Morten Rønnevig Martinsen.pdf - NTNU Open
91
Doctoral theses at NTNU, 2020:359 Morten Rønnevig Martinsen Development of an On-Line Monitoring Platform and Procedure for Rapid Environmental and Process Monitoring of Heavy Oil Extraction Operations and Industrial Activity Doctoral thesis NTNU Norwegian University of Science and Technology Thesis for the Degree of Philosophiae Doctor Faculty of Natural Sciences Department of Chemistry
-
Upload
khangminh22 -
Category
Documents
-
view
0 -
download
0
Transcript of Morten Rønnevig Martinsen.pdf - NTNU Open

ISBN 978-82-326-5064-4 (printed ver.) ISBN 978-82-326-5065-1 (electronic ver.)
ISSN 1503-8181 (printed ver.)ISSN 2703-8084 (online ver.)
Doctoral theses at NTNU, 2020:359
Morten Rønnevig Martinsen
Development of an On-Line Monitoring Platform and Procedure for Rapid Environmental and Process Monitoring of Heavy Oil Extraction Operations and Industrial Activity
Doc
tora
l the
sis
Doctoral theses at N
TNU
, 2020:359M
orten Rønnevig Martinsen
NTN
UN
orw
egia
n U
nive
rsity
of S
cien
ce a
nd T
echn
olog
yTh
esis
for t
he D
egre
e of
Philo
soph
iae
Doc
tor
Facu
lty o
f Nat
ural
Sci
ence
sD
epar
tmen
t of C
hem
istr
y


Thesis for the Degree of Philosophiae Doctor
Trondheim, December 2020
Norwegian University of Science and TechnologyFaculty of Natural SciencesDepartment of Chemistry
Morten Rønnevig Martinsen
Development of an On-LineMonitoring Platform andProcedure for RapidEnvironmental and ProcessMonitoring of Heavy OilExtraction Operations andIndustrial Activity

NTNUNorwegian University of Science and Technology
Thesis for the Degree of Philosophiae Doctor
Faculty of Natural SciencesDepartment of Chemistry
© Morten Rønnevig Martinsen
ISBN 978-82-326-5064-4 (printed ver.)ISBN 978-82-326-5065-1 (electronic ver.) ISSN 1503-8181 (printed ver.)ISSN 2703-8084 (online ver.)
Doctoral theses at NTNU, 2020:359
Printed by NTNU Grafisk senter

1
Acknowledgments
The work presented in this doctoral thesis has been carried out at the Department of
Chemistry at the Norwegian University of Science and Technology (NTNU) between
2009 and 2018. Financial support from the Nature and Science Faculty (NV).
First and foremost, I would like to thank my supervisor Professor Øyvind Mikkelsen
and co-supervisor Rudolf Schmid. Thank you for believing in me through all these
years. It has been a long struggle with ups and downs and you have, throughout all these
years, pushed me to complete. Thank you both for being positive, expanding my
horizon of knowledge, for always having time for a chat. Thank you both for giving me
the opportunity to partake in this very interesting and challenging project.
I have had some great years at the Department of Chemistry at NTNU, and I would like
to thank all my former colleagues and fellow PhD-students. There are many people who
deserve to be mentioned here; Svein Jacob, Thor and Karina are some of them. Thank
you for great lunches, coffee breaks and talks over a pint.
During the work with my degree I have also had the pleasure of working at Applied
Environment Research Laboratory (AERL) at Vancouver Island University, Nanaimo.
There I’ve had the pleasure of working with Professor Erik Krogh and Professor Chris
Gill and their group. Thank you, Kyle Duncan, Megan Willis and Ryan Bell for your
insight and your willingness to share knowledge with me. A special thanks to Nick
Davey. The number of hours we have spent together in a car during field work or
crunching data before a conference are far too many to count. Your friendship will
always be cherished.
Thanks to my current employer, Sweco Norge AS, and Yvonne Johansen, for giving me
time to complete my thesis.
A very special thank goes to my wife and better half, Lise. Your support to help me
complete my doctoral thesis means the world to me and I will always be thankful for it.
It’s been a trial time with both of us having jobs, kids and everything that comes with
being a family of five. This would not have happened if it hadn’t been for you!

2
List of papers included in this thesis
Paper I
Nicholas G. Davey, Cole T.E. Fitzpatrick, Jacob M. Etzkorn, Morten Martinsen, Robert
S. Crampton, Gretchen D. Onstad, Timothy V. Larson, Michael G. Yost, Erik T. Krogh,
Michael Gilroy, Kathy H. Himes, Erik T. Saganić, Christopher D. Simpson &
Christopher G. Gill. Measurement of spatial and temporal variation in volatile
hazardous air pollutants in Tacoma, Washington, using a mobile membrane introduction
mass spectrometry (MIMS) system, Journal of Environmental Science and Health, Part
A, 2014, 49, 1199-1208
Paper II
Ryan J. Bell, Nicholas G. Davey, Morten Martinsen, Christian Collin-Hansen, Erik T.
Krogh, Christopher G. Gill. A field-portable membrane introduction mass spectrometer
for real-time quantitation and spatial mapping of atmospheric and aqueous
contaminants. Journal of The American Society for Mass Spectrometry, 2015, 26, 212-
223
Paper III
Ryan J. Bell, Nicholas G. Davey, Morten Martinsen, R. Timothy Short, Chris G. Gill,
Erik T. Krogh. The Effect of the Earth’s and Stray Magnetic Fields on Mobile Mass
Spectrometer Systems, Journal of The American Society for Mass Spectrometry, 2014,
26, 201-211
Paper IV
Morten R. Martinsen*, Nicholas G. Davey, Ryan J. Bell, Erik T. Krogh, Chris G. Gill,
Oyvind Mikkelsen, Rudolf Schmid. A field portable membrane introduction mass
spectrometer with in-line standard infusion and sample heat exchanger for real-time
monitoring of volatile organic compounds in aqueous samples. Environmental
Chemistry and Ecotoxicology, 2020, 2, 168-174

3
Paper V (draft)
Morten Martinsen. Proton Transfer Chemical Ionization – A short review, draft.

4
Summary
Developing monitoring systems for micro-pollutants and toxic substances to be able to
protect particularly valuable and vulnerable areas against negative environmental
pressures and impacts, and be in the forefront concerning environmental issues, several
basic research aspects within environmental monitoring needs to be addressed. Of
specific important and urgent need is to develop new and reliable analytical methods
with sensitivity in the range capable of measuring real concentrations in filed. New and
reliable methods, of sensitivities that allow measuring realistic concentrations in the
field, are important to be able to address several basic aspects in environmental research
and monitoring.
With an increasing demand for on-site online and real-time monitoring in the areas of
environmental surveys, membrane introduction mass spectrometry (MIMS) has seen
increased use. For flexible and thorough analysis of VOCs/SVOCs, e.g. in the
environment, the analytical system should preferably be brought to the location of
interest and allow continuous monitoring, locally or remote/on-line. This would allow to
immediately respond to undesirable levels of analyte and provide instant feedback
regarding analyte levels of any measures taken at the site. An optimized heat exchanger
– MIMS interface is presented in combination with a continuous flow internal standard
addition for quantification. Both continuous infusion of toluene-d8 and standard
addition into the sample line while analyzing samples ensures the ability for online
calibration together with correcting for any drift in signal, and without any need for
more comprehensive calibration steps pre or post analysis.
The advent of portable chemical sensing technology enables a new framework for
environmental monitoring, where it is possible to take high precision, high accuracy
chemical measurements to the field. The collection of continuous real-time datasets
affords additional challenges and opportunities for data storage, presentation, and
interpretation. In-field data collection is eased through the use of cellular networks and
cloud-based storage. These systems allow any user with an internet connection to
inspect the data at any time, while simultaneously creating an integrated data backup
system. Data presentation and interpretation is eased through the use of free Geographic

5
Information System (GIS) applications, such as Google Earth™. A portable battery
operated highly sensitive membrane introduction mass spectrometer system was
assembled and demonstrated for on-line measurements in air and water samples. The
system was tested close to an oil sand facility in Northern Alberta during 2010-2012.
The novel portable system was capable of resolving and quantifying VOC and SVOCs
with high spatial and temporal resolution, in the field, in real-time.
The popularity of field portable mass spectrometry is growing as many of the technical
hurdles of bringing laboratory equipment into the field are overcome. The effect of
external magnetic fields though, such as the Earth’s magnetic field, on portable mass
spectrometer signal intensity has not yet been addressed by the mass spectrometry
community. When precise, low-energy electron beams are employed, care must be
taken to reduce the influence of uncontrolled magnetic fields. For example,
photoelectron spectrometer components are intentionally lined with or constructed from
magnetically permeable materials to limit the influence of magnetic fields. Field
portable instrumentation also experiences varied magnetic fields as a result of changing
its orientation with respect to the Earth’s magnetic field. The resulting transient
deflection of electron trajectory may generate a significant source of instrumental
variability. Characterization of the influence of magnetic bearing on the relative
instrument response of several field portable mass spectrometers, simulations of the
electron beam transmission efficiencies for several instrumental conditions and
demonstration of simple instrumental modifications that provide magnetic shielding for
better signal stability and sensitivity gains have been shown.
An interesting recent alternative technique to electron ionization (EI) is Chemical
ionization (CI). CI, and specifically proton transfer, differs from EI because bimolecular
processes are used to generate analyte ions. The process of these bimolecular reactions
requires sufficiently many ion-molecule collisions during the dwell time in the ion
source. Multiple methods for environmental applications have been reviewed.
The work presented in this thesis demonstrates the capability of Membrane Introduction
Mass Spectrometry as a method for on-line and real-time measurement of VOC’s and
SVOC’s in atmospheric and aqueous matrices. Several improvements and method

6
developments have been studied and tested to improve analyte response, quantification,
data sampling and handling, georeferencing and the elimination of external influence of
the earth’s magnetic field on electron ionization.

7
Table of Contents
Introduction ................................................................................................................................... 8
Theory ........................................................................................................................................... 9
Membrane Introduction Mass Spectrometry (MIMS) ............................................................... 9
Measurement of spatial and temporal variation in volatile hazardous air pollutants .................. 13
A Field-Portable Membrane Introduction Mass Spectrometer for Real-time Quantitation and
Spatial Mapping of Atmospheric and Aqueous Contaminants ................................................... 14
Field apparatus and magnetic fields ............................................................................................ 17
Method development for aqueous measurements with Membrane Introduction Mass
Spectrometer ............................................................................................................................... 19
Proton Transfer Chemical Ionization (PTR-CI), an alternative to electron ionization mass
spectrometry ................................................................................................................................ 21
Authors Contribution .................................................................................................................. 26
Conclusions ................................................................................................................................. 26
Future Aspects ............................................................................................................................. 28
References ................................................................................................................................... 28

8
Introduction
Several basic research aspects within environmental monitoring need to be addressed
and monitoring systems for micro-pollutants and toxic substances need to be developed
to be able to protect particularly valuable and vulnerable areas against negative
environmental pressures and impacts and to be in the forefront concerning
environmental issues. Of specific important and urgent need is to develop new and
reliable analytical methods with sensitivity in the range capable of measuring real
concentrations in field. This thesis aims at contributing to develop analytical techniques
for field use to monitor volatile and semi-volatile organic compounds in air and/or
water. The focus in this work is both instrumental and method development for
monitoring micro-pollutants and toxic substances in the field both in aqueous and
atmospheric matrices. Utilizing modified miniature GC-MS instrumentation coupled
with membrane introduction mass spectrometry (MIMS) requires extensive work in the
laboratory prior to real-time and on-line field measurement. This thesis and the work
presented demonstrates real-time, on-line field measurements of both aqueous and
atmospheric matrices, calibrations done both pre-, during-, and post field deployment,
solving complex interferences regarding the earth’s magnetic field and the development
of a heat-exchanger for preheating aqueous samples together with an in-line continuous
infusion of an internal stand. Furthermore, a review on alternative methods, in particular
proton transfer mass spectrometry (PTR-MS) is presented, as traditional electron
ionization (EI) has issues with isobaric interferences. New and reliable methods, of
sensitivities that allow measuring realistic concentrations in the field, are important to
be able to address several basic aspects in environmental research and monitoring.
Developing monitoring systems for micro-pollutants and toxic substances can also help
secure that hydrocarbon production is done in an environmentally sustainable manner
(1), for which properly designed monitoring programmes are essential for.

9
Theory
Membrane Introduction Mass Spectrometry (MIMS)
Membrane introduction mass spectrometry (MIMS) is a powerful technique with
demonstrated capabilities as an on-line monitor for volatile and semi-volatile organic
compounds (VOC/SVOCs) in complex environmental samples. A number of recent
review articles describe the theory and practice of the technique, including a number of
environmental and process control applications (2-4). MIMS uses a semi-permeable
membrane to introduce mixtures of hydrophobic organic analytes from samples of air,
water, slurries, etc. into a mass spectrometer, where their signals can be resolved based
on their mass to charge ratio, or by using advanced techniques such as tandem mass
spectrometry (MS/MS). The advantage of using this approach over conventional
analytical techniques is that the sample can be directly measured in a continuous fashion
via flowing the sample over a membrane inlet. This eliminates sample preparation and
chromatographic separation, giving an effective analytical duty cycle that is limited only
by the analyte transport rate through the membrane (typically seconds to minutes).
Conventional MIMS uses a hydrophobic membrane material, such as
polydimethylsiloxane (PDMS, Silicone™) in, e.g., a capillary hollow fibre geometry.
The bulk sample is rejected, while the hydrophobic organic analytes partition into the
membrane and diffuse across to an acceptor fluid phase, e.g. helium gas
(pervaporation), or a liquid in the case of condensed phase MIMS, (CP-MIMS). The
diffusion across the membrane is governed by Fick’s law of diffusion. There are mainly
two equations that describes the permeation process, assuming that the constants for
solvation and diffusion are independent of partial pressure. These equations are:
𝐼𝑚(𝑥, 𝑡) = −𝐴𝐷[𝜕𝐶𝑚(𝑥, 𝑡) 𝜕𝑥⁄ ] (1)
𝜕𝐶𝑚(𝑥, 𝑡) 𝜕𝑡⁄ = 𝐷[𝜕2𝐶𝑚(𝑥, 𝑡) 𝜕𝑥2⁄ ] (2)
where Im(x,t) is the analyte flow inside the membrane (mol/s), A is the membrane
surface area (cm2), D is the diffusion constant of the analyte inside the membrane
(cm2/s), Cm(x,t) is the concentration inside the membrane (mol/cm2), x is the depth in
the membrane (cm), and t is time (s). Equation 1 describes the rate of molecular flow
10
inside the membrane and equation 2 describes the rate at which concentrations change
with time. At steady-state the concentration gradient in the membrane is constant and
the flow rate can be calculated using Henry’s law (S=Cm/Ps)
𝐼𝑠𝑠 = 𝐴𝐷𝑆(𝑃𝑠 𝑙)⁄ (3)
where Iss is the steady-state flow through the membrane (mol/s), S is the solubility
constant (mol/torr cm3), Ps is the vapor pressure of the analyte on the sample side of the
membrane (torr), and l is the membrane thickness (cm). As seen in equation 3 the
steady-state flow depends on the product of diffusion constants and the solubility,
whereas the rate at which measured analyte concentrations change depends only on the
diffusion constants (5).
The fluid is introduced to the ion source of the mass spectrometer, allowing for
continuous quantification. MIMS has been shown to have detection limits in the µg/L
range for VOCs in air and water (6-10). By heating the membrane, thus increasing and
accelerating pervaporation, semi-volatile organic compounds can also be detected (11).
MIMS is well suited for rapid and simultaneous measurement of volatile chemicals. It
can be used as an on-line (continuous) analytical technique with sensitivity in the low
ppb range for volatile compounds. Because MIMS introduces analytes to the ionization
source of the mass spectrometer as a mixture, the use of tandem mass spectrometry
(MS/MS) confers a significantly higher specificity for mixture resolution and analyte
quantitation than single step mass spectrometry can provide (12).
Although MIMS has been known for almost four decades, (13) in the mid-1990s there
was a resurgence in the use of MIMS for ‘real--time’ trace analytical measurements in
both air (14) and water samples (15). There are several reviews on MIMS technique
reported, including trends (1), environmental applications (16) and, recently, its use for
environmental and in-situ measurements (2). Several groups have been applying MIMS
as an on-line monitor for environmental contaminants. As examples, Feilberg and co-
workers (17) used MIMS as an on-line monitor to study the removal of malodorous
compounds in air by livestock air filtration systems, and Norgard et. al. (18) used a
compact MIMS system to study the release of VOCs during the application of nanofilm
spray products. Thompson et. al. used MIMS as a method for monitoring the release of
11
biogenic VOCs from wounded plants (19) and Etzkorn et. al. have shown its potential
use as an in-situ, mobile measurement strategy for investigating anthropogenic VOCs in
both terrestrial and marine environments (12). Other examples of applications are in
biochemistry (20) or in medicine (21).
The Applied Environmental Research Laboratories group at Vancouver Island
University has developed MIMS systems for a variety of divergent applications ranging
from monitoring aqueous contaminant destruction (22) to on-line atmospheric
contaminant detection (6) as well as the development of MIMS systems with enzyme
modified membranes (23), a thermally assisted MIMS systems for SVOCs (13),
membrane based online monitoring devices with compound detectors (14), furthermore
utilizing ion-molecule reactions for on-line speciation and quantitation of VOC (24) and
MIMS instruments as mobile laboratories for air quality study in field (15).

12
Figure 1. Simple schematic of the setup of a hollow fibre MIMS-interface coupled with an Ion Trap Mass
Spectrometer.
13
Measurement of spatial and temporal variation in volatile
hazardous air pollutants
Environmental organic toxicants in air encompass a diversity of chemicals, including
both particulate and vapor phase components. Traffic exhaust and woodsmoke are two
important sources of air toxics. Both of these sources emit complex chemical mixtures
including particulate and vapor phase air toxics. A wealth of literature demonstrates
associations between air pollution and adverse health outcomes (25-27). A number of
recent studies have suggested that fine scale spatial variation in pollutant concentrations
may be an important determinant of exposure to air pollution and adverse health
outcomes. Significant associations have been reported between roadway proximity and
various health outcomes (28-30). Fine scale spatial variability tends to be greater for
specific air toxics, than it is for particulate matter (PM) in general (31, 32). Therefore, it
is important to develop and evaluate in-situ monitoring tools and strategies that are able
to measure multiple air pollutants simultaneously, with high spatial resolution. In the
attached paper 2 (33) spatial and temporal variation in volatile hazardous air pollutants
were measured. By use of an in-house assembled MIMS system (based on a standard
bench-top GC/MS system), it was found that levels of VOCs and SVOCs were higher in
winter compared to summer and were spatially uniform across the study area.
Concentrations of vapor phase pollutants, notably benzene and toluene, had relatively
uniform spatial distributions at night, but exhibited substantial spatial variation during
the day-daytime, as levels were up to 3-fold at traffic-impacted locations than at a
reference site. Although no direct side-by-side comparison was made between the
MIMS system and traditional fixed site monitors, the MIMS system typically reported
higher concentrations of specific VOCs, particularly benzene, ethylbenzene and
naphthalene, compared to annual average concentrations obtained from SUMA canisters
and gas chromatographic analysis at the fixed sites.

14
A Field-Portable Membrane Introduction Mass
Spectrometer for Real-time Quantitation and Spatial
Mapping of Atmospheric and Aqueous Contaminants
Several processes, both natural and anthropogenic, are associated with the release of
volatile and semi-volatile organic compounds, and their concentrations in air can vary
dramatically in time and space under the influence of environmental conditions (34).
When considering hydrocarbon extraction and processing, emissions may be
atmospheric (35) or aqueous (36), can be from point or diffuse sources (37), and are
potentially harmful to nearby residents, biota and workers (38). Additionally,
contaminant concentrations in the environment can be very dynamic as plumes migrate
especially under the influence of mixing events driven by meteorological and
hydrological processes (39, 40). Manual grab sample collection is often the primary
sampling method used for current environmental monitoring programs. However, the
time and expense required by such strategy often results in monitoring programs with
relatively low data density that are limited in scope, and that can fail to provide
information for making timely corrective decisions. Furthermore, improper
documentation of baseline concentrations to compare industrially affected areas can
lead to controversial situations that are difficult to assess (41, 42). As a result, grab
sample collection programs are often very limited and frequently serve only to meet
current regulatory compliance requirements. The advent of portable chemical sensing
technology enables a new framework for environmental monitoring, where it is possible
to take high precision, high accuracy chemical measurements to the field (12, 21, 33,
43-49). Membrane introduction mass spectrometry (MIMS), can provide continuous
monitoring time series data that resolve multiple analyte concentrations simultaneously
(2, 12, 33, 50-54). When operated on a mobile platform, these instruments can track
transient concentration excursions in both spatial and temporal domains that may be
missed by grab sampling strategies (50). Continuous datasets allow the analyst to better
understand the spatial boundaries of contaminant plumes as well as temporal changes
due to dilution, mixing and/or processing. For example, directly comparing plume
intensities and background intensities in a single dataset can reduce the possibility of

15
obtaining both false negative and/or positive measurements made in dynamic
environments. Furthermore, with this information collected in real-time, sampling
decisions and corrective actions can be made in a timely manner, helping to mitigate
liability for both resource management and environmental stakeholders.
In general, MIMS systems allow continuous sampling of VOC/SVOC analytes as they
diffuse through a semi-selective membrane, whereupon simultaneous quantification of
multiple co-permeating molecules occurs by mass spectrometry (1, 2, 16). MIMS
systems employing hydrophobic PDMS membranes yield sensitive and selective
determinations of VOC/SVOCs in both aqueous and gaseous samples, by pre-
concentrating hydrophobic compounds, enhancing their permeation, while impeding the
diffusion of ionic and hydrophilic compounds. Because the membrane allows analytes
to pass simultaneously as a mixture, it is important for quantitative analyses that the
mass spectrometer can resolve each analyte without interference. Analyte interferences
can be reduced using tandem mass spectrometric (MS/MS) techniques. In addition,
corrections for known interferences can be applied by using simultaneous measurements
for these interfering compounds and, sometimes, through inspection of analyte response
times (55).
The collection of continuous real-time datasets affords additional challenges and
opportunities for data storage, presentation, and interpretation. In-field data collection is
eased through the use of cellular networks and cloud-based data storage. These systems
allow any user with an internet connection to inspect the data at any time, while
simultaneously creating an integrated data backup system. Data presentation and
interpretation is facilitated through the use of free Geographic Information System
(GIS) applications, such as Google Earth™. By using mass spectrometric data that is
both time and location stamped, it is possible to provide real-time chemical
concentrations that are geospatially mapped. In addition to providing environmental
protection, through rapid screening and continuous monitoring applications, this
approach can be used to inform intelligent adaptive sampling strategies, delineate
plumes or contaminated sites, identify point sources, quantify fugitive emissions,
monitor process efficiencies and provide discrete molecular information about complex
mixtures (e.g. chemical fingerprinting).

16
A portable battery-operated highly sensitive membrane introduction mass spectrometry
system was assembled and demonstrated for on-line measurements of air and water
samples. The system was tested close to an oil sand extraction facility in Northern
Alberta during 2010-2012. The novel portable system was capable of resolving and
quantifying VOC and SVOCs with high spatial and temporal resolution, in the field, in
real-time. An electron impact ionization cylindrical ion trap mass spectrometer modified
with a capillary hollow fibre polydimethylsiloxane membrane interface was used for
continuous air or water sampling. Tandem mass spectrometry by both selected ion
monitoring scans performed in series allowed for the quantitation of target analytes, and
full scan mode was used to survey for unexpected analytes. Pre-deployment and in-field
external calibrations were performed with a continuously infused internal standard to
enable real-time quantitation and monitor instrument performance. During field
experiments, the system was operated in a moving vehicle with internet-linked data
processing and storage. Software development was included to integrate MIMS and
relevant meta-data for visualization and geospatial presentation in Google Earth™.

17
Field apparatus and magnetic fields
The popularity of field portable mass spectrometry is growing as many of the technical
hurdles of bringing laboratory equipment into the field are overcome (33, 49, 56). On-
site analysis requires that instrumentation can be transported conveniently, powered
remotely, be free of self-contamination, and can be serviced in adverse conditions.
Additionally, the instrumentation should be capable of data collection while moving,
and overcome any additional hurdles resulting from changing environmental and
sample conditions. For example, non-steady state or transient conditions are likely to be
more prevalent and may require correction (4, 38). Additionally, varied sample
conditions, such as temperature, pressure, and humidity, may alter the relative
instrumental response (4, 38, 57-59), and changing environmental conditions may
adversely affect the instrument itself (60). Apart from a report by Short, et al. (2000)
(60), the effect of magnetic fields, such as the Earth’s magnetosphere, on portable mass
spectrometer signal intensity has not yet been addressed by the mass spectrometry
community.
Electron beams that have a short pathlength or have sufficiently high energies are not
significantly affected by weak magnetic fields. Additionally, weak magnetic fields are
likely to have a negligible impact on the deflections of ion beams due to their
significantly greater relative momentum. However, when precise, low-energy electron
beams are employed, care must be taken to reduce the influence of uncontrolled
magnetic fields. For example, photoelectron spectrometer components are intentionally
lined with, or constructed from, magnetically permeable materials to limit the influence
of magnetic fields (61). Nickel-iron alloys such as mu-metal and other magnetically
permeable materials have a magnetic permeability many times that of free space and
tend to absorb passing magnetic fields by providing a preferred location for field
transmittance. Thus, when instrumentation is encased in mu-metal, effects of external
magnetic fields are greatly reduced inside the instrument, avoiding unintended electron
beam deflections. Although impractical in the context of portable mass spectrometry
instrumentation, Helmholtz cages have also been employed to compensate for the

18
effects of the Earth’s magnetic field in testing facilities (62) and in high resolution
cathode ray tubes (63).
Field portable instrumentation also experiences varied magnetic fields as a result of
changing its orientation with respect to the Earth’s magnetic field. The resulting
transient deflection of electron trajectory may generate a significant source of
instrumental variability. In addition, the magnetic fields created by various mass
spectrometer components (e.g. vacuum pumps, inductive coils, or filament current) may
also affect electron beam deflection. The summation of multiple magnetic field vectors
will have an additive effect that is directionally dependent.
These effects are difficult to observe when instrumentation is operated in GC mode due
to the highly variable nature of the instrumental signal. Further, the effects are
compensated for if instrument orientation is not changed between calibration and
sample analysis, as recommended by instrument manufacturers. However, when
operating in a continuous mode, signal variability becomes easily observed when
underway.

19
Method development for aqueous measurements with
Membrane Introduction Mass Spectrometer
The release of volatile organic compounds (VOC) and semi-volatile organic compounds
(SVOC) to the environment can be traced back to both natural and anthropogenic
sources (2, 6, 33, 50). Monitoring the release of these compounds to the environment by
monitoring programs is normally done using nationally or internationally standardized
method, such as ISO or EPA methods. For aqueous solutions analyses using purge and
trap gas chromatography mass spectrometry are the preferred methods of analysis for
VOCs and SVOCs, e.g. EPA method 18 and EPA-NERL 542.2 (64, 65) These are well-
proven and reliable methods for environmental monitoring programs, but require time-
consuming sample preparations and chromatographic separation, reducing its capability
to resolve detailed compound concentration variations in a highly dynamic
environment.
With an increasing demand for on-site online and real-time monitoring in the areas of
environmental surveys, membrane introduction mass spectrometry (MIMS) has seen
increased use (1, 2, 66). Typically, MIMS uses a semi-permeable polymer membrane,
such as polydimethylsiloxane (PDMS), with hydrophobic properties. The hydrophobic
properties will prevent diffusion of particulates, water and highly polar and ionic
compounds, while enhancing diffusion of compounds with a hydrophobic nature,
yielding a MIMS system that is selective and sensitive for volatile and semi-volatile
organic compounds (VOC/SVOC). This type of membrane will, thus, allow enrichment
of these analytes from both liquid and gaseous samples. After diffusion through the
membrane, they are then directly transferred, often using helium gas as the carrier
acceptor phase, to a mass spectrometer for subsequent ionization, resolution and
quantitative measurement (66).
For flexible and thorough analysis of VOCs/SVOCs, e.g. in the environment, the
analytical system should preferably be brought to the location of interest and allow
continuous monitoring, locally or remote/on-line. This would allow to immediately

20
respond to undesirable levels of analyte and provide instantaneous feed-back regarding
analyte levels of any measures taken at the site.
There are many challenges to be faced when developing mobile on-line analytical
instruments capable of providing real-time data. For MIMS systems, one of these
challenges is connected to the diffusion conditions when an analyte species permeates
through the membrane interface. In general, the permeation through a membrane is
dependent upon Fick’s law of diffusion, where permeation rates are governed by
membrane properties affecting partition coefficient for the analyte species between
membrane and sample, (the analytes' diffusion coefficients,) the thickness of the
membrane and the concentration of the analyte species. Previous research has shown a
temperature dependence of analyte response, which for field use might cause challenges
not seen in laboratory under controlled temperature conditions. According to Arrhenius
equation the permeability is dependent on the initial permeability at some initial
temperature and the activation energy for diffusion. It is, therefore, of importance to
regulate sample temperature to avoid sensitivity variations, and to maximize analyte
response (67, 68). Further, analyzing complex matrices in an on-line manner can
experience drift in the detector signal. It is therefore important to be able to calibrate,
not only by standard additions to discrete samples, but continuously in an online manner
while analyzing samples using field apparatus.
This work presents the development and characterization of a counter-current-flow heat
exchanger suited for mobile deployment to overcome the challenges with membrane
introduction at different sample temperatures and to limit power consumption for such
field apparatus. An optimized heat exchanger – MIMS interface is presented in
combination with a continuous flow internal standard addition for quantification. Both
continuous infusion of toluene-d8 as the internal standard, and adding it directly into the
sample line while analyzing samples, ensures the ability for online calibration together
with correcting for any drift in signal. This happens without any need for more
comprehensive calibration steps pre or post analysis. In this work calibration curves
with different sample temperature are presented. Furthermore, experiments with
additions of plumes containing different samples from the SAGD oil refinery process
are presented.

21
Proton Transfer Chemical Ionization (PTR-CI), an alternative to
electron ionization mass spectrometry
An interesting alternative technique to electron ionization (EI) is Chemical ionization
(CI). CI, including proton transfer, differs from EI because bimolecular processes are
used to generate analyte ions. The process of these bimolecular reactions requires
sufficiently many ion-molecule collisions during the dwell time in the ion source (69).
Proton transfer follows a general pathway to form ions from a neutral analyte M in CI:
(69)
M + [BH]+ → [M+H]+ + B
Sources of protons include water vapor, ambient air and internal CI gas.
Proton Transfer (Reaction) Mass Spectrometry (PTR-MS) instruments usually comprise
an ion source to produce primary reagent ions (H3O+), a flow drift tube and a mass
spectrometer to detect and quantify analyte(-derived) ions (70), see Figure 2 for a
schematic example.
Figure 2. Schematic representation of a PTR-MS instrument (71).
There are several examples of CI-MS systems coupled with single quadruple mass
analyzers. A compact atmospheric pressure chemical ionization mass spectrometer

22
(APCI-MS) was utilized for on-line monitoring of dimethyl sulfide (DMS) in seawater.
DMS was measured in air equilibrated with flowing seawater across a porous Teflon
membrane in a hollow-fiber membrane interface design. The gas stream was diluted in
clean air containing an isotopically labelled internal standard and DMS was ionized at
atmospheric pressure by proton transfer from water vapor. The equilibration was done
by flowing the seawater containing DMS on the outside of a single tube flow-through
membrane and dry clean air on the inside (72). The formation of water ions and ion
clusters are done at 400ºC by passing the air with the analyte over a 63Ni foil, 63Ni being
a low energy β-emitting (65,88 keV) radioactive isotope (72, 73). The pressure is about
atmospheric (~760 Torr) from the equilibrator, reaches 1 torr in the collision region
before it ends at 10-5 torr in the analyzer region. For quantification, deuterated DMS
(CH3SCD3) is infused into the flow from the equilibrator to the MS. Detection limits for
the system are estimated to be 220 pptv for field conditions and 148 ppt in the
laboratory. The difference is explained by elevated signal-to-noise ratio in the field due
to motion, thermal effect or electrical noise (72). A similar system has also been used
for real-time measurements of HCN in air (74). Many volatile organic compounds are
photo oxidized to oxygenated volatile organic compounds (OVOC) and contribute to
both the gas phase and secondary organic aerosols (SOA). PTR-MS has shown to be a
useful tool for determining many of these compounds in ambient air, e.g. acetaldehyde,
acetone, propenal, methyl vinyl ketone, benzaldehyde, propene, toluene and 1,3,5-
trimethylbenzene , both in particulate and ambient OVOC (75). The PTR-MS system
has also been used for on-line measurements of gas phase hydrocarbon concentration in
diesel engine exhaust as a function of engine load (76), to monitor selected hydrocarbon
emissions like methanol, acetaldehyde, acetone, methyl tertiary-butyl ether (MTBE),
benzene and toluene from vehicle exhaust emission (77), to measure oxygenated
volatile organic compounds from crops after wounding and drying, e.g. alcohols, esters,
aldehydes and ketones (78).
Environmental application of proton transfer chemical ionization coupled with triple
quadruple mass spectrometers seems to be of lesser abundance than with other mass
analyzers. The existing literature involving this coupling seems to orientate towards
comparisons between selections of ionizing reagents, studies of kinetics, molecular

23
structures and fragmentation pathways (79-86). Atmospheric pressure chemical
ionization mass spectrometry (APCI-MS) was used to find responses to selected
polycyclic aromatic compounds (PACs) as a function of both solvents and source gases.
These studies were done on light gas oil samples collected from Syncrude Canada Ltd.
(87). Cisper et al. demonstrated in 1997 the use of membrane introduction mass
spectrometry for determination of aqueous SVOCs, utilizing electron ionization and
proton transfer chemical ionization in ion trap system. The authors stated that
determination of 2-chlorophenol achieved higher response for proton-transfer chemical
ionization than for/with electron ionization (8).
Allen et al. goes in further depth on the topic of analysis of benzene (VOC),
naphthalene (SVOC) and ferrocene (organometallic compound) in aqueous solutions
using membrane inlet mass spectrometry, with proton-transfer chemical ionization as
ionization process. It was reported an increase in signal intensity yield from 2 to 800
times compared to electron ionization. The same compounds were also analyzed in air
utilizing oxygen, O2, for charge transfer CI (88).
Baudic et al. (89) have utilized a PTR-MS to measure a wide range of VOCs in Paris
megacity. The measurements where done from January to February 2010 to show the
seasonal variability of atmospheric VOCs and their various associated emission sources.
In the article written by Parzeller et al. discusses the advantages of proton-transfer ion
trap mass spectrometry (PTR-ITMS) over linear quadruple mass spectrometers. The
main advantages of PTR-ITMS are the ability of specific identification i.e. overcoming
problems with mass overlaps (isobaric compounds and isomers) and faster response
times (90).
An on-line breath gas analyses by proton transfer time of flight mass spectrometer
(PTR-TOF) has been developed for sensitive detection of VOCs. Time of flight
instruments allows for the measurement of a complete mass spectrum within a fraction
of a second, and the high mass resolving power enables the separation of isobaric
molecules and the recognition of their elemental composition (91). A chemical
ionization reaction time-of-flight mass spectrometer (CIR-TOF-MS) with H3O+ as
primary chemical ionization source was used in the determination of concentrations of

24
OVOCs down to 10 ppbv. Measurements were done in real-time (92). Blake et al (93)
describes a proton-transfer reaction time of flight mass spectrometer for the
determination of VOCs with advantage in terms of mass resolution, mass range and
ability to better resolve complex mixtures. Tanamito et al. developed a proton transfer
reaction-time-of-flight mass spectrometer (PTR-TOFMS) for real-time measurements of
VOCs as well. The detection limits for acetaldehyde, acetone, isoprene, benzene,
toluene and p-xylene were determined to be at the sub-ppbv levels (94).
Environmental monitoring with PTR-CI single quadruple mass analyzers is limited to
parent ion detection, [M-H]+. Therefore, isobaric interferences and mass overlapping is
a recurring problem and requires extra measures to be taken to overcome. Time of
Flight (TOF), and triple quadruple mass analyzers constitute a category offering mostly
bench top instrumentation. Triple quadruple mass analyzers serve more as an instrument
for studying fragmentation pathways and more intricate experiments. TOF and ICR (or
Orbitraps) offer great resolution compared to other analyzers mentioned in here, but on
the other side these instruments are expensive compared to for instance ion traps and are
therefore often out-competed by them. In terms of field-mobility,weight, volume and
complexibility of magnetic sector instrumentation and Ion Cyclotron Resonance Mass
Spectrometers (FT-ICR-MS) are far too big and complex . The ion trap mass analyzer
has the capability to ionize, trap and isolate parent ions, fragment these ions, and trap
isolate and detect the new fragments “at the spot”, also called tandem-in-time. Ion traps
also offer the possibility for smaller instrumentation enabling field portability as
described in some of the articles.
Developments in methods of sample introduction and ionization have opened the ability
to analyse a wider range of compounds with PTR instrumentation. Zhang et al. (95)
have shown how dipolar proton transfer ionization offers the availability to analyse both
VOCs and inorganic substances, e.g. CO2 and NH3. Sulzer et al. (96) describes a
method combining proton transfer with charge exchange analysing both trace VOCs
(benzene, toluene etc.) and CO, CO2, CH4 and SO2. Membrane introduction or spray
inlet are examples of sample introduction methods that allows analysing VOCs in
aqueous matrices (97, 98).

25
PTR-MS has found application not only in environmental analysis of the atmosphere
and water bodies, but also in food science, medicine (breath analyzers), biology and
biotechnology, a.o. New capabilities are also created by combining the PTR-MS data
with other data into powerful information (topological, chronological, meteorological
etc.).

26
Authors Contribution
The candidate’s contribution to the work presented in paper I, “Measurement of spatial
and temporal variation in volatile hazardous air pollutants in Tacoma, Washington,
using a mobile membrane introduction mass spectrometry (MIMS) system”, comprises
crucial contribution to pre-deployment calibration, data collection and field
experimentation. as well as post-deployment data workup and presentation. The
candidate has also contributed significantly with commenting and editing on the paper
draft.
In the work described in paper II, “A field-portable membrane introduction mass
spectrometer for real-time quantitation and spatial mapping of atmospheric and aqueous
contaminants.”, the candidate has contributed significantly to the instrumental
development, method development, pre-deployment calibration, field deployment data
collection and edits and comments to the paper draft.
In the attached paper III “The Effect of the Earth’s and Stray Magnetic Fields on Mobile
Mass Spectrometer Systems” published in Journal of the American Society for Mass
Spectrometry (2014) the candidate’s contribution has been taking part in laboratory and
field experimentation. The variation in signal intensity was first discovered during a
field-deployment in 2010, where the candidate was partaking in collecting field data. It
was not until the first author of the paper, Ryan Bell, connected the recurring issue of
signal intensity variations with a similar issue he had had with a solenoid pump that the
contribution of a magnetic field could be the problem.
Conclusions
Several processes, both natural and anthropogenic, are associated with the release of
volatile and semi-volatile organic compounds, and their concentrations in air can vary
dramatically in time and space under the influence of environmental conditions. In such
cases traditional sampling methodology including manual spot sampling followed by
shipping the samples to a laboratory for later analyses is not necessarily the optimal way
to achieve representative results. There are few possibilities for on-line field monitoring

27
of low concentrations of volatile and semi-volatile organic compounds (VOC/SVOCs)
in air and natural water. However, membrane introduction mass spectrometry (MIMS)
is a powerful technique with demonstrated capabilities as an on-line monitor for
VOC/SVOCs in complex environmental samples. MIMS uses a semi-permeable
membrane to introduce analyte mixtures from samples (air, water, slurries etc.) to a
mass spectrometer, where they can be resolved based upon their mass to charge ratio, or
by using advanced techniques such as tandem mass spectrometry (MS/MS). The
advantage of using this approach over conventional analytical techniques is that the
sample can be directly measured in a continuous fashion via flowing the sample over a
membrane inlet. This eliminates sample preparation and chromatographic separation,
giving an effective analytical duty cycle that is limited only by the analyte transport rate
through the membrane (typically seconds to minutes). The current MIMS methodology
for monitoring organic contaminants is, however, still sub-optimal for field apparatus,
and challenges relate to complexity in introducing analytes in the MIMS system,
detector drift, analyte carry-over, matrix effects and calibration routines among others.
The aim of this thesis has been to contribute to develop an on-line monitoring platform
and procedure for rapid environmental and process monitoring of heavy oil extraction
and industrial activity. To solve challenges related to the complex diffusion conditions
for analytes in the MIMS system in field apparatus and difficulties with calibrations, a
counter-current-flow heat exchanger in combination with a continuous flow internal
standard addition system has been developed and tested in field apparatus. The studies
showed that the developed system was well suited for rapid on-line (continuous) and
simultaneous measurement of volatile chemicals in the low ppb range. The papers
constituting this thesis present the development of methods for on-line monitoring of
VOCs and SVOCs in both atmospheric and aqueous matrices. Two papers demonstrate
the use of the system in relevant field applications. Additionally, one paper presents an
interesting study of the effect of earth’s magnetic field on mass spectrometers and how
this effect was overcome during field deployment. As an alternative to MIMS EI one of
the attached papers is a review of another method of ionization, in particular PTR-MS,
to overcome isobaric interferences occurring with EI.

28
Future Aspects
Through the work with this thesis MIMS has proven a reliable, versatile, and rugged
instrumentation for environmental monitoring of pollutants in both air and aqueous
matrices. Efforts have been made to overcome difficulties with controlling sample
temperature variabilities in aqueous sampling, quantification, and the effects of earth’s
magnetic field.
Further development within the field of methods of ionization, chemical fingerprinting
and data collection and presentation can be made.
Collecting data in the field and displaying calibrated results connected to GPS signal to
give special and temporal resolved data are mostly done post-deployment. For future
development, the utilization of cloud-based storage for on-line and real-time data
collection could be coupled with a spatial data integration platform, e.g. Feature
Manipulation Engine (FME), one could be able to portray calibrated data real-time on a
map.
Understanding the source and composition of a plume or a spill of oil can be crucial in
terms of locating the source and controlling it. Different types of oil products will
produce different types of mass spectra. Utilizing statistical methods one can separate
and identify different types of hydrocarbon products (e.g. diesel, gasoline, oil sands,
different types of North Sea oil). Clustering different hydrocarbon products by utilizing
multivariate analysis one might be able to use these data to pinpoint or locate the source
of a plume or an oil spill real time with MIMS.
Chemical ionization is a powerful and versatile method of ionization. Efforts have been
made to employ ion-molecule reactions to overcome isobaric interferences. Further
studies into reagent molecules and manipulation of reaction times can be done.
References 1. Johnson RC, Cooks RG, Allen TM, Cisper ME, Hemberger PH. Membrane introduction mass spectrometry: trends and applications. Mass spectrometry reviews. 2000;19(1):1-37. 2. Davey NG, Krogh ET, Gill CG. Membrane-introduction mass spectrometry (MIMS). TrAC Trends in Analytical Chemistry. 2011;30(9):1477-85.

29
3. Feilberg A, Adamsen APS, Lindholst S, Lyngbye M, Schafer A. Evaluation of Biological Air Filters for Livestock Ventilation Air by Membrane Inlet Mass Spectrometry. Journal of environmental quality. 2010;39(3):1085-96. 4. Short RT, Toler SK, Kibelka GPG, Rueda Roa DT, Bell RJ, Byrne RH. Detection and quantification of chemical plumes using a portable underwater membrane introduction mass spectrometer. TrAC Trends in Analytical Chemistry. 2006;25(7):637-46. 5. Kotiaho T, Lauritsen FR, Choudhury TK, Cooks RG, Tsao GT. Membrane Introduction Mass-Spectrometry. Analytical Chemistry. 1991;63(18):A875-+. 6. Bell RJ, Davey NG, Martinsen M, Collin-Hansen C, Krogh ET, Gill CG. A Field-Portable Membrane Introduction Mass Spectrometer for Real-time Quantitation and Spatial Mapping of Atmospheric and Aqueous Contaminants. Journal of the American Society for Mass Spectrometry. 2015;26(2):212-23. 7. Brennwald MS, Schmidt M, Oser J, Kipfer R. A Portable and Autonomous Mass Spectrometric System for On-Site Environmental Gas Analysis. Environmental Science & Technology. 2016;50(24):13455-63. 8. Cisper ME, Hemberger PH. The direct analysis of semi-volatile organic compounds by membrane introduction mass spectrometry. Rapid Commun Mass Sp. 1997;11(13):1449-53. 9. Louarn E, Hamrouni A, Colbeau-Justin C, Bruschi L, Lemaire J, Heninger M, Mestdagh H. Characterization of a membrane inlet interfaced with a compact chemical ionization FT-ICR for real-time and quantitative VOC analysis in water. International Journal of Mass Spectrometry. 2013;353:26-35. 10. Miranda LD, Byrne RH, Short RT, Bell RJ. Calibration of membrane inlet mass spectrometric measurements of dissolved gases: Differences in the responses of polymer and nano-composite membranes to variations in ionic strength. Talanta. 2013;116:217-22. 11. Thompson AJ, Creba AS, Ferguson RM, Krogh ET, Gill CG. A coaxially heated membrane introduction mass spectrometry interface for the rapid and sensitive on-line measurement of volatile and semi-volatile organic contaminants in air and water at parts-per-trillion levels. Rapid Commun Mass Sp. 2006;20(13):2000-8. 12. Etzkorn JM, Davey NG, Thompson AJ, Creba AS, Leblanc CW, Simpson CD, Krogh ET, Gill CG. The Use of MIMS-MS-MS in field locations as an on-line quantitative environmental monitoring technique for trace contaminants in air and water. J Chromatogr Sci. 2009;47(1):57-66. 13. Westover LB, Tou JC, Mark JH. Novel mass spectrometric sampling device. Hollow fiber probe. Analytical Chemistry. 1974;46(4):568-71. 14. Cisper ME, Gill CG, Townsend LE, Hemberger PH. Online Detection of Volatile Organic Compounds in Air at Parts-per-Trillion Levels by Membrane Introduction Mass Spectrometry. Analytical Chemistry. 1995;67(8):1413-7. 15. Soni M, Bauer S, Amy JW, Wong P, Cooks RG. Direct Determination of Organic Compounds in Water at Parts-per-Quadrillion Levels by Membrane Introduction Mass Spectrometry. Analytical Chemistry. 1995;67(8):1409-12. 16. Ketola RA, Kotiaho T, Cisper ME, Allen TM. Environmental applications of membrane introduction mass spectrometry. Journal of mass spectrometry : JMS. 2002;37(5):457-76. 17. Feilberg A, Adamsen AP, Lindholst S, Lyngbye M, Schafer A. Evaluation of biological air filters for livestock ventilation air by membrane inlet mass spectrometry. Journal of environmental quality. 2010;39(3):1085-96. 18. Nørgaard AW, Jensen KA, Janfelt C, Lauritsen FR, Clausen PA, Wolkoff P. Release of VOCs and Particles During Use of Nanofilm Spray Products. Environmental Science & Technology. 2009;43(20):7824-30.
30
19. Thompson AJ, Etzkorn JM, van Pel DM, Krogh ET, Drakeford DR, Gill CG. Membrane introduction tandem mass spectrometry (MIMS-MS/MS) as a real-time monitor for biogenic volatile organic compound (BVOC) emissions from plants. Can J Anal Sci Spect. 2008;53(2):75-81. 20. Hansen KF, Degn H. On-line membrane inlet mass spectrometry for feed-back control of precursor concentration in penicillin fermentation. Biotechnology Techniques. 1996;10(7):485-90. 21. Elizarov AY. Mass Spectrometric Analysis of the Antinociceptive Effect of Lidocaine. Biophysics. 2017;62(6):977-9. 22. Nelson JHL, Krogh ET, Gill CG, Friesen DA. Monitoring the TiO2-photocatalyzed destruction of aqueous environmental contaminants at parts-per-trillion levels using membrane introduction mass spectrometry (MIMS). J Environ Sci Heal A. 2004;39(9):2307-17. 23. Creba AS, Weissfloch AN, Krogh ET, Gill CG. An enzyme derivatized polydimethylsiloxane (PDMS) membrane for use in membrane introduction mass spectrometry (MIMS). Journal of the American Society for Mass Spectrometry. 2007;18(6):973-9. 24. Davey NG, Bell RJ, Krogh ET, Gill CG. A membrane introduction mass spectrometer utilizing ion-molecule reactions for the on-line speciation and quantitation of volatile organic molecules. Rapid Commun Mass Sp. 2015;29(23):2187-94. 25. Davidson CI, Phalen RF, Solomon PA. Airborne Particulate Matter and Human Health: A Review. Aerosol Science and Technology. 2005;39(8):737-49. 26. Naeher LP, Brauer M, Lipsett M, Zelikoff JT, Simpson CD, Koenig JQ, Smith KR. Woodsmoke health effects: a review. Inhalation toxicology. 2007;19(1):67-106. 27. USEPA. National-Scale Air Toxics Assessment for 1996. 2001. 28. Brunekreef B, Janssen NA, de Hartog J, Harssema H, Knape M, van Vliet P. Air pollution from truck traffic and lung function in children living near motorways. Epidemiology (Cambridge, Mass). 1997;8(3):298-303. 29. Dales R, Wheeler A, Mahmud M, Frescura AM, Smith-Doiron M, Nethery E, Liu L. The Influence of Living Near Roadways on Spirometry and Exhaled Nitric Oxide in Elementary Schoolchildren. Environmental Health Perspectives. 2008;116(10):1423-7. 30. Van Hee VC, Adar SD, Szpiro AA, Barr RG, Bluemke DA, Diez Roux AV, Gill EA, Sheppard L, Kaufman JD. Exposure to traffic and left ventricular mass and function: the Multi-Ethnic Study of Atherosclerosis. American journal of respiratory and critical care medicine. 2009;179(9):827-34. 31. Karner AA, Eisinger DS, Niemeier DA. Near-Roadway Air Quality: Synthesizing the Findings from Real-World Data. Environmental Science & Technology. 2010;44(14):5334-44. 32. Monn C, Carabias V, Junker M, Waeber R, Karrer M, Wanner HU. Small-scale spatial variability of particulate matter < 10 μm (PM10) and nitrogen dioxide. Atmospheric Environment. 1997;31(15):2243-7. 33. Davey NG, Fitzpatrick CTE, Etzkorn JM, Martinsen M, Crampton RS, Onstad GD, Larson TV, Yost MG, Krogh ET, Gilroy M, Himes KH, Saganic ET, Simpson CD, Gill CG. Measurement of spatial and temporal variation in volatile hazardous air pollutants in Tacoma, Washington, using a mobile membrane introduction mass spectrometry (MIMS) system. J Environ Sci Heal A. 2014;49(11):1199-208. 34. Liu Y, Shao M, Fu L, Lu S, Zeng L, Tang D. Source profiles of volatile organic compounds (VOCs) measured in China: Part I. Atmospheric Environment. 2008;42(25):6247-60. 35. Simpson IJ, Blake NJ, Barletta B, Diskin GS, Fuelberg HE, Gorham K, Huey LG, Meinardi S, Rowland FS, Vay SA, Weinheimer AJ, Yang M, Blake DR. Characterization of trace gases measured over Alberta oil sands mining operations: 76 speciated C2–C10 volatile organic

31
compounds (VOCs), CO2, CH4, CO, NO, NO2, NOy, O3 and SO2. Atmos Chem Phys. 2010;10(23):11931-54. 36. Joint Community Update: Reporting on our Environmental Activities to the Community, Wood Buffalo Environmental Association, Cummulative Environmental Management Association and Regional Aquatics Monitoring Program, Edmonton, Alberta, Canada. 2008. 37. USEPA. An Assessment of theEnvironmental Implications of Oil and Gas Production: A Regional Case Study. 2008. 38. Janfelt C, Lauritsen FR, Toler SK, Bell RJ, Short RT. Method for quantification of chemicals in a pollution plume using a moving membrane-based sensor exemplified by mass spectrometry. Anal Chem. 2007;79(14):5336-42. 39. Camilli R, Duryea AN. Characterizing Spatial and Temporal Variability of Dissolved Gases in Aquatic Environments with in situ Mass Spectrometry. Environmental Science & Technology. 2009;43(13):5014-21. 40. Chambers AK, Strosher M, Wootton T, Moncrieff J, McCready P. Direct Measurement of Fugitive Emissions of Hydrocarbons from a Refinery. Journal of the Air & Waste Management Association. 2008;58(8):1047-56. 41. Groat C, Grimshaw T. Fact Based Regulation for Environmental Protection in Shale Gas Development. The Energy Institute, Austin, Texas; 2012. 42. Kelly EN, Short JW, Schindler DW, Hodson PV, Ma M, Kwan AK, Fortin BL. Oil sands development contributes polycyclic aromatic compounds to the Athabasca River and its tributaries. Proceedings of the National Academy of Sciences of the United States of America. 2009;106(52):22346-51. 43. Cooks RG, Mueller T. Through a Glass Darkly: Glimpses into the Future of Mass Spectrometry. Mass Spectrometry. 2013;2(Spec Iss):S0001. 44. Guimbaud C, Catoire V, Gogo S, Robert C, Chartier M, Laggoun-Défarge F, Grossel A, Albéric P, Pomathiod L, Nicoullaud B, Richard G. A portable infrared laser spectrometer for flux measurements of trace gases at the geosphere–atmosphere interface. Measurement Science and Technology. 2011;22(7):075601. 45. Herndon SC, Jayne JT, Zahniser MS, Worsnop DR, Knighton B, Alwine E, Lamb BK, Zavala M, Nelson DD, McManus JB, Shorter JH, Canagaratna MR, Onasch TB, Kolb CE. Characterization of urban pollutant emission fluxes and ambient concentration distributions using a mobile laboratory with rapid response instrumentation. Faraday discussions. 2005;130:327-39; discussion 63-86, 519-24. 46. Lane DA. Mobile mass spectrometry. Environ Sci Technol. 1982;16(1):38a-46a. 47. Lindinger W, Hansel A, Jordan A. On-line monitoring of volatile organic compounds at pptv levels by means of proton-transfer-reaction mass spectrometry (PTR-MS) medical applications, food control and environmental research. International Journal of Mass Spectrometry and Ion Processes. 1998;173(3):191-241. 48. Pétron G, Frost G, Miller BR, Hirsch AI, Montzka SA, Karion A, Trainer M, Sweeney C, Andrews AE, Miller L, Kofler J, Bar-Ilan A, Dlugokencky EJ, Patrick L, Moore CT, Ryerson TB, Siso C, Kolodzey W, Lang PM, Conway T, Novelli P, Masarie K, Hall B, Guenther D, Kitzis D, Miller J, Welsh D, Wolfe D, Neff W, Tans P. Hydrocarbon emissions characterization in the Colorado Front Range: A pilot study. Journal of Geophysical Research: Atmospheres. 2012;117(D4):n/a-n/a. 49. Taylor S, Bierbaum VM. Focus on Harsh Environment Mass Spectrometry. Journal of the American Society for Mass Spectrometry. 2008;19(10):1375-6.

32
50. Brkic B, France N, Taylor S. Oil-in-Water Monitoring Using Membrane Inlet Mass Spectrometry. Analytical Chemistry. 2011;83(16):6230-6. 51. Camilli R, Reddy CM, Yoerger DR, Van Mooy BAS, Jakuba MV, Kinsey JC, McIntyre CP, Sylva SP, Maloney JV. Tracking Hydrocarbon Plume Transport and Biodegradation at Deepwater Horizon. Science. 2010;330(6001):201-4. 52. Chen H, Xia Z, Pedersen-Bjergaard S, Svensmark B, Lauritsen FR. Analysis of semivolatile pharmaceuticals and pollutants in organic micro extracts using hot cell membrane inlet mass spectrometry. Anal Chem. 2009;81(10):4010-4. 53. Ouyang Z, Noll RJ, Cooks RG. Handheld miniature ion trap mass spectrometers. Anal Chem. 2009;81(7):2421-5. 54. Wenner PG, Bell RJ, van Amerom FHW, Toler SK, Edkins JE, Hall ML, Koehn K, Short RT, Byrne RH. Environmental chemical mapping using an underwater mass spectrometer. TrAC Trends in Analytical Chemistry. 2004;23(4):288-95. 55. Overney FL, Enke CG. A mathematical study of sample modulation at a membrane inlet mass spectrometer-Potential application in analysis of mixtures. Journal of the American Society for Mass Spectrometry. 1996;7(1):93-100. 56. Huang G, Gao L, Duncan J, Harper JD, Sanders NL, Ouyang Z, Cooks RG. Direct detection of benzene, toluene, and ethylbenzene at trace levels in ambient air by atmospheric pressure chemical ionization using a handheld mass spectrometer. Journal of the American Society for Mass Spectrometry. 2010;21(1):132-5. 57. Bell RJ, Short RT, Byrne RH. In situ determination of total dissolved inorganic carbon by underwater membrane introduction mass spectrometry. Limnology and Oceanography: Methods. 2011;9(4):164-75. 58. Bell RJ, Short RT, van Amerom FHW, Byrne RH. Calibration of an In Situ Membrane Inlet Mass Spectrometer for Measurements of Dissolved Gases and Volatile Organics in Seawater. Environmental Science & Technology. 2007;41(23):8123-8. 59. Diaz JA, Pieri D, Arkin CR, Gore E, Griffin TP, Fladeland M, Bland G, Soto C, Madrigal Y, Castillo D, Rojas E, Achí S. Utilization of in situ airborne MS-based instrumentation for the study of gaseous emissions at active volcanoes. International Journal of Mass Spectrometry. 2010;295(3):105-12. 60. Short RT, Fries DP, Kerr ML, editors. Influence of the Earth’s Magnetic Field on Portable Mass Spectrometers. 12th Sanibel Conference on Mass Spectrometry; 2000; FL, USA. 61. Teodoro O, Silva J, Moutinho AMC. Multitechnique surface analysis system: apparatus description. Vacuum. 1995;46(8):1205-9. 62. Poppenk FM, Amini R, Brouwer G, editors. Design and Application of a Helmholtz Cage for Testing Nano- satellites. 6th International Symposiun on Environmental Testing for Space Programmes; 2007: ESA/ESTEC. 63. Goldwasser S. TV and Monitor CRT (Picture Tube) Information (v2.02): Samuel M. Goldwasser; 1998 [ 64. EPA. Method 18 - Volatile Organic Compounds by Gas Chromatography www.epa.gov: United States Environment Protection Agency; 1997 [updated August 10th 2017. 65. EPA-NERL. Measurement of Purgeable Organic Compounds in Water by Capillary Column Gas Chromatography/Mass Spectrometry www.nemi.gov: National Environmental Methods Index; 1995 [ 66. Krogh ET, Gill CG. Membrane introduction mass spectrometry (MIMS): a versatile tool for direct, real-time chemical measurements. Journal of Mass Spectrometry. 2014;49(12):1205-13.

33
67. Janes DW, Durning CJ, van Pel DM, Lynch MS, Gill CG, Krogh ET. Modeling analyte permeation in cylindrical hollow fiber membrane introduction mass spectrometry. J Membrane Sci. 2008;325(1):81-91. 68. LaPack M. The Theory and Practice of Membrane Extractions. Ann Arbor, MI: Michigan State University; 1994. 69. Gross JH. Mass Spectrometry: A Textbook: Springer International Publishing; 2017. 70. Dong C, Hou KY, Wang JD, Li HY. Application of chemical ionization mass spectrometry in in situ measurement of atmospheric trace species. Prog Chem. 2007;19(2-3):377-84. 71. Hansel A, Jordan A, Warneke C, Holzinger R, Lindinger W. Improved detection limit of the proton-transfer reaction mass spectrometer: On-line monitoring of volatile organic compounds at mixing ratios of a few PPTV. Rapid Commun Mass Sp. 1998;12(13):871-5. 72. Saltzman ES, De Bruyn WJ, Lawler MJ, Marandino CA, McCormick CA. A chemical ionization mass spectrometer for continuous underway shipboard analysis of dimethylsulfide in near-surface seawater. Ocean Sci. 2009;5(4):537-46. 73. Coursey BM, Lucas LL, Grau Malonda A, Garcia-Toraño E. The standardization of plutonium-241 and nickel-63. Nuclear Instruments and Methods in Physics Research Section A: Accelerators, Spectrometers, Detectors and Associated Equipment. 1989;279(3):603-10. 74. Knighton WB, Fortner EC, Midey AJ, Viggiano AA, Herndon SC, Wood EC, Kolb CE. HCN detection with a proton transfer reaction mass spectrometer. International Journal of Mass Spectrometry. 2009;283(1-3):112-21. 75. Hellen H, Dommen J, Metzger A, Gascho A, Duplissy J, Tritscher T, Prevot ASH, Baltensperger U. Using proton transfer reaction mass spectrometry for online analysis of secondary organic aerosols. Environmental Science & Technology. 2008;42(19):7347-53. 76. Jobson BT, Alexander ML, Maupin GD, Muntean GG. On-line analysis of organic compounds in diesel exhaust using a proton transfer reaction mass spectrometer (PTR-MS). International Journal of Mass Spectrometry. 2005;245(1-3):78-89. 77. Rogers TM, Grimsrud ER, Herndon SC, Jayne JT, Kolb CE, Allwine E, Westberg H, Lamb BK, Zavala M, Molina LT, Molina MJ, Knighton WB. On-road measurements of volatile organic compounds in the Mexico City metropolitan area using proton transfer reaction mass spectrometry. International Journal of Mass Spectrometry. 2006;252(1):26-37. 78. De Gouw JA, Howard CJ, Custer TG, Baker BM, Fall R. Proton-transfer chemical-ionization mass spectrometry allows real-time analysis of volatile organic compounds released from cutting and drying of crops. Environmental Science & Technology. 2000;34(12):2640-8. 79. Augusti R, Augusti DV, Chen H, Cooks RG. Gas-phase halide affinity of aliphatic alcohols estimated by the kinetic method. Eur J Mass Spectrom. 2004;10(6):847-55. 80. Bachorz RA, Klopper W, Gutowski M, Li X, Bowen KH. Photoelectron spectrum of valence anions of uracil and first-principles calculations of excess electron binding energies. J Chem Phys. 2008;129(5):-. 81. Chen GD, Cooks RG. Electron-Affinities of Polycyclic Aromatic-Hydrocarbons Determined by the Kinetic Method. Journal of Mass Spectrometry. 1995;30(8):1167-73. 82. Cole RB, Tabet JC. Stereospecific ion-molecule reactions of nucleophilic gas-phase reagents with protonated bifunctional tetracyclic terpene epimers in the triple quadrupole collision cell. Journal of Mass Spectrometry. 1997;32(4):413-9. 83. Donovan T, Brodbelt J. Examination of Ortho-Effects in the Collisionally Activated Dissociation of Closed-Shell Aromatic Ions. Org Mass Spectrom. 1992;27(1):9-16. 84. Massaro RD, Dai YF, Blaisten-Barojas E. Energetics and Vibrational Analysis of Methyl Salicylate Isomers. J Phys Chem A. 2009;113(38):10385-90.

34
85. Pepi F, Ricci A, Rosi M, Di Stefano M. Effect of alkali metal coordination on gas-phase chemistry of the diphosphate ion: The MH2P2O7- ions. Chem-Eur J. 2006;12(10):2787-97. 86. Sherin PS, Gritsan NP, Tsentalovich YP. Experimental and quantum chemical study of photochemical properties of 4-hydroxyquinoline. Photoch Photobio Sci. 2009;8(11):1550-7. 87. Kolakowski BM, Grossert JS, Ramaley L. The importance of both charge exchange and proton transfer in the analysis of polycyclic aromatic compounds using atmospheric pressure chemical ionization mass spectrometry. Journal of the American Society for Mass Spectrometry. 2004;15(3):301-10. 88. Allen TM, Cisper ME, Hemberger PH, Wilkerson CW. Simultaneous detection of volatile, semivolatile organic compounds, and organometallic compounds in both air and water matrices by using membrane introduction mass spectrometry. International Journal of Mass Spectrometry. 2001;212(1-3):197-204. 89. Baudic A, Gros V, Sauvage S, Locoge N, Sanchez O, Sarda-Esteve R, Kalogridis C, Petit JE, Bonnaire N, Baisnee D, Favez O, Albinet A, Sciare J, Bonsang B. Seasonal variability and source apportionment of volatile organic compounds (VOCs) in the Paris megacity (France). Atmos Chem Phys. 2016;16(18):11961-89. 90. Prazeller P, Palmer PT, Boscaini E, Jobson T, Alexander M. Proton transfer reaction ion trap mass spectrometer. Rapid Commun Mass Sp. 2003;17(14):1593-9. 91. Herbig J, Muller M, Schallhart S, Titzmann T, Graus M, Hansel A. On-line breath analysis with PTR-TOF. J Breath Res. 2009;3(2):-. 92. Wyche KP, Blake RS, Ellis AM, Monks PS, Brauers T, Koppmann R, Apel EC. Technical note: Performance of Chemical Ionization Reaction Time-of-Flight Mass Spectrometry (CIR-TOF-MS) for the measurement of atmospherically significant oxygenated volatile organic compounds. Atmos Chem Phys. 2007;7:609-20. 93. Blake RS, Wyche KP, Ellis AM, Monks PS. Chemical ionization reaction time-of-flight mass spectrometry: Multi-reagent analysis for determination of trace gas composition. International Journal of Mass Spectrometry. 2006;254(1-2):85-93. 94. Tanimoto H, Aoki N, Inomata S, Hirokawa J, Sadanaga Y. Development of a PTR-TOFMS instrument for real-time measurements of volatile organic compounds in air. International Journal of Mass Spectrometry. 2007;263(1):1-11. 95. Zhang QL, Zou X, Liang Q, Zhang YT, Yi MJ, Wang HM, Huang CQ, Shen CY, Chu YN. Development of Dipolar Proton Transfer Reaction Mass Spectrometer for Real-time Monitoring of Volatile Organic Compounds in Ambient Air. Chinese J Anal Chem. 2018;46(4):471-8. 96. Sulzer P, Edtbauer A, Hartungen E, Jurschik S, Jordan A, Hanel G, Feil S, Jaksch S, Mark L, Mark TD. From conventional proton-transfer-reaction mass spectrometry (PTR-MS) to universal trace gas analysis. International Journal of Mass Spectrometry. 2012;321:66-70. 97. Zou X, Kang M, Wang HM, Huang CQ, Shen CY, Chu YN. Rapid and sensitive on-line monitoring 6 different kinds of volatile organic compounds in aqueous samples by spray inlet proton transfer reaction mass spectrometry (SI-PTR-MS). Chemosphere. 2017;177:217-23. 98. Beale R, Liss PS, Dixon JL, Nightingale PD. Quantification of oxygenated volatile organic compounds in seawater by membrane inlet-proton transfer reaction/mass spectrometry. Anal Chim Acta. 2011;706(1):128-34.

Paper I

This paper is not included due to copyrightavailable at https://doi.org/10.1080/10934529.2014.910014

Paper II


50 5 1
2
3
4 6
78
9
21
9
05 4
5 38
31 69
6
07
MIMS
Abstract. Environmental concentrations of volatile and semivolatile organic com-pounds (VOC/SVOCs) can vary dramatically in time and space under the influence ofenvironmental conditions. In an industrial setting, multiple point and diffuse sourcescan contribute to fugitive emissions. Assessments and monitoring programs usingperiodic grab sampling provide limited information, often with delay times of days orweeks. We report the development and use of a novel, portable membrane introduc-tion mass spectrometry (MIMS) system capable of resolving and quantifying VOCand SVOCs with high spatial and temporal resolution, in the field, in real-time. Anelectron impact ionization cylindrical ion trap mass spectrometer modified with acapillary hollow fiber polydimethylsiloxane membrane interface was used for contin-
uous air and water sampling. Tandemmass spectrometry and selected ion monitoring scans performed in seriesallowed for the quantitation of target analytes, and full scan mode was used to survey for unexpected analytes.Predeployment and in-field external calibrations were combined with a continuously infused internal standard toenable real-time quantitation andmonitor instrument performance. The systemwas operated in amoving vehiclewith internet-linked data processing and storage. Software development to integrate MIMS and relevant meta-data for visualization and geospatial presentation in Google Earth is presented. Continuous quantitation enablesthe capture of transient events that may be missed or under-represented by traditional grab sampling strategies.Real-time geospatial maps of chemical concentration enable adaptive sampling and in-field decision support.Sample datasets presented in this work were collected in Northern Alberta in 2010–2012.
Key words: VOC/SVOC, Membrane introduction mass spectrometry (MIMS), Emissions, Alberta oil sands,Mobile mass spectrometry, Real time quantitative mapping
Received: 15 August 2014/Revised: 9 October 2014/Accepted: 11 October 2014/Published Online: 5 December 2014
B American Society for Mass Spectrometry, 2014 J. Am. Soc. Mass Spectrom. (2015) 26:212Y223DOI: 10.1007/s13361-014-1028-3
FOCUS: HARSH ENVIRONMENT AND FIELD-PORTABLE MASS SPECTROMETRY:RESEARCH ARTICLE
A Field-Portable Membrane Introduction MassSpectrometer for Real-time Quantitation and SpatialMapping of Atmospheric and Aqueous Contaminants
Ryan J. Bell, Nicholas G. Davey, Morten Martinsen, Christian Collin-Hansen,41,2 1,2
1 1,2 1,3
Erik T. Krogh, Christopher G. Gill1Applied Environmental Research Laboratories (AERL), Chemistry Department, Vancouver Island University, Nanaimo, BC,Canada 2Chemistry Department, University of Victoria, Victoria, BC, Canada3Chemistry Department, Norwegian University of Science and Technology (NTNU), Trondheim, Norway4Statoil Petroleum ASA, TPD RDI Frontier Developments, Trondheim, Norway
Introduction
Many processes, both natural and anthropogenic, are as-sociated with the release of volatile and semivolatile
organic compounds (VOC/SVOCs) to the environment [1].When considering hydrocarbon extraction and processing, the-se emissions may be atmospheric [2] or aqueous [3], can befrom point or diffuse sources [4], and are potentially harmful to
Correspondence to: Erik T. Krogh; e-mail: [email protected],Christopher G. Gill; e-mail: [email protected]
nearby residents, biota, and workers [5]. Additionally, contam-inant concentrations in the environment can be very dynamic asplumes migrate, especially under the influence of mixingevents driven by meteorological and hydrological processes[6, 7]. Grab sample collection (e.g., bottles, canisters, andsorbent traps) are often the primary sampling method used forcurrent environmental monitoring programs and, althoughquantitative in nature, measured concentrations reflect a singlepoint in space and time (or integrated over a specific timewindow), predominantly in an ‘off-line’ manner. The time
Paper 2
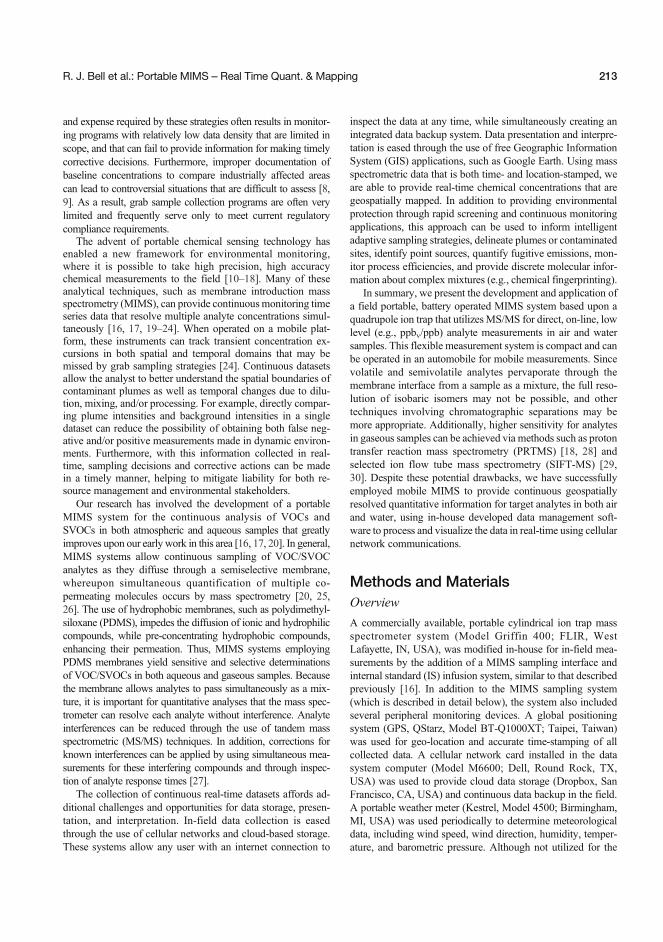
and expense required by these strategies often results in monitor-ing programs with relatively low data density that are limited inscope, and that can fail to provide information for making timelycorrective decisions. Furthermore, improper documentation ofbaseline concentrations to compare industrially affected areascan lead to controversial situations that are difficult to assess [8,9]. As a result, grab sample collection programs are often verylimited and frequently serve only to meet current regulatorycompliance requirements.
The advent of portable chemical sensing technology hasenabled a new framework for environmental monitoring,where it is possible to take high precision, high accuracychemical measurements to the field [10–18]. Many of theseanalytical techniques, such as membrane introduction massspectrometry (MIMS), can provide continuousmonitoring timeseries data that resolve multiple analyte concentrations simul-taneously [16, 17, 19–24]. When operated on a mobile plat-form, these instruments can track transient concentration ex-cursions in both spatial and temporal domains that may bemissed by grab sampling strategies [24]. Continuous datasetsallow the analyst to better understand the spatial boundaries ofcontaminant plumes as well as temporal changes due to dilu-tion, mixing, and/or processing. For example, directly compar-ing plume intensities and background intensities in a singledataset can reduce the possibility of obtaining both false neg-ative and/or positive measurements made in dynamic environ-ments. Furthermore, with this information collected in real-time, sampling decisions and corrective actions can be madein a timely manner, helping to mitigate liability for both re-source management and environmental stakeholders.
Our research has involved the development of a portableMIMS system for the continuous analysis of VOCs andSVOCs in both atmospheric and aqueous samples that greatlyimproves upon our early work in this area [16, 17, 20]. In general,MIMS systems allow continuous sampling of VOC/SVOCanalytes as they diffuse through a semiselective membrane,whereupon simultaneous quantification of multiple co-permeating molecules occurs by mass spectrometry [20, 25,26]. The use of hydrophobic membranes, such as polydimethyl-siloxane (PDMS), impedes the diffusion of ionic and hydrophiliccompounds, while pre-concentrating hydrophobic compounds,enhancing their permeation. Thus, MIMS systems employingPDMS membranes yield sensitive and selective determinationsof VOC/SVOCs in both aqueous and gaseous samples. Becausethe membrane allows analytes to pass simultaneously as a mix-ture, it is important for quantitative analyses that the mass spec-trometer can resolve each analyte without interference. Analyteinterferences can be reduced through the use of tandem massspectrometric (MS/MS) techniques. In addition, corrections forknown interferences can be applied by using simultaneous mea-surements for these interfering compounds and through inspec-tion of analyte response times [27].
The collection of continuous real-time datasets affords ad-ditional challenges and opportunities for data storage, presen-tation, and interpretation. In-field data collection is easedthrough the use of cellular networks and cloud-based storage.These systems allow any user with an internet connection to
inspect the data at any time, while simultaneously creating anintegrated data backup system. Data presentation and interpre-tation is eased through the use of free Geographic InformationSystem (GIS) applications, such as Google Earth. Using massspectrometric data that is both time- and location-stamped, weare able to provide real-time chemical concentrations that aregeospatially mapped. In addition to providing environmentalprotection through rapid screening and continuous monitoringapplications, this approach can be used to inform intelligentadaptive sampling strategies, delineate plumes or contaminatedsites, identify point sources, quantify fugitive emissions, mon-itor process efficiencies, and provide discrete molecular infor-mation about complex mixtures (e.g., chemical fingerprinting).
In summary, we present the development and application ofa field portable, battery operated MIMS system based upon aquadrupole ion trap that utilizesMS/MS for direct, on-line, lowlevel (e.g., ppbv/ppb) analyte measurements in air and watersamples. This flexible measurement system is compact and canbe operated in an automobile for mobile measurements. Sincevolatile and semivolatile analytes pervaporate through themembrane interface from a sample as a mixture, the full reso-lution of isobaric isomers may not be possible, and othertechniques involving chromatographic separations may bemore appropriate. Additionally, higher sensitivity for analytesin gaseous samples can be achieved via methods such as protontransfer reaction mass spectrometry (PRTMS) [18, 28] andselected ion flow tube mass spectrometry (SIFT-MS) [29,30]. Despite these potential drawbacks, we have successfullyemployed mobile MIMS to provide continuous geospatiallyresolved quantitative information for target analytes in both airand water, using in-house developed data management soft-ware to process and visualize the data in real-time using cellularnetwork communications.
Methods and MaterialsOverview
A commercially available, portable cylindrical ion trap massspectrometer system (Model Griffin 400; FLIR, WestLafayette, IN, USA), was modified in-house for in-field mea-surements by the addition of a MIMS sampling interface andinternal standard (IS) infusion system, similar to that describedpreviously [16]. In addition to the MIMS sampling system(which is described in detail below), the system also includedseveral peripheral monitoring devices. A global positioningsystem (GPS, QStarz, Model BT-Q1000XT; Taipei, Taiwan)was used for geo-location and accurate time-stamping of allcollected data. A cellular network card installed in the datasystem computer (Model M6600; Dell, Round Rock, TX,USA) was used to provide cloud data storage (Dropbox, SanFrancisco, CA, USA) and continuous data backup in the field.A portable weather meter (Kestrel, Model 4500; Birmingham,MI, USA) was used periodically to determine meteorologicaldata, including wind speed, wind direction, humidity, temper-ature, and barometric pressure. Although not utilized for the
R. J. Bell et al.: Portable MIMS – Real Time Quant. & Mapping 213

presented study, a video camera (Model HERO2; GoPro Inc.,San Mateo, CA, USA) was incorporated to allow the potentialcreation of a video log of the surrounding environment duringdata collection events, to allow retrospective assessment of thedata collection environment.
Membrane Introduction Mass Spectrometer
The cylindrical ion trap utilizing electron impact ionization (EI)was selected for use as the mass analyzer because of its com-pact, ruggedized, and field-portable design, and its ability toperform MS/MS for increased selectivity. Furthermore, thesystem is capable of multiple types of mass scan techniquesin an interlaced series, allowing cycled quantitative analytescans to be performed in sequence with general survey (full)scans. The entire mass spectrometer was encased in approxi-mately 1.6 m2 of 0.1 mm thick nickel alloy foil, or mu-metal (μ≈ 50,000) (product number 8912 K32; McMaster Carr,Elmherst, IL, USA) to reduce the effects of the earth’s magneticfield upon instrumental sensitivity. For additional informationregarding the influence of magnetic fields upon portable EImass spectrometers, the reader is directed to an article specif-ically addressing the topic, also in this issue of JASMS. Theinstrument was equipped with a temperature-controlled MIMSinterface that replaced the supplied gas chromatograph system.For this work, the MIMS interface was constructed using aPDMS hollow fiber membrane (0.94 mm o.d., 0.51 mm i.d.,10 cm length, Silastic brand; Dow Corning, Midland, MI,USA) and a flow-over sample cell design. A similar experi-mental arrangement has been described previously [16],though a major difference in design is the use of an in-houseconstructed aluminum block heater to maintain a constantmembrane temperature. The lumen (permeate side) of themembrane was swept with a helium carrier gas (~1 mL/min),provided by a miniature 16 L helium cylinder (Model49617HE; Leland Ltd., South Plainfield, NJ, USA). In additionto acting as the membrane acceptor phase for analyte transportto the mass spectrometer, helium was also used as a buffer gasby the mass spectrometer. A schematic of the entire apparatusis given in Figure 1. For choosing desired sample flows, twothree-way valves (Figure 1, valves A1, A2) were located oneither side of the membrane inlet to facilitate convenientswitching between aqueous or atmospheric samples (videinfra).
Gaseous Sampling
Sample was drawn into the MIMS system via two solvent-cleaned microporous stainless steel inlet filters in series (15 and5 μm) (Model SS-6 F; Swagelok, Solon, OH, USA), and ¼in.o.d. Teflon transfer lines (Cole Parmer). The air-sampling inletwas mounted on the roof rack of a sport utility vehicle, approx-imately 30 cm above the roofline. Upstream from the MIMSinlet system, gaseous samples flowed through a temperature-regulated chamber housing a toluene-d8 permeation tube toallow the continuous on-line infusion of IS (Figure 1). Sincethe permeation of analytes through the membrane is
temperature-dependent, for the experiments described belowthe MIMS interface, permeation chamber, transfer lines, andinlet filters were independently temperature-regulated to 50°C.To utilize the system for SVOC analyses (data not shown), theinlet filter and transfer lines could be maintained at tempera-tures up to 200°C. The sample flow rate was set to the desiredvalue using a rotameter equipped with a precision, 10-turnneedle valve (Model FM4312(4); Advanced Specialty GasEquipment, Middlesex, NJ, USA) and maintained by a me-chanical diaphragm pump (Model B-Series Dia-Vac; AirDimensions, Deerfield Beach, FL, USA) located after themembrane. A pressure gauge (Model PX209-30V15G5V;Omega, Laval, Canada) located on the sample flow line imme-diately following the membrane interface was used to monitorpressure changes (e.g., resulting from a clogged inlet filter). Asecond pressure gauge (Model PX209-030G5V; Omega), lo-cated between the diaphragm pump and rotameter, was used tomonitor possible changes in sample flow rate. A pressuredecrease here would suggest a leak in the sampling system,most notably a failure in the sampling pump diaphragm. Pumpsand pressure transducers were controlled andmonitored using acustom microcontroller (Arduino UNO, Torino, Italy) and in-house developed software (Labview 2011; NationalInstruments, Austin, TX, USA). While underway, the systemwas powered by a bank of four 6 V lead acid batteries (2011)(Model T-145 Plus; Trojan Battery Company, Santa FeSprings, CA, USA) or smaller footprint Li-polymer batteries(2012) (Model 4784 AA; Portable Power Corp, Richmond,CA, USA), using the mass spectrometer’s on-board 24 V volt-age regulator to ensure a steady voltage supply to criticalcomponents.
Prior to field deployment, the system was calibrated for avariety of target analytes (Table 1). Tandem mass spectrometryscans (MS/MS) were optimized for suitable target analytes, andselected ion monitoring (SIM) scans where used in cases whereanalytes did not fragment well in the cylindrical ion trap (e.g.,reduced sulfur compounds), or for those that were highlyfragmented under EI conditions (e.g., pinene). A full scanwas also performed to survey for any unexpected analytes(see Table 1). Performing each measurement in an interlacedseries resulted in a total scan cycle time of 13.5 s (averaging 10replicate scans per measurement). Continuous flow gas stan-dards were produced using certified permeation tubes (Kin-Tek, La Marque, TX, USA) housed in a Dynacalibrator gasdilution apparatus (Model 340; VICI Metronics Inc., Poulsbo,WA, USA), with hydrocarbon scrubbed air used for the dilu-tion gas. At an air sampling flow rate of 1850 mL/min, the in-line toluene-d8 permeation tube produced a constant IS con-centration of 75 ppbv throughout calibration. Response factorsfor each analyte (relative to the IS) were obtained by flowingindividual gas standards prepared using the Dynacalibratorthrough the in-line permeation chamber (Table 1). Detectionlimits reported for each analyte were based upon three timessignal to noise ratio.
The satisfactory performance of the in-line permeation tubechamber and sample heat exchanger was confirmed by
214 R. J. Bell et al.: Portable MIMS – Real Time Quant. & Mapping

comparing calibration standards made using the in-line perme-ation chamber to those made externally using theDynacalibrator. Figure 2 illustrates the results for gas phaseethylbenzene. Each point on the calibration curve was mea-sured as the mean of 90 scans and fit with a weighted least-squares solution, using the inverse of the variance as theweighting factor. Importantly, the slopes of each calibrationcurve are in excellent agreement (within 0.4%). This indicatesthat the in-line permeation chamber and sample heat exchangerperform as anticipated, and field calibrations utilizing the in-line chamber for on-line IS addition can be trusted and directlycompared with laboratory-based calibrations performed usingthe Dynacalibrator. A small offset (~380 counts) was observed(Figure 2) as a result of minor instrumental background shiftsoccurring overnight between the calibration runs, suggestingthe necessity of daily background signal checks.
Interference correction factors were also calculated andemployed for selected, known isobaric interferents. For exam-ple, ethylbenzene EI fragment ions trapped by the MS/MS scanfor toluene result in isobaric interference. The fragmentation ofethylbenzene (M.+, m/z 106) under EI conditions yields thestable aromatic tropylium ion (C7H7
+, m/z 91), which is alsoused for toluene quantitation via MS/MS (m/z 91 → 65). Thispositive isobaric interference of ethylbenzene upon toluene wasnumerically corrected by using the ratio of isobaric interferencebetween the ethylbenzene (m/z 106→ 91) and the toluene MS/MS scans (m/z 91 → 65) obtained during the analysis of a
gaseous ethylbenzene standard. In this manner, signal contri-butions from the EI fragment ions of known interferents werenumerically corrected. Although a similar, unaccounted forinterference from xylene may result in a positive bias fortoluene, the low xylene concentrations typically observed (datanot shown) will lead to small biases. Future work will focus onresolving additional interference factors using more advancedspectral analysis or soft ionization techniques (e.g., CI) [31].
Experimentally, we have observed that with this system,reproducible measurements are possible for air sampling flowrates of 91000 mL/min (data not shown). In the field, the airsampling flow rate was maintained at 1850 mL/min (wellabove this threshold), yielding a constant 75 ppbv toluene-d8IS concentration in the sample flow. This resulted in a suffi-cient IS signal from which analyte concentrations could becalculated using the experimentally determined response fac-tors (Table 1). A sensitivity coefficient was also calculated,giving the user an indication of the overall instrument perfor-mance level. For example, if the IS response during an analysisis observed to be 80% of its response measured duringpredeployment calibration, a correction factor of 0.8 could beapplied to the external calibration coefficients. Drift in theinstrumental sensitivity was monitored continuously, allowingfor corrective actions (e.g., replace the EI filament, optimize thedetector voltage, etc.) when necessary. Thus, continuouslyinfused IS allowed for both real-time calibration and instrumentperformance monitoring. Variations in operational parameters
Membrane Interface
Cylindrical Ion Trap Mass Spectrometer
MiniHe(g)
A1
A2
Activated Carbon Filter
Flowmeter
Peristaltic Pump
Subsampling Outlet
Coaxial WaterHeat Exchanger
Automated Syringe Pumps For Direct Infusion
Inlet Filter
LaptopComputer
Meta-Data
USB Hub
Micro-Controller
GPS GoProHeatedSample Flow
In-line Heater
Innertube: 1/4” ODOutertube: 1/2” OD
Inlet Filters
Air Sample Heat Exchanger
Internal StandardPermeation Tube (Toluene-d8)
HeatedTransfer Line
Sample Pump(1850 cc/min)
Rotameter
Water Waste Outet
Air Waste Outlet
Air Sampling Manifold Inlet
Water SamplingManifold Inlet
Figure 1. Schematic of the field portable MIMS system. Two flow selection valves (A1 and A2) are used to quickly switch betweeneither the air or aqueous sample introduction manifolds
R. J. Bell et al.: Portable MIMS – Real Time Quant. & Mapping 215

are also detected by observation of the correction coefficient. Forexample, if the sample temperature, pressure, or flow rate chang-es, the concentration of the IS will also change, signaling poten-tial problems to the operator during in-field measurements. Forthis study, we limited our measurements to relatively flat terrain,minimizing pressure variations arising from altitude changes.Sampling parameters were closely monitored and stored as inter-laced meta-data to enable post-deployment data interrogation.
Prior to daily deployments during field monitoring cam-paigns, instrumental background values were reestablishedafter a 1 h warm up, using a small cylinder of zero air (ModelAI 0.0UM; Praxair, Mississauga, ON, Canada). Periodic cali-bration checks were performed using toluene and benzenepermeation tubes added to the in-line permeation chamberand varying sample gas flow rate from the zero air cylinder.
Aqueous Sampling
MIMS analysis of aqueous samples was carried out with thesame instrumentation by changing the position of valves A1and A2 (Figure 1). Aqueous sampling was performed at asample flow rate of 150 mL/min using a battery-operatedperistaltic pump (Model Masterflex E/S; Cole Parmer,Montreal, Canada) and monitored with a flow meter (ModelFLR1000-8; Omega, Laval, Canada). Experimentally, we haveobserved with this system that reproducible measurements arepossible for aqueous sample flow rates of 9100 mL/min (datanot shown). Incoming aqueous samples were maintained at35°C using a flexible heating tape (thermocouple regulated)wrapped around the sample inlet tubing upstream of the MIMSinterface. To reduce the power consumption required for sam-ple heating before measurement, an in-house constructedT
able1.
Summaryof
MassSp
ectrom
eter
Scan
Methods
andAnalyticalPerformance
CharacteristicsforTargetA
nalytes
Analyte
Vapor
pressure
Massspectrom
eter
at25°C
(Pa)
scan
method(m
/z)
Responsetim
est 10–90
Detectio
nlim
itsd
Responsefactors
Airat
Water
atAirat
50°C
(min)
35°C
(min)
50°C
(ppb
v
Water
Airat50°C
Water
at35°C
)at35°C
(ppb)
Survey
Scan
FullScan
40-150
n/a
n/a
n/a
n/a
n/a
n/a
Toluene-d
8(InternalS
tandard)
98→
69,70
0.5
20.5
0.5
--
Toluene
3,715a
91→
64,65
0.5
20.5
0.5
1.5
2.7
Benzene
12,590
aSIM
77,78
0.5
22
10.3
0.17
Ethylbenzene/Xylenes
1,230/630a
106→
91,92
0.5
20.75
11.0
0.04
Chloroform
25,120
aSIM
83,85
0.5
22
12.8
n/a
Chlorobenzene
1,580a
112→
76,77,78
12
105
0.08
0.06
Naphthalene
200a
128→
102
210
105
3.9
0.29
2-Methoxyphenol
20.9a
124→
108,109
210
2050
n/a
n/a
Pinene
582b
SIM
121
210
2050
n/a
n/a
Dim
ethylS
ulfide
64,460
bSIM
621
520
500.03
n/a
MethylM
ercaptan
196,200b
SIM
47,48
15
2050
n/a
0.04
a Reference
[37].
bReference
[38].
c Selectedreactio
nmonito
ring
(SRM)transitio
nsdenotedwith
→;selectedionmonito
ring
(SIM
)andfullscan
dataacquired
asnoted.
dDetectionlim
itsbasedupon
signal/noise
=3.
Dynacalibrator (176 ± 2 a.u. / ppb) Inline Perm. Chamber (177 ± 2 a.u. / ppb)
0 60 120 Ethylbenzene / ppbv
3
2
1
0
Sig
nal
Int.
m/z
91,9
2 / a
.u. (
x104 )
Figure 2. Direct comparison of the instrumental response forgas phase ethylbenzene concentrations with the permeationtube standard located in the Dynacalibrator versus the inlinepermeation chamber. Instrumental signal intensities are given inarbitrary units (a.u.)
216 R. J. Bell et al.: Portable MIMS – Real Time Quant. & Mapping

coaxial tubing heat exchanger (~70% efficient) was used torecycle thermal energy from the exiting sample flow (Figure 1).Continuously infused IS was added to the aqueous samplestream, (e.g., toluene-d8) using a software-controlled syringepump (Model C24000; Tricontinent, Grass Valley, CA, USA).Additionally, a second syringe pumpwas incorporated to allowon-line analyte infusions for lab experiments, in-field calibra-tion checks, and standard addition calibrations. The exitingsample flow was passed through an in-house constructed acti-vated carbon filter trap (1000 g of activated carbon suspendedbetween glass wool plugs in a 3-in. diameter plastic casing)before discharge from the system.
Prior to field deployments, theMIMS systemwas calibratedfor a variety of aqueous analytes using closed 1-L glass recir-culation flasks equipped with a Teflon lined septa in a mannersimilar to that described previously [32, 33]. Deionized water(maintained at 35°C by a constant temperature water bath) wasrecirculated through the MIMS interface at 150 mL/min, andstepwise injections of combined analyte stock solutions inmethanol were used to generate low ppb (μg/L) aqueous con-centrations (e.g., 3 to 30 ppb) for calibration. To avoid isobaricinterferences during aqueous calibrations, two analyte suiteswere employed: Suite 1: benzene, toluene, chloroform, methyliodide, dimethyl sulfide; Suite 2: ethylbenzene, chlorobenzene,naphthalene, guaiacol, iso-octane, 1-chloronaphthalene.Toluene-d8 was included in both suites and used as an IS forthe determination of response factors. Using these data, instru-mental background, analyte sensitivity, detection limits, andresponse factors were determined for each target analyte(Table 1).
For in-field quantitation, incoming aqueous samples werecontinuously infused with toluene-d8 at low ppb levels via asyringe pump, allowing on-line analyte quantitation by re-sponse factors as well as affording the continuous monitoringof overall instrument performance. For example, an infusionflow rate of 0.20 mL/min of 14 ppm toluene-d8 (in methanol)into 150 mL/min on-line sample flow rate produced an on-linetoluene-d8 concentration of 19 ppb. The second syringe pumpinjection port was used to infuse analyte standards in the fieldfor periodic target analyte calibration checks. Some of theaqueous samples were also calibrated by using standard addi-tions methodology, whereupon a calibration solution contain-ing toluene-d8 and the desired target analytes was infused intothe sample stream immediately following a sample measure-ment. Field samples included 4-L grab samples collected inamber glass bottles (Scientific Specialties Inc., Hanover,MD, USA) and also the continuous sampling of waterdirectly drawn from rivers and streams over multi-hoursampling periods with the peristaltic pump. Extendedperiods of stationary aqueous monitoring in the field(912 h) were enabled by switching to supplementarypower, provided by a small gasoline-powered generator(EU2000i; Honda, Tokyo, Japan) located at least 100 mdownwind from the sampling location. This preventedthe complete depletion of the battery systems, and en-sured uninterrupted data collection.
Software Development
Mass spectrometric scan methods were developed and executedusing the mass spectrometer’s operating software (GriffinSystem Software, GSS, v3.9; FLIR Systems, West Lafayette,IN, USA). Calibration software to quantitate the raw data andautomate the handling of the associated meta-data was writtenin-house using Labview. Calibration results were stored in acustom file format that was subsequently employed by addition-al Labview-based software designed for real-time data collectionand analysis. Briefly, the real-time software extracted quantita-tive ion signals from the raw GSS data files and applied thecalibration data file, producing real-time quantitative results.These results were then plotted as multiple time series and ascolor proportional tracks on a map. Maps were downloaded asneeded using Google Maps API. All data were automaticallystored on Dropbox servers via the cellular data connection. Afterall mobile data were collected, data workup and re-analysis wereperformed using in-house developed MATLAB code(Mathworks, Natick, MA, USA). Meta-data and final result fileswere stored as time series for inspection and quality control.Final results were saved as .kmz files for presentation in GoogleEarth. These self-contained data files enable inspection of databoth geospatially and temporally, are easily networked, andcontain hierarchal data structures to enable the presentation andsharing of the large complex datasets in a clear and concise way.
Field Work Methods
The field monitoring examples presented were obtained inNorthern Alberta in early July, 2012. Air sampling data setswere obtained in and around a Steam Assisted GravityDrainage (SAGD) pilot facility (Statoil Canada Ltd.) locatedroughly 200 km south of Fort McMurray, and on public roadsnorth of Fort McMurray along Highway 63. TheMIMS systemwas operated in a sport utility vehicle (GMC Yukon).Stationary air sampling data sets were collected with the vehi-cle engine off and correlated with meteorological data deter-mined at the sampling site. Aqueous sampling included theanalysis of grab samples of on-site processed and ground wateras well as measurements made by continuously sampling fromnearby natural surface waters.
An example air monitoring dataset, presented here (videinfra), was generated during travel north of Fort McMurrayon Highway 63 through areas adjacent to active oil sandrecovery operations. Frequent stops (with the vehicle engineoff) were performed to allow the collection of meteorologicaldata and to obtain periods of stationary MIMS data. Theexample dataset was collected on July 7, 2012. The day waswarm (27°C) and dry (30% relative humidity), with gentlewind speeds ranging between 4 and 7 m/s.
Aqueous samples of both on-site process water and off-sitenatural (stream, river, and ground) water were also collectedduring this field trip. An example dataset shown here wascollected July 3, 2012 from an active steam generation systemused by a Statoil Canada Ltd. oil recovery operation (videinfra). The SAGD site has been operational since 2010, and
R. J. Bell et al.: Portable MIMS – Real Time Quant. & Mapping 217

the small settling pond is used for holding recovery water priorto reuse in the steam injection process.
Results and DiscussionField Work – Air Monitoring
Data collectedwith themass spectrometer operating continuouslyin a moving vehicle is presented as a time series in Figure 3, andthe progression of dataworkup is presented in each subpanel. Theraw data for toluene measurement is shown in Subpanel a andindicates several toluene detections throughout the day.Generally, the data consists of long periods where toluene wasnot detected, punctuated periodically by transient excursions tohigher signal levels. For example, at 16:02, a very strong signalwas observed (14,240 counts) when the vehicle passed over astretch of road that had been very recently paved with freshasphalt. At 16:24, a sustained signal was detected while thevehicle was stationed downwind of a tailings settling pond usedby an active heavy oil extraction operation. Several other minor
concentration excursions above detection limit levels may havebeen the result of passing vehicle exhaust emissions or air massesinfluenced by other settling ponds. Detections of vehicle exhaustwere rather infrequent because of the elevated sampling intake,the very large dilution that rapidly occurs in the turbulence behinda moving vehicle (roughly estimated to be 25,000:1 at highwayvelocity), and the effective catalytic conversion of hydrocarbonemissions that occurs for hot, underway vehicles [34].
As noted above, ethylbenzene readily fragments under EI toyield m/z 91, and this can lead to a positive bias in the tolueneconcentration as determined bym/z 91→ 65. To compensate forthis, we independently measure ethylbenzene by measuring m/z106 → 91 and applying an interference factor calculated duringpredeployment calibration. The interference contribution datawere smoothed (five-point boxcar) prior to being subtracted fromto the analyte signal. Smoothing prevents the inclusion of addi-tional instrumental noise into the signal data and allows signalcorrections to be made on a time scale comparable with theMIMS response time for ethylbenzene (Table 1). The contribu-tion of ethylbenzene to the m/z 91→ 65 signal is typically small(e.g., during the detection of emissions from fresh asphalt, 1.2%,
(a) Raw Signal m/z 64, 65, 66
14240 a.u.
150
100
50
0
[To
luen
e] /
pp
bS
ign
al In
t. /
a.u
.[T
olu
ene]
/ p
pb
Sig
nal
Int.
/ a.
u.
Sig
nal
Int.
/ a.
u.
vv
(b) Interferent Corrected Signal (Smoothed)
180 a.u.
150
100
50
0 3
2
1
0
3000
2000
1000
(c) Direct Calibration Detection Limit
0
(d)
Smoothed Toluene-d8 Signal m/z 70, 69 Predicted Toluene-d8 Signal
(e) Final Calibrated Result (via Response Factor) Detection Limit
385 ppbv
15:50 15:57 16:04 16:12 16:19 16:26 16:33 16:40 16:48 16:55
Time, July 7, 2012
Figure 3. Time series representation of the instrumental data used for real-time toluene quantitation collected north of FortMcMurray, Alberta, Canada. The x-axis represents the time of day when the data was collected. Subpanels show data progressionthrough the data workup process and the final data time series result is given in subpanel e
3
2
1
0
443 ppbv
218 R. J. Bell et al.: Portable MIMS – Real Time Quant. & Mapping

16:02), but can in some instances be significant (e.g., duringdetection of settling pond off gassing, 40%, 16:24). The variabil-ity, of course, is strongly dependent on the particular samplecomposition. We cannot rule out positive interference in thetoluene quantitation arising from other alkylbenzenes and hydro-carbons likely present near fresh asphalt paving [35]. Therefore,we caution the reader not to over-interpret the displayed tolueneconcentrations, even after correction for specific interferencessuch as those arising from ethylbenzene. Although EI is relativelysimple to implement, it is a ‘hard’ ionization strategy, resulting inthe extensive fragmentation of many analytes, especially alkylhydrocarbons. Further improvements in the use of interferencefactors as well as on-line standard addition strategies and softerionization sources are currently being investigated to address thechallenges of resolving isobaric interferents.
The ethylbenzene corrected toluene signal is converted toconcentration in Subpanel c (Figure 3) using direct calibrationfactors from gaseous calibration standards preparedpredeployment. Displaying this data along with the calculateddetection limits is an additional quality control check andallows the user to quickly assess any signal deviations in thefinal data time series (Subpanel e).
Subpanel d (Figure 3) shows the instrumental signal for thecontinuously infused IS, toluene-d8 (m/z 98 → 70), and is com-pared with the expected response to the IS given the sample flowrate and laboratory predeployment calibration (predicted toluene-d8 signal). The IS concentration was calculated from the analyteconstant, K0 (cc/mg), derived from molecular weight and theideal gas constant, permeation tube emission rate, (E , ng/min),and sampling gas flow rate (F, mL/min at STP) (Eq. 1). ExpectedIS response is calculated as the product of IS concentration IS½ �and instrumental sensitivity to the IS (mIS ). The ratio of actualresponse to expected response provides a sensitivity coefficientthat is a real-time measure of the instrument performance (Eq. 2).For example, rapid changes in the sensitivity coefficient may beindicative of transient events that can impact instrument sensitiv-ity (e.g., due to a matrix interference or space-charge effectsresulting from a highly contaminated sample or from membranerupture/fouling). Long-term changes are useful in reporting driftin the instrumental state (e.g., filament or electron multiplierwear). As can be seen in Subpanel d (Figure 3), the instrumentwas slightly more sensitive to toluene-d8 on this deployment thanduring predeployment lab-based calibrations. The IS data wasalso boxcar smoothedwith a moving average (n =5) to reduce theaddition of unnecessary electrical noise to the analyte signals,while allowing sensitivity corrections to be made on a time scalethat is comparable to the MIMS signal response times (Table 1).
½IS� ¼ K0*E
Fð1Þ
Sens Coeff ¼ CountsISm * ISIS ½ � ð2Þ
Subpanel e (Figure 3) shows the toluene concentration timeseries calibrated from an instrumental response factor (e.g.,
toluene/toluene-d8) determined during lab calibration, the rawanalyte counts and the smoothed IS counts along with thesensitivity adjusted detection limit (DL , Eq. 3). As theAdj
instrumental sensitivity declines during multi-day deploy-ments, the adjusted detection limit will increase. This canhappen, for example, when the EI filament is nearing failure.When the detection limit crosses a predetermined threshold, theuser can be warned by the software interface and correctiveactions (e.g., replace the filament) can be taken. It is importantfor the instrument field operator to have real-time knowledge ofthe detection limit for immediate assessment of anomaloussignals and to ensure the detection limits are adequate for thecollection of meaningful data.
DLAd j ¼ DL*Sens Coeff ð3Þ
As a final data assessment, Subpanel a (Figure 3) indicatestwo distinct detections. These detections are marked with ver-tical dashed bars (16:02 and 16:24) and for these intervals, the30 s of full scan data following the vertical bar were averagedand presented as insets in Figure 4. The spectra were normal-ized using the IS signal (measured atm/z 98), then corrected bysubtracting the spectrum for the IS. The IS spectrum wasdetermined immediately prior to collection of this time series,and this time stamp is also marked with a vertical bar inSubpanel a (Figure 3, 15:54 h). The spectra indicate a complexsuite of analytes permeating the membrane. The spectra insetsin Figure 4 are distinctly different and suggest that MIMS fullscanm/z data can be used in multivariate statistical approaches,such as Principal Component Analysis (PCA) for source ap-portionment and tracking. They also emphasize the importanceof employing selective techniques such as MS/MS forquantitation.
The response factor calibrated toluene mass spectrometricdata (m/z 91→ 65) collected north of Fort McMurray, Canada(Figure 3, Panel e) was time-matched to GPS data and meteo-rological data, and is presented in Figure 4. White dots repre-sent data collected that were below the detection limit. Windvectors are represented by the red arrows and can be queried(with a computer mouse click) in Google Earth to inspect thedata file source, wind direction, wind speed, temperature, hu-midity, barometric pressure, time, latitude, and longitude. The16:02 detection discussed above is noticeable as a large dot justnorth of Fort McMurray, and the 16:24 detection is labeled at“Settling pond 16:24.” The data track presented in Figure 4 is asmall subset of a much larger dataset navigable by GoogleEarth.
Multiple analyte concentrations are embedded in the GoogleEarth *.kml data file(s) and can be depicted as individual tracksfor inspection in real-time or post-deployment. Figure 5 showsa 5 h continuous time series collected while driving and parkedin a discrete pattern (termed a ‘Rosette’) at strategic locations inand around a SAGD demonstration facility, similar to themethodology employed in other work by our group [17].Subpanel a illustrates the data obtained for benzene, toluene,and ethylbenzene (+xylene). The shaded regions represent data
R. J. Bell et al.: Portable MIMS – Real Time Quant. & Mapping 219

collected while the vehicle was stationary (with the vehicleengine off), whereas the unshaded data was collected whilemoving. Most of the time VOC concentrations are well belowour observed detection limits (dashed horizontal line). Thesignal appearing around 12:00 h was observed while the vehi-cle was parked just downwind of a relatively small, lined
settling pond used to hold process reuse water. Subpanel bdisplays a whisker plot of the stationary data only and illus-trates the distribution of chemical concentrations as 25–75percentiles as well as outliers. Subpanel c illustrates aGoogle Earth screenshot depicting the toluene concentrationtrack. The navigation panel on the left sidebar of the screen
(a) Settling pond (16:24)
(b) Fresh Asphalt (16:02)Fort McMurray
Fort McKay
Figure 4. Google Earth snapshot of atmospheric toluene data collected north of Fort McMurray, Alberta, Canada. Data aremultidimensional and time-stamped, allowing for a fully navigable data environment and video creation. The insets illustrate full scanmass spectra of selected survey data obtained during detection events. Inset (a) shows themass spectrum of the air space downwindof a waste-water settling pond (16:24) and (b) shows themass spectrum for atmospheric monitoring while travelling on a freshly pavedasphalt roadway (16:02). Both spectra were normalized to the toluene-d8 IS, with background and IS spectra subtracted
220 R. J. Bell et al.: Portable MIMS – Real Time Quant. & Mapping

allows the user to select the analyte to display. The data can be Field Work – Aqueous Monitoringviewed in a ‘video’mode, playing back the data evolution overtime. Screen overlays that include legend, data time se-ries, and institutional logos can also be generated whendesired. Importantly, each data point can be queried forits source file, scan information, raw counts, concentra-tion, detection limit, time, latitude, and longitude. Insummary, Google Earth has proven to be an extremelyuseful tool for data visualization and analysis due to itsdata structure and wide availability. be loaded with analyte standards and employed for periodic in-
Water samples can be readily analyzed using the same mem-brane interface and ion trap mass spectrometer system bydiverting the aqueous sample stream into the MIMS interfaceusing the aqueous sampling manifold (Figure 1, valves A1 andA2). Continuously infused IS delivered via a syringe pump canbe utilized for real-time calibrations using predetermined re-sponse factors as above. The other syringe pump (Figure 1) can
[EtB
z+X
yl]
/ pp
b[T
olu
ene]
/ p
pb
[Ben
zen
e] /
pp
bv
vv
[To
luen
e] /
pp
bv
[EtB
z+X
yl]
/ pp
bv
[Ben
zen
e] /
pp
bv
(a) (b)
0 0 10
40
20
0 0 20 14
10
30
15
5
30
0 0 9:00 10:00 11:00 12:00 13:00 14:00
Time, June 29, 2012
7
5
(c)
June 29 Rosette 2: Mobile MIMS Air Monitoring
Central S
ite 9:01 AM
Northwest S
ite 9:30 AM
Central S
ite 10:38 AM
Southwest Site
11:10 AM
Central S
ite 11:48 AM
Eastern Site 12:46 PM
Central S
ite 1:40 PM
Figure 5. (a) Five-hour time series for atmospheric benzene, toluene, and ethylbenzene + xylenes (EtBz + Xyl) showing datacollected in moving vehicle (white background) and while stationary (gray background). The horizontal dotted line represents thecalculated detection limits. (b) Whisker box plots for stationary deployments only showing mean concentrations, 25–75 percentilesand data outliers. (c) Google Earth screenshot of the atmospheric toluene data collected on-site. Geospatial time series data for allanalytes can be inspected in a single *.kmz file along with the relevant meta-data
R. J. Bell et al.: Portable MIMS – Real Time Quant. & Mapping 221

field calibrations by standard addition methods. The in-linesample heater and heat exchanger system can be used topreheat samples and improve response times, if necessary.Figure 6 illustrates data for the analysis of a VOC contaminatedboiler feed water sample, diluted 24:1 to avoid space chargeeffects in the ion trap from excessively high analyte concentra-tions. The sample inlet line was switched from deionized waterto diluted boiler feed water at 21:24. Data analysis indicated thediluted sample had a concentration of 29 ppb. At 21:39 (dashedbar A), the continuous infusion of a standard solution contain-ing both benzene (19 ppb) and toluene-d8 (19 ppb) was initiat-ed. The software system allows for sample analysis by IS and/or standard addition methods, depending on the injected solu-tion. The benzene signal was calibrated using the standardaddition data, whereas the toluene-d8 is shown as a demonstra-tion of the use of an IS. Once again, the use of an IS relaysimportant information to the field operator about instrumentperformance by comparing on-site signal intensities to thoseobserved predeployment. The sudden jump in signal at 21:50 isa result of an entrained air bubble that occurred when switchingthe sample stream to a washout blank (DI water). The abruptchange observed for the IS signal would be a suitable trigger tosuggest that this is compromised data, allowing it to be cen-sored (if desired) from any further data analyses.
Since the instrument can be employed to report continuous,calibrated VOC concentrations in aqueous samples in real-time, it is a powerful in-field monitoring tool for dynamicchemical systems. Industrial sites such as SAGD operationshave numerous operational systems to process and reuse watersupplies. On-line process monitoring can provide importantinformation to industrial operators. Furthermore, sensitive andselective on-site monitoring of contaminants in surroundingsurface and ground waters aids in better environmental stew-ardship and protection initiatives.
Implications and Future Work
The combination of instrumentation, data analysis, and visual-ization software presented here provides a novel approach that
provides quantitative, information-rich data sets that enablereal-time, on-site decision making. This is especially usefulfor timely process control decisions, emergency response sce-narios, adaptive sampling during field measurement cam-paigns, and long-term environmental monitoring studies. Thepresented system is amenable to several improvements includ-ing the inclusion of a thermally assisted membrane [33] toimprove detection limits for SVOC analytes and the implemen-tation of various chemical ionization methods to improve in-strument selectivity [28, 30, 36]. Future software developmentwill focus on cataloguing data for improved online databaseaccess, additional data input features (e.g., real-time dilutioncalculations), and improved data (and meta-data) presentationfor real-time quality control analysis. Additional peripheralequipment development will include continuous wind vectordeterminations and simultaneous video monitoring capabili-ties. The presentation of more extensive datasets includingvalidation studies for hydrocarbons in both air and water willfollow in subsequent publications.
ConclusionsA novel field portable membrane introduction mass spectrom-etry (MIMS) system is presented that utilizes in-house devel-oped real-time data analysis and visualization software forgeospatial mapping of VOC/SVOCs in the environment. Thesystem has been used for monitoring hydrocarbon contami-nants in air and water samples during in-field sampling cam-paigns in and around oil and gas extraction facilities inNorthern Alberta, including the direct, in-field measurementof process waters. Real-time detection limits are in the low ppbrange. The presented system allows operators to develop intel-ligent, adaptive sampling strategies based on data being pro-duced in real-time, and provides data to enable remotely locat-ed decision makers to implement corrective actions whenneeded. Continuous mass spectral time series datasets are ob-tained, processed, and visualized using in-house developedsoftware. Data are temporally resolved and, therefore, capableof capturing transient concentration excursions. In the case ofair monitoring, data capture over a wide spatial area by usingthe system in a moving vehicle is also possible. Although thepresented system is currently limited to electron impact ioni-zation (EI), we are exploring the use of softer chemical ioniza-tion strategies to alleviate isobaric interferences that arise fromthe EI fragmentation of matrix species.
AcknowledgmentsThe authors gratefully acknowledge Alexander Thompson,Oyvind Mikkelsen, Rudolf Schmid, and the students and staffof the Applied Environmental Research Laboratory (AERL)for their assistance with this project. Special thanks are given toGregory Vandergrift (AERL) for his assistance with preparingthe technical illustrations. The authors thank Vancouver IslandUniversity and the University of Victoria for their ongoing
21:14 21:28 21:43 21:570
Benzene (Fullscan m/z 78) Toluene-d8 (IS, MS/MS m/z 98→70)
Time, July 5, 2012
50
100
Co
nce
ntr
atio
n /
pp
b
A
Figure 6. In-field analysis of a heavy oil process water sample.At 21:39 (dashed bar A), an infusion containing both benzene(19 ppb) and toluene-d8 IS (19 ppb) commenced. Pre-analysisdilution was 24-fold
222 R. J. Bell et al.: Portable MIMS – Real Time Quant. & Mapping

support of their research and graduate students. This work wassupported in part by funding from Statoil ASA (Grant No4502457485).
References1. Liu, Y., Shao, M., Fu, L.L., Lu, S.H., Zeng, L.M., Tang, D.G.: Source
profiles of volatile organic compounds (VOCs) measured in China: Part I.Atmos. Environ. 42, 6247–6260 (2008)
2. Simpson, I.J., Blake, N.J., Barletta, B., Diskin, G.S., Fuelberg, H.E.,Gorham, K., Huey, L.G., Meinardi, S., Rowland, F.S., Vay, S.A.,Weinheimer, A.J., Yang, M., Blake, D.R.: Characterization of trace gasesmeasured over Alberta oil sands mining operations: 76 speciated C-2-C-10volatile organic compounds (VOCs), CO2, CH4, CO, NO, NO2, NOy, O-3and SO2. Atmos. Chem. Phys. 10, 11931–11954 (2010)
3. Joint Community Update: Reporting on our Environmental Activities to theCommunity, Wood Buffalo Environmental Association, Cummulative En-vironmental Management Association, and Regional Aquatics MonitoringProgram, Edmonton, Alberta, Canada (2008)
4. An Assessment of the Environmental Implications of Oil and Gas Produc-tion: A Regional Case Study, United States Environmental ProtectionAgency (2008)
5. McKenzie, L.M., Witter, R.Z., Newman, L.S., Adgate, J.L.: Human healthrisk assessment of air emissions from development of unconventionalnatural gas resources. Sci. Total Environ. 424, 79–87 (2012)
6. Chambers, A.K., Strosher, M., Wootton, T., Moncrieff, J., McCready, P.:Direct measurement of fugitive emissions of hydrocarbons from a refinery.J. Air Waste Manage. Assoc. 58, 1047–1056 (2008)
7. Camilli, R., Duryea, A.N.: Characterizing spatial and temporal variabilityof dissolved gases in aquatic environments with in situ mass spectrometry.Environ. Sci. Technol. 43, 5014–5021 (2009)
8. Kelly, E.N., Short, J.W., Schindler, D.W., Hodson, P.V., Ma, M.S., Kwan,A.K., Fortin, B.L.: Oil sands development contributes polycyclic aromaticcompounds to the Athabasca River and its tributaries. Proc. Natl. Acad. Sci.U. S. A. 106, 22346–22351 (2009)
9. Groat, C., Grimshaw, T.: Fact-Based Regulation for Environmental Pro-tection in Shale Gas Development. The Energy Institute, Austin (2012)
10. Lane, D.A.: Mobile mass-spectrometry. Environ. Sci. Technol. 16, A38–A46 (1982)
11. Taylor, S., Bierbaum, V.M.: Focus on harsh environment mass spectrom-etry. J. Am. Soc. Mass Spectrom. 19, 1375–1376 (2008)
12. Herndon, S.C., Jayne, J.T., Zahniser, M.S., Worsnop, D.R., Knighton, B.,Alwine, E., Lamb, B.K., Zavala, M., Nelson, D.D., McManus, J.B.,Shorter, J.H., Canagaratna, M.R., Onasch, T.B., Kolb, C.E.: Characteriza-tion of urban pollutant emission fluxes and ambient concentration distribu-tions using a mobile laboratory with rapid response instrumentation. Fara-day Discuss. 130, 327–339 (2005)
13. Guimbaud, C., Catoire, V., Gogo, S., Robert, C., Chartier, M., Laggoun-Defarge, F., Grossel, A., Alberic, P., Pomathiod, L., Nicoullaud, B., Rich-ard, G.: A portable infrared laser spectrometer for flux measurements oftrace gases at the geosphere-atmosphere interface. Meas. Sci. Technol. 22(2011)
14. Petron, G., Frost, G., Miller, B.R., Hirsch, A.I., Montzka, S.A., Karion, A.,Trainer, M., Sweeney, C., Andrews, A.E., Miller, L., Kofler, J., Bar-Ilan,A., Dlugokencky, E.J., Patrick, L., Moore, C.T., Ryerson, T.B., Siso, C.,Kolodzey, W., Lang, P.M., Conway, T., Novelli, P., Masarie, K., Hall, B.,Guenther, D., Kitzis, D., Miller, J., Welsh, D., Wolfe, D., Neff, W., Tans,P.: Hydrocarbon emissions characterization in the Colorado Front Range: apilot study. J. Geophys. Res.: Atmos. 117, D04304 (2012)
15. Cooks, R.G., Mueller, T.: Through a glass darkly: glimpses into the futureof mass spectrometry. Mass Spectrom. 2, S0001 (2013)
16. Etzkorn, J.M., Davey, N.G., Thompson, A.J., Creba, A.S., Leblanc, C.W.,Simpson, C.D., Krogh, E.T., Gill, C.G.: The use of MIMS-MS-MS in fieldlocations as an on-line quantitative environmental monitoring technique fortrace contaminants in air and water. J. Chromatogr. Sci. 47, 57–66 (2009)
17. Davey, N.G., Fitzpatrick, C.T.E., Etzkorn, J.M., Martinsen, M., Crampton,R.S., Onstad, G.D., Larson, T.V., Yost, M.G., Krogh, E.T., Gilroy, M.,Himes, K.H., Saganic, E.T., Simpson, C.D., Gill, C.G.: Measurement ofspatial and temporal variation in volatile hazardous air pollutants in
Tacoma, WA using a mobile membrane introduction mass spectrometry(MIMS) system. J. Environ. Sci. Health A 49, 1199–1208 (2014)
18. Lindinger, W., Hansel, A., Jordan, A.: Proton-transfer reaction mass spec-trometry (PTR-MS): on-line monitoring of volatile organic compounds atpptr levels. Chem. Soc. Rev. 27, 347–354 (1998)
19. Chen, H., Xia, Z.N., Pedersen-Bjergaard, S., Svensmark, B., Lauritsen,F.R.: Analysis of semivolatile pharmaceuticals and pollutants in organicmicro extracts using hot cell membrane inlet mass spectrometry. Anal.Chem. 81, 4010–4014 (2009)
20. Davey, N.G., Krogh, E.T., Gill, C.G.: Membrane introduction mass spec-trometry (MIMS). Trends Anal. Chem. 30, 1477–1485 (2011)
21. Wenner, P.G., Bell, R.J., van Amerom, F.H.W., Toler, S.K., Edkins, J.E.,Hall, M.L., Koehn, K., Short, R.T., Byrne, R.H.: Environmental chemicalmapping using an underwater mass spectrometer. Trends Anal. Chem. 23,288–295 (2004)
22. Ouyang, Z., Noll, R.J., Cooks, R.G.: Handheld miniature ion trap massspectrometers. Anal. Chem. 81, 2421–2425 (2009)
23. Camilli, R., Reddy, C.M., Yoerger, D.R., Van Mooy, B.A.S., Jakuba,M.V., Kinsey, J.C., McIntyre, C.P., Sylva, S.P., Maloney, J.V.: Trackinghydrocarbon plume transport and biodegradation at deepwater horizon.Science 330, 201–204 (2010)
24. Brkic, B., France, N., Taylor, S.: Oil-in-water monitoring using membraneinlet mass spectrometry. Anal. Chem. 83, 6230–6236 (2011)
25. Johnson, R.C., Cooks, R.G., Allen, T.M., Cisper, M.E., Hemberger, P.H.:Membrane introduction mass spectrometry: trends and applications. MassSpectrom. Rev. 19, 1–37 (2000)
26. Ketola, R.A., Kotiaho, T., Cisper, M.E., Allen, T.M.: Environmental ap-plications of membrane introduction mass spectrometry. J. Mass Spectrom.37, 457–476 (2002)
27. Overney, F.L., Enke, C.G.: A mathematical study of sample modulation ata membrane inlet mass spectrometer—potential application for the analysisof mixtures. J. Am. Soc. Mass Spectrom. 7, 93–100 (1996)
28. Jordan, A., Haidacher, S., Hanel, G., Hartungen, E., Herbig, J., Mark, L.,Schottkowsky, R., Seehauser, H., Sulzer, P., Mark, T.D.: An online ultra-high sensitivity proton-transfer-reaction mass-spectrometer combined withswitchable reagent ion capability (PTR+SRI-MS). Int. J. Mass Spectrom.286, 32–38 (2009)
29. Prince, B.J., Milligan, D.B., McEwan, M.J.: Application of selected ionflow tube mass spectrometry to real-time atmospheric monitoring. RapidCommun. Mass Spectrom. 24, 1763–1769 (2010)
30. Smith, D., Spanel, P.: Selected ion flow tube mass spectrometry (SIFT-MS)for on-line trace gas analysis. Mass Spectrom. Rev. 24, 661–700 (2005)
31. Yang, C.H., Khan, N.A., Wu, H.F.: Differentiation and quantification ofxylene by combining headspace solid-phase microextraction/gas chroma-tography and self-ion molecule reaction in an ion trap tandem mass spec-trometry. J. Sep. Sci. 31, 3050–3057 (2008)
32. Nelson, J.H., Friesen, D.A., Gill, C.G., Krogh, E.T.: On-line measurementof oxidative degradation kinetics for trace gasoline contaminants in aqueoussolutions and natural water by membrane introduction tandem mass spec-trometry. J. Environ. Sci. Health A 45, 1720–1731 (2010)
33. Thompson, A.J., Creba, A.S., Ferguson, R.M., Krogh, E.T., Gill, C.G.: Acoaxially heated membrane introduction mass spectrometry interface forthe rapid and sensitive on-line measurement of volatile and semivolatileorganic contaminants in air and water at parts-per-trillion levels. RapidCommun. Mass Spectrom. 20, 2000–2008 (2006)
34. Kaspar, J., Fornasiero, P., Hickey, N.: Automotive catalytic converters:current status and some perspectives. Catal. Today 77, 419–449 (2003)
35. Gasthauer, E., Maze, M., Marchand, J.P., Amouroux, J.: Characterizationof asphalt fume composition by GC/MS and effect of temperature. Fuel 87,1428–1434 (2008)
36. Huang, G.M., Gao, L., Duncan, J., Harper, J.D., Sanders, N.L., Ouyang, Z.,Cooks, R.G.: Direct detection of benzene, toluene, and ethylbenzene attrace levels in ambient air by atmospheric pressure chemical ionizationusing a handheld mass spectrometer. J. Am. Soc. Mass Spectrom. 21, 132–135 (2010)
37. Schwarzenbach, R.P., Gschwend, P.M., Imboden, D.M.: EnvironmentalOrganic Chemistry. John Wiley and Sons Ltd., Hoboken, NJ, USA (2003)
38. National Institute of Standards and Technology. NIST Chem Webbook.Available at: http://webbook.nist.gov/chemistry/ (2012). Accessed 3 Oct2014
R. J. Bell et al.: Portable MIMS – Real Time Quant. & Mapping 223

Paper III


B American Society for Mass Spectrometry, 2014DOI: 10.1007/s13361-014-1027-4
J. Am. Soc. Mass Spectrom. (2015) 26:201Y211
FOCUS: HARSH ENVIRONMENT AND FIELD-PORTABLE MASS SPECTROMETRY:RESEARCH ARTICLE
The Effect of the Earth’s and StrayMagnetic Fields onMobileMass Spectrometer Systems
Ryan J. Bell,1 Nicholas G. Davey,1,2 Morten Martinsen,3 R. Timothy Short,4 Chris G. Gill,1,2
Erik T. Krogh1,2
1Chemistry Department, Applied Environmental Research Laboratories (AERL), Vancouver Island University, Nanaimo, BC,Canada2Chemistry Department, University of Victoria, Victoria, BC, Canada3Chemistry Department, Norwegian University of Science and Technology (NTNU), Trondheim, Norway4SRI International, St. Petersburg, FL, USA
Abstract.Development of small, field-portablemass spectrometers has enabled a rapidgrowth of in-field measurements on mobile platforms. In such in-field measurements,unexpected signal variability has been observed by the authors in portable ion traps withinternal electron ionization. The orientation of magnetic fields (such as the Earth’s)relative to the ionization electron beam trajectory can significantly alter the electron fluxinto a quadrupole ion trap, resulting in significant changes in the instrumental sensitivity.Instrument simulations and experiments were performed relative to the earth’smagneticfield to assess the importance of (1) nonpoint-source electron sources, (2) vertical versushorizontal electron beam orientation, and (3) secondary magnetic fields created by theinstrument itself. Electron lens focus effectswere explored by additional simulations, and
were paralleled by experiments performed with a mass spectrometer mounted on a rotating platform. Additionally,magnetically permeable metals were used to shield (1) the entire instrument from the Earth’s magnetic field, and (2)the electron beam from both the Earth’s and instrument’s magnetic fields. Both simulation and experimental resultssuggest the predominant influence on directionally dependent signal variability is the result of the summation of twomagnetic vectors. As such, the most effective method for reducing this effect is the shielding of the electron beamfrom bothmagnetic vectors, thus improving electron beam alignment and removing any directional dependency. Theimproved ionizing electron beam alignment also allows for significant improvements in overall instrument sensitivity.Key words:Mobile mass spectrometry, Membrane introduction mass spectrometry (MIMS), Online in situ analysis,Field portable, Earth’s magnetic field, SIMION, Simulation, Mu-metal, Metglas, Electron beam trajectory deflection,Electron ionization
Received: 8 August 2014/Revised: 10 October 2014/Accepted: 11 October 2014/Published Online: 20 December 2014
Introduction
The popularity of field portable mass spectrometry is grow-ing as many of the technical hurdles of bringing laboratory
equipment into the field are overcome [1–3]. On-site analysis
requires that instrumentation can be transported conveniently,powered remotely, be free of self-contamination, and can beserviced in adverse conditions. Additionally, the instrumenta-tion should be capable of data collection while moving, andovercome any additional hurdles resulting from changing en-vironmental and sample conditions. For example, non-steadystate or transient conditions are likely to be more prevalent andmay require correction [4, 5]. Additionally, varied sampleconditions, such as temperature, pressure, and humidity, mayalter the relative instrumental response [3, 6–8], and changingenvironmental conditions may adversely affect the instrumentitself [9]. To our knowledge, apart from a report by Short et al.
Electronic supplementary material The online version of this article(doi:10.1007/s13361-014-1027-4) contains supplementary material, which isavailable to authorized users.
Correspondence to: Ryan J. Bell; e-mail: [email protected]; Chris G. Gill;e-mail: [email protected]

(2000) [9], the effect of magnetic fields, such as the Earth’s, onportable mass spectrometer signal intensity has not yet beenaddressed by the mass spectrometry community.
Electron beams that have a short path length or have suffi-ciently high energies are not meaningfully affected by weakmagnetic fields. Additionally, weak magnetic fields are likelyto have a negligible impact on the deflections of ion beamsbecause of their significantly greater relative momentum.However, when precise, low-energy electron beams areemployed, care must be taken to reduce the influence of un-controlled magnetic fields. For example, photoelectron spec-trometer components are intentionally lined with or constructedfrommagnetically permeable materials to limit the influence ofmagnetic fields [10]. Nickel-iron alloys such as mu-metal andother magnetically permeable materials have a magnetic per-meability many times that of free space, and tend to absorbpassing magnetic fields by providing a preferred location forfield transmittance. Thus, when instrumentation is encased inmu-metal, magnetic fields inside the instrument are greatlyreduced, avoiding unintended electron beam deflections.Although impractical in the context of portable mass spectrom-etry instrumentation, Helmholtz cages have also beenemployed to compensate for the effects of the Earth’s magneticfield in testing facilities [11] and in high resolution cathode raytubes [12].
In mass spectrometry, relatively low energy electron beams(e.g., 70 eV) are used in electron ionization (EI) sources.Though generally the ion source is located as close as possibleto the mass analyzer, maintaining a flexible design sometimesnecessitates transmission distances of several centimeters be-fore electrons enter a small ion source electron aperture (e.g., G3 mm diameter). In these cases, ionization efficiency (andtherefore the instrument’s relative sensitivity) will be depen-dent on the electron beam flux stability. Normally, in a station-ary mass spectrometer, local magnetic fields are constant, andelectron beam deflections go unobserved, or are compensatedfor by instrumental tuning optimizations. Occasionally, thesefields are not constant; for example, we have observed thatlocating a solenoid pump or solenoid valve near the massspectrometer’s vacuum housing may result in a detectableeffect on the signal intensity. For example, when samplingunderwater vents in Yellowstone Lake in September 2003 witha portable underwater membrane introduction mass spectrom-etry system, an observable beat in the measured signals resultedfrom the operation of the solenoid sampling pump(Supplementary Figure S1). Post-deployment, it was discov-ered that the beat intensity was proportional to the proximity ofthe solenoid pump to the instrument’s vacuum chamber.Encasing the pump in magnetically permeable metal resolvedthe issue (data not shown).
Field portable instrumentation also experiences variedmagnetic fields as a result of changing its orientationwith respect to the Earth’s magnetic field. The resultingtransient deflection of electron trajectory may generate asignificant source of instrumental variability. In addition,
the magnetic fields created by various mass spectrometersystems (e.g., vacuum pumps, inductors, or filament cur-rent) may also affect electron beam deflection. The sum-mation of multiple magnetic field vectors will have anadditive effect that is directionally dependent.
These effects are difficult to observe when instrumen-tation is operated in a GC mode because of the highlyvariable nature of the instrumental signal during a GCscan. Further, the effects are compensated for if instru-ment orientation is not changed between calibration andsample analysis, as recommended by instrument manu-facturers. However, when operating in a continuous mea-surement mode, signal variability becomes easily ob-served when underway. In our case, the effect was high-ly intensified during operation with a sub-optimumelectron lens voltage.
In this study, we characterize the influence of magneticbearing on the relative instrument response of several fieldportable mass spectrometers, simulate the electron beam trans-mission efficiencies for several instrumental conditions, anddemonstrate simple instrumental modifications that providemagnetic shielding, resulting in better signal stability and sen-sitivity gains.
ExperimentalAs noted above, we have experimentally observed a directionaldependence of the relative instrument response for a variety offield portable mass spectrometers. To better understand thisphenomenon, simulations were performed using SIMION(v8.1, Scientific Instrument Services Inc., Ringoes, NJ, USA)software that incorporated the influence of the Earth’s magneticfield on an electron impact ion source as an instrument isrotated through 360°. Results from the rotation of a verticalelectron beam were compared with that for a horizontal elec-tron beam. Additional simulations explored the result ofasymmetries generated from the use of a linear filament geom-etry as an electron source in an otherwise cylindrical system,and also the additive effect of local instrumental magneticfields with the Earth’s magnetic field. Simulation results weredirectly compared with experimental data collected in thelaboratory.
To reduce the influence of magnetic fields on the relativeinstrumental response, three methods were explored experi-mentally and compared with simulations. First, the ion source’selectron beam focus was altered, allowing the comparison ofunfocused and well-focused electron beams. Next, the entireinstrument was protected from the Earth’s magnetic field by amu-metal casing, reducing the presence of directionally depen-dent magnetic fields. Last, Metglas (an amorphous metallicribbon material with very high magnetic permeability) wasused to line the inside the instrument’s vacuum chamber sur-rounding the electron beam to reduce the influence of both theEarth’s and the much of the instrument’s magnetic field.
202 R. J. Bell et al.: Magnetic Field’s Effects on Mobile MS Systems

Mobile Mass Spectrometer Relative ResponseVersus Orientation
To demonstrate the effects of the orientation of the Earth’smagnetic field on the relative instrumental response of differentmobile mass spectrometers, experimental field data obtainedfrom four different instruments were compared by analyzing asteady-state internal standard signal while the mass spectrom-eter’s magnetic orientation (azimuth) was changed. All massspectrometers utilized membrane sampling inlets employingpolydimethylsiloxane capillary membranes maintained at con-stant temperatures. Membrane introduction mass spectrometry(MIMS) provides a direct analysis approach for the continuousquantitative online monitoring of specific analytes and internalstandards. For additional background on MIMS, which isoften employed in mobile mass spectrometry systems be-cause of its simplicity, several reviews of the techniquehave been published [13–15].
The first instrument used was a field operableMIMS systemmade from a bench top, hyperbolic electrode quadrupole iontrap (QIT) (Model Saturn 2000; Agilent Technologies, SantaClara, CA, USA), employing internal ionization. In this instru-ment, the electrons ejected from a hot filament are acceleratedto 70 eV and transmitted ~1.7 cm before a focusing gateelectrode guides the electrons through a 1 mm aperture in oneof the ion trap’s endcaps. The quantity of ions formed (and thusthe relative signal intensity) is proportional to the number ofelectrons that pass through the 1 mm aperture. In addition, thisinstrument has the electron beam on a horizontal axis, parallelto the Earth’s surface. To compare instrument response tomagnetic orientation, a continuously infused 1 ppb aqueousdimethylsulfide solution was analyzed using full scan massspectra (m/z 62) while operated onboard a moving marineresearch vessel (R/V Suncoaster, St Petersburg, FL, 1999) thatwas intentionally rotated 360°. Field orientation was deter-mined by measuring the magnetic field perpendicular to theelectron beam using a three-axis magnetometer (Model 2300;Honeywell, Morristown, NJ, USA) [9].
Data were also collected from a field portable cylindricalelectrode quadrupole ion trap (CIT) (Model Griffin 400; FLIRSystems, West Lafayette, IN, USA), equipped with a custom-built membrane interface. This instrument uses a 75 eV elec-tron beam for ionization within the ion storage volume of thetrap. The electron path length from the filament to the end capaperture is approximately 4.6 cm and a simple, three electrodecylindrical Einzel lens is used to focus the electron beamthrough a 2.5 mm aperture in one of the trap endcap plates.In this system, the electron beam axis is perpendicular to theEarth’s surface (i.e., a vertical electron beam). Toluene-d8(used as an internal standard) was supplied to the membraneinterface in air samples using a permeation tube (Kin-Tek, LaMarque, TX, USA) housed in a thermally regulated permeationchamber in line with the membrane interface. The full scaninstrument response with respect to orientation was obtained byoperating the mass spectrometer inside a moving vehicle whileanalyzing exterior air continuously infused with 75 ppbv
toluene-d8 (m/z 98). Orientation was derived from GPS datawhile the vehicle was traveling in a ‘figure eight’ pattern.
The third instrument included in the study was a compactlinear quadrupole mass spectrometer (Model TranspectorCPM; Inficon, Syracuse, NY, USA) implemented as the massanalyzer in an underwater membrane introduction mass spec-trometry system [16]. This mass spectrometer uses a closedelectron ionization source, whereby 70 eV electrons producedby the filament travel about 2 mm before passing through a 5mm × 2 mm slot. The data used here, collected from fieldstudies made in Lake Maggoire, St Petersburg, FL, were alsoused in work published by Wenner et al. (2004) [17]. In thiswork, orientation was also derived from GPS data while thevehicle was travelling in a ‘lawn mower’ pattern. Electronbeam direction (vertical vs. horizontal) was not determined.
The final instrument examined in this study was also ahyperbolic electrode quadrupole ion trap that utilizes an exter-nal electron ionization source (Model GCQ; Finnigan MAT,San Jose, CA, USA). This system employs an ion source inwhich 70 eV electrons from the filament are collimated into aspiraling beam by two permanent magnets (~300–400 G). Thefocused electrons are passed through two apertures (each about2.6 mm diameter) over 4.8 mm distance prior to entering theion source, travelling on a vertical axis (i.e., perpendicular tothe Earth’s surface). Ions generated in the source are subse-quently injected into the ion trap by a compact ion lens system.Full scan data (m/z 98) from a toluene-d8 internal standardinfused into ambient air at 341 ppbv were obtained in the samemanner as described for the CIT (vide supra). The data usedhere, collected while conducting field measurements inTacoma, WA, was analyzed as part of a study published byDavey et al. (2014) [1]. Orientation was derived from GPSdata.
Electron Beam Deflection Simulations
Ten simulations conducted using SIMION software are pre-sented to understand the contributing factors and possiblesolutions to unintended electron beam deflections by magneticfields in a mass spectrometer ion source. The electron beamwas simulated as it traveled from the electrons’ origin, throughthe focusing lens, and either passing through the end plateaperture or impacting the endplate. For these simulation stud-ies, the ion source geometry and voltages of the CIT (videsupra) were used. The 2D-cylindrical model used to simulatethe CIT ion source and transmission efficiency is shown inFigure 1. Constant values for the simulations included the elec-tron deflector plate (–10 V), the ion trap endplates (0 V), andring electrode (75 V), the initial electron kinetic energy (0.2 eV),mean electron source location (x = 0 mm, y = 0 mm), and filledelectron axial cone angle (80°). The initial electron kineticenergy was calculated assuming a 2050°C filament [18], usinga Maxwellian distribution [19, 20]. Simulations were performedusing 10,000 electrons at each of eight rotational steps (45°)relative to the Earth’s magnetic field, with an additional ninthcondition of no magnetic field from the Earth. Set-points that
R. J. Bell et al.: Magnetic Field’s Effects on Mobile MS Systems 203

were varied between simulations are summarized in Table 1.Intensities for the Earth’s magnetic field in Nanaimo, Canada(Bx = 0.18 G, By = 0.054 G, and Bz = 0.51 G) were obtainedusing the IGRF function from the Matlab (Mathworks, Natick,
MA, USA) file exchange, and confirmed using the an Androidsmartphone (Model Incredible; HTC Corporation, TaoyuanCity, Taiwan). The smartphone contained a vector magnetome-ter that was monitored and logged using the AndroSensor (ver.1.9.4.4a) application.
Simulations 1 through 3 were conducted to test whether thecause of observed signal variations in field measurementscould be due to the relative orientation of the Earth’s magneticfield. The electron beam in these simulations was orientedperpendicular to the Earth’s magnetic field (i.e., a verticalelectron beam), as is the case for the normal operation of theCIT system. Simulation 1 (intended to be the idealized case)was conducted with all electrons originating from a pointsource. Simulation 2 was identical, except that the origin ofthe electrons approximated the linear filament found in the CITsystem. Here, the electrons were sourced from a Gaussiandistribution (SD = 0.3 mm) along a line in the y direction.Simulation 3 was performed using the same conditions asSimulation 2, with the exception of an additional secondarymagnetic field. This secondary field was not rotated with theEarth’s magnetic field, thus simulating the measured magneticfield originating within the instrument itself. The intensity ofthis vector (Bx = –0.047 G, By = 0.21 G, and Bz = –0.63 G) wasdetermined using a magnetometer adjacent to the instrument’svacuum housing, and subtracting the Earth’s magnetic contri-butions. Because the magnetic field in the instrument housingvaries strongly within a few centimeters, this determination islikely one of the largest sources of error for these simulations.Simulations 4 through 6 were parallel experiments toSimulations 1 through 3 except that the magnetic vectors werealtered to reproduce the Earth’s field rotating about the instru-ment’s yz plane, simulating a horizontal electron beam. Thehorizontal beam has a distinctly different symmetry with re-spect to the Earth’s magnetic field than the vertical electronbeam. Although the CITwas not designed to be operated in thisorientation, a horizontal electron beam was employed in thehyperbolic electrode quadrupole ion trap (i.e., Saturn 2000,vide supra).
Electron Beam Defocusing Studies
Together, Simulations 3, 7, and 8 were designed to determinethe importance of electron trajectory deflection when the elec-tron beam is refocused by altering the Einzel lens voltage whilein the vertical electron beam configuration. Simulation 3 wasused as a reference, employing the manufacturer recommendedset-point of 25 V for the Einzel lens, whereas Simulation 7 and8 used a lens voltage of 75 V and 200 V, respectively.
For direct comparisons with the simulations, analogousexperiments were conducted on the CIT system. Toluene wasused as a constantly infused analyte (via 70 ppbv air samplescontinuously infused to the membrane interface), and the in-strument was located on a free moving turntable where 0° ismagnetic north in Nanaimo, Canada. In this case, the instru-ment analyzed the toluene using anMS/MS scan (m/z 91→ 65,10 μA electron current, 150 ms ionization time, 1.5 V dissoci-ation voltage, and 20 ms dissociation time).
Figure 1. SIMION model approximating the CIT ion sourceshown in a vertical orientation relative to the Earth’s surface(xy plane). The electron trajectories shown in this example areinfluenced the Earth’s magnetic field, the sum of which is out ofthe page (y) and, as a result, electron deflection is rightward (x).The dashed reference lines demarcate the entrance aperture’s xposition and are intended to help visualize electron deflection
204 R. J. Bell et al.: Magnetic Field’s Effects on Mobile MS Systems

Magnetic Field Shielding Effects
Simulations 3, 9, 10, and their associated parallel experiments(again, using the CIT) were performed to determine the effec-tiveness of using magnetically permeable materials to reducethe intensity of the Earth’s magnetic field experienced by themass spectrometer. Simulation 3 was used as a reference point,and Simulation 9 was designed to match the conditions thatwere determined after paneling the entire instrument with mu-metal. In this case, the instrument’s outside casing was coveredwith about 1.6 m2 of 0.1 mm thick nickel alloy foil, or mu-metal (μ ≈ 50,000) (Product Number 8912 K32; McMasterCarr, Elmhurst, IL, USA), held in place with adhesive tape.Magnetic fields inside the instrument after the mu-metal wasinstalled were determined by locating the magnetometer next tothe vacuum housing and rotating the operational instrumentthrough 360°. The magnitude of instrument’s and Earth’smagnetic field vectors were resolved using custom Matlabcode. It was determined that the mu-metal resulted in a 66%reduction in the intensity of the Earth’s x, y, and z magneticfield vectors. The instrument’s internal magnetic fieldschanged slightly, but this was highly dependent on the exactlocation of the magnetometer. Because of this, it was decided toretain the original numbers for the instrument’s magnetic fieldfor consistency with each simulation.
Simulation 10 was designed to match the conditions thatwere determined after the interior of the vacuum chamber waslined with a 10 layer thick cylinder of 0.015 mm thick Metglas(μ ≈ 290,000, Metglas 2075 M; Metglas, Conway, SC, USA)mounted on the interior wall of the CIT instrument’s vacuumchamber. Several small holes were cut in the Metglas cylinderto allow the necessary electrical feed-through connections re-quired for normal operation. The magnetic fields in the vacuumhousing were characterized by locating themagnetometer with-in the vacuum chamber and rotating the (nonoperational) in-strument through 360°. It was determined that the xy compo-nents of both the Earth and instrument magnetic fields were
negligible. Because the top and bottom of the chamber were notprotected by Metglas, there was a significant z field. Over thecourse of the study, it was also determined that the differencebetween the instrument’s internal magnetic field was smallwhen operating or not, suggesting the instrument’s fields areprimarily sourced from the permanent magnets in theturbomolecular vacuum pump (Model TC100; PfeifferVacuum, Asslar, Germany). Neither the mu-metal foil nor theMetglas were annealed for this work, which would furtherincrease their relative magnetic permeability.
Figures were generated using Matlab, and the data plottedwith respect to the field orientation was best fit with a linedetermined by a nonlinear fit to y = a + b*sin(c + x) +d*sin(2*(e + x). Error bars shown in simulated data representthe SD of electron transmission through the aperture for the10,000 simulated electrons binned into groups of 10. Error barsshown in experimental data represent the SD of the 24 steadystate signal measurements.
ResultsMobile Mass Spectrometer Sensitivity VersusDirectional Bearing
For the purpose of demonstrating the in-field response of amobile mass spectrometer to relative to the Earth’s magneticorientation, internal standard signal intensities for the fourmobile mass spectrometer systems examined are plotted inFigure 2. Data shown in Figure 2a and b were produced byquadrupole ion traps using internal ionization directly withinthe ion storage volume, requiring the injection of electronsthrough an endcap aperture. In both cases, there was an ob-served dependence on directional bearing in which the signalintensity displays one maxima per 360° rotation. Shown inFigure 2c are data obtained for a quadrupole ion trap with anexternal ion source that generates ions using electrons focused
Table 1. Parameters Varied Between Simulations of the CIT Ion Source. Electron Beam Orientation is with Respect to the Earth’s Surface (i.e., the xy plane). Lensand Ion Trap Design are Depicted in Figure 1 and Described in Text
Sim. # Description Electron beamorientation
Lens (V) SF of electronsource on y(mm)
Earth’s field (G) Instrumentreferenced field (G)
Bx By Bz Bx By Bz
1 Earth’s field only vertical 25 0 0.18 0.054 0.51 0 0 02 Earth’s field + filament vertical 25 0.3 0.18 0.054 0.51 0 0 03 Earth’s field + filament + instrument’s field vertical 25 0.3 0.18 0.054 0.51 0.21 –0.047 –0.634 Earth’s field only horizontal 25 0 0.18 0.054 0.51 0 0 05 Earth’s field + filament horizontal 25 0.3 0.18 0.054 0.51 0 0 06 Earth’s field + filament + instrument’s field horizontal 25 0.3 0.18 0.054 0.51 0.21 –0.047 –0.637 Earth’s field + filament + instrument’s
field + altered focusvertical 75 0.3 0.18 0.054 0.51 0.21 –0.047 –0.63
8 Earth’s field + filament + instrument’sfield + very altered focus
vertical 200 0.3 0.18 0.054 0.51 0.21 –0.047 –0.63
9 Earth’s field + filament + instrument’sfield + mu-metal around instrument
vertical 25 0.3 0.060 0.018 0.17 0.21 –0.047 –0.63
10 Earth’s field + filament + instrument’sfield + Metglas in vacuum chamber
vertical 25 0.3 0 0 0.51 0 0 –0.63
R. J. Bell et al.: Magnetic Field’s Effects on Mobile MS Systems 205
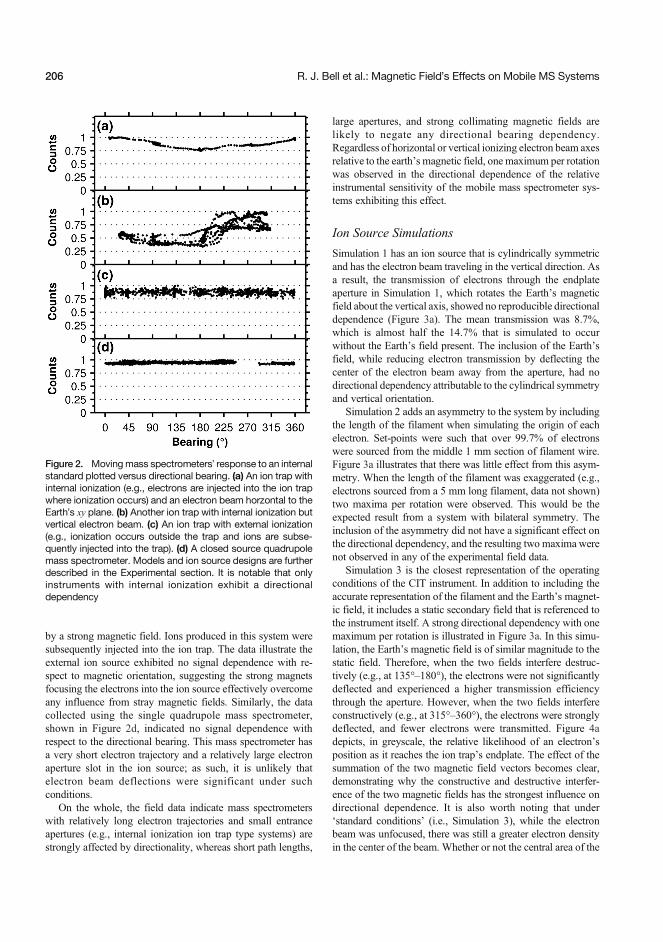
by a strong magnetic field. Ions produced in this system weresubsequently injected into the ion trap. The data illustrate theexternal ion source exhibited no signal dependence with re-spect to magnetic orientation, suggesting the strong magnetsfocusing the electrons into the ion source effectively overcomeany influence from stray magnetic fields. Similarly, the datacollected using the single quadrupole mass spectrometer,shown in Figure 2d, indicated no signal dependence withrespect to the directional bearing. This mass spectrometer hasa very short electron trajectory and a relatively large electronaperture slot in the ion source; as such, it is unlikely thatelectron beam deflections were significant under suchconditions.
On the whole, the field data indicate mass spectrometerswith relatively long electron trajectories and small entranceapertures (e.g., internal ionization ion trap type systems) arestrongly affected by directionality, whereas short path lengths,
large apertures, and strong collimating magnetic fields arelikely to negate any directional bearing dependency.Regardless of horizontal or vertical ionizing electron beam axesrelative to the earth’s magnetic field, one maximum per rotationwas observed in the directional dependence of the relativeinstrumental sensitivity of the mobile mass spectrometer sys-tems exhibiting this effect.
Ion Source Simulations
Simulation 1 has an ion source that is cylindrically symmetricand has the electron beam traveling in the vertical direction. Asa result, the transmission of electrons through the endplateaperture in Simulation 1, which rotates the Earth’s magneticfield about the vertical axis, showed no reproducible directionaldependence (Figure 3a). The mean transmission was 8.7%,which is almost half the 14.7% that is simulated to occurwithout the Earth’s field present. The inclusion of the Earth’sfield, while reducing electron transmission by deflecting thecenter of the electron beam away from the aperture, had nodirectional dependency attributable to the cylindrical symmetryand vertical orientation.
Simulation 2 adds an asymmetry to the system by includingthe length of the filament when simulating the origin of eachelectron. Set-points were such that over 99.7% of electronswere sourced from the middle 1 mm section of filament wire.Figure 3a illustrates that there was little effect from this asym-metry. When the length of the filament was exaggerated (e.g.,electrons sourced from a 5 mm long filament, data not shown)two maxima per rotation were observed. This would be theexpected result from a system with bilateral symmetry. Theinclusion of the asymmetry did not have a significant effect onthe directional dependency, and the resulting two maxima werenot observed in any of the experimental field data.
Simulation 3 is the closest representation of the operatingconditions of the CIT instrument. In addition to including theaccurate representation of the filament and the Earth’s magnet-ic field, it includes a static secondary field that is referenced tothe instrument itself. A strong directional dependency with onemaximum per rotation is illustrated in Figure 3a. In this simu-lation, the Earth’s magnetic field is of similar magnitude to thestatic field. Therefore, when the two fields interfere destruc-tively (e.g., at 135°–180°), the electrons were not significantlydeflected and experienced a higher transmission efficiencythrough the aperture. However, when the two fields interfereconstructively (e.g., at 315°–360°), the electrons were stronglydeflected, and fewer electrons were transmitted. Figure 4adepicts, in greyscale, the relative likelihood of an electron’sposition as it reaches the ion trap’s endplate. The effect of thesummation of the two magnetic field vectors becomes clear,demonstrating why the constructive and destructive interfer-ence of the two magnetic fields has the strongest influence ondirectional dependence. It is also worth noting that under‘standard conditions’ (i.e., Simulation 3), while the electronbeam was unfocused, there was still a greater electron densityin the center of the beam. Whether or not the central area of the
Figure 2. Movingmass spectrometers’ response to an internalstandard plotted versus directional bearing. (a) An ion trap withinternal ionization (e.g., electrons are injected into the ion trapwhere ionization occurs) and an electron beam horzontal to theEarth’s xy plane. (b) Another ion trap with internal ionization butvertical electron beam. (c) An ion trap with external ionization(e.g., ionization occurs outside the trap and ions are subse-quently injected into the trap). (d) A closed source quadrupolemass spectrometer. Models and ion source designs are furtherdescribed in the Experimental section. It is notable that onlyinstruments with internal ionization exhibit a directionaldependency
206 R. J. Bell et al.: Magnetic Field’s Effects on Mobile MS Systems

electron beam passes the aperture had a significant effect on thenumber of electrons ultimately entering the ion trap and sub-sequently ionizing neutral molecules.
In the case of the vertical electron beam, Simulation 3 (Figure3a) accurately predicted the one maximum per rotation signalobserved in the field measurements for the mobile mass spec-trometers. Given the additional asymmetry that results from ahorizontal electron beam, one might expect two maxima in sucha system. However, Figure 2a depicts a mass spectrometer in thefield with a horizontal electron beam—also with one maximumper rotation. Simulation 4 (horizontal electron beam, pointsource electron source, Figure 3b) shows that the effect of theEarth’s field alone does, in fact, create a two maxima directionaldependency. The inclusion of the filament wire in the electronsource has a rather small effect (Figure 3b, Simulation 5).
However, Simulation 6, which included the additional instru-ment referencedmagnetic field, shows a dramatic onemaximumdirectional dependency (Figure 3b). The constructive/destructive interference of the two fields clearly had a verystrong effect on the system and explains why the QIT, with ahorizontal electron beam, displays a dominant one maximumdirection dependency on the field. It is noteworthy that thedimensions of the QIT are different from the CIT and themagnitude of signal variation was not expected to be in agree-ment between Simulation 6 (Figure 3b) and Figure 2a.
Reducing the Relative Response Variability
Having established a plausible mechanism for the variation insignal intensity with respect to the instrument’s magnetic
Figure 3. Simulation of electron transmission of a vertical (a) and a horizontal (b) electron beam through endplate aperture versusthe Earth’s field orientation. Simulation 1 and 4, Earth’s field + point source filament; Simulation 2 and 5, Earth’s field + transversefilament wire; and Simulation 3 and 6, Earth’s field + transverse filament wire + instrument’s field
Figure 4. Density maps indicating the xy location of electrons as they reach the ion trap endplate for Simulations 3 [25 V lens, (a)]and 8 [200 V lens, (b)] under different magnetic bearing conditions. Each subplot is calculated from 10,000 electrons, the dark greyrepresents high probability of an electron at that position, and light grey represents low probability. The outside rectangle representsthe outside edge of the endplate and the central circle represents the endplate aperture. Magnetic bearing and percent of electronspassing the aperture are indicated
R. J. Bell et al.: Magnetic Field’s Effects on Mobile MS Systems 207

orientation, Simulation 3 was used as a starting point forsubsequent simulations and experiments. These studies wereaimed at determining an effective way to reduce the observedsensitivity dependency related to directional bearing.Simulations 3 and 7–10 were matched with a parallel experi-ment performed in the lab with a CIT instrument mounted on aturntable. Simulations 7 and 8 simulate the results when theelectrons are not focused according to manufactures specifica-tions by the Einzel lens prior to the aperture. Figure 4b showsthe improved aperture transmission relative to Figure 4aresulting from altering the lens voltage from 25 V(Simulation 3) to 200 V (Simulation 8). Experimental dataare in relatively good agreement with Simulations 3, 7, and 8(Figure 5). These data suggest that a defocused electron beam(Simulation 3) does not necessarily reduce the directional de-pendency, but does reduce instrumental sensitivity. Not shownare simulations with an increased secondary field. In thesesimulations, a well-focused beam can result in an extremedirectional dependency as the entire beam may be transmittedor rejected by the aperture depending on the state of interfer-ence with the Earth’s magnetic field.
Simulation 9 compared electron aperture clearance withSimulation 3 after a reduction in the Earth’s magnetic field byadding mu-metal on the outside of the instrument, andSimulation 10 compared transmittance after a reduction in boththe Earth’s and instrument’s fields by adding Metglas on theinside of the vacuum chamber. These simulations were directlycompared with instrumental data collected under the samemagnetic conditions (Figure 6). Simulation 3 indicates a58.7% variation in signal intensity as a result of the additiveeffect of the Earth’s and the instrument’s fields. Simulation 9indicates that this is reduced to a 21.7% signal variability withthe addition of mu-metal on the outside of the instrument (a
reduction of 62.9% in the signal variability). This result iscomparable to the experimental data, which demonstrated a47.4% reduction in actual signal variance between the standardand mu-metal conditions. Simulation 10 indicates we can ex-pect 4.9% signal variability (a reduction of 93.2% in the signalvariability) as a result of the Metglas addition. This result iscomparable to the actual data from the CIT that displayed a92.3% reduction in signal variability between the standard andMetglas conditions. This reduction made the relative responsevariability due to the instrument’s magnetic orientation virtu-ally indistinguishable from other instrumental noise.
DiscussionRegardless of the specifics of the mass spectrometer instrumentsymmetry, the results of these studies suggest the best way tominimize directional response dependency is to shield lowenergy electron beams from both the Earth’s and instrument’smagnetic fields. In doing so, the electron beam can be properlyaligned for optimum ionization, regardless of the orientation ofthe instrumentation during mobile measurements. Both simu-lation and experimental results indicate that in addition tosignificantly reducing the signal variability during deployment,the focusing lens may be tuned to ensure a higher electronthroughput yielding significant improvements in sensitivity.Simulations indicate that a well-tuned lens can improve instru-mental sensitivity nearly 10-fold. However, it should be notedthat shielding of the electron beam from stray magnetic fieldsbecomes imperative in this case, as it is possible that the tightlyfocused electron beam could miss the entrance aperture entire-ly. With increased sensitivity, the opportunity to reduce therequired filament emission current arises; this may be desirable
Figure 5. Electron transmission versus Earth’s field orientation under varied lens set-points. (a) Illustration of the percentage ofelectrons transmittedwith a lens set-point of 25V (Simulation 3), 75 V (Simulation 7), and 200 V (Simulation 8); (b) plots the instrumentresponse to an internal standard during a parallel experiment performed on a mass spectrometer under the same conditions as thesimulation
208 R. J. Bell et al.: Magnetic Field’s Effects on Mobile MS Systems

when the vacuum chamber is under relatively oxidative condi-tions, as is common inMIMS systems. This would yield longerfilament lifetimes and lower the signals from background gases[7, 21].
Another factor that should be considered is the electroncurrent control feedback mechanism. In order to produce aconstant electron ionization current, ion sources are designedto maintain a constant flow of electrons by using a feedbackcontrol system. Typically, there are two methods to monitorand control filament emission current. One is achieved bymonitoring the filament emission current using the filamentpower supply circuitry; this methodology provides no correc-tion for the variations in transmission through the ion trapentrance aperture. Another method is to monitor the electroncurrent on an aperture plate in the ion optical system (e.g., theion trap entrance aperture); use of this method assumes that thecurrent collected on this plate is a constant fraction of thetransmitted electron current. This methodology provides feed-back control for emission control circuitry but unfortunatelymay serve to exaggerate the directional dependence. In thiscase, fewer electrons may be entering the ionization regionbecause of deflection by external magnetic fields. With moreelectrons striking the aperture plate, this would provide errone-ous feedback that acts to decrease filament current, resulting infurther reduction of the transmitted electron current. Anotherfeedback option, however, could be to measure the electroncurrent on the ion trap exit endplate. This feedback mechanismwould compensate for variations in transmitted electron currentby increasing filament current when transmission is decreased.Since only the transmitted electrons contribute to the feedback,this method would compensate for deflections resulting fromthe Earth’s magnetic field. However, it may prove impractical
because of the radio frequency trapping fields of the trap, whichmay direct a portion of transmitted electrons into the ringelectrode instead.
Additionally, the use of automatic gain control may helpcompensate for the observed phenomena, although gain controlwas fixed during these studies. Since mass spectrometers canhave several scan types and pre-scans, and the directionaldependence of the full scan and an MS/MS scan varies slightlywith the CIT (data not shown). Such variability is likely due tochanges in ionization time estimated by instrumental gaincontrol pre-scans. Investigation of this phenomenon was be-yond the scope of the current study.
Solutions not explored in this work include the use ofmagnetically permeable paints or magnetically permeablecomponents, especially those components closest to the elec-tron beam (e.g., the lenses and vacuum housing). Additionally,simulations suggest that in some situations where precision iskey, it may be prudent to use a pointed filament that would givea more cylindrically symmetric electron beam than that pro-duced by a linear filament wire perpendicular to the electronbeam. Locally shielding specific instrumental components thatare contributing to the instrument’s magnetic field may also bebeneficial, especially if it is not practical to sufficiently shieldthe electron beam.
Some instrumental components can have very strong mag-netic fields (e.g., from the filament current, turbo pump mag-netic bearings, or induction coils). Further, if the componentgenerates cyclical fields (e.g., a motor or pulsing solenoid), thefield coming in and out of phase with specific mass scans maysignificantly affect instrument stability. Depending on aliasingand frequency reproducibly, this noise may show up as a beat(as demonstrated in Supplementary Figure S1) or as random
Figure 6. Electron transmission versus Earth’s field orientation under varied magnetic field conditions. (a) The percentage ofsimulated electrons transmitted through the aperture with no protection from magnetic fields (Simulation 3), 66% reduction of theEarth’s magnetic field by an exterior mu-metal casing (Simulation 9), and 95% reduction of both the Earth’s field and instrument’sfield by interior Metglas (Simulation 10); (b) plots the relative instrumental response to an internal standard during a parallelexperiment performed on a CIT mass spectrometer operated under the same conditions as the simulation
R. J. Bell et al.: Magnetic Field’s Effects on Mobile MS Systems 209

noise. A noteworthy source of instrumental magnetic fieldsmay be the electric current through the filament. A filamentoperating at 5 amps (a high but not unusual current for an ionsource), would have a field equal to the Earth’s at a distance of2 cm. While this field intensity would decrease rapidly withdistance (Ampere’s Law), it will be very intense in closeproximity to the filament. This will cause significant deflectionnear the filament and be very difficult to prevent; however, thesubsequent focusing via the Einzel lens dampens the effect ofdeflections prior to and within the lens. Magnetic fields locatedbetween the lens and ion trap entrance endplate will have themost significant impact on electron beam deflections. Thiseffect can be observed through careful examination of electrontrajectories relative to the aperture reference lines shown inFigure 1, and suggests this effect could be minimized byplacing the Einzel lens as close as possible to the ion trapendplate.
Last, as this study occurred in Nanaimo, Canada, all simu-lations were done assuming a field at that location (latitude,longitude, and near sea-level altitude). At higher latitudes, theEarth’s magnetic z vector is rather strong and subsequently xand y vectors are rather weak. Since the z vector does notcontribute to the deflection of electrons travelling in the verticalaxis, the effects observed in this manuscript will be stronger atmore equatorial latitudes.
ConclusionsTo our knowledge, this is the first rigorous study of the influ-ence of stray magnetic fields from the Earth and/or instrumentalsources on the relative signal response and sensitivity of por-table mass spectrometers. Signal variability is observed withinstruments in which ionizing electrons have long path lengthsand must pass through a small aperture, and are observed whenthe instrument is physically moved with respect to the Earth’smagnetic field. It was found that the predominant source ofsignal variability is a result of the vector sum of the Earth’smagnetic field and a secondary, instrument-referenced magnet-ic field. Removing either one will result in a significantlyreduced directional dependence. Preferably, both fields canbe shielded from the electron beam by the addition of magnet-ically permeable material to the vacuum chamber. In this case,directional dependence will become increasingly negligible asthe deflection of the electron beam is eliminated. Subsequently,the optimum alignment of electron ionization beams may allowfor improved electron beam focusing and significant gains ininstrument sensitivity.
AcknowledgmentsThe authors gratefully acknowledge the assistance of the staffof the Center for Ocean Technology, College of Marine Sci-ence, and the C. D. Simpson Laboratories at the University ofWashington for their assistance with the collection of variousfield data. The authors also thank the students and staff of the
Applied Environmental Research Laboratories (AERL) fortheir assistance with this project, and the notably insightfulinput from Kyle Duncan. They also thank two anonymousreviewers for their thoughtful reviews and intellectual contri-butions to this manuscript. They are grateful to VancouverIsland University and the University of Victoria for their on-going support of graduate students and the Natural Science andEngineering Research Council of Canada for support.
References1. Davey, N.G., Fitzpatrick, C.T.E., Etzkorn, M.J., Martinsen, M., Crampton,
R.S., Onstad, G.D., Larson, T.V., Yost, M.G., Krogh, E.T., Gilroy, M.,Himes, K.H, Saganić, E.T., Simpson, C.D., Gill, C.G.: Measurement ofspatial and temporal variation in volatile hazardous air pollutants in Taco-ma, WA using a mobile membrane introduction mass spectrometry(MIMS) system. J. Environ. Sci. Health A. 49, 1199–1208 (2014)
2. Taylor, S., Bierbaum, V.M.: Focus on harsh environment mass spectrom-etry. J. Am. Soc. Mass Spectrom. 19, 1375–1376 (2008)
3. Huang, G., Gao, L., Duncan, J., Harper, J.D., Sanders, N.L.,Ouyang, Z., Cooks, G.R.: Direct detection of benzene, toluene,and ethylbenzene at trace levels in ambient air by atmosphericpressure chemical ionization using a handheld mass spectrometer.J. Am. Soc. Mass Spectrom. 21, 132–135 (2010)
4. Short, R.T., Toler, S.K., Kibelka, G.P.G., Rueda Roa, D.T., Bell, R.J.,Byrne, R.H.: Detection and quantification of chemical plumes using aportable underwater membrane introduction mass spectrometer. TrACTrends Anal. Chem. 25, 637–646 (2006)
5. Janfelt, C., Lauritsen, F.R., Toler, S.K., Bell, R.J., Short, R.T.: Method forquantification of chemicals in a pollution plume using amovingmembrane-based sensor exemplified by mass spectrometry. Anal. Chem. 79, 5336–5342 (2007)
6. Bell, R.J., Short, R.T., van Amerom, F.H.W., Byrne, R.H.: Calibration ofan in situ membrane inlet mass spectrometer for measurements of dissolvedgases and volatile organics in seawater. Environ. Sci. Technol. 41, 8123–8128 (2007)
7. Bell, R.J., Short, R.T., Byrne, R.H.: In situ determination of total dissolvedinorganic carbon by underwater membrane introduction mass spectrome-try. Limnol. Oceanogr. Methods 9, 164–175 (2011)
8. Diaz, J.A., Pieri, D., Arkin, C.R., Gore, E., Griffin, T.P., Fladeland, M.,Bland, G., Soto, C., Madrigal, Y., Castillo, D., Rojas, E., Achi, S.: Utiliza-tion of in situ airborne MS-based instrumentation for the study of gaseousemissions at active volcanoes. Int. J. Mass Spectrom. 295, 105–112 (2010)
9. Short, R.T., Fries, D.P., Kerr, M.L.: Influence of the Earth’s magnetic fieldon portable mass spectrometers, in field-portable miniature mass spectrom-etry. Proceedings of the 12th Sanibel Conference on Mass Spectrometry,Sanibel Island, Florida, 22–25 Jan 2000
10. Teodoro, O., Silva, J., Moutinho, A.: Multitechnique surface analysissystem: apparatus description. Vacuum 46, 1205–1209 (1995)
11. Poppenk, F.M., Amini, R., Brouwer, G.F.: Design and application of aHelmholtz cage for testing nano-satellites. Proceedings of the ESA-ESTEC6th International Symposium Environmental Testing for Space Pro-gramme, Noordwijk, The Netherlands, 12–14 June 2007
12. Goldwasser, S.: TV and monitor CRT (Picture Tube) information (v2.02),Samuel M. Goldwasser (1998)
13. Davey, N.G., Krogh, E.T., Gill, C.G.: Membrane-introduction mass spec-trometry (MIMS). TrAC Trends Anal. Chem. 30, 1477–1485 (2011)
14. Ketola, R.A., Kotiaho, T., Cisper, M.E., Allen, T.M.: Environmental ap-plications of membrane introduction mass spectrometry. J. Mass Spectrom.37, 457–476 (2002)
15. Johnson, R.C., Cooks, R.G., Allen, T.M., Cisper, M.E., Hemberger, P.H.:Membrane introduction mass spectrometry: trends and applications. MassSpectrom. Rev. 19, 1–37 (2000)
16. Short, R.T., Fries, D.P., Toler, S.K., Lembke, C.E., Byrne, R.H.: Develop-ment of an underwater mass-spectrometry system for in situ chemicalanalysis. Meas. Sci. Technol. 10, 1195–1201 (1999)
17. Wenner, P.G., Bell, R.J., van Amerom, F.H.W., Toler, S.K., Edkins, J.E.,Hall, M.L., Koehn, K., Short, R.T., Byrne, R.H.: Environmental chemicalmapping using an underwater mass spectrometer. TrAC Trends Anal.Chem. 23, 288–295 (2004)
210 R. J. Bell et al.: Magnetic Field’s Effects on Mobile MS Systems

18. Jenkins, R.: A review of thermionic cathodes. Vacuum 19, 353–359(1969)
19. Kiser, R.W.: Introduction to mass spectrometry and its applications,(2nd ed.), pp. 195–197. Prentice-Hall, Inc, Upper Saddle River, NJ(1965)
20. Honig, R.E.: Ionization potentials of some hydrocarbon series. J. Chem.Phys. 16, 105–112 (1948)
21. Ørsnes, H., Bohatka, S., Degn, H.: Reaction of water at hot filamentinterferes with measurements of dissolved gases by membrane inlet massspectrometry. Rapid Commun. Mass Spectrom. 11, 1736–1738 (1997)
R. J. Bell et al.: Magnetic Field’s Effects on Mobile MS Systems 211


Paper IV


A field portable membrane introduction mass spectrometer with in-linestandard infusion and sample heat exchanger for real-time monitoring ofvolatile organic compounds in aqueous samples
Morten R. Martinsen a,⁎, Nicholas G. Davey b, Ryan J. Bell b,c, Erik T. Krogh b, Chris G. Gill b,Øyvind Mikkelsen a, Rudolf Schmid a
a Department of Chemistry, Norwegian University of Science and Technology (NTNU), NO-7491 Trondheim, Norwayb Applied Environmental Research Laboratories (AERL), Chemistry Department, Vancouver Island University, 900 Fifth Street, Nanaimo, BC V9R 5S5, Canadac Beaver Creek Analytical, 707 W Lucerne Dr, Lafayette, CO 80026, USA
A B S T R A C TA R T I C L E I N F O
Article history:Received 3 July 2020Received in revised form 14 September 2020Accepted 16 September 2020Available online 22 September 2020
Maintaining a steady sample temperature when analyzing real-time samples in the field is crucial for Membrane Intro-ductionMass Spectrometry (MIMS). Diffusion through themembrane interface is temperature dependent, and sampletemperature might vary depending on the sample source. In order to reduce this source of inaccuracy, an in-field andonline continuous monitoring system based on (MIMS) coupled with a heat exchanger and in-line standard additionwas developed for monitoring volatile organic compounds (VOC) in actual field samples. Parametric studies of theheat exchanger have been conducted in the laboratory. In order to maintain control on instrumental signal drift duringcontinuous, long-term analysis periods, the system used continuous infusion of internal standard (tuloene-d8) into thesample stream and also provided the possibility to infuse, in the sameway, an analyte for standard addition calibration.This set-up has been utilized in the field for analyzing both natural water sources and heavily polluted process water.The system was demonstrated to offer a rapid method for quantifying volatile hazardous pollutants in aqueous matri-ces with good time-resolution.
Keywords:VOCWater contaminationMembrane introduction mass spectrometry(MIMS)Mobile mass spectrometryOn-site contaminant analysisSample stream heat exchanger
1. Introduction
The release of volatile organic compounds (VOC) and semi-volatile or-ganic compounds (SVOC) into the environment can be traced back toboth natural and anthropogenic sources [1–4]. Monitoring the release ofthese compounds to the environment by monitoring programs is normallydone using nationally or internationally standardized methods, such asISO or EPA methods. For aqueous solution analyses, purge-and-trap gaschromatography/mass spectrometry is the preferred method of analysisfor VOCs and SVOCs, e.g. EPA method 18 and EPA-NERL 542.2 [5,6]These are well-proven and reliable methods for environmental monitoringprograms, but require time-consuming sample preparation and chromato-graphic separation, reducing their capabilities to resolve detailed com-pound variations in highly dynamic environments.
With an increasing demand for on-site online and real-time monitoringfor environmental surveys, membrane introduction mass spectrometry(MIMS) has seen increased use [3,7–10]. Typically, MIMS uses a semi-permeable polymer membrane, such as polydimethylsiloxane (PDMS),with hydrophobic properties. The hydrophobic properties will prevent dif-fusion of particulates, water and highly polar and ionic compounds, whileenhancing diffusion of compounds with a hydrophobic nature, yielding aMIMS system that is selective and sensitive for volatile and semi-volatile or-ganic compounds (VOC/SVOC). This type of membrane will reject hydro-philic sample matrix and, thus, allow enrichment of these analytes fromboth liquid or gaseous samples. After diffusion through the membrane,analytes are directly transferred, often using helium gas as the carrier ac-ceptor phase, to a mass spectrometer for subsequent ionization, resolutionand quantitative measurement [10].
Environmental Chemistry and Ecotoxicology 2 (2020) 168–174
⁎ Corresponding author.E-mail address:[email protected]. (M.R. Martinsen).
http://dx.doi.org/10.1016/j.enceco.2020.09.0032590-1826/© 2020 The Author. Production and hosting by Elsevier B.V. on behalf of KeAi Communications Co., Ltd. This is an open access article under the CC BY-NC-NDlicense (http://creativecommons.org/licenses/by-nc-nd/4.0/).
Contents lists available at ScienceDirect
Environmental Chemistry and Ecotoxicologyj ourna l homepage: www.kea ipub l i sh ing.com/en/ journa ls /env i ronmenta l -chemist ry -
and-ecotox ico logy/
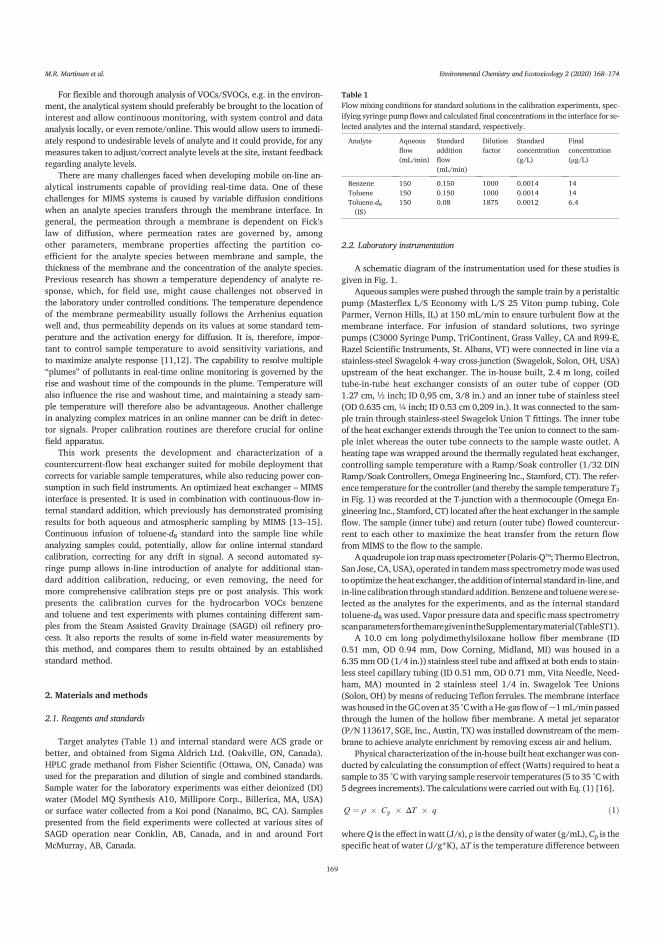
For flexible and thorough analysis of VOCs/SVOCs, e.g. in the environ-ment, the analytical system should preferably be brought to the location ofinterest and allow continuous monitoring, with system control and dataanalysis locally, or even remote/online. This would allow users to immedi-ately respond to undesirable levels of analyte and it could provide, for anymeasures taken to adjust/correct analyte levels at the site, instant feedbackregarding analyte levels.
There are many challenges faced when developing mobile on-line an-alytical instruments capable of providing real-time data. One of thesechallenges for MIMS systems is caused by variable diffusion conditionswhen an analyte species transfers through the membrane interface. Ingeneral, the permeation through a membrane is dependent on Fick'slaw of diffusion, where permeation rates are governed by, amongother parameters, membrane properties affecting the partition co-efficient for the analyte species between membrane and sample, thethickness of the membrane and the concentration of the analyte species.Previous research has shown a temperature dependency of analyte re-sponse, which, for field use, might cause challenges not observed inthe laboratory under controlled conditions. The temperature dependenceof the membrane permeability usually follows the Arrhenius equationwell and, thus permeability depends on its values at some standard tem-perature and the activation energy for diffusion. It is, therefore, impor-tant to control sample temperature to avoid sensitivity variations, andto maximize analyte response [11,12]. The capability to resolve multiple“plumes” of pollutants in real-time online monitoring is governed by therise and washout time of the compounds in the plume. Temperature willalso influence the rise and washout time, and maintaining a steady sam-ple temperature will therefore also be advantageous. Another challengein analyzing complex matrices in an online manner can be drift in detec-tor signals. Proper calibration routines are therefore crucial for onlinefield apparatus.
This work presents the development and characterization of acountercurrent-flow heat exchanger suited for mobile deployment thatcorrects for variable sample temperatures, while also reducing power con-sumption in such field instruments. An optimized heat exchanger – MIMSinterface is presented. It is used in combination with continuous-flow in-ternal standard addition, which previously has demonstrated promisingresults for both aqueous and atmospheric sampling by MIMS [13–15].Continuous infusion of toluene‑d8 standard into the sample line whileanalyzing samples could, potentially, allow for online internal standardcalibration, correcting for any drift in signal. A second automated sy-ringe pump allows in-line introduction of analyte for additional stan-dard addition calibration, reducing, or even removing, the need formore comprehensive calibration steps pre or post analysis. This workpresents the calibration curves for the hydrocarbon VOCs benzeneand toluene and test experiments with plumes containing different sam-ples from the Steam Assisted Gravity Drainage (SAGD) oil refinery pro-cess. It also reports the results of some in-field water measurements bythis method, and compares them to results obtained by an establishedstandard method.
2. Materials and methods
2.1. Reagents and standards
Target analytes (Table 1) and internal standard were ACS grade orbetter, and obtained from Sigma Aldrich Ltd. (Oakville, ON, Canada).HPLC grade methanol from Fisher Scientific (Ottawa, ON, Canada) wasused for the preparation and dilution of single and combined standards.Sample water for the laboratory experiments was either deionized (DI)water (Model MQ Synthesis A10, Millipore Corp., Billerica, MA, USA)or surface water collected from a Koi pond (Nanaimo, BC, CA). Samplespresented from the field experiments were collected at various sites ofSAGD operation near Conklin, AB, Canada, and in and around FortMcMurray, AB, Canada.
2.2. Laboratory instrumentation
A schematic diagram of the instrumentation used for these studies isgiven in Fig. 1.
Aqueous samples were pushed through the sample train by a peristalticpump (Masterflex L/S Economy with L/S 25 Viton pump tubing, ColeParmer, Vernon Hills, IL) at 150 mL/min to ensure turbulent flow at themembrane interface. For infusion of standard solutions, two syringepumps (C3000 Syringe Pump, TriContinent, Grass Valley, CA and R99-E,Razel Scientific Instruments, St. Albans, VT) were connected in line via astainless-steel Swagelok 4-way cross-junction (Swagelok, Solon, OH, USA)upstream of the heat exchanger. The in-house built, 2.4 m long, coiledtube-in-tube heat exchanger consists of an outer tube of copper (OD1.27 cm, ½ inch; ID 0,95 cm, 3/8 in.) and an inner tube of stainless steel(OD 0.635 cm, ¼ inch; ID 0.53 cm 0,209 in.). It was connected to the sam-ple train through stainless-steel Swagelok Union T fittings. The inner tubeof the heat exchanger extends through the Tee union to connect to the sam-ple inlet whereas the outer tube connects to the sample waste outlet. Aheating tape was wrapped around the thermally regulated heat exchanger,controlling sample temperature with a Ramp/Soak controller (1/32 DINRamp/Soak Controllers, Omega Engineering Inc., Stamford, CT). The refer-ence temperature for the controller (and thereby the sample temperature T3in Fig. 1) was recorded at the T-junction with a thermocouple (Omega En-gineering Inc., Stamford, CT) located after the heat exchanger in the sampleflow. The sample (inner tube) and return (outer tube) flowed countercur-rent to each other to maximize the heat transfer from the return flowfrom MIMS to the flow to the sample.
Aquadrupole ion trapmass spectrometer (Polaris-Q™; ThermoElectron,San Jose, CA,USA), operated in tandemmass spectrometrymodewas usedtooptimize theheatexchanger, theadditionof internal standard in-line, andin-line calibration through standardaddition.Benzeneand toluenewere se-lected as the analytes for the experiments, and as the internal standardtoluene‑d8 was used. Vapor pressure data and specific mass spectrometryscanparametersforthemaregivenintheSupplementarymaterial(TableST1).
A 10.0 cm long polydimethylsiloxane hollow fiber membrane (ID0.51 mm, OD 0.94 mm, Dow Corning, Midland, MI) was housed in a6.35 mmOD (1/4 in.)) stainless steel tube and affixed at both ends to stain-less steel capillary tubing (ID 0.51 mm, OD 0.71 mm, Vita Needle, Need-ham, MA) mounted in 2 stainless steel 1/4 in. Swagelok Tee Unions(Solon, OH) by means of reducing Teflon ferrules. The membrane interfacewas housed in theGCovenat 35 °Cwith aHe-gasflowof~1mL/minpassedthrough the lumen of the hollow fiber membrane. A metal jet separator(P/N 113617, SGE, Inc., Austin, TX) was installed downstream of the mem-brane to achieve analyte enrichment by removing excess air and helium.
Physical characterization of the in-house built heat exchanger was con-ducted by calculating the consumption of effect (Watts) required to heat asample to 35 °Cwith varying sample reservoir temperatures (5 to 35 °Cwith5 degrees increments). The calculationswere carried outwith Eq. (1) [16].
Q ¼ ρ � Cp � ΔT � q ð1Þ
whereQ is the effect inwatt (J/s), ρ is the density of water (g/mL),Cp is thespecific heat of water (J/g*K), ΔT is the temperature difference between
Table 1Flow mixing conditions for standard solutions in the calibration experiments, spec-ifying syringe pumpflows and calculatedfinal concentrations in the interface for se-lected analytes and the internal standard, respectively.
Analyte Aqueousflow(mL/min)
Standardadditionflow(mL/min)
Dilutionfactor
Standardconcentration(g/L)
Finalconcentration(μg/L)
Benzene 150 0.150 1000 0.0014 14Toluene 150 0.150 1000 0.0014 14Toluene‑d8(IS)
150 0.08 1875 0.0012 6.4
M.R. Martinsen et al. Environmental Chemistry and Ecotoxicology 2 (2020) 168–174
169

sample temperatureand theheated sample temperature (K), andq is the vol-umetricflow rate (mL/s).
Power consumption needed to heat the sample from its original temper-ature to a final temperature for analysis was linked directly to recordedtemperature of the sample. This was done in real time, by using the giventemperature difference (ΔT). As seen in Fig. 1 Three different temperatureswere recorded at specific locations in the sample stream. For the calculationof effect to heat the sample, ΔT comes from the subtraction of T1 from T2(ΔT= T2-T1). The externally required effect corresponds to the subtractionof power required to heat and power given from the sample in the heat ex-changer on the return, from T2 to T3.
Analyte calibrations were performed by using continuously infused in-ternal standard calibration. The delivery of a combined standard and the in-ternal standards was achieved with the two syringe pumps, infusingstandards directly to the aqueous sample flow at the 4-way cross-junction(Fig. 1). A combined standard was prepared with toluene, benzene andnaphthalene in methanol to a final concentration of 14 mg/L each (how-ever, the naphthalene data were not used further). The toluene‑d8 used asinternal standard (IS) and was prepared in methanol to a final concentra-tion of 12 mg/L. With deionized water (DI) flowing at a set flow rate of150 mL/min over the membrane, the internal standard was infused withone syringe pump at a constant flow rate of 0,080 mL/min while the com-bined standard was injected with the second syringe pump at varying flowrates, yielding specific dilutions and thereby a range of concentrations from3 to 50 μg/L. See Table 1. For some examples of a setup of infusion flows,dilutions and concentrations. Relative Response factors, RRF, for theanalytes (A) were calculated from Eq. (2) based on the standard and inter-nal standard concentrations, [A] and [IS] respectively, and used for quanti-fication in further experiments.
RRF ¼ SignalA= A½ �SignalIS= IS½ � ð2Þ
Plume experiments were simulated by injecting various solutions into asample stream of DI water (150 mL/min) at various lengths of time with asyringe pump at a set flow rate (0.150 mL/min). Plumes of contaminantsproducing both steady- and non-steady state conditions were created. Theartificial plume was made up of a standard containing benzene only in
methanol at a concentration of 14 μg/L. For quantification of the contami-nants, a constant flow of IS was infused at a set flow rate (0.08 mL/min) tothe same sample stream. Test experiments for plume detection with morerealistic matrices were also performed successfully where the DI waterwas replaced by surface water collected from a koi pond (results not re-ported). Furthermore, a process water sample from a (tar sand) oil extrac-tion process was injected in plume experiments (with dilution in DIwater) to better simulate contamination during field operation of theinstrumentation.
2.3. Field instrumentation
The instrumental setup used during field deployment is shown inFig. SF2. A modified GC/MS system with a cylindrical ion trap mass spec-trometer (Griffin™ 400, FLIR© Systems, Inc., West Laffayette, IN, USA) op-erated in tandem mode was used to obtain the MIMS data. Additionaldetails regarding the field portable ion trap system have been publishedelsewhere [1].
Calibrations done pre-deployment were acquired by using a dilutemethanol standard of target analytes (Table 1) combined with toluene‑d8as an internal standard injected at set volumes to a separate closed loop re-circulationMIMS system (not represented in Figs. 1 and SF2) with a flow of150 mL/min. Relative response factors were calculated at several differentμg/L sample concentrations using MIMS steady state signals based onEq. (2).
Water samples were collected from the source (e.g. lake, pond, creek orriver) with a peristaltic pump, described earlier in this section. These sam-pleswere analyzed in real time and online at specific locations. The temper-ature of sample entering the MIMS interface was regulated (35 °C) bymeans of the heat exchanger. Sampling time varied between 1 h and 3 h.A standard comprised of target analytes (Table 1) was injected at the endof each run by means of an automated syringe pump (Figs. 1 and SF2) foran additional in-field calibration check. When continuous monitoring wasnot feasible, samples were analyzed as grab samples (e.g. ground water,process water and, in general, water from inaccessible locations), bycollecting the water in 4 L brown glass bottles and analyzing them in theMIMS system within 3–4 h. Quality Control subsamples for conventionalanalysis of BTEX compounds using static headspace-GC/MS (EPA 5021
Fig. 1. Schematics of MIMS apparatus with a dual syringe pump setup for direct standard infusion. An in-house built heat exchanger was connected in-line to ensure stablesample temperatures in the membrane interface at low energy consumption. The three locations for temperature measurements for the test of the heat exchanger areindicated in the figure as T1, T2 and T3. Specific adaptations for use in the laboratory and the field experiments, respectively, are shown in the Supplementary Material (inFigs. SF1 and SF2).
M.R. Martinsen et al. Environmental Chemistry and Ecotoxicology 2 (2020) 168–174
170

and EPA 8260) by an accredited laboratory (ALS Environmental, Edmon-ton, AB, Canada) were collected in-line while sampling (Fig. SF2, at theOutlet for subsampling). Subsamples were collected both while analyzingthe sample and during standard injection for method validation.
3. Results and discussion
3.1. Heat exchanger
Theminimization of power consumption is of key importance when op-erating an instrument in-field, especially when operating on (limited) bat-tery power. A heat exchanger system should be able to reduce powerconsumption of the temperature control of the sample stream. Utilizingtemperature regulation of the sample gives the advantage of having a ther-mally more stable feed of sample to the membrane interface, as membranepermeation is dependent on temperature, among other parameters [12].This is especially important when operating in-field, where sample temper-atures may vary widely. Depending on the nature of in-field samples, tem-peratures may be from 5 °C, e.g. in a low temperature ground waterreservoir, to well above 20 °C or higher for surface water bodies.
The developed heat exchanger and syringe pump assembly wereemployed to optimize our in-field aqueous MIMS analysis system includingthe use of a continuously infused internal standard. The power consump-tion of the heat exchanger was characterized with respect to sample feedtemperature and sample flow first, in a laboratory MIMS system. This wasdone to optimize (and maximize) the efficiency of the heat exchanger forlow power consumption, to allow longest possible field operation. In gen-eral, the energy consumption of the heat exchanger for maintaining a tem-perature above sample temperature increases with decreasing sample feedtemperature.
The in-house built heat exchanger was investigated with regard topower consumption and was found to have a heat transfer efficiency ofabout 70%. To further characterize the heat exchanger, experiments wereconducted to calculate the different sources of power consumption andtheir respectivemagnitude. Shown in Fig. 2 are the results of the calculationof (A) power required to heat the sample to 35 °C from varying sample res-ervoir temperature with varying flow and (B) externally required power forthe heat exchanger tomaintain the sample temperature of 35 °C under samephysical parameters as (A).
With increasing flow rate and decreasing sample reservoir temperaturethe power required to heat the sample increases. With a sample tempera-ture of 5 °C the heat exchanger was incapable of maintaining a sample tem-perature of 35 °C with flow rates above 250 mL/min.
A flow rate of 150 mL/min was selected, as higher flow rates requireddisproportionately more power by the heater to keep a stable sample tem-perature at low sample temperatures. For a flow of 150 mL/min about140 W is required from an external power source to heat a sample from5 °C to 35 °C. The dead volume of the inner tube of the heat exchanger isabout 50 mL creating a thermal equilibration time of 20 s.
3.2. Calibrations
Calibrations for MIMS analyses are normally done in a recirculating sys-tem with standard addition of selected standards, which makes the processof in-field calibrations cumbersome [17]. With the dual syringe pump andthe heat exchanger assembly, calibration could be performedwith a contin-uous infusion of an internal standard simultaneouslywith the infusion of se-lected standards under controlled temperature conditions. For portabledeployment, this allows improved calibration routines of the instrumenta-tion for rapid QA/QC.
In the present laboratory experiments the typical procedure of calibra-tion was for two selected compounds, benzene and toluene, using an inter-nal standard. The concentrations of benzene and toluene in the calibrationsample stream were regulated by the syringe pump with the standard mix-ture solution, controlling the analyte flow into the DI water sample streamby its pumping speed. Standard solution was added repeatedly in intervalswith blank periods in between during the calibration, usually in a sequenceof increasing concentration levels. Meanwhile, the internal standard is per-manently infused at a set flow rate over the course of standard injections,maintaining a constant concentration.
An example of MIMS data from such a calibration sequence can be seenin Fig. SF3 for calibration levels of 0, 3, 5, 15, and 50 μg/L of benzene andtoluene, with lengths for standard and blank infusion intervals of approxi-mately 10–20 min each. Under these conditions, it seems as if the tracesat the lower concentrations reach, or get quite close to, steady-state levels(within 2–4 min), while the signal at highest concentration (for toluene inparticular) seems to slowly increase in intensity until the end of the intervalplume. This requires an unambiguous specification of where signal sizeshould be measured within a plume for clearly non-steady state plumes.Calibration curves and their linear regression functions for a representativeinternal standard-based calibration experiment are shown in Fig. SF4. Thecalibration offered a good linearity over a range of concentrations (R2 =0.9991 and 0.9997, respectively, for benzene and toluene) in the concentra-tion range investigated (3–50 μg/L) with no, or small, deviations fromsteady state plume signals. For in-field calibrations the heat exchanger -syringe pump assembly offers a very convenient and simple way of
Fig. 2. Calculated power required to heat a sample from various reservoir temperatures (5–35 °C) at various flow rates assuming no heat exchange (A). The experimentallydetermined amounts of power needed externally for heating the heat exchanger to reach a sample temperature of 35 °C at specific flow rates with varying sample reservoirtemperatures (5–25 °C) (B).
M.R. Martinsen et al. Environmental Chemistry and Ecotoxicology 2 (2020) 168–174
171

calibration by the internal standard method, as well as the possibility tocontinuously infuse an internal standard while analyzing a sample of inter-est. As seen in Fig. 3.
In order to check the robustness of calibration, the variations in relativeresponse factors, RRF, at various initial temperatures and flow velocities ofthe sample can be compared. Looking at the values for 10, 20 and 35 °C fortemperature variation, and for 100, 150 and 200 mL/min for variation inflow velocities, the variations in RRF are moderate. Values are varyingwithin about 15% between lowest and highest relative response, as isshown in Fig. SF5.
3.3. Resolution and quantification of sequential plumes
Resolving multiple plumes in an aqueous body, e.g. a running stream,can represent a problem as contaminants within a plume have different res-idence/pervaporation times within the membrane, depending on theirchemical and physical properties. Having two plumes passing a sample
inlet in a limited timewindow can, therefore, result in undesireable overlapof the tailing signal of the less volatile compounds from the first plumewiththe signals from the second one. For environmental monitoring, however,the ability to resolve sequential plumes of pollution within an often limitedwindow of time is important. With aqueous MIMS analysis this is, amongmany factors, limited by the nature of the compounds of interest within aplume. The retention time within the membrane, i.e. the rate ofpervaporation to the gas phase will depend primarily on the volatility ofthe compounds (transfer/evaporation into the acceptor gas phase) for agiven membrane. For testing this context, attempts were made to simulateplumes in the laboratory, with a combined standard of benzene and tolu-ene. In addition, for more realistic testing, a SAGD process water samplecontaining volatile aromatic hydrocarbons was injected, which created aplume simulating contamination from a heavy oil process facility. In theseexperiments plume time lengths of several minutes were tested, where sig-nal responses for analytes were expected not to be at, but hopefully not toofar from, steady state behavior. The scope of this experiment was to demon-strate plumes passing over a sample inlet during a limited time windowwhere steady state therefore is not expected to be achieved.
Fig. 3 (A) shows artificial pulses (plumes) of the process water sampleinjected by one syringe pump into aDIwater stream at two different lengthsof exposure, while, for quantitative purposes, an internal standard was in-fused continuously alongside by the other pump. Fig. 3 (B) shows the SIMtrace from plumes of the benzene in the sample from a this heavy oil pro-cessing facility. Firstly, two plumes were simulated with a 20 min injectiontime, then two shorter plumes with an 8 min injection time of the samesample. As shown in the figure, neither the 8 min nor the 20 min plumereaches steady state.
It is also evident, that at the same infused concentration, the shorterplumes only reach about 80–90% of the maximum height of the longerones. Calibration accuracy will, therefore, (also) be dependent on howlong the sample plume lengths are compared to the plume lenghts duringcalibration. In the simple (but probably unrealistic) case of clear-cut squarepulse plumes, the width of the signals recorded could indicate the plumewidth to be used for post analysis calibration work. For such a case, hypo-thetically, one could also derive signal width- dependent correction factorsfor the quantitation of peaks calibrated at a different plume duration, if highaccuracy is required and makes the considerable extra effort worthwhile.
The signal of the internal standard, continuously infused at a concentra-tion of 8 μg/L, can be seen in Fig. 3(C).
Using the regression equation from the calibration (see Fig. SF4) theconcentration of benzene was calculated to about 3 μg/L for each concen-tration. As the signal height is dependent on the plume length, the accuracyfor these plumes in the experiment of Fig. 3 is coarsely estimated at +/−10%, based on the observed peak height dependence on plume length (re-duction of 10–15% for the shorter plume). This uncertainty might be moresignificant than the uncertainty by precision determined in the calibrationcurve, as long as plume lengths are variable (not identical to the calibration
Fig. 3. (A) represents the flow rate of sample of heavy oil process water (boiler feedwater, BFW) added by the automated syringe pump to the DI water sample stream.(B) Shows the variation in signal intensity for the benzene signal during thesequential injections of pulses of the process water sample. (C) shows the signalintensity of toluene‑d8 during the course of the experiment (with a signal dipduring syringe refill at about 178 min, and at the end of internal calibration at225 min).
Table 2Comparison of concentration data for benzene of real samples obtained from MIMS data in the field, and data measured by a commercial laboratory (ALS, using standardsampling and analysis methods), respectively. For an overview of sampling locations please refer to Fig. SF8.
Benzene
Sample MIMS - Sample (μg/L) ALS - Sample (μg/L) Qual. Contr.: MIMS - Sample with Comb. Standard (μg/L) Qual. Contr.: ALS– Sample with Comb. Standard (μg/L)
A (McLean creek) <0.5 <0.5 13.8 20.6B (Paw pond) <0.5 <0.5 14.6 10.6C (Rommegrot creek) <0.5 <0.5 13.9 14.6D (Christina River) <0.5 <0.5 14.4 0.7E (Tailing pond 1) 0.7 <0.5 15 20.2F (Process water) 28.6 29.1 50.3 46.5G (Tailing pond 2) 13.5 13.7 23.6 36.8H (Clearwater River) <0.5 <0.5 13.4 14.2I (Athabasca River) <0.5 <0.5 13.5 16.8J (ALS DI experiment)a <0.5 <0.5 13.7 18.3
a Experiment conducted with deionized water (DI), where DI with and without combined standard was analyzed with MIMS and ALS.
M.R. Martinsen et al. Environmental Chemistry and Ecotoxicology 2 (2020) 168–174
172

pulses). It will lead to systematic underestimation of concentrations in shortplumes - the shorter the plume, the more pronounced the error.
Limiting factors for time-resolving successive plumes are the rise andwashout times of analytes in the membrane interface (illustrated for a20 min rectangular concentration pulse (plume) of benzene in heavy oilprocess water in Fig. SF6). The t10–90 rise times for each plume of benzenein a sequence of rectangular plumes in Fig. 3Bwere calculated to be, respec-tively, 3.3, 2.8, 2.4 and 2.3 min (Fig. SF7). These values are slightly higherthan determined earlier [1]. The washout time (t90–10) was estimated to berespectively 5, 5.5, 3.3 and 5.5 min for the same plumes.
As Figs. 3 and SF7 show for the 20min plumes of benzee, the baseline isreached about 10 min after the end of the plume for this highly volatile an-alyte. Signals for less volatile analytes will return more slowly (comparebenzene and toluene in Fig. SF3) and settling times might be significantlyhigher than these 10 min, maybe as high as 30 min. Considering the ob-served rise- and washout times, one can assume a resolving power of oneplume, depending on the nature of the analytes, to be 30–50 min if full res-olution of the plumes is desired. The estimations presented here are notbased on a steady state signal, as plumes occurring during sampling in acreek or a stream (especially when close to the location of introductioninto the water body) might be short and not reach a steady state when pass-ing by the sample inlet. To attempt a quantitation by peak height, that doesnot massively deviate from a probable real value, we would estimate thatsignals with widths (at 10% of maximum height) of at least about 1.5 to 2times the sum of rise and washout time (t10–90 + t90–10) would be recom-mended. Alternatively, calibration with adapted realistic plume widthsshould be performed.
3.4. Quality control and data verification
During experiments carried out in the field, several grab samples rang-ing from process water to streams and rivers were collected. Sampling loca-tions are given in Fig. SF8. Each sample was collected in duplex, where onepart was injected with a combined standard of BTEX compounds (in thispaper we focus on benzene and toluene, with a concentration of about20 μg/L) and the other was not. Both these samples were then split intotwo parts where one set of subsamples without and one with combinedstandard added were analyzed with a field portable MIMS, and the othertwo subsamples were sent for laboratory analysis by an accredited commer-cial analysis laboratory (ALS Environmental). Results for benzene and tolu-ene are presented in Table 2 and Table 3, respectively. As can be seen theresults of the analyses with MIMS and those of conventional samplingand analysis (by ALS Environmental) are comparable, both for the real sam-ples and the quality control samples. Actually, the results for the controlsamples show larger deviations between MIMS measurements and conven-tional analyses than the quantifiable results of the field samples (E - G). Inthe majority of cases, the conventional analyses measure lower concentra-tions, some of them up to 35% lower values (sample H). However, the
statistical basis is tooweak to draw any firm conclusions. In the quality con-trol sample D (containing injected combined standard) the concentrationsof both benzene and toluene show very lowmeasured values in the analysiswith conventional methods. This may be attributed to either a fault in theaddition of the combined standard to water sample D, or to an error withthe combined standard itself in this specific case, as all other sampleshave reasonable concentrations.
4. Conclusions
An in-field membrane introduction mass spectrometry (MIMS) systemusing a countercurrent-flow heat exchanger has been successfully testedin the field for online determinations of VOCs in the μg/L range. Optimizedparameters with respect to stability and heating power savings were found.This, together with the continuous infusion of toluene‑d8 as an internalstandard into the sample streamwas used to both achieve stable online cal-ibration and to compensate for signal drift. Quantitative results of in-fieldMIMS analyses for benzene and toluene of water samples, both fromSAGD oil refinery process operation, and from various freshwater bodiesin Alberta (Can), and corresponding control (grab) samples analyzed by acommercial laboratory are found to be in good agreement. The techniquewas successfully used for rapid and simultaneous measurement of volatileorganic chemicals in a variety of freshwater samples.
Acknowledgements
The authors gratefully acknowledge the students and staff of the Ap-plied Environmental Research Laboratory (AERL) for their assistance withthis project. The authors thank Vancouver IslandUniversity and the Norwe-gian University of Science and Technology for their ongoing support. Thiswork was supported in part by funding from Statoil ASA (Grand No4502457485).
Appendix A. Supplementary data
Supplementary data to this article can be found online at https://doi.org/10.1016/j.enceco.2020.09.003.
References
[1] R.J. Bell, N.G. Davey, M. Martinsen, C. Collin-Hansen, E.T. Krogh, C.G. Gill, A field-portable membrane introduction mass spectrometer for real-time quantitation and spa-tial mapping of atmospheric and aqueous contaminants, J. Am. Soc. Mass Spectrom. 26(2) (2015) 212–223.
[2] N.G. Davey, C.T.E. Fitzpatrick, J.M. Etzkorn, M. Martinsen, R.S. Crampton, G.D. Onstad,et al., Measurement of spatial and temporal variation in volatile hazardous air pollut-ants in Tacoma, Washington, using a mobile membrane introduction mass spectrometry(MIMS) system, J. Environ. Sci. Heal. A 49 (11) (2014) 1199–1208.
Table 3Comparison of concentration data for toluene of real samples obtained from MIMS data in the field, and data measured by a commercial laboratory (ALS, using standardsampling and analysis methods), respectively. For an overview of sampling locations please refer to Fig. SF8.
Toluene
Sample MIMS - Sample (μg/L) ALS - Sample (μg/L) Qual. Contr.: MIMS - Sample with Comb. Standard (μg/L) Qual. Contr.: ALS– Sample with Comb. Standard (μg/L)
A (McLean creek) <0.5 <0.5 20.3 19.2B (Paw pond) <0.5 <0.5 20.2 14.1C (Rommegrot creek) <0.5 <0.5 20.3 13.9D (Christina River) <0.5 <0.5 20.4 1.1E (Tailing pond 1) 1.5 1.5 21.2 15.3F (Process water) 18 17.3 31.2 35G (Tailing pond 2) 10.1 9.1 26.7 25.6H (Clearwater River) <0.5 <0.5 20.8 13.4I (Athabasca River) <0.5 <0.5 22 17.4J (ALS DI experiment)a <0.5 <0.5 21.5 15.5
a Experiment conducted with deionized water (DI), where DI with and without combined standard was analyzed with MIMS and ALS.
M.R. Martinsen et al. Environmental Chemistry and Ecotoxicology 2 (2020) 168–174
173

[3] N.G. Davey, E.T. Krogh, C.G. Gill, Membrane-introduction mass spectrometry (MIMS),Trac-Trend Anal. Chem. 30 (9) (2011) 1477–1485.
[4] B. Brkic, N. France, S. Taylor, Oil-in-water monitoring using membrane inlet mass spec-trometry, Anal. Chem. 83 (16) (2011) 6230–6236.
[5] EPA, Method 18 - Volatile Organic Compounds by Gas Chromatography www.epa.gov,United States Environment Protection Agency, 1997 ([updated August 10th 2017).
[6] EPA-NERL, Measurement of Purgeable Organic Compounds in Water by Capillary Col-umn Gas Chromatography/Mass Spectrometry www.nemi.gov, National EnvironmentalMethods Index, 1995.
[7] R.C. Johnson, R.G. Cooks, T.M. Allen, M.E. Cisper, P.H. Hemberger, Membrane intro-duction mass spectrometry: trends and applications, Mass Spectrom. Rev. 19 (1)(2000) 1–37.
[8] N.G. Davey, E.T. Krogh, C.G. Gill, Membrane-introduction mass spectrometry (MIMS),TrAC Trends Anal. Chem. 30 (9) (2011) 1477–1485.
[9] R.C. Johnson, R.G. Cooks, T.M. Allen, M.E. Cisper, P.H. Hemberger, Membrane intro-duction mass spectrometry: trends and applications, Mass Spectrom. Rev. 19 (1)(2000) 1–37.
[10] E.T. Krogh, C.G. Gill, Membrane introduction mass spectrometry (MIMS): a versatiletool for direct, real-time chemical measurements, J. Mass Spectrom. 49 (12) (2014)1205–1213.
Environmental Chemistry and Ecotoxicology 2 (2020) 168–174
[11] D.W. Janes, C.J. Durning, D.M. van Pel, M.S. Lynch, C.G. Gill, E.T. Krogh, Modeling an-alyte permeation in cylindrical hollow fiber membrane introduction mass spectrometry,J. Membr. Sci. 325 (1) (2008) 81–91.
[12] M. LaPack, The Theory and Practice of Membrane Extractions, Michigan State Univer-sity, Ann Arbor, MI, 1994.
[13] C.H. Chung, I. Brenner, C.F. You, Comparison of microconcentric and membrane-desolvation sample introduction systems for determination of low rare earth elementconcentrations in surface and subsurface waters using sector field inductively coupledplasma mass spectrometry, Spectrochim. Acta B 64 (9) (2009) 849–856.
[14] N.G. Davey, R.J. Bell, E.T. Krogh, C.G. Gill, A membrane introduction mass spectrome-ter utilizing ion-molecule reactions for the on-line speciation and quantitation of vola-tile organic molecules, Rapid Commun. Mass Sp. 29 (23) (2015) 2187–2194.
[15] K.D. Duncan, G.W. Vandergrift, E.T. Krogh, C.G. Gill, Ionization suppression effects withcondensed phase membrane introduction mass spectrometry: methods to increase thelinear dynamic range and sensitivity, J. Mass Spectrom. 50 (3) (2015) 437–443.
[16] F.P. Incropera, DeWitt DP, T.L. Bergman, Principles of Heat and Mass Transfer, Wiley,Singapore, 2013.
[17] P. Tata, J. Witherspoon, C. Lue-Hing, VOC Emissions fromWastewater Treatment Plants: Characterization, Control, and Compliance, Lewis Publishers, Boca Raton, Fla, 2003.
M.R. Martinsen et al.
174


Paper V


Proton Transfer Mass Spectrometry – a short review draft Martinsen, R. M.
Introduction
This short review is intended to give a selective overview of environmental applications where proton
transfer reaction chemical ionization (PTR-CI) is used as ion source for different mass analyzers. Several
reviews of similar topics (1-8) have been published, whereof those of Dong et al. and Badjagbo et al., both
published in 2007, appeared to be of most relevance. The review by Dong et al. (2) seems to cover the topic
of this review, but as the full text only was available in Chinese to the author, this was not possible to
establish to full extent. Two larger reviews summarized the status in 2009 (9) and in 2017 (focused towards
atmospheric sciences) (10), and a book was published on PTR-MS in 2014 (10). A review of Biasioli et al.
also included other direct-injection MS techniques for Volatile Organic Compound (VOC) analysis (11).
The span of articles used in this review covers mid-1990s and up recently.
The mass analyzers used in conjunction with PTR include: Single (Linear) Quadruple, Triple Quadruple,
Ion Trap (IT), Time of Flight (TOF) and Ion Cyclotron Resonance (ICR). The aforementioned analyzers
and their applications will be reviewed separately.
Chemical ionization (CI) and hence proton transfer differs from classical electron ionization mass
spectrometry because bimolecular processes are used to generate analyte ions. The process of these
bimolecular reactions requires sufficiently large number of ion-molecule collisions during the dwell time of
the analyte in the ion source (12).
Proton transfer forms ions from a neutral analyte M in CI by the following reaction: (12)
M + [BH]+ → [M+H]+ + B
Sources of protons include water vapor, ambient air and internal CI gas. In PTR-MS the most used proton
source is the hydronium ion formed from water (12).
Other cations than H3O+ for charge transfer reaction MS may be obtained by selecting another source gas
than water (e.g. O2), or by selecting the more elaborate SIFT (Selected Ion Flow Tube) technique, providing
selected ionization ions such as NO+ or O+, thus generating alternative selectivities and mass spectra.
PTR-MS instruments comprises an ion source (often a hollow cathode discharge ion source) to produce
primary reagent ions (H3O+), a flow drift tube and a mass spectrometer to separate, detect and quantify ions
(13), see figure 1 for a schematic view.
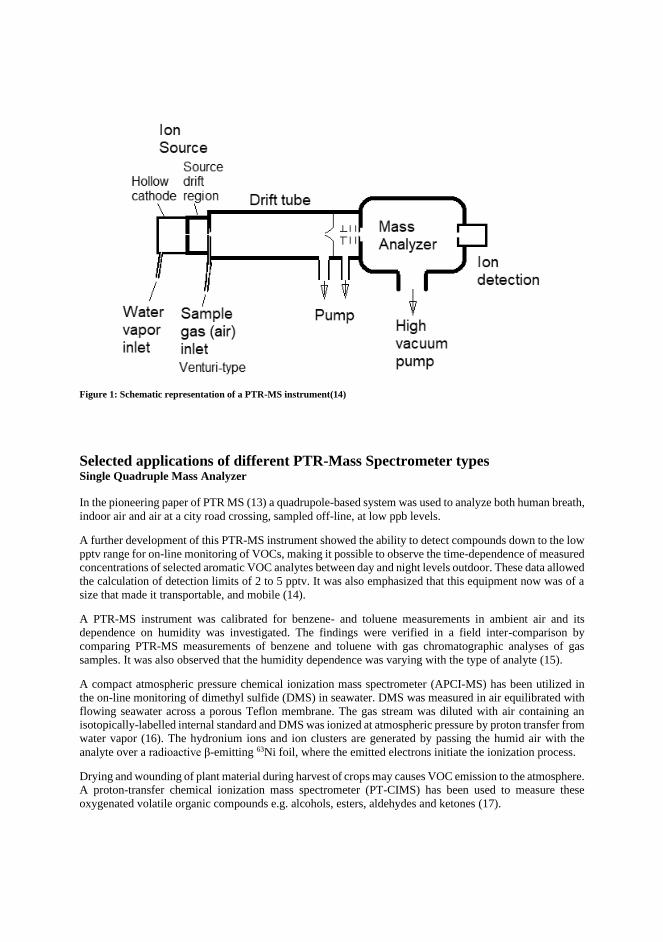
Figure 1: Schematic representation of a PTR-MS instrument(14)
Selected applications of different PTR-Mass Spectrometer types Single Quadruple Mass Analyzer
In the pioneering paper of PTR MS (13) a quadrupole-based system was used to analyze both human breath,
indoor air and air at a city road crossing, sampled off-line, at low ppb levels.
A further development of this PTR-MS instrument showed the ability to detect compounds down to the low
pptv range for on-line monitoring of VOCs, making it possible to observe the time-dependence of measured
concentrations of selected aromatic VOC analytes between day and night levels outdoor. These data allowed
the calculation of detection limits of 2 to 5 pptv. It was also emphasized that this equipment now was of a
size that made it transportable, and mobile (14).
A PTR-MS instrument was calibrated for benzene- and toluene measurements in ambient air and its
dependence on humidity was investigated. The findings were verified in a field inter-comparison by
comparing PTR-MS measurements of benzene and toluene with gas chromatographic analyses of gas
samples. It was also observed that the humidity dependence was varying with the type of analyte (15).
A compact atmospheric pressure chemical ionization mass spectrometer (APCI-MS) has been utilized in
the on-line monitoring of dimethyl sulfide (DMS) in seawater. DMS was measured in air equilibrated with
flowing seawater across a porous Teflon membrane. The gas stream was diluted with air containing an
isotopically-labelled internal standard and DMS was ionized at atmospheric pressure by proton transfer from
water vapor (16). The hydronium ions and ion clusters are generated by passing the humid air with the
analyte over a radioactive β-emitting 63Ni foil, where the emitted electrons initiate the ionization process.
Drying and wounding of plant material during harvest of crops may causes VOC emission to the atmosphere.
A proton-transfer chemical ionization mass spectrometer (PT-CIMS) has been used to measure these
oxygenated volatile organic compounds e.g. alcohols, esters, aldehydes and ketones (17).

When studying VOC emissions from wounded leaves, isomeric compounds could be separated in a coupled
gas chromatography-PTR-MS system for identification and quantification. However, gas chromatography
run lengths of 30 minutes drastically reduced measurement frequency (18). This could be dramatically
improved by coupling Fast GC to the PTR-MS system, reducing cycle time to 1.5 minutes for the analysis
of monoterpenes in air (19).
As a part of the Nitro Europe field study, a PTR-MS method was developed for the time-resolved
measurement of ammonia (NH3) emitted from grassland (20). The PTR-MS method was modified by the
use of O2 instead of H2O, to generate O2+ as the reactant ion (changing the mechanism from a PTR to a
charge transfer reaction, CTR) (21).
Many volatile organic compounds are photo-oxidized to oxygenated volatile organic compounds (OVOCs)
and contribute to both the gas phase and secondary organic aerosols (SOA). PTR-MS has shown to be a
useful tool for determining many of these compounds in ambient air (22).
A PTR-MS was adapted by employing NO+ as the ionization reagent instead of water vapor, by switching
the reagent ion source gas to dry air. The advantage of dry air over water vapor is that it is a cleaner reagent
gas. Its only minor impurity, NO2+, can be kept to below 2% of total ion intensity by controlling operational
conditions of the hollow cathode ion source. This CTR technique allowed real-time on-line measurement of
1,3-butadiene in a suburban atmosphere at sub-ppb levels (23).
A PTR-MS instrument was modified for short time response (<2 s total cycle time), tolerance of shock and
vibrations of a mobile laboratory and necessary sensitivity for rapidly changing hydrocarbon concentrations.
By on-road measurements in the Mexico City metropolitan area selected organics emissions from vehicle
traffic exhaust were monitored, including methanol, acetaldehyde, acetone, methyl tertiary butyl ether
(MTBE), benzene and toluene (24).
By rapidly switching between H3O+, NO+ and O2+ as reagent ions in a SIFT-MS system exhaust gas emission
from a Caterpillar 3304 diesel engine could be analyzed both on-line and in real time (25).
PTR-MS was used for on-line measurements of VOC concentrations in diesel engine exhaust as a function
of engine load. Calculated sensitivities for non-polar species were found in agreement with experimental
results with gas standards. A slight humidity-dependent sensitivity was also observed. Complex mass
spectra were observed resembling typical alkane fragmentation patterns for EIMS. In the exhaust small
aldehydes (C1 and C2) dominated at all engine loads over small aromatics, the latter increasing at higher
loads. Compositions determined by PTR-MS were in agreement with literature values determined by gas
chromatography, and about 75% of the PTR signals could be assigned to organic ions. (26).
By utilizing a spray inlet coupled with a PTR-MS Zou et al. developed a method to analyze benzene in
aqueous samples which had low detection limits, short response times and good reproducibility. Ionization
of the water vapor was accomplished by a glow discharge ion source (27). The same author also has reported
utilizing the same ionization technique for rapid and sensitive monitoring of multiple VOCs in aqueous
samples, offering short response times, low LODs and very good repeatability. Target analytes in this study
were acetonitrile, acetaldehyde, ethanol, acetone, ether and methylbenzene (28).

Triple Quadruple Mass Spectrometer
Environmental application of proton transfer chemical ionization coupled with triple quadruple mass
spectrometers seems to be much less common than with other mass analyzers. The existing literature
involving this coupling seems to orientate towards comparisons between selections of ionizing reagents,
studies of kinetics, molecular structures and fragmentation pathways (29-36).
Atmospheric pressure chemical ionization mass spectrometry (APCI-MS) was used to find responses to
selected polycyclic aromatic compounds (PACs) as a function of both analyte solution solvents and ion
source (nebulizer, sheath, bath) gases. These studies were done on light gas oil samples collected from
Syncrude Canada Ltd. (37).
Ion Traps
Cisper et al. demonstrated in 1997 the use of membrane introduction mass spectrometry for determination
of aqueous SVOCs utilizing electron ionization, charge exchange ionization and proton transfer chemical
ionization. The authors stated that proton-transfer chemical ionization achieved higher response for the
determination of 2-chlorophenol than electron ionization (38).
Allen et al. investigated further on the topic of analysis of benzene (VOC), naphthalene (SVOC) and
ferrocene (organometallic compound) in aqueous solutions using membrane inlet mass spectrometry, with
a proton-transfer chemical ionization ion source. The authors report an increase in signal intensity from 2
to 800 compared to electron ionization. The same compounds were also analyzed in air utilizing oxygen,
O2, for charge transfer CI (39).
In the article by Parzeller et al. the authors investigated the advantages of proton-transfer ion trap mass
spectrometry (PTR-ITMS) over PTR linear quadruple mass spectrometers. The two main advantages of
PTR-ITMS are the ability of specific identification i.e. overcoming problems with mass overlaps (isobaric
compounds and isomers) by the possibility to use MS/MS, and a higher duty cycle (40); a disadvantage of
PTR-ITMS was a lower sensitivity.
A method for quantitative determination of VOCs by a proton-transfer reaction-linear ion trap mass
spectrometer (PTR-LIT) system was developed by Mielke et al. (41). This instrumentation enabled MS/MS
measurements and, thus, allowed quantitation by mass spectral differentiation of isoprene, methyl vinyl
ketone and methacrolein.
Ion Cyclotron Resonance Mass Spectrometry (ICR)
Ion cyclotron resonance mass spectrometry is not a widely used mass analyzer for environmental
applications. As ICR has such a big advantage in mass resolution compared to other conventional mass
analyzers (42-47), its field of use has mainly been focused in the field of larger molecules e.g. proteomics
(proteins) and peptides (48-50). Its price and size make it a non-fieldable technique used for special tasks
that require extreme high-resolution mass spectrometry.
Sarrabi et al. (51) developed a method for monitoring thermal oxidation of polypropylene with proton
transfer Fourier transform ion cyclotron resonance mass spectrometry (PTR-FTICR). This method offered
real time monitoring of the oxidative degradation of polypropylene, producing VOCs.

Time of Flight Mass Spectrometry (TOF)
PTR-TOF is the second most used combination of PTR source and mass analyzer, and the second type of
system that is commercially available. Its advantage is the potentially extremely high scan speed of the TOF,
and more important even, its high resolution capabilities which allow the separate identification and
quantitation of compounds of identical nominal mass but different element composition – a possibility not
available with low resolution mass analyzeres (52).
Blake et al (53) describe a proton-transfer reaction time of flight mass spectrometer for the determination
of VOCs. The system uses radioactive α-particle emitting 241Americum as the ionization source for the gases
O2, NO/N2, NH3 and H2O. The authors explain, in detail, the advantage of TOF over QMS in terms of mass
resolution, mass range and ability to better resolve complex mixtures.
Tanamito et al. developed a proton transfer reaction-time-of-flight mass spectrometer (PTR-TOFMS) for
real-time measurements of volatile organic compounds (VOC). A custom-built discharge source enhanced
the sensitivity over the commercially available radioactive sources. The detection limits for acetaldehyde,
acetone, isoprene, benzene, toluene and p-xylene were determined to be at the sub-ppbv levels (54).
A chemical ionization reaction time-of-flight mass spectrometer (CIR-TOF-MS) with H3O+ as primary
chemical ionization source was used in the determination of concentrations of OVOCs down to 10 ppbv.
Measurements were done in real-time (55).
An on-line breath gas analysis by proton transfer time of flight mass spectrometer (PTR-TOF) has been
developed for the sensitive detection of VOCs. Time of flight instruments allows for the measurement of a
complete mass spectrum within a fraction of a second, and the high mass resolving power enables the
separation of isobaric molecules and the recognition of their chemical structure (56).
By utilizing a membrane inlet interface to introduce sample into a PTR-MS, Beale et al. (57) developed a
method for analyzing methanol, acetaldehyde and acetone in seawater. This method offered good selectivity,
but compared to other methods, the membrane inlet showed limitations in terms of permeation rate of
compounds through the membrane.
Baudic et al. (58) utilized a PTR-MS to measure a wide range of VOC in Paris megacity. The measurements
where done from January to February 2010 to show the seasonal variability of atmospheric VOC and their
various associated emission sources.
Recent developments within PTR-MS have shown the advantage of combining ionization techniques to
acquire a broader selection of target analytes to be monitored.
Zhang et al. (59) utilized a dipolar proton transfer mass spectrometer (DP-PTR-MS) to be able to analyze
VOC’s and inorganic gases whose proton affinities are greater than that of H2O, and thus not accessible by
normal PTR. The hydroxide ion (OH-) can be used to identify VOC’s, cooperating with the reagent ion
H3O+, and also for some inorganic gases like CO2 (in negative ion mode). For the accurate detection of NH3
, which suffers from interferences in PTRMS with water, the reagent ion (CH3)2COH+ can be used. These
three reagent ions can be switched depending on the compound to be analyzed for (59).
Sulzer et al. (60) describe a modification to the PTR-MS instrument that allows to switch from proton
transfer ionization to charge transfer reaction (ionization) (CTR), by changing to reagent gas types that allow
CTR. This offers the capability to analyze VOC through PTR with water, and CO, CO2, CH4, NOX and SO2
through CTR using krypton as the reagent gas, requiring a high-resolution TOF MS system for resolving
interferences of some isobaric analytes and contaminants.
Conclusion
Proton transfer reaction mass spectrometry has proven to be a highly sensitive, fast and mobile technique
for identification and quantification of volatile organic compounds in air, and with some restrictions, also
in water. The addition of alternative ionization methods, reagent ions, increased sensitivities and mass
spectral resolution power have strengthened the position of this technique in recent time, and made it the
method of choice for the analysis of organic compounds in trace concentration in air, especially where
mobile detection is required on ships, planes or in cars. The accessibility of high-resolution MS allows
separate observation of isobaric compounds, and the possibility of using MS/MS has been shown to allow
identification of isomers, in favorable cases - if they produce distinguishable dissociation patterns.
PTR-MS has found application not only in environmental analysis of atmosphere and water bodies, but
also in food science, medicine (breath analyzers), biology and biotechnology, a.o. New capabilities are
also created by combining the PTR-MS data with other data into powerful information (topological,
chronological, meteorological etc.).

1. Marchi I, Rudaz S, Veuthey JL. Atmospheric pressure photoionization for coupling liquid-chromatography to mass spectrometry: A review. Talanta. 2009;78(1):1-18. 2. Dong C, Hou KY, Wang JD, Li HY. Application of chemical ionization mass spectrometry in in situ measurement of atmospheric trace species. Prog Chem. 2007;19(2-3):377-84. 3. Badjagbo K, Moore S, Sauve S. Real-time continuous monitoring methods for airborne VOCs. Trac-Trend Anal Chem. 2007;26(9):931-40. 4. Marx D. Proton transfer 200 years after von Grotthuss: Insights from ab initio simulations. Chemphyschem. 2006;7(9):1848-70. 5. Smith D, Spanel P. Selected ion flow tube mass spectrometry (SIFT-MS) for on-line trace gas analysis. Mass spectrometry reviews. 2005;24(5):661-700. 6. Kiefer PM, Hynes JT. Adiabatic and nonadiabatic proton transfer rate constants in solution. Solid State Ionics. 2004;168(3-4):219-24. 7. Deakyne CA. Proton affinities and gas-phase basicities: theoretical methods and structural effects. International Journal of Mass Spectrometry. 2003;227(3):601-16. 8. Brodbelt JS. Analytical applications of ion-molecule reactions. Mass spectrometry reviews. 1997;16(2):91-110. 9. Blake RS, Monks PS, Ellis AM. Proton-Transfer Reaction Mass Spectrometry. Chemical Reviews. 2009;109(3):861-96. 10. Yuan B, Koss AR, Warneke C, Coggon M, Sekimoto K, de Gouw JA. Proton-Transfer-Reaction Mass Spectrometry: Applications in Atmospheric Sciences. Chemical Reviews. 2017;117(21):13187-229. 11. Biasioli F, Yeretzian C, Märk TD, Dewulf J, Van Langenhove H. Direct-injection mass spectrometry adds the time dimension to (B)VOC analysis. TrAC Trends in Analytical Chemistry. 2011;30(7):1003-17. 12. Gross JH. Mass Spectrometry: A Textbook: Springer International Publishing; 2017. 13. Hansel A, Jordan A, Holzinger R, Prazeller P, Vogel W, Lindinger W. Proton transfer reaction mass spectrometry: on-line trace gas analysis at the ppb level. International Journal of Mass Spectrometry and Ion Processes. 1995;149-150:609-19. 14. Hansel A, Jordan A, Warneke C, Holzinger R, Lindinger W. Improved detection limit of the proton-transfer reaction mass spectrometer: On-line monitoring of volatile organic compounds at mixing ratios of a few PPTV. Rapid Commun Mass Sp. 1998;12(13):871-5. 15. Warneke C, van der Veen C, Luxembourg S, de Gouw JA, Kok A. Measurements of benzene and toluene in ambient air using proton-transfer-reaction mass spectrometry: calibration, humidity dependence, and field intercomparison. International Journal of Mass Spectrometry. 2001;207(3):167-82. 16. Saltzman ES, De Bruyn WJ, Lawler MJ, Marandino CA, McCormick CA. A chemical ionization mass spectrometer for continuous underway shipboard analysis of dimethylsulfide in near-surface seawater. Ocean Sci. 2009;5(4):537-46. 17. De Gouw JA, Howard CJ, Custer TG, Baker BM, Fall R. Proton-transfer chemical-ionization mass spectrometry allows real-time analysis of volatile organic compounds released from cutting and drying of crops. Environmental Science & Technology. 2000;34(12):2640-8. 18. Fall R, Karl T, Jordan A, Lindinger W. Biogenic C5 VOCs: release from leaves after freeze–thaw wounding and occurrence in air at a high mountain observatory. Atmospheric Environment. 2001;35(22):3905-16. 19. Materic D, Lanza M, Sulzer P, Herbig J, Bruhn D, Turner C, Mason N, Gauci V. Monoterpene separation by coupling proton transfer reaction time-of-flight mass spectrometry with fastGC. Anal Bioanal Chem. 2015.
20. Norman M, Spirig C, Wolff V, Trebs I, Flechard C, Wisthaler A, Schnitzhofer R, Hansel A, Neftel A. Intercomparison of ammonia measurement techniques at an intensively managed grassland site (Oensingen, Switzerland). Atmos Chem Phys. 2009;9(8):2635-45. 21. Norman M, Hansel A, Wisthaler A. O2+ as reagent ion in the PTR-MS instrument: Detection of gas-phase ammonia. International Journal of Mass Spectrometry. 2007;265(2):382-7. 22. Hellen H, Dommen J, Metzger A, Gascho A, Duplissy J, Tritscher T, Prevot ASH, Baltensperger U. Using proton transfer reaction mass spectrometry for online analysis of secondary organic aerosols. Environmental Science & Technology. 2008;42(19):7347-53. 23. Knighton WB, Fortner EC, Herndon SC, Wood EC, Miake-Lye RC. Adaptation of a proton transfer reaction mass spectrometer instrument to employ NO+ as reagent ion for the detection of 1,3-butadiene in the ambient atmosphere. Rapid Commun Mass Sp. 2009;23(20):3301-8. 24. Rogers TM, Grimsrud ER, Herndon SC, Jayne JT, Kolb CE, Allwine E, Westberg H, Lamb BK, Zavala M, Molina LT, Molina MJ, Knighton WB. On-road measurements of volatile organic compounds in the Mexico City metropolitan area using proton transfer reaction mass spectrometry. International Journal of Mass Spectrometry. 2006;252(1):26-37. 25. Smith D, Spanel P, Dabill D, Cocker J, Rajan B. On-line analysis of diesel engine exhaust gases by selected ion flow tube mass spectrometry. Rapid Commun Mass Sp. 2004;18(23):2830-8. 26. Jobson BT, Alexander ML, Maupin GD, Muntean GG. On-line analysis of organic compounds in diesel exhaust using a proton transfer reaction mass spectrometer (PTR-MS). International Journal of Mass Spectrometry. 2005;245(1-3):78-89. 27. Zou X, Kang M, Li AY, Shen CY, Chu YN. Spray Inlet Proton Transfer Reaction Mass Spectrometry (SI-PTR-MS) for Rapid and Sensitive Online Monitoring of Benzene in Water. Anal Chem. 2016;88(6):3144-8. 28. Zou X, Kang M, Wang HM, Huang CQ, Shen CY, Chu YN. Rapid and sensitive on-line monitoring 6 different kinds of volatile organic compounds in aqueous samples by spray inlet proton transfer reaction mass spectrometry (SI-PTR-MS). Chemosphere. 2017;177:217-23. 29. Donovan T, Brodbelt J. Examination of Ortho-Effects in the Collisionally Activated Dissociation of Closed-Shell Aromatic Ions. Org Mass Spectrom. 1992;27(1):9-16. 30. Chen GD, Cooks RG. Electron-Affinities of Polycyclic Aromatic-Hydrocarbons Determined by the Kinetic Method. Journal of Mass Spectrometry. 1995;30(8):1167-73. 31. Cole RB, Tabet JC. Stereospecific ion-molecule reactions of nucleophilic gas-phase reagents with protonated bifunctional tetracyclic terpene epimers in the triple quadrupole collision cell. Journal of Mass Spectrometry. 1997;32(4):413-9. 32. Augusti R, Augusti DV, Chen H, Cooks RG. Gas-phase halide affinity of aliphatic alcohols estimated by the kinetic method. Eur J Mass Spectrom. 2004;10(6):847-55. 33. Pepi F, Ricci A, Rosi M, Di Stefano M. Effect of alkali metal coordination on gas-phase chemistry of the diphosphate ion: The MH2P2O7- ions. Chem-Eur J. 2006;12(10):2787-97. 34. Bachorz RA, Klopper W, Gutowski M, Li X, Bowen KH. Photoelectron spectrum of valence anions of uracil and first-principles calculations of excess electron binding energies. J Chem Phys. 2008;129(5):-. 35. Massaro RD, Dai YF, Blaisten-Barojas E. Energetics and Vibrational Analysis of Methyl Salicylate Isomers. J Phys Chem A. 2009;113(38):10385-90. 36. Sherin PS, Gritsan NP, Tsentalovich YP. Experimental and quantum chemical study of photochemical properties of 4-hydroxyquinoline. Photoch Photobio Sci. 2009;8(11):1550-7. 37. Kolakowski BM, Grossert JS, Ramaley L. The importance of both charge exchange and proton transfer in the analysis of polycyclic aromatic compounds using atmospheric pressure chemical ionization mass spectrometry. Journal of the American Society for Mass Spectrometry. 2004;15(3):301-10. 38. Cisper ME, Hemberger PH. The direct analysis of semi-volatile organic compounds by membrane introduction mass spectrometry. Rapid Commun Mass Sp. 1997;11(13):1449-53.
39. Allen TM, Cisper ME, Hemberger PH, Wilkerson CW. Simultaneous detection of volatile, semivolatile organic compounds, and organometallic compounds in both air and water matrices by using membrane introduction mass spectrometry. International Journal of Mass Spectrometry. 2001;212(1-3):197-204. 40. Prazeller P, Palmer PT, Boscaini E, Jobson T, Alexander M. Proton transfer reaction ion trap mass spectrometer. Rapid Commun Mass Sp. 2003;17(14):1593-9. 41. Mielke LH, Erickson DE, McLuckey SA, Muller M, Wisthaler A, Hansel A, Shepson PB. Development of a Proton-Transfer Reaction-Linear Ion Trap Mass Spectrometer for Quantitative Determination of Volatile Organic Compounds. Analytical Chemistry. 2008;80(21):8171-7. 42. Heninger M, Leprovost J, Courthaudon L, Mestdagh H, Lemaire J. Real time analysis by chemical ionisation in a compact FT-ICR mass spectrometer. Actual Chimique. 2009(329):19-24. 43. Duan P, Fu M, Gillespie TA, Winger BE, Kenttamaa HI. Identification of Aliphatic and Aromatic Tertiary N-Oxide Functionalities in Protonated Analytes via Ion/Molecule and Dissociation Reactions in an FT-ICR Mass Spectrometer. J Org Chem. 2009;74(3):1114-23. 44. Shea RC, Petzold CJ, Liu JA, Kenttamaa HI. Experimental investigations of the internal energy of molecules evaporated via laser-induced acoustic desorption into a Fourier transform ion cyclotron resonance mass spectrometer. Analytical Chemistry. 2007;79(5):1825-32. 45. Szulejko JE, Luo ZH, Solouki T. Simultaneous determination of analyte concentrations, gas-phase basicities, and proton transfer kinetics using gas chromatography/Fourier transform ion cyclotron resonance mass spectrometry (GC/FT-ICR MS). International Journal of Mass Spectrometry. 2006;257(1-3):16-26. 46. van Beelen ESE, Koblenz TA, Ingemann S, Hammerum S. Experimental and theoretical evaluation of proton affinities of furan, the methylphenols, and the related anisoles. J Phys Chem A. 2004;108(14):2787-93. 47. Campbell S, Rodgers MT, Marzluff EM, Beauchamp JL. Deuterium exchange reactions as a probe of biomolecule structure. Fundamental studies of cas phase H/D exchange reactions of protonated glycine oligomers with D2O, CD3OD, CD3CO2D, and ND3. J Am Chem Soc. 1995;117(51):12840-54. 48. Ziegler BE, McMahon TB. Energetics and Structural Elucidation of Mechanisms for Gas Phase H/D Exchange of Protonated Peptides. J Phys Chem A. 2010;114(44):11953-63. 49. Han J, Borchers CH. Top-down analysis of recombinant histone H3 and its methylated analogs by ESI/FT-ICR mass spectrometry. Proteomics. 2010;10(20):3621-30. 50. Colas I, Koroleva O, Shaw PJ. Mass spectrometry in plant proteomic analysis. Plant Biosyst. 2010;144(3):703-14. 51. Sarrabi S, Colin X, Tcharkhtchi A, Heninger M, Leprovost J, Mestdagh H. Real Time Analysis of Volatile Organic Compounds from Polypropylene Thermal Oxidation Using Chemical Ionization Fourier Transform Ion Cyclotron Resonance Mass Spectrometry. Analytical Chemistry. 2009;81(15):6013-20. 52. Graus M, Müller M, Hansel A. High Resolution PTR-TOF: Quantification and Formula Confirmation of VOC in Real Time. Journal of the American Society for Mass Spectrometry. 2010;21(6):1037-44. 53. Blake RS, Wyche KP, Ellis AM, Monks PS. Chemical ionization reaction time-of-flight mass spectrometry: Multi-reagent analysis for determination of trace gas composition. International Journal of Mass Spectrometry. 2006;254(1-2):85-93. 54. Tanimoto H, Aoki N, Inomata S, Hirokawa J, Sadanaga Y. Development of a PTR-TOFMS instrument for real-time measurements of volatile organic compounds in air. International Journal of Mass Spectrometry. 2007;263(1):1-11. 55. Wyche KP, Blake RS, Ellis AM, Monks PS, Brauers T, Koppmann R, Apel EC. Technical note: Performance of Chemical Ionization Reaction Time-of-Flight Mass Spectrometry (CIR-TOF-MS) for the measurement of atmospherically significant oxygenated volatile organic compounds. Atmos Chem Phys. 2007;7:609-20.

56. Herbig J, Muller M, Schallhart S, Titzmann T, Graus M, Hansel A. On-line breath analysis with PTR-TOF. J Breath Res. 2009;3(2):-. 57. Beale R, Liss PS, Dixon JL, Nightingale PD. Quantification of oxygenated volatile organic compounds in seawater by membrane inlet-proton transfer reaction/mass spectrometry. Anal Chim Acta. 2011;706(1):128-34. 58. Baudic A, Gros V, Sauvage S, Locoge N, Sanchez O, Sarda-Esteve R, Kalogridis C, Petit JE, Bonnaire N, Baisnee D, Favez O, Albinet A, Sciare J, Bonsang B. Seasonal variability and source apportionment of volatile organic compounds (VOCs) in the Paris megacity (France). Atmos Chem Phys. 2016;16(18):11961-89. 59. Zhang QL, Zou X, Liang Q, Zhang YT, Yi MJ, Wang HM, Huang CQ, Shen CY, Chu YN. Development of Dipolar Proton Transfer Reaction Mass Spectrometer for Real-time Monitoring of Volatile Organic Compounds in Ambient Air. Chinese J Anal Chem. 2018;46(4):471-8. 60. Sulzer P, Edtbauer A, Hartungen E, Jurschik S, Jordan A, Hanel G, Feil S, Jaksch S, Mark L, Mark TD. From conventional proton-transfer-reaction mass spectrometry (PTR-MS) to universal trace gas analysis. International Journal of Mass Spectrometry. 2012;321:66-70.

ISBN 978-82-326-5064-4 (printed ver.) ISBN 978-82-326-5065-1 (electronic ver.)
ISSN 1503-8181 (printed ver.)ISSN 2703-8084 (online ver.)
Doctoral theses at NTNU, 2020:359
Morten Rønnevig Martinsen
Development of an On-Line Monitoring Platform and Procedure for Rapid Environmental and Process Monitoring of Heavy Oil Extraction Operations and Industrial Activity
Doc
tora
l the
sis
Doctoral theses at N
TNU
, 2020:359M
orten Rønnevig Martinsen
NTN
UN
orw
egia
n U
nive
rsity
of S
cien
ce a
nd T
echn
olog
yTh
esis
for t
he D
egre
e of
Philo
soph
iae
Doc
tor
Facu
lty o
f Nat
ural
Sci
ence
sD
epar
tmen
t of C
hem
istr
y