
06Dr philos thesis final - NTNU Open
247
Dr. Philos. thesis Kjell Stordahl Long-term telecommunication forecasting NTNU Trondheim Norwegian University of Science and Technology Dr.Philos. thesis 2006 Faculty of Information Technology, Mathematics and Electrical Engineering Department of Telematics
-
Upload
khangminh22 -
Category
Documents
-
view
1 -
download
0
Transcript of 06Dr philos thesis final - NTNU Open

Dr. Philos. thesis
Kjell Stordahl
Long-term telecommunication forecasting
NTNU Trondheim Norwegian University of Science and Technology
Dr.Philos. thesis 2006 Faculty of Information Technology, Mathematics and Electrical Engineering Department of Telematics

Page 2 of 96
Long-Term Telecommunications Forecasting
by
Kjell Stordahl
Telenor Nordic, Fixed
Submitted to NTNU
Faculty of Information Technology, Mathematics and Electrical engineering
in partial fulfillment of the requirements
for the Dr. Philos. degree

Page 3 of 96
To Kari Synnøve,
Liv and Håkon

Page 4 of 96
Abstract
The key word for the thesis is long-term demand forecasting which have been applied on telecommunications and especially on broadband accesses and traffic.
The objective with the thesis has been to structure and present work on long-term broadband forecasting, to evaluate the forecasting results and to extract the learning. Each main chapter ends with a section called experiences and conclusions.
The thesis is organized in seven main parts.
The first part addresses application of the Delphi technique for long-term forecasting broadband accesses. Three Delphi surveys, which have been conducted during a long period, have been evaluated. All three Delphi surveys have used similar procedures in carrying out the survey, except that two of the Delphi surveys were postal surveys, while one was carried out on site. The applied procedure is evaluated based on an important reference article on Delphi surveys and also based on the long-term forecasting results. The Delphi surveys are not very often used. Hence, the description of the way to conduct the surveys and the experiences and also the evaluations of the results are given specific attention in the thesis.
The second part of the thesis has the title “Long-term broadband technology forecasting”. Results from three papers are presented and evaluated. The papers show the evolution of the forecasting modelling. The first forecasts for the broadband evolution in Western Europe were made before broadband was introduced in the residential market in Western Europe. The long-term forecasts were developed based on Logistic models. The modelling also includes substitution effects between broadband technologies. Experiences have shown that technological knowledge and techno-economic evaluations are crucial for making long-term broadband forecasts. Some attention is also put on available broadband accesses statistics and an approach to separate aggregated broadband statistics to access statistics for the business market and for the residential market.
“Long-term forecasting models for cost components and technologies” is the third part in the thesis. To be able to evaluate broadband technologies, techno-economic calculations of the “economic” value of the relevant broadband technologies are very important. The extended learning curve model invented by Borgar T Olsen and Kjell Stordahl is presented. The model is much more powerful than the simple exponential learning curve. The extended learning curve makes long-term forecasts of component costs and has the ability to be used directly on techno-economic calculations, as opposed to the traditional learning curve model, which does not predict the cost as a function of time. In addition the extended learning curve model has interpretable parameters. It is shown that the model may utilize a priori information in cases where too few observations are available.
The fourth part addresses long-term traffic forecasting. Three papers are enclosed. The chapter starts with a short overview of relevant forecasting models. Then attention is paid to forecasting and network planning. A comprehensive overview of the field is given together with numerous references in the enclosed paper “Forecasting – an important factor for network planning”. Long-term forecasts for the core network is analyzed and discussed. Also some figures for the total broadband traffic evolution in the Norwegian core network is presented. The last paper described in the chapter shows how long-term traffic forecasts on aggregated level can be used for traffic matrix forecasting by using the extended weighted least square method. The chapter ends by listing several important drivers for new and enhanced broadband traffic that are important in traffic forecasting models.

Page 5 of 96
Long-term forecasts are of course encumbered with uncertainty. Four papers are attached in the fifth part. The papers show how risk analysis is used to evaluate the consequences of uncertainty. All papers analyses rollout of broadband technologies. The long-term forecasts are important inputs to the techno-economic analysis of broadband rollout. The risk analysis evaluates the effect of the uncertainties in the long-term forecasts through the “economic value” of the rollout. The economic value is often expressed by net present value (NPV), payback period or internal rate of return. The experiences show that especially the long-term broadband forecasts and the average revenue per user (ARPU) forecasts are the most critical variables, which have the most significant influence on the variation in the economic value of the broadband rollout.
Long-term adoption rate forecasting is the second last part. These forecasts are essential for broadband rollout strategies. One paper describes optimal rollout strategies in the high capacity broadband market. Long-term adoption rate forecasts have been differentiated based on the order the operators are entering the exchange area. The first operator, who enters, gets all demand which has been aggregated over years, while the operators who enter later only have to fight to get parts of the future yearly growth. The strategy shows how limited investment means should be applied taking into account the effectiveness of investing in large exchange areas and utilizing the “first mover’s advantage”.
The second paper in this part is called: “Broadband in the residual market: First mover’s advantage”. The paper is so far unpublished and included completely in the thesis. Long-term broadband adoption rate forecasts play an important role in the analysis. The residual market is defined as the part of the market, which is not covered by broadband infrastructure. The business case for rolling out DSL in small exchange areas is based on monopoly considerations. If the areas are small enough, the long-term adoption rate forecasts for the first mover are locally upgraded because no other competitor gets a good business case by entering the area as number two. Analysis is carried out to develop optimal broadband rollout in the residual areas for given values of a set of critical variables i.e., long-term adoption rate, long-term ARPU forecasts, DSL equipment costs, OPEX costs and others.
The thesis ends with a part called “Forecasting new broadband revenue”. This is a very important and challenging aspect in the telecommunication world. The paper documents that the telecommunication spending per household both in Norway and selected European countries have increased significantly during the last years. The statistics of households purchasing behavior is analyzed. The hypotheses is that parts of the spending categories, which the households now are paying for, will in the future be partially substituted by services in the mobile and fixed network. Relevant spending categories are purchase of films and music, leasing of films and music, TV licenses, on demand ordering of films etc, on-line games, gambling, books, newspapers, magazines, e-learning. A framework for long-term broadband revenue forecasts is suggested.

Page 6 of 96
Preface
Since 1992 I have been working on the techno-economic broadband projects partly financed by the European Commission and the last two years by the Norwegian Research Council. I have been privileged to be responsible for the market analysis and the forecasting in these projects.
Therefore, I have had the opportunity to follow the development of broadband technologies at an early stage, to participate in techno-economic analyses of broadband business cases and to follow the broadband market evolution in Western Europe closely.
I am particular indebted to Borgar Tørre Olsen, Nils Kristian Elnegaard and Leif Aarthun Ims for very constructive and fruitful cooperation during these years.
The thesis is based on work and papers I have produced during a long period. Often we do not have time to put “things” together, to evaluate completed work and to examine what is learned. When I finally decided to make a thesis, I found great pleasure in structuring the thesis, to “review” and select my own papers for the thesis and lastly to evaluate earlier work. Since I have been working a lot with long-term forecasting, I have had the opportunity to compare my long-term forecasts with the real evolution and even extract some learning from the process!
I have participated in these research activities in parallel with my ordinary job at Telenor Networks/Telenor Nordic, and the main part of the work has been done at home during late hours and weekends.
I would like to thank Carlo Hjelkrem, Lars Rand and Borgar Tørre Olsen for constructive comments to the thesis.
And last, but not least, I want to thank my family for their support, patience and willingness to do more than I could expect during these years. I hereby dedicate the thesis to my wife Kari Synnøve, and my children Liv and Håkon.
Kjell Stordahl
Oslo, 22th February 2006

Page 7 of 96
TABLE OF CONTENTS
Abstract....................................................................................................................................... 4
Preface ....................................................................................................................................... 6
Table of Contents........................................................................................................................ 7
1 Introduction ........................................................................................................................ 11
1.1 Background................................................................................................................. 11
1.2 Motivation ................................................................................................................... 12
1.3 Organisation of the thesis ........................................................................................... 12
2 Long-term demand forecasting and application of the Delphi technique............................. 15
2.1 The Delphi technique .................................................................................................. 15
2.2 “Use of expert surveys to forecast the demand for new telecommunications services in the residential market” [Stor94a]............................................................................................ 16
2.2.1 Background ......................................................................................................... 16
2.2.2 Selection of experts ............................................................................................. 16
2.2.3 Number of experts ............................................................................................... 17
2.2.4 Individual arguments and reasons ....................................................................... 17
2.2.5 Number of rounds ................................................................................................ 17
2.2.6 Structuring the questionnaire ............................................................................... 18
2.2.7 Evaluation of the results....................................................................................... 18
2.3 “Forecasting long term demand for wide- and broadband services in the residential market”[Stor95a].................................................................................................................... 19
2.3.1 Background ......................................................................................................... 19
2.3.2 Selection of experts ............................................................................................. 19
2.3.3 Number of experts ............................................................................................... 20
2.3.4 Individual arguments and reasons ....................................................................... 20
2.3.5 Number of rounds ................................................................................................ 20
2.3.6 Structuring the questionnaire ............................................................................... 20
2.3.7 Evaluation of the results....................................................................................... 21
2.4 “Long term forecasts for broadband demand”. [Stor99a]............................................. 24
2.4.1 Background ......................................................................................................... 24
2.4.2 Planning and conducting the Delphi survey ......................................................... 24
2.4.3 Selection of experts/number of experts................................................................ 24
2.4.4 Individual arguments and reasons ....................................................................... 25
2.4.5 Number of rounds ................................................................................................ 25
2.4.6 Structuring the questionnaire ............................................................................... 25
2.4.7 Evaluation of the results....................................................................................... 27
2.5 Experiences and conclusions...................................................................................... 29

Page 8 of 96
3 Long-term broadband technology forecasting .................................................................... 31
3.1 “Long term forecasts for broadband demand” [Stor99a].............................................. 31
3.2 “Broadband access forecasts for the European market” [Stor02a] .............................. 32
3.3 Data availability........................................................................................................... 35
3.4 Broadband access statistics........................................................................................ 35
3.5 Long-term broadband forecast modelling of the business market ............................... 38
3.6 “Long-term broadband technology forecasting” [Stor04a]............................................ 41
3.7 Techno-economic analysis.......................................................................................... 44
3.8 Broadband forecasts comparisons.............................................................................. 45
3.9 Experiences and conclusions...................................................................................... 46
4 Long-term forecasting models for cost evolution of components and technologies ............ 48
4.1 “Models for forecasting cost evolution of components and technologies” [Olsen04] .... 48
4.2 Experiences and conclusions...................................................................................... 49
5 Long-term traffic forecasting............................................................................................... 50
5.1 Forecasting models..................................................................................................... 50
5.2 " Forecasting – an important factor for network planning" [Stor03a] ............................ 51
5.3 “ Traffic forecast models for the transport network”[Stor02b]....................................... 53
5.4 “Methods for traffic matrix forecasting” [Stor88]........................................................... 57
5.5 Experiences and conclusions...................................................................................... 58
6 Forecast uncertainty and Risk............................................................................................ 60
6.1 “Risk assessment and techno-economic analysis of competition between PNO and Cable operators”[Stor96] ....................................................................................................... 60
6.2 “Overview of risks in multimedia broadband upgrades”. [Stor99b]............................... 63
6.3 “Broadband access rollout strategies in a competitive environment”[Stor01]............... 64
6.4 “Analysing the impact of forecast uncertainties in broadband access rollouts by use of risk analysis”[Elne04]............................................................................................................. 65
6.5 Experiences and conclusions...................................................................................... 68
7 Long-term adoption rate forecasting................................................................................... 69
7.1 “Competition in the local loop – How to minimize the market risks” [Stor04b].............. 69
7.2 “Broadband in the residual market: First mover’s advantage” [Stor06] Full paper. ...... 71
7.2.1 Abstract ............................................................................................................... 71
7.2.2 Introduction.......................................................................................................... 71
7.2.3 Residual broadband market ................................................................................. 72
7.2.4 Market evolution and penetration forecasts.......................................................... 72
7.2.5 Broadband coverage............................................................................................ 75
7.2.6 Adoption rate forecasts ........................................................................................ 76
7.2.7 Business case model ........................................................................................... 77
7.2.8 Techno-economic calculations............................................................................. 78

Page 9 of 96
7.2.9 Roll out analysis................................................................................................... 78
7.2.10 Rollout strategies and conclusions....................................................................... 84
7.3 Experiences and conclusions...................................................................................... 85
8 Forecasting new broadband revenue................................................................................. 86
8.1 “Potential new broadband revenue streams”[Stor05a] ................................................ 86
8.2 Experiences and conclusions...................................................................................... 88
References ............................................................................................................................... 89
Acronyms.................................................................................................................................. 93
The enclosed papers for the dr. Philos. thesis
9 Long-term demand forecasting and application of the Delphi technique Long-term demand forecasting and application of the Delphi technique
9.1 Stordahl K, “Bruk av ekspertundersøkelser til prognoser for nye teletjenester i privatmarkedet” (Use of expert surveys to forecast the demand for new telecommunications services in the residential market) Telektronikk no. 1, 1994. 9.2 Stordahl K and E Murphy, “Forecasting long term demand for wide- and broadband services in the residential market”. IEEE of Comminications no.2 1995. 9.3 Stordahl K and L. Rand. “Long term forecasts for broadband demand”. Telektronikk (95) no2/3, 1999.
10 Long-term broadband technology forecasting
10.1 Stordahl K, K O Kalhagen, “Broadband access forecasts for the European market”. Telektronikk (98) no 2/3, November 2002. 10.2 Stordahl K. “Long-term broadband technology forecasting”, Telektronikk (100) no 4, 2004.
11 Long-term forecasting models for cost evolution of components and technologies
11.1 Olsen B. T., K Stordahl, “Models for forecasting cost evolution of components and technologies” Telektronikk (100) no4, 2004.
12 Long-term traffic forecasting
12.1 Stordahl K, “Forecasting – an important factor for network planning”. Telektronikk (99) no 3, 2003 12.2 Stordahl K, K O Kalhagen, B T Olsen, J Lydersen, B Olufsen, N K Elnegaard, ”Traffic forecast models for the transport network”. In Proc Networks2002, Münic, Germany, June 23-27, 2002. 12.3 Stordahl K "Methods for traffic matrix forecasting". In Proc 12th International Teletraffic Congress. Torino, Italy, June 1-8, 1988.
13 Forecast uncertainty and risk
13.1 Stordahl K, L A Ims and B T Olsen “Risk assessment and techno-economic analysis of competition between PNO and Cable operators” In Proc Networks 96, Sydney, November 24 –29, 1996. 13.2 Stordahl K, N. K. Elnegaard, L. A. Ims, B.T. Olsen. Overview of risks in multimedia broadband upgrades. In proc Globecom ’99, Rio de Janeiro, Brazil, December 5-10, 1999. 13.3 Stordahl K, N K Elnegaard, B T Olsen, “Broadband access rollout strategies in a competitive environment”. In Proc Optical Hybride Access Network/Full Service Access Network workshop, Yokohama, Japan, April 4-6, 2001 13.4 Elnegaard N. K., K Stordahl “Analysing the impact of forecast uncertainties in broadband access rollouts by use of risk analysis”, Telektronikk(100) no 4, 2004

Page 10 of 96
14 Long-term adoption rate forecasting
14.1 Stordahl K, N K Elnegaard, B T Olsen, M Lähteenoja “Competition in the Local Loop – How to Minimize the Market Risks” In Proc. XV International Symposium on Services in the Local access - ISSLS 2004. Edinburgh, Scotland, 21-24 March, 2004
15 Forecasting new broadband revenue
15.1 Stordahl K, B. Craignou, T Smura, J O Paret, I Welling, K R Renjish, T Monath “Potential new broadband revenue streams”, The 2005 Networking and Electronic Commerce Research Conference, Lake Garda, Italy, 6-9 October, 2005

Page 11 of 96
1 INTRODUCTION
1.1 Background I have for some decades been working with telecommunications forecasting. The area has been very interesting and challenging. In the 70’s and 80’s few telecommunications services were available. In Europe there was no competition and the incumbents controlled the telecommunications market. At that time it was much more straightforward to make forecasts in the telecom market. The demand evolved more smoothly than we see today and more advanced econometric and mathematical/statistical models were used for long-term forecasts.
During the last 15 years the world of telecommunication has changed dramatically. The European mobile system GSM was introduced in 1993. The European networks were digitalised in the 90’s. Internet gained speed after the release of the World Wide Web in 1990 and the first graphical browser, Mosaic in 1993. ISDN was introduced and after some years the broadband technologies ADSL and Hybride Fibre Coax (HFC). During the last years the broadband technologies Fibre To The Home (FTTH), Fibre To The Building (FTTB), ADSL2+, power line connections (PLC), SHDSL, Fixed Wireless Broadband Access (FWA) and Wireless Local Access Network (WLAN) have been introduced and coming up technologies are VDSL2, Dynamic Spectrum Management (DSM), Wireless Fidelity (WiFi) and Wireless Metropolitan Area Network (WiMAX). The mobile market evolves at the same time by the technologies GPRS, EDGE and UMTS and the enhancement High Speed Downlink Packet Access (HSDPA). The traditional POTS service has during a short period lost significant market share to Voice over IP (VoIP).
Three decades ago a telephone access had no additional functionality. Now, the broadband terminal is a PC, while the mobile terminal is a small computer often with a camera. We see a variety of new services every year. New complex relations between services are generated. Knowledge about substitutions and migration effects are important for understanding the dynamics of the services. Now, there are many new competitors and the incumbents have been forced to open up their markets through wholesale and Local Loop Unbundling. In Norway 170 operators have entered the broadband market.
To be able to make forecasts and especially long-term forecasts in this complex and very dynamic market, it is not enough to apply advanced classical forecasting models. A very important aspect is ability to obtain and to utilize technical information about new services and technologies, which may affect the established services. Also techno-economic calculations and evaluation of new and established technologies are important input to the forecasts. Hence, the process, especially for making long-term telecommunications forecasts, is more complex than before.
From 1992 until now I have participated in the international projects RACE 2087/TITAN, AC 226/OPTIMUM, AC364/TERA, IST-2000-25172 TONIC and ECOSYS through the European programs RACE, ACTS, IST and EUREKA/CELTIC. The main objectives have been to develop a techno-economic tool and to apply the tool to analyse broadband and mobile technologies, the rollout strategies and defined business cases in this area. An important input to the analysis has been long-term forecasts for the Western European market.

Page 12 of 96
1.2 Motivation The Dr. Philos thesis is mainly based on papers on “Long-term telecommunications forecasting”. The thesis gives a short review and evaluation of each of the enclosed papers. To be able to make reasonable evaluation of long-term forecasting models and long-term forecasts a natural approach is to wait and see the real evolution. Therefore, parts of the evaluations are based on comparing the long-term forecasts with the real data. This is the main reason for including some older publications in the thesis.
The motivation for the thesis has been to view a selection of papers on long-term forecasting, review the results and examine what is learned.
The majority of the papers are concentrating on broadband and long-term broadband forecasting. The papers include both broadband access forecasts and traffic forecasts.
Techno-economic calculations and evaluation of technologies show their “economic” value, which is an important input to the long-term forecasts. A part of the techno-economic calculations is long-term forecasts and long-term forecasting models for technology and component cost evolution. Therefore, a paper of these subjects is included in the thesis.
There are of course significant uncertainties connected to long-term forecasts. To be able to evaluate the impact of the uncertainties, risk analysis has been applied to show how the uncertainties in critical variables affect the results. Some papers focused especially on uncertainties in the market and penetration forecasts are included in the thesis, because this type of analysis cannot be avoided when long-term forecasts are used.
Long-term adoption rate forecasts are crucial for rollout strategies. Adoption rate is the genuine demand and defined in chapter 7 of the thesis. The operator’s rollout strategy should be based on the long-term adoption rate forecasts, which is described in the enclosed papers.
Finally, also forecasting models of new broadband revenue are included. The paper shows the potentials for new broadband and mobile revenue and settles a framework for long-term mobile and broadband revenue forecasts.
Some of the papers are found in “Telecommunications Forecasting”, Telektronikk (100) no 4, 2004 where I have been the guest editor. The issue contains a comprehensive collection of papers in this field from several international experts.
1.3 Organisation of the thesis The thesis covers the following main areas:
- Long-term demand forecasting and application of the Delphi technique
- Long-term broadband technology forecasting
- Long-term forecasting models for cost evolution of components and technologies
- Long-term traffic forecasting
- Forecast uncertainty and risk
- Long-term adoption rate forecasting
- Forecasting new broadband revenue
The thesis covers long-term forecasts of the broadband market and not other markets (mobile, satellite).

Page 13 of 96
The following papers for the Dr. Philos thesis are enclosed:
Long-term demand forecasting and application of the Delphi technique
• Stordahl K, “Bruk av ekspertundersøkelser til prognoser for nye teletjenester i privatmarkedet” (Use of expert surveys to forecast the demand for new telecommunications services in the residential market) Telektronikk no. 1, 1994. [Stor94a]
• Stordahl K and E Murphy, “Forecasting long term demand for wide- and broadband services in the residential market”. IEEE of Comminications no.2 1995. [Stor95a]
• Stordahl K and L. Rand. “Long term forecasts for broadband demand”. Telektronikk (95) no2/3, 1999. [Stor99a]
Long-term broadband technology forecasting
• Stordahl K, L. Rand. “Long term forecasts for broadband demand”. Telektronik ( 95) no2/3, 1999. [Stor99a] (Same paper as the previous one)
• Stordahl K, K O Kalhagen, “Broadband access forecasts for the European market”. Telektronikk (98) no 2/3, November 2002. [Stor02a], (Chapter 1-4,and 61. The first part overlaps with [Stor99a])
• Stordahl K. “Long-term broadband technology forecasting”, Telektronikk (100) no 4, 2004. [Stor04a]
Long-term forecasting models for cost evolution of components and technologies
• Olsen B. T., K Stordahl, “Models for forecasting cost evolution of components and technologies” Telektronikk (100) no4, 2004. [Olsen04]
Long-term traffic forecasting
• Stordahl K, “Forecasting – an important factor for network planning”. Telektronikk (99) no 3, 2003 [Stor03a]
• Stordahl K, K O Kalhagen, B T Olsen, J Lydersen, B Olufsen, N K Elnegaard, ”Traffic forecast models for the transport network”. In Proc Networks2002, Münic, Germany, June 23-27, 2002. [Stor02b]
• Stordahl K "Methods for traffic matrix forecasting". In Proc 12th International Teletraffic Congress. Torino, Italy, June 1-8, 1988. [Stor88]
1 Chapter 5 in [Stor02a] presents mobile forecasts, which is outside the scope of the thesis.

Page 14 of 96
Forecast uncertainty and risk
• Stordahl K, L A Ims and B T Olsen “Risk assessment and techno-economic analysis of competition between PNO and Cable operators” In Proc Networks 96, Sydney, November 24 –29, 1996. [Stor96]
• Stordahl K, N. K. Elnegaard, L. A. Ims, B.T. Olsen. Overview of risks in multimedia broadband upgrades. In proc Globecom ’99, Rio de Janeiro, Brazil, December 5-10, 1999. [Stor99b]
• Stordahl K, N K Elnegaard, B T Olsen, “Broadband access rollout strategies in a competitive environment”. In Proc Optical Hybride Access Network/Full Service Access Network workshop, Yokohama, Japan, April 4-6, 2001 [Stor01]
• Elnegaard N. K., K Stordahl “Analysing the impact of forecast uncertainties in broadband access rollouts by use of risk analysis”, Telektronikk(100) no 4, 2004 [Elne04]
Long-term adoption rate forecasting
• Stordahl K, N K Elnegaard, B T Olsen, M Lähteenoja “Competition in the Local Loop – How to Minimize the Market Risks” In Proc. XV International Symposium on Services in the Local access - ISSLS 2004. Edinburgh, Scotland, 21-24 March, 2004 [Stor04b]
• Stordahl K, N K Elnegaard, “Broadband in the residual market: First mover’s advantage” Unpublished so far, but sent to WTC/ISSLS 2006 [Stor06]
Forecasting new broadband revenue
• Stordahl K, B. Craignou, T Smura, J O Paret, I Welling, K R Renjish, T Monath “Potential new broadband revenue streams”, The 2005 Networking and Electronic Commerce Research Conference, Lake Garda, Italy, 6-9 October, 2005 [Stor05a]

Page 15 of 96
2 LONG-TERM DEMAND FORECASTING AND APPLICATION OF THE DELPHI TECHNIQUE
2.1 The Delphi technique When there are no possibilities for making quantitative forecasting models, qualitative forecasting methods may be applied. Relevant qualitative forecasting methods are judgemental methods, market surveys, expert opinions, the analogy method, the Scenario method and the Delphi method.
The Delphi technique is an advanced expert opinion method developed by Rand Corporation during the 1950’s. The Delphi technique is a relevant forecasting method when quantitative statistical models cannot be used because of lack of available or appropriate data.
The Delphi technique is based on four main principles:
1) Selection of a number of experts who are responding anonymously without interactions
2) Application of structured questionnaires and controlled feedback from the facilitators
3) The questionnaire is sent several rounds until the expert’s views iterate to a sort of common opinion
4) The final result is based on statistical aggregation of the expert’s responses.
The following papers, where the Delphi technique is used for long-term forecasting, are a part of the thesis:
• Stordahl K, “Bruk av ekspertundersøkelser til prognoser for nye teletjenester i privatmarkedet” (Use of expert surveys to forecast the demand for new telecommunications services in the residential market) Telektronikk no. 1, 1994. [Stor94a]
• Stordahl K and E Murphy, “Forecasting long term demand for wide- and broadband services in the residential market”. IEEE of Comminications no.2 1995. [Stor95a]
• Stordahl K and L. Rand. “Long term forecasts for broadband demand”. Telektronikk (95) no 2/3, 1999. [Stor99a]
The first paper describes and evaluates the results from a Norwegian Delphi survey conducted in 1975-1976. The second and third paper describes the results from two Pan European Delphi surveys conducted in 1993-1994 and 1997. In all cases the Delphi surveys were used to make long-term forecasts for new broadband services in the residential market. All three Delphi surveys are included in the thesis because the approaches are very similar, which makes it easier to draw conclusions about the methodology.
To be able to evaluate the results and the long-term forecasts, especially for the two last surveys, the year 2005 may be a natural check point level for the validation.
The basis for the three papers was to make forecasts for new telecommunication services when no historical demand data were available for most of the services and demand data would not be available for several years.

Page 16 of 96
The evaluation of each of the papers is performed in two steps. The first step is to evaluate how the Delphi technique is used. The reference article for this part is:
• Rowe G, and G. Wright “Expert opinions in forecasting: The role of the Delphi technique”. Principles of Forecasting. J Scott Armstrong, ISBN 0-7923-7930-6, Kluwer Academic Publishers, 2001 [Rowe01]
The article is summing up the knowledge on this field and gives recommendations for conducting Delphi surveys based on experience from a set of Delphi surveys and related research.
The second step is to analyse the Delphi results and compare the results with the actual historical evolution of the demand until 2005.
2.2 “Use of expert surveys to forecast the demand f or new telecommunications services in the residential mark et” [Stor94a]
2.2.1 Background
The results from the Delphi survey was described in:
• Trælnes T, K Stordahl ”Behovsstudie for nye teletjenester i hjemmene“ TF rapport no 19, 1976 [Træ76]
The most important results and evaluation of the results 19 years later are also documented in [Stor94a].
The objective of the study was to estimate the long-term demand for new telecommunication services in the residential market. The results were used as input to Long-term planning activities in Televerket (Telenor).
It is important to underline that the study was conducted in a period where most of the services described were not known either in Televerket or outside Televerket. In 1975-76 no available national or international surveys were available for most of the services. Some information of the services described and defined in the Delphi survey was found in professional international, mainly American magazines. At that time Televerket’s main services were: telephony, telex, datel and telegram. Televerket did not conduct marketing, market analyses or market surveys because the organisation at that time had to concentrate their effort to reduce the huge waiting line for getting telephone access.
2.2.2 Selection of experts
[Rowe01] discusses the effect of having experts with a general background compared of appropriate knowledge in the domain examined. The conclusion was that the quality increases especially in the additional rounds because the experts were able to understand and adopt arguments and reasons, which was distributed together with the quantitative part of the feedback. [Rowe01] also recommend heterogeneous experts not to get too “uniform” answers from the participants.

Page 17 of 96
In the Norwegian Delphi survey it was decided to include expert from a large part of the society, but a dominating part with relation to existing and future telecommunication services. Out of 64 experts 15,5% represented Televerket, 15,5% telecommunication industry and distribution, 8% newspapers and their organisations, 5% Norwegian broadcasting, 5% governmental departments, 5% publishing houses, 5% technical universities, 5% education and media research, 3% post organisation, 25% special experts and 9% separate institutions. The new telecommunication services defined in the survey covered not only the traditional telecommunication services, but services which were supposed to interact with newspapers, publishing houses, educational institutions, postal distribution, Norwegian broadcasting etc.
The survey was postal and not “on site”.
2.2.3 Number of experts
[Rowe01] discusses the number of experts in a Delphi survey and recommends 5- 20 persons. Arguments for the limitation are: “Larger groups make conflicts and produces to a greater extent irrelevant arguments, easier to create information overflow and not too high administrative costs”. However, the article also states “The answer to the question of what is the optimal size however is uncertain”. Number of experts available may limit the possibilities. More in depth feedback might suggest a smaller panel of experts. However, direct empirical research in this domain is limited.
In the Norwegian Delphi survey 123 experts were asked to participate. 54 experts participated in both Delphi round one and two. 64 experts participated either in round one or round two. The question is if the needed number of experts has been overestimated in the survey. Personally I think this is a very difficult question. First of all, it must be very difficult to recommend a general size of number of experts independent of the complexity of the Delphi survey. In the Norwegian survey a set of new services were examined and it was necessary to include experts on various fields in the society to cover specific aspects. Each of the experts had the possibility to deliver specific arguments and reasons for their answers and many did. These verbal answers were classified in groups and sent to every expert together with the structured quantitative aggregated answers. [Rowe01] states: “More in depth feedback might suggest a smaller panel of experts”. It is important to notice that one of the main principles of the Delphi technique is the anonymity of the experts. Hence, it is not easy to understand how the feedback could be more in dept than the process described in the Norwegian Delphi survey.
2.2.4 Individual arguments and reasons
[Rowe01] documents that the Delphi results improve when the feedback contains individual arguments and reasons for the responses. In the Norwegian survey the individual arguments for each telecommunication service were listed and classified, and sent back together with the quantitative part of the responses.
2.2.5 Number of rounds
Number of rounds is recommended to be 2-3 depending on the variation of the answers in the questionnaire [Rowe01]. In the Norwegian Delphi survey there were few outliers after the second round and the variation in the responses were assumed to be acceptable. In the analysis the median, not the statistical mean, were used to avoid bias because of some outliers. Therefore, it

Page 18 of 96
was decided to stop the Delphi survey after round two. However, each participant was invited to attend a half-day workshop with presentation and discussions of the Delphi results. 55% of the experts participated and gave additional value to the Delphi survey.
2.2.6 Structuring the questionnaire
[Rowe01] gives many advices regarding phrasing questions, being precise in the questions and definitions, avoiding irrelevant information, etc.
This point is of course the most fundamental for carrying out a successesful Delphi survey. First of all, the objectives and the main content for the survey have to be determined. Both research and extensive literature search were carried out to identify the future telecommunication services. A total of 20 new telecommunication services were defined. Before answering questions about a service, the following information was presented:
- Description of the service
- Presentation of how the service was used
- Presentation of technical conditions for the service
- Illustrate (Figure) of the service
In addition a standardized questionnaire for the services was developed. By using this procedure, the experts got the same questions for each service, which made responding easier.
The standardized questionnaire is shown in [Stor94a]. The questions in the Delphi survey covered:
- Desirability for the service
- Usage of the service (Mean time and frequency)
- Annual price for the service
- Demand for a set of prices
- Introduction time for the service
- Demand 5 and 10 years after introduction, respectively
- Deployment coverage respectively 5 and 10 years after introduction
2.2.7 Evaluation of the results
The services defined in 1976 Delphi survey were:
- Additional TV channels
- TV program with separate payment (Later called: Pay TV)
- TV programs from program library (Later called: Video on demand)
- Video recorder
- Text transmission on the TV screen (Later called: Text TV)
- Extraction of information from data banks (Later called: Prestel in UK and Teledata in Norway)
- Self service on the network (Later called: Tele shopping)

Page 19 of 96
- Tele education with teacher (Later called: Tele learning)
- Tele education with computer (Later called: Tele learning)
- Tele newspaper on subscription (Later called: Electronic newspaper)
- Specialised Tele newspaper on demand
- Tele post (Later: Fax, Data communication, E-mail)
- Video phone
- Home office
- Data response and tele control
- New telephone services
- Long distance tele control
- Radio programs on demand (Radio programs and music on demand)
- Still picture phone
The evaluation of the results from the Delphi survey is done in [Stor94a] based on information until 1994 – 19 years after the Delphi survey was conducted. The evaluation of service by service is performed rather detailed and will not be repeated here - only the main conclusions.
All defined services have proved to be future proof. This was of course an important basis for the experts of the Delphi survey. The introduction year for most of the services was estimated to be 1990 with a 75% quartile ranging from 1995 to 2000 and a 25% quartile ranging from 1990 to 1985. For some services introduction year were estimated to be 1985. Even if the services video on demand, radio programs on demand and newspaper on demand has been significantly delayed, the introduction year forecasts from the Delphi survey is surprisingly good taken into account the telecommunication situation in 1976 when the forecasts were produced.
2.3 “Forecasting long term demand for wide- and bro adband services in the residential market”[Stor95a]
2.3.1 Background
The Delphi survey was carried out in 1993-1994 as a part of the European Commission project TITAN in the RACE II programme. The TITAN project developed techno-economic methodologies and a tool to calculate economic value (NPV, payback period, Internal rate of return) and evaluate various technologies for narrowband and broadband networks. The Delphi survey was conducted to develop long-term forecasts for demand for new broadband applications and broadband access capacities. The demand forecasts, together with information of willingness to pay, were used as input to techno-economic calculations and evaluations of new technologies.
2.3.2 Selection of experts
Since TITAN was a Pan European project and the results should be valid for Western Europe, it was decided to conduct a Delphi survey, which reflected the Western European market. Therefore, the intention was to establish a panel with experts from the 10 participating countries in the project. The selection of experts was carried out based on the same criteria as in the Norwegian Delphi survey.

Page 20 of 96
The survey was postal and not “on site”.
2.3.3 Number of experts
It was decided to select 10 experts from each of the countries, Belgium, Finland, France, Germany, Greece, Italy, the Netherlands, Norway, Portugal, and United Kingdom – a total of 100 experts. However, some non-response occurred and 58 experts participated in the first round and 50 in the second. The further South in Europe, the higher was the non-response.
Since the objective with the Delphi survey was to make long-term forecasts for Western Europe, it should be important to increase the number of expert participants compared to [Rowe01], since the economic situation, the telecommunication infrastructure and the willingness to pay varies between countries in Western Europe.
2.3.4 Individual arguments and reasons
[Rowe01] documents that the Delphi results improve when the feedback contains individual arguments and reasons for the responses. In the Pan European survey the individual arguments for each telecommunication service were listed and sent back together with the quantitative part of the responses.
2.3.5 Number of rounds
The difference between 75% quartile and the 25% quartile was reduced significantly from round one to round two for most all questions. In the analysis the median, not the statistical mean, were used to avoid bias because of some outliers and get more robust statistical results. In addition it turned out to be more difficult than anticipated to persuade the international experts to complete their questionnaire. Therefore it was decided to stop the Delphi process after two rounds.
2.3.6 Structuring the questionnaire
The questionnaire was structured as in the Norwegian Delphi survey. Before answering questions about an application, the following information was presented:
- Description of the application
- Presentation of how the application was used
- Presentation of technical assumption for the application
- Illustrate (Figure) of the application
In addition a standardized questionnaire for the applications was developed. By using this procedure, the experts got the same questions for each application, which made responding easier. The questions of the Delphi survey covered:
- Reasons for purchasing the application
- Comments

Page 21 of 96
- User characteristics
- What kind of alternatives to the described applications exist
- Demand for a set of annual prices for Wideband (2 Mbit/s) and for Broadband (8Mbit/s) quality
- Forecasts for 1995, 2000, 2005, 2010 and the expected saturation for Wideband (2 Mbit/s) and for Broadband (8Mbit/s) quality
- Willingness to pay for Wideband (2 Mbit/s) and for Broadband (8Mbit/s) quality as a function of the households disposal income
The questions were asked for 128 kbit/s access, 2048 kbit/s access and 8 Mbit/s access and for 12 different broadband applications.
Finally, the experts were asked to indicate which three broadband applications they expected to have the greatest number of subscribers.
The total number of questions was 398 in the first round and reduced to 365, in the second since some of the qualitative questions were not resubmitted to experts.
2.3.7 Evaluation of the results
The selected and defined broadband applications were:
Tele interaction (Entertainment)
- Video on demand
- Multimedia telegame
- Videophony
- Telecommunity (Telemedicine home)
Tele shopping (Electronic market)
- Home ordering with electronic bill payment
- Advertising and marketing
Thematic Channels
- Interactive TV and specialized channels
- Electronic newspaper
Teleworking
- Home office (simple)
- Home office (advanced)
- Remote education (home)
- Remote education (studio)
The defined applications from 1994 are still very relevant and important. The main part of the applications was assumed to use a broadband access. Looking at the evolution from 1994 to 2005, a very important group of applications arise based on Internet, the first graphical Internet browser and the release of WWW client, Mosaic in 1993. The first years only simple low

Page 22 of 96
capacity browsing and information retrieval was possible, but during the last part of the period also high capacity information retrieval and downloading are possible.
Table 2 in [Stor95a] shows the ranking of the applications with video on demand, home office and video telephony on top. Table 3 and 4 show the willingness to pay for the services and the penetration forecasts which confirm the ranking. Video on demand is in the introduction phase in Western Europe. However, the broadband access makes possible downloading of film clips, movies, news, earlier distributed TV programs etc. Many employees utilise home offices today by use of broadband connection. Video telephony has not turned out to be very popular. Multimedia telegame, which was ranked as number 5 is extremely popular among the young broadband users [MMI03]. The demand curves for the services are still difficult to evaluate because business models for broadband content and payment is under development. So far most of the countries in Western Europe have a flat rate regime, but some countries have traffic tariffs above a given monthly Gbyte volume [Point04].
It is important to validate the Delphi questionnaire and the results based on the situation in 1993- 1994. At that time the concept broadband was mainly unknown and also the main access technologies, which is used today. The concepts narrowband (- 128kbit/s), wideband (128 kbit/s – 2Mbit/s) and Broadband (2Mbit/s -) existed. Today wideband is eliminated and included in broadband. The future tariff regime for broadband was unknown. In the Delphi questionnaire it was assumed that the user should pay for the access and for the services. Now, because of flat rate in most of the European countries and no specific monthly tariff for the services, it is difficult to evaluate the forecasting table 4 in [Stor95a]. If a customer has a broadband access, then many of the listed applications will be available, independent of the usage or not.
The figure 2.1 in the thesis shows the experts view on the demand different accesses. The figure is shown in [Stor94b] and chapter 3 in [Ims98].
Figure 2.1 Estimated demand curves for ISDN, wide- and broadband accesses.
The willingness to pay for ISDN, wide- and broadband accesses is shown as a function of annual subscription tariff in ECU (Euro). When the survey was conducted, the broadband access was assumed to be very expensive compared with what is seen now. New technology, especially DSL and HFC and mass production of equipment and network components have reduced the access price significantly.

Page 23 of 96
Figure 2.1 and table 1 in [Stor95a] show a set of very high annual subscription tariffs for 2Mbit/s (wideband) access, but the Delphi experts do a very good evaluation, telling that even for the lowest alternative, 1000 Euro, only 10% of the residential market is willing to order the access. At the end of 2004, the monthly tariff for 2Mbit/s access varied mainly between 40 and 60 Euro among the Western European countries [Point04]. The tariff corresponds to 500-700 Euro per year. At that time total broadband penetration including also lower access capacities than 2Mbit/s was about 20% (Section 3.4, Table 3.7 in the thesis).
Figure 2.1 and figure 3 in [Stor95a] show in the same way a set of very high annual subscription tariffs for 8Mbit/s (broadband access), but the Delphi experts do a very good evaluation in this case too, telling that even for the lowest alternative (1500 Euro per year) only 5% will order the connection. Until 2004 few operators in Europe offered 8Mbit/s or more and the capacity price was to some extent lower. One year later, 8-15 Mbit/s is going to be a more common access capacity because the cost of ADSL2+ line cards has been significantly reduced during 2005. The ADSL2+ line cards can be put into the same DSLAM as for ADSL cards. The lower production costs will also influence the end user prices and increase the demand for higher capacity.
Figure 2.2 shows the long-term access forecasts for ISDN, wideband (2 Mbit/s) and broadband (8 Mbit/s). The figure is shown in [Stor94b] and chapter 3 in [Ims98].
Figure 2.2 Long-term forecasts for ISDN, wide and broadband accesses as percentage of the residential market.
The long-term forecasts for ISDN was optimistic and substitution effects between ISDN and wide/broadband was not foreseen in the Delphi survey. Figure 5.1 in the thesis shows that ISDN reached 26% penetration in 2002 in Norway, 7 years after introduction. Norway and Germany had the highest ISDN penetration in the world and are not representative of the European ISDN evolution. The wide/broadband accesses for the residential market were introduced in Western Europe in 1999. The accesses offered were mainly below 2 Mbit/s. Since there were only two alternatives, it is reasonable to interpret the 2 Mbit/s class to include also lower capacities. Hence, the forecasts were too high for year 2000 and too low in 2005. (Precise West European statistics on access capacities is not available). So far, not much high capacity access volume has been offered in the Western European market. Therefore, the forecasts for 2005 seem fairly ok.

Page 24 of 96
However, because of extensive rollout of ADSL2+ cards, the 2010 forecasts are probably too low.
Access capacity forecasts from this Delphi survey is also discussed in the following paper [Stor99a] together with access capacity forecasts from the 1997 Delphi survey.
Chapter 3, “Demand for new services” page 23-38, by K Stordahl, in the book “Introduction strategies and techno-economic evaluations” [Ims98] shows additional results from the Delphi survey.
2.4 “Long term forecasts for broadband demand”. [St or99a]
2.4.1 Background
In 1997 broadband accesses were not introduced in the European residential market. Leased lines were at that time the most relevant technology for high capacity connections in the business market. The Delphi survey was conducted during the workshop “Techno-economics of Multimedia networks” in 1997 arranged at University of Aveiro by the project OPTIMUM. The European Commission supported the project through the ACTS program. The objective for OPTIMUM was to develop a techno-economic tool and to evaluate various network architectures. The Delphi survey was carried out to develop long-term demand forecasts for new broadband services and broadband access capacities and for predicting the expected broadband tariff evolution.
Because the experience from the TITAN Delphi survey from 1993-94 was assumed to be reasonable good, it was decided to carry out a Delphi survey based on mainly the same approach. The only difference was the duration of the survey, which now was conducted as an “on-site” survey, which produced the final Delphi results in two days.
2.4.2 Planning and conducting the Delphi survey
The questionnaire was finalized before the workshop. A data program was developed for implementing the answers from the experts and for producing figures and tables with accumulated statistics from the experts. On the first day of the workshop, introduction of the Delphi survey was given in plenum. The presentation included objectives, how the survey would be conducted, and information of technical and financial prerequisites. The whole questionnaire was presented and there were comments and questions from the floor, which were answered by the facilitator (Kjell Stordahl). The questionnaires were distributed to the conference participants, who answered the questions during the Delphi- session. The next day a new Delphi-session was scheduled. The facilitator (Kjell Stordahl) presented accumulated statistics for all questions from the first round and clarified and answered questions from the floor. Then the conference participants filled out the questionnaire for the second round. The final results were produced and posted on a wall the third day.
2.4.3 Selection of experts/number of experts
The experts were participants of the workshop on “Techno-economics of Multimedia networks”. There were 36 participants in the first round and 32 in the second. The experts were not selected,

Page 25 of 96
but attended as experts because of the workshop. They represented 16 different European countries. However, the experts attended the workshop, and could be considered as a homogeneous group in that sense. The workshop covered demand, economics and telecom technology related areas.
The Delphi criteria on anonymous experts were not satisfied and can be evaluated to be a weakness in the survey. The question is how much time the experts had to discuss the Delphi survey after a long conference day and how much the questions from the floor influenced the Delphi results.
2.4.4 Individual arguments and reasons
The questionnaire had some open questions for each service (comments, alternative suggestion to the service). However, there was limited time to present all individual verbal comments. Some individual arguments/reasons were presented to the experts after the first round, and the same experts also presented their views and raised some discussions.
2.4.5 Number of rounds
The number of rounds was decided beforehand to be two since the conclusions had to be reached during the workshop. The workshop program included two Delphi sessions. Therefore, the final Delphi results were not presented in plenum, but the tables and figures were posted on a wall, which was available for all the experts. Analysis showed that the interval between 75% and 25% quartile was significantly reduced from round one to round two. One example is shown in figure 4 [Stor99a].
2.4.6 Structuring the questionnaire
The questionnaire was structured similar to the TITAN Delphi survey. Instead of asking questions of specific applications, the questions were divided in groups of applications. Like in the two previous Delphi surveys, the application group questions started with general description of the application group, presentation of technical assumptions and an illustration (figure).
The main questions in the survey were:
- Application groups: Usage as a function of price
- Access capacity: Penetration as a function of price
- Access capacity: Penetration as a function of time (2000, 2005, 2010, 2015 and saturation)
- Access capacity: Demand as a function of disposable income
The defined access capacities were:
- ISDN
- 2-4 Mbit/s
- 25Mbit/s (downstream)/384 kbit/s (upstream)
- 25Mbit/s (downstream)/6 Mbit/s (upstream)

Page 26 of 96
The experts were also asked to rank the most important leading application groups.
Figure 2.3 shows how the description of applications were structured in the questionnaire.
Example of application: Video on demand and Audio/Music on demand. General description: This is an application where a video-library is accessed, and programs may be ordered and transmitted to the home. This application could substitute some part of the time spend on ordinary TV and part of money spent on renting videos in video shops. Technical assumptions: The user may either use an advanced telephone or a PC to communicate with the video-library. The transmission of the video may either be done via a Cable-TV network, or a telecommunication network. The access capacity will be in the range of 2- 4 Mbit/s.
.
1 Given the following alternative prices per hour (1997 ECU). What do you believe will be the expected use of this group of applications (Tele-entertainment)? Note: We assume that the tele-entertainment applications are supplementary to the traditional TV channels, but there may be some substitution effects.
Round 1 (medians)
Prices per hour 0,5 ECU 2 ECU 5 ECU 10 ECU 20 ECU
Minutes per day 70 40 12 5 1
Having seen the above results, what would your answers be to the corresponding question today?
Round 2 Prices per hour: 0.5 ECU 2 ECU 5 ECU 10 ECU 20 ECU Minutes per day:
Comments (if any):
Figure 2.3 Description of an application and related questions to the application (1997 Delphi survey)

Page 27 of 96
2.4.7 Evaluation of the results
The broadband applications were classified in the following 7 main groups:
Tele-entertainment
- Multimedia telegame
- Virtual reality
- Video on demand
- Audio/music on demand
Information services
- Information retrieval
- Electronic magazines
- Information retrieval by intelligent agents
- Electronic newspapers
Teleshopping
- Teleshopping
- Advertising
Private communications services
- Videophone
- Teleconferencing
Teleworking
- Videophone
- Joint editing/publishing
- Teleconferencing
- Information retrieval
- Multimedia applications
Telelearning
- Video on demand
- Virtual reality
Telecommunity
- Telesurveillance
- Videophone
- Telediagnostics
The applications and application groups defined 8 years ago still covers the main broadband applications in 2005.
Table 3 in [Stor99a] compares the ranking of application in the 1994 and 1997 Delphi survey. The application groups Teleworking, Information services and Tele-entertainment were the highest ranked in 1997. Even in 2005 this ranking seems to be very good. The ranking is comparable with the 1994 ranking except that video telephony is substituted with information services.

Page 28 of 96
The 1994 Delphi survey questionnaire handled each broadband application separately. The conditions in the 1997 Delphi survey presupposed that a broadband access was necessary to offer broadband applications and subscription fee had to be paid for the broadband access. In addition the customers had to pay for the traffic generated by the different broadband applications. Figure 2 and 3 in [Stor99a] shows the expected usage as a function of price per hour for the defined application groups. The willingness to pay was definitely highest for teleworking, especially when the employing company paid for all usage. Telelearning and tele-entertainment were ranked as 2 and 3. Since the households will not use all services the experts was asked to estimate the usage of a broadband access in minutes per day for 5 alternative prices. The conclusion was 45 minutes per day for 2 Euro per hour and 120 minutes per day for 0,5 Euro per hour. The estimates indicates a monthly traffic charge between 30 and 45 Euro per month, which had to be paid in addition to the access subscription fee.
As mentioned, it is difficult to evaluate the estimates of willingness to pay for the usage, because the main traffic regime in Western Europe today is the broadband flat rate regime. However, there are also exceptions. The incumbents Belgacom, Deutsche telecom, KPN, TDC and Telecom Italy have one or more broadband access products, where the traffic is charged per time unit or per traffic volume beyond a given monthly limit [Point04]. In Belgium practically all broadband operators avoid the flat rate regime. The white paper “Broadband Incentive Problem” by Broadband Working Group MIT Communication Future Program, [BWG05], states “that the broadband traffic per user continuously increases and generates operational costs and investments without reflection in increased traffic charges and revenue for the operators. The operators may reach a situation where they want reduce the traffic instead of stimulating to increase and create value for the society. Bandwidth demanding innovation will not be stimulated because there exists no incentives. One possibility may be to introduce charge for broadband traffic”. So far, it is difficult to draw conclusions about the future broadband tariff regime.
The Delphi experts were asked how much a household is willing to pay for broadband capacity with 128kbit as a reference level. They estimated, see figure 12 in [Stor99a], that a household was willing to pay 50% more for 2Mbit/s, 100% more for 50Mbit/s and 120% more for 500Mbit/s.
Figure 2.4 Willingness to pay for increased capacity relatively to 128 kbit/s

Page 29 of 96
The results show that there is no linear willingness to pay as a function of increased bandwidth. The increased willingness to pay as a function of bandwidth is rather moderate. Figure 11 in [Stor99a] gives the same conclusions. The figure shows that even households with high disposable income are willing to pay marginally more for high bandwidth. This knowledge is important and gives directions for relevant prices for higher bandwidths. The broadband evolution so far supports these results. When higher access bandwidths are introduced in the market, the prices are not significantly higher than for lower bandwidth products. At the same time the prices on all established products are reduced as a function of time.
The long-term broadband residential access forecasts, from the 1994 and 1997 Delphi surveys are found in figure 5 [Stor99a]. The figure shows that the high capacities (8Mbit/s, 25Mbit/s) forecasts have been too optimistic in the period 2000 – 2005. However, if all capacities are accumulated the forecasts are reasonable good. In 2000 the broadband access penetration per household in Western Europe was 1%.
At the end of 2005 the broadband residential penetration is estimated to be about 28,5% (See chapter 3.4 in the thesis). The 1994 Delphi forecasts for 2005 were 11,3%, while the 1997 Delphi forecasts were 20,5%, which must be very acceptable taking into account that no demand data were available and broadband was not introduced when the forecasts were made. The 1994 Delphi survey’s 2005 broadband forecasts (11,3%) was very right for 2003 (11,4%), while the 1997 Delphi survey’s 2005 broadband forecasts (20,5%) was very right for 2004 (19,9%). See chapter 3.4 in the thesis.
2.5 Experiences and conclusions The strength of the Delphi method is to give the best prediction based on available knowledge and perspectives about the future. The weakness of the approach is lack of scientific and statistical analysis of historical data and the possibility for including biased knowledge. However, the approach of answering questions in several rounds supplemented with individual arguments for the answers should reduce the bias in the results.
The results from the Delphi surveys has been better than what could be expected taking into account the information available at the time when the surveys were conducted. The evaluation of applications/services, the evaluations of expected demand, and the long-term forecasts have been of accepted quality.
A lot of preparations and also research were done in beforehand to be able to define the relevant applications/ services, to give necessary background information about the applications/services, to formulate separate questions and finally the questionnaire.
It is recommended to describe new applications/services by a description, by presentation of how the service is supposed to be used, by a short presentation of technical conditions for the application/service and an illustration (figure) of the application/service. The approach for presentation is shown in figure 3.3 and 3.4 in [Stor94a] and in figure 1 in [Stor99a].
The same design of the questionnaire was used in all three Delphi surveys. It is also recommended to use exactly the same type of questions for each service, so that misunderstandings may be avoided. Figure 3.2 in [Stor94a] and figure 1 in [Stor99a] show the question design. The question design is also timesaving and makes it possible to include more questions compared with more complex questionnaires.
The Delphi approach used is recommended for future Delphi surveys. The approach corresponds mainly with the guidelines described in [Rowe01].

Page 30 of 96
The on-site Delphi survey, where the Delphi results were produced in two days, was effective. The small deviations from the basic Delphi principles do not seem to reduce the quality of the results.

Page 31 of 96
3 LONG-TERM BROADBAND TECHNOLOGY FORECASTING
The next type of models applied for long term broadband forecasting are diffusion models. These models are quantitative forecasting models, which are based on a time series. One class of the diffusion models are the Logistic models. These models have been used in the following papers, which are a part of the thesis:
• Stordahl K, L. Rand. “Long term forecasts for broadband demand”. Telektronikk (95) no 2/3, 1999. [Stor99a]
• Stordahl K, K O Kalhagen, “Broadband access forecasts for the European market”. Telektronikk (98) no 2/3, November 2002. [Stor02a] (The first part overlaps with [Stor99a])
• Stordahl K. “Long-term broadband technology forecasting”, Telektronikk (100) no 4, 2004. [Stor04a]
The papers describe long-term broadband access demand forecasting models for the fixed network.
The main part of the chapter deals with long-term residential broadband demand forecasts. The residential broadband market is the dominating part of the broadband market and constitutes for the moment about 80% of the total access market in Western Europe.
The data availability is commented and broadband statistics are analysed to separate the residential and business market.
Section 3.5 deals with long-term broadband penetration forecasts for the business market. This part of the thesis has not been published before.
3.1 “Long term forecasts for broadband demand” [Sto r99a] In [Stor99a] Logistic forecasting models uses the results from 1997 Delphi survey as input. The broadband forecasts have been revised and table 4 in [Stor99a] shows the information used to estimate the parameters in the Logistic model. The forecasts were developed in the TERA project [Stor98b] and the conclusions were published in [Stor99a]. In the document [Stor98b] it is showed that a three-parameter model (α is level parameter, β growth parameter and M saturation) gave bad fitting for 2000 and 2005 and also low multiple correlation coefficient. Hence, an additional growth parameter γ was introduced. The document shows that the multiple correlation coefficient of course increased significantly when an additional parameter was introduced, but the most important point was that the model got much better flexibility and gave much better fitting for 2000 and 2005. The estimation procedure is described in section 4.5 in [Stor99a]. Examination of the effect of γ on RMSE(root mean square error), showed that the value of γ did not change RMSE for high values. (γ = 500 and γ = 20.000 gave about the same fitting and the same RMSE). The conclusion was to apply a four parameter Logistic model instead of a three parameter Logistic model because the model had much better fitting flexibility.
The value of the saturation parameter is found directly based on the Delphi experts’ answers, while the other parameters are found by minimising RMSE. The long-term forecasts for 2, 8 and 26 Mbit/s access are shown in figure 6 in [Stor99a].

Page 32 of 96
Another simple three parameter Logistic model was defined to forecast the distribution between asymmetric and symmetric accesses for each capacity class. The three parameters were estimated based on the following three conditions:
- Estimate of the long-term saturation level (degree of symmetric accesses)
- Rough estimate of time (number of years) until half the saturation was reached
- The degree of symmetric accesses in EoY (end of year) 2000
The long-term asymmetric and symmetric accesses for 2, 8 and 26 Mbit/s from 2000 to 2010 is shown in figure 8. The accumulated forecasts follow the results from the 1997 Delphi survey except for year 2000, where the forecasts are set to 2,6%. The actual broadband penetration for year 2000 was 1%. The forecast for year 2005 is 20,5% and the actual broadband penetration for 2005 seems to be about 28,5% (See chapter 3.4 in the thesis) in the residential market. However, the forecasts for 8 Mbit/s and 26 Mbit/s access capacities have not evolved as fast as predicted. The capacities have been introduced in 2003/2004 but do not have very high market share. So far mainly the business market have got symmetric broadband accesses through SDSL or SHDSL. Therefore, the degree 6 –10% symmetric accesses in 2005 have been too optimistic. Another important point, which is missing in the modelling, is substitution effects between capacities.
3.2 “Broadband access forecasts for the European ma rket” [Stor02a]
In [Stor02a] more advanced residential broadband demand forecasting models were developed for the Western European market. Available demand at that time was annual demand observations from 1999-2001. The main part of countries in Western Europe introduced ADSL in 1999 or 2000. The cable modem technology was introduced in the same period and the cable modem had a very high market share in 1999.
Substitution effects between the main broadband technologies were modelled by applying a set of Logistic models. The main technologies were:
- DSL
- Cable modem (HFC – Hybride Fibre Coax)
- Other broadband technologies
In addition DSL was split in ADSL and VDSL. At that time other broadband technologies were assumed to catch limited market shares during the first years.
The technology forecast modelling was performed in the following way:
The first step was to develop a forecasting model for the total residential broadband penetration. The next step was to make forecasting models for the market share evolution of each of the main broadband technologies. Finally the broadband technology penetration forecasts were found by multiplying the market share forecasts for the technology with the total broadband penetration forecasts. The forecasting models applied were four-parameter Logistic models.
In [Stor02] a four-parameter Logistic model was chosen to forecast the Western European residential broadband market. The number of parameters in the model exceeds the number of observations. A possible solution is to estimate the saturation level independently. The yearly

Page 33 of 96
demand observations for the period 1999-2001 was: 0,2%, 0,9% and 2,9%. However, the demand each year is not representative for all countries since broadband were introduced on different times in the period 1999 – 2001 in Western Europe.
The long-term saturation level was estimated to 90% of the households because of coverage limitations. Estimation of the additional parameters based on the demand observations the first years, gave forecasts which were evaluated to be too high. (The year 2005 forecast was about 30%). Therefore, the forecasts were reduced taking into account earlier forecasts (Delphi survey 20,5%). A “compromise” was to develop forecasts in between and EoY 2005 forecasts were fixed to about 25%. The forecasts are shown in figure 4.1 in [Stor02a].
Figure 9 in [Stor02a] shows the Cable modem (HFC) market share forecasts. The market share forecasts were found by making a forecasting model for DSL and other broadband technologies and subtract the forecast from 100%. OVUM [OVUM01], Forrester [Forr00] and Strategy Analytics [Stra01] had at that time very optimistic forecasts for the cable modem market in Western Europe. They predicted 24% - 44% market share at the end of 2005. The market share forecasts in Figure 9 are close to 20% at the end of 2005. The cable modem market share forecasts modelling is described in more detail in [Stor04a] page 24.
The broadband survey performed by Idate, [Idate05a], [Idate05b], showed 21,9% market share at the end of 2004. Figure 3.1 shows the long-term market share forecasts in [Stor02a].
Figure 3.1 Long-term market share forecasts between cable modems (HFC) and DSL + Other broadband technologies [Stor02a]
Figure 10 in [Stor02a] shows the market share evolution of ADSL and VDSL. This is a very difficult forecast. No other VDSL forecasts were published at that time. The forecasts were based on extensive techno-economic analysis of the VDSL technology and VDSL rollouts ([Stor00], [Stor01], [Henr02]). Applications described in the Delphi surveys are applicable on VDSL. The analysis indicated significant VDSL potentials and a positive net present value for roll out of the new technology. Since there are capacity limitations on the twisted pair as a function of the length of the copper line, the market share saturation for VDSL was set to 40%. It was assumed that the “cherry picking strategy”(no additional infrastructure deployment), would be used the first years limiting the VDSL potential demand.
VDSL was introduced in Western Europe in 2004 (Belgium). IP-TV (TVoDSL) was introduced in 2005 in several European countries. In addition ADSL2+ with 10-15Mbit/s capacity is

Page 34 of 96
installed very extensively. From October 2005, Telenor installs only ADSL2+ line cards instead of ADSL line cards. Because the same DSLAM is used, the ADSL2+ line cards constitute the overall part of the new investments. Therefore, the long-term monthly tariff will evolve against to days ADSL tariff level. A similar evolution is seen for the HFC network. The capacity of the network has increased significantly through new versions of Docsis cable modem specifications: Docsis 1.0, 1.1, 2.0 and 3.0 [CaLab05]. The last version, Docsis 3.0, with minimum dowstream capacity of 160 Mbit/s and minimum upstream capacity 120 Mbit/s, will probably be approved in 2007. However, the hybrid fibre coax network may probably have bottlenecks in the upper part of the coax tree structure if the customers utilise too much capacity in the busy hour.
Anyhow, these facts indicate significant increase in the long-term demand for high capacity broadband.
The evolution of VDSL (figure 10) follows these lines, but should have been delayed 1-2 years.
Another important point arises from these considerations. When long-term technology forecasting models are developed, understanding of technology, the trends and the possibilities are vital. Techno-economic modelling of new technology will often be an important part of the forecasting.
Figure 11 in [Stor02a] shows the prediction of the market share of ADSL capacity classes. The forecasts show how ADSL capacity classes substitute each other. In many West European countries more capacity classes are available. The evolution so far has been based on more differentiation in the lower classes, but the evolution tends to remove the lower capacity classes. In Norway (Telenor) 384 kbit/s and 512 kbit/s are removed and 1024 kbit/s is the lowest capacity2. Exceptions are subscribers with very long copper length. 2, 4 and 6 Mbit/s have been introduced in the market. Hence, the trend described is reasonable even if the capacity classes are more differentiated. The mean values in figure 12 gives a better fundament for comparisons.
Figure 12 is a simple transition from figure 11. It is important to underline that this is mean access capacity, and have nothing to do with carried broadband traffic in the busy hour. Available statistics for Western Europe are not found. However, the ADSL capacity forecasts are evaluated in detail in the chapter 5.3 in the thesis based on Norwegian data. Figure 5.2 in the thesis shows the capacity evolution in the Norwegian market.
Figure 13 gives a complete picture of the market share evolution. The development of the market share forecasts for the class “Other technologies” are not commented in the [Stor02a]. When the forecasts where developed, demand data of other broadband technologies were not available. The forecasts were developed based on an assumption of smooth increase during the first years with a market share of 1,3% at the end of 2005. Later, available data shows that market share evolution for the class “Other technologies” has fluctuated between 1,2% and 1,8% in the period 2001-2004. The future expected evolution is commented in chapter 3.6.
The country group forecasts for the three groups (Finland, Norway), (France, Germany, UK) and (Greece, Portugal) are developed in the same way. The forecasts were based on broadband statistics from OVUM [OVUM01], Jupiter [Jupi01], and Strategy Analytics [Stra01], in the period 1999 –2001 and supplementary information gathered from each participating country in the Tonic project. It turned out that there were some deviations between the national data gathered in the project compared to data from the consultancy companies.
The broadband access penetration forecasts for (Finland, Norway) and for (France, Germany, UK) were rather similar. (Finland, Norway) had the highest growth the first years because of the
2 A low end ADSL 704 kbit/s product was reintroduced at the end of 2005

Page 35 of 96
higher initial penetrations. The long-term saturation level was estimated to be lower in (Finland, Norway) because the countries were more sparsely populated. Therefore, the penetration forecasts for (France, Germany, UK) were estimated to be a little bit higher in the period 2007-2010. However, an important enhancement of the DSLAM technology was invented: The mini DSLAM. The technology made it profitable to roll out DSL in more sparsely populated areas. The saturation level would have been higher and also the forecasts if this fact had been known when the forecasts for (Finland, Norway) were developed.
The broadband access penetration forecasts for (Greece, Portugal) are much lower because of delayed introduction in Greece, low initial demand the first years and lower willingness to pay for broadband.
There are great variations between market share forecasts in the three country groups. The reason is different positions for the DSL operators and cable modem operators regarding initial roll out and especially the cable modem coverage.
3.3 Data availability During the period 1999 – 2001, broadband data from consultancy companies were available and used as the basic statistics for the analysis. There were some deviations in the statistics from the companies, so mean values were used as the basic statistics. For the country group forecasts [Stor02a], information from the participating countries was collected and adjustments were done in the statistics. For the last years, data from Point topic [Point05] is used. This statistics seems to have very good quality. The main problem is that the statistics show the accumulated number of broadband accesses in the residential and the business market. The statistics is shown for DSL and for cable modem. However, the statistics do not contain other broadband technologies. The statistics include the broadband penetration per 100 households in all countries with broadband infrastructure.
The European Commission funded a project to establish broadband statistics for Western Europe. Idate made four surveys in the period 2003-2004 each half-year to establish the statistics [Idate05a].
[Idate05b] is a detailed broadband statistics that is not published, but has been available for the Ecosys project and also for this thesis. The Idate statistics from EoY 2003 together with Point topics statistics were used for the broadband forecasting in [Stor04a]. The Idate statistics for EoY 2004 and the Point topic broadband statistics have been used in chapter 3.4 and 3.5 in the thesis.
3.4 Broadband access statistics During 2000 – 2002/2003 the traditional broadband statistics was reported as pure residential penetration related to number of households. Penetration is a very relevant measure since the total residential demand can be calculated by multiplying the total number of households in a country with the penetration.
The business access statistics is more difficult to handle. The reason is that the business population and the broadband potential are not so easily defined. One possibility is to define the business population as the number of business locations in a country. The definition of business locations is identical with the Norwegian Statistical Bureau of Census definition of a business unit. However, some refinements have to be done because many business units are not active companies and do not need a broadband access. On the other hand, some business units order

Page 36 of 96
more than one broadband accesses. Therefore, the broadband potential for the business market is difficult to estimate and then also the penetration forecasts.
The solution has been to present statistics of the broadband market as the sum of the residential and the business market to avoid some statistical problems. As mentioned in chapter 3.3 the statistics have limitations. Point topic makes this type of statistics [Point05]. The broadband statistics are presented as the number of broadband accesses per 100 inhabitants. The statistics covers most of the countries in the world that has deployed broadband. By accumulating the accesses for all countries in Western Europe, the following table is constructed:
Table 3.1 Broadband penetrations (DSL and cable modem) in Western Europe for sum residential and business market [Point05]
Year Penetration per Penetration perinhabitant household
2002 Q4 3,3 % 7,9 %2003 Q4 6,2 % 14,4 %2004 Q2 8,3 % 19,1 %2004 Q4 10,5 % 24,4 %2005 Q2 12,7 % 29,3 %
Western Europe covers the EU15 countries and Iceland, Norway and Switzerland.
In [OECD05] the status of other broadband technologies in Western Europe is described. The access demand and a backward projection are presented in table 3.2.
Table 3.2 Evolution of demand for other broadband services than DSL and cable modem in Western Europe [OECD05]
Year Other Technology
2002 Q4 2951192003 Q4 5565382004 Q2 7363972004 Q4 9402062005 Q2 1130000
Table 3.3 includes other broadband technologies and shows the sum of table 3.1 and 3.2.
Table 3.3 Broadband penetrations in Western Europe for sum residential and business market [Point05] and [OECD05]
Year Penetration per Penetration perinhabitant household
2002 Q4 3,4 % 8,1 %2003 Q4 6,4 % 14,8 %2004 Q2 8,4 % 19,6 %2004 Q4 10,8 % 25,0 %2005 Q2 13,0 % 30,0 %

Page 37 of 96
In order to establish statistics for the residential and the business market, additional information is necessary. The Idate statistics [Idate05b] are used. The Idate statistics do not cover Switzerland. Therefore, adjustments for Switzerland have been made to get a complete statistics for Western Europe.
The adjusted Idate statistics have been used to separate the residential and the business market, which is showed in table 3.4 and 3.5
Table 3.4 Broadband penetrations per inhabitant for the residential and business market in Western Europe [Idate05b]
Year Penetration per inhabitantResidential Business Total
2003 Q4 4,8 % 1,4 % 6,2 %2004 Q2 6,0 % 1,6 % 7,5 %2004 Q4 8,2 % 1,9 % 10,2 %
Table 3.5 Broadband penetrations per household for the residential and business market in Western Europe [Idate05b]
Year Penetration per householdResidential Business Total
2003 Q4 11,3 % 3,3 % 14,6 %2004 Q2 14,2 % 3,7 % 17,9 %2004 Q4 19,6 % 4,6 % 24,2 %
Table 3.3 and 3.5 show that there are minor differences in Point topic’s and Idate’s total estimate for the broadband market in Western Europe. The total penetration per household for 2004 Q4 is 24,2% for Idate and 25,0% for Point topic. The difference is larger for 2004 Q2 (1,7%), while the difference is 0,2% for 2003 Q4.
The Point topic total number of broadband accesses (included other technology) for 2004 Q4 was 40.267.220.
The Idate statistics (including Switzerland) of total number of broadband accesses for 2004 Q4 was 39.925.582.
The difference between the two volumes is less than 1%.
The deviations between the total penetrations per household: 25,0% and 24,2% is 0,8%. However, the relative difference (0,8% / 25%) is 3,2% which is much more than 1%. The reason is the use of different population sizes and household sizes when the penetrations were calculated.
In the following, the mean value of the adjusted Point topics and Idate statistics are used as a reference level.
Estimation of the 2005 Q2 statistics for residential and business penetration, prediction of the market share is made in table 3.6.
Table 3.6 Proportion between the size of the business market and the residential market as a function of time

Page 38 of 96
Year Market share Residential Business Total
2003 Q4 77,5 % 22,5 % 100,0 %2004 Q2 79,2 % 20,8 % 100,0 %2004 Q4 80,9 % 19,1 % 100,0 %2005 Q2 82,6 % 17,4 % 100,0 %
The last line in the table is a prediction, while the other values are found from table 3.5. The table shows that the residential market grows faster than the business market. The reason is that the broadband business accesses increased relatively faster than the residential accesses during the first years.
Finally, table 3.7 shows the demand broadband access statistics based on mean value of the broadband demand from Idate and Point topic statistics.
Table 3.7 Broadband penetrations per household for the residential and business market in Western Europe. [Point05] and [Idate05b]
Year Penetration per householdResidential Business Total
2003 Q4 11,4 % 3,3 % 14,7 %2004 Q2 14,8 % 3,9 % 18,7 %2004 Q4 19,9 % 4,7 % 24,6 %2005 Q2 24,4 % 5,1 % 29,5 %
The residential broadband penetration per household in Western Europe is shown in the left hand side of table 3.7. The penetration reached 24,4% in Western Europe second quarter 2005. No information is available of the penetration EoY 2005. Table 3.7 shows that the half year difference between 2004 Q4 and 2004 Q2 was 5,1%, while the difference between 2005 Q2 and 2004 Q4 was 4,5%. The broadband penetration per household at the end of 2005 is estimated to be about 28,5%.
3.5 Long-term broadband forecast modelling of the b usiness market As mentioned, broadband penetration forecasts are very convenient to use. These types of forecasts have an upper limit (saturation), which some time can be estimated independently.
The objective with this section is to identify differences between the growth in the broadband residential and business market and to show how broadband penetration forecasts of the business market can be modelled.
The broadband access demand for the business market is found from table 3.7:
Table 3.8 Evolution of the business market access volume in Western Europe

Page 39 of 96
Year Access Volume2003 Q2 45246602003 Q4 54078062004 Q2 61593912004 Q4 6960718
A Logistic model has been applied for the business market broadband penetration forecasts. The model, or the data, does not separate IP-VPN and Internet accesses.
This approach uses assumptions from broadband forecast modelling of the Norwegian market.
The following considerations are important for estimating the market potential:
- The number of business units
- Many business units have been constructed of pure tax reasons
- 62% percentage of business units in Norway have no employees [SSB06]
- Small business units like fishermen and farmers and others do not order business DSL, but instead private (residential) DSL
On the other hand, additional broadband accesses must be included for larger business units. In modelling the demand for the Norwegian market, it is assumed that potential number of broadband accesses per business unit is the number of employees divided by 20. In other words, 20 employees should as a mean consideration have the possibility to use one broadband access in parallel. The assumptions have been based on busy hour concentration and packet switching concentrations discussed in [Stor02b] and in section 5.3 in this thesis. The number 20 is continuously evaluated because the evolution of higher subscription access capacity and usage of more demand capacity applications.
A factor to be used for downscaling number business units to potential broadband access for the business market is 0,48. The factor takes into account reduction in number of business units that will order broadband and adjustments for larger business units, which in the long run will order more than one broadband access. The downscaling factor also includes a long-term saturation of 85% of the potential broadband business accesses.
The factor 0,48 has been used for Western Europe assuming that the business structure is the same as in Norway.
The number of business units is found in the [Idate05b]. The number for Western Europe including Switzerland is 28.503.000.
This yields a broadband access potential for the business market of 13.681.000. The penetrations are estimated to be:
Table 3.9 Estimated broadband access penetration for the Western European business market
Year Penetration2003 Q2 33,1 %2003 Q4 39,5 %2004 Q2 45,0 %2004 Q4 50,9 %
A four parameter Logistic model is used to make long-tem forecasts.

Page 40 of 96
The business penetration forecasts are shown in figure 3.2. Also the residential penetration forecasts developed in [Stor04a], see next section of the thesis, are shown in figure 3.2.
Broadband penetration forecasts for the business an d residential market in Western Europe
0,0 %
10,0 %
20,0 %
30,0 %
40,0 %
50,0 %
60,0 %
70,0 %
80,0 %
90,0 %
2002 2003 2004 2005 2006 2007 2008 2009 2010
Pen
etra
tion
(%)
Business
Residential
Figure 3.2 Broadband penetration forecasts for the business and residential market in Western Europe
The broadband forecast modelling shows that some assumptions of estimating the potential are necessary to make penetration forecasts for the business market.
An alternative method is to make forecasts based on the access demand in table 3.8. Then the forecasts will not be dependent on a set of assumption for estimating the broadband potential. However, it is very difficult to make long-term forecasts on these statistics alone. The best should be to utilise additional information like number of business units etc.
The method suggested could be developed further taking into account specific aspects for different countries.
One important message is the very different penetration evolution in the business and residential market.
Over time, table 3.6 shows that the relative proportion of broadband business accesses to residential accesses changes in favour of residential accesses. Figure 3.2 confirms the evolution and shows that the broadband business market has a higher penetration and is closer to saturation than the residential market.
Therefore, it is recommended to separate the most common available broadband statistics, which shows the broadband evolution as the total number of business market accesses and the residential accesses per 100 inhabitants. Development of separate forecasts for the business and residential market makes it possible to forecast the access evolution in various areas with different mix of residential and business customers.

Page 41 of 96
3.6 “Long-term broadband technology forecasting” [S tor04a] The paper gives an overview of different broadband technologies and underlines the necessity to understand the strength and weaknesses of each technology. Section 6 in the paper introduces “Techno-economic assessments” because the methodology is important for the evaluation of the various broadband technologies.
The position of the dominating broadband technologies is influenced by the supply side because the mass production of network components generates low component costs, reduced investments and reduced tariffs. The roll out and coverage of the various technologies are also of great importance. The residual market which cannot be covered by the dominating technologies, also gives possibilities for alternative technologies. Two - tree years ago the residual market was a rather significant part of the total market. At that time, the residual market in Norway was estimated to 25%. However, when mini DSLAMs were introduced, the residual market was reduced significantly. Such technology innovations increase the market possibilities and the forecasts. Relevant technologies for the residual market are DSL, WiFi, WiMAX and possibly DTT, UMTS/HSDPA and satellite for very sparsely populated areas.
The broadband forecasting methodology follows the same approach as described in [Stor02a]. The four main broadband technologies are:
- ADSL
- ADSL2+/VDSL
- Cable modem (HFC)
- Other technologies.
The DSL- and cable modem coverage is analysed. Coverage forecasts which are important premises, are developed and long-term penetration forecasting models and the forecasts are described.
The broadband penetration forecasts for end of year (EoY) 2005 were estimated to be 26,6%. The forecasts are shown in figure 8.4 in [Stor04a]. Because of a very strong growth the last year, penetration in the Western European market will increase from 19,9% EoY 2004 to about 28,5% EoY 2005.
The broadband survey data from Idate, [Idate05a], [Idate05b], shows a significant reduction of the cable modem market share during the last year ending up with 21,9% in the end of 2004. The reason is relatively higher DSL growth compared with cable modem growth. Therefore, the long-term saturation level for cable modem will be lower than originally estimated.
The broadband survey from Idate, [Idate05a, Idate05b], confirms the very significant ADSL growth and the dominating market share of 76,4% EoY 2004. Now, ADSL2+/VDSL have been introduced commercially in the Western European market. Some operators like Belgacom have introduced VDSL and many operators are installing ADSL2+ cards in the DSLAMs. Therefore, ADSL2+/VDSL will capture a significant market share during the next years. Figure 8.9 in [Stor04a] shows the ADSL2+/VDSL market share forecasts and gives argumentation for the forecasts. The Logistic model is used for the ADSL2+/VDSL market share forecasts. The next DSL generation with 50 to 100 Mbit/s access capacity is DSM [Ciof04]. This technology is so far not included in the forecasts modelling.
In [OECD05] an overview of broadband subscribers by technology per 100 inhabitants is shown per June 2005. The statistics cover both the business and the residential market.

Page 42 of 96
0
5
10
15
20
25
30
Korea
Nethe
rland
s
Denmark
Icela
nd
Switzer
land
Canad
a
Finlan
d
Belgiu
m
Norway
Sweden
Japa
n
United
Sta
tes
United
Kin
gdom
Franc
e
Austri
a
Luxe
mbo
urg
Austra
lia
Germ
any
Italy
Portu
gal
Spain
New Z
ealan
d
Hunga
ry
Irelan
d
Polan
d
Czech
Rep
ublic
Slovak R
epub
lic
Turke
y
Mex
ico
Gree
ce
Source: OECD
DSL Cable Other
OECD Broadband subscribers per 100 inhabitants, by technology, June 2005
OECD average
Figure 3.3 Broadband penetration per 100 inhabitants (Business + Residential) by technology, Q2 2005, for the OECD market (OECD June 2005)
The statistics shows that the South Korea, Netherlands, Belgium, Switzerland, Canada and the five Nordic countries have the highest broadband penetration followed by Japan and United States. The broadband statistics also show that Japan, South Korea, Sweden, Denmark and United States have a much higher market share of new technology than other countries. Norway is no 6 on this list. The statistics also show that all countries with a relatively high market share of other technologies were among the 12 OECD countries with the highest broadband penetration. The [ECC05] supports the statistics regarding other technologies.
Figure 8.7 in [Stor04a] shows the market share evolution of “Other technologies” than DSL and cable modem. Relevant technologies for the residential market are: FTTB, FTTH, FWA (WiFi, WiMax, CDMA 450) and possibly PLC (Power Line Communication). The figure shows the market share evolution 2000 –2003: 0,4%, 1,2%, 1,8%, 1,6%.
For 2004 the market share is estimated to be 1,7%, ([Idate05b], [OECD05]). During the last three years the market share has not increased in the Western European market. Of course the volume of accesses of other technologies has increased, but only in the same proportion as the total broadband access volume.
Figure 3.4 shows the market share evolution of the main broadband technologies in the Norwegian market.
The figure shows that wireless solutions were established very quickly in the Norwegian market, but did not succeed in capturing higher market share. The reason is that the wireless solutions are expensive and the technology looses market share when the DSL technology is established in the same areas. However, there is still about 10% of the Norwegian market, which is not covered by broadband, and the technology has potential in these areas. Fibre solutions are now growing significantly. Status for Q3 2005 is 4,7% market share consisting of 3,5% fibre and 1,2% wireless solutions. Operators in the market are offering excellent triple play solutions. In addition fibre are deployed in new “green fields” for dwelling and the modern cottages market and in areas with much failures in the access networks. In Denmark and Sweden fibre is deployed to large buildings with inside Ethernet connections. Other possibilities, which may be used later, is to utilize old (and new) tube structure in the cities to draw fibre to the buildings.
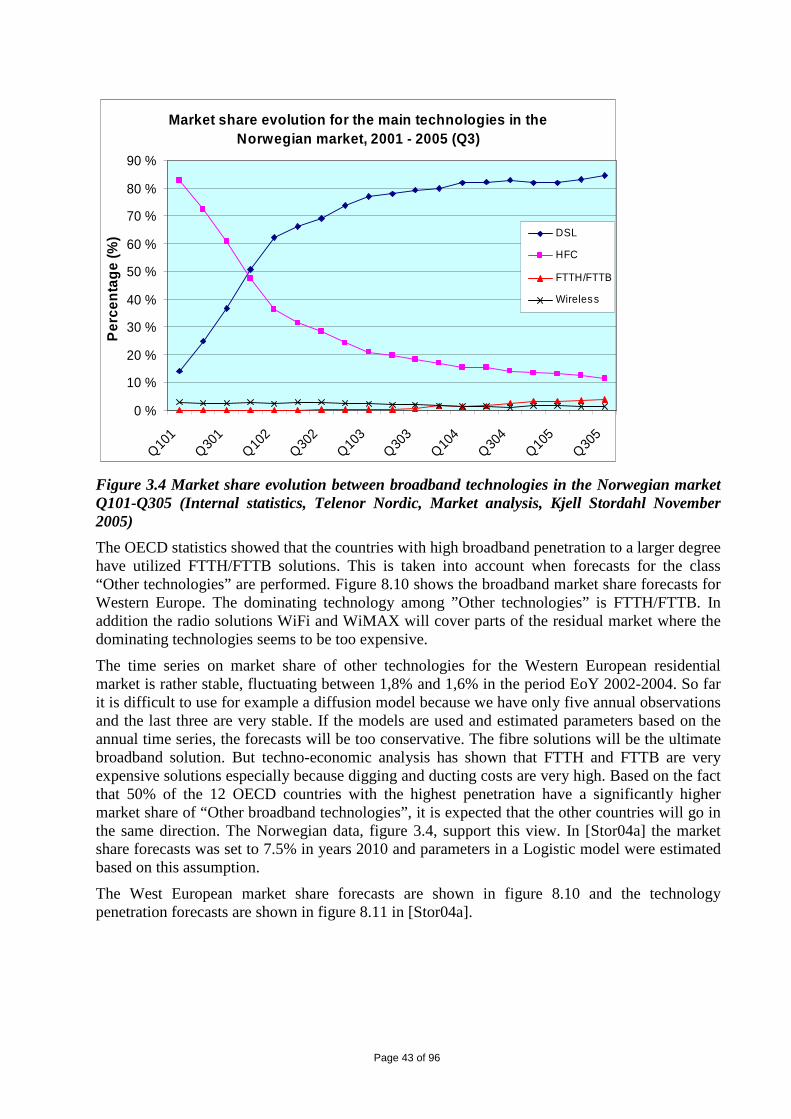
Page 43 of 96
Market share evolution for the main technologies in the Norwegian market, 2001 - 2005 (Q3)
0 %
10 %
20 %
30 %
40 %
50 %
60 %
70 %
80 %
90 %
Q101
Q301
Q102
Q302
Q103
Q303
Q104
Q304
Q105
Q305
Per
cent
age
(%)
DSL
HFC
FTTH/FTTB
Wireless
Figure 3.4 Market share evolution between broadband technologies in the Norwegian market Q101-Q305 (Internal statistics, Telenor Nordic, Market analysis, Kjell Stordahl November 2005)
The OECD statistics showed that the countries with high broadband penetration to a larger degree have utilized FTTH/FTTB solutions. This is taken into account when forecasts for the class “Other technologies” are performed. Figure 8.10 shows the broadband market share forecasts for Western Europe. The dominating technology among ”Other technologies” is FTTH/FTTB. In addition the radio solutions WiFi and WiMAX will cover parts of the residual market where the dominating technologies seems to be too expensive.
The time series on market share of other technologies for the Western European residential market is rather stable, fluctuating between 1,8% and 1,6% in the period EoY 2002-2004. So far it is difficult to use for example a diffusion model because we have only five annual observations and the last three are very stable. If the models are used and estimated parameters based on the annual time series, the forecasts will be too conservative. The fibre solutions will be the ultimate broadband solution. But techno-economic analysis has shown that FTTH and FTTB are very expensive solutions especially because digging and ducting costs are very high. Based on the fact that 50% of the 12 OECD countries with the highest penetration have a significantly higher market share of “Other broadband technologies”, it is expected that the other countries will go in the same direction. The Norwegian data, figure 3.4, support this view. In [Stor04a] the market share forecasts was set to 7.5% in years 2010 and parameters in a Logistic model were estimated based on this assumption.
The West European market share forecasts are shown in figure 8.10 and the technology penetration forecasts are shown in figure 8.11 in [Stor04a].

Page 44 of 96
3.7 Techno-economic analysis Techno-economic analysis is described in section 6 in [Stor04a].
From 1992 to 2005 the European programs RACE, ACTS, IST and CELTIC through the projects RACE 2087/TITAN, AC 226/OPTIMUM, AC364/TERA, IST-2000-25172 TONIC and ECOSYS have developed a methodology and a tool for calculation of the overall financial budget of any access architecture. The techno-economic analyses are used to evaluate technical projects and portfolios.
The tool handles the discount system costs, operations, maintenance costs, life cycle costs, net present value (NPV) and internal rate of return (IRR). The tool combines low level, detailed network parameters of significant strategic relevance with high level, overall strategic parameters for performing evaluations of various network architectures.
The analyses were applied on different broadband technologies to examine prospects of the different technologies. The analyses and evaluations performed are important input to the broadband technology forecasts.
The techno-economic analyses have been used rather extensively in the mentioned European projects to analyse broadband and mobile business cases, technology roll out, studies of actors like operators, broadband strategies etc.
Figure 3.5 illustrates how the techno-economic assessments are performed.
NPVNPV IRRIRR PaybackPeriod
PaybackPeriod
Economic Inputs
Cash flows, Profit & loss accounts
Geometric Model
Services Architectures
Year 0 Year 1 Year n Year m. . .
Demand for the Telecommunications Services
DB
RevenuesOA&MCosts
Life Cycle Cost
Life Cycle Cost
First Installed Cost
First Installed CostInvestments
Risk Assessment
Figure 3.5 Techno-economic tool for calculation NPV, IRR and payback period for telecommunications projects
Figure 3.5 shows that broadband demand forecasts are fundamental inputs to the analysis.

Page 45 of 96
In [Ims98] more detailed descriptions of techno-economic modelling and the tool are found.
Chapter 20 in [Ims98] gives a very good overview of the findings from techno-economic analysis. Different broadband technologies have been analysed. The possibilities for each technology is described based on capacity offered, investments per homes passed, broadband connected demand etc. Similar results are described in [Olsen96], [Ims96], [Ims97b] and [Myhr99].
The techno-economic analysis shows the ability of the different broadband technologies in urban, suburban and rural areas combined with investment and revenue possibilities.
These results are important for broadband technology forecasting.
3.8 Broadband forecasts comparisons Figure 10.2, section 10 in [Stor04a] makes comparisons between long-terms forecasts from:
- Tera (1998) [Stor99a]
- Tonic (May 2001) [Stor02a]
- Jupiter (February 2003) [Jupi03]
- Forrester (June 2003) [Forr03]
- Jupiter (April 2004) [Jupi04]
- Ovum (May 2004) [OVUM04]
- Ecosys (August 2004) [Stor04a]
The forecasts are plotted from 2000 until 2008, which is the last year because some of the consultancy forecasts stops at the end of 2008. The forecasts are shown in figure 3.6 in this thesis, which is the same as figure 10.2, section 10 in [Stor04a].
Comparison of long-term forecasts
0 %
10 %
20 %
30 %
40 %
50 %
60 %
1999 2000 2001 2002 2003 2004 2005 2006 2007 2008
Pen
etra
tion
(%)
Tonic (M ay 2001)
Ecosys (A ugust 2004)
OVUM (M ay 2004)
Tera (1998)
Jupiter (A pril 2004)
Forrester(June 2003)
Jupiter (2003)
Figure 3.6 Comparisons of long-term broadband penetartion forecasts for the residential market

Page 46 of 96
The forecasts are grouped in:
High Long-term forecasts:
- Tonic (2001)
- Ecosys (2004)
- OVUM (2004)
Low Long-term forecast:
- Tera (1998)
- Jupiter (2004)
- Forrester (2003)
- Jupiter (2003)
Looking on the Tera (1998) forecasts [Stor99a], we see a much steeper growth rate in 2008 compared to other forecasts in this group. Figure 6 in [Stor99a] shows that the Tera broadband penetration forecast in 2010 is estimated to be 44% for the Western European market. This will be considerably higher than the expected predictions for the other forecasts in that group. Hence, the Tera (1998) forecasts should be upgraded to the “High Long-term forecasts” group.
The crucial question is what the expected future evolution of broadband penetration in Western Europe is. The penetration is expected to be about 28,5% at the end of 2005. The annual growth seems to be about 8,5% percentages - a formidable annual increase.
In figure 10.2 the Ecosys (2004) forecast is the highest one in 2005 and estimated to be 26,6% EoY 2005. These facts support the conclusion that the “High” Long-term forecasts clearly seem to give the best forecasts. Based on knowledge from 2005, even the “High Long-term forecasts” group should be renamed to “Medium” Long-term forecasts. The Ecosys forecasts have a turning point in 2007, which indicates reduced growth in the Western European market.
3.9 Experiences and conclusions The papers on long-term technology forecasting for the residential Western European broadband market documents fairly good results. There are of course deviations when the forecasts are compared with the real access demand. The EoY 2005 forecasts for the residential broadband demand were 20% [Stor99a], 24,9% [Stor02a] and 26,6% [Stor04a]. The penetration end of year 2005 is expected to be about 28,5%. It should be noted that no historical broadband observations were available when the first forecasts were developed.
The broadband forecasts made in 1998 [Stor99a] modelled each broadband capacity class independently without taking into account substitution effects. The approach has obviously been wrong. The capacity classes modelled was 2 Mbit/s, 8 Mbit/s and 26 Mbit/s. During the years 1999 –2005 we have seen much more differentiation in lower capacities and also substitution effects between each capacity class.
In [Stor02a] and [Stor04a] the substitution effects have been build into the models by using a set of Logistic models.

Page 47 of 96
The experience from work with long-term forecasting models shows that it has been extremely important to catch up new information about recent developments in broadband technologies. Some examples are:
- The development of mini DSLAM, which made it possible to roll out mini DSLAM in sparsely populated areas
- The very low production price of ADSL2+ subscriber line cards, which in the long run will decrease the price and increase the demand on high capacity broadband accesses
- Enhancement of ADSL to Rate adaptive ADSL, which gives a larger coverage (will be implemented in Telenor’s network in 2006).
- Introduction of DSM – Dynamic Spectrum Management, which will increase the DSL capacity considerably [Ciof04]
- Information about approved new standards, for example for WiMax and other services
- etc
Techno-economic analysis is also an important key for long-term forecasting. The analyses have been applied on the various broadband technologies. The papers [Olsen96], [Ims96], [Ims97b] and [Myhr99] documents strength and weakness of various broadband technologies. The analyses show that FTTH solutions are very expensive and the marked share evolution for FTTH will move slowly upwards. The main reason is large digging and ducting costs. The cost for a fibre connection to a home (FTTH) is expensive compared with fibre connection to buildings where many households shares the digging and ducting costs. The analyses have shown that DSL and cable modem (HFC) definitely are the cheapest broadband solutions. The techno-economic analyses have also examined many other broadband technologies. The results of the analysis are important input to the forecasting process.
International broadband access statistics is often published as the number of accesses per 100 inhabitants, but does not distinguish between the residential and business market. The statistics is easy to produce in that way, but the statistics create problems for forecasters since they have to transform the statistics to separate residential and business broadband access statistics in order to make better forecasts. Statistics of percentage of households with broadband access (residential broadband penetration) is much easier to use than total number of broadband accesses in the residential and business market together. Furthermore, the residential broadband penetration is interpretable, easy to use and helps the forecaster to make better forecast modelling.
A simple model for broadband penetration forecasts in the business market of Western Europe is developed. The model is based on estimating the potential broadband business market. It is important to notice that a registered business unit is not necessary a potential for a broadband access. In Norway 62% of the registered business units do not have employees. There are significant uncertainties in the estimation of the potential broadband access market.
It is showed that the relative proportion between residential and business broadband accesses continuously is changing, which shows that the penetration of the residential and business market evolves differently.
A main problem for making long-term forecasting models for the Western European market is lack of detailed information from each West European country. The forecasting models are only based on aggregated data, because it has not been possible to make separate forecasting models for each country in Western Europe. If each country had been treated separately by using detailed country specific information, the aggregated forecasts for Western Europe would have been better.

Page 48 of 96
4 LONG-TERM FORECASTING MODELS FOR COST EVOLUTION OF COMPONENTS AND TECHNOLOGIES
Learning curves are used in the industry to predict reduction in production time and costs as a function of produced volume. Borgar T Olsen and Kjell Stordahl invented in 1993 and published in 1994 a new forecasting model for cost predictions [Olsen94]. The forecasting model is an extension of the learning curve model of Wight and Crawford ([Wrig36] and [Craw44]).
The extended learning curve model is more flexible, predict the cost evolution as a function of time and has interpretative parameters. The model has the ability to make long-term forecasts for component costs even when number of observations is limited.
The following paper is enclosed as a part of the thesis:
• Olsen B. T., K Stordahl, “Models for forecasting cost evolution of components and technologies” Telektronikk (100) no4, 2004. [Olsen04]
4.1 “Models for forecasting cost evolution of compo nents and technologies” [Olsen04]
Wright and Crawfords’ traditional learning curve models could not be used directly in techno-economic calculations because the cost function was a function of number of produced units and not a function of time. The learning curve model is a simple exponential function starting with given cost at t=0. The cost is reduced with the function n-α where α is a parameter and n the production volume.
The first step was to derive a forecasting model of the production volume n(t). The production volume evolution, n(t), is assumed to follow a Logistic model with 3 or 4 parameters. The paper describes the substitution by the Logistic model into the learning curve model in more detail. Hence, the extended learning curve model can be used to forecast component costs as a function of time.
The second step was to transform the parameters of the model to be interpretative (Annex 1-3 in [Olsen04]). The transformations resulted in the following interpretative parameters:
- Production cost in the reference year (starting year)
- The relative accumulated production volume in the reference year
- The time span between 10% to 90% accumulated volume (“Mini life cycle” = main part of the life cycle to the component)
- The learning coefficient (How much the cost is reduced when the production volume is doubled)
The reference year is defined as the year when the component is implemented in a given project. However, the component may have been produced on worldwide basis some times earlier.
The traditional objective from a statistical point of view is to estimate the parameters. When the number of observations is limited or when there are no observations at all, statistical methods may not be used to estimate the parameters. However, when the parameters are interpretative, additional knowledge may be included for the estimation.

Page 49 of 96
To give some examples:
- The component price in the reference year should be known because of negotiations with the industry who produces the components
- We should have an opinion about where the component is in the life cycle, when the component is bought
- Life cycle of new components is decreasing, because new technologies substitute the old technologies increasingly rapid than for ten years ago. Therefore, it should be possible to give a rough estimate of the “Mini life cycle” of a component.
- Based on experience regarding type of component, we should have opinion about how much the cost is reduced when the production volume is doubled. (Components based on new technology have higher reductions than more traditional components)
Table 7.1 in [Olsen04] shows how much different types of component costs are reduced when the production volume is doubled.
Table 7.2 shows how different components are classified in different volume classes. This is used for the extended learning curve forecasts.
Figure 5.1 and especially 5.2 in [Olsen04] shows that the product life cycle decreases with time. In the projects TITAN, OPTIMUM, TERA, TONIC and ECOSYS, techno-economic calculations have been performed to evaluate different broadband technologies and rollouts.
In the techno-economic projects mentioned, a large database of network components has been established and maintained. The database contains more a large set of network components, which are classified according to the different volume classes.
Section 8 in [Olsen04] describes how the parameters in the extended learning curve model are estimated. Since the parameters are interpretative, the parameters may also be assessed. In the two cases presented, the estimated parameter values seemed to be reasonable.
4.2 Experiences and conclusions The originally learning curve models by Wright and Crawford do not have the ability to predict the price as a function of time. The extended learning curve model developed by Olsen and Stordahl, has included a Logistic model enabling the model to forecast the component costs as a function of time.
The extended learning curve model is an important part of the tool for techono-economic calculations and analysis. Since the technology and the component often are new, very limited information is available of the cost evolution.
Very often the examined business cases includes rather new technologies or a set of rather new network components. Then, there are not enough statistics to estimate the model parameters.
The extended learning curve model includes both observations and a priori knowledge through interpretative parameters into the forecast modelling. Therefore, this type of model has much larger applicability than traditional models, which is more dependent on pure statistical estimation procedures.

Page 50 of 96
5 LONG-TERM TRAFFIC FORECASTING
Long-term traffic forecasting is important for network planning. Short- and medium-term forecasting is important for local extensions in the network, while long-term forecasts gives valuable information for larger investments in the networks and for decisions regarding services and new network platforms.
Three papers are enclosed as a part of the thesis:
• Stordahl K, “Forecasting – an important factor for network planning”. Telektronikk (99) no 3, 2003 [Stor03a]
• Stordahl K, K O Kalhagen, B T Olsen, J Lydersen, B Olufsen, N K Elnegaard, ”Traffic forecast models for the transport network”. In Proc Networks2002, Münic, Germany, June 23-27, 2002. [Stor02b]
• Stordahl K "Methods for traffic matrix forecasting". In Proc 12th International Teletraffic Congress. Torino, Italy, June 1-8, 1988. [Stor88]
5.1 Forecasting models [Stor03] lists relevant classes of forecasting methods for network planning. The following forecasting methods were recommended for access forecasting: Diffusion models, regression models, econometric models, ARIMA models, Kalman filter models and smoothing models. The same classes of models with exception of diffusion models were recommended also for traffic forecasting. The reason that diffusion models were excluded is that the models have a saturation level, which cannot be identified for the traffic.
The ARIMA models, Kalman filter models and Holt-Winters’ smoothing models are convenient for modelling seasonal behaviour. The Kalman filter models and the smoothing models may be used for “automatic” forecasting without specific interference for estimating the model parameters. It is recommended to use “back casting” to improve the quality of the smoothing models forecasting ability. Now, program packages exist for automatic estimation of autoregressive and moving average parameters and identification of the number of differences in the ARIMA models. Therefore, these types of models may be used automatically. Automatic forecasting methods were used to forecast the traffic elements in the Extended weighted least squares method [Stor88], while manual procedures for developing the forecasting models were used for the aggregated traffic.
Diffusion models, regression models and econometric models are candidates for long-term forecasting. The reason is that regression models and econometric models have the ability to include important explanatory variables. When a forecasting model with explanatory variables is assessed based on historical fitting, it is important to note that for example a very high multiple correlation coefficient does not necessary mean that the model is good. The model fitting is based on exact values of the explanatory variables. However, the model forecasts are based on forecasts of the explanatory variables, which of course will not be true values, but forecasts with uncertainties. Therefore, explanatory variables with large uncertainties in the forecasts should not be included in the forecasting model even if the fitting has turned out to be very good. Forecast of

Page 51 of 96
some explanatory variables regarding the Norwegian economy from the Bank of Norway or the Norwegian Bureau of Census may be relevant as explanatory variables and it may be other. However, it is important to understand the dynamics of the forecasting process.
Diffusion models perform an interesting class of models for access forecasting. The models are based on annual data, which may be a weakness. On the other hand, in its simplest form, the models have only one explanatory variable and the variable is the time (number of years). There is no uncertainty to forecast this explanatory variable. The models consist of a set of growth parameters and a parameter for the saturation level. Usually, the saturation may be estimated directly and not by the historical observations. Several alternatives may exist for estimation. Results from market surveys may be one alternative. The percentage of the population – for example based on long-term coverage assumptions for a broadband access may be another.
As shown in this thesis, the Logistic models have been used to develop long-term forecasts. It has also been commented that the choice of model among the diffusion models had not been very important because the number of observations have been limited and some time not enough even to estimate the parameters in the model. However, when number of observations is sufficient a two steps iteration procedure is used to estimate the parameters in the logistic model. The iteration procedure is explained in section 4.5 in [Stor99a]. Regression analysis is applied for the estimation. It is important to underline that the multiple correlation coefficient cannot be used as a criteria for fitting quality. The fitting is based on accumulated data, which means that the observations itself have a very high self-explaining effect and the observations are not at all independent, which is a criteria for using the multiple correlation coefficient.
The selection and application of the logistic models for long-term forecasting has not been based on the multiple correlation coefficient, but more on experience regarding the forecasting results, which is commented earlier in this thesis.
The statistical modelling and estimation is usually not enough for the long-term forecasting process. As commented several times in the thesis, it has been important to make techno-economic evaluations of various broadband technologies to evaluate the future possible market share for the technology. Also specific break through in production technology is important. Therefore, additional information has to be included in the modelling.
5.2 " Forecasting – an important factor for network plann ing" [Stor03a]
The paper gives an overview of forecasts and forecasting methodology for network planning. Many network planning issues need long-term forecasting. [Stor03a] lists a set of network planning processes. The following are linked to long-term forecasting:
- Choice of technology and network components
- Design of network structure
- Implementation of new network functionality
- Introduction of new services
- Replacement strategies for old technology/old components
- Long-term strategy planning

Page 52 of 96
Investment analyses are usually based on Net Present Value and Payback period is applied. The horizon of this type of analysis will usually be 4-5 years or more. Crucial input to the investment analysis is long-term forecasts.
The paper also gives an overview of different forecasts, which support the planning process. The following long-term forecasts are relevant:
- Forecasts for service demand
- Subscription/access forecasts
- Traffic volume forecasts for services and applications
- Market segmentation forecasts
- Forecasts based on competition/market share
- National/regional/local level forecasts
- Forecasts allocated to various network
- Forecasts allocated to transport/access network
[Stor03] shows several examples of strategic evaluations and decisions regarding new technologies and new networks where long-term forecasts play an important role. Some major introductions in the Norwegian network during the last 20 years are listed.
Substitution effects are important for long-term forecasting. New technology substitutes old technology for the long run. This of course affects the forecasts. The paper mentions narrowband Internet, which continuously is substituted by broadband regarding accesses and traffic.
The following figure (newly developed and not a part of [Stor03a]) shows the penetration growth of some technologies in the Norwegian network:
Access penetration per year after introduction
0,0 %
20,0 %
40,0 %
60,0 %
80,0 %
100,0 %
120,0 %
1 2 3 4 5 6 7 8 9 10 11 12 13
Pen
etra
ion
in %
BB telephony accessGSMBroadbandDSLISDNNMT
Figure 5.1 Access penetrations for different technologies in the Norwegian market as a function of number of years after introduction (Kjell Stordahl, November 2005).

Page 53 of 96
The penetration for NMT and GSM is based on the Norwegian population, while penetration of the other services are based on the number of households in Norway
The figure shows what is stated in [Stor03a]: That broadband is substituting narrowband Internet, which affects the evolution of ISDN. The figure also shows the strong growth of Broadband telephony accesses.
[Stor03a] describes subscriber/access, capacity and traffic forecasting which is commented earlier in this thesis.
The last part of the paper discusses uncertainties and risks related to the forecasts. This aspect will be treated in the next chapter of the thesis.
5.3 “ Traffic forecast models for the transport network”[ Stor02b] In 2002 the broadband technology was well established and the broadband traffic had started to be a noticeable part of the total traffic. The paper analyses the broadband traffic, propose a structure of the expected traffic based on different traffic segments and suggest some general long-term traffic forecasting models.
Separate models are suggested for the residential and business market. The traffic forecasting models estimates the traffic load in the busy hour. The traffic load in the busy hour will vary in different places in the network depending on the respective shares of mix between residential and business customers. The generated busy hour is in addition dependent of traffic behaviour of the two customer classes since they don’t have busy hour at the same time. This procedure has to be followed for network planning. However, to get information about the general traffic growth, the traffic indicator formulas in the paper may be used.
Input to the traffic indicator defined in equation (1), are residential broadband access forecasts described in [Stor02a] and the revised forecasts [Stor04a] evaluated in Chapter 3 in the thesis.
Input to the traffic indicator defined in equation (2), is business broadband access forecasts. Description of broadband business forecasts is found in section 3.5 in the thesis. Input to the traffic indicator defined in equation (3), is mobile access forecasts shown in figure 5 and described in [Stor02a] and adjusted forecasts described in [Stor04a] and [Stor05b].
The total traffic volume in busy hours may be found by adding traffic from the three indicators mentioned and also the traffic from other operators who are leasing parts of the network.
The broadband traffic load is a function of the traditional busy hour concentration, but also the packet switching concentration factor. The last factor depends very much of the applications applied and how they are used. In addition the available access speed or capacity is important.
The traffic forecasts for the incumbent are based on a set of traffic indicators. The formula is rather complex because representative traffic measurements were not available for pure broadband traffic. The traffic forecast indicator segments the incumbents broadband traffic based on the following variables:
- Broadband penetration forecasts
- Number of households/business units
- Busy hour concentration factor
- Packet switching concentration factor
- Access capacity utilisation factor
- Mean downstream access capacity

Page 54 of 96
The variables are described in more detail in [Stor02b].
The two first variables give forecasts of the number of customers, which were available. Since the traffic behaviour of the users was not known, assumptions were made. An important message in [Stor02b] is the exponential evolution of the future broadband traffic.
Now, also the forecasts presented will be evaluated.
Figure 1 and 2 in [Stor02b] show the long-term forecasts for the residential broadband market, which are a part of the traffic forecast model. The broadband access forecasts have been examined in chapter 3 in the thesis. Figure 3 shows the forecasts for increased bandwidth in the Western European market.
Since West European statistic is not available, complete statistics of Telenor’s residential retail market is used to assess the statistics. This market is about half of the total Norwegian ADSL market. Statistics from 2001 to 31. August 2005, gives the following figure:
Mean capacity evolution for Telenors retail market, 2001 - 2005 (31. August 2005)
0,00
0,20
0,40
0,60
0,80
1,00
1,20
1,40
1,60
2001 2002 2003 2004 2005
Mea
n ca
paci
ty in
Mbi
t/s
Figure 5.2 Evolution of mean ADSL capacity in Mbit/s for Telenors’ retail market, 2001- August 2005 (Kjell Stordahl, September 2005).
The mean ADSL capacity is the weighted sum of capacities, where the weight for each ADSL capacity is number of ADSL customers with that capacity divided with total number of ADSL customers.
In the period 2002-2003 Telenor introduced ADSL capacity classes with 1Gbyte and 10Gbyte limitations respectively and then payment for the monthly usage beyond these limits. A large proportion of the high usage group churned at that time to other broadband operators. Then, Telenor went back to flat rate for all users. In 2005 Telenor introduced 2Mbit/s and 4Mbit/s access capacities and transferred at the same time all users on 704 kbit/s to 1024 kbit/s without changing the monthly tariff.
The 2005 mean value (1,50Mbit/s) is from August 2005 and may be higher at the end of the year. The slow increase the first years, is caused by high capacity users who churned to other operators. Usually, other operators lead an offering of higher capacity. There are reasons to

Page 55 of 96
believe that the incumbent mean capacities are lower than the country mean. Therefore, the capacity evolution on ADSL, 2001–2005, figure 3 in [Stor02b] seems not to deviate much from national Norwegian data. However, the mean Western European evolution may to some extent be lower, but information about the situation has not been found.
Figure 4 in [Stor2b] shows the predicted evolution of concentration of ADSL traffic per user as a function of busy hour concentration and packet switching concentration based on given assumptions. For estimating the broadband traffic per user, also forecasts of the access capacity utilisation factor and mean downstream capacity is needed. Figure 5.1 shows the mean ADSL capacity evolution 2001 – 2005. The user’s behaviour regarding up- and downstream usage and the ability to utilise the whole capacity is not known. To be able to assess the forecasts from [Stor02b] the access utilisation factor is set to 70% for the whole period. Then the traffic forecasts per user can be calculated for each alternative (Figure 4 in [Stor02b]). The results are shown in figure 5.3.
Broadband traffic forecasts per user in busy hour based on assumptions in [Stor02b]
0
20
40
60
80
100
120
2001 2002 2003 2004 2005
kbit/
s pe
r us
er
Alternative 1
Alternative 4
Figure 5.3 Broadband traffic forecasts per user in busy hour based on assumptions in [Stor02b]
Figure 5.3 shows an exponential increase in the traffic per user. This accounts for both the aggressive alternative (alt. 1) and the modest alternative (alt. 4). The yearly increase in the period 2003 – 2005 were: 74%, 73% and 111% for alternative 1 and 30%, 40% and 81% for alternative 4.
The long-term forecasts were developed in 2001 and the forecast period was 2001 –2010. The starting point in 2001 was assumed to be about 13 kbit/s per user in busy hour based on the situation in Norway.
Norwegian measurements showed that the traffic per user started at 20 kbit/s in 2002 and decreased to 12 kbit/s in 2003. The heavy broadband users caused the decrease in the traffic. They churned to other operators, when Telenor started charging the total traffic volume per month exceeding a given limit.
However, from the first quarter of 2004 there has been a very significant increase in the traffic per user in busy hour. Figure 5.4 shows the evolution of traffic per user in the Norwegian core network (T-nett). The broadband traffic evolution in the busy hour shown in the figure is the sum

Page 56 of 96
of residential traffic and the business traffic. The traffic per user is found by dividing the total measured traffic by the number of users.
Traffic evolution per user in the Norwegian core ne twork - T-nett, (Busy hour)
0
5
10
15
20
25
30
35
40
Q104 Q204 Q304 Q404 Q105 Q205 Q305 Q405
Tra
ffic
in k
bit/s
Figure 5.4 Traffic evolution per user into the Norwegian core network (T-nett) in busy hour (January 2006)
Figure 5.3 shows that the reference point in figure 4 [Stor02b] is 13 kbit/s per user. At the end of 2005 the four alternatives indicates an interval between 47 and 110 kbit/s per user.
Figure 5.4 shows 36,4 kbit/s per user in the busy hour in the Norwegian core network. The traffic increase per user has been 39% in 2004 and 67% in 2005.
Measurements at DSLAM level in the Norwegian network show significantly higher traffic per user in the busy hour compared to aggregated traffic is at the core network level. The reason is the law of large numbers. When the busy hour is defined based on aggregated traffic, busy hour from many DSLAMs are not taken into account. Therefore, the aggregated busy hour traffic on a lower level in the network will always be higher than the aggregated busy hour traffic on a higher network level.
The conclusion is that the assumptions done in 2001, seems not all to be out of scale. The forecasts 2006 - 2010 will be commented at the end of the chapter.
Figure 5.5 shows the traffic evolution in the Norwegian core network.

Page 57 of 96
Traffic evolution in the Norwegian core network - T-nett, (Busy hour traffic)
0
2
4
6
8
10
12
14
16
18
20
Q104 Q204 Q304 Q404 Q105 Q205 Q305 Q405
Tra
ffic
in G
iga
bit/s
Figure 5.5 Total traffic evolution in Gigabit/s in the Norwegian core network (T-nett) in busy hour. (January 2006)
The traffic is a function of number of users and traffic per user. The figure shows the traffic evolution from Q1 2004 to Q4 2005. The traffic increased 138% the first year and 145% the last year. Both figure 5.4 and 5.5 shows an exponential growth, in fact with increased growth in the period Q2 – Q4 2005!
5.4 “Methods for traffic matrix forecasting” [Stor8 8] [Stor02b] describes long-term forecasts for the total traffic volume in the core network. In the same way long-term forecasts can be developed for outgoing and incoming traffic at each node at the edge of the core network. The traffic inside the core network is a logical mesh network. Traffic matrix measurement and forecasts are important for planning and dimensioning all the routes in the core network.
The network consists of n nodes having a related nxn traffic matrix showing the incoming and outgoing traffic between the nodes. Kruithof [Krui37] invented the first traffic matrix forecasting method by adjusting the traffic elements in the matrix by incoming and outgoing traffic (row sums and column sums) forecasts from each node.
In [Stor85] and [Stor88] new models were developed to further improve the traffic matrix forecasts. The idea was to utilize more information. The improved method, called the “Weighted least squares method”, was based on making forecasts for the traffic elements and for row and column sums, and corrects the deviations (make consistence in the traffic matrix) by minimizing a weighted sum of squares. The weights represent the estimated uncertainty of the various forecasts. A computer program was developed by Norwegian Computer Center to handle relatively large traffic matrices.
In [Stor88] also the forecasts for the total traffic generated by the matrix was included in the model, which was called “Extended weighted least squares method”. The paper describes the Extended weighted least squares method, evaluates the method and discusses the effects of the weights used in relation to the forecast uncertainty.

Page 58 of 96
Large traffic matrixes contain a lot of traffic elements and it is of course very time consuming to make advanced forecasts for each element. The established procedure was to use simple forecasting models for the traffic elements and more advanced forecasting models for the outgoing and incoming traffic and for the total traffic. Here, long-term forecasting models are relevant as well as medium-term forecasting models.
5.5 Experiences and conclusions The improved traffic matrix forecasting methods were recommended and included in the CCITT recommendations [CCITT86], [CCITT88].
The methods were adapted by the Central Traffic Planning office in Televerket (Telenor) and used in the beginning of 1990’s on Telenor’s long distance network (core network). (Contact person: Arne Østlie, Telenor). Model input was quarterly time series for all traffic elements, incoming traffic, outgoing traffic and the total traffic. After some years the structure and the number of long distance exchanges were changed and it turned out to be difficult to reconstruct the time series in the new traffic matrix structure. Hence, the methodology was not used any longer. The future development has shown an evolution to a more flexible network where it would have been difficult to maintain a constant structure of the statistics.
The paper [Stor02b] gives a framework for traffic forecasts of the core network. Because of lack of measurements, assumptions had to be used for specific factors in order to make long-term traffic forecasting.
Measurements from the Norwegian core network have been used to evaluate the forecasts made in 2001. The broadband traffic evolution in the busy hour in Norway follows the modest alternative described in [Stor02b]. Because of many uncertainties and no available measurements when the forecasts were made, the quality of the forecasting assumptions have not at all being out of scale.
Now, it is of course not necessary to use the traffic indicator-forecasting model any longer. First of all the time series it-self should be used to make short-term forecasting. A natural approach is to use forecasting models for the number of users and multiply the forecasts with forecast of the traffic per user in the busy hour.
Long-term forecasts for the traffic in the core network are still very complicated subjects. When such a model is built, it is important to include many different aspects. Some of them are commented here.
One question is how ADSL2+ and IP-TV or TVoDSL and VDSL will influence the future capacity evolution. Several operators in Europe have introduced TVoDSL in 2004, and this is only the start of the evolution. This evolution will definitely create substantially higher capacity traffic in the network.
As commented the ADSL2+ access price will be significantly reduced because of low production price on the ADSL2+ cards, which will push the capacity evolution significantly upwards because of increased demand.
Another important factor is the TV transmission technology. In a long period both MPEG 2 and MPEG 4 signals will be used for the transmission. The signals have to be transmitted in parallel to every household who orders TV programs over DSL because it takes time to remove one standard from the whole TV market. In addition HDTV signals will also be transmitted. In an initial period three parallel TV signals instead of one for each TV program, will probably be

Page 59 of 96
transmitted. On the other hand, multicast will be used not to send the same TV program in parallel down to different subscribers in the same area.
An interesting evolution is also identified in the HFC (cable modem) network. The Docsis 1.1 standard is going to be changed into Docsis 2.0 and Docsis 3.0 [CaLab05]. This means that the end user capacity will increase from max 26Mbit/s down- and max 4Mbit/s upstream to minimum 160 Mbit/s downstream with a fairly high upstream. The cable modem specification, Docsis 3.0, is supposed to be approved in 2007.
It is important to underline that not all traffic will be part of the transport network. The TVoDSL distribution will probably be downloaded to the transport network, which will be used for the TVoDSL distribution. However, Video on demand services will be offered on specific decentralized servers for distribution in the local areas.
The described evolution supports the forecasts 2005 – 2010 which is showed in figure 4 [Stor02b], even if the development the first years not have been very aggressive. To make a more complete traffic forecast model for 2005 -2010, it is recommended to make the same type of capacity model for High capacity broadband (ADSL2+, VDSL2, DSM and HFC) as was shown for ADSL. A set of applications including TV applications, have to be part of the model.
[Stor03b] pointed out that forecasts and long-term forecasts are crucial for network planning. The paper gives an overview of the areas where the forecast modelling is important. The paper gave a short review of different forecasting models, which are relevant for network planning. One problem is that few forecasting models give confidence intervals of the forecast uncertainty. However, this aspect is addressed in the next chapter of the thesis.

Page 60 of 96
6 FORECAST UNCERTAINTY AND RISK
Forecasts are needed in many telecommunication areas. However, forecasts and especially long-term forecasts are uncertain. Important decisions are many times based on forecasts. When Telenor makes important investment decisions, sensitivity analysis is performed for selected critical variables. Usually, the forecasts will be one of the critical variables.
Net present value (NPV) is a natural measure for the economic value of investment projects or a portfolio of investments. A good approach for evaluating the NPV is to perform either sensitivity of risk analysis to see how robust the NPV is when the value of the critical variables changes.
Risk analysis is more advanced than sensitivity analysis. Risk analysis defines a priori probability densities for each critical variable and makes simulations of the economical measures like NPV, internal rate of return and payback period based on simulations of the probability densities representing the selected critical variables. One such critical variable is the long-term demand forecasts.
Kjell Stordahl developed the first framework for risk analysis in the RACE 2087/TITAN project in the period 1994-1996 [Stor95b]. The framework was also documented in chapter 9, page 99-110, in the book “Introduction strategies and techno-economic evaluations” [Ims98]. Since then, risk analysis has been applied extensively in the techno-economic projects TITAN, OPTIMUM, TERA, TONIC and ECOSYS. The risk methodology has up to 2005 been enhanced. These projects have developed a techno-economic tool for calculations. However, it was decided not do specific programming for risk analysis inside the tool, but instead use the risk simulation tool Crystal Ball [Crys06]
The following papers on risk analysis, where long-term forecasts are a critical variable, are enclosed as part of the thesis:
• Stordahl K, L A Ims and B T Olsen “Risk assessment and techno-economic analysis of competition between PNO and Cable operators” In Proc Networks 96, Sydney, November 24 –29, 1996. [Stor96]
• Stordahl K, N. K. Elnegaard, L. A. Ims, B.T. Olsen. Overview of risks in multimedia broadband upgrades. In proc Globecom ’99, Rio de Janeiro, Brazil, December 5-10, 1999.[Stor99b]
• Stordahl K, N K Elnegaard, B T Olsen, “Broadband access rollout strategies in a competitive environment”. In Proc Optical Hybride Access Network/Full Service Access Network workshop, Yokohama, Japan, April 4-6, 2001. [Stor01]
• Elnegaard N. K., K Stordahl “Analysing the impact of forecast uncertainties in broadband access rollouts by use of risk analysis”, Telektronikk(100) no 4, 2004 [Elne04]
6.1 “Risk assessment and techno-economic analysis o f competition between PNO and Cable operators”[Stor96 ]
The analysis in [Stor96] was carried out several years before the first broadband networks were deployed in Europe. A similar paper was published in 1997 [Ims97a]. [Stor96] addresses different challenges faced by incumbents and cable operators adapting their present networks to

Page 61 of 96
broadband competition. Extensive risk analysis was performed based on long-term forecasts for a basket of services and for market shares between the incumbent and the cable operators. Four different upgrade alternative were examined, two for the incumbents and two for the cable operators:
- Incumbent: Fibre to the node (FTTN) with enhanced copper
- Incumbent: Fibre to the building (FTTB) architecture based on ATM-PON
- Cable operator: Fibre to the node (FTTN) architecture based on HFC and cable modem
- Cable operator: Fibre to the building (FTTB) architecture based on HFC and cable modem
The following variables, considered as the most critical one for the risk analysis, were selected:
- Market shares between PNO (Incumbent) and cable operators
- Penetration forecasts for POTS, ISDN, 2Mbit/s ASB(Asymmetric Switched Broadband), 2Mbit/s SSB(Symmetric Switched Broadband), CATV
- Tariffs
Section 3 in [Stor96] shows the long-term market forecasts for POTS, ISDN, CATV, 2Mbit/s ASB and 2Mbit/s SSB accesses. Parts of the access forecasts (Figure 1) and tariff forecasts (Figure 2) are based on the TITAN Delphi survey from 1994 [Stor95a]. The broadband access forecasts have been commented, but not the ISDN forecasts. Figure 1 shows a very significant growth of ISDN (about 40% in 2005) and an inverse reduction of POTS. However, this situation did not occur. The main reason was growth of broadband, which substituted the expected ISDN growth. Norway and Germany had the highest ISDN penetration in the world. Figure 5.1, chapter 5, in the thesis shows that the maximum ISDN penetration in Norway was about 25%.
The annual tariff forecasts in the paper from 1996 are reasonably good. One exception is 2Mbit/s symmetric accesses, which have mainly not been available in the residential market in Western Europe [Point04]. The 2Mbit/s (SSB) tariff predictions for the Norwegian business market seem reasonable for 2003 and 2004, but the competition is now pressing the tariffs downwards. The 2Mbit/s symmetric tariffs for the residential and SOHO seem to be too high in 2004-2005 and also for the further forecasts.
Figure 7 in [Stor96] shows the evolution (forecast) of estimated standard deviation of the long-term forecasts for each of the services in the period 1997 – 2006. The Normal distribution is used as the probability density for each of the critical variables. For each year the standard deviations of the forecasts are plotted in figure 7. The standard deviations were estimated based on the variation in answers among the experts for the various forecasting questions in the Delphi survey.
Since the Normal distribution is uniquely defined when the expectation (here the forecasts) and standard deviation are given, then all probability densities are defined for the long-term forecasts which are used as input to the simulations in the risk analysis. Figure 8 in [Stor96] shows that a truncated Normal distribution is used in the simulations to avoid negative forecasts.
Section 7.1 – 7.4 show the risk analysis of the four described rollouts, while section 7.5 – 7.6 evaluate the effects of the critical variables and effects on the upgrade alternatives.
The risk analysis results for the four different architectures were described and primary figures and tables show the frequency distribution of net present value, the ranking of the critical

Page 62 of 96
variables according to their influence on variation of NPV/IFC(Installed first cost) and a frequency distribution of the payback period. The factor NPV/IFC represents roughly the profit relatively to the investments.
Table 3 and 4 show the ranking of the critical variables according to their influence on the variation of respectively NPV/IFC and NPV respectively.
Figure 9 and 10 in [Stor96] describe the frequency distribution of the NPV for the incumbent FTTN based on about 1000 simulations. Figure 9 (Figure 6.1 in the thesis) shows that no simulations of NPV are less than 200.000 ECU (Euro) and there is a probability of 10% of a NPV less than 402.000 ECU (Euro).
Cell K11 Frequency Chart 998 Trials Shown
,000
,010
,019
,029
,038
0
9,5
19
28,5
38
200.000 375.000 550.000 725.000 900.000
Forecast: npv
Figure 6.1 Frequency distribution of NPV based on 998 simulations
Figure 11 (Figure 6.2 in the thesis) and 12 show the cumulative frequency distribution of the payback period. The cumulative frequency distribution describes the probability for having a payback period less than a given value and vice versa the probability of having a payback period greater than a given value.
Cell J11 Cumulative Chart 990 Trials Shown
,000
,248
,495
,743
,990
0
247
495
742
990
4,00 5,50 7,00 8,50 10,00
Forecast: payback
Figure 6.2 Cumulative frequency distribution payback period based on 990 simulations
The risk assessments and additional analysis show that the FTTN alternative for the incumbent is the best economic alternative with the lowest risk. The FTTB alternative for the CATV operator was the least economic alternative and also with the highest risk.

Page 63 of 96
The NPV, payback period, etc are always calculated for making decisions of rollout of new technologies. [Stor96] shows that risk analysis gives important supplementary information for these types of strategic decisions.
6.2 “Overview of risks in multimedia broadband upgr ades”. [Stor99b]
The first part gives an overview of risks connected to roll out of a broadband network structure. Specific attention is put on market risks, competition risks, regulatory risks, technology risks, operation risks, investment risks and economic risks.
The second part of the paper describes the methodology for quantifying the risks. A new methodology had been developed to define probability densities for the critical variables. Instead of using truncated Normal distributions and Beta distributions were introduced. The risk simulations were performed by the Latin Hyper Cube approach. Latin Hyper Cube simulations use segmented probability distributions to be sure that the whole probability distribution is represented in the simulations.
The long-term cost forecasts were performed by application of the extended learning curve model.
The long-term broadband access forecasts, figure 4, were based on the results from the latest Delphi survey [Stor99b]. The long-term forecasts describe the evolution of demand for 2Mbit/s, 8Mbit/s and 26 Mbit/s accesses. The long-term forecasts are commented in chapter 3.
The long-term tariff forecasts were based on information from the latest Delphi survey [Stor99b].
The broadband case study examined is a very competitive SOHO and residential area, consisting of large apartment blocks. The incumbent offers ADSL and VDSL based on:
- Introduction of DSL in year 2000 (Fibre to the Lex (Local exchange))
- Introduction of VDSL and Fibre to the node in year 2005 and then stepwise deployment of fibre nodes (FTTN128 and FTTN512)
- The incumbent starts with 100% market share in the area, but is loosing market share continuously until Fibre to the node is deployed.
The uncertainties based on the following critical variables, are studied:
- Long-term market share evolution
- Long-term access penetration, 2Mbit/s asymmetric/symmetric, 8Mbit/s and 26Mbit/s
- Long-term tariff forecasts
Specific probability densities were defined for the different variables. In addition three different uncertainty values were allocated to the market share uncertainty:
- 10% relative standard deviation
- 20% relative standard deviation
- 30% relative standard deviation

Page 64 of 96
The relative standard deviation was defined as the percentage of the expected value (market share).
Figure 5 in [Stor99b] shows the expected life cycle costs (Total discounted sum of investment and operations and maintenance costs). The life cycle costs are shown for the three different uncertainties of the market share evolution. The other dimension of the figure gives the risk evaluation based on 10% and 5% fractiles of the simulated life cycle distribution.
Figure 6 (Figure 6.3 in the thesis) is an analogue figure for the net present value. The figure shows that the probability of a negative NPV is quite low when the relative standard deviation of the market share is 10 –20%.
5% fractile
10% fractile
Mean value
10% standarddev20% standard
dev30% standarddev
-100
0
100
200
300
400
500
Figure 6.3 Net present value distribution(mean, 10%, 5% fractile) based on different degree of market share uncertainties
However, when the relative standard deviation is 30%, we clearly see a risk for negative net present value. The 10% fractile indicates NPV of about 0, while the 5% fractile indicates a negative NPV.
[Stor99b] describes how risk analysis add valuable information to the traditional economic calculations of a broadband case study.
6.3 “Broadband access rollout strategies in a compe titive environment”[Stor01]
The paper examines different access rollout scenarios in dense urban areas where the incumbent and a cable operator fight to take additional broadband market share. The analysis focuses on different evolutionary paths starting with the twisted copper pair network. The strategy for the incumbent is to roll out ADSL and VDSL at the right time.
The rollout case study analyses the broadband demand in a highly competitive dense urban area where a cable operator and the incumbent plans to upgrade the network to offer broadband. The incumbent plan to offer the following DSL capacities: 0,5Mbit/s, 1Mbit/s, 2Mbit/s, 6Mbit/s and 24Mbit/s, while the cable operator plans to offer services on HFC.

Page 65 of 96
Information about long-term forecasts from the latest Delphi survey and the adjusted TERA forecasts [Stor99] is known. However, the forecasts used in this business case are not based on mean forecasts for whole Western Europe, but for a specific highly competitive area, which significantly deviates from West European mean values. Therefore, also the long-term forecasts shown in figure 1 are significantly higher than West European mean forecasts. The long-term tariff evolution is shown in figure 2.
Because the area is highly competitive, rather aggressive rollout scenarios are examined. In total 7 different rollout scenarios of ADSL/VDSL for the incumbent and HFC rollout for the cable operator are described. Figure 4-10 show the introduction time and describe the market share evolution for the competitors.
Figure 11 shows the incumbents installed first cost and net present value for each of the 7 scenarios. The scenarios showed that the incumbent looses market share and low net present value on broadband rollout if the rollout is significantly delayed compared with the cable operators HFC rollout.
Risk modelling was used to evaluate the results taking into account uncertainties in the critical variables. The “uncertainty” variables were grouped in the following main categories:
- Price evolution of DSL equipment
- Long-term penetration forecasts, all services
- Erosion of monthly access fee
The long-term access penetration forecasts were based on a four parameters Logistic model. The tariff erosion was modelled by a simple exponential distribution.
Figure 12 shows the probability for negative NPV. The figure shows that scenario 4 and 3 and may be 7 are acceptable for the incumbent. Figure 13 shows ranking of the three groups of critical variables according to the influence of the NPV’s variation for the 7 scenarios. The figure shows that uncertainty in the tariff evolution explains 55%-70% of the variation in NPV. The uncertainty in the demand forecasts explains 15%-35%, while uncertainty in the cost evolution of DSL contributes with 7%-17%.
The conclusions about the rating of the groups of critical variables are not surprising. In 2001 much experience have been learned about the component cost prices. The broadband demand was at an early stage and the relative uncertainty was assumed to be high. Also the uncertainty in the tariff evolution was assumed to be high. However, the uncertainty in the tariff evolution influences the NPV more than the long-term demand forecasts. This is because the forecasts influence both the revenue and the investment part of NPV, while the tariffs only influence the revenue part.
In chapter 6.4 in the thesis the effects of demand and tariffs are analysed more closely. The conclusion is reduced overall uncertainty of NPV because of negative correlation between demand and tariffs.
6.4 “Analysing the impact of forecast uncertainties in broadband access rollouts by use of risk analysis”[Elne04]
Before reading the comments, it is recommended to go to the next chapter and read [Stor04b] or comments to [Stor04b] because the risk analysis presented, is based on the case study described and analysed in [Stor04b].

Page 66 of 96
This paper gives an updated overview of the various uncertainties and risks based on the overview given in [Stor99]. Substantial risks are connected to predicted evolution of the broadband market regarding market share predictions, demand for enhanced and new services and demand for accesses. The uncertainties are usually expressed by measures like standard deviations and confidence limits. Traditional statistical methods may in some situations be used to estimate forecast uncertainties. There are two different uncertainty elements in a statistical forecasting model. One uncertainty element is caused by the parameter estimation itself. The other is caused by the forecasting period. If the only explanatory variable is the time, then no additional uncertainty in prediction of the time itself is added. However, if other explanatory variables are included in the forecasting model, forecast uncertainty for each of the variables also influences the forecasting uncertainty. As mentioned in [Elne04], modelling and estimating the uncertainty in this situation is complicated.
Section 2 in [Elne04] describes two probability distributions of NPV, representing two projects. It is showed that the project with highest expected NPV value and largest variance in the distribution is the best investment alternative. The conclusion is to examine the combination of the expected value and the variation when the evaluations of investment projects are performed.
Section 4 gives an overview of the risk methodology. The use a priori information for estimating the probability distributions for the critical variables is crucial. The paper proposes to use either the Beta distribution or the Log Normal distribution. The procedure is developed by Nils Kristian Elnegaard and described in Appendix A. The risk analysis is performed as illustrated in figure 2 in [Elne04] by making a number of simulations of the (critical) variables and make calculations of the NPV/Internal rate of return/Pay back period for each run. After a number of simulations a distribution like the one in figure 2 will be built. The simulation package Crystall Ball [Crys06] is used for the simulations. The simulations may be carried out as pure simulations or by using Latin Hyper Cube simulations.
The risk analysis was applied to 6 scenarios with different timing and ambition levels for ADSL2+/VDSL rollout. The long-term adoption rate forecasts for ADSL2+/VDSL rollout are shown in [Stor04b]. Adoption rate forecasts also called take rate forecasts are adjusted penetration forecasts taking into account the coverage. The forecasts are commented more in detail in [Stor04b] and the next chapter.
Figure 3 in [Elne04] shows the NVP for the different scenarios. Table 1 gives an overview of critical variables:
- ARPU
- Line card price
- Sales costs
- Provisioning costs
- Equipment price reduction rate
- ADSL/VDSL adoption rate forecast, reference year 2011
- Customer installation costs
- Content costs
- Smart card costs
- Customer operations and maintenance
including the following values:

Page 67 of 96
- Minimum value
- 5% percentile
- Default value (used for traditional NPV calculation)
- 95% percentile
- Maximum value
The parameters of the Beta distribution are estimated based on the values in table 1.
Three approaches for risk analysis were carried out:
- Risk analysis based on the 10 critical variables in table 1
- Risk analysis based on Adoption rate forecasts and ARPU
- Risk analysis based on Adoption rate forecast.
The 5% percentile, the 95% percentile and the standard deviation of the NPV for all scenarios and the three approaches are shown in table 2. It is shown that the adoption rate forecasts contribute heavily to the uncertainty in NPV, while the adoption rate forecasts and the ARPU contributes much more and close to the total contribution of all 10 critical variables.
So far all variables have been simulated independently. There is significant negative correlation between adoption rate forecasts and the ARPU. (If ARPU decreases, the adoption rate forecasts increases, and vice versa).
Now, two alternatives can be used to improve risk results. One alternative is to construct a demand curve, which give the relation between the adoption rate and the ARPU and add noise components to generation of the drawn values. Another alternative is to correlate the two variables when their values are drawn in the simulations. The last alternative was used in [Elne04] and the correlations used were: -0,25, -0,50 and –0,75.
Figure 5 (figure 6.4 in the thesis) shows the 5% percentiles of the NVP for the 6 scenarios, when all 10 critical variables are simulated with no correlation, -0,25, -0,50 and –0,75 between adoption rate forecasts and ARPU.
-400
-300
-200
-100
0
100
200
300
400
Sc. 1 Sc. 2 Sc. 3 Sc. 4 Sc. 5 Sc. 6
5% p
erce
ntile
s of
NP
V [m
ill. E
UR
O]
no corr.
-0.25 corr.
-0.50 corr.
-0.75 corr.
Figure 6.4 5% percentiles for various degrees of correlation between ARPU and Adoption Rate forecasts. Ten variables simulated

Page 68 of 96
The figure shows very clearly that the 5% percentile of NPV (risk level) reduces significantly for all scenarios as a function of negative correlation between ARPU and adoption rate forecasts. The same calculations are carried out for adoption rate forecasts and ARPU. Figure 6 shows the same type of results. Still the size of the 5% percentile is not much lower compared to the situation with 10 critical variables. Hence, the adoption rate forecasts and the ARPU are still the dominating factors for generation of NPV uncertainty.
6.5 Experiences and conclusions Risk analysis is an analytical approach used for examining the effects of uncertainties in critical variables. [Stor96] shows different outputs from the risk analysis and describes how the risk probabilities should be interpreted.
The papers in this chapter show how risk analysis is used to evaluate the following broadband business cases:
- FTTN with enhanced copper
- FTTB architecture based on ATM-PON
- FTTN architecture based on HFC and cable modem
- FTTB architecture based on HFC and cable modem
- DSL with enhanced copper
- VDSL with FTTN
- Competition between DSL and HFC operators
- Competition between DSL operators
In all broadband business cases the long-term market evolution and in particular the long-term forecasts are critical variables analysed by the risk analysis.
The risk analysis for the business cases shows that the market evolution induces greater uncertainties than the cost evolution. Even when the main part of the component costs are grouped together, the cost forecasts from this group of components does not contribute as much to the uncertainties as tariff/ARPU forecasts or broadband penetration forecasts.
[Elne04] shows that ARPU and broadband adoption rate forecasts are the dominating critical variables in the ADSL2+/VDSL roll out business case. The paper also documents that the total uncertainties are reduced significantly when negative correlation are modelled between ARPU forecasts and adoption rate forecasts.

Page 69 of 96
7 LONG-TERM ADOPTION RATE FORECASTING
Usually the broadband demand in a given country is characterised by the broadband penetration. To be able to identify the potential broadband demand, defined as broadband adoption rate, we need to know the broadband penetration and the coverage. Suppose that the rollout at time t gives the broadband coverage, Ct, and that the broadband penetration at that time is Pt. The broadband adoption rate (or take rate), At, is the ratio between demand and coverage in an area.
At = Pt /Ct
The same relation is valid not only for the total broadband penetration, but also for the penetration of different broadband technologies and for disaggregated areas.
Suppose that the broadband coverage in a country is 80% and the broadband penetration 25%. When broadband is deployed and offered in a new area, the real broadband demand (adoption rate) in this area is 31%, not 25%.
Long-term adoption rate forecasts are important for evaluation of broadband rollout strategies. This chapter shows how the long-term adoption rate forecasts are used to make rollout strategies for high capacity broadband ADSL2+/VDSL2 and for broadband rollout in the residual market.
The following papers, where long-term adoption rate forecasts play an important part of the rollout strategy, are enclosed as a part of the thesis:
• Stordahl K, N K Elnegaard, B T Olsen, M Lähteenoja “Competition in the local loop – How to minimize the market risks” In Proc. XV International Symposium on Services in the Local access - ISSLS 2004. Edinburgh, Scotland, 21-24 March, 2004
• Stordahl K, N K Elnegaard, “Broadband in the residual market: First mover’s advantage” Unpublished, but sent to WTC/ISSLS 2006.
7.1 “Competition in the local loop – How to minimiz e the market risks” [Stor04b]
Section 2 in [Stor04b] describes the long-term broadband penetration forecasts. Section 3 and 4 describes the ADSL2+/VDSL rollout strategy by starting with the largest exchanges because the coverage is high and the investment per customer is less than in other areas.
The differentiated adoption rate forecasts shown in Figure 5.1 in [Stor04b], are the key to the rollout strategies. The adoption rate forecasts is shown:
- when an operator enters the area and is alone
- when two operators enters the area at the same time
- when one operator enters the area one year delayed
- when one operator enters the area two years delayed
- etc

Page 70 of 96
The model for the differentiated adoption rate forecasts assumes that the first operator takes the initial market, while a second operator entering next year takes 20% of the growth. The second operator takes 35% of the market growth the second year, and 50% the next years. Figure 7.1 shows the adoption rate forecasts for ADSL2+/VDSL based on these assumptions.
Adoption rate as a function of delayed introduction
0,0 %
5,0 %
10,0 %
15,0 %
20,0 %
25,0 %
30,0 %
35,0 %
2004 2005 2006 2007 2008 2009 2010
Alone
0 Year delay
1 year delay
2 year delay
3 year delay
4 year delay
5 year delay
6 year delay
Figure 7.1 ADSL2+/VDSL adoption rate forecasts as a function of delayed introduction
The business case is based on rollout of ADSL2+/VDSL in a large country. The high capacity broadband market is divided in five market segments according to the sizes of the exchanges. It is assumed some differentiation in the adoption rate in the different market segments: The larger exchange areas, the higher demand.
The business case is based on competition between two main operators rolling out ADSL2+/VDSL with limited resources each year. Table 7.1 – 7.6 show the rollout each year as a percentage of the whole market. The main point is of course to start the rollout in large exchange areas. When the most attractive areas are occupied, the operator continues with the second best and at a given point, the operator enter the most attractive exchange areas as the second operator instead of entering small exchange areas. The long-term adoption rate forecasts are an extremely important factor for choosing the most optimal rollout strategy.
The results from scenarios 1-6 give some guidelines for the rollout strategies. Figure 9.1 and 9.2 show that two years delayed rollout for the incumbent gives very poor results, while an aggressive rollout of the incumbent gives high NPV.
It is interesting to see that the largest operator in Europe seems to follow the strategy based on adoption rate forecasts presented in this paper. Deutsche Telecom announced 14. November 2005 that they have decided to spend 3 Billion Euro to roll out a VDSL FTTN in Germany [OVUM05].

Page 71 of 96
7.2 “Broadband in the residual market: First mover’ s advantage” [Stor06] Full paper.
7.2.1 Abstract
Long-term broadband penetration forecasts for Western Europe are presented. The broadband penetration forecasts take into account the historical evolution. The broadband penetration forecasts show the predicted mean demand in Western Europe. However, the penetration forecasts do not reflect the genuine broadband demand in specific areas. The broadband penetration forecasts are adjusted according to the broadband coverage. The adjusted forecasts are defined as adoption rate forecasts. These forecasts are used as input to the techno-economic calculations.
The techno-economic calculations examine broadband roll out in the different access area types. Furthermore, copper loop length distribution, distributions of number of potential subscribers and the adoption rate in the area are analysed.
The paper documents the profitability of broadband rollouts in sparsely populated areas and estimates the limits for having monopoly areas as a function of given characteristics.
The identified monopoly areas will of course contribute to higher broadband coverage because the profitability in these small areas will be better than earlier expected because of none competition.
The paper ends with recommended broadband roll out strategies for the residual market.
7.2.2 Introduction
In 2004 the Norwegian Government gave the following statement regarding broadband:
The government looks at deployment of the broadband network as establishment of a national infrastructure, which during the coming years will be as important for evolution of the modern Norway as the telephone network, power line network, railway network, roads, water and sewage network earlier have been for the Norwegian Society.
In 2005 the newly elected Norwegian government announced that they wanted to roll out broadband toentire country within the end of 2007. The Norwegian Ministry of Government Administration and Reform has calculated the cost to cover the last 5% of the Norwegian rural areas to about 120 million Euro.
The Norwegian government has so far utilised the free market dynamics and handed over the broadband deployment to the operators. To speed up rollout of the very last part of the infrastructure, which so far is not commercially profitable, the government has decided to support with the financing.
This paper does not analyse Norwegian business cases. The paper analyses the residual markets in Western Europe.
During the last five years West European countries have rolled out broadband extensively. DSL technology is the dominating technology followed by HFC. Most of the countries in Western Europe still have a residual market, which so far is not covered by broadband. The size of the residual market in Western Europe varies mainly between 5 – 10% of the total market size. For

Page 72 of 96
countries outside Western Europe the residual market is on average much higher. Exceptions are: South Korea, Taiwan, USA, Canada and some others.
The strategy for the broadband rollout has been to cover the most densly populated areas as the first step. DSLAMs have been installed in large exchange areas, and cable networks with many subscribers have been upgraded to HFC. Also wireless systems have been used for the coverage. By entering the most densly populated areas, the operators secured high market shares and also low investments per customer. High net present value and relatively short pay back period have generated the broadband rollouts so far.
At present, only more sparsely populated areas have no broadband coverage in Western Europe. This paper shows that important factors like increased broadband demand, lower production price of broadband equipment and relatively higher market shares for operators who are entering smaller areas give reasonable good business cases also in these areas.
The paper pays specific attention to DSL technology and rollout strategies in the residual broadband market. DSL is the dominating technology in rural areas. The residual market consists of parts of the access network with too long copper lines and areas with too few potential subscribers, where broadband so far has not been rolled out. The analysis presented in this paper shows how DSL can be deployed in smaller areas to increase the broadband coverage.
7.2.3 Residual broadband market
The residual broadband market is defined as the part of the market, which is not covered by broadband accesses. 100% minus the broadband percentage coverage is a measure for the residual broadband market. The broadband coverage is a function of rollout of different broadband technologies like DSL, HFC (cable modem), FWA, FTTB/FTTH etc. The definition of broadband is not quite clear. A definition often used expresses broadband as downstream capacity greater than ISDN (2x128kbit/s+16kbit/s = 144kbit/s). Other alternatives used, are 384kbit/s or 512kbit/s. The costs to cover the broadband residual market increase as a function of the defined minimum access capacity.
7.2.4 Market evolution and penetration forecasts
To evaluate broadband rollout strategies, broadband modelling and long-term broadband access forecasts have been developed. The broadband forecast modelling is based on work in the techno-economic project ECOSYS ([Stor04a], [Stor04b]).
7.2.4.1 Relevant broadband technologies for the residual ma rket
Newly updated forecasts for the Western European broadband market based on the methodology showed in [Stor04a], have been developed. Figure 7.2 shows the market share forecasts of the most dominating technologies. The forecast modelling is based on Logistic models with four parameters.

Page 73 of 96
Market share distribution between technologies
0
20
40
60
80
100
120
1999 2000 2001 2002 2003 2004 2005 2006 2007 2008 2009 2010
Mar
ket s
hare
(%
)
ADSL
ADSL2+/VDSL2
Other BB tech.
Cable modem
Figure 7.2 Market share forecasts between ADSL, ADSL2+/VDSL, Cable modem and other technologies for the West European residential market
The figure shows that DSL and cable modem are the dominating broadband technologies in Western Europe. Other technologies have relatively small market shares in the period 1999 – 2006. The most important technologies in this group are FWA and FTTB/FTTH. The fibre solutions are rather expensive to establish and are not candidates for the residual market for most of the countries in Western Europe. The HFC network is an enhancement of the traditional TV distribution network, which has been rolled out in urban and suburban areas. The HFC network will not be deployed in rural areas because of very high investment costs. Hence, HFC (cable modem) is not a candidate for the broadband residual market.
DSL is an important alternative for the broadband residual market. However, the technology has limitations. First of all, the copper loop length limits the coverage possibilities. Secondly, it will not be profitable to cover too small areas with DSLAM installations because of too high investments per customer.
Other possibilities are especially WiFi, WiMAX and satellite. For some countries also the Digital Terrestrial Television network (DTT) could be a candidate. The network has limited capacity for individual communication and the network will probably be deployed too late.
7.2.4.2 Broadband penetration forecasts for the res idential market
Newly updated forecasts for the Western European broadband market based on the methodology presented in [Stor04a], have been developed. Figure 7.3 shows the penetration forecasts.

Page 74 of 96
Broadband penetration forecasts residential market
0,0 %
10,0 %
20,0 %
30,0 %
40,0 %
50,0 %
60,0 %
70,0 %
1999 2000 2001 2002 2003 2004 2005 2006 2007 2008 2009 2010 2011 2012
Pen
etra
tion
(%)
Figure 7.3 Broadband penetration forecasts for the residential market, Western Europe
The figure shows the broadband penetration forecasts per household for the residential Western European market. The mean value for the all countries in Western Europe is shown in the figure. There are of course great differences between the Western European countries. The Netherlands, Switzerland, Belgium and the five Nordic countries have a significantly higher penetration than the mean value for 2005, while especially Greece and Ireland have a very low broadband penetration [OECD05].
7.2.4.3 Broadband forecasts for the business market
The broadband forecasting model for Western Europe has not been easily developed because of lack of data. The most important statistics used is the Western European broadband survey conducted by Idate and supported by the European Commission [Idate05b], Point topics [Point05], and broadband statistics from OECD [OECD05].
A central element of the access forecasts is the long-term saturation level. The number of business units for Western Europe reported in [Idate05b] is a basis for the saturation level. A business unit is placed at an independent location and a company consists of one or more business units. 62% of business units in Norway are units without employees and many of these units have been constructed to avoid taxes etc. [SSB06]. It is assumed that only a limited number of the business units without employees are ordering broadband access. On the other hand, larger business units have a potential to order more than one broadband accesses. The number of accesses needed depends of number of employees and the traffic concentration, which is a function of the busy hour concentration factor and the packet switching concentration factor. It is assumed that not all employees are using the broadband access. The traffic concentration factor is assumed to be 1:20. The traffic concentration factor will of course depend on the evolution of higher capacity connections and the evolution of usage of high capacity applications.
The number of business units in Europe is found in [Idate05b]. Based on the traffic concentration factor and reduction of business units, which are expected not to order broadband access, the broadband access potential for the business market in Western Europe is estimated. Figure 7.4 shows the penetrations forecasts.

Page 75 of 96
Broadband penetration forecasts, business market
0,0 %
10,0 %
20,0 %
30,0 %
40,0 %
50,0 %
60,0 %
70,0 %
80,0 %
90,0 %
1999 2000 2001 2002 2003 2004 2005 2006 2007 2008 2009 2010 2011 2012
Figure 7.4 Broadband penetration forecasts for business market, Western Europe
Statistics from [Idate05b] indicates that the volume of accesses in the business market in EoY 2004 was about 19% of the total volume of broadband accesses (Table 3.6 in the thesis). Because the broadband evolution in the business market is closer to saturation than the residential market, the market share ratio increases in favour of the residential market.
The adoption rate forecast used in the analysis takes into account the different evolutions of the two markets.
7.2.5 Broadband coverage
The average broadband coverage in Western Europe was 91% at the end of 2004. Most countries had a broadband coverage of 90% or more, but some countries like Greece, Ireland and Norway had a significantly lower broadband deployment. Also in 2005 the broadband accesses have been deployed rather extensively. In Norway the broadband DSL coverage increased from 82,0% to 88,4% at the end of 2005.
Figure 7.5 shows coverage of the Western European countries for DSL and Cable modems as of December 2004.

Page 76 of 96
1 0 0 %
1 0 0 %
1 0 0 %
1 0 0 %
9 6 %
9 5 %
9 2 %
9 2 %
9 2 %
9 1 %
9 1 %
8 8 %
8 7 %
8 6 %
8 5 %
8 2 %
7 1 %
9 %
8 0 %
6 0 %
3 4 %
8 2 %
4 5 %
5 0 %
3 2 %
3 1 %
6 1 %
2 6 %
1 0 %
2 9 %
4 2 %
3 1 %
0 %
2 0 %
4 %
0 %
0 % 2 0 % 4 0 % 6 0 % 8 0 % 1 0 0 %
B e lg iu m
De n ma r k
L u x e mb o u r g
Ne th e r la n d s
S w e d e n
UK
Fin la n d
Ic e la n d
Po r tu g a l
Fr a n c e
G e rma n y
A v e ra g e
S p a in
A u s tr ia
Ita ly
No r w a y
Ire la n d
G r e e c eCa b le mo d e m
DS L
Figure 7.5 Broadband deployments in Western Europe December 2004 [Idate05a]
The rollout plans and the rollout possibilities for different broadband technologies are important factors for the future broadband coverage and for the broadband penetration forecasts.
7.2.6 Adoption rate forecasts
The broadband rollout has a crucial impact on the broadband penetration. To evaluate the penetration in Western Europe, the broadband coverage in the country must be identified. Assuming the rollout at time t gives the broadband coverage, Ct, and that the penetration at that time is Pt. Then the Adoption rate, At, is expressed by At = Pt / Ct. The adoption rate is the genuine demand in an area with 100% supply or coverage.
Hence, the penetration depends on the coverage and the broadband adoption rate, reflecting the genuine demand as a function of the broadband application availability, the broadband tariffs, the service quality, etc.
The penetration forecasts are shown in figure 7.3 and 7.4. The coverage is shown in [Idate05a]. Based on the business and residential market potentials, the penetration forecasts and the coverage, the adoption rate forecasts are calculated.
The adoption rate forecasts express the sum of business and residential accesses per potential subscriber. Potential subscribers in the area are defined as the sum of the households and relevant business units including possible additional business accesses (Business units with more than 20 employees will have more than one potential broadband access).
In the analysis different adoption rate forecasts are used to evaluate the broadband rollout options. Adoption rate forecasts with modest evolution are represented by countries in central Europe while adoption rate forecasts with more aggressive evolution are represented by the Nordic countries. The adoption rate forecasts are reduced because assumption of lower broadband demands in rural than in urban areas. Since information about lower demand in

Page 77 of 96
sparsely populated areas is not available, the reduction factor is set to 10% for the central European rollout case and 5% for the Nordic rollout case.
Many business case calculations are based on immediate rollout the first month of the year. The rollout presented here, assumes that the rollout is in the middle of the first year. This is also representative for an operator with a portfolio of rollout projects.
Experiences have shown that it takes time from the DSLAM is installed and the DSL is offered, to the customers have ordered DSL (to the adoption rate demand is reached). The model assumes that the demand gradually increases in a 4 months period until adoption rate is reached.
The adoption rate forecasts for rural areas are shown in figure 7.6 for Central European and the Nordic countries. The adoption rate forecasts are not corrected for entering the area in the middle of the year and the delay in the adoption.
Adoption rate forecasts for rural areas in Central Europe and Nordic countries
0,0 %
10,0 %
20,0 %
30,0 %
40,0 %
50,0 %
60,0 %
70,0 %
80,0 %
90,0 %
2006 2007 2008 2009 2010 2011 2012
Ado
ptio
n ra
te (%
)
Nordic
Central Europe
Figure 7.6 Adoption rate forecasts, mixed residential business for rural areas in central Europe and Nordic countries
7.2.7 Business case model
The model describes important characteristics of the access areas. Futhermore, copper loop length distribution, distributions of number of potential subscribers and distributions of market share between residential and business accesses are combined. The techno-economic calculations examine broadband rollout in the different access areas.
The most important factors are copper loop lengths and the number of subscribers in the area.
Areas analysed are assumed to have ADSL coverage of 95% and ADSL2+ coverage of 70%.
The areas analysed are rural with 5% potential business accesses and 95% potential residential accesses. Potential subscribers are defined as available subscribers in the long-term.
The reference level for monthly ARPU is set to 40 Euro per month with a 5% reduction the first year. The argumentation for the stable ARPU level is minimal competition and the possibility to offer higher capacities and ADSL2+. The business market contributes marginally to higher

Page 78 of 96
ARPU because of the relatively small proportion of business accesses. The reference level for the connection fee is 30 Euro.
The CAPEX cost elements as follows:
- ADSL2+ line cards
- Mini DSLAM
- DSLAM interface
- DSLAM installation and power
- DSLAM internal cabling
- Backhole costs to DSLAM
The cost predictions are found by using the learning curves [Olsen04].
The OPEX costs is segmented in the following main segments
- IP cost per subscriber
- Network operations cost per subscriber
- Support and billing costs per subscriber
- Sales and marketing costs per subscriber
The discount rate is 10% and the riskfree rate of return is 5%. The investment horizon is 2006 – 2015. The study period could, alternatively have been shorter i.e. 2006 – 2011 with a terminal value. Because of a monopoly situation for the operator with minimal risks, a fairly long study period is acceptable.
7.2.8 Techno-economic calculations
A techno-economic tool is used to calculate the economical value of broadband rollouts. The tool and the techno-economic methodology have been developed by the European programs RACE, ACTS, IST and EUREKA/CELTIC through the projects RACE 2087/TITAN, AC 226/OPTIMUM, AC364/TERA, IST-2000-25172 TONIC and ECOSYS. The techno-economic methodology and the tool calculate the overall financial budget of any access architecture. The tool handles the discount system costs, operations, maintenance costs, life cycle costs, net present value (NPV) and internal rate of return (IRR). The tool is well suited to combine low level, detailed network parameters of significant strategic relevance with high level, overall strategic parameters for performing evaluation of various network architectures. More detailed descriptions of techno-economic modelling and the tool are found in [Ims98].
To evaluate broadband rollout strategies for the residual market, techno-economic analysis uses the generic access area models, broadband adoption rate forecasts and predictions of other important factors like tariffs, component costs, operation and management costs etc
7.2.9 Roll out analysis
The DSL rollout analysis handles two main cases:
- A central European case
- A Nordic case

Page 79 of 96
Central European case
Net present value (NPV) for DSL broadband rollout has been calculated as a function of the number potential subscribers in the area. The calculations have been performed to examine the sensitivity of NPV, when the adoption rate forecasts are changing. Three different alternatives for the adoption rate forecasts are used:
- Pessimistic adoption rate forecasts
- Default adoption rate forecasts
- Optimistic adoption rate forecasts
The default adoption rate forecasts are shown in figure 7.6. The pessimistic adoption rate forecasts ends 10% lower than the default adoption rate forecasts in 2015, while the optimistic adoption rate forecasts end 10% higher in 2015.
The default adoption rate forecasts are close to, but not identical to the Western European mean.
Figure 7.7 shows the results. The results presuppose a monopoly area.
NPV of DSL rollout as a function of potential subscribers. Monopoly.
(10 000)
(5 000)
0
5 000
10 000
15 000
20 000
40 45 50 55 60 65 70
Potential subscribers
NP
V in
€
Optimistic
Default
Pesimistic
Figure 7.7 NPV of DSL rollout as a function of potential subscribers and different adoption rates. Monopoly. Central European case. The figure shows that the NPV is positive for the default adoption rate case where there are 50 or more potential subscribers in the area. With a pessimistic adoption rate the critical number of potential subscribers in the area is 55.
Suppose a second operator enters the same areas as operator no 1, but is one year delayed. Then the new operator will loose the initial demand and is only able to fight to get parts of the yearly growth. It is assumed that operator no. 2 takes 20% of the growth the first year and 50% the next years.
Figure 7.8 shows the NPV for operator no 1 in the case when a new operator enters the area one year delayed.

Page 80 of 96
NPV of DSL rollout as a function of potential subscribers. Competitor one year delayed
(15 000)
(10 000)
(5 000)
0
5 000
10 000
15 000
40 45 50 55 60 65 70
Potential subscribers
NP
V in
€
Optimistic
Default
Pesimistic
Figure 7.8 NPV of DSL rollout as a function of potential subscribers and different adoption rates. Competitor one year delayed. Central European case.
Because of the new competitor, the critical size for the DSL rollout has changed from 50 to 58. The relevant question is what type of analysis the new operator has done, since the operator will never get a positive business case simply because the operator was too late and had no possibility to utilise the first mover’s advantage!
However, the conclusion is that the operator no. 1 has a fairly good business case, independent of entrance of a competitor. The explanation is that the first mover’s advantage is utilised before new operators are entering the area.
Figure 7.9 shows how the NPV for DSL rollout in an area with 40 potential subscribers is changing when the value of the main critical variables deviates from their default value.
The vertical line in the figure shows the default values of the critical variables. The NPV is about – 5.000€. A positive NPV require that the monthly ARPU level has to increase from 40€ to 45€. Another option is to find dense areas concentrations where the distance between the exchange and mini DSLAM is not too long, such that the backhaul costs are less than 20.000€.

Page 81 of 96
NPV [k€](Potential lines: 40)
1 500 €
20 €
15 €
20 €
40 €
70 €
60 %
20 000€
30 €
2 000 €
40 €
25 €
30 €
80 €
120 €
80 %
30 000 €
45 €
(25,0) (20,0) (15,0) (10,0) (5,0) 0,0 5,0
Broadband ARPU
Backhaul Cost
Broadband Saturation
Support, Billing etc.
Sales & Marketing
IP Cost per subscriber - yearly
Network operation cost per subscr. -yearly
Broadband Connection Fee
DSL Linecard Price
Figure 7.9 Sensitivity analysis. NPV of broadband rollout in an area with 40 potential subscribers. Monopoly area. Central European case.
Figure 7.9 indicates clearly that the ARPU, backhaul costs, broadband adoption and to some extent support/billing are the variables which have the strongest influence on the ARPU.
Figur 7.10 shows the same analysis for an area with 60 potential subscribers.
NPV [k€](Potential lines : 60)
20 €
1 500 €
15 €
20 €
40 €
70 €
60 %
20 000 €
30 €
40 €
2 000 €
25 €
30 €
80 €
120 €
80 %
30 000 €
45 €
(20,0) (10,0) 0,0 10,0 20,0 30,0
Broadband ARPU
Backhaul Cost
Broadband Saturation
Support, Billing etc.
Sales & Marketing
IP Cost per subscriber - yearly
Netw ork operation cost per subscr. -yearly
DSL Linecard Price
Broadband Connection Fee
Figure 7.10 Sensitivity analysis. NPV of broadband rollout in an area with 60 potential subscribers. Monopoly area. Central European case.

Page 82 of 96
When the DSL rollout area has 60 potential accesses, the NPV is about 8.000€. Only a very low ARPU may squeeze the NPV below 0. No other variables are significant in this respect.
Nordic case
In some Western European countries the broadband penetration is much higher than the mean West European penetration. Higher penetration will of course improve the rollout business case. The adoption rate forecasts for mixed business residential rural areas are shown in Figure 7.6. The adoption rate forecasts for central Europe starts with 35% EoY 2005, while the Nordic adoption rate forecasts starts with 54% EoY 2005.
The Nordic case is analysed with and without competition. The analysis performed is based on the incumbent point of view. In case of competition, it is assumed that operator no 2 enters one year later than the first one and takes 20% of the growth the first year and 50% of the growth the next years.
Figure 7.11 shows the NPV as a function of the number of potential subscribers in the area.
NPV for operator no. 1 as a function of potential subscribers in area with monopolly and area with
competition
(15 000)
(10 000)
(5 000)
0
5 000
10 000
15 000
20 000
25 30 35 40 45 50
Potential subscribers
NP
V in
Monopolly
Competitor 1year delayed
Figure 7.11 NPV as a function of potential subscribers in the area with and without competition. Nordic case.
When the area is a monopoly area, the number of potential subscribers must be 34 or more to reach a positive NPV. If another competitor enters the area one year delayed, the critical size of the areas is 38 potential subscribers. The adoption rate for the Nordic case, see figure 7.6, shows that the adoption rate is increasing slowly from 2007. The yearly growth is not very large in absolute terms. Hence, the loss for operator no 1 by sharing 50% of the yearly growth with operator no. 2 is not a very great loss, compared to the initial gain catching 60% of the potential subscribers during the first year.

Page 83 of 96
The analysis of the Nordic broadband rollout case shows clearly the first mover’s advantage. In situations where the adoption rate is very high, it is crucial to roll out broadband before other competitors are entering the areas.
Figure 7.12 shows the results of a sensitivity analysis of the Nordic case with area size of 40 potential subscribers.
NPV [k€](Potential lines: 40)
1 500 €
20 €
15 €
20 €
40 €
85 %
70 €
20 000 €
30 €
2 000 €
40 €
25 €
30 €
80 €
95 %
120 €
30 000 €
45 €
(20,0) (10,0) 0,0 10,0 20,0
Broadband ARPU
Backhaul Cost
Support, Billing etc.
Broadband Saturation
Sales & Marketing
IP Cost per subscriber - yearly
Network operation cost per subscr. -yearly
Broadband Connection Fee
DSL Linecard Price
Figure 7.12 Sensitivity analysis. NPV of broadband rollout in an area with 40 potential subscribers. Monopoly area. Nordic case.
The figure shows that only large changes in the ARPU will reject rollout when there are 40 or more potential subscribers in the area.
Figure 7.13 shows the sensitivities in NPV for operator no. 1 when a new operator enters the area one year delayed.

Page 84 of 96
NPV [k€](Potential lines: 40)
1 500 €
20 €
30 %
10 %
15 €
20 €
40 €
85 %
70 €
0 years
20 000 €
30 €
2 000 €
40 €
50 %
30 %
25 €
30 €
80 €
95 %
120 €
2 years
30 000 €
45 €
(20,0) (10,0) 0,0 10,0 20,0
Broadband ARPU
Backhaul Cost
Delay of competitor entry
Support, Billing etc.
Broadband Saturation
Sales & Marketing
IP Cost per subscriber - yearly
Network operation cost per subscr. -yearly
Competitor's share of new subscr. - entryyear
Competitor's share of new subscr. - 2years after entry
Broadband Connection Fee
DSL Linecard Price
Figure 7.13 Sensitivity analysis. NPV of broadband rollout in an area with 40 potential subscribers. Competition area. Nordic case.
When there is competition in the area, rollout in areas with 40 potential subscribers give a positive net present value. However, changes in the critical variables may change the NPV value to be negative.
7.2.10 Rollout strategies and conclusions
The analysis shows that the most critical variables in the rollout analysis are:
- The size of the area
- ARPU
- Backhaul costs
- Adoption rate forecasts
For the central European monopoly case, the operator reaches positive NPV when number of the potential subscribers in the area is about 50. In case a new operator enters the area one year delayed, the critical value for operator no. 1 is an area size of 58 potential accesses.
The Nordic case has much higher adoption rate than the central European case. The operator who rolls out broadband, needs only to have 34 potential subscribers to get a positive NPV. In case of competition (competitor one year delayed) the critical number of potential subscribers is 38. The very small difference between the critical values with and without competition is caused by the high adoption rate when the rollout starts.
The ARPU is the most uncertain variable; hence it has the strongest influence on NPV. But the ARPU is also the key variable. Since the area is a monopoly, the operator may claim higher ARPU in these sparsely populated areas, arguing that the costs are higher for the broadband rollout. Another option is supplementary financing from the government (The Norwegian case) or from the municipalities. If so, rollout of DSL may occur in even smaller areas.

Page 85 of 96
Only some figures have been presented to show the critical area size for DSL rollouts. There are many combinations of the values of the critical variables, which have not been presented. However, there will only be minor changes in the results if the variables do not deviate from the intervals shown in the figures.
The analysis of the Nordic broadband rollout case shows very clearly the first movers advantage. In situations where the adoption rate is very high and the areas are large, it is crucial to roll out broadband before other competitors enters the area. If not the whole area may be lost.
7.3 Experiences and conclusions The adoption rate forecasts distinguish between the operator who enter a local area as the first one and operators who enters later. The first operator catches all initial demand, which has been aggregated through many years, while the other operators have to fight to win parts of the growth in the following years.
[Stor04b] shows how adoption rate forecasts are used to roll out ADSL2+/VDSL and presents ADSL2+/VDSL rollout strategy based on a set of analyzed scenarios. The optimal rollout strategy is to start the roll out in large exchange areas, followed by proactive rollouts compared with the other competitors.
[Stor06] documents the profitability of broadband rollouts in sparsely populated areas based on long-term adoption rate forecasts and limits for having monopoly areas as a function of given characteristics.
The two papers show that long-term adoption rate forecasts are crucial for the evelopment of optimal broadband roll out strategies.

Page 86 of 96
8 FORECASTING NEW BROADBAND REVENUE
The telecommunication spending has increased very significantly during the last decade, both in Norway and in Western Europe. The market is willing and has the purchasing power to pay for enhanced and new telecommunications services. Network based broadband and mobile content are in the initial phase. Significant additional revenue may be generated in this area during the coming years.
The following paper is enclosed as part of the thesis:
• Stordahl K, B. Craignou, T Smura, J O Paret, I Welling, K R Renjish, T Monath “Potential new broadband revenue streams”, The 2005 Networking and Electronic Commerce Research Conference, Lake Garda, Italy, 6-9 October, 2005 [Stor05a]
8.1 “Potential new broadband revenue streams”[Stor0 5a] [Stor05a] focuses on the household spending as a basis of new potential telecommunications revenue. The paper shows that the telecommunication spending per household adjusted for inflation has increased significantly during the last years. See Figure 8.1.
Annual te lecommunication spending per household In 2000-€, adjusted for inflation
0,00
100,00
200,00
300,00
400,00
500,00
600,00
700,00
800,00
900,00
1996 1997 1998 1999 2000 2001 2002 2003
France
Finland
Germany
Norway
Spain
UK
Figure 8.1 Evolution in telecommunication spending, in 2000-€ adjusted for inflation, for selected European countries
Parts of the spending categories may in the long run be substituted by new broadband and mobile services and applications. Relevant spending categories for new revenue streams are: TV, cinema, theatre, concerts, music, books, newspapers, newsletters, journals, gambling, education and learning and gaming. Figure 8.2 shows the evolution in annual spending in Norway. The data is taken from the Norwegian Bureau of Census [SSB05].

Page 87 of 96
Evolution of annual house hold spending categories i n NOK in the Norwe gian marke t
0
1000
2000
3000
4000
5000
6000
7000
8000
1998 1999 2000 2001 2002 2003 2004
Telecomservices
IT equipment
Purchage offilms, music,CD, DVD etcCulturalservices
Gambling
Books,Newpapers,Magazines
Figure 8.2 Evolution of annual household spending categories in NOK adjusted for inflation, in the Norwegian market 1998 - 2004.
The household spending on almost all the selected categories in the Norwegian market have increased in the period 1998 – 2004. One exception is the relatively constant spending on purchase of films, music, CD, DVD etc. Probably this may be explained by cheap or free downloading of films and music from the network.
The evolution of spending on the selected categories in France, Finland, Germany, Norway, Spain and UK in the period 1998 – 2003 is shown in [Stor05a]. The results indicate that the household spending mainly evolves in the same way in all the selected countries. Since parts of the spending categories are potentials for telecommunications, introduction of new and enhanced services for both mobile and the fixed network may continue to rise the telecommunication spending.
Furthermore, the paper shows how new content services may be classified.
A framework for long-term revenue forecasts based on the substitutions is described. Important elements in the long-term revenue forecasts are:
- The proportion of each spending category which on long-term may be substituted
- The proportion of each spending category which is allocated to broadband/mobile
- The inclusion of a Logistic models, forecasting the substitutions, as a function of time
- The inclusion of a long-term broadband access forecasting model
- The inclusion of a long-term mobile technology forecasting model
Finally, the long-term forecasts for additional broadband and mobile revenue have to be shared between the different players (content creators, content brokers, service providers, operators, etc).

Page 88 of 96
8.2 Experiences and conclusions The number of households and the spending per household has increased significantly over time and also the spending per household in Western Europe have increased significantly during the period 1998-2003. This is explained by increased purchasing power for households and significantly additional potential for telecommunications.
The analyses show that the telecommunication spending per household has increased with about 33% during the period 1998-2002 for the selected country sample. The results indicate that introduction of new and enhanced services for both mobile and the fixed network may continue to rise the telecommunication spending.
An important area for new telecommunication services is the content services. The analysis show that households are spending significant amount of money on leasing and buying videos and music, pay-TV and TV licenses, on cinema, theatre, concerts, gambling, books, journals, newsletters, newspapers, education and learning, and on-line gaming. The challenge for the operators is to capture parts of these spending, through establishment of new and enhanced telecommunications services and applications.
A general framework for the new revenue streams is established. Long-term broadband and mobile access forecasts are an important part of the framework.
The papers identify large potentials for new telecommunications revenue streams. Even, if a general framework is described, there are many unsolved problems and challenges. The paper should be considered as the very first start of forecasting models in this area.

Page 89 of 96
References [BWG05] Broadband Working Group MIT Communication Future Program White paper
“Broadband Incentive Problem” by, September 2005
[CaLab05] CableLab, project Primer, September 2005, http://www.cablemodem.com/primer/
[CCITT86] CCITT Com II 50-E “Procedures for traffic matrix forecasting”, ITU Geneve, 1986
[CCITT88] CCITT Recommendation E506, 1988
[Ciof04] Cioffi J M, M Mohseni, “Dynamic Spectrum Management. A methodology for providing significantly higher broadband capacity to the users”. Telektronikk (10), no4. 2004.
[Craw44] Crawford, J. R. Learning curve, ship curve, ratios, related data. Lockheed Aircraft Corporation, 1944.
[Crys06] Crystal Ball,Decisionering, Home page: http://www.decisioneering.com/products.html
[ECC05] ECCommission, “Broadband access in the EU: Situation at 1 July 2005,COCOM05-34 Final, 23”. November 2005
[Elne04] Elnegaard N. K., K Stordahl “Analysing the Impact of Forecast Uncertainties in Broadband Access Rollouts by Use of Risk Analysis”, Telektronikk(100) no 4, 2004
[Forr00] Forrester Research Inc, “European Broadband takes off”, July 2000
[Forr03] Forrester Research Inc. “Europe's Broadband Focus Shifts To Profit”, June 2003
[Henr02] Henriques B, W King, H ElGuernaoui, L A Ims, B T Olsen, K Stordahl, “DSL rollout strategies based on user group segmentation”. In Proc. XIV International Symposium on Services in the Local access - ISSLS 2002, Seoul, Korea, April 14-18, 2002
[Idate05a] Idate, “Broadband Access Development in Europe. Final Results European Benchmark. June 2003 to December 2004”. September 2005
[Idate05b] Idate, Broadband demand data, June 2003 – December 2004, Unpublished, 2005
[Ims96] Ims, L A, B T Olsen, D Myhre, J Mononen, M Lähteenoja, U Ferrero, A Zaganiaris, Multiservice Access Network Upgrading in Europe: a Techno-economic Analysis. IEEE Communications Magazine, 34, (12), 1996, 124-134.
[Ims97a] Ims L A, K Stordahl and B T Olsen “Risk analysis of residential broadband upgrade in a competitive environment”. IEEE Communication Magazine June 1997.
[Ims97b] Ims, L A, B T Olsen, B T, D Myhre. Economics of residential broadband access network technologies and strategies. IEEE Network, 11, (1), 1997, 58-64
[Ims98] Ims L A, “Introduction strategies and techno-economic evaluations”. ISBN 041282820 0, Chapman&Hall, 1998 [Ims/Stor98]
[Jupi01] Jupiter, “Overcoming local-loop broadband challenges”, 2001
[Jupi03] Jupiter: “European Internet AND Access and Broadband Forecasts 2002-2008”, February 2003

Page 90 of 96
[Jupi04] Jupiter: European Forecasts Market Report, April 2004
[Krui37] Kruithof J “Telefoonverkeerrsrekening” De Ingenieur 52, no8, 1937
[MMI03] MMI “Resultater fra SAFT-barneundersøkelsen”, September 2003
[Myhr99] Myhre D. ”The economics of broadband service introduction” Telektronikk no 2/3, 1999
[OECD05] OECD, Broadband Statistics OECD, 20. October 2005 http://www.oecd.org/document/16/0,2340,en_2649_34225_35526608_1_1_1_1,00.html
[Olsen94] Olsen B and K Stordahl “Prognoser for pris på nettkomponenter basert på utvidelse av lærekurvemodellen” (Forecasting price on network components based on an extension of the learning curve model) Telektronikk no. 1, 1994
[Olsen96] Olsen, B T, A. Zaganiaris, K. Stordahl, L.Aa. Ims, D. Myhre, T. Øverli, M. Tahkokorpi, I. Welling, M. Drieskens, J. Kraushaar, J. Mononen, M. Lähteenoja, S. Markatos, M. De Bortoli, U. Ferrero, M. Ravera, S. Balzaretti, F. Fleuren, N. Gieschen, M. De Oliveira Duarte, E. de Castro, «Techno-economic evaluation of narrowband and broadband access network alternatives and evolution scenario assessment», IEEE Journal of Selected Areas in Communications, 14 (6), 1996, 1184-1203
[Olsen04] Olsen B. T., K Stordahl, “Models for Forecasting Cost Evolution of Components and Technologies” Telektronikk (100) no4, 2004.
[OVUM01] OVUM: Forecasts for the fixed access network, February 2001
[OVUM04] OVUM: DSL forecasts, Cable modem forecasts, May 2004
[OVUM05] OVUM, EuroView, 14. November 2005
[Point01] Point topics “World Broadband Statistics” (Quarterly), 2001
[Point04] Point topics Tariff statistics, December, 2004
[Point05] Point topics “World Broadband Statistics” (Quarterly), 2003-2005
[Rowe01] Rowe G, and G. Wright “Expert opinions in forecasting: The role of the Delphi technique”. Principles of Forecasting. J Scott Armstrong, ISBN 0-7923-7930-6, Kluwer Academic Publishers, 2001
[SSB05] SSB, Forbrukerundersøkelsene 1998 –2004, 2005
[SSB06] SSB, Statistics Norway, http://www.ssb.no/bedrifter/tab-2006-01-20-01.html
[Stor85] Stordahl K and L Holden, " Traffic forecasting models based on top down and bottom up procedures". In Proc 11th International Teletrafic Congress. Kyoto, Japan, September 1985.
[Stor88] Stordahl K "Methods for traffic matrix forecasting". Proc 12th International Teletraffic Congress. Torino, Italy, June 1-8, 1988.
[Stor94a] Stordahl K, “Bruk av ekspertundersøkelser til prognoser for nye teletjenester i privatmarkedet” (Use of expert surveys to forecast the demand for new telecommunications services in the residential market) Telektronikk no. 1, 1994.

Page 91 of 96
[Stor94b] Stordahl K, B T Olsen, E Murphy, A Zaganiaris, E Castro and M Ravera, “Delphi survey: Forecasting demand for wide- and broadband services. From Race 2087/TITAN”. In Proc 6th international workshop on optical access network. Kyoto. Japan, October 16 –19, 1994.
[Stor95a] Stordahl K and E Murphy, “Forecasting long term demand for wide- and broadband services in the residential market”. IEEE of Comminications no.2 1995.
[Stor95b] Stordahl K, “Risk modelling and assessment”. Proc 2th European workshop on Techno-economics of access network. Aveiro, Portugal, July 4– 6, 1995.
[Stor96] Stordahl K, L A Ims and B T Olsen “Risk assessment and techno-economic analysis of competition between PNO and Cable operators” In Proc Networks 96, Sydney, November 24 –29, 1996
[Stor98a] Stordahl K, “Sensitivity analysis and risk assessment”. Chapter 9 in Introduction strategies and techno-economic evaluations. Editor L A Ims, ISBN 041282820 0, Chapman&Hall, 1998
[Stor98b] Stordahl K, “Analytical forecasting models” Working document TERA, August 1998
[Stor99] Stordahl K, L. Rand. Long term forecasts for broadband demand. Telektronikk, 95, (2/3), 1999.
[Stor99b] Stordahl K, N. K. Elnegaard, L. A. Ims, B.T. Olsen. ”Overview of risks in Multimedia Broadband Upgrades”. In proc Globecom ’99, Rio de Janeiro, Brazil, December 5-10, 1999.
[Stor00] Stordahl K, N K Elnegaard, L A Ims, B T Olsen, “Optimal roll out strategies for XDSL broadband upgrades of the access network”. In Proc. ITS 2000. Buenos Aires, Argentina, July 2-5, 2000.
[Stor01] Stordahl K, N K Elnegaard, B T Olsen, “Broadband access rollout strategies in a competitive environment”. In Proc Optical Hybride Access Network/Full Service Access Network workshop, Yokohama, Japan, April 4-6, 2001
[Stor02a] Stordahl K, K O Kalhagen, “Broadband Access Forecasts for the European Market”. Telektronikk (98) no 2/3, November 2002.
[Stor02b] Stordahl K, K O Kalhagen, B T Olsen, J Lydersen, B Olufsen, N K Elnegaard ”Traffic forecast models for the transport network”. In Proc Networks2002, Münic, Germany, June 23-27, 2002.
[Stor03a] Stordahl K, “Forecasting – an important factor for network planning”. Telektronikk (99) no 3, 2003
[Stor03b] Stordahl K, “Traffic forecasting models for the incumbent based on new drivers in the market”, Telektronikk (99) no 3, 2003
[Stor04a] Stordahl K. “Long-Term Broadband Technology Forecasting”, Telektronikk (100) no 4, 2004.
[Stor04b] Stordahl K, N K Elnegaard, B T Olsen, M Lähteenoja “Competition in the Local Loop – How to Minimize the Market Risks” In Proc. XV International Symposium on Services in the Local access - ISSLS 2004. Edinburgh, Scotland, 21-24 March, 2004

Page 92 of 96
[Stor04c] Stordahl K, N. K. Elnegaard “Roll out Strategies and Forecasts for ADSL2+/VDSL” Telektronikk (100) no4, 2004
[Stor04d] Stordahl K, Nye inntektsmuligheter: Potensialvurdering for betaling av bredbåndsinnhold (New revenue possibilities: Evaluation of willingess to pay potential for broadband content). Paper in Telenor Network Market report no.1, February 2004.
[Stor05a] Stordahl K, B. Craignou, T Smura, J O Paret, I Welling, K R Renjish, T Monath “Potential new broadband revenue streams”, The 2005 Networking and Electronic Commerce Research Conference, Lake Garda, Italy, 6-9 October, 2005
[Stor05b] Stordahl K, I. G. Gjerde, R. Venturin ”Long-Term Forecasts for the Mobile market in Western Europe”. ITS 16th European Regional Conference, Porto, Portugal, 4-6 September 2005
[Stor06] Stordahl K, N K Elengaard Unpublished “Broadband in the residual market: First mover’s advantage”
[Stra01] Strategy Analytics, “Residential Broadband”, 2001
[Tera98] TERA Project (http://www.telenor.no/fou/prosjekter/tera/index.htm)
[Tele04] Stordahl K, Guest editor ”Telecommunications Forecasting” (100), no 4, 2004
[Tonic01] TONIC Project (http://www-nrc.nokia.com/tonic/)
[Træ76] Trælnes T, K Stordahl ”Behovsstudie for nye teletjenester i hjemmene“ TF rapport no 19, 1976
[Wrig36] Wright, T. P. Factors affecting the costs of aeroplanes. Journal of Aeronautic Sciences, 3 (4), 122-128, 1936.

Page 93 of 96
ACRONYMS
ACTS Advanced Communications Technologies and Servi ces
Adoption rate Proportion between demand and supply.
ADSL Asymmetric Digital Subscriber Line
ADSL2+ Enhanced Asymmetric Digital Subscriber Line
ARIMA Autoregressive Integrated Moving Average mode l
ARMA Autoregressive Moving Average model
ARPU Average Revenue Per User
ATM Asynchronous Transfer Mode
ASTN Automatic Switched Transport Network
AR Autoregressive model
BJ Box Jenkins methods
Busy hour Travel time
Cable modem HFC – Hybride Fibre Coax
CAPEX Capital expenditure
CaTV Cable Television
CDMA Code Division Multiple Access
CELTIC Cooperation for a European sustained Leaders hip In Telecommunications
DVB-H Digital Video Broadcasting – Handheld
DSL Digital Subscriber Line
DSLAM Digital Subscriber Line Access Multiplexer
DSM Dynamic Spectrum Management
DTH Direct To the Home satellite system
DTT Digital Terrestrial Television network
DWDM Dense Wavelength Division Multiplexing
DXX Digital Cross Connect
EDGE Enhanced Data for GSM Evolution
EoY End of year
Extended learning curve Forecasting model for produ ct and component costs.

Page 94 of 96
model
ETSI European Telecommunication Standards Institute
FTTB Fibre To The Building
FTTC Fibre To The Curb
FTTH Fibre To The Home
FWA Fixed Wireless broadband Access
GPRS General Packet Radio Service
GSM Global System for Mobile communications
HDSL High Bit Rate Digital Subscriber Line
HDTV High Definition Television
HFC Hybrid Fibre Coax
HSCSD High Speed Circuit Switched Data
HSDPA High-Speed Downlink Packet Access
ICT Information and Communication Technology
IFC Installed First Cost
IP VPN IP Virtual Private Network
IRR Internal Rate of Return
ISDN Integrated Service Digital Network
IST Information Society Technologies
IT Information Technology
ITU International Telecommunication Union
LAN Local Area Network
Learning curve model Prediction model for product c osts
Learning curve coefficient Parameter in the Learnin g curve model
LL Leased Lines
LLU Local Loop Unbundling
LMDS Local Multipoint Distribution System
Monte Carlo simulation A procedure for simulating r eal-world events.
MP3 MPEG-1/2 Audio Layer-3
MPE Mean Percentage Error
MPLS Multi Protocol Label Switching

Page 95 of 96
MVNO Mobile Virtual Network Operator
NMT Nordic Mobile Telephone
NPV Net present value
NxISDN Multiple ISDN lines
OA Operator access
OA&M Operation, Administration and Maintenance
OECD Organisation for Economic Co-operation and Dev elopment
OLS Ordinary Least Squares
OPEX Operations Expenditure
OSI Open System Interconnection
OTN Optical Transport Network
P2P Peer To Peer
PON Passive Optical Network
POTS Plain Old Telephone Service
PLC Power Line Connection
PSTN Public Service Telephone Network
QoS Quality of Service
RACE Research in Advanced Communications in Europe.
READSL Reach Extended Asymmetric Digital Subscriber Line
RMSE Root Mean Squared Error
RSS Remote Subscriber Stage
RSU Remote Subscriber Unit
SDH Synchronous Digital Hierarchy
SDSL Symmetric Digital Subscriber Line.
SHDSL Single pair High speed Digital Subscriber Lin e
SIM Subscriber Identity Module
SLA Service Level Agreement
SMAKS SMalbånds AKSess (Norwegian) Narrow band acce ss
SME Small and Medium Enterprises
SMP Significant Market Power
SMS Short Message Service

Page 96 of 96
Take rate Proportion between demand and supply.
TVoDSL TV over DSL
UMTS Universal Mobile Telecommunication System
VDSL Very high speed digital subscriber line
VOD Video On Demand
VoIP Voice over IP
WAN Wide Area Network
WAP Wireless Application Protocol
WLAN Wireless Local Area Network
Wi-Fi Wireless Fidelity
WiMax/WMAN Wireless Metropolitan Area Network
WWW World Wide Web
xDSL (Any) Digital Subscriber Line

1 BakgrunnDet å kunne lage prognoser for en nyteletjeneste er i seg selv problematisk.Det vil være lettere å lage prognoser foren teletjeneste som har vært på markedeten periode. Da vil utformingen og funk-sjonaliteten til tjenesten være kjent. Kost-nadene til investering for utbygging avtjenesten og for drift av tjenesten vil værekjente. Samtidig vil også takstene fortjenesten være gitt, og ut fra dette vilkundene over perioden ha generertabonnements- og trafikketterspørsel.
Når tjenesten er ny og ennå ikke intro-dusert i markedet, vil ingen av de oven-nevnte data være tilgjengelige. Dette gjørat prognostisering for etterspørsel ettertjenesten blir spesielt vanskelig og ogsåusikker.
Tradisjonelle kvantitative prognose-metoder kan derfor ikke benyttes. Istedenmå en benytte andre angrepsmåter. Aktu-elle kvalitative angrepsmåter/ prognose-metoder er:
- Markedsundersøkelser
- Potensialvurderinger
- Ekspertbedømmelser
- Analogimetoden
- Scenariometoden
- Delphimetoden.
Metodene omtales nærmere i følgendekapittel.
Hvorfor er det viktig å utarbeide prog-noser for tjenester som vi ennå ikke harpå markedet? I en del tilfeller er det ikketatt noen beslutning på innføring av tjen-esten. Da vil ekspertvurderinger og mark-edsundersøkelser være et viktig underlagfor å kunne anslå det potensielle behovetfor tjenesten. Denne type vurderinger erhelt nødvendig som en del av et beslut-ningsgrunnlaget for innføring av en tjen-este.
Ser vi spesielt på privatmarkedet og tjen-ester som krever stor kapasitet i nettet,vil en prognose for slike tjenester alle-rede i dag influere på hvorledes abonn-entnettet skal bygges. Mange har i lengretid arbeidet med tekniske løsninger forFTTH (Fiber To The Home), FTTB(Fiber To The Building) og FTTC (FiberTo The Curb). Den fremtidige etterspør-sel etter høykapasitets tjenester både tilbedriftskunder og privatkunder vil væreavgjørende for de nettløsninger som etterhvert skal velges for å tilfredsstille etter-spørselen.
Gravekostnadene er en vesentlig del avde totale kostnadene i abonnentnettet.Det er derfor svært viktig så tidlig sommulig å ha kjennskap til en sannsynligutvikling i etterspørselen etter høykapasi-tetstjenester. Sammen med utnyttelse avny teknikk – det vil si bruk av optiskenettkomponenter – vil etterspørsel gigrunnlag for nye strukturplaner som nålages i hvert sentralområde.
I denne artikkelen ses det på resultatenefra en eldre Delphiundersøkelse som blegjennomført av Televerket midt i 70-årene. Det foretas en vurdering av hvorgode prognosene var og av hvilke erfar-inger som en fikk både fra gjennomfør-ingen og fra resultatene fra undersøk-elsen. Deretter omtales en ny Delphiund-ersøkelse som nå gjennomføres av Tele-verket på det samme markedet – privat-markedet. I tillegg gis det en oversiktover ulike kvalitative metoder som kanbrukes til å lage prognoser.
2 Ulike kvalitative metoderfor å utarbeide prognoser
2.1 Markedsundersøkelser
Markedsundersøkelser kan også brukessom underlag for prognoser. Et eksempelpå bruk av markedsundersøkelser for ålage prognoser er å spørre aktuelleabonnenter på den nye tjenesten om hvade er villig til å betale for tjenesten. Detkan også stilles et sett med prisspørsmålslik at en kan få estimert en etterspør-selskurve som funksjon av prisen. Ut fraforutsetninger om kostnads- og prisut-viklingen kan det så ut fra etterspør-selskurven lages en prognose for tjen-esten.
Markedsundersøkelser kan også brukestil å kartlegge substitutter for en tjeneste.Eksempelvis vil møtevirksomheten i nor-ske bedrifter være et volum som kanvære et substitutt for bildetelefon og kon-feransefjernsyn.
2.2 Potensialvurderinger
Et potensial er det samme som metnings-nivået for en tjeneste. Det betyr at deteksempelvis kan være det maksimaleantall abonnenter som vil etterspørre entjeneste.
Anslag for et potensial kan gjøres påulike måter. Som nevnt i 2.1 kan etpotensial finnes ved bruk av markeds-undersøkelser. Ved å kartlegge møtevirk-somhet i bedrifter finnes et potensial fortelemøter fremfor ‘face to face’ møter.
Anslag for potensialer kan også finnesved å gå inn i offisiell statistikk. Totaltantall norske husstander vil kunne væreet potensial for en gitt teletjeneste – ellerdet kan være summen av antall leilig-heter, bolighus og hytter.
En fremgangsmåte for å lage prognoserut fra et anslag for potensialet er åbenytte metningsmodeller der potensialeteller metningsnivået er en av de funda-mentale parametrene i modellen.
2.3 Ekspertbedømmelser
Når det ikke eksisterer data, utviklings-trender eller annen kvantitativ informa-sjon som underlag for prognosene, vilekspertbedømmelser være en aktuellmetode.
En metode som er velkjent er brainstorm-ing. Det vil si at det innkalles en gruppeeksperter som sitter sammen og inspir-eres og influeres av hverandre. Resultat-ene her kommer frem gjennom en for-holdsvis ustrukturert prosess.
En annen fremgangsmåte er at en prog-noseansvarlig plukker ut et sett med eks-perter og at han på en systematisk måtefremlegger problemstillingen gjerne medet sett med gjennomarbeidede spørre-skjemaer. Ekspertenes svar vil da væreprognosegrunnlaget.
2.4 Analogimetoden
Analogimetoden går ut på å anta atutviklingen for ulike produkter er samm-enliknbar eller at utviklingen av like pro-dukter i ulike områder, eksempelvis ulikeland, kan være lik, men i forskjelligetidsintervaller.
Dersom det skal lages prognoser forutviklingen av en ny teletjeneste, kan detvære naturlig å se på hvorledes utvikl-ingen har vært i et land der denne tjen-esten allerede har blitt introdusert. Ved åse på utviklingen av ISDN i Frankrikeder tjenesten en periode har vært kom-mersielt tilgjengelig og anta at utvikl-ingen i Norge vil ha analogt forløp etterkommersiell introdusjon, er det mulig ålage prognoser for ISDN også for Norge.En må imidlertid være varsom med slikeavledninger fordi forholdene i de to landsom sammenliknes kan være vidt for-skjellig – både demografisk, økonomiskog med hensyn til utforming og funk-sjonalitet av tjenesten.
2.5 Scenariometoden
Metoden går ut på å lage enkeltprognoser,men med en fremstilling av flere variable
53
Bruk av ekspertundersøkelser til prognoser for nye teletjenester i privatmarkedetA V K J E L L S T O R D A H L
001.18:621.39

som gjensidig varierer og som kanpåvirke hverandre. Det er en konstruktivmetode som kan benyttes til å avdekke ogvurdere nærmere årsakssammenhenger ogpåvirkninger.
Metoden går ut på å ta utgangspunkt i etspesielt år – eksempelvis 10 år frem i tid.Det skal så lages en forventet beskrivelseav situasjonen dette året. Hvis vi tarutgangspunkt i Televerket, vil det værenaturlig å se på Televerkets konkurranse-situasjon dette året. Her åpnes det selv-sagt for ulike situasjonsbilder, og dette eren av fordelene med scenariometoden.Det er mulig å foreta ulike beskrivelseravhengig av de forutsetninger som leggestil grunn. Deretter går metoden ut på å gien beskrivelse av utviklingen av de til-hørende variable 10 år fremover i tid.Beskrivelsen av denne utviklingen for åkomme frem til det gitte fremtidsbildeblir da scenariometodens prognoser.
2.6 Delphimetoden
Delphimetoden er en raffinering av eks-pertundersøkelse. Navnet Delphikommer fra oldtidens Hellas der orakletble oppsøkt og hvor det gav prognosersom var mer eller mindre vel funderte.
I Delphimetoden velges det ut et sett medeksperter. En del av ekspertene skal værespesialister innenfor det aktuelle fagom-rådet, men mange eksperter kan ogsåvære spesialister innen andre områder.
Delphimetoden går ut på å gjøre etgrundig forarbeid før undersøkelsenforetas. Deretter utformes det et spørre-skjema til bruk i undersøkelsen. Aktuellespørsmål i en Delphiundersøkelse er for-ventet introduksjonstidspunkt for en nytjeneste, forventet utvikling av tjenestenog gjerne etterspørsel etter tjenesten somfunksjon av pris.
Det sendes så ut spørreskjema til et settmed eksperter. Svarene returneres,hvoretter de behandles på statistisk formslik at enhver vil se hvorledes han harsvart i forhold til de øvrige. Disse resul-tatene sendes så sammen med spørre-skjemaet tilbake til hver enkelt ekspertsom igjen skal svare på de samme spørs-målene. I tillegg skal det også sendes utspesielle opplysninger som enkelte avdeltakerne har angitt som begrunnelse forsine vurderinger. På denne måten skalekspertene etter hvert nærme seg enfelles oppfatning. Vanligvis vil det væretilstrekkelig å bruke to til tre runder i enDelphiundersøkelse.
I det videre vil det bli sett mer detaljertpå Delphiundersøkelser som Televerkethar gjennomført.
3 Erfaringer fra tidligereDelphiundersøkelse
3.1 Målsetting og bakgrunn for undersøkelsen
Fra august 1975 til september 1976gjennomførte Televerkets Forskningsin-stitutt i samarbeid med IndustrikonsulentA/S en større Delphiundersøkelse. Resul-tatene er dokumentert i TF-rapport 19/76“Behovsstudie for nye teletjenester ihjemmene” [1].
Målsettingen med undersøkelsen var åfinne grove anslag for den langsiktigeetterspørsel etter nye teletjenester for pri-vatmarkedet. Resultatene skulle være etunderlag for langtidsplanleggingsarbeideti Televerket. Med den lange levetidensom nettkomponentene har og ut fra bådeteknologisk utvikling, økonomisk utvikl-ing og samfunnsutviklingen var detviktig for Televerket å kunne kjenne til
markedsutviklingen for nye teletjenester.Langsiktige planer for utbygging avTeleverkets infrastruktur var avhengig avdenne type prognoser.
I sluttrapporten fra undersøkelsen heterdet “Ambisjonsnivået ved de tallmessigeog kvalitativt angitte uttrykk for tjeneste-behov, har i lys av usikkerheten i pro-blemstillingen ikke vært særlig høy. Enhar vært inneforstått med at de resultatersom fremkom, neppe ville være direkteegnet for drastiske beslutninger om idrift-setting. Undersøkelsen må heller sees påsom et første skritt i markedsanalyseneog som en læreprosess om hvilke telean-vendelser som kan muliggjøres i frem-tiden”.
En må også være klar over at undersøk-elsen ble gjennomført på en tid da defleste tjenestene som ble beskrevet i und-ersøkelsen ikke var kjent eller definert iTeleverket. Mange av tjenestene i under-søkelsen ble beskrevet ut fra litteratursøkog ut fra utenlandske – spesielt amerik-anske – fagtidsskrifter. På den tiden vardet heller ikke noen kjente markedsund-ersøkelser tilgjengelig internasjonalt fordisse nye tjenestene.
Delphiundersøkelsen ble gjennomførtblant et sett eksperter – et sett subjektivtutvalgte personer – for å vurdere enrekke nye teletjenester som først var for-ventet innført i det norske telenettet fremmot århundreskiftet.
I Norge hadde vi på den tiden praktisktalt ingen som arbeidet med markedsana-lyser. Vi hadde bare de klassiske tjenest-ene telefon, teleks, datel og telegram ogvi hadde svært lange ventelister på tele-fonabonnement. Det var ikke noe behovfor verken markedsføring eller markeds-analyser for å få økt salget og dermed øktinntektene av tjenestene.
3.2 Gjennomføring avundersøkelsen
Planleggingen av gjennomføringen avDelphiundersøkelsen tok tre måneder. Ensvært viktig aktivitet i denne periodenvar arbeid med definisjon av de aktuelletjenester og med utforming av selvespørreskjemaet. Det er også på dettepunktet Delphiundersøkelsen skiller segfra en del andre kvalitative undersøk-elser. Selve underlaget skal være godtgjennomarbeidet og det som det spørresom, skal være godt definert og struktur-ert. Dette gjør det enklere for eksperteneå svare på spørsmålene selv om det erkompliserte problemstillinger.
54
Televerket10
Produsenter ogforhandlere
Diverseenkeltpersoner
16
Diverseenkeltinstitusjoner 6
Depar tementer 3
Undervisning ogmediaforskning 3
Forlagsvirksomhet 3NRK 3
NTNF og tilknyttedeinstitusjoner 3
Postverket 2
Presse ogpresseorg 5
Figur 3.1 Deltakernes sammensetning i Delphiundersøkelsen

55
Spørsmål Svar Kommentar
1 Hvordan ser De på ønskeligheten av en Sterkt Indifferent Sterktslik tjeneste ut fra en samfunnsmessig uønsket (likegyldig) ønskethelhetsvurdering?
-3 -2 -1 0 1 2 3
Ved besvarelse av spørsmål 2, 3, 4 og 5 må man forsøke å tenke seg at disponibel inntekt målt i 1976-kroner er 50 % høyere enn i dag. Videre må spørsmålene ses i sammenheng med hverandre.
2 Hvor mange ganger pr uke tror De en norskhusstand som har anskaffet nødvendigutstyr for tjenesten, vil benytte den?
3 Hvor mange minutter pr gang tror De tje-nesten gjennomsnittlig vil bli anvendt avdem som har anskaffet nødvendig utstyr?
4 Hvor meget vil de som har anskaffet nød-vendig utstyr for tjenesten, akseptere sommånedlig utgift for det bruksvolum De harangitt ovenfor (målt i 1976-kroner og anskaf-felsesutgiftene holdt utenfor)?
5 Hvor stor prosentdel av norske hushold-ninger vil ønske å anskaffe og bruke ut-styr for denne tjenesten dersom de må be-tale det beløp som De har angitt underspørsmål 4?
Ved besvarelse av spørsmål 6, 7 og 8 må man forsøke å trekke både markedssiden og tilbudssiden inn ivurderingen. De må derfor basere svarene på egne forutsetninger om kostnader, teknologi, priser, mark-edsforhold, utbyggingstakt, politiske beslutninger, etc.
6 Når omtrent tror De tjenesten vil bli in-trodusert for norske husstander? Årstall:
7 Hvor stor andel av de norske husstandene Prosentvis an- Prosentvis an-tror De vil være tilbudt tjenesten henholds- del etter 5 år del etter 15 årvis 5 år og 15 år etter introduksjonen?
8 Hvor stor andel av de husstandene som er Prosentvis an- Prosentvis an-tilbudt tjenesten, vil ha anskaffet den hen- del etter 5 år del etter 15 årholdsvis 5 år og 15 år etter introduksjonen?
Øn
ske-
ligh
et
Spørsmål i Delphiundersøkelsen
Eksempler på anvendelser:
Tekniske forutsetninger:
Bru
ksvo
lum
Intr
o-
du
ksj.
Utb
yg-
gin
gM
arke
ds-
dek
nin
g
ganger pr uke
minutter pr gang
kroner pr måned
% av hushold-ningen
Figur 3.2 Spørreskjema i Delphiundersøkelsen

56
Figur 3.3 Innhenting av informasjon fra databank
Figur 3.4 Teleundervisning mot lærer
Innhenting av informasjon fra databank
Tilgang til tekstinformasjon og stillestående bilde på TV-skjerm.Informasjonen kan være relativt spesialisert, og derfor dekkeindividuelle og lokale informasjonsbehov. Databanken oppdat-eres fortløpende, og er tilgjengelig til vilkårlige tidspunkter. “Tele-avis på bestilling” er tatt med som egen tjeneste, nr 11.
Eksempler på anvendelser:
- Som tjeneste 5 “Teletekstoverføring på TV-skjerm”, men med større datamengder og større individuelle valgmuligheter- Informasjonsinnhenting, eksempelvis forbrukeropplysninger, juridisk informasjon, etc- Oversikt over alternative reiseruter- Varekataloger/vareoversikt- Oversikt over bibliotektilbud- Kontoforespørsel
Tekniske forutsetninger:
Bestilling av informasjon skjer ved hjelp av et tastatur og en returkanal (eksempelvis telefonlinje) til databank. Informasjonen kanmottas på TV-skjerm.
Teleundervisning med lærer
Tilgang til undervisningsprogram med levende bilde. Undervis-ningen foregår lokalt til fastsatte tidspunkter, og er basert på fore-lesninger hvor de hjemmeværende elevene kan gi enkle svar påspørsmål, etc. Elevene kan velge fritt mellom et begrenset antallprogrammer.
Eksempler på anvendelser:
Kurstilbud innen ulike emner som ikke krever fysisk oppmøte på et undervisningssted.
Tekniske forutsetninger:
TV-apparat og egen undervisningskanal. Samspill mellom lærer og elev ved hjelp av et tastatur og returkanal (eksempelvis telefon-linje).

Deretter ble det arbeidet med å velge utpersoner som skulle delta i Delphiunder-søkelsen. Totalt ble det sendt ut forespør-sel til 123 personer. Det ble lagt vekt påat deltakerne skulle være bredt represent-ert for å kunne dekke flest mulig berør-ingspunkter mellom samfunn og nye tele-tjenester i hjemmene. Det skulle altsåikke være noen representativ markeds-undersøkelse, men en undersøkelse meddeltakelse av en rekke spesialister. Detdeltok 54 personer i begge rundene,mens 64 personer deltok enten i førsteeller andre runde. Sammensetning av del-takerne er vist i figur 3.1
En Delphiundersøkelse gjennomføresvanligvis over to eller tre runder. I denneundersøkelsen ble det vurdert at to rundervar tilstrekkelig. Til gjengjeld ble deltak-erne invitert til et avsluttende møte hvorsluttresultatene fra runde to ble presentertog hvor det var mulig å komme medutfyllende kommentarer.
3.3 Definerte tjenester
De tjenestene som ble definert i Delphi-undersøkelsen, var:
- Flere TV-kanaler – større programtil-bud
- TV-program mot særskilt betaling
- TV-program fra programbibliotek
- Videospiller og -opptaker
- Teletekstoverføring på TV-skjerm
- Innhenting av informasjon fra data-bank
- Selvbetjening over telenettet
- Teleundervisning mot lærer
- Teleundervisning mot datamaskin
- Teleavis på abonnement
- Teleavis på bestilling
- Telepost
- Bildetelefon
- Tele-hjemmearbeid
- Datarespons og telekontroll
- Nye telefontjenester
- Telealarm
- Fjernkontroll
- Radioprogram på bestilling
- Stillbilde telefon.
Det registreres at det her er tjenester somkrever både smal- og bredbåndskapasitet.
I Delphiundersøkelsen ble det for hvertjeneste spurt om:
- Ønskelighet for tjenesten
- Hvor ofte og lenge tjenesten ville blibrukt (bruksfrekvens)
- Pris for bruk av tjenesten
- Etterspørsel gitt pris
- Introduksjonstidspunkt for tjenesten
- Etterspørsel hhv 5 og 10 år etter intro-duksjon
- Utbyggingsgrad hhv 5 og 10 år etterintroduksjon.
Figur 3.2 viser hvorledes spørreskjemaetvar utformet.
Det var et spørreskjema for hver tjeneste.På spørreskjemaet ble det også gitt enillustrasjon av tjenesten. I tillegg ble detgitt eksempler på hvorledes tjenestenkunne anvendes, og endelig ble det gitten teknisk beskrivelse av tjenesten.
Figur 3.3 og 3.4 viser hvorledes tjenest-ene “Innhenting av informasjon fra data-bank” og “Teleundervisning mot lærer”er illustrert.
3.4 Ønskeligheten avtjenestene
Figur 3.5 angir hvorledes en i 1976 på enskala fra -3 til +3 vurderte samfunns-messig ønskelighet av de ulike tjenester.Det ses at vanlig TV og telefon, som vartatt med som kontrollspørsmål, lå høyest.Deretter kommer nye telefontjenester,telealarm og teleundervisning mot lærerog først deretter flere TV-kanaler. Alletjenestene, unntatt teleavis som lå pårundt 0, får en positiv vurdering.
Det ble parallelt i prosjektet foretatt enmarkedsundersøkelse blant vanlige hus-stander. På spørsmål om ønskelighet foret utvalg av tjenestene, var den vanligebruker noe mer tilbakeholden enn eks-pertene.
Hvorledes ønskeligheten for disse tjen-estene er i dag, er ikke så lett å svare på,men det er grunn til å tro at den ut fraforholdet mellom tjenestene ikke er såforskjellig.
3.5 Bruk av tjenestene
På grunnlag av spørsmål om forventetbruksfrekvens og brukslengde var detmulig å beregne gjennomsnittlig tidsfor-bruk på enkelte tjenester. Det forutsettesikke her at en abonnent abonnerer på
samtlige tjenester. Resultatet av beregn-ingen er vist i figur 3.6.
Tidsforbruket som er angitt er relatert tilen husstand. I 1976 var det gjennomsnitt-lig 2.9 personer i en husstand. Dette talleter nå betraktelig lavere – noe som ut fraen 1993 betraktning vil redusere på detangitte tidsforbruk.
3.6 Introduksjonstidspunkt for tjenestene
Et av de mest interessante spørsmålene iundersøkelsen var introduksjonstidspunktfor de ulike tjenester. Resultatene fraundersøkelsen er angitt i figur 3.7.
I figuren er det oppgitt median og kvar-tiler. Dette er en vanlig fremstillingsformi Delphiundersøkelser. Årsaken til at detvanligvis brukes median og kvartilerfremfor gjennomsnittsverdi og stand-ardavvik er at spesielt grove misforstå-elser og feilvurderinger kan føre tilkvantifiserte svar som kan påvirke engjennomsnittsverdi betraktelig. Enmedian som er det samme som midtob-servasjonen, er robust i forhold til slikeoutliere. Det samme er kvartilene som erdet samme som 25 prosent- og 75 pro-sentpersentilen. Det ses av figuren at deter disse kvartilene som brukes. Det betyrat 50 % av alle svarene ligger mellom 25% og 75 % persentilen som i en Delphi-undersøkelse kan betraktes som et kon-fidensintervall.
Flere TV-kanaler – større programtilbudDet har vært en kontinuerlig utvikling pådette feltet. Kabelfjernsynsnettene harmed sine store antenner tatt inn et stadigstørre programtilbud. Prisen påparabolantenner for den enkelte brukerhar gått ned, noe som førte til en stadigstørre etterspørsel i 80-årene. På sluttenav 80-årene ble også de første kringkast-ingssatellittene skutt opp, hvilket betingerenda mindre diameter på parabolantenn-ene.
TV-program mot særskilt betalingInnført i 1985. Kryptering og adgangskon-troll blir nå i stigende grad benyttet.
TV-program fra programbibliotekEr ennå ikke realisert.
Teletekstoverføring på TV-skjermDenne tjenesten ble kalt tekst-TV ogkom omtrent midt på 80-tallet.
Innhenting av informasjon fra databankDenne tjenesten ble kalt teledata. Etter enlengre prøveperiode ble den kommersiellet stykke ut på 80-tallet.
57

Selvbetjening overtelenettetTjenesten ble defin-ert ved at en ut frastillbildeinformasjonskal kunne foretabestillinger. Vi harsiden starten på 80-tallet hatt elektroniskbetalingsformidling.Dette har imidlertidikke vært fra betal-ingsterminaler ihjemmet. Slike trans-aksjoner kan någjøres ved postdata.Her er det ikkeinkludert levendebilde. I Delphiunder-søkelsen antas intro-duksjonstidspunktmellom 1990 og2000. En mer avans-ert tjeneste basert påsekvenser av levendebilde er nå underutredning. Denkrever imidlertid etmer avansert nett enndet vi har i dag.
Teleundervisningmot lærerTjenesten har vært iutprøving i lang tidog må kunne sies åvære introdusert.
Teleundervisningmot datamaskinDenne tjenestenkrever kun PC ogdatatilknytning oghar i lengre tid værtrealiserbar på data-nettene. Datex bleinnført i 1980 ogdatapak i 1985.Prisen vil i 1994 gåkraftig ned vedintroduksjon avISDN.
Teleavis på abonnementForløpig ikke realisert.
Teleavis på bestilling (spesialisert stofffra flere aviser etter eget ønske)Foreløpig ikke realisert.
TelepostHar i prinsippet hatt tjenesten i mange år.Nå begynner tjenesten å bli attraktiv forhjemmene fordi faksmaskinene harsunket i pris og fordi ISDN gir mulighet
for flere tilknytninger på sammenummer.
BildetelefonKommersielt tilgjengelig i 1994 ved inn-føring av ISDN.
Telehjemmearbeid (Fjernarbeid)Har vært tilgjengelig etter innføring avdatanettene på første halvdel av 80-tallet.
TelealarmTilgjengelig fra 1980.
FjernkontrollTjenesten har ikke noe med telenettetsfunksjonalitet å gjøre. Ble forholdsvis tid-lig mulig ved bruk av telenettet.
Radioprogram på bestillingEnnå ikke realisert.
58
Figur 3.5 Ønskelighet for teletjenestene
-3 -2 -1 0 1 2 3
Sterktønsket
Indif-ferent
SterktuønsketSp. 1 Hvordan ser De på ønskeligheten av en
slik tjeneste ut fra en samfunnsmessighelhetsvurdering?
1 Flere TV-kanaler - større programtilbud
2 TV-program mot særskllt betaling - massespredning
3 TV-program fra programbibliotek - på bestilling
4 Videospiller og -opptak
5 Teletekstoverføring på TV-skjerm
6 Innhenting av informasjon fra databank
7 Selvbetjening over telenettet
8 Teleundervisning med lærer
9 Teleundervisning mot datamaskin
10 Teleavis på abonnement
11 Teleavis på bestilling
12 Telepost
13 Bildetelefon
14 Tele-hjemmearbeid
16 Nye telefontjenester
17 Telealarm
18 Fjernkontroll
19 Radioprogram på bestilling
20 Stillbildetelefon Vanlig TV
Vanlig telefon
Gjennomsnittsverdier fra
Delphi-runde 2

StillbildetelefonDette navnet brukes ikke. Men funk-sjonen er fullt realiserbar eksempelvis iISDN, som har vært i prøvedrift i flere årog som kommersielt innføres i 1994.
Resultatene fra Delphiundersøkelsen nårdet gjelder introduksjonsår, må sies åvære overraskende bra, når det tas hen-syn til at denne undersøkelsen ble utført i1976 med det utgangspunktet en haddepå den tiden.
3.7 Utbyggingsgrad ogetterspørsel
Vanligvis vil vi ha en prøveperiode i til-knytning til innføring av en ny tjeneste.Deretter settes den i kommersiell drift. Etgodt eksempel på dette er ISDN som eret nett som muliggjør nye tjenester. Dethar nå i lengre tid vært i prøvedrift. Etutsagn om når en tjeneste introdusereskan derfor tolkes på flere måter.
På figur 3.8 til 3.15 er det vist hvorledesekspertene for et utvalg av tjenestene iDelphiundersøkelsen vurderte utviklingenav etterspørselen (markedsdekning) ogutbyggingsgraden etter introduksjon avrespektive tjenester.
Flere TV-kanaler – større programtilbudble i Delphiundersøkelsen definert sommulighet til å få tilgang til utenlandskesendinger samt et eventuelt norsk TV2.Det med å ta inn utenlandske sendingerdekkes nå opp av kabelfjernsynsnettenesamt med de som har egne parabolan-tenner. For øvrig vil vi nå om kort tid hapraktisk talt full dekning for et norskTV2. Figur 3.8 gir en god beskrivelse avdenne utviklingen.
Så langt har vi ikke noe tilbud på TV-program fra programbibliotek eller videoon demand, som tjenesten også kalles.Det finnes imidlertid tekniske løsningerved bruk av IN-noden som muliggjørtjenesten. I USA er tjenesten på forsøks-stadiet. Anslagene i figur 3.9 er derfornoe optimistiske.
Innhenting av informasjon fra databankkom relativt tidlig til Norge. Ideen blehentet fra Prestel-tjenesten i England.Tjenesten fikk navnet Teledata og forsøkble startet tidlig på 80-tallet. Tjenestenvar basert på en kombinasjon av bruk avtelefon og fjernsynsskjerm. Denne tjen-esten tok imidlertid aldri skikkelig av. Vihar imidlertid i dag teletorgtjenester somgir ekspertinformasjon muntlig og vi har
datatorget somblant annet til-byr nærings-livsinforma-sjon, offentligregistre, elek-tronisk tele-fonkatalog,databaser, etc.
Televerket drevde siste år på80-tallet for-søksvirksomhetmed teleunder-visning medlærer. Utprøv-ing av tjenestenfortsetter også isamarbeid medandre institu-sjoner. Det sesogså på under-visningsformeri desentrale“studioer”. Vedkommersiellintroduksjon avISDN i 1994vil tekniskemuligheter forå få lyd-, data-og bildefor-
bindelse til en lærer være mulig. Dettekrever en ISDN grunntilknytning samt etopplegg med lærer. Figur 3.11 gir en godbeskrivelse av utviklingen. Vi vilimidlertid raskere komme opp i 100 %utbyggingsgrad.
Alle er kjent med den svært raske utvikl-ingen i etterspørsel etter og bruk av faks inæringslivet. Det vil etter hvert skje enparallell utvikling i privatmarkedet somså vidt har startet opp. Muligheten til åbruke faksmaskin hjemme kom tidligereenn det som er angitt på figur 3.12, menstart av en signifikant etterspørsel har detikke vært tidligere. Nettet har imidlertidgenerelt vært utbygd slik at vi i lengre tidhar hatt 100 % utbyggingsgrad.
Som nevnt blir ISDN etter en pilotfase pånoen år kommersielt tilgjengelig i 1994.På forholdsvis kort tid vil infrastrukturenbli bygget ut slik at alle som ønskerISDN skal kunne få abonnement. Detbetyr at også bildetelefon blir tilgjenge-lig. Figur 3.13 treffer rimelig godt pådenne utviklingen. Utbyggingsgraden vilraskt gå opp i 100 %, men det er grunn tilå tro at etterspørselen de første årene førmasseproduksjon av bildetelefon vil værenoe lavere.
59
1 2 3 4 5 6 7 8
1 Flere TV-kanaler - større programtilbud
2 TV-program mot særskllt betaling - massespredning
3 TV-program fra programbibliotek - på bestilling
4 Videospiller og -opptak
5 Teletekstoverføring på TV-skjerm
6 Innhenting av informasjon fra databank
7 Selvbetjening over telenettet
8 Teleundervisning med lærer
9 Teleundervisning mot datamaskin
11 Teleavis på bestilling
13 Bildetelefon
14 Tele-hjemmearbeid
19 Radioprogram på bestilling
20 Stillbildetelefon
Bruk i timer pr uke
Figur 3.6 Tidsforbruk for ulike tjenester

Det kan være van-skelig med noenentydig definisjonav hvilke tekniskeog kommunika-sjonsmessige kravsom stilles for atarbeid i hjemmetskal kunne defin-eres som fjernar-beid. Ulikearbeidsfunksjonervil eksempelviskreve ulike typertjenester. Derfor erdet også vanskeligå vurdere kurvene ifigur 3.14. IDelphiundersøk-elsen ble tele-hjemmearbeid(fjernarbeid) defin-ert som arbeids-plass med mulighetfor overføring avtekst, lyd og stille-stående bilde. Vedintroduksjon avISDN i 1994 vil vifå mer avansertemuligheter til enforholdsvis aksept-abel pris.
Nye telefontjen-ester ble i Delphi-undersøkelsendefinert som enpakke med tjen-ester som blantannet inneholdtkortnummervalg,ventekopling, med-flytting og videre-kopling i tillegg tilet knappsatsap-parat. Figur 3.15 gir en god beskrivelseav utviklingen. Tjenestene kom med denførste 10C sentralen som ble installert i1976. Etter en forsiktig startfase har detvært en jevn utvikling av disse tjenesterved innføring av 10C sentraler ogdigitale sentraler og ved bruk av CHATSutstyr.
3.8 Evaluering av resultatenefra Delphiundersøkelsen
Alt i alt må det sies at de prognosene somble laget, har vært gode og kanskjebemerkelsesverdig gode når det tas hen-syn til på hvilket tidspunkt prognoseneble laget og de forutsetninger og den bak-grunnsinformasjon som en hadde på dentiden. Det var tross alt i en periode hvorTeleverket kun hadde tjenestene telefon,teleks, datel og telegram og samtidigingen markedsaktiviteter. Storparten avtjenestene ble definert og beskrevet i pro-sjektet, da denne type informasjon ikkevar kjent i Norge.
4 Delphiundersøkelse iTITAN-prosjektet
4.1 TITAN-prosjektet
TITAN-prosjektet er et RACE-prosjekt[3]. Målsettingen med prosjektet er åutviklet et verktøy for å beregne utbygg-ingskostnader i abonnentnettet basert påinnføring og bruk av ny teknologi i formav optiske nettkomponenter. Som under-lag er det nødvendig å gå igjennom ogvurdere ulike nettarkitekturer – bådenåværende basert på eldre teknologi somet referansegrunnlag og ny arkitektur vedbruk av optiske nettkomponenter.
60
1980 1985 1990 1995 2000
1 Flere TV-kanaler - større programtilbud
2 TV-program mot særskllt betaling - massespredning
3 TV-program fra programbibliotek - på bestilling
5 Teletekstoverføring på TV-skjerm
6 Innhenting av informasjon fra databank
7 Selvbetjening over telenettet
8 Teleundervisning med lærer
9 Teleundervisning mot datamaskin
10 Teleavis på abonnement
11 Teleavis på bestilling
12 Telepost
13 Bildetelefon
14 Tele-hjemmearbeid
17 Telealarm
18 Fjernkontroll
19 Radioprogram på bestilling
20 Stillbildetelefon
1. kvartil 2. kvartil
25% av del-
takerne25% av del-takerne
årstall for median (midtobservasjonen)
Figur 3.7 Introduksjonsår – median og kvartiler for tjenestene

I prosjektet bygges det også opp en data-base med priser og prisutvikling for aktu-elle nettkomponenter. Ut fra denne data-basen lages det også prognoser for frem-tidige priser på nettkomponentene [2].
For å kunne vurdere ulike arkitekturer ogutbyggingsstrategi og utbyggingsvolumer det helt nødvendig å ha kjennskap tilde tjenester og applikasjoner som vil blietterspurt og til hvor stor etterspørselenvil være. Med andre ord, det må lagesprognoser for etterspørsel etter de uliketjenestene. I TITAN-prosjektet har enkun mandat for å lage prognoser for pri-vatmarkedet. Dette er for hver enkelttjeneste gjort ved bruk av potensialbe-traktninger og metningsmodeller, og deter gjort ved bruk av en Delphiundersøk-else. Det er den siste undersøkelsen somvil bli omtalt her.
4.2 Delphiundersøkelse
Delphiundersøkelsen gjennomføres nåved at det er sendt ut 100 spørreskjemaertil 10 eksperter i hver av de 10 deltak-
ende landene i TITAN-prosjektet. Idenne artikkelen trekkes ikke de nyeresultatene frem, men det ses isteden påden angrepsmåten som er benyttet, sam-tidig som det er naturlig å sammelikne deto Delphiundersøkelsene fra henholdsvis1976 og 1993.
Spørreskjemaet i Delphiundersøkelsenbestår av:
- Generell informasjon om undersøk-elsen
- Tekniske forutsetninger og opplys-ninger
- Økonomiske forutsetninger og opplys-ninger
- Oversikt over de ulike tjenestene
- Selve spørreskjemaene – ett skjema forhver tjeneste.
De tjenestene som på sikt er aktuelle forprivatmarkedet og som er definert i pro-sjektet, er følgende:
- Teleinteraksjon, underholdning
⋅ Video on demand
⋅ Multimedia telespill
⋅ Bildetelefon
⋅ Telemedisin
- Telekjøp, elektronisk marked
⋅ Vare- og billettbestilling
⋅ Avertering og marketing
- Temakanaler og informasjon
⋅ Interaktivt TV og spesialisertekanaler
⋅ Elektronisk avis
- Fjernarbeid og fjernundervisning
⋅ Fjernarbeid – enkelt kontor
⋅ Fjernarbeid – avansert kontor
⋅ Fjernundervisning i hjemmet
⋅ Fjernundervisning i studio
Et meget avgjørende punkt med hensyn tilkostnader er den kapasiteten som tjenest-ene vil kreve. Det er delt opp i følgendeaktuelle hastighetsklasser:
- 64 kbit/s
- 2 Mbit/s (Vidbånd)
- 8 Mbit/s (Bredbånd).
Det forventes at også høykvalitetsfjern-syn på sikt ved bruk av optimal kodingskal kunne overføres på 8 Mbit/s.
61
100
50
1980 1990 2000 År
AB%
100
50
1980 1990 2000 År
A
B
%
100
50
1980 1990 2000 År
A
B
%
100
50
1980 1990 2000 År
A
B
%
100
50
1980 1990 2000 År
A
B
%
100
50
1980 1990 2000 År
A
B
%
100
50
1980 1990 2000 År
A
B
%
100
50
1980 1990 2000 År
A
B
%
Figur 3.8 Flere TV-kanaler– større progamtilbudA: Utbyggingsgrad, B: Etterspørsel
Figur 3.9 TV-program fraprogrambibliotekA: Utbyggingsgrad, B: Etterspørsel
Figur 3.10 Innhenting avinformasjon fra databankA: Utbyggingsgrad, B: Etterspørsel
Figur 3.11 Teleundervisningmot lærerA: Utbyggingsgrad, B: Etterspørsel
Figur 3.12 TelepostA: Utbyggingsgrad, B: Etterspørsel
Figur 3.13 BildetelefonA: Utbyggingsgrad, B: Etterspørsel
Figur 3.14 Telehjemmear-beid (Fjernarbeid)A: Utbyggingsgrad, B: Etterspørsel
Figur 3.15 Nye telefontjen-esterA: Utbyggingsgrad, B: Etterspørsel

I TITAN-prosjektet ble det foretattberegninger for de investeringer som mågjøres ut fra etablering av tilpassetnettarkitektur og ut fra antakelse om engitt fyllingsgrad, om avskrivningstid påinvesteringskostnader, om driftsutgifterog om et gitt overskudd. Deretter ble detformulert spørsmål om betalingsvillighetbasert på prisintervaller der det også tashensyn til prognostisert prisnedgang påsikt.
I figur 4.1 er det som eksempel vist hvor-ledes en tjeneste beskrives i Delphiunder-søkelsen. Det er her tatt utgangspunkt ivideo on demand. Først er det gitt engenerell beskrivelse av tjenesten.Deretter informeres det om de tekniskeforutsetningene på en forholdsvis ukom-plisert måte. Her skilles det mellom vid-bånd og bredbånd. Stort sett kan de uliketjenestene overføres på begge hastighets-klasser. Det vil hovedsakelig være kvali-teten som endres.
Deretter gis det en illustrasjon av tjen-esten og til slutt noen eksempler på brukav tjenesten.
Deretter kommer det en rekke spørsmålom hver tjeneste. Disse spørsmål er forenkelthets skyld nesten identiske for hvertjeneste. Spørsmålene er som følger:
- Angivelse av grunner for bruk av tjen-esten
- Karakteristikk av typiske brukere avtjenesten
- Angivelse av forventet etterspørselsom funksjon av prisalternativer
- Angivelse av forventet etterspørselsom funksjon av tiden
- Anslag for hvor stor andel av dis-ponibel inntekt en husholdning ervillig til å betale for tjenesten somfunksjon av husholdningens disponibleinntekt
- Angivelse for alternativer til bruk avtjenesten.
Det er også skilt på vidbånds- og bred-båndskvalitet på tjenestene.
For øvrig er det gitt mulighet for å kunnegi spesielle kommentarer og argumenta-sjon i tilknytning til de enkelte spørsmål.I figur 4.2 er det gitt et eksempel på etutsnitt av spørsmålene for video ondemand tjenesten.
Til slutt i spørreskjemaet er det ogsålaget “samlespørsmål” som kartleggeretterspørsel for den enkelte hastighets-klasse: 64 kbit/s, 2 Mbit/s og 8 Mbit/s.
4.3 Bruk av resultatene i TITAN-prosjektet
I Delphiundersøkelsen kartlegges etter-spørselen etter de ulike tjenestene som enfunksjon av pris. Samtidig finnes detogså en direkte prognose for tjenestenefor årene 1995, 2000, 2005 og 2010. Etmetningsnivå for tjenestene angis også. Idenne sammenheng er prognosespørs-målet det mest kompliserte å svare på.Det blir derfor lagt mest vekt på hva eks-pertene mener de enkelte abonnenter ervillig til å betale for tjenesten
I figur 4.3 og figur 4.4 er det gitt eteksempel på hvorledes resultater fra und-ersøkelsen kan brukes. Dette er foreløp-ige resultater fra først runde i Delphiund-ersøkelsen, og de er kun basert på 10 nor-ske eksperter og kan i denne sammen-heng ikke betraktes som signifikanteresultater. De er imidlertid tatt med for åillustrere metodikken med bruk av dennetype resultater. Tjenesten som er valgt uther er video on demand.
Når det gjelder priser og kostnader, er detviktig å være klar over at trafikk-kost-nader og trafikkvolum ikke er tatt med idette prosjektet. Dette passer bra medhvorledes kostnadene allokeres i det nor-ske telenettet. Alle kostnader somrelateres til trafikkmaskinen – det vil si
62
Figur 4.1 Beskrivelse av video on demand
Video on demand
Dette er en tjeneste der et video-bibliotek kan nås ved en hjelp av en teletjeneste, og programmer kan bestilles ogoverføres til hjemmet.
Video Library
Telephone PC
Service-access
Tele-communication
network
Television
Cable-Tvoutlet
Video Decoder
HomeThe video-transmission can eitherbe done over the cable-TV network,or the telecommunication network
Eksempler på anvendelser:
Bestilling og mottak av spillefilmer, TV-programmer, musikk-videoer, osv.
Tekniske forutsetninger:
Brukeren kan enten benytte en avansert telefon eller en PC for å kommunisere med video-biblioteket via en teletjen-este. PC- eller telefon-tastaturet brukes for å velge videoer fra biblioteket. Overføringen av videoen kan skje entenvia kabel-TV-nettet eller telekommunikasjonsnettet. Det antas at husholdningen må abonnere på enten en vidbånds-eller bredbånds-teletjeneste for å kunne bruke denne anvendelsen. Bredbåndstjenesten vil gi raskere overføring ogbedre bildekvalitet, men både brukerutstyret og teletjenesten vil bli dyrere.

63
2) Of all households that might end up with a home office, what percentage of the user terminals and teleservice doyou believe will be paid by the household, and what percentage will be paid by the employer?
(Note: The two columns must add up to 100 %)
Comments (if any):
3) Given that the annual costs (1993 NOK) are as given in the table. What percentage of the residential market do youbelieve will demand a telecommunication service for this application?(Note: Assume overall prices and income to be constant over time, and that there is a universal knowledge of the application. For explanation ofannual costs, see page 6.)
Comments (if any):
4) What percentage of the residential market do you believe over time will end up with a telecommunications servicefor this application?(Note: Assume a cost and a cost-trend which will be implicit in your demand predictions.)
Comments (if any):
5) Given that the household pays, and given the following set of annual disposable income of the household. Howmuch of the income do you believe a family will be willing to spend on this application?(Note: For explanation of annual disposable income, see page 6.)
Comments (if any):
6) What kind of alternatives might exist for this application?Answer:
Percentage paid by the household: Percentage paid by the employer:
% %
In the case of wideband teleservices
Annual costs: 5800 NOK 6600 NOK 8200 NOK 9900 NOK 19800 NOK
Answer (percentage): % % % % %
In the case of broadband teleservices
Annual costs: 15000 NOK 20000 NOK 25000 NOK 30000 NOK 60000 NOK
Answer (percentage): % % % % %
In the case of wideband teleservices
Year: 1995 2000 2005 2010 Maximum demand(Saturation)
Answer (percentage): % % % % %
In the case of broadband teleservices
Year: 1995 2000 2005 2010 Maximum demand(Saturation)
Answer (percentage): % % % % %
Disposable income: 66 000 NOK 100 000 NOK 165 000 NOK 290 000 NOK 410 000 NOK
Answer (NOK): NOK NOK NOK NOK NOK
Figur 4.2 Spørsmål knyttet til video on demand tjenesten

den delen av telenettet som ligger overabonnentmodulen i endesentralen – skalrefunderes med trafikkinntekter. Deøvrige kostnader – altså i abonnentnettetskal refunderes med abonnementsinn-tekter. Dermed holder det i TITAN-pro-sjektet å begrense seg til abonnement-setterspørsel, abonnementskostnader ogabonnementspriser.
Som tidligere nevnt er det i TITAN-pro-sjektet bygd opp en database for pris pånettkomponenter. Ut fra denne databasenlages det også prognoser for prisnedgangpå de ulike nettkomponenter. Ser vi påutbyggingsområder bestående av privateabonnenter, vil det ut fra en gitt pris foren tjeneste kunne anslås en gitt etterspør-sel.
Videre arbeid er ut fra etterspørsel etterulike tjenester å bestemme en hensikts-messig nettarkitektur. Dermed kaninvesteringskostnader og øvrige kost-nader beregnes ved bruk av det utvikledeberegningsverktøy. Spørsmålet er så omde kostnader som er beregnet harmonerermed de priser som opprinnelig er antattfor tjenestene. Dersom det er betydeliguoverensstemmelse her, må en gå inn etannet sted på etterspørselskurven oggjenta hele prosessen. Samme prosessbenyttes også ved ulike tidsintervalleretter hvert som prisprognosene avtar. Påden måten lages det også prognoser foretterspørselen etter tjenestene.
Det lages altså ikke direkte prognoser,men det lages indirekte prognoser for deulike tjenester basert på etterspør-selskurven fra Delphiundersøkelsen ogprisprognoser sammen med kalkulasjonom kostnader ved oppbygging og drift avnettet. Figur 4.5 gir en oppsummering avdette. Det samme opplegget kan ogsåbrukes i blandede områder med forret-ningsabonnenter og private abonnenterog i områder med bare forretningsabonn-enter, men det betinger informasjon ometterspørsel i bedriftsmarkedet på sammeform som for privatmarkedet.
5 Sammenlikning av de toDelphiundersøkelser
Formen på de to undersøkelsene er sværtlike. Spørreskjemaene er laget nesten påidentisk måte. Dette skyldes ikke minstden positive erfaring en hadde med denførste Delphiundersøkelsen.
Ellers kan det konstateres at tjeneste-spekteret i to undersøkelser er overrask-ende likt. Ses det bort fra telegame ogtelecommunity (telemedisin) så er tjen-
estene fra 1993-undersøkelsen ogsådefinert i Delphiundersøkelsen fra 1976.
Konklusjonen er at i situasjoner der enikke har historiske data om etterspørseletter nye teletjenester, vil en Delphiund-ersøkelse være en av de aktuelle kvalita-tive prognosemetoder.
Referanser
1 Trælnes, T, Stordahl, K. Behovs-studie for nye teletjenester i hjemm-ene. Kjeller, Televerkets Forsknings-institutt, 1976. (TF-rapport 19/76.)
2 Stordahl, K, Olsen, B T. Prognoserfor pris på nettkomponenter basert påutvidelse av lærekurvemodellen.Telektronikk 90(1), 166–172, 1994(denne utgave).
3 RACE 2087 TITAN. Deliverable #2.
64
Figur 4.3 Eksempel på estimert etterspør-selskurve for video on demand med vid-båndstilknytning (2 Mbit/s)
Figur 4.4 Eksempel på estimert etterspør-selskurve for video on demand med bred-båndstilknytning (8 Mbit/s)
Figur 4.5 Prosess for beregning av prognoser,kostnader og priser for ny infrastruktur iabonnentnettet
25
20
15
10
5
0400 600 800 1000 1200 1400
Prosentandelav husstander
Årlig abonnementspris i ECU(1 ECU = ca kr 8.30)
8
6
4
2
01500 2700 3900 5100 6300 7500
Prosentandelav husstander
Årlig abonnementspris i ECU(1 ECU = ca kr 8.30)
Prognoser påpris på nett-komponenter
Prognoserfor nye
tjenester
Bestemmelseav nett-
arkitektur
Etterspørselsom funksjon
av pris
Kostnadsanslagav nett-
arkitektur
Pris fortjenestene


34 Telektronikk 2/3.1999
1 Introduction
What are the market drivers for futurebroadband demand? This paper showsthat the long term demand for broadbandservices depends on a set of differentmarket drivers. Some of the marketdrivers like application evolution, devel-opment of new technology and networkarchitectures, terminal equipment tech-nology, mass production of networkcomponents and tariff evolution arepresented.
The long term demand for broadbandservices is estimated based on an interna-tional Delphi survey. The experts partici-pating in the Delphi survey used infor-mation about market drivers as a basisfor their evaluation of the evolution of afuture broadband market. A comparisonis done between the expectations the ex-perts had about the market developmentsin 1994 and 1997. The results from theDelphi survey are used to model analyti-cal forecasting functions for broadbanddemand. The aggregated forecasts forspecific broadband capacities are splitinto asymmetric and symmetric broad-band forecasts.
1.1 Technology developmentand new network architec-tures
In the transport network deploymentstrategies for substitution of PDH trans-mission equipment with SDH transmis-sion equipment are now being carriedout. In parallel the fibre capacity is ex-panded by the introduction of wavelengthdivision multiplexing (WDM). Over thelast years the development of new tech-nology has dramatically reduced costsby significant expansion of the systemcapacity. During a 20 year period thetransmission cost per capacity unit hasbeen reduced from 10,000 to 1. However,the technical problem of high capacityswitching is not yet solved. One possibil-ity is to use ATM, another possibility isto use IP, and a third one is to implementATM over the IP platform.
In the access network a wide range offibre architectures are relevant, of whichdeployment depends on factors such asthe subscriber area:
• Hybrid fibre coax (HFC);
• Fibre to the cabinet (FTTCab);
• Fibre to the node (FTTN);
• Fibre to the curb (FTTC);
• Fibre to the building (FTTB);
• Fibre to the home (FTTH).
In addition new multiplexing techniques,access protocols for point-to-multipointconfigurations and modulation tech-niques are developed. Also the digitalsubscriber line (DSL) technologies, likeADSL (asymmetric digital subscriberline), HDSL (high bit rate subscriberline), VDSL (very high speed digitalsubscriber line) and SDSL (symmetricdigital subscriber line) are of greatimportance for utilising twisted pairs [1,2]. The technologies may substitute eachother or may be deployed as supplementsin different parts of the network.
Introduction of passive optical networkcomponents as TPON and ATM PONand the use of ATM- and SDH technol-ogy will increase the transmission capac-ity and reduce the costs. Wireless broad-band access is a technology currentlyunder development. The access radiotechnology is expected to evolve fromcarrying narrowband services to transportof services up to 2 Mbit/s capacitythrough local multipoint distributionservice (LMDS) and multipoint multi-channel distribution (MMDS) [3–5].Another relevant architecture in thefuture is the universal mobile telephonesystem, UMTS.
Other alternatives are satellite communi-cation combined with a wireline returnchannel. The cable operators will up-grade their networks with return channelsoffering both POTS/ISDN, Internet andbroadband services together with CATV.The most relevant architecture is a com-bination of passive optical network and acoax droop called hybrid fibre coax sys-tem, HFC. The access technologies men-tioned may substitute each other or maybe deployed as supplements in differentparts of the network.
1.2 Terminal equipmenttechnology
The terminal equipment is evolvingrapidly into several future options includ-ing specific electronic interfaces/termi-nals which may be used together with aTV, like a network computer. Anotherpossibility is the use of a PC. There areseveral drivers connected to the termi-nals. During the last 20 years, from the8080 to the Pentium processor, the num-ber of transistors per chip has doubledevery 18 months (Moore’s law), while
the speed in million instructions per sec-ond (MIPS) has increased proportionally[6]. In 1983 the cost per Mbyte was USD300, while in 1995 the cost was reducedto 15 cents. Future exponential develop-ment of the storage capacity will enablesoftware decompression of MPEG-2 videostreams and direct computer storage.
1.3 Market drivers
The new technologies, the mass produc-tion of network components and lowtransmission costs are continuously cre-ating new applications. At the same timean extraordinary expansion of the Inter-net has occurred. It seems that it is not akiller application for the broadband mar-ket, but that Internet is a ‘killer network’.From 1998 wideband services wereoffered on the Internet, and broadbandservices are also expected to emergesoon. At the same time some CATVcompanies are installing cable modemsand are offering broadband services ontheir networks. Some of the main driversfor the development of the broadbandmarket are: new technology, new appli-cations, increased computing power andstorage, mass production, price reduc-tions, the Internet revolution and thecompetition [7].
2 Prediction of networkcomponent cost trends
Within the European programs RACEand ACTS the projects RACE 2087/TITAN, AC 226/OPTIMUM and AC364/TERA have developed a methodol-ogy and tool for calculation of the overallfinancial budget of any access architec-ture. The tool handles the discount costsystem, operations, maintenance, lifecycle costs and the cash balance. Thisenables a comparison of various opticalor hybrid architectures through a globalsystem assessment. The tool has the abil-ity to combine low level, detailed net-work parameters of significant strategicrelevance with high level, overall strate-gic parameters for performing evaluationof various network architectures [1, 8–11].
The TITAN project developed a method-ology based on an expansion of theWright and Crawford’s learning curvemodels to predict future cost of the net-work components [12–14]. In the OPTI-MUM project, Wright and Crawford’slearning curve models for cost predic-tions were examined. The models forcost predictions were extended not only
Long term forecasts for broadband demandK J E L L S T O R D A H L A N D L A R S R A N D

35Telektronikk 2/3.1999
to estimate the costs as a function ofnumber of produced units, but also as afunction of time. The cost prediction ofeach network component is described byexpansion of the learning curve given asa function of the parameters:
f(0) the predicted costs at time 0;
n(0) the relative proportion of pro-duced components at time 0;
∆t the time interval between 10 %and 90 % penetration;
K the learning curve coefficient(relative decrease in the cost bythe double production).
The extended learning curve function is:
f(t) = f(f(0), n(0), ∆t, K, t) = f(0)[n(0)–1 (1 + exp[ln(1/n(0)
– 1) – 2t ln9/∆t])–1]log2K
The parameters in the learning curve:f(0), n(0), ∆t and K are given in theOPTIMUM cost database, which con-tains more than 200 different networkcomponents. The components aregrouped in volume classes. The valuesused for the various volume classes areshown in Table 1. In the same way the Kparameter is estimated based on type ofcomponent. The K value indicates howmuch the component price is reducedby a doubling of the production.
In the cost database all components arelisted with a given n(0), ∆t and K valuein addition to the estimated cost f(0) attime 0. Then the extended learning curveis uniquely defined and the prediction ofthe costs is determined.
Table 2 shows that new componentsbased on electronics or advanced opticsexperience a significant price reduction.When the production is doubled, theprice is reduced by 20 % and 30 %respectively. An additional doubling ofthe production will reduce the cost by 36% and 51 % respectively.
3 The Delphi survey
A Delphi survey is a method by whichthe opinions of experts are canvassed, inorder to achieve consensus on a particu-lar issue. The methodology involvesasking a set of questions, analysing theresults and resubmitting the questions tothe experts, together with a summary ofthe first round results. The experts thenresubmit their opinions, which may have
changed following a consideration ofresults from the previous round. Theprocedure can be repeated a number oftimes and usually leads to a reduction inthe variance of the answers received.Medians are used as a measure in theDelphi survey because they are morerobust estimators than the mean valueand standard deviations, and also lessaffected by extreme answers.
In 1994 the TITAN project carried outan international postal Delphi surveyon broadband service demands amongexperts in ten European countries[14–15]. An additional comprehensivetwo-round, on-site Delphi survey wascarried out during the OPTIMUM work-shop “Techno-economics of MultimediaNetworks” in Aveiro, Portugal in Octo-ber 1997. The following countries wererepresented in the survey: Belgium, TheCzech Republic, Denmark, Finland,France, Switzerland, Germany, Greece,Holland, Hungary, Ireland, Italy, Nor-way, Portugal, Spain and Sweden. Thenumber of participants were 36 in thefirst round and 32 in the second round.
3.1 Broadband applications
The Internet development and the newtechnology continuously create newapplications. To be able to evaluate thedifferent broadband applications, they aredivided into groups. The questions in thesurvey do not address single applications,but the main group of applications. Themain groups of applications in the studyare:
1 Tele-entertainment (Symmetric and asymmetric)
• Multimedia telegame
• Virtual reality
• Video on demand
• Audio/music on demand;
2 Information services (Asymmetric)
• Information retrieval
• Electronic magazines
• Information retrieval by intelligentagents
• Electronic newspaper;
3 Teleshopping (Asymmetric)
• Teleshopping
• Advertising;
4 Private communications services(Symmetric)
• Videophone
• Teleconferencing
5 Teleworking (Symmetric and asymmetric)
• Videophone
• Joint editing/publishing
• Teleconferencing
• Teleparticipation
• Information retrieval
• Multimedia applications;
6 Telelearning (Symmetric and asymmetric)
• Video on demand
• Videophone
• Virtual reality;
Volume class n(0) ∆t
1 0.5 5
2 0.1 5
3 0.01 5
4 0.5 10
5 0.1 10
6 0.01 10
7 0.001 50
Table 1 Variation in n(0) and t for each volume class
Component group K value
Civil work 1
Copper 1
Installation 1
Sites and enterprises 0.95
Fibre 0.9
Electronics 0.8
Advanced optical components 0.7
Table 2 The K values for component groups

36 Telektronikk 2/3.1999
7 Telecommunity (Symmetric and asymmetric)
• Telesurveillance
• Videophone
• Telediagnostics.
3.2 Access capacity
The technology and network componentsare rather expensive today, but mass pro-duction may exponentially reduce pro-duction costs and consequently theprices. The following access capacitieswere examined in the Delphi survey:
• 2 – 4 Mbit/s asymmetric access includ-ing a 384 kbit/s symmetric upstreamcapacity;
• 25 Mbit/s asymmetric access includinga 384 kbit/s symmetric upstreamcapacity;
4 Comments (if any):
Figure 1 An example from the Delphi survey questionnaire
Example of application: Video on demand and Audio/Music on demand
General description:
This is an application where a video library is accessed, and programs may be ordered and transmitted to the home. This appli-cation could substitute some part of the time spent on ordinary TV and part of the money spent on hiring videos in video shops.
Technical assumptions:
The user may use either an advanced telephone or a PC to communicate with the video library. The transmission of the video maybe done either via a Cable-TV network or a telecommunication network. The access capacity will be in the range of 2– 4 Mbit/s.
Given the following alternative prices per hour (1997 ECU), what do you believe will be the expected use of this group ofapplications (Tele-entertainment)?
Note: We assume that the tele-entertainment applications are supplementary to the traditional TV channels, but there may be somesubstitution effects.
Video library
Tele-communication
network
Service-access
Home
Telephone PC
Television
Cable-TVoutlet
Video Decoder
The video-transmission can eitherbe done over the cable-TV network,
or the telecommunication network.
Round 1
Prices per hour: 0.5 ECU 2 ECU 5 ECU 10 ECU 20 ECU
Minutes per day: 70 40 12 5 1
Round 2
Prices per hour: 0.5 ECU 2 ECU 5 ECU 10 ECU 20 ECU
Minutes per day:
Having seen the above results, what would your answers be to the corresponding question today?

37Telektronikk 2/3.1999
• 25 Mbit/s asymmetric access includinga 6 Mbit/s symmetric upstream capa-city.
Several factors contribute to an applica-tion’s requirements in terms of band-width over the network. In most cases,high capacity is needed for large volumesof information.
First of all, the type of medium (speech,text, graphics, video, or several mediasimultaneously – multimedia), may indi-cate the possibility for large volumes ofinformation. The types of applicationsdemanding high bandwidth transmissionare fast transfer of video, high qualityimages/graphics, large data files, or asimultaneous combination of these inmultimedia applications.
High quality videophone, telecommunityand telemedicine are applications bene-fiting from a high symmetric upstreamcapacity. For example, interactive videoapplications transferring moving pictureslike videotelephony or videoconferences,require a minimum image frequencydepending on the speed of change in thepictures transferred. This increases thebit rate requirement, and so does theimage resolution and colour richness.
3.3 The Delphi questionnaire
The questionnaire starts with a shortdescription of the application, followedby some questions relating to it. Themain questions in the survey are:
• Usage as a function of charge;
• Penetration as a function of charge;
• Penetration as a function of time(forecast);
• Demand as a function of disposablehousehold income.
An illustration of the design of the ques-tions in the questionnaire which includesa description and an illustrative figure isgiven in Figure 1.
As shown in Figure 1, in the secondround of the survey the participants werepresented the medians from the samequestions in the first round of the survey.The participants took this into considera-tion when answering the second roundquestions.
In order to use the presented applications,an access in the range of 128 kbit/s –25 Mbit/s is needed. The users will haveto pay more for enhanced performanceand quality generated by higher band-width. All the equipment and networkcomponents will gradually become less
expensive, depending on factors like newtechnology, sales volume, competition,etc. Broadband communications costscan be divided into four elements:
• Costs for necessary terminal equip-ment;
• Subscription charges;
• Traffic charges;
• Charges for delivered information (eg.charge for hiring/ordering a video).
In the Delphi survey we were interestedin how much the customers are willingto pay for the traffic and the subscription(connection) charges. It was assumedthat the customers already possess thenecessary terminal equipment like TV,PC, etc. Supplementary expenditure forspecific adapters and ‘interface’ hard-ware for the applications which have tobe installed, was assumed to be coveredby a subscription (connection) charge.The costs of the delivered informationwere not taken into account.
Some information may be financed byadvertisements. The teleshopping appli-cation may be financed by the sellers andnot by the customers. The costs of otherinformation like electronic newspapersmay be substituted by a reduction ofcosts for buying hard copies (traditional
Choices 1994 survey *) Answers 1994 *) Choices 1997 survey Answers 1997
Video on demand 28 % Teleworking 28 %
Home office 27 % Information services 25 %
Videotelephony 18 % Tele-entertainment 24 %
Remote education 8 % Teleshopping 7 %
Multimedia telegames 7 % Private communications services 6 %
Home ordering system 4 % Telecommunity 4 %
Interactive TV/specialized channels 4 % Telelearning 3 %
Electronic newspapers 3 % Others (Telebanking) 1 %
Advertising and marketing 1 %
Telecommunity 0 %
Table 3 Leading Group of Applications, percentage score
*) Source [15]

38 Telektronikk 2/3.1999
newspapers). Nevertheless, it is reason-able to believe that the customers haveto pay for some type of information.
4.1 Household budget and usage
A household has an annual disposableincome, which is the income after tax orthe part of the income which is availablefor purchasing goods and services, forsavings etc. Part of the service budget isrelated to
• budget for entertainment;
• budget for telecommunications;
0,0 5,0 10,0 15,0 20,0Price per hour (euro)
Min
utes
per
day
250
200
150
100
50
0
Teleworking Business
Teleworking Private
Telelearning
Figure 2 Demand curves for broadband access for teleworking and telelearning
0,0 5,0 10,0 15,0 20,0Price per hour (euro)
Min
utes
per
day
70,0
60,0
50,0
40,0
30,0
20,0
10,0
0,0
Tele-entertainment
Information services
Telecommunity
Private communications services
Teleshopping
Figure 3 Demand curves for other private broadband applications groups
• budget for newspapers, magazines,dictionaries, specific books and videos,etc.
The household has both a time budgetand a financial budget, dependent on thenumber of persons in the household. Thebudgets limit the use of applications. It isreasonable to expect some substitutioneffects between the household’s use oftime today and possible use of broadbandaccesses. In the questionnaire we haveasked how much additional time a house-hold would spend on the new broadbandapplications as a function of additionalpayment.
4.2 Ranking groups of applications
The respondents were asked to point outthe three most important services for thefuture. This makes up 33 % the highestpossible score for an application group.Table 3 shows the ranking of the groupof applications in 1994 and in 1997.Teleworking, information services andtele-entertainment stand out as the antici-pated most popular services for broad-band. A comparison with a similar Del-phi survey in 1994 [15] shows that thethree most promising broadband applica-tions were video on demand, home officeand videophony. It looks like informationservices have become more popular fromthe 1994 survey to the 1997 survey. Inaddition, from the first to the second sur-vey other application groups havebecome more interesting than privatecommunications services (videophony).
A telecommunication access line maysupport the use of many of these groupsof applications, so for each group ofapplications questions were asked on thedemand at different prices in order toquantify the demand.
4.3 Potential usage of applications
For every service the respondents wereasked to indicate the demand in minutesper day for a given set of prices per hour.Hence a demand curve can be con-structed for each application group basedon medians from the survey. In Figure 2a distinction is made between companypaid teleworking and teleworking paid bythe households themselves, since compa-nies are expected to have a higher will-ingness to pay than private households.
The demand for telelearning is trickierbecause it concerns a small share of thehouseholds and for a limited time of theyear. The household usage will be highsome days and zero at other timesdepending on the type of courses andeducation frequency. Demand curves forother private broadband applicationgroups are shown in Figure 3. The resultsshow that tele-entertainment follows thesame demand curve as telecommutingfrom a price of five euro per hour, buthas a higher saturation level – so theexpected demand is much higher at alow price. Tele-entertainment services,which are defined as video on demand,audio/music on demand, multimedia tel-egame and virtual reality, are very attrac-tive services, but are quite price elastic.

39Telektronikk 2/3.1999
Figure 4 shows medians for round 1 andround 2 and identifies the range from the25 quartile to the 75 quartile of theanswers on demand for broadband con-nections for different hourly prices. Thefigure indicates significant reductions inthe variance of the answers received inthe first round compared to the secondround.
Teleworking, information services andtele-entertainment stand out as the mostpromising broadband applications in thefuture. The interest for information ser-vices can be explained by the rapiddevelopment of the Internet and therelated narrowband applications. Theinterest for tele-entertainment is causedby a high degree of usage of existingapplications. Teleworking is of specialinterest and may be one important driverfor the broadband market. Teleworking isused by self employed persons with theiroffice at home (SOHO), by one person inthe family financed by the company, orby some in the family, but financed inter-nally. Today there is a positive trendtowards supporting teleworking at home.For employees with qualified and inde-pendent work there are reasons to predictthat society and the companies are will-ing to support and finance extensive useof teleworking with a broadband connec-tion. In that way the employees can workmore effectively and in a more flexibleway. Society also supports teleworkingbecause of reduced pollution and reducedtraffic at rush hour times, etc. Some largecompanies now offer a home office solu-tion combined with a company paid nar-rowband access (N-ISDN) for some oftheir employees.
4.4 Demand forecasts
The respondents were asked to indicatethe expected penetration in the residentialmarket for broadband access for theyears 2000, 2005, 2010, 2015 in additionto the saturation level. Figure 5 indicatesquite a high demand for broadband con-nections in the residential market. Thepenetration forecasts for 2 Mbit/s havenot changed much from the 1994 Delphisurvey. In 1994 the experts predicted, for2 Mbit access, a penetration rate of 5 %,10 % and 15 % respectively for the years2000, 2005 and 2010. In the 1997 surveythe forecasts are 4 %, 12 % and 23 %respectively for the years 2000, 2005 and2010. The difference in the predictions issomewhat larger for faster connections,but the results show the same pattern.While the experts in 1994 expected a
0 20 40 60 80 100 120 140 160 180
Pric
es p
er h
our
(eur
o)
Minutes per day
20
10
5
2
0,5
Round 2Round 1
Figure 4 Demand curves for broadband access – all applications
Access capacity 2000 2005 2010 2015 Saturation
2 Mbit/s 2 12 23 40 50
8 Mbit/s 0.5 5.5 14 22 40
26 Mbit/s 0.1 3 9 15 25
Sum 2.6 20 45 75 *)
Table 4 Revised broadband forecasts as percentage of the residential market
*) The saturation for the various accesses will occur at different points in time
2000 2005 2010 2015 SaturationYear
Per
cent
age
of th
e re
side
ntia
l mar
ket
60,0
50,0
40,0
30,0
20,0
10,0
0,0
2-4 Mbit/s (1997)25 Mbit/s downstream and 384 kbit/s upstream (1997)25 Mbit/s downstream and 6 Mbit/s upstream (1997)2 Mbit/s wideband (1994)8 Mbit/s broadband (1994)
Figure 5 Forecast for broadband access in the residential market

40 Telektronikk 2/3.1999
penetration rate for 8 Mbit/s of 1 %, 2 %and 5 %, the respective penetration fore-casts for 25 Mbit/s in the 1997 survey are2 %, 5% and 13 %.
4.5 Analytical forecastingfunctions
The development of analytical forecastmodels for broadband access was a partof the OPTIMUM project. The resultsfrom the Delphi survey contain only2 Mbit/s and 25 Mbit/s accesses. Thereare reasons to believe that also 8 Mbit/swill be a conventional offered access.Evaluation of the results shows that thesum of the two 25 Mbit/s gives about thesame demand as the 2 Mbit/s. During thefirst ten years the demand for 2 Mbit/swill probably be significantly higher than25 Mbit/s. Since the total demand for25 Mbit/s seems optimistic, it has beensuggested to transfer 25 Mbit/s with384 kbit/s return demand to a 8 Mbit/sdemand. In addition it has been sug-gested to split the given demand in asymmetric demand and an asymmetricdemand. Since 8 Mbit/s is a lower cap-acity than 25 Mbit/s it has been sug-gested to increase demand by 10 %.In addition we will use 26 Mbit/s, whichis closer to the new standard than25 Mbit/s. The forecasts for 8 Mbit/sand 26 Mbit/s for the year 2000 is alsoreduced to 0.5 % and 0.1 % respectively.The revised forecasts are found in Table4.
The demand forecasts in the table in-clude both symmetric and asymmetricaccesses. The fraction between asymmet-ric and symmetric will change over time,but during the first years, there willmainly be asymmetric accesses. Themodels developed in the OPTIMUMproject are based on the results from the1997 Delphi survey. Different analyticalforecasting models for fitting the Delphidata are tested. The extended Logistic
model with three parameters give a rathergood fitting. The model is defined by thefollowing expression:
Yt = M / (1 + exp(α + βt))γ
where the variables are defined as fol-lows:
Yt Demand forecast at time t
M Saturation level
t Time
α, β, γ Parameters.
The parameters α, β, γ cannot be esti-mated simultaneously by ordinary leastsquares regression since the model isnon-linear in the parameters. The mainobjective in the fitting is not to get thebest overall fit, but a reasonably good fit
for the first years. Therefore, the para-meters in the model are estimated byordinary least squares regression (OLS)for different values of γ. The OLS esti-mation is based on the following trans-formation:
ln((M/Yt)1/γ – 1) = α + βt
The saturation level M and the parameterγ are fixed values in the estimation pro-cess. M is found from the Delphi data,while γ is estimated by systematic calcu-lations of RMSE (root mean squareerror) for a set of different values. Themultiple correlation coefficient, R2, forthe models is rather high. The estimatedvalues are given in Table 5.
The broadband penetration forecasts areshown in Figure 6.
4.6 Symmetric and asymmetricdemand modelling
The forecasts have to be divided intoasymmetric and symmetric demand.Introduction of analytical functions areconvenient for describing the share ofasymmetric and symmetric accesses. Thequestion is how the symmetric demandwill develop compared to the asymmetricdemand. The symmetric demand willprobably be low for the first years com-pared to the asymmetric demand. After
Parameter estimates a b g M R2
2 Mbit/s - 0.07496 - 0.19266 5 50 98.56
8 Mbit/s - 4.79468 -0.13249 500 40 99.38
26 Mbit/s - 4.57674 - 0.15775 500 25 99.37
Table 5 Parameter estimates and multiple correlation coefficient for broadband pene-tration forecast functions
0,00
5,00
10,00
15,00
20,00
25,00
30,00
35,00
40,00
45,00
50,00
2000
2002
2004
2006
2008
2010
2012
2014
2016
2018
2020
Pen
etra
tion
(%)
2 Mbit/s
8 Mbit/s
26 Mbit/s
Figure 6 2 Mbit/s, 8 Mbit/s and 26 Mbit/s broadband forecasts

41Telektronikk 2/3.1999
some years the symmetric demandwill probably have a relatively higherincrease. In the end we assume that theproportion of symmetric subscriptionswill converge to a given level. Oneimportant element is how the PCs areused as broadband terminals, either forcommunication with specific informationsources, or for communication betweenusers. The behaviour may be modelledby constructing analytical functionsdefining market shares as a function oftime between the asymmetric demandand the symmetric demand. The analyti-cal functions should be simple.
It is suggested to use the Logistic modelto describe the evolution of the distribu-tion of asymmetric and symmetricdemand. The following parametersare defined:
S Saturation level
St Share of symmetric demand
t Time
T Time to 50 % saturation
a Growth per year
α, β Parameters in the Logistic model(Model 2).
The model is given by:
St = S / (1 + exp(α + βt))
The Logistic model is symmetric onboth sides of S/2. The model is uniquelydefined if S, α and β are defined. Insteadof defining the parameters, we havedecided to determine the function bythe following assumptions:
1)Define the saturation level S;
2)Define the time (number of years) T,until half saturation is reached;
3)Define the market share S0 at time 0,which is the year of introduction.
The parameters in the model are found by:
α = – β * T
β = (1/T) * ln(S/S0 – 1)
The degree of symmetric demand de-pends on the offered broadband capacity.The analytical specification differs, de-pending on connection capacity. The sat-uration for 2 Mbit/s symmetric demandis suggested to be 40 % in the long run,while the 8 Mbit/s and 26 Mbit/s sym-metric demand is suggested to be 30 %and 25 % respectively. The time to reachhalf saturation for 2 Mbit/s, 8 Mbit/s and
26 Mbit/s is estimated to be eight years,and the starting proportion of symmetricbroadband communication demand isestimated to be 2 %. The distributionsare shown in Figure 7.
4.7 Demand for accesscapacities
The access lines with different capacitiesmay support the use of many of the ear-lier mentioned applications. Thus, ques-tions were asked on the demand forbroadband access for three differentaccess types as a function of annualcosts. Figure 9 shows the estimated
demand curves for 2 Mbit/s, 8 Mbit/s and26 Mbit/s broadband connections. Thedifference between the demand curves isvery small and indicates that residentialusers are not willing to pay much morefor a high capacity connection despitethe better quality.
4.8 Analytical demand models
As a part of the OPTIMUM project ana-lytical demand models dependent onprice were developed. Based on the samearguments as for analytical forecastingfunctions, 2 – 4 Mbit/s, 25 Mbit/s with anarrowband return channel and a broad-
0 %
5 %
10 %
15 %
20 %
25 %
30 %
2 Mbit/s
8 Mbit/s
26 Mbit/s
2000 2001 2002 2003 2004 2005 2006 2007 2008 2009 2010
Figure 7 Proportion of the symmetric communication penetration of the total broadband penetration demand. The given assumptions lead to forecasts for asymmetric and symmetric demand as shown in Figure 8
0
2
4
6
8
10
12
14
16
18
20
2000 2001 2002 2003 2004 2005 2006 2007 2008 2009 2010
2 Mbit/s asym
2 Mbit/s sym
8 Mbit/s asym
8 Mbit/s sym
26 Mbit/s asym
26 Mbit/s sym
Figure 8 Forecasts for asymmetric and symmetric connections (%)

42 Telektronikk 2/3.1999
band return channel are transferred to2 Mbit/s, 8 Mbit/s and 26 Mbit/s. Thesuggested demand model based on threeparameters is:
y = e(α+βp)γ
y Demand;
p Price;
α, β, γ Parameters in the model.
The parameter estimates are found byOLS regression for a given set of γ val-ues. A variant of this model is based onthe assumption that the demand is 100 %when the price is 0. Evaluation of theresults show that the fitting is not satis-factory. To improve the fit, the para-meters α and β are determined such thatthe demand curve passes through the twoinitial points, while the γ parameters are
determined by minimising the squareddistance between the demand curve andthe results from the Delphi survey.
Now, let the initial values be:
(yI, pI) and (yL, pL)
Hence:
β = – [(ln yL)1/γ – (ln yI)1/γ] / (pI – pL)
α = (ln yI)1/γ – β pI
The parameter γ is found by minimisingthe following expression:
Q(γ) = Σ(yi – e[α(γ)+β(γ)pi]γ)2
In the non-linear estimation procedure,not only the last equation is minimisedbut also the first years achieve a reason-ably good fit. For all models γ equal to
around 10 gives a rather good fit. Theframework for the demand curves isdescribed hereafter. It is important tounderline that the tariff in this contextconsists of both a one year subscriptiontariff and also a usage tariff based on theexpected traffic during one year. Themethodology described in the previoussections is used to predict the tariff evo-lution for broadband connections. Thepredictions are calculated in the follow-ing steps:
The tariff p is found by transforming thedemand model to the formula:
pt = [(ln yt)1/γ – α]/β
The parameters α, β and γ are found bythe above equations. Then the tariff pre-dictions for the years 2000, 2001, ...,2010 are determined by inserting thedemand forecasts {yt} in the same years.The tariffs are found in Table 6. The tar-iff evolution for broadband services inthe mass market is shown in Figure 10.
4.9 Willingness to pay for access capacity
Willingness to pay as a function of dis-posable household income is estimatedfor broadband access based on answersfrom the respondents. Disposable incomeis the household income after tax, ie. thepart of the income that is available forsaving and purchasing goods and ser-vices. Figure 11 shows that householdswith an annual disposable income in the10,000 to 15,000 euro range cannotafford to pay more for a high capacityconnection. Incremental willingness topay for broadband access is very small,even for wealthy households.
0
5
10
15
20
25
30
0 1000 2000 3000 4000 5000 6000
Annual cost (euro)
Pre
cent
age
of th
e re
side
ntia
l mar
ket %
2 Mbit/s
8 Mbit/s
26 Mbit/s
Figure 9 Demand curves for broadband access as a function of annual cost
Parameters 2 Mbit/s 2 Mbit/s 8 Mbit/s 8 Mbit/s 26 Mbit/s 26 Mbit/sasym sym asym sym asym sym
Demand, year 2000 1.900 % 0.037 % 0.637 % 0.013 % 0.150 % 0.003 %
Demand, long run 40 % 40 % 30 % 30 % 25 % 20 %
Tariff, year 2000 1800 euro 2700 euro 3240 euro 4860 euro 5192 euro 7788 euro
Tariff, long run 500 euro 750 euro 900 euro 1350 euro 1442 euro 2163 euro
Table 6 Assumption tariff evolution for broadband services (mass market)

43Telektronikk 2/3.1999
For households with an annual dispos-able income of between 25,000 and60,000 euro the willingness to pay forsubscription and traffic charges for thehighest capacity access is only 2 % ofthe household’s disposable income.
4.10 Price and capacity
The previous sections have shown a lowwillingness to pay for higher capacityand better quality. The questionnairealso included direct questions on thehousehold’s willingness to pay forincreased capacity relative to a 128 kbit/saccess, ie. an ISDN basic access. Figure12 confirms a low willingness to pay forincremental increased connection capac-ity. The difference between the 75 %quartile (25 % answered higher) and the25 % quartile (25 % answered lower) areshown in the figure as a measure of thevariation in the answers. The uncertaintyincreases with increased capacity.
5 Conclusions
The results from the 1997 Delphi surveyshow that there will be a substantialdemand for broadband services in theresidential and SOHO markets during thenext ten years. However, the householdsare not willing to pay too much more foradditional broadband applications andadditional capacity. Households with lowdisposable income will not afford to havea subscription, while households with areasonable disposable income are willingto pay up to 2 % of their disposableincome. The possibilities for substitutioneffects between new and old media(newspapers, magazines, video rental,video games, etc.) are taken into account.
The Delphi survey indicates that cus-tomers will be unwilling to pay muchmore for increased capacity. It is interest-ing to see that the demand curves for2 Mbit/s, 8 Mbit/s and 26 Mbit/s are quitesimilar. The results are supported by theprice/quality question where the expertsindicate that the households are willing topay twice as much for a 50 Mbit/s accesscompared to how much they are willingto pay for an ISDN BA access, and only2.2 times as much for a 500 Mbit/saccess. This is a quite important finding,because a 50 Mbit/s access is possibleusing VDSL modem for customers withshort subscriber lines, while 500 Mbit/s isimpossible because of the physical limita-tion on the twisted pair. To offer 500Mbit/s access an FTTH solution will
0
1000
2000
3000
4000
5000
6000
7000
8000
9000
2 Mbit/s asym
2 Mbit/s sym
8 Mbit/s asym
8 Mbit/s sym
26 Mbit/s asym
26 Mbit/s sym
2000 2001 2002 2003 2004 2005 2006 2007 2008 2009 2010
Figure 10 Tariff evolution for broadband services (mass market) euro
Ann
ual c
harg
es (e
uro)
2 %
2 %
2 %
1 %
0
200
400
600
800
1 000
1 200
1 400
10,000 20,000 30,000 40,000 50,000 60,000Disposable income (euro)
2 Mbit/s
8 Mbit/s
26 Mbit/s
0.3 %
Figure 11 Income spent on broadband accesses as a functionof disposable income
190
240
300
220
100
176200
120
200
150145
113
0
50
100
150
200
250
300
Inde
x A
nnua
l Pric
e
75 quartil
50 quartil
25 quartil
128 kbit/s 384 kbit/s 2 Mbit/s 50 Mbit/s 500 Mbit/s
Capacity
350
Figure 12 Willingness to pay for increased capacity relative to 128 kbit/s

44 Telektronikk 2/3.1999
probably be needed, but the customers arenot willing to pay more than 2.2 times theprice of an ordinary ISDN access!
Comparison of the results from the 1997Delphi survey and the one carried out in1994 shows that the results are rathersimilar. It is interesting to note that thepenetration forecasts for a 2 Mbit/saccess for the years 2000, 2005 and 2010are quite close, with the 1997 forecastsbeing a little bit higher. For higher accesscapacities we see the same pattern. Usu-ally, the experience when comparing oldforecasts of new telecommunication ser-vices to new forecasts is that the old fore-casts have been too optimistic. The fore-casts of the Internet evolution is ofcourse an exception.
Like in the 1994 Delphi survey, the vari-ation in the answers among the experts inthe 1997 Delphi survey was significantlyreduced from round 1 to round 2. Thevariation was measured by 25 % and75 % quartiles. The results indicated thatit was unnecessary to carry out an addi-tional round.
To realise the potential broadband de-mand, a key option is the developmentof the broadband drivers mentioned inthe introduction. Models to predict costtrends for network components show thatincreased production gives significantreduced cost.
In addition analytical broadband fore-casting functions and demand functionsare developed together with forecastsfor asymmetric and symmetric demand.The analytical forecasting functions anddemand functions are modelled basedon the results from the Delphi survey.
References
1 Ims, L A et al. Evolution of technolo-gies and architectures to a full servicenetwork. In: Proc. IBC Broadbandstrategies – the battle for customeraccess. London, UK, 4–5 December1997.
2 Ims, L A (ed.). Broadband accessnetworks : Introduction strategiesand techno-economic evaluations.London, Chapman-Hall, 1998.
3 de Passoz, G, Clausse, J L, Karam,G. Can digital techniques give a newboost to MMDS? In: Proc. 11thInternational Symposium on Sub-scriber Loops and Services (ISSLS).Melbourne, Australia, 4–9 Feb 1996,134–139.
4 Nowak, R J. Wireless : part of thebroadband future. In: Proc. 11thInternational Symposium on Sub-scriber Loops and Services (ISSLS).Melbourne, Australia, 4–9 Feb 1996,122–127.
5 Welling, I. Internet access and Videoon demand. In: Proc. IBC Broadbandstrategies – the battle for customeraccess. London, UK, 4–5 Dec 1997.
6 Moore, G. Electronic Materials Sym-posium, Santa Clara, USA, Mar 1998.
7 Stordahl, K, Olsen, B T, Ims, L. Dowe need a pan-European networkand what are the demand for appli-cations? Invited paper 22nd Euro-pean Conference on Optical Commu-nications. Oslo, Norway, Sep 1996,2, 2.3–2.10.
8 Olsen, B T et al. Techno-economicevaluation of narrowband and broad-band access network alternatives andevolution scenario assessment. IEEEJournal of Selected Areas in Commu-nications, 14 (6), 1184–1203, 1996.
9 Ims, L A et al. Multiservice accessnetwork upgrading in Europe : atechno-economic analysis. IEEECommunications Magazine, 34 (12),124–134, 1996.
10 Olsen, B T et al. PNO and CableOperator broadband upgrade technol-ogy alternatives : a techno-economicanalysis. In: Proc. Optical FiberConference 1996 (OFC ’96). SanJose, USA, 25 Feb – 1 Mar 1996.
11 Ims, L A, Stordahl, K, Olsen, B T.Risk analysis of residential broad-band upgrade in a competitive envi-ronment. IEEE CommunicationsMagazine, 35 (6), 96–103, 1997.
12 Wright, T P. Factors affecting thecost of airplanes. Journal of Aero-nautic Science, 3 (4), 122–128, 1936.
13 Crawford, J R. Learning curve, shipcurve, ratios, related data. LockheedAircraft Corporation, 1944.
14 Stordahl, K et al. Delphi survey :forecasting the demand for wide- andbroadband services. From RACE2087/TITAN. In: Proc. 6th Interna-tional Workshop on Optical AccessNetwork. Kyoto, Japan, Oct 1994,7.3.1–7.3.10.
15 Stordahl, K, Murphy, E. Methods forforecasting long term demand forwide and broadband services in theresidential market. IEEE Communi-cations Magazine, 13 (2), 4–49, 1995.
Lars Rand (34) is a graduate engineer from the NorwegianUniversity of Science and Technology from 1990. Heworked for seven years as researcher at the Institute ofTransport Economics with modelling and analysis of privatetransport. Since 1997 he has been working as forecastanalyst in Telenor Nett.
email: [email protected]
Kjell Stordahl (54) received his M.Sc. degree in statistics atthe University of Oslo in 1972. He worked with Telenor Re-search Dept. for 15 years, seven of which as manager forthe teletraffic field. He joined Telenor Nett in 1989 and wasmanager in the Planning Department until 1996. From 1997to 1999 he was manager for Market analysis in the MarketDivision, Telenor Nett. He has participated in various Euro-pean projects and authored or co-authored more than 90papers in international journals and conferences.
email: [email protected]

21
1 IntroductionBroadband forecasts are important input for awide range of areas. Specific models are devel-oped to forecast broadband subscriptions andbroadband traffic generated in the network [1].Short-term forecasts are used to estimate the rev-enue. The forecasts are also input to the budgetprocess and even for following up the budgetmonth by moth.
In addition, the forecasts are used to estimatethe investment and operations and maintenancecosts. Broadband forecasts are important for pre-dicting purchase of broadband equipment, net-work components and to predict manpower usedfor the installations.
However, this paper focuses on long term evolu-tion of broadband technologies. The broadbandforecasting models have to take into accountvarious broadband technologies. A battle hasstarted between incumbent operators and cableoperators in Western Europe. In some countriesthe cable operators have rather high broadbandmarket shares since they have started broadbanddeployment earlier than the incumbent operators.The forecasts show that DSL access technologywithin a short time will be the dominating tech-nology in Europe. However, in areas were thereexist cable networks, the competition is inten-sive and the broadband penetration higher thannormal [2,3]. The situation in Europe is different
from North America where forecasts show thatcable modem technology based on HFC duringthe coming years still will have more than 50 %of the market. Fixed wireless broadband accessbased on technologies like LMDS is for themoment rather expensive. A lot of operatorsplan to utilise the technology, but it will takesome years before the technology is cheapenough to compete with DSL and HFC.
To be able to make the right decisions for therollout of broadband platforms, overall techno-economic calculations have to be performed.The European Commission has since 1992 sup-ported the following portfolio of techno-eco-nomic projects:
• TITAN, RACE 364 (1992–1995)• OPTIMUM, 2087 (1996–1998)• TERA3), ACT 226 (1998–2000)• TONIC, IST 25172 (2001–2002)
The broadband forecasting models have been animportant element in techno-economic modelling.
2 Broadband ForecastingModels for Techno-Economic Analysis ofBroadband Roll-out
Important input to techno-economic modellingof broadband rollout is broadband forecasts.Both quantitative and qualitative forecasting
Broadband Access Forecasts for theEuropean MarketK J E L L S T O R D A H L A N D K J E L L O V E K A L H A G E N
The first part of the paper gives a review of broadband forecasts and broadband forecasting methods
which have been applied during the last eight years to predict the broadband evolution in Western
Europe. It is documented that the Delphi survey has developed rather good long-term forecasts based
on surveys carried out in 1994 and 1997.
The second part of the paper presents demand modelling and forecasts for different access tech-
nologies for the fixed and mobile network based on results from the IST project TONIC1)2). The
demand modelling and broadband forecasts are important input to four techno-economic business case
analyses in the TONIC project. Forecasts for three generic types of Western European countries have
been developed: A Nordic country, a Central European country and a Southern European country.
For the fixed network, a model has been developed for forecasting the total broadband penetration in
the European residential market. Forecasts are made from 2002 to 2010 based on diffusion models. A
specific model is developed to predict the market share evolution between ADSL, VDSL, fixed wireless
broadband and cable modem/HFC, and then penetration forecasts for the different access technologies.
For the mobile network, specific forecasting models have been developed to forecast the total mobile
access penetration in Europe and for the mobile system generations GSM, GPRS/HSCSD, 3G and
3G/WLAN.
Kjell Ove Kalhagen (29) gradu-ated with a Master in Economicsfrom the University of Oslo in1998. Kalhagen has worked asSenior Executive Officer at theMinistry of Petroleum andEnergy. He joined Telenor R&Din 2001, where he is working asResearch Scientist in the Strate-gic Network Development groupof Telenor R&D. Kalhagen hasparticipated in international ISTprojects, and he is currentlyleader of a business case focus-ing on the provisioning of broad-band services to rural areas. Heis author or co-author of severalarticles in international journalsand conferences.
Kjell Stordahl (57) received hisM.S. in statistics from Oslo Uni-versity in 1972. He worked withTelenor R&D for 15 years andwith Telenor Networks for 15years, mainly as manager ofPlanning Department RegionOslo and then Market analysis.Since 1992 he has participatedin various techno-economic EUprojects (TITAN, OPTIMUM,TERA, TONIC) analysing rolloutof different broadband technolo-gies. Kjell Stordahl has beenresponsible for working pack-ages on broadband demand,forecasting and risk analysis inthese projects. He has pub-lished more than 130 papers ininternational journals and con-ferences.
1) TONIC: TechnO-ecoNomICs of IP optimised networks and services2) http://www-nrc.nokia.com/tonic/3) http://www.telenor.no/fou/prosjekter/tera
Telektronikk 2/3.2002

22 Telektronikk 2/3.2002
models are candidates for making broadbandforecasts. Actual quantitative forecasting modelscould be Smoothing models, Time Series models(Box Jenkins approach), Kalman filter models,Regression models, Logit models, Diffusionmodels and other econometric models. Actualqualitative forecasting methods could be Marketsurveys, the Scenario method, the Analogymethod, Experts methods and the Delphimethod.
The question is what type of models can be usedfor techno-economic analysis of broadband roll-out. The forecasting models have to satisfy thefollowing:
1)Because of the nature of investment projects,long term forecasts are important.
2)The forecasting models should also have theability to be applied with limited or no data atall as input.
In addition there should be possibilities to in-clude relevant expert information.
To establish a new broadband platform, it isnecessary to examine a project period of 5 – 10years. Because of heavy investments the pay-back could be 5 years or more both in the fixednetwork using DSL, HFC or LMDS technology,and in the mobile network for UMTS. Themobile business case has also to take intoaccount the mobile licences for UMTS. Hence,
long term forecasting models have to be used toevaluate rollout of a new broadband platform.
In case of no historical data the qualitative fore-casting models are of course the most relevantmodels. Time series models and Kalman filtermodels are not relevant since they need a sub-stantial number of observations. HFC and DSLwere introduced in Western European countriesin the period 1999 – 2001. Therefore the numberof yearly historical observations in differentEuropean countries varies from 1 to 3. Theforecasting models used have to utilise limitedobservations and in addition make long termforecasts.
3 Forecasting Models Usedfor Broadband Forecasts1993 – 2000
The EU has since 1992 supported a portfolio oftechno-economic projects, with the objective toanalyse and evaluate broadband rollout. Thischapter gives a review of the forecasting meth-ods used in the techno-economic projects:TITAN, OPTIMUM, TERA and TONIC.
3.1 TITANQuantitative forecasting models could not beused in TITAN (Tool for Introduction Strategiesand Techno-Economic Evaluations of AccessNetworks) since the project was carried out along time before broadband services were intro-duced in the residential market. Even parts ofbroadband technology, which are used now,were not known. In the first phase of the project,internal expert evaluations were performed tomake predictions of the future broadband mar-ket. The applications teleworking, telelearning,telegames, teleshopping, teleinteraction andinformation/thematic channels were examined.In 1994 a postal two-round Delphi survey wascarried out among 100 experts from 10 differentWestern European countries. The experts had toanswer questions about the demand for broad-band applications, the demand for access capac-ity and willingness to pay. The access capacitieswere segmented in ISDN, wideband accesses(2 Mbit/s) and broadband accesses (8 Mbit/s).
The Delphi results contained demand forecastsfor ISDN, 2 Mbit/s and 8 Mbit/s accesses in theyears 1995, 2000, 2005 and 2010. The resultsare shown in Figures 1 and 2.
Figure 1 shows the demand curve for ISDN,wide- and broadband accesses. The experts inthe Delphi survey had to estimate the demandbased on rather high annual tariffs. For wide-band the tariff interval was [1000 – 2300 Euro],while the interval was [1500 – 3400 Euro] forbroadband accesses.
Figure 1 Forecasts ofpenetration of ISDN, wide-and broadband accesses in theresidential market, WesternEurope (Delphi survey, 1994)
Figure 2 Demand curvesISDN, wide- and broadbandaccesses in the residentialmarket, Western Europe(Delphi survey, 1994)
30
25
20
15
10
5
0
Pen
etra
tion
(%)
1995 2000 2005 2010
ISDN
2 Mbit/s
8 Mbit/s
30
25
20
15
10
5
0
Dem
and
in (
%)
0 1000 2000
Annual tariff in Euro
3000
ISDN
2 Mbit/s
8 Mbit/s
4000

23Telektronikk 2/3.2002
The differences between the demand curves aresmall and show that the users are not willing topay much more for higher capacity. One reasonis the relatively high tariff levels.
Ranking of broadband applications is shown inTable 1. The demand curve and price elasticitywas estimated based on results from the Delphisurvey. The results are documented in [4–7].
3.2 OPTIMUMA new Delphi survey was performed in OPTI-MUM (Optimised Network Architectures forMultimedia Services) to predict the future evolu-tion of the broadband market. The survey was anon-site two-round Delphi survey carried out onthe Techno-economic Workshop arranged byOPTIMUM in 1997. In 1994 a set of applica-tions were described. Now, the relevant applica-tions were grouped in the following applicationclasses:
1 Tele-entertainment (Symmetric andasymmetric)• Multimedia telegames• Virtual reality• Video on demand• Audio/music on demand
2 Information services (Asymmetric)• Information retrieval• Electronic magazines• Information retrieval by intelligent agents• Electronic newspapers
3 Teleshopping (Asymmetric)• Teleshopping• Advertising
4 Private communications services (Symmetric)• Videophone• Teleconferencing
5 Teleworking (Symmetric and asymmetric)• Videophone• Joint editing/publishing• Teleconferencing• Teleparticipation• Information retrieval• Multimedia application
6 Telelearning (Symmetric and asymmetric)• Video-on-demand• Videophone• Virtual reality
7 Telecommunity (Symmetric and asymmetric)• Telesurveillance• Videophone• Telediagnostics
The questionnaire starts with a description of theapplications. The capacity classes defined were2–4 Mbit/s with 384 kbit/s and 25 Mbit/s with384 kbit/s and 6 Mbit/s return, respectively. Themain questions in the survey were:
• Usage as a function of charge;• Penetration as a function of charge;• Penetration as a function of time (forecast);• Demand as a function of disposable household
income.
The experts in the Delphi surveys were askedto select the three most interesting broadbandapplications. Table 1 shows the ranking ofthe application in the Delphi survey in 1994and 1997. The table shows that the Delphi sur-vey in 1994 and 1997 predict that home office/teleworking and tele-entertainment/video-on-demand will be important future broadbandapplications.
The broadband penetration forecasts from theDelphi surveys in 1994 and 1997 are described
Applications 1994 Answers 1994 Application classes 1997 Answers 1997
Video-on-demand 28 % Teleworking 28 %
Home office 27 % Information services 25 %
Videotelephony 18 % Tele-entertainment 24 %
Remote education 8 % Teleshopping 7 %
Multimedia telegames 7 % Private communications services 6 %
Home ordering system 4 % Telecommunity 4 %
Interactive TV/specialised channels 4 % Telelearning 3 %
Electronic newspapers 3 % Others (Telebanking) 1 %
Advertising and marketing 1 %
Telecommunity 0 %
Table 1 Evaluation ofapplications.
Percentage score

24 Telektronikk 2/3.2002
in Figure 3. The 2 Mbit/s penetration forecastsin the two surveys are rather close, while highaccess capacity predictions are lower in 1994compared with 1997. The Delphi survey from1994 predicted 13 % broadband penetration inyear 2005, while the survey from 1997 predicted20.5 % broadband penetration.
In OPTIMUM the demand classes were revisedto 2, 8 and 25 Mbit/s downstream access capaci-ties. The demand curves based on the Delphiresults are shown in Figure 4. The figure showslimited broadband demand when the annual tar-iff exceeds 1000 Euro. The willingness to payfor access capacity was examined with referenceto ISDN. The results are shown in Figure 5.
[8–10] describe results from the 1997 Delphisurvey in more detail.
3.3 TERATERA (Techno-Economics Results from ACTS)utilised the demand data from the 1997 Delphisurvey. Diffusion models were examined todescribe the evolution of broadband penetration.A four parameter Logistic model was used to themodelling. The model is defined by:
Yt = M / (1 + exp(α + βt))γ
where the variables are defined as follows:
Yt is demand forecast at time tM is saturation levelt is timeα, β, γ are parameters
The model was used to forecast the demand for2, 8 and 25 Mbit/s accesses. The results areshown in Figure 6.
Since there was no reason to adjust the Delphiforecasts, the Delphi observations were used asinput to fit the parameters in the Logistic model.In addition a specific model was used to predictmarket share between asymmetric and symmet-ric accesses. The model was described by:
St = S / (1 + exp(α + βt))
Where the parameters are defined by:S is saturation levelSt is share of symmetric demandt is timeα, β are parameters in the Logistic model(Model 2)
Figure 7 describes the market share evolution ofsymmetric accesses
Results are described in more detail in [10–17].
Figure 6 Demand forecastsfor 2, 8 and 25 Mbit/s accessesin the residential market inWestern Europe (1999)
Figure 7 Market shareevolution of symmetricbroadband accesses in the residential market
Figure 3 Broadbandpenetration forecasts forthe residential market inWestern Europe (1994 and 1997)
Figure 4 Demand curves asa function of annual cost inEuro (ECU) for broadbandsubscription (1997)
Figure 5 Willingness topay for increased capacityrelative to ISDN (128 kbit/s)
2000
2-4 Mbit/s (1997)25 Mbit/s downstream and 384 kbit/s upstream (1997)25 Mbit/s downstream and 6 Mbit/s upstream (1997)2 Mbit/s wideband (1994)8 Mbit/s broadband (1994)
2005 2010 2015 Saturation
Year
Per
cent
age
of t
he r
esid
entia
l mar
ket 60
50
40
30
20
10
0
Per
cent
age
of t
he r
esid
entia
l mar
ket
% 30
25
20
15
10
5
00 1000 2000 3000 4000
Annual cost (ECU)
5000 6000
2 Mb/s
8 Mb/s
26 Mb/s
Inde
x A
nnua
l Pri
ce
300
250
200
150
100
50
0128kb/s 384kb/s 2Mb/s 50Mb/s
Capacity
500Mb/s
75 quartile
50 quartile
25 quartile
Pen
etra
tion
(%)
50
40
30
20
10
0
2000
Broadband forecasts
2 mb
6 mb
25 mb
2002
2004
2006
2008
2010
2012
2014
2016
2018
2020
Per
cent
30
25
20
15
10
5
0
2 mb
6 mb
26 mb
2000 2002 2004 2006 2008 2010

25Telektronikk 2/3.2002
4 Forecasting Models Usedfor Broadband Forecastsin TONIC
A model has been developed to forecast the totalbroadband penetration in the European residen-tial market. Forecasts are done from 2001 to2010 based on diffusion models. Specific mod-els are developed to predict the market shareevolution between ADSL, VDSL, fixed wirelessbroadband and cable modem/HFC, and thenpenetration forecasts for the different accesstechnologies.
Especially the evolution of broadband in Ger-many, Sweden and Denmark speeds up thebroadband demand in Europe. Germany reached2 million DSL accesses already at the end of2001. The wide use of (narrowband) Internet,the flat rate tariff and the broadband competitionare important drivers for broadband. Introduc-tion of wholesale and the possibility to hire cop-per lines (LLUB) increase the competition. Alsodifferent broadband technologies compete tocatch significant market share. Monitoring onthe demand data shows that the cable operatorshave been dominating the first years. However,the broadband penetration at this stage is notvery high.
4.1 Data Sources and ModellingInformation has been gathered from a lot of dif-ferent sources. The project partners have col-lected up-to-date data of the broadband evolu-tion, demographic data and tariff data. Otherimportant sources have been consultant reportsfrom Jupiter [18], Strategy Analytics [19] andOVUM [20]. The Tonic project has developednew forecasts based on the collected information[21–23]. It has been difficult to use the forecastsfrom the consultant reports since the forecastspredict too high a market share for cable modemand the HFC technology, probably influencedby the situation in North America.
The first step has been to make penetration fore-casts for the total broadband demand in the resi-dential market. A four parameter logistic modelhas been used for the forecasts. The saturationlevel in the model has been estimated based oncoverage for broadband in various countries inEurope. In non-dense rural areas, the expensesin rolling out broadband are too high, becausetoo few households give payback to the neces-sary investments. The other parameters in themodel are estimated based on historical data andalso some expert evaluations.
Then predictions of the evolution of marketshare between different broadband technologyhave been developed based on a set of Logisticforecasting models. Migration between tech-nologies are handled when VDSL and Fixed
wireless broadband are catching market sharesfrom ADSL and cable modem. The penetrationforecasts for the broadband technologies arefound by multiplying the predicted market sharewith the total broadband penetration.
4.2 Residential BroadbandPenetration Forecasts forWestern Europe
Figure 8 shows the long-term Western Europeanresidential broadband subscription forecasts. Thedemand is expressed in percentage of total num-ber of households. The figure shows a penetra-tion of nearly 25 % at the end of 2005.
4.3 Cable Modem (HFC) MarketShare Evolution
Figure 9 shows that the market share for cablemodems (HFC) starts on nearly 100 % in 1999but loses about 40 % of the market during thefirst two years. The long-term forecasts showsaturation for cable modem on a 20 % level.Even that level may be a little bit too high forWestern Europe. These forecasts contradict thelong-term forecasts from various consultantcompanies, which predict higher cable modempenetration.
4.4 Market Share Evolution for DSLFigure 10 shows that the market share evolutionof DSL reaches a turning point around 2005.Then the DSL market share is predicted to de-crease because of other competing technologies.
Figure 8 Long-termbroadband penetration
residential marketsWestern Europe
Figure 9 Predicted marketshare evolution between cable
modems (HFC) and DSL +other broadband technologies
Pen
etra
tion
(%)
70
60
50
40
30
20
10
02000
Broadband penetration Western Europe
2002 2004 2006 2008 2010
Mar
ket
shar
e (%
)
120
100
80
60
40
20
02000
Market share distribution
2002 2004 2006 2008 2010
DSL + Other BB tec
Cable modem

26 Telektronikk 2/3.2002
Separate forecasts are developed for VDSL mar-ket share evolution. The figure shows that VDSLstarts slowly in 2003, but increases rather signif-icantly and reaches 30 % penetration in 2010. Atthe same time VDSL is at the same subscriptionvolume as ADSL. Physical limitations especiallythe length of the subscriber line influences themarket potential for VDSL.
4.5 Market Share Evolution forDifferent ADSL AccessCapacities
The ADSL is divided into the following accesscapacities:
• Basic-Residential: 512/128kb• Premium-Residential: 2048/256kb• Silver-Residential: 6144/640kb
The expected market share evolution is shown inFigure 11. The figure shows that “Basic” isdominating the first years starting with nearly100 % market share in year 2001. In 2005 “Pre-mium” reaches the same level as “Basic”. Thedemand for “Silver” is expected to start around2003.
The mean downstream capacity for “Basic” isassumed to be 0.75 kb. For Premium and Silverthe respective figures are 3 Mb and 6 Mb. Basedon the assumed figures and the market share dis-tribution, the evolution in average downstreamcapacity for ADSL is described in Figure 12.The figure shows that the average downstreamcapacity is 0.75 Mb in 2001. The capacity in-creases to about 2 Mb in 2005 and about 4 Mbin 2009 for ADSL subscriptions.
4.6 Distribution Between TechnologyTo be able to predict penetrations for each tech-nology, the overall market share for each tech-nology is needed. Figure 13 shows the marketshare evolution between different technologies.
The resulting penetration forecasts for each tech-nology are given in Figure 14.
4.7 Broadband Forecasts forCountry Groups
The TONIC project has also developed seg-mented country forecasts for Europe. Require-ments for the country grouping have been tohave reasonable homogeneous country groupsand in addition mainly countries represented inthe TONIC project. The following countrygroups were selected both for the fixed and themobile network services:
• Nordic countries (Finland, Norway)• Large central European countries (France,
Germany, UK)• Southern European Countries (Greece, Portugal)
Figure 10 Market shareevolution of DSL and thedistribution between ADSLand VDSL
Figure 11 Predicted marketshare evolution for ADSLbasic, premium and silvercapacity.
Figure 12 Evolution ofpredicted average downstreamcapacity in Mb for ADSLsubscriptions
Figure 13 Market sharedistribution and prediction ofADSL, VDSL, cable modemand other broadbandtechnologies
Figure 14 Broadbandpenetration forecasts forADSL, VDSL, cable modemand other broadbandtechnologies
Mar
ket
shar
e (%
)
908070605040302010
02000
Market share DSL
2002 2004 2006 2008 2010
DSLVDSLADSL
Mar
ket
shar
e (%
)
120
100
80
60
40
20
02000 2002 2004 2006 2008 2010
ADSL BasicADSL PremiumADSL Silver
4,54,03,53,02,52,01,51,00,5
0
2001
2002
2003
2004
2005
2006
2007
2008
2009
2010
Mar
ket
shar
e (%
)
80
60
40
20
02002 2004 2006 2008 2010
Distribution between technologies
ADSLVDSLOther BB techCable modem
Pen
etra
tion
(%)
30
25
20
15
10
5
02002 2004 2006 2008 2010
Penetration each broadband technology
ADSLVDSLOther BB techCablemodem

27Telektronikk 2/3.2002
4.7.1 Nordic Countries (Finland, Norway)The Nordic country group is represented by Fin-land and Norway, since the countries are part-ners in the TONIC project. It is important tounderline that Sweden and Denmark, whichhave a rather high broadband penetration, arenot included in the presented results. The broad-band evolution in Finland and Norway is rathersimilar. The number of households in the twocountries is 2.45 mill and 2.01 mill, respectively,while GDP per capita is about 27,000 Euro and38,000 Euro. At the end of 2001 the broadbandpenetration in Finland was 3.7 % consisting of2.9 % DSL and 0.9 % Cable modem. At the endof 2001 the broadband penetration in Norwaywas 3.5 % consisting of 2.0 % DSL and 1.5 %Cable modem.
Figure 15 shows the broadband penetration fore-casts for the Nordic country group. It assumedthat saturation is lower in the Nordic countriescompared with central European countries be-cause the proportion of low density areas islarger in the Nordic countries.
The predicted market share evolution betweenbroadband technologies is shown in Figure 16.
4.7.2 Large Central European Countries(France, Germany, UK)
France, Germany and UK represent the largecentral European country group. The number ofhouseholds in the three countries is 27 mill, 38mill and 26 mill, respectively, while GDP percapita is about 27,000 Euro, 28,000 Euro and24,000 Euro. At the end of 2001 the broadbandpenetration in France was 2.6 %, consisting of2.0 % DSL and 0.6 % Cable modem. At the endof 2001 the broadband penetration in Germanywas 6.1 % consisting of 5.8 % DSL and 0.3 %cable modem.
Figure 17 shows the broadband penetration fore-casts for the large central European countrygroup. It assumes that the forecasts are close tothe European mean forecasts.
The predicted market share evolution betweenbroadband technologies is shown in Figure 18.
4.7.3 Southern European Countries(Greece, Portugal)
The Southern European country group is repre-sented by Greece and Portugal, since the coun-tries are partners in the TONIC project. Thebroadband evolution in Greece and Portugal israther low so far. The number of households inthe two countries is 3.7 mill and 5.1 mill, respec-tively, while GDP per capita is about 13,000Euro and 12,000 Euro. At the end of 2001 thebroadband penetration in Greece was 0.4 % con-sisting of 0.1 % DSL and 0.3 % cable modem.
Figure 18 Market shareevolution of broadband
technology
Figure 19 Broadbandpenetration forecasts
Figure 15 Broadbandpenetration forecasts
Figure 16 Market shareevolution of broadband
technology
Figure 17 Broadbandpenetration forecasts
Pen
etra
tion
(%)
70
60
50
40
30
20
10
02002 2004 2006 2008 2010
Broadband penetration Nordic countries
2000
Mar
ket
shar
e (%
)
90
70
50
30
10
2002 2004 2006 2008 2010
Distribution between technologies
ADSLVDSLOther BB techCable modem
Pen
etra
tion
(%)
2002 2004 2006 2008 2010
Broadband penetration Large CentralEuropean country
2000
70
60
50
40
30
20
10
0
Mar
ket
shar
e (%
)
100
80
60
40
20
02002 2004 2006 2008 2010
Distribution between technologies
ADSLVDSLOther BB techCable modem
Pen
etra
tion
(%)
2002 2004 2006 2008 2010
Broadband penetration SouthernEuropean country
2000
50
40
30
20
10
0

28 Telektronikk 2/3.2002
At the end of 2001 the broadband penetration inPortugal was 1.4 %, consisting of 0.02 % DSLand 1.4 % cable modem. Figure 19 shows thebroadband penetration forecasts for the SouthernEuropean country group. The figure shows thatthe evolution is more defensive compared withCentral European and Nordic countries.
The predicted market share evolution betweenbroadband technologies is shown in Figure 20.
5 Forecasting Models Used forMobile Forecasts in TONIC
Demand forecasts for different mobile technolo-gies for Western European countries are pre-sented. The forecasts are established for threedifferent groups of Western European countries.The countries in each group are similar withrespect to GDP per capita, GSM penetrationtoday, and forecasted UMTS penetration in2007. Specific forecasts are developed for eachcountry group.
In particular, after formulating projections ontotal mobile subscriber penetration, we makeforecasts for the different penetration rates forthe following mobile system “generations”:
• 2G – digital mobile systems such as GSM• 2.5 G – HSCSD, GPRS, EDGE• 3G – UMTS• 3.5G – ubiquitous roaming among 3G and
WLAN4) systems
It is assumed that a “higher” mobile subscriptionhas interworking access to “lower” mobile sub-
scriptions. 3G have for example possibilities tointerwork with 2G and 2.5G. The system genera-tion 3.5G is in fact an UMTS subscription whichalso has WLAN possibilities. The TONIC Pro-ject has developed a set of forecasting modelsbased on extracted external information and onmembers’ expertise for the establishment ofbasic assumptions. The results of this work areinputs to the forecasting models.
The demand models and tariff predictions serveas important input to business cases I and II.
5.1 Data Sources and ModellingInformation has been collected from differentconsultancy reports. The three most importantreports are from Strategy Analytics [24],Analysys [25] and OVUM [26]. In addition theTONIC project partners have collected up-to-date information about mobile penetration,demographic data and ARPU levels.
As for the fixed network, a four parameter logis-tic model has been applied to the forecasts. Thesaturation level in the model has been estimatedbased on the number of mobile subscribers andsubscriptions. The other parameters in the modelare estimated based on historical data and alsosome expert evaluations.
5.2 Western European Mobile MarketForecast
The statistics show that the 2G subscribers haveincreased from about 15 % to 70 % during theperiod 1997 – 2001. One important driver thelast years is the prepaid subscriptions, whichconstitute a significant part. Based on evaluationfrom the TONIC project and external consultantreports, assumptions of average mobile penetra-tion for Western Europe are assumed, see Table 2.
A four parameter Logistic model is used to gen-erate penetration rates from 1997 to 2010, asshown in Figure 21.
The total subscriber penetration in WesternEurope is split into four mobile system genera-tions, namely 2G, 2.5G, 3G and 3.5G. Assump-tions about the relative market share for each ofthe systems were discussed and adopted. Weassume that the share of 2G is decreasing to 2 %in 2010, while the respective shares at that timewill be 28 % for 2.5G, 37 % for 3G and 33 % for3.5G. Our assumptions for 3G taking off in 2003are based on the fact that the initial horizon ofearly 2002 today appears ambitious, and mostoperators admit to at least a 6–12 months’ delay.
Figure 20 Market shareevolution of broadbandtechnology
Mar
ket
shar
e (%
)
100
80
60
40
20
02002 2004 2006 2008 2010
Distribution between technologies
ADSLVDSLOther BB techCable modem
Penetration/year 2005 2010 Saturation
Subscribers 81 90 95
Subscriptions 100 120 130
Table 2 Subscriptions andsubscribers assumption formobile penetration in Western Europe
4) Based on the technical architecture developed within the IST-MIND project (WLAN is Hiperlan2).

29Telektronikk 2/3.2002
Based on the assumptions for the evolution ofthe total subscriber penetration combined withthe assumptions regarding each of the mobilesystems, we have calculated the penetration fore-cast for the four different mobile generations.These penetrations are shown in Figure 23.
We can see that the predicted subscriber penetra-tion levels for 2G and 2.5G systems are equal inyear 2004/2005. 3G subscriber penetration is3 % in 2003, increasing to about 33 % in 2010.3.5G subscriber penetration will reach almost30 % in 2010.
Figure 24 shows subscription penetration for dif-ferent mobile systems based on assumptions inTable 1 and the evolution of market shares givenin Table 2. It is assumed that mobile subscriberswill have more than one mobile subscription.
We see that total mobile subscription penetrationwill reach 120 % in 2010. 2.5G subscriptionswill reach almost 40 % in 2010. 3G subscriptionpenetration is almost 4 % in 2003, increasing to40 % in 2010. 3.5G subscriptions will increasefrom 1 % in 2005 to nearly 40 % in 2010.
5.3 European Public WLAN Accessin Hot-Spot Areas
The number of hot-spot locations that will beWLAN-enabled is one of the critical uncertain-ties for the 3.5G subscriber forecasts. Analysyshave based their forecasts on the assumption thatproperty owners will react positively to the ser-vice propositions currently being in place byoperators and that roaming arrangements be-tween public WLAN operators will emerge from2002 onwards. Analysys have estimated the roll-out in hot spots by considering the number of po-tential locations by type illustrated in Figure 25.
If these assumptions are correct, the number ofhot spots with WLAN access will reach over90,000 locations across Europe by 2006. Figure25 shows that the overall value of the market islikely to be highly sensitive to the ability of ser-vice providers to persuade the owners of cafés,restaurants and hotels to host public WLAN ser-vices.
5.4 Mobile Forecast for EachCountry Group
5.4.1 Nordic Countries The Nordic country group is represented by Fin-land and Norway.
The mobile evolution in Finland and Norway israther similar. For a long time Finland has beenthe country with the highest mobile penetration.In the same period Norway has been among thetop three. Because of heavy sale of prepaid
Figure 21 Mobile subscriberpenetration forecasts for
Western Europe
Figure 22 Shares of differentmobile systems for Western
Europe
Figure 23 Subscriberpenetration forecasts for
different mobile systems forWestern Europe
Figure 24 Subscriptionpenetration forecasts for
different mobile systems forWestern Europe
Figure 25 Public WLANaccess locations, by type oflocation (source: Analysys)
Pen
etra
tion
(%)
2002 2004 2006 2008 2010
Total mobile penetration forecasts
2000
100
80
60
40
20
01998
Mar
ket
shar
e (%
)
120
100
80
60
40
20
0
Mobile market share evolution
2002 2004 2006 2008 201020001998
2G2.5G3G3.5G
Pen
etra
tion
(%)
70
60
50
40
30
20
10
0
Evolution of system generations
2002 2004 2006 2008 201020001998
2G2.5G3G3.5G
Pen
etra
tion
(%)
140
120
100
80
60
40
20
0
Mobile subscription penetration
2002 2004 2006 2008 2010
2G2.5G3G3.5GSum
100000
80000
60000
40000
20000
02002 2003 2004 2005 2006
Major corporate buildingsPublic buildingsCafes and restaurantsConferance FacilitiesTrain stationsAirportsHotels
2001

30 Telektronikk 2/3.2002
mobile card the mobile penetration starts to bemore even in several European countries.
The number of inhabitants in the two countries is5.16 mill and 4.45 mill, respectively, while GDPper capita is about 27,000 Euro and 38,000 Euro.At the end of 2001 the mobile penetration was80 % in both Finland and Norway.
Figure 26 shows the market share evolution ofmobile system generations for Nordic countries.
Figure 27 shows that the 2G penetrations in2010 is 0 %, while 2.5G are 25 % and 3.5G is37 %. The market share is multiplied by the totalmobile penetration forecasts for the Nordiccountries.
5.4.2 Large Central European Country(France, Germany and UK)
France, Germany and UK represent the largeCentral European country group. The number ofinhabitants in the three countries is 59 mill., 82mill., and 59 mill., respectively, while GDP percapita is about 27,000 Euro, 28,000 Euro and24,000 Euro. At the end of 2001 the mobile pen-etration was 58 % in France, 67 % in Germanyand about 75 % in the UK. It is assumed that themobile evolution for the large Central Europeancountries is close to the evolution for WesternEurope.
Figure 28 shows the market share evolution ofmobile system generations for large CentralEuropean countries. The figure shows that the2G penetrations in 2010 is 0 %, while 2.5G is30 % and 3.5G is 33 %. The market share ismultiplied by the total mobile penetration fore-casts for the Nordic countries. The results areshown in Figure 29.
5.4.3 Southern European Country(Portugal and Greece)
The Southern European country group is repre-sented by Greece and Portugal. The mobile evo-lution in Greece and Portugal has increased verysignificantly during recent years. At the end of2001 the mobile penetration was 70 % in Greeceand 79 % in Portugal. The number of inhabitantsin the two countries is 10.9 mill and 10.4 mill,respectively, while GDP per capita is about27,000 Euro and 38,000 Euro.
Figure 30 shows the market share evolution ofmobile system generations for the SouthernEuropean country group.
Figure 31 shows that the 2G penetrations in2010 is 5 %, while 2.5G is 33 % and 3.5G is25 %. The market share is multiplied by the totalmobile penetration forecasts for the SouthernEuropean country group. The results are shownin Figure 31.
Figure 26 Market shareevolution of mobile systemgenerations
Figure 27 Mobile penetrationforecasts for the Nordiccountry group
Figure 28 Market shareevolution of mobile systemgenerations
Figure 29 Mobile penetrationforecasts
Figure 30 Market shareevolution of mobile systemsgenerations
Mar
ket
shar
e (%
)
120
100
80
60
40
20
0
Market share evolution
2002 2004 2006 2008 2010
2G2.5G3G3.5G
20001998
Pen
etra
tion
(%)
100
80
60
40
20
0
Mobile user penetration forecasts
2002 2004 2006 2008 201020011998
2G2.5G3G3.5GSum
Mar
ket
shar
e (%
)
120
100
80
60
40
20
0
Market share evolution
2002 2004 2006 2008 201020001998
2G2.5G3G3.5G
Pen
etra
tion
(%)
100
80
60
40
20
0
Mobile user penetration forecasts
2002 2004 2006 2008 201020011998
2G2.5G3G3.5GSum
Mar
ket
shar
e (%
)
120
100
80
60
40
20
0
Market share evolution
2002 2004 2006 2008 201020001998
2G2.5G3G3.5G

31Telektronikk 2/3.2002
6 ConclusionsAn overview of broadband forecasting modelsused during the last eight years in a portfolio oftechno-economic projects supported by theEuropean Commission has been presented.The forecasts have mainly been based on expertsurveys, especially Delphi surveys, before thebroadband services were offered. Also diffusionmodels are used based on results from Delphisurveys and historical demand data. Table 3gives a comparison of broadband penetrationforecasts for Western Europe in 2005. The tableshows that the forecasts are mainly on the samelevel. One exception is the forecasts done in1994. However, at that time much higher annualtariffs on broadband were expected compared towhat we see today. The main conclusion is thatthe long term forecasting models used seem togive rather good results. If the flat rate tariffregime is changed during the next years becauseof heavy traffic in the core network, it may bepossible that a level of 20 % penetration will bemore probable for year 2005.
The paper presents a methodology to forecastbroadband penetration based on migrationbetween the competing broadband technologiesADSL, VDSL, HFC (cable modem) and fixedwireless broadband.
The TONIC forecasts show that DSL accesstechnology within a short time will be the domi-nating technology in Europe. The situation inEurope is different from North America whereforecasts show that cable modem technologybased on HFC during the next years will stillhave more than 50 % of the market. Fixed wire-less broadband access based on technologieslike LMDS are for the moment rather expensive.
Demand forecasts for different mobile technolo-gies for Western European countries are pre-sented. The forecasts are established for threedifferent groups of Western European countries.The following mobile system “generations” havebeen considered:
• 2G – digital mobile systems such as GSM• 2.5 G – HSCSD, GPRS, EDGE• 3G – UMTS• 3.5G – ubiquitous roaming among 3G and
WLAN5) systems
The predicted Western European subscriber pen-etration levels for 2G and 2.5G systems areequal in year 2004/2005. 3G-subscriber penetra-tion is 3 % in 2003, increasing to about 33 % in2010. WLAN subscriber penetration is predictedto reach almost 30 % in 2010.
7 References1 Stordahl, K et al. Traffic forecasting models
for the transport network. In: Proc. 10thInternational Telecommunication networkStrategy and Planning Symposium, Munich,Germany, 23–27 June, 2002.
2 Stordahl, K, Elnegaard, N K, Olsen, B T.Broadband access rollout strategies in acompetitive environment. In: Proc. OpticalHybrid Access Network/Full Service AccessNetwork workshop, Yokohama, Japan, April4–6, 2001.
3 Stordahl, K, Elnegaard, N K. Battle betweencable operator and incumbent: OptimalADSL/VDSL rollout for the incumbent. In:Proc. XIV International Symposium on Ser-vices in the Local access – ISSLS 2002,Seoul, Korea, April 14–18, 2002.
4 Stordahl, K et al. Delphi survey: Forecastingdemand for wide- and broadband services.From Race 2087/TITAN. In: Proc 6th inter-national workshop on optical access net-work, Kyoto, Japan, October 16–19, 1994.
5 Stordahl, K, Murphy, E. Forecasting longterm demand for wide- and broadband ser-vices in the residential market. IEEE ofComminications, 2, 1995.
6 Stordahl, K, Olsen, B T. Demand Elasticityand Forecasts of Wide and Broadband Ser-vices in the Residential Market Based onResults from an International Delphi Survey.
Figure 31 Mobile penetrationforecasts for the SouthernEuropean country group
Penetration
TITAN forecasts (Delphi survey, 1994) 11.3 %
OPTIMUM forecasts (Delphi survey, 1997) 20.5 %
TERA forecasts (Diffusion models, 2000) 20.5 %
TONIC forecasts (Diffusion models, 2002) 24.9 %
Table 3 Broadbandpenetration forecasts, Western Europe 2005
Pen
etra
tion
(%)
100
80
60
40
20
0
Mobile user penetration forecasts
2002 2004 2006 2008 201020011998
2G2.5G3G3.5GSum
5) Based on the technical architecture developed within the IST-MIND project (WLAN is Hiperlan2).

32 Telektronikk 2/3.2002
1995 International Communications Fore-casting Conference, Toronto, Canada, June13–16, 1995.
7 Ims, L A (ed). Broadband Access networks:Introduction Strategies and Techno-eco-nomic Evaluation. London, Chapman &Hall, 1998. (ISBN 0 412 82820 0.)
8 Stordahl, K. Forecasting long term demandfor broadband services. In: Proc. Marketforecasts in the telecoms industry. Instituteof International Research (IIR), Hong Kong,May 25–27, 1998.
9 Stordahl, K, Ims, L A, Olsen, B T. Riskanalysis of residential broadband upgradesbased on market evolution and competition.In: Proc. Supercom ICC ’98, Atlanta, June7–11, 1998.
10 Stordahl K, Rand, L. Long term forecasts forbroadband demand. Telektronikk, 95 (2/3),34–44, 1999.
11 Stordahl, K. Case studies on broadbandaccess: Market risk analysis for fiber roll-out. SAS session, Investment in telecommu-nication networks: Techno-economics ofmultimedia services and networks. ICC2000, New Orleans, USA, June 18–22, 2000.
12 Stordahl, K et al. Broadband upgrading andthe risk of lost market shares under increas-ing competition. In: Proc. ISSLS 2000,Stockholm, Sweden, 19–23 June 2000.
13 Stordahl, K, Ims, L A, Moe, M. Forecasts ofbroadband market evolution in Europe. In:Proc. ITS 2000, Buenos Aires, Argentina,July 2–5, 2000.
14 Stordahl, K. Broadband market evolution –demand forecasting and tariffs. SAS session,Investment in telecommunication networks:Techno-economic methodologies and casestudies. ICC 2000, New Orleans, June18–22, 2000.
15 Elnegaard, N K, Stordahl, K, Ims, L A. Roll-Out Strategies for the Copper Access Net-work: Evolution towards a Full ServiceAccess Network. In: Proc. ISSLS 2000,Stockholm, Sweden, 19–23 June 2000.
16 Stordahl, K, Moe, M, Ims, L A. Broadbandmarket – The driver for network evolution.In: Proc. Networks 2000, Toronto, Canada,September 10–16, 2000.
17 Stordahl K, Elnegaard, N K. Broadbandmarket evolution in Europe and the upgraderisks. 2000 International CommunicationsForecasting Conference, Seattle, USA,September 26–29, 2000.
18 Jupiter. Overcoming local-loop broadbandchallenges. 2001.
19 Strategy Analytics. Residential Broadband.2001.
20 Access OVUM. October 2001.
21 Elnegaard, N K, Stordahl, K. Broadbandrollout strategies. In: Proc. 17th EuropeanNetwork Planning Workshop, Les Arcs,France, March 19–23, 2001.
22 Stordahl, K, Kalhagen, K O. Broadbanddemand modelling. In: Proc. 4th Workshopon Telecommunications Techno-Economics,Rennes, France, May 14–15, 2002.
23 Stordahl, K, Kalhagen, K O, Olsen, B T.Access Technology Demand in Europe.ICFC 2002, San Francisco, USA, 25–28June 2002.
24 Strategy Analytics. Western European Cel-lular Market Forecast 2001 – 2006. 2001.
25 Analysys. Public Wireless LAN access: Mar-ket forecasts. 2001.
26 OVUM. Global Wireless market forecast2002 – 2006. 2002.

13
1 IntroductionIn 2004 the Norwegian Government gave the follow-ing statement on broadband:
The Government looks at deployment of the broad-band network as establishment of a national infra-structure, which during the coming years will be asimportant for evolution of modern Norway as thetelephone network, power line network, railwaynetwork, roads, water and sewage network earlierhave been for the Norwegian Society.
The same statement applies also to other countries.The broadband network provides new possibilitiesand advantages for the business and public sector bygiving access to an advanced high capacity electronicinfrastructure. The technology and the network willbe a fundament for application of information tech-nology, for innovation, rationalisation and valuecreation. In addition broadband will change the be-haviour of households in the private sector signifi-cantly over the next years.
The broadband network is the last step of the evolu-tionary part of the telecommunication network start-ing with telegraph, telephone, telex, fax, low capacitydata network (packet and circuit switched), Nordicmobile systems, GSM, GPRS, Internet and leasedlines.
The broadband networks in North America and West-ern Europe were mainly established just before 2000.During the first two years the HFC technologywas dominant in both areas, but in most countriesof Western Europe, DSL has now taken over as theleading technology.
Still there are many challenges for rolling out broad-band. A lot of different broadband technologies areavailable. In most countries a lot of competitors areinvolved in the market. Regulatory bodies haveopened the broadband market by introduction ofLocal Loop Unbundling (LLU) giving other operators
the possibility to lease the incumbent’s copper pair.Nowadays the regulatory bodies examine the marketto check if the incumbent has Significant MarketPower (SMP) and will in that case use some regulat-ing tools to reduce the incumbent’s market position.The main actors in the broadband market are: incum-bents, operators owning different types of infrastruc-ture (fibre, radio, twisted copper), virtual operators,energy companies, wholesalers, Internet ServiceProviders (ISP), service providers, manufactures,vendors.
To be able to make the right decisions in this verydynamic market, it is vital to make broadband fore-casts. This paper concentrates on long-term broad-band forecasts, which are used for project invest-ments and investments for establishment of broad-band technology platforms.
During a period of 12 years (1992 – 2004) long-termforecasts have been developed as part of techno-eco-nomic broadband assessments for analysing variousbroadband technologies through the European pro-grams RACE, ACTS and IST, by the projects RACE2087/TITAN, AC 226/OPTIMUM, AC364/TERAand IST-2000-25172 TONIC financed by the Euro-pean Commission. This paper documents broadbandforecast modelling performed by the CELTIC projectEcosys.
2 Making long-term broadbandforecasts
10 – 20 years ago it was much more straightfowardto make forecasts in the telecom market. In Europe,it was limited competition and the incumbents werecontrolling the market. There were only a few ser-vices available and a limited number of technologiesand networks, and the telecommunication demandtime series were rather stable and regular. At thattime it was easier to apply advanced economic andmathematical/statistical models for long-term fore-casts.
Long-term broadband technology forecastingK J E L L S T O R D A H L
Kjell Stordahl is
Senior Advisor in
Telenor Networks
Telektronikk 4.2004
The paper gives an overview of the relevant broadband technologies, describes their market positions
and possibilities. Diffusion models are used to make long-term broadband forecasts for the Western
European residential market. The forecasts are separated for the main broadband technologies ADSL,
ADSL2+/VDSL, Cable modem and other technologies (FTTx, BWA) based on market share predictions
for each technology. The long-term forecasts are evaluated and compared with other broadband
forecasts for the Western European market.

14 Telektronikk 4.2004
This paper will describe the methods developed toforecast the long-term demand for broadband access.In order to make the forecasts, it is necessary to havean overview of the relevant broadband technologiesand understand the strengths and weaknesses of eachtechnology. The paper gives an overview of alterna-tive technologies and shows the variety and the com-plexity of technologies.
It is of course important to sample the historical evo-lution of the demand for each technology and analysethe data. However, when long-term forecasts aremodelled, it is also important to have a good under-standing of the abilities of each new technology. Thepaper shows that techno-economic analysis of the rel-evant technologies is crucial for evaluating the long-term potential of the technologies. In ([2], [10], [17],[19], [22], [27], [28]) techno-economic analysis ofbroadband technologies is a substantial part of theforecast modelling.
An important part of the techno-economic analysis isthe forecasting models for cost predictions of networkcomponents and technologies [1].
The position of the dominating broadband technolo-gies is influenced by the supply side because massproduction generates low production costs and lowtariffs for the subscribers for having a useful businesscase. The rollout and coverage of the various tech-nologies are also of great importance. Finally, the restmarket, which cannot be covered by the dominatingtechnologies, gives possibilities for alternative tech-nologies.
3 Broadband technologiesIn the early 1990s the following capacity classifica-tions were recommended:
• Narrowband: [ – 128 kb/s]• Wideband: < 128 kb/s – 2 Mb/s>• Broadband: [2 Mb/s – ]
However, the concept wideband has disappeared andbroadband is now defined as capacities larger thanISDN. During the last few years a lot of new broad-band technologies have been developed. Figure 3.1gives an overview of various broadband technologies.
The first platform for mobile communications wasestablished when the Nordic countries in 1980 intro-duced the Nordic Mobile Telephone System (NMT).In 1993, the second generation (2G) mobile system,GSM, was established in Europe. Later, GPRS withthe possibility for data communication was intro-duced, and recently an enhancement of GPRS –EDGE – offering even larger access capacity.Recently the third generation mobile system (3G),UMTS – WCDMA, has started the rollout in manycountries opening for much higher bandwidth in theaccess. It is well known that license auctions in manycountries of Western Europe generated extremelyhigh costs for many mobile operators. The Nordiccountries held a “beauty contest” and managed tokeep the license fees on a normal level. New mobiletechnologies with considerably higher capacity arebeing developed. One of them, the High SpeedDownlink Packet Access (HSDPA) is a relevantfuture mobile technology.
Figure 3.1 Different broadband technologies
Powerline
modems
ADSL2+SHDSL
IMUX
DSM
ADSL
FTTC
FTTNFTTB
BPON
LMDS
Wi-Max
HFC
APON
PON
Cable modemADSL2
FTTH
Iridium
Fibre GB Ethernet
Teledesic
LEO
FSAN
UMTS
DTH
DTT
Globalstar
EDGE
GPRSGSM
ATM IPSDH
ISDN
NxISDN
GEO
MEO
WLAN 4G
VDSL
Skystation
HALO
Wi-Fi

15Telektronikk 4.2004
Parallel to the mobile and fixed network broadbandevolution, new technologies have been developed fornomadic applications. WLAN has been introduced ona lot of hot spots, like gas stations, airports, railwaystations, hotels, cafés, bars, restaurants, etc. In addi-tion new technologies for fixed broadband radiotransmission like WiFi, WiMax are under way. Thehot spots are also called IP zones since they use theIP network as a backbone network for the broadbandtraffic.
Local Multipoint Distribution System (LMDS), WiFiand WiMax are fixed wireless broadband accesssystems for the fixed network. LMDS was alreadyfour years ago a promising broadband technology.However, the system did not succeed, because oftoo expensive components and too low productionvolumes. The new fixed wireless broadband accesssystems (WiFi and WiMax) are now in a similar posi-tion. Especially WiMax has the possibility either togive high capacity or to have a long reach. The sys-tem may be an interesting technology in areasnot covered by DSL technology.
The Direct To the Home satellite solution (DTH) alsogive possibilities for broadband communication.However, the number of satellites and the transpon-der capacity are limited. In addition, the signals inter-face and return unit are too expensive for the residen-tial market. Hence, the potential for the systems willbe part of the business market, which so far is notcovered by cheaper broadband technologies.
The Digital Terrestrial Television network (DTT)constitutes a broadband alternative. The local tele-vision masts can be used for downlink broadbandtransmission. In Norway, Bømlo has been establishedas a pilot area for the system. The downlink is usinga dedicated frequency on the DTT system while thereturn channel is ISDN or GPRS on the mobile.Within some time a dedicated frequency on the DTTfor the return channel will be specified.
Another business concept was the balloon sky station.The plan was to place balloons in the air to coverlarge populated areas. The capacity would be rela-tively higher than for satellites, but the maintenancecost is large and uncertain.
Another interesting broadband technology is thepower line technology (PLC). The concept of trans-mitting broadband signals through the power lineshas high revenue potential, especially for the powerline companies. So far the technology has generatedtoo high radiation effects, and specific improvementsare necessary to have a new competitive broadbandtechnology. The European Commission is now sup-
porting the PLC technology, trying to generate heav-ier competition in the European broadband market.However, there are still uncertainties regarding thefuture radiation effect of these systems.
Countries like Norway and Germany have a veryhigh ISDN penetration, Norway probably the highestISDN penetration in the whole world. The ISDN net-work has the possibility to transfer broadband traffic.Telenor introduced in 2004 the service NxISDN withthe possibility to use more than one twisted copperpair. The service called SMAKS offers up to 256 kb/sas a flat rate service (no traffic charge), which covers100 % of Norway. The service is offered only in thebusiness market, since the monthly tariff is ratherhigh.
Because of increased capacity demand, an extensivepart of the transport networks in Europe are coveredby fibre. Fibre is also deployed in some parts of theaccess network. In many access areas fibre rings withservice connection points have substituted parts of theconventional copper tree structure. New operators areentering the broadband market and deploy their ownfibre infrastructure in parallel with the incumbent.Some operators have installed Fibre To The Home(FTTH) and Fibre To The Building (FTTB) with in-house Ethernet solutions. Especially in Sweden,FTTB have been deployed extensively to large build-ing complexes. FTTH – fibre to individual houses ismuch more expensive, because of digging and civilwork expenses. The solutions offer the triple playconcept for TV, Internet and telephony at the sametime. So far the fibre technology has potential to catch
Figure 3.2 Physical network structures for some important broadbandservices
BAP
0 km
DTT
VDSLLAP
BSP
FTTB
ca 35 km
3 km
1 km
ISP
LAP
DTT
LLAPAPLAP
ISDN/ADSL
LLAPAPLAP
LMDS

16 Telektronikk 4.2004
medium and large size companies, which alreadyneed high broadband capacity. Further, the FTTB isa competing broadband technology in dense accessareas where fibre is deployed to large building com-plexes. Another technology is Fibre To The Curb(FTTC) where fibre is deployed deeper in the accessnetwork. The deployment strategy for green fieldareas is usually to deploy tubes with the possibilityto install fibre for future demand for both the businessand the residential market. The fibre solutions will beeven more competitive in the future with significantlyincreasing capacity demand.
The Passive Optical Network (PON) solutions do notoffer a subscriber access, but represent alternativebroadband technology for transmitting the traffic inthe access network. In the future also Coarse WDM(CWDM) systems can be used in the same way.
The Hybrid Fibre Coax (HFC) system, also denotedcable modem, was the first real broadband technol-ogy to be established in the residential market. Thetechnology is still the dominating one in North Amer-ica but has lost its position to the DSL technology inEurope. The system uses parts of the traditional cabletelevision network by splitting the network into sepa-rate small islands with cable tree structure, which areconnected with a fibre droop from the head end to theseparate coax islands. A return channel is also estab-lished.
Finally, the Digital Subscriber Line (DSL) utilisingthe traditional twisted pair, is the broadband technol-ogy with the highest market share on a worldwidescale. There is a set of different DSL technologieswhich are continuously evolving. There are someimportant factors to bear in mind regarding the DSLtechnology:
1 The broadband access could be symmetric(SHDSL) or asymmetric (ADSL)
2 The access capacity decreases with the length ofthe subscriber line
3 The access capacity increases with the copperdiameter
4 The signal to noise proportion increases with theelectrical power on the suscriber line
5 New coding is used to improve the signal to noiseproportion. The system is called rate adaptivesystem or READSL
6 The access capacity or the subscriber line lengthcan be increased by doubling the frequency (from
1.1 MHz to 2.2 MHz). The new technology iscalled ADSL2+.
7 Further increase of the frequency is utilised withVDSL and long range VDSL.
8 ITU develops recommendations for frequencyplans for the various DSL technologies to mini-mize the noise and cross talk on the copperbundles.
9 New electrical power plans for dedicated copperlines improve the capacity and line length of theother copper lines in the bundle.
10 Dynamic Spectrum Management (DSM) is ex-pected to offer a significant performance improve-ment of the DSL technology. The system is basedon establishment of a control centre, whichdynamically allocates spectrum sizes to eachcopper line depending on the signal to noise pro-portion. See the paper in this journal “DynamicSpectrum management – a methodology for pro-viding significantly higher broadband capacityto the users” [6].
11 Usually both households and businesses have aset of twisted pairs as broadband connection. Itis possible to use more than one twisted pair byusing the concept of wire bonding in order toincrease both capacity and line length for thecustomer.
Figure 3.3 illustrates the possibilities with differentDSL technology.
In [7] in this journal there is a comprehensivedescription of the evolution towards the next broad-band network platform. The paper addresses majortrends and technology development in networking,which is of crucial importance for making goodbroadband technology forecasts.
So far the DSL technologies for the residential mar-ket are dived into two main groups regarding down-stream capacity:
• ADSL class• ADSL2+/VDSL class
It is assumed that ADSL has a downstream capacityof up to 8 Mb/s with ADSL2+/VDSL from 10 Mb/supward. A new procedure is now going to be imple-mented. It is called dynamic bandwidth control giv-ing the subscriber the possibility to choose the neededbandwidth at the right time. Anyhow, it is important

17Telektronikk 4.2004
to plan the demand for low and high access capacitywhen the broadband network is dimensioned.
The most important broadband technologies are:
• ADSL• ADSL2+/VDSL• HFC (Cable modem)• FTTH/FTTB• WLAN/WiFi/WiMax
In this paper it is assumed that broadband traffic onmobile terminals and fixed network PCs mainly com-plement each other. In addition it is assumed thatfixed wireless broadband access systems are relevantalternatives for covering sparsely populated areas andalso supplements for nomadic movements.
The ability and the possibilities of the different tech-nologies have been analysed in [23], [29], [33], [34],[35], [38].
4 Broadband rolloutThe broadband rollout has a crucial impact on thebroadband penetration. To be able to evaluate thepenetration, we need to know the broadband cover-age of the country. Suppose that the rollout at time tgives the broadband coverage Ct , and that the pene-tration at that time is Pt . Take rate is the proportionbetween demand and coverage in an area. A Countryconsists of a set of areas where broadband is rolledout and a set of areas without any broadband avail-ability. Let the take rate at time t be Tt . Then
Pt = Tt Ct
The above equation tells us that the penetrationdepends on the broadband take rate, which reflectsthe genuine demand based on the broadband applica-tion availability, the broadband tariffs, the servicequality, etc. This is commented on in more detail laterin this paper. In addition the penetration is dependenton broadband coverage.
The same relation is valid not only for the totalbroadband penetration, but also for the penetration ofdifferent broadband technologies. Figure 4.1 showsthe European mean coverage for DSL and HFC(Cable modem) respectively, distributed on urban,suburban and rural areas.
The areas are defined as:
• Urban areas: areas with population densitygreater than 500 inhabitants/km2
• Suburban areas: areas with population densitybetween 100 and 500 inhabi-tants/km2
• Rural areas: areas with population densityless than 100 inhabitants/km2
The figure shows that the DSL coverage in Europeis much higher than the HFC coverage, which alsoreflects the penetrations of the two most dominatingtechnologies in Europe.
The figure also shows that HFC has a limited cover-age in sparsely populated areas. The reason is theoriginal coverage of cable TV networks in Europe.The cable television networks were mainly deployedin dense areas, because deployment in urban areaswas rarely cost-effective. Hence, there are definitelimitations of the potential for HFC in Europebecause of cable TV coverage. Techno-economic
Figure 3.3 Downstream capacity and line length possibilities forvarious DSL technologies
Figure 4.1 DSL and Cable modem coverage in urban, suburban andrural areas in Western Europe (EC: Connecting Europe at High Speed:National Broadband Strategies Dec 2003[13], IDATE)
Mb
ps
(Do
wn
stre
am
)
22
14
12
10
8
6
4
16
20
18
22
1 2 3 4 5 6Distance (km)
VDSL
Masked
ADSL2+
ADSL2+
ADSL
0
20
40
60
80
100
National Urban Suburban Rural
Pe
rce
nta
ge
of
the
po
pu
lati
on
co
vere
d

18 Telektronikk 4.2004
calculations show that further expansion of cable TVnetworks is not a good business case. One importantreason is the possibility for the households to buysmall dishes and subscribe via a DTH satellite opera-tor like Viasat or Canal Digital instead of connectingan expensive expansion of a cable TV network.Therefore, the expansion of the HFC coverage willonly be performed by upgrading the established cableTV infrastructure to two-way broadband and not byexpanding the original network.
A conclusion is that the rollout plans and the rolloutpossibilities for different broadband technologies areimportant factors for future broadband coverage andfor the broadband penetration forecasts.
5 The broadband rest marketThe European Commission and also Governments inthe European countries are following the broadbanddeployment very closely. The reasons are all the ben-efits broadband communication and the broadbandnetwork create for society. Broadband supports theICT evolution and generates innovation, rationalisa-tion, new working possibilities and additional valuefor households and companies. Therefore, the Com-mission and the national Governments support thebroadband deployment and also give economic assis-tance and advice for rolling out the broadband net-work. In countries like Sweden and Canada, the Gov-ernments have given substantial economic support tothe broadband deployment. Other countries rely ona more market driven broadband rollout where theactors and operators take care of the deployment. Atthis stage of the rollout part of the traditional marketand the rest market are the last parts to be covered.
The broadband rest market in European terms is usu-ally defined as the coverage which cannot be realisedcost efficiently by the DSL technology. This is a dif-ficult issue, since the size of the rest market continu-ously changes because of improvements of the DSLtechnology. 2 – 3 years ago the rest market was arather significant part. In Norway the size of the restmarket at that time was estimated to be about 25 %.However, mini DSLAMs (very small DSLAMs) weredeveloped, reducing the rest market significantly.Further improvement of the DSL technology isexpected, which will limit the rest market even more.
The DSL rest market is limited by the size of theaccess area and also by the length of the copper line.The number of subscribers in an access area mustexceed a limit in order to get a DSLAM in the area.In addition, the line length must not exceed a givenlength in order to offer a subscriber a DSL access.
More extensive analysis of broadband technologiesand rollout in rural areas and in the rest market isfound in [13], [16], [26], [36].
Where DSL technology is not relevant, other broad-band technologies will be installed to offer broadbandin the rest market. Relevant technologies are:
• WiFi• WiMAX• DTT (digital terrestrial television network)
6 Techno-economic assessmentsThe long-term broadband forecasts are based onresults from techno-economic calculations.
The techno-economic calculations evaluate the “eco-nomic value”, i.e. expressed by net present value orpay back period of rollout of different broadbandtechnologies. The assessments have been carried outfor rollout on a national level and on specific areaslike urban, suburban, rural and especially the restmarket to examine the potential of the differentbroadband technologies.
The main results from the techno-economic calcula-tions show that it is difficult for new broadband tech-nologies to capture significant market share in areaswhere cable modem and/or DSL are alreadydeployed. The reason is low subscription prices forthe established technologies, which is explained bylarge mass production on a worldwide basis.
The potential for the upcoming technologies will bein market segments which are sparsely populated andnot covered by cable modem or DSL. Even expensivewireless broadband access systems may be offered tothe business market in these areas.
There is a close link between techno-economic cal-culations and the broadband forecasts. To be ableto perform the techno-economic calculations, it isimportant to use the forecasts as input. An evaluationof the technologies is then carried out. The next stepis to adjust the forecasts for different technologiesand perform new techno-economic calculations. Thisprocess is continued until the results are quite stable.
To be able to carry out these calculations, a veryadvanced techno-economic tool is needed.
Within the European programs RACE, ACTS andIST, the projects RACE 2087/TITAN, AC 226/OPTI-MUM, AC364/TERA and IST-2000-25172 TONIChave in the 1992 – 2003 period, developed a method-ology and a tool for calculating the overall financial

19Telektronikk 4.2004
budget of any access architecture. The tool handlesthe discount system costs, operations, maintenancecosts, life cycle costs, net present value (NPV) andinternal rate of return (IRR). The tool has the abilityto combine low level, detailed network parameters ofsignificant strategic relevance with high level, overallstrategic parameters for performing evaluation of var-ious network architectures. In [43] are found moredetailed descriptions of techno-economic modellingand the tool.
Telecommunication demand forecasts are input tothe tool and to the techno-economic calculations. TheTonic tool is widely used to analyse economic conse-quences of implementing new network platforms.Important parts of the tool are:
• Service definitions• Subscription and traffic forecasts• Service tariff predictions• Revenue model• A topology model mapping geographic areas with
given penetrations into the tool• Network component cost data base including
more than 300 network components• Network component cost prediction model• Investment model• Operation and maintenance model• Model for economic calculations• Risk analysis model
The following steps are needed in the techno-eco-nomic evaluations of the network solutions:
The services to be provided must be specified. Themarket penetration of these services over the studyperiod will be defined. The services have associatedtariffs. From the combination of yearly marketdemand forecasts and ARPU predictions the toolcalculates the revenues for each year for the selectedservice set.
Next, the architecture scenarios to provide theselected service set must be defined. This requiresnetwork planning expertise for design of the networkand the relevant network components. However, thetool includes several geometric models facilitatingthe network planning by automatically calculatinglengths of cables and ducting. These geometric mod-els are optional parts of the methodology and thetechno-economic tool can be used without them. Theresult of the architecture scenario is a so-called shop-ping list. This list contains the volumes of all networkcost elements (equipment, cables, cabinets, ducting,installation etc.) for each year of the study period andthe location of these network components in differentflexibility points and link levels.
The costs of the network components are calculatedusing an integrated cost database containing datagathered from many European sources. Architecturescenarios together with the cost database give theCapital Expenditure (CAPEX) for each year.
The tool contains a forecasting module for cost pre-dictions of network components. The module in-cludes extended learning curve forecasts, which arebased on worldwide mass production as an importantexplanatory variable. See the paper “Models for fore-casting cost evolution of components and technolo-gies” [1] in this issue.
In addition Operational Costs (OPEX) is calculatedbased on operations and maintenance parameters forthe component and the maintenance system. TheOPEX costs are divided into different components,such as cost of repair parts including civil work andoperations and administration costs. Typically theOPEX are driven by services, say by number of cus-tomers and number of critical network elements.
CAPEX costs together with the OPEX costs give thelife-cycle costs of the selected architecture scenario.Finally, by combining service revenues, investments,operating costs and general economic inputs (e.g. dis-count rate, tax rate), cash flows and other economicfactors the NPV, IRR, Payback period etc are calcu-lated. The methodology is described in more detailin [43].
New mobile systems have been examined by techno-economic analysis regarding market opportunitiesand rollout strategies ([20], [31], [32], [39]).
7 Broadband penetration status
Data sources
Broadband information has been gathered from a lotof different sources. Project partners in the CELTICproject Ecosys have collected up-to-date data fromthe broadband evolution. Other important sourceshave been consultant reports from Point topic [9],OVUM [11], Jupiter [14], Forrester [18] and a set ofreports from the European Commission ([12], [15],[21]). It has been difficult to use the forecasts fromthe consultant reports because the main part of thereports underestimates the expected broadband evolu-tion. One exception is however the last report fromOVUM.
An evaluation of the broadband reports from the con-sultant companies from the 2000 – 2004 period is thecontinuous underestimation of the expected broad-band evolution in Western Europe. During the first

20 Telektronikk 4.2004
part of the period the DSL technology was signifi-cantly underestimated because the first forecastsprobably took to much account of the HFC broad-band evolution in North America.
Parallel broadband forecasts have been developedindependently through the European programsRACE, ACTS and IST, by the projects RACE2087/TITAN, AC 226/OPTIMUM, AC364/TERAand IST-2000-25172 TONIC financed by the Euro-pean Commission. This paper documents broadbandmodelling performed in the CELTIC project Ecosys.
In the TONIC project broadband forecasts were mod-elled and presented in two deliverables (WesternEurope, 2001) [40] and (Country groups, WesternEurope, 2002) [30]. These forecasts have been devel-oped based on principles shown in this paper. Theseforecasts are significantly higher than all forecastsdeveloped by consultant companies in the period2001 – 2003. Next section shows that there is a veryhigh growth in the broadband penetration in 2004,which clearly indicates significantly higher penetra-tions than what was expected by the consultant com-panies.
Broadband status
Updated broadband statistics from Point topic fromQ4 2003 (ultimo 2003) to Q1 2004 (first quarter2004) and Q2 (second quarter 2004) are presented inthis section [9]. The broadband demand status of all
Western European countries is shown. The statisticsinclude the sum of the business market and the resi-dential market. The next chapters present forecastsfor the residential market only. In addition the statis-tics cover DSL and Cable modem, but not otherbroadband technologies. The reason for using Pointtopic statistics is that the statistics are updated withQ2 2004 data.
The broadband penetration relative to the number ofhouseholds from end 2003 to the first half of 2004for all countries in Europe is shown in Figure 7.1.
The figure shows that Denmark, Netherlands,Switzerland and Belgium are in front, while runnersup are Iceland, Norway, Sweden and Portugal. How-ever, during the last year Sweden has lost her positionas one of the top three broadband countries in West-ern Europe. The large countries France, Germany,Italy and UK have a penetration of about 15 % in thefirst quarter of 2004. However, Germany is now los-ing her position, in spite of an aggressive DSL rolloutthe first years. France and Italy have a significantgrowth and also a hard competition among the broad-band operators.
The mean penetration, sum business and residentialmarket for the Western European countries was14.5 % at the end of 2003 and 17.1 % after Q1 2004.Second quarter 2004 the penetration is 18.9 % – anincrease of 4.4 % in six months. The mean penetra-
Figure 7.1 Broadband penetration (DSL and cable modem) as sum of residential and business accessesQ4 2003 – Q2 2004 for Western European countries
0 5 10 15 20 25 30 35 40
Austria
Belgium
Denmark
Finland
France
Germany
Greece
Iceland
Ireland
Italy
Luxembourg
Netherlands
Norway
Portugal
Spain
Sweden
Switzerland
UK
Total
Q4 2003
Q1 2004
Q2 2004
%

21Telektronikk 4.2004
tion for the Western European residential market was11.4 % at the end of 2003. Hence, 3.1 % of the pene-tration is caused by the business market, which con-stitutes a market share of about 22 %. The businessmarket has a faster growth than the residential mar-ket. Q2 2004 penetration data for the pure residentialmarket, Western Europe, is not available at themoment. Based on the given market share, the resi-dential penetration (DSL + Cable modem) is esti-mated at 15.0 % medio 2004. Penetrations by othertechnologies have to be added. At the end of 2003,the broadband penetration of other technologies in theresidential market was 0.2 %.
The half-year broadband penetration growth, Q42003 to Q2 2004 for sum residential and businessmarket for the West European countries is shown inFigure 7.2. The figure shows that Portugal, Denmark,Netherlands, Switzerland, France, and Norway had avery significant broadband growth during the first sixmonths of 2004.
The mean growth in broadband penetration amongcountries in Western Europe from Q4 2003 to Q22004 for the sum of residential and business access is4.44 % measured per households. The adjusted quar-terly growth for the residential market is 3.5 %. If thebroadband market evolve with the same speed therest of the year, the yearly growth of the residentialmarket is estimated to be 7.0 %.
8 Broadband technology forecasts
Drivers for broadband evolution
Important drivers in the broadband market are ofcourse the applications. The evolution of applicationsgenerates continuously higher broadband penetration.The evolution of narrowband Internet is an importantpart of the picture. Now, a significant part of thesesubscribers are converting to broadband each year.Another important factor is the PC penetration. ThePCs are broadband terminals and until now, thebroadband subscribers need a PC. In Norway the PCpenetration is about 80 %. However, in some Euro-pean countries the PC penetration is low and maybe a barrier for the broadband evolution. Figure 8.1shows the PC penetration in some OECD countries.
One important aspect is the distribution of broadbandcontent. Interesting applications are: Streaming,Surfing, Peer-to-Peer, Music-on-demand, Video-on-demand, Games, eLearning, Electronic newspapers,Electronic books, Gambling, Broadcasting, etc. Theoperators and service providers are also bundling theservices. The HFC and FTTx operators offer tripleplay.
Other important drivers are national objectives foroffering schools, community centres, libraries, etc.high speed broadband. In the national communicationplan for Norway, eNorge2005, all schools shall haveminimum 2 – 10 Mbit/s broadband access by 2005.
Figure 7.2 Broadband penetration (DSL and Cable modem) growth as sum of residential and businessaccesses from Q4 2003 to Q2 2004 for Western European countries
0 2 4 6 8 10 12
Austria
Belgium
Denmark
Finland
France
Germany
Greece
Iceland
Ireland
Italy
Luxembourg
Netherlands
Norway
Portugal
Spain
Sweden
Switzerland
UK
Total
%

22 Telektronikk 4.2004
Larger schools shall have minimum 10 – 100 Mbit/sconnections. In addition the Government is monitor-ing the broadband coverage very carefully. SomeGovernments in Western Europe may follow Swedenand Canada, who have supported the broadband roll-out with significant investment means. If the broad-band rollout in the rest market is too slow, publicmeans may be used to support broadband deploymentin these areas.
Another very interesting broadband driver is voiceover IP (VoIP). Since broadband access gives thepossibility for voice communication, different playersare establishing IP-based voice communication on thebroadband accesses. Several operators with large corenetworks, like the incumbents, are developing VoIPwith high service quality. Other players in the broad-band market establish VoIP services without invest-ing in their own infrastructure. Telio was the com-pany in Norway who offered VoIP without their owninfrastructure.
Broadband classification of technologies
for the residential market
The broadband technologies are described in chapter3. For the residential market the technologies aredivided into four main groups:
• ADSL• ADSL2+/VDSL• Cable modem (HFC)• Other technologies
Other technologies are mainly: Fixed wireless broad-band access systems (FWA), Fibre to the home, Fibre
to the building systems, Power line systems, Directto the home satellite with return channel, and Digitalterrestrial television systems.
Broadband technology modelling
The broadband forecasts for the different technolo-gies are modelled by beginning with the broadbandpenetration forecasts development for the total broad-band demand in the Western European residentialmarket. Based on experience from the last few years,diffusion type models have proved to have the bestabilities for long-term forecast modelling. A discus-sion on the forecasts is found in the last chapter ofthis paper. Also Technology Future Inc. uses diffu-sion type models for long-term technology forecasts.See [5] in this journal. In [5] and [12] it is shown thatthe aggregated long-term demand for a set of infor-mation and telecommunication services, ICT, in thehousehold segment has a diffusion pattern. [25] givesan overview of different diffusion models used tomodel telecommunication demand. In this analysis afour parameter Logistic model has been applied forthe long-term forecasts.
In this paper the analysis is mainly based on meanvalues from the Western European market. The mod-els will be improved by modelling the demand inhomogeneous groups of European countries. Thenmore dedicated information will be used regardingrollout speed and coverage of various technologiesfor the different countries.
Predictions of market share evolution between differ-ent broadband technologies have been developedbased on a set of Logistic forecasting models. Migra-
Figure 8.1 Access to home computers. Selected OECD countries (EU Community Survey on Household Use ofICTs, 2002) [21]
0
20
40
60
80
1994 1995 1996 1997 1998 1999 2000 2001 2002
Netherlands
Denmark
Canada
Australia
United States
Japan
United Kingdom (1,2)
Germany
Finland (1)
New Zealand (3)
France
%

23Telektronikk 4.2004
tions between technologies are handled whenADSL2+/VDSL and other broadband technologiesare catching market shares from ADSL and cablemodem. Finally, the broadband penetration forecastsfor the technologies are found by multiplying thetotal forecasts with the market share forecasts for thetechnologies.
Broadband coverage
The number of cable TV subscribers in 2003 wasabout 55,000,000 in Western Europe. Since the roll-out of the cable TV has become saturated, new sub-scribers will mainly be connecting to the existing net-works. OVUM [11] predicts about 2 % additionalcable TV subscribers per year. At the same time thenumber of households increases by 0.8 % per year.OVUM estimates that the penetration of cable TVsubscribers will increase to 36 % in 2008.
Figure 8.2 shows the cable modem and DSL coveragein Western Europe (Dec 2003). The differencebetween cable TV coverage and cable modem cover-age is due to the heavy expenses in upgrading cableTV networks to a two-way broadband network (HFC).Some of the networks are rather small and some othernetworks may be of poor quality and not usable forupgrading. Therefore, the cable modem coverage willprobably not be very much higher.
On the other hand, the DSL coverage will continue togrow. Figure 8.2 shows that the DSL mean coverageis about 80 %, but much less in rural areas. The DSLis deployed very intensively in Western Europe and isgoing to have a coverage of more 95 % in the longrun. The limitations for coverage are too long copperlines and/or too small local exchange areas. The pre-dictions are estimated by using a Logistic model with97 % saturation level. However, new technology willprobably reduce the size of this rest market. Figure8.2 gives predictions for the DSL and cable modemcoverage.
Residential broadband penetration
forecasts for Western Europe
Figure 8.3 shows the evolution of residential broad-band penetration from 1999 to 2003.
The figure shows that the broadband penetration evo-lution during the first years was close to an exponen-tial growth. The demand is expressed in percentageof total number of households. The observations indi-cate that Logistic models are relevant alternatives forforecasting the penetrations.
Figure 8.4 shows the long-term Western Europeanresidential broadband subscription forecasts. The sat-uration level in the model has been estimated based
on historical data, demographics and also expertopinion. The other parameters in the model are esti-mated.
The figure shows fast increase in the broadband pene-tration in Western Europe during the next years andthe point of inflexion around 2005 – 2006. The situa-tion among countries in Western Europe is of coursevery different. Greece has a very limited penetration,while the Nordic countries and Belgium, Netherlandsand Switzerland have a very high penetration.
Figure 8.2 DSL and cable modem coverage
Figure 8.3 Residential broadband penetration, Western Europe, 1999 – 2003
Figure 8.4 Broadband penetration forecasts for residential market,Western Europe
0
40
80
120
%
2003 2004 2005 2006 2007 2008 2009 2010
DSL coverage
Cable modem coverage
0
2
4
6
8
10
12
1999 2000 2001 2002 2003
Pe
ne
tra
tio
n (
%)
0
20
40
60
2000 2002 2004 2006 2008 2010
Pe
ne
tra
tio
n (
%)

24 Telektronikk 4.2004
Market share evolution
The market share evolution of cable modem 1999 –2003 is shown in Figure 8.5. The figure shows thatthe market share for cable modems (HFC) starts withnearly100 % in 1999, but cable operators lost morethan 60 % of the market in the first two years. Asmentioned earlier, the cable modem market share hasdecreased significantly compared with the dominat-ing position in 1999. At that time the number ofbroadband subscribers was very limited.
The cable modem market share depends on the cover-age. Figure 8.2 shows the predicted mean coveragefor DSL and cable modem in Europe. The cablemodem penetration in the residential market was3.1 % in Western Europe at the end of 2003. The cov-erage was 29.0 % and the take rate 10.7 %. The DSLpenetration was 7.9 % and the coverage 79 %, whichgives a 10.0 % take rate.
The total broadband take rate in cable modem areasis higher than the take rate in other areas. One reasonis a more intensive competition in these areas. Cablemodem areas are also rather dense areas, wherehouseholds probably have a higher willingness to payfor broadband subscriptions. In addition the broad-
band rollout started earlier in cable modem areas. It isestimated that the broadband take rate at the end of2003 is 3 % higher in cable modem areas than inother areas. The DSL take rate at the end of 2003 incable modem areas is estimated at 5.3 %, while theDSL take rate in areas without cable modem is esti-mated at 12.7 %. In addition other technologies startto take minor market shares.
Figure 8.6 shows the market share forecasts for cablemodem in Western Europe.
It is assumed that cable modem operators manage tomaintain their broadband position in cable modemareas. Based on the coverage predictions until 2010for DSL, cable modem and other technologies, thelong-term market share for cable modem is estimatedto be about 22 %.
The predicted market share evolution for cablemodem is modelled indirectly by subtracting marketshare forecasts for DSL and other broadband tech-nologies from 100 %. The market share forecasts forDSL and other broadband technologies are modelledby a four parameter Logistic model where the long-term market share is set to be 100 % – 22 % = 78 %.Forecasts for the two evolutions are shown in Figure8.6.
However, there are some uncertainties regarding themarket share forecasts. The cable operators bundlethe broadband services and the cable television ser-vices (TV channels). Therefore, it is difficult forother operators to compete. When ADSL2+ andVDSL are introduced, other operators have the possi-bility to offer cable television services based on themulticast functionality and traditional broadbandservices. New operators have the possibility to offertriple play by offering broadband, cable televisionand telephony. Thus, it may be more difficult for thecable operators to maintain their rather dominatingposition in the cable areas.
The long-term forecasts show saturation for cablemodem on a 22 % level. Even that level may be alittle bit too high for Western Europe.
Now, the question is what role the new broadbandtechnologies are going to play in the coming years.The most important technologies for the residentialmarket are FTTB, FTTH, FWA (WiFi, WiMax) andpossibly PLC (Power Line Connections). The marketshare for the new technologies has been reasonablylow in the period 2000 – 2003. The market share isshown in Figure 8.7.
Figure 8.6 Predicted market share evolution between cable modems(HFC) and DSL + other broadband technologies
Figure 8.5 Cable modem market share evolution in Western Europe
0
40
80
120
1999 2000 2001 2002 2003
Ma
rke
t sh
are
(%
)
0
40
80
120
2000 2002 2004 2006 2008 2010
Mar
ket
shar
e (%
)
DSL+Other BB tech
Cable modem

25Telektronikk 4.2004
By end 2003 there were about 375,000 FTTB/FTTHbroadband accesses in Western Europe, while thenumber of FWA was about 31,000 and the PLCaccesses were about 12,000. A significant part ofthe FWA accesses are business customers. The totalnumber of broadband households was 18,400 millionat the end of 2003.
Techno-economic calculations have shown that newbroadband technologies have problems surviving inthe broadband market. The main reason is a lack ofsignificant mass production possibilities. If a technol-ogy enters the market too late, then the mass produc-tion potential is reduced and the network componentswill not be cheap enough.
The broadband penetration in the West Europeanmarket was 11.4 % at the end of 2003. In the courseof the next two years the broadband penetration ispredicted to be more than 25 %. Therefore it is cru-cial for the upcoming new technologies to enter themarket and to catch more significant market sharesbefore the established technologies will be even moredominating.
Techno-economic calculations show that it will beextremely difficult to produce broadband solutionswith lower CAPEX and OPEX than DSL and cablemodem. The best strategy for the new technologiesis to enter the rest market before the establishedbroadband technologies reach this part of the market.Because of long line length and high rollout costsfor DSL, the FWA solutions may be an alternative inparts of the rest market. In 2010 the DSL coverageis estimated to be about 97 %. Hence, the FWA solu-tions should have a chance of catching the additional3 %.
However, there is also a question of service capacityand quality, not only a question of price. In the longterm, new demands for very large capacity will begenerated. Therefore, FTTH and FTTB and evenFTTC (Fibre To The Curb) will be attractive broad-band solutions. Especially Sweden and Denmark arein front in the rollout of these access solutions. Strate-gies for fibre rollout will be:
• To deploy fibre to large building complexes• To deploy fibre to the homes when building out
green field areas• To renew old infrastructure because of failures
Figure 8.8 shows that the development of marketshare for new broadband technologies is rather slow.It is difficult to make forecasts for the market shareevolution even if we have some observations. Thefibre accesses will continue to evolve because of new
capacity demanding applications. In addition, themarket will be covered by different broadband solu-tions because of political decisions combined with amarket driven approach.
Based on the given arguments, the market share forthe new technologies is assumed to be about 7.5 %in 2010. A four parameter Logistic model models themarket share evolution. The market share forecastsare shown in Figure 8.8.
The next step is to separate the DSL services ADSL,ADSL2+ and VDSL. The DSL services are describedin detail in chapter 3. So far ADSL2+ and VDSL arerarely introduced in the Western European access net-works. Telenor started already in 2001 a large VDSLtrial with 700 households. During the next yearsADSL2+ and VDSL will be deployed gradually.
Techno-economic calculations show that anADSL2+/VDSL rollout based on cherry pickinggives fairly good business cases for the network oper-ators. The rollout strategies are described in moredetail in the paper “rollout Strategies and Forecastsfor VDSL/ADSL2+” [3] in this journal. One indicator
Figure 8.7 Market share other broadband technologies than DSL andcable modem
Figure 8.8 Market share forecast for DSL and other broadbandtechnologies
0,0
0,4
0,8
1,2
1,6
2,0
2000 2001 2002 2003
Mar
ket
shar
e (%
)
0
20
40
60
80
2000 2002 2004 2006 2008 2010
Ma
rke
t sh
are
(%
)
DSL + Other BB tech
Other BB tech
DSL

26 Telektronikk 4.2004
for the evolution is the new DSLAM exchanges,which have interfaces for both ADSL line cards andADSL2+ line cards. It is important to note that theproduction cost of ADSL and ADSL2+ cards are atthe same level. Therefore, there will be a significantincrease in the high capacity demand for DSL. Sincethere are no historical demand data, it is of course dif-ficult to predict the future market share evolution ofADSL2+ and VDSL. However, because of low addi-tional production costs, especially for ADSL2+, therewill be a very significant increase in the coming years.
ADSL2+ and VDSL offer higher broadband capacitythan ADSL. During the next few years new highcapacity broadband applications will be introduced.Now, streaming applications are very popular insome market segments, but the access capacity limitsthe usage. The incumbents are working hard to createnew income possibilities on broadband to compensatefor the loss on ISDN/telephony. New concepts ofbroadband contents are underway. ADSL2+ andVDSL will offer TVoDSL and in addition VoD andindividual choice possibilities of events and old TVprograms. Specific content applications will be:entertainment, online games, gambling, elearning,music on demand, “voice books” on demand, elec-tronic newspapers and journals etc. Other broadbandapplications are: “teleshopping” and auctions, surf-ing, downloading and exchanging software, back-upservices, remote broadband storage, home office,video and multimedia conferences, file and informa-tion exchange, data base upgrades and tele-surveil-lance. The peer-to-peer applications in the residentialmarket are about to start to evolve. There will be asignificant increase in demand in the coming yearsfor exchange of personal content like digital pictures,digital film sequences – either personal or streamed,videograms, greetings cards, email with broadbandcontent, personal video and multimedia conferences– for example birthday video conferences.
One of the first steps for the incumbents is to intro-duce TVoDSL. The technology will be based onmulticasting. However, the market segment in thisarea is limited because DTH satellites, the CATVnetwork and some FTTH/FTTB operators alreadyoffer TV distribution. The next step will be to intro-duce the more advanced broadband services andapplications. The evolution and speed in developingnew broadband products will influence the demandfor ADSL2+/VDSL.
The ADSL2+/VDSL market share forecasts are basedon the assumption of a diffusion type evolution start-ing in 2004. The premises for the forecasts are thatthe main part of the Western European operators startto use the cherry picking strategy without additionalinfrastructure investment. The coverage of ADSL2+/VDSL is about 50 %. It is assumed that operators atthe end of the period (2010) will also be deployingfibre deeper into the access network and expand thecoverage to about 65 %. Premises for the market seg-mentation for Western Europe is 90 % HFC coverageinside a radius of 2 kilometres from the exchange(DSLAM). Hence, the potential for ADSL2+/VDSLin 2010 will be 60 % minus 20 % multiplied with theestimated HFC coverage of 22.4 %. The future tariffsfor ADSL and ADSL2+/VDSL and the content deliv-ered are of course important factors for the marketshare of the different services. So far, there is limitedinformation about what consumers will choose.Multinomial logit models have been used to examineADSL and VDSL demand in the Norwegian market.Significant demand for VDSL was identified [8]. It isassumed that 35 % of the consumers in 2010 willchoose ADSL2+/VDSL instead of ADSL where pos-sible. The latter assumption is uncertain, especiallybecause we do not know the future tariffs nor thebroadband content of the services. Then the marketshare for ADSL2+/VDSL is estimated to be about15 % in year 2010. Figure 8.9 shows the market shareforecasts for DSL, ADSL and ADSL2+/VDSL.
Market share and penetration forecasts
for different broadband technologies
An overview of the market share forecasts for thedifferent technologies is given in Figure 8.10. Thefigure shows that the DSL technology in the futurewill be the dominating broadband technology inWestern Europe and that the ADSL2+/VDSL ser-vices will gradually substitute ADSL. However, theevolution is reduced because of long subscriber linelengths and the need for heavy investments in theaccess network for parts of the subscribers. The fig-ure shows that the cable modem market sharedecreases significantly in the period 2000 – 2010,while the market share for new technologiesincreases.
Figure 8.9 Predicted market share evolution for ADSL andADSL2+/VDSL
Ma
rke
t sh
are
(%
)
0
20
40
60
80
2000 2002 2004 2006 2008 2010
DSL
VDSL/ADSL2+
ADSL

27Telektronikk 4.2004
The penetration forecasts for the broadband technolo-gies are found by multiplying the total penetrationforecasts with the market share forecasts for the tech-nologies. The forecasts are found in Figure 8.11. Thefigure shows that ADSL is the dominating broadbandtechnology in the period 2000 – 2010, but the pene-tration decreases at the end of the period. The mainreason for this is substitution effects with ADSL2+and VDSL, which have shown a very strong growthfrom 2007 to 2010. In parallel the cable modem pene-tration increases even when the market share isreduced. Also the penetration of other broadbandtechnologies increase in the period.
9 Forecast uncertaintiesThere are a lot of uncertainties connected to the fore-casts. Since the broadband forecasts are developedthrough qualitative and quantitative information, sta-tistical modelling and also subjective input to themodelling, it is difficult to express the uncertainty bya pure statistical model.
However, it is important to analyse the impact of thebroadband forecasting uncertainty. The long-termforecasts are mainly used as input for rollout deci-sions of different broadband technologies and forestablishing new network platforms. Techno-eco-nomic assessments are used to calculate net presentvalue, internal rate of return and pay back period forthe various projects.
A relevant method for evaluating forecast uncertaintyis to apply a risk analysis [42]. The paper “Analysingthe impact of forecast uncertainties in broadbandaccess rollouts by use of risk analysis” [4] in thisissue shows how risk analysis can be used for thistype of evaluations. In [24 and [37] risk analysis onbroadband investment is combined with option theoryfor evaluation of uncertainty to decide the right timefor broadband rollouts.
10 Broadband forecastscomparisons
Comparison of forecasts is a subject on its own. Inthis chapter some comparisons of long-term broad-band will be shown and discussed. However, theintention is not to give a complete picture of all long-term broadband forecasts produced.
In 1994 the RACE 2087/TITAN project performeda Delphi survey among 100 experts from 10 WesternEuropean countries on the future broadband residen-tial market [44]. Demand curves for broadbandaccesses and applications together with forecasts forlong-term broadband demand for the Western Euro-
pean market were estimated based on the Delphimethodology. In 1997 a new Delphi survey was car-ried out in the AC 226/OPTIMUM project [41]. Atthat time no broadband demand data were available,since the broadband services were not yet introducedin the residential market. The forecasts from the twosurveys are shown in Figure 10.1.
The aggregated penetration forecasts per householdfrom the first Delphi survey (1994) based on the sumof 2 Mb and 8 Mb accesses were estimated to be14 % in 2005 and 20 % in 2010. Now we see thatthese 10 year old forecasts have been a little bit pes-simistic. However, at that time neither the DSL tech-nology nor the HFC/cable technology were known.
The aggregated forecasts from the 1997 Delphi sur-vey predict 18.2 % penetration in 2005 and 48.5 %in 2010. These forecasts are rather good. The 2005forecasts are probably a little bit lower than theexpected penetration for 2005, and the 2010 forecastsare so far in the right range. The figure shows thathigh broadband capacity (25 Mb) forecasts are too
Figure 8.10 Market share forecasts between ADSL, ADSL2+/VDSL,Cable modem and other technologies for the West European market
Figure 8.11 Penetration forecasts for broadband technologies inWestern Europe
Ma
rke
t sh
are
(%
)
0
20
40
60
80
2000 2002 2004 2006 2008 2010
ADSL
ADSL2+/VDSL
Other BB tech.
Cable modem
Ma
rke
t sh
are
0
5
10
15
20
25
30
35
2000 2002 2004 2006 2008 2010
ADSL
ADSL2+/VDSL
Other BB tech.
Cable modem

28 Telektronikk 4.2004
optimistic. ADSL2+ and VDSL, which were notspecified at that time, are evolving now, but not veryfast. The broadband forecast from AC364/Tera isbased on the results from the 1997 Delphi surveywith some adjustments [41].
Now many companies are making long-term fore-casts for the broadband evolution. New broadbandforecasts were developed in IST 2000-25172 TONICin 2001 [40]. It is of course easier to make broadbandforecasts when historical demand data are available.This paper presents some of the forecasts. Figure 10.2gives a comparison of the following forecasts for theWestern European residential market:
• Tera (1998)• Tonic (May 2001)• Jupiter (2003)• Forrester (June 2003)• Jupiter (April 2004)• OVUM (May 2004)• Ecosys (August 2004)
The broadband penetration ultimo 2003 was 11.4 %.The Tonic (2001) forecasts and the Tera (1998) fore-casts underestimate the penetration in 2003 by 1.7 %– 3.2 %. However, the yearly growth in the period2003 – 2008 is larger than the Jupiter (2003 and2004) forecasts and the Forrester (2003) forecasts.
Chapter 7 in this paper gives an overview of the quar-terly DSL and cable modem increase Q1 and Q2 forthe sum of the residential and business markets in2004. The adjusted half year growth for the residen-tial market is estimated to be 3.5 %, which gives ayearly growth of 7 % for DSL and cable modem.Taking into account the growth of other broadbandtechnologies, the broadband penetration in WesternEurope will increase from 11.4 % to 18.5 – 19 % atthe end of 2004.
Jupiter (2004), OVUM (2004) and Ecosys (2004)forecasts for 2004 seem to have the right predictionsfor 2004. However, Jupiter (2004) have more pes-simistic long-term forecasts. The long-term forecastscan be divided into two groups:
Group 1: Tonic (2001), Ecosys (2004), OVUM(2004): High long-term forecasts
Group 2: Tera (1998), Jupiter (2004), Forrester(2003), Jupiter (2003): Low long-term fore-casts
In Group 2 Tera (1998) shows a much strongergrowth at the end of the studied period than theothers. The Jupiter (2004) forecasts, which probablywill be on the right level ultimo 2004, have a turningpoint at the end of 2004. It explains the deviationsfrom Group 1 long-term forecasts. Netherlands,Belgium, Denmark and Switzerland have the highestbroadband penetration in Western Europe, with alevel for the sum of residential and business of about35 %. Still the broadband growth in these countriesis increasing, which indicates a much higher turningpoint than 19 %.
Therefore, it is reasonable to believe that the Group 1forecasts are the best forecasts.
Figure 10.1 Broadband access penetration forecasts per household inthe residential market from Delphi surveys performed in 1994 and 1997
Figure 10.2 Comparison of long-term broadband penetration forecastsper household
Pe
rce
nta
ge
of
the
re
sid
en
tia
l ma
rke
t
0
10
20
30
40
50
60
2000 2005 2010 2015 Saturation
Year
2-4 Mbit/s (1997)
25 Mbit/s downstream and 384 kbit/s upstream (1997)
25 Mbit/s downstream and 6 Mbit/s upstream (1997)
2 Mbit/s wideband (1994)
8 Mbit/s broadband (1994)
Pe
ne
tra
tio
n (
%)
0
10
20
30
40
50
60
2000 2002 2004 2006 2008
Tonic (May 2001)
Ecosys (August 2004)
OVUM (May 2004)
Tera (1998)
Jupiter (April 2004)
Forrester(June 2003)
Jupiter (2003)

29Telektronikk 4.2004
11 ConclusionsLong-term broadband technology forecasting is nota very easy subject. Experience has shown that it isnearly impossible to make long-term forecasts with-out understanding the evolution of new broadbandtechnologies and new broadband network platforms.Knowledge of broadband technologies regardingpossibilities and limitations is important for theforecasting.
In order to make good long-term broadband forecasts,techno-economic analysis of the relevant broadbandtechnologies has to be performed. Each technologygenerates investments and operations and maintenancecosts for the rollout, which is dependent on the char-acteristics of the various access areas in the countries.Techno-economic analysis has the ability to show theeconomic value of the various technologies. Therefore,the techno-economic analysis is crucial for technologyrollout strategies and for broadband forecasts.
Long-term broadband forecasting models for theWestern European market take into account the pene-tration status for the various technologies until 2003/medio 2004. Then long-term forecasts are developedfor the period 2004 – 2010. The broadband forecastsare segmented in separate forecasts for ADSL,ADSL2+/VDLS, cable modem and other broadbandtechnologies.
The analysis shows that ADSL, cable modem/HFCand FTTC/FTTB solutions for large building com-plexes are the cheapest broadband technologies. Inmany countries in Western Europe the cable modems/HFC have limitations because of low CATV cover-age. Other broadband technologies have to fight formarket share where the mentioned broadband tech-nologies are not deployed. Especially the rest market,with too long copper lines is a potential market forthese technologies.
The broadband subscription growth in WesternEurope is estimated to be 7 % in 2004 and the long-term forecasts for 2008 probably close to 50 %.
So far the broadband forecasts are mainly based onWestern European mean values. The forecast mod-elling can be improved by making separate broad-band forecasts for each country by including explana-tory variables such as broadband coverage, broad-band roll plans, service offer, tariffs etc.
The experience from using Delphi surveys for mak-ing long-term broadband forecasts, before broadbanddemand data were available, has been very good.However, it is difficult to make general conclusionsbased on the results from two Delphi surveys.
Comparisons of earlier forecasts from consultantcompanies and forecasts from the EU Commissionfunded techno-economic projects RACE 2087/TITAN, AC 226/OPTIMUM, AC364/TERA andIST-2000-25172 TONIC show that the forecasts fromtechno-economic projects seem to be more offensiveand probably give better forecasts.
References1 Olsen, B T, Stordahl, K. Models for forecasting
cost evolution of components and technologies.Telektronikk, 100 (4), 138–148, 2004. (This issue)
2 Hjelkrem, C, Stordahl, K, Bøe, J. Forecasting res-idential broadband demand with limited informa-tion – A long-term supply and demand model.Telektronikk, 100 (4), 43–49, 2004. (This issue)
3 Stordahl, K, Elnegaard, N K. Rollout strategiesbased on adoption forecasts for ADSL2+/VDSL.Telektronikk, 100 (4), 149–156, 2004. (This issue)
4 Elnegaard, N K, Stordahl, K. Analysing theimpact of forecast uncertainties in broadbandaccess rollouts by the use of risk analysis. Telek-tronikk, 100 (4), 157–167, 2004. (This issue)
5 Vanston, L, Hodges, R L. Technology forecastingfor telecommunications. Telektronikk, 100 (4),32–42, 2004. (This issue)
6 Cioffi, J, Mohseni, M. Dynamic Spectrum Man-agement – A methodology for providing signifi-cantly higher broadband capacity to the users.Telektronikk, 100 (4), 126–137, 2004. (This issue)
7 Ims, L A, Bersvendsen, A, Bhatnagar, A,Bozorgebrahimi, K, Østlyngen, E. Towards thenext generation broadband network platform.Telektronikk, 100 (4), 107–125, 2004. (This issue)
8 Andersson, K, Fjell, K, Foros, Ø. Are InteractiveTV-Pioners and Surfers different Breeds? Broad-band Demand and Asymmetric Cross-priceEffects. Review of Industrial Organization, pp1–22. Kluwer Academic Publ., 2004.
9 Point topic: Broadband statistics, June andSeptember 2004.
10 Stordahl, K. Broadband Technology Forecasting.(Handout). International Symposium on Forecast-ing 2004, Sydney, Australia, 4–7 July, 2004.
11 Ovum: Forecasts, May 2004

30 Telektronikk 4.2004
12 European Commission: Information TechnologyOutlook: ITC diffusion and use. March 2004.
13 Elnegaard, N K, Stordahl, K, Olsen, B T, Läh-teenoja, M. Segmentation of the Broadband Mar-ket with Respect to Present as well as EmergingServices Offerings. In: Proc ISSLS, Edinburgh,Scotland, 21–24 March, 2004.
14 Jupiter: European Forecasts Market Report, 3,2003.
15 European Commission. Connecting Europe atHigh Speed: National Broadband Strategies.Brussels, December 2003.
16 Elnegaard, N K, Olsen B T, Stordahl K. Broad-band deployment in rural and non competitiveareas: The European perspective. In: Proc FITCE2003’, Berlin, Germany, 1–4 September, 2003
17 Stordahl, K. Traffic forecasting models for theincumbent based on new drivers in the market.Telektronikk, 99 (3/4), 122–127, 2003.
18 Forrester Research Inc. Europe’s BroadbandFocus Shifts To Profit. June 2003.
19 Stordahl, K, Kalhagen, K O. Broadband forecastmodelling. Evaluation of methodology andresults. (Handout). International Symposium onForecasting 2003’, Merida, Mexico, 16–19 June,2003
20 Welling, I, Harno, J, Loizillon, F, Stordahl, K,Varoutas, D. Techno-Economic Evaluation 3G &WLAN Business Case Feasibility Under VaryingConditions. In: Proc 10th International Confer-ence on Telecommunications, Tahiti, FrenchPolynesia, February 23 – March 1, 2003.
21 European Commission. Community Survey onHousehold Use of ICTs. 2002.
22 Stordahl, K, Kalhagen, K O. Broadband AccessForecasts for the European Market. Telektronikk,98 (2/3), 21–32, 2002.
23 Elnegaard, N, Stordahl, K. Deciding on optimaltiming of VDSL and ADSL roll-outs for incum-bents. Telektronikk, 98 (2/3), 63–70, 2002.
24 Kalhagen, K O, Elnegaard, N K. AssessingBroadband Investment Risk Trough OptionTheory. Telektronikk, 98 (2/3), 51–62, 2002.
25 Fildes, R. Telecommunications Demand Forecast-ing – a Review. International Journal of Fore-casting, 1, 2002.
26 Elnegaard, N K. How to incorporate the value offlexibility in broadband access network rolloutinvestment projects. 41st European Telecommuni-cations Congress (FITCE), Genova, Italy, 4–7September 2002.
27 Stordahl, K, Kalhagen, K O, Olsen, B T. Broad-band Technology Demand in Europe. 2002 Inter-national Communications Forecasting Confer-ence, San Francisco, USA, June 25–28, 2002.
28 Stordahl, K, Olsen, B T. Traffic forecast modelsfor the transport network. In: Proc Networks2002, Munich, Germany, June 23–27, 2002.
29 Monath, T, Zeidler, T, Elnegaard, N K, Stordahl,K, Cadro, P, Devoldere, P. Economics of Ethernetversus ATM- based access networks for broad-band IP services. In: Proc Networks 2002,Munich, Germany, June 23-27, 2002.
30 IST-2000-25172. Market Models for IP services.31 May 2002. Tonic deliverable 8.
31 Varoutas, D, Stordahl, K et al. Economic viabilityof 3G Mobile Virtual Network Operators. In:Proc 3G Wireless 2002, San Francisco, USA,May 28–31, 2002.
32 Kalhagen, K O, Elnegaard, N K. The Economicsand Risks of 3rd Generation Mobile ServiceDeployment. In: Proc 3G 2002, 20–23 May,Amsterdam, The Netherlands.
33 Ims, L A. Towards deployment of VDSL forinteractive broadband services: Experiences froma large-scale consumer market trial. In: Proc. XIVInternational Symposium on Services in the Localaccess – ISSLS 2002, Seoul, Korea, April 14–18,2002.
34 Ims, L A, Loktu, H. Extending the broadband ser-vice footprint beyond the urban and highly com-petitive areas by hybrid broadband access solu-tions. In: Proc. XIV International Symposium onServices in the Local access – ISSLS 2002, Seoul,Korea, April 14–18, 2002.
35 Stordahl, K, Elnegaard, N K. Battle betweencable operator and incumbent: Optimal ADSL/VDSL rollout for the incumbent. In: Proc. XIVInternational Symposium on Services in the Local

31Telektronikk 4.2004
access – ISSLS 2002, Seoul, Korea, April 14–18,2002.
36 Olsen, B T, Kalhagen, K O, Stordahl, K. Provi-sioning of broadband services in non-competitiveareas. In: Proc. XIV International Symposium onServices in the Local access – ISSLS 2002, Seoul,Korea, April 14–18, 2002.
37 Elnegaard, N K, Stordahl, K. Deciding on theright timing of VDSL rollouts: A real optionsapproach. In: Proc. XIV International Symposiumon Services in the Local access – ISSLS 2002,Seoul, Korea, April 14–18, 2002.
38 Monath, T, Elnegaard, N K, Stordahl, K, Cadro,P, Devoldere, P. Economics of Fixed Access Net-works for broadband IP services. (In German.)3. ITG-Fachtagung Netze und Anwendungen,Duisburg, Germany, February 28 – March 1,2002.
39 Katsianis. D, Ylönen, M, Varoutas, D, Sphico-poulos, T, Elnegaard, N K, Olsen, B T, Budry, L.The financial perspective of the mobile networksin Europe. IEEE Personal Communications Mag-azine, 8 (6), 58–64, 2001.
40 IST-2000-25172. Demand models and prelimi-nary forecasts for IP services. June 2001. Tonicdeliverable 2.
41 Stordahl, K, Rand, L. Long term forecasts forbroadband demand. Telektronikk, 95 (2/3), 34–44,1999.
42 Stordahl, K, Elnegaard, N K, Ims, L A, Olsen, BT. Risk methodology for multimedia projectsassessments. In: Proc ECMAST 1999, Madrid,Spain, May 26–28, 1999.
43 Ims, L A (ed). Broadband Access networks:Introduction Strategies and Techno-economicEvaluation. Chapman & Hall, 1998. ISBN 0 41282820 0.
44 Stordahl, K, Murhy, E. Forecasting long termdemand for wide- and broadband services in theresidential market. IEEE of Comminications, 2,1995.
For a presentation of the author, please turn to page 2.

138 Telektronikk 4.2004
Wright and Crawford first developed the learningcurve model for aircraft production [1, 2, 3]. Thismodel is a simple exponential function where thedecrease of production time is a function of numberof produced units.
This paper describes an extension of the learningcurve model [4, 5, 6]. The motivation for this exten-sion was the need to model the cost evolution of newtelecommunication network elements in business casestudies. To be able to use the cost prediction model ineconomic calculations, it is important to forecast thecost evolution as a function of time, not as a functionof produced units. The model is a combination of thelearning curve model and a diffusion model whichmodels the life cycle of the component.
Within the European research programs, the projectsRACE 2087/TITAN, AC 226/OPTIMUM, AC364/TERA and IST-2000-25172 TONIC have worked outa methodology and a tool for calculating the overallfinancial budget of any telecommunication serviceand network project. The tool handles the discountsystem costs, operations, maintenance costs, demandforecasts, tariffs etc. The output of the tool is the lifecycle costs, expected net present value (NPV) andinternal rate of return (IRR). An important part of thetool includes the extended learning curves and costprediction of network components.
The tool has been used to evaluate the life cycle costsof the different telecommunications network tech-nologies with different maturity, and the results arefed back into more general forecast models (based onexisting infrastructure, competition level etc.) of themarket share of the technologies. In that sense theelasticity of technology volumes and cost levels arederived. In addition the tool is used for telecommuni-cations network profitability studies, risk analysis andbusiness scenario evaluations within many telecom-munication companies and in several internationalresearch projects [7–15].
1 BackgroundIn the European program RACE, project 2087/TITAN identified the need for modeling cost of net-work components and infrastructure deployment asa function of time [4, 5, 6]. One of the project objec-tives was to develop a methodology and tool fordoing strategic business case studies. In studyingfuture strategic telecom projects new and older costcomponents with a different degree of maturity haveto be considered. It was decided that every cost com-ponent should be characterized with its own cost evo-lution. To be able to do this with a large number ofcost elements, a model was developed and imple-mented in the tool. The model combines the learningcurve and the logistic function into a closed formwith a set of parameters, which have a clear meaning.This model is called the extended learning curvemodel and includes parameters representing:
- Cost of the product in the reference year;
- Relative accumulated production volume sold atthe reference year;
- Main part of the life cycle time to the product;
- Cost decrease when the production volume isdoubled (Learning curve coefficient).
In addition a fifth parameter can be used, whichdescribes the asymmetry of the diffusion growth ofthe product.
2 Wright and Crawford learningcurve models
The Wright-Crawford model is a simple exponentialfunction where the decrease of production time is afunction of number of produced units. The initialvalue of the function is the production time of thefirst unit. The parameter in the model is the learningcurve coefficient K, which denotes the reduction inproduction time when the production volume is dou-bled. By assuming that the cost of production is pro-portional to the production time, the learning curvemodel describes the cost decrease per produced unit
Models for forecasting cost evolution ofcomponents and technologiesB O R G A R T . O L S E N A N D K J E L L S T O R D A H L
Borgar T Olsen
is Senior
Researcher at
Telenor R&D
Kjell Stordahl is
Senior Advisor in
Telenor Networks
Learning curves are used in the industry to predict reduction in production time or production cost
as a function of produced volume. The causes of cost reductions are better control of the production
process, new production methods, new technology, redesign of the product, standardization and
automatisation.

139Telektronikk 4.2004
as a function of production volume. In the literaturethe learning curve is also used for describing individ-ual learning. In an industrial process such individuallearning is not the primary cause for cost reductionbut a combination of several factors such as:
- More effective labor force- Better control of the production process- More effective organization- Introduction of new production methods- New technology- Redesign of the product- Standardization- Automatization
Many of these factors are dependent on each otherand are therefore not easily separable. For example,the development of software to support productionof a product can be composed of better control of theproduction process, introduction of new productionmethod and standardization of the production process.
T.P. Wright first proposed the concept of learningcurves in 1936 to describe the production time of air-craft [1]:
Tn = n–α · T0 (2.1)
where Tn is the average production time for n units,given by
(2.2)
where tn is the time to complete the nth unit, T0 thetime to complete the first unit and n is the number ofcompleted units.
J.R. Crawford applied the same formula, but inter-preted Tn as the completion time for the nth unit [2].Wright’s law describes the cumulative effect of learn-ing, while Crawford’s formula only refers to scaleeffects. A disadvantage of Wright’s law is the appear-ance of strong autocorrelation, affecting the statisticalestimation of its parameters, a problem that alwaysarises when trying to correlate accumulated values.
In the literature many extensions and modifications ofthe Wright-Crawford’s law has been proposed [3] butfor our purpose the simple expression is used as a basisfor deriving cost as a function of time. In principle weinterpret Pn as the cost of the nth component sold in themarket of a specified component with a given func-tionality (e.g. GSM mobile phones), or a componentfrom a specified product generation or series.
Suppose that component cost (price) Pn is somehowproportional with production time Tn for the nth com-ponent, then we have from (2.1):
Pn = n-α · P0 (2.3)
Where- Pn is the cost of production of the nth component;- P0 is the cost of production of the very first com-
ponent;- n is the total number of produced units (possibly in
a production series);- α is a parameter in the model.
If the production volume is doubled, then:
P2n = (2n)-α · P0 (2.4)
The relation between Pn and P2n is given by:
P2n = K · Pn (2.5)
K is the factor by which the price is reduced when theproduction volume is doubled. K is called the learn-ing curve coefficient and is related to α by
K = (2)-α (2.6)
or
α = –log2 · K (2.7)
The learning curve coefficient is a number less than1. It is usually expressed in percentage and typicalvalues are between 70 % and 95 %. The valuedepends highly on which product group we are takingabout, the lower the value the steeper the learningcurve. In Figure 2.1 the learning curve with K set to80 % or α set to 0.32 is shown.
Figure 2.1 Wright-Crawford learning curve model
Tn =t1 + t2 + . . . + tn
n
Learning curve predictions as a function ofnumber of produced units
0
0,2
0,4
0,6
0,8
1
1,2
1 3 5 7 9 11 13 15 17 19 21 23 25 27 29
Co
st

140 Telektronikk 4.2004
3 The Logistic model and com-ponent cost as a function of time
We know that the production volume n and the pro-duction cost per unit Pn is a function of time. Thusthe learning curve can be written as:
P(t) = n(t)-α · P0 (3.1)
where n(t) is the global volume (for the world pro-duction of a component) and P0 is the cost of thevery first component.
The description of the growth over time of the accu-mulated volume of a cost component can be modeledin many ways. In the situation where very little isknown, because the component is new or not evenintroduced to the market, a standard demand Logisticcurve with four parameters is chosen. This curve hasthe needed generality for most types of growth pro-cesses and has a sound theoretical basis. The Logisticmodel chosen is defined by:
n(t) = M[1 + e(c+d·t)]-γ
(3.2)
where
- M is the total market potential- c, d and γ are parameters- t is time
The model predicts the yearly-accumulated produc-tion volume. If the production volume for severalyears is known, it is possible to estimate the para-meters M, c, d and γ. An iterative estimation proce-dure where OLS (ordinary least squares regression)is one part of the method can be used for estimatingthe parameters [17].
However, in new network architectures there are alot of rather new or completely new network compo-nents. Then there is no time series of the yearly pro-duction volume. In that case we need another proce-dure for estimating the parameters. Such a procedureis described in the next chapters.
4 Introduction of relativeproduction volume and growthperiod as substitution for generalparameters in the Logistic curve
Formulas 3.1 and 3.2 contain both the total marketsize M and the production cost of the first unit P0.Both of those inputs are sometimes difficult to obtain.
Dividing the learning curve cost in eq. 3.1 by thevalue at the reference year, M and P0 disappear andP(0) means the cost in reference year 0. The subscript
r indicates that we now have introduced normalizedlogistic functions (Annex 1) where nr (0) is defined asthe relative accumulated volumes sold at the refer-ence year.
(4.1)
This formula with the derived expression for α from(2.7) inserted can now be written:
P(t) = P(0) · [nr(0)-1 · nr(t)]log2·K (4.2)
Now we have the three parameters P(0), nr(0) and K.The normalized logistic formula with γ set to 1 isnow:
(4.3)
Instead of using the parameters c and d in the Logis-tic model only the growth period ∆T has to be intro-duced in addition to the relative accumulated produc-tion volume nr(0) sold at the reference year as alreadydefined. It is easier to understand and also easier tohave an opinion about the size of these parametersthan the parameters c and d.
By setting the t equal to 0 in eq. 4.3 and rearrangingthe expression, c is expressed by nr(0).
c = ln[nr(0)-1 – 1] (4.4)
The growth period, ∆T, is now defined as the timefrom the component reaches 10 % of the total pro-duction volume until it reaches 90 %. Then, thefollowing expression for d can be derived:
nr(t1) = 0.1 (4.5)
nr(t2) = 0.9 (4.6)
By definition
∆T = t2 – t1 (4.7)
which after some manipulation (Annex 2) gives:
(4.8)
(4.9)
Inserting c and d in the normalised diffusion curve weget the following formula:
(4.10)
P (t)
P (0)=
[nr(t)
nr(0)
]−α
nr(t) =[1 + e
(c+d·t)]−1
∆T =−2 · ln 9
d
d =−2 · ln 9
∆T
nr(t) =(1 + e
{ln[nr(0)−1−1]−[ 2·ln 9
∆T ]·t})−1

141Telektronikk 4.2004
It is clear from Figure 4.1 that the meaning of ∆T andnr(0) are very intuitive and much easier to work withthan the abstract parameters c and d.
5 Life cycle for different productsThe growth period ∆T of equipment or productsdepends of course on the technical development inthe different industrial areas. Especially for consumerelectronics like mobile phones the lifetime hasbecome shorter and shorter over the last years. If thediffusion curve (S-curve) is used to describe the accu-mulated growth of a specific series of equipment, saythe ZyXEL Prestige 600 series of ADSL modems orthe Nokia 7110 Model of mobile handsets, thegrowth period ∆T of the models is short (1–5 years)due to new models introduced to the market with newcapacities and functionality. If the formula is used todescribe the accumulated growth of all units in allseries of the product, like fixed telephones, the lifetime would be much longer, as illustrated in Figures5.1 and Figure 5.2. For example, the growth period ofTelevision in Canada was about 10 years. In general,due to the better production process, the life cycle ofthe different electronic products has decreased signif-icantly during the last two decades.
In Figure 5.2 we can observe ∆T of more than 20years for growth of several goods in Finland (alldevices and all production series).
6 The extended learning curveThe expression for nr(t) in (4.10) is now to be sub-stituted into the learning curve formula (4.2) yieldingthe final expression for cost versus time in closedform (Annex 2). The expression is called Theextended learning curve model.
(6.1)
The parameters in the extended learning curve modelare defined by:
- P(0) the production cost in the reference year 0,- nr(0) the relative accumulated volume in year 0,− ∆T the time for the accumulated volume to grow
from 10 % to 90 %- K the learning curve coefficient- 0 is the reference year.
In order to illustrate this relation, and to get a nor-malised component cost, we put P(0) = 1 and K = 0.90.By keeping nr(0) = 0.001 constant and letting theparameter ∆T range from 2 to 20 years, we can illus-
trate the evolution of the normalised cost versus timefor different ∆T, as shown in Figure 6.1.
Figure 6.2 shows the impact of nr(0) on the nor-malised cost, keeping ∆T = 5 years as a constant.
Figure 5.1 Historical diffusion of selected goods in Canada, source:Sciadas 2002b [18]
Figure 5.2 Historical diffusion of selected goods in Finland, source:Statistics Finland 2003 [18]
[nr(0)−1
·
(1 + e
{ln[nr(0)−1−1]−[ 2·ln 9
∆T ]·t})−1
]log2·K
P (t) = P (0)·
0
0,2
0,4
0,6
0,8
1
1,2
t1
t2
0
∆
nr(0)
0
0,2
0,4
0,6
0,8
1
1,2
∆Τ
Figure 4.1 The logistic model showing nr(0) and ∆T
0
20
40
60
80
100
Fixed telephoneTelevisionCableVCRPCMobileInternet
19531985 1999
0
20
40
60
80
100
Color TV
Freezer
Microwave
Video recorder
Dishwasher
MobileInternet
CD player
PC
1976 1980 1990 2000

142 Telektronikk 4.2004
From the previous expression it is clear that theasymptotic price level when t approaches ∞ does notdepend on ∆T, and is given by:
(6.2)
In addition, for small t the slope of the price curve isproportional to ∆T -1.
7 Volume and learning curve classesIn the practical implementation of the extended learn-ing curve in the tool mentioned in the introduction,the user chooses or estimates values of every costcomponent among different classes of the learningcurve coefficients K and combinations of nr(0) and∆T (volume classes). In case the components are newand no historical costs exist, a priori values have tobe chosen. Illustrations are shown in Table 7.1 andTable 7.2. Typical values of the Learning curve coef-ficient are from 100 % (meaning no cost reduction) to70 %, giving 30 % reduction for doubling of produc-tion volume.
Typical volume classes are shown in Table 7.2. Thegrouping can be established by the user of the tooland is not fixed.
The learning curve coefficient K classes and thevolume classes are chosen according to a pragmaticchoice of granularity and can be changed by the userof the tool. Especially the volume classes are chosento cover the two aspects of cost components: the typeand maturity of cost components. For example thetwisted copper pair or civil work costs are StraightLine class, POTS may be Old Very Slow class, Fibrecosts can be Mature Slow class and new devices foroptical switching can be like Emerging Fast class.
The grouping in classes brings the needed granularityfor modelling cost evolution of every cost compo-nent. The effect of allocating cost evolution to everycomponent in the business case study make theuncertainty of the overall cost picture smaller due tothe “large number law” in statistics. In general, over-and under-estimation cancel out by the large numberof components.
8 Forecasts by the extendedlearning curve – some examples
To illustrate how the extended learning curvemethodology can be applied, two examples from thetelecommunication area are presented in this chapter.The first example shows how ADSL line costs areforecasted based on collected data. A substantial partof the ADSL line costs comes from the DSLAM and
Figure 6.1 The impact of ∆T on the normalised cost, keepingnr(0) = 0.001 and K = 0.9
Table 7.1 The learning curve classes (Learning curve coefficient)
P (∞) = P (0) ·
[1
n(0)
]log2(K)
1 2 3 4 5 6 7 8 9 10
2
10
18
0
0,1
0,2
0,3
0,4
0,5
0,6
0,7
0,8
0,9
1
Co
st
Years
∆Τ
Cost for different ∆Τ
1 2 3 4 5 6 7 8 910 11
12
0,00001
0,01
0
0,1
0,2
0,3
0,4
0,5
0,6
0,7
0,8
0,9
Co
st
Years
Cost for different n(0)
n(0) r
ef
Figure 6.2 The impact of nr(0) on the normalised cost, keeping ∆T = 5years and K = 0.9
LearningCurveClass K_Value
CivilWorks 100.0 %
CopperCable 100.0 %
Electronics 80.0 %
SitesAndEnclosures 100.0 %
FibreCable 90.0 %
Installation (constant) 100.0 %
AdvancedOpticalComponents 70.0 %
Installation (decreasing) 85.0 %
OpticalComponents 80.0 %

143Telektronikk 4.2004
the line cards itself (modem is not included). The sec-ond example makes cost forecasts for transmissionequipment used in the core network. The describedcosts are not production costs, but costs the operatorshave to pay for the equipment.
Figure 8.1 shows the development of ADSL linecosts in the period 2000–2003. The line costs areshown in brown. Note the significant drop in the linecost from 2001 to 2002. It is difficult to collect interna-tional cost data. Some times the data may reflectimmediate results from negotiations between manufac-tures and operators, while some other times there havebeen no changes in the costs/prices over a long period.The reason can be rather long contract periods. The2001 cost observation on ADSL line cost is too highcompared to both 2000 and 2002 cost, to fit a “natural”decrease during the observed period. The observationhas been treated as an outlier. The learning curvemodel is complex and traditional linear estimationmethods cannot be used. The estimation of the para-meters is performed by a non-linear estimation proce-dure, which minimises the root mean square error.
The ADSL line cost forecast modelling gave theestimates:
P(2000) = 212 Euro∆T = 8nr(2000) = 0.1 %K = 0.74
Figure 8.1 shows the forecasting results based on theestimation.
The figure shows that ADSL line costs havedecreased to about 30 % of the original 2000 costsduring a period of only three years. The forecasts alsoshow that there is still a potential for a significantdrop in the line costs. The forecasts indicate that theline costs reach a rather stable level after a period of9–10 years. One reason is the estimated ∆T = 8 years.
It is of interest to evaluate the estimated values.P(2000) = 212.3 Euro is one Euro less than theobserved value in 2000. The initial production vol-ume in year 2000 is estimated to be 0.1 %. At thattime, ADSL was in its initial phase and 0.1 % is areasonable value. The growth period ∆T = 8 years,from a 10 % production level to a 90 % productionlevel, may be right for ADSL cards with low accesscapacity. However, if high capacity ADSL cards (upto 8 Mb/s) are included, there is reason to believe that∆T will be larger. The K factor estimated tells that thecost is reduced by a factor of 0.736 when the produc-tion volume on a worldwide basis is doubled. We do
not have information about the total international pro-duction volume, but the K value seems reasonable.
Figure 8.2 shows the development of SDH equipmentcosts from 2000 to 2003. The SDH equipment costsare shown in brown in the figure.
The observed equipment costs have a nice reduction.However, we see that the relatively yearly reductionsare not of the same size as for ADSL line costs. Aninterpretation is that the maturity of the SDH equip-ment in 2000 was much higher than the ADSL equip-ment. This is true because SDH equipment was putinto production many years before the ADSL equip-ment, meaning that the cost evolution of SDH iscloser to the tail of the cost curve.
Table 7.2 The volume classes
Figure 8.1 Cost observations and forecasts for ADSL line costs
VolumeClass nr(0) ∆T
Emerging_Fast 0.001 5.0
Emerging_Medium 0.001 10.0
Emerging_Slow 0.001 20.0
Emerging_VerySlow 0.001 40.0
New_Fast 0.01 5.0
New_Medium 0.01 10.0
New_Slow 0.01 20.0
New_VerySlow 0.01 40.0
Mature_Fast 0.1 5.0
Mature_Medium 0.1 10.0
Mature_Slow 0.1 20.0
Mature_VerySlow 0.1 40.0
Old_Fast 0.5 5.0
Old_Medium 0.5 10.0
Old_Slow 0.5 20.0
Old_VerySlow 0.5 40.0
StraightLine 0.1 1000.0
Forecast model for ADSL line costs
0
50
100
150
200
250
2000 2001 2002 2003 2004 2005 2006 2007 2008 2009 2010
Eu
ro
Model
Data

144 Telektronikk 4.2004
The same non-linear estimation procedure is per-formed for the SDH equipment. The estimation gavethe following results:
P(2000) = 1188 Euro∆T = 8nr(2000) = 7.4 %K = 0.76
Figure 8.2 shows the SDH equipment cost forecasts.The figure indicates quite a small future decrease incosts and that the component cost evolution stabilisesaround 2007. The estimation shows that 7.4 % of thetotal volume has been produced. The growth period∆T is estimated to be eight years. The K factor is esti-mated to be about the same as for the ADSL linecosts. This seems to be reasonable, because bothtypes of equipment are produced today with verysimilar production methods (10 years is very typicalfor equipment in a series today). Also the estimatedinitial cost in year 2000 Euro is reasonably good,only 26 Euro from observed real cost value.
It is difficult to evaluate the forecasts, but the fact thatthe value of the estimates both for the ADSL line costand the SDH equipment cost is reasonable based onour additional knowledge is of course a positive ele-ment in the evaluation.
9 ConclusionsWright and Crawford have developed the learningcurve model for cost predictions. However, theirmodel is not able to predict the costs as a function oftime. In traditional business case modeling, cost pre-dictions for a given period is a necessary input forcalculations of net present value, pay-back period andinternal rate of return.
The extended learning curve model presented in thispaper has the ability to predict cost evolution as afunction of time. The model extends Wright andCrawford’s learning curve by inserting a Logisticforecasting function for number of produced units.The Logistic function includes three parameters forflexible modelling of different production volumeevolutions. In addition the learning curve is describedwith two parameters.
Hence, the number of parameters that go into the newmodel is five. The saturation level of the Logisticfunction, which is the expected total number of unitsto be produced, is one parameter. This parameter iseliminated through expression of the relative number(percentage) of produced units. Then the resultingnumber of parameters in the extended learning curvemodel is only four.
The traditional objective from a statistical point ofview is to estimate the parameters. This is of course areasonable way to perform the modeling when manyobservations are made. However, there are possibili-ties to include even more knowledge into this process.Therefore substantial work has been carried out totransform two of the parameters (c and d) in themodel, to get interpretative parameters.
The following interpretative parameters were identi-fied after the transformation:
- Price in the reference year;
- Relative accumulated volume sold today;
- Main part of the life cycle time to the product – theperiod between 10 % and 90 % penetration of theproduct (growth period);
- Proportion of cost decrease when the productionvolume is doubled (the learning curve coefficient).
In many situations, business case modeling for intro-duction of new products is performed. Then, no dataare available of the production evolution of the newproduct. Even if no data are available, it is possible touse the extended learning curve model for predictionof the costs. And the reason is the interpretativeparameters. Without observations, there are possibili-ties to give a priori values of these parameters.
Information about a probable price in the referenceyear of the product can be collected. The relativevolume sold today nr(0) can be almost 0 or estimatedon the basis of some country data. There is no needto know the worldwide penetration. The growthperiod of the product ∆T has to be roughly estimated.
Figure 8.2 Cost observations and forecasts for SDH equipment costs
Eu
roForecast model for STM equipment costs
0
200
400
600
800
1000
1200
1400
2000 2001 2002 2003 2004 2005 2006 2007 2008 2009 2010
Model
Data

145Telektronikk 4.2004
Remember that the life cycle of the product hasdecreased significantly during the last two decades(Chapter 5). Based on this type of knowledge it ispossible without observations to do some estimates.There exists a priori knowledge about the K factorfor different types of components. This information isavailable from the equipment provider industry if thecomponent is on the market. The advantage of havinginterpretative parameters in the learning curve modelis obvious when cost predictions for new products aredeveloped.
Chapter 8 documented how the extended learningcurve model is applied when a set of observations areavailable. Then, statistical methodology (non-linearestimation) is used to estimate the parameters. Evenin this situation, a priori knowledge is important.The evaluation of the estimated values turned out tobe reasonably good in the two examples presented.However, if for example the main part of the lifecycle of those products was estimated to be 40 years,we know that this is completely wrong and we havethe possibility to adjust the parameter.
The extended learning curve modeling gives thepossibility to include both observations and a prioriknowledge in the cost forecasts.
The extended learning curve is based on insertion ofa three parameter Logistic model which describes asymmetric behavior of the production penetrationaround a turning point for the function. In Annex 3 afour parameter Logistic model with a non-symmetricpattern is used as input to the learning curve. Thisvariant of the extended learning curve model can givea better flexibility for the estimation of the cost evo-lution.
References1 Wright, T P. Factors affecting the costs of aero-
planes. Journal of Aeronautic Sciences, 3 (4),122–128, 1936.
2 Crawford, J R. Learning curve, ship curve, ratios,related data. Lockheed Aircraft Corporation, 1944.
3 Yelle, L E. The learning curve: historical reviewand comprehensive survey. Decision Science,10 (2), 302–328, 1979.
4 Olsen, B T, Zaganiaris, A, Gieschen, N, Tahkoko-rpi, M, Drieskens, M, Markatos, S. RACE 2087/TITAN: Tool for Introduction scenarios andTechno-economic studies for the Access Net-work. In: Proc. RACE Open Workshop on Broad-
band Access, June 7–8, 1993, Nijmegen, theNetherlands.
5 Zaganiaris, A, Gieschen, N, Olsen, B T, Stordahl,K, Tahkokorpi, M, Drieskens, M, Ajibulu, A. Amethodology for achieving life-cycle costs ofoptical access networks-from RACE 2087/TITAN.In: Proc. 11th Annual Conference EuropeanFibre Optic Communications and Networks(EFOC ‘93), June 30 – July 2, 1993, the Hague,the Netherlands.
6 Olsen, B T, Stordahl, K. Forecast of price devel-opment of network components, based on anextension of the learning curve model. Telektron-ikk, 90 (1), 166–172, 1994. (In Norwegian)
7 Olsen, B T et al. Techno-economic evaluation ofnarrowband and broadband access network alter-natives and evolution scenario assessment. IEEEJournal of Selected Areas in Communications,14 (6), 1184–1203, 1996.
8 Ims, L A, Stordahl, K, Olsen, B T. Risk analysisof residential broadband upgrade in a competitiveenvironment. IEEE Communications Magazine,June 1997.
9 Ims, L A, Olsen, B T, Myhre, D. Economics ofresidential broadband access network technolo-gies and strategies. IEEE Network, 11 (1),58–64, 1997.
10 Ims, L A et al. Broadband Access Networks.Chapman & Hall, 1998.
11 Ims, L A, Myhre, D, Olsen, B T. Costs of up-grading the residential telecommunications infra-structure to broadband. In: Proc. Globecom ’98,Sydney, Australia, Nov 8–12, 1998.
12 Ims, L A et al. The economics of broadbandinfrastructure upgrade investments in variousEuropean markets: The EURESCOM view. Tele-com 99 Forum, Geneva, Switzerland, October9–17, 1999.
13 Katsianis, D et al. The financial perspective of themobile networks in Europe. IEEE Personal Com-munications Magazine, 8 (6), 58–64, 2001.
14 Olsen, B T et al. The Business Perspective ofUMTS-WLAN Deployment. In: Proc.ISSLS2002, Seoul, Korea, April 15–18, 2002.

146 Telektronikk 4.2004
15 Stordahl, K, Kalhagen, K O, Olsen B T. Broad-band technology demand in Europe. ICFC 2002,San Francisco, USA, June 25–28, 2002.
16 Elnegaard, N K, Olsen, B T, Stordahl, K. Broad-band Deployment in Rural and Non-CompetitiveAreas. The European Perspective. The Journal ofThe Communications Network, 2 (3), July –September 2003.
17 GAS 10 Handbook. Planning Data and Forecast-ing Methods. Volume 1. Geneva, 1986. ISBN 9261 03081-5.
18 European Commission. Information TechnologyOutlook: ITC diffusion and use. March 2004.
Annex 1 – Relative growth modelWe know that the production volume n and the pro-duction cost per unit Pn are a function of time. Thus
P(t) = n(t)-α · P0 (A1.1)
In principle n(t) is the global accumulated volume forthe world production of a component at time t and P0is the cost of the very first component.
Both of these inputs are sometimes difficult to obtain.These obstacles are easily removed from the learningcurve formulation by using relative values, in whichcase P0 does not appear.
(A1.2)
Furthermore, the global accumulated volume n(t)may be removed from the expression by observingthat
holds true since
where nr(t) and nr(0) are relative values (i.e. normal-ized to 1). Rearranging the expression gives:
(A1.3)
or
P(t) = P(0) · [nr(0)-1 · nr(t)]log2·K (A1.4)
nr(0) is the relative component volume at time t = 0.The relative accumulated component volume nr(t) attime t of the component must be modeled in some way.
In the situation with limited number of observations,it is necessary to make a model of the lifetime ofevery cost component. To be very general we assumethat the best general model to describe the relativeaccumulated volume produced (sold) of a componentnr(t) is the normalized standard demand logistic curvewith four parameters. Hence, the Logistic model isdefined by:
n(t) = [1 + e (c+d·t)]-γ
(A1.5)
where
- c, d and γ are parameters;- t is time.
The model predicts the yearly production volume.If the production volume for the last years is known,it is possible to estimate the parameters c, d and γ.However, in new network architectures, there are alot of rather new or completely new network compo-nents. In this case there is no time series of the yearlyproduction volume. Then we need to be able to inter-pret the parameters and estimate them based on dif-ferent a priori knowledge.
Annex 2 – Reformulation of theLogistic curve in the symmetric caseIn general the Logistic curve is described by abstractparameters, which give no direct meaning. In a situa-tion where hundreds of cost components have to becharacterized, it is important to be able to have amore direct feeling about the reasonable sets ofparameters to be applied. In the following we firstmake the reformulation in the symmetric case withthe γ set to 1.
Instead of using the parameters c and d in the Logis-tic model, the growth period ∆T and the relative pro-duction volume nr(0) at a reference time 0 are intro-duced. It is easier to understand and also easier tohave an opinion about the size of these parametersthan the parameters c and d.
nr(t) = [1 + e (c+d·t)]-1
(A2.1)
c expressed by nr(0):
Setting t = 0 in (A2.1), we get:
nr(0) = (1 + ec)-1
(A2.2)
P (t)
P (0)=
[n(t)
n(0)
]−α
P (t)
P (0)=
[nr(t)
nr(0)
]−α
[n(t)
n(0)
]−α
=
[nr(t)
nr(0)
]−α
P (t) = P (0) ·
[nr(t)
nr(0)
]−α

147Telektronikk 4.2004
Some rearrangements give:
c = ln[nr(0)-1 – 1] (A2.3)
which expresses c in terms of the relative accumu-lated volume at year 0.
d expressed by ∆T:
We define the growth period as the time from thecomponent reaches 10 % of the total productionvolume (saturation) until it reaches 90 %. Then thefollowing equations are defined:
nr(t1) = 0.1 (A2.4)
nr(t2) = 0.9 (A2.5)
Thus
(A2.6)
(A2.7)
(A2.8)
(A2.9)
By dividing the right hand side by the left hand sideof (A2.6) we get
(A2.10)
By definition
∆T = t2 – t1 (A2.11)
(A2.12)
(A2.13)
which express d in terms of ∆T.
Substitution of the expressions of c and d into thelogistic curve gives
(A2.14)
where nr(0) and ∆T are the only parameters.
Annex 3 – The extended learningcurve model based on asymmetricproduction growthThe Logistic curve for various values of the para-meter γ is illustrated in Figure A3.1.
The parameters c and d can be derived as in the sym-metric case giving:
(A3.1)
and by defining δ:
(A3.2)
where δ is a function of γ only.
Finally, we get the expression for δ as a function of∆T:
(A3.3)
Hence, the final expression for price versus time ingeneral is:
(A3.4)
The parameters in the formula are defined by:
P(0), the price in the reference year 0;nr(0), the relative accumulated volume in year 0;∆T, the time for the accumulated volume to growfrom 10 % to 90 %;K, the learning curve coefficient;γ, the asymmetry of the logistic curve.
P (t) = P (0)·⎡⎣nr(0)−1
·
(1 + e
{ln
[nr(0)
−1
γ−1
]+[ ln δ
∆T ]·t})−γ
⎤⎦
log2·K
d =ln δ
∆T
δ =
[(10
9
) 1
γ− 1
][10
1
γ− 1
]
c = ln[nr(0)
−1
γ− 1
]
nr(t) =(1 + e
{ln[nr(0)−1−1]−[ 2·ln 9
∆T ]·t})−1
∆T =−2 · ln 9
d
d =−2 · ln 9
∆T
Figure A3.1 Diffusion curves for different values of γ(from 0.3 to 10)
[1 + e
(c+d·t1)]−1
= 0.1 &
[1 + e
(c+d·t2)]−1
= 0.9
1 + e(c+d·t1) = 10 & 1 + e
(c+d·t2) =10
9
e(c+d·t1) = 9 & e
(c+d·t2) =1
9
ec· e
d·t1 = 9 & ec· e
d·t2 =1
9
ed·(t2−t1) =
1
92
d · (t2 − t1) = −2 · ln 9
0
0,2
0,4
0,6
0,8
1
1,2
-5 0 5 10 15
0,3
0,5
1
2
4
10
-10

148 Telektronikk 4.2004
Borgar T. Olsen received his MSc in physics in 1975 and his DrPhilos degree in 1987 from the University of
Oslo. From 1977 to 1983 he was Research Assistant at the Department of Physics, University of Oslo. From
1984 to 1986 he was Research Fellow at Max-Planck-Institut in Bad Nauheim and Munich in Germany.
Since 1986 he has had a position at Norwegian Telecom Research Department, now Telenor R&D. Since
1992 he has been involved in European projects RACEII2087/TITAN, AC226/OPTIMUM, AC364/TERA, and
IST-2000-TONIC, EURESCOM P306, EURESCOM P413, EURESCOM P614, EURESCOM P901, EURESCOM
P1446 and EUREKA/CELTIC ECOSYS. He has been project manager of the AC226/OPTIMUM and
AC364/TERA projects. He has published several papers in international journals and conferences and is
co-author of the book “Broadband Access Networks” (Chapman&Hall, 1998).
email: [email protected]
For a presentation of Kjell Stordahl, please turn to page 2.

Telektronikk 3/4.2003
1 Is Forecasting Necessary forNetwork Planning?
Network planning is an important activity for theoperators. In order to utilise the resources andinvestment means in the best possible way, it isof crucial importance to have insight in futuretelecommunication demand. A professional fore-casting process will show the expected evolutionof the telecommunication demand.
Questions to be solved in the network planningprocess are:
• Choice of technology and network components• Design of network structure• Routing principles and redundancy in the net-
work• Dimensioning of nodes and routes in the net-
work• Timing of network expansion• Implementation of additional functionality• Introduction of new and enhanced services• Integration of functionality on various OSI
levels• Replacement strategies for old network com-
ponents/old technology• Long-term strategy planning for network evo-
lution
Important forecasts to support the planning pro-cess are:
• Forecasts for service demand• Forecasts for enhanced services demand• Identification of demand for new services• Subscription/access forecasts for the services• Traffic volume forecasts for services and
applications• Busy hour traffic forecasts for services and
applications• Forecasts based on market segmentation• Forecasts taking into account competition and
market share• Forecasts separated into national level,
regional level and local level• Forecasts allocated to the various networks• Forecasts allocated to transport network,
regional network and access network
Specific forecasts are defined by combining theitems on the list.
For example, Telenor SHDSL subscription fore-casts for the business market for one specificlocal access area are based on the following:
• Estimation of potential DSL accesses for dif-ferent market segments, especially type ofindustry (SIC code) and size in the specificarea
• Forecasts of the DSL business penetration inthe area
• Forecasts of the evolution of demand of sym-metric business access demand in the specificarea
• Prediction of expected market share in thespecific area
There are different players in the telecommuni-cation market. Because of open network provi-sioning additional operators have been estab-lished in the market. The access network isavailable based on Local Loop UnBundling andseveral operators hire the copper pair from theincumbents. In addition wholesale has beenintroduced to create a more open and competi-tive telecommunication market with new serviceproviders. The telecommunication market ismore complex and there are even more need forforecast modelling taking into account the newenvironments.
There are always economic risks related to net-work planning. The forecasting process shouldgenerate reduced risks by identifying the newand enhanced applications and make predictionsof access and traffic demand generated by thenew and traditional services in environmentswhere the competition and evolution of expectedmarket share are described.
Of course there are significant uncertaintiesrelated to the forecasting process. Hence, animportant part of the process is to describe theuncertainty and try to incorporate the uncertaintyevaluations into the network planning process.
2 Network Evolution and theForecasts
The circuit switched telephone network hasevolved through certain milestones from beingan analogue network to a network consisting ofonly digital exchanges. The next step was the
Forecasting – An Important Factor forNetwork PlanningK J E L L S T O R D A H L
Kjell Stordahl (58) received hisM.S. in statistics from Oslo Uni-versity in 1972. He worked withTelenor R&D for 15 years andwith Telenor Networks for 15years, mainly as manager ofPlanning Department RegionOslo and then Market analysis.Since 1992 he has participatedin various techno-economic EUprojects (TITAN, OPTIMUM,TERA, TONIC) analysing rolloutof different broadband technolo-gies. Kjell Stordahl has beenresponsible for working pack-ages on broadband demand,forecasting and risk analysis inthese projects. He has pub-lished more than 140 papers ininternational journals and con-ferences.
The paper gives an overview of forecasts and forecast methodology used for network planning. Specific
attention is given to how forecasts are applied for development of strategies and planning. An extensive
list of references is annexed for more detailed studies.
110

111Telektronikk 3/4.2003
introduction of ISDN. Now, Telenor has thehighest ISDN penetration in the world. Duringthe last few years the IP based Internet hasevolved significantly. In Norway the Internetpenetration is more than 60 %. Before the resi-dential broadband take off, the main capacityin the transport network was made up by leasedlines and PSTN/ISDN traffic. A significant partof PSTN/ISDN traffic has been narrowbandInternet traffic.
Now we see conversion of narrowband Internettraffic to broadband ADSL traffic. New servicesand applications are established and new demandgenerated. The broadband platform will be en-hanced either through ADSL2+ or VDSL, whichin turn include broadband entertainment servicesin the fixed network. In parallel HFC networksfrom the cable operators UPC and Telenor Avidihave been deployed and Fixed broadband radiosystems like LMDS are established.
Today there is a significant conversion of voicetraffic from the PSTN/ISDN to mobile networks.The mobile platform is evolving from GSM toGPRS, possibly to EDGE and to UMTS. In addi-tion WLAN hot spots are deployed.
The business market has evolved through dataline switched and data packet switched networkwithout considerable success, to leased lines,Internet and DSL. Now, new services like sym-metric DSL (SHDSL), fast- and GB Ethernet areintroduced.
The market, the established services, the en-hanced and new services and applications createtelecommunication demand. Market forecastsare important and necessary for taking the rightdecisions for network evolution. The forecastshelp to get the right timing from introductionof new network platforms and services. Moredetailed description of the forecasts are shownin [1, 3, 5, 7-8, 11-13, 26-27, 30-31, 34-35, 37,51, 55, 57, 63, 65, 74, 82-83, 85-87].
3 Techno-Economic Toolfor Strategic Evaluationsof New Technology andNetwork Structures
To be able to make the right decision for rollingout a new network platform, a comprehensivetechno-economic analysis has to be carried out.
Within the European programs RACE, ACTSand IST, the projects RACE 2087/TITAN, AC226/OPTIMUM, AC364/TERA and IST-2000-25172 TONIC have developed a methodologyand a tool for calculation of the overall financialbudget of any access architecture. The tool han-dles the discounted system costs, operations,maintenance costs, life cycle costs, net presentvalue (NPV) and internal rate of return (IRR).The tool has the ability to combine low level,detailed network parameters of significant strate-gic relevance with high level, overall strategicparameters for performing evaluation of variousnetwork architectures [40–46, 58–59, 66, 71–72].
Figure 1 TONIC techno-economic tool for investment
projects analysisNPV IRR
Investments
Services Architectures
Year Year Year Year. . .
PaybackPeriod
EconomicInputs
Revenues
OA&MCosts
Life CycleCost
First InstalledCost
Topology
ServicesServices Architectures
Year 0 Year m. . .
Demand for the TelecommunicationsServices
DB
Cash flows,Profit & loss accounts
Year 1 Year n

112 Telektronikk 3/4.2003
Figure 1 shows a techno-economic tool used indifferent international EU projects.
The figure shows that telecommunication de-mand is an input to the tool and to the techno-economic calculations. The TONIC tool iswidely used to analyse economic consequencesby implementing new network platforms. Impor-tant parts of the tool are:
• Service definitions• Subscription and traffic forecasts• Service tariff predictions• Revenue model• A topology model mapping geographic areas
with given penetrations into the tool• Network component cost data base including
more than 300 network components• Network component cost prediction model• Investment model• Operation and maintenance model• Model for economic calculations• Risk analysis model
The following steps are needed in the techno-economic evaluations of the network solutions:
The services to be provided must be specified.The market penetration of these services over thestudy period will be defined. The services haveassociated tariffs, i.e. the part of the tariff that isattributed to the network under study. From thecombination of yearly market penetration andyearly tariff information TONIC calculates therevenues for each year for the selected service set.
Next, the architecture scenarios to provide theselected service set must be defined. This needsnetwork design expertise and is mostly outsideof the framework of TONIC methodology. How-ever, TONIC includes several geometric models,which facilitate the network design by automati-cally calculating lengths for cables and ducting.These geometric models are optional parts of themethodology and TONIC can be used withoutthem. The result of an architecture scenario defi-nition is a so-called shopping list. This list indi-cates the volumes of all network cost elements(equipment, cables, cabinets, ducting, installa-tion etc.) for each year of the study period andthe location of these network components in dif-ferent flexibility points and link levels.
The costs of the network components are calcu-lated using an integrated cost database devel-oped within the TONIC project, containing datagathered from many European sources. Archi-tecture scenarios together with the cost databasegive investments for each year.
The OA&M costs are divided into differentcomponents like cost of repair parts includingcivil work and operations and administrationcosts. Typically the OA&M costs are beingdriven by services, say by number of customersand number of critical network elements.
Investment costs together with the OA&M costsgive the life-cycle cost for the selected architec-ture scenario. Finally, by combining service rev-enues, investments, operating costs and generaleconomic inputs (e.g. discount rate, tax rate)OPTIMUM, cash flows and other economic fac-tors (NPV, IRR, Payback period etc) are calcu-lated.
4 Strategic Evaluationsof New Technology andNetwork Structures
The possibility to introduce new services, en-hanced services, new applications, additionaltraffic growth and generation of additional rev-enue is important for network operators. Strate-gies for introduction of new technologies andnetwork platforms open the possibilities for gen-eration of additional revenue. Some examples ofintroduction of new technology during the last20 years are:
• Establishment of NMT• Deployment of optical fibre and fibre technol-
ogy in the network• Digitalisation of the PSTN• Introduction of ISDN• Establishment of GSM• Introduction of Internet• Establishment of ATM network• Establishment of IP networks• Establishment of SDH transmission technology• Introduction of ADSL
The next step is enhancement of the ADSL plat-form to ADSL2+ or VDSL and for the mobilenetwork UMTS, WLAN and 4G. Importantinput for making the right decisions of introduc-ing new technology has been demand forecastsfor new and enhanced services. The forecastsand tariff predictions give revenue forecasts,which are used together with techno-economicanalysis to support decisions of introduction ofnew technology.
The traffic forecasts are also fundamental fordimensioning the networks and establishingoptimal network structures.
Techno-economic evaluations of new networktechnology is analysed in [2, 4, 14–15, 18–25,28–29, 33, 36, 38–39, 48, 50, 52–54, 60, 68, 70,76, 81, 84, 88–89].

113Telektronikk 3/4.2003
5 Subscriber/AccessForecasting
Network planning of the access network dependsheavily on subscriber forecasts. Until recently,substantial investments in the local telephoneexchanges have been based on forecasts of thesubscriber growth in the local area. The sub-scriber forecasts indicated time for expansionof the telephone exchange. In addition the sub-scriber forecasts were used together with queu-ing models to estimate the busy hour traffic vol-ume in the exchange. When the data traffic waslimited, Erlang’s dimensioning rule was used fortraffic dimensioning taking into account the dis-tribution of residential and business customers.30 years ago the business customer traffic wasdominating and the busy hour was around lunch.Now, traffic from residential customers is domi-nating on the main part of the Norwegian ex-changes. During the last few years the busy hourhas been moved from after the main televisionnews programme to the 21.00–22.00 period,mainly because of the Internet traffic.
ISDN was introduced in the Norwegian market10 years ago. There have been significant substi-tution effects between ISDN and PSTN in thisperiod. The ISDN forecasts consist of: 2B+Dresidential, 2B+D business and 30B+D business.Also multiple ISDN line forecasts will be imple-mented.
The ISDN forecasts have been important for plan-ning and providing new network components.
Because of competition and substitution effectsbetween services, the penetration of PSTN andISDN have saturated the Norwegian network.Now, the new PSTN and ISDN forecasts reflecta smaller number of subscribers. There are twomain reasons for the decrease:
• Some residential customers substitute theirmain telephone subscriptions with mobilesubscriptions
• Some residential customers substitute theirPSTN/ISDN Internet connections with ADSL.
These forecasts are crucial for network planning.The forecasts show as a function of time thespare capacity in the network regarding trafficcapacity and number of connections.
The subscriber forecasts have been importantalso for restructuring the access network. Theforecasts are used for planning and establishingservice connection points in the access networkand for dimensioning the access lines and fibrerings between the service connection points.
Subscription forecasts have been developed for(narrowband) Internet, ATM, ADSL, SHDSL,SHDSL point-to-point, Fast Ethernet and GBEthernet and leased lines. The subscription fore-casts give valuable information for planning, di-mensioning and expanding the network structure.
However, it is important to take into account sig-nificant substitution effects between the services.The ISDN and PSTN forecasts are mutuallydependent. The ADSL forecasts influence sig-nificantly the narrowband Internet forecastsand ISDN and PSTN forecasts. Lost PSTN andISDN market shares for the incumbent increasethe leased line demand forecasts. Subscriptionforecasts for 2.5G and 3G increase the leasedlines forecasts. Increased ADSL subscriber fore-casts and demand for LLUB increase the leasedline forecasts because of expansion of the trafficcapacity between DSLAM and broadband accesspoint, and because of additional traffic in thetransport network. Subscriber demand forecastsfor SHDSL and SHDSL point-to-point andpoint-to-multipoint will lower the leased linesforecasts, since the new services are leased linessubstitutes with cheaper tariffs and a degradedservice quality.
To be able to control the dependencies, forecast-ing models for the different services are linkedtogether.
6 Traffic ForecastingAn important part of network planning is designof network structures. The PSTN/ISDN consistsof the access network including local exchanges,region networks including group exchanges andthe long distance network including long dis-tance exchanges and national exchanges. Tomaintain a high degree of reliability, indepen-dent routes are established between local ex-changes and group exchanges on the one handand between group exchanges and long distanceexchanges on the other hand. Between the longdistance exchanges there is a logical mesh net-work. However, even when there is a mesh net-work there is a simpler physical network takinginto account the logical mesh network abilities.The physical network is based on deployed fibrerings and SDH transmission equipment.
Network planning designs optimal structure ofthe network with the nodes (exchanges) and theroutes by minimising the costs for a given redun-dancy. Important factors are the exchange sites,the route length and the capacity on the routes.Specific network planning tools have also beendeveloped to minimise the investments. Differ-ent tools have been developed for the access net-work and for the transport network. The toolscan be applied for establishing new networkstructures or for expanding the network.

114 Telektronikk 3/4.2003
The traffic forecasts are important input fordesigning the network and for dimensioning theexchanges and capacity on the different routesand as input to the network planning tools.
The busy hour traffic forecasts quantify increases/decreases in the traffic. The dimensioning calcu-lations based on queuing theory add some extracapacity to control random variation in the traf-fic load during the busy hours. When the trafficon a route or in an exchange approaches thecapacity, an expansion will be carried out. Theexpansion of the capacity will be based on theforecasts for a given planning period.
The forecasting procedure described is used notonly for the PSTN/ISDN but for other networkslike PSDN, Frame relay/ATM, Digital CrossConnect, various IP networks, networks formobile operators and leased lines. There are dif-ferent possibilities for making traffic forecasts.One possibility is to measure the traffic and usethe traffic measurements as a historic databasefor the forecasts. One problem is rerouting of thetraffic based on new network structures orbecause of change of interconnection sites in thenetwork. Such changes affect the traffic mea-surements, which have to be adjusted before theforecasts can be developed. Another possibilityis to analyse the total traffic growth in the givennetwork and make the forecasts on the aggre-gated level.
A detailed description of the traffic forecastingprocedure for the transport network is describedin [1]. The traffic forecasting procedure for thetransport network is rather complex since thenetwork carries business and residential trafficfrom all the other networks.
7 Capacity ForecastsModels for making traffic forecasts during thebusy hour have been described. However, thecapacity needed to carry the traffic is higher.Additional capacity has to be dimensioned tak-ing into account stochastic variations around themean traffic in the busy hour. Usually Erlang’sblocking formula is applied for voice traffic,while Lindberger’s approximation is useful fordimensioning the data traffic capacity [90]. Thetraffic will probably be transported on SDH sys-tems where packet overhead is added. In addi-tion the systems’ average load factor is less thanthe maximum capacity. Finally there will in gen-eral be some extra dimensioning since the ex-pansion of the network is planned and deployedstepwise. A planning period is defined as thetime between two expansions. The duration ofthe planning period is found by taking intoaccount the repeating costs by performing theexpansion and the unused investment meansduring part of the period. The optimal planning
period is found by minimising the total costs.The estimation of additional capacity depends onthe planning process and the technical systemsand will vary from one incumbent to another.
8 Forecasting MethodologiesA variety of forecasting models are used for pre-dicting the evolution of the telecommunicationmarket. An important task is collection and anal-ysis of statistics – historical data. A lot of re-sources are used to maintain rather large cus-tomer based systems. An extraction of datafrom these systems is used to create subscriptionstatistics, which is a base for subscriber fore-casts. In addition specific measurement systemsare established to extract traffic measurementson specific points in the networks and also onthe aggregated level.
The forecasting models take into account histori-cal data. The most common models for accessforecasts are:
• Diffusion models• Regression models• Econometric models• ARIMA models• Kalman filter models• Smoothing models
The access forecasting models have to take intoaccount substitution effects between services aspointed out in chapter 5. Even the competitionbetween the incumbent and the other operatorsinfluences not only the access forecasts but alsothe BOT and leased lines forecasts. Telenor isusing a rather comprehensive composite modelwhere the substitution effects between PSTN,ISDN, Leased lines, ADSL, VDSL/ADSL2+,HFC, FTTH, FWA are included. Important fac-tors in the model are the predicted technologycoverage for the coming years, the predictedmarket shares etc.
The most common models for traffic forecastsare:
• Regression models• Econometric models• ARIMA models• Kalman filter models• Smoothing models
In addition specific forecasting procedures canbe used. The traffic is generated by sources andmoves in a network from source to a set of sinks.To dimension the network, it is important toknow the traffic behaviour from the edge routersor the local exchanges. The traffic streams aremapped in a traffic matrix. Each element in thematrix denotes the traffic between two ex-changes. Suppose the number of exchanges is

115Telektronikk 3/4.2003
N. Then an NxN matrix describes the traffic be-tween all exchanges. Specific forecasting proce-dures can be used to forecast the traffic in thenetwork or the matrix. The procedures are usedwhen the network structure is stable during acertain period.
The best known traffic matrix forecasting proce-dure is Kruithof’s method [103]. The methodmakes traffic matrix forecasts based on the ob-served traffic matrix, let us say at time 0, andforecasts of the outgoing traffic and forecasts ofthe incoming traffic from an exchange, let us sayat time t. The outgoing traffic corresponds to therow sums in the traffic matrix and the incomingtraffic corresponds to the column sums. Therewill be inconsistency between the row sums attime 0 and the forecast row sums at time t and inthe same manner for the column sums. To reachconsistency, Kruithof’s method tries to take intoaccount both the traffic structure at time 0 andthe row and column forecasts in the best possibleway. Hence Kruithof’s method uses an iterationprocedure to get a compromise between the traf-fic matrix structure at time 0 and the forecasts.The iteration procedure upgrades the rows in thetraffic matrix to correspond with the row sumforecasts. Then the iteration procedure upgradesthe columns in the traffic matrix to correspond tothe column forecasts. After some iterations theadjusted traffic matrix elements correspond tothe row and column forecasts, which gives atraffic matrix forecast at time t.
An extension of Kruithof’s method can be per-formed by making point-to-point forecasts foreach element in the traffic matrix together withforecasts of the outgoing traffic and incomingtraffic from each exchange and then adjust thetraffic elements in the matrix based on theexchange forecasts using the same iterationprocedure.
A further extension of Kruithof’s traffic matrixforecasting procedure has been developed. Theweighted least squares method is based on thefact that the relative uncertainties in the trafficelement forecasts are larger than the row andcolumn sum forecasts. The method calculatesthe adjusted traffic element forecasts by takinginto account the relative uncertainty in the trafficelement forecasts and the row and column sumforecasts. The different forecasts are found byweighting the forecasts according to their uncer-tainty using weighting least square method.
Extended least square method takes also intoaccount the total traffic forecasts for the wholetraffic matrix. The total traffic is defined as thesum of the row sums or the sum of the columnsums in the matrix, which of course are identi-cal. The method is based on the statistical princi-
ple to use as much information as possible.Hence, forecasts of the traffic elements, the rowsums, the column sums and the total traffic areused. The model is described as follows:
• Cijt is the traffic between i and j at the time t• Ci.t is the traffic from i at time t• C.jt is the traffic from j at time t• C..t is the total traffic at time t
The forecasts at time t is given by Cijt, Cijt, Cijtand C..t respectively. The extended weightedleased square forecasts are denoted by {E} andfound by solving the following minimisationproblem:
The square sum Q is defined by:
Q = Σ αij. (Eijt – Cijt) + Σ βi (Ei.t – Ci.t)
+ Σ γj (E.jt – C.jt) + Σ δ (E..t – C..t)
where {αij}, {βi}, {γj} and δ are given constants.The square sum is minimised given that adjustedforecasts {E} are consistent, i.e. satisfy the con-dition that the row sum is equal to the row sumforecasts of each element and the column sum isequal to the column sum forecasts of each ele-ment and the sum of the elements in the wholematrix is equal to the total forecasts. A naturalchoice of the weights is the inverse of the vari-ance of forecast uncertainty of the forecasts. Oneway to find estimates of the forecasts’ uncer-tainty is to perform ex-post forecasts and thencalculate the mean square error. The solutionof the minimisation problem is found by usingLagrange’s multiplicator method adding the con-straints based on consistency in the adjustedforecasts. By using the method we get N(N + 3)+ 2 equations when N is the dimension of thetraffic matrix. The solution of the system ofequations gives the traffic matrix forecasts.
The forecasts methodologies are described inmore detail in [91–103].
9 Forecasts Uncertainty andthe Risk
There are always uncertainties connected toforecasts. Network planning decisions have to bemade based on expectations of future evolution.The uncertainty in the evolution can be classi-fied in the following main groups:
• Uncertainty in market (penetration and marketshare) forecasts
• Uncertainty in tariff forecasts (predictions)
• Uncertainty in network component cost pre-dictions.

116 Telektronikk 3/4.2003
The effect of uncertainty in the predictions shouldbe quantified to examine the consequences. Thefirst step is to find the most critical variables inthe project. The next step is to perform calcula-tions based on variation in the critical variablesto identify the consequences.
One possibility is to apply sensitivity analysis.Another and more advanced method is to usethe risk analysis. The output in an economic riskanalysis is net present value (NPV), internal rateof return (IIR) and pay back period. One of theoutputs or all of them simultaneously can beused in risk analysis.
Instead of using the expected forecast, say attime t, a probability distribution of the forecastat time t has to be used. Similar probability dis-tributions have to be constructed for all criticalvariables. Usually truncated Normal distribu-tions or Beta distributions are used.
A Monte Carlo simulation with 1000 – 5000 tri-als is performed. In each trial, a random numberis picked from the predefined probability distri-butions; one for each of the critical variables.The simulation gives as output the cumulativedistribution of NPV, IIR and pay back periodand the ranking of the critical variables accord-
ing to their impact. This uncertainty ranking isbased on the percentage to the contribution tothe variance of the NPV or the rank correlationwith the NPV.
A commercial spreadsheet application CrystalBall has been integrated with the techno-eco-nomic tool. A graphical interface in Crystal Ballmakes it possible to specify the distributionfunctions directly from a palette type of menuinside the techno-economic model.
The risk analysis has been applied on a set ofdifferent cases studying strategies for rolling outnew network technology [6, 9–10, 16–17, 32,37, 47, 49, 56, 61–64, 67, 69, 73, 75, 77, 78–80].
10 ConclusionsThe paper documents that forecasts and forecastmethodology are important factors in the net-work planning process and strategy process forrolling out new technology platforms. Since theforecasts are uncertain, it is recommended to userisk analysis to evaluate the risk generated byforecasts and predictions of other critical vari-ables. For more detailed studies the papers inthe reference list should be studied.
Figure 2 Risk analysis
• Statistical Variation of the inputparameters
• Using Monte Carlo Simulation• Results: probability distribution,
risk profile of the business case• Extended basis for investment
decisions
Component Price
Service Penetration
Revenue per customer
0.68 0.74 0.80 0.86 0.92
1.09 1.54 2.00 2.46 2.91
0.55 0.78 1.00 1.23 1.45
kECU
Frequency Chart
.000
.007
.013
.020
.027
0
67.25
134.5
201.7
269
-3000 -1000 1000 3000 5000
10 000 Trials 52 Outliers
NPV

117Telektronikk 3/4.2003
References1 Stordahl, K. Traffic forecasting models for
the incumbent based on new drivers in themarket. Telektronikk, 99 (3/4), 122–127,2003 (this issue).
2 Elnegaard, N K, Olsen, B T, Stordahl, K.Broadband deployment in rural and noncompetitive areas: The European perspec-tive. In: Proc FITCE 2003, Berlin, Germany,September 1–4, 2003.
3 Stordahl, K, Kalhagen K O. Broadband fore-cast modelling. Evaluation of methodologyand results. International Symposium onForecasting 2003, Merida, Mexico, June16–19, 2003.
4 Welling, I et al. Techno-Economic Evalua-tion 3G & WLAN Business Case FeasibilityUnder Varying Conditions. In: Proc 10thInternational Conference on Telecommuni-cations, Tahiti, French Polynesia, February23 – March 1, 2003.
5 Stordahl, K, Kalhagen, K O. BroadbandAccess Forecasts for the European Market.Telektronikk, 98 (2/3), 21–32, 2002.
6 Elnegaard, N, Stordahl, K. Deciding on opti-mal timing of VDSL and ADSL roll-outs forincumbents. Telektronikk, 98 (2/3), 63–70,2002.
7 Kalhagen, K O, Elnegaard, N K. AssessingBroadband Investment Risk Trough OptionTheory. Telektronikk, 98 (2/3), 51–62, 2002.
8 Stordahl, K. Developing demand forecastsand tariff predictions for different telecomservices both for fixed and mobile based onresults from the IST TONIC project. IIRTelecoms Market Forecasting 2002, Prague,Czech Republic, October 7–10, 2002.
9 Kalhagen, K O, Elnegaard, N K. The Eco-nomics and Risks of 3rd Generation MobileService Deployment. Launching AppealingMobile Services, September 18–19, London,UK.
10 Elnegaard, N K. How to incorporate thevalue of flexibility in broadband access net-work rollout investment projects. 41st Euro-pean Telecommunications Congress (FITCE),Genova, Italy, September 4–7, 2002.
11 Stordahl, K, Kalhagen, K O, Olsen, B T.Broadband technology demand in Europe.2002 International Communications Fore-casting Conference, San Francisco, USA,June 25–28, 2002.
12 Hjelkrem, C, Stordahl, K, Bøe, J. Forecast-ing residential broadband demand with lim-ited information. A long term supply anddemand model. 2002 International Commu-nications Forecasting Conference, San Fran-cisco, USA, June 25–28, 2002.
13 Olsen, B T, Stordahl, K. Traffic forecastmodels for the transport network. In: ProcNetworks 2002, Munich, Germany, June23–27, 2002.
14 Monath, T et al. Economics of Ethernet ver-sus ATM-based access networks for broad-band IP services. In: Proc Networks 2002,Munich, Germany, June 23–27, 2002.
15 Varoutas D et al. Economic viability of 3GMobile Virtual Network Operators. In: Proc3G Wireless 2002, San Francisco, USA,May 28–31, 2002.
16 Kalhagen, K O, Elnegaard, N K. The Eco-nomics and Risks of 3rd Generation MobileService Deployment. In: Proc 3G 2002,Amsterdam, Netherlands, May 20–23, 2002.
17 Stordahl, K, Elnegaard, N K. Battle betweencable operator and incumbent: OptimalADSL/VDSL rollout for the incumbent. In:Proc. XIV International Symposium on Ser-vices in the Local access, ISSLS 2002, Seoul,Korea, April 14–18, 2002.
18 Olsen, B T, Kalhagen, K O, Stordahl, K.Provisioning of broadband services in non-competitive areas. In: Proc. XIV Interna-tional Symposium on Services in the Localaccess, ISSLS 2002, Seoul, Korea, April14–18, 2002.
19 Elnegaard, N K, Stordahl, K. Deciding onthe right timing of VDSL rollouts: A realoptions approach. In: Proc. XIV Interna-tional Symposium on Services in the Localaccess, ISSLS 2002, Seoul, Korea, April14–18, 2002.
20 Monath, T et al. Economics of Fixed AccessNetworks for broadband IP services (in Ger-man). 3. ITG-Fachtagung Netze und Anwen-dungen, Duisburg, Germany, February 28 –March 1, 2002.
21 Katsianis, D et al. The financial perspectiveof the mobile networks in Europe. IEEE Per-sonal Communications Magazine, 8 (6),58–64, 2001.

118 Telektronikk 3/4.2003
22 Ims, L A et al. Building a solid business planfor developing fibre in the access network.In: Proc. Optical Access Networks, London,UK, Oct 3–5, 2001.
23 Ims, L A et al. End-to-end-solutions for Tel-cos – is it a Broadcaster’s World? In: Proc.Interactive Convergence, London, UK, Sep3–5, 2001.
24 Ims, L A et al. From a large scale VDSLmarket trial towards commercial services –key issues. In: Proc. DSLCon Asia, HongKong, China, Aug 13–16, 2001.
25 Elnegaard, N K et al. From VDSL markettrials to commercial launch – The key issueson content, services, technical platform andthe business case. In: Proc. XDSL Summit,Geneva, Switzerland, July 11–13, 2001.
26 Hjelkrem, C. Forecasting with limited infor-mation: A study of the Norwegian ISDNaccess market. Journal of Business Fore-casting, 20 (3), 2001.
27 Stordahl, K, Elnegaard, N K, Olsen, B T.Broadband access rollout strategies in acompetitive environment. In: Proc. OpticalHybrid Access Network/Full Service AccessNetwork workshop, Yokohama, Japan, April3–5, 2001.
28 Ims, L A et al. Market driven deploymentof next generation networks – increasingthe service footprint by hybrid broadbandaccess. In: Proc. Hybrid Optical AccessNetwork 2001 (HOAN 2001), Yokohama,Japan, April 3–5, 2001.
29 Elnegaard, N K, Stordahl, K. Broadbandrollout strategies. In: Proc. 17th EuropeanNetwork Planning Workshop, Les Arcs,France, March 19–23, 2001.
30 Stordahl, K, Elnegaard, N K. Broadbandmarket evolution in Europe and the upgraderisks. 2000 International CommunicationsForecasting Conference, Seattle, USA,September 26–29, 2000.
31 Stordahl, K, Moe, M, Ims, L A. Broadbandmarket – The driver for network evolution.In: Proc. Networks 2000, Toronto, Canada,September 10–16, 2000.
32 Elnegaard, N K, Stordahl, K, Ims, L A. Therisks of DSL access network rollouts. In:Proc. Networks 2000, Toronto, Canada,September 10–16, 2000.
33 Stordahl, K et al. Optimal roll out strategiesfor XDSL broadband upgrades of the accessnetwork. In: Proc. International Telecommu-nication Society 2000, Buenos Aires,Argentina, July 2–5, 2000.
34 Stordahl, K, Ims, L A, Moe, M. Forecasts ofbroadband market evolution in Europe. In:Proc. International TelecommunicationSociety 2000, Buenos Aires, Argentina, July2–5, 2000.
35 Hjelkrem, C. Forecasting access demandwhen information is scarce : A case study ofthe Norwegian ISDN market. In: Proc. Inter-national Telecommunication Society 2000,Buenos Aires, Argentina, July 2–5, 2000.
36 Cerboni, A et al. Evaluation of demand fornext generation mobile services. In: Proc.International Telecommunication Society2000, Buenos Aires, Argentina, July 2–5,2000.
37 Stordahl, K et al. Broadband upgrading andthe risk of lost market shares Under Increas-ing Competition. In: Proc. ISSLS 2000,Stockholm, Sweden, June 19–23, 2000.
38 Elnegaard, N K, Stordahl, K, Ims, L A. Roll-Out Strategies for the Copper Access Net-work: Evolution towards a Full ServiceAccess Network. In: Proc. ISSLS 2000,Stockholm, Sweden, June 19–23, 2000.
39 Katsianis, D et al. The Economics of NextGeneration Mobile Systems. ISSLS 2000,Stockholm, Sweden, June 19–23, 2000.
40 Olsen, B T. Introduction to telecom invest-ments and techno-economics. SAS session.Techno-economics of multimedia servicesand networks, ICC 2000, New Orleans,USA, June 18–22, 2000.
41 Stordahl, K. Broadband market evolution –demand forecasting and tariffs. SAS session.Techno-economic methodologies and casestudies, ICC 2000, New Orleans, June18–22, 2000.
42 Ims, L A. Designing case studies. SAS ses-sion. Techno-economics of multimedia ser-vices and networks, ICC 2000, New Orleans,USA, June 18–22, 2000.
43 Olsen, B T. The TERA project – main objec-tives and results. SAS session. Techno-eco-nomics of multimedia services and networks.ICC 2000, New Orleans, USA, June 18–22,2000.

119Telektronikk 3/4.2003
44 Stordahl, K. Overview of risks in multimedianetworks. SAS session. Techno-economicmethodologies and case studies, ICC 2000,New Orleans, June 18–22, 2000.
45 Ims, L A. Case studies on broadband access:HFC, LMDS, VDSL, ADSL. SAS session.Techno-economics of multimedia servicesand networks, ICC 2000, New Orleans,USA, June 18–22, 2000.
46 Olsen, B T. The challenge of predicting costevolution. SAS session. Techno-economicsof multimedia services and networks, ICC2000, New Orleans, USA, June 18–22, 2000.
47 Stordahl, K. Case studies on broadbandaccess: Market risk analysis for fiber roll-out. SAS session. Techno-economics of mul-timedia services and networks, ICC 2000,New Orleans, USA, June 18–22, 2000.
48 Olsen, B T, Stordahl, K, Ims, L A. Evolutionof network architectures. In: Proc. 16thEuropean Network Planning Workshop,Les Arcs, France, March 20–24, 2000.
49 Stordahl, K et al. Overview of risks in Multi-media Broadband Upgrades. In: Proc.Globecom ’99, Rio de Janeiro, Brazil,December 5–10, 1999.
50 Ims, L A et al. The economics of broadbandinfrastructure upgrade investments in variousEuropean markets : The EURESCOM view.Telecom 99 Forum, Geneva, Switzerland,October 9–17, 1999.
51 Stordahl, K. Identifying the key risks in net-work development, taking into accountuncertainties in market forecasts and compe-tition. In: Proc. Future proof network plan-ning strategies, Vision in Business, Berlin,Germany, September 27–28, 1999.
52 Ims, L A. Introduction to broadband accessnetworks. Telektronikk, 95 (2/3), 2–22, 1999.
53 Ims, L A. Wireline broadband access net-works. Telektronikk, 95 (2/3), 73–87, 1999.
54 Ims, L A. Design of access network casestudies. Telektronikk, 95 (2/3), 251–253, 1999.
55 Stordahl K, Rand, L. Long term forecasts forbroadband demand. Telektronikk, 95 (2/3),34–44, 1999.
56 Stordahl, K, Ims, L A, Olsen, B T. Riskmethodology for evaluating broadbandaccess network architectures. Telektronikk,95 (2/3), 273–285, 1999.
57 Istad, S, Stordahl, K. Broadband demandsurvey in the residential and SOHO marketin Norway. Telektronikk, 95 (2/3), 45–49,1999.
58 Olsen, B T. OPTIMUM – a techno-eco-nomic tool. Telektronikk, 95 (2/3), 239–250,1999.
59 Tahkokorpi, M, Lähteenoja, M. Techno-Eco-nomic Guidelines for TelecommunicationNetworks and Services. Telektronikk, 95(2/3), 236–238, 1999.
60 Ims, L A et al. Towards broadband access inNorway – the view from Telenor. Telektron-ikk, 95 (2/3), 191–201, 1999.
61 Elnegaard, N K, Ims, L A, Stordahl, K.Techno-economic risk assessment of PNOaccess network evolutionary paths. Telek-tronikk, 95 (2/3), 286–290, 1999.
62 Stordahl, K et al. Risk methodology formultimedia projects assessments. In: Proc.ECMAST 1999, Madrid, Spain, May 26–28,1999.
63 Stordahl, K. Evaluation of key risks inbroadband network development taking intoaccount uncertainties in market forecasts andcompetition. In: Proc. Future Network Plan-ning Strategies, Vision in Business, London,March 2–4, 1999.
64 Elnegaard, N K, Stordahl, K. Technologychoice risk analysis and its impact on yourbusiness development and market position-ing. In: Proc. Future Proof Network Plan-ning Strategies, Vision in Business, London,UK, March 2–4, 1999.
65 Hjelkrem, C. Forecasting the demand forISDN accesses when the information isscarce : A case study from the Norwegianmarket. International Business Forecasting99, Las Vegas, USA, February 26, 1999.
66 Budry, L et al. The economics of broadbandservice introduction : Area specific invest-ments for broadband upgrade. In: Proc.TRIBAN, Bern, Switzerland, November17–19, 1998.
67 Stordahl, K et al. Broadband access networkcompetition – analysis of technology andmarket risks. In: Proc. Globecom ‘98, Syd-ney, November 8–12, 1998.

120 Telektronikk 3/4.2003
68 Ims, L A et al. Economics of broadbandaccess network upgrade strategies: TheEuropean perspective. In: Proc. Globecom’98 Access Networks Mini Conference,Sydney, November 8–12, 1998.
69 Stordahl, K et al. Evaluating broadbandstrategies in a competitive market using riskanalysis. In: Proc. Networks 98, Sorrento,October 18–23, 1998.
70 Ims, L A, Myhre, D, Olsen, B T. Investmentcosts of broadband capacity upgrade strate-gies in residential areas. In: Proc. Networks98, Sorrento, Italy, October 18–23, 1998.
71 Lähteenoja, M et al. Broadband access net-works: techno-economic methodology andtool application results. IEEE symposiumon planning and design of broadband Net-works, Montebello, Quebec, October 8–11,1998.
72 Ims, L A (ed). Broadband Access networks :Introduction Strategies and Techno-eco-nomic Evaluation. London, Chapman &Hall, 1998. (ISBN 0 412 82820 0)
73 Stordahl, K, Ims, L A, Olsen, B T. Riskanalysis of residential broadband upgradesbased on market evolution and competition.In: Proc. Supercom ICC ’98, Atlanta, June7–11, 1998.
74 Stordahl, K. Forecasting long term demandfor broadband services. In: Proc. Marketforecasts in the telecoms industry, Instituteof International Research (IIR), Hong Kong,May 25–27, 1998.
75 Olsen, B T et al. Multimedia business casesin a deregulated environment : Opportunitiesand risks. ISSLS 1998, Venice, March22–27, 1998.
76 Ims, L A et al. Key factors influencinginvestment strategies of broadband accessnetwork upgrades. In: Proc. ISSLS ‘98,Venice, Italy, March 22–27, 1998.
77 Stordahl, K. Evaluating broadband upgradestrategies in a competitive market using riskanalysis. Institute of International Research(IIR). In: Proc. Evaluating Broadband Ser-vice Strategies, London, UK, February18–20, 1998.
78 Ims, L A, Stordahl, K, Olsen, B T. Riskanalysis of residential broadband upgrade ina competitive environment. IEEE Communi-cation Magazine, June, 1997.
79 Ims, L A, Olsen, B T, Myhre, D. Economicsof residential broadband access networktechnologies and strategies. IEEE Networks,11 (1), 58–64, 1997.
80 Stordahl, K. Risk assessments of broadbandupgrade strategies. In: Proc. Broadbandstrategies – the battle for the customer, IBCconference, London, December 4–5, 1997.
81 Ims, L A et al. Evolution of technologies andarchitectures to a full services network. In:Proc. Broadband strategies – the battle forthe customer, IBC conference London,December 4–5, 1997.
82 Stordahl, K. Forecasting long term demandfor broadband services and their influenceon broadband evolution. Institute of Interna-tional Research (IIR). In: Proc. MarketForecasting in the Telecoms Industry,London, UK, December 1–4, 1997.
83 Stordahl, K, Ims, L A, Olsen, B T. Forecastsand risk analysis of PNO and Cable opera-tors by introducing broadband upgrades inthe access network. 1997 InternationalCommunication Forecasting Conference,San Francisco, June 24–27, 1997.
84 Ims, L A et al. Key factors influencing theoverall costs and project values of broadbandaccess network upgrades. NOC ‘97,Antwerp, Belgium, June 17–20, 1997.
85 Stordahl, K. Forecasting long term demandfor broadband services in the residentialmarket: Devising a method for developingforecasts for new services. Institute of Inter-national Research (IIR). In: Proc. MarketForecasting in the Telecoms Industry, Lon-don, UK, May 19–21, 1997.
86 Hjelkrem, C. Forecasting models for ISDNaccesses in the Norwegian market and theirinfluences on the investments strategies.Institute of International Research (IIR). In:Proc. Market Forecasting in the TelecomsIndustry, London, UK, May 19–21, 1997.
87 Stordahl, K. Techno-economic analysis,market forecasts and risk analysis of broad-band access network upgrading. In: Proc.13th European Network Planning Workshop,Les Arcs, France, March 9–15, 1997.
88 Olsen, B T. Access Network Evolution. In:Proc. 13th European Network PlanningWorkshop, Les Arcs, France, March 9–15,1997.

121Telektronikk 3/4.2003
89 Olsen, B T et al. Techno-economic evalua-tion of narrowband and broadband accessnetwork alternatives and evolution scenarioassessment. IEEE Journal of Selected Areasin Communications, 14 (8), 1996.
90 Lindberger, K. Analytical methods for thetraffical problems with statistical multiplex-ing in ATM network. In: Proc. 13th Interna-tional Teletraffic Congress, Copenhagen,June 19–26, 1991.
91 Stordahl, K. Methods for traffic matrix fore-casting. In: Proc. 12th International Tele-traffic Congress, Torino, Italy, June 1–8,1988.
92 Stordahl, K. Extended weighted minimumsquared method for forecasting traffic matri-ces. In: Proc. VII Nordic TeletrafficSeminar, Lund, Sweden, August 25–27,1987.
93 Stordahl, K. Forecasting models for networkplanning. In: Proc. VI Nordic TeletrafficSeminar, Copenhagen, Denmark, August28–30, 1986.
94 Stordahl, K, Damsleth, E. Traffic forecastingmethods for network planning. In: Proc. 6thInternational Conference on Forecastingand analysis for business in the informationage, Tokyo, Japan, August 1986.
95 ITU. Procedures for traffic matrix forecast-ing. Geneva, ITU, 1986. CCITT Com II 50-E.
96 Stordahl, K. Prognoser som grunnlag forplanlegging. (“Forecasts as a base for plan-ning”). Telektronikk, 82 (3), 1986.
97 Stordahl, K, Holden, L. Traffic forecastingmodels based on top down and bottom upprocedures. In: Proc. 11th InternationalTeletrafic Congress, Kyoto, Japan, Septem-ber 1985.
98 Stordahl, K. Routing algorithms based ontraffic forecast modelling. Time series analy-ses – Theory and practice. O D Anderson(ed.). Amsterdam, North Holland PublishingCompany, 1985.
99 Stordahl, K. Forecasting models for traffic inthe future broadband network. In: Proc. VNordic Teletraffic Seminar, Trondheim, Nor-way, June 5–7, 1984.
100 ITU. Forecasting of traffic. Geneva, ITU,1984. CCITT Red Book Rec E.506.
101Stordahl, K. Routing algorithms based ontraffic forecast modelling. Time series analy-ses – Theory and practice. Toronto, Canada,August 18–21, 1983.
102Stordahl, K. Centralized routing based onforecasts of the telephone traffic. In: Proc.10th International Teletraffic Congress,Montreal, Canada, June 1983.
103Kruithof, J. Telefoonverkeerrsrekening. DeIngenieur, 52 (8), 1937.

Stordahl et al Networks 2002, Munich, June 23-28, 2002
Traffic forecast models for the transport network Kjell Stordahl Telenor Network, St Olavs plass PO Box 6701, N-0130 Oslo, Norway Phone: + 47 23 250535, + 47 900 99 820, Fax: + 47 23 250505, E-mail: [email protected] Kjell Ove Kalhagen, Borgar T. Olsen, Jørgen Lydersen, Bjørn Olufsen, Nils Kristian Elnegaard (Telenor) Topics: 1A 1 Introduction The line switched voice traffic has traditionally been a significant part of the traffic in the transport network. However, during the recent years Leased lines ordered by different operators and also the Leased lines ordered from the business market have expanded the transport network capacity. A new capacity wave has also started: the data traffic moving from narrowband to broadband. The data traffic is increasing exponentially and will during some years be the dominating traffic in the transport network. Important traffic drivers are broadband applications carried by HFC, ADSL, VDSL, LMDS, UMTS and WLAN. This paper analyses the traffic and capacity evolution of the transport network of an incumbent operator having the possibility to integrate different type of traffic into the network. A traffic volume indicator is developed for traffic increase in the transport network. The access forecast modelling has been developed based on parts of the results from the projects ACT 384 TERA IST-2000-25172 project TONIC [1 – 11]. 2 Market segments Services Traffic from the services is transported on different network platforms or on leased lines. Important services for the transport network are: POTS/ISDN, Internet, Leased lines, PSDN (packet switched data network), Frame relay, ATM, IP Virtual private network(VPN), ADSL/SDSL, VDSL/LMDS, Fast Ethernet, Gigabit Ethernet, Lamda wavelength, Dynamic bandwidth allocation. Market segments An incumbent operator is leasing transport capacity to other operators. In addition the incumbent offers transport capacity to the residential and the business market. The incumbent operator offers transport capacity either via own service provider or as wholesale. A segmentation of the market will be: Residential market: POTS, ISDN, Internet, ADSL, VDSL, LMDS, HFC Business market: POTS, ISDN, IP VPN, Internet, PSDN, Frame Relay, ATM, ADSL, SDSL, VDSL, LMDS, Leased lines, Fast Ethernet, Gigabit Ethernet, Lamda wavelength, Dynamic bandwidth allocation. Operators: ADSL, SDSL, VDSL, LMDS, Leased lines, Fast Ethernet, Gigabit Ethernet IP-VPN, Lamda wavelength, Dynamic bandwidth allocation. (mobile operators, ISPs, other operators) Network platforms Relevant network platforms are: POTS/ISDN, PSDN, Frame Relay/ATM, Digital Cross Connect, Various IP Networks including IP networks for mobile operators, Leased lines. POTS/ISDN is a line switched network. Leased lines have no concentration effect at all, while the other network platforms also have packet switched concentration. 3 Traffic from the residential market The residential market generates different type of traffic: Voice traffic, Dialled Internet traffic, ADSL traffic, VDSL/LMDS traffic

Stordahl et al Networks 2002, Munich, June 23-28, 2002
The voice traffic has nearly reached saturation. During the next years, the line switched voice traffic will be rather stable before parts of the line switched voice traffic are substituted by IP voice. The dialled Internet traffic reaches maximum within a few years. Then the dialled Internet traffic will continuously be substituted by broadband traffic. A battle has already started between broadband operators to capture parts of the broadband market. Broadband access forecasts have been developed in the IST-2000-25172 project TONIC. Figure 1 shows the market share evolution of ADSL, VDSL, FWBB (Fixed wireless broadband) and HFC/cable modem for West European countries.
Figure 1 Market share distribution and prediction of ADSL, VDSL, FWBB and HFC(cable modem) for West European countries Figure 2 shows total broadband penetration. Combination of the figures gives the broadband penetration for each technology.
Figure 2 Broadband penetration forecasts for the residential market
Now, the question is which traffic is carried in the incumbent’s transport network. Usually the cable TV/HFC traffic is carried outside the transport network, while a part (market share) of the penetration of each of the other technologies will be carried in the incumbent’s transport network. A traffic volume forecast indicator,VR(t), for the residential busy hour traffic into the transport network is given by:
VR(t) = Nt Σi=1, 2, 3 bit uit Ait Cit Mit pit (1) where i = 1 denotes voice traffic i = 2 denotes Dialled Internet
0,0
10,0
20,0
30,0
40,0
50,0
60,0
2001 2003 2005 2007 2009
ADSL VDSL FWBB HFC
0,0
10,0
20,0
30,0
40,0
50,0
60,0
70,0
2001 2002 2003 2004 2005 2006 2007 2008 2009 2010

Stordahl et al Networks 2002, Munich, June 23-28, 2002
i = 3 denotes ADSL i = 4 denotes VDSL i = 5 denotes FWBB
Nt is number of households in year t bit is busy hour concentration factor for technology i in year t uit is packet switching concentration factor for technology i in year t Ait is the access capacity utilisation for technology i in year t Cit is mean downstream access capacity for technology i in year t
M it is incumbent’s access market share for technology i in year t pit is the access penetration forecasts (%) for technology i in year t
Market share and access penetration The factor Nt Mit pit represents a forecast of number of households connected to the incumbent’s transport network in year t using technology i. Suppose the incumbent operator have 40% of the ADSL market share and expects to be in the same position the next years, then M3t = 0.40 for t = 2001, 2002, - - -. Mean downstream access capacity The downstream access capacity, C1t, for voice traffic is 64kbs and will be the same the next years. However the downstream access capacity, C3t, for ADSL is changing. Figure 3 shows how the mean downstream access capacity is increasing. Now, the operators offer a set of different access capacities. There will be an evolution from low access capacities to higher access capacities especially because of new and enhanced applications. In addition new functionality such as, bandwidth on demand, will be introduced by the operators. For VDSL the access capacity will be about 24Mbs. However, only part of this capacity will be individual, while the capacity for dedicated TV channels will be a common resource for all households. The market share evolution for different ADSL access capacities is described in the IST-2000-25172 project TONIC. Mean access capacity is calculated according to the distribution of different access capacities for each year. The results are shown in figure 3.
Figure 3 Evolution of predicted average downstream capacity in Mbs for ADSL subscriptions
Access capacity utilisation A broadband customer is not utilising the maximum capacity all the time. The access capacity utilisation factor indicates average capacity use taking into account the proportion of time during the conversation performing downloading and the proportion of time for upstream. The factor also reflects the degree of using the specified bandwidth. Busy hour concentration The busy hour concentration effect is well known. Usually about 10% (b1t = 0,1) of the customers make phone calls in the busy hour. Traditionally Erlang’s blocking formula (assuming exponential interarrival time and holding time) is used for dimensioning. The busy hour concentration factor is increasing because of Internet. For broadband connections the busy hour concentration factor is significantly higher because of heavy users, longer holding times, flat rate and evolution of new applications.
0,00 0,50 1,00 1,50 2,00 2,50 3,00 3,50 4,00 4,50
2001 2002 2003 2004 2005 2006 2007 2008 2009 2010

Stordahl et al Networks 2002, Munich, June 23-28, 2002
The busy hour for residential narrowband and broadband traffic is in the evening. Packet switching concentration The line switched services POTS and ISDN have no packet switching concentration (u1t = 1). The other services have significant concentrations. Internet use constitutes of sessions based downloading, thinking and upload. The traffic will be packet according to the use. Traditional Internet use gives low packet switching concentration. Applications like music on demand and video on demand generate high packet switching concentration. The evolution of the packet switching concentration factor is complex. Uncertainty in the concentration factors Figure 4 shows possible evolutions of combinations between busy hour concentrations and packet switching concentrations. There are significant uncertainties in the evolution. The basis for the predictions in figure 4 is 0,15 (15%) busy hour concentration and 0,20 packet switching concentration in 2001. Four alternatives are defined having a linear yearly increase: Busy hour concentration: 0,15 in 2001 to respectively 0,195 – 0,24 – 0,285 – 0,33 in 2010 Packet switching concentration: 0,20 in 2001 to respectively 0,335 – 0,47 – 0,605 – 0,74 in 2010 Figure 4 Description of possible evolutions of concentrations of ADSL traffic as a function of busy hour and packet switching concentration Figure 2 – 4 show a nearly exponential evolution of broadband penetration, capacity increase and traffic concentration the coming years. The most probable prediction will be between alternative 2 and 3. The traffic volume indicator described in equation (1) has a much stronger exponential evolution because of multiplicative effect the same factors. 4 Traffic from the business market The business market generates following type of traffic/capacity: Voice traffic, Dialled Internet traffic, PSDN, ATM, Frame Relay, DSL traffic, IP Virtual Private Networks (IP VPN) traffic, Leased lines, Fast and Gigabit Ethernet. There are significantly substitution effects between DSL, IP VPN, Leased lines, fast and Gigabit Ethernet, which have to be taken into account in the forecasting process. Leased lines are used to establish fixed connections between sites often based on head office and branch offices or between different enterprises. The established network forms a local network with high service quality. There are no busy hour concentration or packet switching concentration. Leased lines constitute a significantly part of the transport network capacity. Some part of leased lines capacity will be transferred to IP VPN or DSL because of cheaper tariffs and in spite of reduced service quality/SLA. A traffic volume forecast indicator,VB(t), for the business market busy hour traffic is given by:
VB(t) = Nt Σi bit uit Ait Cit Mit pit (2) where the different traffic/capacity types i are defined in the first paragraph of the chapter.
0,000
0,050
0,100
0,150
0,200
0,250
0,300
2001 2003 2005 2007 2009
Alternative 1
Alternative 2
Alternative 3
Alternative 4

Stordahl et al Networks 2002, Munich, June 23-28, 2002
5 Traffic generated by other operators Different operators like mobile operators, ISPs, other fixed network operators lease necessary capacity in the transport network. The capacity demand depends on type of services offered and the market share to the operators and of cause the probability for using the transport network to the incumbent. The mobile operators are important transport network customers using leased lines in the transport network. These operators generate during the next years following traffic:
- 2G traffic (Digital mobile systems such as GSM) - 2.5G traffic (HSCSD, GPRS, EDGE) - 3G traffic (UMTS) - 3.5G traffic (Ubiquitous roaming among 3G and WLAN systems)
The access forecasts for the different systems have been developed in the IST-2000-25172 project Tonic.
Figure 5 Subscriber penetration forecasts for different mobile systems Subscription forecasts for the mobile systems, allowing the subscribers to have more than one subscription have also been developed. The traffic capacity for data applications per user is increasing from 40 kbs to 1,92 Mbs from 2G to 3G, while WLAN offers up to 54Mbs. The traffic forecast model for mobile traffic is similar to the traffic in the fixed network. The busy hour concentration factor and the packet switching concentration factor are extremely important for the dimensioning. The services/applications are defined in different service classes: conversation, streaming, best effort and the capacity is reserved according to service level agreements. The traffic forecasting model, VM(t), for mobile operators is given by:
VM(t) = Nt Σi bit uit Ait Cit Mit pit (3) Here Nt is number of persons, not number of households. Mit denotes the market share to the operator and i = 1, 2, 3, 4 the system generations 2G, 2.5G, 3G and 3.5G. The penetration forecasts pit are shown in figure 5. The capacity Cit is a mean capacity. A 3.5G subscriber has the possibility to use a data rate up to144kbs using UMTS but a significantly higher capacity in WLAN hotspot. The number of hot spots available and the proportion of time the subscriber uses WLAN compared with UMTS give the mean capacity C4t. The factor, Ait, indicates the real utilisation of the capacity. Let VO(t) be the busy hour traffic forecasts for the other operators, then the total of busy hour traffic forecasts, V(t), is given by: V(t) = VR(t) + VB(t) + VM(t) + VO(t) (4) There are definitely possibilities to reduce V(t) since the business traffic has busy hour before/after lunch, while the residential traffic has busy hour in the evening. Since the operators are using leased lines, the capacity is equal during the day and night. Let VBL(t) be the Leased line capacity and VBP(t) be the packet switched traffic in
Subscriber penetration forecasts for different mobile systems
0102030405060708090
100
1997
1998
1999
2000
2001
2002
2003
2004
2005
2006
2007
2008
2009
2010
2G
2.5G
3G
3.5G
Sum

Stordahl et al Networks 2002, Munich, June 23-28, 2002
the business market. Then VB(t) = VBL(t) + VBP(t). The residential broadband traffic is larger than the packet switched business traffic in the busy hour. Suppose that ∆ = 0,2 (20%) of the packet switched business busy hour traffic is transferred during the residential busy hour. Then the adjusted busy hour traffic forecasts V*(t) is: V*(t) = VR(t) + ∆VBP(t) + VBL(t) + VM(t) + VO(t) (5) 6 Capacity forecasts Models for making traffic forecast during the busy hour have been described. However, the capacity needed to carry the traffic is higher. Additional capacity has to be dimensioned taking into account stochastic variations around the mean traffic in the busy hour. Usually Erlangs blocking formula is applied for voice traffic, while Lindbergers approximation is useful for dimensioning the data traffic capacity [12]. The traffic will probably be transported on SDH systems where packet overhead is added. In addition the systems load factor in average is less than the maximum capacity and finally there will in general be some extra dimensioning since the expansion of the network is planned and deployed stepwise. The estimation of additional capacity depends on the planning process and the technical systems and will vary from one incumbent to another. 7 Conclusions A traffic volume indicator has been developed to estimate busy hour traffic increase in the transport network. The indicator estimates the traffic entering the transport network. The traffic volume indicator does not include redundancy and protection capacity in the core network. Telenor is using the traffic volume indicator forecasts as input to transport network planning process – evaluating new network structures, expansion of the network and introduction of new core network technology. The indicator depends of the application evolution and also the tariff regime for broadband services. So far most countries use flat rate for broadband traffic. However, specific applications will overload the transport network heavily if no actions are performed. There exist no incitements to control the size of the traffic in the transport network. A probable solution will be to introduce tariff on high capacity traffic and on bandwidth on demand and specific applications. The traffic forecasts used assume that a new tariff regime for broadband services will be implemented within the next two years. References 1. K Stordahl, N K Elnegaard, “ Risk analysis of broadband access rollout strategies in a competitive
environment”. In Proc Optical Hybride Access Network/Full Service Access Network workshop, Yokohama, Japan, April 4-6, 2001.
2. K Stordahl, N K Elnegaard, “Broadband market evolution in Europe and the upgrade risks”. ICFC Seattle September 26-29, 2000.
3. K Stordahl, N, M Moe, Leif A Ims, K Elnegaard “Broadband market, the driver for network evolution”. Networks 2000, Toronto, Canada, September 10-15, 2000.
4. N K Elnegaard, L A Ims, K. Stordahl “The risks of DSL access network rollouts”. In proc Networks 2000, Toronto, Canada, September 10-15, 2000
5. K Stordahl, L A Ims, M Moe “Forecasts of broadband market evolution in Europe”. In proc ITS 2000, Buenos Aires, Argentina, July 2-5, 2000.
6. K Stordahl “Broadband market evolution – demand forecasting and tariffs”. ICC 2000, SAS session Techno-economics of multimedia services and networks. New Orleans, USA, June 18-22, 2000.
7. K Stordahl, L A Ims, B T Olsen, N K Elnegaard “Broadband upgrading and the risk of lost market share under increasing competition”. In proc ISSLS 2000, Stockholm, Sweden, June 19-23, 2000.
8. N K Elnegaard, L A Ims, K Stordahl “Rollout strategies for the copper access network – evolution towards a full service access network”. In proc ISSLS 2000, Stockholm, Sweden, June 19-23, 2000.
9. K. Stordahl, N. K. Elnegaard, L. A. Ims, B.T. Olsen. Overview of risks in Multimedia Broadband Upgrades. In proc Globecom ’99, Rio de Janeiro, Brazil, Dec 5-10, 1999.
10. K. Stordahl, N. K. Elnegaard, F. Azevedo, L. A. Ims, B.T. Olsen,”Evaluating broadband strategies in a competitive market using risk analysis”. In Proc. Networks 98, Sorrento, Italy, Oct 18-23, 1998.
11. L. A. Ims (editor), «Broadband Access Networks - Introduction strategies and techno-economic analysis», Chapman-Hall, January 1998.
12. K Lindberger “Dimensioning and design methods for integrated ATM networks” In proc 14th ITC, Antibes, France, June, 1994


To be presented at Networks ‘96, Sydney, November 24-29, 1996. 1
Risk assessment and techno-economic analysis of competition between PNO and CATV operators
Kjell Stordahl‡, Leif Aarthun Ims†, Borgar Tørre Olsen†
‡Telenor Network Division, PO Box 6701, St.Olavs plass, N-0130 Oslo, Norway. Phone: +47 22 77 56 86. Fax: +47 22 77 36 72.
†Telenor Research and Development, PO Box 83, N-2007 Kjeller, Norway. Phone: +47 63 84 83 24. Fax: +47 63 81 00 76. E-mail: [email protected]
The paper presents risk analyses and techno-economic analyses of broadband access network upgrade strategies for Public Network Operators and Cable Operators in a competitive environment
in the residential and small business market. The effect of uncertainties in predictions of critical parameters such as demand forecasts and market shares are analysed. The assessed technology
options include broadband twisted pair modems, hybrid fiber coax networks and ATM based passive optical networks.
1. INTRODUCTION The access network is expected to be one of the major battlegrounds of the telecommunication network providers as a full deregulation of the services draws near in Europe. The Public Network Operators (PNO’s) are facing competition from Cable Operators in an almost saturated high revenue telephony market. Most PNO’s are in turn eager to provide distributive broadband services. Currently this Cable Operator-dominated market is characterised by a potentially high revenue, although the residential demand remains uncertain. The difference in existing access networks of the competitors call for quite different upgrade strategies. This advocates for an in-depth study of the existing competing infrastructures, and technology alternatives, which might be the starting point for upgrades to broadband [1-7].
This paper addresses some of the different challenges faced by the PNO and Cable Operators in adapting their present fixed network to competition. The analysis of broadband upgrade alternatives focuses on one of the most competitive market segments: an urban, apartment block area with short outdoor average loop lengths, in which both the PNO and the Cable Operator have an established infrastructure for their own subscribers. The methodology and tool developed within the project RACE1 2087/TITAN2 has been used to evaluate the selected set of network upgrade alternatives and strategies [10]. The techno-economic analysis approach, which includes assessment of the risk, has enabled specific conclusions and general guidelines to be drawn [8,9]. In this paper extensive risk assessments are performed based on forecasts of the residential and small business
1 RACE: Research in Advanced Communications in
Europe. 2 TITAN: Tool for Introduction scenario and Techno-
economic evaluation of Access Networks.
market and market shares between PNO and Cable operators for the services: POTS, N-ISDN, CATV, 2Mbit/s Asymmetric Switched Broadband and 2Mbit/s Symmetric Switched Broadband. Other important economic variables like all network component costs, civil work costs, OAM costs, tariffs etc are predicted for each year, but are not varied according to a probability distribution as for the total market and market shares for each service. The analyses shows the market evolution and how the related uncertainties influence on the risks for PNO and CATV operator.
2. THE CASE STUDY A network evolution during a 10 year period from 1997 to 2007 has been examined. An urban, residential and small business area with the customers living in apartment blocks with an average of 32 dwellings per block has been analysed. The average outdoor loop length from the network concentrator location to the buildings is 400 metres. Network architectures for PNO and Cable Operators have already been established in the area, and the availability of ducts for new cables is low (20% for fibre and 10% for coaxial cable). In the initial year the Cable Operator is assumed to have an existing 450 MHz distribution coax network, whilst the PNO has an existing twisted pair infrastructure for delivering POTS (Plain Old Telephony Service) and N-ISDN (Narrowband Integrated Services Digital Network). For both operators the existing network includes optical access network nodes serving approximately 1.000 subscribers. All of the existing PNO and Cable Operator infrastructures have been fully amortised.

To be presented at Networks ‘96, Sydney, November 24-29, 1996. 2
Table 1. General assumptions
General assumptions Number of households in area 1.024 Number of buildings in an area 32 Number of households per building 32 Duct availability, feeder 100% Duct availability, fibre 20% Duct availability, coaxial cable 10% Civil works cost per metre 25 ECU Global cable length, distribution network 7,46 km Distance, SAP - building 400 m Global cable length, indoor drop network 20,5 km Average cable length, drop network 20 m Discount rate 7,5% Tax rate 30%
3. THE MARKET FORECAST The scope of this paper is the study of the broadband upgrade of the above two networks. New services forecasting and demand projections have recently been reported, derived from current spending patterns of households or from market surveys [11]. In this study a common set of services is assumed to be provided by both operators: POTS, N-ISDN, CATV (Cable Television), 2 Mbit/s Asymmetric Switched Broadband (ASB) and 2 Mbit/s Symmetric Switched Broadband (SSB). The CATV service penetrations used here are European averages. The forecasts of the total market of the broadband bearer services are extracted from a Delphi survey on broadband demand, carried out by TITAN in ten European countries [12,13].
Competition is assumed from 1997 on all services, and hence the market will be shared between the PNO and Cable Operator. The competition has been simulated by appropriate adjustments of the service penetrations. The PNO starts with the majority of the market share of the high-revenue narrowband switched services. The Cable Operator initially has the majority of the market share of the low-revenue CATV service.
Figure 1 shows forecasts for the service penetration in percentage of the small business and residential market for each service studied. The forecasts indicate the evolution from 1997 to 2006. In the same period it is assumed that the PNO operator will maintain 75% of the POTS market and the N-ISDN market, the CATV operator will maintain 75% of the CATV market, while the two operators equally share the broadband market: 50% each. In chapter 6 the penetrations and market shares are simulated around their expected valued according to a Normal distribution to examine how changes in penetrations and market shares influence the risks and the economic outcome of the projects.
Forecasted service penetrations
Ser
vice
pen
etra
tio
n (
%)
0%
10%
20%
30%
40%
50%
60%
70%
80%
90%
100%
1997
1998
1999
2000
2001
2002
2003
2004
2005
2006
POTS
CATV
ISDN
2M ASB
2M SSB
Figure 1. Forecasts 1997 - 2006 of the service penetration (percentage of small business and residential market) for the services POTS, N-ISDN, CATV, 2Mbit/s Asymmetric Switched Broadband and 2Mbit/s Symmetric Switched Broadband
Only the annual subscription tariffs for bearer services have been considered in the analysis. Traffic income is not accounted for, since this is assumed to be trunk network specific revenue. The tariffs used are based on European averages from the TITAN Delphi Survey and other sources. The tariff structure incorporated in the economic analysis includes an evolution of the tariffs during the study period. The evolution of tariffs is strongly related to competition and penetration. The tariff elasticities for the broadband switched services are derived from the Delphi Survey, as described in [14]. The CATV tariff elasticity is modelled by a similar approach. The POTS and N-ISDN tariffs decrease annually by respectively 2% and 4%. The evolution of the annual tariffs are shown in figure 2.

To be presented at Networks ‘96, Sydney, November 24-29, 1996. 3
Annual tariffs
An
nu
al t
arif
fs (
EC
U)
0
500
1.000
1.500
2.000
2.50019
97
1998
1999
2000
2001
2002
2003
2004
2005
2006
2M SSB
2M ASB
ISDN
POTS
CATV
Figure 2. Tariff evolution.
4. BROADBAND UPGRADE OPTIONS The network operators face great strategic challenges in upgrading the physical layer of the very cost sensitive access network, both with respect to selection of transmission medium and system technology. Optical fibre cable, coaxial cable and twisted copper pairs are the relevant wireline transmission media. Alternative system technologies encompass enhanced copper options like ADSL (Asymmetric Digital Subscriber Line), VDSL (Very high-speed Digital Subscriber Line) and HDSL (High bit-rate Digital Subscriber Line), the fibre option of ATM-PON (ATM based broadband Passive Optical Network) and HFC (Hybrid Fibre Coax) for coaxial cable networks [15].
Two different access network upgrade alternatives have been examined for each of the two operators:
1. PNO, alternative 1: FTTN (Fiber To The Node, 1.000 home passed per node) architecture with enhanced copper.
2. PNO, alternative 2: FTTB (Fiber To The Building) architecture based on ATM-PON
3. Cable operator, alternative 1: FTTN architecture based on HFC with Cable modems.
4. Cable operator, alternative 2: FTTB architecture based on HFC.
4.1 PNO upgrade alternatives
The alternative considered highlight the economic and technological implications for moderate operators which aim to utilise the existing twisted pair copper cables as the basic transmission medium, and aggressive operators which extensively upgrade the
network with broadband fibre technology. The former represents a limited degree of service integration, whilst the aggressive upgrade enables an introduction of a full service fibre network. Detailed sketches of the architectures for the PNO alternatives are shown in figures 3 and 4.
Distr.Service Access PointFeederLEX
Local Service Access
Building
CATV
Point (Node)Exchange
2M ASB
PremisesCustomer
ISDNPOTSLC
RSS/RSU POTS
HDSL
Twistedpairs
Public Network OperatorFiber To The Node, enhanced copper architecture
1:4
SDHRing
ADM
OPDXC
ADM
OPDXC
PSTN Exch.
ADSL
To servers
FromHE
NT1
ADSLISDN
2M SSBHDSLTwistedpairs
O/EO/ECoax
Figure 3: The PNO FTTN upgrade option: FTTN architecture with enhanced copper and a parallel distribution network for CATV.
PNO, FTTN: The PDH ring between the local exchange and the Service Access Point3 (SAP) is replaced by an SDH ring in 1997. In the distribution network ADSL and HDSL equipment is installed to provide new services like 2 Mbit/s ASB, i.e. Service on Demand (SoD), and 2 Mbit/s SSB. In addition, a CATV distribution network is installed.
3 The Service Access Point refers to the network
localisation of the concentrator, as used in several European countries with modern access network infrastructures.

To be presented at Networks ‘96, Sydney, November 24-29, 1996. 4
Distr.Service Access PointFeederLEX
Local Service Access
Building
Point (Node)Exchange PremisesCustomer
Public Network OperatorFiber To The Building, ATM-PON
CATV1:4FromHE
O/EO/E 1:4
IWUTo
servers
2M ASB
2M SSB1:4 1:4
ATM OLT
AONU2M ASB
2M SSB
ADM
ADM
SDHRing OPDXCOPDXC
ISDNPOTSLC
RSS/RSU POTS
Twistedpairs
NT1 ISDN
PSTNExch.
ATM
Figure 4: The PNO FTTB upgrade option: FTTB architecture with an ATM broadband passive optical network for broadband services and a parallel distribution network for CATV. (The ATM exchange is not included in the calculations.)
PNO, FTTB: New technology is introduced during the period from 1997 to 2002. The PDH point to point connection to the HUB is replaced by an SDH based ringstructure. The deployment of an ATM-PON in an FTTB configuration is started in 1997 in order to provide new services like SoD and 2 Mbit/s SSB. In addition, a combined fibre-coax network for CATV distribution is installed in 1997.
4.2 Cable Operator upgrade alternatives
The Cable Operator upgrade alternatives represent moderate operators which only partially integrate their network by sharing duct layout, and aggressive operators which fully integrate the network by providing the service set over the same duct layout, transmission medium and network termination units as well. Detailed sketches of the architectures for the Cable Operator alternatives are shown in figures 5 and 6.
Cable Operator, FTTN: The existing coaxial cable infrastructure between the access node serving 1.000 subscribers and the homes are kept during the upgrade period. In 1997 the CATV network is upgraded to bi-directional network with return path. All services are then offered on the integrated coaxial cable network. Cable modems are installed at the customer premises. 10 Mbit/s shared access data modems are for used for 2 Mbit/s ASB.
POTS
Distr.NodeFeederHUB Building
NodeHUB Customer Premises
Cable OperatorFiber To The Node, Hybrid Fiber Coax
To LEX
ISDN
2M SSB
2 Mbit/s
CATV
1:4
ISDN-BAmodem
POTSmodem
ISDN-PRAmodem
Datamodem
CNU 2M
CNU 4M
2M ASB
O/E CoaxO/E
NB HDT
Cable router
To servers
2Mbit/s ASB
POTS, ISDN2Mbit/s SSB
To HE
Figure 5: The Cable Operator FTTN upgrade option: FTTN architecture with a HFC network for all services.
Cable Operator, FTTB: Fibre is deployed to the buildings in 1997. This yields a fibre rich network with separate fibres between the HUB (serving approximately 4.000 homes) and the buildings. Cable modems are installed, with 2 Mbit/s dedicated channels access data modems are provided for 2 Mbit/s ASB subscribers.
POTS
Distr.NodeFeederHUB Building
NodeHUB Customer Premises
Cable OperatorFiber To The Building, Hybrid Fiber Coax
To LEX
ISDN
2M SSB
2 Mbit/s
CATV
ISDN-BAmodem
POTSmodem
ISDN-PRAmodem
2M ASBmodem
CNU 2M
CNU 4M
2M ASB
O/E CoaxO/E
NB HDT
BB HDT
To servers
2Mbit/s ASB
POTS, ISDN2Mbit/s SSB
To HE
Figure 6: The Cable Operator Fiber To The Building upgrade option: FTTB architecture with a HFC network for all services.
5. THE TITAN METHODOLOGY The methodology developed by the RACE 2087/TITAN project has been applied to evaluate the broadband upgrade case [10]. The ability to combine

To be presented at Networks ‘96, Sydney, November 24-29, 1996. 5
low level, detailed network parameters of significant strategic relevance with high level, overall strategic parameters is a key feature of this methodology and tool as compared to other similar assessment methods and tools recently reported [16].
In TITAN the network costs are calculated taking the evolution of component costs into account. The cost trends of the various network elements are derived from initial cost, appropriate learning curve coefficients and network penetration assessment over the study period considered. A database including costs at a given reference year for components, installation, civil works and operations and maintenance (OAM) has been developed within the TITAN project. The database contains data gathered from many European sources. The cable infrastructure costs of the network are calculated using a geometric model which involves parameters such as subscriber density, duct availability and type of civil works as inputs. At first the discounted system cost is derived, then OAM costs are calculated using inputs from the cost database, yielding life-cycle costs. Finally the overall financial budget is calculated for the various projects by incorporating revenue estimates from demand and tariff inputs.
6. RISK ASSESSMENT METHODOLOGY The TITAN tool also contains a methodology for calculating economic risks. The main point in risk analysis is to introduce a probability distribution instead of the expected value for each critical parameter in the model. A simulation program called Crystal Ball based on Latin Hyper Cube simulations is used in combination with the TITAN tool to calculate economic outputs based on various set of the critical parameters. These includes a procedure is made for linking the parameter values in time based on prediction function for the expected value and for the standard deviation.
In this paper, the competition between PNO and Cable operators is modelled by adjustments of the service penetrations. The methodology for risk assessment is used to analyse the effect of uncertainties in predictions of critical parameters. These include:
• The respective market shares (in percentage) of the PNO and the Cable operators
• Total market demand forecasts for POTS, N-ISDN, 2Mbit/s ASB, 2 Mbit/s SSB and CATV.
• Tariffs • Costs of key network elements
6.1 Risk assessment assumptions
The assumptions used in the risk assessments are shown in figure 1, figure 7 and table 2. For each service penetration and each market share one
expected value and one estimated standard deviation are given.
Table 2. Expected values and estimated standard deviations of market shares to PNO operator and Cable operator for each service studied
Expected values and standard deviations Value Standard
deviation PNO market share, POTS and ISDN
75 % 7,5 %
PNO market share, CATV 25 % 2,5 % PNO market share, 2 Mbit/s ASB/SSB
50 % 5 %
Cable op. market share, POTS/ISDN
25 % 2,5 %
Cable op. market share, CATV
75 % 7,5 %
Cable op. market share, 2 Mbit/s ASB/SSB
50 % 5 %
For each variable the values uniquely defines a Normal distribution. The set of Normal distributions are used to simulate all service penetrations and market shares. Since all service penetrations and market shares are simulated simultaneously, it is necessary to perform a great number of repeated runs for getting a representative output of the economic results of the different upgrade alternatives studied.
Standard deviation trend
Sta
nd
ard
dev
iati
on
tre
nd
(%
)
0%
2%
4%
6%
8%
10%
12%
14%
16%
18%
20%
1997
1998
1999
2000
2001
2002
2003
2004
2005
2006
POTS
ISDN
2M ASB
CATV
2M SSB
Figure 7. Estimated standard deviations of forecasted service penetration (percentage of small business and residential market) 1997 - 2006 for the services POTS, N-ISDN, CATV, 2Mbit/s Asymmetric Switched Broadband and 2Mbit/s Symmetric Switched Broadband

To be presented at Networks ‘96, Sydney, November 24-29, 1996. 6
In the risk analysis the simulated value is obtained by adding to the mean forecasted value the product of the standard deviation values shown in figure 7 and the normal distribution, as shown in figure 8.
-3 -2 0 2 3
Total market forecast, ISDN
Figure 8. The normal distribution applied to the total market forecast for ISDN.
The forecasted values used here are the Net Present Value4, the Net Present Value divided by Installed First Costs and Payback period.
7. RESULTS AND DISCUSSION The risk assessment has been applied to all four technical upgrade alternatives and the following results illustrate the uncertainty in the different techno-economic outputs and the ranking of parameters having the most important effects on the uncertainty.
7.1 PNO, Fibre to the node (FTTN)
Figure 9 shows the frequency distribution of net present value based on the variation of the market inputs.
Cell K11 Frequency Chart 998 Trials Shown
,000
,010
,019
,029
,038
0
9,5
19
28,5
38
200.000 375.000 550.000 725.000 900.000
Forecast: npv
Figure 9. Frequency distribution of the net present value
The expected net present value is about 532.000 ECU. There is a 10% probability that the net present value will be less than 402.000 ECU.
4 The NPV as used here is the discounted accumulated
revenues minus the discounted accumulated costs (IFC and running costs). The residual network value is also included in the NPV.
Analysis show that the uncertainty in the total market forecasts for the different services has the strongest influence on the variation of net present value. The most significant effects are contributed by ISDN and POTS. Our study shows that the expected net present value divided by installed first cost is about 1.19. There is a 10% probability that the factor is less than 0.95.
Table 3 illustrates how much the different market variables influence on the variation of net present value divided by installed first cost (NPV/IFC).
Target Forecast: npv/ifc
Total market forecast, POTS 38,5%
Total market forecast, ISDN 28,8%
POTS market share PNO 22,9%
Total market 2M SSB 6,8%
N-ISDN market share, PNO 1,0%
2M ASB market share, PNO 0,8%
CATV market share PNO 0,6%
2M SSB market share, PNO 0,3%
Total market forecast, CATV 0,1%
Total market 2M ASB 0,1%
0% 25% 50% 75% 100%
Measured by Contribution to Variance
Sensitivity Chart
Table 3 Ranking of market variables according to their influence on the variation of net present value divided by installed first cost(NPV/IFC)
Table 3 shows that the uncertainty in the total market forecasts for the different services also has the strongest influence on the variation of NPV/IFC. The most significant effects are contributed by the total market for POTS and ISDN. In addition also the uncertainty in the market share for POTS contributes substantially to the variation.
The expected payback period in this case is 4.12. There is a 10% probability that the payback period is greater than 4.69 years. The uncertainty in the total market forecasts for the different services also have the strongest influence on the variation of net present value. In addition the market shares of ISDN and 2M SSB contributes significantly.
7.2 PNO, Fibre to the building (FTTB)
The expected net present value for the FTTB alternative for the PNO is about 400.000 ECU. There is a 10% probability that the net present value will be less than 285.000 ECU. Analysis show that the uncertainty in the total market forecasts for the different services significantly influence on the variation of net present value. The most significant effect are contributed by the total market for ISDN and POTS and also POTS market share.
Figure 10 shows the frequency distribution of the factor NPV/IFC based on the variation of the market inputs.

To be presented at Networks ‘96, Sydney, November 24-29, 1996. 7
Cell M11 Frequency Chart 993 Trials Shown
,000
,008
,016
,024
,032
0
8
16
24
32
0,20 0,43 0,65 0,88 1,10
Forecast: npv/ifc
Figure 10 Frequency distribution of net present value divided by installed first cost (NPV/IFC)
The expected NPV/IFC is about 0.63. There is a 10% probability that the factor is less than 0.44.
The uncertainty in the total market forecasts for the different services is the most important factor contributing to the variation of net present value. The most significant effect are contributed by total market for ISDN, 2M ASB, POTS and also the market share for POTS.
Figure 11 shows the cumulative frequency distribution of payback period based on the variation of the market inputs.
Cell J11 Cumulative Chart 990 Trials Shown
,000
,248
,495
,743
,990
0
247
495
742
990
4,00 5,50 7,00 8,50 10,00
Forecast: payback
Figure 11 Cumulative frequency distribution of the payback period
The expected payback period is 6.80. There is a 10% probability that the payback period is greater than 8.14 years. The uncertainty in the total market forecasts for the different services again significantly influence the variation of net present value. The most significant effect are contributed by the total market for POTS, CATV, ISDN and also the market share for CATV and 2M SSB.
7.3 CATV, Fibre to the node (FTTN)
The expected net present value is about 215.000 ECU. There is a 10% probability that the net present value will be less than 149.000 ECU.
Table 4 illustrates how much the different market variables influence on the variation of net present value.
Table 4 Ranking of market variables according to their influence on the variation of net present value
Target Forecast: npv
Total market 2M SSB 32,2%
Total market 2M ASB 28,6%
Total market forecast, ISDN 14,3%
Total market forecast, POTS 8,9%
POTS market share Cable operator 7,1%
2M ASB market share, Cable operator 3,2%
2M SSB market share, Cable operator 3,1%
CATV market share, Cable operator 2,0%
ISDN market share, Cable operator 0,5%
Total market forecast, CATV 0,0%
0% 25% 50% 75% 100%
Measured by Contribution to Variance
Sensitivity Chart
Table 4 shows that the uncertainty in the total market forecasts for the different services has the strongest influence on the variation of net present value. The most significant effects are contributed by the broadband services. The expected NPV/IFC is about 0.70. There is a 10% probability that the factor is less than 0.55. The uncertainty in the total market forecasts for the different services has the strongest effect on the variation of net present value. The most significant effects are contributed by the total market for 2M ASB, POTS and ISDN.
Figure 12 shows the cumulative frequency distribution of payback period based on the variation of the market inputs.
Cell J11 Cumulative Chart 993 Trials Shown
,000
,248
,497
,745
,993
0
248
496
744
993
4,25 5,00 5,75 6,50 7,25
Forecast: payback
Figure 12 Frequency distribution of the payback period
The expected payback period is 5.75. There is a 10% probability that the payback period is greater than 6.42 years. The uncertainty in the market shares for the different services is in this case the most important influence on the variation of the payback period.
7.4 CATV, Fibre to the building (FTTB)
The expected net present value is about 96.000 ECU. There is a 10% probability that the net present value will be less than 30.000 ECU.
The uncertainty in the total market forecasts for the different services significantly influence on the variation of net present value. The expected NPV/IFC is about 0.13 which is very low. There is a 10%

To be presented at Networks ‘96, Sydney, November 24-29, 1996. 8
probability that the factor is less than 0.04. Analysis show that the uncertainty in the total market forecasts for the different services is the most important factor contributing to the variation of net present value. The expected payback period is 12.03. There is a 10% probability that the payback period is greater than 13.62 years. The uncertainty in the market shares for POTS and ISDN and the total market for POTS significantly influence on the variation of the payback period.
7.5 Evaluation of uncertainty factors.
The results in 7.1 to 7.4 describe how variation in market variables influence on the economic outcome.
For the PNO, the main uncertainty is caused by forecasts of the total market for POTS and ISDN. In the model the uncertainties connected to the two variables are generated independently. However, there is correlation between the markets. When the POTS market decreases, the ISDN market increases and vice versa. This effect reduces to a certain extent the total uncertainty. The reason for relatively strong influence is explained by high penetration and in addition the tariffs which are significantly higher than for the CATV service. Also market share for POTS influences net present value and net present value divided by installed first cost significantly, while PNO’s market share for ISDN is the most important factor influencing the payback period.
For the CATV operator the forecasts of the total market for broadband services are dominating the uncertainty in the variation of net present value. The variables are also the most important ones for explaining the variation of net present value divided by installed first cost. The penetration for 2M SSB and 2M ASB are low compared with the penetration of CATV, POTS and ISDN, but their standard deviations are relatively high compared with the penetrations. In addition the tariffs are considerably higher than for other services. Also the total market forecasts for ISDN and POTS are of importance both for net present value and net present value divided on installed first cost.
For the CATV operator, the most important contributors to the variation in payback period are the market shares to the services POTS, ISDN, CATV and 2M SSB(only for FTTN). For the FTTB upgrade alternative, forecasts of the total market for POTS and ISDN are of significant importance. The fact is explained with a long payback period, more than 10 years. For the FTTN upgrade alternative, the payback period is less than 6 years. Therefore variables which contribute much to the uncertainty the first part of the 10 years period have the highest weight.
7.6 Evaluation of upgrade alternatives.
The risk analysis show that the net present value of the FTTN solution for the PNP may be reduced by 25% from 532.000 ECU to 402.000 ECU with a 10% probability depending on the market evolution. The respective percentages for PNO FTTB, CATV FTTN and CATV FTTB are: 29%, 31% and 69%. The analysis show about the same behaviour of the factor NPV/IFC for the different alternatives. The NPV/IFC factor is reduced by 20-30% except for CATV FTTB where the decrease is about 70%. The most extreme unprofitable upgrade project is the FTTB for CATV operator which is also underlined by an extremely long payback period. The expected values calculated for the alternative upgrade projects show that FTTN alternatives for both operators have the highest net present values. The NPV/IFC factor range from 1.2 to 0.7 with a payback period from 4.12 to 5.75 years. PNO has the most profitable projects. Since this upgrade projects include all new and old revenues for all services even the FTTN alternatives are quite heavy projects. The FTTB alternative for the PNO is comparable to the FTTN alternative for the CATV operator although slightly less profitable. The FTTB alternative for CATV operator based on the given assumptions, is an extremely unpromising project
8. CONCLUDING REMARKS The risk assessment and additional analysis show that the FTTN alternative for the PNO is the best economic alternative with the lowest risk. The FTTB project for the CATV operator is the least economic alternative and also a high risk project.
The service forecasts of the total market contribute more to the variation of the results compared to the service market shares to the operators. The ordinary services POTS and ISDN generates more uncertainty than the other services, mainly because of the high penetration. Depending on the technical alternative, type of operator and economic output different set market variables explain the main part of the variation.
In this paper only market variables , forecasts of total market penetration and market shares for a set of services, are simulated according to given probability distributions to evaluate their effect on the economic results for various upgrade alternatives. It is important to study the effect of these variations which are based on a set of assumptions mainly from an European Delphi survey. In supplementary analysis also the cost element like civil work costs, OAM costs, cost of network components and also the tariffs should be simulated in order to identify critical risks.
Acknowledgement

To be presented at Networks ‘96, Sydney, November 24-29, 1996. 9
TITAN is project 2087 of the European RACE program. The authors gratefully acknowledge the support of the European Commission and the TITAN project members in carrying out this work.
Members of RACE 2087/TITAN A. Zaganiaris, D. Joram (CNET-France Telecom-F), B.T. Olsen, K. Stordahl, L.A. Ims, T. Øverli (Telenor Research and Development-N), S. Markatos (Univ. Of Athens-GR), M. Tahkokorpi, M. Kalervo, I. Welling (Nokia-FIN), J. Mononen, M. Lähteenoja (Telecom Finland-FIN), N. Kerteux (MET-F), M. De Bortoli, U. Ferrero, M. Ravera, S. Balzaretti, (CSELT-I), M. Drieskens, J. Kraushaar, J. van Hoecke (Raynet-B), N. Gieschen (DBP-Telekom-D), F. Fleuren (KPN-NL), M. De Oliveira Duarte, E. de Castro, M.J. Oliveira (Univ. Aveiro-P), R. Diaz de la Iglesia (Telefonica-SP).
References:
[1] A. Cook, J. Stern, «Optical Fiber Access - Perspectives Towards the 21st Century,» IEEE Communications Magazine, 32 (2), 1994, 78-86.
[2] P. LeBel, R.Oliver, «Residential Broadband Architectures Strategies and Economics,» in Proc. The 7th International IEEE workshop on Optical Access Networks (OAN ‘95), Sep. 24-27, 1995, Nuremberg, Germany.
[3] T. Miki, «Toward the Service-Rich Era,» IEEE Communications Magazine, 32 (2), 1994, 34-39.
[4] L.A. Ims, D. Myhre, B. T.Olsen, J. Mononen, M. Lähteenoja, U. Ferrero, A. Zaganiaris, «Advanced Multiservice Scenarios for Europe: a techno-economic analysis». Submitted to IEEE Communiactions Magazine.
[5] U. Ferrero, M. De Bortoli , D. Myhre, L. A. Ims, B. T. Olsen , M. Lähteenoja, J. Mononen, S. Törmälä , A. Zaganiaris, M. Pousa , I. Orfanos, «Strategies for FITL Introduction: Managing the European Diversity». In Proc. The 7th Workshop on Optical Access Networks 1995 (OAN ‘95), Nuremberg, Germany, September 24-28, 1995.
[6] B.T. Olsen, L.A. Ims, D. Myhre, K. Stordahl, R. Theivindrein: «Technoeconomic Evaluation of Optical Broadband Access Network Scenarios for the residential and business market». In Proc. 21st European Conference on Optical Communications 1995 (ECOC ‘95), Bruxelles, Belgium, September 14-17, 1995.
[7] J.Saijonmaa, M. Tahkokorpi, I.Welling, «Cost of Investment and Revenue Modelling and Analysis of Various Networked Multimedia Services in PTO and Cable Operator Environments,» in Proc. TELECOM ‘95, Technology Summit, vol. 2 pp 629-633, Oct, 3-11, 1995, Geneva, Switzerland.
[8] B.T. Olsen, L.A. Ims, T. Øverli, K. Stordahl, D. Myhre, M. Drieskens, J. Kraushaar, M.
Tahkokorpi, M. Ravera, M. De Bortoli, A. Zaganiaris, S. Markatos, M. Lähteenoja, J. Mononen, F. Fleuren, «PNO and Cable Operator broadband upgrade technology alternatives: a techno-economic analysis,» in Proc. Optical Fiber Conference 1996 (OFC ‘96), Feb. 25 - March 1, 1996, San Jose, USA.
[9] B.T. Olsen, L.A. Ims, T. Øverli, K. Stordahl, D. Myhre, M. Drieskens, J.Kraushaar, A. Zaganiaris, «Techno-economic analysis of PNO and Cable Operator strategies for broadband upgrade of the access network,» in Proc. International Teletraffic Seminar 1995, Nov. 28 - Dec. 1, 1995, Bangkok, Thailand.
[10] B. T. Olsen, A. Zaganiaris, K. Stordahl, L.A. Ims, D. Myhre, T. Øverli, S. Markatos, N. Gieschen, M. Lähteenoja, J. Mononen, U. Ferrero, M. Tahkokorpi, M. Drieskens, J.Kraushaar: «Technoeconomic evaluation of narrowband and broadband access network alternatives and evolution scenario assessment». Accepted for publication in IEEE Journal of Selected Areas in Communications, 14, (8), 1996.
[11] D. P. Luck, «Broadband To The Home: Evolution Scenarios for Australia». In Proc. 13th Annual Conference European Fibre Optic Communications and Networks, EFOC&N ‘95, June 27-30, 1995, Brighton, UK.
[12] K. Stordahl, E. Murphy, «Methods for forecasting long term demand for wide and broadband services in the residential market», IEEE Communications magazine, 13, (2), 1995, 44-49.
[13] K. Stordahl, B.T.Olsen, E. Murphy, A. Zaganiaris, E. Castro, M.Ravera: «Delphi Survey: Forecasting Demand for Wide- and broadband services. From RACE 2087/TITAN». In Proc. 6th International Workshop on Optical Access Networks, October 16-19, 1994, Kyoto, Japan.
[14] K. Stordahl, B.T. Olsen: «Demand Elasticity and Forecasts of Wide and Broadband Services in the Residential Market Based on Results from an International Delphi Survey». 1995 International Communications Forecasting Conference, Toronto, Canada, June 13-16, 1995.
[15] Pugh, G. Boyer, «Broadband Access: Comparing Alternatives», IEEE Communications Magazine, 33 (8), 34-45, 1995.
[16] Siden, «Modelling Tool for assessment of Business OpportunititesIn Proc. 11th International Symposium on Subscriber Loops and Services, ISSLS ‘96, February 4-9, 1996, Melbourne, Australia.P
[17] A. Zaganiaris, B. T. Olsen and K. Stordahl, M. De Bortoli, M. Tahkokorpi: «Life-cycle cost and risk assessment of the access network. From RACE 2087/TITAN». In Proc. 6th International Workshop on Optical Access Networks, Kyoto, Japan, October 16-19, 1994.

To be presented at Networks ‘96, Sydney, November 24-29, 1996. 10
[18] K. Stordahl, B.T.Olsen, E. Murphy, A. Zaganiaris, E. Castro, M. Ravera: «Delphi Survey: Forecasting Demand for Wide- and broadband services. From RACE 2087/TITAN». In Proc. 6th International Workshop on Optical Access Networks, Kyoto, Japan, October 16-19, 1994.

K. Stordahl et al. OVERVIEW OF RISKS IN MULTIMEDIA BROADBAND UPGRADES 1
OVERVIEW OF RISKS IN MULTIMEDIA BROADBAND UPGRADES
Kjell Stordahl Telenor , Nils Kristian Elnegaard TeleDenmark, Leif Aarthun Ims and Borgar Tørre Olsen Telenor
Addr: Kjell Stordahl, Telenor Nett, PO Box 6701, St. Olavs plass, N-0130 Oslo, Norway
1 ABSTRACT The first part of the paper gives an overview of the risks connected to a roll out of a broadband infrastructure. Specific attention is put on market risk, competition risk, regulatory risk, technology risk and operational risk. The risk methodology developed in the ACTS projects OPTIMUM and TERA is described. The paper shows how risk methodology can be applied for evaluation of various network architectures. The second part of the paper presents risk and techno-economic analyses of broadband access network upgrade strategies for Public Network Operators in a competitive environment in the residential and small business market. The effect of uncertainties in predictions of critical parameters such as demand forecasts and market shares are analysed. 2 MARKET RISKS Substantial risks are linked to the predicted evolution of the broadband market. A fundament for the evolution is new and enhanced broadband applications. Uncertain demand forecasts generate significant risks influencing the investments and also other costs. One realisation is an unexpected delay in the demand. Overestimation of the demand implies overestimation of investment costs, where parts of the costs are bundled and not utilised for a period. Underestimation of the demand will generate waiting lines and bad reputation and lost market shares. Also the problems in the roll out, in component and service supply and in service quality will induce bad reputation. If some customers are lost to a competitor, it is difficult to win these customers back. This risk problem is denoted as the churn problem. The customer can be lost from specific market segments, specific user groups or in specific geographic areas. The risks for lost market shares may also be caused of substituting applications and services. 3 COMPETITION RISKS The main objective for the regulator is to establish a competition regime where the newcomers should have a fair competition, while the incumbent operator should have significant handicap. The effect will be reduced market share and power for the incumbent operator and a more balanced market between all operators. The risks and the uncertainty are influenced of unpredicted regulations, number of new competitors and alliances between the operators and also service providers. The risks are lost market shares. The geographic deployment strategy for roll out influences the market shares as well as service mix, service quality, customer support and type of billing
systems compared with the other network operators. Another important competitive factor is the tariffs and the tariff strategy. Significant risks for loosing market shares are linked to the tariff evolution for the different competitors. 4 REGULATORY RISKS Since the public network operators (PNOs) own large parts of the access network, the European regulators have taken some actions to induce competition in the access network. In some countries the PNO have been forced to implement Local Loop UnBundling, LLUB. In other countries specific transmission equipment for permanent access can be hired from the PNO. However there are a lot of uncertainty connected to the actions of the regulator. The regulator may generate changes in some important parts of the telecommunication law. The regulator controls the number of licenses for the operators. The regulator may prevent the incumbent operator for offering given services. The body influences the interconnect tariffs and may also regulate the ordinary tariffs. The regulator controls also the Universal Service Obligation, USO regime. 5 TECHNOLOGY RISKS A wide range of technologies is available for transport of broadband communication. In the access network a fibre node structure or a coax structure have to be deployed. The last part of the access network can be covered by ADSL or VDSL modems on copper, or by the radio solution LMDS or in the future the universal mobile telephone system, UMTS. Other alternatives are satellite communication combined with a wireline return channel or a hybride fibre coax system, HFC. The technologies may substitute each other or may be deployed as supplements in different parts of the network. In the transport network deployment strategies for substitution between PDH and SDH transmission equipment are carried out. In parallel the fibre capacity is expended by introduction of wavelength division multiplexing, WDM. Another

K. Stordahl et al. OVERVIEW OF RISKS IN MULTIMEDIA BROADBAND UPGRADES 2
technical problem not solved is the switching. One possibility is to use ATM, another is to use IP and a third one is to implement ATM over IP. There are substantial risks for implementing the wrong technology at the wrong time. Important questions are: - - time for optimal roll-out
- which geographic areas should be covered at the start - which market segments should be covered at the start - the size of the broadband nodes and the structure is of crucial importance - dimensioning of the network and estimated demand controlled expansion - selection of optimal technology in different parts of the network - strategies for roll out based on competition in specific areas - strategies for robust upgrading of the upper part of the access network giving possibilities for utilising different technologies - strategies for minimising the upfront costs the first period
To get insight in these problems for understanding the risk, economic evaluations of the different technologies have to be performed by rather comprehensive calculations. One possibility is to use the TERA/OPTIMUM tool. Some examples are shown in this paper. 6 OPERATIONAL AND INVESTMENTS RISKS Investment and operational costs can be divided in: - investment costs - operational and management costs - maintenance cost - administrative costs - cost for support systems - customer support costs - marketing costs Implementation of a new broadband network including new services and applications will generate uncertain cost estimates. The main input is demand forecasts for the total market and estimates for lost market shares because of competition. If the forecasts turn out to be completely wrong, then also the investments will be out of scale. Since forecasts for new services are uncertain there are generated substantial cost risks. The network components and the technology standards induce risks when an operator starts a roll out before the standards have been adapted. Additional investments and replacement of rather new components may be necessary. There are substantial uncertainty related to the prediction of component costs. The learning curve forecasts show that the component costs decrease as a function of large scale
production. However, there is significant uncertainty in the predicted component cost evolution. In addition specific technology problems may occur. The quality of some components does not satisfy the norms and have to be replaced by other type of components. The selected manufactory has significant problems and does not satisfy the production specifications. The effect is bad quality for the customers, delivery problems, waiting list and a bad reputation. The same risks can be generated if the demand forecasts, planning, dimensioning, projecting or deployment of the network is pure. 7 ECONOMY RISKS To be able to evaluate a broadband network upgrading, the discounted sum of revenues, investments, operations and maintenance costs etc has to be calculated over 5 – 10 years period. The result can be expressed in net present value, payback period, internal rate of return, installation first costs, life cycle costs, payback each year etc.The economic risks is the sum of all the above mentioned risks. Some of the risk problems mentioned, can be quantified and analysed by using the TERA/OPTIMUM tool which contains an option for risk simulations and assessments.
Important economic risks are caused by:
- higher investment costs than expected - higher operational and maintenance costs than
expected - higher administrative costs - higher customer support and marketing costs than
expected - investments restrictions due to lower profit or new
priorities - reduction of service mix - loose of market shares - higher revenue reductions due to substitution
effect between other services - lower subscription and traffic demand - slower broadband application evolution - restricted regulations. 8 TERA TOOL FOR TECHNO-ECONOMIC EVALUATIONS
Within the European programs RACE and ACTS the projects RACE 2087/TITAN and AC 226/OPTIMUM and TERA have developed a methodology and a tool for calculation of the overall financial budget of any access architecture. The tool handles the discount cost system, operations, maintenance, life cycle costs and the cash balance. This enables a comparison of various optical or hybrid architectures through a global system

K. Stordahl et al. OVERVIEW OF RISKS IN MULTIMEDIA BROADBAND UPGRADES 3
assessment. The tool has the ability to combine low level, detailed network parameters of significant strategic relevance with high level, overall strategic parameters for performing evaluation of various network architectures [1–2].
NPVNPV IRRIRR PaybackPeriod
PaybackPeriod
Economic Inputs
Cash flows, Profit & loss accounts
Geometric Model
Services Architectures
Year 0 Year 1 Year n Year m. . .
Demand for the Telecommunications Services
DB
RevenuesOA&MCosts
Life Cycle Cost
Life Cycle Cost
First Installed Cost
First Installed CostInvestments
Risk Assessment
Figure 1 Model for techno-economic assessments
A methodology has been developed based on an expansion of the Wright and Crawford’s learning curve models to predict future cost of the network components. Geometric (geographic) models are used to map network structures into the tool. A specific model for operations and maintenance costs has been developed. The tool has also a specific module used for risk assessments [3-4]. In addition forecasts of the demand for the services offered and the relating tariffs is necessary for the calculations. Figure 1 gives an overview of the techno-economic model. 9 METHODOLOGY FOR QUANTIFYING THE RISKS Choice of probability functions The uncertainty in the assumptions made has to be quantified with respect to probability functions and limits of the uncertain variables when risk analysis is performed. Since, it is meaningless to operate with negative costs, tariffs or forecasts, the Beta distribution is introduced to solve the problem. Traditionally the Normal distribution can be used, but in cases where there are significant probabilities for generating negative values, the Beta function is recommended. Simulation performance When performing sensitivity and risk analysis, the uncertain parameters are described by suitable probability density functions. The techno-economic scenario is then calculated based on a certain number of times using Monte Carlo or Latin Hypercube simulation; each time a random number is picked from each distribution. In general, it is difficult to give an
advice of number of simulations since there is a dependency of the complexity in each case study analysed. The best way to control the problem, is to do some test-simulations series and calculate the uncertainty in the output distributions. Based on experience so far, the sufficient number of simulations could be 500 – 10000. Figure 2 illustrates how the risk assessment is performed
Figure 2 Risk simulations Methodology for cost predictions and uncertainties The extended learning curve for prediction of component costs has been developed in the OPTIMUM project. The cost prediction curve is dependent of a set of parameters: Starting cost at the starting time, type of component, penetration at the starting time and penetration growth. The TERA cost data base contains estimates on these parameters for all components and generates cost predictions based on the extended learning curve. The methodology takes into account the variation in uncertainty for different technology. For example, the uncertainty in the cost of civil works is smaller than the uncertainty in the cost of electronics. In addition a time component increasing the relative uncertainty is implemented in the model. Methodology for demand forecasts and uncertainties It was decided to develop analytical forecasting models instead of the usual tables as input to the TERA tool. The analytical functions will be part of the new framework for TERA [5]. It is more convenient to use functions instead of tables as input to the tool. In addition the functions give more flexibility for variations when risk analysis is carried out. The models are based on the results from the last Delphi survey performed at the last OPTIMUM workshop in Aveiro in October 1997. Different analytical forecasting models for fitting the Delphi data are

K. Stordahl et al. OVERVIEW OF RISKS IN MULTIMEDIA BROADBAND UPGRADES 4
tested. The extended Logistic model with three parameters gave rather good fitting for 2 Mb/s, 8Mb/s and 26 Mb/s. In addition specific forecasting models for symmetric and asymmetric demand penetration are constructed.
0,00
5,00
10,00
15,00
20,00
25,00
30,00
35,00
40,00
45,00
50,00
2000
2002
2004
2006
2008
2010
2012
2014
2016
2018
2020
2 Mb/s
8 Mb/s
26 Mb/s
Penetration (%) BROADBAND FORECASTS
Figure 3 Broadband penetration forecasts
Tariff predictions and uncertainties The tariffs used are based on European averages given as functions of the penetration according to the demand curves extracted from the OPTIMUM Delphi survey carried out in 1997. The tariffs are service penetration dependant, which is needed in a reasonable risk model. The tariff includes subscription and traffic costs. The costs for the terminal and for the content are not included. Uncertainty distributions have been defined, including trends. Limits are imposed in the model on low and high penetration tariffs. For low penetrations, the tariff is kept constant below 2 % service penetration. Because of the uncertainty in penetration, the tariff for each service will vary in each run of the simulation.
10 RISK EVALUATION WHEN THE
COMPETITION INCREASES In this paper extensive risk assessments are performed based on penetration forecasts and lost market shares for the 2Mbit/s, 8Mbit/s and 26Mbit/s services. The 2 Mbit/s service is offered as an asymmetric and symmetric switched broadband service. The broadband case study A network evolution during a 10 year period from 2000 to 2009 has been examined. Upgrade boundary conditions for the PNO, like the demographic area, the existing networks, overall service take rate and market shares are included in the case study. One of the most competitive market segments is analysed: a highly density residential and small business area with customers living in apartment blocks. The network architectures for PNO have already been established in the area.
The operator aims to utilise the existing twisted pair copper cables as the basic transmission medium. ADSL and VDSL modems are deployed at the local exchange and at the customer premises to offer broadband access; fibres are used as transmission medium in the upper part of the network – FTTLex architecture. The architecture is stepwise expanded by deployment of fibre and fibre nodes (FTTN128 and FTTN512) combined with VDSL modems further down in the access network. Competition and lost market shares The incumbent operator starts by having 100% of the market in year 2000, but is loosing market shares continuously during the study period. In addition the uncertainty in lost market shares is simulated based on different degree of uncertainty.
Figure 4 The market share evolution for the public network operator For each year until year 2005 the market share is reduce relatively with 5%. If the operator deploys FTTN architectures, the market share reach a stationary situation, else the operator continues to 7.5% relative market share each year until year 2009. The market share evolution is illustrated in figure 6. There are significant uncertainty connected to the competition and the estimated market share. Therefore, the uncertainty in the market share evolution is simulated based on: - 10% relative standard deviation - 20% relative standard deviation
- 30% relative standard deviation In addition uncertainty distributions are implemented in the analysis for: - Penetration (2, 8, 26 Mbit/s)
- Symmetric/asymmetric (2Mbit/s) - Tariffs (2, 8, 26 Mbit/s) Results
M a rk e t s h a re
0
20
40
60
80
100
120
2000 2001 200 2 2003 2004 2005 2006 200 7 2008 2009
Y e ar
% F TTLex
F TTN

K. Stordahl et al. OVERVIEW OF RISKS IN MULTIMEDIA BROADBAND UPGRADES 5
The results show that there is a significant probability (on a 10% level) for 50% reduction of the life cycle costs mainly based reduced
Figure 5 Expected life cycle costs and life cyclce cost on 10% and 5% level based on different degree of uncertainty penetration and lost market share. The life cycle costs is defined as the total discounted accumulated costs for the projects including both investment costs and OAM costs. When the operator looses market shares both the costs and the revenue are reduced At the same time there is a 10% probability for a 50% reduction of the net present value. The net present value is defined as the total discounted sum of all costs and all revenue each year. With a fairly high uncertainty in the evolution of lost market share, there is a substantial risk for a negative net present value. Figure 6 shows that there is a 5% risk to get a significant negative net present value if the standard deviation is 30%. If the standard deviation is 20%, the net present value on a 5% level is rather low. However if the standard deviation is 10%, then there are reasonable high estimates for the net present value.
Figure 6 Expected net present value and net present value on 10% and 5% level based on different degree of uncertainty
The results show that large uncertainty in competition and lost market causes significant risks on 5 – 10% probability level. The same results can be shown when there are rather high uncertainty in the tariff evolution and in the estimated penetrations. REFERENCES [1] Olsen, A. Zaganiaris, K. Stordahl, L.Aa. Ims, D. Myhre, T. Øverli, M. Tahkokorpi, I. Welling, M. Drieskens, J. Kraushaar, J. Mononen, M. Lähteenoja, S. Markatos, M. De Bortoli, U. Ferrero, M. Ravera, S. Balzaretti, F. Fleuren, N. Gieschen, M. De Oliveira Duarte, E. de Castro, ″Techno-economic evaluation of narrowband and broadband access network alternatives and evolution scenario assessment,″ IEEE Journal of Selected Areas in Communications, 14 (6), 1996, 1184-1203. [2] A. Ims, B. T Olsen, D. Myhre, J. Mononen, M. Lähteenoja, U. Ferrero, A. Zaganiaris, ″Multiservice Access Network Upgrading in Europe: a Techno-economic Analysis,″ IEEE Communications Magazine, vol. 34, no. 12, Dec. 1996. [3] Stordahl, L.A. Ims, B.T.Olsen, ″Risk assessment and techno-economic analysis of competition between PNO and Cable operators,″ In Proc. Networks ‘96, 6th International Workshop on Optical Access Networks, Sydney, Australia, November 25-29, 1996. [4] Ims L A, K Stordahl, B T Olsen “Risk analysis of residential broadband upgrade in a competitive environment” IEEE Communications Magazine June 1997 [5] Stordahl, E. Murphy, ″Methods for forecasting long term demand for wide and broadband services in the residential market,″ IEEE Communications magazine, 13, (2), 1995.
5%
fractile
10%
fractile
Mean
value10%
standard
dev
20%
standard
dev
30%
standard
dev
0
100
200
300
400
500
600
700
5% fractile
10% fractile
Mean value
10% standarddev20% standard
dev30% standarddev
-100
0
100
200
300
400
500

Risk analysis of broadband access rollout strategies in a competitive environment
Kjell Stordahl
Manager Market analysis Telenor Telecom Solutions PO Box 6701 S Olavs Plass
email: [email protected] Phone: +47 23 250535 Fax: +47 23 250505
Nils Kristian Elnegaard Senior Research Scientist
Telenor Research Department PO Box 83 2007 Kjeller
Norway
Borgar T. Olsen Senior Research Scientist
Telenor Research Department PO Box 83 2007 Kjeller
Norway
Abstract This paper analyses a set of different broadband access rollout scenarios for an incumbent operator in the most competitive market segments: a dense urban area. The residential market and the SOHO market are examined. The analysis focuses on different evolutionary paths starting with the twisted pair copper network. The strategy of the incumbent operator is to roll out ADSL and VDSL at the right time. The timing for rollout depends on a set of critical factors like the infrastructure and area characteristics, component costs, mass production of network components, applications offered, expected tariff evolution, willingness to pay, demand forecasts and evolution of expected market share. The operator aims to utilise the existing twisted pair copper cables as the basic transmission medium. The architecture is stepwise expanded by deployment of fibre and fibre nodes combined with VDSL modems further down in the access network. Net present value (NPV) and internal rate of return (IRR) have been calculated in order to estimate each rollout alternative. A cost break down of various rollout alternatives is shown, giving a better understanding of the viability of each rollout. A techno-economic tool developed in the projects AC 226/OPTIMUM and AC 364/TERA have been used for the calculations. To establish a robust optimal rollout strategy, risk analysis has been performed. Risk analysis takes into account the uncertainties in the critical factors demand, tariffs, market share, and cost evolution of specific equipment. Instead of using single values as input to the calculations, probability distributions of each critical factor are used as input. The probability distributions characterise the uncertainties of the predictions to each factor. A risk simulation tool, Crystal Ball, has been used together with the techno-economic tool. For each rollout alternative, a Monte Carlo simulation of 500 runs has been performed for the risk analysis. The optimal ADSL/VDSL rollout strategy is developed, taking into account both the mean values of the NPV and IRR, and the risk involved.
Introduction Mainly all West-European incumbent operators introduced ADSL commercially during 1999-2000. In North America the number of DSL modem reached 2,0 million accesses third quarter 2000, while the number cable modems reached 3,0 million the second quarter 2000. The battle between the DSL operators and the cable operators has started and the question is how the market share between these technologies is evolving? The incumbent operators face further competition from wholesale and Local Loop Unbundling and also because of LMDS and UMTS operators. The incumbent operator will meet the competition by starting to roll out ADSL and after some years VDSL with the potential of a much broader spectrum of services including video on demand and multimedia applications. This paper examines various rollout and market share scenarios for the incumbent operator. The timing for rollout of ADSL and VSDL is crucial. The rollout case study The rollout case study analyses an exchange area consisting of 34.560 potential customers. A cable operator is deploying a HFC network with cable modems, while the incumbent operator is expanding the network to a DSL network. The cable operator already offers ordinary TV distribution to their customers in the exchange area, while the incumbent operator offers POTS/ISDN and Internet. The introduction of ADSL gives possibilities to offer a large set of new applications like high speed Internet, various home office applications, multimedia applications, but not high quality interactive entertainment applications. VDSL and HFC are assumed to be competitive solutions, which in addition offers high quality broadband like interactive entertainment applications etc. The churn rate for ADSL is rather high, while the churn rate for HFC and VDSL customers are low. The cost for transition of customers from the cable operator to the incumbent operator and vice versa is high. The reasons are that

the customers for a long time have been owned by the operators, either as cable TV customers and/or POTS/ISDN/Internet customers. In addition the customers are strongly linked to the operators by service bundling. The following services (capacity classes) is offered by the incumbent operator: Table 1 Capacity classes
Downstream Capacity [Mbps]
Upstream Capacity [Mbps]
XDSL Technology
0.512 0.128 ADSL 1.024 0.256 ADSL 2.028 0.512 ADSL 6.144 0.640 ADSL 24.576 4.096 VDSL
Technical description The 4 ADSL services are provided from DSLAMs at the local exchange – each DSLAM is supporting up to 768 customers. VDSL services are provided from optical network units (ONUs) places at outside cabinets as well as at the local exchange. Different vendors use different names for the ONU – sometimes ‘DSLAM’ is used. Up to 128 users per ONU is assumed. No passive splitters are used in the architecture. An optical fibre cable carrying 24 fibres feed each ONU. Twisted pair copper is used for the remaining path to the customer. In this study, there has been no analysis on crosstalk (NEXT and FEXT) between xDSL sources. Total broadband penetration (demand) The broadband forecasts are based on a Delphi survey and additional forecast demand data from the TERA project [1, 2, 4, 5, 8]. The forecasts show the demand evolution in a highly competitive residential market where two broadband operators are rolling out a broadband structure. The total broadband demand forecasts are fitted by an extended Logistic model with four parameters:
Y t = M / ( 1 + exp (α + βt))γ
where Yt is the demand forecast at time t, M is the saturation level and α, β, γ are the additional parameters. The accumulated forecasts shown in figure 1, are calculated based on the assumption of 40% penetration in 2005.
Figure 1 Total broadband penetration forecasts The total broadband forecasts are split based on technology (operators) and access capacity. The market share evolutions are described in scenario 1 – 7, depending of different roll out strategies. Tariff evolution/prediction The broadband tariff structure is rather complex. Important tariffs are: connection tariff, access tariff, service provider tariff, traffic tariff, transaction tariff, and tariff for content (pay per view etc). Only some few operators have introduced a traffic tariff when the monthly traffic volume exceeds a given limit. In the case study we suppose free traffic charge and are mainly interested in the demand for accesses. The yearly charge for having a 0.5 Mbps is set to 800 Euro. The tariff model is constructed in the following way: The basic tariff for a 0.5 Mbps is given (800 Euro). The model predicts a relatively 10% decrease of the tariff per year. In addition the model predicts an increase of 40% for each doubling of the downstream capacity for year 2001, while this factor is linearly reduced to 20% in year 2005. The connection tariff is set 150 Euro for 0.5 Mbps and 1 Mbps, while the tariff is 200 Euro for higher capacities
Figure 2 Tariff evolution for access capacities
Br oadband access penet r at i on f or ecast s -
r esi dent i al mar ket
0,0 %
5,0 %
10,0 %
15,0 %
20,0 %
25,0 %
30,0 %
35,0 %
40,0 %
45,0 %
50,0 %
2001 2002 2003 2004 2005 2006
Tariff evolution for access capacities
0
100
200
300
400
500
2001 2002 2003 2004 2005 2006
Mo
nth
ly s
ub
scri
pti
on
tar
iff
(Eu
ro)
24 Mbps
6 Mbps
2 Mbps
1 Mbps
0.5Mbps

Figure 2 shows the erosion of the monthly subscriber tariff, which includes access tariff, service provider tariff and the traffic tariff. Usually the operators have a flat rate tariff for the traffic. Charges for specific applications are not included. Rollout scenarios/Market share scenarios Seven different scenarios are studied. In three scenarios 5 – 7, the cable operator is rolling out broadband network in 2001. In four scenarios 1 – 4, the cable operator is deploying the broadband network to offer the services in 2002. The various scenarios for 2001 and 2002 reflect the incumbent operators timing for ADSL and VDSL rollout. Figure 3 shows the prediction of access demand distributed on the access capacities 0,5 – 6 Mbps in the period 2001 – 2006. The figure shows that there will be continuously demand for higher capacity. The demand is generated of new and enhanced broadband applications and the operators have to meet the capacity demand. Figure 3 Prediction of demand for ADSL access capacities Scenario 1 The incumbent operator offers ADSL in year 2001. The cable operator meets the challenge by deploying HFC offering cable modems in year 2002. One year later the incumbent operator offers VDSL in the same area. Figure 4 show the
Figur 4 Scenario 1: Market share ADSL, VDSL and cable modems
market share evolution. The ADSL market share is reduced from 100% to 50% when the cable operator introduces broadband. The figure shows that the market share for ADSL gradually is decreasing during the study period. At the same time it is difficult for the incumbent operator to take a larger part of the broadband market. Scenario 2 The incumbent operator offers ADSL in year 2002. The cable operator meets the challenge by deploying HFC offering cable modems the same year. One year later the incumbent operator offers VDSL in the same area. Figure 5 show the market share evolution. The cable operator gets 60% of the broadband market the first year since the operator has a more advanced product. The operator takes more market share during the comming years because of late introduction of VDSL.
Figur 5 Scenario 2: Market share ADSL, VDSL and cable modems Scenario 3 The incumbent operator offers ADSL in year 2001. The cable operator meets the challenge by deploying HFC offering cable modems in year 2002. The same year the incumbent operator offers VDSL. Figure 6show the market share evolution. The ADSL market share is reduced from 100% to 45% from 2001 to 2002.The figure shows that the market share for ADSL gradually is decreasing.
0 %
10 %
20 %
30 %
40 %
50 %
60 %
70 %
80 %
2001 2002 2003 2004 2005 2006
Mar
ket
shar
es
ADSL
VDSL
Cable modem -competitor
0 %
10 %
20 %
30 %
40 %
50 %
60 %
70 %
80 %
2001 2002 2003 2004 2005 2006
Sh
are
of
tota
l A
DS
L
ADSL - 512 Kbps
ADSL - 1 Mbps
ADSL - 2 Mbps
ADSL - 6 Mbps
0 %
20 %
40 %
60 %
80 %
100 %
120 %
2001 2002 2003 2004 2005 2006
Mar
ket
shar
e
ADSL
VDSL
Cable modem -competitor

Figur 6 Scenario 3: Market share ADSL, VDSL and cable modems
In spite of introducing VDSL at the same time as the cable operator, the incumbent operator has to fight very hard to get high VDSL market share. It is difficult for the incumbent operator to win larger parts of the market since most of the subscribers have a TV channel subscription by the cable operator. Scenario 4 The incumbent operator introduces an offensive strategy by offering both ADSL and VDSL in year 2001. The cable operator deploys HFC, but is offering cable modems only from year 2002. Figure 7 show the market share evolution. The ADSL starts with 70% market share in 2001, which is gradually reduced. The cable operator introduces broadband later than the incumbent operator and have to fight rather hard to get broadband market share at the same level as the incumbent operator.
Figur 7 Scenario 4: Market share ADSL, VDSL and cable modems Scenario 5 Scenario 5 - 7 describes the situation where the cable operator deploys HFC early and is offering the cable modems already in year 2001. The first scenario shows that the cable operator introduces broadband in year 2001, while the incumbent
operator is offering ADSL. The cable operator gets 70% of the market and is able to hold the market share during the study period in spite of introduction of VDSL in year 2002. Figure 8 show the market share evolution.
Figur 8 Scenario 5: Market share ADSL, VDSL and cable modems
Scenario 6 The cable operator introduces broadband in year 2001, while the incumbent operator is offering ADSL in year 2002 and VDSL in 2003. The cable operator gets 100% of the market the first year. Since incumbent operator introduces VDSL two year after the cable operator, in a market where the cable operator during a lot of years has delivered TV distribution, it is very hard take market share. The incumbent operator ends with 15% market share at the end of the study period. Figure 9 shows the market share evolution
Figur 9 Scenario 6: Market share ADSL, VDSL and cable modems Scenario 7 Scenario iii describes a highly competitive situation where the cable operator in 2001 is offering broadband based on their HFC solution, while the incumbent operator has deployed a VDSL structure in 2001 beeing able to offer the customers both ADSL and VDSL. Since the cable operator has
0 %
10 %
20 %
30 %
40 %
50 %
60 %
70 %
80 %
2001 2002 2003 2004 2005 2006
Mar
ket
shar
es
ADSL
VDSL
Cable modem -competitor
0 %
10 %
20 %
30 %
40 %
50 %
60 %
70 %
80 %
2001 2002 2003 2004 2005 2006
Mar
ket
shar
es
ADSL
VDSL
Cable modem -competitor
0 %
20 %
40 %
60 %
80 %
100 %
120 %
2001 2002 2003 2004 2005 2006
Mar
ket
shar
es
ADSL
VDSL
Cable modem -competitor
0 %
20 %
40 %
60 %
80 %
100 %
120 %
2001 2002 2003 2004 2005 2006
Mar
ket
shar
es
ADSL
VDSL
Cable modem -competitor

delivered TV distribution for a long period, it is assumed that the cable operator will get 60% of the market in year 2001 and is increasing the market share slightly. The incumbent operator starts with 30% ADSL market share and a 10% VDSL market share. The evolution of market share is shown in figure 10.
Figur 10 Scenario 7: Market share ADSL, VDSL and cable modems Results Within the European programs RACE and ACTS the projects RACE 2087/TITAN and AC 226/OPTIMUM and AC364/TERA have developed a methodology and a tool for calculation of the overall financial budget of any access architecture. The tool handles discounted costs of capital investments, operations, maintenance costs, life cycle costs, and revenues as well as net present value (NPV) and internal rate of return (IRR).The tool has the ability to combine low level, detailed network parameters of significant strategic relevance with high level, overall strategic parameters for performing evaluation of various network architectures [6-7, 9-16]. The TERA tool has been used to evaluate techno-economic results of the described scenarios. Figure 11 shows the calculated net present values and the installed first costs for each scenario. Figure 11 Installed first cost and net present value for scenario 1-7
The figure shows that the incumbent operator has to fight rather hard to get a positive net present value when the cable operator starts to roll out broadband in 2001 (Scenario 5-7). The only possible way to get a significant part of the broadband market is to introduce ADSL and VDSL at the same time as the cable operator. In addition the incumbent operator to a certain degree, has to meet the access tariffs to the cable operator. Scenario 6 shows that the incumbent operator gets a significant negative net present value. The reason is too late roll out of broadband and too low market share. The cable operators have not financial strength enough to roll out a broadband structure in all relevant areas during a short time. Hence, scenario 1–4 is important to analyse. The figure shows that the incumbent operators have a possibility to get rather good economical results by rolling out a broadband DSL network in “cable-land”. Scenario 4 indicates a very good net present value for the incumbent operator. The investments depend of the total broadband penetration in the area, the proportion between ADSL and VDSL subscriptions, broadband market share for the incumbent operator and of course the network component costs and the evolution 2001–2006. Figure 11 shows that the installed first costs increases when the incumbent operator gets a larger market share. The proportion between first installed costs and net present value is acceptable for scenario 4, 3 and 7. Uncertainties and risk modelling A series of risk analyses has been carried out- one for each of the seven scenarios. One uncertainty variable is introduced for:
o Price evolution of xDSL equipment o Growth of the total broadband demand (all
services, including competitor’s) o Erosion of monthly access fee
A Monte Carlo simulation with 500 runs is performed for each scenario. In each run of a simulation, a random number is picked from suitable probability distributions; one for each of the 3 uncertainty variables. The simulation gives as output the cumulative distribution of the NPV and the ranking of the 3 uncertainty variables. This uncertainty ranking is based on the percentage to the contribution to the variation of the NPV. From the cumulative distribution, the probability that the project will produce a negative NPV is calculated. In the following, the uncertainty model is described:
0 %
10 %
20 %
30 %
40 %
50 %
60 %
70 %
2001 2002 2003 2004 2005 2006
Mar
ket
shar
es
ADSL
VDSL
Cable modem -competitor
4 000 000
2 000 000
0
2 000 000
4 000 000
6 000 000
8 000 000
10 000 000
12 000 000
4 3 7 1 5 2 6
Scenario
EU
RO NPV
IFC

Price evolution of xDSL equipment: Even though a significant part of the overall investment cost is civil works, this cost is not very uncertain. Therefore the uncertainty is put in new equipment. The price of each xDSL network component ‘i’ (DSLAM, modems etc) follows a learning curve [3, 6, 7, 16]:
( ) ( )tTPKnftf iiiiii ,,,, ,0,0 ∆=
The uncertainty is modelled as a relative uncertainty s(t):
( ) Yatbts )(3.01 ++=
Y is calculated as linear transformation of a Beta-distributed variable X:
minminmax )( YXYYY +−=
The price curve including uncertainty is therefore calculated as;
( ) ( ) ( )tstftf ii =~
The reason for choosing a Beta-distribution is the fact that this distribution is confined between a minimum and a maximum value avoiding negative prices, which would be meaningless. In addition, the Beta-distribution may have many different shapes. The rectangular distribution is a special case of the Beta-distribution. In our calculation, a = b = 1/5 and X is Beta-distributed with parameters µ = ν = 4. Y = X as we have degrees of freedom choosing the parameters a and b. The maximum deviation in the last year is between 0.7 and 1.3. With a 95% confidence, the relative uncertainty in the last year is between 0.79 and 1.21. The same relative uncertainty curve is used for all components so that the learning curves move in the same direction for each run which is plausible as the component prices will be strongly related (same technology, vendor etc.) Tariff erosion The tariff erosion is modelled by a simple percentage reduction. The uncertain tariff erosion is modelled by a linear transformed Beta-distributed random variable as in the price evolution. The default value is 10%. The minimum and maximum values are 0% and 20% respectively. Thee confidentiality interval of Y is [5%, 15%]. By using the simple linear transformation and the Solver function in Excel, the parameters µ and ν are easily found. In fact µ is found using:
( )M
MM
X
XX 121 −+−=
µν
where XM is the mode of X found as (10%-0%)/(20%-0%) = 0.5.
Growth in total broadband demand A general S-curve with asymmetry parameter γ is used to model the total broadband demand. When γ and the saturation parameter are given, the two remaining parameters are found when for instance the penetration in the first and final year are given. We have chosen 5% penetration in 2001 and 40% in 2006. The penetration in 2001 is kept fixed and the penetration in 2006 is changed randomly. Again, a linear transformed Beta-distribution is chosen. The minimum and maximum values for the penetration are 30% and 50% respectively. µ = ν = 3 are chosen. Risk analysis For each Monte Carlo simulation specific values are generated for:
o Price evolution of xDSL equipment o Growth of the total broadband demand (all
services, including competitor’s) o Erosion of monthly access fee
based on the described risk models. For each simulation run a complete set of techno-economic calculations are performed including first installed costs, OAM costs, revenues, cash flow, IRR, NPV, payback period etc. The set of 500 simulations generates an accumulated distribution for each variable. The accumulated distributions are used to evaluate the risk; i.e. to calculate the probability for the variable to exceed given limits. Figure 12 shows for each scenario the probability to have a net present value less than 0.
Figure 12 Probability for having a negative net present value The figure shows that the probability to have a negative net present value for scenario 6 is close to 100%, while the probability for scenario 4 is close to 0%. For the incumbent operator scenario 1, 2, 5, 6 have significant risks for negative net present values. Again, the conclusion is to speed up the
0,00 %10,00 %20,00 %30,00 %40,00 %50,00 %60,00 %70,00 %80,00 %90,00 %
100,00 %
Sce
nario
1
Sce
nario
2
Sce
nario
3
Sce
nario
4
Sce
nario
5
Sce
nario
6
Sce
nario
7

introduction of broadband before the cable operator takes the main part of the broadband market. The question is which of the above mention variables gives the dominated contribution to the net present value uncertainty. Figure 13 answers the question for each scenario. The figure shows that the uncertainty in tariff evolution is the dominated variable – which explains 55% –70% of the variation of net present value. The demand forecasts explains 15% - 35%, while the price evolution of the DSL equipment only contributes with 7% - 17%. The price evolution of DSL equipment seems to be more certain than the tariff evolution. One important argument is that predictions of a sum of component costs are based probably of overestimation of some costs and underestimation of some other costs. The uncertainty in the demand forecasts introduces uncertainty both in the investments and in the revenues, while uncertainty in the tariff predictions only introduces uncertainties in the revenue.
Figure 13 Ranking the sensitivities. Contribution (%) to the net present value uncertainty Figure 13 also illustrates how the uncertainty in market share and market share evolution has an impact on incumbent operator’s net present value. Since the incumbent operator is not controlling the cable operator, there are significant uncertainties and risks related to the timing for broadband roll out. References 1. K Stordahl, N K Elnegaard, “Broadband market
evolution in Europe and the upgrade risks”. ICFC Seattle September 26-29, 2000
2. K Stordahl, N, M Moe, Leif A Ims, K Elnegaard “Broadband market, the driver for network evolution”. Networks 2000, Toronto, Canada, September 10-15, 2000
3. N K Elnegaard, L A Ims, K. Stordahl “The risks of DSL access network rollouts”. Networks 2000, Toronto, Canada, September 10-15, 2000
4. K Stordahl, L A Ims, M Moe “Forecasts of broadband market evolution in Europe”. ITS 2000, Buenos Aires, Argentina, July 2-5, 2000.
5. K Stordahl “Broadband market evolution – demand forecasting and tariffs”. ICC 2000, SAS session Techno-economics of multimedia services and networks. New Orleans, USA, June 18-22, 2000.
6. K Stordahl, L A Ims, B T Olsen, N K Elnegaard “Broadband upgrading and the risk of lost market share under increasing competition”. ISSLS 2000, Stockholm, Sweden, June 19-23, 2000
7. N K Elnegaard, L A Ims, K Stordahl “Rollout strategies for the copper access network – evolution towards a full service access network”. ISSLS 2000, Stockholm, Sweden, June 19-23, 2000.
8. K. Stordahl, L. Rand. Long term forecasts for broadband demand. Telektronikk 95, (2), 1999.
9. K. Stordahl, N. K. Elnegaard, L. A. Ims, B.T. Olsen. Overview of risks in Multimedia Broadband Upgrades. In proc Globecom ’99, Rio de Janeiro, Brazil, Dec 5-10, 1999.
10. K. Stordahl, N. K. Elnegaard, L. A. Ims, B.T. Olsen. Risk methodology for multimedia projects assessments. In Proc ECMAST 1999, Madrid, Spain, May 26-28, 1999.
11. L. A. Ims, D. Myhre, B.T. Olsen, ” Costs of upgrading the residential telecommunications infrastructure to broadband”, In Proc. Globecom ’98, Sydney, Australia, Nov 8-12, 1998.
12. L. A. Ims, D. Myhre, B.T. Olsen, K. Stordahl, A. Ruiz-Cantera, B. Jacobs, B. Rose, M. C. Combes, J. Mononen, M. Lähteenoja, L. Budry, M. Salerno, U. Ferrero, V, Benedetto, D. Collins, ” Economics of broadband access network upgrade strategies: the European perspective”, In Proc. OHAN ’98, Sydney, Australia, Nov 8-12, 1998.
13. K. Stordahl, N. K. Elnegaard, F. Azevedo, L. A. Ims, B.T. Olsen,”Evaluating broadband strategies in a competitive market using risk analysis”, in Proc. Networks 98, Sorrento, Italy, Oct 18-23, 1998.
14. L. A. Ims, D. Myhre, B.T. Olsen, ”Investment costs of broadband capacity upgrade strastegies in residential areas”, in Proc. Networks 98, Sorrento, Italy, Oct 18-23, 1998.
15. L. A. Ims, J. Mononen, M. Lähteenoja, L. Budry, M. Salerno, U. Ferrero, D. Myhre, B. T. Olsen, K. C. Aas, “Key factors influencing investement strategies of broadband access network upgrades”, In Proc. ISSLS ‘98, Venice, Italy, 22-27 March 1998.
16. L. A. Ims (editor), «Broadband Access Networks - Introduction strategies and techno-economic analysis», Chapman-Hall, January 1998.
Sce
nario
1
Sce
nario
2
Sce
nario
3
Sce
nario
4
Sce
nario
5
Sce
nario
6
Sce
nario
7
0,010,0
20,0
30,0
40,0
50,0
60,0
70,0
80,0
Tariff erosion
Demand
Price evolution

157
1 IntroductionThere are many complex and interacting factors withan impact on the economics of telecommunicationinvestment projects. The main factors are the evolu-tion of: applications, technologies, network plat-forms, service quality requirements, cost evolution,demand for new services, price levels, regulatoryenvironment and competition. Telecom projects areinfluenced by future forecasts and predictions of allthese factors.
The network operator’s strategy is governed by esti-mated revenue, expected return on investments andassessed economic risks caused by uncertaintiesin the forecasts and predictions. Introduction of newtechnologies, new applications, new network plat-forms, new architectures etc. depend on the long-termrevenue prospects and also on related uncertaintiesand risks. Strategic decisions play an important rolein the near term positioning when the competition isincreasing. The environment of the telecommunica-tions market is now changing dramatically and willcontinue to do so in the coming years.
New applications and services can be implementedby using the existing network platform, or by expand-ing the network platform, or by introducing new tech-nology and new network platforms. The preferredalternatives depend on the cost of network compo-nents and the cost evolution. The price of the givenapplications depends on investment costs, operationand maintenance costs, and revenue considerations.Demand depends on the expected competition, themarket potential for the applications, expected marketshares, substitution effects between applications, pen-etration as a function of time, price and service qual-ity. In addition there are interactions between themain factors.
In this paper, thorough risk analysis is performed onthe rollout investment case described in this journal[1]. We begin with an introduction to the concepts ofuncertainty and risk, followed by a description of therisk methodology. The risk and sensitivity analysis
performed on the scenarios described in [1] is dis-cussed. Focus is on financial risk in this paper.
2 Uncertainty and riskUncertainty and risk are unavoidable companionsin every business case evaluation. Many high levelassumption variables in a business case, e.g. servicepenetration, ARPU, market share etc. of which thedefault values are chosen from consensus/brainstorm-ing/expert information etc., are inherently uncertain.The variation of these variables may have a vitalimpact on the whole value of the project, whichmeans the difference between success and failure.The first questions that arise are how do we describethe uncertainty in assumptions, and what is actuallythe difference between uncertainty and risk?
To illustrate the concepts of uncertainty and risk, letus start with a simple example. We assume that wehave two projects, A and B, with their respective dis-tributions as shown in Figure 1 (for example obtainedfrom simulations).
The question is now: Which project is more uncertainthan the other, and which project carries most risk? Itis immediately seen from Figure 1 that Project B hasthe highest level of uncertainty due to its higher stan-dard deviation. However, Project A is the riskier ofthe two projects as the 5 % percentile is negative, andtherefore there is a probability of a negative NPVhigher than 5 %. For Project B, however, the proba-bility of a negative NPV is 0 as the minimum value ispositive. The 5 % percentile (Value at Risk) is there-fore also positive.
A “plain” traditional sensitivity analysis is often used,in which each input variable is changed on a one-by-one basis, in order to identify the most significantvariables. However, this is not sufficient if a morecomplete picture of the overall uncertainty is needed.The multivariable sensitivity and risk analysis app-roach applied in this paper is based on the well-known Monte Carlo simulation methodology. In
Analysing the impact of forecast uncertainties inbroadband access rollouts by the use of risk analysisN I L S K R I S T I A N E L N E G A A R D A N D K J E L L S T O R D A H L
Nils Kristian
Elnegaard is
Researcher in
Telenor R&D
Kjell Stordahl is
Senior Advisor in
Telenor Networks
Telektronikk 4.2004
In this paper thorough risk analysis is performed on the rollout investment case described in this
journal [1]. The concepts of uncertainty and risk are introduced, followed by an extensive overview of
various types of uncertainties and risks in telecommunication investment projects. The next part of
the paper describes the risk methodology. The risk and sensitivity analysis performed on the scenarios
described in [1] is discussed. The focus is on financial risk in this paper.

158 Telektronikk 4.2004
short, the difference between traditional “plain”sensitivity analysis and risk analysis based on MonteCarlo simulation is that the former only tells youwhat is possible; not what is probable!
3 Overview of uncertaintiesand risks in broadband tele-communication projects
Market uncertainties and risks
Substantial risks are linked to the predicted evolutionof the broadband market. A fundament for the evolu-tion is new and enhanced broadband applications.Uncertain demand forecasts generate significant risksinfluencing the investments and also other costs. Onerealisation is unexpected delay in the demand. Over-estimation of the demand implies overestimation ofinvestment costs, where parts of the costs are bundledand not utilised for a period.
Underestimation of the demand will generate waitinglines and bad reputation and lost market share. Alsothe problems in the rollout, in component and servicesupply and in service quality will induce bad reputa-tion.
If some customers are lost to a competitor, it is diffi-cult to win these customers back. This risk problemis denoted as the churn problem. The customer canbe lost from specific market segments, specific usergroups or in specific geographic areas. The risk oflost market shares may also be caused by substitutingapplications and services.
Uncertainties are usually expressed by measures likestandard deviations and confidence limits. Traditionalstatistical methods are used to estimate standard devi-ations and confidence limits for given probabilitydensities. However, the situation is often more com-plicated when forecast uncertainties are estimated.
Then there are two sets of uncertainties: Uncertaintiesbased on estimation of parameters in the forecastingmodel and uncertainties caused by the forecastingperiod. The forecasting uncertainties are eitherexpressed directly from the model when Box Jenkinstime series models [3] are used, or in regression mod-els with time, t, as explanatory variable. However,when there are additional explanatory variables thesituation is more complex. Then, the uncertainty ofthe forecasts of each explanatory variable also has animpact on the total forecast uncertainty. In such situa-tions it is difficult to model and estimate the uncer-tainty as a function of time.
Competition, regulatory risks and
uncertainties
The main objective for the regulator is to establisha competition regime where newcomers have a faircompetition, while the incumbent operator has signif-icant handicap. The European Commission has rec-ommended that the regulators perform market analy-sis to identify whether the incumbent is dominatingthe market or not (Significant Market Position).
The effect could be a reduced market share andpower for the incumbent operator and a more bal-anced market between all operators. The risks and theuncertainty are influenced by unpredicted regulations,the number of new competitors, and alliancesbetween the operators and also service providers.
The geographic deployment strategy for rollout in-fluences the market shares as well as the service mix,service quality, customer support and type of billingsystems compared with the other network operators.Another important competitive factor is the tariffsand the tariff strategy. Significant risks of losing mar-ket shares are linked to the tariff evolution generatedby different competitors.
Since the incumbents own large parts of the accessnetwork, the European Commission through Euro-
Figure 1 The difference between uncertainty and risk
0
0.2
0.4
0.6
0.8
1
1.2
a.u
.
Project A
µ=E(X)=11.58
σ=9.06
5%perc.=-2.47
95%perc.=75.17
0
0,2
0,4
0,6
0,8
1
1,2
a.u
.
Project Bµ=E(X)=45.36σ=15.985%perc.=21.6995%perc.=74.03

159Telektronikk 4.2004
pean regulators have taken actions to generate com-petition in the access network by introducing LocalLoop Unbundling, LLU. However there is a lot ofuncertainty connected to the actions of the regulator.The regulator may generate changes in some impor-tant parts of the telecommunication law. The regula-tor controls the number of licenses for the operators.The regulator may prevent the incumbent operatorfrom offering given services. The body influences theinterconnect tariffs and may also regulate the ordi-nary tariffs.
Technology risks
A wide range of technologies are available for trans-port of broadband communication. In the access net-work a fibre node structure or a coax structure has tobe deployed. The last part of the access network canbe covered by ADSL, ADSL2+ or VDSL on twistedpair copper lines, or by the radio solutios such asLMDS, WiFi, WiMax. Other alternatives are satellitesystems combined with a wireline return channel ora hybrid fibre coax system, HFC. The technologiesmay substitute each other or may be deployed as sup-plements in different parts of the network. In parallelthe fibre capacity is extended by introduction ofwavelength division multiplexing, WDM and mainlyIP in the core network.
There are substantial risks of implementing the wrongtechnology at the wrong time. Important questions are:
• Selection of optimal technology in different partsof the network;
• Strategies for rollout based on competition in spe-cific areas;
• Strategies for robust upgrading of the upper part ofthe access;
• Network design giving possibilities for utilisingdifferent technologies;
• Strategies for minimising the upfront costs the firstperiod.
In addition specific technology problems may occur.The quality of some components does not satisfy thenorms and have to be replaced by other types of com-ponents. The selected manufacturer has significantproblems and does not satisfy the production specifi-cations. The effect is bad quality for the customers,delivery problems, waiting lists and bad reputation.The same risks can be generated if the demand fore-casts, planning, dimensioning, projecting or deploy-ment of the network are pure.
Operational and investments risks
Investment and operational costs can be divided into:
• Investment costs• Operational and management costs• Maintenance cost• Administrative costs• Costs of support systems• Customer support costs• Marketing/sales costs.
Implementation of a new broadband network includ-ing new services and applications will generateuncertain cost estimates. The main input is demandforecasts for the total market and estimates for lostmarket shares because of competition. If the forecaststurn out to be completely wrong, then the investmentswill also be out of scale. Since forecasts for new ser-vices are uncertain substantial cost risks are gener-ated. Important questions are:
• Introduction time for optimal rollout;
• Which geographic areas should be covered at thestart;
• Which market segments should be covered at thestart;
• The size of the broadband nodes and the structureare of crucial importance;
• Dimensioning of the network and estimateddemand controlled expansion.
The network components and the technology stan-dards induce risks when an operator starts a rolloutbefore the standards have been adapted. Additionalinvestments and replacement of rather new compo-nents may be necessary. There are substantial uncer-tainties related to the prediction of component costs.The learning curve forecasts show that the componentcosts decrease as a function of large-scale production.However, there is significant uncertainty in the pre-dicted component cost evolution.
Revenue and cost risks
To be able to evaluate a broadband network upgrad-ing, the discounted sum of revenues, investments,operations and maintenance costs etc. has to be cal-culated over a 5–10 year period. The result can beexpressed in net present value, payback period, inter-nal rate of return, installation first costs, lifecyclecosts, pay-back each year, etc. Important revenue andcost risks are caused by:

160 Telektronikk 4.2004
• Lower tariffs than expected;• Reduction of service mix;• Loss of market shares;• Higher revenue reductions due to substitution
effect between other services;• Higher investment costs than expected;• Higher operational and maintenance costs than
expected;• Higher administrative costs;• Higher customer support and marketing costs than
expected;• Investments restrictions due to lower profit or new
priorities.
4 Risk methodologyThe uncertainty in each assumption has to be quanti-fied with respect to a suitable probability densityfunction including “practical limits for variation forperforming risk analysis”.
Data collection
All relevant information, specific assumptions, natu-ral limits, and types of distribution as well as confi-dence intervals have to be collected.
Probability distributions
Suitable probability distributions should be identifiedfor each assumption variable. The choice of probabil-ity distribution depends on the restrictions on thevariable, whether we need some extra degree offreedom such as asymmetry in the distribution etc.In various fields, e.g. physics, economics and socialsciences, empirical data or the law of large numbersdetermine the choice of distribution, e.g. noise inelectrical systems, the evolution of stock prices andpeople’s IQ. IQ values are for example modelled bya normal distribution with mean value 100 for a pop-ulation (age group) and standard deviation 15. How-ever, one should generally be careful using the Nor-mal distribution in simulations if negative numbersare not allowed.
For instance a market share will always be between0 % and 100 %, the value of a stock is non-negativebut can (theoretically) be of infinite value, and pene-tration and costs cannot be negative, etc.
Usually Beta distribution and Log Normal are usedto model important variables in the business cases.Appendix A gives a more detailed description of howthe Beta distribution and Log Normal distribution arefitted.
Risk simulation performance
Output variables have to be identified. Usually netpresent value, internal rate of return and pay-back
period are used to evaluate the economic value ofinvestment projects. Also the number of simulationtrials has to be decided. Then the number of trialsperformed in a simulation shows the impact on theoutput variable.
Thanks to modern easy-to-use software, Monte Carlosimulations can be performed on standard spread-sheet models on a PC. Such software also has splen-did report features, in which the user can specifyresult tables with the complete statistics of the outputvariables such as mean value, standard deviation, per-centiles, etc.
Random numbers are generated in each trial of thesimulation according to the selected distributionsgenerated for each of the selected variables for therisk analysis. The simulation therefore calculates alarge number (maybe thousands; the number of simu-lation trials specified by the user) of what-if scenar-ios. Equally important: the simulation keeps track ofthe calculations by measuring the impact on the resultfrom the changes in each of the variables.
In the simulation package called Crystal Ball® [2],“normal” Monte Carlo or Latin Hypercube Samplingcan be used. In Latin Hypercube Sampling, anassumption’s probability distribution is divided intointervals of equal probability, whereas in the formerapproach the random numbers are picked over theentire range for that distribution.
In general, it is difficult to give advice on the numberof simulations since there is a dependency of thecomplexity in each case study analysed. The best wayto control the accuracy is to do some test-simulationseries and calculate the uncertainty in the output dis-tributions. Based on experience so far, the sufficientnumber of simulations could be 500 – 10,000.
Figure 2 illustrates the concept of Monte Carlo simu-lation. The figure shows how random values aredrawn from probability distributions representinginput variables 1, 2, 3, .... For each trial a value of theoutput variable, here NPV, is calculated. By repeatingthis process 10,000 times a frequency chart (histo-gram) is generated. Figure 2 shows that the histogramforms a probability distribution for the output variable.The final part of the risk analysis is to interpret theinformation from the input and output distribution.
Risk analysis
When the simulation is finalised, the complete statis-tics on the output variable distributions, the correla-tion between output variables is available and can beextracted in a report, which is an Excel workbookwith tables. The samples generated for the input vari-

161Telektronikk 4.2004
ables can also be saved for further analysis. In addi-tion, the impact of each input variable on the givenoutput variable is measured as well – either in termsof the so-called Rank Correlation or the contributionto the variance. Both of these metrics will bedescribed in more detail in Appendix B.
An overview of the uncertainties and risks intelecommunication projects is discussed next beforemoving on to the actual case study in Chapter 5.
5 Risk analysis of ADSL2+/VDSLrollout case study
The six different rollout scenarios described in [1]with different timing and ambition levels ofADSL2+/VDSL rollout are summarised as follows:
Scenario 1: “Market equality, no overlap”Scenario 2: “Market equality, 50 % overlap”Scenario 3: “Market equality, 75 % overlap”Scenario 4: “Incumbent two years delayed”Scenario 5: “Incumbent one year delayed”Scenario 6: “Incumbent aggressive rollout “
The base case results [1] are summarised in Figure 3.
To be able to analyse the impact of the uncertainties,the most critical variables have to be identified. Inthis case study the most important variables are con-sidered to be:
• Adoption rate forecasts• ARPU• Broadband content costs• Sales costs• Provisioning costs• Customer operations and maintenance• Customer installation costs• Smart card costs• Line card costs• Price reduction rate for DSL equipment, i.e.
DSLAM rack and linecards.
Table 1 summarises the uncertainty assumptionsfor each variable. Each selected input variable is de-scribed by its default value, upper and lower limit,confidence interval and probability distributionparameters.
Figure 2 Risk simulation using Monte Carlo analysis
Figure 3 Base case results for the six scenarios
0,68 0,74 0,80 0,86 0,92
Variable 1
1,09 1,54 2,00 2,46 2,91
0,55 0,78 1,00 1,23 1,45
1,09 1,54 2,00 2,46 2,91
Variable 2
1,09 1,54 2,00 2,46 2,91
0,55 0,78 1,00 1,23 1,45
Variable 3
Frequency Chart
kECU
,00
,007
,013
,020
,027
0
67,25
134,5
201,7
26
-300 -1000 1000 300 500
10 000 Trials 52 OutliersNPV
kECU
,000
,007
,013
,020
,027
0
67,25
134,5
201,7
269
-300 -1000 1000 300 500
kECU
-300 -1000 1000 300 500-3000 -1000 1000 3000 5000
Pro
ba
bili
ty
Freq
ue
nc
y
-100
0
100
200
300
400
500
600
700
Sc. 1 Sc. 2 Sc. 3 Sc. 4 Sc. 5 Sc. 6
NP
V [
mill
. EU
R]

162 Telektronikk 4.2004
The broadband demand, the costs and revenues arepredicted from 2005 to 2011. The main variablescan be grouped by demand, ARPU, which gives theexpected revenue, and costs like Capex, Opex andcontent and sales costs.
Most of the values in the table are specified inEURO. The sales costs and the content costs areexpressed as a proportion of the total (ISP + whole-sale part) and ISP part of the revenues respectively.The sales costs are 30 % of the total revenue eachyear. The content costs are 60 % (default) of the ISPpart of the revenues in the first two years of opera-tion, 5 % less in year 3 and 4 and then decreasing by5 % in the following years. Figure 4 shows thedefault ARPU breakdown.
The demand evolution is based on the adoption ratein year 2011. The adoption rate values in the period2006 – 2010 are adjusted proportionally according tothe simulated 2011 value.
The other variables in the table have reference valuesfor 2005. Based on the reference values, predictionsare calculated for the 2006 – 2011 period. In a simu-lation trial, the reference value has a deviation. Thenthe predicted values (2006 – 2011) will have a devia-tion proportional to the predicted size (2006 – 2011)multiplied by the reference value deviation. Since thevalues of the variables are simulated a large number
of times, there will be great variation in the devia-tions, based on the probability distribution used.
10,000 trials of Hypercube simulation were perform-ed for each of the six scenarios, in order to analysethe impact on the net present value (NPV). The Betadistribution has been used for all input variables. Amore detailed description of the Beta distribution isfound in Appendix B.
First, three sets of simulations (for each scenario)were carried out:
• All ten variables were simulated;
• Only Adoption Rate and ARPU were simulated(the rest were frozen at default values);
• Only Adoption Rate was simulated (the rest werefrozen at default values).
Table 2 summarizes the results for all the three simu-lation types for the six different scenarios in terms ofmean value, standard deviation and 5 % percentile.All values are in mill. EURO.
As can be seen, all six scenarios have negative 5 %percentile values when all ten variables were simu-lated. The reason is the generally high customer-inde-pendent investment combined with high uncertainty
Table 1 Assumptions for probability distributions used in uncertainty and risk calculations
Variable name Minimum 5 % Default 95 % Maximum α βvalue percentile value percentile value
Monthly ARPU 90 95 100 108 124.7 5.11 11.16
Line card price 1,200 1,400 1,600 1,800 2,000 4.94 4.94
Sales costs 25 % 27.5 % 30 % 32.5 % 35 % 4.94 4.94
Provisioning costs 50 60 65 70 80 11.77 11.77
Equipment price
reduction rate 5 % 8 % 10 % 12 % 15 % 8.02 8.02
Adoption rate,
final year 26 % 29 % 32 % 37 % 42 % 4.02 6.04
Customer
installations cost 100 110 120 130 140 4.95 4.95
Content costs 50 % 55 % 60 % 65 % 70 % 4.95 4.95
Smart card costs 20 25 30 35 40 4.94 4.94
Customer operations
& maintenance 15 20 25 30 35 4.95 4.95

163Telektronikk 4.2004
in ARPU and adoption rate. The input variables areindependent in the simulations, which means that tri-als with a combination of a low adoption rate and alow ARPU will give a significantly negative contri-bution to the NPV.
For all the scenarios it was found that the adoptionrate and ARPU in that order were by far the mostdominant contributors to the uncertainty in NPV. Thecontributions to the NPV variance were in the 48 % –56 % range for the adoption rate and the 33 % –38 % range for the ARPU for the six scenarios. Thecontributions from the remaining assumptions weretherefore small in comparison. Especially the networkcomponent costs have a very small impact. This isdue to fairly good cost prediction models combinedwith experiences of cost reduction trends of networkcomponents for the last years.
Scenario 6 has the largest NPV and also the highestmean value to standard deviation ratio and is there-fore the least risky scenario. Scenario 4 has the small-est NPV (default as well as simulated mean value)and in addition the most negative 5 % percentile (andtherefore the highest value at risk; VaR). All the sce-narios look quite risky with negative 5 % percentilesin most cases.
As expected, the standard deviation decreases withfewer simulated input variables. As the ARPU andAdoption Rate are the two dominant variables, themost dramatic decrease is seen when going from twovariables simulated to only one simulated variable.When only the two dominant variables are simulated,the 5 % percentile turns positive in Scenario 6. Whenonly the adoption rate is simulated, the 5 % percentilealso turns positive for the first three scenarios. Whenonly simulating the Adoption Rate, we avoid the neg-ative contribution from trials with low values of bothAdoption Rate and ARPU. Therefore the 5 % per-
centile is improved and the risk therefore reducedeven further.
This first batch of simulations was done in order toillustrate that too pessimistic values are generated ifwe do not take the inherent coupling between ARPUand Adoption Rate into account. This coupling canbe modelled by the use of price elasticity models sothat the adoption rate will generally increase with adecrease in the monthly tariff. However, such modelscan be quite complex as other parameters than justprice generally influence the adoption rate of servicessuch as brand value, etc. As this kind of price mod-elling is outside the scope of this paper, we chose tostudy the impact of introducing a generic negativecorrelation between the Adoption Rate and theARPU. The next step was to study the impact of“weak”, “moderate” and “strong” correlation using–0.25, –0.50 and –0.75 respectively for the correla-tion value. The results are shown in Figure 5 whereall variables are simulated.
We see that the risk is reduced remarkably as the5 percentile is increased significantly due to thereduced standard deviation in each simulation.
Table 2 Summary of three types of Monte Carlo simulations – by scenario
Scenario 10 variables simulated Adoption rate and ARPU Only Adoption Rate simulated
5% perc. 95% perc. σ 5% perc. 95% perc. σ 5% perc. 95% perc. σ
Sc. 1 -48.5 1,155.7 364.1 -5.1 1,114.5 339.5 58.6 928.4 263.4
Sc. 2 -70.6 1,138.4 365.7 -27.4 1,097.3 341.2 37.6 909.7 265.6
Sc. 3 -102.3 1,108.3 366.4 -58.9 1,066.1 341.9 4.3 882.5 266.6
Sc. 4 -376.4 438.5 264.8 -341.4 408.4 227.6 -287.4 261.6 166.7
Sc. 5 -212.0 830.8 315.9 -174.2 795.8 293.8 -112.9 624.9 224.1
Sc. 6 -50.6 1,561.9 487.7 6.0 1,507.2 455.9 90.6 1,256.9 356.1
0
20
40
60
80
100
120
2005 2006 2007 2008 2009 2010 2011
AR
PU
[E
UR
O]
Wholesale part of ARPU
ISP share of ARPU
Figure 4 ARPU breakdown

164 Telektronikk 4.2004
The ranking of the different scenarios with respectto the ranking of NPV and riskiness is however un-changed. Scenario 6 is still the most profitable projectand is also the project with the smallest level of riskin terms of mean to standard deviation ratio. Scenario6 has the highest mean to standard deviation ratio fol-lowed by Project 2. We also see that Scenario 4 andScenario 5 have negative percentiles for all levels ofcorrelation. These two scenarios also have the lowestvalues of the mean to standard deviation ratio.
For moderate and high correlation, Scenarios 1, 2, 3and 6 get positive values of the 5 % percentile.
The simulation batch with correlation was also car-ried out where only Adoption Rate and ARPU weresimulated. The results are summarized in Figure 6.The same trend and ranking as in Figure 5 are seenbut now the standard deviation is even smaller dueto the fewer variables simulated.
Scenario 4 and Scenario 5 remain quite risky due to thedelay of entry by two years and one year respectively.
It should of course be pointed out that broadband roll-outs would be stopped or scaled down if the cashflow is significantly lower than what is expected.Then, the project has to wait until the expected costsdecrease or the revenue increases.
For the given assumptions, the strategy of enteringthe market too late at high coverage as in Scenario 4,is very risky due to lost market shares. The riskpicture for Scenarios 1–3 and Scenarios 5–6 is strictlyon the pessimistic side, as flexibility in timing is nottaken fully into account by considering the given roll-out scenarios separately.
An optimal strategy will be to go for a rollout levelas in Scenarios 1–3 and scale up the ambition level incoverage as in Scenario 6 only if market conditionsare favourable.
6 ConclusionsThe objective of the presentation was to show howrisk analysis and the related risk framework are usedto evaluate business cases on broadband rollouttaking the risks into account.
By using Monte Carlo simulations it has been possi-ble to give a more complete picture of the risks inlarge-scale broadband rollouts. The additional multi-variable sensitivity analysis gives the contribution tothe NPV variance from all the uncertain assumptionvariables in the case study. Using the traditional sen-sitivity analysis concept where all assumption vari-ables are changed one at a time is only useful as afirst step in order to pick the dominant ones for fur-ther analysis. The reason is that the former conceptonly shows what is possible – not what is probable.
When not using correlation between variables, all thesix scenarios that were investigated had a negative5 % percentile, i.e. a positive value at risk, and there-fore carried significant risk even though four of thescenarios showed a high NPV as well as internalreturn. By not taking into account the inherent cou-pling of ARPU and adoption rate what will result is atoo high standard deviation and thereby overestima-tion of the risk. The impact of negative correlation
Figure 5 5 % percentiles for various degrees of correlation betweenARPU and Adoption Rate. Ten variables simulated
Figure 6 5 % percentiles for various degrees of correlation betweenARPU and Adoption Rate. Two dominant variables simulated
-400
-300
-200
-100
0
100
200
300
400
Sc. 1 Sc. 2 Sc. 3 Sc. 4 Sc. 5 Sc. 65%
pe
rce
nti
les
of
NP
V [
mill
. EU
RO
]
no corr.
-0.25 corr.
-0.50 corr.
-0.75 corr.
-400
-300
-200
-100
0
100
200
300
400
Sc. 1 Sc. 2 Sc. 3 Sc. 4 Sc. 5 Sc. 65%
pe
rce
nti
les
of N
PV
[mill
. EU
RO
]
no corr.
-0.25 corr.
-0.50 corr.
-0.75 corr.

165Telektronikk 4.2004
between Adoption Rate and ARPU was thereforestudied thoroughly. Correlation showed significantimpact on the result due to the reduction in standarddeviation. For moderate correlation of –0.5, all butthe two most risky scenarios (Scenario 4 and Sce-nario 5) showed positive values of the 5 % percentile.However the ranking of the scenarios in terms ofNPV and riskiness remained unchanged. The meanvalue/standard deviation is a good measure in orderto rank projects according to risk.
The risk analysis showed that the adoption rate hadthe highest impact on risk followed by the ARPU.The prediction of network component costs generatedlimited risk compared with the adoption rate and theARPU. The reason is the existence of fairly good costprediction models combined with experiences of costreduction trends of network components for the lastyears.
The methodology described showed its usefulness inidentifying the overall uncertainty as well as givinggood indications of the ranking of investment projectswith respect to risk. We also believe that an extensionof the framework taking into account strategic flexi-bility (if any) would be very useful.
7 Appendix AIn the following, the uncertainty model is described.We give a short description of the Beta and Log Nor-mal distributions and how to calculate relevant para-meters from specified values and ranges of theselected uncertainty variables.
Beta distribution:
The Beta distribution has a number of characteristicsthat makes it useful for most studies:
• It is confined to a specified interval;
• It has sufficient degrees of freedom – it can besymmetric and bell-shaped or asymmetric andpeaked.
A Normal distribution is not useful in the modellingof variables that can only have positive values. ANormal distribution with given mean and standarddeviation will have a certain probability > 0 that anegative number will be produced. As a result, eithermeaningless outputs will be generated or the calcula-tion will end with an error message.
The generalised Beta distribution of a variable in theclosed interval [a, b] is given by:
(A.1)
where B(a, β) is the Beta function defined by
(A.2)
where Γ(z) is the gamma function of z, z /=0, –1, –2,–3, ...
In many simulation tools, only the normalised Betadistribution, i.e. α = 0 and β = 1 is available. How-ever, this problem is easily transformed by the lineartransformation:
(A.3)
The most expected value (mode) of the Beta distribu-tion is defined as the value of y for whichBy standard calculus, we get the mode
(A.4)
and the mode of the normalised Beta distribution
(A.5)
It is often easier to relate to a most expected valueand a confidence interval of a random variable thanthe mean value and standard deviation. If q is theconfidence interval, YL the lower percentile of theconfidence interval and YH the higher percentile ofthe confidence interval (by definition q = H – L), wemust have
(A.6)
where is the accumulated Beta distributionof Y with parameters α and β. This function isdefined as a built-in function in Excel. When themode is known, we only get one unknown parameter,namely α. We then have:
(A.7)
α can found by using Solver in Excel.
As an example, we use as default value 15 % for theBeta-distributed variable. The 5 % and 95 % per-centiles are chosen as 10 % and 20 % respectively.The minimum and maximum values are set to 5 %and 25 % respectively. Figure 7 shows an implemen-tation in an Excel spreadsheet.
p(y) =1
B(α, β)(b − a)α+β−1(y − a)α−1(b − y)β−1
B(α, β) =Γ(α)Γ(β)
Γ(α + β)
Y = f(X) = (b − a)X + a ⇔ X =Y − a
b − a
dp(y)
dy= 0.
Y = (b − a)α − 1
α + β − 1+ a
X =α − 1
α + β − 1
∫YH
YL
p(y)dy =
∫YH
0
p(y)dy −
∫YL
0
p(y)dy =
B(YH , α, β) − B(YL, α, β) = q
B(Y, α, β)
β =α(1 − X) + 2X − 1
X=
α(Y − a) + 2Y − (b + a)
Y − a

166 Telektronikk 4.2004
The Beta distribution can have many shapes depend-ing on the size of the parameters α and β. Figure 8shows the shapes of the Beta distribution for differentcombinations of α and β.
The Log Normal distribution:
The Log Normal distribution is often used in mod-elling random variables that can have non-negativevalues up to infinity (in principle) as for stock valuesetc. For a Log Normal distribution, the natural loga-rithm of the variable is Normal distributed. If the log-arithm of the variable of interest, X has a mean and
standard deviation of µLog and σLog respectively, theprobability distribution is defined as:
(A.8)
The mode , Mean E(X) and variance σ2 are foundby standard calculus as:
(A.9)
(A.10)
(A.11)
The parameters can be found by using the Solverfunction, when mode and percentiles, e.g. 5 % and95 % percentiles are known.
8 Appendix BIn the Monte Carlo simulations approach the inputvariables are ranked by so-called rank correlation orcontribution to variance.
Rank correlation:
A correlation coefficient measures the strength of thelinear relationship between two variables. However,if the two variables do not have the same probabilitydistributions (or at least are very different due to thegeneral non-linear relationships in a model e.g.demand models), Pearson’s correlation [4] may givemisleading results. Therefore the so-called rank cor-
p(x) =1
√2πσLogx
exp
{− [ln(x) − µLog]
2
2σ2Log
}
X
X = exp(µLog − σ2Log)
E(X) = exp
(µLog +
σ2Log
2
)
σ2 = exp
(2µLog + σ
2Log
) (exp
(σ
2Log
)− 1
)
Figure 7 Parameter calculation using Solver and Excel
2
1.6
1,2
0.8
0.4
000 0.2 0.4 0.6 0.8 1.0 0 0.2 0.4 0.6 0.8 1.0
3
2.5
2
1.5
1
0.5
0
0 0.2 0.4 0.6 0.8 1.0
3
2.5
2
1.5
1
0.5
00 0.2 0.4 0.6 0.8 1.0
1,2
1
0.8
0.6
0.4
0.2
0
α=3, β=3, X=0.5
α=6, β=3, X=0.71
α=2, β=5, X=0.2
α=1, β=1, X=undefined
Figure 8 The Beta distribution for various combinations of α and β

167Telektronikk 4.2004
relation or Spearman rank correlation coefficient [5]is used. This is the general measure used in mostExcel-based commercial software tools. To calculatethe rank correlation between two data sample vectors
, the data is ranked in order of size usingthe numbers 1, …, n. Rank-correlation is in any caseuseful when data is not presented in precise samples,which is the case when the number of simulation tri-als is moderate or small and hypercube sampling(which is more time consuming than standard MonteCarlo sampling!) is not applied.
The rank correlation coefficient is calculated from thefollowing formula:
(B.1)
where di is the difference between ranks of ith sampleof and n is the dimension of the arrays. Thedata can for example be the ranks in two differentcompetitions among five competitors.
Example
We immediately find
We therefore have
Contribution to total variance:
Crystal Ball® calculates the contribution to variancefor variable i as
(B.2)
References1 Stordahl, K, Elnegaard, N K. Rollout strategies
based on adoption forecasts for ADSL2+/VDSL.Telektronikk, 100 (4), 149–156, 2004. (This issue)
2 Crystal Ball. January 26, 2005 [online] – URL:http://www.decisioneering.com/crystal_ball/index.html
3 Box, G E P, Jenkins, G M. Time Series Analysis:Forecasting and Control. 2nd. San Francisco,Holden Day, 1976.
4 Kenney, J F, Keeping, E S. Linear regression andcorrelation. Ch. 15 in: Mathematical statistics,Pt.1. 3rd ed. Princeton, NJ, Van Nostrand,252–285, 1962.
For a presentation of Nils Kristian Elnegaard please turn to page 156.
For a presentation of Kjell Stordahl please turn to page 2.
A and B
r = 1 −
6∑
d2
i
n(n2− 1)
A and B
A = [5 2 4 1 3] and B = [3 1 5 2 4].
d = [2 1 1 1 1] and d2 = [4 1 1 1 1].
n=5∑
i=1
d2
i= 4 + 1 + 1 + 1 + 1 = 8; n
2 = 25
rRank = 1 −
6 × 8
5 × (25 − 1)= 1 −
2
5= 0.6.
CV ar,i =
r2
i∑n
j=1r2
j

Competition in the local loop: How to minimise the market risk, ISSLS 2004 Stordahl et al 1
COMPETITION IN THE LOCAL LOOP: HOW TO MINIMIZE THE MARKET RISKS
Kjell Stordahl∗ , Nils Kristian Elnegaard∗∗ , Borgar Tørre Olsen∗∗ , Markku Lähteenoja∗∗
*)Telenor Networks, Telenor, Snarøyvn 30, N-1331 Fornebu, Norway **) Telenor R&D, Telenor, Snarøyvn 30, N-1331 Fornebu, Norway
Abstract Different ADSL2+/VDSL roll out scenarios are examined. Take rate for the competing operators is modelled depending on theirs entrance in various exchange areas. Net present value and internal rate of return have been calculated by use of an advanced techno-economic tool. Based on analysis of the different scenarios, guidelines for roll out ADSL2+/VDSL strategies is developed. 1 Introduction During the last years a significant broadband demand has been generated in Western Europe. Forecasts show that the expected broadband penetration in the residential market will be about 20% in year 2005 [2,5,6]. The most relevant broadband technologies are: DSL, HFC, FTTH, FWA, WLAN, multiple ISDN lines, DTT and also satellite solutions to cover the rest market. The European Commission has recommended a market driven and technology neutral broadband evolution. Only Sweden, Canada and South Korea have used another strategy by supporting part of the broadband deployment with Governmental investments. The incumbent operators face competition from the LLU operators, the cable operators and to some extent operators using fixed wireless access and fibre to the home solutions [9,13] In the rest market with sparsely dense population the satellite operators challenge the incumbent operator [1,4,10]. The question is what type of broadband strategy should the incumbent apply for not loosing too large market share. The incumbent operators have started to roll out ADSL. The second step is to use enhanced technologies like ADSL2+ and VDSL with the potential of a much broader spectrum of services. 2 Broadband technology forecasts Broadband access forecasts for the residential European market have been developed by the European projects AC364/TERA and IST 25172/TONIC. The forecasts are made by using diffusion models for the total broadband penetration
and separate the penetration for each technology prediction based on market share predictions [2,5,6,8,14,15]. New updated forecasts have now been developed. The forecasts are shown in figure 2.1. The forecasts are separated in ADSL, VDSL/ADSL2+, HFC and other broadband technologies. The CaTV coverage is very different in Western Europe. Some countries, like Netherlands and Belgium, have a nearly 100% coverage, while other countries have a more limited coverage. Because of Direct To the Home (DTH) satellites, the CaTV networks are not expanded. However, the CaTV operators are upgrading their networks to HFC. The study presented in this paper analyses areas where there is no competition from HFC. Figure 2.1 Broadband penetration forecasts (%) for the West European market The penetration is a function of the deployment and the adoption rate. The adoption rate is the genuine demand for broadband. However, the demand cannot be effectuated if the broadband infrastructure is not deployed. Hence, the adoption rate will always be higher than the penetration if coverage is less than 100%. The penetration for a country is estimated by multiplying the mean adoption rate with the coverage. 3 High capacity broadband: ADSL2+ and VDSL So far the incumbents have offered ADSL in the residential market and ADSL/SHDSL in the business market. The next step is to extend their
0,0
5,0
10,0
15,0
20,0
25,0
30,0
35,0
40,0
45,0
50,0
2001 2002 2003 2004 2005 2006 2007 2008 2009 2010
Sum
ADSL
VDSL/ ADSL2+
Cable modem
Ot her BB t ech.

Competition in the local loop: How to minimise the market risk, ISSLS 2004 Stordahl et al 2
broadband offer by ADSL2+/VDSL. Telenor have studied VDSL extensively the last 3 years by a large VDSL pilot with 700 subscribers. The technology offers two parallel interactive TV channels and traditional Internet surfing (ADSL) at the same time with 15 Mbit/s capacity up to 1,5 km from the DSLAM. ADSL2+ is predicted to cover distances up to 2 km from the DSLAM with 10 Mbit/s capacity. A set of different elements is important for ADSL, ADSL2+ or VDSL roll out in various access areas. Important elements are: Size of the access area (number of customers), broadband penetration forecasts, distribution of the copper lines, standardisation of broadband network elements, especially access cards and multi DSLAM, network component prices and functionality, broadband capacity and length capability for ADSL2+ and VDSL and broadband applications offered. 4 Strategic positioning The challenge for the incumbent operator is to roll out ADSL2+ and VDSL at the right time. The timing for rollout depends on what the LLU operators and other operators using other broadband technology are doing in the same access area. The broadband operators wait for standardisation of the DSL technology and mass production of new network components to get cheaper prices and lower investments and lower operational costs. On the other hand, the operators are afraid for loosing significant market share. In Sweden Bredbåndbolaget and Bostrøm have announced that they plan to offer VDSL based on hiring the copper lines (LLU) from TeliaSonera. The operators will introduce VDSL in the largest exchanges in the three largest cities in Sweden. The operators plan to use a cherry picking strategy by offering the service to customers, which are situated close to the exchange according to the maximum VDSL coverage without doing any infrastructure investments. It is of cause a good strategic move to start with largest exchanges where the investment per customer is small. In addition the operator reduces the other operators market possibilities significantly in the area. 5 Adoption rate forecasts In this paper a generic model is used to quantify the market loss for the incumbent by entering the area later than a competitor. The adoption rate is the genuine demand for broadband in an area. The adoption rate will be effectuated if a broadband infrastructure is deployed in the area. The adoption
rate for ADSL2+/VDSL has been estimated based on the penetration forecasts given in figure 2.1 adjusting for deployment coverage and assumption of no HFC penetration in the areas considered. Figure 5.1 shows the adoption rate for the incumbent as a function of delayed introduction of ADSL2+/VDSL in an area. Figure 5.1 ADSL2+/VDSL adoption rate forecasts as a function of delayed introduction The upper curve shows the adoption rate evolution if only one operator is offering the broadband services in the area. The next curve shows the adoption rate evolution if both the incumbent and another operator enter the area together at the same time. The other curves show the adoption rate evolution based on delayed introductions. The generic model for reduced adoption rate as a function of delayed introduction assumes that the first operator takes the initial market, while the new operator the first year takes 20% of the market growth, the second year 35% of the market growth and from the third year 50% of the market growth. 6 Market segmentation The market is segmented in 5 main groups according to the exchange size where the size is defined as number of households with a twisted pair connection to the exchange. Table 6.1 defines the market segments called area 1, area 2, ---, area 5. Table 6.1 Market segments according to exchange size and volume of households in the segments Market segment
Exchange size N Per cent households
Area 1 15.000 < N 10% Area 2 10.000 < N =< 15.000 15% Area 3 5.000 < N =< 10.000 20% Area 4 2.000 < N =< 5.000 20% Area 5 N =< 2.000 35%
Adoption rate as a function of delayed introduction
0,0 %
5,0 %
10,0 %
15,0 %
20,0 %
25,0 %
30,0 %
35,0 %
2004 2005 2006 2007 2008 2009 2010
Alone
0 Year delay
1 year delay
2 year delay
3 year delay
4 year delay
5 year delay
6 year delay

Competition in the local loop: How to minimise the market risk, ISSLS 2004 Stordahl et al 3
It is assumed that households in dens areas have a higher broadband penetration and also generate higher Average Revenue Per User (ARPU). The relative weights regarding both penetration and ARPU are 1,2 for area 1, 1,1 for area 2, 1,0 for area 3, 0,95 for area 4 and 0,90 for area 5. The most attractive market segment for ADSL2+/VDSL roll out is area 1, followed by area 2 --- etc, because of higher penetration, higher ARPU and lower investment cost per customer. 7 Deployment scenarios Six different deployment evolutions called scenario 1, --- , scenario 6, are analysed. It is assumed for all scenarios that the ADSL2+/VDSL roll out ends with 60% coverage in year 2010. In addition the investments are based on a cherry picking strategy only offering ADSL2+/VDSL to customers with maximum 2 km copper lines. In this study VDSL is offered to customers with copper lines up to 1,5 km, while ADSL2+ is offered to customers with copper line in the range 1,5 –2 km. The cherry picking strategy is based on no additional infrastructure investments. The tables show for each year the deployment volume proportion (in percent) of the total number of households both for the incumbent and for other operators. The tables indicate with bold percentages that the operator is the first one in the given exchange area, and with non bold percentages if the operator is the second one. The deployment strategy for the operators for each scenario is to be the first operator in an exchange area starting with the largest exchanges possible. The operators are not allowed to cover Area X+1-1as a second operator before all the Area X is covered by operator number one. Scenarios 1-3 show competition situations where the incumbent and the other operators take 50% of the market. Scenario 1 represents a strategy where there is no overlap, i.e. there is non-second operator in the areas. In scenarios 2 and 3 there are respectively 50% and 75% overlap in the exchange areas. Scenario 4 and 5 show situations when the incumbent is respectively two and one year delayed in ADSL2+/VDSL roll out compared with the other operators, while scenario 6 shows an offensive roll out from the incumbent point of view. Table 7.1 Scenario 1 – Market equality, no overlap
Table 7.2 Scenario 2 - Market equality, 50% overlap
Table 7.3 Scenario 3 - Market equality, 75% overlap
Table 7.4 Scenario 4 - Incumbent two years delayed
Table 7.5 Scenario 5 – Incumbent one year delayed
Table 7.6 Scenario 6 – Incumbent offensive roll out
Year Incumb Other Overlap Incumb Other Incumb Other Incumb Other Incumb OtherArea1 Area1 Area2 Area2 Area3 Area3 Area4 Area4
2004 2,5 % 2,5 % 0 % 2,5 % 2,5 %2005 7,5 % 7,5 % 0 % 2,5 % 2,5 % 2,5 % 2,5 %2006 12,5 % 12,5 % 0 % 5,0 % 5,0 %2007 17,5 % 17,5 % 0 % 5,0 % 5,0 %2008 22,5 % 22,5 % 0 % 5,0 % 5,0 %2009 27,5 % 27,5 % 0 % 5,0 % 5,0 %2010 30,0 % 30,0 % 0 % 2,5 % 2,5 %Sum 0 % 5,0 % 5,0 % 7,5 % 7,5 % 10,0 % 10,0 % 7,5 % 7,5 %
Year Incumb Other Overlap Incumb Other Incumb Other Incumb Other Incumb OtherArea1 Area1 Area2 Area2 Area3 Area3 Area4 Area4
2004 2,5 % 2,5 % 2,5 % 2,5 %2005 7,5 % 7,5 % 2,5 % 2,5 % 2,5 % 2,5 %2006 15,0 % 15,0 % 5,0 % 2,5 % 2,5 % 5,0 % 5,0 %2007 22,5 % 22,5 % 10,0 % 2,5 % 2,5 % 5,0 % 5,0 %2008 32,5 % 32,5 % 20,0 % 5,0 % 5,0 % 5,0 % 5,0 %2009 40,0 % 40,0 % 25,0 % 2,5 % 2,5 % 5,0 % 5,0 %2010 45,0 % 45,0 % 30,0 % 2,5 % 2,5 % 2,5 % 2,5 %Sum 10,0 % 10,0 % 15,0 % 15,0 % 12,5 % 12,5 % 7,5 % 7,5 %
Year Incumb Other Overlap Incumb Other Incumb Other Incumb Other Incumb OtherArea1 Area1 Area2 Area2 Area3 Area3 Area4 Area4
2004 2,5 % 2,5 % 0,0 % 2,5 % 2,5 %2005 7,5 % 7,5 % 0,0 % 2,5 % 2,5 % 2,5 % 2,5 %2006 17,5 % 17,5 % 10,0 % 5,0 % 5,0 % 5,0 % 5,0 %2007 27,5 % 27,5 % 20,0 % 5,0 % 5,0 % 5,0 % 5,0 %2008 35,0 % 35,0 % 25,0 % 2,5 % 2,5 % 5,0 % 5,0 %2009 45,0 % 45,0 % 35,0 % 5,0 % 5,0 % 5,0 % 5,0 %2010 52,5 % 52,5 % 45,0 % 5,0 % 5,0 % 2,5 % 2,5 %Sum 10 % 10 % 15 % 15 % 20 % 20 % 7,5 % 7,5 %
Year Incumb Other Overlap Incumb Other Incumb Other Incumb Other Incumb OtherArea1 Area1 Area2 Area2 Area3 Area3 Area4 Area4
2004 0,0 % 5,0 % 0,0 % 0,0 % 5,0 %2005 0,0 % 15,0 % 0,0 % 0,0 % 5,0 % 0,0 % 5,0 %2006 10,0 % 25,0 % 5,0 % 5,0 % 5,0 % 5,0 % 5,0 %2007 22,5 % 37,5 % 15,0 % 5,0 % 0,0 % 5,0 % 7,5 % 7,5 %2008 35,0 % 45,0 % 27,5 % 5,0 % 2,5 % 5,0 % 5,0 % 2,5 %2009 45,0 % 50,0 % 37,5 % 5,0 % 2,5 % 2,5 % 2,5 % 2,5 %2010 52,5 % 52,5 % 45,0 % 7,5 % 2,5 %Sum 10,0 % 10,0 % 15,0 % 15,0 % 20,0 % 20,0 % 7,5 % 7,5 %
Year Incumb Other Overlap Incumb Other Incumb Other Incumb Other Incumb OtherArea1 Area1 Area2 Area2 Area3 Area3 Area4 Area4
2004 0,0 % 5,0 % 0,0 % 0,0 % 5,0 %2005 5,0 % 15,0 % 0,0 % 2,5 % 2,5 % 2,5 % 7,5 %2006 15,0 % 25,0 % 7,5 % 5,0 % 2,5 % 2,5 % 2,5 % 2,5 % 5,0 %2007 25,0 % 35,0 % 15,0 % 2,5 % 2,5 % 2,5 % 5,0 % 7,5 %2008 35,0 % 42,5 % 22,5 % 5,0 % 2,5 % 0,0 % 0,0 % 5,0 % 5,0 %2009 45,0 % 47,5 % 32,5 % 2,5 % 5,0 % 2,5 % 2,5 % 2,5 %2010 50,0 % 50,0 % 40,0 % 5,0 % 2,5 %Sum 10,0 % 10,0 % 15,0 % 15,0 % 17,5 % 17,5 % 7,5 % 7,5 %
Year Incumb Other Overlap Incumb Other Incumb Other Incumb Other Incumb OtherArea1 Area1 Area2 Area2 Area3 Area3 Area4 Area4
2004 5,0 % 5,0 % 0,0 % 5,0 % 5,0 %2005 15,0 % 10,0 % 0,0 % 10,0 % 5,0 %2006 25,0 % 20,0 % 10,0 % 5,0 % 5,0 % 5,0 % 5,0 %2007 35,0 % 27,5 % 17,5 % 5,0 % 2,5 % 5,0 % 5,0 %2008 45,0 % 32,5 % 25,0 % 2,5 % 5,0 % 5,0 % 2,5 %2009 52,5 % 37,5 % 32,5 % 2,5 % 5,0 % 2,5 % 2,5 %2010 55,0 % 40,0 % 35,0 % 2,5 % 2,5 %Sum 10,0 % 10,0 % 15,0 % 15,0 % 20,0 % 10,0 % 10,0 % 5,0 %

Competition in the local loop: How to minimise the market risk, ISSLS 2004 Stordahl et al 4
8 Techno-economic assessments Different deployment strategies are analysed by using a techno-economic tool. The tool developed within the European programs ACTS and IST by the projects AC 226/OPTIMUM and AC364/TERA and IST 25172/Tonic calculates net present value (NPV), payback period and internal rate of return (IRR) for each deployment strategy. The tool contains a cost database with reference costs for network components in 2004 and learning curve predictions of the component cost evolution. The Capital Expenditure (CAPEX) is calculated based on the forecasts, the dimensioning of number of components and the predicted cost evolution. In addition Operational Costs (OPEX) is calculated based on operation and maintenance parameters for the component and the maintenance system. The revenue in the model is found by multiplying the ARPU with the access forecasts. The discount rate is assumed to 10%. The cherry picking strategy for ADSL2+ and VDSL only offering the access close to the exchange/DSLAM are examined. The techno-economic tool calculates the economic value of the strategies for different roll out times for the incumbent operator based on deployment strategies to the other operators. 9 Results The business case studied is a country with 60 million inhabitants and 25 million households. The average number of lines per exchange (CO) in area 1, 2, 3, 4, 5 is assumed to be 12.000, 8.000, 2.600, 1.400 and 400 respectively. The ADSL2+/VDSL coverage within 2km is assumed to be 75%. This coverage is different in various European countries because the distribution of the subscriber lines is different. The main results are shown in figure 9.1 where the net present values are calculated for all scenarios. The figure shows that scenario 1-3 have rather good net present values for the incumbent and of cause also for the other operators (since the incumbent and the other operators use identical roll out strategies). Scenario 1-3 is described in table 7.1-7.3. The scenarios 1-3 have a symmetric rollout between the competitors, ending with 60% ADSL2+/VDSL coverage in year 2010. Both the incumbent and the other operators benefit by being the first operator to enter new exchange areas. The figure shows that the net present value decreases when the incumbent has to use additional spending the cover exchange areas as operator no 2. The analysis shows that the most optimal way for the incumbent and the other operators is to share the market without overlap (Scenario 1). Then the
return of the investment is maximised. However, there will be competition in a lot of areas and the operators are not allowed to do such agreements. Scenario 2 and 3 show the net present value when the incumbent and the other operators have respectively 30% and 45% overlap in the rollout.
Figure 9.1 Incumbent: Net present values for scenario 1- 6. Scenario 4 “Incumbent two years delayed” is described in table 7.4. Both the incumbent and the other operators end with 52,5 % coverage in year 2010. However, the incumbent is two years delayed in the rollout compared with the other operators. The consequences are rather dramatic since the other operators enter the largest exchange areas. The incumbent looses the possibility to be operator no 1 in area 1 with the largest potential of subscribers and also significant part of area 2 as the first operator. The move for the incumbent is to concentrate to be the first operator in area 3 and the second operator in area 1 and mainly in area 2. The incumbent has a rather aggressive rollout after the two first years, but it is to late to get good results. The explanation is loss of initial access subscribers by entering the market too late and lower revenue per subscriber by entering areas with less number of lines. The net present value is significant less than zero. Scenario 5 “Incumbent one year delayed” is described in table 7.5. Now, the incumbent is one year delayed compared with the other operators. The incumbent fails to be the dominating operator on the largest exchage areas, but the handicap is not as significant as in scenario 4. Figure 9.1 shows that the net present value is positive but not more than that! Scenario 6 “Aggressive incumbent rollout” is described in table 7.6. Now, both the incumbent and the other operators start the rollout in year 2004. The incumbent has the resources and uses an aggressive rollout and ends with a higher coverage than the other operators at the end. Hence, the incumbent also gets a better position by entering the largest exchange areas as fast or faster than the
-300
-200
-100
0
100
200
300
400
Sc. 1 Sc. 2 Sc. 3 Sc. 4 Sc. 5 Sc. 6
NPV
[ m
ill. E
UR
]

Competition in the local loop: How to minimise the market risk, ISSLS 2004 Stordahl et al 5
other operators. The result is a rather large net present value – also compared with scenario 1. The calculation of internal rate of return for the various scenarios confirms the conclusions based on the assessed net present values. The results are shown in figure 9.2
Figure 9.2 Incumbent: Internal rate of return for scenario 1-6 10 Conclusions The operators have limited resources for ADSL2+/VDSL roll out. The question is how to utilise the resources in an optimal way. Analysis in this paper shows that the first step is to enter the exchange areas by the cherry picking strategy. To optimise the economic value of the roll out, the operators should start to roll out ADSL2+/VDSL in large areas. However, the roll out depends on being the first operator or the second operator in the area. The analysis show that it is better to enter the second best area as the first operator, than enter the best area as the second operator. Both the incumbents and the other operators are in fact playing a game to utilise their resources in an optimal way when they are rolling out ADSL2+/VDSL. This paper also gives some guidelines on how ADSL2+ and VDSL should be rolled out. If the competition is heavy, delay in the roll out causes significant loss. References 1. Elnegaard N K, Olsen B T, Stordahl K,
“Broadband deployment in rural and non competitive areas: The European perspective”, In proc FITCE 2003’, Berlin, Germany, 1-4 September, 2003
2. Stordahl K, Kalhagen K. O. “Broadband forecast modelling. Evaluation of methodology and results”. International Symposium on forecasting 2003’, Merida, Mexico, 16-19 June, 2003
3. Forrester Research Center, “Europe’s Broadband Focus Shifts To Profit”, June 2003
4. Elnegaard N K, Stordahl K, “ Broadband Deployment in Rural and Non-competitive Areas in Europe”, In proc ENWP03', Dresden, Germany, 21-23 May, 2003
5. Stordahl K, “Developing demand forecasts and tariff predictions for different telecom services both for fixed and mobile based on results from the IST Tonic project”.In proc IIR Telecoms Market Forecasting 2002, Prague, Check Republic, October 7-10, 2002
6. Stordahl K, K O Kalhagen, B T Olsen, “Broadband technology demand in Europe”. ICFC 2002, San Francisco, USA, June 25-28, 2002
7. Stordahl K, et al “Traffic forecasting models for the transport network”. Proc 10th International Telecommunication network Strategy and Planning Symposium. Munich, Germany, 23-27 June, 2002
8. Stordahl K, K O Kalhagen “Broadband demand modelling”. In proc 4th Workshop on Telecommunications Techno-Economics, Rennes, France, May 14-15, 2002
9. Stordahl K, N K Elnegaard, “Battle between cable operator and incumbent: Optimal ADSL/VDSL rollout for the incumbent”. In Proc. XIV International Symposium on Services in the Local access - ISSLS 2002, Seoul, Korea, April 14-18, 2002
10. Olsen B T, Kalhagen K O, Stordahl K, ”Provisioning of broadband services in non-competitive areas”. In Proc. XIV International Symposium on Services in the Local access - ISSLS 2002, Seoul, Korea, April 14-18, 2002
11. B Henriques, W King, L A Ims, B T Olsen, K Stordahl, “DSL rollout strategies based on user group segmentation”. In Proc. XIV International Symposium on Services in the Local access - ISSLS 2002, Seoul, Korea, April 14-18, 2002
12. Elnegaard N K, Stordahl K, “Broadband rollout strategies”. In Proc 17th European Network Planning Workshop. Les Arcs, France, March 19-23, 2001
13. Stordahl K, N K Elnegaard, B T Olsen, “Broadband access rollout strategies in a competitive environment”. In Proc Optical Hybride Access Network/Full Service Access Network workshop, Yokohama, Japan, April 4-6, 2001
14. Stordahl K, L A Ims, M Moe “Forecasts of broadband market evolution in Europe”. In Proc ITS 2000,Buenos Aires, Argentina, July 2-5, 2000.
15. Stordahl K, “Broadband market evolution – demand forecasting and tariffs”. SAS session Investment in telecommunication networks: Techno-economic methodologies and case studies”, ICC 2000. New Orleans, June 18-22, 2002
-10 %
-5 %
0 %
5 %
10 %
15 %
20 %
25 %
30 %
Sc. 1 Sc. 2 Sc. 3 Sc. 4 Sc. 5 Sc. 6Inte
rnal
Rat
e of
Ret
urn
[IRR
]

Potential new broadband revenue streams
Kjell Stordahl*), Beatriz Craignou, Timo Smura, José Olivares Paret, Ilari Welling, K.R.Renjish Kumar, Thomas Monath
*)Mail: Telenor, Snarøyvn 30, N-1331 Fornebu, Norway, Email: [email protected]
Abstract The paper examines new potential revenue streams for the fixed and mobile market. Data representing the evolution of household spending for a sample of European countries have been collected and analysed. Especially, new services have been classified and a framework for forecasting models for potential new broadband revenues has been developed. The paper documents substantial potential revenue possibilities for the mobile and fixed broadband market.
Key Words New broadband revenues, service classifications, content services, household spending behavior, fixed mobile market share, forecasting models
1 Introduction The Western European mobile and fixed network markets have grown significantly during the last few years. Several drivers have initiated the very strong growth and new drivers are initiated. Distribution of network based broadband content is in the initial phase. So far the broadband evolution has mainly been driven by facilities like always on, higher speed, fixed price (flat rate) and flexible usage. The degree of payment for broadband content is rather limited for the moment. The analysis and the results in this paper concentrate mainly on the residential broadband market. The residential market is also the dominant part of the broadband market today regarding both accumulated traffic, number of accesses and revenue. The main part of the paper analyses the evolution of the household spending for some European countries: France, Finland, Germany, Norway, Spain and UK. The data collection process has been difficult because the needed detailed spending data cannot be extracted from the usual national statistics. The search has shown that in some countries there exists more detailed household spending data than in
other countries. Therefore, the results are based on rather incomplete statistics from some countries. It is natural to analyse the spending budget for households in order to estimate the revenue potential for broadband content both for fixed network broadband services and mobile services. The hypotheses is: Part of the spending categories, which the household now pay for, will in the future be partially substituted by use of services in the mobile and fixed network. The estimated potential will be an upper limit for a long-term evolution. It is important to know that the identified revenue potentials will be shared between different players in the value chain: content creators, content brokers, service providers, network operators and others. To make this evolution a success, it is important to develop the right business models between the players and also implement tariff procedures and principles for sharing the added broadband value among players.
2 Household budget evolution 2.1 Number of households and the evolution for some selected countries Table 2.1 gives the number of households in the sample of Western European countries.

Table 2.1 Number of households for a sample of European countries, 1998 - 2003 Number of households in thousands 1998 1999 2000 2001 2002 2003 France 23990 24277 24567 24852 25140 25427 Finland 2355 2365 2373 2382 2398 2405 Germany 37532 37795 38124 38456 38720 38944 Norway 1809 1846 1876 1905 1937 1969 Spain 12263 12672 13086 13468 13843 14187 UK 25217 25479 25727 25998 26259 26520 The table shows that the number of households increases for all the selected countries. The mean growth from 1998 to 2003 was 6,0%. Spain had the highest growth with 15,7%, while Finland the lowest with 2,1%. The main part of the paper shows revenue potential per household. In section 6 the subscriber broadband access forecasts takes into account the growth in the number of households. 2.2 Price index evolution in some European countries Usually the statistics contain nominal values, which means what is the amount spentin different years. However, the nominal values do not give the right
information for comparing what a household is spending in different years. Hence, the nominal values have to be corrected taking into account the price index values for the same years. To get comparable spending data across various countries, all data will be adjusted by the price index evolution, setting price index to 100 in year 2000. Table 2.2 shows the adjusted price index evolution for a sample of West European countries, where the index is normalised to 100 in year 2000. For a better understanding of comparisons, table 2.2 shows the adjusted price indexes with 2000 as reference year.
Table 2.2 Normalised price index evolution in a sample of West European countries, 1998 -2003 Adjusted price index to Reference Year 2000 1998 1999 2000 2001 2002 2003 France 0,98 0,99 1,00 1,02 1,04 1,05 Finland 0,96 0,97 1,00 1,03 1,04 1,05 Germany 0,98 0,99 1,00 1,02 1,03 1,05 Norway 0,94 0,97 1,00 1,02 1,05 1,06 Spain 0,94 0,96 1,00 1,03 1,07 1,10 UK 0,98 0,99 1,00 1,01 1,03 1,04
2.3 Household spending distribution
The household spending is distributed in the following main categories: Food, Alcohol/tobacco, Clothes/shoes, House/dwelling/power, Furniture/household
equipment, Health articles/services, Transport, Communications/post, Culture/leisure, Education, Restaurants/hotels, Other services/commodities. The most important spending categories are:

- Food - House/dwelling/power - Transport - Culture/leisure
Table 2.3 shows the household spending evolution in nominal € values in some European countries
Table 2.3 Household spending evolution in nominal € values, 1998 -2003 Household consumption (at year 2000 prices) in € 1998 1999 2000 2001 2002 2003 France 30591 31231 31947 32342 32704 32846 Finland 24690 25357 26083 26484 26704 27788 Germany 29800 30600 31200 32100 32100 33250 Norway 29348 33150 34578 35736 36945 37626 Spain 17731 18330 19863 20879 21320 n.a UK 30873 32475 34011 35452 36851 38151 The values in this figure are not adjusted according to the price index. Therefore, it could be difficult to identify if there has been a real growth in the spending. All figures in the following part of the paper are adjusted with the price index (100 in year 2000). Table 2.4 shows the household spending evolution in real “year 2000” €. Table 2.4 Household spending evolution in real “2000” € values, 1998-2003 Household consumption in € 1998 1999 2000 2001 2002 2003 France 31203 31697 31947 31812 31589 31136 Finland 25819 26211 26083 25813 25627 26440 Germany 30408 31034 31200 31471 31044 31818 Norway 31066 34142 34578 35014 35228 35654 Spain 18964 19074 19863 20370 20000 n.a UK 31530 32722 34011 35021 35932 36691
2.4 Increased purchase power
Table 2.4 shows the evolution in real year 2000 €. The numbers in the table are mainly increasing, which indicates an increase in the household’s purchasing power. Figure 2.1 shows the percentage increase from 1998 to 2002.

Figure 2.1 Increased spending per household 1998-2002 for some European countries All countries except Finland have experienced an increase in purchasing power during this period. UK and Norway got a growth of 13-14%, while the other countries had a more moderate growth. The mean growth was about 6,2%. However, taking into account the growth in number of households during that period, the increase in total spending for the selected countries was 14,1%. The values are corrected for inflation.
3. Services and revenues in the telecommunications industry During the past decade, communication habits of people and the ways of using communications networks have changed tremendously. Multimedia web content is becoming richer every day, and technologies such as e-mail, mobile telephony, and SMS messaging have become an important part of every-day social interaction for the majority of the people in developed countries. Services such as video-on-demand, instant messaging, and different types of VoIP services are currently emerging in the markets.
3.1 Communications and content services
All the aforementioned services can be broadly categorized into two groups, communications and content services. Basically, the difference between the two is whether the people using the services are communicating with other people or servers in the network. Figure 1 shows a classification of person-to-person communications services. In the figure, the communications services are placed on a matrix based on two different qualities. Firstly, the services are divided into three groups: mailing, messaging, and calling, based on the immediacy of the communication. Secondly, the services are differentiated on the basis of the content that can be conveyed by them, i.e. text, images, voice, or video.
Video
Voice
Text
Image
Mailing Messaging Calling
Instantmsg
Push-to-talk
Voice-mail
Multi-mediamsg
Videocall
Textmsg
Voicecall
Chat
Fax
Latency decreasesValue increases
Tra
ffic
volu
me
incr
eas
es
Va
lue
per
bit
decr
eas
es
Figure 3.1: Classification of person-to-person communications services
By content services we mean e.g. electronic books, music, movies, and video clips, ordered and delivered over the fixed or mobile networks. In content services we can differentiate between downloading and streaming, having different kind of use models and technical requirements on the network 3.2 Fixed, mobile, and wireless networks and services The classification introduced in Figure 3.1 does not separate between fixed and mobile services, and all the services in the matrix could be provided over both
Increased spending per household 1998-2002
-2,00
0,00
2,00
4,00
6,00
8,00
10,00
12,00
14,00
16,00
France Finland Germany Norway Spain UK Mean
Gro
wth
in
%

kinds of networks. Mobility increases the value of communications services by allowing people to maintain their ability to communicate regardless of time or place. Furthermore, it removes the location dependence of communications and makes people more reachable. The increased reach ability increases the value of the network service as the number of on-line users in the network increases. In addition to fixed and mobile networks, there exist a number of wireless technologies that provide local mobility inside e.g. a home or office building, adding value to the originally fixed service. Table 3.1 shows a categorization of network technologies in these three different domains.
Table 3.1: Examples of technologies in different network domains
Fixed Wireless Mobile Circuit-switched
PSTN, ISDN
DECT Bluetooth
GSM UMTS CS
Packet-switched
ADSL Cable
WLAN Bluetooth
GPRS/EDGE UMTS PS
Fixed line operators are in a good situation regarding the wireless domain, as the networks are usually deployed as an extension to the fixed (broadband) service. Mobile operators, on the other hand, are more likely to see networks such as WLANs more as a competitor to their current services. WLANs can provide new revenue opportunities for both fixed and mobile operators, and from both communications and content services. Deployed in homes, offices, and public places, the WLANs extend the reach of the fixed broadband networks, and allow the services to be used more flexibly and freely. Mobile handsets with integrated WLAN radios give the users an opportunity to choose between the mobile and fixed broadband networks when using a certain service. 3.2 Revenue split between fixed and mobile services Statistics about the telecommunications market size and breakdown between different sub-categories can be found in the annual regulatory reports of EU [EU7th, EU10th]. A summary of these statistics is presented in Figure 3.2 and Figure 3.3.
Telecom market size, EU15 (€ Billion)
0
50
100
150
200
250
300
1998 1999 2000 2001 2002 2003 2004E
CaTV services
Switched data and leased line
services
Fixed data services
Voice telephony and Internet
Fixed voice telephony services
Mobile telephone services
Figure 3.2 Growth of the EU telecommunications markets, 1998-2004 [EU7th, EU10th]
1998 - EU15 - Total 159 B€
Mobile telephone services
Voice telephony and Internet
Switched data and leased line services
2004 - EU25 - Total 277 B€
Mobile telephone services
Fixed voice telephony services
Fixed data services
CaTV services
Figure 3.3 Breakdown of the EU telecommunications market, 1998 and 2004 [EU7th, EU10th]
Both figures clearly illustrate the growth of the mobile industry both in absolute and relative terms. The share of the mobile service market has increased from 23% to 44% in just seven years, whereas the fixed telephony market has diminished both in absolute and relative terms. Increasing the economic profitability of the fixed telephone network infrastructure, broadband services are currently experiencing high growth throughout Europe and the world.

4 Potential new revenue for broadband 4.1 Broadband in Europe Broadband access is booming in Europe. After a few years of strong growth, the market for broadband access further accelerated in 2004. In most countries, broadband access is now a commodity service that is widely available. This resulted in an intensified competition. There are ample choice of services, affordable pricing, higher speeds and growing awareness among the customers. These factors have made broadband access the main alternative for Internet access. Migration from dial-up service took place faster than initially expected and companies are also replacing leased lines with broadband connections. Although growth over the next years will remain strong, high growth rates for basic access are expected to level off in the long term. By 2009, it is foreseen that 92 million broadband connections will exist. DSL accounts for around 80% of these accesses; the rest is on cable. Beyond the basic Internet access, new services should enrich it, to compensate its dropping prices as well as the decreasing traditional revenue streams. Most of the growth for broadband is in the residential sector, mainly over a DSL or cable access. Users, initially attracted by entry-level plans are migrating to plans offering higher data rates and greater download allowances. As city consumers are generally the main target for service provider, complete availability of these services in all regions is still not a reality. So, coverage of small cities and rural areas remains to be greatly improved. Operators hopefully expect revenues from the new offerings enriching the broadband Internet accesses that can be considered as a pillar ensuring competitive business for operators. However, due to the battle of tariffs and competition, revenues will be reasonable. The possibilities to increase them will be very much in relation to the market, business models and ability to deploy the necessary infrastructure after deep analysis of technical possibilities and demand. In a "virtual society", communications networks are expected to provide resources for education, games, programs and shopping, available in a personalized way. Children find it natural to carry cell phones, iPods, PlayStations. New generations are used to videogames, music downloads, instant messaging and unlimited TV channels, always accessible, any time, any place.
To meet these needs, telecom networks must evolve and telecom service providers have to build infrastructure for voice applications, video and data, delivered with high quality and reliability over broadband networks. New applications as well as general information, movies, music, TV programs, and so on, will stream into the home, workplace and portable devices. The recently launched value-added services for customers create a rather optimistic situation for operators and service providers expecting revenues to live upon.
4.2 Services
Broadband is no longer just high speed Internet access. It has evolved to become the enabler of a bouquet of IP services. Although Internet access remains the most important application for the short or medium terms, voice and video over broadband can currently be considered as cornerstones of successful broadband strategies. Operators will provide bundles of services to attract new customers and retain existing clients. However, if the customer experiences poor performances for even one service of the bundle, the entire service package can be rejected. Then, service providers will lose the bundling business opportunity. Until now, the development of broadband access market has been mainly driven by high speed Internet access. Broadband connections facilitate Internet centric usage types, like surfing, e-mailing, file-sharing, instant messaging. Recently, operators launched additional applications, or enriched existing ones, to increase the appeal of broadband portfolios, expand the potential market and increase revenue streams. Voice and video are still key applications. An increasing number of operators now offer triple play bundles, including voice, video and Internet access. As a result of intense competition, incumbent operators have included voice over broadband in their portfolio, in addition to the traditional PSTN subscription, to retain their customers. Lower cost is the key selling argument. A number of operators are offering low cost or even free second line services. This alternative

allows increasing the bundle of products and services that together represent value for the customers. As a revenue opportunity, these services on a second line are rather limited and substantial business cannot be expected out of them. However, with these low cost access, customers can experience the quality voice over broadband can bring. If this quality meets customer expectations, this alternative may easily be adopted. Video is a major area of activity for broadband operators. Technology allows operators offering quality video services to users over IP connections or on demand. TV over IP is a new market segment for broadband providers. With revenues for fixed voice decreasing, and prices for basic broadband access dropping, new revenue streams are becoming crucial for many players. TV over DSL also contributes to keep customers or even attract some already served by cable operators. These services allow 1 or 2 channels of standard quality to be delivered at the same time, requiring 2 to 4 Mbit/s per channel, depending on the compression method. For competitive TV over IP offerings, multiple TV streams need to be delivered simultaneously, to allow for multiple TVs and a video recorder per household. As HDTV is expected to become popular, bandwidth requirements will increase further. In addition to voice and video, other applications can provide high value for customers when combined with broadband access, such as a broadband IP VPN, which can be an alternative for a company instead of leased lines. Other applications, like online/multiplayer gaming; video-telephony, e-Commerce, e-Learning, e-Government, e-Health, Domotics, Security services are certainly of interest for business customers and may in some cases interest households. In the last few years, operators have increased average downstream speed per broadband connections, often with no extra charge for the customer. This increase, enabled by technology advance, pushed by competition and allows bandwidth intensive video content services available for households. The penetration of services like TV over IP has an impact on the average bandwidth per connection. Some recent services could be used in the home area network, meeting the needs of family members that live far from one another, for them to be able to communicate visually by adding a video feature to the telephone like videophony and the videophonic gatekeeper. The objective of the videophonic gatekeeper is to connect visitors to a member of a household, wherever he is. It meets the needs of people with mobility problems
but also people who are rarely at home during the day. When the visitor arrives, the service displays his/her images on the TV screen, or on the office computer, or soon, on the 3G mobile phone. A connection to the home area network enables communications to be set up with the TV set or with any appropriate set.
4.3 Infrastructure
The broadband needs of residential customers (Internet and audio visual) involve the problem of choosing the access network. For basic Internet services, ADSL is generally sufficient (up to 2Mbit/s and a good coverage), but as many operators want to offer bundles of services, they are looking for ways to increase the bandwidth of their access networks and ways to upgrade their networks to support other DSL technologies. Many operators in Europe are currently upgrading their networks to ADSL2+, a standard that increases the theoretical downstream speed from 10 Mbit/s for normal ADSL to 25 Mbit/s. More realistic performance levels are 16 Mbit/s to 18 Mbit/s downstream. A successor of ADSL2+ is VDSL2 for mass market. The high profile, operating at frequencies up to 30 MHz promises 100 Mbit/s of symmetrical speed, is limited to very short loops of up 100 meters. In the low profile, at 8 MHz, the aim is for downstream speeds of 20 Mbit/s to 30 Mbit/s at 750 to1200 meters. Increasing the bandwidth will allow a much broader range of services to end users. Because of the loop length dependency on DSL technology, the truly high bandwidth TV/Video services will not be available to all customers that can get a DSL service. Therefore, fibre connected access nodes will have to be brought closer to the end user, which will cost a lot of money and time. It seems that this situation will not be completed in a near future. Cable networks are alternatives to DSL. However, only 1 out of 3 households were able to get a cable broadband access in 2004. This situation is improving, but the reach of cable broadband access will remain inferior to that of DSL. Coverage is also significantly improved. The problems to be solved are more political or financial than technical, but this places cable operators at a disadvantage with regards to economies of scale, in terms of marketing, branding, equipment purchasing and network efficiency.

Fibre metro Ethernet appears to be most suitable for business sites. Radio-based broadband access technologies for connecting household and business sites can operate in a number of frequencies. Until recently, most broadband fixed wireless access networks were based on proprietary equipment, resulting in high cost and a poor business case for most operators. The WiMax, based on IEEE 802.16 range of standards, may be suitable for equipment interoperability. Satellite broadband services are mainly marketed in areas where DSL services are not yet available. Power line communications are also a solution, not expensive but with a relatively low performance. Of course, when planning any access deployment, the solution cost is a fundamental criterion. Depending on the specific deployment model, costs vary due to factors such as a technology maturity and market volume (which will drive product price reductions), solution component efficiency and technology. Bandwidth demand is driven by the end users and their need for enhanced services. To assess the capacity supply, different technologies can be compared. By optimizing the bandwidth supply to service demand, providers can realize an economical and profitable deployment.
Traffic engineering and bandwidth consumptions are key factors of deployment plans.
4.4 New potential broadband revenue streams
It is natural to analyse the spending budget for households in order to estimate the revenue potential for broadband content both for fixed network broadband services and mobile services. The hypothesis is: Parts of the spending categories, which the household now pays for, will in the future be partially substituted by use of services in the mobile and fixed network. The estimated potential will be an upper limit for a long-term evolution. Telecommunication services are expected to provide support, or even constitute an alternative, to some existing services or activities. Table 4.1 gives the household consumption on IT equipment. It should be noted that the classification used by COICOP (base of these figures) has not been fully updated and, for instance, IT equipment does not include PCs or other kind of equipment actually used to communicate at the present time.
Table 4.1 Evolution of average household consumption: IT equipment, 1998 - 2003 IT equipment in € 1998 1999 2000 2001 2002 2003 France 89,81 106,64 121,01 112,96 100,13 105,97 Finland 121,22 121,50 119,68 127,28 n.a n.a Germany 146,54 181,67 205,64 199,87 n.a n.a Norway n.a 243,38 297,33 295,50 263,37 246,40 Spain 68,79 69,76 77,00 76,42 60,66 n.a UK 293,97 291,42 294,77 303,85 271,20 273,44 The table indicates a moderate or negative growth during the last few years. Part of the consumption is necessary for telecommunication usage. The consumption on telecommunication services is provided in Table 4.2

Table 4.2 Evolution of average household consumption: Telecommunication services, 1998 -2003 Telecommunication services in € 1998 1999 2000 2001 2002 2003 France 494,88 564,95 610,96 611,26 633,30 646,70 Finland 554,60 676,13 744,21 790,29 804,98 812,22 Germany 544,84 567,01 612,74 718,93 721,18*) 723,44 Norway 524,56 646,18 611,11 678,00 715,38 793,88 Spain 348,53 358,82 373,79 415,25 440,47 n.a UK 560,41 607,50 669,68 697,01 708,19 735,08 *) Estimated The table shows a very significant growth in the telecommunication consumption. Figure 4.2 indicates the same. Figure 4.2 Growth in telecommunication spending per household from 1998 to 2002
The figure shows that households in all selected countries had an increase ot more than 25% in telecommunication spending from 1998 to 2002, which mean a yearly increase of more than 6%! The mean increase for households is 32,9% during the period. The total telecommunication spending for all households in selected countries has increased from 312 mill € to 436 mill € in the period. The total telecommunication spending is adjusted for inflation and takes into account the increased number of households. In the same way, the following figures give the evolution of average household expenditures on TV, cinema, music, theatre, concerts, gambling, books, newspapers, newsletters and journals, education and learning, and electronic gaming. Parts of these spending categories will most likely on long-term to be substituted by telecommunication services available on broadband accesses.
Table 4.3 Evolution of average household consumption: TV licences and pay TV, 1998 - 2003 TV licences and pay TV in € 1998 1999 2000 2001 2002 2003 France 171,54 185,73 191,81 193,80 196,34 202,08 Finland 132,32 132,43 141,17 148,97 149,31 147,96 Germany n.a 266,25 271,64 291,42 311,24 318,06 Norway 176,10 183,88 199,67 212,91 223,79 236,33 Spain n.a n.a n.a n.a n.a n.a UK n.a n.a n.a n.a n.a n.a
Growth in telecommunication spending per household 1998-2002
0
5
10
15
20
25
30
35
40
45
50
France Finland Germany Norway Spain UK Mean
Gro
wth
in
%

Table 4.4 Evolution of average household consumption: Cinema, theatre, concerts, 1998 -2003 Cinema, theatre, concerts in € 1998 1999 2000 2001 2002 2003 France (Cultural services) 342,06 356,69 366,34 372,00 375,01 377,27 Finland 102,57 122,38 134,01 142,42 146,11 151,52 Germany n.a n.a n.a n.a n.a n.a Norway 172,20 179,81 195,25 208,20 218,84 231,10 Spain 121,39 122,16 146,93 152,85 151,12 n.a UK 625,71 643,29 645,62 671,01 725,10 738,97 Table 4.5 Evolution of average household consumption: Gambling, 1998 -2003 Gambling in € 1998 1999 2000 2001 2002 2003 France 235,32 240,86 267,48 275,27 284,73 290,42 Finland 496,88 500,00 524,23 511,58 511,17 538,84 Germany 649,17 684,63 707,11 704,37 678,16 675,93 Norway 307,10 284,69 282,22 302,29 308,19 348,74 Spain 157,94 149,98 155,54 173,65 171,46 n.a UK 417,35 404,05 389,51 385,83 402,63 420,52
Table 4.6 Evolution of average household consumption: Books, 1998 -2003 Books in € 1998 1999 2000 2001 2002 2003 France 113,36 112,32 114,71 121,66 121,05 118,63 Finland 111,45 111,89 106,62 103,95 100,87 106,42 Germany 175,09 175,76 176,53 173,36 n.a n.a Norway 203,73 223,66 230,37 229,59 230,85 242,87 Spain 106,60 97,01 101,65 105,54 101,09 n.a UK 122,85 133,55 143,27 148,87 155,66 159,59 Table 4.7 Evolution of average household consumption: Newspapers, newsletters, journals, 1998 -2003
Newspapers, newsletters, journals in € 1998 1999 2000 2001 2002 2003 France 227,96 224,14 218,24 212,20 206,00 199,88 Finland 338,80 351,40 340,08 341,33 329,04 344,59 Germany 336,58 334,09 332,34 314,08 n.a n.a Norway 378,98 358,57 357,04 376,68 372,70 366,06 Spain 126,22 111,29 124,91 124,94 118,99 n.a UK 166,21 168,24 168,42 159,43 154,66 152,49

Table 4.8 Evolution of average household consumption: Education and learning, 1998 -2003
Table 4.9 Evolution of average household consumption: Electronic gaming, 1998 -2003
5 Classification of services The objectives with classification of broadband services and applications is to make a structure for modelling the evolution of the future broadband ARPU. There are reasons to believe that future ARPU will consist of charges for installation and usage together with a monthly fee. The classification of services and applications can be segmented in three main groups:
- Content services - Information retrieval and storage - Person to person and Peer to peer
The segmentation is valid for the residential, while the business market is more differentiated. Home office is a segment in between the residential and the business market – sometimes financed by the companies.
• Content services/applications Today most of the income streams for content services and applications are not part of the revenue for telecommunications service providers and network operators. However, broadband networks are able to transfer new broadband content applications and capture part of these income streams. The future content services/applications are:
Education and Elearning in € 1998 1999 2000 2001 2002 2003 France 179,34 181,33 176,20 174,38 178,34 180,02 Finland 139,43 133,30 125,58 126,05 125,69 126,60 Germany 198,20 202,60 206,96 205,48 211,81 213,04 Norway 106,51 106,81 107,28 115,52 115,37 108,92 Spain 253,33 250,57 244,86 234,80 230,22 n.a UK 458,87 512,83 537,35 518,39 505,10 501,65
Gaming in € 1998 1999 2000 2001 2002 2003 France (video games, game console) 9,89 11,16 13,60 13,48 16,52 19,91 Finland n.a n.a n.a n.a n.a n.a Germany (consol/pc/online/mobile) n.a 36,01 34,05 35,46 39,01 39,07 Norway 37,03 42,85 48,15 55,60 58,94 61,96 Spain 75,25 79,40 87,18 90,72 84,59 n.a UK (including toys and hoobies) 469,21 513,06 544,33 589,19 669,75 724,66

Purchase of movies and music Purchase of movies, VHS, DVD Purchase of music, cassettes, CD, DVD
Leasing of movies and music Leasing of movies, video on demand Leasing of music, music on demand
Cultural services and entertainment Video from program library, video on demand Events on demand TV channels and subscriptions On demand: News, sports, adult, life stile programs, health, lifeTV, etc Substitutions: Theatre, concerts, opera, cinema, other performances, museums, etc
Lotteries and gambling Gambling on automates Online gambling Online betting Video background information Video transmission of the gambling event
Books, newspapers, newsletters, journals Books (voice) Newspapers, dedicated newspapers Newsletters Journals
E-learning Education Additional education Hobbies
Online games Down loading and updating of gaming software Online games
• Information retrieval (Browsing/surfing) Traditional free surfing applications Surfing on charge (purchase of software, back up services, information)
• Information storage Network based storage
Network based storage of photos and films Network based storage of other information
• Peer to peer and person to person
Homepage® E-post with broadband content Videogram, Greetings cards Exchange of personal content Exchange of downloaded content
Exchange of Shareware software (various small and large programs) Film clubs Music clubs Exchange of general info
Video/WEB telephony Video conference/ Multimedia conference
• Surveillance at home Surveillance services for elderly/sick
• Home services Management home services Smart home services
• Home office Different multimedia broadband applications Data/file exchange Video/film exchange Video telephony Videoconferences
6 Models for forecasting new revenue streams
It is expected that many of the services presented in section 5 will have a significant growth in the future. However, the users will only increase their telecommunication spending based on the increased value created by the new services. The households will still be rational in their telecommunication usage.

6.1 Forecasts for broadband accesses A key factor for increased spending is access to both the mobile and fixed broadband network. Especially, the growth in demand for fixed broadband accesses will have a significant impact on household spending on new services. The CELTIC Eureka project ECOSYS and the IST project Tonic have developed broadband access forecasts for fixed network [2, 3, 4, 5, 7, 8, 9, 10, 11, 12]. These forecasts are important for the Figure 6.1 Penetration forecasts for broadband technologies in Western Europe revenue modelling. Households without access are not able to utilise the new broadband services. Figure 6.1 shows the broadband penetration forecasts for West European countries. In principle the broadband access forecasts should be separated based on what type of applications is used. Let fB(t) be the broadband access forecasts for the households. The forecasts reflect total broadband accesses. Some applications like video on demand, streaming, TV, etc need high capacity. Then ADSL2+/VDSL
and part of the cable modem forecasts and other broadband technology forecasts constitutes the relevant forecasts. Figure 6.2 shows the mobile handset/technology penetration forecast for Western Europe. The forecasts are based on forecast models developed in the projects Tonic and Ecosys [1, 6, 7, 11, 12].
Figure 6.2 Handset (technology) penetration forecasts for GSM, GPRS, EDGE and WDCMA for Western Europe Persons who have EDGE and UMTS handsets will have possibility to access new applications. For some mobile applications GPRS can also be an alternative. Let fM(t) be the forecasts. 6.2 Evaluations of the spending potentials in the residential market To utilise the possibilities, the households need to have access to either a broadband connection or new mobile networks or both. Section 4 showed the household spending on the following main categories:
- Purchase of films, videos, music - Leasing of films, videos, music
Evolution of technology generations
0 %
10 %
20 %
30 %
40 %
50 %
60 %
70 %
1997 1999 2001 2003 2005 2007 2009 2011
Pen
etra
tion
(%)
GSM
GPRS
EDGE
WCDMA
Penetration, each broadband technology
0
5
10
15
20
25
30
35
2000 2001 2002 2003 2004 2005 2006 2007 2008 2009 2010
Pen
etra
tio
n (
%)
ADSL
ADSL2+/VDSL
Other BB tech.
Cable modem

- TV licences and pay TV - Cinema, theatre, concerts - Gambling - Books - Newspapers, newsletters and journals - Education and E-learning - Electronic gaming
Let the spending categories be numbered j = 1,2 - - - N. Let the annual household spending in each category be: Sj(t) at time t. Suppose that ∆j(t) is the fraction of spending category Sj(t) at time t, which will be substituted by use of telecommunications per household. One way to describe the evolution is to assume these fractions on long-term. Let the long-term fraction for spending category j be ∆j(∞). Hence, one possibility is make assumptions of the long-term fraction and then make forecasts, which reach that level in the long run. Questions to be answered are: - How much of film, video, music market (both purchase and leasing) will be transferred by telecommunications in the long run? - How much of the book, newspaper, newsletter, journal market will be transferred by telecommunication in the long run? - How much of the Education market will be substituted by telecommunications - etc Another aspect of substitution effects for the telecommunications is also creation of additional values. It is seen from the significant increase in the household spending on telecommunication in the last few years – especially caused by extended mobile usage. Another important factor for future revenues in this sector is the evolution and growth in the household spending in general. We see the spending over time change between categories, but for some of the countries, there is also a significant growth in the total spending. Part of this growth may be used on telecommunications.
6.3 Potential revenue content forecasts for the residential market We assume that the additional revenues from the content categories are divided in a broadband part and a mobile part. Let - ∆jB(t) is the fraction of spending category Sj(t) at time t which could be
substituted by broadband, j = 1,2 - - - N - ∆jM(t) is the fraction of spending category Sj(t) at time t which could be
substituted by new mobile systems, j = 1,2 - - - N The long-term estimates for broadband and mobile content potential revenue respectively are: − ∆jB(∞) Sj(∞), j = 1,2 - - - N (6.1) − ∆jM(∞) Sj(∞), j = 1,2 - - - N (6.2) Since applications are rather new, it is natural to model the evolution with a diffusion model. Here, logistic models are used. Let the Logistic model for broadband and mobile spending categories be respectively fjB(t) and fjM(t). Then the forecasts are expressed by: Y jB(t) = ∆jB(∞) Sj(∞) / ( 1 + exp (αjB + βjB t))
γjB (6.3)
Y jM(t) = ∆jM(∞) Sj(∞) / ( 1 + exp (αjM + βjM t))
γjM
(6.4) where YjB(t) and YjM(t) are demand forecasts at time t, ∆jB(∞) Sj(∞) and ∆jM(∞) Sj(∞) are the saturation levels and αjB, αjM, βjB, βjM ,γjB ,γjM are growth parameters. The next part of the forecasting model includes: - fB(t) broadband access forecasts (households) - fM(t) mobile access forecasts (persons)
-

To be able to use the applications there are needs for broadband access and an advanced mobile handset. The forecasts are found in section 6.1. As mentioned the forecasts could be differentiated depending of spending category/applications. Hence, potential revenue content forecasting model R(t), consisting on a fixed network part and a mobile part is given by: R(t) = [fB(t) Σj=1, --n Y jB(t)] + [fM(t) Σj=1, --n Y jM(t)] (6.5) More precise forecasts are found when the access/handset forecasts are differentiated based on spending category/applications (fjB(t), fjM(t), j = 1,2 - - - N). Then, we get the following forecasting model: R*(t) = [ Σj=1, --n (fjB(t) Y jB(t))] + [ Σj=1, --n (fjM(t) Y jM(t))] (6.6)
6.4 Tariff considerations
A lot of work has been done on content charging. Different alternatives are: “pay per view”, pay for subscription, pay for usage, combinations etc. So far only potential revenue forecasts have been developed. Suppose that the charging alternative pay per view is used. If the pay per view for category j is PjB(t) and PjM(t) for broadband and mobile respectively, then the annual usage in year t, UjB(t) are UjM(t) are given by: UjB(t) = fjB(t) YjB(t)/ PjB(t) (6.7) UjM(t) = fjM(t) YjM(t)/ PjM(t) (6.8)
6.5 Revenue distribution among players
The content revenue will be shared among different players. The primary source is of course the content owner (C). There may also be content brokers (B) who negotiate with network operators (O) and content owners. In addition there will be service providers (SP) selling the product in the market.
The revenue sharing differentiates between household spending categories and applications and depends on how much resources are used by the players. Let the percentage proportion between the players, i = 1,2, -- m, for each spending category for respectively broadband and mobile be:
- qijB(t) - qijM (t)
then, it is possible to forecast the revenue for the different players. The revenue for the broadband and mobile player no i respectively is given by: RiB
*(t) = Σj=1, --n (fjB(t) YjB(t) qijB(t)) (6.9) RiM
*(t) = Σj=1, --n (fjM(t) YjM(t) qijM (t)) (6.10)
6.6 Content revenue and additional revenue
It is important to separate between services for content categories and services, which is not based on ownership to content. Services based on information exchange and surfing may in the long run give significant revenue possibilities. Examples of such applications are: Surfing, purchasing, electronic commerce, auctions, electronic post with broadband content, videograms, greeting cards, exchange of personal content, exchange of downloaded content (shareware software, film clubs, -), video/WEB telephony, video conferences.
7 Summary and conclusions
The paper documents the evolution of household spending for a sample of West European countries. Specific spending categories in the long run are substitutes to telecommunications are analysed. The results show that the number of households increases significantly over time in Western Europe and the spending per

household increases during the period 1998-2003 taking into account the inflation in that period. The conclusion is increased purchasing power for households. The analyses show that the telecommunication spending per household has increased with about 33% during the period 1998-2002 for the selected country sample. All countries examined had an increase of 25% or more. The results indicate that introduction of new and enhanced services for both mobile and the fixed network will continue to rise the telecommunication spending. Important areas for new telecommunication services are the content services. The analysis show that household are spending much money on leasing and buying videos and music, Pay TV and TV licenses, consumption on cinema, theatre, concerts, gambling, books, journals, newsletters, newspapers, education and learning, and electronic gaming. The tables in the paper show the amount of money, which is used on the different spending categories. Parts of this spending will in long term be substituted to telecommunications. In addition the paper shows how new content services may be classified and indicate how the spending during the last years are dived between mobile and fixed network services. New mobile and broadband access forecasts, which are an important part of the new revenue forecasts, are presented. In addition the paper introduce a framework for forecasting new revenue streams. References
1. Gjerde I. G., R. Venturin, K Stordahl: "Forecasting Mobile Market Development", ConTEL conference, Zagreb, Croatia, 15-17 June 2005
2. Stordahl K, N. K. Elnegaard “ Forecast uncertainties and risks in high capacity broadband rollouts” International Symposium on Forecasting, San Antonio, US, 12-15 July, 2005
3. Stordahl K. “Long-Term Broadband Technology Forecasting”, Telektronikk (100) no 4, 2004
4. Stordahl K, N. K. Elnegaard “Roll out Strategies and Forecasts for ADSL2+/VDSL”, Telektronikk (100) no4, 2004
5. Hjelkrem C, K Stordahl, J Bøe “Forecasting Residential Broadband Demand with Limited Information – A Long Term Demand and Supply Model”, Telektronikk (100) no 4, 2004
6. Stordahl K, I Grigic Gjerde, R Venturin, J Harmo, I Welling, K R Renjish Kumar, T Smura “Mobile Market Dynamics”, Telektronikk (100) no 4, 2004
7. ECOSYS Deliverable 2, “Overview of the demand forecasts for the fixed and mobile networks and services in Europe”, October 2004.
8. Stordahl K “Broadband Technology Forecasting” International Symposium on Forecasting 2004’, Sydney, Australia, 4-7 July, 2004
9. Stordahl K, N K Elnegaard, B T Olsen, M Lähteenoja “Competition in the Local Loop – How to Minimize the Market Risks” In Proc. XV International Symposium on Services in the Local access - ISSLS 2004. Edinburgh, Scotland, 21-24 March, 2004
10. Elnegaard N K, K Stordahl, B T Olsen, M Lähteenoja, “ Segmentation of
the Broadband Market with Respect to Present as well as Emerging Service Offerings” In Proc. XV International Symposium on Services in the Local access - ISSLS 2004. Edinburgh, Scotland, 21-24 March, 2004
11. IST TONIC, Deliverable 8, “Market Models for IP services”, 31. May
2002
12. IST TONIC, Deliverable 2, “Demand models and preliminary forecasts for IP services”, June 2001
Kjell Stordahl received his M.Sc. from Oslo University in 1972. He has been at the Research Department Telenor for 15 years; 7 years as a manager of the Teletraffic field. He joined Telenor Networks in 1989 as chief planning manager until 1996. He has been manager of Market analysis in Telenor Networks 1997-2002. Kjell Stordahl was appointed associated reporter and special reporter 1981-1988 in CCITT SGII for "Forecasting International Traffic". From1985 to1988 he participated in CCITT GAS 10 and developed a forecasting handbook. He has also worked for ITU's headquarter as a specialist on forecasting. From 1994 to 1997 he was on the Board of Telenor Consult AS. He was referee for Project Imagine 21 in the ESPRIT Programme 1999-2001. Kjell Stordahl was on the

Technical Advisory Board of Virtual Photonics 2000-2002. Since 1992 he has participated in various projects funded by the European Commission: RACE/TITAN, ACTS/OPTIMUM and TERA, IST/TONIC and CELTIC/ECOSYS. Kjell Stordahl has published over 150 papers in international journals and conferences. Beatriz Craignou received her M.Sc. from the University of Wales in 1971 and her PhD in mathematics from the University Paris VI in 1979. She has been at the Research Department of France Telecom for 25 years. She is an expert in traffic engineering and network planning. Beatriz Craignou is a specialist in forecasting and dimensioning for intelligent networks and broadband networks and services, including new technologies such as optic fibber, wavelength division multiplexing, optical transport network, ADSL and Ethernet. Since 1995 she has participated in various EURESCOM projects: P308-intelligent network dimensioning tools, P611-network planning in an uncertain environment, P1006-differentiated services, P1012 and P1116-optical networks. She contributes actively to the European projects IST/NOBEL and CELTIC/ECOSYS. Beatriz Craignou has also participated in initiatives of the CCITT, the UIT-T and the UIT-D (GAS and CE), and has held several chairs for ITC. She has published over 30 papers in international journals and conferences. Timo Smura received his MSc (Tech) degree from Helsinki University of Technology in 2004. He is currently working as a research scientist and carrying out his post-graduate studies at the Networking Laboratory in Helsinki University of Technology. His research interest include competition in
telecommunications industry, operator business models and strategies, and techno-economics of communication networks
Ilari Welling received his MSc degree in telecommunication Engineering from Helsinki University of Technology in 1996. He joined the Nokia research Center in 1995, where he has been studying techno-economic aspects of telecommunication networks and is currently leading the research group focusing on this topic. Recently he has been the leader of the EU project Tonic and he is currently leading the CELTIC project ECOSYS, which concentrates on techno-economic modelling. Mr Welling has authored/co-authored several international articles and has presented papers at conferences in the field of telecom techno-economics. He was also a co-author of the book “Broadband Access Networks: Introduction strategies and techno-economic evaluation” (Chapman&Hall 1998) K.R.Renjish Kumar is a research scientist/PhD student at the Networking laboratory, Helsinki University of Technology since January 2003. Prior to this, he has worked with Siemens ICM, Singapore as R&D engineer for over a year and with Cognizant Technology Solutions for over two years as programmer analyst. He received his Masters degree in Computer Science from National University of Singapore (2001) and Bachelor of Engineering degree in Electronics and communications from National Institute of Technology, Suratkal, India (1997). His research interests include techno-economic issues in mobile communications, IP QoS and TCP performance issues.