
Monitoring with Nagios
19
-
Upload
khangminh22 -
Category
Documents
-
view
5 -
download
0
Transcript of Monitoring with Nagios
2
@ 2020, Smarten Visit us at www.smarten.com 2
Document Information
Document ID Smarten-Monitoring-with-Nagios
Document Version 1.0
Product Version 5.1
Date 26-Aug-2020
Recipient NA
Author EMTPL
© Copyright Elegant MicroWeb Technologies Pvt. Ltd. 2020. All Rights Reserved.
Statement of Confidentiality, Disclaimer and Copyright
This document contains information that is proprietary and confidential to EMTPL, which shall not
be disclosed, transmitted, or duplicated, used in whole or in part for any purpose other than its
intended purpose. Any use or disclosure in whole or in part of this information without the express
written permission of EMTPL is prohibited.
Any other company and product names mentioned are used for identification purpose only, may be
trademarks of their respective owners and are duly acknowledged.
Disclaimer
This document is intended to support administrators, technology managers or developers using and implementing Smarten. The business needs of each organization will vary and this document is expected to provide guidelines and not rules for making any decisions related to Smarten. The overall performance of Smarten depends on many factors, including but not limited to hardware configuration and network throughput.
3
@ 2020, Smarten Visit us at www.smarten.com 3
Contents
1 Smarten monitoring with Nagios .............................................................................................. 4
1.1 Nagios Installation ................................................................................................................. 4
1.2 Nagios Plugins Installation .................................................................................................... 6
1.3 Install NRPE Plugin ................................................................................................................. 7
1.4 Add Command Definition ...................................................................................................... 8
1.5 Install and Configure Nagios Client (Linux Ubuntu) .............................................................. 8
1.6 Add Linux Host in Nagios ....................................................................................................... 9
1.7 Configure Memory Monitoring ............................................................................................ 10
1.8 Configure Disk Monitoring .................................................................................................. 11
1.9 Configure CPU Monitoring .................................................................................................. 12
1.10 Configure URL Monitoring................................................................................................. 13
1.11 Configure MYSQL Monitoring ........................................................................................... 14
1.12 Configure JAVA HEAP Monitoring ..................................................................................... 15
1.13 Install and Configure Postfix Server for Nagios Email Notification ................................... 17
2 Product and Support Information........................................................................................... 19
4
@ 2020, Smarten Visit us at www.smarten.com 4
1 Smarten monitoring with Nagios
Nagios is powerful monitoring system that enables organizations to identify and resolve IT infrastructure problems before they effect critical business process.
Hardware Requirements
Memory: 1GB
CPU: 1 Core
Storage : 8 GB
Software Requirements
Ubuntu 18.04 LTS (OS)
Apache 2.4
Php 7.0
1.1 Nagios Installation
Procedure
1. Install the prerequisite packages necessary for building Nagios and Nagios plugins with the
following command.
sudo apt install autoconfgcc libc6 make wget unzip libgd2-xpm-dev
2. Install Apache, PHP7, and all the necessary modules with the following command.
sudo apt install apache2 php libapache2-mod-php7.0
3. When the Apache installation is complete, run the following command to enable Apache to start
on boot.
sudosystemctl enable apache2.service
4. Download the latest stable version of the Nagios tar archive in the /tmp directory on your server
by running the following command.
wget
https://github.com/NagiosEnterprise/nagioscore/release/download/nagios-4.1.1/nagios-
4.1.1.tar.gz -O /tmp/nagioscore.tar.gz
5. When the download is completed navigate to the /tmp directory extract the archieve by issuing
following command.
cd /tmp
tar xf nagioscore.tar.gz
6. Once the Nagios archive is extracted, change to the Nagios-4.1.1 directory.
cd /tmp/Nagios-4.1.1
7. Next step is to run ./configure script which will check your system for missing libraries and
binaries and prepare the Nagios source code for the build process.
sudo ./configure –with-httpd-conf=/etc/apache2/sites-enabled
The output will look like the following.

5
@ 2020, Smarten Visit us at www.smarten.com 5
8. Now that the configuration is completed start the compilation process using the make all
command.
make install
9. Run the following command to create the Nagios user and group and add Apache to the Nagios
Group.
sudo make install –groups-users
sudousermod –a –G nagios www-data
10. The next step is to install Nagios using the make install command
sudo make install
11. Run the following command to install the Nagios sample configuration files.
sudo make install-config
12. Install the initialization script so that you can manage your Nagios service using the systemctl
command.
sudo make install-daemoninit
13. Next, install the Apache web server configuration files with following command.
sudo make install-webconf
14. Restart apache services.
sudosystemctl restart apache2
15. Run the following command to create a user account called nagiosadmin
sudohtpasswd –c /usr/local/Nagios/etc/htpasswd.usersnagiosadmin
16. Next run the following command to install and configure the external command directory
sudo make install-commandmode
6
@ 2020, Smarten Visit us at www.smarten.com 6
1.2 Nagios Plugins Installation
Procedure
1. Install the following dependencies necessary for downloading and compiling Nagios Plugin.
sudo apt install autoconfgcc libc6 libmcrypt-dev make libssl-devwgetbc gawk dc build-
essential snmplibnet-snmp-perlgettext
2. Download the latest stable version of the Nagios tar archive in the /tmp directory on your
server.
wget –no-check-certificate –O /tmp/nagios-plugins.tar.gz
https://github.com/nagios-plugins/nagios-plugins/archive/release-2.2.1.tar.gz
3. When the download is completed change to the temp directory extract the archieve with the
following commands.
cd /tmp
sudo tar xf nagios-plugins.tar.gz
4. Once the Nagios Plugins archive is extracted, change to the Nagios-plugins-relase-2.2.1
directory.
cd /tmp/nagios-plugnis-release-2.2.1/
5. The following commands will check your system for missing libraries and binaries and prepare
the Nagios Plugins source code for build process.
./tools/setup
./configure
6. When the configuration is complete start the compilation process using the make command.
make
7. Install the Nagios Plugins using the make install command
sudo make install
8. Access Nagios
Now that you have both Nagios and Nagios Plugins installed on system, start the Nagios service
with the following command:
sudosystemctl enable apache2
sudosystemctl enable nagios
sudosystemctl start apache2
sudosystemctl start nagios
9. Open port 80 in firewall.
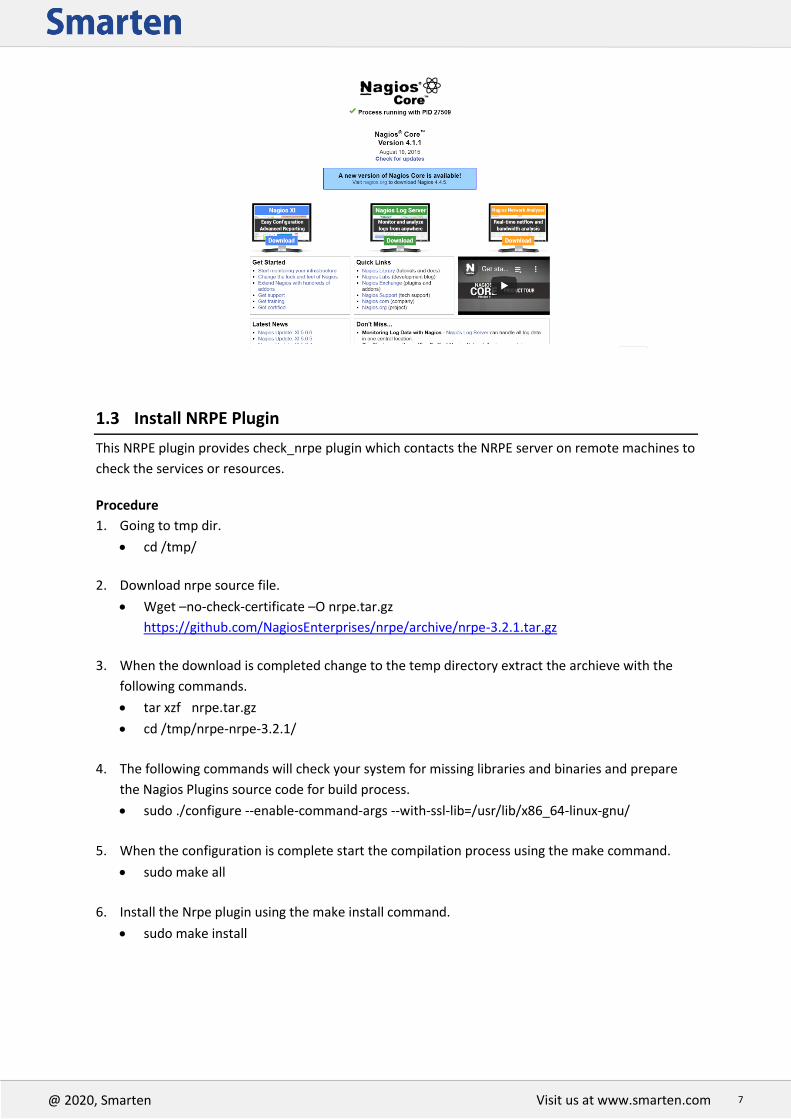
10. Open your browser and navigate to http://your-server-public-ip/nagios and you will be
presented with login pop-up.
Enter the login credentials that you created earlier with the htpasswd command and you will be
redirected to the Nagios home page as shown on the image below.
7
@ 2020, Smarten Visit us at www.smarten.com 7
1.3 Install NRPE Plugin
This NRPE plugin provides check_nrpe plugin which contacts the NRPE server on remote machines to
check the services or resources.
Procedure
1. Going to tmp dir.
cd /tmp/
2. Download nrpe source file.
Wget –no-check-certificate –O nrpe.tar.gz
https://github.com/NagiosEnterprises/nrpe/archive/nrpe-3.2.1.tar.gz
3. When the download is completed change to the temp directory extract the archieve with the
following commands.
tar xzf nrpe.tar.gz
cd /tmp/nrpe-nrpe-3.2.1/
4. The following commands will check your system for missing libraries and binaries and prepare
the Nagios Plugins source code for build process.
sudo ./configure --enable-command-args --with-ssl-lib=/usr/lib/x86_64-linux-gnu/
5. When the configuration is complete start the compilation process using the make command.
sudo make all
6. Install the Nrpe plugin using the make install command.
sudo make install

8
@ 2020, Smarten Visit us at www.smarten.com 8
1.4 Add Command Definition
Now it’s time to configure the Nagios server to monitor the remote client machine, and You’ll need
to create a command definition in Nagios object configuration file to use the check_nrpe plugin.
Procedure
1. Open the commands.cfg file.
nano /usr/local/nagios/etc/objects/commands.cfg
2. Add the following Nagios command definition to the file.
# .check_nrpe.command definition define command{ command_namecheck_nrpe command_line /usr/lib/nagios/plugins/check_nrpe -H $HOSTADDRESS$ -t 30 -c $ARG1$ }
1.5 Install and Configure Nagios Client (Linux Ubuntu)
NRPE is stands for Nagios Remote Plugin Executor. NRPE add-on is designed to allow you to execute
Nagios plugins on remote Linux/Unix machines.
Procedure
1. Install NRPE and Nagios Plugins.
NRPE is available under default apt repositories of Ubuntu systems. Execute the following
command to install it.
sudo apt-get install nagios-nrpe-server nagios-plugins nagios-plugins-basic nagios-plugins-
standard
2. Configure NRPE
Edit the /etc/nagios/nrpe.cfg file and in allowed hosts give the ip address of Nagios monitoring
Server from which monitoring will be done. For example nagios monitoring host server ip
192.168.182.130, then add this IP address to allowed hosts list.
allowed_hosts=127.0.0.1, 192.168.182.130
3. Restart the NRPE service.
Restart the nrpe service in client machine with following command.
sudo /etc/init.d/nagios-nrpe-server restart.
4. Allow port 5666 in firewall.
5. Verify the NRPE daemon is functioning properly. Run the “check_nrpe” command.
/usr/lib/nagios/plugins/check_nrpe -H localhost.
9
@ 2020, Smarten Visit us at www.smarten.com 9
6. The /etc/nagios/nrpe.cfg file contains the basic commands to check the attributes (CPU,
Memory, Disk, etc. architecture) and services (HTTP, FTP, etc.) on remote hosts.
7. Below command lines let you monitor Memory, System Load, Root file system, Swap usage with
the help of Nagios plugins.
……
……
command[check_load]=/usr/lib/nagios/plugins/check_load -r -w 75% -c 80%
command[check_disk]=/usr/lib/nagios/plugins/check_disk -w 25% -c 20% -p /
command[check_mem]=/usr/lib/nagios/plugins/check_mem -u -w 90% -c 95%
8. There is some notification option W,C,R.
W = stands for notify on WARNING service states.
C = stands for notify on CRITICAL service states.
R = stands for notify on service recovering (OK states)
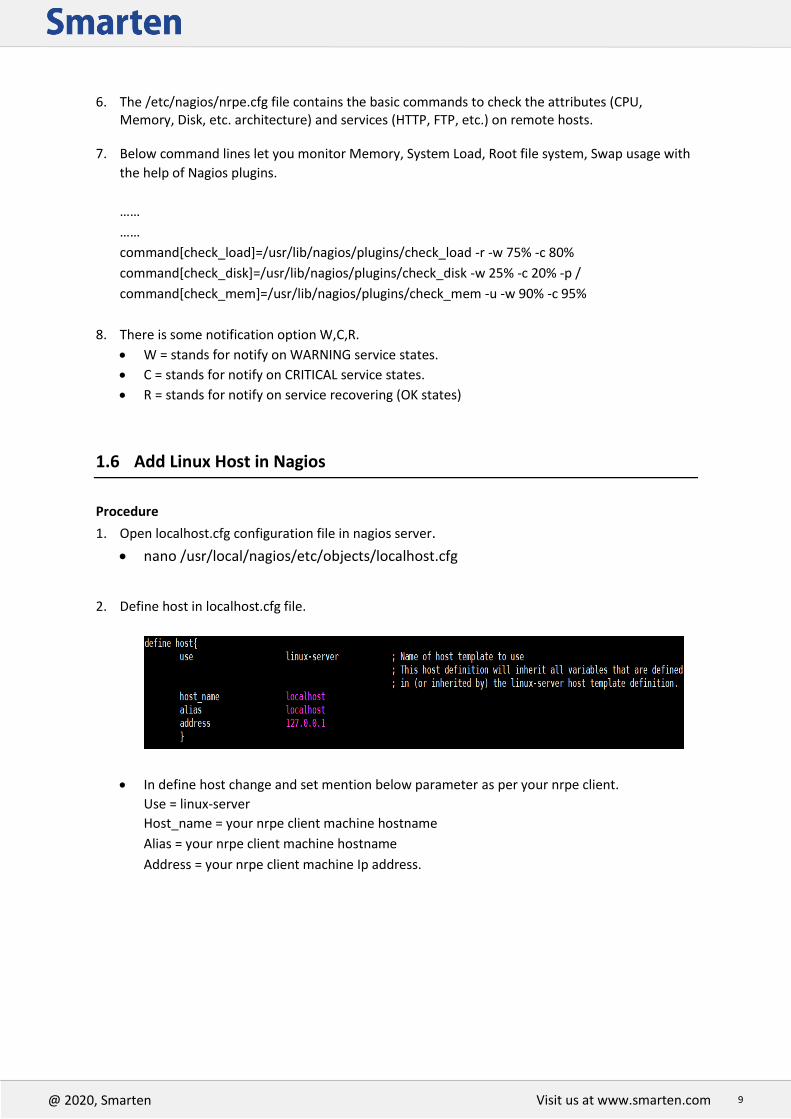
1.6 Add Linux Host in Nagios
Procedure
1. Open localhost.cfg configuration file in nagios server.
nano /usr/local/nagios/etc/objects/localhost.cfg
2. Define host in localhost.cfg file.
In define host change and set mention below parameter as per your nrpe client.
Use = linux-server
Host_name = your nrpe client machine hostname
Alias = your nrpe client machine hostname
Address = your nrpe client machine Ip address.
10
@ 2020, Smarten Visit us at www.smarten.com 10
1.7 Configure Memory Monitoring
Procedure
1. Open localhost.cfg configuration file in nagios server.
nano /usr/local/nagios/etc/objects/localhost.cfg
2. Add below parameter in localhost.cfg configuration file in nagios server.
host_name : Your client machine hostname
service_description : Check RAM
check_command : check_nrpe!check_mem!20%!10%
Notes:
check_mem 20% >> means when your memory utilize 80% nagios send warning alerts.
check_mem 10% >> means when your memory utilize 90% nagios send critical alerts.
For Example:
define service { use local-service host_nameNagios client machine hostname Service_description Check RAM check_commandcheck_nrpe!check_mem max_check_attempts 5 check_interval 1 retry_interval 2 check_period 24x7 register 1 }
3. Open nrpe.cfg configuration file in nagios client machine
nano /etc/nagios/nrpe.cfg
4. Uncomment below mention line and add memory string. For an example you want to when memory
utilize 80% warning alerts and when memory utilize 90% critical alerts.
command[check_mem]=/usr/lib/nagios/plugins/check_mem -u -w 80% -c 90%
5. Restart the services in nagios server
sudosystemctl restart apache2
sudosystemctl restart nagios
6. Restart the services in nagios client
sudosystemctl restart nrpe-server
11
@ 2020, Smarten Visit us at www.smarten.com 11
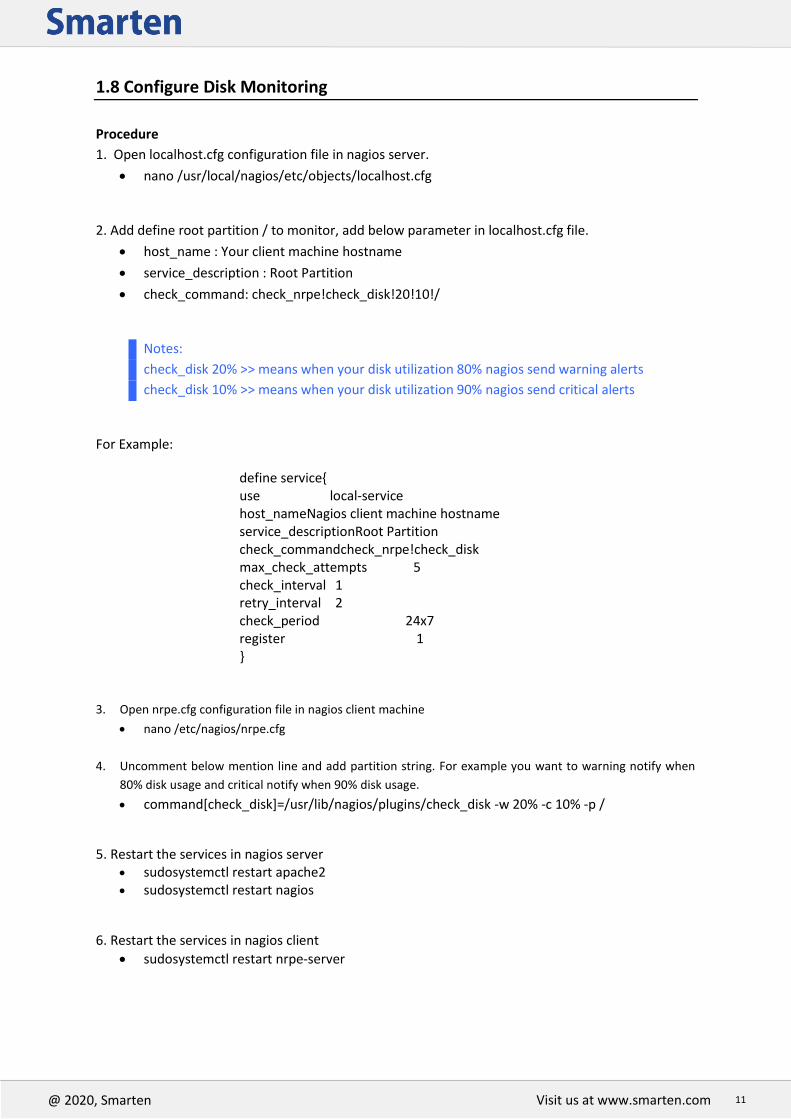
1.8 Configure Disk Monitoring
Procedure
1. Open localhost.cfg configuration file in nagios server.
nano /usr/local/nagios/etc/objects/localhost.cfg
2. Add define root partition / to monitor, add below parameter in localhost.cfg file.
host_name : Your client machine hostname
service_description : Root Partition
check_command: check_nrpe!check_disk!20!10!/
Notes:
check_disk 20% >> means when your disk utilization 80% nagios send warning alerts
check_disk 10% >> means when your disk utilization 90% nagios send critical alerts
For Example:
define service{ use local-service host_nameNagios client machine hostname service_descriptionRoot Partition check_commandcheck_nrpe!check_disk max_check_attempts 5 check_interval 1 retry_interval 2 check_period 24x7 register 1 }
3. Open nrpe.cfg configuration file in nagios client machine
nano /etc/nagios/nrpe.cfg
4. Uncomment below mention line and add partition string. For example you want to warning notify when
80% disk usage and critical notify when 90% disk usage.
command[check_disk]=/usr/lib/nagios/plugins/check_disk -w 20% -c 10% -p /
5. Restart the services in nagios server sudosystemctl restart apache2
sudosystemctl restart nagios
6. Restart the services in nagios client
sudosystemctl restart nrpe-server

12
@ 2020, Smarten Visit us at www.smarten.com 12
1.9 Configure CPU Monitoring
Procedure
1. Open localhost.cfg configuration file in nagios server.
nano /usr/local/nagios/etc/objects/localhost.cfg
2. Add define CPU to monitor, Add below parameter in localhost.cfg
host_name : nagios client machine hostname
service_description : Current load
check_command: check : check_nrpe!check_load!75%!80%
Notes:
check_load 75% >> means when your cpu load utilization 75% nagios send warning alerts
check_load 80% >> means when your cpu load utilization 80% nagios send critical alerts
For Example:
define service{
use local-service
host_nameNagios client machine hostname
service_description Current Load
check_commandcheck_nrpe!check_load
max_check_attempts 5
check_interval 1
retry_interval 2
check_period 24x7
register 1
}
3. Open nrpe.cfg configuration file in nagios client machine
nano /etc/nagios/nrpe.cfg
4. Uncomment below mention line and add partition string. For example you want to warning notify when
75% cpu usage and critical notify when 80% usage.
command[check_load]=/usr/lib/nagios/plugins/check_load -r -w 75% -c 80%
5. Restart the services in nagios server
sudosystemctl restart apache2
sudosystemctl restart nagios
6. Restart the services in nagios client
sudosystemctl restart nrpe-server

13
@ 2020, Smarten Visit us at www.smarten.com 13
1.10 Configure URL Monitoring
Procedure
1. Open localhost.cfg configuration file in nagios server.
nano /usr/local/nagios/etc/objects/localhost.cfg
2. Add define HTTPS URL monitoring, Add below parameter in localhost.cfg.
host_name : nagios client machine hostname
service_description: Add URL (https://xyz.com/smarten)
check_command: check_nrpe!check_https_url
Notes:
check_https_url: Nagios notify warning alerts when your URL 404 not found and when URL
no response or your web server down Nagios notify Critical alerts.
For Example:
define service{ use local-service host_namenagios client machine hostname service_description https://xyz.com/smarten check_commandcheck_nrpe!check_https_url max_check_attempts 5 check_interval 1 interval 1 check_period 24x7 register 1 }
3. Create check_https_url command in Nagios server, Open commands.cfg configuration file
nano /usr/local/nagios/etc/objects/commands.cfg 4. Copy and paste mention below command in EOD file and save it.
define command {
command_namecheck_https_url
command_line /usr/local/nagios/libexec/check_http -H $HOSTADDRESS$ -S -u '$ARG2$'
}
5. Open nrpe.cfg configuration file in nagios client machine
nano /etc/nagios/nrpe.cfg
6. Add below line in nrpe.cfg configuration file and save.
command[check_https_url]=/usr/lib/nagios/plugins/check_http -H xyz.com -S -U /smarten
-H = Website domain name
-S = check_https
-U = /smarten
14
@ 2020, Smarten Visit us at www.smarten.com 14
7. Restart the services in nagios server
sudosystemctl restart apache2
sudosystemctl restart nagios
8. Restart the services in nagios client
sudosystemctl restart nrpe-server
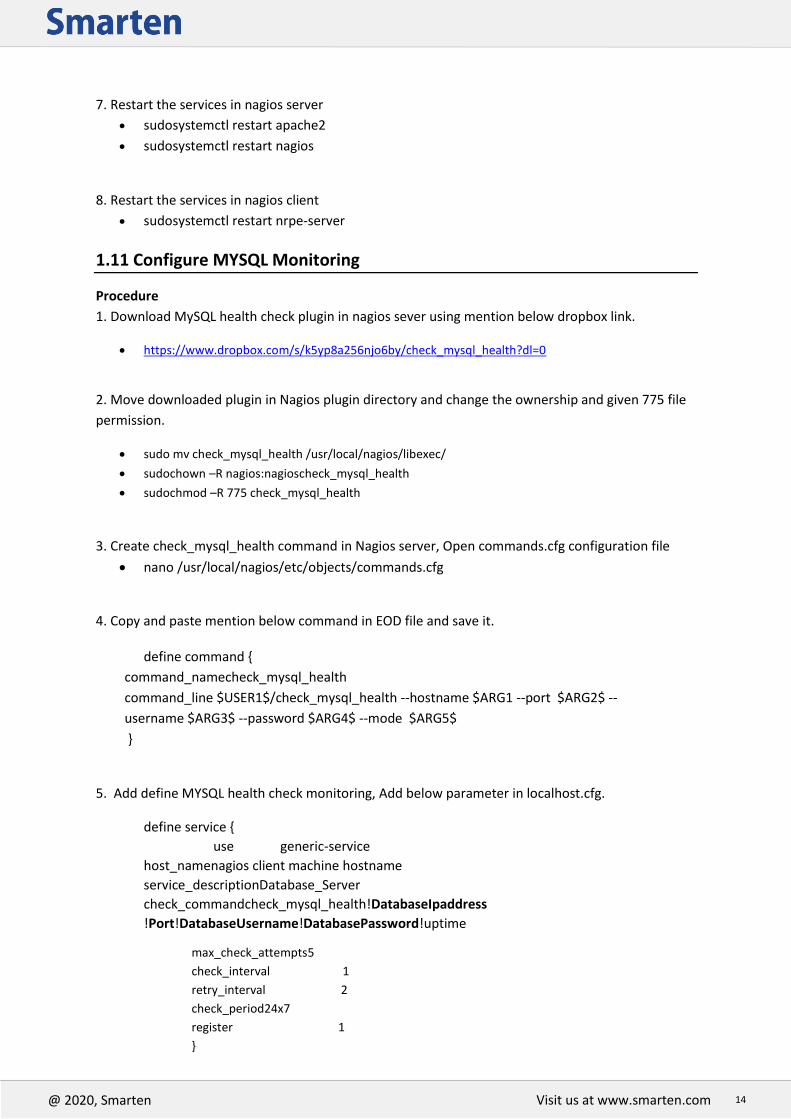
1.11 Configure MYSQL Monitoring
Procedure
1. Download MySQL health check plugin in nagios sever using mention below dropbox link.
https://www.dropbox.com/s/k5yp8a256njo6by/check_mysql_health?dl=0
2. Move downloaded plugin in Nagios plugin directory and change the ownership and given 775 file
permission.
sudo mv check_mysql_health /usr/local/nagios/libexec/
sudochown –R nagios:nagioscheck_mysql_health
sudochmod –R 775 check_mysql_health
3. Create check_mysql_health command in Nagios server, Open commands.cfg configuration file
nano /usr/local/nagios/etc/objects/commands.cfg 4. Copy and paste mention below command in EOD file and save it.
define command {
command_namecheck_mysql_health
command_line $USER1$/check_mysql_health --hostname $ARG1 --port $ARG2$ --
username $ARG3$ --password $ARG4$ --mode $ARG5$
}
5. Add define MYSQL health check monitoring, Add below parameter in localhost.cfg.
define service {
use generic-service
host_namenagios client machine hostname
service_descriptionDatabase_Server
check_commandcheck_mysql_health!DatabaseIpaddress
!Port!DatabaseUsername!DatabasePassword!uptime
max_check_attempts5
check_interval 1
retry_interval 2
check_period24x7
register 1
}
15
@ 2020, Smarten Visit us at www.smarten.com 15
6. Restart the services in nagios server
sudosystemctl restart apache2
sudosystemctl restart nagios
7. Restart the services in nagios client
sudosystemctl restart nrpe-server
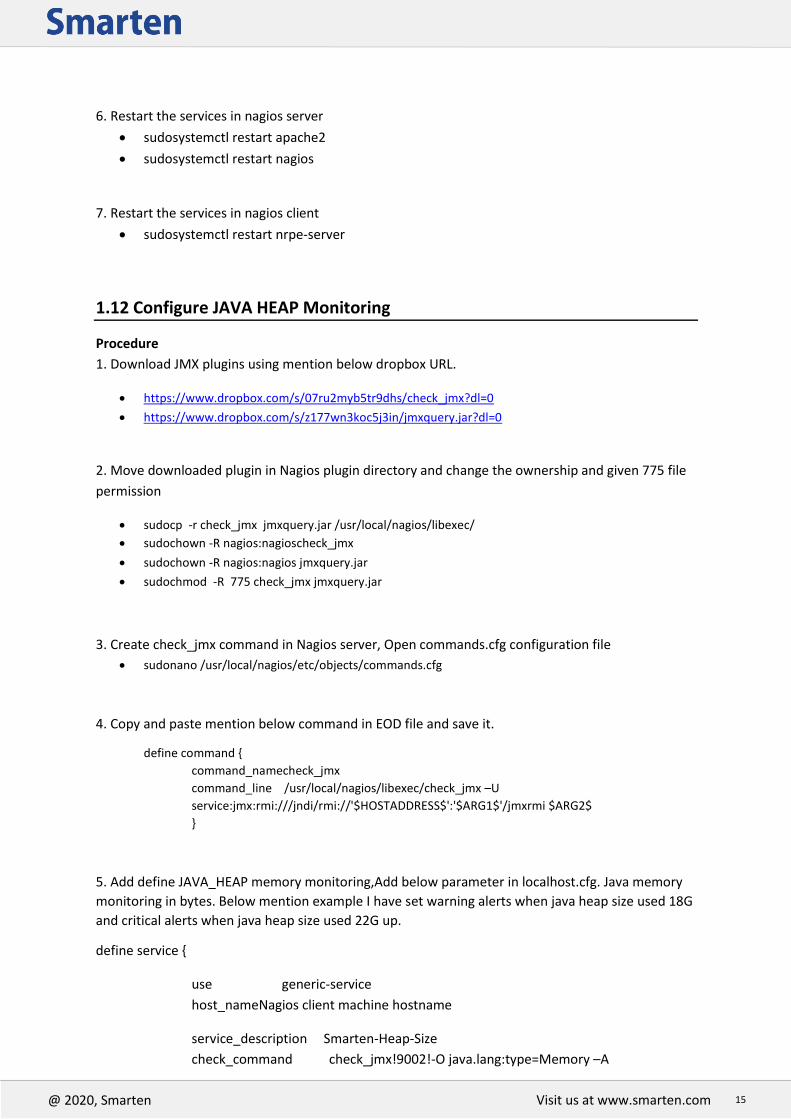
1.12 Configure JAVA HEAP Monitoring
Procedure
1. Download JMX plugins using mention below dropbox URL.
https://www.dropbox.com/s/07ru2myb5tr9dhs/check_jmx?dl=0
https://www.dropbox.com/s/z177wn3koc5j3in/jmxquery.jar?dl=0
2. Move downloaded plugin in Nagios plugin directory and change the ownership and given 775 file
permission
sudocp -r check_jmx jmxquery.jar /usr/local/nagios/libexec/
sudochown -R nagios:nagioscheck_jmx
sudochown -R nagios:nagios jmxquery.jar
sudochmod -R 775 check_jmx jmxquery.jar
3. Create check_jmx command in Nagios server, Open commands.cfg configuration file
sudonano /usr/local/nagios/etc/objects/commands.cfg
4. Copy and paste mention below command in EOD file and save it.
define command {
command_namecheck_jmx
command_line /usr/local/nagios/libexec/check_jmx –U
service:jmx:rmi:///jndi/rmi://'$HOSTADDRESS$':'$ARG1$'/jmxrmi $ARG2$
}
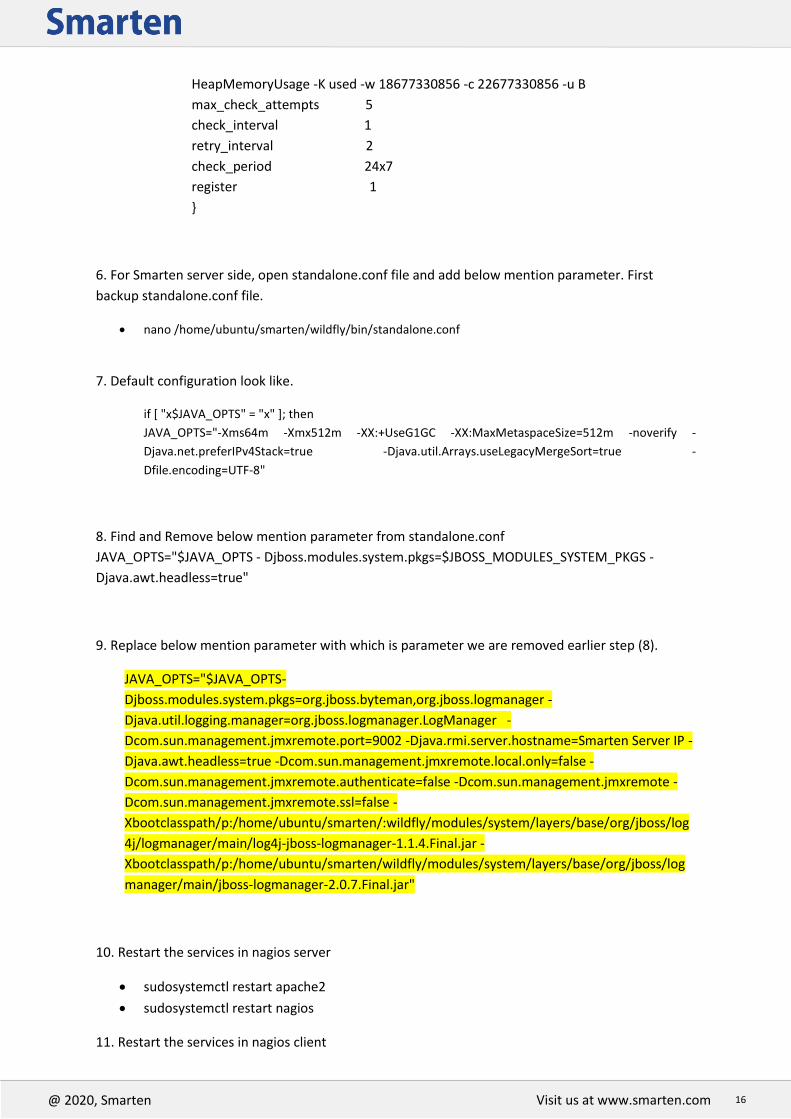
5. Add define JAVA_HEAP memory monitoring,Add below parameter in localhost.cfg. Java memory
monitoring in bytes. Below mention example I have set warning alerts when java heap size used 18G
and critical alerts when java heap size used 22G up.
define service {
use generic-service
host_nameNagios client machine hostname
service_description Smarten-Heap-Size
check_command check_jmx!9002!-O java.lang:type=Memory –A
16
@ 2020, Smarten Visit us at www.smarten.com 16
HeapMemoryUsage -K used -w 18677330856 -c 22677330856 -u B
max_check_attempts 5
check_interval 1
retry_interval 2
check_period 24x7
register 1
}
6. For Smarten server side, open standalone.conf file and add below mention parameter. First
backup standalone.conf file.
nano /home/ubuntu/smarten/wildfly/bin/standalone.conf
7. Default configuration look like.
if [ "x$JAVA_OPTS" = "x" ]; then
JAVA_OPTS="-Xms64m -Xmx512m -XX:+UseG1GC -XX:MaxMetaspaceSize=512m -noverify -
Djava.net.preferIPv4Stack=true -Djava.util.Arrays.useLegacyMergeSort=true -
Dfile.encoding=UTF-8"
8. Find and Remove below mention parameter from standalone.conf
JAVA_OPTS="$JAVA_OPTS - Djboss.modules.system.pkgs=$JBOSS_MODULES_SYSTEM_PKGS -
Djava.awt.headless=true"
9. Replace below mention parameter with which is parameter we are removed earlier step (8).
JAVA_OPTS="$JAVA_OPTS-
Djboss.modules.system.pkgs=org.jboss.byteman,org.jboss.logmanager -
Djava.util.logging.manager=org.jboss.logmanager.LogManager -
Dcom.sun.management.jmxremote.port=9002 -Djava.rmi.server.hostname=Smarten Server IP -
Djava.awt.headless=true -Dcom.sun.management.jmxremote.local.only=false -
Dcom.sun.management.jmxremote.authenticate=false -Dcom.sun.management.jmxremote -
Dcom.sun.management.jmxremote.ssl=false -
Xbootclasspath/p:/home/ubuntu/smarten/:wildfly/modules/system/layers/base/org/jboss/log
4j/logmanager/main/log4j-jboss-logmanager-1.1.4.Final.jar -
Xbootclasspath/p:/home/ubuntu/smarten/wildfly/modules/system/layers/base/org/jboss/log
manager/main/jboss-logmanager-2.0.7.Final.jar"
10. Restart the services in nagios server
sudosystemctl restart apache2
sudosystemctl restart nagios
11. Restart the services in nagios client
17
@ 2020, Smarten Visit us at www.smarten.com 17
sudosystemctl restart nrpe-server
1.13 Install and Configure Postfix Server for Nagios Email Notification
Procedure
1. Install postfix server in nagios server using mention below command
sudo apt-get install postfix mailutils libsasl2-2 ca-certificates libsasl2-modules
2. Open main.cnf postfix configuration file.
sudonano /etc/postfix/main.cnf
3. For example I have set Gmail domain for getting nagios email alerts. Set SMTP relay host as per
your email domain. Add below mention parameter in main.cnf configuration file and save it.
relayhost = [smtp.gmail.com]:587
smtpd_sasl_auth_enable = yes
smtp_sasl_password_maps = hash:/etc/postfix/sasl_passwd
smtp_sasl_security_options = noanonymous
smtp_sasl_tls_security_options = noanonymous
smtp_tls_CAfile = /etc/postfix/cacert.pem
smtp_use_tls = yes
inet_protocols = ipv4
4. Open /etc/postfix/sasl_passwd file and add your email credential which is you want to send from
email notification and save file.
sudonano /etc/postfix/sasl_passwd
[smtp.gmail.com]:587 email id: password
5. After that enter below command to encrypt your password and restart the postfix services.
postmap /etc/postfix/sasl_passwd
cat /etc/ssl/certs/ssl-cert-snakeoil.perm | sudo tee -a /etc/postfix/cacert.pem
sudochkconfig postfix enable
sudo service postfix start
6. Add contacts in Nagios Server for get email notification, Open contact.cfg file and add contact.
sudonano/usr/local/nagios/etc/objects/contacts.cfg
Define contact and add email address which is you want get notification.
define contact{
contact_namenagiosadmin
18
@ 2020, Smarten Visit us at www.smarten.com 18
use generic-contact
aliasNagios Admin
emailAdd Email Address
service_notification_period 24x7
service_notification_optionsw,c,r
service_notification_commands notify-service-by-email
host_notification_period 24x7
host_notification_optionsd,u,r
host_notification_commands notify-host-by-email
}
7. Add nagiosadmin contact in admin group, default contact name is nagiosadmin.
definecontactgroup{
contactgroup_name admins
aliasNagios Administrators
membersnagiosadmin
}
8. Open localhost.cfg file and enable notification and enable group notification, add mention below
parameter in localhost.cfg service check configuration and add notification in every services which is
you want get email notifications.
max_check_attempts = Define the number of times that Nagios will retry the host check command.
check_interval = Define check the number of "time units" between regularly scheduled checks of the
hosts.
retry_interval = Define the number of "time units" to wait before scheduling a re-check of the hosts.
check_period = Define the specify the shot name of the time period during which active checks of this
host can be made.
contact_groups = Contact groups that should be notified whenever there are problems (or
recoveries) with this host.
notification_interval = Define the number of "time units" to wait before re-notifying a contact that
this service is still down or unreachable.
notification_period = Time period during which notifications of events for this host can be sent out of
contacts.
notifications_enabled = 1 means notification enable in particular services or host.
notifications_enabled=0 means notification disable in particular services or host.
Register = determines whether a variable should be registered with Nagios.
define service{ use local-service host_nameNagios client machine hostname service_descriptionhttps://xyz.com/smarten check_commandcheck_nrpe!check_https_url max_check_attempts 5 check_interval 1 retry_interval 1 check_period 24x7 notification_optionsw,c,r contact_groups admins notification_interval 5 notification_period 24x7 notifications_enabled 1
19
@ 2020, Smarten Visit us at www.smarten.com 19
register 1 }
9. Restart the services in nagios server
sudosystemctl restart apache2
sudosystemctl restart nagios
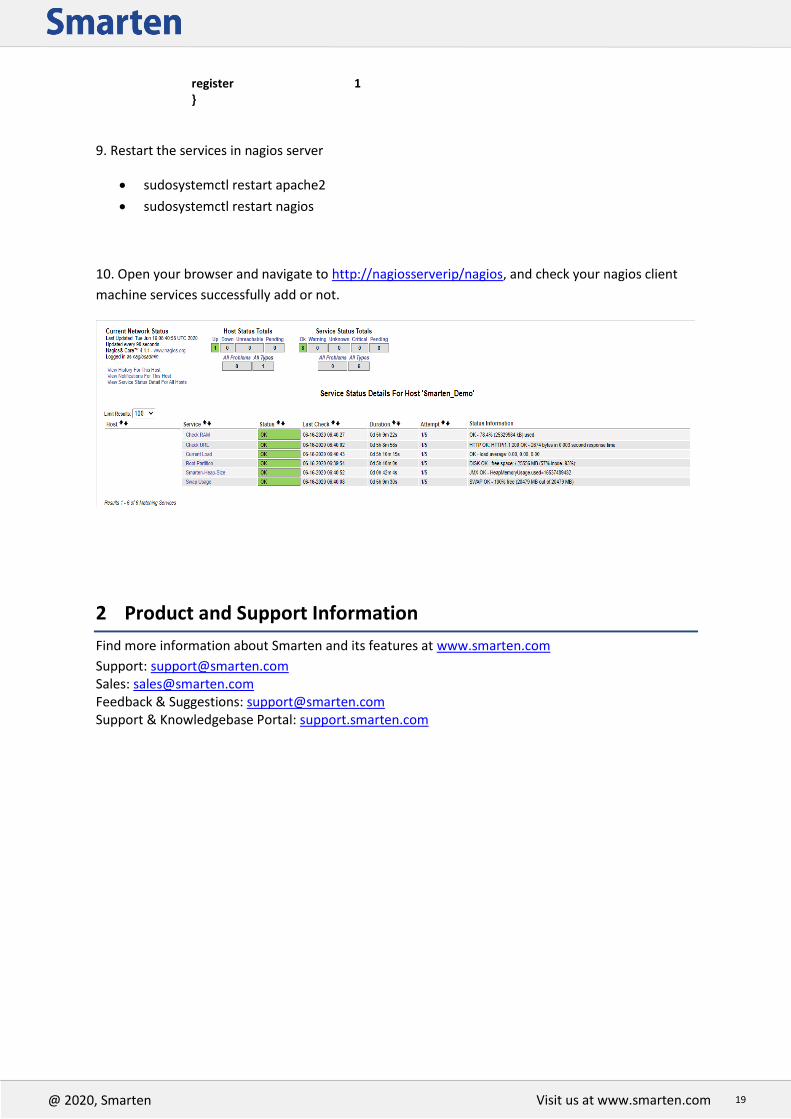
10. Open your browser and navigate to http://nagiosserverip/nagios, and check your nagios client
machine services successfully add or not.
2 Product and Support Information
Find more information about Smarten and its features at www.smarten.com
Support: [email protected] Sales: [email protected] Feedback & Suggestions: [email protected] Support & Knowledgebase Portal: support.smarten.com