Monitoring distributed systems with Riemann - IS MUNI
63
Masaryk University Faculty of Informatics Monitoring distributed systems with Riemann Bachelor’s Thesis Šimon Obetko Brno, Spring 2016
-
Upload
khangminh22 -
Category
Documents
-
view
4 -
download
0
Transcript of Monitoring distributed systems with Riemann - IS MUNI

Masaryk UniversityFaculty of Informatics
Monitoring distributed systemswith Riemann
Bachelor’s Thesis
Šimon Obetko
Brno, Spring 2016


Masaryk UniversityFaculty of Informatics
Monitoring distributed systemswith Riemann
Bachelor’s Thesis
Šimon Obetko
Brno, Spring 2016


Replace this page with a copy of the official signed thesis assignment and thecopy of the Statement of an Author.


Declaration
Hereby I declare that this paper is my original authorial work, whichI have worked out on my own. All sources, references, and literatureused or excerpted during elaboration of this work are properly citedand listed in complete reference to the due source.
Šimon Obetko
Advisor: Petr Bauch
i


Acknowledgement
First I wish to express my sincere thanks to Mgr. Peter Bauch, Ph.D.for expert guidance and advice that were very helpful when writtingthis thesis. My thanks also goes to RNDr. Jan Kasprzak, Ph.D. whoprovided me with access to testing cluster and for helping me set upmy testing enviroment. I take this oppotunity to express gratitude toall of my family members and friends as well. I am also grateful toKristian Jakubík for hours of fun, while watching League of Legendsvideos and discussing TV series such as Daredevil and Magicians.
iii

Abstract
Thesis deals with a push based monitoring of a horizontally scaleddistributed data-store using monitoring tool Riemann. It describesthe internal logic of Riemann, its protocols, underlying principles andbriefly introduces InfluxDB and Grafana, the other two componentsused in monitoring stack. Description of a monitoring stack configu-ration is also part of thesis, along with its testing by monitoring thehorizontally scaled data-store cluster.
iv
Keywords
Riemann, Grafana, InfluxDB, push model monitoring, Hbase, eventaggregation, distributed data-store
v


Contents
1 Introduction . . . . . . . . . . . . . . . . . . . . . . . . . . . . 12 Monitoring stack - used technologies . . . . . . . . . . . . . 3
2.1 Riemann . . . . . . . . . . . . . . . . . . . . . . . . . . . . 32.1.1 Push model . . . . . . . . . . . . . . . . . . . . . 32.1.2 Riemann introduction . . . . . . . . . . . . . . . 42.1.3 Riemann internal logic . . . . . . . . . . . . . . . 52.1.4 Riemann servers and protocols . . . . . . . . . . 72.1.5 Riemann’s TCP protocol . . . . . . . . . . . . . . 10
2.2 InfluxDB . . . . . . . . . . . . . . . . . . . . . . . . . . . 132.3 Grafana . . . . . . . . . . . . . . . . . . . . . . . . . . . . 14
3 Monitored distributed datastore . . . . . . . . . . . . . . . . 173.1 Hbase . . . . . . . . . . . . . . . . . . . . . . . . . . . . . 17
3.1.1 Hbase dependencies . . . . . . . . . . . . . . . . 173.1.2 Hbase architecture . . . . . . . . . . . . . . . . . 183.1.3 Pseudo-distributed Hbase configuration . . . . . 19
4 Stack configuration . . . . . . . . . . . . . . . . . . . . . . . . 234.1 Pushing metrics to Riemann . . . . . . . . . . . . . . . . . 23
4.1.1 JMX and MBeans . . . . . . . . . . . . . . . . . . 234.1.2 Riemann-hbase client . . . . . . . . . . . . . . . 24
4.2 Riemann configuration . . . . . . . . . . . . . . . . . . . . 264.2.1 Riemann master monitor configuration file . . . 274.2.2 Riemann aggregator configuration file . . . . . . 29
4.3 InfluxDB and Grafana configuration . . . . . . . . . . . . . 295 Testing . . . . . . . . . . . . . . . . . . . . . . . . . . . . . . . 31
5.1 Testing enviroment . . . . . . . . . . . . . . . . . . . . . . 315.1.1 Resource partition and consumption analysis . . 31
5.2 Testing topologies . . . . . . . . . . . . . . . . . . . . . . . 325.3 Evaluation tools . . . . . . . . . . . . . . . . . . . . . . . . 34
5.3.1 Measuring Riemann server . . . . . . . . . . . . 345.4 Testing results . . . . . . . . . . . . . . . . . . . . . . . . . 34
5.4.1 Results - topology 1 . . . . . . . . . . . . . . . . . 355.4.2 Results - topology 2 . . . . . . . . . . . . . . . . . 375.4.3 InfluxDB issue . . . . . . . . . . . . . . . . . . . 39
6 Conclusion . . . . . . . . . . . . . . . . . . . . . . . . . . . . . 41A CD contents . . . . . . . . . . . . . . . . . . . . . . . . . . . . 47
vii


List of Figures
2.1 Full stack of technologies used in monitoring system 42.2 Riemann event expiring process 82.3 Non-pipelined vs. pipelined connection [20] 122.4 Channel Pipeline between Riemann client and server 133.1 Hbase daemons 184.1 Process of retrieving metrics 255.1 Testing topology 1 - without aggregator servers 335.2 Testing topology 2 - with aggregator servers 335.3 Riemann latencies (no batching) 355.4 Tcp rate + streams rate (no batching) 365.5 Executor queue size rise 375.6 Cpu usage (no batching) 375.7 Tcp rate + streams rate (batching) 385.8 Riemann latencies (batching) 385.9 Cpu usage (batching) 395.10 Cpu usage bursts (batching) 405.11 Cpu usage aggregator (batching) 40
ix


1 Introduction
System monitoring is important, but often overlooked part of a soft-ware deployment. It is considered to be as critical as a software security,but is hardly given as much attention [1]. Argument stating that mon-itoring system is nice to have, but it is actually not fundamental forsystem operational readiness, is quickly disproved at the moment,when a critical application stops working and the whole system goesdown without a warning. This scenario can be prevented by choosing(and using) the right monitoring system.
Monitoring system processes information (and based on thesetakes action) provided by the system. The moment when the moni-toring system is running, it needs to know what to monitor and howto monitor. In practice we distinguish three basic monitoring models:monitor-poll, agent-push, hybrid model [2]. In my thesis I focus onmonitoring using the monitoring tool Riemann [3], which is built andexploits the advantages of agent-push model (push model). That con-sidered, small part of this thesis is dedicated to explaining the basicfeatures of this model. Riemann aggregates events from servers andapplications with a powerful stream processing language. It originallystarted as a one man open source project written by Kyle Kingsbury(also known as Aphyr), but throughout the time gained popularityand many contributors [4].
Goal of this thesis is to describe functioning of Riemann, its pro-tocols and agents(clients), pushing data to server, and the other com-ponents and technologies, which were used to set up the monitoringsystem. One chapter of the thesis is focused on configuration of themonitoring system itself. Furthermore, testing Riemann’s performanceunder the heavy load of largely scaled cluster are part of the work aswell.
In the first phase, before writing the thesis, it was necessary toconceive the basic understanding of the Lisp based programminglanguage Clojure [5], since Riemann configuration files and even Rie-mann itself are written using this high-level general-purpose language.A great help with that was Kyle Kingsbury’s excellent "Clojure fromthe ground up" series [6]. As for the monitoring system setup, it wasimportant to choose the right monitoring stack components, establish
1

1. Introduction
their communication, design real-time dashboards etc. Final step wastesting, which required setting up the monitored distributed data-storeand the monitoring stack functionality verification.
Thesis can be notionally divided into two parts. In the first one, the-oretical, I explain the basic principles of system monitoring, Riemannarchitecture and fundamentals concerning all of the main components.Second part dedicated to implementation involves the description ofthe monitoring system and the monitored environment configuration.In final phase of the thesis I present the testing results analyse themand verify the monitoring system functionality.
2

2 Monitoring stack - used technologies
Monitoring of a distributed systems involves the collection, manage-ment and display of information concerning the health, status or in-teractions among concurrently running hosts and processes runningon them. There is a great number of out of box monitoring systems,which require only simple installation and minimum amount of con-figuration. These systems, however, lack flexibility concerning scalingand in terms of what they are capable to monitor [7]. For that reason,many prefer creating their own stack of monitoring tools, in order toget the most out of system monitoring.
That has its cost though. The monitoring stack today usually consistsof a variety of tools, all written in a different language, each basedon a different technical principles. Putting these tools together towork, might often require a certain technical skill and even somecode writing, in order to glue the monitoring tools together. Not tomention that in production many of these monitoring tools have to bemonitored themselves [8, 1].
In my thesis I built stack consisting of the three main tools:
» Riemann to aggregate events and metrics from various hosts.
» InfluxDB [9] to store the metrics for analysis.
» Grafana [10] to draw graphs concerning the metrics and the loadof the Riemann.
Graphical representation of the used stack is shown in the Figure 2.1
2.1 Riemann
2.1.1 Push model
Riemann uses event-centric push model [7]. Main difference, in com-parison to the widely used poll-based models, is approach in the termsof who initiates the communication and who decides when the dataand metrics are sent. In a push model, which Riemann uses, each
3

2. Monitoring stack - used technologies
Figure 2.1: Full stack of technologies used in monitoring system
host sends the data from itself to the monitoring application, whichreduces the monitoring system’s load to simply accepting and storingthe data. In poll-based model monitoring system actually polls thehosts elements and data in loop, resulting in a great overhead of aserver running monitoring application [11].
Which brings up another aspect of distributed system monitoring:scaling. While poll-based model treats distributed system monitoringas a monolithic central function and scales the monolith vertically asthe hosts are added, push model introduces a completely differentway. Pushes are decentralized, which makes scaling easier and allowsthe monitoring system to focus on measuring our applications or hostsperformance and health and reacting upon collected data [7].
2.1.2 Riemann introduction
Riemann is a monitoring tool that aggregates events from hosts andapplications and feeds them into a stream processing language to be
4

2. Monitoring stack - used technologies
summarized, manipulated and reacted upon. Since Riemann server isbasically just a routing engine for the incoming events and metrics, itis designed as minimalistic as possible to achieve these goals:
∙ receive events and metrics;
∙ scale as the environment grows;
∙ provide context for alerting and checks;
∙ route data to be stored, graphed, alerted etc.
Riemann is fast and highly configurable. Throughput may vary basedon what we do with each event, but stock Riemann running on com-modity x86 hardware can handle millions of events per second [12].Nevertheless, testing Riemann’s performance takes part further in thisthesis.
Riemann is written in Clojure and runs on top of the JVM. It is opensource and licensed with the Eclipse Public license [12].
2.1.3 Riemann internal logic
Riemann’s internal monitoring logic is quite simple. There are threeconcepts, that need to be understood:
1. Events
2. Streams
3. Index
Events
A Riemann event is a basic structure, which Riemann treats as animmutable map. Events flow into Riemann and can be processed,counted, manipulated and then exported to other systems, in order tobe graphed or persisted in some way. In the Listing 2.1 is an exampleof a Riemann event.
5
2. Monitoring stack - used technologies
{ : host host1 , : s e rv i c e riemann streams rate , : s t a t e ok ,: des c r ip t i on n i l , : metr ic 0 . 0 , : tags [ riemann ] ,: time 355740372471/250 , : t t l 20}
Listing 2.1: Example of a Riemann event
Each event composes of the fields presented in Table 2.1. It is possible
Host A host name e.g "host1" or "mydomain.com"
Service e.g. “cpu load” or “client request write latency”
State 255 bytes long string e.g "warning", "ok", "critical"
Time The time of the event, in unix epoch seconds
Description Freeform text
Tags Freeform list of strings, e.g. ["calculate" "fooimport"]
Metric A number, metric associated with event, e.g. numberof requests/second
TTL A floating-point time in seconds this event is validfor. Events with expired states may be removed fromindex
Table 2.1: A Riemann event fields
to include arbitrary fields into an event as well. This might be help-ful, when we need to carry more contextual information in a singleevent [13].
Streams
Upon its arrival, each event is added into one or more streams. Streamsare basically functions that take events as an argument. Events arethen aggregated, modified, or escalated. Streams are defined in thestream section of Riemann’s configuration file. Streams can also havechild-streams, to which they can pass events, allowing filtering orpartitioning of the top-level stream.
6
2. Monitoring stack - used technologies
Riemann provides a powerful stream processing language thatallows us to select events relevant to a specific stream, for examplefiltering events from a specific host or service.
Streams are designed for events to flow through them and for limitedto no state to be retained. However, for many purposes, we do need toretain some state. In order to retain and manage this state, Riemannhas index.
Index
The index is a table of the current state of all the services trackedby Riemann. Each event is uniquely indexed by its host and service,meaning Riemann creates a new service for each event we wish toindex, by mapping its :host and :service fields. The index thenretains the most recent event for that service. The index is Riemann’sstate table, its picture of the world. Streams or even external servicescan query the index to look at the system’s current state.
Expired events Table 2.1 shows that each event contains a TTL (TimeTo Live) field. This number in seconds indicates how long the givenevent is valid for. Events that are not valid any more are expired anddeleted from the index.
Each time event expires and is removed from index, a new event isgenerated for that indexed service with the same :host and :servicefield and :state field set to "expired". This event is then automaticallyinjected back into the stream.
This is one of the basic Riemann’s ideas. Instead of polling forfailure, Riemann just checks for expired events. Graphical exampleof this process is shown in the Figure 2.2. Expired events will beprocessed by streams according to our configuration file [12, 3, 14].
2.1.4 Riemann servers and protocols
"Riemann" usually refers to one process (JVM). Internally, to receiveevents, this process runs several distinct servers. These are specifiedin the configuration file [4].
7

2. Monitoring stack - used technologies
Figure 2.2: Riemann event expiring process
Running instance of Riemann has these servers:
∙ the TCP server listens for TCP connections.∙ the UDP servers listens for UDP datagrams.∙ the websocket server accepts HTTP websocket connections.
INFO [2016−03−16 1 2 : 1 4 : 5 0 , 8 7 3 ] c lo ju re−agent−send−of f−pool−1− riemann . t ranspor t . websockets − Websockets server0 . 0 . 0 . 0 5556 onl ine
INFO [2016−03−16 1 2 : 1 4 : 5 0 , 9 4 0 ] c lo ju re−agent−send−of f−pool−2− riemann . t ranspor t . tcp − TCP server 0 . 0 . 0 . 0 5555
onl ineINFO [2016−03−16 1 2 : 1 4 : 5 0 , 9 8 6 ] c lo ju re−agent−send−of f−pool−1
− riemann . t ranspor t . udp − UDP server 0 . 0 . 0 . 0 5555 16384−1 onl ine
Listing 2.2: Riemann’s output log after starting the service
8
2. Monitoring stack - used technologies
If Riemann started successfuly, lines listed in the Listing 2.2 will appearin Riemann log file, providing us info that servers are up and running.
Both, TCP and UDP, servers claim and listen on the ports 5555, forwebsocket server it is port 5556 (this can be configured).
A TCP connection to Riemann is a stream of messages. Each mes-sage is a 4 byte network-endian integer "length" followed by a ProtocolBuffer Message [15] of "length" bytes. TCP protocol provides reliabledelivery and acknowledgement of reciept, but as expected, it comeswith a cost - lower pace.
When sending over UDP, a Protocol Buffer Message is sent di-rectly without "length" header. Riemann’s default maximum size forUDP datagrams is 16384 bytes, larger messages should go over TCP.Although UDP protocol is much faster, it is also lossy [13, 14].
Protocol Buffer Message
Protocol Buffers are language-neutral, platform-neutral, extensiblemechanism for serializing structured data. Once we define our data(message) structure, special source code is generated, to easily writeand read our structured data to and from variety of streams [15].
Each Protocol buffer message (or Protobuf message) is a smalllogical record of information, containing a series of name-value pairs.Listing 2.3 shows a scrap of .proto file [16] specifying the structureof a message used by Riemann.
message Msg {1 optional bool ok = 2;2 optional string error = 3;3 repeated State states = 4;4 optional Query query = 5;5 repeated Event events = 6;
}
Listing 2.3: Riemann’s Protcol Buffer Message structure (incomplete)
Riemann’s protobuf message is composed of five member fields:
1. optional boolean field "ok"
- used in a TCP "server response" confirmation messages;
9

2. Monitoring stack - used technologies
2. optional string field "error"
- also used in the confirmation messages;
- in case of an error contains descriptive string.
3. repeated State field "states"
- is now deprecated. It was only used in the older versionsof protocol;
- still member due to the backward compatibility.
4. optional Query field "query"
- allows for querying events from index;
- when Riemann server receives message with query field,it will return a message with events matching given queryexpression.
5. repeated Event field "events"
- contains actual events sent to Riemann (or from Riemannin case of the query result message);
- event structure is defined in the .proto file as well and isdescribed in subsection 2.1.3;
- field specifier repeated means,that field can be repeatedany number of times in a message (zero included).
2.1.5 Riemann’s TCP protocol
Since clients we work with (and all clients mostly) use Riemann’s TCPprotocol, I am going to dedicate a part of the thesis to this topic.
Riemann’s TCP - client side
Riemann’s TCP protocol is simple and synchronous. However, manyfeatures were introduced, in order to increase the throughput both onthe client and the server side.
10

2. Monitoring stack - used technologies
The client sends message over a TCP connection and receives onemessage as a confirmation from the server. Problem is that the olderclients forced us to wait, while the message crossed the network, wasprocessed by Riemann and received confirmation. This can decreasea throughput dramatically, when we are talking about real worldnetworks, where latency is non-trivial.
Newer versions of Riemann TCP client solved this problem bypipelining requests. That way client can send new requests (mes-sages) and does not have to wait for the previous responses. Receivedconfirmation messages are matched up with their corresponding re-quest later [17].
The idea is that all client’s threads enqueue messages into a lock-free queue and as a result receive a Promise objects, which will be ful-filled, once their responses are available. While client threads pipelinetheir request together into the write queue, a writer thread takesmessages out of it and sends them to Riemann server and enqueuestheir promises into an in-flight queue. Meanwhile, a reader threadpulls responses out of the socket and matches them to the enqueuedpromises [18, 19]. The basic difference between the non-pipelined andthe pipelined connection can be seen in the Figure 2.3.
Another optimization client uses is event batching. For number ofreasons this kind of protocol shows better performance, when mes-sages are bigger. So instead of sending one message for each eventand parsing each message separately, we can pack 100 events intoone message, server can buffer the message and parse it in one go.This results in a much higher throughput. On the other hand it alsoincreases latency significantly, since our event needs to wait in buffer,while other events show up to be sent in a message [18].
Riemann’s TCP - server side
Riemann’s implementation uses Netty [21]. Netty is NIO (asynchronous)client-server framework, used for development of Java network appli-cations such as protocol servers and clients. To handle multiple clientsNetty uses Reactor design pattern [22]. Reactor design pattern han-dles service requests that are delivered concurrently to an application
11

2. Monitoring stack - used technologies
Figure 2.3: Non-pipelined vs. pipelined connection [20]
by one or more clients [23]. For any given connection, Netty (as usedin Riemann) has two thread pools handling incoming bytes1:
∙ IO worker pool
» worker threads perform all the asynchronous I/O opera-tions;
» provides a two way shuttle between TCP buffers.
∙ Handler pool
» handler threads are used for long running tasks, in thiscase it is the message handling;
» actually handles Riemann events.
To forward the data between these two thread pools Netty uses Ex-ecution Handler. ExecutionHandler uses queue and simply enques
1. Netty also has The Boss Threads thread pool, used for establish-ing connections. Full explanation of Netty threads can be found athttp://seeallhearall.blogspot.sk/2012/05/netty-tutorial-part-1-introduction-to.html
12

2. Monitoring stack - used technologies
objects of known size (thanks to "header") from IO threads. Handlerthreads then take and decode these objects to messages, which arefurther in the process parsed into the smaller records (events) andpassed on into Riemann streams to be processed. Figure 2.4 shows thefull pipeline and its handlers between client and server [18, 24].
Figure 2.4: Channel Pipeline between Riemann client and server
2.2 InfluxDB
Since Riemann itself does not provide any storage for our metrics andevents, we decided to use InfluxDB as a second part of our monitoringstack. InfluxDB is a time-series metrics and events data-store based onGoogle’s LevelDB. It is written in Go with a goal to handle time seriesdata with high availability and performance requirements. InfluxDB
13
2. Monitoring stack - used technologies
is by design a distributed storage cluster with storage and queriesbeing handled by many nodes at once. Therefore, it is great fit fordistributed systems [9, 25].
There are several reasons why InfluxDB is used as the metricsdatabase in this monitoring stack.
∙ it is easy to scale horizontally (this is important quality whenmonitoring largely scaled distributed systems with lot of moni-tored nodes);1
∙ Riemann already has an adapter written and integrated, whichforwards events to InfluxDB [3];
∙ there are no external (service or component) dependencies [25].
Replication and sharding is configurable. Clustering is built in, whichmeans nothing else is needed to make data highly available (un-like Hbase, which needs Zookeeper to keep cluster coordinated andhealthy).
It is also possible to set a retention policy, in order to auto-expireold data, or somehow compact them (most productions probably donot need to keep a year old metrics). In addition, InfluxDB provides abuilt in web admin interface, which provides a simple way to interactwith our database.
2.3 Grafana
Once our metrics and events are stored using InfluxDB, last step is tovisualize them. Even though Riemann provides a simple dashboard,which would probably suffice for the needs of this thesis, it is not fullyfledged visualisation tool. In order to build a full monitoring stack itwas necessary to pick one. We decided to use Grafana.
Grafana is an application for visualizing large-scale measurementdata and provides an easy way to create and share visualized data and
1. However, InfluxDB v0.11.0, is the last one to support clustering as open source.From version 0.12.0 InfluxDB will still be open source, but will only work in thestandalone mode. Clustering will come only with the paid Enterprise edition [26].
14

2. Monitoring stack - used technologies
dashboards. Using Grafana in our monitoring stack was an obviousdecision for following reasons:
∙ it supports InfluxDB as a storage for time series data (it can useInfluxDB as a source of metrics) 1;
∙ it features elegant and interactive interface, which makes creat-ing dashboards an easy task.
Grafana is open source written in Go. It also allows for authentication,via LDAP, Basic Auth and Auth Proxy (once the production Grafanaserver is exposed to the internet, authentication is inevitable) [10].
1. Grafana supports many storage backends, InfluxDB is just one of them [10].
15


3 Monitored distributed datastore
In order to evaluate Riemann and its capabilities, it was necessaryto build a testing monitored environment. We decided to use somedistributed data-store due to the fact that their design makes themvery flexible in the terms of horizontal scalability. However, only onedata-store could be selected and after some decision making, we choseto use Hbase [27].
3.1 Hbase
Hbase is an open source non-relational, distributed data-store inspiredand designed after Google’s BigTable. It is written in Java, runs on topof the HDFS and its primary goal is to handle big data. Hbase, whichbegan as a project by the company Powerset, shortly became one ofthe top-level Apache projects. In the parlance of Eric Brewer’s CAPTheorem [28], HBase is a CP type system.
3.1.1 Hbase dependencies
Hbase is not designed to run on its own and is dependent on otherservices:
∙ HDFS(Hadoop distributed filesystem)
» used for storage;
» running instance of HDFS is required for deploying HBase;
» HDFS handles checksums, replication and failover.
∙ Zookeeper cluster
» used as a cluster coordination service;
» provides distributed synchronization and group services;
» maintains configuration information.
17

3. Monitored distributed datastore
3.1.2 Hbase architecture
Hbase has a master-slave architecture where:
∙ Hbase Master server is a daemon responsible for monitoringall the slaves i.e. Region Servers
- handles the load balancing;- responsible for schema changes and metadata operations
(table creation etc.).
∙ Region servers are the slaves responsible for storing and man-aging data
- communicate with the client;- handle all write and read requests for all the regions it is
serving.
Each daemon runs as a different JVM. There is always only one masterrunning at a time, but it is possible to have a backup. All the daemonsincluding Hbase dependencies are shown in the Figure 3.1.
Figure 3.1: Hbase daemons
18

3. Monitored distributed datastore
Within this work we are going to monitor the daemons consideringHbase Services only. It is also possible (and in production systemrecommended) to monitor Zookeeper and HDFS services as well.
3.1.3 Pseudo-distributed Hbase configuration
One of the reasons, why we chose Hbase as our testing monitoreddata-store is its ability to run in so called pseudo-distributed mode.Pseudo-distributed mode means, that Hbase runs on a single host buteach daemon (master, region servers, zookeeper nodes, hdfs nodes)runs as a separate process (separate JVM). That means, we can simulatea real-life cluster and run up to 100 region servers on a single host.
Using pseudo-distributed cluster does not make sense in the pro-duction environment and it was not created to evaluate Hbase perfor-mance. It was build for testing purposes only, and since our goal isnot to evaluate Hbase, rather Riemann, it will suffice.
Hadoop configuration
To run cluster in pseudo-distributed mode, slight configuration changeshad to be done to Hadoop after installation, in order to run it on asingle node. Following property had to be set in the core-site.xmlfile. 1
<conf igurat ion ><property >
<name> f s . de fau l t . name</name><value >hdfs :// l o c a l h o s t : 9000</value >
</property ></conf igurat ion >
Listing 3.1: Property setting filesystem URI
Subsequently, changes in the hdfs-site.xml were made:
∙ replication factor was set to 1 (makes no sense to keep morereplicas);
1. core-site.xml contains information such as the port number used for Hadoopinstance, size of the read and write buffers etc.
19

3. Monitored distributed datastore
∙ path on local filesystem where Hadoop stores namespace andtransaction logs was set;
∙ path on local filesystem where hadoop stores its data blocks wasset.
Listing 3.2 shows all the configured properties.
<conf igurat ion ><property >
<name>dfs . r e p l i c a t i o n </name><value >1</value >
</property >
<property ><name>dfs . name . d i r</name><value > f i l e :///home/simon/hadoopinfra/hdfs/namenode
</value ></property >
<property ><name>dfs . data . d i r</name><value > f i l e :///home/simon/hadoopinfra/hdfs/datanode
</value ></property >
</conf igurat ion >
Listing 3.2: hdfs-site.xml
Hbase configuration
Installing Hbase is easy as unpacking and downloading a tarballpackage. However, by default, Hbase is not configured to run in apseudo-distributed mode. Before proceeding, the hbase-site.xml filehad to edited and following properties set:
<property ><name>hbase . c l u s t e r . d i s t r i b u t ed</name><value >true</value >
</property >
Listing 3.3: Property specifying in which mode Hbase should run
20

3. Monitored distributed datastore
<property ><name>hbase . roo td i r</name><value >hdfs :// l o c a l h o s t :9000/ hbase</value >
</property >
Listing 3.4: Property that binds Hbase to already configured hadoop FS
Zookeeper configuration
A pseudo-distributed Hbase depends on a running Zookeeper cluster.By default, Hbase manages a Zookeeper cluster for us and starts theZookeeper ensemble automatically when starting Hbase.
In production it is recommended to manage a Zookeeper ensembleindependent of Hbase and just point Hbase at the Zookeeper clusterit should use. This can be configured in the hbase-env.sh configu-ration file by setting variable HBASE_MANAGES_ZK to either trueor false1. In our case, we will let Hbase handle the Zookeeper clustermanagement [27].
1. defaults to true
21


4 Stack configuration
This part of the thesis describes methods and techniques that wereused to make components communicate and cooperate, in order tocreate a fully functional monitoring stack.
4.1 Pushing metrics to Riemann
First step was to get metrics from Hbase to Riemann. Since Riemannuses push based model, it was necessary to either write or find a client,which can retrieve demanded metrics from each daemon and sendthem to Riemann. Luckily, there already was a simple open source rubyutility client called riemann-hbase [29], written by Mohit Chawla (a.k.aAlcy), which was able to do the required operations. Nonetheless, itwas written in 2012, hence it was working properly only with the olderversions of Hbase. In order to make it work, it was essential to modifythe agent’s source code2.
By default, each Hbase daemon is configured to emit default setof metrics (there is about 100 per daemon). Sampling period is setfor 10 seconds by default. Sampling rate can be set by modifyinghadoop-metrics2-hbase.properties file. What is elementary, is thatall these metrics are available via JMX as a MBeans attributes [27].
4.1.1 JMX and MBeans
Each JVM (Java Virtual Machine) has built in instrumentation thatenables us to monitor and manage it using the Java Management Ex-tensions (JMX) technology. JMX is also able to expose metrics throughJMX MBeans. In essence, we can think of MBean as of an object thatrepresents a device or resource, which needs to be monitored andmanaged [30].
In our case each MBean will represent one daemon (its metrics),either master or region server that are monitored. Each MBean exposes
2. Modified agent (source) is part of the appendix
23

4. Stack configuration
a management interface consisting of a readable attributes. Theseattributes are the actual metrics, we are demanding. MBeans cannotbe accessed directly, but are rather accessed through the MBean servervia their unique name. There is usually one MBeanServer for onevirtual machine, however, there can be more MBeans within JVM(usually one for each resource) [30, 31].
When working with MBeans, it was very helpful to use JVisu-alVM [32]. This tool provides visual information about our runningJVMs. It is capable to view JMX content, moreover to browse MBeansand its attributes. This tool was very useful when modifying andtroubleshooting riemann-hbase client.
4.1.2 Riemann-hbase client
Riemann-hbase is ruby gem1 that runs under JRuby. It uses jmx4r [33](jmx library for JRuby) to gather metrics and stats exposed over JMX.
Essentialy, riemann-hbase works like this:1. establishes a connection to the MBean server, which can be
accessed through the configured jmx remote port;
2. retrieve the MBean using its unique name (MBean name needsto be known up front);
3. go through all the MBean attributes and create an event (for eachattribute one);
4. submit created event to Riemann via ruby TCP client (each eventseparately).
Graphical representation of this connection is shown in the Figure4.1. When starting riemann-hbase, following arguments have to beprovided [29]:
riemann−hbase −h my. riemann . server−server−type master−jmx−port 10101
Listing 4.1: Example of starting riemann-hbase utility
1. Gems are packages that contain ruby programs and libraries that can be installedby RubyGems package manager.
24

4. Stack configuration
Figure 4.1: Process of retrieving metrics
∙ -h
» name of the host, which runs Riemann server;
» requires the naming system to be configured.
∙ -server-type
» type of the server (daemon) we want to monitor (availableoptions are master or regionserver);
» each type has differently named metrics MBean, this switchdetermines unique name of MBean, utility will look for.
∙ -jmx-port
» remote port JVM(daemon) listens on for the JMX remoteconnection;
» provides access to the MBean server.
25

4. Stack configuration
Fully distributed Hbase (one host, one Hbase daemon) is by defaultconfigured to use JMX remote port 10101 in a case of master and 10102in a case of region server [27]. Understandably this will not work,when we use pseudo-distributed mode due to a port overlapping(each JVM has to have its own remote port). Hbase solves this problempragmatically. It omits opening a remote JMX port, when startingregion server in pseudo-distributed mode.
This, however, prevents us from monitoring daemons. Given ob-stacle can be bypassed by setting the system property (allowing JVMto open remote JMX port) in local-regionservers.sh file (script filethat is used for starting region servers in pseudo-distributed mode),by simply modifying the variable HBASE_REGIONSERVER_OPTS .
4.2 Riemann configuration
In our testing chapter of the thesis, we will use two types of Riemannservers:
1. Riemann master monitor server:
Top level Riemann server in topology. It aggregates data fromall of the lower level aggregator servers (and/or clients) andforwards them to InfluxDB.
2. Riemann aggregator server:
Aggregator servers introduce a naive way of distributing Rie-mann and its load by creating a topology of Riemann servers.The basic idea is that each aggregator server monitors a cer-tain production or environment of productions and escalatesonly events which are important for main master monitor server,allowing us to monitor our monitors and reduce master’s mon-itor load. This approach also decreases a chance of absolutemonitoring system failure; once the master monitor server goesdown, environment is still monitored by lower level aggregatorserver [12].
26

4. Stack configuration
Riemann configuration file
As the events from various clients reach Riemann server, they are fedinto its processing language. What happens to any given event andhow do we react is specified in the riemann.conf file.
Riemann configuration file is actually an executable Clojure pro-gram, containing streams definitions. Configuration file can defineevent filtering and streams splitting, and it may include functions send-ing alert emails (or pagerduty alert etc.), in cases when somethingfails or some metric rises above defined threshold [34, 13].
Since we have two types of servers, we need two configurationfiles.
4.2.1 Riemann master monitor configuration file
In case of master monitor server, we simply want Riemann to sendeach arriving event to InfluxDB.
Function influxSender
Riemann already has an adapter written, which can forward events toInfluxDB, thus the only thing we need is to make use of it, by writinga Clojure function in configuration file. Listing 4.2 shows full function:
( def inf luxSender( batch 2000 1
( async−queue ! : agg { : queue−s i z e 10000: core−pool−s i z e 4: max−pool−s i z e 32: keep−a l ive−time 60000 }
( inf luxdb { : host " l o c a l h o s t ": vers ion : 0 . 9: port "8086": db " riemann ": username " root ": password " root " } ) ) ) )
Listing 4.2: Clojure function that forwards events to InfluxDB
27

4. Stack configuration
Clojure is Lisp family language, therefore its syntax can be differ-ent from what we usually see. Following lines explains the functionthoroughly:
1. First we define influxSender symbol, so that we can reference itlater in the configuration file.
2. Arriving events go into the batch stream. This helps to reducecpu load of Riemann (however batches should not be too big,for memory consumption reasons).
3. When batch reaches its limit (2000 events) or each second eventsare batched and sent on to async-queue.
4. Async-queue stream is used, so that sending events to InfluxDB,does not block Riemann’s event processing. Sending metricsasynchronously, can decrease Riemann’s latency tremendously.1
5. Events are then passed on to influxdb stream which forwardsthem to InfluxDB.
Main stream configuration
Stream defined with the name stream can be thought of as of a toplevel stream, which accepts all the incoming events. Our stream con-figuration is simple and straight forward. Each arriving event is in-dexed first. Afterwards we send it to InfluxDB to be stored, usingfunction(influxSender) we have defined earlier.
Configuration stream also contains the expired stream. Expiredstream filters out and lets through only events that expired from index.Once such event occurs, it is logged into the logfile. This makes it iseasy to check for the services that failed to check in in time [3]. Listing4.3 contains a scrap of configuration file, defining the main stream.
1. Number of threads in pool and maximum number of threads in pool can beconfigured depending on Riemann’s load and performance of the server runningRiemann
28

4. Stack configuration
( streams( de fau l t : t t l 60
; Index a l l events immediately .index; Send data to in f l u x .inf luxSender; Log expired events .( expired
( fn [ event ] ( in fo " expired " event ) )
Listing 4.3: Configuration file - stream definition
4.2.2 Riemann aggregator configuration file
Since riemann-hbase client we are using, does not batch events, wewill use our aggregator servers to batch all the incoming events intolarger messages and forward them to the Riemann master monitor.Function forwardSender is principaly identical to the influxSenderfunction master monitor uses, however, instead of the Influxdb adapterit forwards batched events using a tcp client.
4.3 InfluxDB and Grafana configuration
Last step was configuring InfluxDB and Grafana. Both, InfluxDB andGrafana, provide graphical user interface which makes configuringthem uncomplicated.
Regarding InfluxDB, it was necessary to create user for the databaseand to set up the database (for storing the metrics) itself.
As for Grafana, it was needed to specify our InfluxDB database asdata-source by providing the InfluxDB URL and the api port. Otheroperations included creating dashboards for testing.
29


5 Testing
Following chapter discusses Riemann testing and its performancewhen monitoring scaled distributed data-store.
5.1 Testing enviroment
As mentioned earlier, Hbase data-store was chosen for its capabilityto run a whole cluster on a single host. Unfortunately, I was not ableto get equipment powerful enough to deploy a host that could runthe whole cluster, its clients, and Riemann at once. However, schoolprovided me access to their OpenNebula cluster, granting me theirresources to deploy and monitor the cluster in a fully-distributed mode.Resources were limited though, restricted me to have only up to 16virtual machines.
Monitoring 16 daemons was not sufficient to test the Riemann ca-pabilities, thus running Hbase in fully-distributed mode was not anoption. Therefore, we decided to combine the approaches. Result was,we ran several virtual machines on the cluster and each virtual ma-chine ran a small Hbase pseudo-distributed cluster within itself (thiscluster represents one simulated production). This meant we had todecide how to divide resources among virtual machines, so that wecould run maximum number of pseudo-nodes combined.
5.1.1 Resource partition and consumption analysis
Following resources were provided:
∙ 32 GB of operating memory;
∙ 10 physical CPUs (number of virtual CPUs unlimited);
∙ maximum number of 16 virtual machines.
Since the monitored Hbase cluster inside virtual machine is idle all thetime (no read/write requests), each daemon consumes trivial amountof cpu power. Portion of memory occupied (RSS) by Hbase cluster ofa size 9 (1 master + 8 region servers) oscillates at 1,5GB.
31

5. Testing
Clients are active and configured to send metrics periodicaly everysecond, hence their cpu consumption is higher. Memory consumptionof a running client is about 150MB.
Based on these observations and provided resources we created 9virtual machines:
∙ 6 monitored slave servers
» 1 CPU (2 vCPU) + 4GB memory size;» this configuration runs the mentioned Hbase cluster of the
size 9, and all the associated clients, while fully utilizingserver resources.
∙ 2 Riemann slave aggregator servers
» 1 CPU (2 vCPU) + 2GB memory size.
∙ 1 Riemann master monitor server
» 2 CPU (4 vCPU) + 4GB memory size;» runs the main Riemann server, InfluxDB server and Grafana
server.
5.2 Testing topologies
For testing we are using two types of configuration topologies.
1. Topology 1 - topology where daemon’s clients sent events di-rectly to the master monitor without batching;
2. Topology 2 - topology that uses aggregator servers, in order tobatch the events before forwarding them to the master monitor;
Graphical representation of the created topologies with and withoutaggregator servers can be seen in the Figures 5.2 and 5.1.
32

5. Testing
Figure 5.1: Testing topology 1 - without aggregator servers
Figure 5.2: Testing topology 2 - with aggregator servers
33

5. Testing
5.3 Evaluation tools
To visualize and evaluate Riemann’s performance, we use the moni-toring stack we built ourselves. This allows us to verify the monitoringstack functionality, along with evaluating monitoring system (espe-cially Riemann’s) performance.
5.3.1 Measuring Riemann server
Riemann comes with a built in instrumentation, which is sampled peri-odically and injected into streams. Additionally, we will use riemann-health, a simple ruby gem that emits events reporting the current cpu,memory and disk load. We will be focusing on these metrics:
∙ Riemann tcp rate measures number of messages passed to Rie-mann TCP server per second;
∙ Riemann tcp latency measures time in milliseconds for tcp serverto queue, parse, process, and dispatch a response for a message;
∙ Riemann streams rate measures number of events passed toRiemann main stream per second;
∙ Riemann streams latency measures time in milliseconds forRiemann to process a single event through the streaming system;
∙ Riemann executor queue size measures size of a message queueconnecting IO thread pool and Handler thread pool;
∙ Cpu measures cpu usage of a host;
∙ Memory measures total memory usage of a host.
5.4 Testing results
This section presents results of the tests and their analysis.
34

5. Testing
5.4.1 Results - topology 1
In this topology clients send unbatched events directly to master mon-itor.
Graph 5.3 shows 1 hour sample when adding monitored produc-tions. From the top:
∙ 99th percentile tcp latency in ms;∙ 95th percentile tcp latency in ms;∙ 50th percentile tcp latency in ms;∙ 99th percentile streams latency in ms;∙ 95th percentile streams latency in ms.
Figure 5.3: Riemann latencies (no batching)
We can see from the Graph 5.3 that as we were adding monitored pro-ductions, tcp latencies started rising. On the contrary, streams latencieswere stable, staying at sub-millisecond latencies most of the time. Thatconsidered, we can say, that the tcp latency rise was not caused by astreams latency rise, but rather by the other longer running tasks likequeuing, parsing and dispatching response for a message.
35

5. Testing
Figure 5.4: Tcp rate + streams rate (no batching)
Next Graph 5.4 displays the tcp rate and the streams rate. Effec-tively, we can only see one line in the graph, as expected. Since mes-sages and events are mapped one to one, if in any given second Rie-mann TCP server picks up a number of messages, only as much eventsis fed into the streams to be processed.
Hence, if for some reason a long running task like message de-framing, took longer than usual, causing both tcp and streams through-put drop, incoming messages started to queue up in the executorqueue. When the queue size rose above 1000 messages, like we cansee in Graph 5.5, events within the messages, started expiring on theway. Once they reached the streams, due to their low TTL they werenot valid any more, thus were expired from the index immediately.
Riemann eventually always took care of a queue, however, in thereal production systems this would cause false alarms. Therefore, it isvery important to find a "sweet spot" when choosing a TTL, so thatwe know, when some service goes down as soon as possible, yet wedo not get false alarms when a situation like this occurs.
Memory usage of a host running the Riemann server was not chang-ing significantly while monitoring. Cpu usage, per contra, went up to60% when adding monitored productions as seen in the Graph 5.6.
36

5. Testing
Figure 5.5: Executor queue size rise
Figure 5.6: Cpu usage (no batching)
5.4.2 Results - topology 2
This topology aggregates metrics from productions using aggrega-tor servers which then subsequently send larger messages onto theRiemann master monitor.
Batching messages solved many problems that appeared in thetopology 1. Graph 5.7 shows tcp and streams rates when adding mon-itored productions. By basal observation, we see that events and mes-sages are not mapped one to one. While in topology 1 we received
37

5. Testing
Figure 5.7: Tcp rate + streams rate (batching)
thousands of messages each second, batching events by 200, resultsin about 30 messages per second. Streams throughput climbs up toalmost 6000 events per second, since tcp throughput is not the limita-tion any more. Graph 5.8 displays latencies1. Even though there is a
Figure 5.8: Riemann latencies (batching)
small tcp latency increase, message rate dropped by 99.5%, which alsosuggests that executor queue growth is not an issue any more. Events
1. colour layout is same as in the Graph 5.3
38
5. Testing
arrive in time and valid. In comparison to latencies in the Graph 5.3,we notice a streams latency drop too.
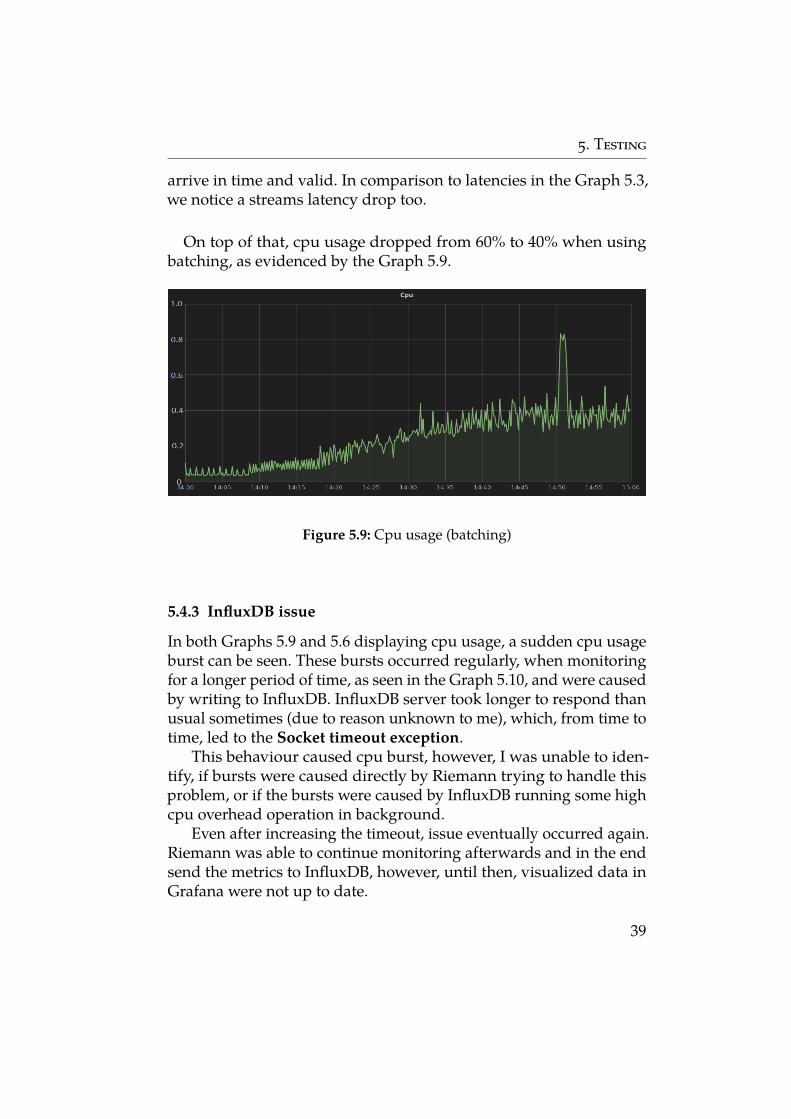
On top of that, cpu usage dropped from 60% to 40% when usingbatching, as evidenced by the Graph 5.9.
Figure 5.9: Cpu usage (batching)
5.4.3 InfluxDB issue
In both Graphs 5.9 and 5.6 displaying cpu usage, a sudden cpu usageburst can be seen. These bursts occurred regularly, when monitoringfor a longer period of time, as seen in the Graph 5.10, and were causedby writing to InfluxDB. InfluxDB server took longer to respond thanusual sometimes (due to reason unknown to me), which, from time totime, led to the Socket timeout exception.
This behaviour caused cpu burst, however, I was unable to iden-tify, if bursts were caused directly by Riemann trying to handle thisproblem, or if the bursts were caused by InfluxDB running some highcpu overhead operation in background.
Even after increasing the timeout, issue eventually occurred again.Riemann was able to continue monitoring afterwards and in the endsend the metrics to InfluxDB, however, until then, visualized data inGrafana were not up to date.
39

5. Testing
Figure 5.10: Cpu usage bursts (batching)
Graph 5.11 displays cpu usage of the aggregator server from thesame period of time. No sudden bursts appeared, cpu usage is stable.
Figure 5.11: Cpu usage aggregator (batching)
40

6 Conclusion
Goal of the thesis was to describe the basic principles of Riemann,along with principles of other components of monitoring stack. Nexttask was to set up a testing monitored distributed data-store, build themonitoring stack and verify its functionality. Finally, testing Riemann’sperformance took part.
In first part of thesis, I have described all the components of moni-toring stack focusing mainly on Riemann, as its evaluation was one ofthe main thesis goals. One chapter is dedicated to the basic descriptionof monitored distributed data-store and its setup process.
The main contribution of the thesis lies in building the monitoringstack, capable of monitoring the data-store. Description of a processfrom retrieving metrics with client, sending them to Riemann and con-tinuously forwarding them to InfluxDB is portrayed in detail withinthis work. Testing monitoring system functionality was done conjointlywith evaluating Riemann’s performance.
Our monitored environment composed of 54 virtual servers send-ing 6000 events per second combined, was handled by Riemann smooth-ly. Reaching limits in terms of Riemann overloading would requireeither more resource capacity, or different kind of tests. There alreadyis a riemann-bench ruby gem that emits large amounts of messageswithout waiting for responses, in order to do that. Even then Rie-mann’s throughput would probably be limited by the available cpuand memory resources server provides, than by its own implementa-tion.
Regarding the monitoring stack as a whole, there is a few issueswhich would require an improvement:
∙ There is a problem with sending data to InfluxDB described insubsection 5.4.3 that requires thorough examination. I was notable to resolve this issue or find its root cause. Problem needs tobe addressed, further analysed, and eliminated.
∙ When testing Riemann, batching events was proven to be effec-tive. Riemann-hbase client however, does not batch, thereforeaggregator servers were used to do so. Rewriting riemann-hbase
41

6. Conclusion
client, or writing new one that could batch events directly, wouldimprove situation greatly.
Overall, we were able to build the functional monitoring stack, never-theless, we only scratched the surface of abilities Riemann possesses.
42

Bibliography
[1] Noah Lehmann-Haupt. Zen and the Art of System Monitoring. Ac-cessed: 2016-01-30. url: https://www.scalyr.com/community/guides/zen-and-the-art-of-system-monitoring.
[2] Push vs. Pull. Accessed: 2016-02-15. url: http://blog.sflow.com/2012/08/push-vs-pull.html.
[3] Riemann documentation. Accessed: 2016-04-12. url: http://riemann.io/api/index.html.
[4] Riemann official website. Accessed: 2016-04-12. url: http://riemann.io/.
[5] Clojure official website. Accessed: 2015-12-12. url: https://clojure.org/.
[6] Clojure from the ground up. Accessed: 2016-02-27. url: https://aphyr.com/tags/Clojure-from-the-ground-up.
[7] James Turnbull. An Introduction To Riemann. Accessed: 2016-01-15. url: https://kartar.net/2014/12/an-introduction-to-riemann/.
[8] Sandy Walsh. The monitoring stack (the state of art). Accessed: 2016-01-27. url: http : / / www . sandywalsh . com / 2013 / 04 / the -monitoring-stack-state-of-art.html.
[9] Influx official documentation. Accessed: 2016-03-22. url: https://docs.influxdata.com/influxdb/v0.12/.
[10] Grafana official documentation. Accessed: 2016-03-22. url: http://docs.grafana.org/.
[11] Boxever Tech. Push vs. pull monitoring. Accessed: 2016-02-12. url:http://www.boxever.com/push-vs-pull-for-monitoring.
[12] James Turnbull. “The art of monitoring”. Accessed 2016-02-15.url: https://www.artofmonitoring.com/TheArtOfMonitoring_sample.pdf.
[13] Kyle Kingsbury. A guide to working with Riemann. Accessed: 2016-02-25. url: http://riemann.io/howto.html.
[14] Kyle Kingsbury. Riemann basic concepts. Accessed: 2016-03-06.url: http://riemann.io/concepts.html.
[15] Protocol buffers developer documentation. Accessed: 2016-03-15. url:https://developers.google.com/protocol-buffers/docs/overview.
43

BIBLIOGRAPHY
[16] Kyle Kingsbury. Riemann java client. 2013. url: https://github.com/riemann/riemann-java-client/blob/master/riemann-java-client/src/main/proto/riemann/proto.proto.
[17] The Internet society. RFC2616 - HTTTP/1.1. Accessed: 2016-03-02. url: https://tools.ietf.org/html/rfc2616#page-176.
[18] Kyle Kingsbury. Reaching 200K events/sec. Accessed: 2016-02-25.url: https://aphyr.com/posts/269-reaching-200k-events-sec.
[19] Kyle Kingsbury. Pipelining requests. Accessed: 2016-02-25. url:https://aphyr.com/posts/267-pipelining-requests.
[20] HTTP pipelining. Accessed: 2016-03-02. url: https://en.wikipedia.org/wiki/HTTP_pipelining.
[21] Netty 3.x user guide. Accessed: 2016-03-02. url: http://netty.io/3.8/guide/.
[22] Alon Dolev. What is netty? Accessed: 2016-04-02. url: http://ayedo.github.io/netty/2013/06/19/what-is-netty.html.
[23] Douglas C. Schmidt. Reactor - An Object Behavioral Pattern for De-multiplexing and Dispatching Handles for Synchronous Events. Tech.rep. Washington University, St. Louise, 1995.
[24] Netty documentation - Interface Channel pipeline. Accessed: 2016-03-03. url: http://netty.io/4.0/api/io/netty/channel/ChannelPipeline.html.
[25] Influx official webiste. Accessed: 2016-03-22. url: https://influxdata.com/time-series-platform/influxdb/.
[26] Paul Dix. Update on InfluxDB Clustering, High-Availability andMonetization. Accessed: 2016-03-15. url: https://influxdata.com/blog/update-on-influxdb-clustering-high-availability-and-monetization/.
[27] Apache Hbase Reference Guide. Accessed: 2016-03-08. url: https://hbase.apache.org/book.html.
[28] Salome Simon. Report to Brewer’s CAP theorem. Accessed: 2016-04-30. url: https://fenix.tecnico.ulisboa.pt/downloadFile/1126518382178117/10.e-CAP-3.pdf.
[29] Mohit Chawla. Riemann-hbase. 2012. url: https://github.com/alcy/riemann-hbase.
[30] Java documentation - Introducing MBeans. Accessed: 2016-04-17.url: https : / / docs . oracle . com / javase / tutorial / jmx /mbeans/.
44

BIBLIOGRAPHY
[31] Oracle - Monitoring and Management using JMX Technology. Ac-cessed: 2016-04-20. url: https://docs.oracle.com/javase/tutorial/jmx/mbeans/.
[32] Introduction to visualvm. Accessed: 2016-04-28. url: http://visualvm.java.net/intro.html.
[33] Jeff Mensil. JMX4R - ruby library for JMX. 2013. url: https://github.com/jmesnil/jmx4r/.
[34] James Turnbull. Just Enough Clojure For Riemann. Accessed: 2016-02-13. url: https : / / kartar . net / 2015 / 04 / just - enough -clojure-for-riemann/.
45

A CD contents
∙ bachelor thesis text in PDF format;
∙ Riemann configuration files master.config and aggregator.config;
∙ modified riemann-hbase client source code.
47