Plastic Optical Fibre Sensor for Spine Bending Monitoring with Power Fluctuation Compensation
18
Sensors 2013, 13, 14466-14483; doi:10.3390/s131114466 sensors ISSN 1424-8220 www.mdpi.com/journal/sensors Article Plastic Optical Fibre Sensor for Spine Bending Monitoring with Power Fluctuation Compensation Mohd Anwar Zawawi 1,2, *, Sinead O’Keeffe 1 and Elfed Lewis 1 1 Department of Electronic and Computer Engineering, University of Limerick, Plassey Rd., Limerick, Ireland; E-Mails: [email protected] (S.O.); [email protected] (E.L.) 2 Faculty of Electrical and Electronics Engineering, Universiti Malaysia Pahang, Pekan, Pahang 26600, Malaysia; E-Mail: [email protected] * Author to whom correspondence should be addressed; E-Mail: [email protected]; Tel.: +353-61-213-386; Fax: +353-61-338-176. Received: 21 August 2013; in revised form: 14 October 2013 / Accepted: 18 October 2013 / Published: 25 October 2013 Abstract: This paper presents the implementation of power fluctuation compensation for an intensity-based optical fibre bending sensor aimed at monitoring human spine bending in a clinical environment. To compensate for the light intensity changes from the sensor light source, a reference signal was provided via the light reflection from an aluminum foil surface fixed at a certain distance from the source fibre end tips. From the results, it was found that the investigated sensor compensation technique was capable of achieving a 2° resolution for a bending angle working range between 0° and 20° . The study also suggested that the output voltage ratio has a 0.55% diversion due to input voltage variation between 2.9 V and 3.4 V and a 0.25% output drift for a 2 h measurement. With the achieved sensor properties, human spine monitoring in a clinical environment can potentially be implemented using this approach with power fluctuation compensation. Keywords: plastic optical fibre sensor; spine monitoring; power fluctuation compensation; intensity modulation technique 1. Introduction The spinal column is an important element in the human physiological system. A human spine consists of three main regions, namely the cervical, thoracic and lumbar region. The cervical spine OPEN ACCESS
Transcript of Plastic Optical Fibre Sensor for Spine Bending Monitoring with Power Fluctuation Compensation

Sensors 2013, 13, 14466-14483; doi:10.3390/s131114466
sensors ISSN 1424-8220
www.mdpi.com/journal/sensors
Article
Plastic Optical Fibre Sensor for Spine Bending Monitoring with
Power Fluctuation Compensation
Mohd Anwar Zawawi 1,2,
*, Sinead O’Keeffe 1 and Elfed Lewis
1
1 Department of Electronic and Computer Engineering, University of Limerick, Plassey Rd.,
Limerick, Ireland; E-Mails: [email protected] (S.O.); [email protected] (E.L.) 2 Faculty of Electrical and Electronics Engineering, Universiti Malaysia Pahang, Pekan,
Pahang 26600, Malaysia; E-Mail: [email protected]
* Author to whom correspondence should be addressed; E-Mail: [email protected];
Tel.: +353-61-213-386; Fax: +353-61-338-176.
Received: 21 August 2013; in revised form: 14 October 2013 / Accepted: 18 October 2013 /
Published: 25 October 2013
Abstract: This paper presents the implementation of power fluctuation compensation for
an intensity-based optical fibre bending sensor aimed at monitoring human spine bending
in a clinical environment. To compensate for the light intensity changes from the sensor
light source, a reference signal was provided via the light reflection from an aluminum foil
surface fixed at a certain distance from the source fibre end tips. From the results, it was
found that the investigated sensor compensation technique was capable of achieving a 2°
resolution for a bending angle working range between 0° and 20°. The study also suggested
that the output voltage ratio has a 0.55% diversion due to input voltage variation between
2.9 V and 3.4 V and a 0.25% output drift for a 2 h measurement. With the achieved sensor
properties, human spine monitoring in a clinical environment can potentially be
implemented using this approach with power fluctuation compensation.
Keywords: plastic optical fibre sensor; spine monitoring; power fluctuation compensation;
intensity modulation technique
1. Introduction
The spinal column is an important element in the human physiological system. A human spine
consists of three main regions, namely the cervical, thoracic and lumbar region. The cervical spine
OPEN ACCESS

Sensors 2013, 13 14467
which connects the human skeleton with the rest of the human vertebral column is composed of seven
cervical bones. Towards the lower part of the cervical spine are twelve thoracic bones which can rotate
and undergo flexion movements. However, their connection with the rib cage prevents them from
excessive flexion. The lowest part of the human spine is the lumbar area which consists of five bones
and it is connected to the sacrum. The lumbar spine is more robust than the cervical and thoracic spines
as its main function is to support the weight of the upper body area [1]. With its robustness and
strength, it allows body movement in several directions, including flexion, extension, lateral rotation
and lateral flexion (side bending).
There are several problems associated with poor spinal conditions such as abnormal kyphosis (over
curvature of the thoracic spine), lordosis (excessive inward curvature of the lumbar spine) or scoliosis
(side to side curve of the thoracic spine) [2]. These problems lead to the requirement of spine
monitoring tools for physiotherapists and physicians to establish a standard measurement approach
among people with back spine problems. In certain patient conditions, it is even becoming necessary to
have a continuous measurement data of spine movement for several hours in order to provide sufficient
information for them to have a thorough understanding of the problems [3].
In general, spine bending measurements can be implemented using several different devices. These
devices can be categorized into three different types; hand-held type, non-contact type and
skin-mounted type. The hand-held type devices are used manually by the examiner during the spine
examinations. Usually there is no other device mounted on the skin-surface during the examination
time. The process of measuring the spine posture is only possible while the subjects under testing are
static. The recording of the spine angle at particular points is done either manually by the examiner or
with the help of a portable transmitter. Some practical examples of this type of device are flexible
rulers [4], tape measures [5], goniometers [6] and spinal mice [7].
Another different approach for spine monitoring are the so-called non-contact devices. The
measurement process for this type of devices takes place at a distance from the body. The image of the
human’s back is captured using a camera. To improve the quality of detection images, these sensors
would require the placement of reflective markers or a harness on the back area. A few examples of
this non-contact type have been presented such as CCD video systems [8], rasterstereography [9] and
digital video fluoroscopy [10].
For both device types described above, it is impractical to provide a continuous assessment of
human spine bending movement considering the limitations of the approaches such as human examiner
constraints to operate the device over a longer measurement duration as well as the risk and side
effects associated with the assessment technique due to radiation exposure on the human skin [11]. To
overcome these shortcomings, the implementation of skin-mounted devices for spine monitoring is
important especially for long term assessment of the human spine condition of patients or any potential
subject for an early diagnosis of back problems.
This paper investigates the development of a skin-mounted type device using a plastic optical fibre
bending sensor based on the intensity modulation technique with power fluctuation compensation. The
compensation was implemented by using the output voltage ratio between the sensor and reference
fibre outputs. The effect of the light source intensity on the output ratio of the bending sensor was
tested by monitoring the output ratio reading of the sensor due to several pre-determined input voltage

Sensors 2013, 13 14468
levels. In addition, the output drift effect was also taken into consideration before the sensor properties
such as resolution, working range and output linearity were determined.
2. Review of Skin Mounted Devices for Spine Monitoring
In general, skin-mounted devices for spine monitoring can be divided into four main groups
according to their sensing mechanism approaches. Firstly, the spine bending movement is measured
based on the elongation and contraction (strain and stress) between two points on the human back. For
devices of this kind, the bending angle of the spine is determined indirectly via the strain measurement
at particular points on the human skin surface. The main requirement of a strain sensor in this case is
an efficient transfer of the applied load to the sensor elements. It is relatively more difficult to ensure
an accurate bending measurement via strain analysis as the sensor is only attached on the surface of the
human skin. To have an optimum stretch and compress effects on the strain sensor, it is the best to
have the sensor embedded in the subject under study (human skin), which in this case no longer
applicable for invasive spine bending monitoring. Another issue related to this strain-based sensor to
measure spine bending is that strain can be so small that very high resolution sensors are required
despite the apparently large deflection curvature of the spine [12]. The use of strain sensors for spine
bending measurement has been presented utilizing strain gages on a thin stainless steel beam to
measure lumbar flexion-extension with an accuracy of within 3° in both the sagittal and frontal planes [13].
Another alternative mechanism is applied by indirectly extracting the posture data from the
acceleration of the spine during flexion and extension exercise movement. However, this method
requires an additional sensor such as gravitometer to provide the data when the subject is in a static
condition. In this spine bending measurement case, this type of sensor is more suitable to assess the
velocity and acceleration of the spine during the body movement in flexion, extension and lateral
directions or during body posture changes such as sitting, standing, walking and running. One good
example of this type of sensor was presented using a piezoresistive accelerometer to record the
acceleration data between trunk and thigh position during sit to stand movements [14].
The next type of skin-mounted device for spine monitoring application is based on the positional
sensor approach. The sensor is normally made up of one base sensor and several other sensor pairs.
The orientation measurement of other sensors with respect to the base sensor will provide a three
dimensional coordinate frame of the human spine position. The sensor has to be reset prior to each
measurement to store the default coordinate frame and to allow calculation of spine position for each
movement. Several different positional sensors have been tested for spine monitoring application such
as using an electromagnetic sensor—Isotrack®
[15] and a fibre optic sensor—Shapetape™ [16] with
different degree of success. For example, the optical bending sensor using Shapetape™ is implemented
based on Cartesian position and orientation vectors between each optical sensor pair and a base sensor
to detect curvature and twist movements along the sensor length during static posture and dynamic
movement of the patient [17].
Considering the limitation of the previous three types of devices to provide any means of
compensation data for spine bending and movement in a single measurement during long period
monitoring, a direct measurement of bending angle and spine movement using a curvature sensor is
necessary. This can be realized using several approaches such as ultrasonic and optical fibre sensors.

Sensors 2013, 13 14469
In brief, an ultrasonic sensor for spine bending applications is composed of several pairs of
transmitters and receivers. An ultrasonic movement analysis device called Zebris®
CMS 50 was used to
record the angular displacement of the thorax and pelvis in humans during walking on a treadmill [18].
The sensor consists of an ultrasonic marker (transmitter) and three ultrasound microphones (receivers)
attached at the back of the human body using adhesive tape. The level of the detected ultrasonic signal
depends on the spine bending angle and direction between the marker and microphones.
The other type of curvature sensor for spine bending monitoring was tested using an optical fibre
sensor integrated into a garment to monitor the spine while the subject was in a seated posture [19].
This sensor is composed of a light source, a light detector and a plastic optical fibre with an abraded
area at one side of the fibre [20]. The sensor length is around 50–55 cm and is stitched to the outer
surface of an elastic garment. The light intensity of the fibre is sensitive to the direction and degree of
curvature of the bending at particular abraded areas along the fibre. The reproducibility of this kind of
sensor is difficult to achieve if the side area of the fibre is polished manually as the light attenuation
characteristics due to bending depend on the length and depth of the abraded side along the fibre [21].
Another issue is that no compensation method has been addressed in this sensor implementation which
could lead to inaccurate bending angle measurement due to the power fluctuation.
3. Review of Related Compensation Approaches for Intensity Modulated Optical Fibre Sensors
For the intensity modulation technique in optical fibre sensors, the detection mechanism is basically
based on the detection of optical intensity. As the output reading from the sensor might be affected by
various noise sources coming from the light source, photodetector, external light coupling and other
environmental factors, it becomes necessary to have a referenced or differential-balanced system to
reject such fluctuations in the sensor measurement. Besides that, to minimize the effects of disturbance
on the light intensity, the reference signal should be placed as close as possible to the sensor output.
The basic approach to provide a compensation signal for light intensity fluctuation was presented
using twin receiving fibre cables [22] as shown in Figure 1a. A white light lamp and a He-Ne laser
source were separately used as the light sources. The output intensity ratio between these two receiving
fibres was used to measure the displacement between the source fibre and twin receiving fibres.
As a comparison, Figure 1b shows another compensation technique which has been applied in 2D
configuration to compensate for the light source intensity for measuring the displacement and rotation
of a reflective object using a sensor probe [23]. The sensor consisted of one source fibre and another
four receiving fibres placed in a ‘T’ figure. Two of the receiving fibres were used to sense the rotation
of the reflector surface and the other two were applied to sense the changing distance between the
reflector and the fibre tip surface by means of the signal ratio between these two fibres.
An alternative approach was presented by using a light source and two identical receiving fibres.
The source fibre was placed in the opposite direction of the receiving fibres as in Figure 1c [24]. The
light source was reflected by a mirror and entered the receiving fibres—fibres A and B—with different
intensity due to the distance of the different fibre end tips to the mirror. The ratio of light intensity
difference between the two fibres (A − B) and their summation (A + B) was used to compensate for
the changes in light source intensity.
Sensors 2013, 13 14470
Another sensor compensation technique was described in pressure sensor application using one
source fibre (middle) and two receiving fibres (front and behind) [25]. Each fibre end tip was placed at
a different distance away from the reflecting target (diaphragm) as shown in Figure 1d. The ratio
between the two outputs of these fibres was used to measure the position of the diaphragm and thus the
pressure reading.
As shown in Figure 1e, the last compensation technique to be discussed here was presented using
dual-wavelength inputs to measure the displacement between the reflector and the sensor surface. A
blue LED (465 nm) and red LED (625 nm) were used in this configuration [26] and alternately
switched on and off to supply the light source from the same source fibre. A dichroic filter with a
cut-off wavelength of 500 nm was fixed 0.5 mm away from the fibre tip to reflect the red light into the
receiving fibre and to pass the blue light from the source fibre to the mirror. The blue light intensity
was changed as the mirror was moved away from the fibre end tips, while the red led which was
constantly reflected by the dichroic filter became the reference output for the signal compensation of
this sensor.
Figure 1. (a) Twin receiving fibres–transmission mode; (b) 2D-reflective sensing
probe; (c) Twin receiving fibres–reflective mode; (d) Twin reflective fibres; (e) Dual
wavelength inputs.
Sensors 2013, 13 14471
For all the compensation methods presented above, the implementations of the compensation signal
were specifically for displacement [22–24,26], pressure [25] and tilt angle [23] measurements. The use
of a mirror and dichroic filter to provide the reference signal for the compensation purpose seems to be
more difficult to realize for the bending sensor configuration as the reflector or filter will also move
due to the bending movement between the fibres which leads to an unreliable referencing signal. One
possible option to realize a compensation technique is to use a 50:50 beam splitter element in between
the input fibres and the sensor fibre. There are several beam splitter options available in the market
such as the Pellicle beam splitter [27], Polka Dot beam splitter [28] and visible beam splitter [29].
However, due to the large diameter size of the splitter (minimum available size is 1 inch) it is not
suitable for the intensity modulation application proposed in this investigation. The reason is that
installing a large diameter of splitter into the fibre holder would require a bigger overall size of the
sensor. This could lead to a stiff bending movement between the input fibres and the sensor fibre.
Another possible approach is to implement an optical coupler such as a face coupler, Y-coupler and
polished coupler [30] along the source fibre before inserted it into the sensor for the bending
measurements. For example, a 1:2 Y-coupler could be used to provide a reference signal at one of the
coupler outputs while the other output could be adopted for the sensor measurement signal. Besides the
significant loss from coupling effect, this technique is also incapable of compensating for any signal
disturbance due to unwanted fibre bending and movement between the coupler output and source fibre
end tip of the sensor. Thus, it is important to have a referencing feedback which is retrieved as close as
possible to the sensor element. A different and relatively more suitable compensation approach is
presented in this investigation considering the size of the sensor and the location of the reference fibre
input for the implementation of bending sensor using plastic optical fibre to cancel out the effect of
power fluctuation.
4. Sensor Configuration for this Investigation
The experimental setup of the sensor configuration for this investigation consists of a multimode
plastic optical fibre LED (GHV-4001, Mitsubishi Rayon Co. Ltd., New York, NY, USA) with a core
diameter of 1 mm, numerical aperture at 0.5 and step index profile, two bright green LEDs (IF-E93,
Industrial Fiber Optics Inc., Arizona, AZ, USA) with a peak wavelength at 530 nm and spectral
bandwidth of 50 nm and two photodiodes (SFH-250 V, Avago Technologies, San Jose, CA, USA &
Singapore) with a photosensitivity spectral range between 400 nm and 1,100 nm. This sensor
configuration was divided into two main fibre parts. The first part consists of three fibre optic cables,
two of which were the input fibres connected to the green LEDs and the other one was the output fibre
connected to the photodiode as a reference output. The other part was also another output fibre cable
representing the sensor output for bending measurements.
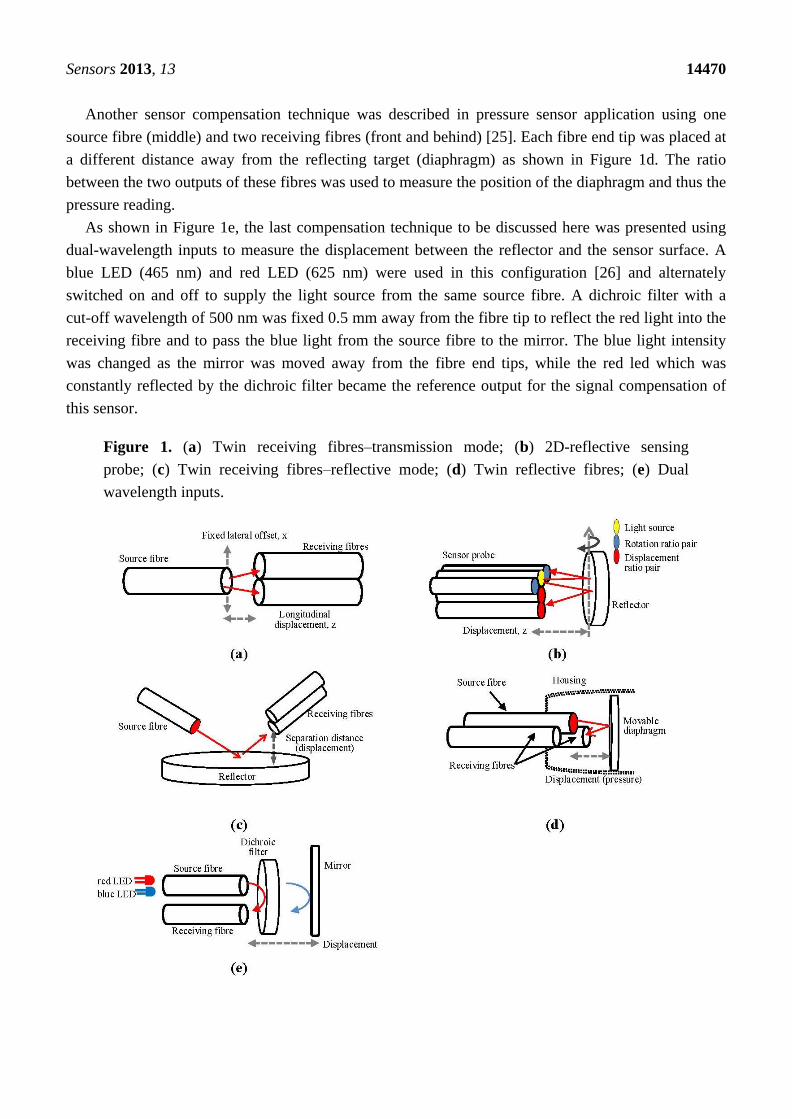
As illustrated in Figure 2a, in the first part containing the source fibres and the reference fibre, all
three of these fibres were merged together at the fibre end tips using a modified V-pin crimp
connector. To firmly hold all the fibres at the remaining area of the fibres, these fibres were securely
insulated using a shrink tube at a certain length. Then, the V-crimp connector containing all the three
fibres was placed into a plastic tube with a center through-hole diameter of 3.5 mm. At the end of the
opposite hole of the tube (near the end tips) a reflector was attached. A small window of 0.5 mm × 1.5 mm
Sensors 2013, 13 14472
was cut out of the aluminum foil to allow certain portions of the light source to travel through the
window into the sensor fibre of the sensor. The rest of the light source was reflected back into the
reference output fibre via the reflective surface of the reflector. The other side of the reflector was a
non-reflective surface so that the effect of back-reflection from the sensor fibre end tip surface into the
reference fibre was minimized. A soft silicon rubber tube of 5 mm inner diameter was used to hold the
first and second parts together during the bending movement.
During the measurement, the sensor was placed on the top of a self-made wooden bending
apparatus as shown in Figure 2c to ensure a consistent sensor position at each bending angle and to
allow angular movement in one direction only (thus lateral direction was avoided). Two U-shape
grippers were used to hold the fibre at the both ends of fibre holders (source and sensor) without
affecting the response of the fibre due to the tape fixing task. This bending apparatus was then placed
on a test rig with a 2.5° bending scale between 0° and 20° to measure the sensor output voltages at
several pre-determined bending angles. A goniometer was attached at the side area of the bending
apparatus for bending angle reference during the measurement. Three different measurements were
made in this investigation; power fluction assessment, bending assessment and repeatability assessment.
Figure 2. (a) Sensor configuration in this investigation; (b) Sensor cross section (side
view); (c) Photo of the sensor placed on a wooden bend apparatus; (d) Bending test rig
with side-attached goniometer.
(a) (b)
(c) (d)
For fluctuation assessment the output voltage and its ratio with respect to the reference voltage were
monitored at several different input voltages between 2.9 V and 3.4 V. The sensor was maintained in a
straight position during the period of this measurement. Secondly, for bending assessment the sensor
Source fibres
Reference fibre Aluminum foil tape
Bending direction
3.5 mm hole
Sensor fibre Rubber tube
Bending apparatus
Goniometer
Source fibre holder
Sensor fibre holder
U shape gripper Rubber tube
x = 1.6 mm
l=1.5 mm
d=0.98 mm
z = 3 mm
Source and reference fibres
Sensor fibre

Sensors 2013, 13 14473
output voltage ratio with respect to the reference voltage was measured at different bending angles.
The sensor on the test rig was bent at several incremental bending angles degree in 2.5° steps starting
from a straight position (assumed to be zero bending) until the fibre was bent at a maximally required
angle of 20°. Lastly for repeatability assessment, the fibre was bent several times from 0° to 10° and
then back to 0° to study the repeatability of the sensor to give the same output voltage ratio after
multiple bending movements of the sensor. The fibre was maintained at each angular position for one
minute as the measurement was recorded. The input voltage was also fixed at 3.4 V at all times for
both bending and repeatability assessments.
The justifications of the parameters selection of the sensor configuration are presented in the
following paragraphs. The right selection of reflector material is important to ensure a good light
reflectivity from the source fibres into the reference fibre. A discussion on the fibre separation gap
between the source and the sensor fibres is important to explain the needs for dual source fibres for the
sensor input; e.g., a gap of up to 4 mm between the source and sensor fibres that was necessary for
optimum light reflection into the reference fibre as well as for smooth fibre bending movement would
lead to a poor signal reception at the sensor fibre. Lastly, it is also necessary to find a suitable gap so
that a maximum light intensity is reflected back from the source fibres into the reference fibre.
4.1. Reflector Material Type
Several types of reflector surface materials can be applied as the reflector element to provide the
light reflection for reference fibre signal besides the use of mirror. Optical reflectivity properties for
different type of materials have been studied using a red LED light source with 660 nm wavelength.
The reflectivity response of gold coated mirror, copper, brass, aluminum, steel and iron obtained from
previous investigation [31] is summarized in Figure 3.
Figure 3. Response of fibre optic reflectivity of different reflector materials [31].
It is important to note that the reflectivity of the gold coating surface is dependent on the
wavelength of the applied light source. For a visible light source with a wavelength of 600 nm and
above, the reflectivity can reach values of up to 90% [32]. On the other hand, for the type of light
Sensors 2013, 13 14474
source in this investigation (green LED: 530 nm), the reflectivity is significantly lower, thus the use of
a gold coated mirror is avoided in this application. Steel and iron are more common in the market but
their poor reflectivity properties became the main problem. Copper, brass and aluminum are available
at relatively low price and it have acceptable reflectivity characteristics, thus they were considered as
the reflectors for this sensor configuration.
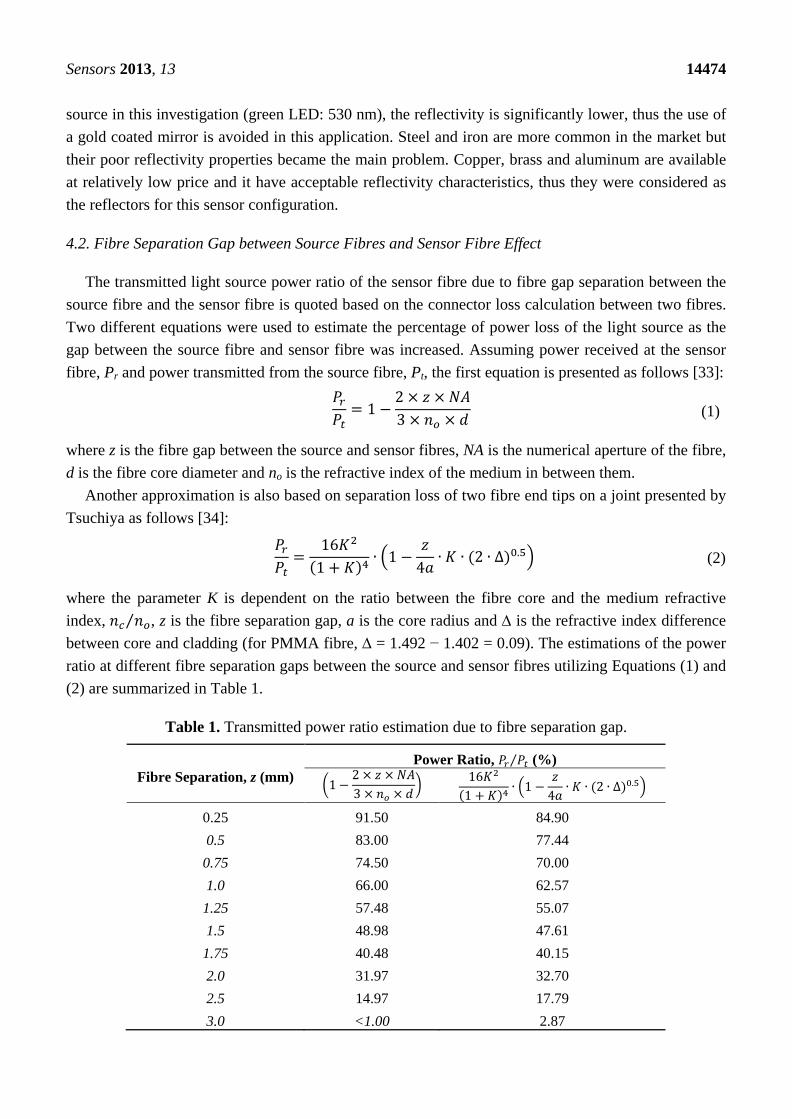
4.2. Fibre Separation Gap between Source Fibres and Sensor Fibre Effect
The transmitted light source power ratio of the sensor fibre due to fibre gap separation between the
source fibre and the sensor fibre is quoted based on the connector loss calculation between two fibres.
Two different equations were used to estimate the percentage of power loss of the light source as the
gap between the source fibre and sensor fibre was increased. Assuming power received at the sensor
fibre, Pr and power transmitted from the source fibre, Pt, the first equation is presented as follows [33]:
(1)
where z is the fibre gap between the source and sensor fibres, NA is the numerical aperture of the fibre,
d is the fibre core diameter and no is the refractive index of the medium in between them.
Another approximation is also based on separation loss of two fibre end tips on a joint presented by
Tsuchiya as follows [34]:
(2)
where the parameter K is dependent on the ratio between the fibre core and the medium refractive
index, , z is the fibre separation gap, a is the core radius and is the refractive index difference
between core and cladding (for PMMA fibre, = 1.492 − 1.402 = 0.09). The estimations of the power
ratio at different fibre separation gaps between the source and sensor fibres utilizing Equations (1) and
(2) are summarized in Table 1.
Table 1. Transmitted power ratio estimation due to fibre separation gap.
Fibre Separation, z (mm)
Power Ratio, (%)
0.25 91.50 84.90
0.5 83.00 77.44
0.75 74.50 70.00
1.0 66.00 62.57
1.25 57.48 55.07
1.5 48.98 47.61
1.75 40.48 40.15
2.0 31.97 32.70
2.5 14.97 17.79
3.0 <1.00 2.87
Sensors 2013, 13 14475
With the use of Equation (2), the estimated power transmission for a gap of 3 mm between the
source fibre and the sensor fibre is less than 3%. The comparison between the theoretical and the
experimental values with respect to this longitudinal separation gap has been discussed in our previous
study [35]. From the estimation in Table 1, the use of a single source fibre for the sensor configuration
presented in this paper will result in a significantly lower light intensity being accepted at the sensor
fibre. To ensure a higher light level reception at the sensor fibre, two source fibres were applied in the
optical fibre sensor. This was significant because besides the loss due to the fibre gap, the sensor fibre
will also experience additional light loss from the bending measurement later.
4.3. Distance between the Source Fibres End Tips and Reflector
The optimum distance between the fibre end tips and the reflector applied in this investigation is
aimed to achieve a maximum optical power received at the reference fibre. The power ratio of the
receiving fibre with respect to the transmitted power for different separation gaps between the fibre
end tip and the reflector can theoretically be presented in an equation [36]:
(3)
where . In this equation, za is the cone vertex distance from the fibre end tips. It was
shown in [36] that the collected power at receiving fibre achieved its maximum value at (e.g.,
= 0.9142). For a PMMA fibre type applied in this investigation, the maximum received power
was reached at a fibre and reflector separation gap of 1.6 mm (e.g., ) as shown by a
reflective sensor configuration for vibration application [37] using plastic optical fibre of the same type
as applied here. As the percent ratio of the hole area (0.75 mm2) by the overall reflector area
(9.6 mm2) was 7.7%, which is very small, and the hole was in a fixed position on the reflector surface
at all time, Equation (3) is presumed to be valid to provide the optimum gap estimation for this sensor.
From the brief discussion provided in Sections 4.1 through 4.3, aluminum foil has been selected as
the reflective material considering its reflectivity response and the availability of that material with an
adhesive side. The fibre separation gap between the source fibres and the sensor fibre was kept as
small as possible. However, as a certain gap was necessary for the optimum light reflection into the
reference fibre as well as for a smooth bending movement between the source fibre and sensor fibre
holders the fibres was separated a distance between 3 to 4 mm. Finally, the distance between the
source fibres and the reflector was set at 1.6 mm simply by using the result from Equation (3).
5. Results and Discussion
The experimental results for the bending sensor configuration in this investigation were achieved
from a photodetector amplifier and filtering circuit using Labview platform via a multifunction
USB-6008 DAQ module (National Instruments, Texas, TX, USA). The results include the power
fluctuation test, bending assessment, repeatability assessment and output voltage drift test. From these
results, important sensor properties such as sensor sensitivity at different bending angles, sensor
working range, acceptable input voltage variation and output linearity were established.

Sensors 2013, 13 14476
Figure 4a,b shows the actual output voltage and output voltage ratio for power fluctuation
investigation. Initially, the input voltage was maintained at 3.4 V for 1 min before a decrease of
0.1 V was applied and continued at each additional minute. The input voltage was reduced until 2.9 V.
In order to have sufficient light transmission from the source fibres into the reference and sensor fibres,
the input voltage was not reduced further. From Figure 4b, it is demonstrated that the output voltage
ratio was able to regulate at 0.55% voltage ratio from the initial reading for an input voltage range
between 2.9 V and 3.4 V.
Figure 4. Power fluctuation test—(a) actual output voltage; (b) output voltage ratio.
(a)
(b)
The bending test result of the sensor is presented in Figure 5a. The sensor was placed in a straight
position at the beginning of the test for 1 min period. Later the bending angle was extended for an
additional 2.5° for the next 1 min and so on until 20° of bending was achieved. The actual output
voltages of the sensor and reference fibres were recorded to monitor the attenuation of the light
intensity at each further 2.5° bending angle.
It is shown in Figure 5a that the output voltage ratio drops more significantly for each additional
2.5° bending angle between 10° and 15° (sensitivity, Smax = 0.0826/1°) than a bending angle of less
2.9V
3.0 V
3.1 V
3.2 V
3.3 V
3.4 V
2.9V
3.0 V
3.1 V
3.2 V
3.3 V
3.4 V
2.9V
3.0 V
3.1 V
3.2 V
3.3 V
3.4 V
Respective input voltages

Sensors 2013, 13 14477
than 10°. The output ratio was minimally reduced at a bending of less than 5° (Smin = 0.0136/1°) which
was caused by a wider far field property of the sensor fibre using dual source input [33]. Besides that,
as shown in Figure 5b the reference voltage output was also least affected from the fibre bending
manipulation, suggesting a reliable compensation signal provided by this sensor configuration.
Figure 5. Bending assessment—(a) output voltage ratio; (b) reference voltage.
(a)
(b)
The repeatability test was conducted to study the ability of the rubber tube to hold the fibre holders
together during the bending and to maintain the same level of sensor output voltage for each particular
bending angle. As shown in Figure 6, the voltage was dropped from 4.57 V to 3.20 V as the sensor was
bent from 0° to 10° and the same level of output voltage (thus similarly for output ratio) was
reproduced after at least five bending repeatations.
The voltage drift test is presented in Figure 7. The sensor output voltage ratio was monitored for a
2 h period to investigate the output voltage ratio drift effect. The drift was found to be at 0.25% from
the initial value after being slightly dropped from 1.164 to 1.161 during the 2 h test. This small drift is
significant for the optical fibre bending sensor based on intensity modulation as presented in this
investigation because a larger drift could potentially lead to miscalculation of the bending angle,
especially for a long period of spine bending monitoring.
0o 2.5o 5o 7.5o
10o
12.5o
15o
17.5o 20o
Output voltage ratio at different bending angle
1.095 1.163
0.827
0.622
0.414
Smin = 0.0136 / 1o
Smax = 0.0826 / 1o
Sensors 2013, 13 14478
Figure 6. Repeatability test—actual output voltage.
Figure 7. Voltage drift test—output voltage ratio.
To show the ability of the sensor to provide a bending measurement for the intended application,
the measurement was made by determining the output ratio at several pre-determined angles before a
linear relationship between the output ratio and the bending angle was made. This relationship was
applied only for this preliminary investigation as an actual relationship between the output ratio and
the bending angle will be applied using fibre tilt angle loss estimation as discussed in [35]. In this
measurement, the sensor was bent starting from a straight position (0°) to 5°, 10° and later to 15°
before it was continued for decreasing angles of the same bending angle position as shown in Figure 8.
As this scale was too large for the spine application, the measurement was carried on for a smaller
bending scale of 2° until 16° of bending. The bending reading between 0° and 6° was slightly less
consistent than the larger bending which was explicable due to the poor sensitivity of the sensor at a
smaller bending range.
0o 0o 0o 0o 0o 0o
10o 10o 10o 10o 10o
Sensors 2013, 13 14479
Figure 8. Bending measurement—bending angle (o).
From the assessment results in Figures 4–8, some important properties of the sensor under
investigation are summarized in Table 2. The effect of the other disturbances such as temperature
variation and external light coupling were minimized in the current investigation results by conducting
the measurement in an ambient room temperature (between 18 °C to 23 °C) and minimum surrounding
light during the measurement period. The room temperature variation will affect the light intensity at
some point but this effect is presumed to be minimized with the compensation technique described
here. The reason is both reference and sensor outputs were supplied by the same light sources before
these values were normalized for the bending measurement. Besides that, it was also presumed that the
body temperature does not directly influence the light intensity because in this case only the fibre cable
has a direct contact with the human body while the light source was placed in a distant location.
Table 2. Optical fibre bending sensor properties of this investigation.
Sensor Properties Measured Value
Power fluctuation (input voltage
of 2.9 V–3.4 V) 0.55%
Sensitivity (between 0° and 5°)
Sensitivity (between 10°and 15°)
Smin = 0.0136/1°
Smax = 0.0826/1°
Resolution <2°
Working range (flexion only) 0°–20°
Output drift 0.25%/2 h
As a general guideline for the minimum requirement of the sensor resolution and its full scale
deflection specifically for the application of the spine bending and movement monitoring, it is
significant to briefly review the typical range of motion of the human spine based on previous studies
on human spine motion conducted by recognized physiotherapists. The summary of the range of
motion of the segmental of the human spine is presented in Table 3.
15o
0o 0o
10o
5o 6o
2o
4o
12o
14o
10o
16o 15o
10o
5o
0o
8o
Sensors 2013, 13 14480
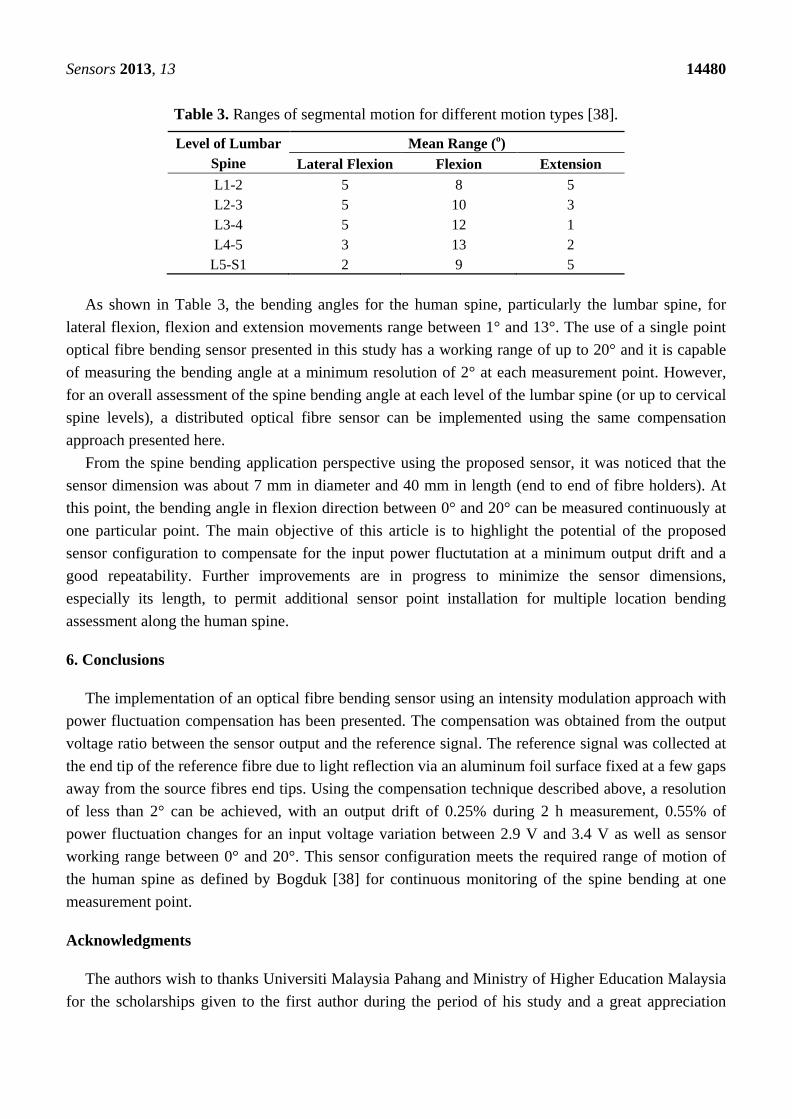
Table 3. Ranges of segmental motion for different motion types [38].
Level of Lumbar
Spine
Mean Range (o)
Lateral Flexion Flexion Extension
L1-2 5 8 5
L2-3 5 10 3
L3-4 5 12 1
L4-5 3 13 2
L5-S1 2 9 5
As shown in Table 3, the bending angles for the human spine, particularly the lumbar spine, for
lateral flexion, flexion and extension movements range between 1° and 13°. The use of a single point
optical fibre bending sensor presented in this study has a working range of up to 20° and it is capable
of measuring the bending angle at a minimum resolution of 2° at each measurement point. However,
for an overall assessment of the spine bending angle at each level of the lumbar spine (or up to cervical
spine levels), a distributed optical fibre sensor can be implemented using the same compensation
approach presented here.
From the spine bending application perspective using the proposed sensor, it was noticed that the
sensor dimension was about 7 mm in diameter and 40 mm in length (end to end of fibre holders). At
this point, the bending angle in flexion direction between 0° and 20° can be measured continuously at
one particular point. The main objective of this article is to highlight the potential of the proposed
sensor configuration to compensate for the input power fluctutation at a minimum output drift and a
good repeatability. Further improvements are in progress to minimize the sensor dimensions,
especially its length, to permit additional sensor point installation for multiple location bending
assessment along the human spine.
6. Conclusions
The implementation of an optical fibre bending sensor using an intensity modulation approach with
power fluctuation compensation has been presented. The compensation was obtained from the output
voltage ratio between the sensor output and the reference signal. The reference signal was collected at
the end tip of the reference fibre due to light reflection via an aluminum foil surface fixed at a few gaps
away from the source fibres end tips. Using the compensation technique described above, a resolution
of less than 2° can be achieved, with an output drift of 0.25% during 2 h measurement, 0.55% of
power fluctuation changes for an input voltage variation between 2.9 V and 3.4 V as well as sensor
working range between 0° and 20°. This sensor configuration meets the required range of motion of
the human spine as defined by Bogduk [38] for continuous monitoring of the spine bending at one
measurement point.
Acknowledgments
The authors wish to thanks Universiti Malaysia Pahang and Ministry of Higher Education Malaysia
for the scholarships given to the first author during the period of his study and a great appreciation

Sensors 2013, 13 14481
also to the STRoNGTiES for the financial support given during the student mobility period of the
first author.
Conflicts of Interest
The authors declare no conflict of interest.
References
1. Snell, R.S. The Back. In Clinical Anatomy by Regions, 8th ed.; Lippincott Williams & Wilkins:
Philadelphia, PA, USA, 2004; pp. 852–860.
2. Croft, P.R.; Macfarlane, G.J.; Papageorgiou, A.C.; Elaine, T.; Silman, A.J. Outcome of low back
pain in general practice: A prospective study. Br. Med. J. 1998, 316, 1356–1359.
3. Spenkelink, C.D.; Hutten, M.M.R.; Hermens, H.J.; Greitemann, B.O.L. Assessment of activities
of daily living with an ambulatory monitoring system: A comparative study in patients with
chronic low back pain and non-symptomatic controls. Clin. Rehabil. 2002, 16, 16–26.
4. Link, C.S.; Nicholson, G.G.; Shaddeau, S.A.; Robert, B.; Gossman, M.R. Lumbar curvature in
standing and sitting in two types of chairs: Relationship of hamstring and hip flexor muscle
length. Phys. Ther. 1990, 70, 611–618.
5. Mellin, G.P. Accuracy of measuring lateral flexion of the spine with a tape. Clin. Biomech. 1986,
1, 85–89.
6. Burdett, R.G.; Brown, K.E.; Fall, M.P. Reliability and validity of four instruments for measuring
lumbar spine and pelvic positions. Phys. Ther. 1986, 66, 677–684.
7. Mannion, A.F.; Knecht, K.; Balaban, G.; Dvorak, J.; Grob, D. A new skin-surface device for
measuring the curvature and global and segmental ranges of motion of the spine: Reliability of
measurements and comparison with data reviewed from the literature. Eur. Spine J. 2004, 13,
122–136.
8. Whittle, M.W.; Levine, D. Three-dimensional relationships between the movements of the pelvis
and lumbar spine during normal gait. Hum. Mov. Sci. 1999, 18, 681–692.
9. Crawford, R.J.; Price, R.I.; Singer, K.P. The effect of interspinous implant surgery on back
surface shape and radiographic lumbar curvature. Clin. Biomech. 2009, 24, 467–472.
10. Ahmadi, A.; Maroufi, N.; Behtash, H.; Zekavat, H.; Parnianpour, M. Kinematic analysis
of dynamic lumbar motion in patients with lumbar segmental instability using digital
videofluoroscopy. Eur. Spine J. 2009, 18, 1677–1685.
11. Shope, T.B. Radiation-induced skin injuries from fluoroscopy. Radiographics 1996, 16, 1195–1199.
12. Djordjevich, A.; He, Y. Thin structure deflection measurement. IEEE Trans. Instrum. Meas. 1999,
48, 705–710.
13. Donatell, G.J.; Meister, D.W.; O’Brien, J.R.; Thurlow, J.S.; Webster, J.G.; Salvi, F.J. A simple
device to monitor flexion and lateral bending of the lumbar spine. IEEE Trans. Neural Syst.
Rehabil. Eng. 2005, 13, 18–23.
14. Janssen, W.G.M.; Bussmann, J.B.J.; Horemans, H.L.D.; Stam, H.J. Analysis and decomposition
of accelerometric signals of trunk and thigh obtained during the sit-to-stand movement. Med. Biol.
Eng. Comput. 2005, 43, 265–272.
Sensors 2013, 13 14482
15. Rowe, P.J.; White, M. Three dimensional lumbar spinal kinematics during gait, following mild
musculo-skeletal low back pain in nurses. Gait Posture 1996, 4, 242–251.
16. Williams, J.M.; Haq, I.; Lee, R.Y. Dynamic measurement of lumbar curvature using fibre-optic
sensors. Med. Eng. Phys. 2010, 32, 1043–1049.
17. The Validation of Measurend Shape Tape for Measuring Joint Angles. Available online:
http://www-archive.ece.queensu.ca/directory/faculty/Morin/publications/CMBEC_02_shapetape.pdf.
(accessed on 20 August 2013).
18. Vogt, L.; Banzer, W. Measurement of lumbar spine kinematics in incline treadmill walking.
Gait Posture 1999, 9, 18–23.
19. Dunne, L.E.; Walsh, P.; Hermann, S.; Smyth, B.; Caulfield, B. Wearable monitoring of seated
spinal posture. IEEE Trans. Biomed. Circuit. Syst. 2008, 2, 97–105.
20. Kuang, K.S.C.; Cantwell, W.J.; Scully, P.J. An evaluation of a novel plastic optical fibre sensor
for axial strain and bend measurements. Meas. Sci. Technol. 2002, 13, 1523–1534.
21. Wei, H.L.; Li, W.C.; Wen, F.X.; Yung, C.C. A sensing element based on a bent and elongated
grooved polymer optical fiber. Sensors 2012, 12, 7485–7495.
22. Yuan, L.; Pan, J.; Yang, T.; Han, G. Analysis of the compensation mechanism of a fiber-optic
displacement sensor. Sens. Actuator. A 1993, 36, 177–182.
23. Yuan, L. Automatic-compensated two-dimensional fiber-optic sensor. Opt. Fiber Technol. 1998,
4, 490–498.
24. Ko, W.H.; Chang, K.M.; Hwang, G.J. A fiber-optic reflective displacement micrometer. Sens.
Actuators A 1995, 49, 51–55.
25. Yuan, L.; Anping, Q. Fiber-optic diaphragm pressure sensor with automatic intensity
compensation. Sens. Actuators A 1991, 28, 29–33.
26. Vallan, A.; Casalicchio, M.L.; Olivero, M.; Perrone, G. Assessment of a dual-wavelength
compensation technique for displacement sensors using plastic optical fibers. IEEE Trans.
Instrum. Meas. 2012, 61, 1377–1383.
27. Thorlabs: Pellicle Beamsplitters. Available online: http://www.thorlabs.de/newgrouppage9.cfm?
objectgroup_id=898 (accessed on 18 July 2013).
28. Thorlabs: Polka Dot Beamsplitters. Available online: http://www.thorlabs.de/newgrouppage9./
cfm?Objectgroup _id=1110 (accessed on 18 July 2013).
29. Thorlabs: Visible Beamsplitters. Available online: http://www.thorlabs.de/newgrouppage9.
cfm?objectgroup_id=914 (accessed on 18 July 2013).
30. Ziemann, O.; Krauser, J.; Zamzow, P.E.; Daum, W. Passive Components for Optical Fibers: POF
Couplers. In POF Handbook: Optical Short Range Transmission Systems, 2nd ed.; Springer:
Berlin, Germany, 2008; pp. 269–275.
31. Binu, S.; Mahadevan Pillai, V.P.; Chandrasekaran, N. Fibre optic target reflectivity sensor.
Opt. Quantum Electron. 2007, 39, 747–752.
32. Inradoptics: Spectral Reflectivity Curves. Available online: http://www.inradoptics.com/
optics-resources/optics-design/spectral-reflectivity-curves (accessed on 28 July 2013).
33. Ziemann, O.; Krauser, J.; Zamzow, P.E.; Daum, W. Passive Components for Optical Fibers: Basis
for Calculating Connector Losses. In POF Handbook: Optical Short Range Transmission
Systems, 2nd ed.; Springer: Berlin, Germany, 2008; pp. 259–268.

Sensors 2013, 13 14483
34. Tsuchiya, H.; Nakagome, H.; Shimizu, N.; Ohara, S. Double eccentric connectors for optical
fibers. Appl. Opt. 1977, 16, 1323–1331.
35. Zawawi, M.A.; O’Keeffe, S.; Lewis, E. Plastic optical fibre sensor for spine bending monitoring.
J. Phys. 2013, 450, 1–6.
36. Faria, J.B. A theoretical analysis of the bifurcated fiber bundle displacement sensor. IEEE Trans.
Instrum. Meas. 1998, 47, 742–747.
37. Perrone, G.; Vallan, A. A low-cost optical sensor for noncontact vibration measurements.
IEEE Trans. Instrum. Meas. 2009, 58, 1650–1656.
38. Bogduk, N. Movement of the Lumbar Spine. In Clinical Anatomy of the Lumbar Spine and
Sacrum, 3rd ed.; Churchill Livingstone: Edinburgh, UK, 1997; pp. 81–100.
© 2013 by the authors; licensee MDPI, Basel, Switzerland. This article is an open access article
distributed under the terms and conditions of the Creative Commons Attribution license
(http://creativecommons.org/licenses/by/3.0/).


![05-03ChapGere[1] | Bending | Beam (Structure) - xdocs.net](https://static.fdokumen.com/doc/165x107/6323c1d9be5419ea700ebf89/05-03chapgere1-bending-beam-structure-xdocsnet.jpg)