
Ablation of Atrial Flutter in Complex Congenital Heart Disease
Upload
khangminh22Category
view
1download
0
NONLINEAR STALL FLUTTER ofWINGS with BENDING-TORSION COUPLING
by
Peter Earl Dunn
S.B., Massachusetts Institute of Technology (1985)S.M., Massachusetts Institute of Technology (1989)
Submitted to the Department of Aeronautics and Astronauticsin partial fulfillment of the requirements for the degree of
Doctor of Philosophyin Aeronautics and Astronautics
at the
Massachusetts Institute of TechnologyFebruary 1992
© Massachusetts Institute of Technology 1992·Th
Signature of
Certified by
Certified
Certified
Certified
AuthorDepartment-of Aeronautics and Astronautics
December 20, 1991
by
by
by
Accepted by
Professor Jhr-)Dugundji, hesis Supervisor
Professor Edward Craw, Thesis Supervisor
Professor Andreas on Flotow, Thesis Supervisor
Professor Michael Giles, Thesis Supervisor
WI 'I r.5.fj u
Professgr Harold Y. WachmanChairman, Departmental Committee on Graduate Students
Department of Aeronautics and Astronautics
? - y,, 1932
F ;-" " J 992
:..2.F<,i z:_65
i

ii

To
Kristine-with-a-K
and
Christine-with-a-C,
for their loving support
iii

iv
NONLINEAR STALL FLUTTER ofWINGS with BENDING-TORSION COUPLING
byPETER EARL DUNN
Submitted to the Department of Aeronautics and Astronautics onDecember 20, 1991, in partial fulfillment of the requirements for thedegree of Doctor of Philosophy in Aeronautics and Astronautics.
ABSTRACT
The nonlinear, stalled, aeroelastic behavior of rectangular,graphite/epoxy, cantilevered plates with varying amounts ofbending-torsion stiffness coupling and with NACA 0012 styrofoamairfoil shapes is investigated for low Reynolds number flow(<200,000). A general Rayleigh-Ritz formulation is used to calculatepoint load static deflections, and nonlinear static vibration frequen-cies and mode shapes for varying tip deflections. Nonlinear lift andmoment aerodynamics are used in the context of the Rayleigh-Ritzformulation to calculate static airload deflections. The nonlinear,stalled ONERA model using non-constant coefficients - initiallydeveloped by Tran & Petot - is reformulated into a harmonic balanceform and compared against a time-marching Runge-Kutta scheme.Low angle-of-attack, linear flutter calculations are done using theU-g method. Nonlinear flutter calculations are done by applyingFourier analysis to extract the harmonics from the ONERA-calculated,3-dimensional aerodynamics, then applying a harmonic balancemethod and a Newton-Raphson solver to the resulting nonlinear,Rayleigh-Ritz aeroelastic formulation.
Test wings were constructed and subjected to static, vibration,and wind tunnel tests. Static tests indicated good agreementbetween theory and experiment for bending and torsion stiffnesses.Vibrations tests indicated good agreement between theory andexperiment for bending and torsion frequencies and mode shapes.2-dimensional application of the ONERA model indicated goodagreement between harmonic balance method and exact Runge-Kuttatime integration. Wind tunnel tests showed good agreement betweentheory and experiment for static deflections, for linear flutter anddivergence, and for stalled, nonlinear, bending and torsion flutterlimit cycles. The current nonlinear analysis shows a transition fromdivergence to stalled bending flutter, which linear analyses areunable to predict.
Thesis Supervisor: John DugundjiTitle: Professor of Aeronautics and Astronautics
v

vi

ACKNOWLEDGEMENTS
First and foremost I would like to thank my supervisor, Prof.
John Dugundji, for his guidance, wisdom, and patience. I would also
like to thank my other thesis committee members, Profs. Edward
Crawley, Andreas von Flotow, and Michael Giles, for their many
invaluable suggestions and recommendations.
Special thanks to my undergraduate helper, Lisa-Jean Marzullo,
for help in accumulating and reducing experimental data; to Al
Supple for help in manufacturing and instrumenting the test speci-
mens; to Al Shaw and Jeffrey Ditullio for never-ending aid in all
phases of wind tunnel testing; to the members of M.I.T.'s Space
Engineering Research Center for allowing me the use of their experi-
mental and computer facilities, especially to Ken Lazarus for the use
of his wind tunnel specimen stand; to my colleagues and friends at
NASA-Langley, Dr. John Edwards, Mark Chaffin, David Seidel, and
Chris Rumsey, for their help in corroborating my aerodynamic anal-
ysis against CFD analysis; and to Prof. Paul Lagace and Ping Lee for
taking care of all the bureaucratic details.
Lastly I would like to acknowledge those who provided the
incentive to keep the fires burning: to Mom and Dad who supported
me all my through these long years; to the other TELAC denizens of
41-219c and 41-317 for their help, for sushi and sake, for the
Cambridge Brewing Company, and for lobster dinners; to my
ex-roommates, Cathy, Earl, Wolfie, Pete, & Andy, for the respite they
provided from M.I.T.; and to The Tech for providing a welcome
escape from classwork.
vii

Support for this research was provided by the Air Force Office
of Scientific Research under Contract No. F49620-86-C-0066 with
Dr. Spencer Wu as Contract Monitor.
viii
TABLE OF CONTENTS
1. Introduction ............................................................................. ................. ....... 1
2. Summary of Previous Work 5
2.1 Dynamic Stall Models ..............................................................................5
2.2 Structural Models ................................................................................. 11
2.3 Stall Flutter Analysis........................................................................... 1 2
3. Theory 173.1 Structural Model ....................................... . 17
3.1.1 Anisotropic Plate Modulus Components ... .. 17
3.1.2 Eqns of Motion with Geometric Nonlinearities ....... 21
3.2 Aerodynamic Model ......................................... 29
3.2.1 The ONERA Aerodynamic Model .................................... 29
3.2.2 Fourier Analysis of
Nonlinear Aerodynamic Forcing Terms...................... 33
3.2.3 Harmonic Balance Applied to ONERA Model .............37
3.3 Algebraic Reduction by Modal Analysis . ...............................44
3.3.1 Rayleigh-Ritz Analysis ......................................... 44
3.3.2 Selection of Rayleigh-Ritz Modes ...................................46
3.3.3 Mass & Stiffness Matrices and Modal Forces .... 5 0.....50
3.4 Pre-Flutter Analyses ........................................................................... 54
3.4.1 Static Deflection Problem ................................ ................ 54
3.4.2 Free Vibration Problem ...................................................... 5 5
3.4.3 Two-Dimensional Aerodynamic Problem ...................5 6
3.5 Flutter Analyses .................................................................................... 60
3.5.1 U-g Method .............................................................................. 60
3.5.2 Harmonic Balance
Applied to Nonlinear Flutter Analysis ........................64
3.5.3 Parameters of Analysis and Implementation .......... 69
ix*

4. Experiment 7 54.1 Test Specimen Sizing ......................................... 7 5
4.2 Test Specimen Preparation....................................................7 6
4.3 Static Deflection Tests ........................................ 8 1
4.4 Free Vibration Tests ............................................................................ 8 3
4.5 Wind Tunnel Tests ............................................................................... 84
5. Results and Discussion 8 9
5.1 Pre-Flutter Results ........................................ 8 9
5.1.1 Static Deflections ........................................ 8 9
5.1.2 Linear Free Vibration.......................................................... 9 6
5.1.3 Nonlinear Free Vibration ................................................. 102
5.1.4 Two-Dimensional Aerodynamics .................................. 109
5.2 Flutter Analysis ................................................................................... 117
5.2.1 Linear U-g Analysis ........................................................... 117
5.2.2 Flutter Boundaries .............................................................. 126
5.2.3 Large-Amplitude, Nonlinear Flutter ........................... 1 37
6. Conclusions and Recommendations 1 5 3
6.1 Aerodynamic Model .......................................................................... 154
6.2 Structural Model ....... ................................. 156
6.3 Experiment ................................................. ......................................... 157
R eferences ................................................................................................................. 159
Appendix A - Material Properties ...................................................... ...........173
Appendix B - Flat Plate Structural and Mode Shape Constants ........ 175
Appendix C - Static Aerodynamic Models ........................................ ..........177
Appendix D Coefficients of Aerodynamic Equations .......................... 182
Appendix E Example of Fourier Analysis ................................................90
Appendix F - The Newton-Raphson Method ........................................ 1 94
Appendix G - Computer Code ........................................ 1 97

LIST OF FIGURES
Fig. 1 Dynamic Stall Events on NACA 0012 Airfoil .......................................7
Fig. 2 Sign convention for ply angles and axes . ................................... 1 8
Fig. 3 Local coordinates and stress & moment resultants ...................... 22
Fig. 4 Description of static curve........................................................................3 1
Fig. 5 Gross characteristics of force hysteresis ............................................7 1
Fig. 6 Cross-section of symmetric curing assembly ................................. 77
Fig. 7 TELAC cure cycle ................................................. 7 9
Fig. 8 Wing construction and specimen dimensions ............................... 8 0
Fig. 9 Static deflection test setup....................................................................... 8 2
Fig. 10 Wind tunnel test stand ........................................ ......... 8 7
Fig. 11 [03/ 9 0] S wing static deflection results ............................................. 93
Fig. 12 [+152/02]S wing static deflection results ......................................... 9 4
Fig. 13 [-152/02] S wing static deflection results ......................................... 9 5
Fig. 14 [03/90]s analytic free vibration mode shapes ............................100
Fig. 15 [+152/02] S analytic free vibration mode shapes ........................1 01
Fig. 16 [03/90] S wing frequency variation,
torsional warping terms not included ................................... 107
Fig. 17 [03/90] S wing frequency variation,
torsional warping terms included ...........................................1 08
Fig. 18 Two dimensional lift coefficient hysteresis loops,
analysis for NACA 0012 airfoil, Re=.2E6 .............................. 1 1 4
Fig. 19 Two dimensional lift coefficient hysteresis loops,
analysis for NACA 0012 airfoil, Re=.2E6 ..............................1 5
Fig. 20 Two dimensional lift coefficient hysteresis loops,
experiment for NACA 0012 airfoil, Re=.5E6 ....................... 11 6
xi

Fig. 21 [03/90] s U-g diagram.............................................................................1 2 3
Fig. 22 [+15 2/02]S U-g diagram.......................................................................1 24
Fig. 23 [-152/021 U-g diagram ............................................................... 1 25
Fig. 24 [03/90] s flutter boundary and frequency variation ................ 13 4
Fig. 25 [+152/02] S flutter boundary and frequency variation ............1 35
Fig. 26 [-152/021S flutter boundary and frequency variation ............13 6
Fig. 27 [03/90]S averaged midchord tip deflections,
and averaged total tip angle .................................................... 1 46
Fig. 28 [03/90]1 tip deflection and
tip angle oscillation amplitudes ...............................................1 47
Fig. 29 [+152/02]S averaged midchord tip deflections,
and averaged total tip angle ...................................................... 1 4 8
Fig. 30 [+152/02]1 tip deflection and
tip angle oscillation amplitudes ...............................................1 49
Fig. 31 [152/02] S averaged midchord tip deflections,
and averaged total tip angle . ........................................ 50
Fig. 32 [-152/02] S tip deflection and
tip angle oscillation amplitudes ............................................... 15 1
Fig. 33 NACA 0012 low Reynolds number lift model .............................1 78
Fig. 34 Generalized lift model ............................................................... 1 8 1
Fig. 35 Nonlinear coefficient sensitivity analysis .....................................1 89
Fig. 36 Example of single break point stall model ...................................1 93
xii

LIST OF TABLES
Table 1. Assumed mode shapes .........................................................................48
Table 2. Free vibration frequencies ........................................ 99
Table 3. First harmonic components of
2-dimensional aerodynamic analysis ....................................113
Table 4. Linear divergence and flutter characteristics ..........................122
Table 5. Aerodynamic Coefficients .................................................................1 88
xiii

xiv

LIST OF SYMBOLS
a damping coefficient of ONERA nonlinearaerodynamic differential equation (3-64)
a0 , a parabolic coefficients of damping coefficient ofONERA nonlinear aerodynamic equation
aij coefficients of polynomial series for i-th regionof the aerodynamic force curve
aoz linear slope of the general aerodynamic forcecoefficient dCz9/dcc
aoL, aoM linear slopes of lift and moment coefficientcurves
A wing area
A damping coefficient of ONERA non-linearaerodynamic differential equation (3-64), basedonly on mean lift deficit AO
[A] matrix of combined mass and complexaerodynamic components used in linear U-gflutter method
Aij components of combined complex mass-aerodynamic matrix used in linear U-g method
A ij extensional modulus components
AR aspect ratio 2/c
[,4(r,a)], [ (r,e)] aerodynamic matrices resulting from harmonicbalance applied to stiffness and damping termsof nonlinear ONERA equation (3-64)
xv

(r a) (r,e)4ij , mij
b
bim
c
C(k)
CD, CL, CM
Cub
CLa
CL2D
CL3D
CM2D
CM 3 D
Cz
Czs
CZ1
components of aerodynamic matrices resultingfrom harmonic balance applied to ONERAequation (3-64)
Femi-chord c/2
power series summation in Fourier analysis ofthe nonlinear aerodynamics, equation (3-84)
coefficients of i-th torsional mode shape
extensional-flexural coupling moduluscomponents
chord length
Theodorsen function
drag, lift, and moment coefficients
profile drag coefficientdCLe
slope of linear lift coefficient -
2-dimensional lift coefficient
3-dimensional lift coefficient
2-dimensional moment coefficient
3-dimensional moment coefficient
general aerodynamic force coefficient
static, linear component of general aerodynamicforce coefficient
static general aerodynamic force coefficient
total linear contribution to the generalaerodynamic force coefficient
xvi

nonlinear contribution to the generalaerodynamic force coefficient
linear, circulatory contribution to the generalaerodynamic force coefficient
Czo' CZs, Czc
Czlo' Czls' Czlc
Cz2o' Cz2sm Cz2cn
(Cp) (p) C()qCo20, 2sm, z2cn
Cz', Czs, CzC
e
eo , el
E
EL
mean, sine, and cosine components of the generalaerodynamic force coefficient
mean, sine, and cosine components of the totallinear contribution to the general aerodynamicforce coefficient
mean, sine, and cosine components of thenon-linear contribution to the generalaerodynamic force coefficient
mean, sine, and cosine components of thenon-linear contribution to the generalaerodynamic force coefficient, expressed in thephase shifted domain of p=kr+5
mean, sine, and cosine components of the linear,circulatory contribution to the generalaerodynamic force coefficient
flexural modulus components
phase lag of ONERA nonlinear aerodynamicdifferential equation (3-64)
parabolic coefficients of phase lag of ONERAnonlinear aerodynamic equation
phase lag of ONERA nonlinear aerodynamicdifferential equation (3-64), based only on meanlift deficit AO
longitudinal modulus
xvii
Cz2
Czr

EA
EAeA** ** **
EB2 ,EB 3 , EB4
EC 1
Eq**ECI
EI,
EIl
EI16
f
f, fj
F(k)
g
gj
GLT
GJx
G(k)
h
h
h0' h,, hC
transverse modulus
extensional stiffness
extensional/bending coupling stiffness
nonlinear stiffness terms, from Section 3.1.2
torsional warping stiffness
torsion/fore-&-aft coupling stiffness
out-of-plane bending stiffness
fore-&-aft bending stiffness
out-of-plane/torsion coupling stiffness
residual vector in Newton-Raphson scheme
cosh and sinh parameters of torsional modeshapes
real part of Theodorsen function
structural damping in linear U-g flutter method
cosine and sine parameters of torsional modeshapes
shear modulus
torsional stiffness
imaginary part of Theodorsen function
1/4-chord tip deflection
non-dimensional 1/4-chord deflection
mean, sine, and cosine components of the
non-dimensional 1/4-chord deflection
xviii

H.H.T
H.O.T.
ix
Ii, 12
Iij
Iim
[I']
Ji
k
kA
kvz
kVL' kM
[K
Kij
fp sty geoij ,I j ,Ke
torsion/fore-&-aft nonlinear coupling stiffnessterm due to m-th bending mode shape
abbreviation for "Higher Harmonic Terms"
abbreviation for "Higher Order Terms"
mass moment of inertia
modulus invariants
mode shape integrals corrected for spanwiseeffects, used in linear U-g flutter method
sinusoidal integrals in Fourier analysis of thenonlinear aerodynamics, equation (3-85)
diagonal matrix of squares of harmonicfrequencies in harmonic balance method
maximum power of the polynomial series for thei-th region of the aerodynamic force curve
reduced frequency _ ob/U
radius of gyration of cross section
second apparent mass coefficient
lift and moment second apparent masscoefficients
stiffness matrix
components of the stiffness matrix
flat plate, styrofoam, and geometric contribu-tions to the components of the stiffness matrix
semi-span, laminate length
xix

L 1, L 2, L 3, L4
Ls, Lc
L v, Lw
m
[M]
M1 , M2 , M 3, M4
Mij
Mfp sty geo
M9
M,
M;
M 0
n
nb, nt, nc, nf
Px
1i
qio, qis, qic
{%}, qs}, {c}
components of complex lift used in linear U-gflutter method
intermediate variables of the harmonic balanceapproximation applied to the ONERA lineardifferential equation
generalized forces in y and z directions
mass per unit area
mass matrix
components of complex moment used in linearU-g flutter method
components of the mass matrix
flat plate, styrofoam, and geometric contribu-tions to the components of the mass matrix
bending moment resultant about axis
bending moment resultant about axis
generalized applied moment about x axis
number of mode shapes
number of bending, torsion, chordwise bending,and fore-&-aft mode shapes
warp term in strain energy equation
i-th modal amplitude
mean, sine, and cosine components of the i-thmodal amplitude
vectors of the means, sines, and cosines of themodal amplitudes
xx

frequency domain modal amplitude, used forfree vibration analysis and linear flutter analysis
i-th modal force
Qio Qis, Qic
{Qo), QS, QC}
Qj(0)
Q ij
ro , r1
R
mean, sine, and cosine components of the i-thmodal force
vectors of the means, sines, and cosines of themodal forces
unidirectional modulus components
rotated modulus components
stiffness term of ONERA nonlinear aerodynamicdifferential equation (3-64)
parabolic coefficients of stiffness term of ONERAnonlinear aerodynamic equation
stiffness term of ONERA nonlinear aerodynamicdifferential equation (3-64), based only on meanlift deficit AO
Rmnij torsion/torsion nonlinear coupling stiffness termdue to m-th and n-th bending mode shapes
R 1, R 2
sz
modulus invariants
first apparent mass coefficient
lift and moment first apparent mass coefficientsSL, SM
Sx twisting moment in strain energy equationarising from shear stress
real time
thickness of graphite/epoxy flat plate
t
tfp
q
xxi

tmax maximum thickness of styrofoam NACA airfoilshape
T kinetic energy
Tx twisting moment in strain energy equationarising from logitudinal stress
U strain energy
U free stream velocity
v fore-&-aft deflection
Vx axial force (tension) in the spanwise x-direction
w out-of-plane deflection
x spanwise cartesian coordinate
x state vector in Newton-Raphson scheme
x sty spanwise location at which styrofoam fairingstarts
y chordwise cartesian coordinate
z out-of-plane cartesian coordinate
Zk distance from mid-plane to upper surface of k-thply
Z complex eigenvalue of linear U-g flutter equation
a effective angle-of-attack
ao aS, ac mean, sine, and cosine components of theeffective angle-of-attack
a c angle-of-attack corrected for 3-dimensionalfinite span effects

ai
a L, aM
CaR
av
a,
v wYi , Yi
ACz
ACzvlI ACzv2
XX'' £X,'
£x4 , xic
angle delineating the beginning of the i-th
polynomial region of the approximation to the
aerodynamic force curve
sinh and sine coefficients of the j-th beambending mode shape
lift and moment phase lags of ONERA linear
aerodynamic differential equation
root angle-of-attack, same as OR
oscillatory amplitude of the effectiveangle-of-attack a 2 +a2
phase lag of the ONERA linear aerodynamicdifferential equation (3-63)
stall angle for single break point model
non-dimensional bending-torsion stiffness ratio
coefficients of nonlinearity of harmonicallybalanced, nonlinear ONERA equation
fore-&-aft and out-of-plane components of thei-th mode shape
deviation of the non-linear aerodynamic forcecurve from the linear approximation
first & second harmonic oscillatory amplitudes ofthe deviation of the non-linear aerodynamicforce curve from the linear approximation
parameter of j-th beam bending mode shapes
engineering strain components
xxiii

T1
go Os Oc
OR
XL' XM
VLT
pPj
PS
GXX 1111' XEl'
lx8 Iq
Oz
tL', 0 MGt G
through-the-thickness or out-of-plane directionin local coordinates
chordwise direction in local coordinates
ply angle referenced to free stream
instantaneous angle-of-attack
mean, sine, and cosine components of theinstantaneous angle-of-attack
root angle-of-attack, same as aR
warp function
lag of ONERA linear aerodynamic differentialequation (3-63)
lift and moment lags of ONERA linearaerodynamic differential equation
Poisson's ratio
phase of effective angle-of-attack tanl c
free stream density
parameter of j-th beam bending mode shape
styrofoam density
engineering stress
linear phase lag used in equation (3-63)
lift and monient linear phase lags
Utnon-dimensional time - b-b
xxiv

V Wpi , spanwise variations of fore-&-aft and
out-of-plane components of i-th mode shape
ViV(z) through-the-thickness variation the fore-&-aftcomponent of the i-th mode shape
wWi (y) chordwise variation the out-of-plane component
of the i-th mode shape
co real frequency
(Pi non-dimensional phase delineating the beginningof the i-th polynomial region of theapproximation to the aerodynamic force curve
xxv

xxvi

Chapter I
IntroductionThe analysis of aircraft flutter behavior is traditionally based
on small amplitude, linear theory, in regards to both structural and
aerodynamic modeling. However, if the wing is near the stall region,
a nonlinear stall flutter limit cycle may occur at a lower velocity than
linear theory would suggest. Moreover, near the divergence velocity,
large deflections producing angles of attack near the stall angle may
also trigger a flutter response. Since some current aircraft are
achieving high angle of attack for maneuvering, and since rotorcraft
may use long, highly-flexible blades for their rotors, it is of interest
to investigate both this nonlinear stall flutter behavior and this large
amplitude deflection behavior, and their transitions from linear
behavior. The development of advanced composite materials allows
the aircraft designer another parameter by which he might control
these new behaviors - his ability to control the anisotropy of
advanced composite materials through selective lamination makes
these materials attractive for aeroelastic tailoring.
The present research is part of a continuing investigation at the
Technology Laboratory for Advanced Composites at M.I.T. into the
aeroelastic flutter and divergence behavior of forward-swept,
graphite/epoxy composite wing aircraft. The specific objectives of
the current investigation are to explore experimentally and analyti-
cally the roles of nonlinear structures and nonlinear aerodynamics in
high angle-of-attack stall flutter of aeroelastically tailored wings,
while attempting to develop a nonlinear method of analysis that is
1

not overly computationally intensive, i.e. that is suitable for routine
aeroelastic analysis.
Chapter 2 describes some of the previous work and analytic
approaches used to grapple with the problem of stall flutter of com-
posite wings. This chapter includes a description of some of the
previous work at TELAC that has concentrated on the beneficial
effects of the bending-torsion coupling of composite wings, but that
has mostly been relegated to linear analysis. It also describes pre-
liminary work in the current investigation that sets up some of the
analytic models that have been chosen to approach the stall flutter
problem.
Chapter 3 describes the theory involved in the current work
that seeks to expand on and improve the efforts of the previous
investigations, described in Chapter 2. Analytically, it was endeav-
ored to more accurately model the nonlinearities over the prelimi-
nary investigation: aerodynamic nonlinearities were incorporated in
both the forcing terms and in the equations of motion; structural
nonlinearities were developed analytically from geometric consid-
erations.
Chapter 4 describes the experiments performed so as to cor-
roborate the theoretical analysis. As with the previous work, static
tests and vibration tests were employed to verify mass and stiffness
properties. Experimentally, the wings were designed so as to better
allow an investigation of the linear-to-nonlinear transition, while also
improving the Reynolds number range. The experimental procedure
was also modified so as to acquire more data on larger amplitude
flutter oscillation.

Chapters 5 and 6 detail the products of the theoretical and
experimental investigations, comparing the results of the two, with
concluding remarks on the significant contributions of the current
investigation and recommendations for further work.
3

4

Chapter IISummary of Previous Work
2.1 Dynamic Stall Models
Much work has been done in creating a large base of dynamic
stall experimental data for airfoils in sinusoidal pitch motion, from
which might be developed models to analytically reproduce their
behavior. The intent of this experimental work was to observe the
2-dimensional dynamic stalling behavior of various airfoils while
varying a large number of parameters - such as airfoil shape, mean
angle of attack, amplitude of oscillation of angle of attack, reduced
frequency, Mach number, Reynolds number, leading edge geometry,
et cetera. Initial work was done Liiva & Davenport [Ref. 11, with dis-
cussion of the effects of Mach number. Extensive work was done by
McAlister, Carr, & McCroskey [Ref. 21 in producing a data base for
the NACA 0012 airfoil, and extended by McCroskey, McAlister, Carr,
Pucci, Lambert, & Indergrand [Ref. 31 and by McAlister, Pucci,
McCroskey, & Carr [Refs. 4 and 51 to include other airfoil shapes and
a wider range in the variable parameters. The general conclusion of
these experiments was that the iprameters of the unsteady motion
itself appear to be more important than airfoil geometry - however,
most of these experiments were conducted for deep dynamic stall,
i.e. vortex-dominated cases. Light dynamic stall cases, which are less
severe and more common for practical applications, appear to
depend on all the parameters of the unsteady motion.
5

Coincidentally with these experiments, attempts were made to
identify the processes that make up the dynamic stall event. With
the aid of chordwise propagation of pressure waves Ref. 61, flow
visualization [Ref. 7 and 81, and data from hot-wire probes and
surface pressure transducers [Ref. 21, Carr, McAlister, & McCroskey
[Refs. 9 and 101 identified the characteristic processes illustrated in
Fig. I [Fig. 27 from Ref. 91. However, it should be noted that the
NACA 0012 airfoil exhibits trailing-edge stall - i.e. the dynamic stall
phenomenon originates from an initial boundary layer separation at
the trailing edge - while other airfoil shapes might exhibit leading-
edge or mixed stall behavior.
Because of the prevalence of dynamic stall in rotorcraft, where
the drop in dynamic pressure for a retreating blade might necessi-
tate angles of attack beyond the stall angle so as to maintain lift,
appropriate modeling of the dynamic stall phenomenon has been a
primary concern in helicopter design for over two decades. Research
in this area has followed two approaches, one theoretical [Refs. 11
to 30], and the other based on experimental data, also called semi-
empirical [Refs. 31 to 591]. These research efforts are well summa-
rized, and their advantages and disadvantages compared, in Refs. 10
and 60-65.
The theoretical approaches are the discrete potential vortex
approach, zonal methods, and Navier-Stokes calculations. The dis-
crete potential vortex approach [Refs. 11 to 17] ignores the viscous
terms in the fundamental equations and assumes potential flow
without the boundary layer. This type of model takes its cue from

(a) STATIC STALL ANGLE EXCEEDEE
(b) FIRST APPEARANCE OF FLOWREVERSAL ON SURFACE
(c) LARGE EDDIES APPEAR INBOUNDARY LAYER
(d) FLOW REVERSAL SPREADS OVERMUCH OF AIRFOIL CHORD
(e) VORTEX FORMS NEARLEADING EDGE
ir . - . e
- I I I I I
(k)
) L I Lurt IINLRKtH/At
C%$7And
U
zwI
U-r
I-0U
0 5 10 15 20 25
INCIDENCE, cx, deg
(g) MOMENT STALL OCCURS
(h) LIFT STALL BEGINS
(i) MAXIMUM NEGATIVE MOMENT
(j) FULL STALL
(k) BOUNDARY LAYER REATTACHESFRONT TO REAR
(I) RETURN TO UNSTALLED VALUES
Fig. 1 Dynamic Stall Events on NACA 0012 Airfoil
7
zU
Ow0LA.
-o0z
__
1-11.11
11I

the discrete vortex model that has been applied to bluff body sepa-
ration - the viscous part of the flow is taken into account by the
generation and transport off the leading and trailing edges of dis-
crete combined vortices, governed by semi-empirical or boundary
layer considerations. Zonal methods IRefs. 18 to 231 model sepa-
rately the viscous, nonviscous, and transition regions of the flow,
under the assumption that the viscous region usually remains rela-
tively thin. The limitations and approximations of the discrete vor-
tex and zonal methods can, in principle, be avoided by solving the
full Navier-Stokes equations [Refs. 24 to 301. However, turbulence
must be modeled - many solutions incorporate the so-called
Reynolds-averaged, Navier-Stokes equations so that the Reynolds
stress, which vanishes in laminar flow, can be modeled in the turbu-
lent case.
These three theoretical models are computationally intensive
and are limited by the approximations and restrictions of their for-
mulations, thus usually making them unsuitable for routine aero-
elastic analysis.
The semi-empirical methods attempt to use static data with
corrections for the dynamic nature of the dynamic stall event,
choosing to model only the gross characteristics of the phenomenon
while ignoring the fine details of the fluid flow. This is advantageous
because the static data already takes into account the effects of
Reynolds number, Mach number, and airfoil shapes, and because the
methods are therefore not as computationally intensive as the theo-
retical methods, thus making them more suitable for routine aero-
elastic analysis. These semi-empirical methods are the Boeing-Vertol

gamma function method, the UTRC or UARL method, the MIT Method,
the Lockheed method, time-delay methods, and the ONERA method.
The Boeing-Vertol gamma function method [Refs. 31 to 33]
uses a corrected angle of attack - calculated as a function of the rate
of change of the angle of attack - when the angle exceeds the static
stall angle, based on y, the essential empirical function of airfoil
geometry and Mach number. The UTRC or UARL a, A, B method
[Refs. 34 to 361, developed at United Technologies Research Center,
is a table-lookup correlation method based on a 3-dimensional array
of measured data (angle of attack, reduced pitch rate, reduced pitch
acceleration), and therefore requires a large amount of data storage
for each airfoil, frequency of oscillation, and the associated interpo-
lation. Recent advances have been made on the UTRC method
[Refs. 37 to 39] to reduce these large volumes of data into compact
expressions (synthesization). The MIT method [Refs. 40 and 41],
like the Boeing-Vertol method, corrects the angle of attack as a func-
tion of its rate, but empirically represents the forces due to the vor-
tex shedding phenomenon for ramp changes in angle of attack, such
that they increase linearly to the peak CL and CM values observed
from ramp experiments. The Lockheed method [Refs. 42 to 45] is a
combined analytical and empirical modeling that incorporates phase-
lag time constants and pitch-rate-dependent, stall-angle delay
increments into an effective angle of attack, together with a number
of separate dynamic stall elements - based on analogy to other
dynamic and/or turbulent flow phenomenon - to construct the aero-
dynamic forces. Time delay methods [Refs. 46 to 48] assume that
9

each dynamic stall event is governed by a universal, dimensionless
time constant, regardless of the time history of the motion.
Finally, the ONERA method [Refs. 49 to 55], developed by
Tran, Petot, & Dat of Office National d'Etudes et de Recherches
Aerospatiales, uses a second-order differential equation with non-
constant coefficients to model the deviation of the dynamic stall
behavior from that of the theoretical linear behavior, with a fixed-
time stall delay, A (usually 5 or 10). The parameters/coefficients of
the differential equations are derived empirically, usually from small
amplitude-of-oscillation experiments, and are meant to reflect the
frequency and damping of the dynamic stall processes. Petot &
Loiseau [Ref. 511 indicate how the ONERA method might be adapted
for Reynolds numbers below the critical Re value. Petot [Ref. 521
demonstrates how the coefficients of the differential equations might
be derived from a few large-amplitude-of-oscillation cases, instead
of a large number of small-amplitude-of-oscillation cases, thus taking
advantage of a smaller data base of such types of experiments.
McAlister, Lambert, & Petot [Ref. 53] demonstrate a systematic pro-
cedure for determining the empiric parameters, approaching the
problem from an engineering point of view. Petot & Dat [Ref. 54]
reformulate the differential equations so that they reduce to the
Theodorsen and Kussner functions in the case of a flat plate in the
linear domain.
Some work has been done to extend these empirical methods
from purely sinusoidal pitching motion to pitch & plunge motion
[Refs. 55 to 59]. In particular, Peters [Ref. 55] and Rogers [Ref. 56]
present physical arguments for the manner in which the pitching and

plunging motions should be separated in the ONERA differential
equations. In general, these empirical methods are employed is
some type of stripwise theoretical fashion, since little experimental
or analytical work has been done on the 3-dimensional effects of
dynamic stall.
2.2 Structural Models
For a flutter analysis, it is first necessary to correctly describe
the linear structural equations of motion of the wing. In general, this
entails accurately modeling the linear frequencies and mode shapes,
since linear flutter usually involves the coalescence of modes, while
nonlinear stall flutter usually involves single degree-of-freedom
behavior.
The modeling of bending and torsion modes for uniform beams
and plates is already well established [Refs. 66 and 67]. However,
for plates which are uniform along the span but anisotropic in
nature, the analytic tools have only recently been developed because
of the relative newness of composite materials. Crawley, Dugundji, &
Jensen [Refs. 68 to 71] have set up the appropriate equations of
motion and have determined the types and number of modes to
accurately evaluate the natural frequencies and mode shapes of
composite plates.
Several approaches have been taken to account for the geo-
metric, structural nonlinearities that can become important for
aeroelastic analysis with large deflections. Some work has been done
using the Finite Element method with application to rotor blades
[Refs. 72 and 73]. Dugundji & Minguet [Ref. 74] have developed a
1

model based on Euler angles which can account for arbitrarily large
deflections, and in which the equations of motion are solved by a
Finite Difference scheme.
However, many of the approaches for long, flexible blades
involve ordering schemes, which rely on being able to identify non-
linear terms of various orders, and truncating the equations of
motion accordingly [Refs. 75 to 771. Such a formulation, by Hodges
& Dowell IRef. 75], can be implemented for an analysis where it is
assumed that out-of-plane bending is moderate in amplitude, while
torsion and fore-&-aft bending are relatively small. This model
derives the equations of motion by Hamilton's principle for long,
straight, slender, homogeneous, isotropic beams, and is valid to
second order. Its ordering scheme assumes that the squares of the
bending slopes, the torsion deformation, and the chord/radius and
thickness/radius ratios are negligible with respect to unity. The
equations can also be converted into a modal formulation, as has
been done by Boyd [Ref. 78]. However, little work has been done to
modify these nonlinear structural equations to account for the
anisotropy of composite materials.
Other nonlinear work, such as that by Tseng & Dugundji
[Refs. 79 and 80], has noted the often encountered, cubic stiffening
phenomenon of many nonlinear, structural vibration problems.
2.3 Stall Flutter Analysis
The characteristics of - and factors affecting - stall flutter
have been identified in early work by Halfman, Johnson, & Haley
[Ref. 81] and by Rainey [Refs. 82 and 83]: (i) there is a sharp drop

in the critical flutter speed, (ii) the flutter frequency rises toward the
torsional frequency, and (iii) the motion is predominantly torsional,
i.e. single degree of freedom flutter. These characteristics are quite
distinct from those of classical linear flutter where the unsteady
instability is generated from the coalescence of bending and torsion
modes and frequencies. Additional experimental work has been
done by Dugundji, et al. [Refs. 84 and 85] to investigate the
2-dimensional, large-amplitude, stall flutter behavior of a flat plate
with a linear torsional spring.
Weisshaar, et al. [Refs. 86 to 89] have concentrated on the
aeroelastic advantages of using composite materials. This work has
investigated the parameters of layup, sweep, taper, aspect ratio, etc.
for such applications as flutter & divergence suppression, lift effec-
tiveness, control effectiveness, and mode shape & frequency tailor-
ing. In general, the models used were 2D strip theory for aerody-
namics, and a comparison of high aspect ratio plate, chordwise rigid,
and laminated tube models for structures.
Recent work at M.I.T. by Dugundji, et al. [Refs. 90 to 92] has
concentrated on taking advantage of bending-torsion coupling for
flutter modeling. These investigations at the Technology Laboratory
for Advanced Composites (TELAC) looked at the aeroelastic flutter
and divergence behavior of cantilevered, unswept and swept,
graphite/epoxy wings in a small, low-speed wind tunnel. The wings
were six-ply, graphite/epoxy plates with strong bending-torsion
coupling. Experiments were conducted to determine the flutter
boundaries of these wings both at low and high angles of attack, stall
flutter often being observed in the latter. Hollowell & Dugundji
13

[Ref. 90] presented the first of these aeroelastic investigations, with
linear structures and V-g linear flutter analysis applied as strip
theory. Selby [Ref. 91] extended this same aeroelastic analysis by
applying a doublet lattice aerodynamic model. Landsberger &
Dugundji [Ref. 92] further extended this analysis to include wing
sweep, with the 3D Weissinger L-method for steady aerodynamics.
The divergence and flutter results at low angles of attack correlated
well with linear, unsteady theory, indicating some beneficial effects
of ply orientation in aeroelastic behavior. Steady, nonlinear aerody-
namics correlated reasonably before the onset of flutter, but none of
these previous analyses attempted to tackle the nonlinearities that
occurred due to dynamic stalling and large amplitude deflections.
Harmonic balance methods have been used as a means to
approach such nonlinear problems [Ref. 93]. While these methods
do not model the fine details of the nonlinear motion, as would time
marching schemes, they are suitable for describing the gross aspects
of the solution if the nonlinearity is sufficiently moderate. Therefore,
they seem particularly suited to stall flutter analyses, since most of
the semi-empirical aerodynamic models likewise choose to ignore the
fine details of the fluid flow.
Most recently the work at M.I.T. has been extended by Dunn &
Dugundji [Refs. 94 and 95] to investigate the nonlinearities in the
flutter behavior of composite wings - this constituted a preliminary
effort toward the current investigation. The ONERA, semi-empirical,
aerodynamic model was applied in a 2D stripwise fashion, with
empirical corrections for Reynolds number and 3D effects. However,
the aerodynamic nonlinearities were modeled in the aerodynamic

forcing terms only, i.e. the nonlinear effects on the natural frequency
and damping of the stalled behavior were not modeled in a time
varying fashion and would therefore break down for large ampli-
tudes of oscillation. The structural model was linear, with empirical
corrections for cubic stiffening, and the combined equations of
motion were reduced algebraically by a harmonic balance method.
Corresponding to this analytic work, experimental work was
conducted to verify these analytic models. Experimental static tests
and vibration tests were conducted to verify the mass and stiffness
properties of the wings. Small-amplitude flutter experiments were
conducted to corroborate the analytic flutter model. However, the
linear flutter velocity of the wings was above the wind tunnel veloc-
ity, precluding experimental investigation of transition from pure
linear to stalled, nonlinear behavior. Also, while the analytic model
existed to investigaste larger amplitude flutter oscillation, little of
such data was taken experimentally.
The principal contributions of this preceding work were the
reduction by harmonic balance and Fourier analysis of some of the
parameters of the nonlinear ONERA equations; the analytic investi-
gation of some of the single degree of freedom, stall flutter phenom-
ena; and the preliminary development of an experimental base of
data for stall flutter of composite wings. However, this initial work
fails to incorporate any analytic, structural nonlinearities; ignores
some of the salient features of the ONERA equations in its application
of the harmonic balance method; and requires further accumulation
of large amplitude of oscillation data.
15

16

Chapter III
Theory3.1 Structural Model
3.1.1 Anisotropic Plate Modulus Components
The flexural modulus components of a laminated,
graphite/epoxy plate depends on both the fiber orientations and
stacking sequence of the individual plies. Only laminated plates with
mid-plane symmetric stacking sequences were constructed in this
study. The ply angles (0) follow the sign convention in Fig. 2.
The in-plane, unidirectional modulus components Qij were
obtained from the orthotropic engineering constants for Hercules
AS4/3501-6 graphite/epoxy, from which the test specimens were
fabricated. These engineering constants take on different values
depending on whether they are obtained from out-of-plane bending
or in-plane stretching tests. Engineering constants obtained from
each type of test appear in Appendix A, and the out-of-plane values
were used in the current analysis because in-plane stretching was
assumed to be negligible. The Qij terms are defined in terms of the
engineering constants as,
EL(3-1) Q
Q- 1 - vLTVTL
(3-2) Q -22 = 1 - LTVTL
17

rip
Root
railing edge
eading edge
Fig. 2 Sign convention for ply angles and axes
18
X
Xt+-
U
y
I I llU-
-

VLTEL
1 - VLTVTL
Q66 = GLT
ETVTL EL VLT
The in-plane, rotated modulus components were obtained by
first defining a set of invariants,
I1 = [Qll + Q22 + 2Q12 ]
1
I2 = 8 [Q11 + Q2 2 - 2Q 12+ 4Q6 6 ]
1
R1 =2[Qll-Q22 ]
1R2 =8 [Q1 ll + 22- 2Q1 2 - 4Q66 ]
The invariants are transformed to the rotated modulus
nents using the relations,
Q11 = I1 + I2 + R1cos20
(20) = I + 12 -Rlcos2
+ R2cos4O
+ R2cos4O
Q(12 = I1 - I2 - R2 cs4O
QI2 = Q21(3-3)
(3-4)
where,
(3-5)
(3-6)
(3-7)
(3-8)
(3-9)
compo-
(3-10)
(3-11)
(3-12)
19

Q6) = 12 - R2cos4O
Q() = Rlsin20 + R2sin4O
Q0) 2 Rlsin2O - R2sin4O
where 0 is the ply angle.
The flexural modulus components, Dij, for an n-ply laminate
with arbitrary ply angle orientation are obtained from,
n
A= EQ()(k -Zk1)k=l I
= 2 2Bij = Q( k -
k=l
n QO3 _ Zk3
kDij Q!zk 3- k=1
i,j = 1,2,6
i,j = 1,2,6
i,j = 1,2,6
where,
Ok = ply angle of the k-th ply
Zk = distance from the mid-plane to the upper surface of thek-th ply (positive above mid-plane, negative belowmid-plane)
Zk 1I = distance from the mid-plane to the lower surface of thek-th ply
(3-13)
(3-14)
(3-15)
(3-16)
(3-17)
(3-18)

3.1.2 Equations of Motion with Geometric Nonlinearities
The equations of motion for a cantilevered beam are obtained
from Hamilton's principle. This representation can include spanwise
variations in mass and stiffness properties. The usual expression for
strain energy - in local coordinates x spanwise, chordwise, and
out-of-plane (see Fig. 3, taken from Hodge & Dowell [Ref. 13])- in
terms of engineering stresses and strains is,
(3-1F9) U = i(oxx£xx al, +one u sets + x + C + )dV
For an isotropic material, one usually sets enn = £x = n = O for
beam theory. For an anisotropic material, however, it is usually nec-
essary for consistency to instead set ao, = o = 0xi = = since the
relations o011 = Ee lln, etc. no longer hold - and then condense the
stress strain relationships so that enn, xC, and E in are eliminated. For
the current investigation, this more exact procedure of condensation
has been avoided, although all the relations that will be derived are
still valid, simply with condensed values (D1 1, etc.) replacing non-
condensed values (D 1 etc.) as in Ref. 74. After having eliminated
1 nn, ExC, and end, whether by condensation or by setting to zero, the
first variation of the strain energy is given by,
(3-20) +O& ) dV(320U = 2-l(xxExx + Ox SEx)dV
The strain components, after having been reduced to second
order by the appropriate ordering scheme, are as given by Hodges &
Dowell [Ref. 75],
21

v-
YTI
x
VI,
z
y
Mx
x
coordinates and stress & moment resultantsFig. 3 Local
22
U'rCY,--4
· CI'4
ZI,2·�.
-4

v,2 w,2 e2(3-21) xx - 2 2 + ( 2+2) 2 - " - [in cos 0 - sin 0] v"
- [I sin 0 + cos 0] w"
(3-22)t el
For a thin plate the warping function can be approximated by,
k= N 2+ 2 = i, and therefore the strain components can be approx-
imated by,
v '2 2 0' 2
(3-23) Cx = 2 2 + (1 2+rl-- - [ cos - sin 0] v"
- [ra sin 0 + cos 0] w"
(3-24) ex = -2C0'
Taking the variational of the strain components gives,
(3-25) 8X = v'8v' + w'6w' + (112+2)6'80 ' -_ n80"
- [ cos 0 - sin 0] (v" + w"80)
- [ sin 0 + cos 0] (w" - v"80)
(3-26) 68x = -2C68'
Substituting the expressions for the variational of the strain
components, 68ex and 8eTI, into the equation for the strain energy
variation, U, we get an expression in terms of the stress and
moment resultants (see Fig. 3),
23

(3-27) 8U= {Vx(v'8v' + w'Bw') + (S + Tx)80' + Px0o"
+ [MC cos 0 + M, sin 0] (v"+w"80)
+ [M; sin 0 - M cos 0] (8w"-v"80)}dx
where the stress and moment resultants are defined as,
(3-28) V Joxd dc I(Q( + Q d k
(3-29) Sx - ;j-2aOxq d d = f-2(Qk 6 )ex + Q()e )
(3-30) Tx - f0' xx(rn2+C2)dl d;
- fI( 2 +52 )0(Qk)£exx + Q)£xQ) d dlk
(3-31) Px f-iC cx d d = |JX- (Q(x)xx + Q(kd)£x) d dk
(3-32) M, f ;xx d = ICf (Q(k)cxx+ Q(kxn) dC dik
(3-33) MC f-i-| rxxd7l d = fI-i(Q? £x + Q16 x
From equations (3-27), (3-29), and (3-30) one can see that S
and T are respectively the shear and longitudinal stress contribu-
tions to the twisting moment resultant, i.e. MX = S + Tx. Also, from
equations (3-27) and (3-31) one can see that P is the torsional
warping term in the strain energy equation. Finally, note that the
axial stress and moment resultants use the subscript x instead of as
24

in Fig. 3, because the deflections are only moderate and so they are
almost equal, i.e. V = V, et cetera.
Substituting the previous nonlinear values for xx and ex1 and
the evaluation of the integrals through the thickness by the appro-
priate flexural stiffness values, we get,
Vx =EA 2 + kA2 - eA[w"cosO - v"sin0]l
- EB *0'
Sx = GJXO' + E116(w"coso - v"sin0)
- EB (2+ 2 EB**e+
2 W'2 _ T = EAkA0 + - EB2* 0'(w"cosO - v"sin0)
X A 2 2) 2
- EB*02
(3-37)
(3-38)
(3-39)
where the
(3-40)
Px = EC1O" + EC**(v"cos + w"sin0)
M = EI (v"sinO - w"cose) - EI 160'
+ EAe 2 + 2 +EB2 Ae2 2 2
M< = EI(v"cosO + w"sin0) + EC 10"
stiffness properties are defined as,
EA = fyfQf) dr = cA 11k
(3-34)
(3-35)
(3-36)
25

EAeA= |Q['( ) d dl = cB1, k
El = xIfC2qk()dC dn = cDl 1k
EIl f" 2 (k)d di d = -Ak
EC4* = I 2 qk)k
d3
d d = Bi
EC = 1f,2 22(k) d dk
C3
= D11
EAk2 = fJ( 2 + 2)q(k) d dik
c3
=12 11 + cD
EB2* = ff(1n 2 + 2)Q(kk
c3
d d = Bll + C,k
r 3 Q(k) dSIll
GJ = | (26)2 Q k ) dC dqk
EI 16 = ff2 2Q (6k)dk
di = 2cD1 6
EB3 = 12 Q1(k )6 di dq = 2cB 16k
(3-41)
(3-42)
(3-43)
(3-44)
(3-45)
(3-46)
(3-47)
(3-48) = 4cD66
(3-49)
(3-50)
26

(3-51) EB4* = f1J2(11 2 + 2)q(k) d dlk
= 2[12B6 + C I3Qk6) d]k
It should be noted here the differences between the above
formulation and that derived by Hodges & Dowell [Ref. 75]. Firstly,
the derivation and values for EA, EAk 2 , E EI, E;, GJx, and ECI are the
same. Secondly, the derivation and values for EAeA , EB2 *, and ECI1
are not the same as for EAeA, EB2, and EC1 in Ref. 75 - but they are
of the same form because the constants in the first set are derived
from the asymmetry in stiffness in the through-the-thickness
C-direction, in fashion similar to that in which the constants in the
second set are derived from the asymmetry in geometry in the
chordwise -direction. Lastly, the EI16, EB3, and EB4* are new con
stants, not appearing in the Hodges & Dowell formulation, that result
from the bending-shear coupling from the stacking sequence of an
anisotropic material.
For a symmetric layup such as those considered in this investi-
gation, EAeA, EB*, EC , EB, and EB are all zero. Also, there is no
spanwise loading in the x-direction, so Vx is constant along the span,
which indicates that V=0 from the root cantilevered conditions.
Incorporating the easily-derived kinetic energy and generalized
force terms, and applying integration by parts, yields,
(3-52) [Mcsin - Mcos0]" + mw = Lw
(3-53) [Mccos + Msin0]" + mv = Lv
27

(3 -54) P-x (Sx+Tx)' - v"[M sin - Mlcos0]
+ w"[Mcose + Mlsin0] + ixO = MO
Substituting in the previously derived stress and moment
resultants gives,
(3-55) [(EIcos 2 0 + EIsin 2e) w" + (EI-EI)cos0 sin v"
+ El 16 0' cose] + mw= Lw
(3-56) [(El;cos2 0 + EInlsin2 0)v" + (EI;-EI,)cos0 sinO w"
- E116 0' sin0] + m =Lv
(3-57) EAk 2 + )] -(4cD 660')' + (EC10")"
+ (EI -EIl)[(w" 2 -v" 2 ) cosO sinO + v"w" cos2e]
-[E 1 6(w"cosO-v"sin0)]'
- EI 16 0'(v"cos0+w"sin0 ) + ixO = Me
Assume first a small amplitude vibration problem around a
mean deflection. Now also assume an ordering scheme such that the
mean out-of-plane deflection is moderate, while the torsion and fore-
&-aft mean deflections are very small - i.e. that w=W+wi, v=V+V, and
0=e+0, where the overbar indicates mean and the tilde indicates
small deviation, and W/e=O(1), Ve=O(e), and =O(e). With these
assumptions, and dropping the tildes to indicate small deviation, the
linearized form of the above equations is,
28

(3-58) EIlwiv + El 60"' + mw = Lw
(3-59) EIviV + (EI-EI)(w"e)" + mv = Lv
(3-60) -GJxO" + ECOiV + (EI-EI)(w" 2 0+v"w") - EI16w"' + i= M
Note first that, again because V is zero, the first term from
equation (3-57) - involving v'2 and w'2 - drops out. This is because,
as can be seen from equation (3-34), if V=0 and the layup is sym-
metric then the first term in equation (3-57) becomes -EAk4 0' 3,
which drops out as a higher order term. Note also that equations
(3-58) to (3-60) involve only the dynamic, small deviation terms of
equations (3-55) to (3-57) - another three equations, similar in form
but without the mass terms, also result so as to describe the mean
deflections.
3.2 Aerodynamic Model
3.2.1 The ONERA Aerodynamic Model
The aerodynamic model used for this study was initially devel-
oped at Office National d'Etudes et de Recherches Aerospatiales by
Tran & Petot [Ref. 49] and by Dat & Tran [Ref. 50]. This ONERA
model is a semi-empirical, unsteady, nonlinear model which uses
quasi-linear, small amplitude of oscillation, experimental data to
predict aerodynamic forces on an oscillating airfoil which experiences
dynamic stall. The model incorporates a single lag term operating on
the linear part of the airfoil's static force curve, thus analogous to the
Theodorsen function for linear theory, and a two lag term operating
29

on the nonlinear (i.e. stalling) portion of the airfoil's static force
curve.
The ONERA model was later investigated by Peters [Ref. 55]
who differentiated the roles of angle of attack due to pitching () and
angle of attack due to plunging (h/U). The final form of the ONERA
model used for this study incorporates all terms needed such that it
fits the theoretical Theodorsen and Kussner coefficients within the
linear domain of operation [Ref. 54],
(3-61) Cz =Czl + Cz2
(3-62) Czl = sza + kvz 0 + Czy
(3 -63) , + X Cz = z + aoza +
** * aAC(3-64) Cz2 + aCz2 + rCz2 = - rACI -e
where the effective angle of attack and time derivative are,
*
(3-65) a =0 -* () Ut(3-66) (( ) ; t b
and,
0 = instantaneous angle of attack
h = instantaneous deflection of 1/4-chordh
h b = non-dimensional deflection
a = effective angle of attack
30

D
extension of linearstatic curve, C e \
ACz
)n-linearatic curve
a
Fig. 4 Description of static curve
31
Czs()

Note first that in equation (3-64) both forms of notation for the
non-dimensional time derivative have been used, /atr and (*) this
is only a matter of convenience of notation since it is awkward to use
the (*) notation over AC,, and there is in fact no difference in the two
time derivatives used on both sides of equation (3-64).
C z represents any of the three relevant non-dimensional force
coefficients: CL, the coefficient of lift, or CD, the coefficient of drag, or
CM, the moment coefficient. aoz is the slope of the linear part of the
static force curve, A C is the nonlinear deviation from the extended
linear force curve, and sz, kz, )z' Cz, Cz, a, r, and e are the coefficients
associated with the appropriate force coefficient, determined empiri-
cally by parameter identification. These force coefficients are listed
in Appendix D.
Equations (3-62) and (3-63) describes that part of the force
coefficient associated with the linear model C 1, and are similar in
form to the description of unsteady, linear theory with a first order
lag for the Theodorsen function. Czy is the linear circulatory contri-
bution, while Cz1 is the total linear contribution, also incorporating
the apparent mass terms. Equation (3-64) describes that part of the
force coefficient associated with the nonlinear model Cz2, and is
dependent on the deviation of the actual static curve from the linear
static curve, ACz, as shown in Fig. 4. It also includes a second order
lag for Cz2. Equation (3-61) combines these linear and nonlinear
terms of the force coefficient into the total coefficient C .
For implementation of the ONERA aerodynamic model, it is nec-
essary to describe the static aerodynamic force curves in terms of
the linear domain, described by the linear slope aoz, and the non-
32

linear domain, described by the deviation from the linear curve ACz.
The deviation ACz is defined as positive for a decrease in the aerody-
namic force, as shown in Fig. 4. The general description of the static
aerodynamic force curve is then given by,
(3 -67) Czs(a) = aozc - ACz(a)
where,
dCze(3-68) aoz d = linear aerodynamic force slope
In general, the deviation A C z can be described in any manner
desired. In the current study, the deviation A C was described by
simple straight line fits between discrete points (see Appendix C).
More generally, the ACz could be described by polynomials in several
regions of the aerodynamic force curve. Polynomials of order Ji are
used for ease of algebraic manipulations in the Fourier analysis,
described later in Section 3.2.2.
The general formula for the deviation ACz in the i-th region can
then be expressed as,
J.
(3-69) ACz(a) = aij(a - i)J ; ai < ai+ 1j=o
where,
(3-70) a 0 - ACz(i)
(3-71 ) AC(a=al) - 0
33

Equation (3-68) ensures that the description of the aerody-
namic force curve is continuous at the juncture of the describing
domains. Equation (3-69) ensures that the deviation AC Z is identi-
cally zero in the linear region before stall. The description of the
aerodynamic force coefficients used in the current study is more
fully described in Appendix C.
3.2.2 Fourier Analysis of Nonlinear Aerodynamic Forcing Terms
For later use in the Harmonic Balance Method, it is necessary to
be able to evaluate the lowest order frequency components of the
nonlinear aerodynamic force coefficients when given a harmonic
input. First, harmonic motion is assumed for the angle of attack and
the non-dimensional, 1/4-chord deflection,
(3-72) 0(T) = 0 + ssin(k:) + Occos(kt)
(3-73) h(x) = ho + hssin(kt) + hccos(kt)
where,
cobk = reduced frequency = U
Ut= non-dimensional time =Ut
b
The effective angle of attack, a, which combines both the
instantaneous angle of attack and the angle of attack due to the
velocity of the 1/4-chord deflection, is given by,
(3-74) a(r) = ao + assin(k:) + accos(kr)
34

where equation (3-65) gives,
a0 = 0
as = 0s + kic
(3-77) a c = 0C - khS
Manipulations of the formulas are further simplified if the
angle of attack is put in the form where it is purely sinusoidal,
ca() = ao + avsin(k+ {) = a + avsin(p
a = a + a 2= tnS C
= tan-1 c
(3-81)
Next, assume harmonic motion for ACz as well,
ACz(X) = ACzo + ACzvl sin(p + ACzv2cos2(p + H.H.T
Note that equation (3-82) contains no cosgp and sin2(p terms, i.e.
no out-of-phase terms. This is because A C z is a direct function of
angle of attack a only - that is, ACz=AC(a) and ACz;ACz(a,t,) - without
any lag terms, so the two are always in phase. If, however, a time
dependence were added as well, for instance from a fixed-time stall
35
(3-75)
(3-76)
(3-78)
where,
(3-79)
(3-80)
(3-82)

delay A, then there might be additional out-of-phase terms.
Substituting equation (3-78) into equation (3-69) and carrying out
the Fourier expansion yields,
(3-83)1 Ji
ACzo =r bimli mi m=O
where the bim's are the j-dependent terms, and the lim's are the
j-independent terms, i.e. dependent or independent of the power of
the describing polynomial. These terms are given by,
(3-84) bijm 'aij (ia v -aj -mibim = X()aij°v, 9J v Ij~~rn aV
v°i+l
Iim = sinm(p dip =(Pi
-sinm - lpcosp i+ m- m m i,m-2
(Pi
where the limits of integration are given by transforming the region
limits into the phase domain,
sin- 1 i aoi-
+/2 if ao+a <ai i.e.
-X/2 if ao-av>ai i.e.
ai-ao>av
cai-ao<-av
and where the binomial coefficients are defined as,
(3-87) (m =m! (j-m)!
36
(3-85)
(3-86)

The first two values required for the recursive formula in
equation (3-85) are given by,
'Pi+l
(3-88) lio= Jdqp = (P+l 9i
(3-89) Ii = fsin(pd(p = cosqpi - cosqi+ 1Pi
Similarly, using the same calculated bij and Iij values, the first
and second harmonic terms are given by,
2 Ji(3-90) AC Y bimim+1
i m=0
(3-91) ACZv2 = Z bim(Ii,m - 2 Iim+2)i m=0
It is unnecessary to also carry out the full Fourier analysis for
the time derivative of AC z because of the mathematical identity that
the Fourier expansion of the derivative of a function is equal to the
derivative of the Fourier expansion. Hence, equation (3-82) gives,
aAC(3-92) a = -kACzvlcos(kx) + 2kACzv2sin(2kt) + H.H.T.
where ACzvl and ACzv2 are again given by equations (3-90) and
(3-91). Simple examples for a force curve with only one and two
break points are given in Appendix E.
37

3.2.3 Harmonic Balance Applied to ONERA Model
The harmonic balance method as applied to solving equation
(3-64) begins by first assuming an infinite harmonic expansion for
ACz, as is given by equation (3-82). It is also assumed that Cz2 can be
expressed as an infinite harmonic series in the phase-shifted domain,
i.e. in terms of p=kr+4 instead of k - this is more convenient since
the expression for ACZ is more simple in the phase-shifted domain,
(3 93) C 2C + X C (2)msin(mp) + Cz2c np)m n
As noted in previous studies [Ref. 53], it is most convenient to
describe the nonlinear aerodynamic coefficients, a, r, & e, in terms of
polynomial expressions in the lift deficit coefficient, ACL. For a sym-
metric wing, the expression should be symmetric about A CL=O,
therefore a polynomial in even powers only, and it has generally
been found that a simple parabolic is sufficient to describe these
coefficients.
(3-94) a = a + alACL
(3-95) r = r + r lAC L
(3-96) e = eo + elACL
Substituting the harmonic series for ACL from equation (3-82)
into the above equations yields expressions for a, r, & e in terms of
the products of harmonic series, instead of constant coefficients.
38

Substituting these harmonic expressions for a, r, & e, along with the
harmonic series for ACz and Cz2 , from equations (3-82) and (3-93),
into the unsteady, stalled ONERA equation (3-64), and then applying
the trigonometric product identities,
1sin(x) sin(y) = 2(cos(x-y) - cos(x+y))
1cos(x) cos(y) = j(cos(x-y) + cos(x+y))
Isin(x) cos(y) = (sin(x-y) + sin(x+y))
yields an infinite harmonic matrix equation for finding the harmonic
components, C C ( *1) C(T) 1 etc., of the nonlinear contribution to thez2o , z2sl' zcl
aerodynamic force, Cz2, given by equation (3-93). After allowing
Mathematica TM to carry out the tedious algebra of multiplication of
harmonic expansions and reduction of trigonometric products, the
resulting equation is,
(3-97) [- k2 [I'] + =[(ra)]](c(9) = [ (r,e)]lACz}
2 (9) * .(r a)] (9)where -k2[I']{Cz2 comes from Cz2; [4(r'a)]{,z2 comes from
(aCz2+rCz2); and [ (re)]{ACz) from (rACz+ra(ACz)/a). The elements of
the nonlinear aerodynamic matrix [ ] truncated to two harmonics
(i.e. 5x5) are,
(r,a) 2 2 2 3 4 2(3-98) 11 = R[(1 + 2(A1 + A2) + f2 2(2AA 1+ 34 2
2 2 322 34+ 2A0A2+AA 2 + 1A2 )J
39

4 (,a) = R[ 1 2(24A - A1 2) +23 3 2i 32(2 AoLA - 2AOA1A, - A'A 2
2 3 31+ 30A1A2-Zh j2)
(r,a) 1(3-100) ,413 = -kAP 1(A 1 - A1A2 )
(r,a) -2kA 1 2(3-101) 14 = 2kAp 1 I -4 1 +A6A2 )
(r,a) =[ 2(3-102) ,415 = R 02(2A + 2A 2 ) + 2 22
14 2- 'A1 + 30A,1A2
92 2 3 A3-A 1 A2 + Ao2)]
(3-1 03 ) $1fa = R[1 2(464AI - 2 1A2) + 32(3A 1OA - 4A2A lA 2
- 21 A2 + 60CAAl2 1
(3 -104) 4(ra) R [1 3 2 2+ 2(2A1 - 2 0 A2 + 2
- 6Aoa1 2
(3-105) g(3a) =-kA[1 + 1
+ 23 2 54+ 2 (3AoA *+OI
22 21 2 2 3 3+ 2AA 2 + A1LA 2 - AoA2
3 2 2(A 1 - A0A2 +
+ 2)]
= 2kA3 1 (-0A 1l + A1 A2 )
(3-99)
(r,a)(3 -106) 1424

3 7 (r,a) =R[2(-2 + 2AA2) + 2(-2O 3+ 4A 2
+25-- -AA 1A2 + 2A 1 2)J
(3 -108) ,j (r,a)
(3 -109) (ra) kA[1+1I(A41 + 2)]32 ~A I + '60 A2 2 ]
(ra) 1 2 2 222 1 4(3-110) "133 = R + 2(iAl + 2 0A2+A+ 2(AA1 +A + 2A0A 20
32 2 3 3 3 4+ AIA 2 + AOA2 + 8A2 )
(3 -1 I ) f (r'a) = R[22)z$34 = Ri2I32 40A1
(3-112) 1(a35) = -2kAt3 1 46A
(3-113) 4(ra) =
(3-114) r,a)
+2 3( 1 3 23 2)]+2 (%AA OA1A2 +A A 2A
1
= kA l,60A1
(3-115) r43a) = R [23 2 40A43[
2 3 1 3 3 2)]+ 132(AOAI - A1A2 +jAOA1 A
(r,a) R[1 22(3-116) 44 = RI + 2(A1 + A2) + 2(2AA1
5 4 3 2+ OA1 - AOAA1A 2
223 22
41
1
+ j2Vl
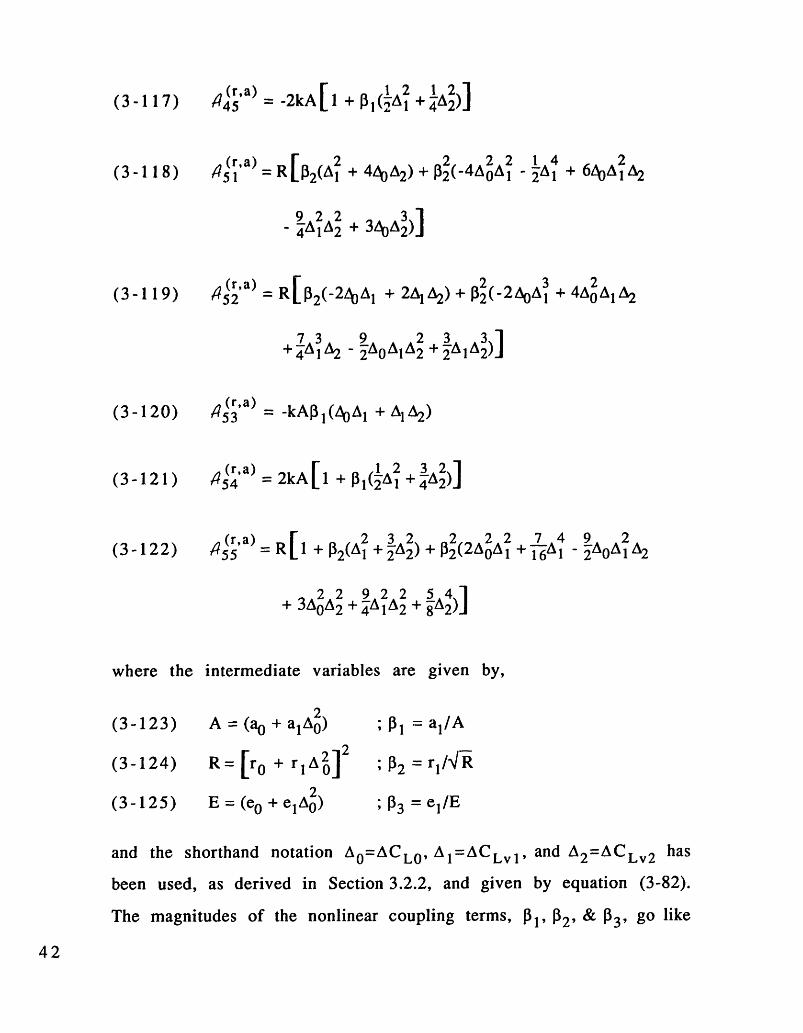
(3- 17) A45 2(3- 17) t4(r'a) = -2kA[1 + 3(~Al +_A2)]
(r,a) 2[ 4 + 2 2 2 1 4 2(3-118) A(51 )=R[ 2(A + 46oA2)+ 2(-4AoA1 - A1 + 6A 1A2
- 9A 1A2 + 30A2)]
(3-1 19 ) 4 (r,a) = R [ 2(-24A + 2 A2) + 2 2 (-2AO0A3 + 42A1 A2
73 9 2 3 3+ A1 A2 - AOA1 A2 + 2A 1 AD
(3-120) n (ra) = -kA13 (joAL + AA2)
(3-121) a 2 2(3 -121) , 54 = 2kA 1 + 3( 1 + A2 )
(3 -122) 4 (ra) = R[ + 2(A2 + A2) 32(2 2 7 4 9 2
2 2 9 2 2 5 4)]+ 3A 0A2 + A1A2 + A
where the intermediate variables are given by,
(3-123) A = (a + aAo)
(3-124) R= [ro + rlA2] 2
(3-125) E = (eo + el A 2)
; 1 = al/A
; P2 = rl/R
; 3 = el/E
and the shorthand notation AO=ACLO, AI=ACLvl, and A2 =ACLV2 has
been used, as derived in Section 3.2.2, and given by equation (3-82).
The magnitudes of the nonlinear coupling terms, 1, B2, & 133, go like
42

a1 /a0 , r l / r 0 , & e1/eo because the flutter analyses are usually only in
light stall, i.e. when A0O is relatively small. Therefore, from
Appendix D, the nonlinear coupling terms are of the order of [1-2,
2-10, and 3-oo.
Note that A, R, & E are the values of a, r, & e based only on the
mean value of ACLO - i.e. they are the simplified values used in
Refs. 94 and 95, and that same analysis can be reproduced by sim-
ply setting 1, 32, & 33 to zero. Moreover, for small amplitudes of
oscillation, i.e. on the flutter boundary, Al & A2 are negligible relative
to A0 , and again the analysis can be much simplified by setting 1, 32,
& 33 to zero.
The aerodynamic matrix [ (re)] governing the right hand side
of equation (3-97) is identical to the aerodynamic matrix [4 (ra)] just
derived, only with all a values substituted by e values. This would
not be the case unless the nonlinear coefficients a & e both had the
same parabolic form, as in equations (3-94) and (3-96). Hence,
(3-126) [g (r,e)] = {[,(r,a)]: aee 0o, al>el
= { [4 (r,a)]: A-*E, 1->03
The [I'] matrix is like an identity matrix, but with squares of
the ascending integers taking up every two diagonal elements (one
each for the sine and cosine components). This matrix results from
taking the second derivative of the harmonics with respect to time.
Truncated to the second harmonic, it looks like,
43

(3-127) [I'] =
00000010000010000040
_ 0 0 0 4_
The {(C,2 and (ACz column vectors of equation (3-97) are
made up of the harmonic elements of Cz2 and ACz from equations
(3-82) and (3-93)
(3 -1 ((P)2 (() L(p) () (() T,()(3-128) tq2 - L z20 2sl 2c1 z2s2 z2c2
(3-129) {AC =LACo ACv 1 0 0 ACzv2... T
Matrix equations (3-97) is solved to find the phase-shifted
harmonic components of Cz2, and these are then converted into the
real-time domain,
(3-130) CZ2 S = C cos- C() 1 sin4
(3-13 1) Cz2cl = C(9c) cos + C(2)1 sin4
(3-132) Cz2s2 =C() cos24 - C() 2 sin24
(3-133) C - C(2c) coS24 + C(2s) sin24z2c2 - z2c2 z2s2
3.3 Algebraic Reduction by Modal Analysis
3.3.1 Rayleigh-Ritz Analysis
The direct Rayleigh-Ritz energy method is a relatively simple,
straightforward approximation for the plate deflections, as required
for the static deflection, free vibration, and flutter analyses in this

study. The Rayleigh-Ritz method also has the advantage of showing
the effect of the individual variables on the solution more clearly
than other more accurate methods, such as finite element analysis.
The "wing" is idealized by a rectangular, cantilevered,
graphite/epoxy flat plate of uniform thickness, with styrofoam fair-
ings covering the entire chord but only part of the entire span.
The Rayleigh-Ritz analysis begins by assuming a deflection
shape for the structure. If only out-of-plane deflections, w, and fore-
&-aft deflections, v, are allowed, the deflection equations, written in
generalized coordinates, are,
n(3-134) w = Y y (x,y)qi(t)
i=l
n(3-135) v = y v4 (x,z)qi(t)
i=l
where i (x,y) and i(x,y) together are the non-dimensional deflec-
tion, or mode shape, of the i-th mode; qi(t) is the generalized dis-
placement, or modal amplitude, of the i-th mode; and n is the num-
ber of mode shapes.
For simplicity, it is further assumed that the mode shapes are
separable in the chordwise, spanwise, and through-the-thickness
directions - x, y, and z - namely that the mode shape can be written
in the form,
(3-136) i (x,y)= i(x) i (Y)
45

(3-137) Yi (x,z) = Ov (x)V(z)
The nonlinear equations of motion are thus transformed from
equations that are differential in both space and time, to equations
that are algebraic in space and differential in time. These equation
relating the modal amplitudes to the modal forces [Ref. 70] - are,
n n
(3-13 8) M ij/j+ 2 Kijqj = Qi i=l,...,nj=1 j=1
or, in matrix form,
(3-139) [M]{q) + [K]q) = {Q)
The mass and stiffness matrices are comprised of contributions
from the graphite/epoxy flat plate, the styrofoam fairings, and
effects of geometric nonlinearities, while the aerodynamic forces
contribute to the modal forces,
(3-140) Mij = Mty + M jIJ iJ ij ij
fp sty geo(3-141) Kij = K + K +Kg
The derivations of these mass and stiffness contributions and
of the modal forces are described in Section 3.3.3.
3.3.2 Selection of Rayleigh-Ritz Modes
To sufficiently describe the deflection of the wing in the static
bending, free vibration and flutter tests, beam out-of-plane bending
46

modes, beam torsion modes, chordwise bending modes, and beam
fore-&-aft bending modes were chosen. Previous studies used sim-
plified, sinusoidal torsional mode shapes [Ref. 921 that did not meet
the cantilevered root conditions, but with a torsional stiffness cor-
rection which accounted for the effect of root warping stiffness
[Ref. 70]. Vibrations tests, where the modal amplitudes were very
small and the modal forces identically zero, showed that this tor-
sional stiffness correction sufficed to accurately predict the natural
frequencies and modes of vibration of the wings.
However, static bending tests and low speed, steady deflection,
wind tunnel tests conducted in this study, where the modal ampli-
tudes and modal forces were no longer insignificant, showed that the
use of mode shapes which did not meet the cantilevered root condi-
tion adversely affected the Rayleigh-Ritz prediction of modal deflec-
tions. Therefore, the more complex torsional modes, with similar
spanwise form as the beam bending modes, were used instead of the
simplified sinusoidal mode shapes. The selected mode shapes are
listed in Table 1.
The parameters of the beam torsion modes are derived from
the definition of and the relationship between fj and gj,
Dll c2
1(3-142) f2= g48 2
(3-143) f2=g2 + 9
47

Out-of-plane bending: mode # = i = j = 1 to nb
() = cosh() - Cos(e - aj[sinh( jeJ
W (Y) = 1
sin Ie
7V(x,z) = 0sinh ei - sin i
cos £j£j= pj ; cj =cosh c +
0.596864162695,3.499989319849,
1.494175614274,4.500000461516, 5
2.500246946168,;.5, 6.5, ...
Torsion: mode # = i = nb+j ;j = 1 to nt
Wi(x) = BjlCos(gje+ Bj2sin(gj) + Bj 3cosh(f)+ Bj4sinh j)
w Y_Wi (Y) = c
yi (x,z) = 0
Chordwise bending: mode # = i = nb + n t+j; j = 1 to nc
4y2
; (Y) = c2 -
4y2
; W2(Y)= c2 -
1
3
1
Fore-&-aft: mode # = i = nb + nt+ nc+ j ; j = 1 to nf
Y (z) = 0
qV(x) = coshje) -
Vi (z) = 1
ej and aj same as
cos - j[sinh
above
Table 1. Assumed mode shapes
P j=
01(X) = 1 -
x2
02(x)= 2 - 1
; (x,z) = 0
y '(Xz) =0
sin j
48
- ----- ��-~'

and by solving the coupled equations which ensure that the mode
shape meets the plate boundary conditions at the root and tip. For
the assumed torsional mode shapes, the equations that describe the
boundary condition that must be met can be written in matrix form
as [Ref. 691,
1 0 1 0 1 FBBji-~l1 o[0 g 0 f B 2
(3-144) [-g2 cosg g2sing f2 coshf f2 sinhf Bj3
gf2sing gf2cosg g2 fsinhf g2fcoshf LB 4 0
The first two lines of the matrix equation (3-144) ensure that
the deflection and slope at the plate root are zero. The last two lines
of the matrix equation ensure that the internal forces at the plate tip
are also zero.
Since f and g are related through equation (3-143), the non-
trivial solution to the eigenvalue problem is found by setting the
determinant of the matrix in equation (3-144) to zero. The values
for f and g can be found by a simple Newton solver scheme. Once the
f and g values are found, the Bij coefficients are determined through
the following matrix equation,
1 0 1 0 B 0
0 g 0 f
(3-145) [ g2 cosg -g2sing f2coshf f2 sinhf 1 Bj32
cosg sing coshf sinhf Bj4 LThe fourth line in equation (3-145), which normalizes the
modal tip deflection to one, replaces the fourth line of equation
49

(3-144), which becomes redundant when f and g are solved so as to
make the matrix singular.
It is clear from equation (3-145) that Bil and B 3 are equal in
magnitude but opposite in sign. It is also generally found that f is
order of magnitude 10, so that the cosh(f) and sinh(f) terms domi-
nate the third line of the matrix equation, making Big and Bi4 oppo-
site in sign and almost equal in magnitude. It is important to note
for purposes of calculating the tip deflection that B3 and Bi4 are not
exactly equal in magnitude, since this difference is magnified expo-
nentially by the cosh and sinh terms near x/Q=l. Values of A, f, g,
and Bij for the layups used in this study are listed in Appendix B.
3.3.3 Mass & Stiffness Matrices and Modal Forces
For the flat plate, the symmetric mass coefficients, Mijf , and thefpsymmetric stiffness coefficients, Kij, are defined as,
(3-146) M j= || P ¥i Yj dxdydz for i,j nb+nt+nC
(3 -147) MJP = j P i yj 'dxdydz for nb+nt+n <i,j
(3 -148) f = {Dli,yjxxYjxx + D22iyY jyy + 4D66¥ixyYjWxy
+ D12[1,xxj,yy + Yi,yyYj,xx]
W W W W+ 2 D16[yixxyJxy + YixyYJ,xxl
+ 2D26[,yyYj,xy + i,xyYj,yy] }dxdy
for i,j <nb+nt+n c
50

(3- 149) $f 2 J v v V V(3 -149) c' f ] xxx A v v(3-149) Kij-Y 2 IIAIIxIYjUxx+ A22YlzzYj.z + 4A66yTXZYjlX7
+ A12 ,zz xl+ + 2A16[lxxyxz + YxzYJxx]
V V V V
+ 2A26[ ,zzj,x z + ,xzjzz }dxdz for nb+ n t+nc < i,j
where p is the density and the subscripts following the commas
denote partial differentiation with respect to the spatial coordinates,
x, y, and z. A 12-point Gaussian quadrature scheme was used to
evaluate the above integrals.
The styrofoam contributions to the mass matrix can be calcu-
lated in the same form as equations (3-146) and (3-147) using the
known thickness of the styrofoam and the chosen mode shapes from
Table 1.
(3- ) MSY = psC(0685tmax-tfp) .ijdxXsty
for i,j<nb or nb+nt+nc<i j
e(3-151) MSjtY= Psi-2(0.506tmax-tfp) ij d x
Xsty
for nb<i,j <nb +n t
(3-152) MiSJY = -0.0545psctmax friojdx
xsty
for i<nb; nb<j<nb+nt
51

The calculations of the styrofoam contributions to the mass
matrix from the chordwise bending modes are more cumbersome
because of the complicated chordwise variation of the mode shape.
Therefore, for those components of the mass matrix involving the
chordwise bending modes, the styrofoam thickness is assumed to be
uniformly half the maximum thickness, tmax, as might be suggested
by equation (3-151).
In the same manner, the contributions of the styrofoam to the
stiffness matrix can be calculated, giving,
(.779tm ax3 (tf t 13 esty sty 2(3-153) Kij =2cQlt1 3 2 ) 2
xsty
for i,j<n b or nb+nt+nc<i,j
esty sty 3 r
(3 -154) Ktjy = -.01585cQl ytmax Jixxxxdx
Xsty
for i<nb; nb<j<nb+n t
(. 8 2 4 tmaxJ3 (t2 3 dsty 1 sty 2 iXXjXXdi-=j Q = P-2Cx11P 3jxx
xsty'779tmax (t 1d
sty 2 2 cq6 ~i, 3 c
xsty
for nb<i,j <n b+n t
52

sty stywhere Q1ly and Q 6Y are the styrofoam engineering constants, defined
in the same manner as for the graphite/epoxy in equations (3-1) and
(3-4), as listed in Appendix A.
Again, the calculations involving the chordwise bending mode
are quite cumbersome, so for these purposes the styrofoam is
assumed to be uniformly 80% its maximum thickness, as might be
suggested by equations (3-153) and (3-155).
The contributions from the geometric nonlinearities can be
added by applying the same Rayleigh-Ritz method to the nonlinear
equations of motion derived in Section 3.1.2. There are no nonlinear
contributions to the mass matrix, Migj= 0 . The nonlinear contribu-
tions to the stiffness matrix, similar to those derived by Boyd
[Ref. 78], are,nb nbE I Rmnijqmqn for nb<i,j<nb+nt
m=l n=lnb(3-156) .e = Hmijqm for nb<i<nb+nt; nb+nt+nc<j
m=l
0 otherwise
where the coefficients of geometric nonlinearity - Rmnij resulting
from modal analysis applied to (EI-EI)(W" 2 0) in equation (3-60),
and Hmij resulting from modal analysis applied to (EI-EI)(W"v") in
equation (3-60) or (EI-EIl)(W"0)" in equation (3-59)- are,
(3-157) Rmnij = EI-EI) lmxx nxxPijdx
for m,n<nb; nb<i,j<n b+n t
53

(3-158) Hmij = (El;-EI)flmxxitjixxdx
for mgnb; nb<i<b+nt; nb+n t+nc<j
The modal forces are then finally obtained by integrating the
aerodynamic force coefficients, as determined in Section 3.2, with
the mode shapes over the span. This integral also incorporates the
spanwise correction to strip theory described by Landsberger
[Ref. 92] and described in Appendix C.
e(3 -15 9) Qi 2 . w c(3-159) Qi = ~pU2 { C[CL(X)COS0R + CD(X)Sin0R]i I(+ 4 )
0
+ c2CM(x)Ni',(+4) (x)dx for i,j<nb+nt+nc
e
(3 -160) Qi = pU J c[-CL(x)sinoR + CD(X)COS0R]Nfi (0) i (x)dx0
for nb+nt+nc< i, j
3.4 Pre-Flutter Analyses
3.4.1 Static Deflection Problem
The static deflection problem is formulated as an analytical
model of the experimental deflection tests described in Chapter 4.
For a pure force test, the cantilevered plate or wing is subjected to a
concentrated load at the specimen tip (x=e), at the elastic axis (y=O).
For a pure moment test, the cantilevered plate or wing is subjected
to equal and opposite concentrated loads at the specimen tip (x=e), at
the leading and trailing edges (y=+c/2). The accelerations are zero

for static deflection, and the real forces are point loads, so equation
(3-138) for a pure force reduces to,
n(3-161) Kiqj = Qi = F i(e)VWi(o) i=l,...,n
j=1
where F is the concentrated load applied at the wing tip. Similarly for
a pure moment, where M is the moment applied to the wing tip,
equation (3-138) reduces to,
M +¢(3-162) Kijqj = Qi= i(e)[i()- i(2) ] i=l...,n
j=1
3.4.2 Free Vibration Problem
The free vibration problem is formulated as an analytical
model of the experimental vibration tests described in Chapter 4.
The problem is formulated by setting the modal forces, Qi, equal to
zero in equations (3-138) and (3-139). The equations of motion are
reduced from differential form to algebraic form by assuming har-
monic (sinusoidal) motion. The modal amplitudes can be expressed
as,
(3-163) q = e i t ; q=co2qei(Ot
where is the frequency. These assumptions are substituted into
the differential equations of motion, (3-138), to obtain the sinusoidal
equations of motion,
n
(3-164) (-0 2 Mij + Kij)qj = i=l,...,nj=1
55

or, in matrix form,
(3-165) [- 2[M]+[K][]q)} = (0)
Equations (3-164) and (3-165) describe an eigenvalue problem
which can be solved by using a numeric eigenvalue solver, for
example EISPACKT M .
The linear free vibration problem about the nonlinear static
deflection is carried out in the same manner as the linear free vibra-
tion problem, with the exception that the stiffness matrix is changed
according to the geometrically nonlinear effects of a nonzero tip
deflection. For this analysis, the tip deflection was effectuated by
increasing only the static deflection in bending of the first mode
shape, ql 0, in other words,
fp sty 2Kj + Kij + R 1ij q10 for nb<ij<nb+n
fp sty(3 j + 6 6t + HiiqljO for nb<i<nb+nt; nb+n+nc<j(3 -1K66) Ki ij + HliqlKij + Kij otherwise
3.4.3 Two-Dimensional Aerodynamic Problem
Three approaches to the ONERA method of calculating the
2-dimensional force hysteresis were compared: a 4th-order Runge-
Kutta time marching scheme, the 2-harmonic scheme described in
Section 3.2.3 (denoted "non-constant" because a, r, & e are not con-
stant through the hysteresis cycle), and a 2-harmonic scheme with
constant coefficients a, r, & e (i.e. i1, 2, & 3 set to zero). The pur-
56

poses of this comparison were, first, to determine if the harmonic
schemes accurately matched the "exact" Runge-Kutta time marching
scheme and, second, to determine if using non-constant coefficients
provided significant improvement over constant coefficients in the
harmonic schemes.
The 2-harmonic, non-constant approach is as described in
Section 3.2.3. The 2-harmonic constant coefficient scheme is merely
a simpler subset of the non-constant approach. Several approaches
can be taken to "smearing" the nonlinear coefficients through the
hysteresis cycle,
(3-167) a = ao + al(ACL(<a>)) 2 = ao + al(ACL(aO)) 2
(3-168) a = a + al(<ACL(a)>)2 = a + al
(3-169) a = <aO + a, (A C L(a ))2> = a + a(A + 2A1 + ...)
Equation (3-167) bases the constant coefficient on the mean
angle of attack. This approximation seems poor because there are no
effects when the mean angle is below the stall angle but the ampli-
tude of oscillation is large enough to cross into the stall region.
Equation (3-168), based on the mean force deficit, and equation
(3-169), based on the mean coefficient through the cycle, account for
this effect, and are likely more accurate approximations. Of the two,
that described by equation (3-169) is likely a better approximation,
but that described by equation (3-168) was used because it was
easier to implement in the current formulation: it could be achieved
by simply setting ,1= 2 =, 3 =0 in equations (3-123) to (3-125). It
57

should be noted that no matter which approach is taken, there is no
dependence on the reduced frequency k because the values of the
harmonic components of the lift deficit, Ao, A1, & A2, are independent
of the reduced frequency.
The 4th-order Runge-Kutta scheme is typical for that used for
second order differential equations. The stalled ONERA equation
(3-64) is set up in terms of the state vector,
a r << i o 11 0 (3-170) a y =f[yx ] = r + x
-Cz2- ACz
with, y = and =
_LC2J _(ACz)1
and the time marching substeps are given by,_ A 1!_--\
(3-171)
1 = k [,Y n x ()]
A(kc) I -+ - 1- A(kt)2 = k f [ y n + -k1 x ( n + 2 k
A(k') 1-- A (k)f [yn + k xn + k )]3 = k 2 2
(k) 7$,--) --j A(kc)-+ - .1 -+ x ( A4 k n 3' ('r,
y,,= y,, + (k 1 + 2 + k)- 11T - 1t tU ' J " 1"
For the Runge-Kutta scheme, each cycle of the hysteresis was
divided into 360 time steps, i.e. 1° change in kx for each time step.
In general it was found that 3 cycles were required for convergence
58
to a steady hysteresis loop, although more were required as the
reduced frequency pushed past 0.2. Therefore, approximately 1000
time steps were required to reach convergence. Each time step
required 4 substeps, and each substep required on the order of 10
multiplication operations (approx. 5 to calculate the updated a, r, e, &
x values, 5 to update the state vector derivative). So, in total, the
Runge-Kutta scheme takes on the order of 40,000 operations.
However, executing a time step per 1 change in k is likely too con-
servative an time marching scheme, despite the high nonlinearity of
the formulation. On the order of 4,000 operations would be more
realistic.
For the 2-harmonic non-constant scheme, with a single break
point lift model as described in Appendix E, setting up the binomial
and integral coefficients bij and Iij requires 9 operations while eval-
uating the harmonic coefficients of the force deficit, AO, A1, etc.,
requires another 13 operations, bringing the total number of opera-
tions to approximately 20. For an n-harmonic scheme, the number of
operations in evaluating the harmonic coefficients of the force deficit,
A, A, etc., goes like 8(n+l). In evaluating the aerodynamic matrix,
the worst case is like the ,i (r,a) component, which requires 30 mul-
tiplication operations. There are 25 such components, thus requiring
750 operations to evaluate the entire matrix. The real number of
operations is likely closer to 500 because of smaller expressions for
other elements such as 41 3 For an n-harmonic scheme, the num-
ber of operations in evaluating the aerodynamic matrix goes like
n+1) 4 (2n+1) 2 . The factor of (2n+1)2 comes from the number of
components in the matrix, the factor of (n+1) 4 comes from multiply-
59

ing out the A0, A1 , etc. terms in ACL in r, while the factor of 4 isL 4because not all the elements of AC L contribute to all the components
of the aerodynamic matrix. Finally, Gauss elimination to solve the
matrix equation requires approximately 1(2n+1)3 operations, i.e.
approximately 60 operations for a 2-harmonic analysis.
Therefore, in total, the 2-harmonic analysis with non-constant
coefficients requires somewhere on the order of 600 operations. This
is about an order of magnitude fewer operations than the Runge-
Kutta scheme. However, for a 3-harmonic analysis, the (n+1)4 (2n+1) 2
term grows very quickly and on the order of approximately 3,000
operations are required, making the tradeoff with the Runge-Kutta
scheme much less beneficial.
3.5 Flutter Analyses
3.5.1 U-g Method
As a starting point from which to investigate the full, nonlinear
flutter problem, it is useful to look at the linear, small-amplitude,
zero root-angle-of-attack flutter and divergence problem, which can
typically be solved using what is called the U-g method.
First, because the problem is linear, the steady problem is
completely uncoupled from the unsteady problem, and the two can
be considered separately. So, for the unsteady problem, sinusoidal
motion is first assumed,
(3-172) qi = qieiowt
After some algebraic manipulation, it is derived that the aero-
dynamic modal forces are given by,
60

(3-173) Q = 2SPb3[L I+iL2]Ji +for n bb
for i<n b
(3-174) Qi = CO2sLpb4[ M l+ iM 2]eI ij +nb
[L3+iL4]leIi' iot.Cqj entnt
[M3+iM4]eIij tjeit t
n1 t
for nb<i<nb+n t
where the complex lift and moment terms are,
(3-175) [L1 +iL 2 ] = 12i aoL- -C(k)
L
1(3-176) [L 3+iL =-
kv L 2C(k)s+ k2sL
2s + 1kV·~[OSLL SL
a2sL] C(k)
1(3-177) [Mi+iM21 -
kvL2s L
1(3-178) [M3+iM4] =
SM 2 kv MSL SM
2+ M+ +
SL
C(k) aoLk2 2 SL
2 SLto L }
2 L-
and where the approximation to the Theodorsen function and the
mode shape integrals corrected for spanwise effects are given by,
XL + aLik(3-179) C(k) =L +
XL + ik
61
2sM
SL
i a- - -g-(k)k 2sL
2smSL
i I 2

(3-180) i 1 l ('aL J [.il1 I + AR 0
Note at this point that if the linearly derived coefficients are
inserted into equations (3-175) to (3-178) [aOL=2 7; SL=n; kL=n/ 2 ;
o L =2 ; sM =- 7/4; k M=- 3/1 6 ; a M = -r/ 4], then the typical
2-dimensional, linear relations, as shown in Refs. 90 and 92, are
recovered.
Inserting these into the equations of motion and canceling the
eiot', yields the following form of the equations of motion, written in
contracted matrix form,
(3-181) [[K] - 2[A]]{4 =0
where the combined aerodynamic/mass matrix is,
(3-182) Aij = Mij + SLpeb2 Iij[L+iL 2] for i,j<n b
Qb3
(3-183) Aij = Mij + LP c Iij[L3+iL4] for i<nb; nb<j<nb+n t
eb3
(3-184) Aij = Mij + LP- Iij[Ml+iM2 ] for nb<i<nb+nt; jnb
eb4
(3-185) Aij = Mij + LP 2 Iij[M3 +iM4] for nb<i,j<nb+n t
Structural damping is then introduced into equation (3-181) by
multiplying the [K] matrix by (+ig). Introducing the complex eigen-
value Z, equation (3-181) then becomes,
62

(3-186) [[Al - [K]Z](q) = 0
where,
(3-187) Z o 2
The solution method is to pick a value of reduced frequency,
and solve equation (3-186) for all the corresponding complex eigen-
values Zi (in this case by using a complex eigenvalue solver in
EISPACKTm). Then, for each Z, the associated frequency, structural
damping, and velocity are given by,
1 Im{Z} cob
(3-188) RZ ; = ReZ) U= k
The procedure is repeated for several values of the reduced
frequency k, until enough values have been generated to plot a
smooth U-g diagram. The divergence points are those locations
where the structural damping and frequency simultaneously go to
zero. The flutter points are those other locations where the struc-
tural damping goes to zero but the frequency is non-zero.
A similar analysis, involving linear aerodynamics but nonlinear
structures, can also be implemented so as to incorporate geometric
nonlinearities. The procedure is to first run the purely linear U-g
analysis. Now, since the problem is coupled to the steady solution
through the structural nonlinearities, the next step is to determine
the steady deflection at the flutter velocity and desired root angle of
attack. The stiffness matrix is then updated according to these
steady deflections and the U-g analysis run anew. Again, the steady
63

deflections at the newly calculated flutter velocity are incorporated
to vndate the nonlinear stiffness matrix, and thus the procedure is
repeated until it converges.
3.5.2 Harmonic Balance Applied to Nonlinear Flutter Analysis
All the components of the flutter problem have been stated in
differential form and now it remains to reduce the problem to an
algebraic form so that it is more easily solved computationally. The
general form of the differential equation describing the motion of the
wing is given by equation (3-138). The left hand side of equation
(3-138) contains the structural information of the problem and is
described by the definitions of the stiffness and mass matrices given
in Section 3.3.3. The right hand side of equation (3-138) contains
the aerodynamic information of the problem, in the form of the
modal forces, and is described also in Section 3.3.3.
In general the aeroelastic problem is reduced from differential
form to algebraic form by assuming harmonic motion in the same
manner as for the free vibration problem in Section 3.4.2 or the U-g
method in Section 3.5.1. This method is acceptable for the linear
flutter problem where the steady part of the solution is uncoupled
from the unsteady part of the solution. However, for the nonlinear
flutter problem, these two are no longer uncoupled and both must be
considered at once.
First, the modal amplitudes are put into harmonic form,
(3-189) qi(r) = qio + qissin(k c) + qiccos(kt)
64

From the modal amplitudes, the angle of attack and 1/4-chord
deflection at each spanwise location are also put into harmonic form,
(3-190) fh(x,t) = hio(x) + ihs(x)sin(kr) + fic(x)cos(kt)
(3 -191) 0(x,t) = 0(x) + 0s(x)sin(kc) + 0c(x)cos(kr)
where the harmonic components of the 1/4-chord deflection are,
(3-192) =i ( (+c/4)i=l
i=l
(3-194) lic =(3' =194b _j i (x) i (+c/4)i=l
and the harmonic components of the angle of attack are,
n W(3-195) 0 = R+ i (x)i(+c/4)i=l(3-196) a = R qi js (x)xi,y(+/4)i=ln
(3-197) Os= qis i (x)Wi,y(+C/4)(3-197) = q (x)x(+/4)i=li=l
65

Substituting equations (3-190)
for the linear aerodynamics, equation (3-63), gives,
(3-198) Cz,(x,t) = Cz',o(X) + C,s(x)sin(kc) + CzC(x)cos(kt)
where the harmonics of the circulatory
(3-199) Czo(x) = aoz0O(x)
(3-200) Czys(X) = F(k)Ls(X) - G(k)Lc(x)
(3-201) Czc(X) = G(k)Ls(x) + F(k)Lc(x)
force coefficient are,
and where, in the present analysis, the F
resulting single lag approximations to
and G functions are the
the Theodorsen function,
C(k) = F(k)+iG(k), namely,
k2 + ak2
(3-202) F(k) = 2 +k 2
(3203) G(k) = Xzk( 1 -az)(3-203) G(k) = 2 +2
zk
and where the other intermediate variables
(3-204) Ls(x) = aoz[0s(x) + khc(x)] - azk0c(x)
(3-205) Lc(x) = aoz[Bc(x) - khs(x)] + ozk0s(x)
66
are,
and (3-191) into the formula

Finally, the apparent mass terms are added to give the usual
harmonic form of the linear aerodynamics derived from equation
(3-62),
(3-206) CzlO(X) = C,(X)
(3-207) Czls(x) = Cz(x) - Sz[kOc(x)-k2s(x)] - kvzk20s(x)
(3-208) CZlc(x) = Cz(x) + sz[ks(x)+k2h'c(x)] - kvzk2 0c(x)
Cz20(x), Cz2s(x), and Cz2c(x) are the spanwise location values of
Cz2o, Cz2sl, and Cz2cl as derived in Section 3.2.3. They are added to
the results of the linear aerodynamics to give the combined
spanwise-varying and time-varying force coefficient,
(3-209) C(x,r) = CZO(X) + Czs(x)sin(kt) + Czc(x)cos(kt)
where the harmonic components of the force coefficient are,
(3-210) Czo(x) = Czlo(x) + Cz2o(x)
(3-211 ) C(x) = Czls(X) + Cz2sl(X)
(3-212) Czc(x) = Czlc() + Cz2c l(X)
The harmonic form of the aerodynamic forces is then placed
into equation (3-159) to give the harmonic form of the modal forces,
(3-213) Qi( x ) = Qio + Qissin(kt) + Qiccos(kt)
67

harmonic components of the modal force are,
(3-214 ) Qio = PU2 | { C [CLO(X)COS0R+CD(X)Sin0R]V(+ +)+0
c2 CMO(X)Vi,(+4) I} i(x)dx
e
(3-215) Qis = pU2 { C[CLs(X)CoSR+CDs(X)SnR]+i(+ 4)+
c 2 CMs(X)Wiy(+4) I} i(x)dx
e
(3-216 ) jQ = 2pU2 ft c[CLc(x)cosOR+CDc(x)sinoR] pV i (+-4) +0
c2 CMc(x)i,y(+ 4 ) I} i(x)dx
The general equations of motion, described in matrix form in
equation (3-139), are converted into the final harmonic form by
substituting the harmonic forms of the modal amplitudes and modal
forces from equations (3-189) and (3-214) to (3-216),
[K] O O FqO}
(3-217) O -c2 [M+[K] O fqs][ Q)J
0 o <o2[M]+[K] {qj) {Qc}J
Equation (3-217) might look deceivingly linear, but this is not
so. First, because of the static aerodynamics, there is a nonlinear
dependence of the mean modal forces { Qo on the mean modal ampli-
tudes q0}, and similarly in a quasi-steady sense for the harmonics
{qs} & {qc} on Qs } & Qc. Second, because of the nonlinear formula-
tion of the ONERA aerodynamic model, there is also a nonlinear
68
where the
dependence across the harmonics - that is, there is a dependence of
{Qo) on qs) & {qc and of Qs) & (Qc) on ({q). Third, because of the
geometric nonlinearities, there is a nonlinear dependence of the
stiffness matrix [K] on the mean modal amplitudes (qo).
3.5.3 Parameters of Analysis and Implementation
Once the governing equations are set up for the various prob-
lems of static deflection, free vibration, 2-dimensional aerodynamics,
and flutter, it still remains to be determined the desired parameters
to solve those problems.
As discussed in Section 3.3.2, beam bending modes and root-
warped torsional modes were chosen to model the structural
dynamics. Alternatively, torsional modes with warping terms ig-
nored - i.e. pure sine mode shapes - could have been used but,
while these would have accurately predicted natural frequencies,
they would have overestimated static deflections because of the lack
of stiffness from root warping.
In general, since the final stalled flutter problem is expected to
yield a single degree of freedom motion in either the first torsional
or first bending mode, it was deemed necessary to only model the
first torsion and first bending modes accurately. For an uncoupled
wing, such as the [03/ 9 0] s, it would therefore only be necessary to
include those two modes to get the frequencies correct. However,
other factors necessitate larger numbers of modes. First, because of
the bending-torsion coupling of the other layups, larger numbers of
modes were required to get even the first torsion and first bending
frequencies accurately. Second, because of the distributed natures of
69

the aerodynamic loading of the linear & nonlinear flutter analyses,
larger numbers of modes were required to accurately model the dis-
tributed loads as the summation of modal forces. In other words,
because of the bending-torsion coupling the mass & stiffness matri-
ces - i.e. the left hand side of equation (3-138) - indicate a need for
a larger number of modes, while the accurate modeling of the modal
forces - i.e. the right hand side of equation (3-138) - also indicates a
need for a larger number of modes. It was decided from these con-
siderations that three bending and three torsion modes would suffice
to accurately model the first bending and first torsion modes through
all the analyses.
Again, because the flutter solution is expected to be "locked" at
the torsional frequency, only one harmonic would seem necessary for
the final analysis. And again, because of the coupling between har-
monics inherent in the nonlinear problem, higher harmonics would
seem necessary. However, the nonlinear coupling between harmon-
ics only occurs through the aerodynamics, and hence the aerody-
namic analysis by itself can use several harmonics, while the total
flutter analysis can use fewer harmonics so as to save computational
time.
The gross harmonic characteristics that the aerodynamic anal-
ysis is trying to capture are described graphically in Fig. 5. As
already noted by Petot [Ref. 52], even within the framework of a
time-marching scheme, the ONERA model does a poor job of predict-
ing any finer details (i.e. higher harmonics) of the hysteresis cycle.
In terms of harmonics, the important characteristics can be loosely
70

"in phase"- sin(kr)
a (deg)
a (deg)
"figure 8" -sln(2k)
a (deg)"out of phase" - cos(kt)
a (deg)
a (deg)
"banana" - cos(2k')
Fig. 5 Gross characteristics of force hysteresis
71
K
I I I I I I - i i i I i
, I P --
! l l l l |- I I I I IV, . . .

labeled as "in-phase" for the first sine harmonic, "out-of-phase" for
the first cosine harmonic, "figure eight" for the second sine harmonic,
and "banana" for the second cosine harmonic.
Physically, the first sine and second cosine harmonics are the
effects of the static curve on the hysteresis - the first sine harmonic
falls generally along the linear force curve, while the second cosine
harmonic is affected by the deviation due to the static stalling. The
first cosine and second cosine harmonics are the work terms - that
is, they give the cycle its hysteretic nature and the area mapped by
each cycle gives an indication of the work done by the flow on the
airfoil. In general, the first harmonics can be loosely associated with
the linear aerodynamics (so the first cosine term is associated with
the "linear" work), while the second harmonics can be loosely asso-
ciated with the nonlinear aerodynamics (so the second sine term is
associated with the "nonlinear" work or work due to stalling).
Obviously, these are just the broad generalities associated with each
harmonic since, in reality, all the physical aspects couple into all the
harmonics because of the nonlinear nature of the fluid flow.
However, it seems reasonable that to capture all these physical
aspects it would be necessary to incorporate at least the first two
harmonics.
So, in calculating the 2-dimensional aerodynamics at each
spanwise location, it was decided to use a two harmonic analysis.
However, for the full flutter analysis only one harmonic was used.
That is, the 2-dimensional aerodynamic analysis took a single har-
monic angle of attack oscillation as its input, and calculated the
resulting two harmonic components of the force coefficients (as

described in Section 3.2.3), but the flutter analysis only used the
first harmonic results from these. As with the modal analysis for the
structural part of the problem, it might in fact be necessary to
include even higher harmonics to capture the proper physical aspects
of the two lowest order harmonics. This aspect of the problem was
not probed in the current investigation.
The theory described in all the previous sections was imple-
mented using MacFortranT M code on a Macintosh IIfx at the
Technology Laboratory for Advanced Composites at the Aeronautics
& Astronautics Department of M.I.T. The source code of these
MacFortranT M programs is listed in Appendix G. A 12-point Gauss
quadrature scheme was used for all integrations that could not be
easily evaluated in closed form - eg. mass & stiffness integrals
(equations (3-146) to (3-158)), modal force integrals (equations
(3-214) to (3-216)), or U-g method aerodynamic integrals (equation
(3-181)). The Gauss points and weights are listed in the include file
"GAUSS.INC" in Appendix G. It is known that in order to accurately
integrate higher order polynomials, the Gauss quadrature scheme
places more emphasis toward endpoints with higher clustering and
weighting there - this is appropriate for the current analysis because
of the evanescent contributions to the mode shapes (sinh & cosh) and
because of the aerodynamic force dropoff at the tip.
73

74

Chapter IVExperiment
4.1 Test Specimen Sizing
The objectives of redesigning the test specimens were twofold:
first, to decrease the linear flutter velocity to within the limits of the
available wind tunnel facilities (approx. 30 m/s); second, to increase
the Reynolds number at flutter to a value closer to that for which the
ONERA aerodynamic model was developed. These two objectives led
to a single overall objective: keep the linear flutter velocity just
under the wind tunnel limit - thus pushing the Reynolds number as
high as possible by means of the wind velocity - and increase the
chord as much as possible. These design objectives were constrained
by several limitations.
Choice of layup - to ensure a wide enough range of bending-
torsion coupling, and because of the manufacturing errors inherent in
the layup procedure, we chose to limit ourselves to ply angles in
increments of 150 only; moreover, we desired to choose our layups
such that one had a divergence velocity above the wind tunnel limit,
a second had a divergence velocity very near its flutter velocity, and
a third had a divergence velocity below its flutter velocity, but not
below the lower wind tunnel limit (approx. 10 m/s).
Number of plies - in general, an increase in number of plies
increased the bending and torsional stiffnesses of the wings.
Therefore, on the one hand, we wished to decrease the stiffness so as
to keep the flutter velocity within the wind tunnel limits and to
allow the wing to twist enough-to reach the stall angle. On the other
75

hand, we wished to keep the stiffness high enough so that gravity
bending effects would be negligible and so that bending deflections
would not diverge too quickly.
Span - it was desirable to increase the span as much as
possible, for purposes of observability, but we were restricted by the
size of the wind tunnel (approx. 3 feet, to allow for wall effects) and
by the flexibility of the specimen: we did not want it to become so
long and thin that it would break at divergence or flutter.
Chord - again, it was desirable to increase the chord as much
as possible, so as to increase the Reynolds number, but it was also
necessary to keep the chord small enough such that the wing would
be torsionally soft enough to reach flutter within the wind tunnel
limits. Both the chord and the span were also limited by the size of
the available autoclave at the Technology Laboratory for Advanced
Composites manufacturing facility.
Most of these goals were achieved, and improved upon the
layups of Refs. 94 and 95, with the following designs: layups of
[03/90],S [+ 15 2/02] s, and [-15 2/0 2]S with the span doubled from 1 ft.
to approximately 2 ft., and the half-span aspect ratio kept at 4.
4.2 Test Specimen Preparation
The test specimens were constructed from Hercules
AS4/3501-6 graphite/epoxy prepreg tape from Lot No. 5874-2,
Spool No. 4 and Lot No. 6075-2, Spool No. 5D, using the standard
TELAC manufacturing procedure [Ref. 96]. The laminates and curing
materials were arranged on an aluminium curing plate as shown in
76

Vacuum Bag
-/ - Alu minum n\-r-///// Id-I M- Aluminum 'U.11-1Top Plate
Paper
L
! L
i'1L)�I
Air Breather
Bleeder
Specimen
6 Cross-section of symmetric curing assembly
PorousTeflon
Fig.
77
_
-- - -
I l
I
cra _.. otQ{1
Fig. 6 and cured in a Baron model BAC-35 autoclave using the
standard TELAC curing cycle described by Fig. 7. After curing, the
laminates were post-cured in a forced air circulation oven at 3500 F
for eight hours. After post-curing, rectangular test specimens
584 mm (23 in) long and 140 mm (5.5 in) wide were cut from the
laminates using a diamond-coated cutting wheel mounted on an
automatic feed, milling machine.
Loading tabs 152 mm (6 in) by 25.4 mm (1 in) were
machined from 3.2 mm (1/8 in) aluminum plate and bonded to the
base of each test specimen with FM-123-2 film adhesive, cured using
the standard TELAC bond curing cycle. The loading tabs were
intended to aid in aligning the test specimen in the clamping fixture
and to prevent damage to the plate surface fibers.
To get an indication of the lateral deflections, strain gauges
were attached to the base of each test specimen at the midchord, as
shown in Fig. 8. Two Micro-Measurement EA-06-125AD-120 strain
gauges, from Lot No. R-A38AD605 with a gauge factor of 2.055, were
attached to both sides of each specimen near the root to measure
bending strain. Two Micro-Measurement EA-06-250TK-120 strain
gauges, from Lot No. R-A38AD399 with a gauge factor of 2.02, were
attached to both sides of each specimen near the root to measure
torsion strain. The two bending gauges were wired together as a
two-arm bridge circuit with three external lead wires. The two
torsion gauges were wired together as a four-arm bridge circuit with
four external lead wires. Wiring the strain gauges in this manner
provided automatic temperature compensation. Finally, the gauges
78

AUTOCLAVEn
10 35 95 115 235 275 280TIME (mins)
AUTOCLAVE
10 275 280TIME (mins)
VACUUM (psia)
280TIME (mins)
Fig. 7 TELAC cure cycle
79
350
240
150
RT-70
85
0
14-
0- I IL -- II --� I - -- - I _�- -- - L- · L
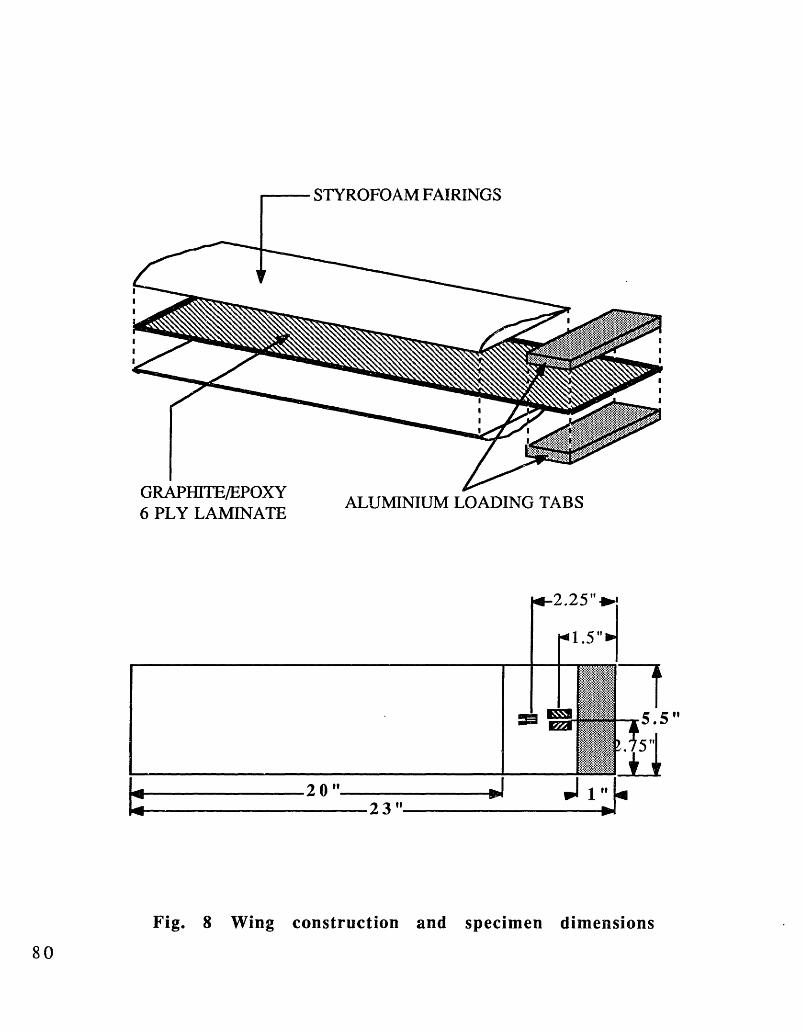
rTVXi) fAClr A Xr L A T D TTI' C
6 Pi LNT % char nALUMINIUM LOADING TABS6 PLY LAMINATE
I
Fig. 8 Wing construction and specimen dimensions
80

and exposed wiring were coated with Micro-Measurement M-Coat A,
an air-drying polyurethane.
The NACA 0012 fairings were cut from 508 mm (20 in)
blocks of styrofoam using a computer controlled hot wire cutter and
were then epoxied to the top and bottom of the graphite/epoxy
plates.
4.3 Static Deflection Tests
The static deflection test setup (see Fig. 9) consisted of a
clamping device bolted to a large aluminum table (the "optics bench"
at M.I.T.'s Space Engineering Research Center). Two low friction
pulleys were attached to vertical rods such that a force or moment
could be applied to the test specimen at its tip. Rulers, graduated in
millimeters, were attached to Dexion angle-iron to facilitate
measuring the test specimens' tip deflections. Threads, routed over
the pulleys and attached to weights, could be attached at any point
along the wooden dowels so as to transfer either a force or a moment
to the test specimen.
The deflection indicator was aligned with the tip of the test specimen
and the test specimen clamped in the vise. For the tip force test, the
pulleys were aligned with the plate midchord and threads from the
center of the wooden dowels were routed over the pulleys. Weights
in increments of 100 grams were successively attached to the
threads, first to give positive deflections, then to give negative
deflections. As each weight was attached, the readings from both
pointers were recorded, along with the applied weight and the
measured bending and torsion strains.
81

LOW
FRICTIPULLE)
Fig. 9 Static deflection test setup
82
U[/ r rm L, L £eJ.1

Next, the pulleys were aligned with the leading and trailing
edge of the plate tip and the threads routed from the plate corners
over the pulleys, so as to produce a positive moment when equal
weights were attached. Weights of 20 gram increments were
successively attached to each thread of the couple, and readings from
the pointers and the strain gauges were again recorded along with
the applied weights. The pulleys were then switched to diagonal
opposites of the plate so that negative moments could be applied,
and the same procedure applied.
For each data point, the lateral deflection of the elastic axis and
the rotation about the elastic axis were calculated from the pointer
measurements. The lateral and angular deflections were plotted
versus applied tip force for each test specimen, and compared
against the Rayleigh-Ritz analysis. Similarly, the lateral and angular
deflections were plotted versus applied tip moment for each test
specimen, and compared against the same analysis. Linearized fits
between lateral deflection and bending strain, and between angular
deflection and torsion strain, were conducted so that a linear relation
could be later applied to the flutter tests. The results of the static
deflection tests are discussed in Section 5.1.1.
4.4 Free Vibration Tests
"Pluck" tests were conducted before each flutter test to verify
the free vibration frequencies of the wings. After the wings had
been clamped vertically in the specimen stand, they would either be
sharply tapped or given a brief, sharp torsional force, thus exciting
several of the lower bending and torsion modes. The strain gauges
83

were wired to 2120 Strain Gauge Amplifiers, with a two-arm D.C.
bridge for the bending gauges and a four-arm D.C. bridge for the tor-
sion gauges, and their readings were recorded on floppy disk using a
Nicolet digital oscilloscope.
Later, these signals were passed through a Fourier analyzer so
as to decompose the frequency content of the signal. Since the free
vibration modes would presumably have been excited by the sharp
taps, the peaks of the resulting frequency spectrum of the FFT would
correspond to the natural frequencies of the specimens. The signals
were made up of 2048 data points taken at 5 ms between data
points, thus corresponding to 2048 data points over 10 seconds or,
approximately, a frequency range of 0-100 Hz with a frequency
resolution of 0.1 Hz. The results of the free vibration tests are
discussed in Section 5.1.2.
4.5 Wind Tunnel Tests
All wind tunnel tests were conducted in the M.I.T. Department
of Aeronautics and Astronautics acoustic wind tunnel. The acoustic
wind tunnel is a continuous flow tunnel with a 1.5 m (5 ft) x 2.3 m
(7.5 ft) free jet test section 2.3 m (7.5 ft) long. The tunnel was
powered by a 100 HP motor giving it a continuously variable
velocity range of 0 m/s to 30 m/s (0 ft/sec to 105 ft/sec). The
tunnel control panel was located inside the chamber and the velocity
was controlled by two knobs (coarse and fine speed control).
The test setup, shown in Fig. 10, consisted of a turntable
machined from aluminum, mounted on a 914 mm (36 in) tall,
cylindrical pedestal made of 51 mm (2 in) thick steel pipe, 305 mm
84

(24 in) in diameter. The pedestal was mounted to the floor of the
wind tunnel section. A wooden cover disk 762 mm (30 in) in
diameter was used to ensure the pedestal did not affect the flow
over the test specimen, and thus provided smooth airflow past the
test specimen. A pointer attached to the free rotating portion of the
turntable, and an angle indicator attached to the fixed base of the
turntable, provided a consistent means of reading the angle of attack
of the test specimen.
The bending and torsion strain gauges were wired to a terminal
strip attached to the fixed pedestal, which was in turn wired to 2120
Strain Gauge Amplifiers. The amplifiers had a two-arm D.C. bridge
installed in channel 1 for the bending gauges and a four-arm D.C.
bridge installed in channel 2 for the torsion gauges. The bending
and torsion outputs from the Strain Gauge Amplifiers were fed to a
Nicolet Digital Oscilloscope where the signals could be recorded on
floppy disk. Visual data was recorded by placing a mirror at a 450
angle above the test setup, and recording onto 8mm videotape the
overhead view of the tip deflections. For sinusoidal flutter motion, a
strobe light was used to help visualize the oscillations.
The procedure for running the flutter tests was done in two
steps. First, the flutter boundary was determined. The root angle of
attack was increased by increments of 1°, and at each angle of
attack the velocity was slowly increased until the onset of flutter was
observed, marked by a visually noticeable amplitude of oscillation
and a clear frequency of oscillation (as distinguishable from wind
tunnel turbulence). Next, static and flutter data was taken at 10, 50,
100, and 15° root angles of attack. At each of these, the velocity was
85

increased in increments of 1 m/s and visual and strain gauge data
taken at each velocity value. This was continued up to the flutter
boundary. The procedure was also continued past the flutter
boundary, for larger amplitudes of oscillation, but care was taken not
to remain too long past the flutter boundary, for fear of damaging
the specimens.
86

CIMEN
GROUND PLANE
STAND
OTATINGTAND
Fig. 10 Wind tunnel test stand
87
"40��

88

Chapter V
Results and DiscussionThe Results & Discussion chapter is divided into two sections:
pre-flutter results and flutter analysis. The objectives of the section
on pre-flutter results is to verify individually the various compo-
nents that make up the flutter analysis - stiffness properties, mass
properties, effects of geometric nonlinearities, and 2-dimensional
aerodynamics - using the various methods of static deflection tests,
in vacuo dynamics (i.e. free vibration) at zero deflection, and free
vibration with tip deflection. Once the individual components of the
flutter analysis are verified, the objective of the section on flutter
analysis is to combine these components and move from linear anal-
ysis to fully nonlinear analysis in a stepwise fashion. This section
starts by approaching the problem using a fully linear U-g analysis;
adds nonlinearity through large mean deflections and angles of
attack while keeping oscillation amplitudes small (i.e. flutter bound-
ary analysis); then adds another level of nonlinearity by considering
large amplitudes of oscillation.
5.1 Pre-Flutter Results
5.1.1 Static Deflections
The experimental results of the static deflection tests for the
[03/ 9 0] s, [+15 2/02]S , and [-1 5 2/0 2]S laminates with NACA 0012
styrofoam fairings are compared in Figs. 11 to 13 with the
Rayleigh-Ritz analysis described in Section 3.4.1. These figures show
excellent agreement between experiment and analysis.
89

Because of the symmetry of the mass and stiffness matrices -
i.e. the bending-torsion coupling terms are equal to the torsion-
bending coupling terms - the analytic force-vs.-angle dF/dO and
moment-vs.-deflection dM/dh slopes should be equal when
expressed in the same units. For example, for the [03/90]S layup,
both these analytic slopes are approximately zero (with some slight
bending-torsion coupling due to the chordwise asymmetry of the
styrofoam fairings), while for the [+1 52/0 2]s layup the analytic
values as seen on Fig. 12 are dF/dO=-.527 N/deg and
dM/dh=-.302 Nm/cm or, in equivalent units, -30.2 N/rad and
-30.2 Nm/m respectively. The magnitudes of the analytically
derived slopes for the [-15 2/0 2]S layup are almost exactly the same
as for the [+15 2/02]S layup, just opposite in sign, as is readily seen by
comparing Figs. 12 and 13 - again, the slight difference in absolute
values is due to the slight chordwise asymmetry of the styrofoam
fairings. The fact that the experimental values match so closely the
analytic values indicates that the assumption of symmetry is valid.
In other words, neither manufacturing defects (such as misaligned
layup, or variability of ply thickness) nor styrofoam asymmetry
adversely affect the symmetry assumption.
The force-vs.-deflection and moment-vs.-deflection experimen-
tal slopes are almost purely linear up to the expected maximum
deflection that would be encountered during a flutter experiment, i.e.
15-20 cm or about 40% of the span. However, the force-vs.-twist
and moment-vs.-twist experimental slopes show hardening charac-
teristics as compared against the linear analysis, that is, the experi-
90

mental values require a greater force or moment to produce the
same twist than would be predicted by the analysis.
These hardening effects appear for the [03/ 9 0 ] s layup below
-4 ° and above +60, for the [+152/0 2]S layup below -6° and above +6° ,
and for the [-15 2/0 2]S layup below -6° and above +60 . For a tip twist
of 9, the discrepancy between the required moment from analysis
and from experiment is consistently about 30% (relative to the
experimental values) for all of the layups. This observed hardening
effect, which is not accounted for in the analysis, would imply that in
a flutter analysis, once the magnitude of the twist exceeded 6, that
the expected experimental phenomenon would harden more quickly
that the analytic phenomenon predicted by the current analysis.
Typical twist values encountered in flutter for the current investiga-
tion are on the order of 100 for light stall flutter (root angles of
attack below the stall angle), and on the order of 5 for deep stall
flutter (root angles of attack at or above the stall angle), and there-
fore it is expected that some structural nonlinearity will be unac-
counted for by the analysis near linear flutter. Also, an amplitude of
oscillation in flutter of 6 is generally considered "moderate" in terms
of the current aerodynamic analysis, while anything larger is consid-
ered "large". That is, experimentally all amplitudes from small to
large are observed (as can be seen from the figures in Section 5.2.3),
but the aerodynamic analysis described in Chapter 3 is assumed to
be valid for moderate amplitudes and to break down for large ampli-
tudes.
Within the range of -6° to +60 twist, the analytic prediction of
the twist from the applied forces generally falls within less than 1°
91

of the experiment, which is less than the experimental error for the
measured angles. Likewise, the analytic prediction of the deflections
from the applied forces falls within the experimental error over the
entire range that would be expected in flutter. Therefore, compari-
son of the experimental static deflections with their analytic predic-
tions indicates that the stiffness properties of the wings are accu-
rately predicted for most of the range for which the flutter analysis
is expected to be applied, and will only lack some cubic stiffening in
torsion at flutter values near divergence or at large amplitudes of
oscillation.
92

-15 -10 -5 0 5 10 15 -12 -8 -4 0 4 8 12Tip deflection (cm) Tip twist (deg)
\06
z000o°
6
-alo
0 C
-15 -10 -5 0 5Tip deflection (cr
Fig. 11 [03/90] s
10 15 -12 -8 -4 0 4 8 12n) Tip twist (deg)
wing static deflection results
93
I
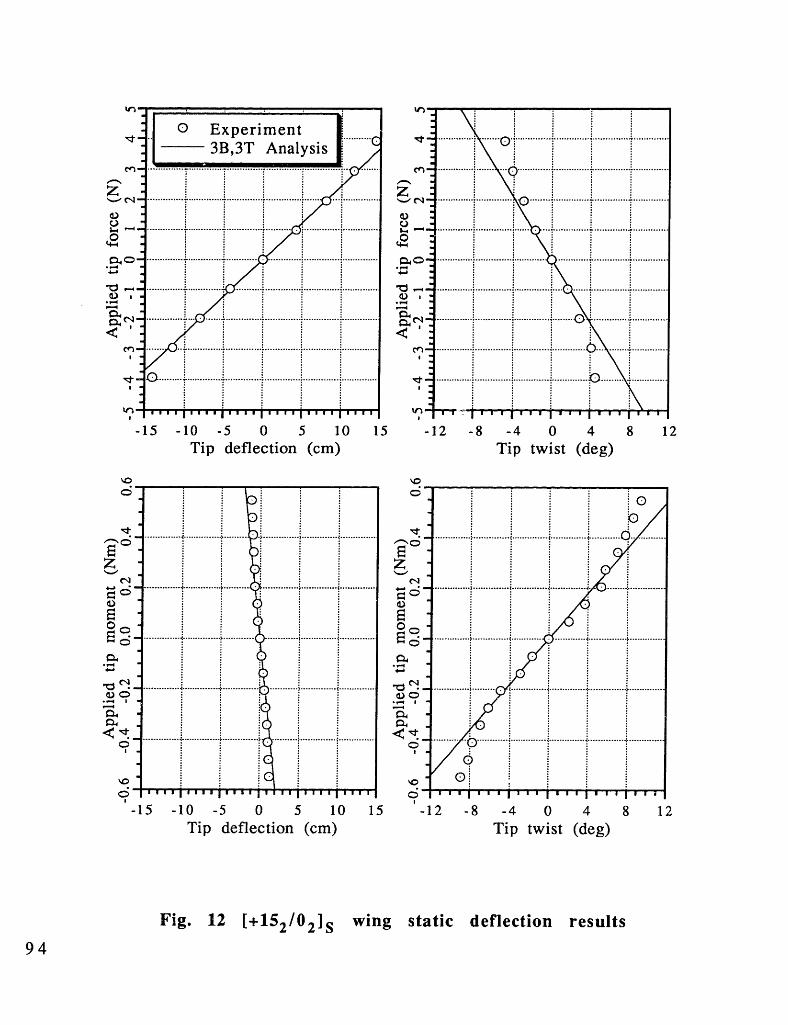
-15 -10 -5 0 5 10 15 -12 -8 -4 0 4 8 12Tip deflection (cm) Tip twist (deg)
-15 -10 -5 0 5 10 15Tip deflection (cm)
-12 -8 -4 0 4Tip twist (deg)
Fig. 12 [+1 5 2/ 0 2]S wing static deflection results
94
8 12
o0

z
C.)
00
Ca
-15 -10 -5 0 5 10 15Tip deflection (cm)
-15 -10 -5 0 5 10 15Tip deflection (cm)
-12 -8 -4 0 4Tip twist (deg)
8 12
-12 -8 -4 0 4 8 12Tip twist (deg)
Fig. 13 [-152/02]s wing static deflection results
95
to

5.1.2 Linear Free Vibration
Natural vibration frequencies for the NACA 0012 wings with-
out tip deflection were determined both experimentally and analyti-
cally, and are tabulated in Table 2. Although these are listed as 1st
bending (B), 1st torsion (T), et cetera, with highly coupled lami-
nates this distinction becomes much less meaningful because of the
high bending-torsion coupling. Figs. 14 and 15 show the uncoupled
mode shapes of the [03/ 90]S layup and the coupled mode shapes of
the [+1 52/02]S layup.
The experimental frequencies show excellent agreement with
the analysis for the first & second bending modes and the first tor-
sional mode. While the percentage errors for the first bending mode
frequencies might seem high, it should be noted that the frequency
resolution of the Fast Fourier Transform that was applied to the sig-
nal from the pluck test (see Section 4.4) was about 0.1 Hz, and
therefore a large part of the 0.3 Hz discrepancy might be accounted
for by this experimental error. The analysis could not be used as
comparison against experiment for the higher modes because it was
found to be too difficult to significantly excite the higher modes by
the pluck test described in Section 4.4, but they are less important
in the final analysis since they are only intended as corrections to the
more important lower modes. One would speculate that the higher
modes are likely less well predicted because the styrofoam fairing is
discontinuous (i.e. it does not cover the flat plate for a short span
near the root), and root warping terms become more significant for
96

higher modes because of the exponentially growing evanescent terms
(i.e. the cosh & sinh contributions to the mode shape).
It is noteworthy that the frequencies of all the layups fall in
almost the same range, both analytically and experimentally. For
example, all the first bending frequencies are clustered near 4 Hz, all
the first torsion frequencies are clustered near 23 Hz, and all the
second bending frequencies are clustered near 27 Hz. The choice of
layups, picked so as to keep the flutter and divergence speeds within
the limited range of the laminar flow of the wind tunnel, is likely the
source of this coincidence.
The reasons why these frequencies remain relatively
unchanged are several. First, as indicated in Appendix B, the D1 1
values are all clustered near 10 Nm for all the layups, so it would be
expected that the first and second bending frequencies would remain
relatively unchanged. Second, again as indicated in Appendix B, the
i values for all the layups, indicating the effect of the root warping
on the torsional frequency, all fall below 0.05, which leads to a
change in the first torsional frequency of less than 10% [Jensen,
Ref. 70]. Third, as indicated in Appendix B, while the D66 values
vary by a factor of almost two, these values are for the flat plates
only. From Appendix A one sees that while the shear modulus of
the styrofoam is three orders of magnitude smaller than the shear
modulus of the graphite/epoxy (8 MPa as compared to 5.3 GPa), the
graphite/epoxy is only 1 mm thick while the styrofoam at its widest
is 12% of the chord or 17 mm thick. Therefore, because of the z3
stiffness dependency on the thickness, the torsional stiffness contri-
bution from the styrofoam is comparable to that of the
97

graphite/epoxy. (This would not be true of the bending stiffness,
since the longitudinal modulus of the graphite/epoxy is about four
orders of magnitude greater than that of the styrofoam.) As sug-
gested in Section 3.3.3, the contribution to the torsional stiffness
from the styrofoam fairings may be accounted for by "smearing" the
styrofoam evenly across the chord at approximately 80% of its
maximum thickness - this would lead to an "equivalent" D66 contri-
bution from the styrofoam fairings of approximately 1.2 Nm, which
is greater than the D66 contributions from the graphite/epoxy for all
of the layups (see Appendix B). For this reason, the first torsional
frequencies remain about the same, despite the difference in the flat
plate torsional properties between layups.
This small variance in frequency has significant implication on
the linear U-g flutter analysis: if there are noticeable variations in
flutter results among the different layups, then these cannot be
attributed to frequency coalescence (since the natural frequencies
are all almost the same), but must be dependent on the bending-
torsion effect on mode shapes as well.
98

lBiT
[03/90] S 1T
2B
lB
[+152/02]S 1T
__ _ 2B
lB
[- 15 2/0 2]s 1T
2B
NACA 0012 wings
Experiment
4.0
21.4
27.1
3.6
22.7
27.1
3.6
24.5
27.4
Table 2. Free vibration frequencies (all values in Hz)99
Analysis
4.3
24.6
27.2
3.9
23.5
28.6
4.0
24.1
27.8
% error
7.5
15.0
0.4
8.3
3.5
5.5
11.1
-1.6
1.5
_ ___
~~~~~II II I I :i i
--------------

IB: 4.3 Hz
1T: 24.6 Hz
2B: 27.2 Hz
2T: 79.2 Hz
Fig. 14 [03/90 ]S analytic free vibration mode shapes
100

IB: 3.9 Hz
IT: 23.5 Hz
2B: 28.6 Hz
2T: 89.8 Hz
Fig. 15 [+152/0 2]S analytic free vibration mode shapes
101
5.1.3 Nonlinear Free Vibration
The nonlinear natural vibration frequencies for the NACA 0012
wings were determined analytically over a range of tip deflections
from Ocm to 20cm, assumed to result from a distributed load. The
analysis, as described in Section 3.4.2, was carried out using varying
numbers of bending, torsion, and fore-&-aft modes, to determine
how many modes would be required to accurately describe the fre-
quency variation over the desired range of tip deflections. These
various analyses were compared against a finite difference method
that exactly solved the equations of motion described by Euler angles
[Ref. 74]. However, this finite difference method ignored most
warping effects. So, for consistency, for the comparison illustrated in
Fig. 16 only, the warping term in Equation (3-58) was left out and
pure sine torsional mode shapes were used for the modal analysis
instead of the mode shapes described in Section 3.3.2.
The results of this comparison of methodologies are presented
in Fig. 16 for the [03/90] S wing. Note that because the warping
terms have been ignored, the linear natural frequencies at Ocm do
not correspond to those in Table 2.
A minimum of two fore-&-aft modes are required to suffi-
citntly describe the proper trend in first torsional frequency varia-
tion; a minimum of three torsion and three fore-&-aft modes are
required to sufficiently describe the trend in the second torsional
frequency; and a minimum of four torsion and four fore-&-aft modes
are required to sufficiently describe the trend in the third torsional
frequency. For accuracy, as compared to the exact analysis, three
102

torsion and three fore-&-aft modes seem to be necessary for describ-
ing the first and second torsional frequency variations, while five
torsion and five fore-&-aft modes seem to be necessary for the third
torsional frequency. So, in general, a minimum of three torsion and
three fore-&-aft modes are required to accurately predict the first
torsion frequency, with an additional torsion and an additional fore-
&-aft mode required for each subsequent torsion frequency.
The trends exhibited by both the exact and the modal analyses
indicate a softening trend in all the torsional frequencies - a drop of
approximately 10% in the first torsion frequency, a drop of approxi-
mately 30% in the second torsion frequency, and a drop of approxi-
mately 15% in the third torsion frequency. These trends reflect
those observed by Minguet [Ref. 74] for specimens of much higher
aspect ratio - semi-span AR=18 as opposed to semi-span AR=4 for
the current analysis - but show a less marked drop in frequency as
tip deflection increases. This less noticeable coupling is likely due to
the high stiffness of the fore-&-aft mode which comes from the large
chord-to-thickness ratio - in the current investigation, the fore-&-aft
stiffness is four orders of magnitude greater than the out-of-plane
bending stiffness. The layups are so stiff in the fore-&-aft direction
that the v component is very small, and couples only lightly into the
lower mode torsional 0 motion.
It should also be noted that the exact values are stiffer (i.e.
higher in frequency) than those predicted by the modal analysis.
This is less noticeable for the first torsion frequency, but more so for
the second and third torsion frequencies. - eg. at 20 cm tip deflec-
tion the exact and modal analyses for the second torsion frequency
103

differ by approximately 10 Hz, or about 20% of the exact value. This
discrepancy is rooted in the two assumptions of the modal analysis.
First, the modal analysis is based on an ordering scheme for moder-
ate deflections, whereas the exact analysis is valid for arbitrarily
large deflections. Also, the fact that a discrete number of modes is
being used in the modal analysis will affect the final stiffness of the
problem. The first of these two effects is the major contributor to
the discrepancy, since with more and more modes the analysis is still
converging to frequency values below those of the exact analysis.
From this comparison it can be estimated that the modal anal-
ysis is accurate up to "moderate" deflections of about 10% of the span
(or about 5 cm), and are not accurate but follow the correct soften-
ing trend for "large" deflections, i.e. above 10% of the span. If the
second and third torsional modes were directly involved in the flut-
ter analysis, then this discrepancy at large deflections would
adversely affect the analysis since the wings are likely to either be
diverged or else flutter at high velocity, and thus the typical deflec-
tion at flutter would likely be above 10 cm. However, the second
and third torsional modes are only really used in the analysis as
minor corrections to the lower modes, so the previously mentioned
discrepancy is not likely to adversely affect the final flutter analysis.
It should also be noted that for very few fore-&-aft modes the
analysis is entirely :,urious, for example 3 torsion & 1 fore-&-aft for
the 1st torsion frequency, 3 torsion & 2 fore-&-aft for the 2nd tor-
sion frequency, and 3 torsion & 3 fore-&-aft for the 3rd torsion fre-
quency. The analyses using these parameters show a rapid harden-
ing trend instead of a slow softening trend. In these cases, there are
104

so few fore-&-aft modes that the torsion/torsion nonlinear terms
(characterized by Rmnij of equation (3-157)) dominate the torsion/
fore-&-aft nonlinear terms (characterized by Hmij of equation
(3-158)).
In terms of application to flutter analysis, it is important that
while the second and third torsion frequencies show moderate soft-
ening, the first torsion frequency shows little change at all (only
2 Hz change over a range of 40% tip deflection, which is within the
error of the linear analysis presented in the previous section), and
the modal analysis matches closely the exact analysis. Since the first
torsion mode is dominant in both the coalescence of a linear flutter
analysis, or the single degree of freedom of a nonlinear flutter anal-
ysis, it is clear that the nonlinear geometric effects will have little
influence on the flutter solution. While it is true that not only the
torsion frequency will also be affected by the nonlinear geometric
effects, but also the torsion mode shape, again, because the fore-&-
aft stiffness if so large, the fore-&-aft contribution to the altered
mode shape is negligible. What little contribution there is from the
fore-&-aft mode has essentially no influence on the aerodynamics -
the fore-&-aft velocity is so small as compared to the free stream
velocity that the dynamic pressure is negligibly affected. There
would also be a contribution to the flapping rate by the rotation of
the fore-&-aft velocity from the local wing frame into the frame of
the free stream - again, this is second order and negligible because it
involves the product of two small quantities, the fore-&-aft velocity
and the angle from the local twist.
105

Fig. 17 shows the results of the modal analysis with the
warping terms included and demonstrates that the trends remain the
same and of the same order of magnitude as for Fig. 16. The second
and third torsion frequencies show the same trends of moderate
softening. The first torsion frequency exhibits slight hardening
instead of slight softening, but the increase of approximately 2 Hz
over a 40% tip deflection still remains not significant enough to merit
ignoring the geometric nonlinearities in a flutter analysis. It should
be noted here the noticeable change between Figs. 16 and 17 in
linear frequency from analysis without and with torsional warping
terms included. As noted in the previous Section 5.1.2, the warping
values are relatively small, so the first torsion frequency changes
only a small amount (approx. 21 Hz to 25 Hz, or 20% change).
However, the increased dependence of the higher modes on [3, and
the strong influence of the discontinuity of the styrofoam fairing
near the wing root, cause the changes in the second and third tor-
sional frequencies to be more noticeable (approx. 63 Hz to 79 Hz, or
25% change, and 105 Hz to 145 Hz, or 40% change).
106

". ' .i~ '""
i " . .,.e~ ............... .
.'.1......'..".(......-· .' .... i....
It '
.. . ..............--- ;:7I .......... .. ;''--- .........
e :, *: ,
',, ;. ;,' o
..... .....' ...................... .......
..3,; L
...... 2T
........... .....I iT
'%
i
m............r .........
? -A- -"'• - F
2 4
0'
-U-
-......
:
.......... L..
......
I ,m
·X ig I .. _Iv * !
I * . .
'i -.. ... . .. . .
--- O----. ------ - -
- ---- -
r r .I ' ' ' I . .I ' ' ' 1 ' I '' ' '6 8
Exact3T, IF3T, 2F3T, 3F3T, 4F4T,4F5T, 5F
O0---
0i3-- -
-_ - - -
10 12 14 16 18 20
Tip deflection (cm)
Fig. 16 [03/90 ] S wing frequency variation, torsionalwarping terms not included
107
13U'
140-
130-
120-
110-
100-
N::
4)I.
O0.
90-
80-
70-
60-
50 -
40-
30
20
10
00
!__ _____ 1 ,,,,,,I1
} r.
I
3
I
....'....-.. .. . . .......
..................
..... ..... ....
-- Z-.M-. - -
..................................
-:: T... .. ... .. .. .. . .. . .. . . .!.!z ..... 4---
.................
. . . . .
.................
. . . I . . I
·.1 u r
.i '.
I,
.............. .......... .... I.
... . b... .... -:.................I , . .. ... . . .. . .
0
. -. 4--1 -.... ...................... 1..... .... ..
,
. X3-
I
-. ~?·~I··~-·
... . ........................................ ....... .....
: I
:I: - .. .... .. .... ....... I.... -. . ..
JO
..................1. .... .. ..
. . . -_- -j . ......
............... ..
.. .. .. .. .. ..
.......... ....... !.. .... ...... .. !"'I' "" I",
... , .................? *. fz- - . ..
~ . ,- - -- . -$ ............. 7:·I
.............. ............ I....
.. .. . .. . .. 7I........ 0 ...I
I
, .............
................II
. --- ~ v _ . _ _ __ ._ _

Tip deflection (cm)
17 [03/ 9 01s wing frequency variation,warping terms included
torsional
N
-I
:t
OH .
Fig.
108

5.1.4 Two-Dimensional Aerodynamics
Different analysis methods for two-dimensional coefficient
hysteresis for a NACA 0012 airfoil in low Reynolds number flow are
compared against one another in Figs. 18 and 19. The analysis
methods that are compared are constant coefficient harmonic bal-
ance, non-constant coefficient harmonic balance, and fourth-order
Runge-Kutta time marching. The purpose of comparing these analy-
sis methods is to determine first, whether non-constant coefficients
are required instead of constant coefficients, and second, whether a
harmonic analysis is sufficient to accurately describe the hysteresis
loop as compared against a method that is presumably an exact solu-
tion to the equations of motion.
Fig. 18, for a moderate amplitude of oscillation of 40, over a
range of reduced frequencies from 0.10 to 0.25, indicates that the
non-constant coefficient analysis compares favorably against the
exact Runge-Kutta analysis. This figure also indicates the major
deficiency of the constant coefficient analysis: since the coefficients
are constant, there is no nonlinear coupling between the mean of the
force coefficient (CLo in Fig. 18) and its other harmonic components,
and therefore there is no dependence of the mean on the reduced
frequency. However, it is clear from the non-constant and Runge-
Kutta analyses that the mean of the force coefficient is in fact
strongly influenced by the reduced frequency.
Table 3 indicates more clearly the appropriate trends for the
first harmonics, which are the harmonics that are likely to be most
dominant in a full flutter analysis. For the moderate amplitude of
109

oscillation of A 1=4, both the Runge-Kutta and non-constant analyses
indicate a decrease in mean force coefficient as reduced frequency
increases (of about 20% from k=.10 to k=.25), while the constant
coefficient analysis shows no change. This is because the constant
coefficient analysis has no coupling between the harmonics and the
mean, so the mean value remains unchanged as long as the oscilla-
tion amplitude, Al, remains unchanged. While the non-constant
analysis doesn't exactly match the exact Runge-Kutta analysis, and
drops more quickly with reduced frequency, the values are within
10% error relative to the Runge-Kutta analysis.
The in-phase, sine components follow the same trend for the
Runge-Kutta and non-constant analyses and are relatively close in
magnitude - there is a slight drop in sine values from k=.10 to k=.15
then an approximate doubling from k=.15 to k=.25. The Runge-Kutta
and non-constant analyses are within 35% of one another for the sine
components. However, the constant coefficient analysis rises contin-
uously from k=.10 to k=.15 to k=.25. It would be expected that the
sine values would be fairly close for all analyses, since the in-phase
component is governed principally by the linear static slope.
The out-of-phase, cosine components match well for the Runge-
Kutta and non-constant analyses (within 25% of one another), show-
ing an increasing trend with reduced frequency, while again the
slope for the non-constant analysis is greater than that for the
Runge-Kutta analysis. However, the constant coefficient analysis
shows a different trend, namely a slight rise from k=.10 to k=.15
then a large drop of approximately 25% at k=.25 - this has serious
repercussions for a flutter analysis since the out-of-phase term is an
110

important indication of the work being performed by the fluid flow.
This 2-dimensional aerodynamic analysis indicates that the constant
coefficient analysis is probably inappropriate for producing accurate
flutter results.
Fig. 19 shows that the non-constant coefficient analysis breaks
down for very large amplitudes of oscillation, in this case A1=100 . In
general, the non-constant coefficient analysis is only valid to ampli-
tudes of oscillation in the range of 50 or 60. Table 3 shows that the
mean and sine components are still moderately close for the Runge-
Kutta and non-constant analyses (within 10-20% of one another),
however the out-of-phase cosine component - while still exhibiting
the same increasing trend for both methods- remains about 300% off
for all values of reduced frequency. This is another indication that
even when only considering the first harmonics, the harmonic anal-
ysis begins to break down for large amplitudes of oscillation. Again,
the constant coefficient analysis indicates an unchanging mean value
(since there is no nonlinear coupling between the harmonics), while
the sine and cosine components are even further off the mark at
A = 100 than for the moderate amplitude of A 1=40.
At first glance, from looking at the values for k=.10 and k=.15,
one might conclude that the mean values decrease as amplitude of
oscillation increases, but this is not the case. Instead, the trend
changes with increasing amplitude of oscillation - that is, the mean
decreases for increasing reduced frequency at A1=40 , but the mean
increases for increasing reduced frequency at A1=100 . So, for
increasing amplitude of oscillation, the mean drops at low reduced
frequezcies and rises at high reduced frequencies, and there is some
111

point between k=.15 and k=.25 for which it does not change at all. A
similar change is also noticed for the sine component - the sine com-
ponent generally increases for increasing reduced frequency at
A 1=-4, but the sine component decreases for increasing reduced fre-
quency at A1=10. It is difficult to attribute physical interpretations
to these trends because of the high nonlinearity of the formulation.
Overall, with the two harmonics also taken into consideration,
the analytic hysteresis loops look odd at an oscillation amplitude of
A1=10 ° in Fig. 19. The loops appear to not have enough stall delay,
drop too low and too quickly into stall after the stall delay, and
return too suddenly from nonlinear stall to linear behavior in return-
ing below the stall angle. This odd behavior is likely due to the fact
that the fixed-time stall delay, A, has been smeared over the entire
cycle, making the apparent delays within specific portions of the loop
seem incorrect.
Fig. 20 is an example of experimental data from Ref. 5. While
this data does not match the analysis - 5x10⁵ Reynolds number as
compared to 2x10 5 for the analysis in Figs. 18 & 19 - it is worthy to
note that the trends in the experiment are similar to that of the
analysis at moderate amplitudes of oscillation. The two harmonic
Fourier components of the data are also presented in Fig. 20.
It was also attempted to compare the analysis against results
produced by the Upwind Approximate Factorization Navier-Stokes
(UPWAFNS, a.k.a. CFL2D) computational fluid dynamics code
[Ref. 30]. However, because of the large amplitudes being consid-
ered here, the CFD analysis proved to be unsuccessful in satisfactorily
reproducing the experimental results of Ref. 5 presented in Fig. 18.
112

AO=10
A1=4
k=.10
AO=10
A1=4
k=.15
AO=10
A1=4
k=.25
AO=10
Al=10
k=.10
AO=10
Al=10
k=.15
AO=10
Al=10
k=.25
RK =-NC =CC =
RK
.699
.690
.578
.512
.519
.644
sin(kr)
.740
.711
.520
.509
.572
.886
cI
.765
.765
.765
.567
.567
.567
RK
.150
.137
.222
.347
.293
.125
.098
.091
.259
.381
.257
-.089
(C
.185
.284
.339
.223
.169
.317
RK
.114
.153
.229
.010
.023
.106
.098
.196
.242
-.004
.062
.329
(c
.218
.236
.174
.142
.321
.740
Runge-Kutta analysisnon-constant coefficient analysisconstant coefficient analysis
Table 3. 1st harmonic components of 2-dimensionalaerodynamic analysis
113
I mean0w .
cos(k2r)l _
_.I

AO=10
A1=4°
k=.10
A 0=10
A1=40
k=.15
0 5 10 15 20Theta (deg)
Fig. 18 2-dimensional liftanalysis for NACA
coefficient0012 airfoil,
hysteresisRe=.2E6
1 C
AO=100
A1=40
k=.25
loops,

Theta-)
AO= 100
A 1=100
k=.10
AO= 100
A1=10
k=.15
(deg)
0 5 10 15Theta (deg)
Fig. 19 2-dimensional lift coefficientanalysis for NACA 0012 airfoil,
hysteresisRe=.2E6
AO=100
A 1=10
k=.25
20 25
loops,
115

A0=9.820
A1=9.90
k=. 104
Theta (deg)
Theta (deg)
AO=9.80
A 1=9.920
k=. 151
5
0 5 10 15Theta (deg)
A0=9.780
A 1=9.930
k=.253
20 25
Fig. 20 2-dimensional lift coefficient hysteresis loops,experiment for NACA 0012 airfoil, Re=.5E6
I

5.2 Flutter Analysis
5.2.1 Linear U-g Analysis
The analytic results for classical, linear divergence are pre-
sented in Table 4 for the laminates of interest using the three-
dimensional, linear aerodynamics described in Section 3.5.1. The
U-g plots from which these values are generated, using three bend-
ing mode shapes and three torsional mode shapes, are shown in Figs.
21 to 23. As expected, the [03/ 90]S wing has a torsional flutter
velocity very near its divergence velocity, the [+15 2/02]S wing has a
torsional flutter velocity just above that of the [03/90]S wing, and the
[- 1 5 2/02]S wing has a divergence velocity well below its torsional
flutter velocity.
For the [03/9 0 ]S layup, the linear flutter velocity, VF, is approx-
imately equal to the linear divergence velocity, VD, because there is
no bending-torsion coupling and the elastic axis is at the midchord -
both are near 28 m/s which is just below the experimental wind
tunnel limit. The flutter frequency, oF, is the typical coalescence fre-
quency of a linear flutter analysis and, as seen from the U-g plot in
Fig. 21, results from the drop of the first torsional frequency o 1 T
from 24.6 Hz to 11.9 Hz, while the first bending frequency co B
drops from 4.3 Hz to 0 Hz (i.e. divergence). The combination of the
flutter velocity and the flutter frequency yield a reduced frequency
of approximately 0.15, indicating that any nonlinear analysis applied
at this point is within the valid range discussed in the previous
section. The divergence velocity is in fact slightly below the flutter
velocity, so in a real flutter situation one would expect stalling at the
117

point of flutter initiation, even at root angle of attack of R=00.
However, one would also expect this stalling to be light, since the
nonlinear effects will just be beginning to come into play so as to
hinder the exponential growth in deflection due to divergence. It is
not possible to predict the dependence of the flutter characteristics
on an increasing root angle of attack a R since the aerodynamics are
stalled, and hence will likely affect both the flutter velocity and the
flutter frequency.
For the [+15 2/02]S layup the linear divergence velocity is much
greater than the linear flutter velocity due to the "negative" bending-
torsion coupling of the layup - that is, because positive bending
induces negative twist. As noted in Section 5.1.2, the flutter charac-
teristics have more to do with the natural mode shapes than the nat-
ural frequencies, since the natural frequencies remain relatively
unchanged for all the layups. The behavior of the first torsion mode
is almost identical to that of the [03/ 9 0]S layup: as shown in Fig. 22,
the first torsion frequency OlT drops from 23.5 Hz to 11.6 Hz by the
time the damping ratio crosses the zero axis at 26.9 m/s. However,
the first bending frequency continues to rise from .9 Hz, and the
damping ratio in bending continues to decrease, never crossing the
zero axis. However, this might be simply due to the fact that the U-g
analysis has not been carried out to a high enough velocity - there
might in fact be a velocity high enough that the bending-torsion
coupling becomes too weak to counteract the positive twist created
by the increasing moment induced by the associated increasing
dynamic pressure. Therefore, the notation of "" in Table 4 is only
meant as an indication that the divergence velocity might be very

large, and is certainly out of the range of the velocity plotted in
Fig. 22 and out of the range of the actual wind tunnel experiment.
In a real flutter situation with the [+15 2/0 21S layup, stalling
would again be expected, but not for the same reason as divergence
as for the [0 3/90]S layup. Instead, it would be expected that the
amplitude of oscillation would grow exponentially until it reaches the
stalling regime, at which point the stalling would hinder further
growth and induce limit cycles. Therefore, certain characteristics can
be predicted within the range of root angle of attack aR below the
static stall angle. First, it can be expected that the flutter velocity
and frequency will remain relatively unchanged since the flutter
response will be governed by linear aerodynamics (with slight cor-
rections to rotate the aerodynamic forces through aR into the local
wing coordinates), and the nonlinear aerodynamics will only act as a
limiting factor. It is in this limiting factor that the characteristics will
change with increasing root angle of attack: as aR increases, smaller
and smaller amplitudes of oscillation will be required to reach the
stalling regime and induce limit cycles. Therefore, as the root angle
of attack is increased, it is expected that the flutter velocity and fre-
quency will remain unchanged while the amplitude of oscillation
decreases. This trend seems counter-intuitive at first - one gener-
ally expects increasing response (whether steady deflection or
unsteady oscillation) with increasing load due to an increased root
angle of attack.
For the [-15 2/0 2]S layup the linear divergence velocity is much
below the linear flutter velocity because of the "positive" bending-
torsion coupling - that is, because positive bending induces positive
119

twist. In a general physical sense, divergence is induced because an
aerodynamic load causes a positive twist, which induces further
aerodynamic load, which causes further twist, and so on, in a cascad-
ing effect. With the "positive" bending-torsion coupling, the increas-
ing aerodynamic load also induces an increased bending, which also
induces further twist, and thus "aggravates" the divergence effect.
That is, because of the bending-torsion coupling, the velocity at
which this effect continues to cascade (i.e. grow exponentially)
instead of converging to a steady deflection is lower than for a layup
with no bending-torsion coupling, such as the [03/ 9 0]S layup. The
U-g diagram for the [-1 5 2/0 2]S layup, shown in Fig. 23, indicates a
different behavior for the torsional mode than the two previously
discussed layups. The behavior shows no sharp rise in damping
ratio, and no sharp drop in the torsion frequency colT just before the
onset of flutter - as is the case for the [03/90]S and [+1 52/02]s layups
in Figs. 21 and 22 - but is instead more gradual.
In a real aeroelastic situation, these results would indicate that
the wing would likely experience divergence, whose growth would
probably be limited by nonlinear aerodynamic effects. Whether such
a growth would trigger any kind of oscillatory response is not pre-
dictable by the U-g analysis. It might also be possible to achieve
flutter at the higher, linear flutter velocity, but this is unlikely. First,
because of divergence, the wing might possibly break at such a high
velocity. Second, again because of divergence, at the higher, linear
flutter velocity the aerodynamics will be in deep stall, and will be
very different from those used to predict the linear flutter velocity
in the first place.
120

Therefore, the U-g method has various degrees of applicability
in predicting flutter characteristics for a range of bending-torsion
coupling. For the [03/ 9 0]s layup, the U-g method is likely to accu-
rately predict the correct flutter velocity and frequency at root angle
of attack aR=O, but one can only estimate trends for increasing aR.
For the [+1 5 2/0 2]S layup, the U-g method will accurately predict the
flutter velocity and frequency characteristics over a wide range of
root angles of attack up to the static stall angle, although it can only
be used to estimate the trend in limit cycle amplitudes over that
range. For the [-1 5 2/0 2]S layup, the U-g method will likely predict
the correct onset of an aerodynamic instability at the divergence
velocity, but what type of instability - whether divergence or
oscillatory - is uncertain. As with the [03/90]s layup, it is difficult to
predict the behavior for increasing root angle of attack aR.
121

[03/90]s[+ 1 52/02] s
[-152/02] S
NACA 0012 WINGS U-g ANALYSIS RESULTS
VD, Divergence VF, FlutterVelocity (m/s) Velocity (m/s)
OF, FlutterFrequency (Hz)
28.20 28.27 11.86
o0 26.89 11.64
18.04 35.60 13.34
Table 4. Linear divergence and flutter characteristics
122

I 11
._
C)
0C-)O
m
em
Velocity (m/s)
150
125-
100
75
In
25
0
I -
I -
0 10���* liii 'I
20 30 40 50 60 70Velocity (m/s)
8 . 0
80IIl90
90I
Fig. 21 [ 0 3/9 0] s U-g diagram
123
N
C)0)
LLr
.IA..................
3B
2T
2BI................. .................
lw =11.9 HzII :
1BI
100
I -I-
. . .- - -
il l I I II - - - .
- - - .- -.--- -
I i .... ... . . . . . . .
................ : n.. . . . . . .. i...--......... .. .. .. .. .. ...... . ........ L ........... ..........-
..................................
..................
---JIT
.................I .................. ..... ..... .... .................·-·-�L: .................
. ..............-4cZt
..................
"IN
j.................
*i
.7C i
i
.__: I
--c,
ell
g
I
g
J
! II 1 I . II I l 1r r' I r 1 I1 " 1 r I r

0c
O
CO42:
*
N
c)v3
44
Fig. 22 [+152/02] s U-g diagram
124
1

1 n
0Co
o4;)O0
Velocity (m/s)
9090 ............. .................. , .................. .................. . .................,.......... .................·. ................. ................... .................
*80i ii
0 .................. ..................]l - - .... t 1111-1-1r1111--L................ L...... . ....... .... . .................9o-~~~~~~~~~~~~~~~~~~~~~]................. ... 4. ¢.. ¢,~~~~~~~~~~~~~~~] 2 _T~.- .....70~~
0 ................. .................................................. ........ .......... ................... .................
0 .................. .................. .................. ................. ................... .................................... ..................................... .................
3o .................. : .................: .................~ .................-................................................ .................................................... ... - _ . _ .2T20 ................. ........... ............
... . ............. . ... .................
I :0050 -____'-30 . is L 0:;0 .320- ..........
10- ...
lo-, ... _
N
C:
;..,,),,.
Velocity (m/s)
Fig. 23 [- 1 52/ 0 2]s U-g diagram
125
1nn1
O 10 20 30 40D 50 60 70 80 90 100A

5.2.2 Flutter Boundaries
The experimental and analytic flutter boundaries (i.e. for very
small amplitude oscillation) are presented in Figs. 24 to 26. Each
graph demonstrates some of the expected trends for each of the
[03/90]s , [+152/02] S, and [-1 5 2/0 2]S layups that were predicted by
the U-g analysis, but quantifies these trends in a way that the U-g
analysis could not.
Fig. 24 for the [03/90] S laminate starts at the linear flutter
velocity but immediately begins to exhibit nonlinear behavior
because the linear flutter velocity is so close to the divergence veloc-
ity, as would be expected from the U-g analysis. That is, the diver-
gence and exponential growth of flutter into the stalling regime only
limit the growth to limit cycles, but do not significantly alter the
linear results that could be derived by the U-g analysis, otherwise
the nonlinear results would be further from the linear results at root
angle of attack aR=0°. An increase in the root angle of attack a R
causes the flutter velocity to drop and the flutter motion to become
more purely torsional (denoted by a frequency closer to the first
torsion free vibration frequency and a decrease in the bending
amplitude).
For values of the root angle of attack up to the static stall angle,
this behavior is governed by "light" stalling, i.e. where the major
portion of the wing is oscillating across the static stall angle, back and
forth between the stalled and unstalled regions. The flutter velocity
drops smoothly and slowly as the root angle of attack increases, by
about 1 m/s per 1 increase in a R - as the root angle of attack
126

increases, the distributed load consequently increases, and the wing
would twist further into stall, except that the velocity decreases so as
to decrease the dynamic pressure, thus counteracting the positive
twist, and keeps the wing only in light stalling. Also, as the flutter
velocity drops, the flutter frequency consequently rises toward the
first torsional natural frequency - again, because the stalling effects
only induce the limit cycles and do not strongly affect the linear
aerodynamics, this is the same as travelling backward along first
torsion branch of the frequency plot derived by the U-g analysis.
After the root angle of attack reaches the static stall angle, the
flutter behavior begins to be governed by "deep" stall, that is, the
changes in characteristics of the vortex shedding as the flow gets
pushed further in the stall regime - characterized mathematically by
the parameters al, r1 , and el in equations (3-94) to (3-96). The
flutter velocity continues to decrease smoothly, and the flutter fre-
quency continues to increase smoothly toward the first torsional nat-
ural frequency, indicating a strong dependence on deep stall charac-
teristics. If the deep stall characteristics were in fact weak, then the
flutter velocity and flutter frequency would show little change past
the static stall angle since both the aerodynamic linear characteristics
and the nonlinear stalling characteristics would change very little (CL
levels off past stall, while CM continues to drop, but only slowly - see
Appendix C). These trends indicate that in designing an airfoil for
flutter purposes, it might be desirable to do so such that the deep
stalling characteristics change as little as possible from the light
stalling characteristics, so that the flutter velocity in deep stall
remains as high as possible. This objective, however, might not
127

prove possible since, as noted in early dynamic stall studies
[Refs. 1-5], the characteristics of deep stall tend to be independent of
airfoil geometry.
It should also be noted that experimentally, at root angle of
attack a R= 1 l, simultaneous bending and torsion flutter were
observed at the divergence/flutter speed (although only the experi-
mental, torsional flutter speed is plotted on Fig. 24). The wing
would "flap" at large amplitudes of oscillation in bending then,
intermittently, would cease flapping and instead oscillate in a tor-
sional manner. This observation seems to indicate the strong cou-
pling of both divergence and flutter in the linear regime.
Fig. 25 for the [+15 2/02]S laminate shows a more extended
range of linear aerodynamic behavior as would be expected from the
linear U-g analysis (because the divergence velocity is very high and
the tip twist is negative) and a very sharp change in the flutter
behavior once it goes into the nonlinear stall region. The linear
region of the behavior is valid up until the root angle of attack aR
reaches the static stall angle. This behavior is because of the
bending-torsion coupling: as aR increases the distributed load
increases, causing increased deflection, and thus inducing negative
twist which counteracts the positive twist from the increased dis-
tributed moment. In the case of the [+15 2/02] S layup, this effect is
large enough so as to actually produce a negative twist, but it would
be possible that with a weaker negative bending-torsion coupling the
effect would only cause a small, but still positive, twist.
The analysis shows an almost linear trend up to the static stall
angle - the only deviation is due to the rotation of the aerodynamic
128

loads from the free stream coordinates into the rotated, local wing
coordinates. The analysis also remains almost linear for a short
range past the static stall angle, up to about aR=1 3 - the negative
twist keeps the majority of the wing unstalled so that while the root
of the wing is stalled, it has little effect on the overall aerodynamics
governing the flutter behavior.
Once past the linear region, the flutter behavior goes into deep
stall very quickly. This is because by the time the tip finally reaches
stall, the root must already be in deep stall because of the negative
twist. As the root angle of attack is then further increased, the twist
remains essentially unchanged - since the force coefficient curves
level off, no more distributed aerodynamic load is generated - so
there is no longer any increasing negative twist to counteract the
increasing positive angle of attack, and the wing quickly goes into
deep stall. In other words, the transition through light stall is unlike
that of the [03/90]S layup, and is very short and very sudden. As the
light stalling characteristics become less dominant (eg. for an airfoil
geometry for which ro might be smaller), it would be expected that
this quick drop would become even more sudden, since the behavior
would lock into the deep stall characteristics more quickly.
Therefore, a wing with the type of bending-torsion coupling as the
[+ 1 5 2/0 2]S layup is beneficial in terms of divergence, but the drop in
flutter velocity due to stalling might prove to be sudden and unex-
pected. For example, a brief change in perceived angle of attack of
only 30 - eg. from R=14 ° to aR=1 7 - might drop the flutter veloc-
ity by half its value, while such a small change in angle of attack for
129

the [03/90]S layup would only induce a moderate change in flutter
velocity.
The experimental flutter velocity values for the [+152/02s
layup show a smoother trend from linear behavior to nonlinear,
stalled behavior than does the analytic prediction. Most noticeably,
the experimental flutter velocities drop by 4 m/s between root
angles of attack a R = 1 and aR- 11 . There are several possible
explanations for this discrepancy. First, there might be unmodeled
structural nonlinearities that are unaccounted for in the current
analysis. The experimental drop in flutter velocity indicates that
there might be an additional softening trend - this might be
accounted for by additional geometric nonlinearities, or by cubic
stiffening. However, neither of these possibilities seems likely since
the inclusion of geometric nonlinearities did not produce this soften-
ing trend in the linear aerodynamic region, and cubic stiffening
would produce a hardening effect instead of a softening effect.
Second, the aerodynamics might not be totally linear just below the
static stall angle. In fact, some previous investigations use a
parabolic drop just before the static stall angle (see Appendix C),
while the current investigation overpredicts the lift coefficient near
the static stall angle. This consideration would have the same effect
as the light stalling for the [03/90]s layup, and would more smoothly
decrease the flutter velocity. This is likely to account for a large part
of the discrepancy, but would make the analysis more difficult since
it would require more describing regions and higher order approxi-
mations than the current analysis. Third, 3-dimensional spanwise
aerodynamics effects might also affect the flutter calculation. While

the spanwise drop used to taper the aerodynamic load as it reaches
the tip (see Appendix C) is fairly accurate for no twist, it tends to be
less accurate for either negative or positive twist (see Landsberger
[Ref. 921 for comparison of currently used strip theory against
3-dimensional lifting line theory). This effect might also account for
some of the discrepancy, though probably very little since the linear
coefficients of the approximated Theodorsen function still remain
unchanged at each spanwise location.
The discrepancy in frequency in Fig. 25 is easier to account for.
First, it is difficult to begin with to accurately get the flutter fre-
quency for frequency coalescence. As can be seen in Fig. 22, the
flutter frequency changes very quickly in the range of the flutter
velocity, so that any slight structural damping, which might move the
zero axis of the damping coefficient and hence slightly alter the flut-
ter velocity, will consequently strongly affect the flutter frequency.
Second, the first bending and first torsion free vibration frequencies
of the [+15 2/0 2]S (as listed in Table 2) are in the range of 1 Hz off in
comparing experiment to analysis, so it can only be expected for a
frequency coalescence phenomenon that the results will show error
in the same order of magnitude.
Fig. 26 for the [-15 2/0 2]S laminate indicates a much different
trend where the flutter is characterized by a low, first-bending fre-
quency and immediate nonlinear, bending stall flutter in the range of
the divergence velocity - there is no portion of the flutter graph
here which could have been predicted by a linear analysis. As with
the [03/9 0] S layup, the behavior seems to be governed by light stall
dynamics for a root angle of attack up to the static stall angle. That
131

is, the flutter behavior is triggered only at the very onset of diver-
gence, where the major part of the wing is just starting to straddle
the static stall angle, instead of at a higher velocity, where the wing
would be twisted even further into stall because of divergence.
Again, as with the [03/90] S layup, an increase in the root angle of
attack induces a smooth decrease in the flutter velocity of just less
than 1 m/s per 10 increase in a R, as if to keep the governing behav-
ior just bordering. the stall regime, neither fully entering either the
fully linear or the fully nonlinear, stalled regions. The analytic
behavior past a root angle of attack equal to the static stall angle, i.e.
in deep stall, also follows the same trend in flutter velocity as the
[03/90] S layup, namely that the deep stall characteristics are strong
enough so that the flutter velocity continues to decrease at approxi-
mately the same rate as for light stall. The experimental behavior
for the [-152/02] S layup is very different in deep stall than for the
[03/90] S layup - perhaps, unlike the [03/90]S layup, the aerodynam-
ics do level off, and the flutter velocity remains relatively
unchanged. However, the deep stall data is represented by only one
data point at aR=150, so it is uncertain whether the discrepancy is
due to spurious experimental data or poor analysis.
The trend in flutter frequency for the [-152/02]S layup differs
quite markedly from that of the [03/90] S layup. Instead of starting
at the linear frequency coalescence value, it starts at just below
2 Hz, that is somewhere between 0 Hz and the first bending natural
frequency of 4.0 Hz. The effect is likely analogous to that of the
[03/90]s layup: the nonlinear stalling features do not play a signifi-
cant role in changing the linear aerodynamics, but instead govern the
132

limit cycles and hence determine at which point on the U-g diagram
the solution shifts in accordance with an increasing root angle of
attack. So, near the divergence velocity, the flutter behavior is gov-
erned by the first bending mode (which has the lowest associated
damping ratio as seen in Fig. 23) and as the root angle of attack aR is
increased, thus decreasing the flutter velocity, the flutter frequency
consequently increases toward the first bending natural frequency,
as if following the first bending branch of the frequency plot for the
U-g analysis. The only portion of Fig. 26 that could directly have
been predicted by the U-g analysis is the velocity at which the
aeroelastic instability first occurs. The U-g analysis would have
predicted divergence, but could not have predicted the possible oscil-
latory nature of the instability, its frequency, or the ensuing trend
with increasing root angle of attack - these would require the non-
linear, stalled analysis.
All three figures indicate that as the root angle of attack aR is
increased, the flutter velocity - whether bending or torsional -
decreases, and the flutter frequency tends toward the associated
linear, natural frequency. The parameter of bending-torsion cou-
pling determines whether the flutter frequency will start as coales-
cence of the torsion with the bending mode, or will start near the
first bending frequency, and whether the decrease in flutter velocity
with root angle of attack will be smooth or sudden. The previous
study [Refs. 94 and 95] was unable to experimentally investigate
the phenomenon of sudden transition from linear flutter to non-
linear, stalled flutter because of the velocity limitations of the wind
tunnel.
133

Root angle-of-attack (deg)
T.................IT
I ..............
0O c 1.9 Hz................. ................... ..................
........ 3B,3T analysis .............
=4.................. H.=43 0lB
2 4 8 10 12 14Root angle-of-attack (deg)
16I I I
18 20
Fig. 24 [03/90] S flutter boundary and frequency variation
134
Mu
25
20
)if 10
5
0
u
25
20-N
o 15-
4)r, 10-
5-
n_U
0
I .
_ I ,
- --- · - . . fl -- . - - - -- . .
- - . . - - . . . . . .
4aa
1% ̂
...................i..................
.......................................
-2'4.6 .
.................. I................. ................
* rm~~~~~i~~~~
................... ..................·........... ·.....z
. .. Il I I
! l . . . I· I' ' l .I i

30
25
)n
WV-I
15
1.
> 10
5
0
.1 Root angle-of-attack (deg)
IU
25
20N
o 15
LL 10
5
Root angle-of-attack (deg)
Fig. 25 [+ 1 5 2/02]s flutter boundary and frequency variation135
AA

JU
25
20
> 15c)
10> 10
5
0
Root angle-of-attack (deg)
3U
25
- LUN:z
15
I-
L 10
5
0
Root angle-of-attack (deg)
flutter boundary and frequency variation
)
Art
Fig. 26 [-15/021S

5.2.3 Large-Amplitude. Nonlinear Flutter
The experimental and analytic flutter characteristics for
increasing amplitudes of oscillation are presented in Figs. 27 to 32.
The pairs of figures (Figs. 27 and 28 for the [03/90 s layup; Figs. 29
and 30 for the [+1 5 2/0 2]S layup; and Figs. 31 and 32 for the
[- 1 5 2/0 2]S layup) contain (a) the graphs of the time-averaged mid-
chord tip deflection and of the time-averaged total tip angle (the sum
of the root angle of attack and the tip twist), and (b) the graphs of
the midchord tip deflection amplitude of oscillation and of the tip
twist amplitude of oscillation, all for increasing velocity with constant
root angle of attack (R=10, 50, 100, and 150). For each line of con-
stant root angle of attack caR, both the full, unsteady flutter analysis
(dashed lines on Figs. 27, 29, & 31; solid lines on Figs. 28, 30, & 32)
and the steady, static analysis (unsteady terms suppressed) (solid
lines on Figs. 27, 29, & 31) are presented, so as to show where the
two meet (equivalent to the flutter boundary). Likewise, both the
steady, static experimental data and the unsteady, flutter experi-
mental data are presented. This experimental data is gathered from
two sources: video recordings of tip deflections (hollow symbols) and
converted strain gauge readings (solid symbols). (The root strain
gauge bending and torsion readings were converted to approximate
tip deflections by assuming the same shape for the spanwise dis-
tributed load as described in Appendix C).
Note that the analysis has been conducted without including
fore-&-aft modes, only bending and torsion modes. This is because,
as noted in previous sections, these modes have little effect on the
137

frequency and mode shape of the first torsional mode, which is the
the dominant torsional mode in both linear and stalled flutter of the
[03/901S and [+152/02] s layups, and has no effect on the first bending
mode, which is the dominant mode for the [-152/021S layup.
Graphs in Fig. 27 for the [03/90]s laminate show the same
trends in analysis: both the midchord tip deflection and total tip
angle show a sharp decrease when the velocity is increased past the
flutter boundary. These analytic trends compare favorably for root
angles of attack acR=1° & 5°, but less well for aR=10 & 150°.
The averaged tip deflections for the [03/90]s layup show the
typical characteristics of divergence. For low root angles of attack,
the tip deflection remains relatively small just up until the point
where the divergence speed is reached. If in fact the root angle of
attack were aR=0 ° , then the deflection would remain zero until the
divergence speed, then would "jump" to an asymptotic stalled behav-
ior [Ref. 94]. For higher root angles of attack above the static stall
angle, eg. aR=100 & 150, the tip deflection variations are almost
identical - since the entire wing is past stall, the distributed load
remains the same irrespective of the root angle of attack, and conse-
quently the bending deflection is identical and only dependent on
the increasing dynamic pressure.
The experimental values show identical trends as the analysis,
although shifted slightly. At worst (i.e. at divergence/flutter for
OaR=l° or 50) they are 5-7 cm lower than the analytic predictions of
20-25 cm; near moderate deflections of approximately 10 cm the
experimental values are 1-2cm below the analysis. Since the
behavior is highly nonlinear and involves rapid changes in deflec-
138

tions, these discrepancies between experiment and analysis seem
within reason. However, the discrepancy between experimental
values for R= 1 0 ° and a R = 1 5 ° indicate that the assumption of
unchanging static aerodynamic characteristics past stall is slightly
inaccurate - since the experimental deflections for the higher root
angle of attack are in fact larger, it can be deduced that the aerody-
namic coefficients do not in fact level off, but continue to rise
slightly. The trends in averaged total tip angle for the [03/90]S layup
are essentially the same as for the averaged tip deflection, since the
two ae in fact coupled in producing the divergence phenomenon, but
the correlation between analysis and experiment happens to be
much closer.
The analysis in Fig. 27 predicts a sharp drop in both tip
deflection and tip angle for R=1 ° & 5 as the amplitude of oscillation
increases past the flutter boundary. The drop in deflections is likely
due to the dependence of mean load on amplitude of oscillation at
low reduced frequency, as described in Section 5.1.4 for the 2D
aerodynamic analysis. The reason the drop is so sudden is because,
as noted in Section 5.2.2 for the flutter boundaries, when the root
angle of attack is below the static stall angle the behavior is still
essentially governed by the linear aerodynamics, so the oscillation
growth is still essentially exponential up until deep stall is reached.
Therefore, it would be expected that a small change in velocity would
produce a large increase in amplitude of oscillation. This prediction
matches the experiment fairly well for aR=1° & 5 in both Figs. 27
and 28. As the oscillation growth then continues within the deep
stall region, the intuitive physical sense is that a hardening trend will
139

occur - that is, larger and larger velocities will be required to create
larger amplitudes of oscillation. This assumption is borne out by the
experiment, especially clear in the tip angle oscillation graph in
Fig. 28, but is not well predicted by the analysis Instead, the anal-
ysis shows hardening with a softening trend, that is, the increase in
velocity required to produce the same increase in amplitude of oscil-
lation progressively gets smaller and smaller. This is likely due to
the poor prediction of the out-of-phase terms of the nonlinear aero-
dynamics at higher amplitudes of oscillation, as discussed in
Section 5.1.4. The oscillation amplitude in bending in Fig. 28 indi-
cates, as expected, that the nonlinear flutter phenomenon is single
degree of freedom in torsion.
The characteristics of oscillation for the [03/90]s layup for
aR=10 and aR=150 are essentially the same as for the low root
angles of attack of aR=1 0 and aR=5 0 , except that there is no sudden
change through light stall to deep stall because the wings are already
in deep stall from the root angle of attack. This means that the
change in mean deflections is less pronounced than for aR=1 0 & 50,
but still follows the trend of decreasing with increased amplitude of
oscillation, again because of the same nonlinear aerodynamic effects.
For example, at a R = 1 an increase in velocity from 27 m/s to
28 m/s produces a 90 drop in twist, while at aR=10 ° an increase in
velocity from 17 m/s to 22 m/s is required to produce the same
drop. This tends not to match the tip deflection experimental data,
which continues to increase, while the tip angle experimental data
shows different trends for the video and strain gauge data.
140

The discrepancy in tip deflection indicates that there should be
an increase in aerodynamic loading with oscillation amplitude in
deep stall, while the trend might be the opposite in light stall. This
discrepancy indicates a deficiency in the aerodynamic model that
might be attributed to the "smearing" of the fixed-time stall delay.
That is, it is convenient to smear the fixed-time stall delay over the
hysteresis loop when the oscillation straddles the stall angle (i.e. light
stalling); but it is probably inappropriate to do so when the entire
hysteresis is above the stall angle and there is in fact no fixed-time
stall delay (i.e. deep stall). The discrepancy in experimental data
between video data and strain gauge data indicates that the assump-
tion in converting the strain gauge data to tip angle is probably no
longer valid -- there are likely higher modes that are starting to come
into play for cR=100 & 150 that drastically alter the root curvatures.
A better method of comparison would to compare the experimental
strain readings against the predicted values derived from the root
curvatures of the mode shapes.
Again, the experimental trends for aR=100 & 150 for the
[0 3/90]S layup follow physical intuition: they are already in deep
stall so a hardening effect is observed such that greater and greater
velocity is required to produce larger amplitudes of oscillation.
Again, as with the low root angles of attack, the analysis predicts the
initial growth fairly well but breaks down as the amplitude of oscil-
lation grows from moderate to large, showing an analytic softening
trend counter to the experimental hardening trend. And again, as
with the low root angles of attack, the small bending oscillation
141

amplitudes indicate a single degree of freedom phenomenon in
torsion.
Fig. 29 for the [+15 2/0 2]S layup shows the characteristics typi-
cal of negative bending-torsion coupling. Increasing velocity induces
increased negative twist, as exemplified in the tip angle plot, thus
precluding any sharp rise in tip deflection, as seen in the tip deflec-
tion plot. Even up to a root angle of attack of oaR=150, the flutter ini-
tiation is essentially governed by linear aerodynamics. Therefore,
the oscillation growth is nearly exponential, until it is checked by the
stalled aerodynamics.
This exponential growth behavior is most clear on the tip angle
oscillation amplitude graph of Fig. 30, in which the oscillation ampli-
tudes continue to increase at the same velocity until deep stall has
been reached. The corresponding points on the averaged deflection
plots of Fig. 29 are harder to identify - remembering that the
velocity remains unchanged during the exponential growth, it then
becomes clear that the tip deflections are also remaining unchanged,
even as the oscillation amplitudes pass through light stall on the way
to limit cycles at deep stall.
Once deep stall is reached, an analytic softening trend in the
flutter characteristics is predicted - that is, once past the flutter
boundary, the analysis predicts that a decrease in velocity will
induce a jump to a larger flutter amplitude. This is a characteristic
also observed in Refs. 94 and 95 for analysis with constant coeffi-
cients and is likely unfounded (and could not be reproduced experi-
mentally), but might again be due to the breakdown of the
2-dimensional aerodynamic analysis at large amplitudes of oscilla-
142

tion. Also, as seen in Fig. 29, the flutter velocities for the [+152/02]s
layup are very high, thus inducing large tip deflections. It is there-
fore likely that at high amplitudes of oscillation the governing effects
are the nonlinear structural effects, not the nonlinear aerodynamic
effects, and hardening effects will be observed such as those for
cubic stiffening in Refs. 94 and 95.
The experimental trends for the [+152/02]S layup for increasing
amplitudes of oscillation again show hardening effects, as would be
expected from physical intuition. However, as seen in the graph for
amplitude of oscillation in torsion, these hardening effects start to
become noticeable even before the oscillation amplitudes reach the
static stall angle. This might also be a consequence of the inaccurate
static aerodynamic modeling below the stall angle, where in fact
there is something like a parabolic drop before stall instead of a con-
tinuous linear rise. This would mean that the stalling effects would
start to play a role in limiting the exponential growth even before
the static stall angle were exceeded.
Fig. 31 for the [- 15 2/0 2]S layup shows a more gentle deviation
from the steady analysis, as compared to the sharp change in charac-
ter demonstrated by the [0 3/9 0 1S layup in Fig. 27. The experiment
and analysis indicate that, contrary to the [03/9 0 ]S laminate, both the
tip deflection and tip angle continue to increase once the velocity is
increased past the flutter boundary. Essentially, however, the flutter
characteristics are not unlike those of the [0 3/ 9 0]S layup. As with
the [03/90] S layup, the steady characteristics of the [- 15 2/02]s layup
are principally governed by divergence phenomenon. The flutter at
low root angles of attack is triggered by the transition into light stall.
143

Unlike the [0 3/9 0]S layup, however, it is difficult to compare how
well the analysis compares against experiment for the averaged
deflections past flutter initiation, since it is difficult to tell how much
the decrease in load with increasing amplitude of oscillation is coun-
teracted by the increase in deflection from increasing velocity. All
that can be concluded from Fig. 31 is that the deflections generally
continue to increase past the flutter boundary, both analytically and
experimentally, thus indicating that for the [- 15 2/0 2]S layup the
divergence effects tend to overpower the nonlinear coupling between
oscillation and mean aerodynamic load.
Fig. 32 for the [-15 2/0 2] S , showing the amplitude of oscillation
of the bending and torsion components, displays a much higher
bending component, as would be expected for this - predominantly
bending stall flutter. In contrast to the [03/90] S and [+152/02]S
layups, the analysis shows more hardening than the experimental
trends - that is, the bending oscillation amplitudes grow very
quickly from just a small increase in velocity, while the analysis
would predict that a larger increase in velocity would be required.
This discrepancy might be due to two possible effects. First, the
dependence of the nonlinear aerodynamics on the difference
between perceived angle of attack due to pitch (0) and due to plunge
rate (/U) might not be accurately modeled, despite the physical
arguments presented in previous investigations [Refs. 55 & 56].
Second, while the geometric nonlinearities have been taken into
account for large mean deflections, the current analysis does not take
into account large amplitudes of oscillation of the deflections, only
small amplitudes of oscillation around a large deflected mean. These
144

two effects might combine so as to account for the difference in soft-
ening between the experimental and analytic values. Again, as with
the previous layups, large amplitudes of oscillation tend to produce a
lessening of the hardening in the analysis (i.e. the hardening with
velocity is smaller at large amplitudes of oscillation than at small
amplitudes of oscillation) that is not at all evident experimentally.
Also, as noted for the flutter boundary analysis, the values at root
angle of attack aR=150 are likely so disparate because of large exper-
imental errors.
145

0
0
.4a)
a-
te
Velocity (m/s)
e)
a
*!wn
a.)
<Oa(UI
co
Ok
to
CZ
0 5 10 15 20 25 30Velocity (m/s)
Fig. 27 [03/90 ] S averaged midchord tip deflections, andaveraged total tip angle
146

o
Velocity (m/s)
0 5 10 15 20 25 30Velocity (m/s)
28 [0 3/ 9 0]1 tip deflection andamplitudes
tip angle oscillation
E
L)
T.
C-04a-o
e4
-o,
0C)a)rdz
0
t)
F*.
Fig.
147

C)
O04-A
a)
a)
4-h
a)
<0
Velocity (m/s)
a =15°. -
aRO=10°R
---..... .-:- .--...........
aR=5°
a =1R
5
- . . . . .- .- . .-. I
10 15Velocity (m/s)
| i ............................
_0 ..1 i. I-.... .- _ .
20 25
29 [+152/0 2]S averaged midchord tipaveraged total tip angle
deflections,
I
20'
5.,
11- -00a-)
00 ... 1('to
a-m
CIO
1-4<.toCZ1--
C
0
Fig.
30
and
I I
J-4
5-1..E]..
m"-mC·�r--�rr�--Q.tZ
"7' A.......... ..............I- - , - -'& - -S-~-- ~ ~
....... ....... ....... ......IQ
1 --.40:: -- & --:: a --: --& --:: &-: -7:.- ",
T I . .
I
11 -
..... .... .... .... .... ....
................................
................................!................................A" :-:ttli
~i'dL~L
II I I

-O --- o-- - I Experiment....... a]r .aR=10,50,100,150
3B,3T analysis, unsteady. -WMOMMi
aR =1R
..................
=100R .
oI
A..A. I.., - ' . ' dL:w :"fA --. T U _
10
a =150R
... . . .. . . .. . .
- . - I ._ " . . . .I .
15
.- - 14
. I 2 I 0
20
a R=50R
. - t ? 1 Ca I I
I V1r
I I I. w
25 30Velocity (m/s)
0 5 10 15 20 25 30Velocity (m/s)
Fig. 30 [+ 1 5 2/ 0 2]S tip deflection and tip angle oscillationamplitudes
149
30
0 25-1-
E 20-o$
0c 15-
0
10-
0)
d.)
._"0·(E - n -
U
0 5
2
a)0
0)
E1C.
O._
c*-wa
O
0
a-
Ill II I I I- I l I I I l .
l ___
.'-I lll I_ I L l - --
............................... .o ......................
............................... ...............................
I
I 1 I I I I I
......... ............
................... .......
.. . . . . . . .. . . . . . .
.j.

0EOrC.
)"0-04)a
OCu
4)oI,Ok
co<
Velocity (m/s)
to0
-)0Cu
04)Co
4)
¢
0 5 10 15 20 25 30Velocity (m/s)
Fig. 31 [-152 /02] averaged midchord tip deflections, andaveraged total tip angle
150

C.}a)-au
0-a
C
:o
.)'IO(0
04co0:Y
._.-A
C)M
a)4
a).Fi-4*a
Velocity (m/s)
.--- E3--o--a}--- Experiment....... . a--- aR= 10, 50,10 ,15 ..............
3B,3T analysis, unsteady
o .............................................................
* aR=fI1
*-'
,,'vp '-*#1* lp
a ='R
5 10 15 20 25
aR= 10
30Velocity (m/s)
Fig. 32 [- 1 5 2/02]S tip deflection and tip angle oscillationamplitudes
151
'1I rLu'
ae
16--a
E 12-ct
Ch0
. 8-
a)° A
CZ
e0o
a =150R
0
; . o
I
I
I
.........................
........... ............ I I;
.................... ·......... ...............................
................................)0
a..,d;:
................................
. . . . . . - ' ' I I ' . . . I I I . .

152

Chapter VI
Conclusions & RecommendationsAn analytic method has been developed to include nonlinear
structural and nonlinear aerodynamic effects into a full,
3-dimensional, aeroelastic problem, using the mathematical tools of
Fourier analysis, harmonic balance, and the Newton-Raphson method
as a numerical solver. The method makes use of the geometrically
nonlinear, Hodges & Dowell structural model, based on a second-
order ordering scheme, together with the ONERA stall flutter model
for the aerodynamics. Although in the current investigation the
method is used with many simplifications - for example in the sim-
plification of the aerodynamic force curves, in the semi-empirical
nature of the aerodynamic model, and in the low number of harmon-
ics used in the harmonic balance method - the formulation can be
extended to implement more complex variations of these factors.
The current analysis extends on previous work by more thoroughly
investigating the effects of nonlinear, large amplitude deflections,
and by more accurately modeling the nonlinear aerodynamics of the
ONERA model within the context of a harmonic balance scheme.
As shown in Chapter 5, the current nonlinear aeroelastic anal-
ysis predicts well almost all the observed, experimental, nonlinear
stall phenomena. Specifically, flutter boundaries have been obtained
which decrease with root angle of attack, limit cycle amplitudes at
flutter have been obtained, and the transitions from linear, bending-
torsion flutter to torsional stall flutter, and from linear divergence to
bending stall flutter, have been predicted analytically. In addition,
153

within the range of the valid amplitudes of oscillation for the ONERA
model, the analysis correctly predicts the experimental hardening
trend as amplitude of oscillation increases.
6.1 Aerodynamic Model
The current investigation has contributed a unique approach to
the application of the ONERA model to stall flutter analyses and has
many advantages. First and foremost, by the use of the ONERA
model, the method is in such a form that it is generalizable for a wide
range of parameters - such as airfoil type and Reynolds number, as
long as the aerodynamic characteristics of the airfoil are available -
and thus relieves some of the cumbersomeness inherent in purely
theoretical models. Second, by the application of harmonic balance
and Rayleigh-Ritz to the ONERA model, the method is in a simplified
form that allows the user to choose the number of mode shapes or
order of harmonics to suit his particular problem, while retaining the
full nonlinearity of the formulation. Third, by use of Fourier analysis
and harmonic balance, the current analysis avoids the need for time-
marching integration and avoids any computational time that might
be needed in such a method to reach the final flutter limit cycle.
However, as currently implemented, the model still has limita-
tions (other than the limitations already inherent in a semi-empirical
model such as the ONERA model). First, the current application of
Fourier analysis to the forcing terms ignores the fixed-time stall
delay of the ONERA model. Second, as noted in Section 5.1.4, the cur-
rent model accurately reproduces the exact time marching solution to
the ONERA equations for moderate amplitudes of oscillation, but
154

breaks down for larger amplitudes. This precludes properly predict-
ing flutter characteristics well beyond the small amplitude flutter
boundary. Third, there is little low Reynolds number data from
which to extract the ONERA nonlinear coefficients.
Fortunately, these deficiencies are not inherent to the model
itself, but are reflections of its current mode of application. The
fixed-time stall delay can be directly implemented - instead of being
"smeared" over the entire hysteresis loop - by incorporating a
Fourier series step function multiplied by the current formulation, so
as to turn "off" the nonlinearity during the appropriate lag time.
Larger amplitudes of oscillation can be handled by applying the
harmonic balance with a larger number of harmonics. However, as
discussed in Section 3.4.3, using a time marching analysis would
probably be more computationally efficient if more than two har-
monics are required. More accurate coefficients can be determined
by simply running the appropriate 2-dimensional aerodynamic tests
with the current wing specimens (so as to retain the correct surface
roughness, et cetera), although this is a recommendation that is
applicable to the current investigation only, and would not be neces-
sary for applications to real, operational devices, for which much
data already exists at the appropriate Reynolds number. Further
work also needs to be done in determining 3-dimensional aerody-
namic effects, although little work in semi-empirical models has yet
been accomplished in this domain.
155

6.2 Structural Model
The current investigation has added two contributions to the
theory of ordering schemes for application to nonlinear structural
modeling. First, it has extended the application of the Hodges &
Dowell nonlinear equations to the realm of anisotropic materials and,
more generally, has outlined the scheme by which those equations
can be implemented for beams with through-the-thickness variation
or through-the-thickness asymmetry. Second, it has shown by com-
parison to Minguet's Euler angle/Finite Difference method that a
modal approach to the Hodges & Dowell nonlinear equations yields
satisfactory results, provided that sufficient fore-&-aft modes are
used, making those equations more tractable in aeroelastic applica-
tions.
Unfortunately, it was found in the current investigation that
the contribution of the nonlinear structures to this particular aero-
elastic problem was insignificant. It would be interesting to make a
further analytic and experimental investigation with wings that were
less tiff in the fore-&-aft direction, i.e. which had fore-&-aft fre-
quencies much closer to the bending and torsion frequencies. Such
an investigation might be accomplished with wings that were more
square in cross section, instead of low thickness-to-chord ratio.
From a theoretical viewpoint, it still remains to somehow ana-
lytically model the cubic stiffening observed in previous investiga-
tions, since this effect seems to play a large role in the hardening
phenomenon observed at larger amplitudes of oscillation. It might
also be interesting to further delve into the effects of chordwise
asymmetry (while the through-the-thickness asymmetry has already
156

been covered), since this is taken into account by the Hodges &
Dowell equations but ignored in the current analysis because of the
low stiffness of the asymmetrical NACA 0012 styrofoam fairings.
6.3 Experiment
Experimental data have been obtained on a set of aeroelasti-
cally tailored wings with varying amounts of bending-torsion cou-
pling and matched the trends of previous studies [Refs. 90 to 92]. A
more in-depth experimental investigation of the transition from
linear to nonlinear flutter behavior has been accomplished, and a
more extended set of data past the flutter boundary has been
collected.
As mentioned in Section 6.1, it would be desirable to experi-
mentally investigate the 2-dimensional aerodynamic behavior of
these same wings, so as to fine tune the ONERA model. Also, as men-
tioned in Section 6.2, it might also be desirable to make a more thor-
ough investigation of the structural nonlinearities by running exper-
iments with wings that are softer in the fore-&-aft direction. Beyond
these recommendations, further work might be focused toward the
investigation of the variation of other parameters affecting stall
flutter with composite wings: taper or spanwise variation of other
properties (such as layup or stiffness); fore and aft sweep, with large
deflection; the aerodynamic and structural effects of stores and
fuselage; the nonlinear aerodynamic and structural effects within
body freedom flutter.
157

158

References
Dynamic Stall Experiments:
1. Liiva, J., and Davenport, F.J., "Dynamic Stall of Airfoil Sectionsfor High-Speed Rotors," Journal of the American HelicopterSociety, Vol. 14, No. 2, April 1969, pp. 26-33.
2. McAlister, K.W., Carr, L.W., and McCroskey, W.J., "Dynamic StallExperiments on the NACA 0012 Airfoil," NASA TP-1100,January 1978.
3. McCroskey, W.J., McAlister, K.W., Carr, L.W., Pucci, S.L., Lambert,O., and Indergrand, R.F., "Dynamic Stall on Advanced AirfoilSections," Journal of the American Helicopter Society, Vol. 26,No. 3, July 1981, pp. 40-50.
4. McAlister, K.W., Pucci, S.L., McCroskey, W.J., and Carr, L.W., "AnExperimental Study of Dynamic Stall on Advanced AirfoilSections Volume 1: Summary of the Experiment," NASATM-84245, July 1982.
5. McAlister, K.W., Pucci, S.L., McCroskey, W.J., and Carr, L.W., "AnExperimental Study of Dynamic Stall on Advanced AirfoilSections Volume 2: Pressure and Force Data," NASA TM-84245,September 1982.
Dynamic Stall Flow Visualization:
6. Carta, F.O., "Analysis of Oscillatory Pressure Data IncludingDynamic Stall Effects," NASA CR-2394, 1974.
7. McAlister, K.W., and Carr, L.W., "Water-Tunnel Experiments onan Oscillating Airfoil at Re=21,000," NASA TM-78446, March1978.
159

8. McAlister, K.W., and Carr, L.W., "Water-Tunnel Visualizations of
Dynamic Stall," Trans. ASME, Journal of Fluids Engineering,Vol. 101, 1979, pp. 376-380.
Identification of Processes in Dynamic Stall:
9. Carr, L.W., McAlister, K.W., and McCroskey, W.J., "Analysis of
the Development of Dynamic Stall Based on Oscillating Airfoil
Experiments," NASA TN-D-8382, January 1977. (Also,McCroskey, W.J., Carr, L.W., and McAlister, K.W., "Dynamic Stall
Experiments on Oscillating Airfoils," AIAA Journal, Vol. 14,No. 1, January 1976, pp. 57-63.)
10. McCroskey, W.J., "The Phenomenon of Dynamic Stall," NASATM-81264, March 1981.
Discrete Potential Vortex Methods for Dynamic Stall:
11. Ham, N.D., and Garelick, M.S., "Dynamic Stall Considerations in
Helicopter Rotors," Journal of the American Helicopter Society,Vol. 13, No. 2, April 1968, pp. 49-55.
12. Ham, N.D., "Aerodynamic Loading on a 2-Dimensional AirfoilDuring Dynamic Stall," AIAA Journal, Vol. 6, No. 10, October
1968, pp. 1927-1934.
13. Baudu, N., Sagner, M., and Souquet, J., "Modelisation duDlchrochage Dynamique d'un Profil Oscillant," AAAF 10iemeColloque d'Aeronautique Apliquee, Lille, France, 1973.
14. Giesing, J.P., "Nonlinear 2-Dimensional Potential Flow with Lift,"
Journal of Aircraft, Vol. 5, No. 2, March/April 1968, pp.135-143.
15. Ono, K., Kuwahara, K., and Oshima, K., "Numerical Analysis of
Dynamic Stall Phenomena of an Oscillating Airfoil by theDiscrete Vortex Approximation," Paper No. 8, 7th InternationalConference on Numerical Methods in Fluid Dynamics, Stanford,California, 1980.
160

16. Katz, J. "A Discrete Vortex Method for the Nonsteady SeparatedFlow Over an Airfoil," Journal of Fluid Mechanics, Vol. 102,January 1981, pp. 315-328.
17. Spalart, P.R., Leonard, A., and Baganoff, D., "NumericalSimulation of Separated Flows," NASA TM-84328, February1983.
Zonal Methods for Dynamic Stall:
18. Crimi, P., and Reeves, B.L., "A Method for Analyzing DynamicStall of Helicopter Rotor Blades," NASA CR-2009, May 1972.(Also, AIAA-72-37, January 1972.)
19. Crimi, P., "Investigation of Nonlinear Inviscid and Viscous FlowEffects in the Analysis of Dynamic Stall," NASA CR-2335,February 1974.
20. Rao, B.M., Maskew, B., and Dvorak, F.A., "Theoretical Predictionof Dynamic Stall on Oscillating Airfoils," American HelicopterSociety Paper 78-62, 1978.
21. Maskew, B., and Dvorak, F.A., "Investigation of SeparationModels for the Prediction of CL ," Journal of the AmericanHelicopter Society, Vol. 23, No. 2, April 1978, pp. 2-8.
22. Scruggs, R.M., Nash, J.R., and Singleton, R.E., "Analysis of FlowReversal Delay for a Pitching Airfoil," AIAA-74-183, January1974.
23. Chi, R.M., "Separated Flow Unsteady Aerodynamic Theory,"Journal of Aircraft, Vol. 22, No. 11, November 1985,pp. 956-964.
161

Navier-Stokes Methods for Dynamic Stall:
24. Mehta, U.B., "Dynamic Stall of an Oscillating Airfoil," AGARDCP-277, AGARD, France, 1977, pp. 23-1 to 23-32. (Also, AGARDFluid Dynamics Panel Symposium on Unsteady Aerodynamics,Paper No. 23, Ottawa, Canada, September 1977.)
25. Shamroth, S.J., and Gibeling, H.J., "The Prediction of theTurbulent Flow Field about an Isolated Airfoil," AIAA-79-1543,paper presented at the AIAA 12th Fluid & Plasma DynamicsConference, Williamsburg, Virginia, July 1979.
26. Shamroth, S.J., and Gibeling, H.J., "A Compressible Solution of
the Navier-Stokes Equations for Turbulent Flow About anAirfoil," NASA CR-3183, October 1979.
27. Sugavanum, A., and Wu, J.C., "Numerical Study of SeparatedTurbulent Flow Over Airfoils," AIAA-80-1441, paper presentedat the AIAA 13th Fluid & Plasma Dynamics Conference,Snowmass, Colorado, July 1980.
28. Shamroth, S.J., "Calculation of Steady and Unsteady Airfoil FlowFields via the Navier Stokes Equations," NASA CR-3899, August1985.
29. Sankar, N.L., and Tang, W., "Numerical Solution of UnsteadyViscous Flow Past Rotor Sections," AIAA Paper 85-0129,January 1985.
30. Rumsey, C.L., and Anderson, W.K., "Some Numerical andPhysical Aspects of Unsteady Navier-Stokes Computations OverAirfoils Using Dynamic Meshes," AIAA-88-0329, paper pre-sented at the AIAA 26th Aerospace Sciences Meeting, Reno,Nevada, January 1988.
162

Boeing-Vertol Method for Dynamic Stall:
31. Gross, D.W., and Harris, F.D., "Prediction of Inflight StalledAirloads from Oscillating Airfoil Data," American HelicopterSociety 25th Annual National Forum, American HelicopterSociety, 1969.
32. Harris, F.D., Tarzanin, F.J., Jr., and Fisher, R.K., Jr., "Rotor High-Speed Performance; Theory vs. Test," Journal of the AmericanHelicopter Society, Vol. 15, No. 3, July 1970, pp. 35-44.
33. Gormont, R.E., "A Mathematical Model of UnsteadyAerodynamics and Radial Flow for Application to HelicopterRotors," US Army AMRDL TR-72-67, May 1973.
UTRC Method for Dynamic Stall:
34. Carta, F.O., et al., "Analytical Study of Helicopter Rotor StallFlutter," American Helicopter Society 26th Annual NationalForum, American Helicopter Society, 1970.
35. Carta, F.O., et al., "Investigation of Airfoil Dynamic Stall and itsInfluence on Helicopter Control Loads," US Army AMRDLTR-72-51, 1972.
36. Carta, F.O., and Carlson, R.G., "Determination of Airfoil and RotorBlade, Dynamic Stall Response," Journal of the AmericanHelicopter Society, Vol. 18, No. 2, April 1973, pp. 31-39.
Synthesization Methods for Dynamic Stall:
37. Bielawa, R.L., "Synthesized Unsteady Airfoil Data withApplications to Stall Flutter Calculations," American HelicopterSociety 31st Annual National Forum, American HelicopterSociety, May 1975.
38. Gangwani, S.T., "Prediction of Dynamic Stall and UnsteadyAirloads for Rotor Blades," Journal of the American HelicopterSociety, Vol. 27, No. 4, October 1982, pp. 57-64.
163

39. Gangwani, S.T., "Synthesized Airfoil Data Method for Predictionof Dynamic Stall and Unsteady Airloads," NASA CR-3672,February 1983.
MIT Method for Dynamic Stall:
40. Johnson, W., "The Effect of Dynamic Stall on the Response andAirloading of Helicopter Rotor Blades," Journal of the AmericanHelicopter Society, Vol. 14, No. 2, April 1969, pp. 68-79.
41. Johnson, W., and Ham, N.D., "On the Mechanism of DynamicStall," Journal of the American Helicopter Society, Vol. 17,No. 4, October 1972, pp. 36-45.
Lockheed Method for Dynamic Stall:
42. Ericsson, L.E., and Reding, J.P., "Dynamic Stall of HelicopterBlades," Journal of the American Helicopter Society, Vol. 17,No. 1, January 1972, pp. 11-19.
43. Ericsson, L.E., and Reding, J.P., "Stall Flutter Analysis," Journal ofAircraft, Vol. 10, No. 1, January 1973, pp. 5-13.
44. Ericsson, L.E., and Reding, J.P., "Dynamic Stall Analysis in theLight of Recent Numerical and Experimental Results," Journal ofAircraft, Vol. 13, No. 4, April 1976, pp. 248-255.
45. Ericsson, L.E., and Reding, J.P., "Dynamic Stall at High Frequencyand Large Amplitude," Journal of Aircraft, Vol. 17, No. 3,March 1980, pp. 136-142.
Time Delay Methods for Dynamic Stall:
46. Beddoes, T.S., "A Synthesis of Unsteady Aerodynamic EffectsIncluding Stall Hysteresis," Vertica, Vol. 1, No. 2, 1976,pp. 113-123.

47. Beddoes, T.S., "Prediction Methods for Unsteady SeparatedFlows," Special Course in Unsteady Aerodynamics, AGARDR-679, France, March 1980, pp. 15-1 to 15-11..
48. Carlson, et al., "Dynamic Stall Modeling and Correlation withExperimental Data on Airfoils and Rotors," Paper No. 2, NASA
SP-352, 1974.
ONERA Method for Dynamic Stall:
49. Tran, C.T., and Petot, D., "Semi-Empirical Model for the Dynamic
Stall of Airfoils in View of Application to the Calculation ofResponses of a Helicopter in Forward Flight," Vertica, Vol. 5,No. 1, 1981, pp. 35-53.
50. Dat, D., and Tran, C.T., "Investigation of the Stall Flutter of anAirfoil with a Semi-Empirical Model of 2-D Flow," Vertica,Vol. 7, No. 2, 1983, pp. 73-86.
51. Petot, D., and Loiseau, H., "Successive Smoothing Algorithm forConstructing the Semi-Empirical Model Developed at ONERA toPredict Unsteady Aerodynamic Forces," NASA TM-76681,March 1982.
52. Petot, D., "Dynamic Stall Modeling of the NACA 0012 Profile,"
Short Note, Recherches Arospatiales, 1984-6, pp. 55-58.
53. McAlister, K.W., Lambert, O., and Petot, D., "Application of the
ONERA Model of Dynamic Stall," NASA Technical Paper 2399,AVSCOM Technical Report 84-A-3, November 1984.
54. Petot, D., and Dat, R., "Unsteady Aerodynamic Loads on an
Oscillating Airfoil with Unsteady Stall," 2nd Workshop onDynamics and Aeroelasticity Stability Modeling of RotorcraftSystems, Florida Atlantic University, Boca Raton, Florida,November 1987.
165

Pitch/Plunge Distinction for Dynamic Stall:
55. Peters, D.A., "Toward a Unified Lift Model for Use in Rotor BladeStability Analyses," Journal of the American Helicopter Society,Vol. 30, No. 3, July 1985, pp. 32-42.
56. Rogers, J.P., "Applications of an Analytic Stall Model to Time-History and Eigenvalue Analysis of Rotor Blades," Journal of theAmerican Helicopter Society, Vol. 29, No. 1, January 1984,pp. 25-33.
57. Fukushima, T., and Dadone, L.U., "Comparison of Dynamic StallPhenomena for Pitching and Vertical Translation Motions,"NASA CR-2693, 1977.
58. Carta, F.O., "A Comparison of the Pitching and PlungingResponse of an Oscillating Airfoil," NASA CR-3172, October1979.
59. Ericsson, L.E., and Reding, J.P., "The Difference Between theEffects of Pitch and Plunge on Dynamic Airfoil Stall," 9thEuropean Rotorcraft Forum, Stresa, Italy, September 1983,pp. 8-1 to 8-8.
Summaries of Dynamic Stall Methods:
60. Johnson, W., "Comparison of Three Methods for Calculation ofHelicopter Rotor Blade Loading and Stresses Due to Stall," NASATN-D-7833, November 1974.
61. Philippe, J.J., "Dynamic Stall: An Example of Strong InteractionBetween Viscous and Inviscid Flow," NASA TM-75447, 1978.
62. Johnson, W., Helicopter Theory, Chapter 16, PrincetonUniversity Press, 1980.
63. Carr, L.W., "Dynamic Stall Progress in Analysis and Prediction,"AIAA Paper 85-1769, August 1985.
166

64. Galbraith, R.A.M., and Vezza, M., "Methods of PredictingDynamic Stall," Paper Presented at the British Wind EnergyConference, Cambridge, U.K., April 1986.
65. Reddy, T.S.R., and Kaza, K.R.V., "A Comparative Study of SomeDynamic Stall Models," NASA TM-88917, March 1987.
Classical Structural Vibration:
66. Reissner, E., and Stein, M., "Torsion and Transverse Bending of
Cantilever Plates," NACA TN-2369, June 1951.
67. Meirovitch, L., Elements of Vibration Analysis, McGraw-Hill,Inc., 1975.
Structural Vibration of Anisotropic Plates:
68. Crawley, E.F., "The Natural Modes of Graphite/Epoxy CantileverPlates and Shells," Journal of Composite Materials, Vol. 13, July1979, pp. 195-205.
69. Crawley, E.F., and Dugundji, J., "Frequency Determination andNon-Dimensionalization for Composite Cantilever Plates,"Journal of Sound and Vibration, Vol. 72, No. 1, 1980, pp. 1-10.
70. Jensen, D.W., "Natural Vibrations of Cantilever Graphite/EpoxyPlates with Bending-Torsion Coupling," M.S. Thesis, Departmentof Aeronautics and Astronautics, M.I.T., August 1981.
71. Jensen, D.W., Crawley, E.F., and Dugundji, J., "Vibration ofCantilevered Graphite/Epoxy Plates with Bending-TorsionCoupling," Journal of Reinforced Plastics and Composites, Vol. 1,July 1982, pp. 254-269.
Finite Element & Finite Difference Schemes for Nonlinear Structures:
72. Bauchau, O.A., and Hong, C.-H., "Finite Element Approach toRotor Blade Modelling," Journal of the American HelicopterSociety, Vol. 32, No. 1, January 1987, pp. 60-67.
167

73. Hinnant, H.E., and Hodges, D.H., "Nonlinear Analysis of aCantilever Beam," AIAA Journal, Vol. 26, No. 12, December1988, pp. 1521-1527.
74. Minguet, P.J., "Static and Dynamic Behavior of CompositeHelicopter Rotor Blades Under Large Deflections," Ph.D. Thesis,Department of Aeronautics & Astronautics, M.I.T., May 1989.(Also Technology Laboratory for Advanced Composites (TELAC)Rept. 89-7, M.I.T., May 1989.)
Ordering Schemes for Nonlinear Structures:
75. Hodges, D.H., and Dowell, E.H., "Nonlinear Equations of Motionfor the Elastic Bending and Torsion of Twisted NonuniformRotor Blades," NASA TN D-7818, December 1974.
/6. Hong, C.H., and Chopra, I., "Aeroelastic Stability of a CompositeRotor Blade," Journal of the American Helicopter Society,Vol. 30, No. 2, April 1985, pp. 57-67.
77. Rosen, A., and Friedmann, P.P., "The Nonlinear Behavior ofElastic Slender Beams Undergoing Small Strains and ModerateRotations," Trans. ASME, Journal of Applied Mechanics, Vol. 46,No. 1, March 1979, pp. 161-168.
78. Boyd, W.N., "Effect of Chordwise Forces and Deformations andDeformation Due to Steady Lift on Wing Flutter," SUDAARRept. 508, Department of Aeronautics & Astronautics, StanfordUniversity, December 1977.
Cubic Stiffening in Nonlinear Structures:
79. Tseng, W.Y., and Dugundji, J., "Nonlinear Vibrations of a BeamUnder Harmonic Excitation," Trans. ASME, Journal of AppliedMechanics, Vol. 37, No. 2, Series E, June 1970, pp. 292-297.
168

/I

80. Tseng, W.Y., and Dugundji, J., "Nonlinear Vibrations of a BuckledBeam Under Harmonic Excitation," Trans. ASME, Journal ofApplied Mechanics, Vol. 38, No. 2, Series E, June 1971, pp.467-47 6.
Stall Flutter Experiments:
81. Halfman, R.L., Johnson, H.C., and Haley, S.M., "Evaluation of HighAngle-of-Attack Aerodynamic Derivative Data and Stall FlutterPrediction Techniques," NACA TN-2533, 1951.
82. Rainey, A.G., "Preliminary Study of Some Factors Which Affectthe Stall-Flutter Characteristics of Thin Wings," NACA TN-3622,March 1956.
83. Rainey, A.G., "Measurement of Aerodynamic Forces for VariousMean Angles of Attack on an Airfoil Oscillating in Pitch and onTwo Finite-Span Wings Oscillating in Bending with Emphasis onDamping in the Stall," NACA TR-1305, November 1957.
84. Dugundji, J., and Aravamudan, K., "Stall Flutter and NonlinearDivergence of a 2-Dimensional Flat Plate Wing," Aeroelastic andStructures Research Laboratory TR 159-6, M.I.T., July 1974.
85. Dugundji, J., and Chopra, I., "Further Studies of Stall Flutter andNonlinear Divergence of 2-Dimensional Wings," NASACR-144924, August 1975. (Also, Aeroelastic and StructuresResearch Laboratory TR 180-1, August 1975.)
Composite Applications for Aeroelasticity:
86. Weisshaar, T.A., "Divergence of Forward Swept CompositeWings," Journal of Aircraft, Vol. 17, No. 6, June 1980,pp. 442-448.
87. Weisshaar, T.A., "Aeroelastic Tailoring of Forward SweptComposite Wings," Journal of Aircraft, Vol. 18, No. 8, August1981, pp. 669-676.
169

88. Weisshaar, T.A., and Foist, B.L., "Vibration Tailoring ofAdvanced Composite Lifting Surfaces," Journal of Aircraft,Vol. 22, No. 2, February 1985, pp. 141-147.
89. Weisshaar, T.A., and Ryan, R.J., "Control of AeroelasticInstabilities Through Stiffness Cross-Coupling," Journal ofAircraft, Vol. 23, No. 2, February 1986, pp. 148-155.
Flutter & Divergence with Composites:
90. Hollowell, S.J., and Dugundji, J., "Aeroelastic Flutter andDivergence of Stiffness Coupled, Graphite/Epoxy CantileveredPlates," Journal of Aircraft, Vol. 21, No. 1, January 1984,pp. 69-76.
91. Selby, H.P., "Aeroelastic Flutter and Divergence of RectangularWings with Bending-Torsion Coupling," M.S. Thesis, Departmentof Aeronautics and Astronautics, M.I.T., January 1982.
92. Landsberger, B., and Dugundji, J., "Experimental AeroelasticBehavior of Unswept and Forward Swept Graphite/EpoxyWings," Journal of Aircraft, Vol. 22, No. 8, August 1985,pp. 679-686.
Harmonic Balance Methods for Nonlinear Flutter:
93. Kuo, C.-C., Morino, L., and Dugundji, J., "Perturbation andHarmonic Balance Methods for Nonlinear Panel Flutter," AIAAJournal, Vol. 10, No. 11, November 1972, pp. 1479-1484.
94. Dunn, P.E., "Stall Flutter of Graphite/Epoxy Wings with Bending-
Torsion Coupling," M.S. Thesis, Department of Aeronautics &Astronautics, M.I.T., May 1989. (Also Technology Laboratoryfor Advanced Composites (TELAC) Rept. 89-5, M.I.T., May1989.)
170

95. Dunn, P.E., and Dugundji, J., "Nonlinear Stall Flutter andDivergence Analysis of Cantilevered Graphite/Epoxy Wings,"AIAA-90-0983, paper presented at the AIAA/ASME/ASCE/AHS/ASC 31st Structures, Structural Dynamics and MaterialsConference, Long Beach, California, April 1990.
TELAC Manufacturing Procedure:
96. Lagace, P.A., and Brewer, C.B., "TELAC Manufacturing ClassNotes," Edition 0-2, Technology Laboratory for AdvancedComposites, Department of Aeronautics and Astronautics, M.I.T.
Static Airfoil Data:
97. Jacobs, E.N., and Sherman, A., "Airfoil Section Characteristics asAffected by Variations of the Reynolds Number," NACA ReportNo. 586, 1937.
98. Jacobs, E.N., Ward, K.E., and Pinkerton, R.M., "The Characteristicsof 78 Related Airfoil Sections from Tests in the Variable-Density Wind Tunnel," NACA Report No. 460, 1933.
171

172

Appendix A - Material Properties
The out-of-plane characteristics of graphite/epoxy laminates
(i.e. the bending curvatures due to applied moments) have been
observed to be experimentally different from in-plane characteristics
(i.e. stretching due to applied extensional forces). These differences
have also been observed to be layup and thickness dependent,
although the thickness dependency may actually be due to manufac-
turing errors compounded by the z3 factor in the Dij terms, as
hypothesized by Minguet [Ref. 74]. For the current investigation,
there is no thickness dependency since all the laminates are of the
same thickness. The layup dependency has been "smeared" across
all the layups, so that in the current investigation only the out-of-
plane bending moduli were used, no matter what the layup was.
EL, longitudinal modulus
ET, transverse modulus
GLT, shear modulus
VLT, Poisson's ratio
p, density
t, ply thickness
Hercules AS4/3501-6Graphite/Epoxy
In-planestretching
143 GPa
9.7 GPa
4.9 GPa
0.30
1540 kg/m3
0.135 mm
Out-of-planebending
97.3 GPa *
6.3 GPa
5.3 GPa*"
0.28
1540 kg/m3
0.135 mm
* Based on static deflection testsBased on free vibration tests
173
--

The styrofoam properties were determined by averaging two
tests. First, static deflection tests in bending and in torsion were
performed on a piece of styrofoam 55 cm long and 12.7 cm by
1.6 cm in cross section. Next, vibration tests were performed on a
smaller [02/ 9 0]s wing with styrofoam fairings [Refs. 94 and 95], and
the styrofoam moduli adjusted until the analytic frequencies exactly
matched the experimental frequencies. The styrofoam moduli were
then assumed to be the average of these two values. The observed
values from static deflection and free vibration were both within
25% of the final averaged values.
EL, longitudinal modulus
ET, transverse modulus
GLT, shear modulus
VLT, Poisson's ratio
p, densityQSty sty
Qi I= Q2Qty sty12 = QtY
I HD-300 styrofoam
Nominal
24 MPa
24 MPa
15 MPa
0.30
35 kg/m3
26.4 MPa
7.9 MPa
15.0 MPa
Observed
15 MPa**
15 MPa***
8 MPa***
0.28
35 kg/m3
16.5 MPa
11.9 MPa
8.0 MPa
Average of static deflection and free vibration tests
174

Appendix B - Flat Plate Structural and Mode ShapeConstants
[03/90]s
8.09x1 0 7
3.15x10⁷
1.91x10⁶
5.72x 10⁶
-0-
-0-
10.1163
0.8147
0.1861
0.5564
-0-
-0-
[+152/02]s
9.96x10 7
7.47x10⁶
4.59x10⁶
8.40x10⁶
1.08xl0 7
1.53x10⁶
9.2478
0.7718
0.6418
1.0121
1.8395
0.2608
[-152/02]s
9.96x10⁷
7.47x10⁶
4.59x 10⁶
8.40x 10⁶
-1.08x10 7
-1.53x10⁶
9.2478
0.7718
0.6418
1.0121
-1.8395
-0.2608
(N/m)
(N/m)
(N/m)
(N/m)
(N/m)
(N/m)
(Nm)
(Nm)
(Nm)
(Nm)
(Nm)
(Nm)
All
A 22
A1 2
A 66
A16
A 26
Dll
D22
D12
D66
D16
D26
All Bij values are zero because all layups are symmetric
175
__ __ _ _ __ __
-
I
l

Layup 3 n g f Bn1 Bn2 Bn4
1 1.8144 6.7476 -.24235 +.90076 -. 24219
[03/901S .02368 2 5.0358 8.2218 +.38956 -.63637 +.38977
3 8.0742 10.365 -.42572 +.54295 -.42296
1 1.7495 9.3334 -.17845 +.94938 -.17844
[+152/02]s .01190 2 5.0501 10.467 +.35933 -.73484 +.35454
3 8.1550 12.270 -.39855 +.59909 -.39817
1 1.7495 9.3334 -.17845 +.94938 -.17844
[-152/02]s .01190 2 5.0501 10.467 +.35933 -.73484 +.35454
3 8.1550 12.270 -.39855 +.59909 -.39817
In all cases Bn3 = -BnI
176

Appendix C - Static Aerodynamic Models
Raw data for the static lift curve of the NACA 0012 airfoil is
taken from Jacobs & Sherman [Ref. 97] and is empirically fit using
the previously described division into polynomial regions. For the
current study, the Reynolds number is very low, always below the
critical Reynolds number of approximately 3.4x10⁵. Therefore, no
Reynolds number dependence was incorporated for varying free
stream velocity. As illustrated in Fig. 33, the model of the
3-dimensional lift curve used in this study is divided into three
regions and, for simplicity, each region is defined by a straight line:
(i) below the stall angle, al = 100, the 3-dimensional lift slope is
given by aoL -CL = 0.8*5.9 rad - 1 (where the 0.8 factor comes
from the finite-span correction for an aspect ratio of 8), (ii) between
100 and 20° the 3-dimensional lift coefficient drops linearly to 0.75,
and (iii) above 200 the 3-dimensional lift coefficient remains con-
stant at 0.75. The 3-dimensional moment coefficient follows the
same trend: (i) it remains zero below the stall angle, (ii) drops lin-
early to -0.108 between 100 and 200, and (iii) drops linearly to
-0.150 between 20° and 37.5° . The two-dimensional profile drag is
given by the polynomial,
(C-l) CDo = 4.923a 3 + .1473a2 + .0420c + .014
Other 3-dimensional effects are included by adding a span-
wise drop, as suggested by lifting line theory and approximated by a
9th order polynomial (see Landsberger [Ref. 92]). The
2-dimensional curves are already corrected for finite aspect ratio.
177

0 5 10 15 20 25
Angle, 0 (deg)
0 5 10 15 20 25
Angle, 0 (deg)
33 NACA 0012 low Reynolds numberFig. lift model

(C-2) CL3D = 1.11 - CL2 D((a=c)
where the corrected angle of attack included the finite-span correc-
tion, as suggested by Jacobs, Ward, & Pinkerton [Ref. 98],
1(C-3) ac= a a
1++AR
The 3-dimensional total drag is found by adding the induced drag to
the profile drag,
(C-4) CD= D+ AR
As is suggested by Petot [Ref. 52], and illustrated in Fig. 34,
more complex descriptions can be devised, and may be useful for
higher Reynolds number flows where the lift drop after stall is more
acute. A parabolic fit can be used to describe the slight drop in lift
preceding stall. A power series expansion into a high order polyno-
mial can be used to describe the exponential drop immediately fol-
lowing stall (the conversion from exponential form to polynomial
form is necessitated by the formulation of the Fourier series in
Section 3.2.2). A flat line can be used to describe the fully decayed
exponential for very high angles of attack.
The variables describing the aerodynamic force curves, such as
the maximum lift coefficient or the minimum profile drag, can fur-
ther be generalized over a wide range of free stream velocities, as
suggested by the logarithmic dependence on the Reynolds number
179

described by Jacobs & Sherman [Ref. 97]. Similar fits for the
moment coefficient curve can be generated using the data from
McAlister, Pucci, McCroskey, & Carr [Ref. 4].
180

Czs(a)
parabolic
linear-
polynomial approximationsto an exponential decay
I I
I II II II II II II II II II II II II II I
I I
I II a
34 Generalized lift modelFig.
181
-
I
atI
l L

Appendix D - Coefficients of Aerodynamic Equations
Table 5 shows the coefficients of the 2-dimensional aerody-
namic equations (3-62) to (3-64), used for the lift and moment coef-
ficients. It is assumed that there is no hysteresis in the drag coeffi-
cient. The linear coefficients (s L , kvL, XL aL' GL' aoM' SM' kvM' XM' acM'
and GM) were taken from standard references with the following
exceptions: L was taken from Petot [Ref. 52] although a more
consistent value could have been L=i; aL was derived by fitting the
NACA 0012 data from Jacobs & Sherman [Ref. 97] although the
linear value aoL= 2 n could have been used.
The nonlinear coefficients a and r for the NACA 0012 airfoil
were taken from Petot [Ref. 52] for Reynolds numbers above the
critical Reynolds number of 3.4x10⁵ . The nonlinear coefficient e for
the NACA 0012 airfoil was taken from Petot & Dat [Ref. 54] for
Reynolds numbers above the critical Re, since the form of the forcing
terms used in Ref. 52 was unsuitable for determining an appropriate
value of e, as is discussed in more detail later.
Corrections for low Reynolds flow were guided by similar
values given by Petot & Loiseau [Ref. 51]. In that investigation, con-
ducted for an OA 209 profile, ao and ro were determined to remain
unchanged from high to low Reynolds number. In other words, it
was determined that the characteristics of light stalling - i.e. when
ACz was small - were insensitive to Reynolds number.
However, it was also determined that the characteristics of
moderate or deep stalling - i.e. when ACz was no longer insignificant
- were very sensitive to the Reynolds number. The value of a rose
182

from 0.45 to 1.75 for the OA 209 airfoil, in other words by a factor
of approximately 4. The form of the nonlinear coefficient r used in
the study was,
(D-1) = ro + AC + 1ACz + + C - with P=- l
r + aACz - 1 + (-1)2(1 - ACz + (aACz)2)
= r + a2(ACz )2
The above formulation indicates that r corresponds approxi-
mately to oa2 , for small values of ACz. In Ref. 51, a rose from 0.65 to
1.0 for the OA 209 airfoil, indicating that the corresponding rl would
rise from approximately 0.42 to 1.0, or by a factor of approximately
2.5.
The final value of the nonlinear coefficient e was governed by
several influences. First, several forms of the forcing - or right hand
side (RHS) - of the nonlinear ONERA equation were used in different
studies,
(D-2) RHS = -[rACz + e(ACz)]
(D-3) RHS = -[rACz + e0]
(D-4) RHS = -r[ACz + e(ACz)]
The form used in equation (D-2) is the form used by Petot &
Loiseau [Ref. 51] for an OA 209 airfoil, in which it was determined
that the value of e1 rose from -0.6 to -2.7 going to low Reynolds
number flow, in other words by a factor of approximately 4.5.
Equation (D-2) is also the form used in the current investigation.
183

The form used in equation (D-3) is that used by Petot [Ref. 52].
While this form is easier to incorporate in a harmonic analysis such
as the current investigation, it seems to be physically counter-intu-
itive since it indicates that there would be stalling influences due to
0 even in the unstalled region. For this reason the form of equation
(D-3) was not used in the current investigation.
The form used in equation (D-4) is that used by Petot & Dat
[Ref. 54] and seems to have a more sound physical basis: the phase-
lag is expressed directly in relation to the force deficit ACz , instead of
in relation to rAC z as in equation (D-2). However, this form is more
difficult to implement in a harmonic balance method since the prod-
uct of r and e would produce a sixth-order polynomial. Hence the
form of equation (D-4) was not used in the current investigation.
However, the value of the nonlinear coefficient e for a NACA 0012
airfoil above the critical Reynolds number was determined from
Ref. 54 since Ref. 51, which uses the form of the current investiga-
tion, only looked at the OA 209 airfoil. The value of el=-0.6 was2
taken from Ref. 54 and multiplied by r =.04 to give the value of
e1l=-.024 used in the current investigation.
In determining the nonlinear coefficient e, the effect of the
fixed-time delay cannot be ignored. As mentioned previously, Petot
& Loiseau [Ref. 51] determined that e1 rose by a factor of approxi-
mately 4.5 for the OA 209 airfoil going to low Reynolds number
flow. However, their investigation included a fixed-time delay while
the current investigation does not. If the force deficit is approxi-
mated by only its first harmonic, i.e. using only AO and A1, then the
forcing term in the current investigation looks like,
184

(D-5) RHS = -[rACZ + e(ACz)I
= -[rAo + rAlsin(kt) + ekAlcos(kt) + H.H.T.]
= -[rAo + r 2+(ek) 2 Alsin(k( + At))]
= -[ra o + rAlsin(k( + At))] for ek < r
with A = tan 1 ek e for ek << rk r r
So, the nonlinear coefficient e can be interpreted as a fixed
time delay parameter - however, it must be realized that this anal-
ogy breaks down for higher harmonics and larger values of ek. Also,
to interpret the nonlinear coefficient as a fixed time delay parameter,
it must be interpreted as affecting the entire forcing function as a
whole, i.e. the entire right hand side of the stalled ONERA equation
(as in Petot & Loiseau [Ref. 51]), and not simply the force deficit ACz
(as in Petot [Ref. 52] or Petot & Dat [Ref. 54]). That is, to interpret
the nonlinear coefficient e as a fixed time delay parameter, it must
be conceded that the nonlinear coefficients r & a are not affected by
the time delay. While this assertion makes the mathematical formu-
lation easier to interpret, it makes less physical sense, since intu-
itively the frequency and damping should be functions of the devel-
opment of the stalling, and should therefore be affected by any delay
which affects A C z. In conclusion, a fixed time delay over a short
period of the hysteresis cycle, such as used in Refs. 51-56, can be
"smeared" over the entire cycle and eliminated from the mathemati-
cal formulation by appropriately adjusting the nonlinear coefficient
e. It is for this reason that the high and low Reynolds number values
185

of e in Table 5 are so different, because A has been left in for the
former while it has been eliminated for the latter.
A sensitivity analysis was done on the flutter boundary of the
[03/ 90]S wing to determine the final values of the nonlinear coeffi-
cients a, r, & e. The initial values of this sensitivity analysis were
governed by the approximate correction factors that might be sug-
gested by the investigation of Petot & Loiseau [Ref. 51]: a remained
constant at 0.25; a rose by a factor of 4 from 0.1 to 0.4; ro remained
constant at 0.2; r rose by a factor of 2.5 from 0.1 to 0.25; el rose by
a factor of 4.5 from -.024 to -0.1. The sensitivity analysis attempted
to find the smallest adjustments to these nonlinear values which
could appropriately fit the [03/90]S flutter boundary.
The values of ao and al had little effect on the flutter bound-
ary, so they were left unchanged. The values of r and r1 were found
to affect the flutter boundary, but had little effect on the flutter fre-
quency plot, as shown in Fig. 35. Increasing r increased the range
over which the flutter boundary was governed by light stall.
Increasing r changed that part of the flutter boundary governed by
deep stall such that the flutter velocity would decrease at a greater
rate. Increasing e1 had the same effect on the flutter boundary, but
also increased the rate at which the frequency plot rose toward the
first torsion frequency.
The procedure for making the final adjustments to the nonlin-
ear coefficients was threefold: first, e1 was increased from -.024 to
+.030 so as to accurately fit the rise in the flutter frequency; second,
r 1 was increased from 0.25 to 1.0 to account for the sharper drop in
flutter velocity; third, r was decreased from 0.2 to 0.1 to account for
186

the shorter range of light stall behavior. The changes in r and rl
seem reasonable in comparison to the similarly large changes indi-
cated by Petot & Loiseau [Ref. 51]. While at first the change in sign
for el seems odd, the "smearing" of Ax is also included in this adjust-
ment.
An alternative method of determining these coefficients of the
nonlinear aerodynamics would have been to base them on the flutter
boundary of the [+15 2/0 2]S instead. The reasoning would be that no
matter what the root angle of attack R would be, most of the wing
would be relatively untwisted, and so, except for 3-dimensional
spanwise corrections, the aerodynamics across the span of the wing
would be almost the same. The only problem with this approach is
that the [+152/02]S layup has a very short light stall region, that is, it
goes from the linear region to the deep stall region for only a small
change in the root angle of attack (as can be seen in Fig. 25).
Therefore, it would be difficult to determine the a, r, and e values
from the [+15 2/02]S layup.
187

sz 0.09*(180/X) rad 1
kvz 7i/2 rad 1
xlz 0.15
az 0.55
oz 5.9 rad '1
a* 0.25 + O.1(ACL)2
* [0.2 + 0.1(ACL)2]2
e* -.024(ACL)2
AX* 1 0a** 0.25 + 0.4(ACL)2
r * [0.1 + I.O(ACL)2]2e* * +.030(ACL)2
,,** O
-;r/4 rad 1
-3;r/16 rad-1
0
1
-I/4 rad- 1
* Re > 3.4x10⁵
** Re < 3.4x10⁵
Table 5. Aerodynamic Coefficients
188
_____ __ __·__I__ ___r�_ Il_ · II I II III I I : : ; f
I Lift Moment

J3
25
,20V
>15
0.> 10
5
0
Root angle-of-attack (deg)
L ) D0. I " I 1 I
10 12 14 16 18Root angle-of-attack (deg)
Fig. 35 Nonlinear coefficient sensitivity analysison [0 3/90]S flutter boundary
20
)
3u -
25-
-20-N) 15 -a)
~ 10-
0
I*. 1 . -- -------
i-'''.. ...ii.
~ ......................................
0
189
.
I
I....................................................... ................. I.................................... .................. I.......................................................
~Ab a
.1 -
I Ad | I .. I B ·l . . I
I l IilII I
_,tl f'hS

Appendix E - Example of Fourier Analysis
Equations (3-78) to (3-80) are still applicable:
a(X) = a o + asin(kt+4)
where,
a = a2+a2ov - S C
as
For a single break point model (see Fig. 36), equation (3-69)
to the following equations, where a A is the stall angle andsimplifies
all is the difference in slopes between the linear region and the non-
linear region,
{all(a-a )ACZ =
for a2aA
for a<aA
Equations
(E-5)
(E-6)
(E-7)
(E-8)
(3-84) to (3-87) then give that,
blo = all(aO-aA)
bll = alla v
I10 = 2 - (PA
Ill = costPA
(E-1)
(E-2)
(E-3)
(E-4)
190

1 . n 1(E-9) I112 = 2sin(PACOS(P + 4- 2PA
where equation (3-86) is,.
sin- 1a-a
L a A -
(E-10) PA= -2 if
+2 a
- if-O2 a
a > +1v
ao < -1V
Finally, putting these expressions into the combined mean and
oscillatory components of the nonlinear aerodynamic deviations
(3-83) and (3-90), we get,
(E-11) ACzo= -[- + cost[, }cc, L2 -J+cos(A
(E-12) ACzv = aa-sin cos(PA + 2 - (P A
A symmetric aerodynamic force curve can also be accounted
for by including a second stall angle at -aA.
versions of Equations (E-11) and (E-12),
This yields expanded
alCla 1 -aaO [1ACzo= - - a - (PA + cosPA
alV - A + A - cosa}/1 a v 2
(E-13)
191
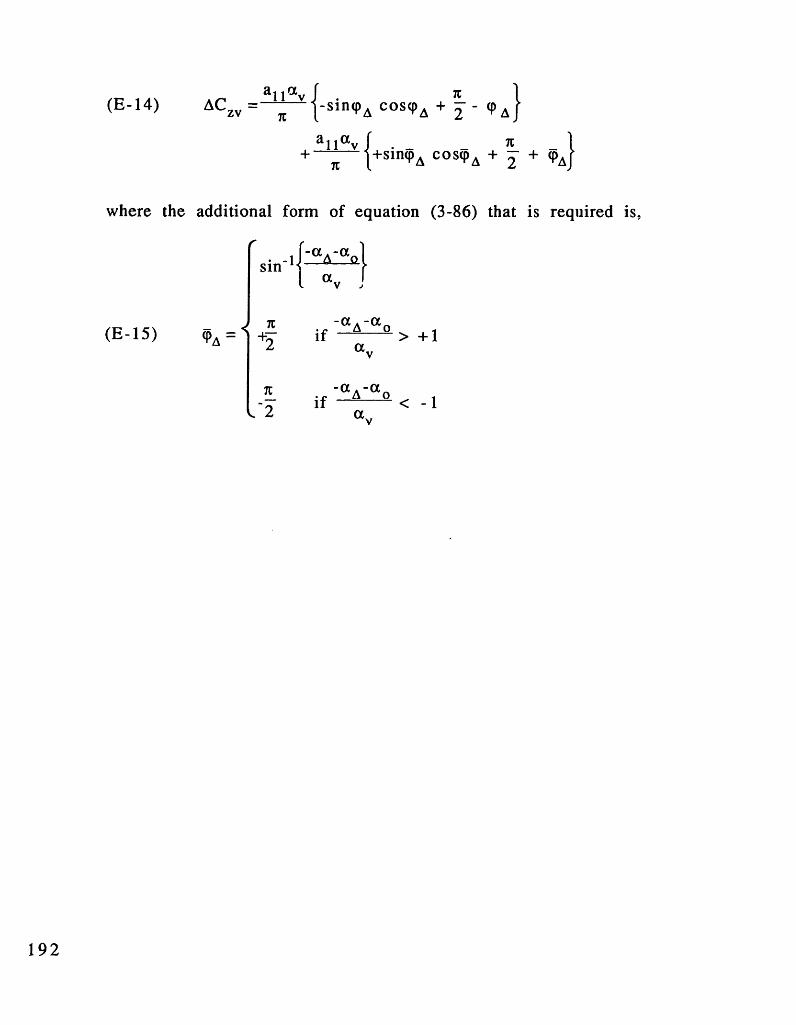
ACz == a 1 v -Sinpc cosca + - (PA
+ a + sin'PA c osp + + A
where the additional form of equation (3-86) that is required is,
sin| l-a-aO}
<7s = +2 if -a-
, -aA -Cif f2 < -1
(E-14)
(E-15)
192
XO> +1

cz· e
I
I
I
II
II
*
aO dC z
II
II
a oz -a 1
aaoA
Fig. 36 Example of single break point stall model
193

Appendix F - The Newton-Raphson Method
The Newton-Raphson method is a numerical solver used to find
the roots of the implicit vector equation, f(x) = 0, where x is the
state vector and f(x) is the vector of residual functions that must be
driven to zero. The Newton-Raphson scheme takes an initial guess of
the state vector x and drives the vector f(x) toward zero by invert-
ing the Jacobian matrix (derivative matrix), and obtaining a correc-
tion Ax to the current guess. The process is repeated until the cor-
rection Ax becomes negligible and the process is deemed to have
converged.
(F-l) Ax(n) = - d' f(x(n)) ; x(n+l) = x(n) + Ax(n)
The Newton-Raphson solver is. applied in the current analysis
by rearranging equation (3-217) as follows;
-f[K] 0 0 - ,1QIl
(F-2) f) L=0 - 2 [M]+[K] O fq - Qs}
tO O -2[M]+[K]_ I%1_ Q}-
Equation (F-2) comprises 3n equations that must be solved in
the form f(x) = 0 and are nonlinear in the aerodynamic dependence
of the modal forces Qi on the modal amplitudes qi and in the struc-
tural dependence of the stiffness matrix Kij on the modal amplitudes
qi. The state vector x is comprised of the harmonic components of
the modal amplitudes, qio qis, and qic, with some minor adjustments
to ensure convergence to a non-trivial solution: the sine component
194

of one mode qi is set to some small constant to set the amplitude
level, while its cosine component is set to zero, since the flutter limit
cycle oscillations can start at any arbitrary phase. The mode usually
chosen for this substitution is the first torsional mode, since experi-
mentally it is this mode which dominates the oscillatory motion.
These sine and cosine components are then dropped from the state
vector x and are replaced by the reduced frequency of oscillation, k,
and the flutter velocity, U. Because the sinusoidal component of one
mode shape has already been set to a non-zero value, the Newton-
Raphson scheme does not converge to the trivial steady solution.
Note that the Newton-Raphson solver is not always guaranteed
to converge, especially when the initial guess is too far from the
ultimate solution or when the derivatives used in the Jacobian matrix
are changing abruptly, which often happens with nonlinearities that
have discontinuous derivatives. In regions where convergence is
difficult (for example near the stall angle where the lift/moment
coefficient curves are discontinuous in slope), a relaxation technique,
which consists of taking only a fraction of Ax as a correction for each
iteration, is more likely to converge. When the Newton-Raphson
solver does converge to a solution, it will satisfy the equations, but
there is no indication as to whether this solution is unique or not. If
other solutions exist, the only way to find them is to start with a
different initial state vector.
The Jacobian matrix can be calculated either numerically or
analytically. The numerical method involves moving an incremental
distance in each direction of the state vector x, finding the resulting
incremental change in the residual vector f, and estimating each
195

component of the derivative matrix as Af/Ax. The analytic method
involves carrying out the entire nonlinear differentiation, which is
best carried out by multiple application of the chain rule to the
equations of Chapter 3.
Both the numerical and analytic methods have their advan-
tages and disadvantages. The numerical method is easier to code on
a computer since it involves using the already existing subroutines
which must compute the residual vector. On the other hand, the
numerical method is computationally inefficient since it requires
recalculating the residual vector for every direction of the state
vector. In addition, the numerical method is likely to be inaccurate
at points of discontinuity in derivatives, unless the user is careful to
choose appropriately small increments in the state vector.
By contrast, the analytic model directly solves for the Jacobian
matrix without needing several iterations, and so is computationally
faster for higher numbers of mode shapes and harmonics. In addi-
tion, the analytic method is always accurate and does not depend on
any step size. Unfortunately, the analytic method cannot employ
already existing subroutines and requires cumbersome programming
for a highly nonlinear problem such as in the current study.
Both the numerical and the analytic methods were used to cal-
culate the Jacobian matrix in the current study and compared well
against each other. However, with the large complexity in calculating
the modal forces, the numerical method is more likely to have fewer
coding errors than the analytic method, despite being computation-
ally slower. For this reason, it was used more extensively for the full
flutter analyses.
196

Appendix G - Computer Code
C-----FILE : FLUTTER.FOR------------------------------C
PROGRAM LUTTERC
INCLUDEINCLUDEREALREALREALREALREALINTEGERLOGICALCHARACTER
REALREALCOMMON
&
QLIT(i,j):
QALL:RES:DRDQ:
DQALL:VEL:AOA:FREQ.ATIP:HTIP:IERR:BENTOR:
CONVERGED:
LNEWT:
LSTRU:
LAYUP:
PARAM.INCGLBBLK.INCQLIT(MAXMODE,3),QDUM(MAXMODE, 3)QALL(3*MAXMODE),RES(3*MAM ODE)MDE),QBIG(MAXMODE,3)DRDQ(3*MAXMODE, 3*MAXMODE),DQALL(3*MAXMODE)VEL,AOA,FREQ,ATIP(3),HTIP(3),VTIP(3)SMAX,RMAXLMAX,IERR,BEN_TOR,MBTCONVERGED,LNEWT,LSTRUC,LCUBE,LFLUTB,LSTARTLAYUP*25,ANSWER*1,FILENAME*25,CDUM*8
AOL,AlL,ROL,R1L,EOL,ElLAOM,AlM,ROM,RlM,EOM,ElM/ COEFBLK / AOL,A1L,ROL,R1L,EOL,E1L,AOM, AlM, ROM, R1M, EOM, ElM
i-th modal amplitude, j-th component (l=mean,2=sine,3=cosine)Augmented state vectorResidual vectorJacobian matrix, derivatives of residuals (RES)w.r.t. the state vector (QALL)Corrections to augmented state vectorFree stream velocityRoot angle-of-attackReduced frequencyComponents of oscillating tip angleComponents of oscillating tip deflectionError status variable for opening of data fileInteger variable denoting whether analysis assumesbending (BENTOR=l) or torsional (BENTOR=2) flutterLogical variable to tell if Newton-Raphson solverhas converged to a solutionLogical variable to tell if diagnostics are to beprinted to output file at each step of the N-R solverLogical variable to tell if diagnostics are to beprinted to output file on structural variablesCharacter variable to denote flat plate layup (eg. for[0:2/90]:s, LAYUP might be '0290'). All data filesmust be of the form <LAYUP>.DAT.
FOIL = 'NAC12'CC Read in the layup.C10 WRITE(*,'(A,$)') ' Layup :
READ(*, ' (A) ', ERR=10) LAYUP20 WRITE(*,'(A,$)') ' Newton-Raphson control file :
READ(*,'(A)',ERR=20) FILENAMECC Read in specifications of current run from control file.C30 FORMAT(/8X,5I18/8X,7L8///8X,I8,2L8,I8,2G8.0,I8)
OPEN(UNIT=2,FILE=TRIM(FILENAME),& STATUS='OLD',FORM='FORMATTED',ERR=20)READ(2,30,ERR=20) NB,NT,NC,NF,BENTOR,LATAN,LCUBE,
197
C
CCCCCCCCCCCCCCCCCCCCCCCCCC

& LINEAR,CORREC,REDUC,STEADY,VLINES,ATYPE,LCONST,& LGEOM,IGEOM,SMAX,RMAX,LMAXCLOSE (2)NMODES = NB+NT+NC+NFIF ((NB.LT.1).OR.(NB.GT.NBMAX)) GOTO 20IF ((NT.LT.1).OR.(NT.GT.NTMAX)) GOTO 20IF ((NC.LT.0).OR.(NC.GT.NCMAX)) GOTO 20IF ((NF.LT.0).OR.(NF.GT.NFMAX)) GOTO 20
CC Read in nonlinear aerodynamic coefficients.C
IF ((ATYPE.NE.0).AND.(ATYPE.NE.1)) THEN35 WRITE(*,'(A,$)') ' Aero control file :
READ(*,'(A)',ERR=35) FILENAMEOPEN(UNIT=2,FILE=TRIM(FILENAME) , STATUS='OLD',
& FORM='FORMATTED',ERR=35)READ(2, '(/8X,6G8.0///8X,6G8.0) ',ERR=35) AOL, AL,
& ROL,R1L,EOL,ElL,AOM,AlM,ROM,RIM,EOM,ElMCLOSE (2)
ENDIFC
LNEWT = .FALSE.40 WRITE(*,'(/A,$)') ' Output Newton-Raphson troubleshooting '//
& 'diagnostics ? 'READ(*, ' (A) ',ERR=40) ANSWERIF ((ANSWER.EQ.'Y').OR.(ANSWER.EQ.'y')) LNEWT = .TRUE.
CLAEROF = .FALSE.
50 WRITE(*,'(A,$)') ' Output aerodynamics troubleshooting '//& 'diagnostics ?READ(*, '(A) ',ERR=50) ANSWERIF ((ANSWER.EQ.'Y').OR.(ANSWER.EQ.'y')) LAEROF = .TRUE.
CLSTRUC = .FALSE.
55 WRITE(*,'(A,$)') ' Output structures troubleshooting '//& 'diagnostics ?READ(*, '(A)',ERR=55) ANSWERIF ((ANSWER.EQ.'Y').OR.(ANSWER.EQ.'y')) LSTRUC = .TRUE.
CLSTART = .FALSE.
60 WRITE(*,'(A,$)') ' Write restart file ?READ(*,' (A) ',ERR=60) ANSWERIF ((ANSWER.EQ.'Y').OR.(ANSWER.EQ.'y')) THEN
LSTART = .TRUE.WRITE(FILENAME,' (A,4I1)') TRIM(LAYUP)//
& '.start',NB,NT,NC,NFOPEN(UNIT=3,FILE=TRIM(FILENAME),STATUS='NEW',
& FORM='FORMATTED',ERR=60)ENDIF
CDO 65 I = 1,NMODES
IF (I.LE.NB) WRITE(MLABEL(I), ' (A,I1) ') 'B',IIF ((I.GT.NB).AND.(I.LE.NB+NT))
& WRITE(MLABEL(I),'(A,I1') 'T',I-NBIF ((I.GT.NB+NT).AND.(I.LE.NB+NT+NC))
& WRITE(MLABEL(I),'(A,I1)') 'C',I-(NB+NT)IF ((I.GT.NB+NT+NC).AND.(I.LE.NB+NT+NC+NF))
& WRITE(MLABEL(I),'(A,I1) ') 'F',I-(NB+NT+NC)65 CONTINUECC Create mass and stiffness matrices by calling STATIC subroutine.C
CALL STATIC(LAYUP, JSTRUC, TRATIO, IERR)IF (IERR.NE.0) THEN
198

WRITE(*,'(A,I2,A)') ' IOSTAT=',IERR,' error reading '//& TRIM(LAYUP)//'.DAT data file.'
GOTO 10ENDIF
CC Open output file.C
FILENAME - TRIM(LAYUP)//'WNAV.OUT 'OPEN(UNIT-2,FILE=TRIM(FILENAME),& STATUS='NEW',FORM='FORMATTED',IOSTAT=IERR)IF (IERR.EQ.0) THEN
WRITE(*,*) ' Analysis results being sent to ',& TRIM (FILENAME)ELSE
WRITE(*,'(A,I2,A)') ' IOSTAT=',IERR,' error opening '//& TRIM(FILENAME)//' as output file.'
GOTO 10ENDIF
CWRITE(2,'(4(/I2,A))') NB,' = number of bending modes',& NT,' number of torsion modes',& NC,' - number of chordwise bending modes',& NF,' number of fore-&-aft modes'WRITE(2,'(F4.2,A)') TRATIO,' = NACA irfoil thickness ratio'
CWRITE(2,*) ' Exact angle calculation =',LATANWRITE(2,*) ' Cubic stiffening ',LCUBEIF (.NOT.LCUBE) KTTCUBE = 0.WRITE(2,*) ' Linear aerodynamics =',LINEARWRITE(2,*) ' Spanwise lift correction =',CORRECWRITE(2,*) ' Finite span lift reduction =',REDUCWRITE(2,*) ' Steady test case (no flutter) =',STEADYIF ((.NOT.STEADY).AND.((ATYPE.EQ.0).OR.(ATYPE.EQ.1)))
& WRITE(2,*) ' Unsteady analysis type =',ATYPE,& ' (see listing of COEFS.FOR)'IF (.NOT.STEADY) WRITE(2,*) ' Constant coeffs in '//
& 'unsteady analysis =',LCONSTWRITE(2,*) ' Geometric structural nonlinearities =',LGEOMWRITE(2, (A, lPE6.0E1) ') ' N-R max allowable step size =',SMAXWRITE(2,'(A, lPE6.El)') ' N-R max allowable residual =',RMAXWRITE(2,'(A,I5)') ' Max number of iterations =',LMAX
CC Read in the start & end values and the incremental step sizeC between each line of either (i) constant velocity orC (ii) constant root angle of attack.C70 IF (VLINES) WRITE(*,'(A,$)') ' Velocity start, end, '//
& '& step size (m/s) ? 'IF (.NOT.VLINES) WRITE(*,'(A,$)') ' Root angle start, '//
& 'end, & step size (deg) ? 'READ (*, *,ERR=70) DUM1LO,DUM1HI,DUMlINCIF ((DUM1LO.LT.0.).OR.(DUM1HI.LT.0.)) GOTO 70IF (((DUMlHI-DUMlLO)/DUMlINC).LT.0.) GOTO 70
CC Write header.C
IF (.NOT.LNEWT) THENIF (STEADY) THEN
WRITE(2,'(/A,$)') ' Vel AOA H avg A avg'IF (NF.EQ.0) WRITE(2,'(A)') ' 'IF (NF.GT.0) WRITE(2,'(A)') ' V avg'WRITE(2,' (A,$) ') (m/s) (deg) (cm) (deg) 'IF (NF.EQ.0) WRITE(2,'(A)') ' 'IF (NF.GT.0) WRITE(2,'(A)') ' (cm)'
199

ELSEIF ((.NOT.STEADY).AND.(BENTOR.EQ.1)) THENWRITE(2,'(/A,$)') ' Vel AOA Freq'//
& ' H avg H amp A avg A amp A phz'IF (NF.EQ.0) WRITE(2,*) 'IF (NF.GT.0) WRITE(2,*) ' V avg V amp V phz'WRITE (2, ' (A,$)) ' (m/s) (deg) (Hz)'//
& I (cm) (cm) (deg) (deg) (deg)'IF (NF.EQ.0) WRITE(2,*) ' 'IF (NF.GT.0) WRITE(2,*) ' (cm) (cm) (deg)'
ELSEIF ((.NOT.STEADY).AND.(BENTOR.EQ.2)) THENWRITE(2,'(/A,$)') ' Vel AOA Freq'//
& ' H avg H amp H phz A avg A amp'IF (NF.EQ.0) WRITE(2,*) ' 'IF (NF.GT.0) WRITE(2,*) ' V avg V amp V phz'WRITE(2,'(A,$) ') ' (m/s) (deg) (Hz)'//
& I (cm) (cm) (deg) (deg) (deg)'IF (NF.EQ.0) WRITE(2,*) ' 'IF (NF.GT.0) WRITE(2,*) ' (cm) (cm) (deg)'
ENDIFENDIF
CC Initialize state vectors.C
DO 80 I = 1,MAXMODEDO 80 J = 1,3
QLIT(I,J) = 0.QALL((I-1)*3+J) = 0.
80 CONTINUEC
LFLUTB = .FALSE.IF ((.NOT.STEADY).AND.(DUM1LO.NE.DUM1HI)) THEN
90 WRITE(*,'(A,$)') ' Flutter boundary analysis ?READ(*,'(A)',ERR=90) ANSWERIF ((ANSWER.EQ.'Y').OR.(ANSWER.EQ.'y')) LFLUTB = .TRUE.
ENDIFCC Loop through each line of either (i) constant velocity orC (ii) constant root angle of attack, denoted by the dummyC variable DUMMY1.C
DO 999 DUMMY1 = DUM1LO,DUM1HI,DUM1INCIF (STEADY) THEN
FREQ = 0.INCLUDE STEADY.INC
ELSEINCLUDE UNSTEADY.INC
ENDIF999 CONTINUE
CLOSE (2)IF (LSTART) CLOSE(3)STOPEND
C-----FILE: STEADY.INC-C
RGEOM = 1.CC Set the velocity VEL or the root angle of attack AOA, dependingC on whether lines of constant velocity or constant angle.C
IF (VLINES) VEL = DUMMY1IF (.NOT.VLINES) AOA = DUMMY1*PI/180.
CC Initialize to zero the augmented modal amplitude vector QALL,
200
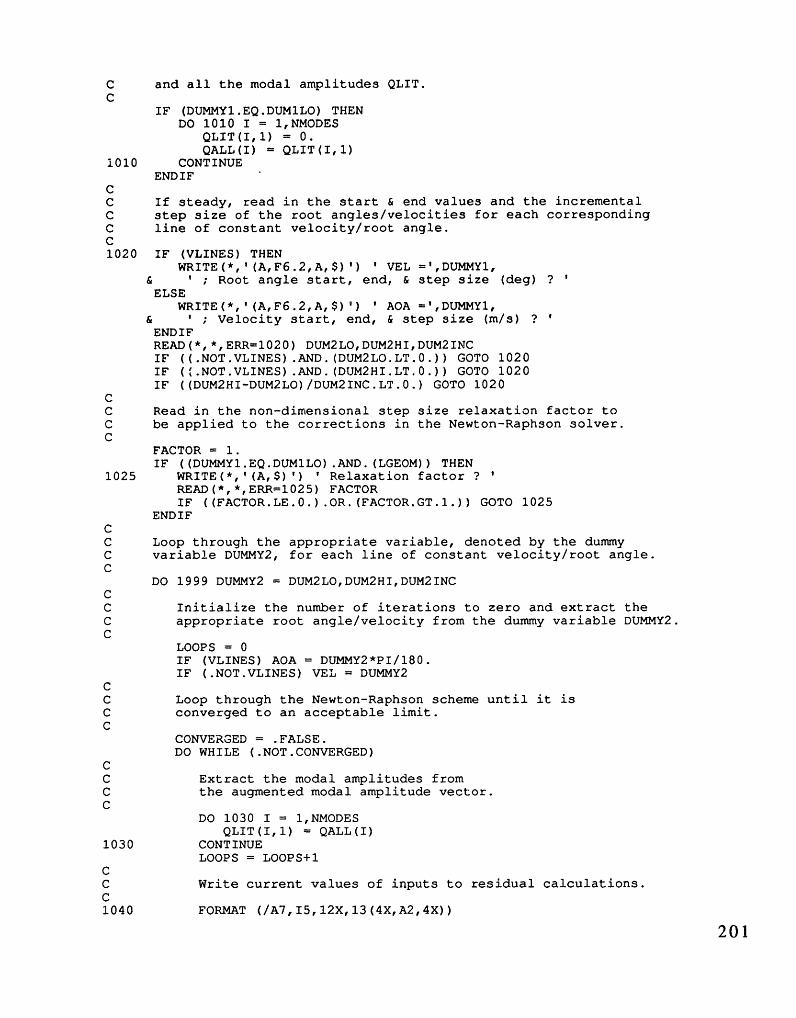
C and all the modal amplitudes QLIT.C
IF (DUMMY1.EQ.DUM1LO) THENDO 1010 I = 1,NMODES
QLIT(I,1) = 0.QALL(I) = QLIT(I,1)
i010 CONTINUEENDIF
CC If steady, read in the start & end values and the incrementalC step size of the root angles/velocities for each correspondingC line of constant velocity/root angle.C1020 IF (VLINES) THEN
WRITE(*,'(A,F6.2,A,$)') ' VEL =',DUMMY1,& ' ; Root angle start, end, & step size (deg) ?ELSE
WRITE(*,'(A,F6.2,A,$)') ' AOA =',DUMMY1,& ' ; Velocity start, end, & step size (m/s) ?ENDIFREAD(*,*,ERR=1020) DUM2LO,DUM2HI,DUM2INCIF ((.NOT.VLINES) .AND.(DUM2LO.LT.0.)) GOTO 1020IF (.NOT.VLINES).AND.(DUM2HI.LT.0.)) GOTO 1020IF ((DUM2HI-DUM2LO)/DUM2INC.LT.0.) GOTO 1020
CC Read in the non-dimensional step size relaxation factor toC be applied to the corrections in the Newton-Raphson solver.C
FACTOR = 1.IF ((DUMMY1.EQ.DUM1LO).AND.(LGEOM)) THEN
1025 WRITE(*,'(A,$)') ' Relaxation factor ?READ(*,*,ERR=1025) FACTORIF ((FACTOR.LE.0.).OR.(FACTOR.GT.1.)) GOTO 1025
ENDIFCC Loop through the appropriate variable, denoted by the dummyC variable DUMMY2, for each line of constant velocity/root angle.C
DO 1999 DUMMY2 = DUM2LO,DUM2HI,DUM2INCCC Initialize the number of iterations to zero and extract theC appropriate root angle/velocity from the dummy variable DUMMY2.C
LOOPS = 0IF (VLINES) AOA = DUMMY2*PI/180.IF (.NOT.VLINES) VEL = DUMMY2
CC Loop through the Newton-Raphson scheme until it isC converged to an acceptable limit.C
CONVERGED = .FALSE.DO WHILE (.NOT.CONVERGED)
CC Extract the modal amplitudes fromC the augmented modal amplitude vector.C
DO 1030 I = 1,NMODESQLIT(I,1) = QALL(I)
1030 CONTINUELOOPS = LOOPS+1
CC Write current values of inputs to residual calculations.C1040 FORMAT (/A7,I5,12X,13(4X,A2,4X))
201

1045 FORMAT (A23,13(1PE10.2))IF (LNEWT) THEN
WRITE(2,1040) ' LOOP ',LOOPS,& (MLABEL(I) ), I=1,NMODES)
WRITE(2,1045) ' Avg modal amp [m] : '& (QLIT(I, 1),I=l,NMODES)
ENDIFCC Calculate the residuals from subroutine RESIDUAL, whichC are functions of the velocity VEL, root angle of attack AOA,C reduced frequency FREQ, and modal amplitudes QLIT.C
CALL RESIDUAL(VEL,AOA,FREQ,QLIT,RGEOM,RES,QBIG)IF (LNEWT) WRITE(2,1045) ' Avg modal Qs (ND):
& (QBIG(I, 1),I=1,NMODES)IF (LNEWT) WRITE(2,1045) ' Avg residuals (ND): ',
& (RES(I),I=1,NMODES)CC Calculate the derivative matrix of the residuals wrt theC modal amplitudes using subroutine R_REDIV, which is aC function of the velocity VEL, root angle of attack AOA,C reduced frequency FREQ, and modal amplitudes QLIT. TheC current values of the residuals RES are also passed sinceC the derivative matrix may be calculated numerically, inC which case the current values are needed.C
CALL R DERIV(BEN TOR,VEL,AOA,FREQ,QLIT,RES,RGEOM,DRDQ)CC Write derivative matrix.C
IF (LNEWT) THENWRITE(2,'(/A)') ' NUMERIC dR/dq MATRIX :'WRITE (2, ' (12X, 13 (6X, I1, 3X)) ') (I, I=1, NMODES)DO 1050 J = 1,NMODES
WRITE (2,' (4X,A8,13(1PE10.2)) ')& 'dR/dq'//MLABEL(J)//'o',(DRDQ(I,J),I=1, NMODES)
1050 CONTINUEENDIF
CC Apply the Newton-Raphson scheme to figure the appropriateC linear correction in the state vector so as to drive theC appropriate residuals to zero. For the steady case, onlyC the steady amplitudes need to be corrected.C
CALL SOLVE(DRDQ,RES,DQALL,3*MAXMODE,1,NMODES)IF (LNEWT) WRITE(2,'(/A,13(lPE10.2))')
& ' DELTA avg amps [m] : ',(-DQALL(I),I=1,NMODES)CC Update the augmented state vector, at the same timeC checking for convergence of the maximum residual andC of the relative change in the state vector QALL.C
CONVERGED = .TRUE.RESMAX = 0.DO 1060 I = 1,NMODES
QALL(I) = QALL(I)-DQALL(I)*FACTORCC Check relative change in state vector.C
IF (QALL(I).NE.0.) THENIF (ABS (DQALL(I) /QALL(I)) .GT.SMAX)
& CONVERGED=.FALSE.ENDIF
C
202

C Check relative size of residuals.C
IF (ABS(RES(I)/QBIG(I,1)).GT.RMAX) CONVERGED=.FALSE.IF (ABS(RES(I)).GT.ABS(RESMAX)) RESMAX=RES(I)
1060 CONTINUEC
IF (LOOPS.GE.ABS(LMAX)) THENIF (LMAX.LT.0) THEN
1065 WRITE(*,'(A,$)') ' Continue iterations ?READ(*, '(A) ',ERR=1065) ANSWERCONVERGED=.TRUE.IF ((ANSWER.EQ.'Y').OR.(ANSWER.EQ.'y')) THEN
CONVERGED = .FALSE.LOOPS = 0
ENDIFELSE
CONVERGED=.TRUE.ENDIF
ENDIFCC Print current status to screen.C1070 FORMAT (A,F6.2,A,I4,A,1PE8.1)
IF (VLINES) WRITE(*,1070) ' STEADY - AOA =',& DUMMY2,' deg ; Loop',LOOPS,' ; Rmax = ',RESMAX
IF (.NOT.VLINES) WRITE(*,1070) ' STEADY - VEL =',& DUMMY2, ' m/s ; Loop',LOOPS,' ; Rmax = ',RESMAX
CIF (LSTART) THEN
DO 1075 I = 1,NMODESQLIT(I,2) = 0.QLIT(I,3) = 0.
1075 CONTINUEWRITE(3,*) AOA*180./PI,VEL,0.,((QLIT(I,J),J=1,3),
& I=1,NMODES),RESMAXENDIF
END DOCC Extract the modal amplitudes from the final, convergedC augmented state vector.C
DO 1080 I = 1,NMODESQLIT(I,1) = QALL(I)
1080 CONTINUEFREQ = 0.
CC Calculate the midchord tip deflection components and the tipC twist components.C
HTIP(1) = 0.ATIP(1) = 0.DO 1090 I = 1,NB+NT+NC
HTIP(l) = HTIP(1)+QLIT(I,1)*FMODE(0,'X',I,1.)*& FMODE(0,'Y',I,0.)
ATIP(1) = ATIP(1)+QLIT(I,1)*FMODE(0,'X',I,1.)*& FMODE(1,'Y', I,0.) /CHORD
1090 CONTINUEC
VTIP(1) = 0.IF (NF.GT.0) THENDO 1100 I = NB+NT+NC+1,NB+NT+NC+NF
VTIP(1) = VTIP(1)+QLIT(I,1)*FMODE(0,'X',I,1.)*& FMODE(0,'Y',I,0.)
1100 CONTINUE
203

ENDIFCC Convert tip deflection to centimeters and tip twist to degrees.C
IF (LATAN) ATIP(1) = ATAN(ATIP(1))HTIP(1) = HTIP(1)*100.ATIP(1) = ATIP(1)*180./PIVTIP(1) = VTIP(1)*100.
CC Write converged results.C
ANG = AOA*180./PIIF (LNEWT) THEN
WRITE(2,'(/A,I5,A)') ' After',LOOPS,' N-R iterations :'DO 1110 I = 1,NMODES
WRITE(2,*) ' Avg ',MLABEL(I),' amp =' ,QLIT(I,1),' m'1110 CONTINUE
WRITE(2,*) ' H tip =',HTIP(1),' cm'WRITE(2,*) ' A tip =',ATIP(1),' deg'WRITE(2,*) ' V tip =',VTIP(1),' cm'WRITE(2,*) ' AOA =',ANG,' degs'WRITE(2,*) ' VEL =',VEL,' m/s'
ELSEWRITE(2, ' (2F7.2,2F9.3,$)') VEL,ANG,HTIP(1),ATIP(1)IF (NF.GT.0) WRITE(2,'(F9.3,$)') VTIP(1)IF (LOOPS.LT.ABS(LMAX)) WRITE(2,'(A)') ' 'IF (LOOPS.EQ.ABS(LMAX)) WRITE(2,'(A)')
& ' * Not converged 'ENDIF
1999 CONTINUE
C----- FILE: UNSTEADY.INC-CC Calculate mode number associated with BEN TOR variable, i.e.C either first bending (#1) or first torsion (#NB+1).C
MBT = (BEN_TOR-1)*NB + 1CC Set the velocity VEL or the root angle of attack AOA, dependingC on whether lines of constant velocity or constant angle.C
IF (VLINES) VEL = DUMY1IF (.NOT.VLINES) AOA = DUMMY1*PI/180.
CCC If unsteady, read in the start & end values and the incrementalC step size of the amplitude of oscillating twist for eachC line of constant velocity/root angle.C
IF ((DUMMY1.EQ.DUM1LO).OR.(.NOT.LFLUTB)) THEN2010 IF (BEN TOR.EQ.1) THEN
IF (VLINES) WRITE(*,'(A,F5.1,A,$)') ' VEL =',DUMMY1,& ' ; Bending amplitude start, end, & step size (cm) ?
IF (.NOT.VLINES) WRITE(*,'(A,F5.1,A,$)') ' AOA =',& DUMMY1,' ; Bending amplitude start, end, & step '//& 'size (cm) ?
ELSEIF (VLINES) WRITE(*,'(A,F5.1,A,$)') ' VEL =',DUMMY1,
& ' ; Twist amplitude start, end, & step size (deg) ?IF (.NOT.VLINES) WRITE(*,'(A,F5.1,A,$)') ' AOA ='
& DUMMY1,' ; Twist amplitude start, end, & step '//& 'size (deg) ?
ENDIFREAD(*,*,ERR=2010) DUM2LO,DUM2HI,DUM2INC
204

IF ((.NOT.VLINES).AND.(DUM2LO.LT.0.)) GOTO 2010IF ((.NOT.VLINES).AND.(DUM2HI.LT.0.)) GOTO 2010IF ((DUM2HI-DUM2LO)/DUM2INC.LT.0.) GOTO 2010
ENDIFCC Determine if previous values should be used as an initial guess.C
IF (DUMMY1.EQ.DUM1LO) THENANSWER = 'N'
ELSEIF (LFLUTB) THENANSWER = 'Y'
ELSEIF (.NOT.LFLUTB) THEN2020 WRITE(*,'(A,$)') ' Use previous values as '//
& 'initial guess ? 'READ(*, ' (Al) ',ERR=2020) ANSWER
ENDIFC
IF ((ANSWER.NE.'Y').AND.(ANSWER.NE.'y')) THENCC Read in the initial guess for root angle AOA, or forC velocity VEL - to be used for the first iteration of theC Newton-Raphson solver for the first corresponding lineC of constant velocity/root angle - and insert in locationC reserved for sine harmonic of bending/twist amplitude.C2021 WRITE(*,'(A,$)') ' Start from restart file ?
READ(*,'(A)',ERR=2021) ANSWERC
QLIT(1,1) = 0.IF ((ANSWER.EQ.'Y').OR.(ANSWER.EQ.'y')) THEN
2022 WRITE(*,'(A,$)') ' Restart filename ?READ(*, '(A) ',ERR=2022) FILENAMEOPEN(UNIT=4, FILE=FILENAME,STATUS='OLD',
& FORM='FORMATTED',ERR=2022)2023 READ(4,*,ERR=2022,END=2029) AOADUM,VELDUM,FRQDUM,
& ((QDUM(I,J), J=1,3),I=1,N MODES)IF (((VLINES).AND.(DUMMY1.EQ.VELDUM)).OR.
& ((.NOT.VLINES).AND.(DUMMY1.EQ.AOADUM))) THENDO 2025 I = 1,NMODESDO 2025 J = 1,3
QLIT(I,J) = QDUM(I,J)QALL((J-1)*NMODES+I) = QLIT(I,J)
2025 CONTINUEIF (VLINES) THEN
AOA = AOADUM*PI/180.QALL(NMODES+MBT) = AOA
ELSEVEL = VELDUMQALL(NMODES+MBT) = VEL**2
ENDIF2026 IF (FRQDUM.LE.O.) THEN
WRITE(*,'(A,$)') ' Initial frequency guess '//& '(in Hz) ? '
READ(*,*,ERR=2026) FRQDUMGOTO 2026
ENDIFFREQ = FRQDUM*2.*PI*(CHORD/2.)/VELQALL(2*NMODES+MBT) = FREQ
ENDIFGOTO 2023
2029 CLOSE(4)IF (QLIT(1,1).EQ.0.) GOTO 2021
ELSEC
205

IF (VLINES) THEN2030 WRITE(*,'(A,$)') ' Initial root angle guess (deg) ?
READ(*,*,ERR=2030) AOAAOA AOA*PI/180.QALL(NMODES+MBT) = AOA
ELSE2040 WRITE(*,'(A,$)') ' Initial velocity guess (m/s) ?
READ(*,*,ERR-2040) VELIF (VEL.LT.0.) GOTO 2040QALL(NMODES+MBT) - VEL**2
ENDIFCC Query user if he wants to directly input the initial averageC amplitudes (eg. might be needed if flutter is near theC divergence velocity).C
WRITE(*,'(A,$)') ' Input initial average deflections ?READ(*,' (Al) ') ANSWERDO 2060 I = 1,NMODES
IF (DUMMY1.EQ.DUM1LO) QLIT(I,1) = 0.IF ((ANSWER.EQ.'Y').OR.(ANSWER.EQ.'y')) THEN
2050 WRITE(*,' (A,$) ') ' Mode '//MLABEL(I)//& ' average [m] =
READ(*,*,ERR-2050) QLIT(I,1)ENDIFQALL(I) = QLIT(I,1)
2060 CONTINUEC2070 WRITE(*,'(A,$)') ' Start vibration on eigenmode ?
READ(*, '(A) ',ERR=2070) ANSWERIF ((ANSWER.EQ.'Y').OR.(ANSWER.EQ.'y')) THEN
CC Determine current nonlinear mass & stiffness matrices.C
DO 2073 I = 1,MAXMODEDO 2073 12 = I1,MAXMODE
MDUM(Il,I2) = M(Il,I2)KDUM(I1,I2) = K(I1,I2)
CC Add corrections to stiffness matrix for geometricC nonlinearities.C
IF (LGEOM) THENIF ((I1.GT.NB).AND.(I1.LE.NB+NT).AND.
& (I2.GT.NB).AND.(I2.LE.NB+NT)) THENDO 2071 I3 = 1,NBDO 2071 I4 = 1,NB
KDTJM(II,I2) = KDUM(I1,I2) +& R(I3,I4,I1-NB,I2-NB)*QLIT(I3,1)*QLIT(I4,1)
2071 CONTINUEELSEIF ((I1.GToNB).AND.(Il1.LE.NB+NT).AND.
& (I2.GT.NB+NT+NC).AND. (I2.LE.NB+NT+NC+NF)) THENDO 2072 I3 = 1,NB
KDUM(Il,I2) = KDUM(I1,I2) +& H(I3,Il-NB,I2-NB-NT-NC) *QLIT(I3,1)
2072 CONTINUEENDIF
ENDIFC
MDUM(I2,I1) = MDUM(I1,I2)KDUM(I2,I1) = KDUM(I1,I2)
2073 CONTINUECC Add contribution to stiffness matrix for cubic stiffening.
206

KDUM(NB+1,NB+I) KDUM(NB+1,NB+1) + KTTCUBE*& (3.*QLIT(NB+1,1)**2+.75*QLIT(NB+1,2)**2+& .75*QLIT(NB+, 3) **2)
CC Call EISPACK eigenvalue solver.C
CALL RSG(MAXMODE,NMODES,KDUM,MDUM,FVIB,1,QVIB,& FV1,FV2,IERR)
CC Print out choice of eigenmodes to start from (negativeC frequency to indicate imaginary).C
DO 2076 I = 1,NMODESQMAX = QVIB(1,I)DO 2075 J = 1,NMODES
IF (ABS(QVIB(J,I)).GT.ABS(QMAX))& QMAX = QVIB(J,I)
2075 CONTINUEWRITE(*, '(5X, I2,A, F9.2,A, SP,32(lX,F4.1))')
& I,' Freq =',SQRT(ABS(FVIB(I)))/(2.*PI)*& (FVIB(I)/ABS(FVIB(I))),' Hz ; mode shape '& (QVIB(J,I)/QMAX,J=l,NMODES)
2076 CONTINUEC2077 WRITE(*,'(/A,$)') ' Starting eigenmode number ?
READ(*,*,ERR=2077) IEIGIF ((IEIG.LE.0).OR.(IEIG.GT.NMODES)) GOTO 2077
CC Initialize amplitudes of vibration.C
TWIST = DUM2LO*PI/180.DEFLC = DUM2LO/100.DO 2078 I = 1,NMODES
IF (BEN TOR.EQ.1) QLIT(I,2) = DEFLC/& FMODE(0,'X',MBT,1.)/FMODE(0,'Y',MBT,0.)*& QVIB(I,IEIG)/QVIB(MBT,IEIG)
IF (BEN TOR.EQ.2) QLIT(I,2) = TAN(TWIST)*CHORD/& FMODE(1,'X',MBT,1.)/FMODE(l,'Y',MBT,0.)*& QVIB(I,IEIG)/QVIB(MBT,IEIG)
IF (I.NE.MBT) QALL(NMODES+I) = QLIT(I,2)QLIT(I,3) = 0.IF (I.NE.MBT) QALL(2*NMODES+I) = QLIT(I,3)
2078 CONTINUECC Initialize reduced frequency.C
FREQ = SQRT(FVIB(IEIG)) * (CHORD/2.)/VELQALL(2*NMODES+MBT) = FREQ
ELSECC Initialize reduced frequency.C
IF (DUMMY1.NE.DUM1LO) WRITE(*,*) ' Current frequency =',& FREQ*VEL/(2.*PI*(CHORD/2.)),' Hz'
2080 WRITE(*,'(A,$)') ' Initial frequency guess (in Hz) ?READ(*,*,ERR=2080) FREQIF (FREQ.LE.0.) GOTO 2080FREQ = FREQ*2.*PI*(CHORD/2.)/VELQALL(2*NMODES+MBT) = FREQ
CC Initialize the oscillating amplitudes to zero.C
DO 2085 J = 2,3
207

DO 2085 I 1,NMODESQLIT(I,J) = 0.IF (I.NE.MBT) QALL(NMODES*(J-1)+I) - QLIT(I,J)
2085 CONTINUEENDIFENDIF
ENDIFCC Read in the non-dimensional step size tolerance [maximumC delta(X)/X] to be applied to the root angle/velocity andC frequency corrections in relaxing the Newton-Raphson solver.C
IF ((DUMMY1.EQ.DUM1LO).OR.(.NOT.LFLUTB)) THEN2090 WRITE(*,'(A,$)') ' Step size tolerance ? '
READ(*,*,ERR=2090) TOLIF (TOL.LE.0.) GOTO 2090
ENDIFC
DO 2999 JGEOM = 0,IGEOMRGEOM = 1.IF ((LGEOM).AND.(IGEOM.GT.O)) THEN
RGEOM = REAL(JGEOM)/REAL(IGEOM)WRITE(*,'(A,F4.3)') 'RGEOM = ',RGEOM
ENDIFCC Loop through the appropriate variable, denoted by the dummyC variable DUMMY2, for each line of constant velocity/root angle.C
DO 2999 DUMMY2 = DUM2LO,DUM2HI,DUM2INCCC Initialize the number of iterations to zero.C
LOOPS = 0CC Initialize convergence. If zero velocity, automatically setC all amplitudes to zero and skip Newton-Raphson solver.C
CONVERGED = .FALSE.IF ((.NOT.VLINES).AND.(DUMMY2.EQ.0.)) THEN
DO 2100 I = 1,NMODESQLIT(I,l) = 0.QALL(I) = 0.
2100 CONTINUECONVERGED = .TRUE.
ENDIFCC Rescale unsteady, variable amplitudes from previous valuesC according to new set amplitude.C
DO 2110 I = 1,NMODESDO 2110 J = 2,3
IF ((I.NE.MBT).AND.(DUMMY2.NE.DUM2LO)) QALL(NMODES*& (J-1) +I) =QALL(NMODES* (J-1) +I) *DUMMY2 /(DUMMY2-DUM2INC)
2110 CONTINUECC Loop through the Newton-Raphson scheme until it isC converged to an acceptable limit.C
DO WHILE (.NOT.CONVERGED)CC Extract the modal amplitudes fromC the augmented modal amplitude vector.C
DO 2120 I = 1,NMODES
208

DO 2120 J = 1,3QLIT(I,J) = QALL(NMODES*(J-1)+I)
2120 CONTINUECC Extract current value of unknown root angle/velocityC from the augmented state vector QALL, appropriate to linesC of constant velocity or root angle. Set velocity toC zero if Newton-Raphson solver drives VEL**2 below zero.C
IF (VLINES) THENAOA = QALL(NMODES+MBT)
ELSEIF (QALL(NMODES+MBT).GT.0.) THENVEL SQRT(QALL(NMODES+MBT))
ELSEQALL(NMODES+MBT) = 0.VEL = 0.
ENDIFCC Extract current value of the unknown reduced frequencyC from the augmented state vector QALL.C
FREQ = QALL(2*NMODES+MBT)CC Extract the desired twist oscillating amplitudes fromC the dummy variable DUMMY2.C
TWIST = DUMMY2*PI/180.DEFLC = DUMMY2/100.IF (BEN_TOR.EQ.1) QLIT(MBT,2) = DEFLC/
& FMODE(0,'X',MBT,1.)/FMODE(0,'Y',MBT,0.)IF (BENTOR.EQ.2) QLIT(MBT,2) = TAN(TWIST)*CHORD/
& FMODE(0,'X',MBT,1.)/FMODE(1,'Y',MBT,0.)QLIT(MBT,3) = 0.
CLOOPS = LOOPS+1
CC Write current values of inputs to residual calculations.C
IF (LNEWT) THENWRITE(2,'(/A,I4,11X,13(4X,A2,4X))') ' LOOP = '
& LOOPS, (MLABEL(I),I=l,NMODES)DO 2130 J = 1,3
IF (J.EQ.1) WRITE(2,'(A,$)') ' Avg 'IF (J.EQ.2) WRITE(2,'(A,$)') ' SinIF (J.EQ.3) WRITE(2, '(A,$)') ' CosWRITE(2,'(A,13(1PE10.2))') 'modal amp : ',
& (QLIT(I,J), I=1,NMODES)2130 CONTINUE
WRITE(2,*) ' VEL =',VEL,' m/s'WRITE(2,*) ' AOA =',AOA*180./PI,' degs'WRITE(2,*) ' k =',FREQOMEGA = FREQ*VEL/(CHORD/2.)/(2.*PI)WRITE(2,*) ' w =',OMEGA,' Hz'
ENDIFCC Calculate the residuals from subroutine RESIDUAL, whichC are functions of the velocity VEL, root angle of attack AOA,C reduced frequency FREQ, and modal amplitudes QLIT.C
CALL RESIDUAL(VEL,AOA,FREQ,QLIT,RGEOM,RES,QBIG)CC Write current values of residuals.C
IF (LNEWT) THEN
209

DO 2140 J = 1,3IF (J.EQ.1) WRITE(2,'(/A,$)') ' Avg 'IF (J.EQ.2) WRITE(2,'(A,$)') ' Sin 'IF (J.EQ.3) WRITE(2,'(A,$)') ' CosWRITE(2,'(A,13(1PE10.2))') 'modal Qs
& (QBIG(I,J),I=1,NMODES)2140 CONTINUE
DO 2145 J = 1,3IF (J.EQ.1) WRITE(2,'(/A,$)') ' Avg 'IF (J.EQ.2) WRITE(2,'(A,$)') ' Sin 'IF (J.EQ.3) WRITE(2,'(A,$)') ' CosWRITE(2,'(A,13(1PE10.2))') 'residuals :
& (RES(I),I=(J-1)*NMODES+1, J*NMODES)2145 CONTINUE
ENDIFCC Calculate the derivative matrix of the residuals wrt theC modal amplitudes using subroutine R_REDIV, which is aC function of the velocity VEL, root angle of attack AOA,C reduced frequency FREQ, and modal amplitudes QLIT. TheC current values of the residuals RES are also passed sinceC the derivative matrix may be calculated numerically, inC which case the current values are needed.C
CALL R_DERIV(BEN TOR,VEL,AOA,FREQ,QLIT,RES,RGEOM,DRDQ)CC Write derivative matrix.C
IF (LNEWT) THENWRITE(2,'(/A)') ' NUMERIC dR/dq MATRIX :'WRITE(2, '(12X,99(6X, I, 3X)) ')
& ((I,I=1,NMODES),J=1,3)DO 2160 I = 1,3DO 2160 I2 = 1,NMODES
IF (Il.EQ.1) CDUM = 'dR/dq'//MLABEL(I2)//'o'IF (I1.EQ.2) CDUM = 'dR/dq'//MLABEL(I2)//'s'IF (I1.EQ.3) CDUM = 'dR/dq'//MLABEL(I2)//'c'IF ((I1.EQ.2).AND.(I2.EQ.MBT)) THEN
IF (VLINES) CDUM = ' dR/dAOA'IF (.NOT.VLINES) CDUM = ' dR/dV*2'
ELSEIF ((I1.EQ.3).AND.(I2.EQ.MBT)) THENCDUM = ' dR/dk'
ENDIFJ = (I1-1)*NMODES+I2WRITE(2,' (4X, A8,13(1PE10.2)) ')
& CDUM, (DRDQ(I, J), I=l, 3*NMODES)2160 CONTINUE
ENDIFCC Apply the Newton-Raphson scheme to figure the appropriateC linear correction in the state vector so as to drive theC appropriate residuals to zero. For the steady case, onlyC the steady amplitudes need to be corrected.C
CALL SOLVE(DRDQ,RES,DQALL,3*MAXMODE,1,3*NMODES)CC Write the uncorrected state vector corrections.C
IF (LNEWT) THENDO 2165 I = 1,3
IF (I.NE.1) RDUM = DQALL((I-1)*NMODES+MBT)IF (I.NE.1) DQALL((I-1)*NMODES+MBT) = 0.IF (I.EQ.1) WRITE(2,'(/A,$)') ' DELTA avg 'IF (I.EQ.2) WRITE(2,'(A,$)') ' DELTA sin '
210

IF (I.EQ.3) WRITE(2,'(A,$)') ' DELTA cosWRITE(2,'(A,13(1PE10.2))') 'amps [ml : ',
& (-DQALL(J),J=(I-1)*NMODES+, I*NMODES)IF (I.NE.1) DQALL((I-1)*NMODES+MBT) = RDUM
2165 CONTINUEIF (VLINES) WRITE(2,*) ' DELTA AOA =',
& -DQALL(NMODES+MBT),' deg'IF (.NOT.VLINES) WRITE(2,*) ' DELTA V*2 -',
& -DQALL(NMODES+MBT),' (m/s) **2'WRITE(2,*) ' DELTA k =',-DQALL(2*NMODES+MBT)
ENDIFCC Calculate the appropriate factor for relaxation when theC correction step size is too large for either the rootC angle/velocity or reduced frequency.C
FACTOR = 1.DO 2170 I = 1,2
J = I*NMODES + MBTIF (QALL(J).NE.0.) THEN
IF (ABS(DQALL(J)/FACTOR/QALL(J)).GT.TOL)& FACTOR = ABS(DQALL(J)/(TOL*QALL(J)))
ENDIF2170 CONTINUE
IF (LNEWT) WRITE(2,'(/A,1PE10.2)')& ' FACTOR = ',FACTOR
CC Update the augmented state vector, at the same timeC checking for convergence of the maximum residual andC of the relative change in the state vector QALL.C
CONVERGED = .TRUE.RESMAX = 0.DO 2180 I = 1,NMODESDO 2180 J = 1,3
II = (J-1)*NMODES+IQALL(II) = QALL(II)-DQALL(II)/FACTOR
CC Check relative change in state vector.C
IF (QALL(II).NE.0.) THENIF (ABS(DQALL(II)/QALL(II)).GT.SMAX)
& CONVERGED=.FALSE.ENDIF
CC Check relative size of residuals.C
IF (ABS(RES(II)/QBIG(I,J)).GT.RMAX) CONVERGED=.FALSE.IF (ABS(RES(II)).GT.ABS(RESMAX)) RESMAX=RES(II)
2180 CONTINUECC Print current status to screen.C
IF (LFLUTB) THENIF (VLINES) WRITE(, ' (A,F6.2,$)')
& ' VEL =',DUMMY1IF (.NOT.VLINES) WRITE(*,'(A,F6.2,$)')
& ' AOA =',DUMMY1ELSE
WRITE(*,'(A,F6.2,$)') ' AMP =',DUMMY2ENDIF
2190 FORMAT (A,I4,A,lPE8.1,A,OPF6.2,A,F5.2,A,F4.2,A)IF (VLINES) THEN
WRITE(*,2190) ' ; Loop ',LOOPS,' ; Rmax =
211

& RESMAX,' ; AOA -',QALL(NMODES+MBT)*180./PI,& ' deg ; w =',QALL(2*NMODES+MBT)*VEL/(CHORD/& 2.)/(2.*PI),' Hz (k=',QALL(2*NMODES+MBT),')'
ELSEWRITE(*,2190) ' ; Loop ',LOOPS,' ; Rmax =
& RESMAX,' ; VEL =',SQRT(QALL(NMODES+MBT)),& ' m/s; w =',QALL(2*NMODES+MBT)*VEL/(CHORD/& 2.)/(2.*PI),' Hz (k=',QALL(2*NMODES+MBT),')'
ENDIFC
OMEGA = FREQ*VEL/(CHORD/2.)/(2.*PI)IF (LSTART) WRITE(3,*) AOA*180./PI,VEL,OMEGA,
& ((QLIT(I,J),J=1,3),I=1,NMODES),RESMAXC
IF (LOOPS.GE.ABS(LMAX)) THENIF (LMAX.LT.0) THEN
2195 WRITE(*,'(A,$)') ' Continue iterations ?READ(*, '(A) ',ERR=2195) ANSWERCONVERGED=.TRUE.IF ((ANSWER.EQ.'Y').OR.(ANSWER.EQ.'y')) THEN
CONVERGED = .FALSE.LOOPS = 0
2196 WRITE(*,'(A,F5.4,A,$)') ' TOL = ',TOL,& ' ; New step size tolerance ?
READ(*,*,ERR=2196) TOLIF (TOL.LE.0.) GOTO 2196
ENDIFELSE
CONVERGED=.TRUE.ENDIF
ENDIFEND DO
CC Extract the modal amplitudes and the velocity and reducedC frequency from the final, converged augmented state vector.C
DO 2200 I = 1,NMODESDO 2200 J = 1,3
QLIT(I,J) = QALL(NMODES*(J-1)+I)2200 CONTINUECC Extract the appropriate root angle/velocity,C frequency, and twist oscillating amplitudes from theC final, converged augmented state vector.C
QLIT(MBT,3) = 0.IF (BENTOR.EQ.1) QLIT(MBT,2) = DEFLC/
& FMODE(0,'X',MBT,1.)/FMODE(0,'Y',MBT,0.)IF (BENTOR.EQ.2) QLIT(MBT,2) = TAN(TWIST)*CHORD/
& FMODE(0,'X',MBT,1.)/FMODE(l,(1,'Y',BT,0.)IF (VLINES) AOA = QALL(NMODES+MBT)IF (.NOT.VLINES) VEL = SQRT(QALL(NMODES+MBT))FREQ = QALL(2*NMODES+MBT)
CC Calculate the midchord tip deflection components and the tipC twist components.C
DO 2220 J = 1,3HTIP(J) = 0.ATIP(J) = 0.DO 2210 I = 1,NB+NT+NC
HTIP(J) = HTIP(J)+QLIT(I,J)*FMODE(0,'X',I,1.)*& FMODE(0,'Y',I,0.)
ATIP(J) = ATIP(J)+QLIT(I,J)*FMODE(0,'X',I,1.)*
212

& FMODE(1,'Y',I,0.)/CHORD2210 CONTINUEC
VTIP(J) = 0.IF (NF.GT.0) THENDO 2215 I = NB+NT+NC+1,NB+NT+NC+NF
VTIP(J) - VTIP(J)+QLIT(I,J)*FMODE(0,'X',I,1.)*& FMODE(0,'Y',I,0.)
2215 CONTINUEENDIEF
CC Convert tip deflection to centimeters and tip twist toC degrees.C
IF (LATAN) ATIP(J) = ATAN(ATIP(J))HTIP(J) = HTIP(J)*100.ATIP(J) = ATIP(J)*180./PIVTIP(J) = VTIP(J)*100.
2220 CONTINUECC Write final/converged results.C
ANG = AOA*180./PIOMEGA = FREQ*VEL/(CHORD/2.)/(2.*PI)IF ((.NOT.LNEWT).AND.(BENTOR.EQ.1)) THEN
WRITE(2,'(3F7.2,5F9.3,$)') VEL,ANG,OMEGA,& (HTIP(J),J=1,2),ATIP(1),SQRT(ATIP(2)**2+ATIP(3)**2),& ATAN2 (ATIP (2) ,ATIP (3))
IF (NF.GT.0) WRITE(2,'(3F9.3,$)') VTIP(1),& SQRT(VTIP(2)**2+VTIP(3)**2),ATAN2(VTIP(2),VTIP(3))
IF (LOOPS.LT.ABS(LMAX)) WRITE(2,'(A)') ' 'IF (LOOPS.GE.ABS(LMAX)) WRITE(2,'(A)')
& ' * Not converged'ELSEIF ((.NOT.LNEWT).AND.(BEN TOR.EQ.2)) THEN
WRITE(2,'(3F7.2,5F9.3,$)') VEL,ANG,OMEGA,& HTIP(1),SQRT(HTIP(2)**2+HTIP(3)**2),& ATAN2(HTIP(2),HTIP(3)),ATIP(1),ATIP(2)
IF (NF.GT.0) WRITE(2,'(3F9.3,$)') VTIP(1),& SQRT(VTIP(2)**2+VTIP(3)**2),ATAN2(VTIP(2),VTIP(3))
IF (LOOPS.LT.ABS(LMAX)) WRITE(2,'(A)') ' 'IF (LOOPS.GE.ABS(LMAX)) WRITE(2,'(A)')
& ' * Not converged'ELSE
WRITE(2,'(/A,I5,A)') ' After',LOOPS,' N-R iterations :'WRITE(2, '(16X,13(4X,A2,4X)) ') (MLABEL(I),I=1,NMODES)WRITE(2,'(A,13(1PE10.2))') ' Avg amps [m] : '
& (QLIT(I,1),I=l,NMODES)WRITE(2,'(A,13(1PE10.2))') ' Sin amps [m] : ',
& (QLIT(I,2),I=1,NMODES)WRITE(2,'(A,13(1PE10.2))') ' Cos amps [m] : ',
& (QLIT(I,3),I=1,NMODES)WRITE(2,'(/A,F7.3,A)') ' AOA =',ANG,' degs'WRITE(2,'(A,F7.3,A)') ' VEL =',VEL,' m/s'WRITE(2,'(A,F7.3)') ' k =',FREQWRITE(2, ' (A, F6.3,A)') ' w = ',OMEGA,' Hz'
ENDIF2999 CONTINUE
C -----FILE : V G.FOR-C
PROGRAM VG_ANALYSISC
INCLUDE PARAM.INCINCLUDE GLBBLK.INC
213

REALREALREALREALREALREALREALCOMPLEXCOMPLEXCOMPLEXINTEGERLOGICALCHARACTER
TRATIO, FREQ, KDETKINV(MAXMODE,MAXMODE), FV3 (MAXMODE)AR(MAXMODE,MAXMODE),AI(MAXMODE,MAXMODE)ZR(MAXMODE),ZI(MAXMODE),QB(NBMAX)QR(MAXMODE,MAXMODE),QI(MAXMODE,MAXMODE)OMEGA (MAXMODE) ,DAMP (MAXMODE) ,VEL (MAXMODE)SL,KVL,LAM,SIGL,ALFA,SM,KVM,SIGMIC,L1L2,L3L4,M1M2,M3M4,THEOA (MAXMODE, MAXMODE)KINVA(MAXMODE,MAXMODE)IERR,IP(MAXMODE)LSTRUC, CONVERGEDLAYUP*25,ANSWER*1,FILENAME*25
CFOIL = 'NAC12'IC = (0.,1.)ATYPE = 1LINEAR = .TRUE.STEADY = .FALSE.REDUC = .TRUE.CORREC = .TRUE.VLINES = .TRUE.LATAN = .FALSE.LAEROF = .FALSE.LCONST = .TRUE.LGEOM = .TRUE.
CC Read in the layup.C10 WRITE(*,'(/A,$)') 'Layup :
READ(*, '(A) ',ERR=10) LAYUPCC Read in number of mode shapes to be used for the analysis.C20 WRITE(*,'(A,$)') 'Number of out-of-plane, '//
& 'torsion, & fore-&-aft modes ?READ(*,*,ERR=20) NB,NT,NFNC = 0IF ((NB.LT.1).OR.(NB.GT.NBMAX)) GOTO 20IF ((NT.LT.1).OR.(NT.GT.NTMAX)) GOTO 20IF ((NF.LT.).OR.(NF.GT.NFMAX)) GOTO 20NMODES = NB+NT+NC+NF
CLSTRUC = .FALSE.
30 WRITE(*,'(A,$)') 'Output structures troubleshooting '//& 'diagnostics ? 'READ(*,'(A)',ERR=30) ANSWERIF ((ANSWER.EQ.'Y') .OR.(ANSWER.EQ.'y')) LSTRUC = .TRUE.
CC Create mass and stiffness matrices by calling STATIC subroutine.C
CALL STATIC(LAYUP,LSTRUC,TRATIO,IERR)IF (IERR.NE.0) THEN
WRITE(*,'(A,I2,A)') ' IOSTAT=',IERR,' error reading '//& TRIM(LAYUP)//'.DAT data file.'
GOTO 10ENDIF
CC Open output file.C
FILENAME = TRIM(LAYUP)//'WNAV.VG'OPEN(UNIT=2,FILE=TRIM(FILENAME),STATUS='NEW',& FORM= FORMATTED',IOSTAT=IERR)IF (IERR.EQ.0) THEN
214
II

WRITE(*,*) 'Analysis results being sent to '//TRIM(FILENAME)ELSE
WRITE(*,'(A,I2,A)') 'IOSTAT=',IERR,' error opening '//& TRIM(FILENAME)//' as output file.'
GOTO 10ENDIFWRITE(2,'(3I2,A)') NB,NT,NF,' = out-of-plane, torsion, '//& 'fore-&-aft modes'WRITE(2,'(F5.2,A)') TRATIO,' = NACA airfoil thickness ratio'
CC Add geometric nonlinearities to stiffness matrix.C
DO 50 I = 1,NB40 WRITE(*, ' (A, I1,A,$)') q',I,'B [m] = '
READ(*,*,ERR=40) QB(I)50 CONTINUEC
DO 80 I = 1,MAXMODEDO 80 2 = I1,MAXMODE
IF ((Il.GT.NB).AND.(I1.LE.NB+NT).AND.& (I2.GT.NB).AND.(I2.LE.NB+NT)) THEN
DO 60 I3 = 1,NBDO 60 I4 = 1,NB
K(I1,I2) = K(II,I2) + R(I3,I4,I1-NB,I2-NB)*& QB(I3)*QB(I4)
60 CONTINUEELSEIF ((Il.GT.NB) .AND.(Il.LE.NB+NT) .AND.
& (I2.GT.NB+NT).AND.(I2.LE.NB+NT+NF)) THENDO 70 I3 = 1,NB
K(Il,I2) = K(Il,I2) + H(I3,I1-NB,& I2-NB-NT) *QB(I3)
70 CONTINUEENDIFK(I2,I1) = K(Il, I2)
80 CONTINUECC Loop through reduced frequencies from 0 to 2.C
CALL COEFS LIN('M',O .,SM,KVM,LAM,SIGM,ALFA)CALL COEFSLIN('L',0.,SL,KVL,LAM,SIGL,ALFA)DO 999 I = 0,210
CFREQ = REAL(I-9)/100.IF (I.GE.159) FREQ = 1.5*2.**(I-159)IF (I.LE.10) FREQ = REAL(I)/1000.IF (I.EQ.0) FREQ = 1.D-4WRITE(*,'(A,I3,A,lPG9.3)') 'I = ',I,' k = ',FREQ
CTHEO = (LAM+IC*(ALFA*FREQ))/(LAM+IC*FREQ)L1L2 = 1. - IC/FREQ*SLOPE('L')/SL*THEOL3L4 = .5 - KVL/SL + THEO/FREQ**2*SLOPE('L')/SL +
& IC/FREQ*(l.+(SIGL/SL-SLOPE('L')/2./SL)*THEO)C
M1M2 = .5 + 2.*SM/SL - IC/FREQ*SLOPE('L')/2./SL*THEOM3M4 = .25 - KVL/2./SL + SM/SL - 2.*KVM/SL +
& THEO/FREQ**2*SLOPE('L')/2./SL + IC/FREQ*(.5 +& 2.*SM/SL + 2.*SIGM/SL + .5*(SIGL/SL-SLOPE('L')/& 2./SL)*THEO)
CIF (REDUC) THEN
L1L2 = LlL2/(l.+SLOPE('L')/PI/(2.*LENGTH/CHORD))L3L4 = L3L4/(1.+SLOPE('L')/PI/(2.*LENGTH/CHORD))M1M2 = MlM2/(l.+SLOPE('L')/PI/(2.*LENGTH/CHORD))M3M4 = M3M4/(1.+SLOPE('L')/PI/(2.*LENGTH/CHORD))
215

ENDIFCC Out-of-plane/out-of-plane matrix components.C
DO 90 II - 1,NBDO 90 JJ II,NB
A(II,JJ) = M(II,JJ) + SL*RHOA*LENGTH*& (CHORD/2.)**2*L1L2*SC INT(II,JJ)
A(JJ,II) = A(II,JJ)90 CONTINUECC Out-of-plane/torsion matrix components.C
DO 100 II 1,NBDO 100 JJ = NB+1,NB+NT
A(II,JJ) = M(II,JJ) + SL*RHOA*LENGTH*& (CHORD/2.)**3/CHORD*L3L4*SC INT(II,JJ)
100 CONTINUECC Torsion/out-of-plane matrix components.C
DO 110 II = NB+1,NB+NTDO 110 JJ = 1,NB
A(II,JJ) = M(II,JJ) + SL*RHOA*LENGTH*& (CHORD/2.)**3/CHORD*M1M2*SC INT(II,JJ)
110 CONTINUECC Torsion/torsion matrix components.C
DO 120 II = NB+1,NB+NTDO 120 JJ = II,NB+NT
A(II,JJ) = M(II,JJ) + SL*RHOA*LENGTH*& (CHORD/2.) **4/CHORD**2*M3M4*& SC INT(II,JJ)
A(JJ,II) = A(II,JJ)120 CONTINUECC Fore-&-aft matrix componentsC
IF (NF.GT.0) THENDO 130 II = 1,NB+NT+NFDO 130 JJ = MAXO(II,NB+NT+1),NB+NT+NF
A(II,JJ) = M(II,JJ)A(JJ,II) = A(II,JJ)
130 CONTINUEENDIF
CCALL INVERT(K,KINV,MAXMODE,NMODES)
CDO 150 II = 1,NMODESDO 150 KK = 1,NMODES
KINVA(II,KK) = (0.,0.)DO 140 JJ = 1,NMODES
KINVA(II,KK) = KINVA(II,KK) + KINV(II,JJ)*A(JJ,KK)140 CONTINUE
AR(II,KK) = REAL(KINVA(II,KK))AI(II,KK) = AIMAG(KINVA(II,KK))
150 CONTINUEC
CALL CG(MAXMODE,NMODEODES,AR,AI,ZR,ZI, 0,QR,QI, FFV3,IERR)CC Extract natural frequency (OMEGA, in Hz), damping ratio (DAMP),C and velocity (VEL, in m/s) for each mode from the complexC eigenvalues.
216

CDO 160 II 1,NMODES
OMEGA(II) = 0.DAMP(II) = 0.IF (ZR(II).NE.0.) THEN
OMEGA(II) = 1./SQRT(ABS(ZR(II)))*ZR(II)/ABS(ZR(II))DAMP(II) = ZI(II)/ZR(II)
END IFVEL(II) = (CHORD/2.)*OMEGA(II)/FREQOMEGA(II) = OMEGA(II)/(2.*PI)IP(II) = II
160 CONTINUECC Sort multiple solutions by increasing frequency.C
DO 170 II = 1, (NMODES-1)DO 170 JJ = (II+1),NMODES
IF (OMEGA(IP(JJ)) .LT. OMEGA(IP(II))) THENIDUM = IP(JJ)IP(JJ) = IP(II)IP(II) = IDUM
ENDIF170 CONTINUEC
DO 180 II = 1,NMODESJJ = IP(II)WRITE(2, '(3(1PE11.3),$) VEL(JJ),DAMP(JJ),OMEGA(JJ)
180 CONTINUEWRITE(2,*) ' '
C999 CONTINUE
CLOSE (2)C
STOPEND
C-----FILE: AEROF.FOR-C
SUBROUTINE AEROF(LM,THETA,HBAR,VEL,FREQ,LPRINT,D,CZ)CC Subroutine to calculate unsteady, non-linear, oscillatory aero-C dynamic coefficients by Fourier decomposition of the oscil-C latory, non-linear, stalled static aerodynamic force coefficient.C
INPUT VARIABLES: LM = indicator for lift coefficient (LM='L')or for moment coefficient (LM='M')
THETA = oscillating components of angle ofattack (rad)
HBAR = oscillating components of 1/4-chorddeflection (non-dimensional)
VEL = velocity (m/s)FREQ = reduced frequency (non-dimensional)LPRINT = logical print variable
OUTPUT VARIABLES: D = coeffs of deviation from linear liftcurve in PHI domain (non-dimensional)
CZ = oscillating components of the desiredforce coefficient (non-dimensional)
INCLUDEINCLUDECHARACTERREALLOGICAL
PARAM.INCGLBBLK.INCLM*1THETA(3),HBAR(3),VEL,FREQ,CZ(5)LPRINT
CCCCCCCCCCCCCC
C
217

C *** Constants used in non-linear equations.CC ALFA: Oscillating components of effective angle of attack (rad)C ALFO: Mean of effective angle of attack (rad)C ALFV: Amplitude of oscillation of effective angle of attack (rad)C TC: Real angle of attack corrected for finite span (rad)C S,KV,LAM,SIG,ALF,W,D,E: Coefficients of ODE's (non-dim)C
REAL ALFA(3),ALFO,ALFV,TC(3),S,KV,LAM,SIG,ALFCHARACTER ANSWER*1
C *** Variables used in linear calculations.REAL LS,LC,CZ1(3)COMMON / CZ1BLK / CZ1(3)
C *** Variables used in non-linear calculations.INTEGER LOREG, HIREGREAL PHI(-MAXREG:MAXREG), BB(-MAXREG:MAXREG, 0:MAXPOW)REAL JCK,SINT(-MAXREG:MAXREG,0:MAXPOW),D(0:2)REAL AA,RR,EE,B1,B2,B3,AMAT(5,5),BVEC(5)REAL CP2(5),CZ2(5)K1,K2,K3,K4,DCZ(5)
CRE = RHOA*VEL*CHORD/RMUA
CIF (LPRINT) THEN
OPEN (UNIT=3,FILE='AEROF.OUT' ,STATUS='NEW' ,FORM='FORMATTED')WRITE(3,*) ' 'IF (LM.EQ.'L') WRITE(3,*) 'LIFT TRIAL USING AEROF SUBROUTINE'IF (LM.EQ.'M') WRITE(3,*) 'MOMENT TRIAL USING AEROF '//
& 'SUBROUTINE'WRITE(3,*) ' 'WRITE(3, ) 'INPUT VARIABLES:'WRITE(3, *) '=WRITE(3,*) 'Reynold''s Number =',REWRITE(3,*) 'THETAO =',(THETA(1)*180./PI),' degs'WRITE(3,*) 'THETAs =',(THETA(2)*180./PI),' degs'WRITE(3,*) 'THETAc =',(THETA(3)*180./PI),' degs'WRITE(3,*) ' HBARO =',HBAR(1)WRITE(3,*) ' HBARs =',HBAR(2)WRITE(3,*) ' HBARc =',HBAR(3)WRITE(3,*) ' FREQ =',FREQ
ENDIFCC Calculate the perceived angle of attack coefficients [ALFA(i)],C the mean and vibratory amplitudes [ALFO and ALFV], and theC phase [ZETA].C
ALFA(l) = THETA(1)ALFA(2) = THETA(2) + FREQ*HBAR(3)ALFA(3) = THETA(3) - FREQ*HBAR(2)
CALFO = ALFA(l)ALFV = SQRT(ALFA(2)**2+ALFA(3)**2)IF (ALFV.EQ.0.) ZETA=0.IF (ALFV.NE.0.) ZETA=ATAN2(ALFA(3),ALFA(2))
CIF (LPRINT) THEN
WRITE(3,*) ' 'WRITE(3,*) 'ALPHAO =',(ALF0*180./PI),' degs'WRITE(3,*) 'ALPHAs =',(ALFA(2)*180./PI),' degs'WRITE(3,*) 'ALPHAc =',(ALFA(3)*180./PI),' degs'WRITE(3,*) 'ALPHAv =',(ALFV*180./PI),' degs'WRITE(3,*) ' ZETA =',(ZETA*180./PI),' degs'
ENDIFCC Correct effective angle of attack and real angle of attack
218

for finite span.
IF (REDUC) THENALFO = ALFO/(1.+SLOPE('L')/PI/(2.*LENGTH/CHORD))ALFV = ALFV/(1.+SLOPE(L')/PI/(2.*LENGTH/CHORD))ALFA(1) - ALFA(1)/(1.+SLOPE('L')/PI/(2.*LENGTH/CHORD))ALFA(2) - ALFA(2)/(1.4SLOPE('L')/PI/(2.*LENGTH/CHORD))ALFA(3) - ALFA(3)/(1.+SLOPE('L')/PI/.(2.*LENGTH/CHORD))TC(1) = THETA(1)/(1.+SLOPE('L')/PI/(2.*LENGTH/CHORD))TC(2) = THETA(2)/(1.+SLOPE('L')/PI/(2.*LENGTH/CHORD))TC(3) = THETA(3)/(1.+SLOPE('L')/PI/(2.*LENGTH/CHORD))
ELSETC (1)TC(2)TC (3)
ENDIF
= THETA(1)= THETA(2)= THETA(3)
CCZ1(1) = SLOPE(LM)*ALFO
CC Calculate lowest and highest region in which the alphaC oscillation passes through.C
LOREG = 0HIREG = 0AMIN = ALFO - ALFVAMAX = ALFO + ALFVDO 10 I = 1,IREGS(FOIL)
IF ((TD(I).LE.AMIN).AND.(AMIN.LT.TD(I+1)))IF ((TD(I).LT.AMAX).AND.(AMAX.LE.TD(I+1)))IF ((-TD(I+1).LT.AMIN).AND.(AMIN.LE.-TD(I)IF ((-TD(I+1).LE.AMAX) .AND.(AMAX.LT.-TD(I)
10 CONTINUEC
LOREG=IHIREG=I)) LOREG=-I)) HIREG=-I
IF (.NOT.STEADY) THEN
Calculate coefficients of the linear differential equations.
CALL COEFS LIN(LM,ALF0,S,KV,LAM, SIG,ALF)IF (LPRINT) THEN
WRITE(3,*) ' 'WRITE(3,*) ' S =',S, '1/rad'WRITE(3,*) ' KV =',KV,'l1/rad'WRITE(3,*) 'LAM =',LAMWRITE(3,*) 'SLP =',SLOPE(LM),'l/rad'WRITE(3,*) 'SIG =',SIG,'1/rad'WRITE(3,*) 'ALF =',ALF
ENDIF
Calculate variables of linear aerodynamic equation.
LS = SLOPE(LM)*ALFA(2)-SIG*FREQ*TC(3)LC - SLOPE(LM)*ALFA(3)+SIG*FREQ*TC (2)IF (LPRINT) THEN
WRITE(3,*) 'WRITE(3,*) 'Ls =',LSWRITE(3,*) 'Lc =',LC
ENDIF
Calculate oscillatory contributions of linear aerodynamics.
CZ1(2) =& (1.-ALF)
CZ1 (3) =& (1.-ALF)
((LAM*LAM+ALF*FREQ*FREQ)*LS+LAM*FREQ**LC)/(LAM*LAM+FREQ*FREQ)((LAM*LAM+ALF*FREQ*FREQ)*LC-LAM*FREQ**LS) / (LAM*LAM+FREQ*FREQ)
CC
CCC
C
CC
CCC
219

ENDIFC
IF (LPRINT) THENWRITE(3,*) 'C'//LM//'1lo'',CZ1(1)WRITE(3,*) 'C'//LM//'ls =',CZ1(2)WRITE(3,*) 'C'//LM/'lc -',CZ1(3)
ENDIFCC Calculate the coefficients of CZ2 in time: 1-constant,C 2-first harmonic sine, 3-first harmonic cosine, 4-secondC harmonic sine, 5-second harmonic cosine.C
IF (((LOREG.EQ.0).AND.(HIREG.EQ.0)),OR.(LINEAR)) THENCC Set coefficients equal to zero if oscillationC never enters the stalled regime or if only consideringC the linear problem.C
DO 20 I = 1,5CZ2(I) = 0.
20 CONTINUEELSEIF ((STEADY).OR.(ALFV.EQ.0.)) THEN
CC If steady, calculate steady non-linear coefficient and setC unsteady non-linear coefficients to zero.C
CZ2(1) = -DCZS(LM,0,ALFO)DO 30 I = 2,5
CZ2(I) = 0.30 CONTINUE
ELSECC Calculate limits of integration for each region forC use in the Fourier analysis.C
PHI(LOREG) = -PI/2.PHI(HIREG+1) = PI/2.IF (LOREG.NE.HIREG) THENDO 40 I = LOREG+1,HIREG
IF (I.LE.0) THENPHI(I) = ASIN((-TD(1-I)-ALF0)/ALFV)
ELSEPHI(I) = ASIN((TD(I)-ALFO)/ALFV)
ENDIF40 CONTINUE
ENDIFC
IF (LPRINT) THENWRITE(3,*) ' 'DO 50 I = LOREG,HIREG+1
WRITE(3,*) 'REGION =',I,' PHI =', (PHI(I)*180./PI),& ' degs'
50 CONTINUEENDIF
CC Calculate the coefficients of the polynomial expansionC sine series in each region that the oscillation passes thru.C
DO 130 I = LOREG,HIREGIF (I.EQ.0) GOTO 130
CC Calculate constant coefficient.C
BB(I,0) = REAL(SIGN(1,I))*DCZS(LM,0,TD(ABS(I)))
220
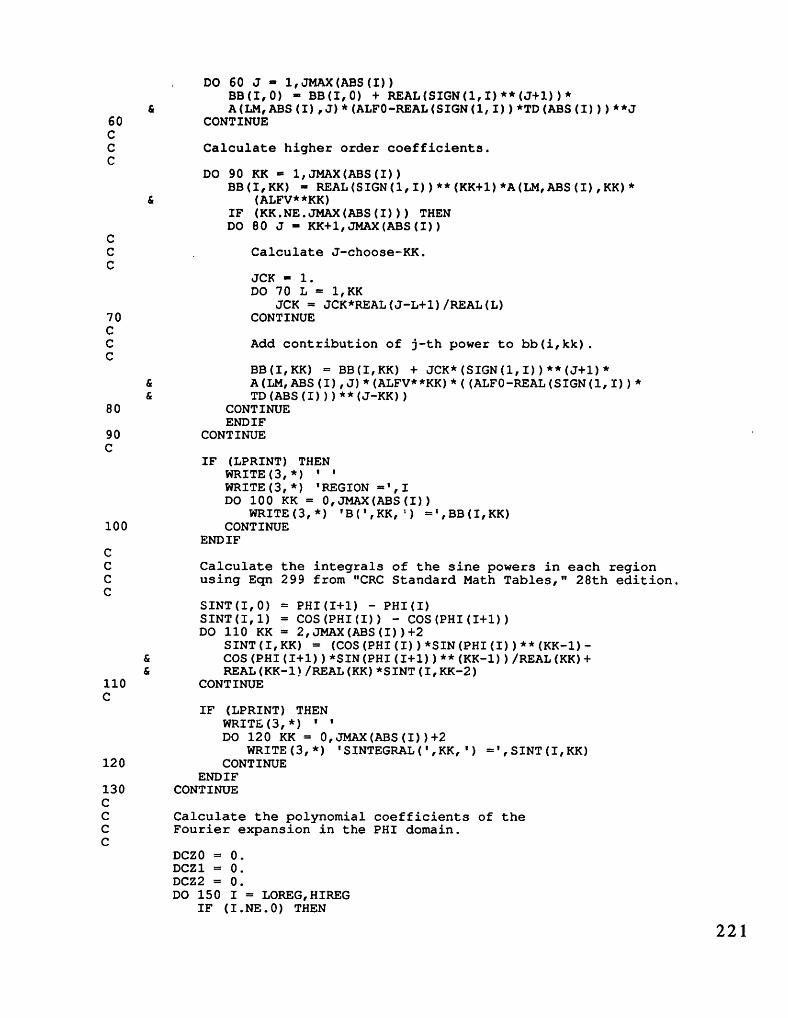
DO 60 J - 1,JMAX(ABS(I))BB(I,0) - BB(I,0) + REAL(SIGN(1,I)**(J+1))*
& A(LM,ABS(I),J)*(ALF0-REAL(SIGN(1,I))*TD(ABS(I)))**J60 CONTINUECC Calculate higher order coefficients.C
DO 90 KK 1,JMAX(ABS(I))BB(I,KK) - REAL(SIGN(1,I))**(KK+1)*A(LM,ABS(I),KK)*
& (ALFV**KK)IF (KK.NE.JMAX(ABS(I))) THENDO 80 J - KK+1,JMAX(ABS(I))
CC Calculate J-choose-KK.C
JCK - 1.DO 70 L = 1,KK
JCK = JCK*REAL(J-L+1)/REAL(L)70 CONTINUECC Add contribution of j-th power to bb(i,kk).C
BB(I,KK) = BB(I,KK) + JCK*(SIGN(1,I))**(J+1)*6& A(LM,ABS(I),J)*(ALFV**KK)*((ALF0-REAL(SIGN(1,I))*& TD(ABS(I)))**(J-KK))
80 CONTINUEENDIF
90 CONTINUEC
IF (LPRINT) THENWRITE(3,*) ' 'WRITE(3,*) 'REGION =',IDO 100 KK = 0,JMAX(ABS(I))
WRITE(3,*) 'B(',KK, ) =',BB(I,KK)100 CONTINUE
ENDIFCC Calculate the integrals of the sine powers in each regionC using Eqn 299 from "CRC Standard Math Tables," 28th edition.C
SINT(I,0) = PHI(I+1) - PHI(I)SINT(I,1) = COS(PHI(I)) - COS(PHI(I+1))DO 110 KK = 2,JMAX(ABS(I))+2
SINT(I,KK) = (COS(PHI(I))*SIN(PHI(I))**(KK-1)-& COS(PHI(I+1))*SIN(PHI(I+1))**(KK-1)))/REAL(KK)+& REAL(KK-1)/REAL(KK)*SINT(I,KK-2)
110 CONTINUEC
IF (LPRINT) THENWRITE(3,*) ' 'DO 120 KK = 0,JMAX(ABS(I))+2
WRITE(3,*) 'SINTEGRAL(',KK,') =',SINT(I,KK)120 CONTINUE
ENDIF130 CONTINUECC Calculate the polynomial coefficients of theC Fourier expansion in the PHI domain.C
DCZ = 0.DCZ1 = 0.DCZ2 = 0.DO 150 I = LOREG,HIREG
IF (I.NE.0) THEN
221

DO 140 KK - 0,JMAX(ABS(I))DCZ0 - DCZ0 + BB(I,KK)*SINT(I,KK)/PIDCZ1 - DCZ1 + BB(I,KK)*SINT(I,KK+1)*2./PIDCZ2 - DCZ2 + BB(I,KK)*(SINT(I,KK)-2.*
& SINT(I,KK+2))*2./PI140 CONTINUE
ENDIF150 CONTINUEC
IF (LPRINT) THENWRITE(3,*) 'WRITE(3,*) 'DC'//LM//'0 ',DCZOWRITE(3,*) 'DC'//LM//'V1 =',DCZ1WRITE(3,*) 'DC'//LM//'V2 =',DCZ2
ENDIFC
IF (LM.EQ.'L') THEND(0) DCZOD(1) = DCZ1D(2) = DCZ2
ENDIFCC Calculate coefficients of the non-linear aerodynamicC differential equations. NOTE: this depends on DCLC components - D(O), D(1), & D(2) - having alreadyC been calculated, i.e. that the calculations forC LM='L' are done before LM='M'.C
CALL COEFS NON(ALF0,D(O),LM,AA,RR,EE,B1,B2,B3)IF (LPRINT) THEN
WRITE(3,*) ' 'IF ((B1.NE.O.).OR.(B2.NE.0.).OR.(B3.NE.0.)) THEN
WRITE(3,*) 'aO =',AA*(1.-B1*D(0)**2)WRITE(3,*) 'al ',AA*B1WRITE(3,*) 'rO =',SQRT(RR)*(1.-B2*D(0)**2)WRITE(3,*) 'rl =',SQRT(RR)*B2WRITE(3,*) 'eO =',EE*(1.-B3*D(0)**2)WRITE(3,*) 'el =',EE*B3
ELSEWRITE(3,*) 'A =',AAWRITE(3,*) 'R =',RRWRITE(3,*) 'E =',EE
ENDIFENDIF
CAMAT(1,1) = RR * (1. + B2 * (D(1)**2+D(2)**2) +
& B2**2 * (2.*D(0)**2*D(1)**2 + .375*D(1)**4 -& 3.*D(0)*D(1)**2*D(2) + 2.*D(0)**2*D(2)**2 +& 1.5*D(1)**2*D(2)**2 + .375*D(2)**4))
AMAT(1,2) = RR * (B2 * (2.*D(O)*D(l)-D(1)*D(2)) +& B2**2 * (1.5*D(0)*D(1)**3 - 2.*D(0)**2*D(1)*& D(2) - D(1)**3*D(2) + 3.*D(O)*D(1)*D(2)**2 -& .75*D(1)*D(2)**3))
AMAT(1,3) = -FREQ*AA*B1 * (D(0)*D(1) -& .5*D(1)*D(2))
AMAT(1,4) = 2.*FREQ*AA*B1 * (-.25*D(1)**2 +& D(0)*D(2))
AMAT(1,5) = RR * (B2 * (-.5*D(1)**2+2.*D(0)*& D(2)) + B2**2 * (-D(0)**2*D(1)**2 - .25*D(1)**4 +& 3.*D(0)*D(1)**2*D(2) - 1.125*D(1)**2*D(2)**2 +& 1.5*D(0)*D(2)**3))
CAMAT(2,1) = RR * (B2 * (4.*D(0)*D(1) - 2.*D(1)*
& D(2)) + B2**2 * (3.*D(0)*D(1)**3 - 4.*D(0)**2*
222

& D(1)*D(2) - 2.*D(1)**3*D(2) + 6.*D(O)*D(1)*& D(2)**2 - 1.5*D(1)*D(2)**3))
AMAT(2,2) - RR * (1. + B2 * (1.5*D(1)**2 -& 2.*D(O)*D(2) + D(2)**2) + B2**2 * (3.*D(0)**2*& D(1)**2 + .625*D(1)**4 - 6.*D(O)*D(1)**2*D(2) +& 2.*D(0)**2*D(2)**2 + 2.625*D(1)**2*D(2)**2 -& 1.5*D(O)*D(2)**3 + .375*D(2)**4))
AMAT(2,3) -FREQ*AA * (1. + B1 * (.75*D(1)**2 -& D(0)*D(2) + .5*D(2)**2))
AMAT(2,4) = 2.*FREQ*AA*B1 * (-D(O)*D(1) +& D(1)*D(2))
AMAT(2,5) = RR * (B2 * (-2.*D(O)*D(1) + 2.*D(1)*& D(2)) + B2**2 * (-2.*D(O)*D(1)**3 + 4.*D(0)**2*& D(1)*D(2) + 1.75*D(1)**3*D(2) - 4.5*D(O)*D(1)*& D(2)**2 + 1.5*D(1)*D(2)**3))
CAMAT(3,1) = 0.AMAT(3,2) = FREQ*AA * (1. + B1 * (.25*D(1)**2 +
& D(0)*D(2) + .5*D(2)**2))AMAT(3,3) = RR * (1. + B2 * (.5*D(1)**2 +
& 2.*D(0O)*D(2) + D(2)**2) + B2**2 * (D(0)**2*& D(1)**2 + .125*D(1)**4 - 2.*D(0)**3*D(2) +& 2.*D(0)**2*D(2)**2 + 2.*D(0)**3*D(2) +& .375*D(1)**2*D(2)**2 + 1.5*D(O)*D(2)**3 +& .375*D(2)**4))
AMAT(3,4) = RR * (B2 * 2.*D(0)*D(1) + B2**2 *& (D(0)*D(1)**3 - .25*D(1)**3*D(2) + 1.5*D(O)*& D(1)*D(2)**2))
AMAT(3,5) = -2.*FREQ*AA*B1 * D(O)*D(1)C
AMAT(4,1) = 0.AMAT(4,2) = FREQ*AA*B1 * D(O)*D(1)AMAT(4,3) = RR * IB2 * 2.*D(0)*D(1) + B2**2 *
& (D(O)*D(1)**3 - .25*D(1)**3*D(2) + 1.5*D(0)*& D(1)*D(2)**2))
AMAT(4,4) = RR * (1. + B2 * (D(1)**2 +& .5*D(2)**2) + B2**2 * (2.*D(0)**2*D(1)**2 +& .3125*D(1)**4 - 1.5*D(O)*D(1)**2*D(2) +& D(0)**2*D(2)**2 + .75*D(1)**2*D(2)**2 +& .125*D(2)**4))
AMAT(4,5) = -2.*FREQ*AA * (1. + B1 *& (.5*D(1)**2 + .25*D(2)**2))
CAMAT(5,1) = RR * (B2 * (D(1)**2 + 4.*D(O)*
& D(2)) + B2**2 * (-4.*D(0)**2*D(1)**2 -& .5*D(1)**4 + 6.*D(O)*D(1)**2*D(2) -& 2.25*D(1)**2*D(2)**2 + 3.*D(O)*D(2)**3))
AMAT(5,2) = RR * (B2 * (-2.*D(0)*D(1) + 2.*& D(1)*D(2)) + B2**2 * (-2.*D(O)*D(1)**3 +& 4.*D(0)**2*D(1)*D(2) + 1.75*D(1)**3*D(2) -& 4.5*D(0O)*D(1)*D(2)**2 + 1.5*D(1)*D(2)**3))
AMAT(5,'3) = -FREQ*AA*B1 * (D(O)*D(1) + D(1)*D(2))AMAT(5,4) = 2.*FREQ*AA * (1. + B1 * (.5*D(1)**2 +
& .75*D(2)**2))AMAT(5,5) = RR * (1. + B2 * (D(1)**2 + 1.5*
& D(2)**2) + B2**2 * (2.*D(0)**2*D(1)**2 +& .4375*D(1)**4 - 4.5*D()*)*D(1)**2*D(2) +& 3.*D(0)**2*D(2)**2 + 2.25*D(1)**2*D(2)**2 +& .625*D(2)**4))
CBVEC(1) = -(AMAT(1,1)*DCZ0 + AMAT(1,2)*DCZ1 +
& AMAT(1,5)*DCZ2)BVEC(2) = -(AMAT(2,1)*DCZ0 + AMAT(2,2)*DCZ1 +
& AMAT(2,5)*DCZ2)
223

BVEC(3) = -(FREQ*DCZ1 * EE * (1. + B3 *& (.25*D(1)**2 + D(0)*D(2) + .5*D(2)**2)) -& 2.*FREQ*DCZ2 * EE*B3 * D(0)*D(1))
BVEC(4) -(FREQ*DCZ1 * EE*B3 * D(0)*D(1) -& 2.*FREQ*DCZ2 * EE * (1. + B3 * (.5*D(1)**2 +& .25*D(2)**2)))
BVEC(5) = -(AMAT(5,1)*DCZ0 + AMAT(5,2)*DCZ1 +& AMAT (5, 5) *DCZ2)
CAMAT(2,2) = AMAT(2,2) - FREQ**2AMAT(3,3) = AMAT(3,3) - FREQ**2AMAT(4,4) = AMAT(4,4) - 4.*FREQ**2AMAT(5,5) = AMAT(5,5) - 4.*FREQ**2
C160 FORMAT(' i',5(1PE10.2),'l',A7,'l',lPE10.2,'l')
IF (LPRINT) THENWRITE(3,*) ' 'DO 170 JJ = 1,5
IF (JJ.NE.3) THENWRITE(3,160) (AMAT(JJ,KK),KK=1,5),
& I ',BVEC(JJ)ELSE
WRITE(3,160) (AMAT(JJ,KK),KK=1,5),& '.C'//LM//'2 = ',BVEC(JJ)
ENDIF170 CONTINUE
ENDIFC
CALL SOLVE(AMAT,BVEC,CP2,5,1,5)IF (LPRINT) THEN
WRITE(3,*) WRITE(3,*) 'Nonlinear coefficients in Phi '//
& 'or (Omega*Tau+Zeta) domain:'WRITE(3,'(/5(A,1PE10.3))') ' C'//LM//'2P0=',CP2(1),
& ' ; C'//LM//'2Psl=',CP2(2),' ; C'//LM//'2Pcl=',CP2(3),& ' ; C'//LM//'2Ps2=',CP2(4),' ; C'//LM//'2Pc2=',CP2(5)
ENDIFCC Convert nonlinear'coefficients to normal OMEGA*TAU domain.C
CZ2(1) = CP2(1)CZ2(2) = CP2(2)*COS(ZETA) - CP2(3)*SIN(ZETA)CZ2(3) = CP2(3)*COS(ZETA) + CP2(2)*SIN(ZETA)CZ2(4) = CP2(4)*COS(2.*ZETA) - CP2(5)*SIN(2.*ZETA)CZ2(5) = CP2(5)*COS(2.*ZETA) + CP2(4)*SIN(2.*ZETA)
CC If diagnostics in effect, compare against old analysis,C from Dunn Master's thesis, using constant coefficients.C
IF (LPRINT) THENC
DCZ(1) = D(0)DCZ(2) = D(1)*COS(ZETA)DCZ(3) = D(1)*SIN(ZETA)DCZ(4) = -D(2)*SIN(2.*ZETA)DCZ(5) = D(2)*COS(2.*ZETA)
CCP2(1) = -DCZ(1)
CC Calculate first harmonic coefficients of unsteadyC aerodynamics.C
K1 = RR-FREQ**2K2 = AA*FREQ
224

K3 = -RR*DCZ(2)+EE*FREQ*DCZ(3)K4 = -RR*DCZ(3)-EE*FREQ*DCZ(2)CP2(2) = (KI*K3+K2*K4)/(Kl*Kl+K2*K2)CP2(3) = (Kl*K4-K2*K3)/(Kl*Kl+K2*K2)
CWRITE(3,'(/A)') ' First Harmonic in Omega*Tau domain'WRITE(3,*) 'DC'//LM//'0 =',DCZ(1)WRITE(3,*) 'DC'//LM//'sl -',DCZ(2)WRiTE(3,*) 'DC'//LM//'cl =',DCZ(3)WRITE(3,*) 'K(11) =',K1WRITE(3,*) 'K2(1) =',K2WRITE(3,*) 'K3(1) =',K3WRITE(3,*) 'K4(1) =',K4WRITE(3,*) 'CZ2o =',CP2(1)WRITE(3,*) 'CZ2sl =',CP2(2)WRITE(3,*) 'CZ2cl =',CP2(3)
CC Calculate second harmonic coefficients of unsteadyC aerodynamics.C
K1 = RR-(2.*FREQ)**2K2 = AA*(2.*FREQ)K3 = -RR*DCZ(4)+EE*2.*FREQ*DCZ(5)K4 = -RR*DCZ(5)-EE*2.*FREQ*DCZ(4)CP2(4) = (Kl*K3+K2*K4)/(K1*Kl+K2*K2)CP2(5) = (Kl*K4-K2*K3)/(K1*Kl+K2*K2)
CWRITE(3,'(/A)') ' Second Harmonic in Omega*Tau domain'WRITE(3,*) 'DC'//LM//'s2 =',DCZ(4)WRITE(3,*) 'DC'//LM//'c2 =',DCZ(5)WRITE(3,*) 'K1(2) =',K1WRITE(3,*) 'K2(2) =',K2WRITE(3,*) 'K3(2) =',K3WRITE(3,*) 'K4(2) =',K4WRITE(3,*) 'CZ2s2 =',CP2(4)WRITE(3,*) 'CZ2c2 =',CP2(5)
ENDIFENDIF
CIF (LPRINT) THEN
WRITE(3,*) ' 'WRITE(3,*) 'C'//LM//'20 =',CZ2(1)WRITE(3,*) 'C'//LM//'2sl =',CZ2(2)WRITE(3,*) 'C'//LM//'2cl =',CZ2(3)WRITE(3,*) 'C'//LM//'2s2 =',CZ2(4)WRITE(3,*) 'C'//LM//'2c2 =',CZ2(5)
ENDIFCC Add apparent mass terms.C
CZI(2) = CZ1(2) - S*FREQ*ALFA(3) - KV*FREQ*FREQ*TC(2)CZ1(3) = CZ1(3) + S*FREQ*ALFA(2) - KV*FREQ*FREQ*TC(3)
CC Combine linear and non-linear terms forC total coefficients of full non-linear aerodynamics.C
CZ(1) = CZl(1) + CZ2(1)CZ(2) = CZ1(2) + CZ2(2)CZ(3) = CZl1(3) + CZ2(3)CZ(4) = CZ2(4)CZ(5) = CZ2(5)
CIF (LPRINT) THEN
WRITE(3,*) ' '
225

WRITE(3,*) 'C'//LM//'O -',CZ(1)WRITE(3,*) 'C'//LM//'sl ',CZ(2)WRITE(3,*) 'C'//LM//'cl =',CZ(3)WRITE(3,*) 'C'//LM//'s2 =',CZ(4)WRITE(3,*) 'C'//LM//'c2 =',CZ(5)CLOSE (3)WRITE(*,*) 'CZO =',CZ(1),' ; CZs1 =',CZ(2),' ; CZcl =',CZ(3),
& ' ; CZs2 =',CZ(4),' ; CZc2 =',CZ(5)PAUSE
ENDIFC
RETURNEND
C----- FILE: CHARAC.FOR ------------------------------------------------CC Subroutines and functions which describe the static lift curveC of the desired airfoil ('OA212' for the OA212 or 'NAC12' for theC NACA-0012).C
CC Function to describe the slope of the linear part of the liftC curve.C
REAL FUNCTION SLOPE(LM)C
INCLUDE PARAM.INCINCLUDE GLBBLK.INCCHARACTER LM*1
CC OA212 lift slope taken from Rogers, "Applications of anC Analytic Stall Model to Time-History and Eigenvalue AnalysisC of Rotor Blades", Journal of the American Helicopter Society,C January 1984.C
IF ((FOIL.EQ.'OA212').AND.(LM.EQ.'L')) SLOPE=7.1CC ** NACA-0012 LIFT SLOPE APPROXIMATED FROM NACA REPORT 586,C ** JACOBS & SHERMAN, FIGURE 3C
IF ((FOIL.EQ.'NAC12').AND.(LM.EQ.'L')) SLOPE=0.103*(180./PI)C IF ((FOIL.EQ.'NAC12').AND.(LM.EQ.'L')) SLOPE=2.*PICC ** NACA-0012 MOMENT SLOPE APPROXIMATED FROM NACA TM-84245-VOL-2,C ** McALISTER, PUCCI, McCROSKEY, AND CARR, FIGURE 9C
IF ((FOIL.EQ.'NAC12').AND.(LM.EQ.'M')) SLOPE=0.002*(180./PI)IF ((FOIL.EQ.'NAC12').AND.(LM.EQ.'M')) SLOPE=O.RETURNEND
C
CC Function to describe the DERIV-th derivative of Delta-CZ StaticC (DCZS, the static deviation from the static, linear lift curve),C evaluated at angle THETA.C
REAL FUNCTION DCZS(LM,IDERIV,THETA)C
INCLUDE PARAM.INCINCLUDE GLBBLK.INCCHARACTER LM*1
C
226

C Find region in which THETA lies.C
IREG 0DO 10 I - 1,IREGS(FOIL)
IF ((TD(I).LT.THETA).AND.(THETA.LE.TD(I+1))) IREG=IIF ((-TD(I+1).LE.THETA).AND.(THETA.LT.-TD(I))) IREG=-I
10 CONTINUEC
IF (LINEAR) THENDCZS = 0.
ELSEIF (IDERIV.EQ.0) THENCC Calculate zero-th derivative.C
IF (IREG.EQ.0) THENDCZS = 0.
ELSEDO 30 I = 0,ABS(IREG)-1
CC Calculate DCZS at TD(IREG) by calculating regionC by region DCZS(TD(I)) in each region previous to IREG.C
IF (I.EQ.0) THENDCZS = 0.
ELSEDO 20 J = 1,JMAX(I)
DCZS = DCZS + A(LM,I,J)*(TD(I+1)-TD(I))**J20 CONTINUE
ENDIF30 CONTINUECC Calculate DCZS(THETA) using the previously calculatedC DCZS(TD(IREG)) as a starting point and the powerC expansion of DCZS in region IREG.C
DO 40 J = 1,JMAX(ABS(IREG))DCZS = DCZS + A(LM,ABS(IREG), J)*(ABS(THETA)-
& TD(ABS(IREG))**J40 CONTINUE
DCZS = DCZS*REAL(SIGN(1,IREG))ENDIF
CELSEIF (IDERIV.GT.0) THEN
CC Calculate higher derivatives.C
DCZS = 0.IF ((IREG.NE.0).AND.(IDERIV.LE.JMAX(ABS(IREG)))) THEN
DO 60 J = IDERIV,JMAX(ABS(IREG))CC Calculate J!/(J-IDERIV)!.C
IFAC = 1DO 50 JJ = J-IDERIV+1,J
IFAC = IFAC*JJ50 CONTINUECC Add contribution of J-th power, differentiated IDERIVC times, to the overall derivative.C
DCZS = DCZS + A(LM,ABS(IREG), J)*REAL(IFAC)*& (ABS(THETA)-TD(ABS(IREG)) ) **(J-IDERIV)
60 CONTINUEENDIF
227

DCZS - DCZS*REAL(SIGN(1,IREG))ENDIF
CRETURNEND
CC=== = ===== === ============ == = =======…
CC Function to describe number of regions into which the liftC curve is divided.C
INTEGER FUNCTION IREGS(FOIL)C
CHARACTER FOIL*5C IF (FOIL.EQ.'OA212') IREGS=2
IF (FOIL.EQ.'OA212') IREGS=1C IF (FOIL.EQ.'NAC12') IREGS=3
IF (FOIL.EQ.'NAC12') IREGS=2RETURNEND
C
CC Function to describe the angles at which each of the regions ofC the lift curve begins [units of radians].C
REAL FUNCTION TD(IREG)C
INCLUDE PARAM.INCINCLUDE GLBBLK.INC
CIF (FOIL.EQ.'OA212') THEN
IF (IREG.EQ.1) TD=10.*PI/180.C IF (IREG.EQ.2) TD=24.8*PI/180.C IF (IREG.GE.3) TD=PI/2.
IF (IREG.EQ.2) TD=PI/2.ELSEIF (FOIL.EQ.'NAC12') THEN
CC ** PARABOLIC, STALL, AND STRAIGHT LINE ANGLES FOR NACA-0012C ** APPROXIMATED USING FIT TO LOG(RE) DATA FROM NACA REPORT 586,C ** JACOBS & SHERMAN, FIGURE 3.C
RVAL = LOG(RE/3.4E5)/LOG(2.)CC Parabolic from half of stall to stall angle (11 deg),C exponential decay to large angles (25 deg), flat line above.CC IF (IREG.EQ.1) TD=( 1 1.+2.143*RVAL)/2.*PI/180.C IF ((IREG.EQ.1).AND.(RE.LT.3.4D5)) TD=11./2.*PI/180.C IF (IREG.EQ.2) TD=(l11.+2.143*RVAL)*PI/180.C IF ((IREG.EQ.2).AND.(RE.LT.3.4D5)) TD=11.*PI/180.C IF (IREG.EQ.3) TD=25.*PI/180.C IF (IREG.GE.4) TD=PI/2.CC Straight line to stall angle (11 deg), exponential decay toC large angles (25 deg), flat line above.CC IF (IREG.EQ.1) TD=(11.+2.143*RVAL)*PI/180.C IF ((IREG.EQ.1).AND.(RE.LT.3.4D5)) TD=11.*PI/180.C IF (IREG.EQ.2) TD=25.*PI/180.C IF (IREG.GE.3) TD=PI/2.CC Slight drop after stall angle (8 deg), then flat line atC high angles (>20 deg)
228

CIF (IREG.EQ.1) TD=8.*PI/180.IF (IREG.EQ.2) TD=20.*PI/180.IF (IREG.EQ.3) TD=PI/2.
CC Flat line lift curve after stall angle.CC CLASY - .75 + .0536*RVALC IF (RVAL.LE.0) CLASY=.75C IF (IREG.EQ.1) TD=CLASY/SLOPE('L')C IF (IREG.EQ.2) TD=PI/2.C
ENDIFRETURNEND
C
CC Function to describe the maximum power of the polynomialC approximation used in region IREG.C
INTEGER FUNCTION JMAX(IREG)C
INCLUDEINCLUDE
PARAM.INCGLBBLK.INC
IF (FOIL.EQ.'OA212') THEN
Straight lines connecting each region.
JMAX=1
IF (IREG.EQ.1) JMAX=7IF (IREG.EQ.2) JMAX=1
ELSEIF (FOIL.EQ.'NAC12') THEN
Straight lines connecting each region.
JMAX=1
Parabolic below stall, exponential to asymptotic, level offto flat line for high angles.
IF (IREG.EQ.1) JMAX=2IF (IREG.EQ.2) JMAX=10IF (IREG.EQ.3) JMAX=1
ENDIFRETURNEND
C
CC Function to prescribe the coefficients of the polynomialC approximation to Delta-CZ in region IREG. Powers of (180/PI)C are present because of conversions from units of degrees toC radians.C
REAL FUNCTION A(LM,IREG,J)C
INCLUDEINCLUDECHARACTER
PARAM.INCGLBBLK.INCLM*1
C
CCC
CCCC
CCC
CCCCCCCC
229

CIF ((FOIL.EQ.'OA212').AND.(LM.EQ.'L')) THEN
C IF (IREG.EQ.1) THENC IF. (J.EQ.1) A-0.C IF (J.EQ.2) A=+6.3059700D-2*(180./PI)**2C IF (J.EQ.3) A--1.3952010D-2*(180./PI)**3C IF (J.EQ.4) A=+1.7390851D-3*(180./PI)**4C IF (J.EQ.5) A=-1.2451913D-4*(180./PI)**5C IF (J.EQ.6) A=+4.6849257D-6*(180./PI)**6C IF (J.EQ.7) A=-7.0879730D-8*(180./PI)**7C ELSEIF (IREG.EQ.2) THENC IF (J.EQ.1) A=SLOPE(LM)C ENDIF
A 0.IF ((IREG.EQ.1).AND.(J.EQ.1)) A=SLOPE(LM)
ELSEIF (FOIL.EQ.'NAC12') THENCC ** PARABOLIC, STALL, AND STRAIGHT LINE COEFFICIENTS FORC ** NACA-0012 LIFT SLOPE ARE APPROXIMATED USING FIT TO LOG(RE)C ** DATA FROM NACA REPORT 586, JACOBS & SHERMAN, FIGURE 3.C ** COEFFICIENTS FOR MOMENT SLOPE TAKEN FROM McALISTER, NASAC ** TM-84245, FIGURE ?.CC RVAL = LOG(RE/3.4E5)/LOG(2.)CC Calculate the maximum lift/moment coefficient, dependent onC the log of the Reynold's Number.CC CZMAX = .86 + .24*RVALC IF (RVAL.LE.0) CZMAX=.86+.03*RVALC IF (LM.EQ.'M') CZMAX=.04CC Calculate the asymptotic lift/moment coefficient (i.e. theC lift/moment coefficient when the angle of attack tends to largeC angles), dependent on the log of the Reynold's Number.C
RVAL = 0.CZASY = .75 + .0536*RVALIF (RVAL.LE.0) CZASY=.75IF (LM.EQ.'M') CZASY=-.12
CC Calculate the coefficient of the exponential decay from maximumC to asymptotic, dependent on the log of the Reynold's Number.CC RNU = -.2-.07*RVALC IF (RVAL.LE.0) RNU=-.2CC Calculate the necessary polynomial coefficients for eachC region, using the previously calculated maximum, asymptotic,C and exponential decay coefficients.CC A= 0.C IF (LM.EQ.'L') THENC IF (IREG.EQ.1) THENCC Parabolic fit from end of linear region (region 0) toC point of maximum lift/moment (end of region 1). TheC polynomial coefficients are chosen such that the slope isC continuous at the juncture of regions 0 and 1.CC IF (J.EQ.1) A=0.C IF (J.EQ.2) A=(SLOPE(LM)*TD(2)-CZMAX)/(TD(2)-TD(l))**2CC ELSEIF (IREG.EQ.2) THEN
230

CC Exponential fit with decay coefficient RNU from end ofC parabolic region (region 1) to beginning of asymptoticC region (region 3). The polynomial coefficients are chosenC such that they fit a power series expansion of theC exponential decay.CC IFAC = 1C DO 10 I = 1,JC IFAC = IFAC*IC10 CONTINUEC A (CZASY-CZMAX)*RNU**J/REAL(IFAC)*(180./PI)**JC IF (J.EQ.1) A=A+SLOPE(LM)CC ELSEIF (IREG.EQ.3) THENCC Flat line fit for the asymptotic region (region 3).CC IF (J.EQ.1) A-SLOPE(LM)C ENDIFC ELSEIF (LM.EQ.'L') THENCC Moment coefficient remains constant up to stall (i.e.C through regions 0 & 1), straight line drop to the asymptoticC value in region 2, and flat line afterward.CC IF ((IREG.EQ.2).AND.(J.EQ.1)) A=-CZASY/(TD(3)-TD(2))C IF ((IREG.EQ.3).AND.(J.EQ.1)) A=SLOPE(LM)C ENDIFC
IF (LM.EQ.'L') THENIF (IREG.EQ.1) A = (SLOPE(LM)*TD(2)-CZASY)/(TD(2)-TD(1))IF (IREG.EQ.2) A = SLOPE(LM)
ELSEIF (LM.EQ.'M') THENIF (IREG.EQ.1) A = (SLOPE(LM)*TD(2)-CZASY)/(TD(2)-TD(1))IF (IREG.EQ.2) A = SLOPE(LM)+(CZASY+.15)/
& (30.*PI/180.-TD(2))ENDIF
CENDIFRETURNEND
C-----FILE: COEFS.FOR CC Subroutine to calculate unsteady lift/moment coefficientsC for linear (CZ1) equations.C
SUBROUTINE COEFSLIN(LM,THETA,S,KV,LAM,SIG,ALPHA)C
INCLUDE PARAM.INCINCLUDE GLBBLK.INCCHARACTER LM*1REAL THETA, S, KV, LAM, SIG, ALPHA
CIF ((FOIL.EQ.'OA212').AND.(LM.EQ.'L')) THEN
CC Coefficients from Rogers, "Applications of an Analytic StallC Model to Time-History and Eigenvalue Analysis of Rotor Blades",C Journal of the American Helicopter Society, January 1984,C page 26, equations (4) to (8).C
S = 5.KV = 0.
231

LAM - 0.2SIG - (SLOPE(LM) - 4.*(1.+1.43*DCZS(LM,O,THETA)))/LAMALPHA - 0.
ELSEIF (FOIL.EQ.'NAC12') THENIF (LM.EQ.'L') THEN
CC Coefficients from Petot, "Dynamic Stall Modeling of theC NACA 0012 Profile", Short Note, page 58, equations (2)C and (3), converted to same notation as Rogers (above).CC S 0.09*(180./PI)
S - PIKV PI/2.
C LAM = 0.2LAM = 0.15
C SIG = (0.08-0.13*DCL0)*(180./PI)/LAMSIG = SLOPE(LM)
C ALPHA .5ALPHA - .55
ELSEIF ((FOIL.EQ.'NAC12').AND.(LM.EQ.'M')) THENC S 5 -0.0304*180./PI
S = -PI/4.KV - -3.*PI/16.LAM - 0.
C SIG = 0.0089*180./PIC IF ((THETA.GT.(13.*PI/180.)).AND.(.NOT.LINEAR))C & SIG=SIG- . 00067*180./PI*(THETA*180./PI-13.)/LAM
SIG = -PI/4.ALPHA = 1.
C GAM = 0.16C IF (THETA.GT.(13.*PI/180.)) GAM=GAM+.035*C & (THETA*180./PI-13.)C ALF = 1./11.5/GAMC C = 3.5C IF (THETA.GT. (15.6*PI/180.)) C=C+3./PI*ATAN(C & SQRT(3.)/1.2*(THETA*180./PI-15.6))
ENDIFENDIF
CRETURNEND
C
CC Subroutine to calculate unsteady lift/moment coefficientsC for non-linear (CZ2) equations.C
SUBROUTINE COEFSNON(THETA,DCLO,LM,AA,RR,EE,B1,B2,B3)C
INCLUDE PARAM.INCINCLUDE GLBBLK.INCREAL THETA, DCLO, AA, RR, EE, B1, B2, B3REAL GAM, ALF, C, L1, L2, L3, L4, L5, L6CHARACTER*1 LMREAL AOL,A1L,ROL,R1L,EOL,E1LREAL AOM,A1M,ROM, RM,EOM,ElMCOMMON / COEFBLK / AOL,A1L,ROL,R1L,EOL,ElL,& AOM,A1M,ROM, RM,EOM,ElM
CIF (ATYPE.EQ.0) THEN
CC Coefficients from Rogers, "Applications of an Analytic StallC Model to Time-History and Eigenvalue Analysis of Rotor Blades",C Journal of the American Helicopter Society, January 1984,
232

C page 26, equations (4) to (8) for airfoil type OA212.C
GAM - 0.1IF (THETA.GT.(13.*PI/180.)) GAM-GAM+0.023*(THETA*
& (180./PI)-13.)ALF 0.105/GAMC - 2.IF (THETA.GT.(13.*PI/180.)) CC-5.1*ATAN(1.21*
& (THETA*(180./PI)-13.))C
AA 2.*ALF*GAMRR = GAM**2*(1.+ALF**2)EE - RR*CB1 - 0.B2 - 0.B3 O0.
ELSEIF (ATYPE.EQ.1) THEN
CC Coefficients from Petot, "Dynamic Stall Modeling of theC NACA 0012 Profile," Short Note, Recherches Aerospatiales,C 1984-6, pp. 55-58, with corrections for low Reynold's numberC from Petot & Loiseau, "Succesive Smoothing Algorithm forC Constructing the Semi-Empirical Model Developed at ONERA toC Predict Unsteady Aerodynamic Forces," NASA TM-76681, MarchC 1982, for airfoil type NACA 0012.C
L1 = .25L2 = .10IF (RE.LE.3.4E5) L2 = .40L3 = .20L4 = .10IF (RE.LT.3.4E5) L4 = .23L5 = 0.L6 = -.60IF (RE.LT.3.4E5) L6 = -2.7
ELSEIF (LM.EQ.'L') THENL1 = AOLL2 = AlLL3 = ROLL4 = R1LL5 = EOLL6 = E1L
ELSEIF (LM.EQ.'M') THENL1 = AOML2 = A1ML3 = ROML4 = R1ML5 = EOML6 = ElM
ENDIFC
AA = L1 + L2*DCLO**2RR = (L3 + L4*DCLO**2)**2EE = L5+L6*DCLO**2IF (ATYPE.LE.1) EE = RR*EE
CIF (LCONST) THEN
B1 = 0.B2 = 0.B3 = 0.
ELSEB1 = L2/AAB2 = L4/SQRT(RR)
233

B3 - L6/EEIF (ATYPE.LE.1) B3 - L3*(L3*
& L6+2.*L4*LS)/EEENDIF
CENDIF
CRETURNEND
C-----FILE: CORREC.FOR ------------------------------------------------CC Functions to describe the spanwise and chordwise distributionsC applicable to the 2-dimensional lift, moment, and dragC coefficients.C
REAL FUNCTION SC(XBAR)SC - 1.SC - 1.11*(1.-XBAR**9)RETURNEND
CREAL FUNCTION CC(YBAR)CC - 3.*(0.5-YBAR)**2RETURNEND
C-----FILE: DRDQ.FOR-C
SUBROUTINE R DERIV(BENTOR,VEL,AOA, FREQ, QLIT, RES, RGEOM,DRDQ)CC Subroutine to calculate the Jacobian matrix d(RES)/d(QLIT) byC numerical estimation of the derivatives.CC INPUT VARIABLES: BEN_TOR = bending/torsion flagC VEL = velocity (m/s)C AOA = root angle of attack (rad)C FREQ = reduced frequency (non-dim)C QLIT = modal amplitudes (m)C RES = current residuals (non-dim)C OUTPUT VARIABLE: DRDQ = numeric derivative matrix (l/m)C
INCLUDE PARAM.INCINCLUDE GLBBLK.INCINTEGER BEN_TOR,MBTREAL VEL, AOA,FREQ,QLIT (MAXMODE, 3), RES (3*MAXMODE), RGEOMREAL VEL2,AOA2,FREQ2,QLIT2 (MAXMODE,3), RES2 (3*MAXMODE)REAL QBIG(MAXMODE,3), DRDQ(3*MAXMODE,3*MAXMODE)
CMBT = (BEN_TOR-1)*NB + 1
CC Loop through each direction of the components of the modalC amplitudes, ignoring oscillating components if steady analysis.C
MAX = 3IF (STEADY) MAX = 1DO 30 Il = 1,NMODESDO 30 J1 = 1,MAX
CC Skip if looking at components of state vectorC reserved for angle of attack/velocity and reduced frequency.C
IF ((Il.EQ.MBT).AND.(Jl.NE.1)) GOTO 30C
234

Initialize modal amplitude trial vector.C
DO 10 12 - 1,MAXMODEDO 10 J2 - 1,3
QLIT2(I2,J2) - QLIT(I2,J2)10 CONTINUECC Increment desired direction of modal amplitudeC trial vector by 0.1%C
QLIT2(I1,J1) - 1.001*QLIT(Il,J1)IF (ABS(QLIT2(I1,J1)).LT.l.E-4) QLIT2(I1,J1)=0.001
CC Calculate new residuals from modal amplitude trial vector.C
CALL RESIDUAL(VEL,AOA,FREQ,QLIT2,RGEOM,RES2,QBIG)CC Calculate numeric derivatives from modal amplitude trialC vector QLIT2 and associated residuals RES2.C
K1 - NMODES*(Jl1-1)+I1DO 20 I2 - 1,NMODESDO 20 J2 - 1,MAX
K2 - NMODES*(J2-1)+I2DRDQ(K2,K1) = (RES2(K2)-RES(K2))/(QLIT2(Il,Jl)-
d& QLIT(I1,J1))20 CONTINUE30 CONTINUECC If steady, skip angle of attack/velocity and frequencyC derivatives.C
IF (STEADY) GOTO 60CC Increment trial angle of attack/velocity by 0.1% andC calculate new residuals.C
IF (VLINES) THENAOA2 = 1.001*AOAIF (AOA2.EQ.0.) AOA2=0.001CALL RESIDUAL (%EL,AOA2,FREQ,QLIT,RGEOM,RES2,QBIG)
ELSEVEL2 = 1.001*VELIF (VEL2.EQ.0.) VEL2=0.001CALL RESIDUAL(VEL2,AOA,FREQ,QLIT,RGEOM,RES2,QBIG)
ENDIFCC Calculate numeric derivatives from trial angle of attack/velocityC AOA2/VEL2 and associated residuals RES2.C
K1 = NMODES+MBTDO 40 I2 = 1,NMODESDO 40 J2 = 1,MAX
K2 = NMODES*(J2-1)+I2IF (VLINES) DRDQ(K2,K1)=(RES2 (K2) -RES(K2))/(AOA2-AOA)IF (.NOT.VLINES) DRDQ(K2,K1)=(RES2(K2)-RES(K2))/
& (VEL2**2-VEL**2)40 CONTINUECC Increment trial frequency by 0.1% and calculate new residuals.C
FREQ2 = 1.001*FREQIF (FREQ2.EQ.0.) FREQ2=0.001CALL RESIDUAL(VEL,AOA,FREQ2,QLIT,RGEOM,RES2,QBIG)
235
C

CC Calculate numeric derivatives from trial frequency FREQ2 andC associated residuals RES2.C
K1 - 2*NMODES+MBTDO 50 12 - 1,NMODESDO 50 J2 - 1MAX
K2 - NMODES*(J2-1)+I2DRDQ(K2,K1)-(RES2(K2)-RES(K2)) / (FREQ2-FREQ)
50 CONTINUEC60 RETURN
END
C-----FILE: MASS.FOR --------------------------------------------------C
SUBROUTINE MASS(LO,HI,MPA)CC Subroutine to calculate components of the flat plate mass matrixC
INCLUDE PARAM.INCINCLUDE GLBBLK.INCREAL LO,HI,MPA, INTGRL
CDO 10 I = 1,NMODESDO 10 J - I,NMODES
IF ((I.LE.NB+NT+NC).AND.(J.LE.NB+NT+NC)) THENCC Calculate out-of-plane mass matrix components.C
M(I,J) - MPA*CHORD*LENGTH*INTGRL(IX',I,0,J,0,LO,HI)*& INTGRL('Y',I,0,J,0,-.5,+.5)
M(J,I) = M(I,J)ELSEIF ((I.GT.NB+NT+NC).AND.(J.GT.NB+NT+NC)) THEN
CC Calculate fore-&-aft mass matrix components.C
M(I,J) = MPA*CHORD*LENGTH*INTGRL('X'I,I,0,J,0,LO,HI)*& INTGRL('Y',I,0,J,0,-.5,+.5)
M(J,I) = M(I,J)ELSE
CC Calculate out-of-plane/fore-&-aft couplingC mass matrix components.C
M(I,J) = 0.M(J,I) = 0.
ENDIF10 CONTINUEC
RETURNEND
C-----FILE: MODE.FOR-C
REAL FUNCTION FMODE(DERIV,XY,NUM, INPUT)CC X and Y variation of the five assumed modes. Note thatC all the x and y coordinates have already been normalized.C DERIV indicates what derivative of the mode is given.C
INCLUDE PARAM.INCINCLUDE GLBBLK.INCINTEGER DERIV,NUM,NUMBF
236

CHARACTER XY*1REAL INPUT, RN(5),EPS,ALFDATA RN / 0.596864162695,1.494175614274,& 2.500246946168,3.499989319849,& 4.500000461516 /
CIF (NUM.EQ.0) THEN
IF (XY.EQ.'X') THENIF (DERIV.EQ.0) THEN
FMODE = 1./3.*(INPUT-1.)**4+4./3.*(INPUT-1.)+1.ELSEIF (DERIV.EQ.1) THEN
FMODE m 4./3.*(INPUT-1.)**3+4./3.ELSEIF (DERIV.EQ.2) THEN
FMODE = 4.*(INPUT-1.)**2ELSEIF (DERIV.EQ.3) THEN
FMODE = 8.*(INPUT-1.)ELSEIF (DERIV.EQ.4) THEN
FMODE = 8.ELSEIF (DERIV.GE.5) THEN
FMODE = 0.ENDIF
ELSEIF (XY.EQ.'Y') THENIF (DERIV.EQ.0) FMODE = 1.IF (DERIV.GT.0) FMODE = 0.
ENDIFELSEIF ((XY.EQ.'X').AND.((NUM.LE.NB).OR.(NUM.GT.NB+NT+NC))) THEN
CC Describe DERIV-th derivative of the spanwise, x-variationC of the bending modes or fore-&-aft modes.C
NUMBF = NUMIF (NUM.GT.NB) NUMBF = NUM - (NB+NT+NC)IF (NUMBF.LE.5) EPS = RN(NUMBF)*PIIF (NUMBF.GT.5) EPS = (REAL(NUMBF)-.5)*PIALF = (SINH(EPS)-SIN(EPS))/(COSH(EPS)+COS(EPS))
CIF (DERIV.EQ.0) THEN
FMODE = COSH(EPS*INPUT)-ALF*SINH(EPS*INPUT)-& COS(EPS*INPUT)+ALF*SIN(EPS*INPUT)
ELSEIF ((DERIV.GT.0).AND.(MOD(DERIV,2).EQ.1)) THENFMODE = (EPS**DERIV)*(SINH(EPS*INPUT) -ALF*
& COSH(EPS*INPUT) + (SIN(EPS*INPUT)+ALF*& COS(EPS*INPUT))*((-1)**((DERIV+3)/2)))
ELSEIF ((DERIV.GT.0).AND.(MOD(DERIV,2).EQ.0)) THENFMODE = (EPS**DERIV)*(COSH(EPS*INPUT)-ALF*
& SINH(EPS*INPUT) + (COS(EPS*INPUT)-ALF*& SIN(EPS*INPUT))*((-1)**((DERIV+2)/2)))
ENDIFELSEIF ((XY.EQ.'X').AND.(NUM.GT.NB).AND.(NUM.LE.NB+NT)) THEN
CC Describe the DERIV-th derivative of the spanwise, x-variationC of the torsional modes.C
IT = NUM - NBIF (DERIV.EQ.0) THEN
FMODE = B(IT,1)*COS(G(IT)*INPUT)+B(IT,2)*& SIN(G(IT)*INPUT)+B(IT,3)*COSH(F(IT)*INPUT)+& B (IT, 4) *SINH (F (IT) *INPUT)
ELSEIF ((DERIV.GT.0).AND.(MOD(DERIV,2).EQ.1)) THENFMODE = (G(IT)**DERIV)*(-B(IT,1)*SIN(G(IT)*
& INPUT)+B(IT,2)*COS(G(IT)*INPUT))*((-1)**((DERIV+3)/& 2))+(F(IT)**DERIV)*(B(IT,3)*SINH(F(IT)*INPUT)+& B (IT, 4) *COSH (F (IT) *INPUT) )
ELSEIF ((DERIV.GT.0).AND.(MOD(DERIV,2).EQ.0)) THEN
237

FMODE - (G(IT)**DERIV)*(-B(IT,1)*COS(G(IT)*INPUT)-& B(IT,2)*SIN(G(IT)*INPUT))*((-1)**((DERIV+2)/2))+& (F(IT)**DERIV)*(B(IT,3)*COSH(F(IT)*INPUT)+B(IT,4)*;& SINH(F(IT)*INPUT))
ENDIFCc IF (DERIV.EQ.O) THENc FMODE = SIN(REAL(2*IT-1)*PI/2.*INPUT)c ELSEIF ((DERIV.GT.0).AND.(MOD(DERIV,2).EQ.1)) THENc FMODE = COS(REAL(2*IT-1)*PI/2.*INPUT)*(REAL(2*c & IT-1)*PI/2.)**DERIV*(-1)**((DERIV+3)/2)c ELSEIF ((DERIV.GT.0).AND.(MOD(DERIV,2).EQ.0)) THENc FMODE = SIN(REAL(2*IT-1)*PI/2.*INPUT)*(REAL(2*c & IT-1)*PI/2.)**DERIV*(-1)**(DERIV/2)c ENDIF
ELSEIF ((XY.EQ.'X').AND.(NUM.EQ.NB+NT+1).AND.(NC.GE.1)) THENCC Describe the DERIV-th derivative of the spanwise, x-variationC of the 1st chordwise bending mode.
IF (DERIV.EQ.O) FMODE = INPUT*(1.-INPUT)IF (DERIV.EQ.1) FMODE = 1.-2.*INPUTIF (DERIV.EQ.2) FMODE = -2.IF (DERIV.GE.3) FMODE = 0.
ELSEIF ((XY.EQ.'X').AND.(NUM.EQ.NB+NT+2).AND.(NC.GE.2)) THENCC Describe the DERIV-th derivative of the spanwise, x-variationC of the 2nd chordwise bending mode.C
IF (DERIV.EQ.1) FMODE = INPUT**2 - 1.IF (DERIV.EQ.1) FMODE = 2.*INPUTIF (DERIV.EQ.2) FMODE = 2.IF (DERIV.GE.3) FMODE = 0.
ELSEIF ((XY.EQ.'Y').AND.((NUM.LE.NB).OR.(NUM.GT.NB+NT+NC))) THENCC Describe the DERIV-th derivative of the chordwise, y-variationC of the bending modes or fore-&-aft modes.C
IF (DERIV.EQ.0) FMODE = 1.IF (DERIV.GE.1) FMODE = 0.
ELSEIF ((XY.EQ.'Y').AND.(NUM.GT.NB).AND.(NUM.LE.NB+NT)) THENCC Describe the DERIV-th derivative of the chordwise, y-variationC of the torsional modes.C
IF (DERIV.EQ.0) FMODE = INPUTIF (DERIV.EQ.1) FMODE = 1.IF (DERIV.GE.2) FMODE = 0.
ELSEIF ((XY.EQ.'Y').AND.(NUM.EQ.NB+NT+1).AND.(NC.GE.1)) THENCC Describe the DERIV-th derivative of the chordwise, y-variationC of the 1st chordwise bending mode.C
IF (DERIV.EQ.0) FMODE = (4.*INPUT*INPUT - 1./3.)IF (DERIV.EQ.1) FMODE = 8.*INPUTIF (DERIV.EQ.2) FMODE = 8.IF (DERIV.GE.3) FMODE = 0.
ELSEIF ((XY.EQ.'Y').AND.(NUM.EQ.NB+NT+2).AND.(NC.GE.2)) THENCC Describe the DERIV-th derivative of the chordwise, y-variationC of the 2nd chordwise bending mode.C
IF (DERIV.EQ.0) FMODE = (2.*INPUT)**2 - 1IF (DERIV.EQ.1) FMODE = 8.*INPUT
238

IF (DERIV.EQ.2) FMODE = 8.IF (DERIV.GE.3) FMODE 0.
ELSEFMODE 0.
ENDiFC
RETURNEND
C-----FILE: QBIG.FOR-C
SUBROUTINE MODALFORCE(VEL,AOA,FREQ,QLIT,QBIG)CC Subroutine to calculate the oscillating components of the modalC forces.CC INPUT VARIABLES: VEL = velocity (m/s)C AOA = root angle of attack (rad)C FREQ = reduced frequency (non-dim)C QLIT = modal amplitudes (m)C OUTPUT VARIABLE: QBIG = modal forces (N)C
INCLUDE PARAM.INCINCLUDE GLBBLK.INCREAL VEL,AOA,FREQ,QLIT(MAXMODE,3),QBIG(MAXMODE,3)REAL THETA(3),HBAR(3),VBAR(3)REAL DCL(0:2),CL(5),CM(5),CD(5)INCLUDE GAUSS.INC
CC THETA: Oscillating components of real angle of attack (rad)C HBAR: Oscillating components of 1/4-chord out-of-planeC deflection, non-dimensionalized with respect toC the half-chordC VBAR: Oscillating components of 1/4-chord fore-&-aftC deflection, non-dimensionalized with respect toC the half-chordC DCL: Oscillating components of the static deviation fromC the linear lift curve (non-dim)C CL: Oscillating components of the lift coeff (non-dim)C CM: Oscillating components of the moment coeff (non-dim)C CD: Oscillating components of the drag coeff (non-dim)CC Initialize the modal forces to zero value.C
DO 10 I = 1,MAXMODEDO 10 J = 1,3
QBIG(I,J) = 0.10 CONTINUECC Loop through Gauss integration points along the span.C
DO 60 IGNUM = 1,GPOINTSCC Calculate the non-dimensional 1/4-chord deflection,C angle-of-attack, and fore-&-aft sinusoidal coefficientsC at the Gauss point spanwise location.C
XBAR = (GP(IGNUM)+1.)/2.DO 30 I = 1,3
CC Add contributions to out-of-plane deflectionC and to torsional twist.C
HBAR(I) = 0.
239

THETA(I) 0.DO 20 J = 1,NB+NT+NC
HBAR(I) = HBAR(I) + QLIT(J,I)/(CHORD/2.)*& FMODE(0,'X',J,XBAR)*FMODE(0,'Y',J,+.25)
THETA(I) = THETA(I) + QLIT(J,I)/CHORD*& FMODE(0,'X',J,XBAR)*FMODE(1,'Y',J,+.25)
20 CONTINUEIF (LATAN) THETA(I) = ATAN(THETA(I))IF (I.EQ.1) THETA(I)=THETA(I)+AOA
CC Add contributions to fore-&-aft deflection.C
VBAR(I) = 0.IF (NF.GT.0) THENDO 25 J = NB+NT+NC+1,NB+NT+NC+NF
VBAR(I) = VBAR(I) + QLIT(J,I)/(CHORD/2.)*& FMODE(0,'X',J,XBAR)*FMODE(0,'Y',J,+.25)
25 CONTINUEENDIF
30 CONTINUECC Calculate the lift/moment coefficient sinusoidal coefficients.C
CALL AEROF ( 'L',THETA,HBAR,VEL,FREQ,LAEROF,DCL,CL)CALL AEROF ( 'M',THETA,HBAR,VEL,FREQ,LAEROF,DCL,CM)
CC Calculate the profile-drag coefficient contribution usingC a 3rd-order polynomial fit.C
CD(1) = 4.923*ABS(THETA(1))**3 + .1472*THETA(1)**2 + .042*& ABS(THETA(1)) + .014
CD(2) = 0.CD(3) = 0.
CC Calculate the induced-drag coefficient contribution.C
CD(1) = CD(1) + CL(1)**2/PI/(2.*LENGTH/CHORD)CC Incorporate spanwise correction for the force dropoff.C
DUMMY = 1.IF (CORREC) DUMMY = SC(XBAR)
C Add contributions from the lift, moment, and drag at theC current Gauss point spanwise location to the modal force.C
DO 50 I = 1,NMODESDO 50 J = 1,3
IF (I.LE.NB+NT+NC) THENQBIG(I,J) = QBIG(I,J)+GW(IGNUM)/2.*(.5*RHOA*
& VEL**2*CHORD*LENGTH)*((CL(J)*COS(AOA)+CD(J)*& SIN(AOA))*FMODE(0,'Y',I,+.25)+CM(J)*& FMODE(1,'Y',I,+.25))*FMODE(0,'X',I,XBAR)*DUMMY
ELSEQBIG(I,J) = QBIG(I,J)+GW(IGNUM)/2.*(.5*RHOA*
& VEL**2*CHORD*LENGTH)*(-CL(J)*SIN(AOA)+CD(J) *& COS(AOA))*FMODE(0,'Y',I,+.25)*FMODE(0,'X',I,XBAR)*& DUMMY
ENDIF50 CONTINUE60 CONTINUEC
RETURNEND
240

C-----FILE : RESIDUAL.FOR --C
SUBROUTINE RESIDUAL(VEL,AOA,FREQ,QLIT,RGEOM,RES,QBIG)CC Subroutine to calculate the residuals used in the Newton-RaphsonC solver.CC INPUT VARIABLES: VEL = velocity (m/s)C AOA = root angle of attack (rad)C FREQ = reduced frequency (non-dim)C QLIT = modal amplitudes (m)C OUTPUT VARIABLES: RES = residuals, non-dimensionalized byC 1/2*rho*(V**2)*areaC QBIG = modal forces, non-dimensionalized byC 1/2*rho*(V**2)*areaC
INCLUDE PARAM.INCINCLUDE GLBBLK.INCREAL VEL,AOA,FREQ,QLIT(MAXMODE,3), RGEOMREAL RES(3*MAXMODE), QBIG(MAXMODE,3)
CC Calculate the modal forces QBIG using subroutine MODAL_FORCE,C which are functions of the velocity VEL, the root angle of attackC AOA, the reduced frequency FREQ, and the modal amplitudes QLIT.C
CALL MODALFORCE(VEL,AOA,FREQ,QLIT,QBIG)C
DO 30 I = 1,MAXMODEDO 30 12 = 1,MAXMODE
KDUM(Il,I2) = K(I1,I2)CC Add corrections to stiffness matrix for geometricC nonlinearities.C
IF (LGEOM) THENIF ((I1.GT.NB).A.ND.(I1.LE.NB+NT).AND.
& (I2.GT.NB).AND.(I2.LE.NB+NT)) THENDO 10 I3 = 1,NBDO 10 I4 = 1,NB
KDUM(I1,I2) = KDUM(I1,I2) + RGEOM**2*& R(I3,I4,I1-NB,I2-NB)*QLIT(I3,1)*QLIT(I4,1)
10 CONTINUEELSEIF ((I1.GT.NB).AND.(I1.LE.NB+NT).AND.
& (I2.GT.NB+NT+NC).AND.(I2.LE.NB+NT+NC+NF)) THENDO 20 I3 = 1,NB
KDUM(Il,I2) = KDUM(I1,I2) + RGEOM*& H(I3,I1-NB,I2-NB-NT-NC)*QLIT(I3,1)
20 CONTINUEENDIF
ENDIFC
KDUM(I2,I1) = KDUM(Il,I2)30 CONTINUEC
KTTO = KDUM(NB+1,NB+1)CC Calculate the residuals by including the contributionsC of the mass and stiffness matrices with the modal forces.C
DO 60 J = 1,3CC Add correction to nonlinear stiffness matrix for cubicC stiffening.
241

CIF (J.EQ.1) KDUM(NB+i,NB+1) = KTTO + KTTCUBE*
& (QLIT(NB+1,1)**2+1.5*QLIT(NB+1,2)**2+1.5*& QLIT(NB+1,3)**2)
IF (J.NE.1) KDUM(NB+1,NB+l) = KTTO + KTTCUBE*& (3.*QLIT(NB+1,1)**2+.75*QLIT(NB+1,2)**2+& .75*QLIT(NB+1, 3)**2)
CDO 50 I = 1,NMODES
II = NMODES*(J-1)+IIF ((STEADY).AND.(J.NE.1)) THEN
RES(II) = 0.ELSE
RES(II) = -QBIG(I,J)DO 40 L = 1,NMODES
RES(II) = RES(II)+KDUM(I,L)*QLIT(L,J)OMEGA = FREQ*VEL/(CHORD/2.)IF (J.NE.1) RES(II)=RES(II)-OMEGA**2*
& M(I,L)*QLIT(L,J)40 CONTINUE
ENDIFRES(II) = RES(II)/(.5*RHOA*VEL**2*CHORD*LENGTH)QBIG(I,J) = QBIG(I,J)/(.5*RHOA*VEL**2*CHORD*LENGTH)
50 CONTINUE60 CONTINUEC
RETURNEND
C-----FILE: SETMODE.FOR-C
SUBROUTINE SETMODE(Dll,D66,CHORD,LENGTH,NT,NTMAX,KT,G,F,B,ERR)CC Subroutine to compute the coefficients G(I), F(I), and B(I,4) ofC the torsional mode shapes for a laminate, given its aspect ratioC and its bending and torsion stiffness properties, Dll and D66,C based on Crawley & Dugundji, "Frequency Determination and Non-C Dimensionalization for Composite Cantilever Plates," JournalC of Sound and Vibration, Vol. 72, No. 1, 1980, pp. 1-10.C
INTEGER NT,NTMAXREAL D 11, D66, CHORD, LENGTHREAL KT(NTMAX),G(NTMAX), F (NTMAX), B (NTMAX, 4), ERR(NTMAX)REAL PI,BETA,A(4,4),BDUM(4),XDUM(4),RO,R1,DELTALOGICAL CONVERGED
CC Initialize warping stiffness influence coefficient.C
PI = ABS(ACOS(-1.))BETA = Dll*CHORD**2/(48.*D66*LENGTH**2)
CC Loop thru torsion modes, calculating appropriate coeffs.C
DO 30 I = 1,NTCC Initialize guesses at non-dimensional natural frequencyC (start a little above the value for zero warping stiffness)C and sin/cos coefficient - derived by inverting eqn [17]C from Crawley & Dugundji.C
IF (I.EQ.1) KT(I) = PI/2.IF (I.NE.1) KT(I) = KT(I-1)*REAL(2*I-1)/
& REAL(2*I-3) * 1.20G(I) = SQRT((SQRT(1.+4.*BETA*KT(I)**2)-1.)/(2.*BETA))
242

F(I) SQRT(G(I)**2+1./BETA)C
CONVERGED .FALSE.DO WHILE (.NOT.CONVERGED)
CC Calculate residual, RO - i.e. determinant of 4x4 matrix inC eqn [18] of Crawley & Dugundji - that is to be drivenC to zero (i.e. to make matrix singular, i.e. a naturalC mode). Also calculate derivative of residual w.r.t. G(I),C R1. Both calculations done by MathematicaTM.C
RO = cosh(F(I))**2*F(I)**2*G(I)**2 - F(I)**2*G(I)**2*& sinh(F(I))**2 + cosh(F(I))*F(I)**4*Cos(G(I)) +& cosh(F(I))*G(I)**4*Cos(G(I)) + F(I)**2*G(I)**2*& Cos(G(I))**2 + F(I)**3*G(I)*sinh(F(I))*Sin(G(I)) -& F(I)*G(I)**3*sinh(F(I))*Sin(G(I)) + F(I)**2*& G(I)**2*Sin(G(I))**2
R1 = 2*cosh(F(I))**2*F(I)**2*G(I) + 2*cosh(F(I))**2*& G(I)**3 - 2*F(I)**2*G(I)*sinh(F(I))**2 - 2*G(I)**3*& sinh(F(I))**2 + 4*cosh(F(I))*F(I)**2*G(I)*Cos(G(I)) +& 4*cosh(F(I))*G(I)**3*Cos(G(I)) + 2*F(I)**3*G(I)*& sinh(F(I))*Cos(G(I)) - F(I)*G(I)**3*sinh(F(I))*& Cos(G(I)) + (G(I)**5*sinh(F(I))*Cos(G(I)))/F(I) +& 2*F(I)**2*G(I)*Cos(G(I))**2 + 2*G(I)**3*& Ccs(G(I))**2 - cosh(F(I))*F(I)**4*Sin(G(I)) +& cosh(F(I))*F(I)**2*G(I)**2*Sin(G(I)) - 2*cosh(F(I))*& G(I)**4*Sin(G(I)) + F(I)**3*sinh(F(I))*Sin(G(I)) -& (G(I)**4*sinh(F(I))*Sin(G(I)))/F(I) + 2*F(I)**2*G(I)*& Sin(G(I))**2 + 2*G(I)**3*Sin(G(I))**2
CC Apply Newton's Method and test relative convergence.C
DELTA = RO/R1G(I) = G(I) - DELTAF(I) = SQRT(G(I)**2+1./BETA)IF ((ABS(DELTA/G(I)).LT.(1.E-7)).AND..(ABS(R0/
& (F(I)**4*COSH(F(I)))).LT.(1.E-6))) CONVERGED=.TRUE.END DO
CC Calculate converged value of non-dimensional natural frequency.C
KT(I) = G(I)*SQRT(1.+BETA*G(I)**2)CC Set up matrix equation to solve for the mode shape, i.e.C eqn [18] from Crawley & Dugundji with the 4th row of theC matrix equation converted to reflect a non-dimensional tipC deflection of 1.C
A(1,l1) = 1.A(1,2) = 0.A(1,3) = 1.A(1,4) = 0.A(2,1) = 0.A(2,2) = G(I)A(2,3) = 0.A(2,4) = F(I)A(3,1) = -G(I)**2*COS(G(I))A(3,2) = -G(I)**2*SIN(G(I))A(3,3) = F(I)**2*COSH(F(I))A(3,4) = F(I)**2*SINH(F(I))A(4,1) = COS(G(I))A(4,2) = SIN(G(I))A(4,3) = COSH(F(I))A(4,4) = SINH(F(I))
243

BDUM(1) - 0.BDUM(2) - 0.BDUM(3) - 0.BDUM(4) - 1.
Cc 1st row converted to ND tip deflection of 1.cc A(1,1) = COS(G(I))c A(1,2) - SIN(G(I))c A(1,3) - COSH(F(I))c A(1,4) = SINH(F(I))c A(4,1) - F(I)**2*G(I)*SIN(G(I))c A(4,2) - -F(I)**2*G(I)*COS(G(I))c A(4,3) - F(I)*G(I)**2*SINH(F(I))c A(4,4) - F(I)*G(I)**2*COSH(F(I))c BDUM(1) = 1.c BDUM(4) = 0.c
CALL SOLVE (A, BDUM,XDUM,4, 1,4)DO 20 J = 1,4
B(I,J) = XDUM(J)20 CONTINUECC Set the error function equal to the. unresolved 4th equationC of eqn [18] from Crawley & Dugundji.C
ERR(I) = B(I,1)*F(I)**2*G(I)*SIN(G(I)) -& B(I,2)*F(I)**2*G(I)*COS(G(I)) + B(I,3)*F(I)*& G(I)**2*SINH(F(I)) + B(I,4)*F(I)*G(I)**2*COSH(F(I))
cc Unresolved 1st equation.cc ERR(I) = B(I,1) + B(I,3)c30 CONTINUEC
RETURNEND
C-----FILE: SETUP.FOR-C
REAL FUNCTION INTGRL(XY,MODE1, DERIV1,MODE2, DERIV2, LO, HI)CC Subroutine to integrate numerically the DERIVl-th derivativeC of the XY-variation of MODE1 with the DERIV2-th derivative ofC the XY-variation of MODE2 over the normalized interval [LO,HI],C using a GPOINTS Gaussian quadrature scheme ("Handbook ofC Mathematical Functions,"Abramowitz and Stegun (eds.), TableC 25.4, p.916).C
INTEGER MODE1,MODE2,DERIVl,DERIV2REAL LO,HI,POINTCHARACTER XY*1INCLUDE GAUSS.INC
CINTGRL = 0.DO 10 I = 1,GPOINTS
POINT = (GP(I)*(HI-LO)+HI+LO)/2.INTGRL = INTGRL + GW(I)*FMODE(DERIVl,XY,MODE1,POINT)*
& FMODE(DERIV2,XY,MODE2,POINT)*(HI-LO)/2.10 CONTINUEC
RETURNEND
244

CC=-------==============- ========= = === =========
CREAL FUNCTION SCINT(MODE1,MODE2)
Subroutine to integrate numerically the X-variation of MODEl withthe X-variation of MODE2 over the normalized interval [0,1],with spanwise correction SC(X) included in the integral,using a GPOINTS Gaussian quadrature scheme ("Handbook ofMathematical Functions,"Abramowitz and Stegun (eds.), Table25.4, p.916).
INTEGERREALINCLUDE
MODE1,MODE2POINTGAUSS.INC
CSC INT = 0.DO 10 I = 1,GPOINTS
POINT = (GP(I)+l.)/2.SC INT = SC INT + GW(I)*FMODE(0,'X',MODE1,POINT)*
& FMODE(0,'X',MODE2,POINT)/2.*SC(POINT)10 CONTINUEC
RETURNEND
C-----FILE: STATIC.FOR-C
SUBROUTINE STATIC(LAYUP,LSTRUC,TRATIO,IERR)C
Subroutine to calculate mass and stiffness matrices and to runstatic deflection and free vibration analyses.
INCLUDEINCLUDEREALREALREALREALREALREALREALREALREALREALREALINTEGERLOGICALCHARACTERINCLUDE
PARAM.INCGLBBLK.INCTRATIO,STYLO,ELFOAM,ETFOAM,NULTFOAM,GLTFOAMRHOFOAM, THETA (MAXPLIES)ZU (MAXPLIES), ZL(MAXPLIES)EL(MAXPLIES), ET(MAXPLIES),NULT(MAXPLIES)GLT(MAXPLIES),RHO(MAXPLIES),QUll(MAXPLIES)QU12(MAXPLIES),QU22(MAXPLIES),QU66(MAXPLIES)QT(3,3,MAXPLIES), ERR(NTMAX)A(3, 3) ,D (3, 3), INTGRLMPA, DFOAM(3,3), MFOAM (MAXMODE, MAXMODE)KFOAM(MAXMODE,MAXMODE),QLIT(MAXMODE)DRDQ (MAXMODE,MAXMODE), DQ(MAXMODE), RES(MAXMODE)IERR,NPLIESLSTRUC,EQUAL,CONVERGEDLAYUP*25,ANSWER*1,FILENAME*25GAUSS.INC
Loop through flat plate (I1=1) and NACA wing (I1=2) analyses.
DO 440 Il = 1,2
IF (Il.EQ.1) THEN
If first loop, then calculate flat plate mass and stiffnessproperties. Begin by reading in foam and ply data from input fileand creating unidirectional Q-values [QU] and rotated Q-values,ie. Q-theta [QT] for each ply.
FILENAME = TRIM(LAYUP)//'.DAT 'OPEN(2,FILE=TRIM(FILENAME),STATUS='OLD',FORM='FORMATTED',
245
CCCCCCCC
CCC
CCC
C
CCCCCC

& IOSTAT-IERR)IF (IERR.NE.0) GOTO 999WRITE(*,'(/2A)') 'Layup data taken from file ',TRIM(FILENAME)READ(2, *) CHORD, LENGTH, NPLIES, LAMBDA, KTTCUBEREAD (2, *) TRATIO, STYLO, ELFOAM, ETFOAM,NULTFOAM, GLTFOAM, RHOFOAMDO 10 I - 1,NPLIES
READ(2,*) THETA(I),ZU(I),ZL(I),EL(I),ET(I),NULT(I),& GLT(I),RHO(I)
THETA(I) - THETA(I)*PI/180.CALL QUCON(EL(I),ET(I),NULT(I),GLT(I),QUll(I),QU12(I),
& QU22(I),QU66(I))CALL QTCON(I,THETA(I),QU11(I),QU12(I),QU22(I),QU66(I),QT)
10 CONTINUECLOSE (2)
CIOUT - 0IF (LSTRUC) THEN
CC Output wing properties.C20 WRITE(*,'(A,$)') ' Output engineering properties (2] '//
& 'to file or [9] to screen ?READ(*,*,ERR=20) IOUTIF ((IOUT.NE.2).AND.(IOUT.NE.9)) GOTO 20IF (IOUT.EQ.2) THEN
FILENAME = TRIM(LAYUP)//'PNAS.OUT 'IF (TRATIO.GT.O.) FILENAME = TRIM(LAYUP)//'WNAS.OUT 'OPEN(UNIT=IOUT,FILE=TRIM(FILENAME),STATUS='NEW',
& FORM='FORMATTED')WRITE(*,*) ' Calculated wing properties being sent to ',
& TRIM(FILENAME)WRITE(IOUT,'(A,4I3)') 'NB, NT, NC, NF =',NB,NT,NC,NF
ENDIFENDIF
CIF (IOUT.NE.0) THEN
CC Output basic overall properties.C
WRITE(IOUT,'(/1X,A,F5.4,A,F4.1,A)') ' Chord length =& CHORD,' m = ',(CAORD*12./.3048),' in'
WRITE(IOUT,'(lX,A,F5.4,A,F4.1,A)') ' Half span =& LENGTH,' m = ',(LENGTH*12./.3048),' in'
WRITE(IOUT,' (lX,A,I2)') ' Number of plies = ',NPLIESWRITE(IOUT,'(A,F5.1,A)') ' Sweepback angle =',
& LAMBDA,' deg'WRITE(IOUT,'(A,F6.3,A)') ' Air density = '
& RHOA,' kg/m**3'CC Output ply layup in degrees.C
WRITE(IOUT,'(A,$) ') ' Layup = ['DO 30 I = 1,NPLIES
ANG = THETA(I)*180./PIIF (I.NE.1) WRITE(IOUT,'(A,$)') '/'IF (ANG.EQ.0.) WRITE(IOUT,'(A,$)') 'O'IF (ANG.NE.O.) WRITE(IOUT,'(SP,I3,$)') NINT(ANG)
30 CONTINUEWRITE (IOUT, ' (A,$)') ']'
CC Determine if all the plies are of the same material.C
EQUAL = .TRUE.DO 40 I = 1,NPLIES
246

IF (EL(I).NE.EL(1)) EQUAL-.FALSE.IF (ET(I).NE.ET(1)) EQUAL-.FALSE.IF (GLT(I).NE.GLT(1)) EQUAL-.FALSE.IF (NULT(I).NE.NULT(1)) EQUAL-.FALSE.IF (RHO(I).NE.RHO(1)) EQUAL-.FALSE.
CONTINUEIF (EQUAL) THEN
WRITE(IOUT,'(/lX,A,F4.1,A)') ' GR/EP EL& EL(1)/1.E9,' GPa'.
WRITE(IOUT,'(1X,A, F4.1,A)') ' GR/EP ET& ET(1)/1.E9,' GPa'
WRITE(IOUT,'(lX,A,F4.1,A)') ' GR/EP GLT 2
& GLT(1)/1.E9,' GPa'WRITE(IOUT,'(1X,A,F5.2)') 'GR/EP Poisson ratio = ',
& NULT(1)WRITE(IOUT,' (lX,A,F6.1,A)') ' GR/EP density =
& RHO(1),' kg/m**3'ENDIF
ENDIF
Calculate flat plate A and D matrices (ie. ignoring foamproperties).
CALL BEND (NPLIES, ZU, ZL, QT, A, D)IF (IOUT.NE.0) THEN
WRITE(IOUT,'(/A)') ' Flat Plate A-matrix [N/m] :DO 50 I = 1,3
WRITE(IOUT,'(10X,3(1PE10.2))') (A(I,J),J=1,3)CONTINUEWRITE(IOUT,'(/A)') ' Flat Plate D-matrix [Nm] :DO 60 I = 1,3
WRITE(IOUT,'(10X,3F7.4)') (D(I,J),J=l,3)CONTINUE
ENDIF
tI !I I
Vgf
tf
I
CC Use the D-matrix properties to set up the natural torsional modeC shapes.C
CALL SETMODE(D(1,1),D(3,3),CHORD,LENGTH,NT,NTMAX,KT,G,F,B,ERR)IF (IOUT.NE.0) THEN
WRITE(IOUT,'(/1X,A,F8.7)') 'Beta = ',D(1,1)*CHORD**2/& (48. *D (3,3) *LENGTH**2)
DO 75 I = 1,NTWRITE(IOUT,'(/lX,3(A,Il,A,F7.4))')
& 'K',I,'T = ',KT(I),'; g',I,' = ',& G(I),'; f',I,' = ',F(I)
72 FORMAT (' B(',Il,') = [',SP,4(1X,F7.5),'] ; B',& SS,Il,'4-B',I1,'1 =',lPE9.2)
WRITE(IOUT,72) I,(B(I,J),J=1,4),I,I,(B(I,4)-B(I,1))WRITE(IOUT,'(A,I1,A,1PE9.2)') ' Err(',I,') = ',ERR(I)
75 CONTINUEENDIF
CC Calculate flat plate mass per unit area thru the thicknessC (i.e. in the out-of-plane Z-direction).C
MPA = 0.DO 70 I = 1,NPLIES
MPA = MPA+(ZU(I)-ZL(I))*RHO(I)70 CONTINUECC Calculate flat plate mass matrix.C
CALL MASS (0.,1.,MPA)
247
40
CCCC
50
60

CC Calculate flat plate stiffness matrix.C
CALL STIFF(A,D,0.,1.)KTTO - K(NB+1,NB+1)KTTCUBE - K(NB+1,NB+1)*KTTCUBE
CIF (IOUT.NE.0) THEN
WRITE(IOUT,'(/A,F5.3,A/)') 'Flat Plate Mass '//& 'per unit Area ',MPA,' kg/m**2'
WRITE(IOUT,*) 'Flat Plate Mass matrix [kg] :DO 80 I - 1,NMODES
WRITE(IOUT,'(10X,32(1PE10.2)) ') (M(I,J),J-1,NMODES)80 CONTINUE
WRITE(IOUT,'(/A, 1PE8.2,A/)') 'Cubic stiffening - ',& KTTCUBE, ' 1/m**2'
WRITE(IOUT,*) 'Flat Plate Stiffness matrix iN/m] :DO 90 I 1,NMODES
WRITE(IOUT. '(10X,32(lPE10.2)) ') (K(I,J),J=1,NMODES)90 CONTINUE
ENDIFCC Initialize sums for numerical integrals used forC nonlinear, geometric stiffness corrections.C
DO 100 J1 - 0,NBMAXDO 100 J2 = 0,NBMAXDO 100 J3 = 1,NTMAXDO 100 J4 = 1,NTMAX
R(J1,J2,J3,J4) = 0.100 CONTINUEC
DO 110 J1 = O,NBMAXDO 110 J2 = 1,NTMAXDO 110 J3 = 1,NFMAX
H(J1,J2,J3) = 0.110 CONTINUECC Calculate nonlinear torsion-torsion coupling integralsC by Gauss numerical integration.C
IF (IOUT.NE.0) WRITE(IOUT,*) 'DO 140 J1 = 0,NBDO 140 J2 = J1,NBDO 140 J3 = 1,NTDO 140 J4 = J3,NT
DO 120 II = 1,GPOINTSXBAR = (GP(II)+1.)/2.R(J1,J2,J3,J4) = R(J1,J2,J3,J4) + GW(II)/2. *
& FMODE(2,'X',J1,XBAR)*FMODE(2,'X',J2,XBAR) *& FMODE(0,'X',NB+J3,XBAR)*FMODE (0,'X',NB+J4,XBAR) *& (A(1,1) *CHORD**2/12.-D(1,1))/(CHORD*LENGTH**3)
120 CONTINUER(J2,J1,J3,J4) = R(J1,J2,J3,J4)R(J1,J2,J4,J3) = R(J1,J2,J3,J4)R(J2,J1,J4,J3) = R(J1,J2,J3,J4)
130 FORMAT ('R(',2(I1,'B,'),I1,'T,',I1,'T) =',lPE10.3)IF (IOUT.NE.0) WRITE(IOUT,130) Jl,J2,J3,J4,R(Jl,J2,J3,J4)
140 CONTINUECC Calculate nonlinear fore/aft-torsion cross-coupling integralsC by Gauss numerical integration.C
IF (NF.GT.0) THEN
248
IF (IOUT.NE.0) WRITE(IOUT,*)DO 170 J1 - 0,NBDO 170 J2 1,NTDO 170 J3 - 1,NF
DO 150 II - 1,GPOINTSXBAR - (GP(II)+1.)/2.H(J1,J2,J3) H(J1,J2,J3) + GW(II)/2. *
& FMODE(2,'X'I,J,XBAR)*FMODE(0,'X',NB+J2,XBAR)*& FMODE(2,'X',NB+NT+NC+J3,XBAR) *& (A(1,1)*CHORD**2/12.-D(1,1))/LENGTH**3
150 CONTINUE160 FORMAT('H(',I1,'B,',I1,'T,',II1,'F) -',1PE10.3)
IF (IOUT.NE.0) WRITE(IOUT,160) J1,J2,J3,H(J1,J2,J3)170 CONTINUE
ENDIFC
ELSEIF ((I1.EQ.2).AND.(TRATIO.GT.0.)) THENCC If second loop, calculate and add styrofoam properties toC the mass and stiffness matrices. Begin by outputing foamC properties if the foam thickness is non-zero.C
IF (IOUT.NE.0) THENWRITE(IOUT,'(/11X,A,F4.1,A)') 'Styrofoam EL =
& ELFOAM/1.E6,' MPa'WRITE(IOUT,'(11X,A,£?4.1,A)') 'Styrofoam ET '
& ETFOAM/1.E6,' MPa'WRITE(IOUT,' (11X,A,F4.1,A)') 'Styrofoam GLT '
& GLTFOAM/1.E6,' MPa'WRITE(IOUT,'(1X,A,F4.2)') 'Styrofoam Poisson ratio =
& NULTFOAMWRITE(IOUT, '(7X,A,F4.1,A)') 'Styrofoam density =
& RHOFOAM,' kg/m**3'WRITE(IOUT,' (4X,A,F4.3)') 'Styrofoam NACA ratio =
& TRATIOENDIF
CC Calculate the contribution to the mass matrix for theC styrofoam bending modes. Note that the styrofoam doesC not cover the first 2'' (STYLO=1/6) of the span of the airfoil.C
DO 180 I = 1,NBDO 180 J = I,NB
MFOAM(I,J) = (0.685*TRATIO*CHORD**2-(ZU(1)-ZL(NPLIES))*& CHORD)*LENGTH*INTGRL('X',I,0,J,0,STYLO,1.)*RHOFOAM
MFOAM(J,I) = MFOAM(I,J)180 CONTINUECC Calculate the contribution to the mass matrix for theC styrofoam torsion modes.C
DO 190 I = NB+1,NB+NTDO 190 J = I,NB+NT
MFOAM(I,J) = (0.506*TRATIO*CHORD**2-(ZU(1)-ZL(NPLIES))*& CHORD)/12.*LENGTH*INTGRL('X',I,0,J,0,STYLO,1.)*RHOFOAM
MFOAM(J,I) = MFOAM(I,J)190 CONTINUECC Calculate the contribution to the mass matrix for theC styrofoam bending-torsion coupling.C
DO 200 I = 1,NBDO 200 J = NB+1,NB+NT
MF'OAM(I,J) = -0.0545*RHOFOAM*TRATIO*CHORD**2*LENGTH*
249

& INTGRL('X', I, 0,J, 0, STYLO, 1.)MFOAM(J,I) - MFOAM(I,J)
200 CONTINUECC Calculate the contribution to the mass matrix for theC styrofoam chordwise bending modes.C
IF (NC.GT.0) THENDO 210 I - 1,NB+NT+NCDO 210 J - MAXO(I,NB+NT+1),NB+NT+NC
MFOAM(I,J) - (0.685*TR ATIO*CHORD-(ZU(1)-& ZL(NPLIES) ) ) *CHORD*LENGTH*RHOFOAM*& INTGRL('X',I,0,J,0, STYLO,1.)*& INTGRL('Y',I,0,J,0,-.5,+.5)
MFOAM(J,I) - MFOAM(I,J)210 CONTINUE
ENDIFCC Calculate the contribution to the mass matrix for theC styrofoam fore-&-aft modes.C
IF (NF.GT.0) THENDO 220 I = 1,NB+NT+NC+NFDO 220 J MAXO(I,NB+NT+NC+1),NB+NT+NC+NF
IF (I.LE.NB+NT+NC) THENMFOAM(I,J) = 0.
ELSEMFOAM(I,J) = (0.685*TRATIO*CHORD**2-
& (ZU(1)-ZL(NPLIES)) *CHORD ) *LENGTH*& INTGRL('X'I,I,0,J,0,STYLO,1.)*RHOFOAM
ENDIFMFOAM(J,I) = MFOAM(I,J)
220 CONTINUEENDIF
CC Calculate unidirectional Q-values for the foam. Because theC foam is isotropic, these are the same as the rotated Q-values.C
CALL QUCON(ELFOAM,ETFOAM,NULTFOAM,GLTFOAM,QT11FOAM,& QT12FOAM,QT22FOAM,QT66FOAM)
CC Calculate the contribution to the stiffness matrix fromC the styrofoam bending modes. Note that the styrofoam doesC not cover the first 2" (STYLO=1/6) of the span of the airfoil.C
DO 230 I = 1,NBDO 230 J = I,NB
KFOAM(I,J) = 2.*QTllFOAM*((0.779*TRATIO*CHORD/2.)**3-& ((ZU(1)-ZL(NPLIES))/2.)**3)/3.*CHORD*LENGTH*& INTGRL('X' ,I,2,J,2,STYLO,1.)/LENGTH**4
KFOAM(J,I) = KFOAM(I,J)230 CONTINUECC Calculate the contribution to the stiffness matrix fromC the styrofoam torsion modes.C
DO 240 I = NB+1,NB+NTDO 240 J = I,NB+NT
KFOAM(I,J) = 2.*QTllFOAM/24.*((0.824*TRATIO*CHORD/& 2.)**3-((ZU(1)-ZL(NPLIES))/2.)**3)/3.*CHORD*LENGTH*& INTGRL('X' ,I,2,J,2,STYLO,1.)/LENGTH**4 + 8.*& QT66FOAM*((0.779*TRATIO*CHORD/2.)**3-((ZU(1)-& ZL(NPLIES))/2.) **3)/3.*CHORD*LENGTH*& INTGRL('X',I,1,J,1,STYLO,1.)/(LENGTH*CHORD)**2
250

KFOAM(J,I) KFOAM(I,J)240 CONTINUECC Calculate the contribution to the stiffness matrix fromC the styrofoam bending-torsion coupling.C
DO 250 I - 1,NBDO 250 J MAXO(I,NB+1),NB+NT
KFOAM(I,J) = -.01585*CHORD*LENGTH*QTllFOAM*(TRATIO*& CHORD)**3*INTGRL('X',I,2,J,2,STYLO,1.)/LENGTH**4
KFOAM(J,I) KFOAM(I,J)250 CONTINUECC Calculate the contribution to the stiffness matrix fromC the styrofoam chordwise bending modes.C
IF (NC.GT.0) THENDO 260 I = 1,NB+NT+NCDO 260 J = MAXO(I,NB+NT+1),NB+NT+NC
KFOAM(I,J) = 2.*CHORD*LENGTH* ( (.779*TRATIO*CHORD/& 2.)**3-((ZU((1))-ZL(NPLIES))/2.)**3)/3.*(QTllFOAM/& (LENGTH**4)*INTGRL ( 'X',I,2,J,2,STYLO, 1.)*& INTGRL('Y',I,0,J,0,-.5,+.5) + QT22FOAM/& (CHORD**4)*INTGRL ('X', I,0,J,0,STYLO, 1.) *& INTGRL('Y',I,2,J,2,-.5,+.5) + 4.*QT66FOAM/& (LENGTH*CHORD)**2*INTGRL('X',I,1,,J,1,,STYLO,l.)*& INTGRL('Y',I,1,J,1,-.5,+.5) + QT12FOAM/& (LENGTH*CHORD)**2*(INTGRL('X',I,2,J,0,STYLO,1.)*& INTGRL('Y',I,0,J,2,-.5,+.5)+INTGRL( 'X',I,0,J,2,& STYLO,1.) *INTGRL( 'Y',I,2,J, 0,-.5,+.5)))
KFOAM(J,I) = KFOAM(I,J)260 CONTINUE
ENDIFCC Calculate the contribution to the stiffness matrix fromC the styrofoam fore-&-aft modes.C
IF (NF.GT.0) THENDO 270 I = 1,NB+NT+NC+NFDO 270 J = MAXO(I,NB+NT+NC+1),NB+NT+NC+NF
IF (I.LE.NB+NT+NC) THENKFOAM(I,J) = 0.
ELSEKFOAM(I,J) = QTllFOAM*(0.685*TRATIO*
& CHORD-(ZU(1)-ZL(NPLIES)))*(CHORD**2/12.)*& CHORD*LENGTH*INTGRL('X',I,2,J,2,STYLO,1.)/& LENGTH**4
ENDIFKFOAM(J,I) = KFOAM(I,J)
270 CONTINUEENDIF
CC Combine flat plate and styrofoam stiffness and mass matricesC to create combines mass and stiffness matrices.C
DO 280 I = 1,NMODESDO 280 J = 1,NMODES
M(I,J) = M(I,J)+MFOAM(I,J)K(I,J) = K(I,J)+KFOAM(I,J)
280 CONTINUEKTTO = K(NB+1,NB+l)
CIF (IOUT.NE.0) THEN
WRITE(IOUT,'(/A)') ' Styrofoam Mass matrix [kg] :
251

DO 290 I - 1,NMODESWRITE(IOUT, '(10X,13(1PE10.2))')
& (MFOAM(I,J),J=1,NMODES)290 CONTINUEC
WRITE(IOUT,'(/A)') ' Styrofoam Stiffness matrix [N/m] : 'DO 300 I - 1,NMODES
WRITE(IOUT, '(10X,13(1PE10.2)) ')& (KFOAM(I,J),J=1,NMODES)
300 CONTINUEC
WRITE(IOUT,'(/A)') ' Combined Total Mass matrix [kg] :DO 310 I 1,NMODES. WRITE(IOUT,'(10X,13(1PE10.2))') (M(I,J),J=1,NMODES)
310 CONTINUEC
WRITE(IOUT,'(/A)') ' Combined Total Stiffness '//& 'matrix IN/m] : '
DO 320 I = 1,NMODESWRITE(IOUT, '(10X,13(1PE10.2))') (K(I,J),J=1,NMODES)
320 CONTINUEENDIF
CELSEIF ((I1.EQ.2).AND.(TRATIO.LE.0.)) THEN
CC Quit on second loop if only flat plate.C
GOTO 440ENDIF
CC Skip static and vibration analyses if no diagnostics requested.C
IF (IOUT.EQ.0) GOTO 440CC Calculate plate and/or wing free vibration modes.C
IF (I1.EQ.1) WRITE(*,'(A,$)') ' Do plate 'IF (I1.EQ.2) WRITE(*,'(A,$)') ' Do wing 'WRITE(*,'(A,$)') 'free vibration analysis ?READ(*, '(Al)') ANSWER
CIF ((ANSWER.EQ.'Y').OR.(ANSWER.EQ.'y')) THEN
IP = 0IF (LGEOM) THEN
IP = 100322 WRITE(*,'(A,I1,A,$) ') ' Bending mode (0-',NB,') ? '
READ(*,*,ERR=322) NBGEOIF ((NBGEO.LT.0).OR.(NBGEO.GT.NB)) GOTO 322
325 WRITE(*,'(A,$)') ' Max tip deflection (cm) ?READ(*, *,ERR=325) WTIPMAX
ENDIFC
IF (Il.EQ.l) WRITE(IOUT,'(/A,$)') ' Plate IF (Il.EQ.2) WRITE(IOUT,'(/A,$)') ' Wing 'WRITE(IOUT,'(A,$)') 'free vibration freqs'IF (LGEOM) WRITE(IOUT,*) ' (LH column = tip deflec in cm):'IF (.NOT.LGEOM) WRITE(IOUT,*) ' and mode shapes: '
CQGEO = 0.DO 345 II = 0,IP
IF (IP.NE.0) QGEO REAL(II)/REAL(IP)*WTIPMAX/100./& FMODE(0,'X',NBGEO,1.)/FMODE(0,'Y',NBGEO,0.)
CC Set up dummy mass & stiffness matrices.
252

CDO 330 I = 1,MAXMODEDO 330 J = I,MAXMODE
CC Add linear contributions.C
MDUM(I,J) = M(I,J)KDUM(I,J) = K(I,J)
CC Add nonlinear contributions due to tip deflection.C
IF (LGEOM) THENIF ((I.GT.NB).AND.(I.LE.NB+NT).AND.
& (J.GT.NB).AND.(J.LE.NB+NT)) THENKDUM(I,J) = KDUM(I,J) +
& R(NBGEO,NBGEO,I-NB,J-NB)*QGEO**2ELSEIF (I.GT.NB).AND.(I.LE.NB+NT).AND.
& (J.GT.NB+NT+NC).AND.(J.LE.NB+NT+NC+NF)) THENKDUM(I,J) = KDUM(I,J) +
& H(NBGEO,I-NB,J-NB-NT-NC)*QGEOENDIF
ENDIFMDUM(J,I) = MDUM(I,J)KDUM(J,I) = KDUM(I,J)
330 CONTINUJECC Call EISPACK eigenvalue solver.C
CALL RSG(MAXMODE,NMODES,KDUM,MDUM,FVIB,1,QVIB,& FV1,FV2,IERR)
CC Convert to Hertz (negative sign if imaginary).C
DO 334 I = 1,NMODESFVIB(I) = SQRT(ABS(FVIB(I)))/(2.*PI)*
& (FVIB(I)/ABS(FVIB(I)))334 CONTINUECC Print out frequency results.C
WRITE(IOUT,'(5X,33F10.2)') QGEO*& FMODE(0,'X', NBGEO,1.)*FMODE(0,'Y',NBGEO,0.)*100.,& (FVIB(I),I=1,NMODES)
IF ((.NOT.LGEOM).OR.(II.EQ.IP)) THENDO 340 I = 1,NMODES
QMAX = QVIB(1,I)DO 335 J = 1,NMODES
IF (ABS(QVIB(J,I)).GT.ABS(QMAX))& QMAX=QVIB(J,I)
335 CONTINUEWRITE(IOUT, '(5X, I2,A, F9.2,A, SP,32F7.3) ')
& I,' Freq =',FVIB(I),' Hz ; mode shape =& (QVIB(J,I)/QMAX,J=1,NMODES)
340 CONTINUEC
IF ((LGEOM).AND.(II.EQ.IP)) THENDO 342 I = 1,MAXMODEDO 342 J = I,MAXMODE
MDUM(I,J) = M(I,J)KDUM(I,J) = K(I,J)IF ((I.GT.NB).AND.(I.LE.NB+NT).AND.
& (J.GT.NB).AND.(J.LE.NB+NT)) THENKDUM(I,J) = KDUM(I,J) +
& R(NBGEO,NBGEO,I-NB,J-NB)*QGEO**2
253

ELSEIF ((I.GT.NB).AND.(I.LE.NB+NT).AND.& (J.GT.NB+NT+NC).AND.(J.LE.NB+NT+NC+NF)) THEN
KDUM(I,J) = KDUM(I,J) +& H(NBGEO,I-NB,J-NB-NT-NC)*QGEO
ENDIFMDUM(J,I) = MDUM(I,J)KDUM(J,I) = KDUM(I,J)
342 CONTINUEWRITE(IOUT,*) 'Mass matrix:DO 344 I - 1,NMODES
WRITE(IOUT,'(99(1PE10.2))') (MDUM(I,J),J=1,NMODES)344 CONTINUE
WRITE(IOUT,*) 'Stiffness matrix:DO 346 I 1,NMODES
WRITE(IOUT,'(99(1PE10.2))') (KDUM(I,J),J=1,NMODES)346 CONTINUE
ENDIFC
ENDIF345 CONTINUE
ENDIFCC Loop through tip force (I2=1) and tip moment (12=2) analyses.C
DO 440 I2 = 1,2C
IF (I1.EQ.l) WRITE(*,'(A,$)') ' Do plate tip 'IF (I1.EQ.2) WRITE(*,'(A,$)') ' Do wing tip 'IF (I2.EQ.1) WRITE(*,'(A,$)') 'force analysis ?IF (I2.EQ.2) WRITE(*,'(A,$)') 'moment analysis ? READ(*, '(A1)') ANSWERIF ((ANSWER.EQ.'N').OR.(ANSWER.EQ.'n')) GOTO 440
CC Do direct inversion of K matrix if no structuralC nonlinearities.C
IF ((.NOT.LGEOM).AND.(KTTCUBE.EQ.0.)) THENK(NB+l,NB+l) = KTTOFORCE = 1.DO 347 I - 1,NB+NT+NC
QLIT(I) = 0.IF (I2.EQ.1) RES(I) = FMODE(0,'X',I,1.)*
& FMODE(0,'Y',I,0.)*FORCEIF (I2.EQ.2) RES(I) = FMODE(0,'X',I,1.)*
& FMODE(1,'Y',I,0.)*FORCE/CHORD347 CONTINUEC
CALL SOLVE(K,RES,QLIT,MAXMODE,1,(NB+NT+NC))C
DEFLEC = 0.TWIST = 0.DO 348 I = 1,NB+NT+NC
DEFLEC = DEFLEC + QLIT(I)*FMODE(0,'X',I,1.)*& FMODE(0,'Y',I,0.)
TWIST = TWIST + QLIT(I)/CHORD*FMODE(0,'X',I,1.)*& FMODE(1,'Y',I,0.)
348 CONTINUEDEFLEC = DEFLEC*100.TWIST = ATAN(TWIST)*180./PIIF (I2.EQ.1) THEN
WRITE(IOUT,*) ' F/h =',FORCE/DEFLEC,' N/m'WRITE(IOUT,*) ' F/a =',FORCE/TWIST,' N/deg'
ELSEIF (I2.EQ.2) THENWRITE(IOUT,*) ' M/h =',FORCE/DEFLEC,' Nm/m'
254

WRITE(IOUT,*) ' M/a -',FORCE/TWIST,' Nm/deg'ENDIF
ELSECC Read in concentrated flat plate force data.C
IF ((I1.EQ.1).AND.(I2.EQ.1)) FILENAME =& TRIM(LAYUP)//'PNXS.FOR '
IF ((I1.EQ.1).AND.(I2.EQ.2)) FILENAME =& TRIM(LAYUP)//'PNXS.MOM '
IF ((Il.EQ.2).AND.(I2.EQ.1)) FILENAME =& TRIM(LAYUP)//'WNXS.FOR '
IF ((I1.EQ.2).AND.(I2.EQ.2)) FILENAME =& TRIM(LAYUP)//'WNXS.MOM '
OPEN(3,FILE=TRIM(FILENAME),STATUS='OLD',& FORM='FORMATTED',ERR=360)
IF (I2.EQ.1) WRITE(*,'(2A/)') ' Force data taken from ',& TRIM(FILENAME)
IF (I2.EQ.2) WRITE(*,'(2A/)') ' Moment data taken from ',& TRIM (FILENAME)
IP = 0XLO = 0.XHI = 0.
CC Read in tip force (N) or moment (Nm), tip deflec (cm), andC tip twist (deg), and determine LO and HI.C350 READ(3,*,END=360) X,Y1,Y2
IF (X.GT.XHI) XHI=XIF (X.LT.XLO) XLO=XIP = IP+1GOTO 350
360 CLOSE(3)C
IF ((I1.EQ.1).AND.(I2.EQ.1)) FILENAME =& TRIM(LAYUP)//'PNAS.FOR '
IF ((I1.EQ.1).AND.(I2.EQ.2)) FILENAME =& TRIM(LAYUP)//'PNAS.MOM '
IF ((Il.EQ.2).AND.(I2.EQ.1)) FILENAME =& TRIM(LAYUP)//'WNAS.FOR '
IF ((I1.EQ.2).AND.(I2.EQ.2)) FILENAME =& TRIM(LAYUP)//'WNAS.MOM '
OPEN(3,FILE=TRIM(FILENAME),STATUS='NEW',& FORM='FORMATTED',ERR=440)
CXLO = 2.*XLOXHI = 2.*XHIIIMAX = IP*8DO 430 II = 1,IIMAX
CC Calculate current force/moment value.C
FORCE = XLO + (XHI-XLO)*REAL(II-1)/REAL(IIMAX-1)IF (I2.EQ.1) WRITE(*,'(A,F9.3,A)') ' Calculating '//
& 'for force =',FORCE,' N'IF (I2.EQ.2) WRITE(*,'(A,F9.3,A)') ' Calculating '//
& I'for moment =',FORCE,' Nm'CC Initialize modal amplitudes and residuals.C
K(NB+l,NB+1) = KTTODO 370 I = 1,NB+NT+NC
QLIT(I) = 0.IF (I2.EQ.1) RES(I) = FMODE(0,'X',I,1.)*
255

& FMODE(0,'Y', I,0. ) *FORCEIF (I2.EQ.2) RES(I) FMODE(O,'X',I,1.)*
& FMODE(1,'Y',I,0.)*FORCE/CHORD370 CONTINUECC Loop through Newton-Rephson solver until converged.C
CONVERGED .FALSE.DO WHILE (.NOT.CONVERGED)
CC Calculate derivative matrix.C
DO 380 I = 1,NB+NT+NCDO 380 J = 1,NB+NT+NC
DRDQ(I,J) - -K(I,J)380 CONTINUE
DRDQ(NB+1,NB+1) = DRDQ(NB+1,NB+1)-2.*KTTCUBE*& QLIT(NB+1)**2
CC Apply Newton-Raphson step.C
CALL SOLVE(DRDQ,RES,DQ,MAXMODE,1,NB+NT+NC)DO 390 I = 1,NB+NT+NC
QLIT(I) = QLIT(I)-DQ(I)390 CONTINUECC Calculate new residuals and test for convergence.C
K(NB+1,NB+1) = KTTO+KTTCUBE*QLIT(NB+1)**2CONVERGED = .TRUE.DO 410 I = 1,NB+NT+NC
IF (I2.EQ.1) RES(I) = FMODE(0,'X',I,1.)*& FMODE(0,'Y',I,0.)*FORCE
IF (I2.EQ.2) RES(I) = FMODE(0,'X',I,1.)*& FMODE(1,'Y',I,O.)*FORCE/CHORD
DO 400 J = 1,NB+NT+NCRES(I) = RES(I) - K(I,J)*QLIT(J)
400 CONTINUEIF (ABS(RES(I)).GT.1.E-6) CONVERGED=.FALSE.
410 CONTINUEC
END DOCC Calculate tip deflection (in cm) and tip twist (in deg).C
DEFLEC = 0.TWIST = 0.DO 420 I = 1,NB+NT+NC
DEFLEC = DEFLEC + QLIT(I)*FMODE(O,'X',I,1.)*& FMODE(0,'Y',I,0.)
TWIST = TWIST + QLIT(I)/CHORD*FMODE(O,'X',I,1.)*& FMODE(1,'Y',I,0.)
420 CONTINUEDEFLEC = DEFLEC*100.TWIST = ATAN(TWIST)*180./PIWRITE(3, ' (3(1PE12.4))') FORCE,DEFLEC,TWIST
C430 CONTINUE
CLOSE (3)ENDIF
C440 CONTINUE
CLOSE (2)
C
256

999 RETURNEND
C----- FILE: STIFF.FOR-C
SUBROUTINE QUCON(EL,ET,NULT,GLT,QU11,QU12,QU22,QU66)CC Subroutine to compute the unidirectional elastic constants, theC uni-directional Q's, from the ply engineering elastic constantsC (all in Pa).C
REAL EL,ET,NULT,NUTL, GLTREAL QUll,QU12,QU22,QU66
CNUTL = ET/EL*NULTDENOM = 1.-NULT*NUTLQUll = EL/DENOMQU12 = NULT*ET/DENOMQU22 = ET/DENOMQU66 = GLTRETURNEND
C
CSUBROUTINE QTCON(K,THETA,QU11,QU12,QU22,QU66,QT)
Subroutine to compute the rotated elastic constants, the Q[theta](Pa), for the K-th ply, laid up at an angle theta (rad).
INTEGERREALREAL
KTHETA,QU11,QU12,QU22,QU66I1, I2, R1, R2,QT (3,3, *)
CC Calculate the invariantsC
I1 = (QU11 + QU22 + 2.*QU12)/4.I2 = (QU11 + QU22 - 2.*QU12 + 4.*QU66)/8.R1 = (QUll - QU22)/2.R2 = (QUll + QU22 - 2.*QU12 - 4.*QU66)/8.
CQT(1, 1,K)QT (2,2,K)QT(1,2,K)QT (3, 3, K)QT(1,3,K)QT (2, 3, K)QT(2,1,K)QT(3, 1,K)QT(3,2, K)
= I + I2 + R1*COS(2.*THETA) + R2*COS(4.*THETA)= I1 + I2 - R1*COS(2.*THETA) + R2*COS(4.*THETA)= I1-I2 - R2*COS(4.*THETA)= I2 - R2*COS(4.*THETA)= R1*SIN(2.*THETA)/2. + R2*SIN(4.*THETA)= R1*SIN(2.*THETA)/2. - R2*SIN(4.*THETA)= QT(1,2,K)= QT(1,3,K)= QT(2,3,K)
RETURNEND
CSUBROUTINE BEND(NPLIES,ZU,ZL,QT,A,D)
CC Subroutine to compute the laminate bending stiffnesses,C Aij (N/m) & Dij (N-m).C
INTEGERREALREAL
NPLIESZU(*) ,ZL(*),QT(3,3,*)A(3,3),D(3,3)
CCCC
C
C
257

C Initialize the A and D matrices.C
DO 10 I - 1,3DO 10 J 1,3
A(I,J) 0.D(I,J) 0.
10 CONTINUECC Add the contribution of each ply to the A & D matrices.C
DO 30 I = 1,3DO 30 J 1,3DO 30 K 1,NPLIES
A(I,J) A(I,J) + QT(I,J,K)*(ZU(K)-ZL(K))D(I,J) = D(I,J) + QT(I,J,K)*(ZU(K)**3-ZL(K)**3)/3.
30 CONTINUEC
RETURNEND
CC =======i== ===== ===
CSUBROUTINE STIFF(A,D,LO, HI)
CC Subroutine to compute the stiffness matrix, Kij (N/m).C
INCLUDE PARAM.INCINCLUDE GLBBLK.INCREAL A(3, 3), D (3, 3) , LO, HI, INTGRL
CC NOTE: INTGRL(XY,I,ID,J,JD,lo,hi) is the function to numericallyC integrate the XY-variation of the ID-th derivative of the I-thC mode with the JD-th derivative of the J-th mode between theC interval [lo,hi].C
DO 10 I = 1,NB+NT+NCDO 10 J = I,NB+NT+NC
CC Calculate out-of-plane stiffness matrix components.C
K(I,J) = (CHIORD*LENGTH) * (D(1,1)*INTGRL('X',I,2,J,2,LO,HI)*& INTGRL('Y' ,I,0,J,0,- .5,+.5)/LENGTH**4 + D(2,2)*INTGRL('X',& I,0,J,0,LO,HI)*INTGRL('Y',I,2,J,2,-.5,+.5)/CHORD**4 + 4.*& D(3,3)*INTGRL('X',I,1,J,1,LO,HI)*INTGRL('Y',I,1,J,1,-.5,& +.5)/(LENGTH*CHORD)**2 + D(1,2)*(INTGRL('X',I,2,J,0,LO,HI)*& INTGRL ( 'Y',I,0,J,2,-.5,+.5)+INTGRL ('X',I,0,J,2,LO,HI)*& INTGRL('Y',I,2,J,0,-.5+.,+.5))/(LENGTH*CHORD)**2 + 2.*& D(1,3)*(INTGRL ('X', I,2,J,1,LO,HI) *INTGRL ( 'Y',I,0,J,1,-.5,& +.5)+INTGRL(X'X', I,1,J,2,LO,HI)*INTGRL('Y',I,1,J,0,-.5,+.5))/& (LENGTH**3*CHORD) + 2.*D(2,3)*(INTGRL('X',I,0,J,1,LO,HI)*& INTGRL('Y', I,2,J,1,-.5,+.5)+INTGRL('X',I,1,J,0,LO,HI)*& INTGRL(Y'Y',I,1,J,2,-. 5,+.5))/(LENGTH*CHORD**3))
K(J,I) = K(I,J)10 CONTINUEC
IF (NF.GT.0) THENDO 20 I = 1,NB+NT+NC+NFDO 20 J = MAXO(1,NB+NT+NC+1),NB+NT+NC+NF
CC Calculate fore-&-aft stiffness matrix components.C
IF (I.LE.NB+NT+NC) THENK(I,J) = 0.
ELSE
258

K(I,J) = (CHORD*LENGTH) * (A(1,1)*INTGRL('X',I,2,J,2,LO,HI)*& INTGRL('Y',I,0O,J,O,-.5,+.5)/LENGTH**4 + A(2,2)*INTGRL('X',& I,0,J,0,LO,HI)*INTGRL('Y',1,2,J,2,-.5,+.5)/CHORD**4 + 4.*& A(3,3)*INTGRL('X', I,1, J,1,LO,HI)*INTGRL('Y',I,1,J,1,-.5,& +.5)/(LENGTH*CHORD)**2 + A(1,2)*(INTGRL('X',I,2,J,0,LO,HI)*& INTGRL ( 'Y',I,0,J,2,-.5,+.5)+INTGRL ('X',I,0,J,2,LO,HI)*& INTGRL('Y',I,2,J,0,-.5,+.5))/(LENGTH*CHORD)**2 + 2.*& A(1,3)*(INTGRL('X',I,2,J,,1,LO,HI)*INTGRL( 'Y',I,0,J,1,-.5,& +.5)+INTGRL('X',I,1,J,2,LO,HI)*INTGRL('Y',I,1,J,0,-.5,+.5))/& (LENGTH**3*CHORD) + 2.*A(2,3)*(INTGRL('X',I,0,J,1,LO,HI)*& INTGRL ( 'Y' ,I,2,J,1,-.5,+.5)+INTGRL('X',I,l,J,0,LO,HI)*& INTGRL('Y',I,1,J,2,-.5,+.5))/(LENGTH*CHORD**3)) *& (CHORD**2/12.)K(I,J) = (CHORD*LENGTH) * A(1,1)*INTGRL('X',I,2,J,2,LO,HI)*& INTGRL('Y',I,0,J,0,-.5,+.5)/LENGTH**4 * (CHORD**2/12.)ENDIFK(J,I) = K(I,J)
C20 CONTINUE
ENDIFC
RETURNEND
259

C-----FILE: PARAM.INCCC "Include" file, PARAM.INC, which describes the generalC parameters of the stall flutter analysis programs.C
PARAMETERPARAMETERPARAMETERPARAMETERPAFAMETERPARAMETERPARAMETERPARAMETERPARAMETERPARAMETERPARAMETER
RHOA:RMUA:MAXPLIES:NBMAX:NTMAX:NCMAX:NFMAX:MAXMODE:MAXREG:
MAXPOW:
(PI-3.141592653589793238)(RHOA-1.226)(RMUA1.78E-5)(MAXPLIES=20)(NBMAX=10)(NTMAX=10)(NCMAX=2)(NFMAX=10)(MAXMODE=32)(MAXREG=5)(MAXPOW=20)
Air density in kg/m**3Air coefficient of viscocity in kg/m-secMaximum allowable number of plies in analysisMaximum allowable number of bending modes in analysisMaximum allowable number of torsion modes in analysisMaximum allowable number of chordwise bending modesMaximum allowable number of fore/aft modes in analysisMaximum allowable number of mode shapes in analysisMaximum allowable number of describing regionsfor aerodynamic force curvesMaximum allowable polynomial power for eachdescribing region for aerodynamic force curves
C-----FILE: GLBBLK.INC-CC "Include" file to describe variables used globallyC by most programs in the stall flutter analysis.C
REALREALREALREALREALREALREALREALINTEGERLOGICALLOGICALCHARACTERCHARACTER*2COMMONCOMMONCOMMONCOMMONCOMMON
RE, CHORD, LENGTH, LAMBDA, KTTO, KTTCUBEM (MAXMODE,MAXMODE),K(MAXMODE,MAXMODE)MDUM (MAXMODE, MAXMODE) ,KDUM(MAXMODE, MAXMODE)QVIB(MAXMODE,MAXMODE),FVIB(MAXMODE)FV1 (MAXMODE), FV2 (MAXMODE)H(0:NBMAX,NTMAX,NFMAX)R(0:NBMAX,0:NBMAX,NTMAX,NTMAX)BETA,KT(NTMAX),G(NTMAX),F(NTMAX),B(NTMAX,4)NB,NT,NC,NF,NMODES,ATYPELINEAR, STEADY, REDUC,CORRECVLINES,LATAN,LAEROF,LCONST,LGEOMFOIL*5MLABEL(MAXMODE)RE, CHORD, LENGTH, LAMBDA, KTTO, KTTCUBE,M, KMDUM, KDUM, QVIB, FVIB, FV1, FV2, H, RBETA, KT,G,F,B,NB,NT,NC,NF,NMODESATYPE, LINEAR,STEADY,REDUC,CORREC,VLINESLATAN,LAEROF,LCONST,LGEOM,FOIL,MLABEL
CC RE: Reynold's number (non-dim)C CHORD: Chord length (m)C LENGTH: Half-span (m)C LAMBDA: Sweep angle (deg)C KTTO: Torsional linear term (N/m)C KTTCUBE: Torsional cubic factor (l/m**2)C M(i,j): Mass matrix (kg)C K(i,j). Stiffness matrix (N/m)C BETA,KT,G,F,B: Coefficients of torsional mode shapes
260
CCCCCCCCCCCCCC

Number of bending modes in analysisNumber of torsion modes in analysisNumber of fore-aft modes in analysisNumber of chordwise bending modes in analysisTotal number of modes in analysisType of aerodynamic analysis to use [see AEROF.FOR]Logical variable, if linear analysis is to be doneLogical variable, if steady analysis is to be doneLogical variable to tell if finite-span reduction isto be applied to aerodynamic forcesLogical variable to tell if spanwise correction is tobe applied to spanwise integrationsLogical variable to tell if constant velocity lines orconstant angle lines are to be calculated by analysisLogical variable to tell if exact angle or small-angle-approximations are to be applied to anglecalculationsLogical variable to tell whether to print diagnoticseach time the AEROF unsteady aerodynamics subroutineis calledLogical variable to tell whether to use constantcoefficients in unsteady aerodynamic analysisCharacter variable that denotes airfoil type
C----- FILE: GAUSS.INC -----------------------------------------------C
INTEGERPARAMETERREALDATA&&&DATA&&&
GPOINTS(GPOINTS-12)GP(GPOINTS) ,GW(GPOINTS)GP/-.981560634,-.904117256,-.769902674,
-.587317954,-.367831499,-.125233409,.125233409,.367831499,.587317954,.769902674,.904117256,.981560634/
GW/.047175336,.106939326,.160078329,.203167427,.233492537,.249147046,.249147046,.233492537,.203167427,.160078329,.106939326,.047175336/
NB:NT:NF:NC:NMODES:ATYPE:LINEAR:STEADY:REDUC:
CORREC:
VLINES:
LATAN:
CCCCCCCCCCCCCCCCCCCCCCCC
LAEROF:
LCONST:
FOIL:
261

I
I
Photo courtesy Christopher J. Andrews
BiographyThe author, Peter Earl Dunn, was born on July 13, 1963, in Montreal,
Quebec, the firstborn child of Drs. Earl Vincent and Ruth Cleto Dunn. He is aCanadian citizen. He attended Grades K through 13 at the Toronto FrenchSchool, and is fluent in both French and English. He attended theMassachusetts Institute of Technology as an undergraduate from Sept. 1981 toJune 1985, completing two Bachelor of Science degrees in Aeronautics &Astronautics and in Applied Mathematics, with a minor in Film & MediaStudies. During his junior & senior years as an undergraduate at MIT, heworked as teaching assistant for the Aero & Astro Department's UnifiedEngineering Class. Upon graduation he was awarded the Henry WebbSalisbury award for scholarship from the MIT Aero & Astro Department.
He has been a graduate student at MIT from Sept. 1985 to Dec. 1991. Hisfirst year as a graduate student, he worked on modal analysis of the aerody-namics of turbine rows for Prof. Edward Crawley under the auspices of the MITLester B. Gardner Fellowship. Since Sept. 1986 he has worked as a researchassistant at MIT's Technology Laboratory for Advanced Composites, under thesupervision of Prof. John Dugundji, with the funding of the Air Force Office ofScientific Research. He received his Master's degree from MIT in June 1989 -his thesis topic was a preliminary study for the work of his doctoral disserta-tion. He presented part of this work at the 31st Structures, StructuralDynamics and Materials Conference in Long Beach, Calif. during April 1990.
He is a member of the AIAA, and the honor societies of Sigma GammaTau, Tau Beta Pi, Phi Beta Kappa, and Sigma Xi. Since 1985 he has served as aboard member of The Tech, the MIT campus newspaper.
262
I~~~~~~~~~~~~~m
')4'=1-
ML-M a , -,,~l*
1
Copyright © 2022 FDOKUMEN