Understanding Thoracic Spine Morphology, Shape, and ...
25
HAL Id: hal-03183834 https://hal.archives-ouvertes.fr/hal-03183834 Submitted on 30 Apr 2021 HAL is a multi-disciplinary open access archive for the deposit and dissemination of sci- entific research documents, whether they are pub- lished or not. The documents may come from teaching and research institutions in France or abroad, or from public or private research centers. L’archive ouverte pluridisciplinaire HAL, est destinée au dépôt et à la diffusion de documents scientifiques de niveau recherche, publiés ou non, émanant des établissements d’enseignement et de recherche français ou étrangers, des laboratoires publics ou privés. Understanding Thoracic Spine Morphology, Shape, and Proportionality Renaud Lafage, Jeremy Steinberger, Sebastien Pesenti, Ayman Assi, Jonathan Elysee, Sravisht Iyer, Lawrence Lenke, Frank Schwab, Han Jo Kim, Virginie Lafage To cite this version: Renaud Lafage, Jeremy Steinberger, Sebastien Pesenti, Ayman Assi, Jonathan Elysee, et al.. Un- derstanding Thoracic Spine Morphology, Shape, and Proportionality. Spine, Lippincott, Williams & Wilkins, 2020, 45 (3), pp.149-157. 10.1097/BRS.0000000000003227. hal-03183834
-
Upload
khangminh22 -
Category
Documents
-
view
1 -
download
0
Transcript of Understanding Thoracic Spine Morphology, Shape, and ...
HAL Id: hal-03183834https://hal.archives-ouvertes.fr/hal-03183834
Submitted on 30 Apr 2021
HAL is a multi-disciplinary open accessarchive for the deposit and dissemination of sci-entific research documents, whether they are pub-lished or not. The documents may come fromteaching and research institutions in France orabroad, or from public or private research centers.
L’archive ouverte pluridisciplinaire HAL, estdestinée au dépôt et à la diffusion de documentsscientifiques de niveau recherche, publiés ou non,émanant des établissements d’enseignement et derecherche français ou étrangers, des laboratoirespublics ou privés.
Understanding Thoracic Spine Morphology, Shape, andProportionality
Renaud Lafage, Jeremy Steinberger, Sebastien Pesenti, Ayman Assi, JonathanElysee, Sravisht Iyer, Lawrence Lenke, Frank Schwab, Han Jo Kim, Virginie
Lafage
To cite this version:Renaud Lafage, Jeremy Steinberger, Sebastien Pesenti, Ayman Assi, Jonathan Elysee, et al.. Un-derstanding Thoracic Spine Morphology, Shape, and Proportionality. Spine, Lippincott, Williams &Wilkins, 2020, 45 (3), pp.149-157. �10.1097/BRS.0000000000003227�. �hal-03183834�

SPINE An International Journal for the study of the spine, Publish Ahead of Print
DOI: 10.1097/BRS.0000000000003227 Understanding Thoracic Spine Morphology, Shape, and Proportionality
Renaud Lafage, MS1 ; Jeremy Steinberger, MD1 ; Sebastien Pesenti, MD2 ; Ayman Assi,
PhD3 ; Jonathan C Elysee, MS1 ; Sravisht Iyer, MD1 ; Lawrence G Lenke, MD4 ; Frank J
Schwab, MD1 ; Han Jo Kim, MD1 ; Virginie Lafage, PhD1
1. Spine research laboratory, Hospital for Special Surgery, New York, NY, USA
2. Aix Marseille Univ, CNRS, ISM, Inst Movement Sci, Marseille, France
3. Laboratory of Biomechanics and Medical Imaging, Faculty of Medicine, University
of Saint-Joseph, Beirut, Lebanon
4. Columbia University Medical Center, The Spine Hospital, New York-Presbyterian
Healthcare System, New York, NY, USA
Corresponding author:
Virginie Lafage, PhD
525 E 71st St., Belaire 4E
New York, NY 10021
Tel: (917) 260-4601
Fax: (212) 774-2642
Email: [email protected]
The manuscript submitted does not contain information about medical device(s)/drug(s).
No funds were received in support of this work.
Relevant financial activities outside the submitted work: board membership, consultancy,
grants, royalties, stocks, expert testimony, travel/accommodations/meeting expenses.
Copyright © 2019 Wolters Kluwer Health, Inc. Unauthorized reproduction of this article is prohibited.
Abstract:
Study Design:
Retrospective review
Objective: The aim of this study was to describe TK in a normal asymptomatic population
and to evaluate the association between TK magnitude and its shape.
Summary and Background Data: Understanding spinal anatomy requires a 3-dimensional
appreciation of the spine’s shape, morphology, and proportions. The customary definition of
thoracic kyphosis (TK) is the angle between T4 and T12. However, little is known on the
actual shape of TK in adults.
Methods: Asymptomatic volunteers were recruited; demographic data along with full body
standing radiographs were recorded. Radiographic data such as T1-12 and T4-12 angles were
collected. Maximum TK (MaxTK) and vertebral orientation/tilt were also collected, in
addition to cumulative TK and Centered Kyphosis at T7. The cohort was stratified by T1-12
value (<40, 40-60°and>60) and comparisons and regressions were performed afterwards.
Results: 119 subjects were included (average age 50.8 years, 81 female). Mean T1-12
kyphosis was 49.5°, mean T4-12 kyphosis 41.5°, and mean MaxTK was 52.6°. T1 was the
most anteriorly tilted vertebra, L1 the most posteriorly tilted; T7 was horizontal,
independently of T1-12 value or age. Cumulative kyphosis analysis revealed that the apex of
kyphosis was located at T6-T7. Regression analysis predicting the value and the percentage
of T1-7 both yielded T1-12 as a predictor (Adj. r2=0.32, Adj. r2=0.13).
Conclusion: Changes in kyphosis distribution in an asymptomatic population suggest that
TK is not a simple circle arc: with low TK, 2/3 of the kyphosis is located in the upper part
and when TK increases, the distribution of kyphosis will be symmetric around T7. It is
possible to predict the amount of kyphosis in the upper part using total kyphosis value. This
could help estimate preoperative compensation and predict reciprocal change.
Keywords:
Thoracic Kyphosis, Thoracic Shape, Thoracic Morphology, Normative alignment
Level of Evidence: 3
Copyright © 2019 Wolters Kluwer Health, Inc. Unauthorized reproduction of this article is prohibited.
Key Points
1. T1-12 was more representative of the maximum kyphosis and should be taken as a
reference when evaluating TK.
2. Our results suggest that measuring T4-12 kyphosis tends to underestimate the
maximum kyphosis in the whole spine and that T1-T12 is a more appropriate
description of “thoracic kyphosis.”
3. Most of the curvature located proximal for low TK values, and even distribution for
high TK values.
4. T1 was the most anteriorly tilted vertebrae, while L1 was the most posteriorly tilted
vertebrae. T7 was the most horizontal vertebrae independent of TK or age.
5. An improved understanding TK is a critical first step to a better understanding what
drives surgical failures in this area - adjacent segment disease, DJK, PJK, and PJF.
Copyright © 2019 Wolters Kluwer Health, Inc. Unauthorized reproduction of this article is prohibited.
Introduction:
Understanding spinal anatomy requires a 3-dimensional appreciation of the spine’s shape,
morphology, and proportions. To comprehend pathophysiology and correction, one has to
appreciate sagittal, coronal, and axial 3-dimensionality. Restoring a diseased spine to a
globally balanced state in spinal deformity is instrumental to successful outcomes. In adult
spinal deformity, studies have shown that postoperative sagittal malalignment results in lower
Health-Related Quality of Life (HRQoL), higher revision rates, and residual pain1.
The primary drivers of deformity are vastly different in adolescents versus adult patients. In
Adolescent Idiopathic Scoliosis (AIS), the major concern is coronal deformity2, whereas in
adult spinal deformity, restoring sagittal alignment is paramount3. Because the loss of lumbar
lordosis has been recognized as a significant driver of adult spinal deformity4, a large amount
of research has focused on lumbar spine shape and morphology.
Areas of investigation in the lumbar spine have included: age related changes5,6 and the
relationship between lordosis and pelvic morphology7. Recent studies have gone beyond
“global alignment” and have begun to focus on the morphology of the lumbar spine; namely,
the position of the apex of lumbar lordosis8, the distribution of normal lumbar lordosis and
the segmental angles of the lumbar vertebrae9. These avenues of investigation have created a
sophisticated understanding of lumbar lordosis that allows for patient-specific alignment
parameters based on pelvic morphology and age10.
Despite our progress in understanding lumbar morphology, very little is known about
thoracic alignment in adults. Understanding normal thoracic kyphosis (TK) is critical given
the burden of proximal junctional kyphosis (PJK) in adult deformity surgery; there is already
evidence, for instance, to suggest that a lack of proper restoration of TK is associated with
PJK11. This study aims to address the shortcomings in the existing literature. Using a cohort
Copyright © 2019 Wolters Kluwer Health, Inc. Unauthorized reproduction of this article is prohibited.
of asymptomatic adults, we describe: “normal” TK in terms of regional and segmental angles,
ideal parameters associated with TK, changes in TK with age, and the evolution of TK shape
as it related to changing kyphosis.
Methods:
This was a retrospective review of a prospective single center database of asymptomatic adult
volunteers. Exclusion criteria for the database included prior spinal surgery, previous hip or
knee arthroplasty, lower limb realignment (due to trauma or osteotomy), disabling back pain
or degenerative spine conditions requiring any intervention (physical therapy, corticosteroid
injection, etc.), inability to walk, history of neuromuscular or inflammatory conditions, and
pregnancy. Informed consent was obtained from each individual before study enrollment. A
total of 119 asymptomatic volunteers were recruited at a single center (Washington
University School of Medicine, St Louis, MO, USA). Institutional Review Board (IRB)
approval was obtained before study initiation.
Data collection
Demographic information collected included age, gender, weight, Body Mass Index (BMI)
and height. All patients underwent full-body biplanar stereoradiographic images (EOS
imaging, Paris, France)12, which acquires images of the entire skeleton using low radiation.
For radiographic acquisition, subjects were asked to stand naturally placing their fists on their
shoulders with with arms bent at 45 degrees. Two trained independent observers measured
radiographic parameters using validated software (Spineview; ENSAM laboratory of
Biomechanics, Paris, France)13. Radiographic parameters collected included pelvic incidence
(PI), pelvic tilt (PT), lumbar lordosis (LL), pelvic incidence minus lumbar lordosis (PI-LL),
T1 pelvic angle (TPA), and sagittal vertebral axis (SVA) (Figure 1). In addition, this study
analyzed thoracic kyphosis by measuring T4-T12 kyphosis (the angle between the superior
Copyright © 2019 Wolters Kluwer Health, Inc. Unauthorized reproduction of this article is prohibited.

endplate of T4 and the superior endplate of T12) and T1-T12 kyphosis (the angle between
superior endplate of T1 and the superior endplate of T12) as well as T5-T12 kyphosis and T2-
T5 kyphosis (Figure 1). Maximum thoracic kyphosis was measured as the angle between the
two superior endplates of the two most tilted thoracic vertebrae in the sagittal plane.
Segmental measurements included: the slope of every superior and inferior endplate of
thoracic vertebrae, the segmental kyphosis at each level between T1 and T12 (the angle
between the inferior endplate of one level with the superior endplate of one level above), the
cumulative kyphosis (the angle between a given level and the T12 inferior endplate), and the
centered kyphosis (the angle between a given level and T7 superior endplate) (Figure 2). By
convention a lordotic curvature will be reported using a positive value while a kyphotic
curvature will be reported using a negative value. Similarly, slope of every endplate were
reported using signed values (positive=tilted forward; negative=tilted backward).
Statistical analysis
Mean values were collected for demographic data and radiographic parameters. Descriptive
statistics were provided for TK values, both traditional kyphosis measurements (T4-T12 and
T1-T12) and for maximum kyphosis. The average slope of each thoracic vertebra between
superior and inferior plates was analyzed to define the sagittal orientation of the vertebra. The
relationship between thoracic kyphosis and patient characteristics (demographic data and
pelvic morphology) was analyzed using a Pearson correlation test. Finally, the cohort was
stratified by maximum thoracic kyphosis value into 3 groups: small kyphosis (below 25th
percentile); average kyphosis (between 25th and 75th percentile); large kyphosis (above 75th
percentile). A comparison of the segmental orientation between the 3 groups of thoracic
kyphosis was performed using an ANOVA.
Copyright © 2019 Wolters Kluwer Health, Inc. Unauthorized reproduction of this article is prohibited.
Results
Cohort description
The study group consisted of 81 females and 38 males. The average age was 50.8 ± 17.0
years, ranging from 22 to 78 year old with approximatively 20 patients per decade. Mean
height 168cm ± 9, mean weight 80.1kg ± 19 and mean BMI was 28 ± 6.0 kg/m². The mean PI
was 52°±11.4, PT 14° ± 7.7, lumbar lordosis 58.1° ± 13, PI-LL of -6.1° ± 12.5, TPA of 8.4° ±
8.5, T1SPi of -5.6° ± 3.6, and SVA -9mm ± 45.
Thoracic kyphosis description:
The mean and median values of the thoracic kyphosis are listed on table 1. The median value
of T4-T12 was -41.5° ± 12.7; T1-T12 was -49.5° ± 13.3. For the maximum kyphosis the
median was -51.9°; the 25th percentile was -60.8° while the 75th percentile was -44°.
The comparison between traditional levels of measurement of TK and maximum kyphosis
revealed significant differences between different levels and their measurements (Table 1).
T5-T12 represented 67.5% ± 13.2% of the maximum kyphosis, T4-T12 78.2% ± 11.3% of
the maximum kyphosis, T2-T5 32.7% ± 12% of the maximum kyphosis, and T1-T12 made
up 93.6% ± 7.2% of the maximum kyphosis.
The analysis of the orientation of each vertebra revealed that L1 had a tilt of -20° ± 8.2, the
most posteriorly tilted of the vertebrae. T7 represented the apex of kyphosis and was the most
horizontal (least tilted) at -0.1° ± 7.4. T1, with an orientation of 26.5° ± 9.5, had the most
anterior tilt. T9 vertebra was the most stable with the lowest standard deviation (-10.8°±6.9).
There was a symmetry observed in the number of tilted vertebrae moving away from T7; six
inferior vertebrae were posteriorly tilted from L1 to T8 and six superior vertebrae were
anteriorly tilted from T6 to T1 (Figure 3).
Copyright © 2019 Wolters Kluwer Health, Inc. Unauthorized reproduction of this article is prohibited.
While the number of tilted vertebrae around T7 was consistent, the distribution of kyphosis
around T7 was not. There was higher segmental kyphosis from T1 to T7 than from T7 to L1.
The maximum segmental kyphosis was located between T6 and T7 with an increase of -6.9°
(Figure 4).
Association with demographic parameters
When age was compared to TK, a negative correlation was found with thoracic kyphosis for
traditional levels (r=-0.244 for T5-T12, r=-0.240 for T4-T12, r=-0.253 for T1-T12, all
p<0.05) as well as maximum kyphosis (r=-0.242, p=0.008), except for the T2-T5 level
(p=0.794). No significant correlation was found with other demographic features (height,
weight, BMI). There was no significant correlation with pelvic morphology (PI and PT).
Maximum kyphosis was significantly smaller for women than men (-56.7 vs -50.7 p = 0.022)
but other TK measurements were not significantly different between sexes.
Stratification by TK values
30 patients were having a maximum TK below the 25th percentile, 55 between 25th and 75th
percentile and 34 above the 75th percentile. Patients in the low TK group predictably had
smaller values of segmental kyphosis and global kyphosis. For the low, medium, and high
kyphosis, respectively, the T5-T12 group values were -23.1°, -35.2°, -49.1°, T4-T12 values
were -28.3°, -40.3°, -55.1°, T2-T5 values were -13.7°, -16.5°, -20.4°, and T1-T12 values
were -33.8°, -48.3°, -65.1°(all p < 0.001). The maximum kyphosis was -37.7, -51.0, and -69.0
in the low, medium, and high kyphosis groups, respectively.
As global kyphosis increased, increased segmental kyphosis and larger changes in vertebral
orientation were observed. Except for T8 and T9 (p=0.696 and p=0.071 respectively), there
were significant differences in vertebral orientation between the low, medium and high TK
groups at all levels. The T7 vertebra, however, remained relatively horizontal in all three
Copyright © 2019 Wolters Kluwer Health, Inc. Unauthorized reproduction of this article is prohibited.
groups (slope of -2.6°, -1.0° and 3.5° in low, medium and high TK groups, respectively)
(Figure 5).
Similar to vertebral orientation, increases in segmental kyphosis were seen across the entire
thoracic spine with higher TK with the exception of T12-L1 and T1-T2 levels (p=0.161 and
p=0.580 respectively).
The centered kyphosis analysis revealed that as maximum TK increased, the thoracic spine
became more symmetric around T7. For small TK, T7-L1 kyphosis was -10.8° compared to
T1-T7 kyphosis which was -21.4°. For medium TK, T7-L1 kyphosis is -18.8° compared to
T1-T7 kyphosis which is -26.1°. For larger TK, T7-L1 kyphosis is -29.9°, compared to T1-T7
kyphosis which is -32.3°. Proportion between L1-T7 and T1-T7 increase significantly
between TK group (low TK: 57.5% vs medium TK: 77.5% vs high TK: 111% p = 0.001)
(Figure 6).
Discussion:
Surgery for spinal deformity correction aims to restore balance and normal alignment. In
order to accomplish this, understanding the thoracic spine as a 3-dimensional structure is
critical. Despite cervicothoracic, thoracic, and thoracolumbar deformity representing a large
proportion of the deformities treated today, relatively little is known about thoracic shape and
the distribution of thoracic kyphosis. Our results address this deficiency in the literature by
providing the first detailed description of normative thoracic alignment in a cohort of
asymptomatic adults. Using a variety of kyphosis parameters in 119 asymptomatic volunteers
with EOS imaging, we display a remarkable consistency of thoracic shape in healthy patients,
T7 serving as a reliable apex regardless of age and proportionality above and below T7
staying consistent throughout.
Copyright © 2019 Wolters Kluwer Health, Inc. Unauthorized reproduction of this article is prohibited.
Our results suggest that measuring T4-12 kyphosis tends to underestimate the maximum
kyphosis in the whole spine by approximatively 20%, as well as T5-T12 by approximatively
30%, and that T1-T12 is a more appropriate description of “thoracic kyphosis” with more
than 90% of the maximum thoracic In addition, we show that the distribution of kyphosis is
not symmetric throughout the thoracic spine. Similar to how the majority of lordosis is
derived from L4-S1, we show that changes in TK cannot be modeled as a “circle.” Indeed,
TK should be considered a more sinusoidal than the characteristic “S” shape. There is a
smaller progression on the ends with maximum progression seen in the middle. With regard
to orientation of vertebra, T1 was the most anteriorly tilted vertebrae, while L1 was the most
posteriorly tilted vertebrae. T7 was the most horizontal vertebrae independent of TK or age.
In addition to providing a global understanding of shape in our analysis, contrary to the value
of TK, the shape of the TK was not a constant. Patients who exhibit smaller TK levels have
more kyphosis seen on the top of the thoracic spine, while patients with larger kyphosis have
an equal percentage distributed throughout the upper and lower spine. This shows that
kyphosis shape and proportion is more than a simple measurement of kyphotic magnitude.
As seen in the centered shape model, there was a significant increase in T1-T7 angle within
the TK groups and there was a significant correlation between TK and proportionality – as
the TK increased, the proportion of the curve coming from above decreased and the thoracic
kyphosis become more symmetric (Figure 7).
Although tremendous progress has been made in the conceptual understanding of the lumbar
spine and its shape, thoracic morphology remains an abstruse entity. Relatively few
investigations of normal TK have been performed. Perriman described TK as sagittal plane
curvature from T1-T1214. Using a flexible electrogoniometer, they showed comparable
measurements with the standard measurement with Cobb angle. Lorbergs describe TK as the
angle from T4-T1215 and showed that thoracic kyphosis was not associated with physical
Copyright © 2019 Wolters Kluwer Health, Inc. Unauthorized reproduction of this article is prohibited.
function in women or men who were high functioning. Other works have shown a “normal”
kyphosis to range from 20-50 degrees16 between T4 and T12 and that excessive thoracic
kyphosis can lead to decreased mobility and loss of physical independence17. For assessment
of the thoracic kyphosis on AIS, the Lenke Classification reported a “normal” T5-T12
thoracic kyphosis angle between 10 and 40°18
The effect of age on TK is well documented. This study’s results are consistent with the
literature showing that age correlates significantly with TK (r=-0.253): as age increases, the
TK increases. Possible contributing factors include habitual posture, occupational tolls, and
decreased muscle tone19. With the cumulative centered angle measurements, the effect of age
did not change the symmetry of the shape. The symmetry of the spine was preserved even in
older age.
Notably, T7 was consistently preserved as the apex of the kyphosis regardless of patient age
and the level of overall kyphosis. The “conserved” orientation of T7 suggests that it may play
an important role in spinal balance. While the current study was conducted in a cohort of
asymptomatic patients, it would be interesting to observe how the thoracic apex changes with
progression of sagittal imbalance and activation of thoracic compensation. Additionally, it
would be interesting to observe if fusions extending into the thoracic spine (cervicothoracic
or thoracolumbar) alter the thoracic apex and if these changes predispose to junctional
complications. These are questions are of tremendous clinical relevance and represent an
important area of future investigation.
Proximal Junctional Kyphosis (PJK) can develop in 23-41% of patients undergoing
surgery for spinal deformity20. Despite recent focus on its pathogenesis, risk factors,
prevention, and treatment, PJK remains a formidable complication. Increased thoracic
kyphosis was an important predictor of PJK21 but this may be an oversimplification of a
Copyright © 2019 Wolters Kluwer Health, Inc. Unauthorized reproduction of this article is prohibited.
complex morphological issue. The decision of the upper instrumented vertebra (UIV) plays
an important role of PJK. The UIV selected in the upper and lower thoracic spine has been
shown to correlate with PJK22. Patients exhibiting preoperative thoracic compensation were
more likely to develop proximal junctional kyphosis23. The data from this study may help
modify the risk of PJK; evaluating deviation from “ideal thoracic shape” in patients with
deformity and PJK, perhaps the risk of PJK can be modified. In evaluating preoperative
interventions, the superior portion of TK can be predicted using the total value of kyphosis.
This can be used to estimate pre-operative compensation, predict reciprocal change, and
potentially PJK as hypothesized by previous study23.
There are several limitations to this study. The relatively small size of our cohort (119
patients) limits the generalizability of our findings. Second, we did not use three-dimensional
or virtual models, which may have enhanced the ability to understand thoracic shape. Third,
because we wished to define thoracic alignment, we did not correlate kyphosis with cervical
and lumbar measurements in this study. Understanding how this shape changes with lumbar
and cervical parameters is an important area of future investigation. Studies have shown, for
example, that a change in kyphosis is an important compensatory method in patients with
sagittal deformity24. Finally, the limited sample size did not allow for a deeper analysis on the
thoracic shape by demographic information. Further investigation with a larger cohort may
elucidate potential differences in thoracic kyphosis shape by demographic groups.
Despite these limitations, the current work represents the most complete evaluation of
“normal” thoracic shape in an asymptomatic patient population. An improved understanding
TK is a critical first step to a better understanding what drives surgical failures in this area -
adjacent segment disease, Distal Junctional Kyphosis or Proximal Junctional Kyphosis.
Copyright © 2019 Wolters Kluwer Health, Inc. Unauthorized reproduction of this article is prohibited.
References
1. Glassman SD, Berven S, Bridwell K, Horton W, Dimar JR. Correlation of
radiographic parameters and clinical symptoms in adult scoliosis. Spine (Phila Pa
1976). 2005;30(6):682-688. doi:10.1097/01.brs.0000155425.04536.f7.
2. Souder C, Newton PO, Shah SA, Lonner BS, Bastrom TP, Yaszay B. Factors in
Surgical Decision Making for Thoracolumbar / Lumbar AIS : It ’ s About More Than
Just the Curve Magnitude. 2017;37(8):530-535. doi:10.1097/BPO.0000000000000746.
3. Lafage V, Schwab FJ, Patel A, et al. Pelvic tilt and truncal inclination: two key
radiographic parameters in the setting of adults with spinal deformity. Spine (Phila Pa
1976). 2009;34(17):E599-606. doi:10.1097/BRS.0b013e3181aad219.
4. Lee C-H, Chung CK, Jang J-S, Kim S-M, Chin D-K, Lee J-K. “Lumbar Degenerative
Kyphosis” Is Not Byword for Degenerative Sagittal Imbalance: Time to Replace a
Misconception. J Korean Neurosurg Soc. 2017;60(2):125-129.
doi:10.3340/jkns.2016.0607.001.
5. Iyer S, Lenke LG, Nemani VM, et al. Variations in Sagittal Alignment Parameters
based on Age: A Prospective Study of Asymptomatic Volunteers using Full-Body
Radiographs. Spine (Phila Pa 1976). 2016;41(23):605-610.
doi:10.1097/BRS.0000000000001642.
6. Vialle R, Levassor N, Rillardon L, Templier A, Skalli W, Guigui P. Radiographic
analysis of the sagittal alignment and balance of the spine in asymptomatic subjects. J
Bone Joint Surg Am. 2005;87(2):260-267. doi:10.2106/JBJS.D.02043.
7. Boulay C, Tardieu C, Hecquet J, et al. Sagittal alignment of spine and pelvis regulated
Copyright © 2019 Wolters Kluwer Health, Inc. Unauthorized reproduction of this article is prohibited.
by pelvic incidence: standard values and prediction of lordosis. Eur Spine J.
2006;15(4):415-422. doi:10.1007/s00586-005-0984-5.
8. Roussouly P, Gollogly S, Berthonnaud E, Dimnet J. Classification of the normal
variation in the sagittal alignment of the human lumbar spine and pelvis in the standing
position. Spine (Phila Pa 1976). 2005;30(3):346-353. doi:00007632-200502010-00016
[pii].
9. Pesenti S, Lafage R, Stein D, et al. The Amount of Proximal Lumbar Lordosis Is
Related to Pelvic Incidence. Clin Orthop Relat Res. 2018;476(8):1603-1611.
doi:10.1097/CORR.0000000000000380.
10. Lafage R, Schwab F, Challier V, et al. Defining Spino-Pelvic Alignment Thresholds:
Should Operative Goals in Adult Spinal Deformity Surgery Account for Age? Spine
(Phila Pa 1976). 2016;41(1):62-68. doi:10.1097/BRS.0000000000001171.
11. Lafage R, Line BG, Gupta S, et al. Orientation of the Upper-most Instrumented
Segment Influences Proximal Junctional Disease Following Adult Spinal Deformity
Surgery. Spine (Phila Pa 1976). 2017;42(20):1570-1577.
doi:10.1097/BRS.0000000000002191.
12. Dubousset J, Charpak G, Dorion I, et al. [A new 2D and 3D imaging approach to
musculoskeletal physiology and pathology with low-dose radiation and the standing
position: the EOS system]. Bull Acad Natl Med. 2005;189(2):287-97; discussion 297-
300.
13. Rillardon L, Levassor N, Guigui P, et al. [Validation of a tool to measure pelvic and
spinal parameters of sagittal balance]. Rev Chir Orthop Reparatrice Appar Mot.
2003;89(3):218-227.
Copyright © 2019 Wolters Kluwer Health, Inc. Unauthorized reproduction of this article is prohibited.
14. Perriman DM, Scarvell JM, Hughes AR, Ashman B, Lueck CJ, Smith PN. Validation
of the flexible electrogoniometer for measuring thoracic kyphosis. Spine (Phila Pa
1976). 2010;35(14):E633-40. doi:10.1097/BRS.0b013e3181d13039.
15. Lorbergs AL, Murabito JM, Jarraya M, et al. Thoracic Kyphosis and Physical
Function: The Framingham Study. J Am Geriatr Soc. 2017;65(10):2257-2264.
doi:10.1111/jgs.15038.
16. Willner S. Spinal pantograph - a non-invasive technique for describing kyphosis and
lordosis in the thoraco-lumbar spine. Acta Orthop Scand. 1981;52(5):525-529.
http://www.ncbi.nlm.nih.gov/pubmed/7331788.
17. Lydick E, Zimmerman SI, Yawn B, et al. Development and validation of a
discriminative quality of life questionnaire for osteoporosis (the OPTQoL). J Bone
Miner Res. 1997;12(3):456-463. doi:10.1359/jbmr.1997.12.3.456.
18. Lenke LG, Betz RR, Harms JJ, et al. Adolescent idiopathic scoliosis: a new
classification to determine extent of spinal arthrodesis. J Bone Joint Surg Am. 2001;83-
A(8):1169-1181. doi:10.1097/00007632-200101010-00009.
19. Milne JS, Lauder IJ. Age effects in kyphosis and lordosis in adults. Ann Hum Biol.
1974;1(3):327-337. http://www.ncbi.nlm.nih.gov/pubmed/4419577.
20. Liu F-Y, Wang T, Yang S-D, Wang H, Yang D-L, Ding W-Y. Incidence and risk
factors for proximal junctional kyphosis: a meta-analysis. Eur Spine J.
2016;25(8):2376-2383. doi:10.1007/s00586-016-4534-0.
21. Mendoza-Lattes S, Ries Z, Gao Y, Weinstein SL. Proximal junctional kyphosis in
adult reconstructive spine surgery results from incomplete restoration of the lumbar
lordosis relative to the magnitude of the thoracic kyphosis. Iowa Orthop J.
Copyright © 2019 Wolters Kluwer Health, Inc. Unauthorized reproduction of this article is prohibited.
2011;31:199-206. http://www.ncbi.nlm.nih.gov/pubmed/22096442. Accessed October
15, 2014.
22. Hyun S-J, Lee BH, Park J-H, Kim K-J, Jahng T-A, Kim H-J. Proximal Junctional
Kyphosis and Proximal Junctional Failure Following Adult Spinal Deformity Surgery.
Korean J Spine. 2017;14(4):126-132. doi:10.14245/kjs.2017.14.4.126.
23. Protopsaltis TS, Diebo BG, Lafage R, et al. Identifying Thoracic Compensation and
Predicting Reciprocal Thoracic Kyphosis and PJK in Adult Spinal Deformity Surgery.
Spine (Phila Pa 1976). August 2018. doi:10.1097/BRS.0000000000002843.
24. Klineberg E, Schwab FJ, Ames CP, et al. Acute reciprocal changes distant from the
site of spinal osteotomies affect global postoperative alignment. Adv Orthop.
2011;2011:415946. doi:10.4061/2011/415946.
Copyright © 2019 Wolters Kluwer Health, Inc. Unauthorized reproduction of this article is prohibited.
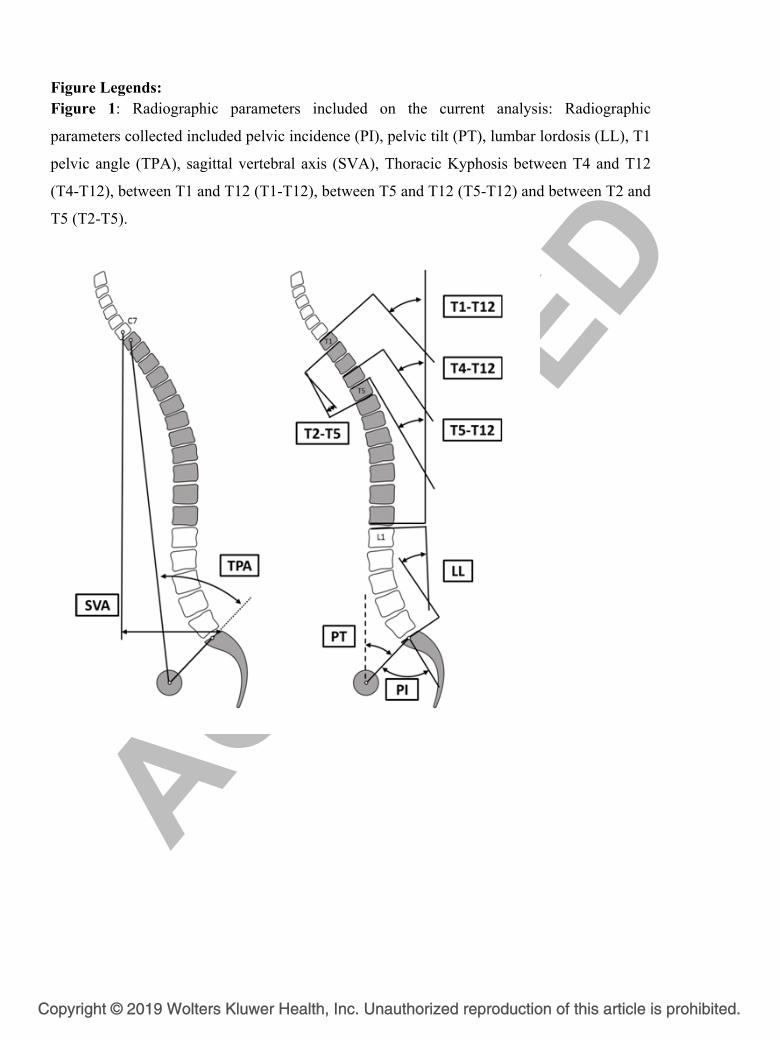
Figure Legends: Figure 1: Radiographic parameters included on the current analysis: Radiographic
parameters collected included pelvic incidence (PI), pelvic tilt (PT), lumbar lordosis (LL), T1
pelvic angle (TPA), sagittal vertebral axis (SVA), Thoracic Kyphosis between T4 and T12
(T4-T12), between T1 and T12 (T1-T12), between T5 and T12 (T5-T12) and between T2 and
T5 (T2-T5).
Copyright © 2019 Wolters Kluwer Health, Inc. Unauthorized reproduction of this article is prohibited.
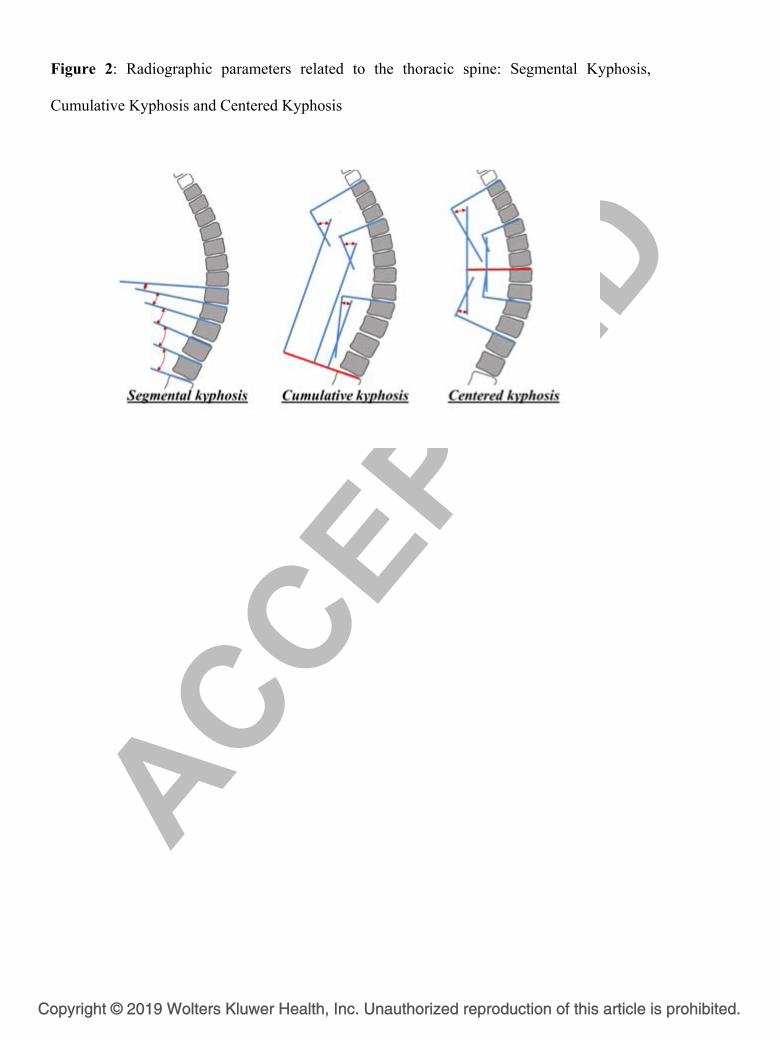
Figure 2: Radiographic parameters related to the thoracic spine: Segmental Kyphosis,
Cumulative Kyphosis and Centered Kyphosis
Copyright © 2019 Wolters Kluwer Health, Inc. Unauthorized reproduction of this article is prohibited.

Figure 3: Mean Vertebra orientation versus horizontal axis in degree. A negative value
denoted a posterior inclination while positive value denoted an anterior inclination.
Copyright © 2019 Wolters Kluwer Health, Inc. Unauthorized reproduction of this article is prohibited.
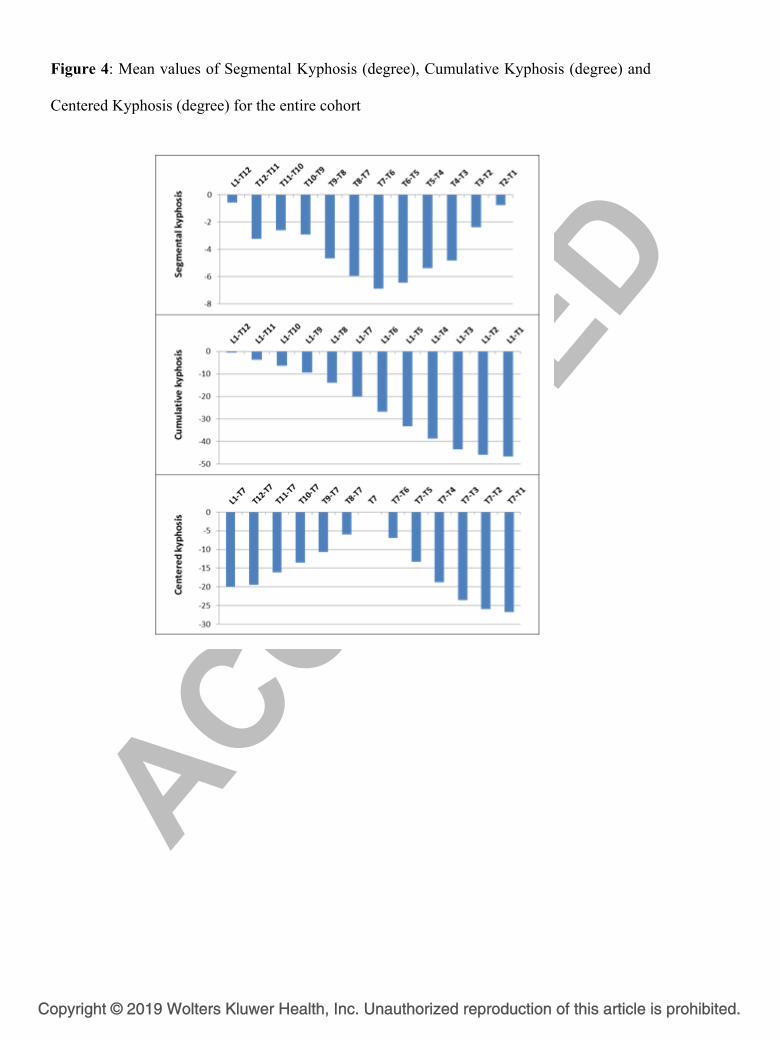
Figure 4: Mean values of Segmental Kyphosis (degree), Cumulative Kyphosis (degree) and
Centered Kyphosis (degree) for the entire cohort
Copyright © 2019 Wolters Kluwer Health, Inc. Unauthorized reproduction of this article is prohibited.
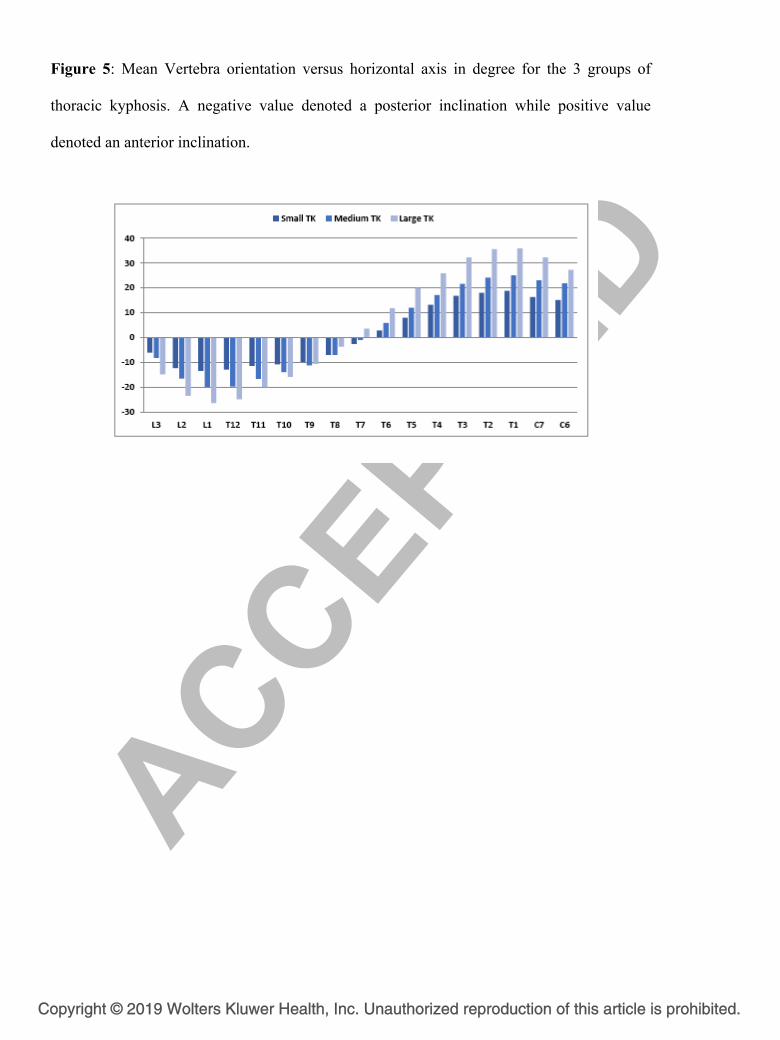
Figure 5: Mean Vertebra orientation versus horizontal axis in degree for the 3 groups of
thoracic kyphosis. A negative value denoted a posterior inclination while positive value
denoted an anterior inclination.
Copyright © 2019 Wolters Kluwer Health, Inc. Unauthorized reproduction of this article is prohibited.

Figure 6: Mean values of Segmental Kyphosis (degree), Cumulative Kyphosis (degree) and
Centered Kyphosis (degree) by group of thoracic Kyphosis.
Copyright © 2019 Wolters Kluwer Health, Inc. Unauthorized reproduction of this article is prohibited.
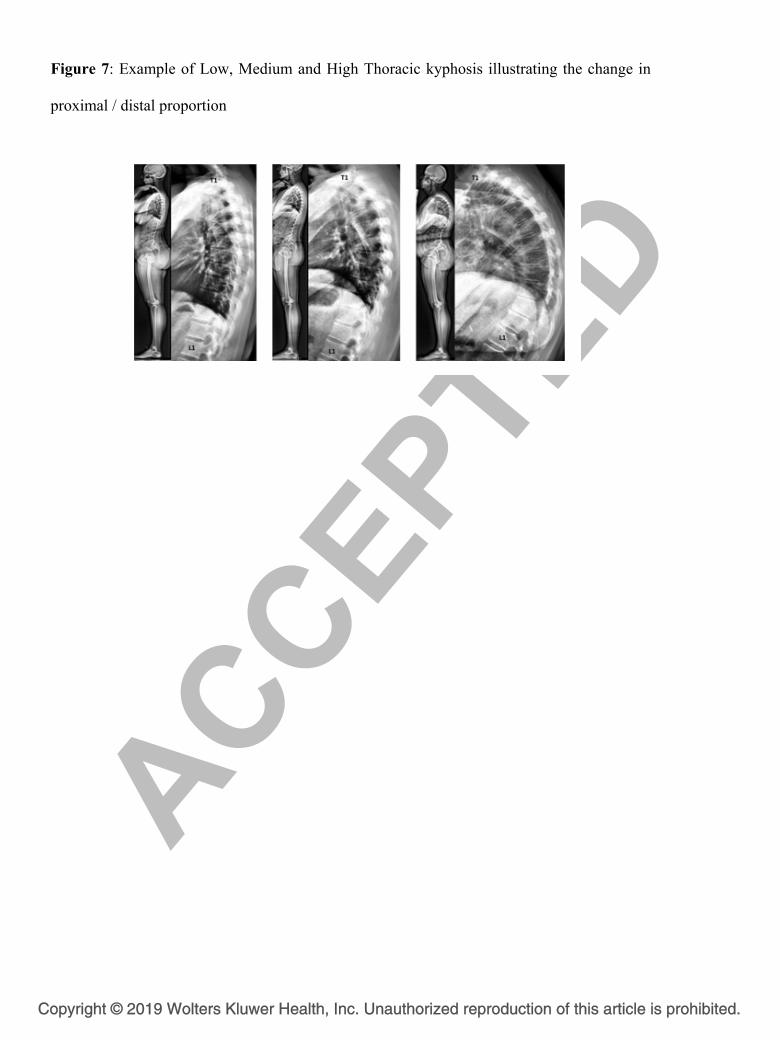
Figure 7: Example of Low, Medium and High Thoracic kyphosis illustrating the change in
proximal / distal proportion
Copyright © 2019 Wolters Kluwer Health, Inc. Unauthorized reproduction of this article is prohibited.
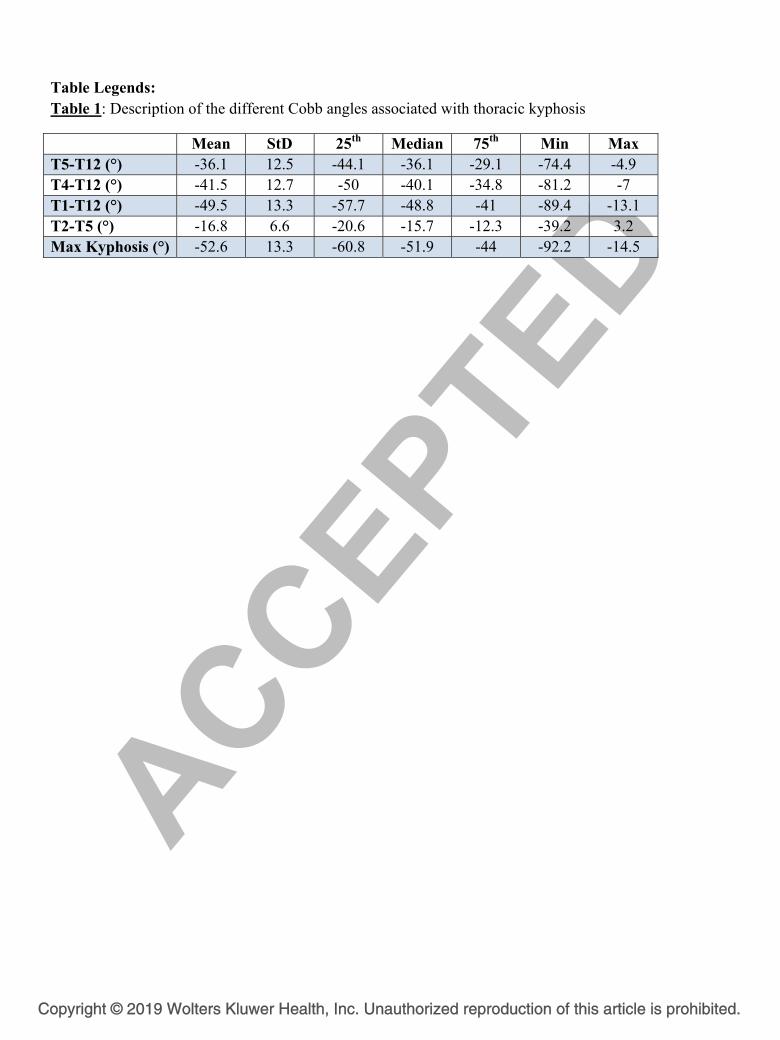
Table Legends: Table 1: Description of the different Cobb angles associated with thoracic kyphosis
Mean StD 25th Median 75th Min Max T5-T12 (°) -36.1 12.5 -44.1 -36.1 -29.1 -74.4 -4.9 T4-T12 (°) -41.5 12.7 -50 -40.1 -34.8 -81.2 -7 T1-T12 (°) -49.5 13.3 -57.7 -48.8 -41 -89.4 -13.1 T2-T5 (°) -16.8 6.6 -20.6 -15.7 -12.3 -39.2 3.2 Max Kyphosis (°) -52.6 13.3 -60.8 -51.9 -44 -92.2 -14.5
Copyright © 2019 Wolters Kluwer Health, Inc. Unauthorized reproduction of this article is prohibited.