Real time phase detection based online monitoring of batch fermentation processes
Upload
khangminh22Category
view
4download
0
© 2019 JETIR April 2019, Volume 6, Issue 4 www.jetir.org (ISSN-2349-5162)
JETIR1904C38 Journal of Emerging Technologies and Innovative Research (JETIR) www.jetir.org 234
Real Time Water Quality Monitoring System With
Smart Sensor Using SEP and BFOA Algorithm
1Er.Riha, 2Er.Shelly 1M.Tech Scholar, Computer Science & Engineering Department, USET, Mohali
2Assistant Professor, Computer Science & Engineering Department, USET, Mohali
Abstract—For drinking water quality PH(public
health)is an essential. It is require to prevent any
interference into water division systems and to
detect pollution as soon as possible, whether
accidental or intentional. Thus, we supposed of
integrating a section to detect the anomalies or
corruption that could affect the drinking water
quality. Hence, a study of the evolution of water
quality is necessary protect. In this we implement
a centralized anomaly detection method in
destinations. Our research work depends on a
WSNs (Wireless Sensor Networks) in
collaboration with a network platform. In
research work, an effective and optimized
(BFOA) detection algorithm is centralized in the
destination sensor network , where a world-wide
and coherent WQ (Water Quality) should be
attained from the considerations taken locally.
The optimization algorithm takes into account the
variable features of the water quality metrics.
Certainly , the water quality metrics like as a PH
scale, Turbidity can unexpectedly exceed the
standard thresholds during a consider window and
then it retains SVs (Standard Values). Our
Research Work method triggers an alarm only, if
the anomaly persists during several of successive
windows defined by the manage center.
The performance computed in this phase is
intended to compute the network efficiency the
ratio between the several of received data packets
and the number of sent data packets as a method
of the packets inter-arrival time. Then, they are
interested in the evolution of the sensitivity
network according to the simulation time (msec)
and simulator used MATLAB 2016a.
Keywords— WSN (Wireless sensor network),
BFOA (bacteria foraging optimization algorithm)
and SEP (Stable Election Protocol).
I INTRODUCTION
A network is a cluster connected with 3 or many
notebook systems that are paired alongside for
you to talk collectively. It’s really a
telecommunication community that allows
computers to change know-how. Within notebook
sites, networked computing devices do know-how
for you to every distinct about know-how
contacts. The particular contacts between nodes
are established mistreatment often were
advertising or Wi-Fi advertising [1].
Fig.1. Wireless Sensor Network [2]
The major applications of WSN are described as
remote overhead water quality monitoring system,
quality monitoring in reservoirs, in sea water
quality equipment and it can be utilized for
industrial use [3]. WSN can manage every one of
the inadequacies of manual strategy and present
us with a few advantages in correlation to past
strategies [4]. Several benefits such as
infrastructure less, delay tolerant, temporal
contamination, real time monitoring and the early
warnings.
A. Water Atmosphere The water atmosphere, consisting of the
surface water atmosphere and underground
water environment, can be differentiated to
water bodies like rivers, lakes, reservoirs,
oceans, swamps, glaciers, springs, & shallow
or bottomless underground waters. The water
environment, as well as other environmental
elements like soil, organism and atmosphere,
etc., constitutes an organic compound. Once a
Internet
PC
Laptop
© 2019 JETIR April 2019, Volume 6, Issue 4 www.jetir.org (ISSN-2349-5162)
JETIR1904C38 Journal of Emerging Technologies and Innovative Research (JETIR) www.jetir.org 235
change or damage to the water environment is
observed in this compound, changes to other
environmental elements inevitably occurs [5].
Due to the speed of Indian’s economic
improvement, we can also see the resulting
speeding-up of contamination & damage to
the water environment.
Fig.2. Water Environment
B. Problem Occurring in Water Level
Monitoring
Cities are facing unprecedented challenges. The
pace of urbanization is cumulative exponentially.
Every day, urban areas produce by almost 150
000 people, either due to migration or births. In
addition, due to climate change and other
environmental pressures, cities are progressively
required to become “smart” & take substantial
measures to meet stringent targets imposed by
commitments and legal obligations [6]. Technical
answers exist for every city to become cleverer.
The challenge today is primarily to implement
appropriate solutions efficiently, rather than only
focusing on new technology development. Smart
cities cannot be established through a patchwork
approach, but by the step-by-step acceptance of
incremental improvements [7].
C. Need of Water Level Monitoring Over the past decade, online water quality
monitoring has been widely used in many
countries known to have serious issues related
to environmental pollution [8]. The water is
limited and essential resource for industry,
agriculture, and all the creatures existing on
the earth including human being. Any
imbalance in water quality would severely
affect the health of the humans, animals &
also affect the ecological balance amongst
species [9]. In the 21st century there were lots
of inventions, but at that time were pollutions,
global warming & so on are also being
formed, as of this there is no safe drinking
water for the world’s population [10]. The
WHO (world health organization) estimated,
in India among 77 million persons is suffering
due to not having safe water. WHO also
estimates that 21% of syndromes are related to
unsafe water in India. The water quality
parameter pH show water is acidic or simple.
Pure water has 7 pH values, less than 7 values
indicate acidity and more than 7 indicate
alkalinity. The normal range of pH is 6 to
8.5.It is considered as a good measure of the
excellence of water. Water temperature,
indicates how water is hot or cold. The
worsening of water resources becomes a
common human problem [11]. Traditional
methods of the water quality finding have the
disadvantages like complex methodology,
long waiting time for results, low
measurement precision and high cost [12].
Therefore, there is a need for continuous
monitoring of water quality parameters in real
time.
The entire research work is divided into six
sections. Section I composes of the general
information about the wireless sensor network
and the water atmosphere. Section II is
defining the structure of the monitoring
system which is created for water quality.
Section III involves the previous researchers.
Section IV is about the explanation of used
methods such as SEP and BFOA. Section V
depicted the process of results obtained and at
last Section IV contains the conclusion and
future scope of the present work.
I. ARCHITECTURE OF WATER
MONITORING SYSTEM
A. Significance to Control Water level
Monitoring
Everyone knows the importance of having
clean, potable water. The water used to supply
your milk house, to clean your equipment, and
to feed your animals, which in most cases is
the same water that supplies the farmhouse,
must meet the same standards as drinking
water. Rule 761 of the Milk Act requires that
all milk houses have a resource of potable
water. Ontario Drinking Water Standards
describe potable water as having zero E. coli &
zero coliform per 100 ml. Water contaminated
by certain bacteria can cause serious animal
health issues that directly affect milk quality.
Pseudomonas bacteria can also readily
© 2019 JETIR April 2019, Volume 6, Issue 4 www.jetir.org (ISSN-2349-5162)
JETIR1904C38 Journal of Emerging Technologies and Innovative Research (JETIR) www.jetir.org 236
generate stubborn biofilms which adhere
themselves to equipment surfaces, and
intermittently shed high levels of bacteria into
the milk supply.
Fig. 3. Significance to Control Water Level
Monitoring
Problems that arise from poor water quality are
not limited to bacteriological quality. Hard
water, buffers, & sediment can reduce the
effectiveness of chlorinated alkali cleaners,
acids and sanitizers in your milk line. Also be
aware that changes in land use next to wells,
and well repairs may also impact water quality
and are therefore good times to test. Everyone
should be aware of and test their own well
water out of concern for their own health, the
health of their animals, and the impact it may
have on their milk quality.
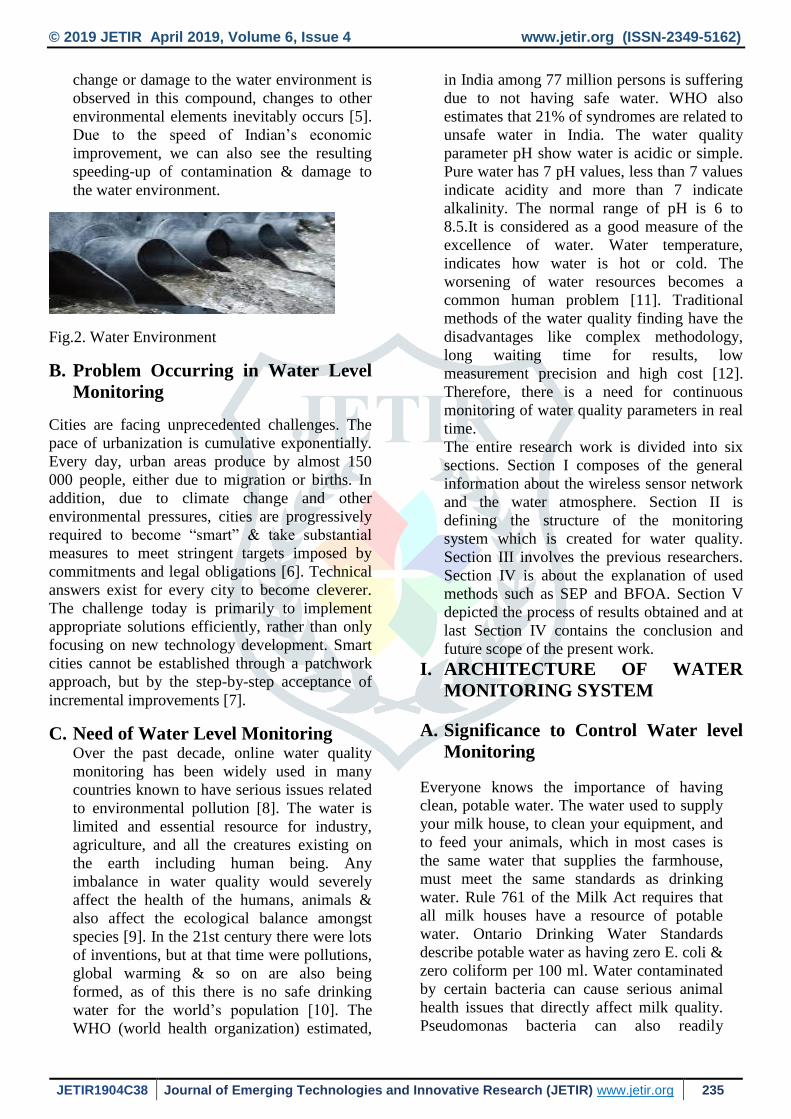
B. System Architecture of Water
Monitoring System
First the water level indicator is used to
indicate level of water in the tank. LED light
sensor will fixed in the side of the tank. In the
tank we fixed the Number of Led light based
on size of the tank. For example: We use LED
1, LED 2 and LED 3 sensor fixed. LED 1 is
the lowest point, LED 2 is the middle point and
LED 3 is the highest point. When the water
will reach the Lowest Point LED 1 sensor
light, The microcontroller (PID) will passed
the input signal to the pump and the pump will
automatically ON. Then when the water will
reaches the highest point LED 3 sensor then
the pump will be automatically off. By using
this concept we easily avoid overflowing and
the water level will be indicate to user on
monitoring.
The second one is water quality level checking
used three parameters such as pH, Temperature
and turbidity sensor. The pH sensor,
temperature & turbidity sensor will localize
into the water inside on the chamber. PH
sensor is used to check the hydrogen value in
the water. Temperature sensor is used to find
the value of temperature in water [13]. The
third one is Pipes leakage detection. Using
Pressure sensor is used to detect the leakage
pipes. This sensor will fixed between the pipes.
A comparative pressure sensing method based
on force sensitive resistors (FSR) is used for
pressure quantities in the proposed UWSN for
pipeline monitoring. All the sensors are
connected to the wireless sensor network. A
wireless sensor network is a group of
specialized transducers with infrastructures
arrangement that uses radio to monitor and
record physical or environmental conditions.
GSM (Global System for Mobile
Communication) is a digital mobile telephony
system. GSM is a cellular arrangement which
resources that cell phones joint to it by
penetrating for cells in the immediate vicinity.
Fig.4. Architecture of Water Monitoring
III PRIMITIVES
C. Parmar, N.M., et al., (2015) [16] Presented a
request of wireless network: the sensing of DO for
a fish farm. Application necessary sensor module
for sensing a required data, wireless module for
data transmission through radio channel and a
gateway module as monitoring center. In this
case, the association was one master with two
slaves using a transmission rate of 9600 b/s. The
wireless broadcast follow the usual IEEE 802.15.4
protocol and implement the routing protocol
based on ZigBee usual. This was a qualitative and
quantitative approach for a water quality
monitoring. Main future of this request was that it

© 2019 JETIR April 2019, Volume 6, Issue 4 www.jetir.org (ISSN-2349-5162)
JETIR1904C38 Journal of Emerging Technologies and Innovative Research (JETIR) www.jetir.org 237
was easy and effective way for doing real time
water quality monitoring .
D. Mithila Barabde et al., 2015 [17] Proposed
a sensor-based water quality monitoring
system. The system architecture consists
of data monitoring nodes, a base station
and a remote station. All these stations
were connected using wireless
communication link. The data from nodes
were send to the base station consisting of
ARM controller designed for special
compact space application. Data collected
by the base station such as pH, turbidity,
conductivity, sent to the remote
monitoring station. Data collected at the
remote site could be displayed in visual
format on a server PC with the help of
MATLAB and was also compared with
standard values. If the obtained value was
above the threshold value automated
warning SMS alert will be sent to the
agent. The uniqueness of proposed
approach was to obtain the water
monitoring system with high frequency,
high mobility and low powered.
E. Adamo, F., et.al., (2015) [18] Presented a
network of smart sensors, based on
ISO/IEC/IEEE 21451 suite of standards,
for in situ and in continuous space-time
monitoring of superficial water bodies, in
particular for seawater. The scheme was
meant to be an important tool for
evaluating water quality and a valid
support to strategic decisions concerning
critical atmosphere issues. The aim of the
proposed scheme was to capture possible
extreme events and to collect long term
periods of data
F. Kaskina, et al., 2014 [19] Planned to
propel the utilization of Remote Sensing
with regards to overseeing water asset by
coordinating high determination remote
detecting innovation into a knowledge
management system for the administration
of water assets and the framework to
control them. Remote detecting innovation
could specifically add to water asset
administration and gives one of kind
techniques and answers for meet the data
prerequisites of water engineers in charge
of water assets administration. Remote
sensing technology was utilized to
supplement the improvement of a
knowledge management system by
propelling the remote detecting ability and
picture handling to close constant. This
capacity could be utilized to screen and
evaluate a waterway bowl to create surge
degree and forecasts.
G. O'Flynn, B., et al., (2007) [20] Described
the “Smart Coast” Multi Sensor System
for water quality monitoring. This system
was aimed at providing a platform capable
of meeting the monitoring requirements of
the water framework instruction. The key
parameters below investigation included
temperature, phosphate, dissolved oxygen,
conductivity, pH, turbidity and water
level. The “Plug & Play” capabilities
enabled by the wireless sensor network
(WSN) platform established at tyndall
allow for integration of sensors as required
were described, as well as the custom
sensors under development within the
project.
. TABLE 1. Comparison of Literature Review
Author’
s Name
and
Year
Technique
Used
Advantage
s
Research
Gap
D.
Kaskina.
, et al.,
2014
Remote
Sensing
Technolog
y
Enhanced
the
knowledge
managemen
t system
Managing
and
controlling
the
pictures.
Mithila
Barabde.
, et al.,
2015
Sensor
based
water
quality
monitoring
system
Applicable
for compact
space
application
Frequency
and
mobility
of nodes.
O’Fynn,
B., et al.,
2007
Smart
coast
Multi
sensor
system
Tendency
to enhance
all the
requirement
s of
monitoring
systems.
Integration
of sensors.
Adamo,
F., et al.,
2015
Smart
Sensors
Ability for
space time
monitoring.
Evaluation
of water
quality.

© 2019 JETIR April 2019, Volume 6, Issue 4 www.jetir.org (ISSN-2349-5162)
JETIR1904C38 Journal of Emerging Technologies and Innovative Research (JETIR) www.jetir.org 238
Parmar,
N.M., et
al., 2015
Zigbee Easy and
effective
process.
Real time
monitoring
.
II. PROPOSED METHODS
A. SEP Protocol
Existing SEP [19] is a heterogeneity-aware
protocol and election probabilities of nodes are
weighted by initial energy of each node relative to
that of other nodes in a network. A Stable
Election Protocol for clustered heterogeneous
wireless sensor networks (SEP) is developed for
the two-level heterogeneous networks, which
include two types of nodes, the advance nodes and
normal nodes according to the initial energy. The
revolving epoch with election probability is
directly correlated with the initial energy of
nodes. The probability threshold, which each node
𝑠 uses to determine whether itself to become a
cluster-head in every one round, is as follow:
T(s) = {p
1−p∗mod(r,round(1
p))
ifs∈ G (i)
Where G is the set of nodes that are eligible to be
cluster heads at round 𝑟. In each one round 𝑟,
when node 𝑠 find it is eligible to be a cluster head,
it will decide a casual number between 0 and 1. If
the amount is less than threshold (𝑠), the node 𝑠𝑖 becomes a cluster head through the current round.
Also, for two-level heterogeneous networks, 𝑝 is
defined as follow:
pnrm =popt
1+a.m (ii)
If s is the normal node
padv =popt
1 + a. m × (1 + a) (iii)
if s is the advanced node SEP, which improves the
stable region of the clustering hierarchy process.
The fraction of advanced nodes (m) and the
additional energy factor between advanced and
normal nodes (α). The novel heterogeneous
setting (with advanced & normal nodes) has no
effect on the spatial density of the system so the a
priori setting of popt, from Equation (1), does not
change. On the other hand, the total energy of the
system changes. Assume that Eo is the first
energy of every normal sensor.
Now increase the stable region of the sensor
network by 1+α·m times, if (i) each normal node
becomes a cluster head once every 1 popt (1+α
·m) rounds per epoch; (ii) each advanced node
becomes a cluster head exactly 1+α times every 1
popt (1+α·m) rounds per epoch; and (iii) the
average number of cluster heads per round per
epoch is equal to n × popt (the spatial density does
not change).
Restraint is very strict— If at the end of each
epoch the number of times that an progressive
sensor has become a cluster head is not equal to 1
+ α then the energy is not well distributed and the
average number of cluster heads per round per
epoch will be less than n×popt. This problem can
be reduced to a problem of optimal threshold T(s)
setting , with the constraint that each node has to
become a cluster head as many times as its initial
energy divided by the energy of a normal node.
T(Snrm) = {pnrm
1−pnrm∗mod(r,round(1
pnrm))
ifs∈ G1
(iv)
T(Sadv) = {pnrm
1−padv∗mod(r,round(1
padv))
ifs∈ G1
(v)
B. BFOA (Bacteria Foraging
Optimization Algorithm)
BFOA is considered as a world widely used
optimization process and accessed for the
optimization and control in the distribution
manner. Generally, BFOA is relied on the
behavior of social foraging Escherichia coli.
While the process of foraging is initialized, the
real bacteria movement is acquired by using
different groups of stretchy flagella. It is a concept
which referred to the Escherichia coli for the
further process even in tumble or swim. Basically,
these are the two major and most crucial
procedure followed by bacterial foraging
optimization algorithm. Whenever, rotation takes
place, these are begun towards the forward
direction and in this way, the flagellum influenced
the cell. After this it become independent and
finally, bacterium flips with reduced count of
tumbling to discover NG (Nutrient Gradient). On
the other hand, in the direction of counter clock-
wise. The flagella utilized to move bacterium to
swim in extremely fast speed [20].
© 2019 JETIR April 2019, Volume 6, Issue 4 www.jetir.org (ISSN-2349-5162)
JETIR1904C38 Journal of Emerging Technologies and Innovative Research (JETIR) www.jetir.org 239
Fig.5. Swim and Tumble in BFOA [20]
Escherichia coli is a plasma member and a cell
wall which includes the cytoplasm and nucleoid.
The pili are assumed for the transformation of
genes to another Escherichia coli specifically for
the movement. The size of cell is between 1min
diameter and 2cm in length. As usually an
Escherichia coli is composed of 70% of water.
1)Chemotaxis: This process is a collaboration of
the locomotion of escherichia coli through the two
processes as namely as swim and tumble by using
flagella. The chemotaxis of bacteria foraging are
described as follows-
∝ (I + 1, P, J) =∝ (I, P, J) + Q(i′)∆ (i′)
√∆t (i′)∆ (i′)
(vi)
∆ represent the unit length in the random
directions.
2)Swarming:These are the crucial behaviors of
the motile species which involved in the bacteria
such as escherichia coli and the styphimurium. At
this place, the constant and most reliant patterns
are generated specifically in the nutrient region.
3)Reproduction:The bacteria that become dead
due to the less healthy when other bacteria are
healthier as compared to it. Then the bacteria
partitioned it into two bacteria which considered
at the same position. In this way, the size of
swarm being stable and constant. It also inclined
the process of discovering parameters.
4)Dispersal:In this step, some of the bacteria are
settled at random locations and contains a reduced
probability when the new placements are
introduced in the search space [21].
Fig.6. Flowchart of BFOA Process [22]
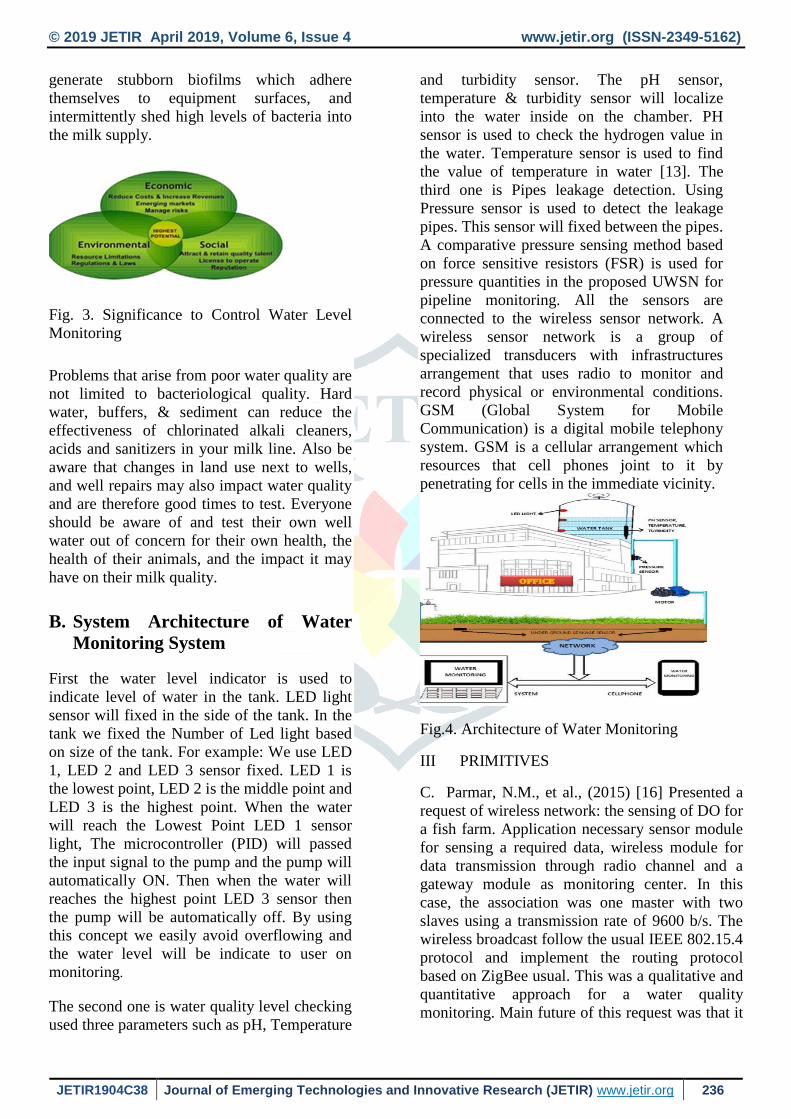
III. RESULT
In this section, we describe the results with novel
approach in water quality monitoring. In BFOA
algorithm has been implemented to reduce the
network failures and enhance the quality
parameters like as network sensitivity and many
more.
Fig.7. Data
The above figure shows the uploaded data in list box. The
data after clicking on the uploaded button which will be
received by the sensor nodes. The parameters like PH level,
nitrate level, chloride, fluoride etc. are taken.
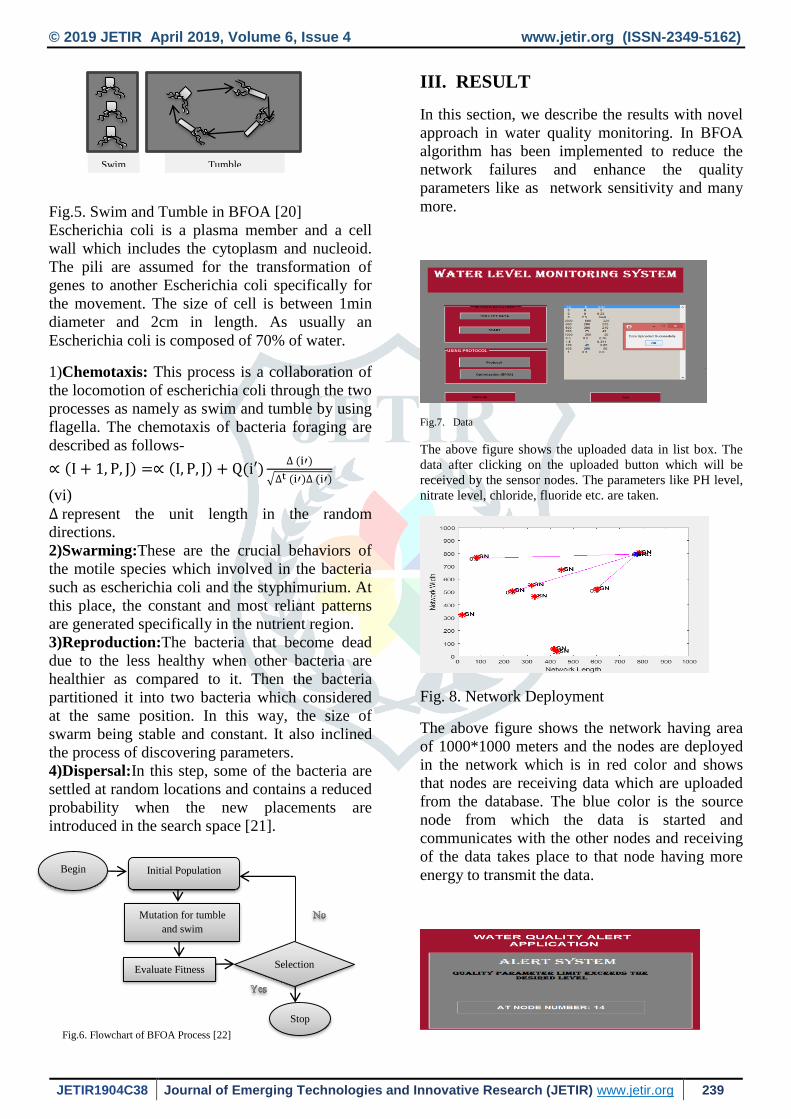
Fig. 8. Network Deployment
The above figure shows the network having area
of 1000*1000 meters and the nodes are deployed
in the network which is in red color and shows
that nodes are receiving data which are uploaded
from the database. The blue color is the source
node from which the data is started and
communicates with the other nodes and receiving
of the data takes place to that node having more
energy to transmit the data.
Swim Tumble
Begin Initial Population
Mutation for tumble
and swim
Evaluate Fitness Selection
Stop
© 2019 JETIR April 2019, Volume 6, Issue 4 www.jetir.org (ISSN-2349-5162)
JETIR1904C38 Journal of Emerging Technologies and Innovative Research (JETIR) www.jetir.org 240
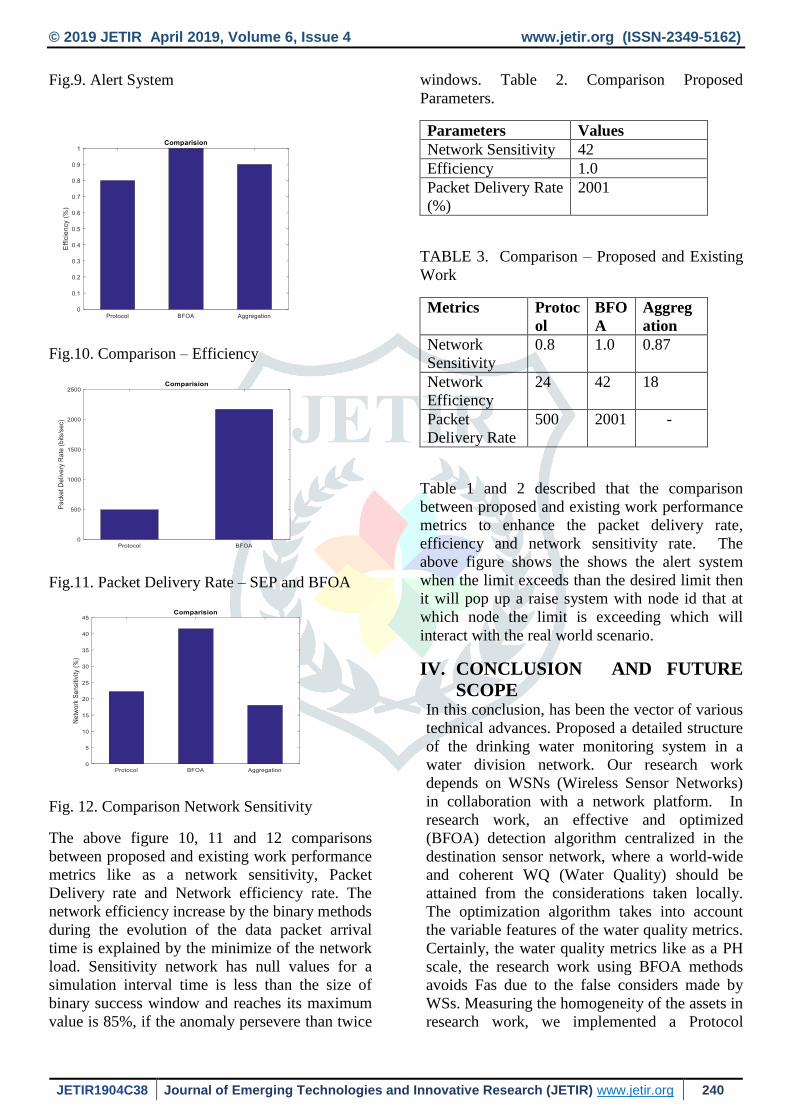
Fig.9. Alert System
Fig.10. Comparison – Efficiency
Fig.11. Packet Delivery Rate – SEP and BFOA
Fig. 12. Comparison Network Sensitivity
The above figure 10, 11 and 12 comparisons
between proposed and existing work performance
metrics like as a network sensitivity, Packet
Delivery rate and Network efficiency rate. The
network efficiency increase by the binary methods
during the evolution of the data packet arrival
time is explained by the minimize of the network
load. Sensitivity network has null values for a
simulation interval time is less than the size of
binary success window and reaches its maximum
value is 85%, if the anomaly persevere than twice
windows. Table 2. Comparison Proposed
Parameters.
Parameters Values
Network Sensitivity 42
Efficiency 1.0
Packet Delivery Rate
(%)
2001
TABLE 3. Comparison – Proposed and Existing
Work
Metrics Protoc
ol
BFO
A
Aggreg
ation
Network
Sensitivity
0.8 1.0 0.87
Network
Efficiency
24 42 18
Packet
Delivery Rate
500 2001 -
Table 1 and 2 described that the comparison
between proposed and existing work performance
metrics to enhance the packet delivery rate,
efficiency and network sensitivity rate. The
above figure shows the shows the alert system
when the limit exceeds than the desired limit then
it will pop up a raise system with node id that at
which node the limit is exceeding which will
interact with the real world scenario.
IV. CONCLUSION AND FUTURE
SCOPE In this conclusion, has been the vector of various
technical advances. Proposed a detailed structure
of the drinking water monitoring system in a
water division network. Our research work
depends on WSNs (Wireless Sensor Networks)
in collaboration with a network platform. In
research work, an effective and optimized
(BFOA) detection algorithm centralized in the
destination sensor network, where a world-wide
and coherent WQ (Water Quality) should be
attained from the considerations taken locally.
The optimization algorithm takes into account
the variable features of the water quality metrics.
Certainly, the water quality metrics like as a PH
scale, the research work using BFOA methods
avoids Fas due to the false considers made by
WSs. Measuring the homogeneity of the assets in
research work, we implemented a Protocol

© 2019 JETIR April 2019, Volume 6, Issue 4 www.jetir.org (ISSN-2349-5162)
JETIR1904C38 Journal of Emerging Technologies and Innovative Research (JETIR) www.jetir.org 241
(SEP), Aggregation and BFOA algorithm in
order to reduce the quantities of information
transmitted by the start nodes to the destination
node. In this approach to maximize the life-time
of the sources and reduces the network load. In
research work, improves the packet delivery rate
and network efficiency rate.
On the other hand, detection method is a reactive
method. It can’t anticipate the anomalies which
can act on the water quality. Our BFOA
algorithm re-groups only the same data packets. It
can use other coding techniques to reduce the
amount of data packet transmitted by the sources.
In upcoming work, to reduce the transmission
delay (ms) and enhance the throughput (%).
REFERENCES
[1] . Dziri Jalal et al., 2017 [34] Represented
that the initial steps in the development of
a drinking water quality monitoring
system. This system was based on a
wireless sensor network to detect and
locate in real time any change in water
quality, quantify its importance, evaluate
its consequences and determine the most
appropriate actions to be taken to limit its
effects. water. they propose a data
aggregation method in order to minimize
the energy consumption of the source
nodes and to reduce the network load.
[2] Afandie, W. N. E. A. W., Rahman, T. K.
A., & Zakaria, Z. (2016). Comparative
Analysis of Bacterial Foraging
Optimization Algorithm and Evolutionary
Programming for Load Shedding in Power
System. International Journal of
Simulation--Systems, Science &
Technology, 17(41).
[3] Barabde, M., & Danve, S. (2015). Real
time water quality monitoring
system. International Journal of Innovative
Research in Computer and
Communication Engineering, 3(6), 5064-
5069.
[4] Adamo, F., Attivissimo, F., Carducci, C.
G. C., & Lanzolla, A. M. L. (2015). A
smart sensor network for sea water quality
monitoring. IEEE Sensors Journal, 15(5),
2514-2522.
[5] Wiranto, G., Mambu, G. A., Hermida, I.
D. P., & Widodo, S. (2015, August).
Design of online data measurement and
automatic sampling system for continuous
water quality monitoring. In Mechatronics and
Automation (ICMA), 2015 IEEE
International Conference on (pp. 2331-
2335). IEEE.
[6] Parmar, N. M., & Goradia, R. S.
(2015)IEEE 802.15. 4 Based Water
Quality Monitoring System.
[7] P., & Georgakopoulos, D. (2014). Perera,
C., Zaslavsky, A., Christen, Sensing as a
service model for smart cities supported
by internet of things. Transactions on
Emerging Telecommunications
Technologies, 25, (81-93).
[8] Kumar, R. K., Mohan, M. C.,
Vengateshapandiyan, S., Kumar, M. M., &
Eswaran, R. (2014). Solar based advanced
water quality monitoring system using
wireless sensor network. International
Journal of Science, Engineering and
TechnologyResearch (IJSETR), 3(3), 385-
389.
[9] Jhankal, N. K., & Adhyaru, D. (2014).
Comparative analysis of bacterial foraging
optimization algorithm with simulated
annealing. Int. J. Sci. Res.(IJSR), 3(3), 10-
13
[10] Rao, T., Ling, Q., Yu, B., & Ji, H. (2014,
May). Estimate the densities of pollutions
in water quality monitoring systems based
on UV/vis spectrum. In Control and
Decision Conference (2014 CCDC), The
26th Chinese (pp. 2984-2989). IEEE.
[11] Kaskina, D., Bradshaw, R. A., James, A., Kho, Y.
H., & Kabiyeva, M. (2014, October). Developing
high resolution remote sensing technology into
an advanced knowledge management system to
monitor and assess water resources.
In Application of Information and
Communication Technologies (AICT), 2014
IEEE 8th International Conference on (pp. 1-6).
[12] Rao, A. S., Marshall, S., Gubbi, J.,
Palaniswami, M., Sinnott, R., & Pettigrovet,
V. (2013, August). Design of low-cost
autonomous water quality monitoring system.
In Advances in Computing, Communications
and Informatics (ICACCI), 2013 International
Conference on (pp. 14-19)
[13] Verma, S. (2012, November). Wireless
Sensor Network application for water
quality monitoring in India. In Computing
and Communication Systems (NCCCS),

© 2019 JETIR April 2019, Volume 6, Issue 4 www.jetir.org (ISSN-2349-5162)
JETIR1904C38 Journal of Emerging Technologies and Innovative Research (JETIR) www.jetir.org 242
2012 National Conference on (pp. 1-5).
IEEE.
[14] Cheng, P., & Wang, X. L. (2010, August).
The design and implementation of remote-
sensing water quality monitoring system
based on spot-5. In Geoscience and
Remote Sensing (IITA-GRS), 2010
Second IITA International Conference
on(Vol. 1, pp. 6-10). IEEE.
[15] Rasin, Z., & Abdullah, M. R. (2009).
Water quality monitoring system using
zigbee based wireless sensor
network. International Journal of
Engineering & Technology, 9(10), 24-28.
[16] Javanmard, M., Abbas, K. A., & Arvin, F.
(2009). A microcontroller-based
monitoring system for batch tea dryer. Journal of
Agricultural Science, 1(2), 101.
[17] Das, S., Biswas, A., Dasgupta, S., &
Abraham, A. (2009). Bacterial foraging
optimization algorithm: theoretical
foundations, analysis, and applications.
In Foundations of Computational
Intelligence Volume 3 (pp. 23-55).
Springer, Berlin, Heidelberg.
[18] O'Flyrm, B., Martinez, R., Cleary, J.,
Slater, C., Regan, F., Diamond, D., &
Murphy, H. (2007, October). SmartCoast:
a wireless sensor network for water quality
monitoring. In Local Computer Networks,
2007. LCN 2007. 32nd IEEE Conference
on (pp. 815-816). Ieee
[19] Raghavendra, C. S., Sivalingam, K. M., &
Znati, T. (Eds.). (2006). Wireless sensor
networks.
An Overview of the Water Environment.
Water Resource., 27, 33–36, in Chinese
[20] Lewis, F. L. (2004). Wireless sensor
networks. Smart environments:
technologies, protocols, and applications,
11-46.
[21] Smaragdakis, G., Matta, I., & Bestavros,
A. (2004). SEP: A stable election protocol
for clustered heterogeneous wireless
sensor networks. Boston University
Computer Science Department.
Copyright © 2022 FDOKUMEN