SMART-I²: A Spatial Multi-users Audio-visual Real Time Interactive Interface
21
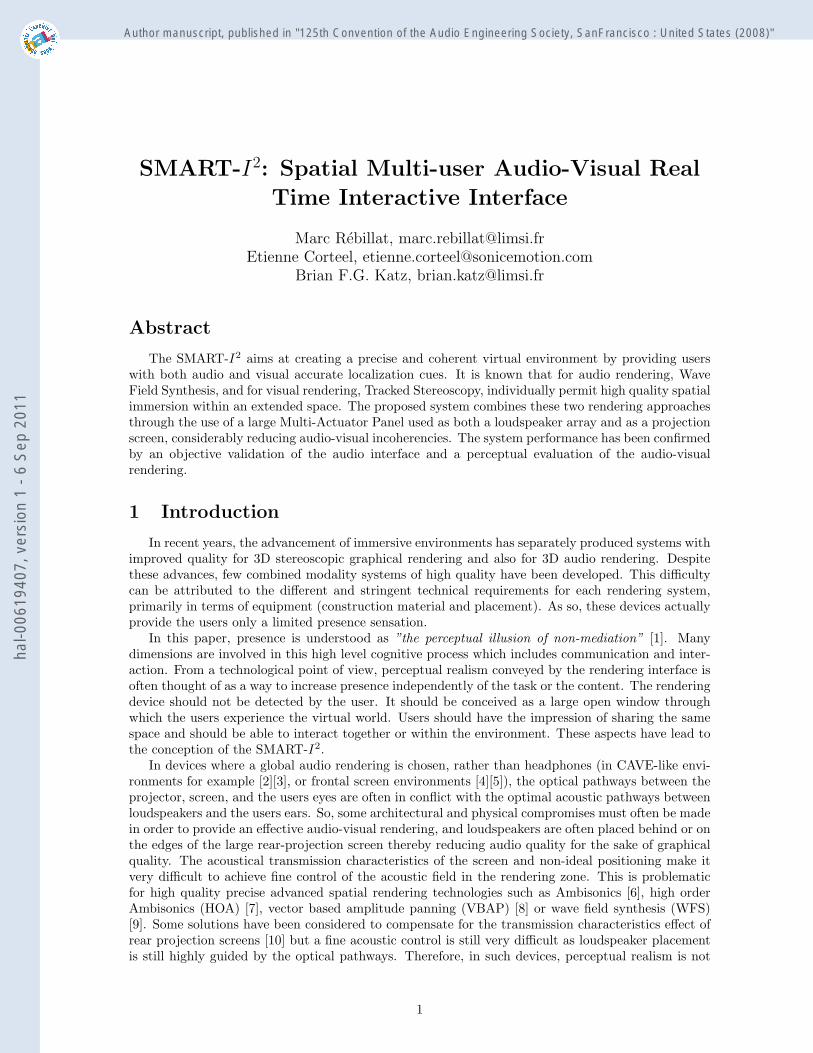
SMART-I 2 : Spatial Multi-user Audio-Visual Real Time Interactive Interface Marc R´ ebillat, [email protected] Etienne Corteel, [email protected] Brian F.G. Katz, [email protected] Abstract The SMART-I 2 aims at creating a precise and coherent virtual environment by providing users with both audio and visual accurate localization cues. It is known that for audio rendering, Wave Field Synthesis, and for visual rendering, Tracked Stereoscopy, individually permit high quality spatial immersion within an extended space. The proposed system combines these two rendering approaches through the use of a large Multi-Actuator Panel used as both a loudspeaker array and as a projection screen, considerably reducing audio-visual incoherencies. The system performance has been confirmed by an objective validation of the audio interface and a perceptual evaluation of the audio-visual rendering. 1 Introduction In recent years, the advancement of immersive environments has separately produced systems with improved quality for 3D stereoscopic graphical rendering and also for 3D audio rendering. Despite these advances, few combined modality systems of high quality have been developed. This difficulty can be attributed to the different and stringent technical requirements for each rendering system, primarily in terms of equipment (construction material and placement). As so, these devices actually provide the users only a limited presence sensation. In this paper, presence is understood as ”the perceptual illusion of non-mediation” [1]. Many dimensions are involved in this high level cognitive process which includes communication and inter- action. From a technological point of view, perceptual realism conveyed by the rendering interface is often thought of as a way to increase presence independently of the task or the content. The rendering device should not be detected by the user. It should be conceived as a large open window through which the users experience the virtual world. Users should have the impression of sharing the same space and should be able to interact together or within the environment. These aspects have lead to the conception of the SMART-I 2 . In devices where a global audio rendering is chosen, rather than headphones (in CAVE-like envi- ronments for example [2][3], or frontal screen environments [4][5]), the optical pathways between the projector, screen, and the users eyes are often in conflict with the optimal acoustic pathways between loudspeakers and the users ears. So, some architectural and physical compromises must often be made in order to provide an effective audio-visual rendering, and loudspeakers are often placed behind or on the edges of the large rear-projection screen thereby reducing audio quality for the sake of graphical quality. The acoustical transmission characteristics of the screen and non-ideal positioning make it very difficult to achieve fine control of the acoustic field in the rendering zone. This is problematic for high quality precise advanced spatial rendering technologies such as Ambisonics [6], high order Ambisonics (HOA) [7], vector based amplitude panning (VBAP) [8] or wave field synthesis (WFS) [9]. Some solutions have been considered to compensate for the transmission characteristics effect of rear projection screens [10] but a fine acoustic control is still very difficult as loudspeaker placement is still highly guided by the optical pathways. Therefore, in such devices, perceptual realism is not 1 hal-00619407, version 1 - 6 Sep 2011 Author manuscript, published in "125th Convention of the Audio Engineering Society, SanFrancisco : United States (2008)"
-
Upload
artsetmetiersparistech -
Category
Documents
-
view
0 -
download
0
Transcript of SMART-I²: A Spatial Multi-users Audio-visual Real Time Interactive Interface
SMART-I2: Spatial Multi-user Audio-Visual Real
Time Interactive Interface
Marc Rebillat, [email protected] Corteel, [email protected]
Brian F.G. Katz, [email protected]
Abstract
The SMART-I2 aims at creating a precise and coherent virtual environment by providing userswith both audio and visual accurate localization cues. It is known that for audio rendering, WaveField Synthesis, and for visual rendering, Tracked Stereoscopy, individually permit high quality spatialimmersion within an extended space. The proposed system combines these two rendering approachesthrough the use of a large Multi-Actuator Panel used as both a loudspeaker array and as a projectionscreen, considerably reducing audio-visual incoherencies. The system performance has been confirmedby an objective validation of the audio interface and a perceptual evaluation of the audio-visualrendering.
1 Introduction
In recent years, the advancement of immersive environments has separately produced systems withimproved quality for 3D stereoscopic graphical rendering and also for 3D audio rendering. Despitethese advances, few combined modality systems of high quality have been developed. This difficultycan be attributed to the different and stringent technical requirements for each rendering system,primarily in terms of equipment (construction material and placement). As so, these devices actuallyprovide the users only a limited presence sensation.
In this paper, presence is understood as ”the perceptual illusion of non-mediation” [1]. Manydimensions are involved in this high level cognitive process which includes communication and inter-action. From a technological point of view, perceptual realism conveyed by the rendering interface isoften thought of as a way to increase presence independently of the task or the content. The renderingdevice should not be detected by the user. It should be conceived as a large open window throughwhich the users experience the virtual world. Users should have the impression of sharing the samespace and should be able to interact together or within the environment. These aspects have lead tothe conception of the SMART-I2.
In devices where a global audio rendering is chosen, rather than headphones (in CAVE-like envi-ronments for example [2][3], or frontal screen environments [4][5]), the optical pathways between theprojector, screen, and the users eyes are often in conflict with the optimal acoustic pathways betweenloudspeakers and the users ears. So, some architectural and physical compromises must often be madein order to provide an effective audio-visual rendering, and loudspeakers are often placed behind or onthe edges of the large rear-projection screen thereby reducing audio quality for the sake of graphicalquality. The acoustical transmission characteristics of the screen and non-ideal positioning make itvery difficult to achieve fine control of the acoustic field in the rendering zone. This is problematicfor high quality precise advanced spatial rendering technologies such as Ambisonics [6], high orderAmbisonics (HOA) [7], vector based amplitude panning (VBAP) [8] or wave field synthesis (WFS)[9]. Some solutions have been considered to compensate for the transmission characteristics effect ofrear projection screens [10] but a fine acoustic control is still very difficult as loudspeaker placementis still highly guided by the optical pathways. Therefore, in such devices, perceptual realism is not
1
hal-0
0619
407,
ver
sion
1 -
6 Se
p 20
11Author manuscript, published in "125th Convention of the Audio Engineering Society, SanFrancisco : United States (2008)"
maximum.Another common way to reproduce spatial audio is binaural rendering over headphones using
the head-related transfer function (HRTF).[11] The quality of binaural rendering is highly linkedto the use of an individual HRTF rather than a non-individual HRTF. In addition, head trackingand a dedicated rendering engine are usually necessary for each user. The use of headphones canreduce the level of immersion and also communication and interactivity for multi-user systems. Thus,loudspeaker reproduction has certain advantages over headphones, and is the option chosen in thissystem.
This research study presents a novel design concept, the SMART-I2, which attempts to resolvethe problem of high quality immersive audio-visual rendering by rendering coherent audio and visualinformation. The sound rendering is realized using wave field synthesis technology (WFS) [9][12] whichrelies on physical based reproduction of sound fields within an extended listening area. The graphicalscene is rendered using tracked stereoscopy [13], which presents users with the correct rendered visualimage for each eye separately. Finally, these two technologies are combined together using two largeMulti-Actuator Panels [14][15] which act both as projection screens and as loudspeaker arrays.
In this paper, the SMART-I2 architecture is first described and technological choices are explained.The spatial audio-visual rendering of the SMART-I2 is then assessed with a combined objective andsubjective evaluation. The validation focuses on localization accuracy for both static and movingusers.
2 The SMART-I2 system
The SMART-I2 system is an advanced audio-visual interface which results from the scientificcollaboration of LIMSI-CNRS and sonic emotion. In this part, the key ideas of the system areexplained and the realized system is later presented.
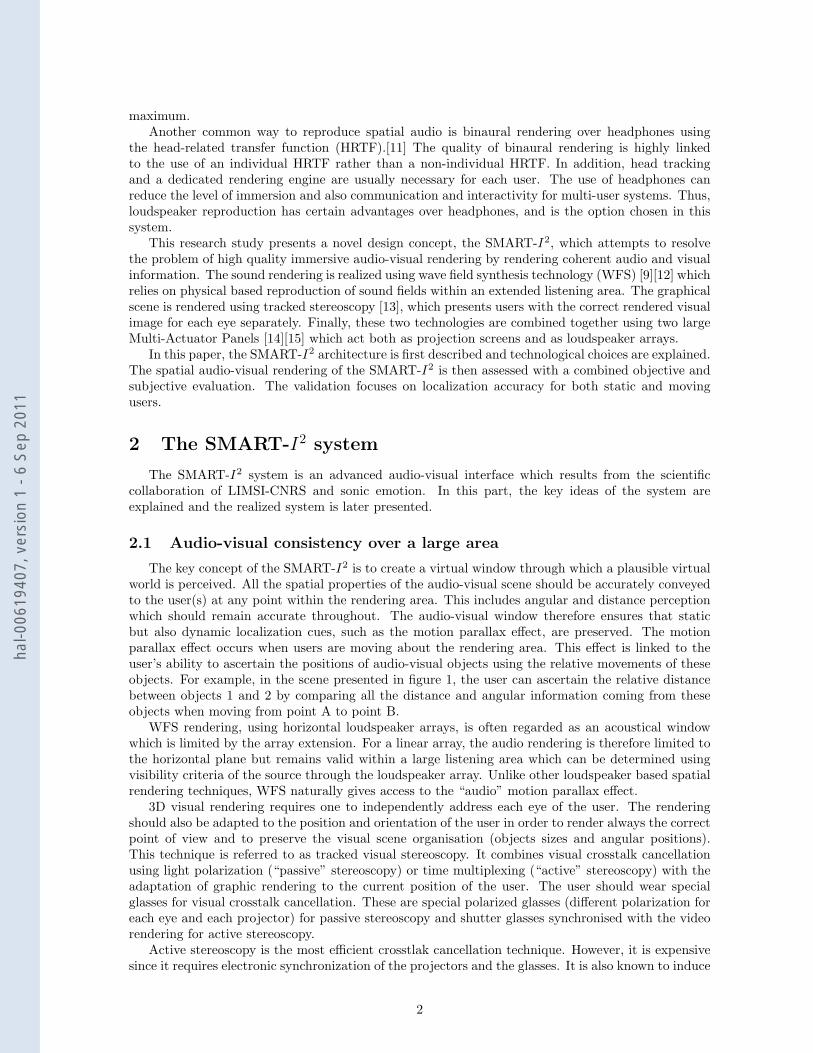
2.1 Audio-visual consistency over a large area
The key concept of the SMART-I2 is to create a virtual window through which a plausible virtualworld is perceived. All the spatial properties of the audio-visual scene should be accurately conveyedto the user(s) at any point within the rendering area. This includes angular and distance perceptionwhich should remain accurate throughout. The audio-visual window therefore ensures that staticbut also dynamic localization cues, such as the motion parallax effect, are preserved. The motionparallax effect occurs when users are moving about the rendering area. This effect is linked to theuser’s ability to ascertain the positions of audio-visual objects using the relative movements of theseobjects. For example, in the scene presented in figure 1, the user can ascertain the relative distancebetween objects 1 and 2 by comparing all the distance and angular information coming from theseobjects when moving from point A to point B.
WFS rendering, using horizontal loudspeaker arrays, is often regarded as an acoustical windowwhich is limited by the array extension. For a linear array, the audio rendering is therefore limited tothe horizontal plane but remains valid within a large listening area which can be determined usingvisibility criteria of the source through the loudspeaker array. Unlike other loudspeaker based spatialrendering techniques, WFS naturally gives access to the “audio” motion parallax effect.
3D visual rendering requires one to independently address each eye of the user. The renderingshould also be adapted to the position and orientation of the user in order to render always the correctpoint of view and to preserve the visual scene organisation (objects sizes and angular positions).This technique is referred to as tracked visual stereoscopy. It combines visual crosstalk cancellationusing light polarization (“passive” stereoscopy) or time multiplexing (“active” stereoscopy) with theadaptation of graphic rendering to the current position of the user. The user should wear specialglasses for visual crosstalk cancellation. These are special polarized glasses (different polarization foreach eye and each projector) for passive stereoscopy and shutter glasses synchronised with the videorendering for active stereoscopy.
Active stereoscopy is the most efficient crosstlak cancellation technique. However, it is expensivesince it requires electronic synchronization of the projectors and the glasses. It is also known to induce
2
hal-0
0619
407,
ver
sion
1 -
6 Se
p 20
11

Figure 1: Illustration of the motion parallax effect.
Figure 2: Overview of the SMART-I2.
visual fatigue which can be disturbing in the long run. Therefore, it was chosen to rely on “passive”stereoscopy. Both techniques could also be combined to increase the number of users. This is a topicfor further research.
WFS and tracked stereoscopy can both be thought as a perceptual window opening onto a virtualworld. They are thus coherent technological choices.
2.2 Overview of the system
The SMART-I2 project was conceived as a large audio-visual window where the screens would alsoact as loudspeakers using WFS rendering. The installation of the system at LIMSI-CNRS is shown infigure 3. Two large screens form a corner so that the system presents a wide angular opening and alarge listening area (2.5 m × 2.5 m). This corner installation poses less constraints, avoiding many ofthe common practical and acoustical concerns of a partly closed box as used in large CAVE systems.The walls and ceiling of the current installation are mostly covered with 2” acoustsics foam to limitreflections. For the current validation study, only one screen is mounted (see figure 2).
2.3 Large MAP as a projection screen and loudspeakers array
MAP loudspeakers are derived from DML technologies. The panels are constructed of a light andstiff material on which multiple actuators are attached. Each actuator is independently driven. Amultichannel loudspeaker is thus realized with a single unique physical structure.
Thanks to their low visual profile, multiple MAP loudspeakers can provide seamless integrationof tens to hundreds of loudspeakers in an existing environment. Due to the excitation nature of the
3
hal-0
0619
407,
ver
sion
1 -
6 Se
p 20
11

Figure 3: Schematic view of the SMART-I2 installation.
Figure 4: View of the back of the SMART-I2 MAP.
panel, and their generally large size, displacement distances are very small and do not disturb 2D oreven 3D video projection on the surface of the panel.
2.3.1 Design of the panels
The MAP used for the SMART-I2 is a large honeycomb panel, 2 m × 2.66 m. The dimensions ofthe panel present a classical 4/3 ratio between height and width suitable for video projection. Twelveexciters are attached to the rear of the panel. They are located on a horizontal line every 20 cm. Suchspacing corresponds to an aliasing frequency of about 1500 Hz accounting for the loudspeaker arraysize and the extension of the listening area.[17] This aliasing frequency assures an efficient spatialaudio rendering. Some strategies are available to further raise the aliasing frequency.[18]
The front face of the panel has been treated with a metallic paint designed to maintain lightpolarization thus allowing for the use of passive stereoscopic projection. The panel is mounted in analuminum frame such that the exciter array is at a height of 1.5 m (see figure 4). This positioningensures that the horizontal plane where audio reproduction is correct corresponds to typical ear heightfor the majority of users.
4
hal-0
0619
407,
ver
sion
1 -
6 Se
p 20
11

Figure 5: Frequency response of the large MAP used for SMART-I2.
2.3.2 Validity of the MAP for WFS
It has been shown that MAPs can be used for WFS rendering.[14][15] However, panels consideredin previous studies were significantly smaller (40 cm × 60 cm or 133 cm × 67 cm) than those usedhere. Pueo et al. recently studied larger panels [16], showing measurements of reproduced sound fieldsusing a 2.44 m wide and 1.44 m high panel. These objective results tend to confirm the potential useof such large panels for WFS, which should nevertheless be confirmed by further perceptual studies.
The typical frequency response of a MAP is not as optimized as electrodynamic loudspeakers,and a large MAP is not expected to have the same radiation as smaller scale MAP loudspeakers. Infigure 5, the frequency response of the MAP designed for the SMART-I2 is given for a central exciter,measured at 60 cm in front of the panel on-axis and at 30°. It can be seen the global frequencyresponse is reasonably flat (±5 dB between 100 Hz and 15 kHz). The frequency responses measuredon axis and at 30° off axis are similar. The level is somewhat reduced below 750 Hz by about 3 dB at30° as compared to on-axis. A full study, including directivity patterns, is a topic for future research.
The frequency response of the large MAP seems appropriate for WFS rendering. In this study,only a naive equalization method is used which compensates for the global radiated response of theloudspeaker array (individual equalization, [12]). Advanced multichannel equlization techniques willbe employed in further studies.
2.4 Rendering architecture of the system
The architecture of the SMART-I2 is composed of three rendering components:
� Virtual Choreographer (VirChor): An open source real-time 3D graphics engine that relies onan XML-based definition of 3D scenes with graphic and sonic components.[21][22]
� The WFS Engine: A real-time audio engine dedicated to low latency (less than 6 ms) WFSrendering which realizes the real-time filtering of up to 24 input channels (virtual sources) to24 output channels (every exciter of the two MAPs).
� Max/MSP : A real-time audio analysis/synthesis engine using a graphical programming envi-ronment that provides user interface, timing, and communications.[23]
The audio visual scene description is based on the “Scene Modeler” architecture [24], which is a genericpackage for virtual audio-visual interactive real-time environment creation using both Max/MSP andVirChor. The Model-View-Controller organisation of the system [25] is depicted in figure 6.
For real-time rendering, two separated computers are used. On the main machine, Max/MSPand VirChor are running simultaneously. Virchor manages the virtual scene and graphical rendering.Max/MSP receives scene information from VirChor and is responsible for generating the audio content
5
hal-0
0619
407,
ver
sion
1 -
6 Se
p 20
11

Figure 6: Model-View-Controller organisation of the SMART-I2.
of the scene. Audio channels are sent to the WFS engine which creates the driving signals for theexciters.
All rendering components are connected on a network which transmits the scene description (po-sition of audio-visual objects, position/orientation of users provided by tracking devices, interactionparameters, basic services: start, stop rendering, shutdown machines...). This information is used toperform real-time updates of both the audio and graphic rendering, making the system fully interac-tive.
3 Evaluation of the SMART-I2 spatial rendering
In this section, we focus on the evaluation of the spatial rendering quality of the SMART-I2
interface. The evaluation combines an objective analysis of the binaural signals at the user’s ear anda subjective analysis based on listening tests.
3.1 Presentation of objective analysis
The objective analysis presented here is similar to an earlier work by Sanson, Corteel and Warusfel.[19]Sanson et al. proposed a combined objective and subjective analysis of localization accuracy in WFSusing individual HRTFs to binaurally render simulated virtual WFS configurations over headphones.
3.1.1 Method
The method used here consists in estimating the localization accuracy of a given loudspeakerbased spatial rendering technique using measured or simulated binaural impulse responses.
This method is composed of five steps illustrated in figure 7:
1. Binaural measurement of a dummy head in an anechoic chamber for a large number of positions(typically every 5° in both azimuth and elevation).
2. Binaural impulse responses on site measurement or estimation (from anechoic binaural mea-surements [19]) at given listening positions.
3. Estimation of “synthesized” binaural impulse responses for a given virtual source by summingthe respective contribution of each array transducer.
4. Computation of localization cues (Interaural Time Differences (ITD) and Interaural Level Dif-ferences (ILD)) for both “ideal” and “synthesized” binaural impulse responses in auditory bands(40 ERB bands between 100 Hz and 20 kHz).1
1For a complete description of the ITD and the ILD extraction process, please refer to [19]
6
hal-0
0619
407,
ver
sion
1 -
6 Se
p 20
11
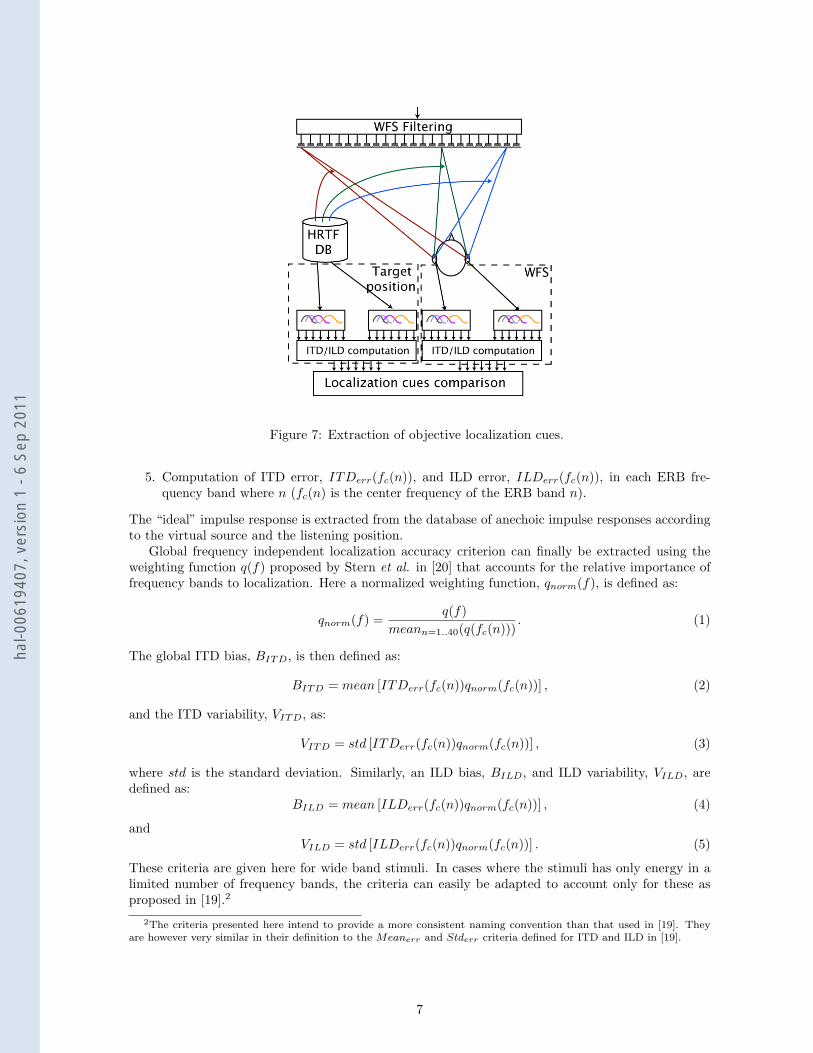
Figure 7: Extraction of objective localization cues.
5. Computation of ITD error, ITDerr(fc(n)), and ILD error, ILDerr(fc(n)), in each ERB fre-quency band where n (fc(n) is the center frequency of the ERB band n).
The “ideal” impulse response is extracted from the database of anechoic impulse responses accordingto the virtual source and the listening position.
Global frequency independent localization accuracy criterion can finally be extracted using theweighting function q(f) proposed by Stern et al. in [20] that accounts for the relative importance offrequency bands to localization. Here a normalized weighting function, qnorm(f), is defined as:
qnorm(f) =q(f)
meann=1..40(q(fc(n))). (1)
The global ITD bias, BITD, is then defined as:
BITD = mean [ITDerr(fc(n))qnorm(fc(n))] , (2)
and the ITD variability, VITD, as:
VITD = std [ITDerr(fc(n))qnorm(fc(n))] , (3)
where std is the standard deviation. Similarly, an ILD bias, BILD, and ILD variability, VILD, aredefined as:
BILD = mean [ILDerr(fc(n))qnorm(fc(n))] , (4)
andVILD = std [ILDerr(fc(n))qnorm(fc(n))] . (5)
These criteria are given here for wide band stimuli. In cases where the stimuli has only energy in alimited number of frequency bands, the criteria can easily be adapted to account only for these asproposed in [19].2
2The criteria presented here intend to provide a more consistent naming convention than that used in [19]. Theyare however very similar in their definition to the Meanerr and Stderr criteria defined for ITD and ILD in [19].
7
hal-0
0619
407,
ver
sion
1 -
6 Se
p 20
11

3.1.2 Interpretation of the objective localization criteria
The bias measures BITD and BILD indicate the average offset of the conveyed ITD and ILDrespectively, compared to the reference (anechoic) ITD and ILD respectively, at the target position.It might be interpreted as an indication of a potential perceptual shift in azimuth due to distortedlocalization cues conveyed by the considered reproduction setup. The suggested shift would be to theright for positive values or to the left for negative values. The variability measures VITD and VILD
are an indication of the consistency of the localization cues among the frequency bands. It mightthus be considered as an indication of the locatedness of the synthesized virtual source.
In [19], Sanson et al. show that the abolute localization bias for WFS does not typically exceed5° independently of the loudspeaker spacing (15 cm or 30 cm in this study) considering large bandstimuli covering the entire audible frequency range (white noise) and virtual sources located behind theloudspeaker array. The absolute localization bias typically increased from 7° to 10° for high-passednoises with cutoff frequencies of 750 Hz, 1500 Hz, and 3000 Hz. The associated analysis showedthat, in some cases, the ITD and ILD errors where indicating conflicting directions which could beattributed to the finite length of the loudspeaker array. Then, in most of these cases, the ILD cueswere dominating which may be due to the frequency content of the employed stimuli (high-passedwhite noise) and possibly the large variability of the ITD (typically above 0.3 ms). Only in caseswhere the ILD error is low (typically below 1 dB), the ITD was the dominant cue (4° localizationbias for a target at +25°, BITD = 0.05 ms and VITD = 0.15 ms).
It should be clear, however, that the objective criteria presented here are meant as comparisonindicators to provide hints about the differences observed between situations. The localization modelis rather naive and does not pretend to provide an absolute predictor of localization.
3.2 Presentation of the evaluation
A joint subjective/objective evaluation of the spatial audio rendering of the SMART-I2 was con-ducted to evaluate its consistency with 3D graphics rendering.
Two perceptual experiments were carried out:
1. A traditional azimuth localization task where stationary subjects have to identify which of aseries of visual object positioned on an arc corresponds to the position of a hear sound source.
2. A spatial exploration task which focuses on the evaluation of the parallax effect rendering inwhich a series of visual object are positioned on a line perpendicular to the screen and subjectsare instructed to wander about the experimental area to identify which of them is the source ofthe sound.
In parallel to these experiments, individual exciters of the SMART-I2 were measured in the exper-imental area using a dummy head (Neumann KU-100). Figure 8 presents a top view the positionof the virtual sources for each experiment and the positions at which the dummy head was located.The dummy head was positioned at 36 different locations on a regular grid, grid spacing of 30 cm inboth X and Y , so as to cover the entire experimental area in which subjects could move during theexperiments.
Bias and variability criteria are computed for all measured listening positions and virtual sourcesused in the subjective experiments. The artificial head was always facing the screen, orientatedtowards the Y axis of figure 8.
These criteria are also computed for a virtual WFS setup composed of 12 ideal omnidirectionalloudspeakers in an anechoic environment. This simulates an “ideal” WFS setup using loudspeakersat the same position as the exciters in the SMART-I2 based on previous anechoic measurements ofthe dummy head. As such, our results can be compared with those of Sanson et al. [19] and anyobserved innaccuracies could be attributed either to known WFS deficiencies (diffraction, aliasing) orto the specific radiation characteristics of the large MAP.
The subjective experiment is organised in 3 parts performed during one 40 minute session:
1. The test scene.
8
hal-0
0619
407,
ver
sion
1 -
6 Se
p 20
11

Figure 8: Top view of the installation, position of screen, audio target sources for subjective experi-ments and measurement points spanning the test experimental area.
Figure 9: Introductory scene.
2. The azimuth localization task.
3. The parallax effect validation task.
Fourteen subjects (9 male and 5 female) ranging from 22 to 53 years old participated in the experiment.No subject was visually or auditory impaired. For half of the subjects, the parallax effect validationtask was performed before the azimuth localization task in order to evaluate the influence of learningor habituation on the results of either task. Analysis confirmed that there was no significant effecton the results due to task order. The introductory scene contained three virtual visual loudspeakersplaced on a neutral background (see figure 9). Only one, indicated by the orange cursor above, isactivate and plays music. The subject can choose which loudspeaker is active using a Wiimote. Thesubject is also free to move within the rendering area to get accustomed to tracked stereoscopy andWFS. During this introductory scene, the stereoscopic rendering parameters were adjusted to theindividual subject.
9
hal-0
0619
407,
ver
sion
1 -
6 Se
p 20
11

Figure 10: The audio-visual scene for azimuth localization accuracy. The 7 potential acoustic targetpositions are indicated here.
4 Azimuth Localization Evaluation
4.1 Experimental Protocol
The goal of this experiment is to evaluate the localization accuracy of the spatial audio renderingof the SMART-I2. The audio-visual scene contains 17 virtual visual loudspeakers distributed on anarc and at 4 m from the audio-visual origin (see figure 10). Virtual loudspeakers are separated by 3°which provides a 48° angular aperture.
The position of the visual objects has been chosen to be smaller or equal to the human audioazimuth resolution (i.e. 3-4°, see [26]). Moreover, all visual objects are similar. This creates multiplevisual distractors that limit bias due to audio-visual integration, the so-called ventriloquism effect[27].
A single white noise burst of 150 ms with 10 ms onset and offset (Hanning window) was presentedat nominal level of 68 dBA from one of the 7 target sources, indicated in figure 10 (background noiselevel at subject position was 40 dBA). The subject’s task was to indicate from which of the 17 visualobjects the sound has been emitted. The subject had no prior knowledge of possible target locations.
At the beginning of the experiment, the subject was positioned at the starting point (see 3), andinstructed to remain there. There were 15 repetitions of the 7 potential positions corresponding to atotal number of 105 trials. At the beginning of each trial, a position is randomly picked. Each trialis organized in the following way:
1. The subject indicates that he is ready by pressing a button.
2. His position and head orientation are checked with the tracking engine.
3. If the subject is ready and his head orientation is correct, the sound stimulus is played once.
4. A visual selector appears (cf. figure 11), and the subject indicates the perceived location of thesound source by moving the cursor on top of the corresponding visual object.
4.2 Results of the subjective evaluation
Each trial was performed in a mean time of 5.8± 3.8 sec. Angles are given clockwise. A Lillieforstest rejected the null hypothesis that the empirical distribution (result values) follows a normal
10
hal-0
0619
407,
ver
sion
1 -
6 Se
p 20
11
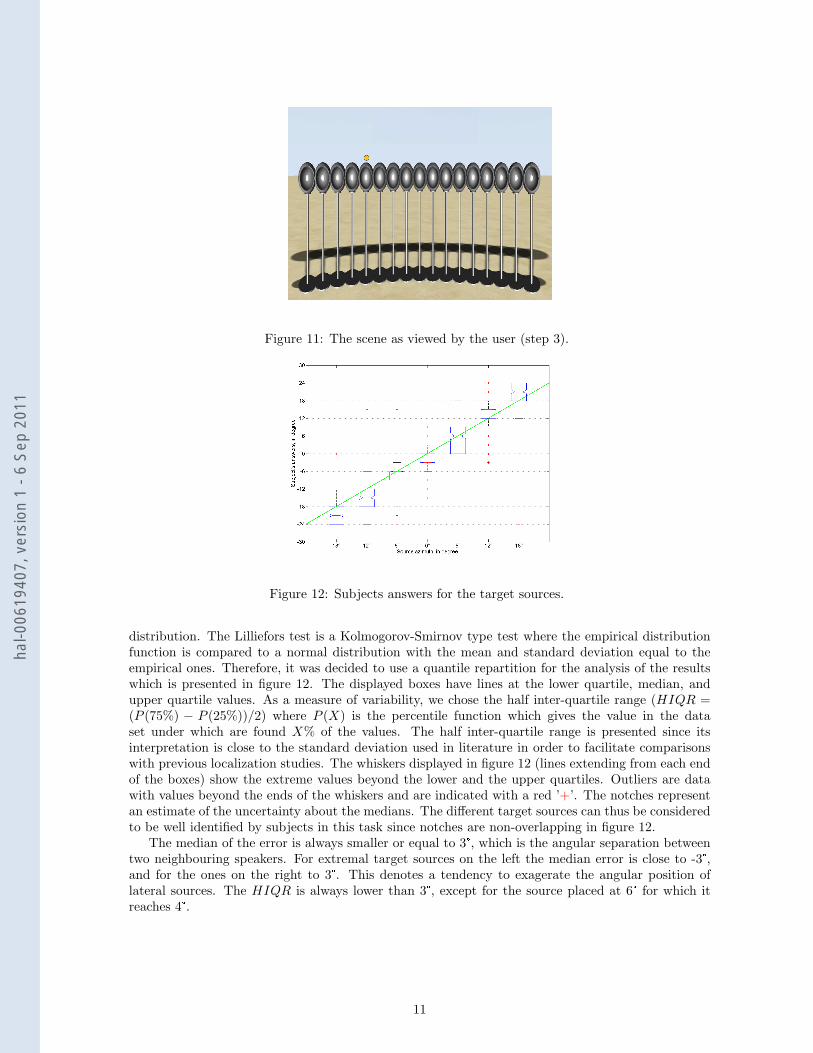
Figure 11: The scene as viewed by the user (step 3).
Figure 12: Subjects answers for the target sources.
distribution. The Lilliefors test is a Kolmogorov-Smirnov type test where the empirical distributionfunction is compared to a normal distribution with the mean and standard deviation equal to theempirical ones. Therefore, it was decided to use a quantile repartition for the analysis of the resultswhich is presented in figure 12. The displayed boxes have lines at the lower quartile, median, andupper quartile values. As a measure of variability, we chose the half inter-quartile range (HIQR =(P (75%) − P (25%))/2) where P (X) is the percentile function which gives the value in the dataset under which are found X% of the values. The half inter-quartile range is presented since itsinterpretation is close to the standard deviation used in literature in order to facilitate comparisonswith previous localization studies. The whiskers displayed in figure 12 (lines extending from each endof the boxes) show the extreme values beyond the lower and the upper quartiles. Outliers are datawith values beyond the ends of the whiskers and are indicated with a red ’+’. The notches representan estimate of the uncertainty about the medians. The different target sources can thus be consideredto be well identified by subjects in this task since notches are non-overlapping in figure 12.
The median of the error is always smaller or equal to 3°, which is the angular separation betweentwo neighbouring speakers. For extremal target sources on the left the median error is close to -3°,and for the ones on the right to 3°. This denotes a tendency to exagerate the angular position oflateral sources. The HIQR is always lower than 3°, except for the source placed at 6° for which itreaches 4°.
11
hal-0
0619
407,
ver
sion
1 -
6 Se
p 20
11
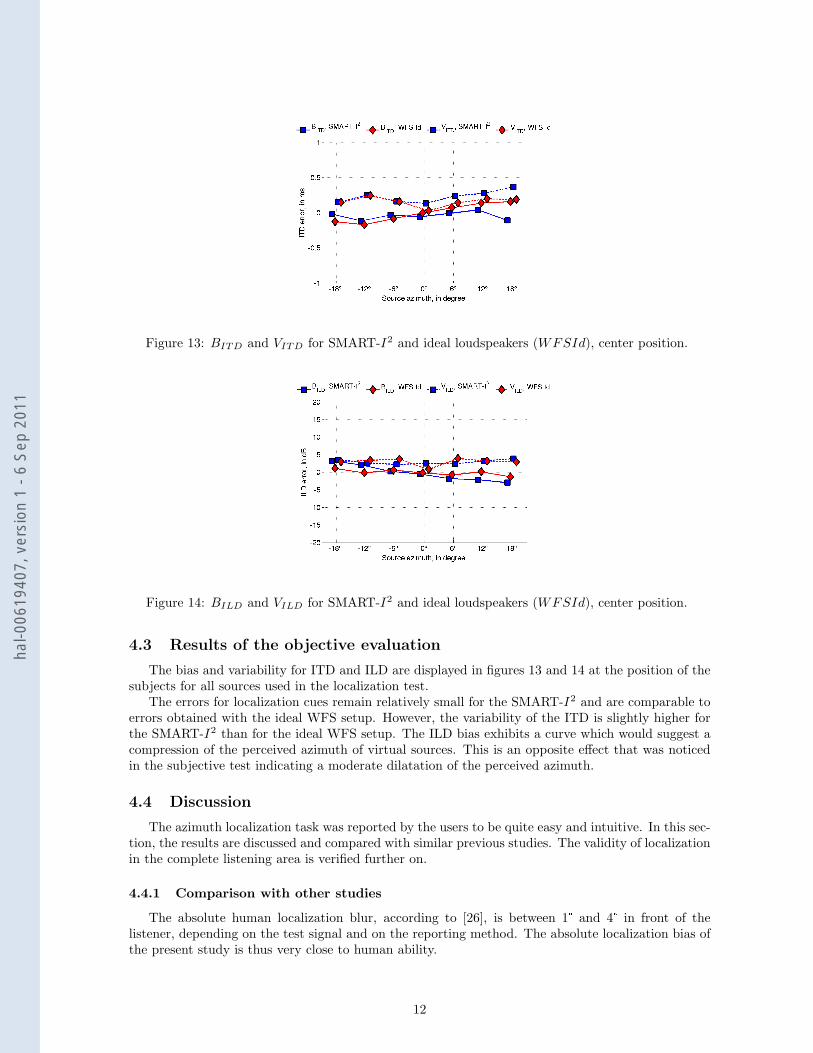
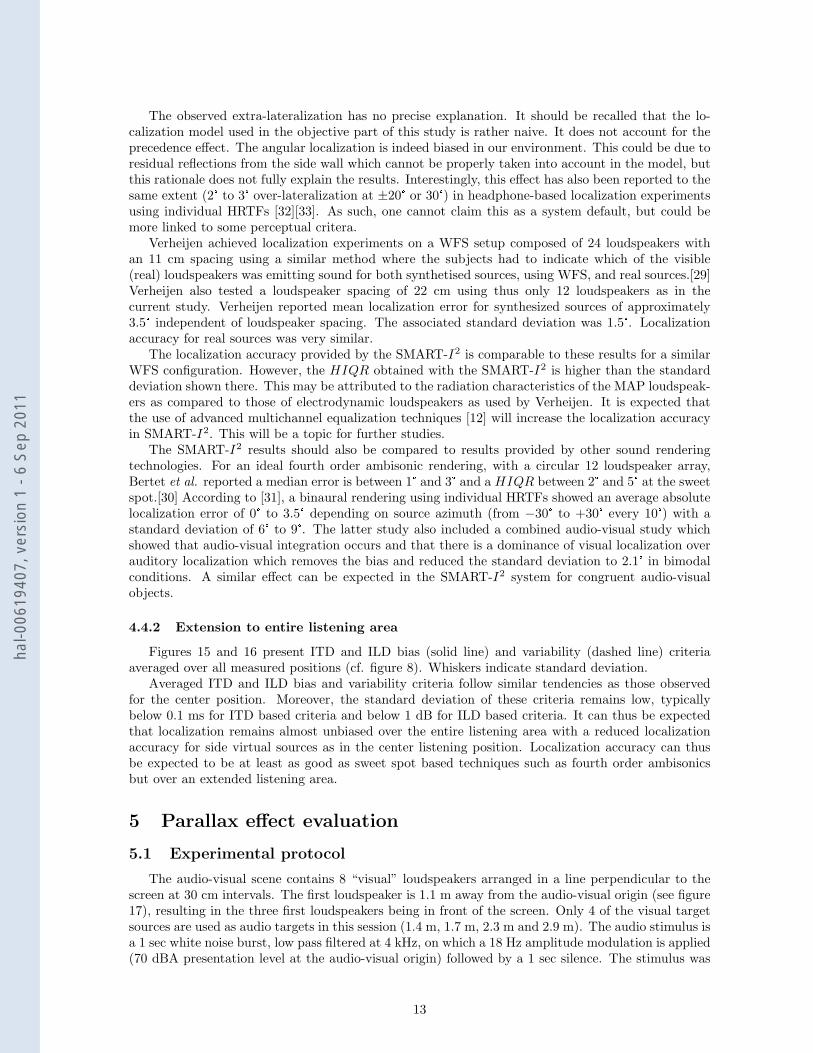
Figure 13: BITD and VITD for SMART-I2 and ideal loudspeakers (WFSId), center position.
Figure 14: BILD and VILD for SMART-I2 and ideal loudspeakers (WFSId), center position.
4.3 Results of the objective evaluation
The bias and variability for ITD and ILD are displayed in figures 13 and 14 at the position of thesubjects for all sources used in the localization test.
The errors for localization cues remain relatively small for the SMART-I2 and are comparable toerrors obtained with the ideal WFS setup. However, the variability of the ITD is slightly higher forthe SMART-I2 than for the ideal WFS setup. The ILD bias exhibits a curve which would suggest acompression of the perceived azimuth of virtual sources. This is an opposite effect that was noticedin the subjective test indicating a moderate dilatation of the perceived azimuth.
4.4 Discussion
The azimuth localization task was reported by the users to be quite easy and intuitive. In this sec-tion, the results are discussed and compared with similar previous studies. The validity of localizationin the complete listening area is verified further on.
4.4.1 Comparison with other studies
The absolute human localization blur, according to [26], is between 1° and 4° in front of thelistener, depending on the test signal and on the reporting method. The absolute localization bias ofthe present study is thus very close to human ability.
12
hal-0
0619
407,
ver
sion
1 -
6 Se
p 20
11
The observed extra-lateralization has no precise explanation. It should be recalled that the lo-calization model used in the objective part of this study is rather naive. It does not account for theprecedence effect. The angular localization is indeed biased in our environment. This could be due toresidual reflections from the side wall which cannot be properly taken into account in the model, butthis rationale does not fully explain the results. Interestingly, this effect has also been reported to thesame extent (2° to 3° over-lateralization at ±20° or 30°) in headphone-based localization experimentsusing individual HRTFs [32][33]. As such, one cannot claim this as a system default, but could bemore linked to some perceptual critera.
Verheijen achieved localization experiments on a WFS setup composed of 24 loudspeakers withan 11 cm spacing using a similar method where the subjects had to indicate which of the visible(real) loudspeakers was emitting sound for both synthetised sources, using WFS, and real sources.[29]Verheijen also tested a loudspeaker spacing of 22 cm using thus only 12 loudspeakers as in thecurrent study. Verheijen reported mean localization error for synthesized sources of approximately3.5° independent of loudspeaker spacing. The associated standard deviation was 1.5°. Localizationaccuracy for real sources was very similar.
The localization accuracy provided by the SMART-I2 is comparable to these results for a similarWFS configuration. However, the HIQR obtained with the SMART-I2 is higher than the standarddeviation shown there. This may be attributed to the radiation characteristics of the MAP loudspeak-ers as compared to those of electrodynamic loudspeakers as used by Verheijen. It is expected thatthe use of advanced multichannel equalization techniques [12] will increase the localization accuracyin SMART-I2. This will be a topic for further studies.
The SMART-I2 results should also be compared to results provided by other sound renderingtechnologies. For an ideal fourth order ambisonic rendering, with a circular 12 loudspeaker array,Bertet et al. reported a median error is between 1° and 3° and a HIQR between 2° and 5° at the sweetspot.[30] According to [31], a binaural rendering using individual HRTFs showed an average absolutelocalization error of 0° to 3.5° depending on source azimuth (from −30° to +30° every 10°) with astandard deviation of 6° to 9°. The latter study also included a combined audio-visual study whichshowed that audio-visual integration occurs and that there is a dominance of visual localization overauditory localization which removes the bias and reduced the standard deviation to 2.1° in bimodalconditions. A similar effect can be expected in the SMART-I2 system for congruent audio-visualobjects.
4.4.2 Extension to entire listening area
Figures 15 and 16 present ITD and ILD bias (solid line) and variability (dashed line) criteriaaveraged over all measured positions (cf. figure 8). Whiskers indicate standard deviation.
Averaged ITD and ILD bias and variability criteria follow similar tendencies as those observedfor the center position. Moreover, the standard deviation of these criteria remains low, typicallybelow 0.1 ms for ITD based criteria and below 1 dB for ILD based criteria. It can thus be expectedthat localization remains almost unbiased over the entire listening area with a reduced localizationaccuracy for side virtual sources as in the center listening position. Localization accuracy can thusbe expected to be at least as good as sweet spot based techniques such as fourth order ambisonicsbut over an extended listening area.
5 Parallax effect evaluation
5.1 Experimental protocol
The audio-visual scene contains 8 “visual” loudspeakers arranged in a line perpendicular to thescreen at 30 cm intervals. The first loudspeaker is 1.1 m away from the audio-visual origin (see figure17), resulting in the three first loudspeakers being in front of the screen. Only 4 of the visual targetsources are used as audio targets in this session (1.4 m, 1.7 m, 2.3 m and 2.9 m). The audio stimulus isa 1 sec white noise burst, low pass filtered at 4 kHz, on which a 18 Hz amplitude modulation is applied(70 dBA presentation level at the audio-visual origin) followed by a 1 sec silence. The stimulus was
13
hal-0
0619
407,
ver
sion
1 -
6 Se
p 20
11
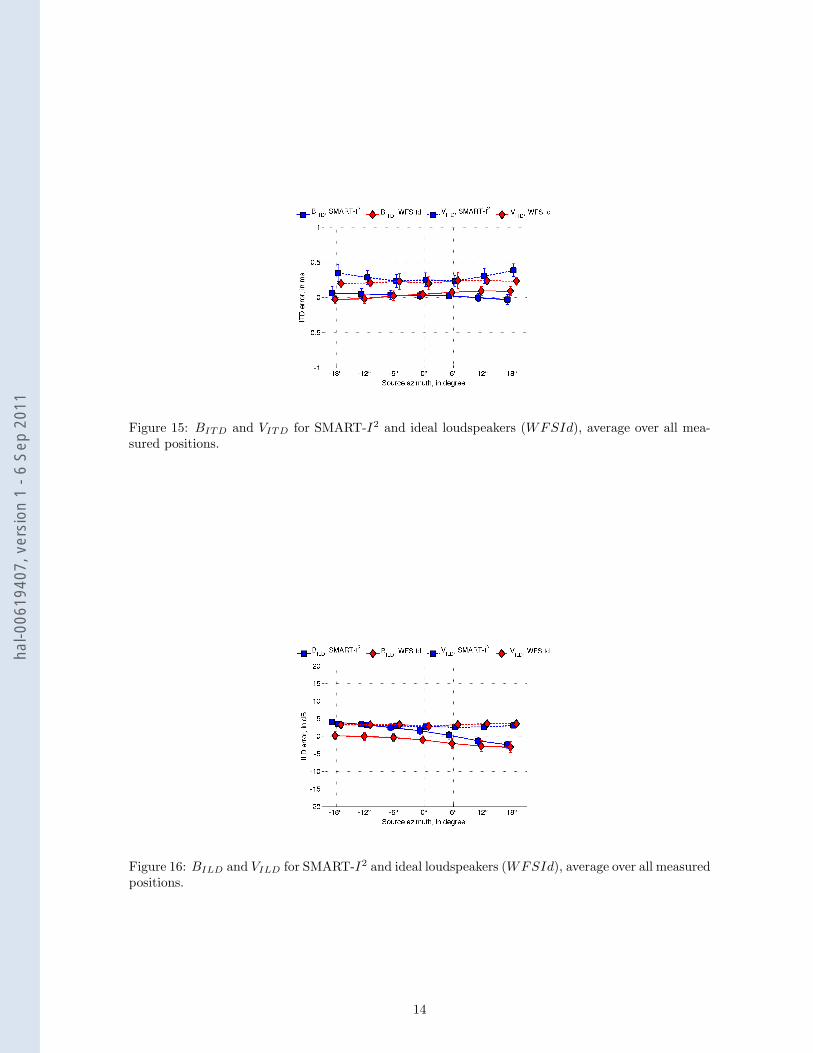
Figure 15: BITD and VITD for SMART-I2 and ideal loudspeakers (WFSId), average over all mea-sured positions.
Figure 16: BILD and VILD for SMART-I2 and ideal loudspeakers (WFSId), average over all measuredpositions.
14
hal-0
0619
407,
ver
sion
1 -
6 Se
p 20
11

Figure 17: The audio-visual scene for parallax effect evaluation in the SMART-I2.
played continuously until the subjects made their selection. The sound levels of the different sourceswere chosen in order to have the same effective level at the audio-visual origin. Parallax was thusthe only available cue to the subjects for distance estimation. There were 10 repetitions of each ofthe 4 target positions corresponding to a total number of 40 trials. In this experiment, subjects wereinstructed to move about within the defined experimental area (see figure 3). Each trial begins withthe user located at the starting point. Subjects are instructed to move slowly from this point tothe right of the listening area. The experimental procedure was the same as previously described.Subject position was checked before the beginning of the trial but not the head orientation.
5.2 Results of the subjective evaluation
The results for parallax evaluation are presented in figures 18 and 19 in the same manner than theprevious results. The average response time for each trial is 23± 13 sec with little variation betweensource positions. In figure 18, the different data sets corresponding to the target sources are not clearlyseparated. The second source (1.7 m: focused source) is perceived to be at the relative position ofthe third source (2.3 m: source behind the screen). The two other sources are well identified. TheHIQR in meters can be seen in figure 18. It is minimum for the closest source (1.4 m) where itreaches 0.15 m. The HIQR is 0.45 m for the source at 1.7 m, and approximately 0.3 m for the twoothers.
Figure 19 presents the median error and the HIQR converted into degrees as perceived at theextreme right listening position (x = 1.5 m, y = 0 m) which is the end of the path proposed inthe instructions. This is the position in the experimental area (cf. figure 3) at which there is themaximum angular difference between visual objects. Therefore, this is the position where the subjectscould most easily perform the required task.
Figure 19 shows that the median error is positive for the two first focused sources, null for thethird one, and negative for the last one. This indicated that the two closest sources are biased tothe right (further distance), the third source (at 2.3 m) is accurately localized whereas the last one isperceived too much to the left (closer to the screen location). The HIQR is close to 4° for all sourceswhich is similar to the results of the first experiment. The estimation of degrees at this positionprovides an explaination for the large variation of HIQR observed in figure 18.
15
hal-0
0619
407,
ver
sion
1 -
6 Se
p 20
11
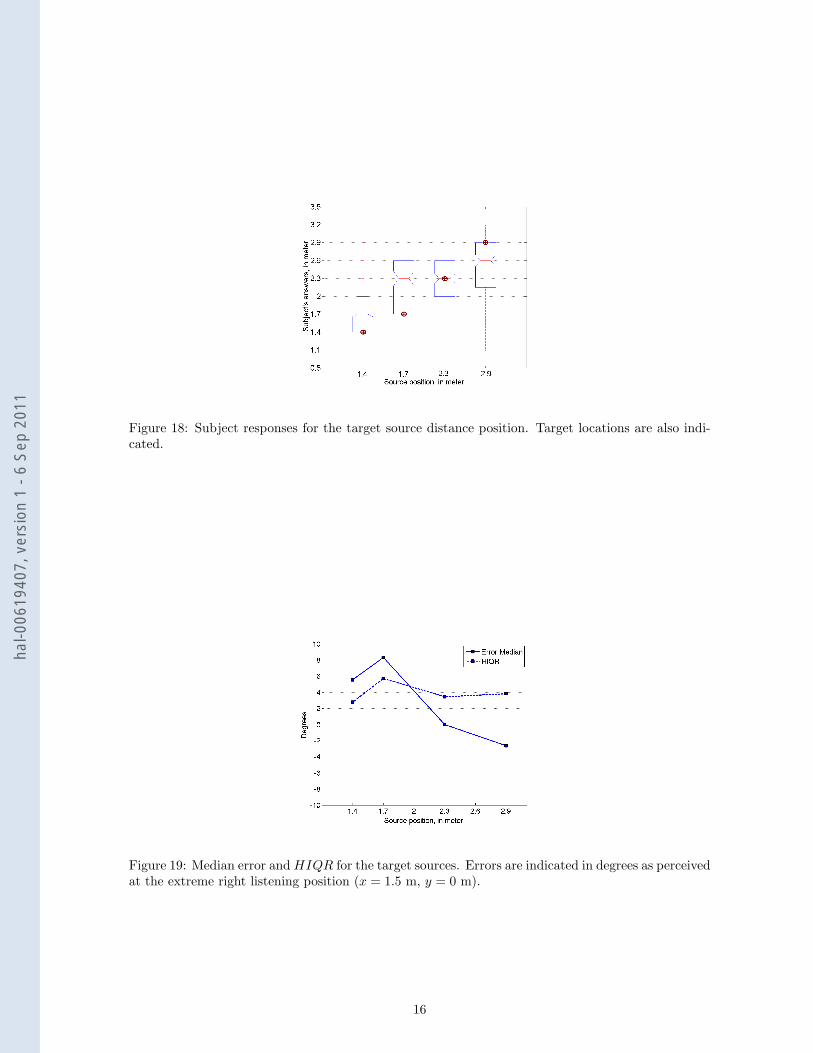
Figure 18: Subject responses for the target source distance position. Target locations are also indi-cated.
Figure 19: Median error and HIQR for the target sources. Errors are indicated in degrees as perceivedat the extreme right listening position (x = 1.5 m, y = 0 m).
16
hal-0
0619
407,
ver
sion
1 -
6 Se
p 20
11

Figure 20: BITD and VITD for SMART-I2 and ideal loudspeakers (WFSId), extreme right listeningposition.
Figure 21: BILD and VILD for SMART-I2 and ideal loudspeakers (WFSId), extreme right listeningposition.
5.3 Results of the objective evaluation
During the experiment, subjects were instructed to follow the path between the center listeningand an extreme side listening position (x = 1.5 m, y = 0 m in figure 8). At the center listeningposition, the ITD and ILD bias and variability are almost independent on the source distance andare therefore not presented here. At this position, ITD and ILD bias are in the range of 0± 0.05 msfor both ideal WFS and SMART-I2, 0 ± 0.5 dB for ideal WFS and −1.5 ± 0.5 dB for SMART-I2.The small observed ILD bias for SMART-I2 might be due to the presence of the wall in the currentinstallation.
Objective criterion at the extreme right position (x = 1.5 m, y = −0.5 m in figure 8) are presentedin figures 20 and 21. It can be seen that there is a positive bias (BITD ' 0.2 ms and BILD ' 7 dB)for sources located in front of the screen (distance lower than 2 m) synthesized using SMART-I2.This bias is not observed for ideal WFS. The consistent bias for both ITD and ILD might explain theoverestimation of perceived distance in the subjective experiment. This might cause a localizationbias to the right of the perceived azimuth of the source compared to the target azimuth.
For sources located behind the array, a positive bias is observed for ILD (BILD ' 5 dB) whereasBITD is close to null. This may explain the limited bias in localization accuracy observed for thesesources accounting for the dominance of ITD for large band stimuli [28].
17
hal-0
0619
407,
ver
sion
1 -
6 Se
p 20
11

5.4 Discussion
The subjects reported this task very difficult to perform. The subjects were all a bit disturbedby the missing “static” acoustical cues for distance perception (level differences, room effect, ...).During the first trials, subjects strategies were to explore the entire rendering area trying to find thebest localization place. After that, 80% of the subjects went directly to the extreme right listeningposition to choose the loudspeaker, and the other part still proceed to a systematic exploration or toa random walking among the rendering area.
The motion parralax is a dynamic distance cue which is known to be not as salient as staticdistance cues.[34][35] In [34], blind-folded subjects were instructed to locate a sound source in avery similar way than our experiment. A number of loudspeakers were located on a line passingthrough the starting position at 2 m to 6 m from the starting position. The subjects were asked towalk either 2 m or 4 m in a direction perpendicular to this line while one loudspeakers was active(synthesized voice). The subjects were then instructed to report the exact location of the activesource by walking to it. The results indicate an over-estimation of the distance of the closer sourcesand an under-estimation of the distant ones. The same phenomenom has been noticed in [35]. Thestandard deviation found in [34] was approximately 0.6 m, greater than the HIQR of our experiment.However, the reporting method we used is quite different than in [34] and [35]. The current studytask can almost be considered as a localization task with visual cues seen from multiple listeningpositions.
The objective analysis revealed inconsistent localization cues which explain the localization biasfor sources in front of the screen. In further studies, these errors should be compensated for usingmore advanced equalization techniques or by modifying the acoustical characteristics of the panel.Considering the furthest position (2.9 m), the compression in distance might also be due to the“natural” room effect of the real environment. The latter provides distance cues related to direct overreverberant energy which may bias distance perception towards the location of the screen.
From a visual point of view, a compression of distance perception has been noticed for a whilein immersive virtual environments. It does not seem to be linked to the field of view and binocularviewing, and for the moment no convincing explanations has been found to this phenomenom.[36]In the SMART-I2, this can contribute to the mislocalization of the audio-visual objects in terms ofdistance.
In conclusion, it can be stated that the SMART-I2’s ability to render the audio-visual motionparralax effect is similar to the one observed with real sources. Therefore, it can be expected thatthe results would be improved using consistent level differences and virtual room effect. Audio-visualintegration should also improve the precision of the motion parallax effect rendering in a similar waythan for the localization accuracy for static users (cf discussion in section 4.4.1).
6 General discussion and conclusion
In this paper, an immersive audio-visual environment, the SMART-I2, has been presented andevaluated. The design focus was placed upon audio-visual consistency which may contribute to anincreased feeling of presence in the virtual environment.
Subjects were globally satisfied with the proposed rendering. Further studies should be made withthis system with more realistic audio-visual scenes to evaluate more precisely the perceptual realismprovided by the SMART-I2. A more complete acoustical study of the large MAP is also required inorder to increase the precision of the WFS rendering, especially for sources located in front of thescreen.
The immersion quality was reported by the subjects to be sufficient and that they really felt theywere “in the scene”. One fact that has been reported was that the limited size of the audio-visualwindow caused some disturbances in extremal positions. Installation of the second MAP will offerusers a larger field of view and thus should raise up the immersion quality.
In these experiments, the level of interaction was very limited in terms of direct interaction withthe scene and also interactions between multiple users. The addition of both may contribute to anincrease in the sense of presence. This will be verified in further studies.
18
hal-0
0619
407,
ver
sion
1 -
6 Se
p 20
11

The global feeling about the audio-visual rendering provided by the SMART-I2 was that theconsistency between audio and visual features is very accurate and that immersion quality is alreadyconvincing. The SMART-I2 was perceived as an audio-visual window opening into a plausible andconsistent virtual world. The results of the objective analysis and subjective evaluation confirm thatpoint. The localisation accuracy shown by subjects permits a global validation of the WFS rendering,the visual rendering and the audio-visual calibration.
7 Aknowledgements
This works was supported by CNRS and sonic emotion. The authors would like to thank MatthieuCourgeon, Rami Ajaj, Jonathan Chaboissier, Christian Jacquemin and Tifanie Bouchara for theirsupport on the graphical part.
References
[1] Lombard M. and Ditton T., “At the heart of it all: The concept of presence”, Journal ofComputer-Mediated Communication, 3(2), September 1997.
[2] Cruz-Neira C., Sandin D., DeFanti T., Kenyon R., Hart J., “The CAVE-Audio visual experienceautomatic virtual environment”, Communications of ACM, 35(6), 64-72, 1992
[3] EVE project homepage (Experimental Virtual Environement) http://eve.hut.fi/
[4] de Bruijn W., “Application of Wave Field Synthesis for life-size videoconferencing” Phd thesis,Delft University of Technology, 2004.
[5] Springer J.P., Sladeczek C., Scheffler M., Hochstrate J., Melchior F., Frohlich B., “CombiningWave Field Synthesis and Multi-Viewer Stereo Displays”, Proceedings of the IEEE conference onVirtual Reality, Washington, IEEE Computer Society, pp. 237-240, 2006.
[6] Gerzon M. A., “Periphony: With-Height Sound Reproduction”, Journal of the Audio EngineeringSociety, 21(1), pp. 2-10, 1973.
[7] Daniel J., “Representation de champs acoustiques, application a la reproduction et a la trans-mission de scenes sonores complexes dans un contexte multimedia”, Ph.D. thesis, University ofParis 6, Paris, France, 2000.
[8] Pulkki V., “Virtual sound source positioning using vector base amplitude panning”, Journal ofthe Audio Engineering Society, 45(6), pp. 456-466, June 1997.
[9] Berkhout A. J. , de Vries D. and Vogel P., “Acoustic Control By Wave Field Synthesis”, Journalof Acoustical Society of America, vol. 93, pp 2764-2778, 1993
[10] Grohn M., Lokki T., and Takala T., “Localizing sound sources in a cave-like virtual environmentwith loudspeaker array reproduction”, Presence: Teleoperators & Virtual Environments, 16(2),pp. 157-171, April 2007.
[11] Begault D., “3D sound for virtual reality and multimedia”, Cambridge, MA: Academic Press,1994.
[12] Corteel E., “Equalization in an extended area using multichannel inversion and wave field syn-thesis”, Journal of the Audio Engineering Society, 54(12), pp. 1140-1161, December 2006
[13] Frohlich B., Blach R., Stefani O., “Implementing Multi-Viewer Stereo Displays”, WSCG Con-ference Proceedings, Plzen, Czech Republic, 2005.
[14] Boone M. M., “Multi-actuator Panels as loudspeakers arrays for Wave Field Synthesis”, Journalof the Audio Engineering Society, 52(7/8), pp. 712-723, July-August 2004.
19
hal-0
0619
407,
ver
sion
1 -
6 Se
p 20
11
[15] Corteel E., “Objective and subjective comparison of electrodynamic and MAP loudspeakersfor Wave Field Synthesis” 30th International Conference of the Audio Engineering Society,Saariselka, Finland, 2007.
[16] Pueo B., Escolano J., Javier Lopez J., Ramos G., “On Large Multiactuator Panels for WaveField Synthesis Applications”, 124th Convention of the Audio Engineering Society, Amsterdam,The Netherlands, 2008.
[17] Corteel E. ”On the use of irregularly spaced loudspeaker arrays for Wave Field Synthesis, poten-tial impact on spatial aliasing frequency” 9th Int. Conference on Digital Audio Effects (DAFx-06),Montreal, Canada, 2006.
[18] Corteel E., Pellegrini R., Kuhn-Rahloff C., “Wave Field Synthesis with Increased Aliasing Fre-quency”, 124th Convention of the Audio Engineering Society, Amsterdam, Netherland, 2008.
[19] Sanson J., Corteel E., Warusfel O., “Objective and subjective analysis of localization accuracyin Wave Field Synthesis”, 124th Convention of the Audio Engineering Society, Amsterdam,Netherland, 2008.
[20] Stern R. M. , Zeitberg A. S., and Trahiotis C., “Lateralization of complex binaural stimuli, aweighted-image model”, Journal of the Acoustical Society of America, 84(1), pp. 156-165, 1988.
[21] Jacquemin C., “Architecture and Experiments in networked 3D Audio/Graphic rendering withVirtual Choreographer”, Proceedings of Sounds and Music Computing, Paris, France, 2004.
[22] Jacquemin C., “Virtual Choreographer Reference Guide (version 1.4)”, LIMSI-CNRS and Uni-versite Paris 11 http://virchor.sourceforge.net
[23] Zicarelli D., Taylor G., Clayton J.K., Dudas R., Nevil B., “MAX 4.6: Reference Manual”,http://www.cylcing74.com
[24] Bouchara T., “Le Scene-Modeler: Des outils pour la modelisation de contenus multime-dia spatialises.” Actes des 13 emes Journees d’Informatique Musicale, Albi, France, 2008.http://gmea.net/upload/
[25] Burbeck S., “Applications Programming in Smalltalk-80(TM): How to use Model-View-Controller (MVC)” Ph.D. thesis, University of Illinois at Urbana-Champaign, 1987.
[26] Blauert J., “Spatial Hearing, the Psychophysics of Human Sound Localization”, MIT Press, firstpublished in 1974, re-edited in 1997.
[27] Bertelson P., Aschersleben G., “Automatic visual bias of perceived auditory location”, Psycho-nomic Bulletin & Review, 5(3), pp. 482-489, 1998.
[28] Wightman F. L., Kistler, D. J. “The dominant role of low-frequency interaural time differencesin sound localization” Journal of the Acoustical Society of America, 91(3), pp. 1648-1641, 1992.
[29] Verheijen E., “Sound reproduction by Wave Field Synthesis”, Ph.D. thesis, Delft University ofTechnology, 1997.
[30] Bertet S., Daniel J., Parizet E., Gros L., Warusfel O., “Investigation of the perceived spatialresolution of higher ambisonics sound fields: a subjective evaluation involving virtual and real3D microphones”, 30th International Conference of the Audio Engineering Society, Saarileska,Finland, 2007.
[31] Nguyen K. V., Suied C., Viaud-Delmon I., Warusfel O., “Intergrating visual and auditory spatialcues in a virtual reality environment”, Submitted.
[32] Wightman F. L., Kistler D. J., “Headphone simulation of free-field listening II: Psychophysicalvalidation.”, The Journal of Acoustical Society of America, 85(2), pp. 868-878, 1989.
20
hal-0
0619
407,
ver
sion
1 -
6 Se
p 20
11
[33] Bronkhorst A., “Localization of real and virtual sound sources”, The Journal of the AcousticalSociety of America, 98(1), pp. 2542-2553, 1995.
[34] Speigle, J. M., Loomis, J. M., “Auditory distance perception by translating observers”, Proceed-ings of IEEE Symposium on Research Frontiers in Virtual Reality, San Jose, CA, October 25-26,1993.
[35] Ashmead D.H., Deford L.D., Northington A. “Contribution of listener’s approaching motionto auditory distance perception”, Journal of Experimental Psychology: Human Perception andPerformance, 21(2),pp. 239-256, 1995.
[36] Creem-Regehr S. H., Willemsen P., Gooch A. A., Thompson W. B. “The influence of restrictedviewing conditions on egocentric distance perception: Implications for real and virtual indoorenvironments”, Perception 34(2), pp. 191-204, 2005.
21
hal-0
0619
407,
ver
sion
1 -
6 Se
p 20
11