Monitoring early response to anti-angiogenic therapy: diffusion-weighted magnetic resonance imaging...
9
Monitoring Early Response to Anti-Angiogenic Therapy: Diffusion-Weighted Magnetic Resonance Imaging and Volume Measurements in Colon Carcinoma Xenografts Moritz Jo ¨ rg Schneider 1 *, Clemens Christian Cyran 2 , Konstantin Nikolaou 2,3 , Heidrun Hirner 2 , Maximilian F. Reiser 1,2 , Olaf Dietrich 1 1 Josef Lissner Laboratory for Biomedical Imaging, Institute for Clinical Radiology, Ludwig-Maximilians-University Hospital Munich, Munich, Germany, 2 Laboratory for Experimental Radiology, Institute for Clinical Radiology, Ludwig-Maximilians-University Hospital Munich, Munich, Germany, 3 Department of Diagnostic and Interventional Radiology, University Hospital Tu ¨ bingen, Tu ¨ bingen, Germany Abstract Objectives: To evaluate the use of diffusion-weighted MRI (DW-MRI) and volume measurements for early monitoring of antiangiogenic therapy in an experimental tumor model. Materials and Methods: 23 athymic nude rats, bearing human colon carcinoma xenografts (HT-29) were examined before and after 6 days of treatment with regorafenib (n = 12) or placebo (n = 11) in a clinical 3-Tesla MRI. For DW-MRI, a single-shot EPI sequence with 9 b-values (10–800 s/mm 2 ) was used. The apparent diffusion coefficient (ADC) was calculated voxelwise and its median value over a region of interest, covering the entire tumor, was defined as the tumor ADC. Tumor volume was determined using T2-weighted images. ADC and volume changes between first and second measurement were evaluated as classifiers by a receiver-operator-characteristic (ROC) analysis individually and combined using Fisher’s linear discriminant analysis (FLDA). Results: All ADCs and volumes are stated as median6standard deviation. Tumor ADC increased significantly in the therapy group (0.7660.09 6 10 23 mm 2 /s to 0.9060.12 6 10 23 mm 2 /s; p,0.001), with significantly higher changes of tumor ADC than in the control group (0.1060.11 6 10 23 mm 2 /s vs. 0.0360.09 6 10 23 mm 2 /s; p = 0.027). Tumor volume increased significantly in both groups (therapy: 347.86449.1 to 405.36823.6 mm 3 ; p = 0.034; control: 219.7679.5 to 443.76141.5 mm 3 ;p,0.001), however, the therapy group showed significantly reduced tumor growth (33.30647.30% vs. 96.43631.66%; p,0.001). Area under the curve and accuracy of the ADC-based ROC analysis were 0.773 and 78.3%; and for the volume change 0.886 and 82.6%. The FLDA approach yielded an AUC of 0.985 and an accuracy of 95.7%. Conclusions: Regorafenib therapy significantly increased tumor ADC after 6 days of treatment and also significantly reduced tumor growth. However, ROC analyses using each parameter individually revealed a lack of accuracy in discriminating between therapy and control group. The combination of both parameters using FLDA substantially improved diagnostic accuracy, thus highlighting the potential of multi-parameter MRI as an imaging biomarker for non-invasive early tumor therapy monitoring. Citation: Schneider MJ, Cyran CC, Nikolaou K, Hirner H, Reiser MF, et al. (2014) Monitoring Early Response to Anti-Angiogenic Therapy: Diffusion-Weighted Magnetic Resonance Imaging and Volume Measurements in Colon Carcinoma Xenografts. PLoS ONE 9(9): e106970. doi:10.1371/journal.pone.0106970 Editor: Roger Chammas, Universidade de Sa ˜o Paulo, Brazil Received May 19, 2014; Accepted August 1, 2014; Published September 15, 2014 Copyright: ß 2014 Schneider et al. This is an open-access article distributed under the terms of the Creative Commons Attribution License, which permits unrestricted use, distribution, and reproduction in any medium, provided the original author and source are credited. Data Availability: The authors confirm that all data underlying the findings are fully available without restriction. All relevant data are within the paper and its Supporting Information files. Funding: This study was supported by the German Federal Ministry of Education and Research (BMBF, www.bmbf.de), Excellence Cluster M4 (01EX1021X) (www. m4.de) and a research grant from Bayer HealthCare (healthcare.bayer.de). The funders had no role in study design, data collection and analysis, decision to publish, or preparation of the manuscript. Competing Interests: The authors have read the journal’s policy and the authors of this manuscript have the following competing interests: CCC: Research grant Bayer HealthCare (solely materials of the study), speakers bureau Bayer HealthCare. This does not alter the authors’ adherence to PLOS ONE policies on sharing data and materials. * Email: [email protected] Introduction Monitoring the response to anti-cancer treatment is an integral part of oncology. With the introduction of novel molecular cancer therapies to clinical routine it has become apparent that conventional, solely morphology-based imaging criteria, such as the Response Evaluation Criteria in Solid Tumors (RECIST) [1], provide limited sensitivity to assess therapy response, particularly during initial treatment [2,3]. Technical developments in recent years introduced a variety of new functional imaging methods, such as diffusion-weighted MRI (DW-MRI) or perfusion imaging. These new methods complement established morphological information and are also applicable as in-vivo imaging biomarkers of therapy response for monitoring of anti-cancer treatment. PLOS ONE | www.plosone.org 1 September 2014 | Volume 9 | Issue 9 | e106970
-
Upload
uni-tuebingen1 -
Category
Documents
-
view
2 -
download
0
Transcript of Monitoring early response to anti-angiogenic therapy: diffusion-weighted magnetic resonance imaging...

Monitoring Early Response to Anti-Angiogenic Therapy:Diffusion-Weighted Magnetic Resonance Imaging andVolume Measurements in Colon Carcinoma XenograftsMoritz Jorg Schneider1*, Clemens Christian Cyran2, Konstantin Nikolaou2,3, Heidrun Hirner2,
Maximilian F. Reiser1,2, Olaf Dietrich1
1 Josef Lissner Laboratory for Biomedical Imaging, Institute for Clinical Radiology, Ludwig-Maximilians-University Hospital Munich, Munich, Germany, 2 Laboratory for
Experimental Radiology, Institute for Clinical Radiology, Ludwig-Maximilians-University Hospital Munich, Munich, Germany, 3 Department of Diagnostic and Interventional
Radiology, University Hospital Tubingen, Tubingen, Germany
Abstract
Objectives: To evaluate the use of diffusion-weighted MRI (DW-MRI) and volume measurements for early monitoring ofantiangiogenic therapy in an experimental tumor model.
Materials and Methods: 23 athymic nude rats, bearing human colon carcinoma xenografts (HT-29) were examined beforeand after 6 days of treatment with regorafenib (n = 12) or placebo (n = 11) in a clinical 3-Tesla MRI. For DW-MRI, a single-shotEPI sequence with 9 b-values (10–800 s/mm2) was used. The apparent diffusion coefficient (ADC) was calculated voxelwiseand its median value over a region of interest, covering the entire tumor, was defined as the tumor ADC. Tumor volume wasdetermined using T2-weighted images. ADC and volume changes between first and second measurement were evaluatedas classifiers by a receiver-operator-characteristic (ROC) analysis individually and combined using Fisher’s linear discriminantanalysis (FLDA).
Results: All ADCs and volumes are stated as median6standard deviation. Tumor ADC increased significantly in the therapygroup (0.7660.0961023 mm2/s to 0.9060.1261023 mm2/s; p,0.001), with significantly higher changes of tumor ADC thanin the control group (0.1060.1161023 mm2/s vs. 0.0360.0961023 mm2/s; p = 0.027). Tumor volume increased significantlyin both groups (therapy: 347.86449.1 to 405.36823.6 mm3; p = 0.034; control: 219.7679.5 to 443.76141.5 mm3; p,0.001),however, the therapy group showed significantly reduced tumor growth (33.30647.30% vs. 96.43631.66%; p,0.001). Areaunder the curve and accuracy of the ADC-based ROC analysis were 0.773 and 78.3%; and for the volume change 0.886 and82.6%. The FLDA approach yielded an AUC of 0.985 and an accuracy of 95.7%.
Conclusions: Regorafenib therapy significantly increased tumor ADC after 6 days of treatment and also significantly reducedtumor growth. However, ROC analyses using each parameter individually revealed a lack of accuracy in discriminatingbetween therapy and control group. The combination of both parameters using FLDA substantially improved diagnosticaccuracy, thus highlighting the potential of multi-parameter MRI as an imaging biomarker for non-invasive early tumortherapy monitoring.
Citation: Schneider MJ, Cyran CC, Nikolaou K, Hirner H, Reiser MF, et al. (2014) Monitoring Early Response to Anti-Angiogenic Therapy: Diffusion-WeightedMagnetic Resonance Imaging and Volume Measurements in Colon Carcinoma Xenografts. PLoS ONE 9(9): e106970. doi:10.1371/journal.pone.0106970
Editor: Roger Chammas, Universidade de Sao Paulo, Brazil
Received May 19, 2014; Accepted August 1, 2014; Published September 15, 2014
Copyright: � 2014 Schneider et al. This is an open-access article distributed under the terms of the Creative Commons Attribution License, which permitsunrestricted use, distribution, and reproduction in any medium, provided the original author and source are credited.
Data Availability: The authors confirm that all data underlying the findings are fully available without restriction. All relevant data are within the paper and itsSupporting Information files.
Funding: This study was supported by the German Federal Ministry of Education and Research (BMBF, www.bmbf.de), Excellence Cluster M4 (01EX1021X) (www.m4.de) and a research grant from Bayer HealthCare (healthcare.bayer.de). The funders had no role in study design, data collection and analysis, decision topublish, or preparation of the manuscript.
Competing Interests: The authors have read the journal’s policy and the authors of this manuscript have the following competing interests: CCC: Researchgrant Bayer HealthCare (solely materials of the study), speakers bureau Bayer HealthCare. This does not alter the authors’ adherence to PLOS ONE policies onsharing data and materials.
* Email: [email protected]
Introduction
Monitoring the response to anti-cancer treatment is an integral
part of oncology. With the introduction of novel molecular cancer
therapies to clinical routine it has become apparent that
conventional, solely morphology-based imaging criteria, such as
the Response Evaluation Criteria in Solid Tumors (RECIST) [1],
provide limited sensitivity to assess therapy response, particularly
during initial treatment [2,3]. Technical developments in recent
years introduced a variety of new functional imaging methods,
such as diffusion-weighted MRI (DW-MRI) or perfusion imaging.
These new methods complement established morphological
information and are also applicable as in-vivo imaging biomarkers
of therapy response for monitoring of anti-cancer treatment.
PLOS ONE | www.plosone.org 1 September 2014 | Volume 9 | Issue 9 | e106970

DW-MRI is a method to visualize and quantify the mobility of
water molecules in the observed tissue [4,5]. The thermally driven
random motion, the so-called Brownian motion, is influenced by
the properties of the surrounding tissue microstructure, e. g.
cellular density and cell integrity. While qualitative DW-MRI is
already widely used in oncology for the detection of metastases,
several recent reviews have highlighted the potential of quantita-
tive DW-MRI, i.e. the measurement of the apparent diffusion
coefficient (ADC), to predict and to monitor response to anti-
cancer treatment [6–11]. Generally, malignant lesions are known
to exhibit lower ADCs compared to healthy tissue and benign
lesions, which is mainly a result of the commonly higher cellularity
of malignancies [12–17]. On the other hand, studies measuring
pre-treatment ADCs have found, that relatively high initial ADCs
in malignant lesions were predictive of poor therapy outcome [18–
21], while increasing ADCs over the duration of various anti-
cancer treatments were associated with therapy response in
malignant breast metastases [22], rhabdomyosarcomas [23],
prostate carcinoma xenografts [24], colorectal liver metastases
[25] and cholangiocarcinomas [26].
The novel oral multi-kinase inhibitor regorafenib exhibits anti-
angiogenic and anti-proliferative effects on glioblastoma, breast,
and renal cell carcinoma xenografts [27] and is clinically approved
for treatment in metastatic colorectal cancer [28]. Pharmacolog-
ically, regorafenib belongs to the group of multi tyrosinekinase
inhibitors and inhibits multiple membrane-bound and intracellular
kinases involved in tumorigenesis, neoangiogenesis and in the
preservation of the tumor microenvironment. In vitro, regorafenib
has been shown to inhibit the activity of VEGFR-1, VEGFR-2,
VEGFR-3, PDGFR-a, PDGFR-b, FGFR-1, FGFR-2, RET, KIT,
TIE2, DDR2, TrkA, Eph2A, RAF-1, BRAF, SAPK2, PTK5 and
Abl at concentrations that can be achieved clinically [27].With
Table 1. MRI acquisition parameters.
Parameter DW-MRI T2-weighted MRI
Acquisition plane Axial Axial
Repetition time (ms) 2500 9560
Echo time (ms) 55 91
Signal averages 8 3
Acquisition matrix 68652 1926192
Reconstructed matrix 1366104 1926192
Field of view (mm2) 65650 60660
Slice thickness (mm) 2 1.5
Slice gap (mm) 0.4 0
Number of slices 12 35
Parallel imaging factor 2 (GRAPPA) 2 (GRAPPA)
Fat supression On Off
b-values (s/mm2) 10, 25, 50, 80, 130, 200, 350, 550, 800 -
Acquisition time (min) 10:08 6:53
doi:10.1371/journal.pone.0106970.t001
Figure 1. Voxelwise calculated ADC maps in the subcutaneouscolon carcinoma of a therapy animal before and after 6 days oftherapy with regorafenib laid over diffusion-weighted imageswith b = 10 s/mm2. The ADC maps display a prominent increase,which is also reflected in the median tumor ADC value for this animal:ADCB = 0.76261023mm2/s at day 0, ADCF = 1.13761023mm2/s at day 7.doi:10.1371/journal.pone.0106970.g001
Figure 2. Region of interest (ROI) placement on diffusion-weighted images with b = 10 s/mm2 over 4 example slices tocalculate the median tumor ADC. Total ROI extends over 10 slicesfor this measurement.doi:10.1371/journal.pone.0106970.g002
Therapy Monitoring Using DW-MRI and Tumor Volume
PLOS ONE | www.plosone.org 2 September 2014 | Volume 9 | Issue 9 | e106970
reported pro-apoptotic effects of regorafenib in colon carcinoma
xenografts [29] and studies reporting significant positive correla-
tions between ADCs and the number of apoptotic tumor cells [30],
we hypothesized that quantitative ADC measurements would be
applicable to sensitively assess the effects of regorafenib in an
experimental model of human colon cancer. An anticipated
potential limitation of this approach as reliable imaging biomarker
is necrotic tumor transformation with progressing tumor growth.
Necrotic transformation also leads to augmented water mobility
[15] and potentially impairs the specificity of ADC measurements
for assessing treatment response. A meaningful combined evalu-
ation of tumor morphology and DW-MRI could reduce the
individual limitations of each approach, allowing for non-invasive
response monitoring during initial treatment. Such a combination
is constituted by Fisher’s linear discriminant analysis (FLDA) [31],
which has been demonstrated to increase the accuracy to separate
between malignant and benign lesions in the vertebral bone
marrow by incorporating ADC and T2 relaxation time values
compared to using each classifier individually [32].
The purpose of this study was to evaluate quantitative DW-
MRI and tumor growth measurements, individually and com-
bined using a discriminant analysis approach, as means of
distinguishing between therapy and control group of human
colorectal carcinoma in rats under regorafenib or placebo therapy.
We hypothesized that the combination of both approaches
outperforms each classifier individually and can be used to
monitor anti-angiogenic therapy non-invasively.
Materials and Methods
Animal ModelThis study was approved by the Government of Upper Bavaria
Committee for Animal Research (Gz.55.2-1-54-2532-33-10) and
was carried out in accordance with the guidelines of the National
Institute of Health for the care and use of laboratory animals. For
the experiments twenty-three female athymic rats (7–8 weeks old,
Harlan Laboratories Inc., Indianapolis, IN) were used. 26106 cells
of the human colon carcinoma cell line HT-29 (ATCC HTB-38)
suspended in a total volume of 0.5 mL as a 1:1 mixture of
phosphate buffered saline pH 7.4 (PBS) and Matrigel (BD
Biosciences, San Jose, CA) were injected subcutaneously into the
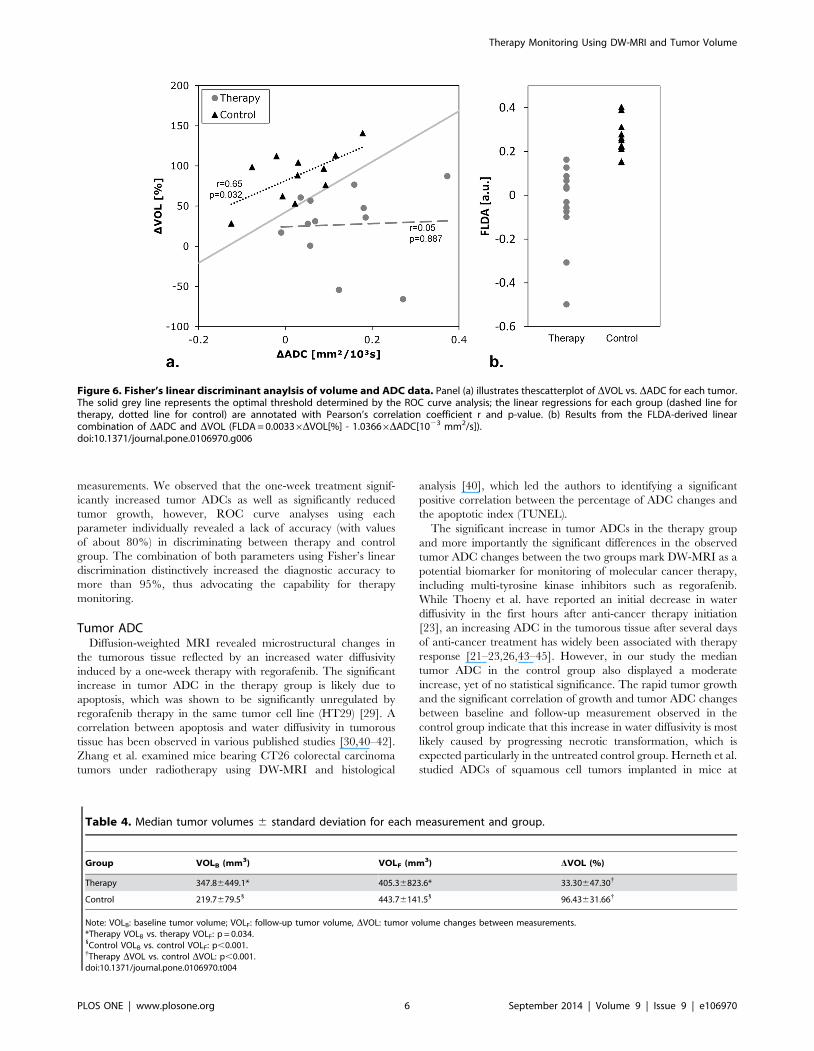
left flanks. Prior to MRI the xenografts were allowed to grow to a
reasonable size for imaging of approximately 400 mm3 (assessed
by daily caliper measurements in three dimensions (a6b6c60.5))
and the animals were randomly assigned to either the therapy
(n = 12) or the control group (n = 11). After the initial MRI on day
0 the animals and were treated daily for one week with the multi-
tyrosine kinase inhibitor, regorafenib (Bayer HealthCare, Lever-
kusen, Germany), respectively with the placebo. On day 7 a
follow-up MRI was performed to assess the effects of regorafenib
on tumor growth and the ADC, after which the animals were
euthanized via intracardiac injection of potassium chloride.
Tumor TherapyThe therapy group was administered 10 mg/kg body weight of
regorafenib daily, formulated as a solution in polypropylene
glycol/PEG400/Pluronic F68 (42.5/42.5/15 + 20% Aqua), via
gastric gavage, using a dedicated 16-gauge curved buttoned
cannula. The control group received volume-equivalent applica-
tions of the regorafenib solvent daily.
MR Image AcquisitionPrior to MR imaging, animals were anaesthetized with
isoflurane (5% for induction, 2.5% for maintenance, administered
in pure oxygen). Scans were conducted on a clinical 3-Tesla
whole-body MRI system (MAGNETOM Verio, Siemens Health-
care, Erlangen, Germany) with a small 4-channel flex coil
(Siemens Healthcare, Erlangen, Germany).
DW-MRI was performed using a diffusion-weighted single-shot
spin-echo sequence with echoplanar imaging (EPI) readout. A
modified monopolar diffusion encoding scheme [33] was used to
achieve a reduction in TE and therefore an increase in signal
intensity. Trace diffusion-weighted images were calculated by
averaging images obtained with diffusion gradients in 3 orthogonal
directions. A total of 9 diffusion weightings (b-values) were
acquired (b = 10; 25; 50; 80; 130; 200; 350; 550; 800 s/mm2)
with the parameters listed in Table 1. To assess the tumor
volumes, a T2-weighted turbo-spin-echo sequence with a high in-
plane resolution of 0.360.3 mm2 was used (Table 1).
Image AnalysisImage analysis was performed on a dedicated workstation using
our in-house software PMI (Platform for Research in Medical
Imaging) [34] written in IDL (ITT Visual Information Systems,
Boulder, CO).
DW-MRI. Prior to quantitative analysis, the diffusion-weight-
ed images were rigidly registered along the b-value-dimension
using a Fourier cross-correlation method to keep bulk-motion from
affecting the diffusion coefficients. The ADC of each voxel was
calculated by non-linear least-squares fitting of the measured
signal intensities from all acquired b-values to the monoexponen-
tial diffusion model: S(b) = S06exp(2 b6ADC), where b is the b-
value and S0 the signal intensity at b = 0 (Figure 1).
Obtaining quantitative parameters from MRI measurements is
highly dependent on region of interest (ROI) placement, which
often suffers from poor reproducibility. To obtain robust results
and to minimize subjective influences on the ROI definition, we
defined a 3D volume of interest (VOI) covering the entire tumor
on multiple slices of the diffusion-weighted data for each animal
and measurement (Figure 2). The median of the ADC distribu-
tions inside the VOIs were then taken as the representative tumor
ADCs for statistical analysis. The tumor ADCs are denoted ADCB
and ADCF for the baseline and follow-up measurements,
respectively.
Figure 3. Region of interest (ROI) placement on T2-weightedimages over 4 example slices to measure the tumor volume.Total ROI extends over 22 slices for this measurement.doi:10.1371/journal.pone.0106970.g003
Therapy Monitoring Using DW-MRI and Tumor Volume
PLOS ONE | www.plosone.org 3 September 2014 | Volume 9 | Issue 9 | e106970

Volume Measurement. The tumor volumes were deter-
mined based on the morphologic T2-weighted images, which
allowed for a clear delineation of the subcutaneous xenografts. For
each animal and each measurement, a VOI was placed over
several slices to cover the entire tumor (Figure 3). The combined
volume of all voxels inside each VOI was defined as the tumor
volume (the slice gap is 0 mm and therefore did not need to be
taken into account) and denoted as VOLB and VOLF for the
baseline and follow-up measurements, respectively. To accommo-
date for varying pre-therapy tumor sizes, tumor growth was
assessed in percentages relative to the baseline value rather than
absolute growth.
Statistical AnalysesAll statistical analyses were performed using the statistical
computing language R [35]. Within each group, median values
and standard deviations of the evaluated parameters over all
animals were determined. For intragroup comparison between
baseline and follow-up parameters, the paired Wilcoxon signed-
rank test was used. The comparison of the parameters between the
therapy and control group was performed using the non-paired
Mann-Whitney U test. The observed changes for both tumor
ADCs (DADC) and volumes (DVOL) from baseline to follow-up
were also used for analyses. To evaluate diagnostic performance of
either DADC or DVOL in discriminating therapy from control
group, the receiver operating characteristics (ROC) curves were
analyzed using the R package pROC [36]. Parameters of interest
were the area under the curve (AUC) as well as the optimal
threshold and the resulting sensitivity, specificity, and diagnostic
accuracy. The statistical significance of the difference between the
AUCs was determined using the method as described by DeLong
et al. [37] based on generalized U-statistics to generate an
estimated covariance matrix.
Additionally, for each group the linear correlation between
DADC and DVOL was determined using Pearson’s product-
moment correlation. To assess if the combination of both
parameters, DADC and DVOL, increases the ability to distinguish
between therapy and control group compared to the individual
classifiers, Fisher’s linear discriminant analysis [31] was performed
using the R package Bioconductor [38,39]. FLDA is a statistical
method used to find a linear combination of given classifiers, in
our case DADC and DVOL, which allows for an optimal
separation of a group of classes. The result from the determined
linear combination was then again used for statistical comparison
between the two groups and as a classifier to perform a ROC
curve analysis. For all analyses, p-values of less than 0.05 were
considered statistically significant.
Results
Tumor ADCMedian tumor ADCs with standard deviations and the results
from the statistical analyses are summarized in Table 2 (see Table
S1 for voxelwise calculated ADC distributions and Table S2 for
individual tumor ADC values (median of the distributions) for
each animal and measurement). A statistically highly significant
(p,0.001) difference in tumor ADC between baseline and follow-
up measurement was found in the therapy group, where the
median increased from ADCB = 0.782(60.085)61023 mm2/s to
ADCF = 0.911(60.121)61023 mm2/s. Conversely, no significant
alteration was found in the control group
(ADCB = 0.740(60.087)61023 mm2/s to ADCF = 0.770
Figure 4. Box plots (first, second, and third quartile, range and outlier) of (a) DADC, (b) DVOL and (c) the results from the linearcombination calculated with Fisher’s linear discriminant analysis (FLDA) for each group and the corresponding p-value for thedifference between them. Although significantly different, DADC and DVOL display distinctive overlaps between the two groups. The result fromFLDA demonstrates a marked improvement in the group discrimination with nearly no overlap, resulting in a highly significant difference.doi:10.1371/journal.pone.0106970.g004
Table 2. Median tumor ADCs 6 standard deviation for each measurement and group.
Group ADCB (1023mm2/s) ADCF (1023mm2/s) DADC (1023mm2/s)
Therapy 0.7660.09* 0.9060.12*1 +0.1060.11{
Control 0.7360.09 0.7560.071 +0.0360.09{
Note: ADCB: baseline tumor ADC; ADCF: follow-up tumor ADC, DADC: tumor ADC changes between measurements.*Therapy ADCB vs. therapy ADCF: p,0.001.1Therapy ADCF vs. control ADCF: p,0.001.{Therapy DADC vs. control DADC: p = 0.027.doi:10.1371/journal.pone.0106970.t002
Therapy Monitoring Using DW-MRI and Tumor Volume
PLOS ONE | www.plosone.org 4 September 2014 | Volume 9 | Issue 9 | e106970

(60.070)61023 mm2/s, p = 0.24). Statistically significant differ-
ences between the two groups were found for the follow-up tumor
ADCs (p,0.001) as well as for the observed changes in tumor
ADCs (therapy: DADC = 0.130(60.110)61023 mm2/s; control:
DADC = 0.030(60.087)61023 mm2/s; p = 0.268; Figure 4a). The
ROC curve analysis for DADC is illustrated in Figure 5a. The
AUC was 0.773 and using an optimal threshold of
DADC = 0.32961023 mm2/s (above = therapy), a sensitivity of
91.7%, a specificity of 63.6%, and a diagnostic accuracy of 78.3%
in differentiating between therapy and control group based on
ADC changes was obtained (Table 3).
Tumor VolumeMedian tumor volumes with standard deviations and the results
from the statistical analyses are summarized in Table 4 (see Table
S3 for individual tumor volumes for each animal and measure-
ment). Both groups displayed a statistically significant increase in
tumor volume from baseline to follow-up measurements (therapy:
p = 0.034; control: p,0.001), however, the observed relative
volume increase in the therapy group (DVOL = 33.29(647.30)%)
was significantly smaller than in the control group
(DVOL = 96.43(631.66)%); p,0.001; Figure 4b). The ROC
curve analysis for DVOL is illustrated in Figure 5b. The AUC
was 0.886 and using an optimal threshold of DVOL = 61.35%
(below = therapy) a sensitivity of 81.8%, a specificity of 83.3%, and
a diagnostic accuracy of 82.6% in differentiating between therapy
and control group based on tumor growth was obtained (Table 3).
There was no statistically significant difference between the AUC
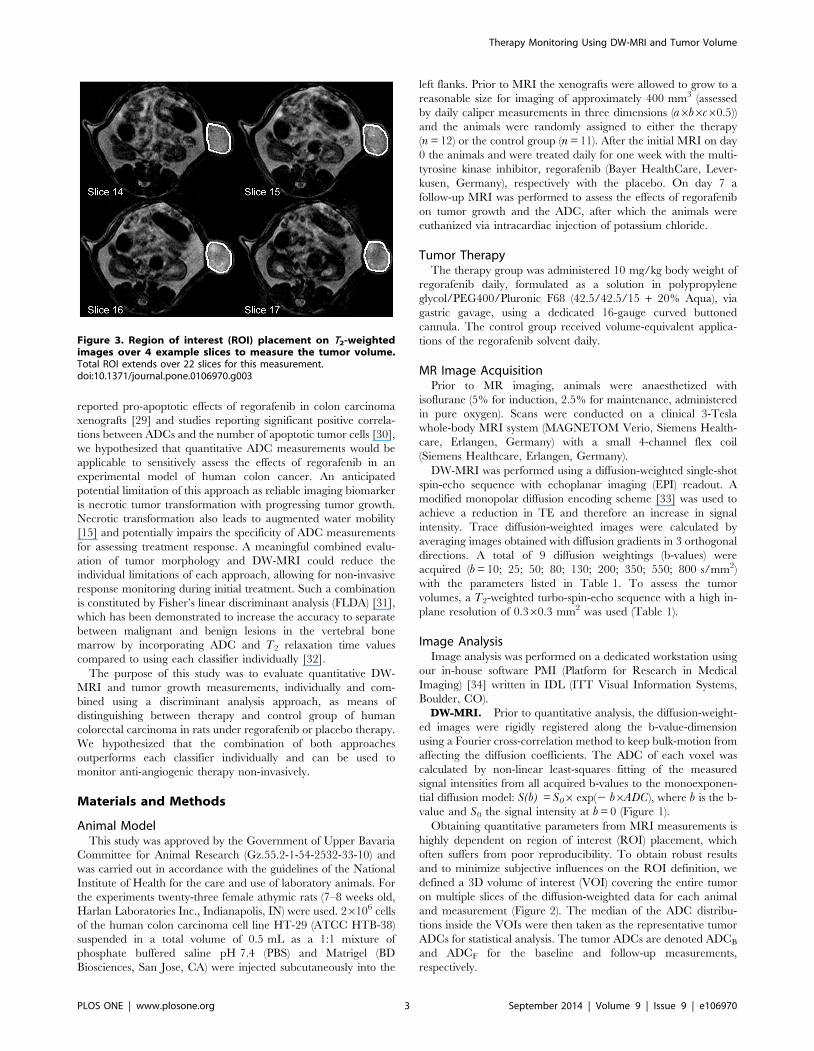
from DADC and DVOL (p = 0.419). The control group displayed
a moderate correlation between DADC and DVOL (r = 0.65,
p = 0.0319, figure 6a, dotted red line), which was not the case for
the therapy group (r = 0.05, p = 0.887, Figure 6a, dashed blue
line).
Fisher’s Linear Discriminant AnalysisThe results from FLDA are also shown in Figure 6. The two
groups display a statistically highly significant difference (p,
0.00001, Figure 4c) between the results from the determined linear
combination (FLDA(DVOL, DADC) = 0.00336DVOL[%] 2
1.03666DADC[1023mm2/s]). The ROC curve analysis for
FLDA is illustrated in Figure 5c. The AUC was 0.985 and using
an optimal threshold of FLDA = 0.139 (below = therapy) a
sensitivity of 91.7%, a specificity of 100%, and a diagnostic
accuracy of 95.7% in differentiating between therapy and control
group based on FLDA was obtained (Table 3). The AUC yielded
by FLDA was significantly larger than the AUC yielded by DADC
(p = 0.036), however, there was no significant difference compared
to the AUC yielded by DVOL (p = 0.145).
Discussion
In this study, we used MRI in an experimental colon carcinoma
model to evaluate the influence of the recently FDA-approved
multi-kinase inhibitor regorafenib [28] on the water diffusivity in
the tumorous tissue and on tumor growth to assess the potential for
non-invasive therapy monitoring using ADC and tumor volume
Table 3. Results from the ROC curve analysis using DADC, DVOL, and FLDA.
Classifier AUC Threshold Sensitivity Specificity Accuracy
DADC 0.773* 0.03361023mm2/s 91.7% 63.6% 78.3%
DVOL 0.886 +61.35% 81.8% 83.3% 82.6%
FLDA 0.985* +0.139[a.u.] 91.7% 100% 95.7%
Note: DADC: tumor ADC changes between measurements, DVOL: tumor volume changes between measurements, FLDA: result from Fisher’s linear discriminantanalysis, AUC: area under the curve.*AUC using DADC vs. AUC using FLDA: p = 0.035.doi:10.1371/journal.pone.0106970.t003
Figure 5. ROC curve analysis using (a) DADC, (b) DVOL and (c) the result from the linear combination calculated with Fisher’s lineardiscriminant analysis (FLDA) to illustrate performance in differentiating therapy from control group. The combined approach usingFLDA outperforms the use of DADC and DVOL notably. Optimal sensitivity and specificity for each parameter and the corresponding thresholds aresummarized in Table 3. * AUC using DADC vs AUC using FLDA: p = 0.035.doi:10.1371/journal.pone.0106970.g005
Therapy Monitoring Using DW-MRI and Tumor Volume
PLOS ONE | www.plosone.org 5 September 2014 | Volume 9 | Issue 9 | e106970
measurements. We observed that the one-week treatment signif-
icantly increased tumor ADCs as well as significantly reduced
tumor growth, however, ROC curve analyses using each
parameter individually revealed a lack of accuracy (with values
of about 80%) in discriminating between therapy and control
group. The combination of both parameters using Fisher’s linear
discrimination distinctively increased the diagnostic accuracy to
more than 95%, thus advocating the capability for therapy
monitoring.
Tumor ADCDiffusion-weighted MRI revealed microstructural changes in
the tumorous tissue reflected by an increased water diffusivity
induced by a one-week therapy with regorafenib. The significant
increase in tumor ADC in the therapy group is likely due to
apoptosis, which was shown to be significantly unregulated by
regorafenib therapy in the same tumor cell line (HT29) [29]. A
correlation between apoptosis and water diffusivity in tumorous
tissue has been observed in various published studies [30,40–42].
Zhang et al. examined mice bearing CT26 colorectal carcinoma
tumors under radiotherapy using DW-MRI and histological
analysis [40], which led the authors to identifying a significant
positive correlation between the percentage of ADC changes and
the apoptotic index (TUNEL).
The significant increase in tumor ADCs in the therapy group
and more importantly the significant differences in the observed
tumor ADC changes between the two groups mark DW-MRI as a
potential biomarker for monitoring of molecular cancer therapy,
including multi-tyrosine kinase inhibitors such as regorafenib.
While Thoeny et al. have reported an initial decrease in water
diffusivity in the first hours after anti-cancer therapy initiation
[23], an increasing ADC in the tumorous tissue after several days
of anti-cancer treatment has widely been associated with therapy
response [21–23,26,43–45]. However, in our study the median
tumor ADC in the control group also displayed a moderate
increase, yet of no statistical significance. The rapid tumor growth
and the significant correlation of growth and tumor ADC changes
between baseline and follow-up measurement observed in the
control group indicate that this increase in water diffusivity is most
likely caused by progressing necrotic transformation, which is
expected particularly in the untreated control group. Herneth et al.
studied ADCs of squamous cell tumors implanted in mice at
Figure 6. Fisher’s linear discriminant anaylsis of volume and ADC data. Panel (a) illustrates thescatterplot of DVOL vs. DADC for each tumor.The solid grey line represents the optimal threshold determined by the ROC curve analysis; the linear regressions for each group (dashed line fortherapy, dotted line for control) are annotated with Pearson’s correlation coefficient r and p-value. (b) Results from the FLDA-derived linearcombination of DADC and DVOL (FLDA = 0.00336DVOL[%] - 1.03666DADC[1023 mm2/s]).doi:10.1371/journal.pone.0106970.g006
Table 4. Median tumor volumes 6 standard deviation for each measurement and group.
Group VOLB (mm3) VOLF (mm3) DVOL (%)
Therapy 347.86449.1* 405.36823.6* 33.30647.30{
Control 219.7679.51 443.76141.51 96.43631.66{
Note: VOLB: baseline tumor volume; VOLF: follow-up tumor volume, DVOL: tumor volume changes between measurements.*Therapy VOLB vs. therapy VOLF: p = 0.034.1Control VOLB vs. control VOLF: p,0.001.{Therapy DVOL vs. control DVOL: p,0.001.doi:10.1371/journal.pone.0106970.t004
Therapy Monitoring Using DW-MRI and Tumor Volume
PLOS ONE | www.plosone.org 6 September 2014 | Volume 9 | Issue 9 | e106970

various tumor sizes [15], reporting that ADCs increased signifi-
cantly with tumor progression and the areas with increased ADCs
correlated well with histologically determined areas of necrosis.
While regorafenib seems to have a significant effect on water
diffusivity, the overlap in the observed tumor ADC changes
between therapy and control group leads to a less accurate
discrimination and therefore to a limitation of the therapy
monitoring capabilities of DW-MRI. To increase diagnostic
accuracy it is therefore advisable to combine ADC measurements
with additional information about tumor progression, such as
tumor volume.
Tumor VolumeThe tumor volume increased significantly between baseline and
follow-up measurement in both groups. This strongly indicates
that the Response Evaluation Criteria in Solid Tumors (RECIST)
[1] based on morphologic properties of the target lesion (longest
diameter), is not suitable to monitor early response of anti-
angiogenic tumor therapy [2,3]. However, the relative tumor
growth was significantly reduced by the regorafenib therapy, as the
control group tumors displayed a median relative tumor growth of
96.4% while therapy group tumors only grew by 33.3%. Similar
results were previously published by Abou-Elkacem et al. [46],
who observed that regorafenib therapy in a murine CT26
metastatic colon cancer model, amongst other anti-angiogenic
and anti-metastatic effects, significantly inhibited tumor growth.
The ROC curve analysis using relative tumor growth yielded a
slight increase in AUC compared to using tumor ADC changes,
nevertheless, tumor growth lacks diagnostic accuracy when used as
classifier to distinguish between control and therapy group animals
after 6 days of regorafenib therapy.
Fisher’s Linear Discriminant AnalysisFisher’s linear discriminant analysis is an effective method to
combine two or more classifiers in separation problems [31]. Biffar
et al. demonstrated that the use of FLDA to combine ADC and T2
relaxation times of water in the vertebral bone marrow allowed for
increased sensitivity and accuracy in the separation between
malignant and benign lesions compared to using each classifier
individually [32]. In the present study, a significant correlation
between tumor ADC changes and relative tumor growth was
found in the control group but not in the therapy group. While this
indicates that the observed ADC changes are likely to have
different physiological causes, it further promotes the application
of a discriminant analysis for the purpose of increased diagnostic
accuracy. Accordingly, the combined classifier resulting from
FLDA of tumor ADC changes and relative tumor growth
improves the discrimination between therapy and control group
substantially compared to the individual use. All tumors, except for
one false negative (therapy group tumor classified as control group
tumor), were classified correctly using the optimal threshold
determined by the ROC curve analysis. This result highlights that
water diffusivity in tumorous tissue potentially reveals insight on
tumor therapy response, but has to be evaluated in a meaningful
way with regard to tumor morphology.
LimitationsThe linear combination of ADC and volume changes calculated
with FLDA and also the thresholds determined with the ROC
curve analyses are specific to the tumor type, the therapy and the
time interval between measurements. These parameters may have
to be reevaluated according to the respective settings. However,
the concept of the method presented in this study to integrate
morphological and functional information as complementing
parameters should remain valid.
For further analysis, it may be possible to gain additional insight
on the tumor physiology by investigating the histogram shape (e.g.
variance or skewness) of the ADC distribution inside the VOI
(Figure 7) if the voxel count of the VOI is sufficiently large (i.e.
several hundred voxels per VOI). Other possible DW-MRI based
evaluations not included in this study are the assessment of
intravoxel incoherent motion [47,48] or diffusional kurtosis
parameters [49].
Conclusions
Using quantitative DW-MRI, we found that therapy of human
colon carcinoma xenografts with the multi-tyrosine kinase
inhibitor regorafenib significantly increased water diffusivity in
tumorous tissue after 6 days of treatment. We also observed that
regorafenib significantly reduced tumor growth compared to the
control group. Using either tumor ADC changes or tumor growth
to distinguish between therapy and control group resulted in
diagnostic accuracy of about 78% and 83%, respectively, which
Figure 7. Exemplary histogram distributions of the voxelwisecalculated ADCs inside the volume of interest for a (a) therapyand (b) control group animal. The median tumor ADC increased inboth cases (therapy: 0.7261023 mm2/s to 0.9161023 mm2/s, control:0.7361023 mm2/s to 0.8261023 mm2/s), however, the therapy tumorgrew by 36%, while the control group tumor grew by 76%.doi:10.1371/journal.pone.0106970.g007
Therapy Monitoring Using DW-MRI and Tumor Volume
PLOS ONE | www.plosone.org 7 September 2014 | Volume 9 | Issue 9 | e106970

we consider not sufficient for an imaging biomarker. The
approach to combine both parameters using Fisher’s linear
discriminant analysis, substantially improved the accuracy to
about 96%, thus highlighting the potential of multi-parameter
MRI as an imaging biomarker for non-invasive early tumor
therapy monitoring.
Supporting Information
Table S1 Voxelwise calculated ADC values for eachanimal and measurement.
(XLSX)
Table S2 Individual tumor ADC values for each animaland measurement.(XLSX)
Table S3 Individual tumor volumes for each animaland measurement.(XLSX)
Author Contributions
Conceived and designed the experiments: CCC MFR KN. Performed the
experiments: MJS CCC KN HH OD. Analyzed the data: MJS CCC KN
HH OD. Contributed reagents/materials/analysis tools: MJS CCC KN
HH MFR OD. Contributed to the writing of the manuscript: MJS CCC
KN HH MFR OD.
References
1. Sohaib A (2012) RECIST rules. Cancer Imaging 12: 345–346.
2. Diederich S (2012) Imaging beyond RECIST: CT and MRI in molecular
therapies. Cancer Imaging 12: 347–350.
3. Ratain MJ, Eckhardt SG (2004) Phase II studies of modern drugs directed
against new targets: if you are fazed, too, then resist RECIST. J Clin Oncol 22:
4442–4445.
4. E. O. Stejskal JET (1965) Spin Diffusion Measurements: Spin Echoes in the
Presence of a Time-Dependent Field Gradient. The Journal of Chemical Physics
42: 288–292.
5. Le Bihan D, Breton E, Lallemand D, Grenier P, Cabanis E, et al. (1986) MR
imaging of intravoxel incoherent motions: application to diffusion and perfusion
in neurologic disorders. Radiology 161: 401–407.
6. Thoeny HC, Ross BD (2010) Predicting and monitoring cancer treatment
response with diffusion-weighted MRI. J Magn Reson Imaging 32: 2–16.
7. Hamstra DA, Rehemtulla A, Ross BD (2007) Diffusion magnetic resonance
imaging: a biomarker for treatment response in oncology. J Clin Oncol 25:
4104–4109.
8. Li SP, Padhani AR (2012) Tumor response assessments with diffusion and
perfusion MRI. J Magn Reson Imaging 35: 745–763.
9. Cyran CC, Paprottka PM, Eisenblatter M, Clevert DA, Rist C, et al. (2014)
Visualization, imaging and new preclinical diagnostics in radiation oncology.
Radiat Oncol 9: 3.
10. Padhani AR, Liu G, Koh DM, Chenevert TL, Thoeny HC, et al. (2009)
Diffusion-weighted magnetic resonance imaging as a cancer biomarker:
consensus and recommendations. Neoplasia 11: 102–125.
11. Patterson DM, Padhani AR, Collins DJ (2008) Technology insight: water
diffusion MRI–a potential new biomarker of response to cancer therapy. Nat
Clin Pract Oncol 5: 220–233.
12. Manenti G, Di Roma M, Mancino S, Bartolucci DA, Palmieri G, et al. (2008)
Malignant renal neoplasms: correlation between ADC values and cellularity in
diffusion weighted magnetic resonance imaging at 3 T. Radiol Med 113: 199–
213.
13. Humphries PD, Sebire NJ, Siegel MJ, Olsen OE (2007) Tumors in pediatric
patients at diffusion-weighted MR imaging: apparent diffusion coefficient and
tumor cellularity. Radiology 245: 848–854.
14. Zelhof B, Pickles M, Liney G, Gibbs P, Rodrigues G, et al. (2009) Correlation of
diffusion-weighted magnetic resonance data with cellularity in prostate cancer.
BJU Int 103: 883–888.
15. Herneth AM, Guccione S, Bednarski M (2003) Apparent diffusion coefficient: a
quantitative parameter for in vivo tumor characterization. Eur J Radiol 45:
208–213.
16. Sumi M, Sakihama N, Sumi T, Morikawa M, Uetani M, et al. (2003)
Discrimination of metastatic cervical lymph nodes with diffusion-weighted MR
imaging in patients with head and neck cancer. AJNR Am J Neuroradiol 24:
1627–1634.
17. Biffar A, Baur-Melnyk A, Schmidt GP, Reiser MF, Dietrich O (2011)
Quantitative analysis of the diffusion-weighted steady-state free precession
signal in vertebral bone marrow lesions. Invest Radiol 46: 601–609.
18. Dzik-Jurasz A, Domenig C, George M, Wolber J, Padhani A, et al. (2002)
Diffusion MRI for prediction of response of rectal cancer to chemoradiation.
Lancet 360: 307–308.
19. DeVries AF, Kremser C, Hein PA, Griebel J, Krezcy A, et al. (2003) Tumor
microcirculation and diffusion predict therapy outcome for primary rectal
carcinoma. Int J Radiat Oncol Biol Phys 56: 958–965.
20. Koh DM, Scurr E, Collins D, Kanber B, Norman A, et al. (2007) Predicting
response of colorectal hepatic metastasis: value of pretreatment apparent
diffusion coefficients. AJR Am J Roentgenol 188: 1001–1008.
21. Cui Y, Zhang XP, Sun YS, Tang L, Shen L (2008) Apparent diffusion
coefficient: potential imaging biomarker for prediction and early detection of
response to chemotherapy in hepatic metastases. Radiology 248: 894–900.
22. Theilmann RJ, Borders R, Trouard TP, Xia G, Outwater E, et al. (2004)Changes in water mobility measured by diffusion MRI predict response of
metastatic breast cancer to chemotherapy. Neoplasia 6: 831–837.
23. Thoeny HC, De Keyzer F, Chen F, Vandecaveye V, Verbeken EK, et al. (2005)Diffusion-weighted magnetic resonance imaging allows noninvasive in vivo
monitoring of the effects of combretastatin a-4 phosphate after repeated
administration. Neoplasia 7: 779–787.
24. Roe K, Kakar M, Seierstad T, Ree AH, Olsen DR (2011) Early prediction of
response to radiotherapy and androgen-deprivation therapy in prostate cancer
by repeated functional MRI: a preclinical study. Radiat Oncol 6: 65.
25. Wybranski C, Zeile M, Lowenthal D, Fischbach F, Pech M, et al. (2011) Value
of diffusion weighted MR imaging as an early surrogate parameter for
evaluation of tumor response to high-dose-rate brachytherapy of colorectal livermetastases. Radiat Oncol 6: 43.
26. Halappa VG, Bonekamp S, Corona-Villalobos CP, Li Z, Mensa M, et al. (2012)
Intrahepatic cholangiocarcinoma treated with local-regional therapy: quantita-tive volumetric apparent diffusion coefficient maps for assessment of tumor
response. Radiology 264: 285–294.
27. Wilhelm SM, Dumas J, Adnane L, Lynch M, Carter CA, et al. (2011)Regorafenib (BAY 73–4506): a new oral multikinase inhibitor of angiogenic,
stromal and oncogenic receptor tyrosine kinases with potent preclinicalantitumor activity. Int J Cancer 129: 245–255.
28. Grothey A, Van Cutsem E, Sobrero A, Siena S, Falcone A, et al. (2013)
Regorafenib monotherapy for previously treated metastatic colorectal cancer(CORRECT): an international, multicentre, randomised, placebo-controlled,
phase 3 trial. Lancet 381: 303–312.
29. Cyran CC, Kazmierczak PM, Hirner H, Moser M, Ingrisch M, et al. (2013)Regorafenib effects on human colon carcinoma xenografts monitored by
dynamic contrast-enhanced computed tomography with immunohistochemicalvalidation. PLoS One 8: e76009.
30. Liimatainen T, Hakumaki JM, Kauppinen RA, Ala-Korpela M (2009)
Monitoring of gliomas in vivo by diffusion MRI and (1)H MRS during genetherapy-induced apoptosis: interrelationships between water diffusion and
mobile lipids. NMR Biomed 22: 272–279.
31. Fisher RA (1936) The Use of Multiple Measurements in Taxonomic Problems.Annals of Eugenics 7: 179–188.
32. Biffar A, Baur-Melnyk A, Schmidt GP, Reiser MF, Dietrich O (2010)
Multiparameter MRI assessment of normal-appearing and diseased vertebralbone marrow. Eur Radiol 20: 2679–2689.
33. Morelli JN, Runge VM, Feiweier T, Kirsch JE, Williams KW, et al. (2010)
Evaluation of a modified Stejskal-Tanner diffusion encoding scheme, permittinga marked reduction in TE, in diffusion-weighted imaging of stroke patients at 3
T. Invest Radiol 45: 29–35.
34. Sourbron S, Biffar A, Ingrisch M, Fierens Y, Luypaert R (2009) PMI: platformfor research in medical imaging. Magn Reson Mater Phy 22: 539.
35. R Development Core Team (2008) R: A Language and Environment for
Statistical Computing. Vienna, Austria: R Foundation for Statistical Computing.
36. Robin X, Turck N, Hainard A, Tiberti N, Lisacek F, et al. (2011) pROC: an
open-source package for R and S+ to analyze and compare ROC curves. BMC
Bioinformatics 12: 77.
37. DeLong ER, DeLong DM, Clarke-Pearson DL (1988) Comparing the areas
under two or more correlated receiver operating characteristic curves: a
nonparametric approach. Biometrics 44: 837–845.
38. Slawski M, Boulesteix A-L, Bernau C (2009) CMA: Synthesis of microarray-
based classification.
39. Gentleman RC, Carey VJ, Bates DM, Bolstad B, Dettling M, et al. (2004)Bioconductor: open software development for computational biology and
bioinformatics. Genome Biol 5: R80.
40. Zhang XY, Sun YS, Tang L, Xue WC, Zhang XP (2011) Correlation ofdiffusion-weighted imaging data with apoptotic and proliferation indexes in
CT26 colorectal tumor homografts in balb/c mouse. J Magn Reson Imaging 33:
1171–1176.
Therapy Monitoring Using DW-MRI and Tumor Volume
PLOS ONE | www.plosone.org 8 September 2014 | Volume 9 | Issue 9 | e106970

41. Kim H, Morgan DE, Buchsbaum DJ, Zeng H, Grizzle WE, et al. (2008) Early
therapy evaluation of combined anti-death receptor 5 antibody and gemcitabinein orthotopic pancreatic tumor xenografts by diffusion-weighted magnetic
resonance imaging. Cancer Res 68: 8369–8376.
42. Huang MQ, Pickup S, Nelson DS, Qiao H, Xu HN, et al. (2008) Monitoringresponse to chemotherapy of non-Hodgkin’s lymphoma xenografts by T(2)-
weighted and diffusion-weighted MRI. NMR Biomed 21: 1021–1029.43. Pickles MD, Gibbs P, Lowry M, Turnbull LW (2006) Diffusion changes precede
size reduction in neoadjuvant treatment of breast cancer. Magn Reson Imaging
24: 843–847.44. Zhai G, Kim H, Sarver D, Samuel S, Whitworth L, et al. (2013) Early therapy
assessment of combined anti-DR5 antibody and carboplatin in triple-negativebreast cancer xenografts in mice using diffusion-weighted imaging and H MR
spectroscopy. J Magn Reson Imaging.
45. Juge L, Doan BT, Seguin J, Albuquerque M, Larrat B, et al. (2012) Colon tumor
growth and antivascular treatment in mice: complementary assessment with MRelastography and diffusion-weighted MR imaging. Radiology 264: 436–444.
46. Abou-Elkacem L, Arns S, Brix G, Gremse F, Zopf D, et al. (2013) Regorafenib
inhibits growth, angiogenesis, and metastasis in a highly aggressive, orthotopiccolon cancer model. Mol Cancer Ther 12: 1322–1331.
47. Le Bihan D, Breton E, Lallemand D, Aubin ML, Vignaud J, et al. (1988)Separation of diffusion and perfusion in intravoxel incoherent motion MR
imaging. Radiology 168: 497–505.
48. Ganten MK, Schuessler M, Bauerle T, Muenter M, Schlemmer HP, et al. (2013)The role of perfusion effects in monitoring of chemoradiotherapy of rectal
carcinoma using diffusion-weighted imaging. Cancer Imaging 13: 548–556.49. Bauer WR, Ziener CH, Jakob PM (2005) Non-Gaussian spin dephasing.
Physical Review A 71.
Therapy Monitoring Using DW-MRI and Tumor Volume
PLOS ONE | www.plosone.org 9 September 2014 | Volume 9 | Issue 9 | e106970