Glioblastoma cancer stem cells: Basis for a functional hypothesis
Modulation of Angiogenic and Inflammatory Responsein Glioblastoma by HypoxiaAnastasia Murat1,2,3, Eugenia Migliavacca3,4, S. Farzana Hussain5, Amy B. Heimberger5, Isabelle
Desbaillets1,2, Marie-France Hamou1,2, Curzio Ruegg3,6, Roger Stupp2, Mauro Delorenzi3,4, Monika E.
Hegi1,2,3*
1 Laboratory of Brain Tumor Biology and Genetics, University Hospital Lausanne (CHUV) and University of Lausanne, Lausanne, Switzerland, 2 Department of
Neurosurgery, University Hospital Lausanne (CHUV) and University of Lausanne, Lausanne, Switzerland, 3 National Center of Competence in Research (NCCR) Molecular
Oncology, ISREC, School of Life Sciences, EPFL, Lausanne, Switzerland, 4 Swiss Institute for Bioinformatics, Lausanne, Switzerland, 5 Department of Neurosurgery, The
University of Texas M. D. Anderson Cancer Center, Houston, Texas, United States of America, 6 Division of Experimental Oncology, Centre Pluridisciplinaire d’Oncologie,
CHUV and University of Lausanne, Lausanne, Switzerland
Abstract
Glioblastoma are rapidly proliferating brain tumors in which hypoxia is readily recognizable, as indicated by focal orextensive necrosis and vascular proliferation, two independent diagnostic criteria for glioblastoma. Gene expressionprofiling of glioblastoma revealed a gene expression signature associated with hypoxia-regulated genes. The correlatedgene set emerging from unsupervised analysis comprised known hypoxia-inducible genes involved in angiogenesis andinflammation such as VEGF and BIRC3, respectively. The relationship between hypoxia-modulated angiogenic genes andinflammatory genes was associated with outcome in our cohort of glioblastoma patients treated within prospective clinicaltrials of combined chemoradiotherapy. The hypoxia regulation of several new genes comprised in this cluster includingZNF395, TNFAIP3, and TREM1 was experimentally confirmed in glioma cell lines and primary monocytes exposed to hypoxiain vitro. Interestingly, the cluster seems to characterize differential response of tumor cells, stromal cells and themacrophage/microglia compartment to hypoxic conditions. Most genes classically associated with the inflammatorycompartment are part of the NF-kappaB signaling pathway including TNFAIP3 and BIRC3 that have been shown to beinvolved in resistance to chemotherapy.
Our results associate hypoxia-driven tumor response with inflammation in glioblastoma, hence underlining theimportance of tumor-host interaction involving the inflammatory compartment.
Citation: Murat A, Migliavacca E, Hussain SF, Heimberger AB, Desbaillets I, et al. (2009) Modulation of Angiogenic and Inflammatory Response in Glioblastoma byHypoxia. PLoS ONE 4(6): e5947. doi:10.1371/journal.pone.0005947
Editor: Chris Jones, Institute of Cancer Research, United Kingdom
Received April 3, 2009; Accepted May 20, 2009; Published June 17, 2009
Copyright: � 2009 Murat et al. This is an open-access article distributed under the terms of the Creative Commons Attribution License, which permitsunrestricted use, distribution, and reproduction in any medium, provided the original author and source are credited.
Funding: This project was supported by the NCCR Molecular Oncology (to MH and MD), the Swiss National Science Foundation (grant 3100AO-108266/1 to MH)and the National Institute of Health (RO1 CA120813 to AH). The funders had no role in study design, data collection and analysis, decision to publish, orpreparation of the manuscript.
Competing Interests: The authors have declared that no competing interests exist.
* E-mail: [email protected]
Introduction
Maintenance of oxygen homeostasis is critical for cell survival.
Hypoxia is a common condition in cancer tissue due to rapid tumor
growth, accompanied by inadequate angiogenesis with formation of
structurally aberrant, leaky blood vessels with poor blood flow and
formation of edema. In fact, such aberrant vascular proliferation
characterized by glomeruloid and garland-like patterns are a
hallmark of glioblastoma [1], the most malignant primary brain
tumor. Cancer cells undergo adaptive changes and are selected for
genetic alterations that allow them to survive and proliferate in a
hypoxic environment. Hypoxia-regulated genes, mediating adap-
tive physiologic changes, include genes regulating the glycolytic
pathway and blood-vessel formation, and genes encoding chemo-
tactic molecules such as CCL2, IL8 and VEGF [2]. In cancer, such
changes are associated with recruitment of macrophages along a
hypoxia-mediated chemotactic gradient. Macrophages recruited to
hypoxic sites exert a tumor-promoting effect through the expression
of genes with mitogenic, angiogenic, and migration/invasion
stimulating properties, such as VEGF, EGF, or HGF [3,4]. The
relative contribution of hypoxia-induced genes expressed by tumor
cells or macrophages to tumor progression is unknown. Tumor
hypoxia is associated with aggressive tumor behavior and worse
outcome in many cancers and its role in driving tumor malignancy
and resistance to therapy is receiving increased attention.
The key mediator of the molecular responses to hypoxia is the
hypoxia-inducible factor-1 (HIF-1), a heterodimeric transcription
factor consisting of an a and a b subunits. In the presence of
oxygen the HIF-1a subunit is hydroxylated, and upon ubiquitina-
tion is targeted to the proteasome for degradation. Under hypoxic
conditions, however, HIF-1a hydroxylation and degradation no
longer occur, since the hydroxylation reaction requires oxygen.
Stabilized, non-hydroxylated HIF-1a translocates to the nucleus
and binds to the hypoxia-response element (HRE) thereby
activating expression of numerous hypoxia-responsive genes [5].
Hypoxia-inducible pathways regulate several biological processes,
including angiogenesis, cell proliferation, metabolism, survival and
apoptosis, immortalization, and migration. Besides hypoxia, HIF-1
PLoS ONE | www.plosone.org 1 June 2009 | Volume 4 | Issue 6 | e5947

can also be activated by growth factor receptors and oncogenic
signaling pathways.
Using gene expression profiling of human gliomas, we have
previously identified angiogenesis/response to hypoxia as one of
the most discriminating features between malignancy grades of
astrocytic glioma [6]. Accordingly, a hypoxia-induced gene
expression signature is a feature of glioblastoma expression profiles
[7,8] which has been reported to classify gliomas into prognostic
groups in some datasets [6,9].
The aim of the present study was to investigate biological and
potential clinical implications of a hypoxia-related gene signature
emerging from our glioblastoma gene expression data set [7]. All
patients were enrolled in a prospective clinical trial of combined
chemoradiotherapy for newly diagnosed glioblastoma [10].
Results
Hypoxia-inducible genes related to angiogenesis andinflammation
Unsupervised analysis of our gene expression data-set derived
from 80 glioblastoma and 4 non-tumoral brain tissues identified
stable gene clusters that were associated with known biological
processes, including a cluster characterized by hypoxia-induced
genes as shown in Figure 1, Table 1. The hypoxia cluster drew our
attention, when we found that the second principle component
(PC) of this cluster was strongly associated with survival
(p = 0.0015; HR, 1.73; 95% CI, 1.23 to 2.43; multivariate analysis
including age, treatment, MGMT-methylation status [a predictive
factor for benefit from temozolomide treatment [11]]), while the
1st PC, as well as the mean expression of the cluster, had no
prognostic value in our cohort of patients. Subsequent investiga-
tion of the loadings (coefficients of the genes) in the PCs of the
hypoxia cluster revealed that the 2nd PC was mainly defined by
two groups of genes: the first characterized by high negative
coefficients and comprising IL8, TREM1, SERPINE1, BIRC3, and
TNFAIP3; the second characterized by high positive coefficients
and consisting of genes such as VEGF, ADM, ZNF395, and KISS1R
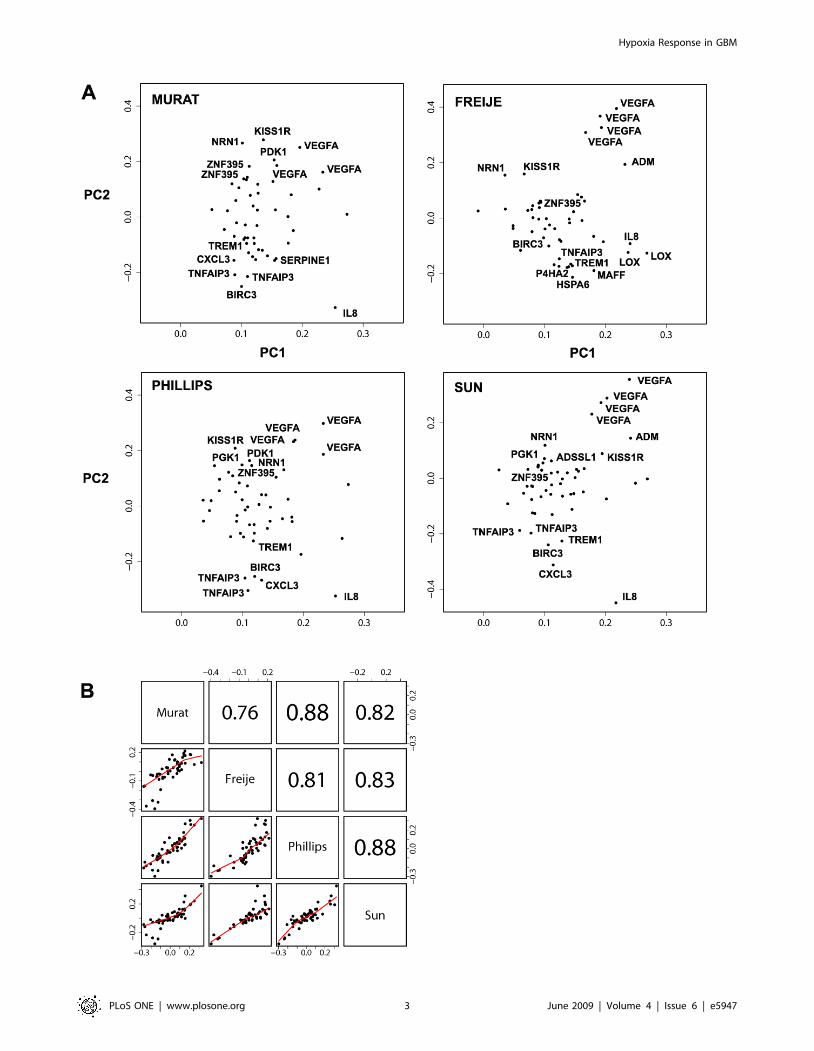
(Fig. 2A). The first group is enriched for inflammation-related
genes, while the second group consists more of universal hypoxia-
regulated genes, including pro-angiogenic factors, such as VEGF
and ADM, in accordance with the gene dendrogram of the
hypoxia cluster (Fig. 1, Table 1). Next we tried to identify
biological features, characterized by gene expression, that might
be correlated with the 2nd PC. In our data-set we identified a list of
genes enriched in inflammatory/innate immune response genes
(e.g. S100A8, S100A9, ITGB2, TLR1) that were anti-correlated
with the 2nd PC, and a list of positively correlated genes
comprising signal transduction-related genes. Samples with lower
2nd PC have higher expression of inflammatory genes and vice
versa. In accordance, our previously published immune response-
related cluster (G24) displayed a similar correlation (20.54,
Pearson correlation of mean expression) with the 2nd PC. The top
anti-correlated genes of the 2nd PC (cut-off at 20.5 correlation)
that passed the initial variation filter, were almost exclusively
clustered in G24 (33/46 genes, Table S1).
To investigate if the two directions that account for the largest
variance in the hypoxia cluster were consistent in different
glioblastoma cohorts, we analyzed three external datasets
[8,9,12] including only samples labeled as glioblastoma (WHO
grade IV) from initial surgery (no other prior therapy). We
performed PC analysis using as descriptive variables 52 probe-sets
from our hypoxia cluster that were common to all datasets
(Table 1). The loading plots of all datasets displayed a similar
influence of the genes to the first two PCs: the group of genes
containing IL8, TREM1, SERPINE1, BIRC3, and TNFAIP3 were
separated from the group containing VEGF, ADM, ZNF395, and
KISS1R in the 2nd PC (Fig. 2A). In particular, most coefficients of
genes in the first group are negative and most coefficients of genes
in the second group are positive in all the four datasets. Hence,
there is a reproducible pattern in which a consistent component of
tumor variability is described by the differential expression of these
two groups of genes.
We observed that the loading vectors for the four datasets were
highly correlated, both for the 1st and the 2nd PC, while there is a
Figure 1. The hypoxia gene cluster. Gene dendrogram and heat map of the hypoxia cluster, showing two main gene groups; G2, enriched forinflammatory genes (yellow bar) and G4, containing angiogenesis-related genes (blue bar). G3 (green bar) is a subcluster of G4 (grey bars markgenes not organized in stable subclusters as defined by CTWC), see Table 1 for detailed cluster information.doi:10.1371/journal.pone.0005947.g001
Hypoxia Response in GBM
PLoS ONE | www.plosone.org 2 June 2009 | Volume 4 | Issue 6 | e5947
Hypoxia Response in GBM
PLoS ONE | www.plosone.org 3 June 2009 | Volume 4 | Issue 6 | e5947
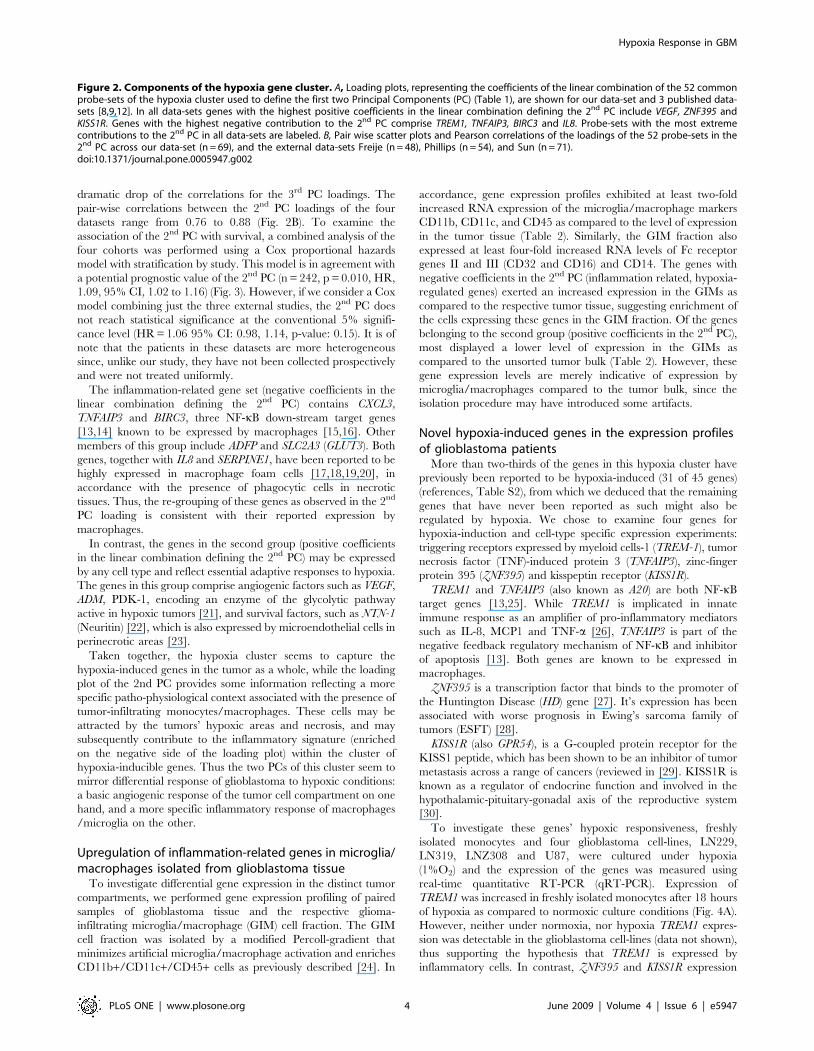
dramatic drop of the correlations for the 3rd PC loadings. The
pair-wise correlations between the 2nd PC loadings of the four
datasets range from 0.76 to 0.88 (Fig. 2B). To examine the
association of the 2nd PC with survival, a combined analysis of the
four cohorts was performed using a Cox proportional hazards
model with stratification by study. This model is in agreement with
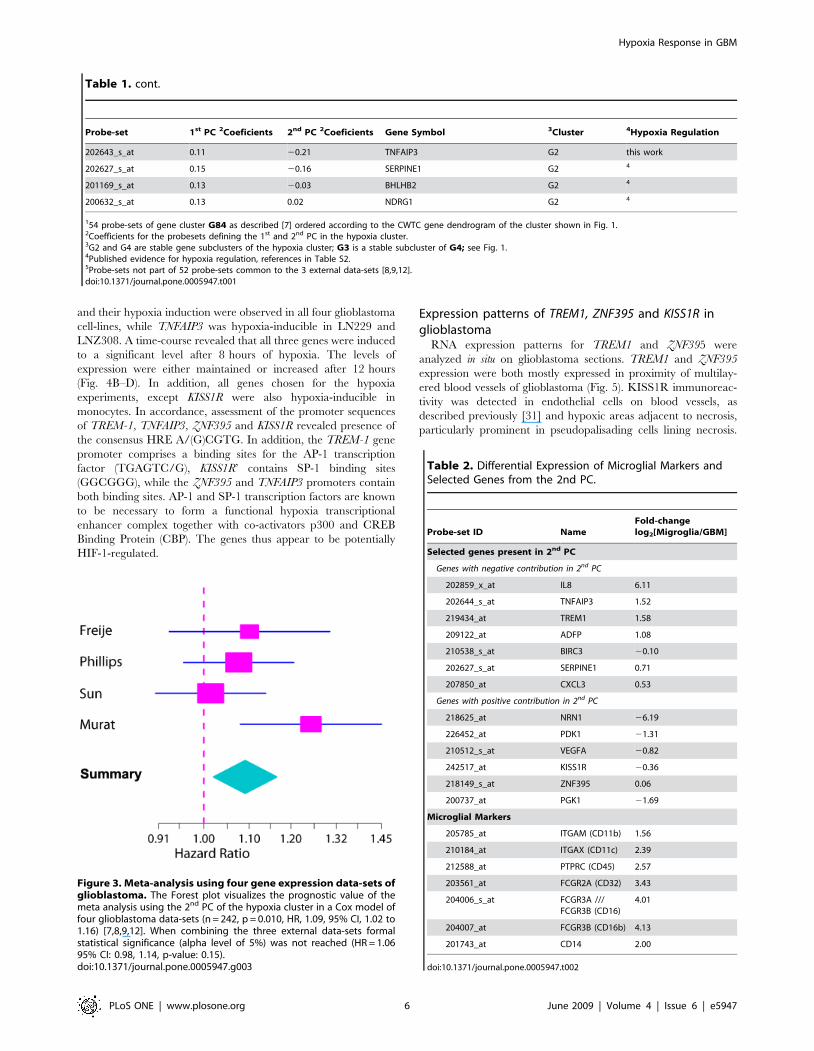
a potential prognostic value of the 2nd PC (n = 242, p = 0.010, HR,
1.09, 95% CI, 1.02 to 1.16) (Fig. 3). However, if we consider a Cox
model combining just the three external studies, the 2nd PC does
not reach statistical significance at the conventional 5% signifi-
cance level (HR = 1.06 95% CI: 0.98, 1.14, p-value: 0.15). It is of
note that the patients in these datasets are more heterogeneous
since, unlike our study, they have not been collected prospectively
and were not treated uniformly.
The inflammation-related gene set (negative coefficients in the
linear combination defining the 2nd PC) contains CXCL3,
TNFAIP3 and BIRC3, three NF-kB down-stream target genes
[13,14] known to be expressed by macrophages [15,16]. Other
members of this group include ADFP and SLC2A3 (GLUT3). Both
genes, together with IL8 and SERPINE1, have been reported to be
highly expressed in macrophage foam cells [17,18,19,20], in
accordance with the presence of phagocytic cells in necrotic
tissues. Thus, the re-grouping of these genes as observed in the 2nd
PC loading is consistent with their reported expression by
macrophages.
In contrast, the genes in the second group (positive coefficients
in the linear combination defining the 2nd PC) may be expressed
by any cell type and reflect essential adaptive responses to hypoxia.
The genes in this group comprise angiogenic factors such as VEGF,
ADM, PDK-1, encoding an enzyme of the glycolytic pathway
active in hypoxic tumors [21], and survival factors, such as NTN-1
(Neuritin) [22], which is also expressed by microendothelial cells in
perinecrotic areas [23].
Taken together, the hypoxia cluster seems to capture the
hypoxia-induced genes in the tumor as a whole, while the loading
plot of the 2nd PC provides some information reflecting a more
specific patho-physiological context associated with the presence of
tumor-infiltrating monocytes/macrophages. These cells may be
attracted by the tumors’ hypoxic areas and necrosis, and may
subsequently contribute to the inflammatory signature (enriched
on the negative side of the loading plot) within the cluster of
hypoxia-inducible genes. Thus the two PCs of this cluster seem to
mirror differential response of glioblastoma to hypoxic conditions:
a basic angiogenic response of the tumor cell compartment on one
hand, and a more specific inflammatory response of macrophages
/microglia on the other.
Upregulation of inflammation-related genes in microglia/macrophages isolated from glioblastoma tissue
To investigate differential gene expression in the distinct tumor
compartments, we performed gene expression profiling of paired
samples of glioblastoma tissue and the respective glioma-
infiltrating microglia/macrophage (GIM) cell fraction. The GIM
cell fraction was isolated by a modified Percoll-gradient that
minimizes artificial microglia/macrophage activation and enriches
CD11b+/CD11c+/CD45+ cells as previously described [24]. In
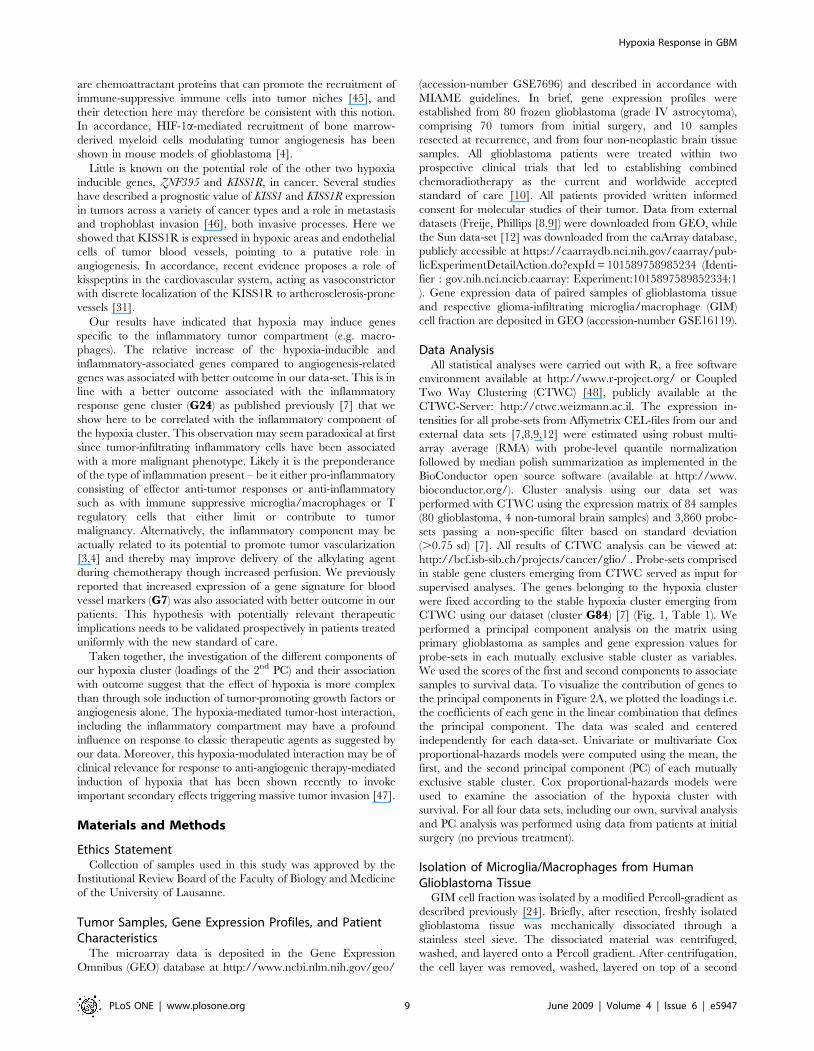
accordance, gene expression profiles exhibited at least two-fold
increased RNA expression of the microglia/macrophage markers
CD11b, CD11c, and CD45 as compared to the level of expression
in the tumor tissue (Table 2). Similarly, the GIM fraction also
expressed at least four-fold increased RNA levels of Fc receptor
genes II and III (CD32 and CD16) and CD14. The genes with
negative coefficients in the 2nd PC (inflammation related, hypoxia-
regulated genes) exerted an increased expression in the GIMs as
compared to the respective tumor tissue, suggesting enrichment of
the cells expressing these genes in the GIM fraction. Of the genes
belonging to the second group (positive coefficients in the 2nd PC),
most displayed a lower level of expression in the GIMs as
compared to the unsorted tumor bulk (Table 2). However, these
gene expression levels are merely indicative of expression by
microglia/macrophages compared to the tumor bulk, since the
isolation procedure may have introduced some artifacts.
Novel hypoxia-induced genes in the expression profilesof glioblastoma patients
More than two-thirds of the genes in this hypoxia cluster have
previously been reported to be hypoxia-induced (31 of 45 genes)
(references, Table S2), from which we deduced that the remaining
genes that have never been reported as such might also be
regulated by hypoxia. We chose to examine four genes for
hypoxia-induction and cell-type specific expression experiments:
triggering receptors expressed by myeloid cells-1 (TREM-1), tumor
necrosis factor (TNF)-induced protein 3 (TNFAIP3), zinc-finger
protein 395 (ZNF395) and kisspeptin receptor (KISS1R).
TREM1 and TNFAIP3 (also known as A20) are both NF-kB
target genes [13,25]. While TREM1 is implicated in innate
immune response as an amplifier of pro-inflammatory mediators
such as IL-8, MCP1 and TNF-a [26], TNFAIP3 is part of the
negative feedback regulatory mechanism of NF-kB and inhibitor
of apoptosis [13]. Both genes are known to be expressed in
macrophages.
ZNF395 is a transcription factor that binds to the promoter of
the Huntington Disease (HD) gene [27]. It’s expression has been
associated with worse prognosis in Ewing’s sarcoma family of
tumors (ESFT) [28].
KISS1R (also GPR54), is a G-coupled protein receptor for the
KISS1 peptide, which has been shown to be an inhibitor of tumor
metastasis across a range of cancers (reviewed in [29]. KISS1R is
known as a regulator of endocrine function and involved in the
hypothalamic-pituitary-gonadal axis of the reproductive system
[30].
To investigate these genes’ hypoxic responsiveness, freshly
isolated monocytes and four glioblastoma cell-lines, LN229,
LN319, LNZ308 and U87, were cultured under hypoxia
(1%O2) and the expression of the genes was measured using
real-time quantitative RT-PCR (qRT-PCR). Expression of
TREM1 was increased in freshly isolated monocytes after 18 hours
of hypoxia as compared to normoxic culture conditions (Fig. 4A).
However, neither under normoxia, nor hypoxia TREM1 expres-
sion was detectable in the glioblastoma cell-lines (data not shown),
thus supporting the hypothesis that TREM1 is expressed by
inflammatory cells. In contrast, ZNF395 and KISS1R expression
Figure 2. Components of the hypoxia gene cluster. A, Loading plots, representing the coefficients of the linear combination of the 52 commonprobe-sets of the hypoxia cluster used to define the first two Principal Components (PC) (Table 1), are shown for our data-set and 3 published data-sets [8,9,12]. In all data-sets genes with the highest positive coefficients in the linear combination defining the 2nd PC include VEGF, ZNF395 andKISS1R. Genes with the highest negative contribution to the 2nd PC comprise TREM1, TNFAIP3, BIRC3 and IL8. Probe-sets with the most extremecontributions to the 2nd PC in all data-sets are labeled. B, Pair wise scatter plots and Pearson correlations of the loadings of the 52 probe-sets in the2nd PC across our data-set (n = 69), and the external data-sets Freije (n = 48), Phillips (n = 54), and Sun (n = 71).doi:10.1371/journal.pone.0005947.g002
Hypoxia Response in GBM
PLoS ONE | www.plosone.org 4 June 2009 | Volume 4 | Issue 6 | e5947
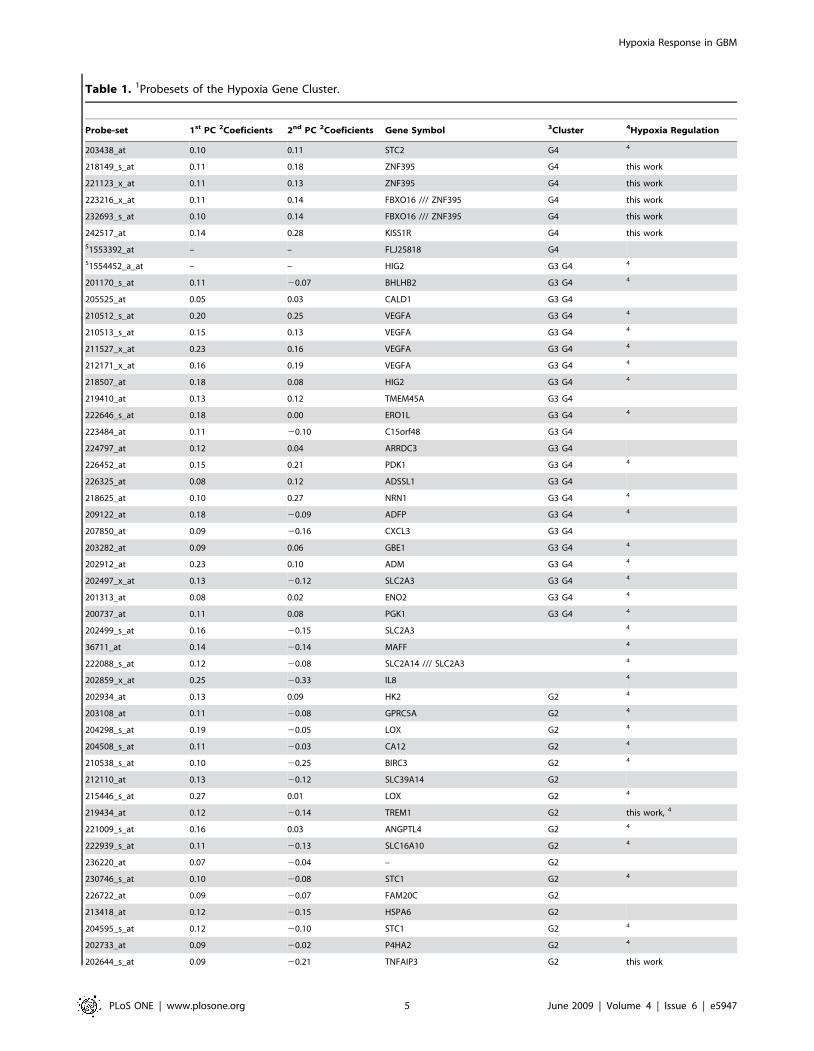
Table 1. 1Probesets of the Hypoxia Gene Cluster.
Probe-set 1st PC 2Coeficients 2nd PC 2Coeficients Gene Symbol 3Cluster 4Hypoxia Regulation
203438_at 0.10 0.11 STC2 G4 4
218149_s_at 0.11 0.18 ZNF395 G4 this work
221123_x_at 0.11 0.13 ZNF395 G4 this work
223216_x_at 0.11 0.14 FBXO16 /// ZNF395 G4 this work
232693_s_at 0.10 0.14 FBXO16 /// ZNF395 G4 this work
242517_at 0.14 0.28 KISS1R G4 this work
51553392_at – – FLJ25818 G4
51554452_a_at – – HIG2 G3 G4 4
201170_s_at 0.11 20.07 BHLHB2 G3 G4 4
205525_at 0.05 0.03 CALD1 G3 G4
210512_s_at 0.20 0.25 VEGFA G3 G4 4
210513_s_at 0.15 0.13 VEGFA G3 G4 4
211527_x_at 0.23 0.16 VEGFA G3 G4 4
212171_x_at 0.16 0.19 VEGFA G3 G4 4
218507_at 0.18 0.08 HIG2 G3 G4 4
219410_at 0.13 0.12 TMEM45A G3 G4
222646_s_at 0.18 0.00 ERO1L G3 G4 4
223484_at 0.11 20.10 C15orf48 G3 G4
224797_at 0.12 0.04 ARRDC3 G3 G4
226452_at 0.15 0.21 PDK1 G3 G4 4
226325_at 0.08 0.12 ADSSL1 G3 G4
218625_at 0.10 0.27 NRN1 G3 G4 4
209122_at 0.18 20.09 ADFP G3 G4 4
207850_at 0.09 20.16 CXCL3 G3 G4
203282_at 0.09 0.06 GBE1 G3 G4 4
202912_at 0.23 0.10 ADM G3 G4 4
202497_x_at 0.13 20.12 SLC2A3 G3 G4 4
201313_at 0.08 0.02 ENO2 G3 G4 4
200737_at 0.11 0.08 PGK1 G3 G4 4
202499_s_at 0.16 20.15 SLC2A3 4
36711_at 0.14 20.14 MAFF 4
222088_s_at 0.12 20.08 SLC2A14 /// SLC2A3 4
202859_x_at 0.25 20.33 IL8 4
202934_at 0.13 0.09 HK2 G2 4
203108_at 0.11 20.08 GPRC5A G2 4
204298_s_at 0.19 20.05 LOX G2 4
204508_s_at 0.11 20.03 CA12 G2 4
210538_s_at 0.10 20.25 BIRC3 G2 4
212110_at 0.13 20.12 SLC39A14 G2
215446_s_at 0.27 0.01 LOX G2 4
219434_at 0.12 20.14 TREM1 G2 this work, 4
221009_s_at 0.16 0.03 ANGPTL4 G2 4
222939_s_at 0.11 20.13 SLC16A10 G2 4
236220_at 0.07 20.04 – G2
230746_s_at 0.10 20.08 STC1 G2 4
226722_at 0.09 20.07 FAM20C G2
213418_at 0.12 20.15 HSPA6 G2
204595_s_at 0.12 20.10 STC1 G2 4
202733_at 0.09 20.02 P4HA2 G2 4
202644_s_at 0.09 20.21 TNFAIP3 G2 this work
Hypoxia Response in GBM
PLoS ONE | www.plosone.org 5 June 2009 | Volume 4 | Issue 6 | e5947
and their hypoxia induction were observed in all four glioblastoma
cell-lines, while TNFAIP3 was hypoxia-inducible in LN229 and
LNZ308. A time-course revealed that all three genes were induced
to a significant level after 8 hours of hypoxia. The levels of
expression were either maintained or increased after 12 hours
(Fig. 4B–D). In addition, all genes chosen for the hypoxia
experiments, except KISS1R were also hypoxia-inducible in
monocytes. In accordance, assessment of the promoter sequences
of TREM-1, TNFAIP3, ZNF395 and KISS1R revealed presence of
the consensus HRE A/(G)CGTG. In addition, the TREM-1 gene
promoter comprises a binding sites for the AP-1 transcription
factor (TGAGTC/G), KISS1R’ contains SP-1 binding sites
(GGCGGG), while the ZNF395 and TNFAIP3 promoters contain
both binding sites. AP-1 and SP-1 transcription factors are known
to be necessary to form a functional hypoxia transcriptional
enhancer complex together with co-activators p300 and CREB
Binding Protein (CBP). The genes thus appear to be potentially
HIF-1-regulated.
Expression patterns of TREM1, ZNF395 and KISS1R inglioblastoma
RNA expression patterns for TREM1 and ZNF395 were
analyzed in situ on glioblastoma sections. TREM1 and ZNF395
expression were both mostly expressed in proximity of multilay-
ered blood vessels of glioblastoma (Fig. 5). KISS1R immunoreac-
tivity was detected in endothelial cells on blood vessels, as
described previously [31] and hypoxic areas adjacent to necrosis,
particularly prominent in pseudopalisading cells lining necrosis.
Table 1. cont.
Probe-set 1st PC 2Coeficients 2nd PC 2Coeficients Gene Symbol 3Cluster 4Hypoxia Regulation
202643_s_at 0.11 20.21 TNFAIP3 G2 this work
202627_s_at 0.15 20.16 SERPINE1 G2 4
201169_s_at 0.13 20.03 BHLHB2 G2 4
200632_s_at 0.13 0.02 NDRG1 G2 4
154 probe-sets of gene cluster G84 as described [7] ordered according to the CWTC gene dendrogram of the cluster shown in Fig. 1.2Coefficients for the probesets defining the 1st and 2nd PC in the hypoxia cluster.3G2 and G4 are stable gene subclusters of the hypoxia cluster; G3 is a stable subcluster of G4; see Fig. 1.4Published evidence for hypoxia regulation, references in Table S2.5Probe-sets not part of 52 probe-sets common to the 3 external data-sets [8,9,12].doi:10.1371/journal.pone.0005947.t001
Figure 3. Meta-analysis using four gene expression data-sets ofglioblastoma. The Forest plot visualizes the prognostic value of themeta analysis using the 2nd PC of the hypoxia cluster in a Cox model offour glioblastoma data-sets (n = 242, p = 0.010, HR, 1.09, 95% CI, 1.02 to1.16) [7,8,9,12]. When combining the three external data-sets formalstatistical significance (alpha level of 5%) was not reached (HR = 1.0695% CI: 0.98, 1.14, p-value: 0.15).doi:10.1371/journal.pone.0005947.g003
Table 2. Differential Expression of Microglial Markers andSelected Genes from the 2nd PC.
Probe-set ID NameFold-changelog2[Migroglia/GBM]
Selected genes present in 2nd PC
Genes with negative contribution in 2nd PC
202859_x_at IL8 6.11
202644_s_at TNFAIP3 1.52
219434_at TREM1 1.58
209122_at ADFP 1.08
210538_s_at BIRC3 20.10
202627_s_at SERPINE1 0.71
207850_at CXCL3 0.53
Genes with positive contribution in 2nd PC
218625_at NRN1 26.19
226452_at PDK1 21.31
210512_s_at VEGFA 20.82
242517_at KISS1R 20.36
218149_s_at ZNF395 0.06
200737_at PGK1 21.69
Microglial Markers
205785_at ITGAM (CD11b) 1.56
210184_at ITGAX (CD11c) 2.39
212588_at PTPRC (CD45) 2.57
203561_at FCGR2A (CD32) 3.43
204006_s_at FCGR3A ///FCGR3B (CD16)
4.01
204007_at FCGR3B (CD16b) 4.13
201743_at CD14 2.00
doi:10.1371/journal.pone.0005947.t002
Hypoxia Response in GBM
PLoS ONE | www.plosone.org 6 June 2009 | Volume 4 | Issue 6 | e5947

For comparison, expression of KDR/VEGFR-2, an angiogenic
marker expressed by endothelial cells; CD11b, a monocyte/
macrophage marker; and CD45, a pan-leukocyte marker were
determined by immunohistochemistry on sequential frozen
sections of a glioblastoma used for the in situ hybridization (Fig 5).
Discussion
Investigating a hypoxia-related gene expression signature in
glioblastoma we observed two classes of hypoxia-induced genes.
The first class, reflecting a common response to hypoxia, includes
genes involved in regulating angiogenesis and glycolytic metabo-
lism. The second group comprises genes more commonly
expressed in the macrophage/microglia compartment, in accor-
dance with the gene expression profiles of paired samples of
glioblastoma and the respective GIM fraction. This second class of
genes might reflect the presence of the tumor infiltrating
macrophages attracted to hypoxic sites in the tumors. A similar
expression pattern was confirmed in independent, published
glioblastoma data-sets. Most interestingly, the 2nd PC of the
hypoxia cluster was associated with inferior outcome in our dataset
of prospectively and homogenously treated glioblastoma patients.
A weak trend in the same direction was observed when combining
3 independent external glioblastoma datasets. The weaker signal
may be expected given the fact of various treatments, in particular
for the chemotherapy component. Our patient cohort was treated
homogenously adding an alkylating agent, temozolomide, con-
comitant and adjuvant to standard radiation, a regimen
demonstrated to have improved efficiency.
The importance of the inflammatory response or the involve-
ment of tumor-associated macrophages in tumor promotion have
been widely described, but not in the perspective of hypoxia-
induced tumor resistance. Although acute hypoxia can induce cell
death, exposure to chronic or repeated hypoxia can initiate
adaptive changes and select for genetic alterations in tumors that
allow survival and proliferation in a hypoxic environment. Our
analysis of expression profiles from four independent glioblastoma
datasets suggests that hypoxia may induce TREM1, TNFAIP3 and
BIRC3 in the inflammatory compartment. BIRC3 and TNFAIP3
are known anti-apoptotic factors involved in the NF-kB pathway.
Interestingly, both have been implicated in conferring resistance to
apoptosis induced by anticancer drugs. BIRC3 is highly expressed
in cisplatin-resistant prostate cancer cell lines [32], and in
doxorubicine- and busulfan-resistant leukaemia cell lines [33,34]
while TNFAIP3 is overexpressed in tamoxifen-resistant breast
carcinoma cell lines [35] and part of a signature for resistance to
Figure 4. Hypoxia induction of TREM1, ZNF395 and KISS1R. A, TREM1 expression in primary isolated monocytes under normoxia or 18 hourshypoxia (1% O2); B, ZNF395; C, KISS1R and D, TNFAIP3 expression in four different glioblastoma cell-lines (LN229, LNZ308, LN319, and U87) undernormoxia and after 8, and 12 hours of hypoxia (1% O2). All results are normalized to expression of the RNA polymerase II (POLR2A) gene. Error barsrepresenting standard deviation of triplicate qRT-PCR measurements. Histograms are representative of three independent experiments.doi:10.1371/journal.pone.0005947.g004
Hypoxia Response in GBM
PLoS ONE | www.plosone.org 7 June 2009 | Volume 4 | Issue 6 | e5947

alkylating agents in glioblastoma cells [36]. Hence, resistance to
hypoxia may also trigger resistance to anticancer treatment.
Evidence from clinical and experimental studies have indicated
that macrophages can promote tumor progression and metastasis
[37]. Macrophages are recruited to the tumor microenvironment
by growth factors and chemokines, such as CSF-1, TGF-b, and
MCP-1 produced by the tumor cells themselves or cells of the
microenvironment, similar to those expressed upon challenge by
pathogens or wounding. Once recruited, tumor-educated macro-
phages take on non-immunological functions, in particular the
production of factors that promote progression of tumors to a
more malignant state through paracrine cues, including angio-
genic factors (VEGF, TNF-a, ANG1), proteases (MMPs), growth
factors (FGF, PDGF, TGF-b), and motility factors (EGF, HGF)
[3]. Similar to amplifying the immune response, TREM1 may
have a role in amplifying these processes in tumors. During innate
immune response, engagement of TREM1 stimulates phagocytes
to secrete pro-inflammatory cytokines and chemokines, such as IL-
8, MCP-1, TNF-a and IL-1 [26]. Interestingly, some of these
tumor-promoting factors are also expressed by glioblastoma cells
themselves [38,39,40]. TREM1 has been shown to be upregulated
only in infectious inflammatory responses, but not in non-
microbial inflammatory processes [41]. However, in tumors or
more likely in tumor-associated macrophages according to our
results, TREM1 may also be induced by hypoxia. High expression
of TREM1 in tumor-associated macrophages was reported to
correlate with cancer recurrence and poor survival in patients with
non-small cell lung cancer [42]. TREM1 expression in macro-
phages is also regulated by NF-kB at the transcriptional level [25]
again emphasizing the contribution of NF-kB pathway activation
in bridging inflammation and tumor promotion and progression.
It is known from a number of studies that hypoxia activates NF-
kB, and NF-kB has been described to promote malignancy in
inflammation-associated cancers by means of its cytoprotective
and anti-apoptotic properties [43]. In these cancers, the activation
state of NF-kB is controlled by pro-inflammatory mediators
produced by neighboring inflammatory cells. In glioblastoma, NF-
kB could thus be activated in a similar way, in addition to
constitutive NF-kB activity reported from various glioma cell lines
and primary cultures from tumor tissue [44]. Of interest is also
that S100A8 and S100A9 transcripts were found correlated with
the inflammatory component in the 2nd PC. S100A8 and S100A9
Figure 5. Expression patterns of hypoxia inducible genes in glioblastoma. A, In-situ hybridization (ISH) using TREM1 and ZNF395 anti-senseprobes on sequential frozen sections. Pictures were taken from the same region in proximity to a multilayered blood vessel, and an intermittentregion, respectively. A respective sense probe (s_probe) was used as negative control. The perinuclear signal for the probes is black-purple (BCIP/NBT), the nuclei are counterstained with methyl green (light blue/green). KISS1R expression was determined by immunohistochemistry (IHC) onparaffin sections: the top panel displays immunoreactivity of the multilayered blood vessel and adjacent cells situated next to a necrosis (originalmagnification 640), (middle panel, lower magnification). The bottom panel shows KISSR1 expression in pseudopalisading cells lining a necrosis(original magnification 610). B, IHC against CD11b, a marker for macrophages; CD45, a marker for leukocytes, and KDR that is predominantlyexpressed by endothelial cells, was performed on sequential sections used for ISH of TREM1 and ZNF395 and pictures were taken from the sameregion close to a multilayered aberrant blood vessel. Original magnifications, 640.doi:10.1371/journal.pone.0005947.g005
Hypoxia Response in GBM
PLoS ONE | www.plosone.org 8 June 2009 | Volume 4 | Issue 6 | e5947
are chemoattractant proteins that can promote the recruitment of
immune-suppressive immune cells into tumor niches [45], and
their detection here may therefore be consistent with this notion.
In accordance, HIF-1a-mediated recruitment of bone marrow-
derived myeloid cells modulating tumor angiogenesis has been
shown in mouse models of glioblastoma [4].
Little is known on the potential role of the other two hypoxia
inducible genes, ZNF395 and KISS1R, in cancer. Several studies
have described a prognostic value of KISS1 and KISS1R expression
in tumors across a variety of cancer types and a role in metastasis
and trophoblast invasion [46], both invasive processes. Here we
showed that KISS1R is expressed in hypoxic areas and endothelial
cells of tumor blood vessels, pointing to a putative role in
angiogenesis. In accordance, recent evidence proposes a role of
kisspeptins in the cardiovascular system, acting as vasoconstrictor
with discrete localization of the KISS1R to artherosclerosis-prone
vessels [31].
Our results have indicated that hypoxia may induce genes
specific to the inflammatory tumor compartment (e.g. macro-
phages). The relative increase of the hypoxia-inducible and
inflammatory-associated genes compared to angiogenesis-related
genes was associated with better outcome in our data-set. This is in
line with a better outcome associated with the inflammatory
response gene cluster (G24) as published previously [7] that we
show here to be correlated with the inflammatory component of
the hypoxia cluster. This observation may seem paradoxical at first
since tumor-infiltrating inflammatory cells have been associated
with a more malignant phenotype. Likely it is the preponderance
of the type of inflammation present – be it either pro-inflammatory
consisting of effector anti-tumor responses or anti-inflammatory
such as with immune suppressive microglia/macrophages or T
regulatory cells that either limit or contribute to tumor
malignancy. Alternatively, the inflammatory component may be
actually related to its potential to promote tumor vascularization
[3,4] and thereby may improve delivery of the alkylating agent
during chemotherapy though increased perfusion. We previously
reported that increased expression of a gene signature for blood
vessel markers (G7) was also associated with better outcome in our
patients. This hypothesis with potentially relevant therapeutic
implications needs to be validated prospectively in patients treated
uniformly with the new standard of care.
Taken together, the investigation of the different components of
our hypoxia cluster (loadings of the 2nd PC) and their association
with outcome suggest that the effect of hypoxia is more complex
than through sole induction of tumor-promoting growth factors or
angiogenesis alone. The hypoxia-mediated tumor-host interaction,
including the inflammatory compartment may have a profound
influence on response to classic therapeutic agents as suggested by
our data. Moreover, this hypoxia-modulated interaction may be of
clinical relevance for response to anti-angiogenic therapy-mediated
induction of hypoxia that has been shown recently to invoke
important secondary effects triggering massive tumor invasion [47].
Materials and Methods
Ethics StatementCollection of samples used in this study was approved by the
Institutional Review Board of the Faculty of Biology and Medicine
of the University of Lausanne.
Tumor Samples, Gene Expression Profiles, and PatientCharacteristics
The microarray data is deposited in the Gene Expression
Omnibus (GEO) database at http://www.ncbi.nlm.nih.gov/geo/
(accession-number GSE7696) and described in accordance with
MIAME guidelines. In brief, gene expression profiles were
established from 80 frozen glioblastoma (grade IV astrocytoma),
comprising 70 tumors from initial surgery, and 10 samples
resected at recurrence, and from four non-neoplastic brain tissue
samples. All glioblastoma patients were treated within two
prospective clinical trials that led to establishing combined
chemoradiotherapy as the current and worldwide accepted
standard of care [10]. All patients provided written informed
consent for molecular studies of their tumor. Data from external
datasets (Freije, Phillips [8,9]) were downloaded from GEO, while
the Sun data-set [12] was downloaded from the caArray database,
publicly accessible at https://caarraydb.nci.nih.gov/caarray/pub-
licExperimentDetailAction.do?expId = 101589758985234 (Identi-
fier : gov.nih.nci.ncicb.caarray: Experiment:1015897589852334:1
). Gene expression data of paired samples of glioblastoma tissue
and respective glioma-infiltrating microglia/macrophage (GIM)
cell fraction are deposited in GEO (accession-number GSE16119).
Data AnalysisAll statistical analyses were carried out with R, a free software
environment available at http://www.r-project.org/ or Coupled
Two Way Clustering (CTWC) [48], publicly available at the
CTWC-Server: http://ctwc.weizmann.ac.il. The expression in-
tensities for all probe-sets from Affymetrix CEL-files from our and
external data sets [7,8,9,12] were estimated using robust multi-
array average (RMA) with probe-level quantile normalization
followed by median polish summarization as implemented in the
BioConductor open source software (available at http://www.
bioconductor.org/). Cluster analysis using our data set was
performed with CTWC using the expression matrix of 84 samples
(80 glioblastoma, 4 non-tumoral brain samples) and 3,860 probe-
sets passing a non-specific filter based on standard deviation
(.0.75 sd) [7]. All results of CTWC analysis can be viewed at:
http://bcf.isb-sib.ch/projects/cancer/glio/ . Probe-sets comprised
in stable gene clusters emerging from CTWC served as input for
supervised analyses. The genes belonging to the hypoxia cluster
were fixed according to the stable hypoxia cluster emerging from
CTWC using our dataset (cluster G84) [7] (Fig. 1, Table 1). We
performed a principal component analysis on the matrix using
primary glioblastoma as samples and gene expression values for
probe-sets in each mutually exclusive stable cluster as variables.
We used the scores of the first and second components to associate
samples to survival data. To visualize the contribution of genes to
the principal components in Figure 2A, we plotted the loadings i.e.
the coefficients of each gene in the linear combination that defines
the principal component. The data was scaled and centered
independently for each data-set. Univariate or multivariate Cox
proportional-hazards models were computed using the mean, the
first, and the second principal component (PC) of each mutually
exclusive stable cluster. Cox proportional-hazards models were
used to examine the association of the hypoxia cluster with
survival. For all four data sets, including our own, survival analysis
and PC analysis was performed using data from patients at initial
surgery (no previous treatment).
Isolation of Microglia/Macrophages from HumanGlioblastoma Tissue
GIM cell fraction was isolated by a modified Percoll-gradient as
described previously [24]. Briefly, after resection, freshly isolated
glioblastoma tissue was mechanically dissociated through a
stainless steel sieve. The dissociated material was centrifuged,
washed, and layered onto a Percoll gradient. After centrifugation,
the cell layer was removed, washed, layered on top of a second
Hypoxia Response in GBM
PLoS ONE | www.plosone.org 9 June 2009 | Volume 4 | Issue 6 | e5947
gradient and centrifuged. Microglia/macrophages were collected
from the interphase between the 1.065-g/ml and 1.03-g/ml layers.
Glioblastoma Cell Lines and Human MonocytesHuman glioblastoma cell lines were grown in high glucose
Dulbecco’s Modified Eagle Medium (DMEM) (Invitrogen)
supplemented with 100 units/ml penicillin, 100 mg/ml strepto-
mycin and 5% fetal calf serum (FCS, Bioconcept). Human
peripheral blood lymphocytes and monocytes were purified from
dextran-sedimented leukocytes. The monocytic and lymphocytic
fractions were obtained using the Nycoprep protocol. Cells were
maintained under normoxic condition in a humidified incubator,
21% O2/5% CO2 at 37uC.
Culture under Hypoxic ConditionMonocytes (16106) were plated in 3.5 cm tissue culture dishes,
incubated under normoxic or hypoxic conditions for 18 hours. For
hypoxic conditions, cells were incubated in an Oxoid Gas
anaerobic system chamber (Unipath Ltd., Hampshire, UK) using
1% O2, 94% N2, 5% CO2. Glioblastoma cells lines were plated in
10 cm tissue culture dishes. When the cultures reached 80%
confluence, fresh culture medium was added and cells were
incubated under normoxic or hypoxic conditions as indicated.
RNA extraction & qRT-PCRTotal RNA was extracted using the Qiagen RNeasy total RNA
extraction kit (Qiagen) and reverse transcribed using random
hexamers and Superscript RT II (Invitrogen). Quantitative real
time PCR was performed in triplicates using the QuantiTect
SYBR Green PCR-kit (Qiagen) on a LightCycler 2.0 Instrument
(Roche Applied Science). Primer sequences were as follows:
TREM-1 (59-GCAGATAATAAGGGACGGAGA-39; 59–
CCACTTGGACTGGATGG–39), ZNF395 (59–CTGCATG-
GAAGTCAAAGGAA–39; 59–AACCCAATGTCTGAGG-
GAAC–39), POLR2A (RefSeq ID NM_000937) (59–CTGCCAA-
CACAGCCATCTAC–39; 59–TCACCCATTCCTGATCCT-
CT–39) and TNFAIP3 as previously published [36]. Quantitect
Primers (Qiagen) were used for KISS1R. The following PCR
conditions were used: 95uC, 15 minutes; 45 cycles at 94uC,
30 seconds; 50uC, 30 seconds; 72uC, 20 seconds. The measured
transcript abundance was normalized to the level of POLR2A
(RNA Polymerase II) for all samples.
In situ Hybridization and ImmunohistochemistryFragments of the TREM-1 and ZNF395 cDNAs were obtained
by PCR using specific primers (TREM-1: forward 59-
TTGTCTCAGAACTCCGAGCTGC-39, reverse 59-GAGA-
CATCGGCAGTTGACTTGG-39; ZNF395: forward 59-
TTTTGGTTCTCCCCAAACTG-3, reverse 59-GGTGGAA-
GAGCAGACAGAGG-39). PCR products were purified and
cloned into pBluescript-KS-M13+. Digoxigenin-11-UTP (DIG)-
labeled riboprobes were synthesized from 6baI or PstI linearized
plasmids by in vitro transcription reaction with T7 or Sp6
polymerase and with incorporation of DIG, and used for in situ
hybridization as described (protocol Roche Applied Science).
Briefly, freshly cut frozen sections were fixed with 4% parafor-
maldehyde and hybridized with 0.4 ng/ml riboprobes in hybrid-
ization buffer (50% formamide, 46SSC, 10% dextran sulfate, 16Denhardts solution, 2 mM EDTA, and 500 mg/ml sheared
salmon sperm DNA) at 45uC overnight, followed by increasingly
stringent washes of SSC to 0.026, immunodetection using anti-
DIG antibody (1:200 dilution), and stained by a combination of
BCIP (5-Bromo-4-Chloro-39-Indolyphosphate p-Toluidine Salt)
and NBT (Nitro-Blue Tetrazolium Chloride) (Roche Applied
Science). Slides were subsequently counterstained with methyl
green.
Immunohistochemistry for CD11b (Pharmingen, dilution
1:100), CD45 (DAKO, dilution 1:100) and KDR (Santa Cruz,
dilution 1:500) were performed on 5 mm frozen sections according
to standard procedures using 5 min cold acetone fixation and
1 hour incubation with the primary antibody. Expresssion of
KISS1R was evaluated on paraffin embedded glioblastoma
samples (NOVUS Biologicals, GPR54 antibody, dilution 1:500)
according to standard procedures using high temperature epitope
retrieval (citrate buffer pH 6.0, pressure cooker 20 min).
Supporting Information
Table S1
Found at: doi:10.1371/journal.pone.0005947.s001 (0.06 MB
DOC)
Table S2
Found at: doi:10.1371/journal.pone.0005947.s002 (0.12 MB
DOC)
Acknowledgments
We thank our colleagues from Neurosurgery for providing fresh tumor
tissue and Robert Janzer for helpful discussions.
Author Contributions
Conceived and designed the experiments: AM MH. Performed the
experiments: AM FH MFH. Analyzed the data: AM EM ID MD.
Contributed reagents/materials/analysis tools: FH ABH RS. Wrote the
paper: AM EM ABH CR MH. Clinical input: RS.
References
1. Plate KH, Breier G, Weich HA, Risau W (1992) Vascular endothelial growth
factor is a potential tumour angiogenesis factor in human gliomas in vivo. Nature
359: 845–848.
2. Shweiki D, Itin A, Soffer D, Keshet E (1992) Vascular endothelial growth factor
induced by hypoxia may mediate hypoxia-initiated angiogenesis. Nature 359:
843–845.
3. Lewis CE, Pollard JW (2006) Distinct role of macrophages in different tumor
microenvironments. Cancer Res 66: 605–612.
4. Du R, Lu KV, Petritsch C, Liu P, Ganss R, et al. (2008) HIF1alpha induces the
recruitment of bone marrow-derived vascular modulatory cells to regulate tumor
angiogenesis and invasion. Cancer Cell 13: 206–220.
5. Semenza GL (1999) Regulation of mammalian O2 homeostasis by hypoxia-
inducible factor 1. Annu Rev Cell Dev Biol 15: 551–578.
6. Godard S, Getz G, Delorenzi M, Farmer P, Kobayashi H, et al. (2003)
Classification of human astrocytic gliomas on the basis of gene expression: a
correlated group of genes with angiogenic activity emerges as a strong predictor
of subtypes. Cancer Res 63: 6613–6625.
7. Murat A, Migliavacca E, Gorlia T, Lambiv WL, Shay T, et al. (2008) Stem cell-
related ‘‘self-renewal’’ signature and high epidermal growth factor receptor
expression associated with resistance to concomitant chemoradiotherapy in
glioblastoma. J Clin Oncol 26: 3015–3024.
8. Phillips HS, Kharbanda S, Chen R, Forrest WF, Soriano RH, et al. (2006)
Molecular subclasses of high-grade glioma predict prognosis, delineate a pattern
of disease progression, and resemble stages in neurogenesis. Cancer Cell 9:
157–173.
9. Freije WA, Castro-Vargas FE, Fang Z, Horvath S, Cloughesy T, et al. (2004)
Gene expression profiling of gliomas strongly predicts survival. Cancer Res 64:
6503–6510.
10. Stupp R, Mason WP, van den Bent MJ, Weller M, Fisher B, et al. (2005)
Radiotherapy plus concomitant and adjuvant temozolomide for glioblastoma.
N Engl J Med 352: 987–996.
11. Hegi ME, Diserens AC, Gorlia T, Hamou MF, de Tribolet N, et al. (2005)
MGMT gene silencing and benefit from temozolomide in glioblastoma. New
Engl J Med 352: 997–1003.
Hypoxia Response in GBM
PLoS ONE | www.plosone.org 10 June 2009 | Volume 4 | Issue 6 | e5947

12. Sun L, Hui AM, Su Q, Vortmeyer A, Kotliarov Y, et al. (2006) Neuronal and
glioma-derived stem cell factor induces angiogenesis within the brain. Cancer
Cell 9: 287–300.
13. Beyaert R, Heyninck K, Van Huffel S (2000) A20 and A20-binding proteins as
cellular inhibitors of nuclear factor-kappa B-dependent gene expression and
apoptosis. Biochem Pharmacol 60: 1143–1151.
14. Chu ZL, McKinsey TA, Liu L, Gentry JJ, Malim MH, et al. (1997) Suppression
of tumor necrosis factor-induced cell death by inhibitor of apoptosis c-IAP2 is
under NF-kappaB control. Proc Natl Acad Sci U S A 94: 10057–10062.
15. Li HL, Wang AB, Zhang R, Wei YS, Chen HZ, et al. (2006) A20 inhibits
oxidized low-density lipoprotein-induced apoptosis through negative Fas/Fas
ligand-dependent activation of caspase-8 and mitochondrial pathways in murine
RAW264.7 macrophages. J Cell Physiol 208: 307–318.
16. Manderscheid M, Messmer UK, Franzen R, Pfeilschifter J (2001) Regulation of
inhibitor of apoptosis expression by nitric oxide and cytokines: relation to
apoptosis induction in rat mesangial cells and raw 264.7 macrophages. J Am Soc
Nephrol 12: 1151–1163.
17. Bostrom P, Magnusson B, Svensson PA, Wiklund O, Boren J, et al. (2006)
Hypoxia converts human macrophages into triglyceride-loaded foam cells.
Arterioscler Thromb Vasc Biol 26: 1871–1876.
18. Fu Y, Maianu L, Melbert BR, Garvey WT (2004) Facilitative glucose transporter
gene expression in human lymphocytes, monocytes, and macrophages: a role for
GLUT isoforms 1, 3, and 5 in the immune response and foam cell formation.
Blood Cells Mol Dis 32: 182–190.
19. Wang N, Tabas I, Winchester R, Ravalli S, Rabbani LE, et al. (1996) Interleukin
8 is induced by cholesterol loading of macrophages and expressed by
macrophage foam cells in human atheroma. J Biol Chem 271: 8837–8842.
20. Colli S, Lalli M, Rise P, Mussoni L, Eligini S, et al. (1999) Increased
thrombogenic potential of human monocyte-derived macrophages spontane-
ously transformed into foam cells. Thromb Haemost 81: 576–581.
21. Koukourakis MI, Giatromanolaki A, Sivridis E, Gatter KC, Harris AL (2005)
Pyruvate dehydrogenase and pyruvate dehydrogenase kinase expression in non
small cell lung cancer and tumor-associated stroma. Neoplasia 7: 1–6.
22. Fujino T, Wu Z, Lin WC, Phillips MA, Nedivi E (2008) cpg15 and cpg15-2
constitute a family of activity-regulated ligands expressed differentially in the
nervous system to promote neurite growth and neuronal survival. J Comp
Neurol 507: 1831–1845.
23. Le Jan S, Le Meur N, Cazes A, Philippe J, Le Cunff M, et al. (2006)
Characterization of the expression of the hypoxia-induced genes neuritin,
TXNIP and IGFBP3 in cancer. FEBS Lett 580: 3395–3400.
24. Hussain SF, Yang D, Suki D, Aldape K, Grimm E, et al. (2006) The role of
human glioma-infiltrating microglia/macrophages in mediating antitumor
immune responses. Neuro-oncol 8: 261–279.
25. Zeng H, Ornatowska M, Joo MS, Sadikot RT (2007) TREM-1 expression in
macrophages is regulated at transcriptional level by NF-kappaB and PU.1.
Eur J Immunol 37: 2300–2308.
26. Bouchon A, Dietrich J, Colonna M (2000) Cutting edge: inflammatory responses
can be triggered by TREM-1, a novel receptor expressed on neutrophils and
monocytes. J Immunol 164: 4991–4995.
27. Tanaka K, Shouguchi-Miyata J, Miyamoto N, Ikeda JE (2004) Novel nuclear
shuttle proteins, HDBP1 and HDBP2, bind to neuronal cell-specific cis-
regulatory element in the promoter for the human Huntington’s disease gene.
J Biol Chem 279: 7275–7286.
28. Yabe H, Tsukahara T, Kawaguchi S, Wada T, Sato N, et al. (2008)
Overexpression of papillomavirus binding factor in Ewing’s sarcoma family of
tumors conferring poor prognosis. Oncol Rep 19: 129–134.
29. Mead EJ, Maguire JJ, Kuc RE, Davenport AP (2007) Kisspeptins: a
multifunctional peptide system with a role in reproduction, cancer and thecardiovascular system. Br J Pharmacol 151: 1143–1153.
30. Murphy KG (2005) Kisspeptins: regulators of metastasis and the hypothalamic-
pituitary-gonadal axis. J Neuroendocrinol 17: 519–525.31. Mead EJ, Maguire JJ, Kuc RE, Davenport AP (2007) Kisspeptins are novel
potent vasoconstrictors in humans, with a discrete localization of their receptor,G protein-coupled receptor 54, to atherosclerosis-prone vessels. Endocrinology
148: 140–147.
32. Nomura T, Yamasaki M, Nomura Y, Mimata H (2005) Expression of theinhibitors of apoptosis proteins in cisplatin-resistant prostate cancer cells. Oncol
Rep 14: 993–997.33. Vaziri SA, Grabowski DR, Tabata M, Holmes KA, Sterk J, et al. (2003) c-IAP1
is overexpressed in HL-60 cells selected for doxorubicin resistance: effects onetoposide-induced apoptosis. Anticancer Res 23: 3657–3661.
34. Valdez BC, Murray D, Ramdas L, de Lima M, Jones R, et al. (2008) Altered
gene expression in busulfan-resistant human myeloid leukemia. Leuk Res 32:1684–1697.
35. Vendrell JA, Ghayad S, Ben-Larbi S, Dumontet C, Mechti N, et al. (2007) A20/TNFAIP3, a new estrogen-regulated gene that confers tamoxifen resistance in
breast cancer cells. Oncogene 26: 4656–4667.
36. Bredel M, Bredel C, Juric D, Duran GE, Yu RX, et al. (2006) Tumor necrosisfactor-alpha-induced protein 3 as a putative regulator of nuclear factor-kappaB-
mediated resistance to O6-alkylating agents in human glioblastomas. J ClinOncol 24: 274–287. Epub 2005 Dec 2019.
37. Coussens LM, Werb Z (2002) Inflammation and cancer. Nature 420: 860–867.38. Desbaillets I, Diserens AC, Tribolet N, Hamou MF, Van Meir EG (1997)
Upregulation of interleukin 8 by oxygen-deprived cells in glioblastoma suggests a
role in leukocyte activation, chemotaxis, and angiogenesis. J Exp Med 186:1201–1212.
39. Oh JW, Drabik K, Kutsch O, Choi C, Tousson A, et al. (2001) CXC chemokinereceptor 4 expression and function in human astroglioma cells. J Immunol 166:
2695–2704.
40. Nabors LB, Suswam E, Huang Y, Yang X, Johnson MJ, et al. (2003) Tumornecrosis factor alpha induces angiogenic factor up-regulation in malignant
glioma cells: a role for RNA stabilization and HuR. Cancer Res 63: 4181–4187.41. Bouchon A, Facchetti F, Weigand MA, Colonna M (2001) TREM-1 amplifies
inflammation and is a crucial mediator of septic shock. Nature 410: 1103–1107.42. Ho CC, Liao WY, Wang CY, Lu YH, Huang HY, et al. (2008) TREM-1
expression in tumor-associated macrophages and clinical outcome in lung
cancer. Am J Respir Crit Care Med 177: 763–770.43. Greten FR, Eckmann L, Greten TF, Park JM, Li ZW, et al. (2004) IKKbeta
links inflammation and tumorigenesis in a mouse model of colitis-associatedcancer. Cell 118: 285–296.
44. Raychaudhuri B, Han Y, Lu T, Vogelbaum MA (2007) Aberrant constitutive
activation of nuclear factor kappaB in glioblastoma multiforme drives invasivephenotype. J Neurooncol 85: 39–47.
45. Hiratsuka S, Watanabe A, Sakurai Y, Akashi-Takamura S, Ishibashi S, et al.(2008) The S100A8-serum amyloid A3-TLR4 paracrine cascade establishes a
pre-metastatic phase. Nat Cell Biol 10: 1349–1355.46. Hiden U, Bilban M, Knofler M, Desoye G (2007) Kisspeptins and the placenta:
regulation of trophoblast invasion. Rev Endocr Metab Disord 8: 31–39.
47. Paez-Ribes M, Allen E, Hudock J, Takeda T, Okuyama H, et al. (2009)Antiangiogenic therapy elicits malignant progression of tumors to increased local
invasion and distant metastasis. Cancer Cell 15: 220–231.48. Getz G, Levine E, Domany E (2000) Coupled two-way clustering analysis of
gene microarray data. Proc Natl Acad Sci U S A 97: 12079–12084.
Hypoxia Response in GBM
PLoS ONE | www.plosone.org 11 June 2009 | Volume 4 | Issue 6 | e5947
Copyright © 2022 FDOKUMEN