Wong Lock et al xenografts 2014
23
Stability of gene expression and epigenetic profiles highlights the utility of patient-derived paediatric acute lymphoblastic leukaemia xenografts for investigating molecular mechanisms of drug resistance Nicholas C Wong 1,2,† Email: [email protected] Vivek A Bhadri 3 Email: [email protected] Jovana Maksimovic 1 Email: [email protected] Mandy Parkinson-Bates 1 Email: [email protected] Jane Ng 1 Email: [email protected] Jeff M Craig 1,4 Email: [email protected] Richard Saffery 1,4,† Email: [email protected] Richard B Lock 3*,† * Corresponding author Email: [email protected] 1 Murdoch Childrens Research Institute, Royal Children’s Hospital, Flemington Road, Parkville, Victoria 3052, Australia 2 Ludwig Institute for Cancer Research, Olivia Newton John Cancer and Wellness Centre, Austin Hospital, Burgundy Street, Heidelberg, Victoria 3184, Australia 3 Children’s Cancer Institute Australia for Medical Research, Lowy Cancer Research Centre, UNSW, PO Box 81, Sydney, NSW 2052, Australia 4 Department of Paediatrics, The University of Melbourne, Royal Children’s Hospital, Flemington Road, Parkville, Victoria 3052, Australia † Equal contributors.
-
Upload
independent -
Category
Documents
-
view
0 -
download
0
Transcript of Wong Lock et al xenografts 2014

Stability of gene expression and epigenetic profiles highlights the utility of patient-derived paediatric acute lymphoblastic leukaemia xenografts for investigating molecular mechanisms of drug resistance
Nicholas C Wong1,2,† Email: [email protected]
Vivek A Bhadri3 Email: [email protected]
Jovana Maksimovic1 Email: [email protected]
Mandy Parkinson-Bates1 Email: [email protected]
Jane Ng1 Email: [email protected]
Jeff M Craig1,4 Email: [email protected]
Richard Saffery1,4,† Email: [email protected]
Richard B Lock3*,† * Corresponding author Email: [email protected]
1 Murdoch Childrens Research Institute, Royal Children’s Hospital, Flemington Road, Parkville, Victoria 3052, Australia
2 Ludwig Institute for Cancer Research, Olivia Newton John Cancer and Wellness Centre, Austin Hospital, Burgundy Street, Heidelberg, Victoria 3184, Australia
3 Children’s Cancer Institute Australia for Medical Research, Lowy Cancer Research Centre, UNSW, PO Box 81, Sydney, NSW 2052, Australia
4 Department of Paediatrics, The University of Melbourne, Royal Children’s Hospital, Flemington Road, Parkville, Victoria 3052, Australia
† Equal contributors.

Abstract
Background
Patient-derived tumour xenografts are an attractive model for preclinical testing of anti-cancer drugs. Insights into tumour biology and biomarkers predictive of responses to chemotherapeutic drugs can also be gained from investigating xenograft models. As a first step towards examining the equivalence of epigenetic profiles between xenografts and primary tumours in paediatric leukaemia, we performed genome-scale DNA methylation and gene expression profiling on a panel of 10 paediatric B-cell precursor acute lymphoblastic leukaemia (BCP-ALL) tumours that were stratified by prednisolone response.
Results
We found high correlations in DNA methylation and gene expression profiles between matching primary and xenograft tumour samples with Pearson’s correlation coefficients ranging between 0.85 and 0.98. In order to demonstrate the potential utility of epigenetic analyses in BCP-ALL xenografts, we identified DNA methylation biomarkers that correlated with prednisolone responsiveness of the original tumour samples. Differential methylation of CAPS2, ARHGAP21, ARX and HOXB6 were confirmed by locus specific analysis. We identified 20 genes showing an inverse relationship between DNA methylation and gene expression in association with prednisolone response. Pathway analysis of these genes implicated apoptosis, cell signalling and cell structure networks in prednisolone responsiveness.
Conclusions
The findings of this study confirm the stability of epigenetic and gene expression profiles of paediatric BCP-ALL propagated in mouse xenograft models. Further, our preliminary investigation of prednisolone sensitivity highlights the utility of mouse xenograft models for preclinical development of novel drug regimens with parallel investigation of underlying gene expression and epigenetic responses associated with novel drug responses.
Keywords
Acute lymphoblastic leukaemia, Xenografts, Genome-wide DNA methylation, Microarray analysis of gene expression, Glucocorticoid resistance
Background
Despite progress in the treatment of several cancers over recent decades, the lack of clinically relevant tumour models for individual subtypes of human cancer has proven to be a major impediment in the development of effective anti-cancer therapies [1]. Approaches that facilitate development of novel rational therapies targeting specific tumours (or specific features of tumours) remain an urgent priority. Traditional models of human cancer involving the analysis of immortalised cell lines have given way in recent years to more clinically relevant studies in models that mirror the features of primary tumours [2]. The two main approaches have been the generation of primary tumour-derived cell lines, and the generation

of mouse models, either via transgenic approaches or through the engraftment of primary human tumour into immune-compromised mouse models [3]. Mouse models have been used extensively in this regard, for preclinical testing of drug efficacy and toxicity prior to establishing clinical trials. A broad panel of xenografts with known treatment responsiveness, and well-defined molecular profiles, would provide an excellent adjunct to these models [4].
Mouse xenograft models of haematological malignancies, established by the transplantation of donor cells into non-obese diabetic/severe combined immunodeficient (NOD/SCID) or NOD/SCID/IL-2 receptor gamma chain−/− (NSG) mice, are recognised as one of the most clinically relevant systems for investigating leukaemia biology and testing new treatments [5-12]. This is due to the faithful recapitulation of many aspects of the human disease, including kinetics of engraftment in the bone marrow (BM), with subsequent infiltration of the spleen, peripheral blood and other organs [10,13,14]. For these reasons, patient-derived xenografts (PDXs) are considered superior to in vitro immortalised cancer cell lines that show many differences to primary tumours, including gene expression, drug responsiveness and epigenetic profiles [15], which is most likely due to the selective processes associated with long term culturing. PDXs have become increasingly popular as evidence mounts that they accurately recapitulate many of the features of patient tumours, such as tumour microenvironment, differentiation state and morphology, architecture and in some instances molecular signatures of the original patient tumour (reviewed in [1,2]).
To establish the relevance of PDX models to primary tumours, high density molecular profiling of gene expression and epigenetic markers should be performed. This was recently demonstrated for gene expression both between two tissue types, bone marrow and spleen and between independently engrafted mice for T-ALL [16].
As a first step towards examining the equivalence of epigenetic profiles between primary tumour and xenograft, we carried out parallel DNA methylation and gene expression profiling on a panel of childhood B-cell precursor acute lymphoblastic leukaemia (BCP-ALL) selected by their clinical responses to prednisolone. This panel consisted of five individuals who had a good response to prednisolone (PGR) and five who had a poor response (PPR). By comparing DNA methylation and gene expression profiles between primary and derived, single-passaged xenograft lines, we report the stability of both gene expression and DNA methylation in the xenograft, further highlighting their potential for exploring gene expression and epigenetic changes associated with responses to established and novel drugs.
Methods
Patient samples, characteristics and xenograft model generation
All experimental studies were approved by the Human Research Ethics Committee and the Animal Care and Ethics Committee of the University of New South Wales. Written informed consent was obtained from the parents or guardians of paediatric ALL patients for use of biopsy samples in research, with the exception of samples obtained prior to May 2003 (ALL-26, ALL-28 and ALL-53), for which a waiver had been issued by the Human Research Ethics Committee. A total of 10 xenograft lines were generated from children diagnosed with BCP-ALL. Individuals were selected based on their response to prednisolone. We classified prednisolone poor responders (PPR) as patients with a peripheral blast count of ≥ 1 x 10⁹/L

on day 8 following induction treatment with prednisolone and a single intrathecal dose of methotrexate, while a prednisolone good responder (PGR) demonstrated a day 8 peripheral blast count of < 1 x 10⁹/L (Table 1). Xenografts were established in NOD/SCID or NSG mice using direct explants of patient BM biopsies, exactly as described previously [10,17]. When mice were highly engrafted with leukaemia human CD45+, mononuclear cells were isolated from spleens by FACS at >90% purity and cryopreserved for subsequent experiments.

Table 1 Patient demographics of xenografts used in this study
Xenograft Sex Age Cytogenetics Immunophenotype Diagnosis WCC Diagnosis Blasts Day 8 Blasts
(months) (diagnostic patient sample) x109/L x109/L x109/L
PPR ALL-28 M 20 Hyperdiploid CD45-/DR+/10+/19+/2-/7-/13-/33+/34+ 15.0 11.8 1.9 PPR ALL-50 M 131 Normal CD45+/DR+/10+/19+/20+ 34.6 26.1 5.5 PPR ALL-54 M 89 Normal CD45+/DR+/10+/19+/20+/34+/13-/33- 185.0 174.8 1.2 PPR ALL-55 M 176 t(9;22) CD45+/DR+/10+/19+/13+/33+/34+ 422.5 388.7 22.6 PPR ALL-57 F 72 t(1;19) CD45+/DR+/19+/10+/34-2-/7- 15.9 7.2 1.6 PGR ALL-26 F 43 t(12;21) CD45+/DR+/CD19+/10+/22+/3-/34+/117-/Cu-/TdT+ 89.4 80.5 0.0 PGR ALL-51 M 19 dic(7;9) CD45+/DR+/CD19+/10+/22+/34-/117-/Cu-/TdT+ 90.5 76.9 0.0 PGR ALL-52 M 138 t(7;15) CD45+/DR+/CD19+/22+/13+/33+/10-/34-/Cu-/TdT+ 14.4 4.0 0.0 PGR ALL-53 M 87 t(12;21) CD45+/DR+/10+/19+/34+ 20.3 13.8 0.1 PGR ALL-56 M 120 t(9;22) CD45-/DR+/10+/19+/34+/2-/7-/13-/33- 8.5 0.1 0.0

Genomic DNA and total RNA extraction
Genomic DNA was extracted from the primary bone marrow biopsies used for xenografting and from cells harvested from the spleens of engrafted animals for each xenograft using standard phenol/chloroform extraction and isopropanol precipitation. Total RNA was extracted using TriZol Reagent (Life Technologies, Carlsbad, USA) according to manufacturer’s instructions. Quality and yield were measured using a Nanodrop spectrophotometer.
Sodium bisulphite conversion of genomic DNA
Genomic DNA was converted for DNA methylation analysis using the MethylEasy Xceed Kit (Human Genetic Signatures, Sydney, Australia) according to manufacturer’s instructions. Converted DNA was used for downstream Illumina Infinium DNA methylation BeadArray analysis and SEQUENOM EpitTYPER validation.
Genome-scale DNA methylation analysis
Converted genomic DNA was processed and analysed for Illumina Infinium HumanMethylation27 BeadArray (Illumina, San Diego, USA) according to manufacturer’s instructions (ServiceXS, Leiden, The Netherlands). This BeadArray platform interrogates 27,578 CpG sites across the human genome. The arrays were scanned using an Illumina BeadArray Reader and subsequently processed using the Illumina GenomeStudio V.1 software package. The Bioconductor Lumi package was used for downstream data processing and normalisation [18]. Briefly, DNA probe methylation data were quality checked and then colour balance adjusted, background corrected and scaled based on the mean of all probes, using the methylation simple scaling normalization (SSN) implemented within the Lumi package. CpG sites with at least one sample having a detection p-value > 0.01 were excluded from subsequent analyses, leaving 27,341 CpG sites. Differential methylation analysis was performed using the LIMMA package from Bioconductor [19] Significantly differentially methylated probes were selected based on a Benjamini-Hochberg adjusted p-value < 0.05. The methylation microarray data have been deposited into Gene Expression Ominibus (http://www.ncbi.nlm.nih.gov/geo/) with the identifier GSE57581.
Gene expression Illumina array analysis
Total RNA was extracted from the primary and xenograft tumours and amplified using the Illumina TotalPrep RNA amplification kit (Ambion, Austin, USA). The amplified total RNA was analysed using Illumina WG-6_V3 chips (Illumina, San Diego, USA) according to manufacturer’s instructions. The sample probe profiles with no normalisation or background correction were exported from BeadStudio (version 3.0.14, Illumina), and the data were pre-processed using quantile normalisation. Probes with detection p-value greater than 0.01 on all arrays were deemed as non-expressed probes and filtered out. Differential gene expression was determined using LIMMA with the positive False Discovery Rate (FDR) correction for multiple testing (Benjamini-Hochberg adjusted p-value < 0.05). The gene expression microarray data have been deposited into Gene Expression Ominibus (http://www.ncbi.nlm.nih.gov/geo/) with the identifier GSE57491.

SEQUENOM MassArray EpiTYPER analysis
Primers (detailed in Additional file 1: Table S1) were designed to generate PCR amplicons from bisulphite converted genomic DNA suitable for SEQUENOM EpiTYPER chemistry as per the manufacturer’s protocol. Samples were analysed using MALDI-TOF mass spectrometry, DNA methylation information was collected using EpiTYPER Viewer Software (v 1.0.5). Non-analysable and poor quality CpG sites were removed from downstream analysis as previously described [20].
Results
Xenograft models of BCP-ALL are an accurate reflection of DNA methylation and gene expression status of the corresponding primary tumour
One sample in our analysis, ALL28P, failed to meet array quality metrics (low overall signal intensity). Therefore, the matching xenograft pair, ALL28X along with ALL28P gene expression data was removed from subsequent analysis. ALL28 was also removed from the DNA methylation and gene expression correlation analysis herein.
Plotting the beta values of the entire data set revealed similar DNA methylation profiles between primary tumour tissue and the matching xenograft from each of the 10 patients in our study. Similarly, gene expression levels between primary tumour tissue and xenograft were also comparable (Figure 1A). For genome-scale DNA methylation, Pearson’s correlation coefficients between matching primary and xenograft samples ranged between 0.94-0.98 while correlation coefficients between individuals ranged between 0.80-0.91. For genome-wide gene expression, Pearson’s correlation coefficients between primary and xenograft samples ranged between 0.85-0.97 and between individuals was greater than 0.83-0.96 (Figure 1B). Gene expression profiles between individuals were more correlated than their DNA methylation profiles.
Figure 1 Comparisons of DNA methylation and gene expression profiles between primary tumour tissue and xenografts. (A) Scatterplots of DNA methylation and gene expression array results from ALL26 showing high correlation between primary and xenograft tumours. (B) Heatmap plot of Pearson’s correlation coefficients of all primary and xenograft samples analysed for DNA methylation and gene expression. Coefficients greater than 0.94 and 0.84 between matching primary and xenograft tumours were observed for DNA methylation and gene expression respectively. (C) Heatmap plot of the most variable DNA methylation and gene expression probes. A high level of similarity between matching primary and xenograft tumours resulted in all pairs clustering together.
Consistent with this observation, unsupervised hierarchical clustering of the most variable DNA methylation and gene expression across all samples revealed clustering of matching primary and xenograft samples. This implies that the profiles from the xenografts recapitulate the profile of the primary tumour (Figure 1C).
To identify differential DNA methylation between primary tumour and matching xenograft samples we applied a linear model with empirical Bayes estimation and found 1564 probes to be differentially methylated between matching primary tumour and xenograft sample after correction for multiple testing (adjusted p-value < 0.05, Additional file 2: Table S2). The

majority of these probes demonstrated a small change in DNA methylation with the average difference across individuals ranging from 0.4 to 8.6% (Additional file 3: Figure S1A).
We also looked for differential gene expression between matching primary and xenograft cell lines again applying a linear model with empirical Bayes estimation on the genome-scale gene expression microarray results. We found 3441 probes from 3208 genes to be differentially expressed between primary and xenograft lines (adjusted p-value < 0.05, Additional file 4: Table S3). However, as we observed with DNA methylation, the differences in expression of these probes between primary and xenograft were minimal with an average fold difference in expression between primary and xenograft tumours of 1.12 (Additional file 3: Figure S1B).
Using DAVID (http://david.abcc.ncifcrf.gov/), the differentially methylated and differentially expressed genes between primary and matching xenograft lines were found to be mainly involved in haematological and cell signalling processes that could be accounted for given the cellular origins of the primary (bone marrow) and xenograft (spleen) samples.
Given the relatively small number of differentially methylated probes (6%) and differentially expressed probes (17%), and the minimal absolute differences in DNA methylation and expression (Additional file 3: Figure S1A and S1B), our results indicate that xenograft models largely recapitulate the DNA methylation and gene expression profile of the corresponding primary tumour. This highlights the potential utility of xenograft cell lines for modelling primary disease.
Molecular biomarkers associated with prednisolone response
We then sought to identify differential DNA methylation and gene expression associated with prednisolone poor (PPR) and prednisolone good (PGR) responders and included primary and xenograft samples in our analysis. After correction for multiple testing, 35 DNA methylation probes were differentially methylated between PPR and PGR (Benjamini-Hochberg adjusted p-value < 0.05, Table 2, Figure 2). Gene expression analysis revealed 23 genes differentially expressed between PPR and PGR (Benjamini-Hochberg adjusted p-value < 0.05, Table 2, Figure 2). From these lists, we did not find any commonly annotated genes associated with prednisolone response between the top differentially methylated and top differentially expressed probes. Differential DNA methylation segregated PPR from PGR by supervised hierarchical clustering and may serve as potential biomarkers for prednisolone response (Figure 2A). However, interrogating gene expression alone did not accurately segregate PPR from PGR (Figure 2B). Functional annotation of differentially methylated genes annotated to these probes identified a number of apoptotic, cell signalling/structure pathways that did not reach statistical significance (Additional file 5: Table S4).
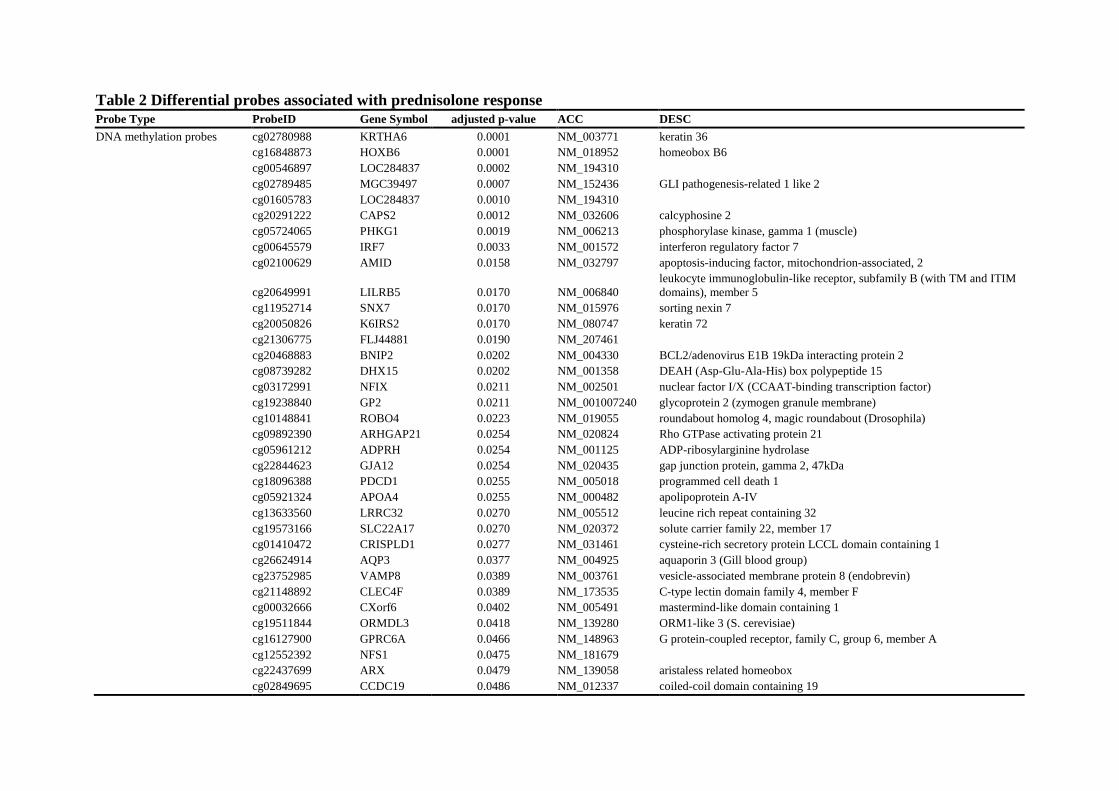
Table 2 Differential probes associated with prednisolone response Probe Type ProbeID Gene Symbol adjusted p-value ACC DESC
DNA methylation probes cg02780988 KRTHA6 0.0001 NM_003771 keratin 36 cg16848873 HOXB6 0.0001 NM_018952 homeobox B6 cg00546897 LOC284837 0.0002 NM_194310 cg02789485 MGC39497 0.0007 NM_152436 GLI pathogenesis-related 1 like 2 cg01605783 LOC284837 0.0010 NM_194310 cg20291222 CAPS2 0.0012 NM_032606 calcyphosine 2 cg05724065 PHKG1 0.0019 NM_006213 phosphorylase kinase, gamma 1 (muscle) cg00645579 IRF7 0.0033 NM_001572 interferon regulatory factor 7 cg02100629 AMID 0.0158 NM_032797 apoptosis-inducing factor, mitochondrion-associated, 2
cg20649991 LILRB5 0.0170 NM_006840 leukocyte immunoglobulin-like receptor, subfamily B (with TM and ITIM domains), member 5
cg11952714 SNX7 0.0170 NM_015976 sorting nexin 7 cg20050826 K6IRS2 0.0170 NM_080747 keratin 72 cg21306775 FLJ44881 0.0190 NM_207461 cg20468883 BNIP2 0.0202 NM_004330 BCL2/adenovirus E1B 19kDa interacting protein 2 cg08739282 DHX15 0.0202 NM_001358 DEAH (Asp-Glu-Ala-His) box polypeptide 15 cg03172991 NFIX 0.0211 NM_002501 nuclear factor I/X (CCAAT-binding transcription factor) cg19238840 GP2 0.0211 NM_001007240 glycoprotein 2 (zymogen granule membrane) cg10148841 ROBO4 0.0223 NM_019055 roundabout homolog 4, magic roundabout (Drosophila) cg09892390 ARHGAP21 0.0254 NM_020824 Rho GTPase activating protein 21 cg05961212 ADPRH 0.0254 NM_001125 ADP-ribosylarginine hydrolase cg22844623 GJA12 0.0254 NM_020435 gap junction protein, gamma 2, 47kDa cg18096388 PDCD1 0.0255 NM_005018 programmed cell death 1 cg05921324 APOA4 0.0255 NM_000482 apolipoprotein A-IV cg13633560 LRRC32 0.0270 NM_005512 leucine rich repeat containing 32 cg19573166 SLC22A17 0.0270 NM_020372 solute carrier family 22, member 17 cg01410472 CRISPLD1 0.0277 NM_031461 cysteine-rich secretory protein LCCL domain containing 1 cg26624914 AQP3 0.0377 NM_004925 aquaporin 3 (Gill blood group) cg23752985 VAMP8 0.0389 NM_003761 vesicle-associated membrane protein 8 (endobrevin) cg21148892 CLEC4F 0.0389 NM_173535 C-type lectin domain family 4, member F cg00032666 CXorf6 0.0402 NM_005491 mastermind-like domain containing 1 cg19511844 ORMDL3 0.0418 NM_139280 ORM1-like 3 (S. cerevisiae) cg16127900 GPRC6A 0.0466 NM_148963 G protein-coupled receptor, family C, group 6, member A cg12552392 NFS1 0.0475 NM_181679 cg22437699 ARX 0.0479 NM_139058 aristaless related homeobox cg02849695 CCDC19 0.0486 NM_012337 coiled-coil domain containing 19

Gene Expression Probes ILMN_1806907 PAWR 0.0000 NM_002583 PRKC, apoptosis, WT1, regulator
ILMN_1794046 MTX2 0.0119 NM_006554 NM_001006635 Metaxin 2
ILMN_1758128 CYGB 0.0119 NM_134268 Cytoglobin ILMN_1738438 MAST4 0.0157 NM_198828 Microtubule associated serine/threonine kinase family member 4 ILMN_1789384 QSOX2 0.0190 NM_181701 Quiescin Q6 sulfhydryl oxidase 2
ILMN_2306565 MTX2 0.0190 NM_006554 NM_001006635 Metaxin 2
ILMN_2295987 NBPF1 0.0237 NM_017940 Neuroblastoma breakpoint family, member 1 ILMN_1765772 MYO3A 0.0305 NM_017433 Myosin IIIA ILMN_1713934 LITAF 0.0305 NM_004862 Lipopolysaccharide-induced TNF factor ILMN_1668125 MYRIP 0.0305 NM_015460 Myosin VIIA and Rab interacting protein ILMN_1681888 PRKAR2A 0.0305 NM_004157 Protein kinase, cAMP-dependent, regulatory, type II, alpha ILMN_2184966 ZHX2 0.0305 NM_014943 Zinc fingers and homeoboxes 2 ILMN_1706505 COL5A1 0.0305 NM_000093 Collagen, type V, alpha 1 ILMN_1656057 PLAU 0.0305 NM_002658 Plasminogen activator, urokinase
ILMN_1761540 SEMA3F 0.0305 NM_004186 Sema domain, immunoglobulin domain (Ig), short basic domain, secreted, (semaphorin) 3F
ILMN_1753143 DKFZp761L1918 0.0305 NM_033103 Homo sapiens rhophilin-like protein mRNA, complete cds.
ILMN_2148944 ADCY4 0.0305 NM_139247 Adenylate cyclase 4 ILMN_1812618 ARAP3 0.0305 NM_022481 ArfGAP with RhoGAP domain, ankyrin repeat and PH domain 3
ILMN_1681081 AGPAT2 0.0359 NM_006412 1-acylglycerol-3-phosphate O-acyltransferase 2 (lysophosphatidic acid acyltransferase, beta)
ILMN_1743275 SH3RF3 0.0359 NM_001099289 SH3 domain containing ring finger 3 ILMN_1656951 APCDD1 0.0359 NM_153000 Adenomatosis polyposis coli down-regulated 1
ILMN_1719756 ZAP70 0.0359 NM_207519 NM_001079 Zeta-chain (TCR) associated protein kinase 70kDa
ILMN_1768732 SPAG16 0.0437 NM_024532 NM_001025436 Sperm associated antigen 16

Figure 2 Heatmap plot of the most significant DNA methylation and gene expression probes distinguishing prednisolone good responders (PGR) from poor responders (PPR) after LIMMA analysis (BH adjusted p-value < 0.05). DNA methylation probes distinguished PGR from PPR while gene expression probes did not.
We then determined the relationship between DNA methylation and gene expression in association with prednisolone response. Plotting the average DNA methylation and gene expression differences between PPR and PGR revealed 22 probes annotated to 12 genes that were more highly expressed and less methylated in PPR samples compared to PGR samples (gene expression cut-off greater than 2 and a DNA methylation cut-off of less than −0.2, Figure 3, Table 3). Conversely, 11 probes annotated to 8 genes were less highly expressed and more methylated in PPR samples compared to PPR (gene expression cut-off of less than −2 and a DNA methylation cut-off greater than 0.2, Figure 3, Table 3). With the exception of expression probes annotated to PAWR, MTX2 and MYO3A no other gene expression and DNA methylation probes reached statistical significance (Table 3). DNA methylation probes associated with PAWR, MTX2 and MYO3A demonstrated an average difference of >0.2 between groups but did not reach significance with LIMMA analysis between PPR and PGR.
Figure 3 Scatterplot of the average DNA methylation and gene expression difference between PPR and PGR samples reveals 20 genes with a negative association between gene expression and DNA methylation.

Table 3 Probes both differentially methylated and expressed in association with prednisolone response Expression Methylation
Threshold Gene_symbol.x Gene_description.x adj.P.Val adj.P.Val methDiff expDiff
Upregulated and less methylated in PPR H2AFY2 H2A histone family, member Y2 0.1173 0.1782 -0.2204 4.0116 (>2-fold expression, <-0.2 methylation) H2AFY2 H2A histone family, member Y2 0.1173 0.3973 -0.3007 4.0116
MTX2 Metaxin 2 0.0190 0.3673 -0.4061 3.9695 PAWR PRKC, apoptosis, WT1, regulator 0.0000 0.3154 -0.4185 3.6350 PAWR PRKC, apoptosis, WT1, regulator 0.0000 0.3973 -0.3026 3.6350 MYO3A Myosin IIIA 0.0305 0.2944 -0.4156 3.4893 MYO3A Myosin IIIA 0.0305 0.3154 -0.4006 3.4893 MTX2 Metaxin 2 0.0119 0.3673 -0.4061 3.1908 BX537570 0.2492 0.0333 -0.3571 3.1574 BX537570 0.2492 0.1707 -0.4761 3.1574 CTSC Cathepsin C 0.0624 0.1782 -0.4239 2.6472 CTSC Cathepsin C 0.0624 0.2267 -0.2834 2.6472 CTSC Cathepsin C 0.0766 0.1782 -0.2834 2.5574 CTSC Cathepsin C 0.0766 0.2267 -0.4239 2.5574 MOSC1 MOCO sulphurase C-terminal domain containing 1 0.0578 0.5189 -0.2051 2.5035 NGFRAP1 Nerve growth factor receptor (TNFRSF16) associated protein 1 0.4360 0.4775 -0.2504 2.4066 MARCKS Myristoylated alanine-rich protein kinase C substrate 0.5467 0.4154 -0.2603 2.3418 MPO Myeloperoxidase 0.5920 0.4097 -0.2226 2.3130 CTSC Cathepsin C 0.0578 0.1782 -0.2834 2.1699 CTSC Cathepsin C 0.0578 0.2267 -0.4239 2.1699 CCR7 Chemokine (C-C motif) receptor 7 0.2918 0.4434 -0.2264 2.0570 PLS3 Plastin 3 (T isoform) 0.6662 0.3610 -0.2919 2.0256
Downregulated and more methylated in PPR POU4F1 POU class 4 homeobox 1 0.1004 0.4404 0.3017 -5.3928 (<-2-fold expression, >0.2 methylation) CYB5R2 Cytochrome b5 reductase 2 0.1734 0.5066 0.2699 -4.3486
TMED6 Transmembrane emp24 protein transport domain containing 6 0.0504 0.5271 0.2317 -4.1584 CRMP1 Collapsin response mediator protein 1 0.3007 0.4431 0.3668 -3.8640 CRMP1 Collapsin response mediator protein 1 0.3007 0.3996 0.2607 -3.8640 IRX3 Iroquois homeobox 3 0.5401 0.4957 0.2710 -2.9003 LDOC1 Leucine zipper, down-regulated in cancer 1 0.2608 0.6055 0.2578 -2.4859 DSC3 Desmocollin 3 0.5401 0.4585 0.3377 -2.2248 DSC3 Desmocollin 3 0.5401 0.4402 0.3561 -2.2248 ANXA5 Annexin A5 0.5923 0.3699 0.2228 -2.0708 ANXA5 Annexin A5 0.5923 0.3727 0.2386 -2.0708

Validation of DNA methylation biomarkers associated with prednisolone response
From our array analysis, the DNA methylation changes segregated samples by prednisolone response. We validated 17 of these probes using SEQUENOM EpiTYPER chemistry on both primary and xenograft samples by selecting from our LIMMA analysis, those also associated with changes in gene expression (Additional file 6: Figure S2). Of the assays containing the 17 probes of interest, 4 regions continued to discriminate samples according to prednisolone response (Figure 4). These were associated with the genes CAPS2 and ARHGAP21 (less methylated in PPR), ARX and HOXB6 (more methylated in PPR). Primary and matching xenograft samples showed similar DNA methylation levels in all cases.
Figure 4 Validation of DNA methylation across four probes, CAPS2, ARHGAP21, ARX and HOXB6 using SEQUENOM EpiTYPER chemistry.
Discussion
It is becoming clear that the complexity of genetic, epigenetic, and subsequent gene expression disruption associated with human cancer is immense. As such, many mouse models of tumourigenesis are limited in their capacity to faithfully mimic human disease. In light of this, patient derived tumour tissue xenograft models are increasingly recognised as offering the most robust approach for testing tumour responses to various chemotherapeutic regimens, evaluating the efficacy of novel therapeutic agents, analysing the process of tumour progression at the cellular and molecular level and the identification of new therapeutic targets [2]. However, as with most mouse xenograft models, the stability of molecular profiles (gene expression and epigenetic) that regulate all aspects of tumour function remains to be determined. Confirmation of this stability is crucial in order identify molecular responses to treatment within the xenograft that could be extrapolated back to patients.
Here, we have determined the stability of genome wide DNA methylation and gene expression profiles between primary tumour cells and matching xenograft tumour cells from a small number of paediatric ALL cases with differential response to prednisolone. A high correlation in both DNA methylation and gene expression profiles was observed in all cases, confirming the stability of these molecular features of primary tumours in the mouse system. Differences in DNA methylation and gene expression between primary and xenograft samples were negligible in magnitude (Additional file 3: Figure S1) and comprised of a small fraction of probes for each array platform. The differentially methylated genes include MYOD1, GPR6 and SLC27A6 (Table 1). Many genes associated with minor expression differences were part of the globin gene family and genes involved in oxygen transport and include HBB, AHSP, HBD, HBA2 (Table 2). This is likely to have arisen by the differences in cellular composition as the primary tumour samples contained a milieu of haematopoietic cells, including human erythrocytes that were absent in the xenograft samples that comprised of mononuclear cells derived from the murine spleen. Given the high degree of correlation and clustering of matching primary and xenograft samples after unsupervised hierarchical clustering of the most varied probes for DNA methylation and gene expression, the xenografts described in this study are an accurate reflection of their corresponding primary tumours.

While a number of candidate genes whose DNA methylation and/or gene expression status were associated with prednisolone response, given the small sample numbers and inherent genetic heterogeneity of the tumours, the significance of these genes remains unclear. Using hierarchical clustering, the most significant probes for DNA methylation discriminated prednisolone response while the gene expression probes did not (Figure 2), reflecting the more variable nature of gene expression compared to DNA methylation [21,22]. Using SEQUENOM, we were able to replicate DNA methylation changes at four genes associated with prednisolone response indicative of a potential DNA methylation biomarker. Taking methylation and expression status together, 20 genes were differentially regulated between good and poor responders to prednisolone (Table 3). While the genes were found to be part of apoptotic and cell signalling pathways, their significance remains unclear given the small numbers in each group. PAWR demonstrated significant overexpression and hypomethylation across PPRs compared to PGRs. This is a WT1 interacting protein that also functions as a transcriptional repressor with pro-apoptotic functions and tumour resistance [23]. While the down regulation of PAWR confers poor prognosis in a range of solid tumours [24,25], its role in haematological malignancy is less clear, with expression detectable in a range of leukaemias [26]. Our results warrant further investigation of PAWR to determine a potential role in prednisolone response and responses to other novel drug regimens in an expanded xenograft cohort.
Another gene with potential interest is POU4F1, which appears to be differentially regulated according to prednisolone response (Table 3). However in our analysis, statistical significance was not achieved with the modest sample size of our panel. POU4F1 has been shown to have a role in regulating the expression of B-cell markers in t(8;21) positive acute myeloid leukaemia [27-29]. Its role in B-cell ALL response to prednisolone remains unclear and could be a potential gene target for further characterisation in an expanded B-cell ALL xenograft panel.
While our study did not identify statistically significant genes associated with prednisolone response, we present here a first pass analysis using low-resolution microarray platforms to interrogate DNA methylation and gene expression across our model system. We demonstrate that our B-cell ALL xenograft panel recapitulates the DNA methylation and gene expression profiles of the primary tumour and will facilitate future genome-wide interrogation of gene expression and DNA methylation using next generation sequencing methodology.
Conclusions
Patient-derived tumour xenograft models offer superior utility as preclinical models over cell line systems with their ability to recapitulate the milieu and microenvironment of the primary tumour. However, the extent of gene expression and epigenetic stability within the xenograft has remained unclear at least in the haematological setting. We have demonstrated that the gene expression and DNA methylation profiles of cells taken from the spleens of engrafted mice are highly correlated to the original primary tumour. Given the similarity to the primary tumour, our study confirms the opportunity to investigate gene expression and DNA methylation biomarkers in response to novel treatment strategies.

Availability of supporting data
The data sets supporting the results of this article are included within the article and its additional files. All microarray data presented in this paper have been deposited into Gene Expression Omnibus (http://www.ncbi.nlm.nih.gov/geo/) with the identifiers GSE57581 and GSE57491.
Competing interests
The authors declare no actual or perceived competing interests.
Authors’ contributions
NCW, VAB, JMC, RS and RBL designed the study; NCW, VAB and JM performed the experiments; NCW, VAB, JM, MP-B and JN analysed data; NCW, VAB, RS and RBL interpreted the data and wrote the manuscript. All authors read and approved the final manuscript.
Acknowledgements
This work was supported by an NHMRC Project Grant to JC, RS and RBL, and an NHMRC Research Fellowship to RBL. NW has been supported by the Leukaemia Foundation of Australia, My Room and the Children’s Cancer Centre Foundation. VB was supported by a scholarship from the Leukaemia Foundation of Australia. The Murdoch Childrens Research Institute is supported by the Victorian Operational Infrastructure Grant. We thank Dr Benjamin Ong for assistance with the SEQUENOM Facility. Children’s Cancer Institute Australia for Medical Research is affiliated with the University of New South Wales and the Sydney Children’s Hospitals Network.
References
1. Williams SA, Anderson WC, Santaguida MT, Dylla SJ: Patient-derived xenografts, the cancer stem cell paradigm, and cancer pathobiology in the 21st century. Lab Invest 2013, 93:970–982.
2. Tentler JJ, Tan A-C, Weekes CD, Jimeno A, Leong S, Pitts TM, Arcaroli JJ, Messersmith WA, Eckhardt SG: Patient-derived tumour xenografts as models for oncology drug development. Nat Rev Clin Oncol 2012, 9:338–350.
3. Vandamme T: Use of rodents as models of human diseases. J Pharm Bioallied Sci 2014, 6:2.
4. Bachmann PS, Lock RB: In vivo models of childhood leukemia for preclinical drug testing. Curr Drug Targets 2007, 8:773–783.
5. Anderson K, Lutz C, Van Delft FW, Bateman CM, Guo Y, Colman SM, Kempski H, Moorman AV, Titley I, Swansbury J, Kearney L, Enver T, Greaves M: Genetic variegation of clonal architecture and propagating cells in leukaemia. Nature 2010, 469:356–361.

6. Carol H, Boehm I, Reynolds CP, Kang MH, Maris JM, Morton CL, Gorlick R, Kolb EA, Keir ST, Wu J, Wozniak AE, Yang Y, Manfredi M, Ecsedy J, Wang J, Neale G, Houghton PJ, Smith MA, Lock RB: Efficacy and pharmacokinetic/pharmacodynamic evaluation of the Aurora kinase A inhibitor MLN8237 against preclinical models of pediatric cancer. Cancer Chemother Pharmacol 2011, 68:1291–1304.
7. Carol H, Szymanska B, Evans K, Boehm I, Houghton PJ, Smith MA, Lock RB: The anti-CD19 antibody-drug conjugate SAR3419 prevents hematolymphoid relapse postinduction therapy in preclinical models of pediatric acute lymphoblastic leukemia. Clin Cancer Res 2013, 19:1795–1805.
8. Clappier E, Gerby B, Sigaux F, Delord M, Touzri F, Hernandez L, Ballerini P, Baruchel A, Pflumio F, Soulier J: Clonal selection in xenografted human T cell acute lymphoblastic leukemia recapitulates gain of malignancy at relapse. J Exp Med 2011, 208:653–661.
9. Liem NLM, Papa RA, Milross CG, Schmid MA, Tajbakhsh M, Choi S, Ramirez CD, Rice AM, Haber M, Norris MD, MacKenzie KL, Lock RB: Characterization of childhood acute lymphoblastic leukemia xenograft models for the preclinical evaluation of new therapies. Blood 2004, 103:3905–3914.
10. Lock RB, Liem N, Farnsworth ML, Milross CG, Xue C, Tajbakhsh M, Haber M, Norris MD, Marshall GM, Rice AM: The nonobese diabetic/severe combined immunodeficient (NOD/SCID) mouse model of childhood acute lymphoblastic leukemia reveals intrinsic differences in biologic characteristics at diagnosis and relapse. Blood 2002, 99:4100–4108.
11. Maude SL, Tasian SK, Vincent T, Hall JW, Sheen C, Roberts KG, Seif AE, Barrett DM, Chen IM, Collins JR, Mullighan CG, Hunger SP, Harvey RC, Willman CL, Fridman JS, Loh ML, Grupp SA, Teachey DT: Targeting JAK1/2 and mTOR in murine xenograft models of Ph-like acute lymphoblastic leukemia. Blood 2012, 120:3510–3518.
12. Notta F, Mullighan CG, Wang JCY, Poeppl A, Doulatov S, Phillips LA, Ma J, Minden MD, Downing JR, Dick JE: Evolution of human BCR-ABL1 lymphoblastic leukaemia-initiating cells. Nature 2011, 469:362–367.
13. Kamel-Reid S, Letarte M, Doedens M, Greaves A, Murdoch B, Grunberger T, Lapidot T, Thorner P, Freedman MH, Phillips RA: Bone marrow from children in relapse with pre-B acute lymphoblastic leukemia proliferates and disseminates rapidly in scid mice. Blood 1991, 78:2973–2981.
14. Nijmeijer BA, Mollevanger P, Van Zelderen-Bhola SL, Kluin-Nelemans HC, Willemze R, Falkenburg JH: Monitoring of engraftment and progression of acute lymphoblastic leukemia in individual NOD/SCID mice. Exp Hematol 2001, 29:322–329.
15. Saferali A, Grundberg E, Berlivet S, Beauchemin H, Morcos L, Polychronakos C, Pastinen T, Graham J, McNeney B, Naumova AK: Cell culture-induced aberrant methylation of the imprinted IG DMR in human lymphoblastoid cell lines. Epigenetics 2010, 5:50–60.

16. Samuels AL, Peeva VK, Papa RA, Firth MJ, Francis RW, Beesley AH, Lock RB, Kees UR: Validation of a mouse xenograft model system for gene expression analysis of human acute lymphoblastic leukaemia. BMC Genomics 2010, 11:256.
17. Bhadri VA, Cowley MJ, Kaplan W, Trahair TN, Lock RB: Evaluation of the NOD/SCID xenograft model for glucocorticoid-regulated gene expression in childhood B-cell precursor acute lymphoblastic leukemia. BMC Genomics 2011, 12:565.
18. Du P, Kibbe WA, Lin SM: lumi: a pipeline for processing Illumina microarray. Bioinformatics 2008, 24:1547–1548.
19. Wettenhall JM, Smyth GK: limmaGUI: A graphical user interface for linear modeling of microarray data. Bioinformatics 2004, 20:3705–3706.
20. Ollikainen M, Smith KR, Joo EJ-H, Ng H-K, Andronikos R, Novakovic B, Abdul Aziz NK, Carlin JB, Morley R, Saffery R, Craig JM: DNA methylation analysis of multiple tissues from newborn twins reveals both genetic and intrauterine components to variation in the human neonatal epigenome. Hum Mol Genet 2010, 19:4176–4188.
21. Gutierrez-Arcelus M, Lappalainen T, Montgomery SB, Buil A, Ongen H, Yurovsky A, Bryois J, Giger T, Romano L, Planchon A, Falconnet E, Bielser D, Gagnebin M, Padioleau I, Borel C, Letourneau A, Makrythanasis P, Guipponi M, Gehrig C, Antonarakis SE, Dermitzakis ET: Passive and active DNA methylation and the interplay with genetic variation in gene regulation. Elife 2013, 2:e00523–e00523.
22. Pai AA, Bell JT, Marioni JC, Pritchard JK, Gilad Y: A Genome-wide study of DNA methylation patterns and gene expression levels in multiple human and chimpanzee tissues. PLoS Genet 2011, 7:e1001316.
23. Zhao Y, Rangnekar VM: Apoptosis and tumor resistance conferred by Par-4. Cancer Biol Ther 2008, 7:1867–1874.
24. Nagai MA, Gerhard R, Salaorni S, Fregnani JHTG, Nonogaki S, Netto MM, Soares FA: Down-regulation of the candidate tumor suppressor gene PAR-4 is associated with poor prognosis in breast cancer. Int J Oncol 2010, 37:41–49.
25. Moreno-Bueno G, Fernandez-Marcos PJ, Collado M, Tendero MJ, Rodriguez-Pinilla SM, Garcia-Cao I, Hardisson D, Diaz-Meco MT, Moscat J, Serrano M, Palacios J: Inactivation of the candidate tumor suppressor par-4 in endometrial cancer. Cancer Res 2007, 67:1927–1934.
26. Boehrer S, Chow KU, Puccetti E, Ruthardt M, Godzisard S, Krapohl A, Schneider B, Hoelzer D, Mitrou PS, Rangnekar VM, Weidmann E: Deregulated expression of prostate apoptosis response gene-4 in less differentiated lymphocytes and inverse expressional patterns of par-4 and bcl-2 in acute lymphocytic leukemia. Hematol J 2001, 2:103–107.
27. Fortier JM, Payton JE, Cahan P, Ley TJ, Walter MJ, Graubert TA: POU4F1 is associated with t(8;21) acute myeloid leukemia and contributes directly to its unique transcriptional signature. Leukemia 2010, 24:950–957.

28. Dunne J, Gascoyne DM, Lister TA, Brady HJM, Heidenreich O, Young BD: AML1/ETO proteins control POU4F1/BRN3A expression and function in t(8;21) acute myeloid leukemia. Cancer Res 2010, 70:3985–3995.
29. Dunne J, Mannari D, Farzaneh T, Gessner A, Van Delft FW, Heidenreich O, Young BD, Gascoyne DM: AML1/ETO and POU4F1 synergy drives B-lymphoid gene expression typical of t(8;21) acute myeloid leukemia. Leukemia 2012, 26:1131–1135.
Additional files
Additional_file_1 as XLSX Additional file 1: Table S1 SEQUENOM EpiTYPER primers used in this study.
Additional_file_2 as XLS Additional file 2: Table S2 Differentially methylated probes between primary and xenograft tumours.
Additional_file_3 as PDF Additional file 3: Figure S1 Heatmap plot of the most significant DNA methylation (A) and gene expression (B) probes differentiating primary to xenograft tumours. While the samples clustered accordingly, the magnitude of DNA methylation and gene expression differences across these probes were minimal.
Additional_file_4 as XLSX Additional file 4: Table S3 Differentially expressed probes between primary and xenograft tumours.
Additional_file_5 as XLSX Additional file 5: Table S4 DAVID ontology list of functional pathways of genes found to be associated with prednisolone response.
Additional_file_6 as PDF Additional file 6: Figure S2 SEQUENOM Validation of 17 probes identified as significantly differentially methylated between primary and xenograft tumours. The green side column depicts PGR samples, while red depicts PPR samples. DNA methylation of these probes were able to separate tumours on prednisolone response, with 4 (depicted in Figure 4) giving the most discriminatory power.

ALL26P ALL26X ALL28P ALL28X ALL50P ALL50X ALL51P ALL51X ALL52P ALL52X ALL53P ALL53X ALL54P ALL54X ALL55P ALL55X ALL56P ALL56X ALL57P ALL57X A L L 5 7 XA L L 5 7 PA L L 5 6 XA L L 5 6 PA L L 5 5 XA L L 5 5 PA L L 5 4 XA L L 5 4 PA L L 5 3 XA L L 5 3 PA L L 5 2 XA L L 5 2 PA L L 5 1 XA L L 5 1 PA L L 5 0 XA L L 5 0 PA L L 2 8 XA L L 2 8 PA L L 2 6 XA L L 2 6 P0 . 8 5 0 . 9 0 . 9 5 1C o r r e l a t i o n
Figure 1.
B.
C.
A.
0 . 0 0 . 2 0 . 4 0 . 6 0 . 8 1 . 00 .00 .20 .40 .60 .81 .0
P r i m a r yX enograf t
Methylation
A L L 2 6 PA L L 2 6 XA L L 5 0 PA L L 5 0 XA L L 5 1 PA L L 5 1 XA L L 5 2 PA L L 5 2 XA L L 5 3 PA L L 5 3 XA L L 5 4 PA L L 5 4 XA L L 5 5 PA L L 5 5 XA L L 5 6 PA L L 5 6 XA L L 5 7 PA L L 5 7 X ALL57X ALL57P ALL56X ALL56P ALL55X ALL55P ALL54X ALL54P ALL53X ALL53P ALL52X ALL52P ALL51X ALL51P ALL50X ALL50P ALL26X ALL26P6 8 1 0 1 2 1 4 1 668
10121416
P r i m a r yX enograf t
Gene Expression
A L L 5 5 XA L L 5 5 PA L L 5 6 XA L L 5 6 PA L L 5 3 XA L L 5 3 PA L L 2 6 PA L L 2 6 XA L L 5 7 XA L L 5 7 PA L L 5 2 PA L L 5 2 XA L L 5 1 XA L L 5 1 PA L L 5 0 XA L L 5 0 PA L L 5 4 XA L L 5 4 P
6 8 1 0 1 4E x p r e s s i o nA L L 5 3 XA L L 5 3 PA L L 5 5 XA L L 5 5 PA L L 5 6 XA L L 5 6 PA L L 5 2 XA L L 5 2 PA L L 2 8 XA L L 2 8 PA L L 2 6 XA L L 2 6 PA L L 5 7 XA L L 5 7 PA L L 5 1 XA L L 5 1 PA L L 5 4 XA L L 5 4 PA L L 5 0 XA L L 5 0 P
0 . 2 0 . 6’� v a l u e
Figure 1

0 . 2 0 . 6’� V a l u e
PGRPPR
Figure 2.
6 8 1 0 1 4E x p r e s s i o nA. B.
PPR PGR
Figure 2

(206 (204 202 204 206
(6(4
24
6
xi"Dgvc"RRT(RIT
xi"Nqi4"RR
T(RI
T
P A W R
A N X A 5C R M P 1
E[D7T4
A N X A 5
V L D L R
RQW6H3
M Y O 3 A P A W RM P OCTJICR43 C T S CC T S CC T S C
L D O C 1
J4CH[4C T S CC T S CCTJICR43OVZ4
OVZ4
L D O C 1C R M P 1
M Y O 3 A
T N S 3
Figure 3

CAPS2 _C pG _2ARHGAP21 _C pG _10 .11
ARHGAP21 _C pG _22ARHGAP21 _C pG _2
ARHGAP21 _C pG _4 .5 ARX _C pG _2 .3 ARX _C pG _4 ARX _C pG _6 .7HOXB6 _C pG _7 ARX _C pG _8 A L L 5 6A L L 5 6 dA L L 5 3A L L 5 3 dA L L 5 2A L L 5 2 dA L L 5 1A L L 5 1 dA L L 2 6A L L 2 6 dA L L 5 7A L L 5 7 dA L L 5 5A L L 5 5 dA L L 5 4A L L 5 4 dA L L 5 0A L L 5 0 dA L L 2 8A L L 2 8 d0 0 . 4 0 . 8
PPR
PGR
Figure 4

Additional files provided with this submission:
Additional file 1: 1975590940114570_add1.xlsx, 31Khttp://www.biomedcentral.com/imedia/1513265899131344/supp1.xlsxAdditional file 2: 1975590940114570_add2.xls, 534Khttp://www.biomedcentral.com/imedia/4400853701313444/supp2.xlsAdditional file 3: 1975590940114570_add3.pdf, 1824Khttp://www.biomedcentral.com/imedia/2909887913134441/supp3.pdfAdditional file 4: 1975590940114570_add4.xlsx, 1015Khttp://www.biomedcentral.com/imedia/9842029161313444/supp4.xlsxAdditional file 5: 1975590940114570_add5.xlsx, 57Khttp://www.biomedcentral.com/imedia/1225558934131344/supp5.xlsxAdditional file 6: 1975590940114570_add6.pdf, 173Khttp://www.biomedcentral.com/imedia/1698498839131344/supp6.pdf