MOLECULAR RECOGNITION PROPERTIES AND KINETIC CHARACTERIZATION OF TRANS EXCISION-SPLICING REACTION...
128
University of Kentucky UKnowledge University of Kentucky Doctoral Dissertations Graduate School 2006 MOLECULAR RECOGNITION PROPERTIES AND KINETIC CHACTERIZATION OF TNS EXCISION-SPLICING REACTION CATALYZED BY A GROUP I INTRON- DERIVED RIBOZYME Joy Sinha University of Kentucky, [email protected] is Dissertation is brought to you for free and open access by the Graduate School at UKnowledge. It has been accepted for inclusion in University of Kentucky Doctoral Dissertations by an authorized administrator of UKnowledge. For more information, please contact [email protected]. Recommended Citation Sinha, Joy, "MOLECULAR RECOGNITION PROPERTIES AND KINETIC CHACTERIZATION OF TNS EXCISION- SPLICING REACTION CATALYZED BY A GROUP I INTRON-DERIVED RIBOZYME" (2006). University of Kentucky Doctoral Dissertations. Paper 296. hp://uknowledge.uky.edu/gradschool_diss/296
-
Upload
independent -
Category
Documents
-
view
0 -
download
0
Transcript of MOLECULAR RECOGNITION PROPERTIES AND KINETIC CHARACTERIZATION OF TRANS EXCISION-SPLICING REACTION...

University of KentuckyUKnowledge
University of Kentucky Doctoral Dissertations Graduate School
2006
MOLECULAR RECOGNITION PROPERTIESAND KINETIC CHARACTERIZATION OFTRANS EXCISION-SPLICING REACTIONCATALYZED BY A GROUP I INTRON-DERIVED RIBOZYMEJoy SinhaUniversity of Kentucky, [email protected]
This Dissertation is brought to you for free and open access by the Graduate School at UKnowledge. It has been accepted for inclusion in University ofKentucky Doctoral Dissertations by an authorized administrator of UKnowledge. For more information, please contact [email protected].
Recommended CitationSinha, Joy, "MOLECULAR RECOGNITION PROPERTIES AND KINETIC CHARACTERIZATION OF TRANS EXCISION-SPLICING REACTION CATALYZED BY A GROUP I INTRON-DERIVED RIBOZYME" (2006). University of Kentucky DoctoralDissertations. Paper 296.http://uknowledge.uky.edu/gradschool_diss/296

ABSTRACT OF DISSERTATION
Joy Sinha
The Graduate School
University of Kentucky
2006

MOLECULAR RECOGNITION PROPERTIES AND KINETIC
CHARACTERIZATION OF TRANS EXCISION-SPLICING REACTION CATALYZED BY A GROUP I INTRON-DERIVED RIBOZYME
___________________________________
ABSTRACT OF DISSERTATION
__________________________________
A dissertation submitted in partial fulfillment of the requirements for the degree of Doctor of Philosophy
in the College of Arts and Sciences at the University of Kentucky
By
Joy Sinha
Lexington, Kentucky
Director: Dr. Stephen Testa, Associate Professor of Chemistry
Lexington, Kentucky
Copyright © Joy Sinha 2006

ABSTRACT OF DISSERTATION
MOLECULAR RECOGNITION PROPERTIES AND KINETIC CHARACTERIZATION OF TRANS EXCISION-SPLICING REACTION
CATALYZED BY A GROUP I INTRON-DERIVED RIBOZYME
Group I introns belong to a class of large RNAs that catalyze their own excision from precursor RNA through a two-step process called self-splicing reaction. These self-splicing introns have often been converted into ribozymes with the ability site specifically cleave RNA molecules. One such ribozyme, derived from a self-splicing Pneumocystis carinii group I intron, has subsequently been shown to sequence specifically excise a segment from an exogenous RNA transcript through trans excision-splicing reaction.
The trans excision-splicing reaction requires that the substrate be cleaved at two positions called the 5’ and 3’ splice sites. The sequence requirements at these splice sites were studied. All sixteen possible base pair combinations at the 5’ splice site and the four possible nucleotides at the 3’ splice site were tested for reactivity. It was found that all base pair combinations at the 5’ splice site allow the first reaction step and seven out of sixteen combinations allow the second step to occur. Moreover, it was also found that non-Watson-Crick base pairs are important for 5’ splice site recognition and suppress cryptic splicing. In contrast to the 5’ splice site, 3’ splice site absolutely requires a guanosine.
The pathway of the trans excision-splicing reaction is poorly understood. Therefore, as an initial approach, a kinetic framework for the first step (5’ cleavage) was established. The framework revealed that substrate binds at a rate expected for RNA-RNA helix formation. The substrate dissociates with a rate constant (0.9 min-1), similar to that for substrate cleavage (3.9 min-1). Following cleavage, the product dissociation is slower than the cleavage, making this step rate limiting for multiple-turnover reactions. Furthermore, evidence suggests that P10 helix forms after the 5’ cleavage step and a conformational change exists between the two reaction steps of trans excision-splicing reaction. Combining the data presented herein and the prior knowledge of RNA catalysis, provide a much more detailed view of the second step of the trans excision-splicing reaction.
These studies further characterize trans excision-splicing reaction in vitro and provide an insight into its reaction pathway. In addition, the results describe the limits of

the trans excision-splicing reaction and suggest how key steps can be targeted for improvement using rational ribozyme design approach.
Keywords: Group I intron; ribozyme; trans excision-splicing; splice site sequence
requirements; kinetic characterization of 5’ cleavage step.
Joy Sinha
2006

MOLECULAR RECOGNITION PROPERTIES AND KINETIC
CHARACTERIZATION OF TRANS EXCISION-SPLICING REACTION CATALYZED BY A GROUP I INTRON-DERIVED RIBOZYME
By
Joy Sinha
Stephen M. Testa, Ph.D. Director of Dissertation Robert B. Grossman, Ph.D. Director of Graduate Studies August 28, 2006

RULES FOR THE USE OF DISSERTATIONS
Unpublished dissertations submitted for the Doctor’s degree and deposited in the University of Kentucky Library are as a rule open for inspection, but are to be used only with due regard to the rights of the authors. Bibliographical references may be noted, but quotations or summaries of parts may be published only with the permission of the author, and with the usual scholarly acknowledgements. Extensive copying or publication of the dissertation in whole or in part also requires the consent of the Dean of the Graduate School of the University of Kentucky.

DISSERTATION
Joy Sinha
The Graduate School
University of Kentucky
2006

MOLECULAR RECOGNITION PROPERTIES AND KINETIC
CHARACTERIZATION OF TRANS EXCISION-SPLICING REACTION CATALYZED BY A GROUP I INTRON-DERIVED
RIBOZYME
___________________________________
DISSERTATION
__________________________________
A dissertation submitted in partial fulfillment of the requirements for the degree of Doctor of Philosophy in the College of Arts and Sciences at the University of Kentucky
By
Joy Sinha
Lexington, Kentucky
Director: Dr. Stephen Testa, Associate Professor of Chemistry
Lexington, Kentucky
2006
Copyright © Joy Sinha 2006

ACKNOWLEDGMENTS
It has been said that you learn more from your failures than your successes - if that is
true, I must have learned a lot. Although the five years I have spent here have been filled
with much frustration (and some successes too), I do feel it has been worth it for I have
learned not only a lot about science but also about myself. No one can pass through the world
of single minded pursuit of doctoral research without an advisor and thus, I will begin with
my research advisor, Dr. Stephen Testa. I joined his lab partly because I would learn
something new, partly because I would have the opportunity to work on a variety of projects
and partly because he is a nice guy. I thank him for teaching me to think vigorously, and to
figure out things for myself rather then telling me what to do next. I would also like to thank
him for pointing out my weaknesses and encouraging me to improve myself. I have benefited
immensely from the lessons he imparted to me. I also appreciate his steadfast confidence in
my abilities and judgment.
I have had the privilege to work in a lab full of very nice people and would like to
thank all the members of the Testa Lab, both past and present, for their input and assistance. I
owe special thanks to Dr. Michael Bell who helped me a lot; especially for helping me to
learn different techniques when I first started. In addition, it has been a pleasure to work with
Dr. Rashada Alexander, Dr. Ashley Johnson, Dr. Dana Baum, and Dustin Lafferty. I
especially thank P. Patrick Dotson II and Nick Tzouanakis for their comradeship, which
provided invaluable support, as did their advices and suggestions. It has been fun to work
with you two.
I thank Dr. Edward DeMoll, Dr. Bert C. Lynn, Dr. Marcos Oliveira, Dr. David
Rodgers, and Dr. Martha Peterson for serving on my doctoral advisory committee. I
appreciate their time and energy to attend committee meetings, my oral exam, my exit
seminar and for reading this disseratation.
I especially thank my parents back home in India- for their love and support. My
father, Dr. Dikshit Sinha from whom I first heard about research and was inspired by his life
long pursuance and endeavor in academics, and my Mother, Swati Sinha, for her sacrifice
and for always encouraging me to succeed. Although they might have difficulty
distinguishing ribozyme from ribosome, it is their steadfast support, encouragement and love
iii

that facilitated and enriched my twenty nine years of exploration of many facets of this
world, including science. I thank my wife Debaleena for putting up with my quest for
scientific success. She was wondrously understanding, supportive, and optimistic through
this adventure and some very difficult times.
I will always treasure the five wonderful years that I spent at Visva Bharati University
in India. I remain thankful to my undergraduate mentor Prof. Aloka Rao for all her
encouragements and excellent teaching. I am also thankful to late Prof. R. R. Rao for his
infinite wisdom and introducing me to the fascinating aspects of organic chemistry and utility
of the interdisciplinary research. I would also want to thank all my friends from those days
(the list would be too long to mention in person). To attempt to thank all the people who have
entered and touched my life over the years would take several pages and thus, I limited
myself to thanking only a few individuals. Those not mentioned here are not forgotten and no
less appreciated.
iv

TABLE OF CONTENTS
ACKNOWLEDGMENTS ....................................................................................................... iii
TABLE OF CONTENTS.......................................................................................................... v
LIST OF TABLES................................................................................................................... ix
LIST OF FIGURES .................................................................................................................. x
ABBREVIATIONS .................................................................Error! Bookmark not defined.
CHAPTER ONE- INTRODUCTION....................................................................................... 1
Investigation of the Molecular Recognition of Splice Sites in a Trans Excision-
Splicing Reaction .......................................................................................................... 2
Kinetic Characterization of the First Step of the Trans Excision-Splicing Reaction. .. 2
CHAPTER TWO-BACKGROUND......................................................................................... 4
Nucleic Acid Composition............................................................................................ 4
Central Dogma of Molecular Biology .............................................................. 4
Deoxyribonucleic Acid...................................................................................... 4
Ribonucleic Acid ............................................................................................... 5
RNA Splicing ..................................................................................................... 6
RNA Catalysis .............................................................................................................. 7
Catalytic RNA or Ribozyme .............................................................................. 7
Group I Intron Self-Splicing ............................................................................. 8
Group I Intron-Derived Ribozymes ................................................................ 10
The Trans Excision-Splicing Reaction............................................................ 10
Experimental Methods used for Nucleic Acids .......................................................... 11
Gel Electrophoresis ........................................................................................ 11
v

Autoradiography ............................................................................................. 12
Site Directed Mutagenesis .............................................................................. 13
CHAPTER THREE- STUDYING MOLECULAR RECOGNITION OF SPLICE SITES IN
A TRANS EXCISION SPLICING REACTION.................................................................... 34
Introduction................................................................................................................. 34
Materials and Methods................................................................................................ 35
Oligonucleotide Synthesis and Purification.................................................... 35
Plasmid Construction and Synthesis............................................................... 36
Transcription................................................................................................... 37
TES Reactions ................................................................................................. 37
Kinetics of the Trans Excision-Splicing Reaction........................................... 38
Competition Studies ........................................................................................ 38
Results......................................................................................................................... 39
Molecular Recognition at the 5’ Splice Site. .................................................. 39
The Source of Cryptic Products. ..................................................................... 42
The Mechanism of Cryptic Product Formation .............................................. 42
Molecular Recognition at the 3’ Splice Site. .................................................. 43
Discussion................................................................................................................... 44
Molecular Recognition at the 5’ Splice Site. .................................................. 44
Molecular Recognition at the 3’ Splice Site. .................................................. 47
P9.0 and P10 are not Required for TES Reactions. ....................................... 47
A Mechanism for Ribozyme-Mediated TES Product Degradation. ................ 48
Non-Watson-Crick Base Pairs at the 5’ Splice Site Can Play a Role in
Determining the Binding Register of Reaction Substrates. ............................ 49
What is the Role of ωG in Determining the Binding Register of Substrates? 50
Implications................................................................................................................. 51
CHAPTER FOUR - KINETIC FRAMEWORK OF THE FIRST STEP OF THE TRANS
EXCISION-SPLICING REACTION ..................................................................................... 66
vi
Introduction................................................................................................................. 66
Materials and Methods................................................................................................ 67
Nucleic Acid Synthesis and Purification........................................................ 67
Transcription................................................................................................... 67
Analysis of 5’ Cleavage Reaction Catalyzed by rP-8/4x Ribozyme................ 67
pH/ Rate Determinations ................................................................................ 68
Measurement of the substrate dissociation rate constant (k-1) ....................... 68
Measurement of the Substrate Association Rate Constant (k1). ..................... 69
Measurement of the Dissociation Constant, KdP of the Ribozyme-Product
Complex. ......................................................................................................... 70
Measurement of Rate Constant of 5’ Cleavage Product Dissociation (k-3).70
Results......................................................................................................................... 71
Substrate for Kinetic Characterization of the First Step of TES Reaction ..... 71
Rate Constant of Substrate Cleavage, k2. ....................................................... 71
Dependence of Rate Constant of Substrate Cleavage on pH.......................... 72
Rate Constant of Substrate Dissociation (k-1)................................................. 73
Rate Constant of Substrate Association (k1). ................................................. 74
Reversibility of 5’ Cleavage Reaction............................................................. 74
Equilibrium Dissociation Constant of Substrate and Product. ..................... 75
Rate Constant of 5’ Cleavage Product (5’ Exon Intermediate) Dissociation (k-
3). ..................................................................................................................... 76
Discussion................................................................................................................... 76
Summary of Kinetic Results. ........................................................................... 76
Rate Constants of Substrate and 5’ Exon Intermediate Binding. ................... 77
Rate Constant of Substrate Cleavage. ............................................................ 77
Helix P10 Forms After the First Step. ............................................................ 78
ωG Does Not Interact with the GBS Prior to or During the 5’ Cleavage
Reaction. ......................................................................................................... 79
Intervening Conformational Change Between the Two Reaction Steps. ........ 79
Implications................................................................................................................. 80
vii

Implication Regarding Sequence Specificity. ................................................. 80
Comparison to Other Ribozymes. ................................................................... 80
CHAPTER FIVE - CONCLUSIONS ..................................................................................... 92
Molecular Recognition of Splice Sites in a TES Reaction ......................................... 92
Mechanism and Kinetic Characterization of the 5’ Cleavage Step of the TES Reaction
..................................................................................................................................... 93
REFERENCES ....................................................................................................................... 95
Vita........................................................................................................................................ 108
viii

LIST OF TABLES Table 3.1: Observed Rate Constants for Base Pair Combinations Producing Appreciable TES
Product in 15 Minutes....................................................................................................... 52
ix

LIST OF FIGURES FIGURE 2.1: Central Dogma of Molecular Biology.............................................................. 15
FIGURE 2.2: Deoxyribonucleotide ........................................................................................ 16
FIGURE 2.3: Nitrogenous Bases in DNA .............................................................................. 17
FIGURE 2.4: Chain Form of DNA......................................................................................... 18
FIGURE 2.5: Watson-Crick Base Pair ................................................................................... 19
FIGURE 2.6: Hoogsteen Base Pair......................................................................................... 20
FIGURE 2.7: Ribonucleotide.................................................................................................. 21
FIGURE 2.8: Uracil and Pseudouridine ................................................................................ 22
FIGURE 2.9: RNA Secondary Structure ................................................................................ 23
FIGURE 2.10: Chemical Steps of Self-Splicing and Self-Cleaving Reactions of Ribozymes
................................................................................................................................................. 24
FIGURE 2.11: Predicted Secondary Structure of the Pneumocystis carinii Self-Splicing
Group I Intron ......................................................................................................................... 25
FIGURE 2.12: Self-Splicing Reaction of a Group I Intron .................................................... 27
FIGURE 2.13: Predicted Secondary Structure of the Pneumocystis carinii Ribozyme ......... 29
FIGURE 2.14: Trans Excision-Splicing Reaction .................................................................. 31
FIGURE 2.15: Site Directed Mutagenesis.............................................................................. 33
FIGURE 3.1: Scheme of the Two Step Trans Excision-Splicing Reaction............................ 53
FIGURE 3.2: The G●U Wobble Pair ..................................................................................... 54
FIGURE 3.3: Test System for 5’ Splice Site Sequence Requirements................................... 55
FIGURE 3.4: Results for the 5’ Splice Site During 1 Hour Reaction Times ......................... 56
FIGURE 3.5: Time Courses Following the Appearance of Cryptic Products........................ 58
FIGURE 3.6: Results for the 5’ Splice Site During 15 Minute Reaction Times .................... 60
FIGURE 3.7: Time Courses to Identify the Source of the Cryptic Products.......................... 62
FIGURE 3.8: Competition Studies Investigating Product Dissociation and Rebinding ........ 63
FIGURE 3.9: Results for the 3’ Splice Site for 1 Hour Reaction Times ................................ 64
FIGURE 3.10: Results for Reactions Where No P10 Formation Is Possible ......................... 65
FIGURE 4.1: Test System for Kinetic Characterization of the 5’ Cleavage Reaction........... 82
FIGURE 4.2: The Minimal Kinetic Scheme for 5’ Cleavage Reaction. ................................ 83
x

FIGURE 4.3: 5’ Cleavage Reactions under Single Turnover Conditions. ............................. 84
FIGURE 4.4: Determination of k2 and k2/KM’ ........................................................................ 85
FIGURE 4.5: The pH Dependence of the 5’ Cleavage Reaction. .......................................... 86
FIGURE 4.6: Determination of Rate of Substrate Dissociation (k-1). .................................... 87
FIGURE 4.7: Determination of the Rate of Substrate Association (k1). ................................ 88
FIGURE 4.8: 5’ Cleavage Products Can Undergo the Reverse Reaction and Existence of an
Internal Equilibrium................................................................................................................ 89
FIGURE 4.9: Determination of Equilibrium Dissociation Constant, KdP............................... 90
FIGURE 4.10: The Dissociation Rate Constant of the 5’ Cleavage Product (k-3).................. 91
xi

List of Files
JSDiss.pdf Adobe Acrobat portable document file
xii

CHAPTER ONE- INTRODUCTION
Ribonucleic acid, or RNA, is a biomolecule, that plays a pivotal role in the central
dogma of molecular biology although it was initially thought to be a relatively passive
molecule. The ability of RNA molecules to catalyze chemical reactions were discovered little
more than two decades ago in the early 1980’s (1, 2). This discovery of catalytic RNA
changed the old view of RNA. It was soon found that RNA catalysis occurs widely in nature,
occurring in plants, bacteria, viruses, and lower eukaryotes and also in mammals (3, 4). Also,
research has focused on characterizing these catalytic RNAs, or ribozymes, and utilizing their
properties to catalyze new reactions (5-8).
It has been previously shown that a ribozyme derived from a group I intron of a large
ribosomal subunit from the opportunistic pathogen Pneumocystis carinii can catalyze the
sequence specific excision of regions from an RNA transcript (9-11). The reaction was
termed the trans excision-splicing (TES) reaction. Our interest in this system is three fold.
First, the previous studies have uncovered many intriguing mechanistic questions. What is
the sequence requirement for the two reaction steps? What is holding the 3’ exon
intermediate between the two reaction steps? Is there a conformational change between the
two steps. Second, this reaction has potential use as a biochemical tool for the sequence
specific modification of RNA molecules. The ribozyme also has potential therapeutic
applications in that it could be used to remove mutations (at the RNA level) that are
implicated in a host of genetic diseases. Third, the ability to manipulate the substrate and
catalytic portion of the molecule separately provides the trans excision-splicing reaction with
the ability to serve as a unique model system for studying the structure and function of group
I introns. The purpose of this research is to understand the fundamental principles that govern
RNA catalysis. The research presented in this work further characterizes the TES ribozyme
in vitro by elucidating molecular recognition properties for the determination of 5’ and 3’
splice sites (10). This thesis further describes investigation of the kinetic pathway of the TES
ribozyme with emphasis on the first step of the reaction.
1

Investigation of the Molecular Recognition of Splice Sites in a Trans Excision-Splicing
Reaction
TES ribozyme recognizes their target through base pairing. These base pairing
interactions also help to define sites where the backbone is cleaved (called splice sites).
Previous works with the P. carinii group I intron-derived ribozyme, preserved the highly
conserved nucleotide sequences that define the splice sites in the native group I introns.
Specific sequence requirements at these critical positions would limit the sequences that
could be a useful target for TES ribozymes. In conjunction with another member of Testa
lab, Dana Baum, all possible sequences were identified that would allow the catalytic activity
at the splice sites. These studies would be useful for obtaining insight into molecular
recognition of the splice site by the ribozymes.
These results showed that the sequence requirement at the 5’ splice site were not
stringent like other group I intron-derived ribozymes. However, certain sequences lead to
product degradation through cryptic splicing and should be avoided. This lax sequence
specificity indicates the molecular recognition of the 5’ splice site is dependent on structure,
and not sequence (i.e. base pairing). In contrast, the sequence requirement at the 3’ splice site
is absolute. The 3’ splice site must have a guanosine for the second step of the TES reaction
to proceed leading to the formation of TES product (10). These results provide guidelines for
rational development of new TES target systems.
Kinetic Characterization of the First Step of the Trans Excision-Splicing Reaction.
To understand the mechanism of RNA catalyzed reactions, establishment of kinetic
framework was widely used (12-14). These studies have been mechanistically informative. It
has advanced our knowledge of the chemical basis and the pathway for the catalytic
functions of these ribozymes. For trans excision splicing ribozyme, the rate constants for 5’
cleavage and exon ligation reactions in a single turnover reaction have been reported and
possible mechanistic pathway has been proposed based on prior understanding of other group
I intron-derived ribozyme reactions (10, 15). However, none of the reaction steps have been
studied in detail and rate constants for individual steps have not yet been determined. Thus, a
2
detailed kinetic scheme would provide a foundation for further mechanistic understanding of
trans excision splicing reaction.
The kinetic pathway of the 5’ cleavage reaction shows that the substrate dissociation
is comparable to the substrate cleavage step and the chemical step is masked by a rate-
limiting conformational change. These results further suggest that the product dissociation is
so slow that it is rate limiting for multiple turnover reaction. These results provide
mechanistic insights for understanding of the TES reaction and establish a basis for further
studies on its mechanism. Furthermore, as the same ribozyme or its derivative has been used
to develop new reactions (16, 17) where 5’ cleavage is the first reaction step, the framework
presented herein will also provide a starting point for further enhancement of these reactions.
Copyright © Joy Sinha 2006
3

CHAPTER TWO-BACKGROUND
Nucleic Acid Composition
Central Dogma of Molecular Biology
Nucleic acids occupy an important position in biological systems and participate in a
wide array of complex cellular functions even though they are based on relatively simple
nucleotide monomers. For example, in the cell, DNA stores all the genetic information. This
double stranded DNA is transcribed into single stranded RNA and RNA acts as a template
for translation of protein. This flow of genetic information was first described by Crick and is
known as the central dogma of molecular biology (Figure 2.1) (18).
Deoxyribonucleic Acid
DNA, or deoxyribonucleic acid, is a polymer consisting of monomeric units termed
nucleotides. Each of these units contains three components: a phosphate group, a 2’ deoxy-
D-ribose molecule (a sugar), and a nitrogenous aromatic heterocyclic nucleobase (19, 20)
(Figure 2.2). The nucleobases are of two types: bicyclic purines and monocyclic pyrimidines.
Purines are adenine (A) and thymine (T), while pyrimidines are guanine (G), and cytosine
(C) (Figure 2.3). Each DNA nucleoside is joined by a phosphodiester from its 5’-hydroxyl to
the 3’-hydroxyl group of one neighbor and by a second phosphodiester from its 3’-hydroxyl
to the 5’-hydroxyl of its other neighbor (Figure 2.4). There are no 5’-5’ or 3’-3’ linkages in
the regular DNA. The phosphodiester backbone has directionality from the 5’-carbon to the
3’-carbon on the sugar. The uniqueness of a given DNA primary sequence is based solely on
the sequence of its bases. The predominant DNA structure found under physiological
conditions is termed as B-DNA. This form of DNA consists of two anti parallel strands of
nucleic acid connected by base pairs around a central axis. The base pairs are formed by
hydrogen bonding between the nucleobases (Figure 2.5) and the most common base pairs are
called Watson-Crick base pairs. There are two sets of Watson-Crick base pairs: A-T or T-A
(forming two hydrogen bonds) and C-G or G-C (forming three hydrogen bonds). These two
sets of base pairs have an isomorphous geometry and thus A-T pairs can replace C-G pairs
4

and vice versa without changing the overall geometry of the helix. While Watson-Crick base
pairing is predominant, other pairings have also been discovered although these base pairs
are not isomorphous with Watson-Crick pairs. Most significant of them is the Hoogsteen
pairs (21) (Figure 2.6). The nature of Watson-Crick base pairing results in a duplex structure
composed of single strands that are self-complimentary so that knowledge of nucleobase
sequence in one strand is sufficient to define the sequence of the other. This feature facilitates
the replication and repair of DNA.
Ribonucleic Acid
RNA, or ribonucleic acid, like DNA is also a polymer of nucleotides. The main
difference between RNA and DNA is that RNA contains a ribose sugar instead of a
deoxyribose sugar. The ribose sugar has a hydroxyl group on its 2’-carbon (Figure 2.7), and
the presence of this additional functional group makes RNA chemically less stable than
DNA. The extra hydroxyl group also allows the RNA to have the catalytic functions
discussed here. Another difference between RNA and DNA is that RNA uses nucleobase
uracil while DNA uses thymine. In addition, some RNAs sometimes contain modified
nucleobases like pseudouridine etc (Figure 2.8).
RNA, like DNA is a polymer with a phosphodiester backbone linked in a 5’ to 3’
direction (Figure 2.4). Therefore, like DNA the sequence of nucleobases determines the
primary structure of RNA, but unlike DNA, RNA is typically single stranded. Presence of an
additional 2’ hydroxyl group, helps RNA to fold so that it can base pair with complementary
sections of itself (only when forming the secondary and tertiary structures), producing
structures. The current model of RNA folding proposes that it is hierarchical in nature
although there are well documented exceptions (22, 23). In a hierarchical folding model,
primary sequence interacts to form the secondary structure, and from the secondary structure
develops the tertiary structure (23-25). The formation of the tertiary structure minimally
distorts the secondary structure.
The secondary structure in RNA is dominated by Watson-Crick base pairs that form
A-form double helices. The secondary structure forms first between neighboring regions in
the primary sequence, followed by end-to-end stacking of adjacent helices (26). The
5

preformed helices in a secondary structure associate into bundles of helices (also known as
structural domains) to constitute the tertiary structure. The tertiary structure is generally
maintained by long-range interactions called tertiary interactions (27). The tertiary structure
of large RNAs are often composed of several structural domains, which can assemble and
fold independently (28, 29).
RNA secondary structures are most commonly comprised of helices, internal and
asymmetric loops, bulges, and junctions (Figure 2.9). Bases in loops, bulges, and junctions
are sometimes paired but the pairing is usually non-canonical. Even unpaired nucleotides
might not be single stranded and are frequently involved in a variety of interactions. These
secondary structures play very important roles in substrate binding and determining the
correct folding of RNA. For example, non Watson-Crick base pairs and coaxial stacking of
helices are important mediators of RNA self-assembly. Non-canonical base pairs widen the
major groove, thereby making it accessible to ligands (30).
RNA Splicing
Eukaryotic genes usually contain noncoding DNA sequences termed introns. RNA
polymerases transcribe both the coding sequences (exons) and the introns to give large
precursor RNAs. After transcription, the introns are removed by a process known as RNA
splicing, which results in the introns being excised out and the flanking exons being ligated
together (31). RNA splicing proceeds through two consecutive phosphotransesterification
reactions forming mature RNA (32). The process requires sequence recognition, strand
cleavage, and ligation. In addition, the splicing process must be efficient and accurate; error
in pre-mRNA will destroy the reading frame for protein synthesis, inaccuracy in pre-rRNA
and pre-tRNA will produce nonfunctional ribosomes and tRNAs (33). In vivo, the splicing is
carried out by a large, multicomponent, and dynamic RNA-protein complex termed as
spliceosome (34, 35). It should be noted that in many cases, RNA splicing involves the RNA
molecule not only as a substrate, but also as a catalyst.
6

RNA Catalysis
Catalytic RNA or Ribozyme
In the early eighties, it was discovered that naturally occurring RNA sequences have
the ability to catalyze the cleavage of phosphodiester bonds in the absence of proteins (1, 36)
which falsified the longtime thought that only proteins were capable of catalyzing chemical
reactions. These RNA sequences have been termed “catalytic RNA”.
Seven different classes of catalytic RNA motifs have been found in nature:
hammerhead (37, 38), hairpin (39, 40), hepatitis delta virus (HDV) (41), and Varkud satellite
(VS) (42) catalytic RNAs, group I (2) and group II introns (43-45), and the RNA subunit of
RNase P (1). Recently an eighth natural catalytic RNA motif, called glmS ribozyme, has been
identified in a riboswitch (46) that only shows catalyzes cleavage of phosphodiester bond
upon cofactor binding. In addition, RNA components of ribosomes have been shown to have
catalytic activity (47).
Based on their size and mechanism, the catalytic RNAs have been broadly divided
into two categories. The hammerhead, HDV, VS, and glmS are small catalytic RNAs (also
known as self-cleaving) of only 50-150 nucleotides, or even less. Other three catalytic RNAs
(group I and II introns, and the RNA subunit of RNase P) are larger, several hundred
nucleotides in length, and fold into complex structures containing single and double stranded
regions, base triples, loops, bulges, and junctions. Surprisingly, with one exception, naturally
occurring catalytic RNAs cannot be termed true enzymes (or catalysts) because they catalyze
reactions that modify themselves. The exception is RNase P, which processes the 5’ end of
tRNA precursors and is the only known example of a true naturally occurring RNA-based
enzyme. However, all theses naturally occurring catalytic RNAs can be engineered, so that
they can modify external RNA molecules in trans (intermolecular fashion) without becoming
altered themselves. The engineered catalytic RNAs behave like true enzymes and are termed
ribozymes (ribonucleic acid + enzyme).
In addition to size, the catalytic mechanisms of small and large ribozymes are
different, although all of them catalyze a phosphotransesterification reaction. The
hammerhead, hepatitis delta virus (HDV), hairpin, Varkud satellite (VS), and glmS
ribozymes perform site-specific reversible phosphodiester cleavage reaction. The reaction
7

proceeds due to an attack of a neighboring 2’-OH on the phosphorus atom and generates 5’
hydroxyl and 2’, 3’ cyclic phosphate termini (48) (Figure 2.10A). RNase P (49), self-splicing
group I and II introns catalyze phosphodiester cleavage and ligation reactions that produce 5’
phosphate and 3’ hydroxyl termini (7, 50, 51) (Figure 2.10B). All these reactions proceed by
attack of a nucleophile. This nucleophile is either 3’ hydroxyl of an external guanosine
(group I intron), or water molecule (RNase P), or 2’ hydroxyl of an internal adenosine (group
II introns).
One absolute requirement for ribozyme catalysis is the presence of a divalent metal
ion, most commonly Mg2+, or a high concentration of monovalent cations (most commonly
Na+ or K+) (52-66). In this regard the ribozymes are similar to protein metalloenzymes and
metal ions seemed to offer the chemical versatility that RNA functional groups lack (60). The
phosphotransesterification reactions catalyzed by either small or large ribozymes are roughly
equivalent to non-enzymatic hydrolysis of RNA and proceeds with an inversion of the
configuration at the phosphorus atom undergoing nucleophilic attack (67-69). Inversion of
the configuration suggests that the reactions follow an SN2 type in-line attack mechanism
with the development of a pentacoordinate transition state or intermediate.
Group I Intron Self-Splicing
Group I introns belong to a phylogenetically diverse family of large RNAs, its size
ranging from a few hundred nucleotides to around 3000. More than 2000 of them have been
discovered to date in tRNAs, mRNAs, and rRNAs of prokaryotes but were not yet found in
higher eukaryotes. The group I introns from phylogenetically diverse sources can be
recognized by a common secondary structure, although they can show less than 10% overall
sequence identity. A common secondary structure implies a common tertiary structure and a
common splicing pathway (7). The catalytic activity of RNA was first discovered in the
group I intron of the pre-rRNA of Tetrahymena thermophila (36). It was found that the intron
could self-splice, excising itself out of the pre-rRNA in the absence of proteins.
Prior to this reaction, the intron folds into its catalytically active form through
extensive base pairing and tertiary interactions. Through this folding pathway, the helices P1
to P9.0 form the catalytic core of the intron (Figure 2.11). The helices are further organized
8

in two principal pseudo-helical domains: domain P4-P5-P6 and domain P3-P7-P8 (70, 71).
These two domains together form a cleft in which helices P1 and P10 reside. These two
helices together constitute the internal guide sequence (IGS) of the intron and form by base
pairing with the endogenous 5’ and 3’ exons (7).
The self-splicing reaction of a group I intron consists of two consecutive
phosphotransesterification reactions. The first catalytic step of self-splicing reaction is called
5’ cleavage (Figure 2.12) reaction. This step is initiated by either an exogenous guanosine or
one of its 5’ phosphorylated forms (GMP, GDP or GTP) (7). The exogenous guanosine
nucleotide binds a specific site located in P7 helix, known as the guanosine binding site
(GBS) (Figure 2.11) (72, 73). The 3’ hydroxyl of this guanosine acts as a nucleophile and
attacks the phosphodiester backbone at the 5’ splice site within the P1 helix. The 5’ splice
site is defined by the last nucleotide of the 5’ exon, base-paired to a specific nucleotide that is
part of the internal guide sequence of the intron. The last nucleotide of the 5’ exon is
normally a uridine, exceptionally a cytidine, and paired to a conserved guanosine (part of the
IGS) in all known group I Introns. Therefore, a conserved G●U wobble pair at the 5’ end of
the P1 helix defines the 5’ splice site (74-76). Due to the nucleophilic attack the backbone is
cleaved, resulting in a free 3’ hydroxyl on the terminal uridine nucleotide (part of G●U
wobble pair), the last base of the 5’ exon. The exogenous guanosine nucleophile after the
first catalytic step gets covalently attached to the end of the intron (2, 36, 77).
The second catalytic step is the exon ligation reaction, in which the newly generated
free 3’ hydroxyl of the terminal uridine attacks the phosphodiester backbone at the 3’ splice
site (Figure 2.12) (78, 79). This results in ligation of the exons and excision of the intron.
Following its excision, the intron goes on to circularize via an intramolecular reaction
pathway. The 3’ splice site of a group I intron is defined by a guanosine which always
precedes the splice site (80, 81). Mutational analysis (82) confirmed the importance of this
nucleotide in defining this site. This conserved G is known as ωG and it needs to bind the
GBS for exon-ligation step. However, the exogenous G binds the GBS prior to the first step
and needs to be removed so that ωG can bind. This is achieved through a conformational
change preceding the second step, which replaces the exogenous G with the ωG at the GBS.
The nucleotide preceding the ωG is not conserved among group I introns, but is nevertheless
important for the determination of the 3’ splice site as demonstrated in the Tetrahymena and
9

sunY introns (82, 83). The sequences preceding 3’ splice site form the P9.0 helix and along
with P10 helix can participate in the determination of the 3’ splice site. In addition, formation
of these two helices precisely positions the 3’ exon and brings the phosphodiester bond
between the ωG and 3’ exon next to the nucleophilic 3’ hydroxyl group of the 5’ exon,
resulting in the exon ligation reaction.
Group I Intron-Derived Ribozymes
Group I introns are frequently exploited as model systems for a thorough
understanding of RNA structure, function and reactions. Because the self-splicing introns
evolved to act as a single-turnover catalyst, studies often utilize group I intron-derived
ribozymes that can catalyze multiple turnover reactions. These ribozymes are essentially
introns lacking their endogenous 5’ and 3’ exons (5, 84). Such group I intron derived-
ribozymes recognize an exogenous RNA substrate by base-pairing, and cleave the substrate
using either exogenous guanosine or 3’ terminal guanosine or hydrolysis (6, 16, 79, 84-87).
New non-native ribozyme reactions are also developed by exploiting the molecular
recognition interactions and the inherent catalytic properties of the intron. In addition, it has
been shown that the IGS sequence of these ribozymes can be mutated so that it can target
different substrates. This characteristic has been exploited for engineering group I intron-
derived ribozymes that target and react with specific sequences. The trans excision-splicing
reaction studied throughout this work was developed based on the self-splicing reaction of
group I introns, in fact, the ribozyme catalyzing this reaction is itself derived from a self-
splicing group I intron (9, 88, 89).
The Trans Excision-Splicing Reaction
The Trans Excision-Splicing (TES) reaction was developed by the Testa lab using a
ribozyme derived from a group I intron in the ribosomal RNA of the opportunistic pathogen
Pneumocystis carinii (9, 88, 90) (Figure 2.13). This ribozyme can catalyze sequence specific
excision of a targeted sequence (from 1 to at least 28 nucleotides) from an exogenous RNA
substrate (10, 91). Prior to the reaction, the ribozyme folds into its catalytically active form
and binds the substrate (Figure 2.13). The ribozyme folding and substrate binding are similar
10

in TES and self-splicing reactions. RE1 base pairs with the 5’ region of the substrate (5’
exon), forming the P1 helix (Figure 2.13 and 2.14). RE2 base pairs with the segment targeted
for excision (when larger than a single nucleotide), forming the P9.0 helix, while RE3 base
pairs with the 3’ region of the substrate (3’ exon) to form the P10 helix (Figure 2.13 and
2.14). It should be noted that like self-splicing reaction, all the base pairing interactions
mentioned above are not absolutely required for reactivity. Engineered ribozymes without the
ability to form either P9.0 or P10, still retain the ability to catalyze reactions (91, 92).
After the ribozyme binds the RNA substrate, the reaction proceeds with two
phosphotransesterification reactions that are analogous to the self-splicing reaction (Figure
2.12). Prior to the reaction, the 3’ terminal guanosine (G344) of the ribozyme binds to the
guanosine binding site (5, 79, 84) and then activates its 3’ hydroxyl of the nucleoside for
nucleophilic attack. This phosphotransesterification reaction releases the 5’ exon, linking the
3’ exon of the substrate to the 3’ end of the ribozyme (P. P. Dotson, unpublished result). The
cleavage site (located within helix P1) for the first catalytic step (5’ cleavage) is at the
position that is equivalent to 5’-exon/intron junction in the self-splicing intron (the splice site
is known as 5’-splice site). This step does not require an exogenous guanosine. In the second
step (exon-ligation), the newly released nucleophilic 5’ exon attacks a specific base within
the 3’ exon of the intermediate, simultaneously ligating the exon intermediates and excising
an internal segment from the substrate. To position the 3’ exon mimic for the second
nucleophilic attack, the 3’ exon mimic forms a P10 helix with the ribozyme (Figure 2.14).
The 3’ splice site is defined by a guanosine (Figure 2.14) and this G acts like the ωG from
the intron, and presumably interacts with the guanosine binding site (GBS) in the ribozyme.
Experimental Methods used for Nucleic Acids
Gel Electrophoresis
Electrophoresis is the separation of charged molecules in an applied electric field.
Positive or negative charges are common in biomacromolecules. When placed in an electric
field, charged biomolecules move towards the electrode of opposite charge due to the
electrostatic attraction. The main method of analysis used in these studies is gel
electrophoresis.
11

Hydrated gel networks have many desirable properties for electrophoresis. The most
important of them is that they are chemically inert which allows for separation of molecules
based on physical rather than chemical differences. Theoretically, the molecules should
separate with respect to net charge, size, and shape. For nucleic acids, charge and shape are
consistent and hence size is the sole determining factor for separation. Gel networks are
polymers that are either crosslinked or non-crosslinked. The two most common gels used for
studying nucleic acids are agarose and polyacrylamide. The agarose is a polymer composed
of a repeating disaccharide unit called agarobiose which consists of galactose and 3, 6-
anhydrogalactose. These gels are used widely in separation of DNA molecules and are most
commonly used in the concentration range 0.5-2.0 % allowing separation of molecules up to
50 kb. A far stronger gel, also suitable for separation of nucleic acids, is the polymerized
acrylamide. The inclusion of a small amount of N, N’ methylene bisacrylamide allows
formation of a crosslinked gel with a highly-controlled porosity. For separation of nucleic
acids, the ratio of acrylamide: N, N’ methylene bisacrylamide is usually 19:1 and can be used
with nucleotides when a difference in size down to single nucleotides needs to be observed.
A polyacrylamide gel is usually set between two glass plates and held there while it is run.
The nucleic acid samples are applied to the gel at one end and migrate under the influence of
the electric field vertically to the other end. Smaller molecules move faster and so move
farther down the gel, while larger molecules remain higher up on the gel. One of the most
common methods for visualizing and analyzing polyacrylamide gels is autoradiography.
Autoradiography
Autoradiography is a method, by which radioactive material can be localized; for
example, within a particular tissue, cell, or even molecule. In this technique, a sample
containing a radioactive substance is placed in direct contact with a layer of a photographic
emulsion specially designed for autoradiography. Thus, autoradiography utilizes two
components, radioactive molecules, and photographic emulsions. The molecule is usually
radiolabeled with three types of radioisotopes- high energy (32P), medium (14C, 35S) and low
(3H); all of them are β-emitters. The emulsions contain suspensions of silver halide (AgCl,
AgF, AgBr, AgI). After the radioactive specimens are fixed on a fixed two-dimensional
12

surface (e.g. PAGE gel), the emulsion is exposed to it. Each β-particle emitted from the
molecules converts some of the silver ions to silver atoms within a film emulsion. The image
is revealed by subsequent development of the film which results in the reduction of all of the
silver atoms of an entire silver halide crystal to metallic silver (93). This process creates a
hole in the lattice corresponding to that area containing radioactive specimens. The
development process results in images or bands corresponding to the orientation of the
specimens on the gel. One disadvantage of this process is that the atoms of silver are likely to
lose their electrons and return to the silver ions. Hence, the image is likely to fade.
Traditional autoradiography requires X-ray film; however, the process of storage
phosphor visualization or phosphorimaging provides an additional method of visualizing
radioactive reactions. Plates, or screens, are coated with a solid phosphor, which store energy
in the photostimulable crystals. Typical phosphors are CaWO4, BaFCl•Eu2+, and rare-earth
oxysulfides. The screen is exposed to the radioactive substance and the energy from the β-
particles ionizes the rare earth metals, liberating electrons to the conduction band of the
phosphor crystals. The screen is then scanned laser light of approximately 633 nm, which
releases the trapped electrons and emits photons at 390 nm (94). The emitted photons are
detected with a conventional photomultiplier tube and are used to form an image. This image
is presented on a computer screen and the radioactive substances can be quantified using
specialized computer programs (94). Although this process requires a more expensive
instrument and specific software so that the image can be manipulated and the radioactive
substances can be quantified, the time to acquire images is reduced 80-90%. The images of
PAGE gels shown in these studies have been acquired using this method.
Site Directed Mutagenesis
Over last 25 years, because of recombinant DNA technology, a technique known as
site-directed mutagenesis has become one of the most important and powerful tools in
modern genetics. Its power lies in its ability, by chemical and enzymatic manipulation, to
change a specific DNA target in a predetermined manner.
One very important component of the site directed mutagenesis is oligonucleotide
primers of known unique sequences that also carry the changes needed to be incorporated to
13

the DNA. The changes in a mutant DNA sequence may be single or multiple. They may
involve base changes, base deletions, or base additions. The length of the primers must be
sufficient to overcome the likelihood that their sequence would occur randomly in the large
number of nontarget DNA sequences that are in the sample.
The first site-directed mutagenesis strategies employed single-stranded M13
bacteriophage DNA (95) and required around 24 hours to complete the process. The advent
of polymerase chain reaction (PCR), the discovery of thermostable DNA polymerases with
proofreading functions and high fidelity have made the site-directed mutagenesis a rapid and
efficient method. Site-directed mutagenesis, as it is practiced today, is an automated 3-step
process. The first step is denaturation where the reaction mix is heated to 95 OC for about 1
minute to separate the two strands of the DNA template. The second step is annealing (or
renaturation) where the reaction mixture is cooled to a certain temperature allowing the
oligonucleotide primers to anneal to the DNA template (most common temperatures used for
annealing being in the range of 50-55 OC). The third step is elongation (or synthesis) and in
this step, the reaction mixture is heated to a temperature ideal for the DNA polymerase. The
polymerase then catalyzes the synthesis of the DNA strand. The polymerase uses the
oligonucleotide primers to initiate the process and progresses in the 5’→3’ direction. These
three-step cycles are repeated over and over until a sufficient amount of product is produced.
The polymerase also uses the template DNA to direct what nucleotide should be added to the
growing chain (the method is outlined in Fig. 2.15). In addition, the use of DNA polymerase
with proofreading ability ensures synthesis of new DNA strand with very few errors. The
presence of hemimethylated sites in DNA, (5’Gm6ATC3’) is important for site directed
mutagenesis. These sites occur quite commonly in DNA obtained from cells but are absent in
enzymatically synthesized DNA from PCR. The endonuclease DpnI recognizes these
hemimethylated sequences and destroys the template DNA leaving the newly synthesized
mutant DNA intact. The mutant DNA can then be cloned into any plasmid of choice and
grown in a common strain of E. coli; the most commonly used one being DH5α.
Copyright © Joy Sinha 2006
14

FIGURE 2.1: Central Dogma of Molecular Biology Schematic, simplified description of the central dogma of molecular biology. Double-
helical DNA is replicated and passed on from one generation to the next. DNA encodes the
information on amino acid sequence in protein. DNA transfers this information to RNA via
transcription, which in turn, is transferred into protein through translation. In retroviruses
information can also be transferred from RNA to DNA through a process called reverse
transcription. Several additional processes, such as post-transcriptional and post-translational
modifications, are not depicted.
15

FIGURE 2.2: Deoxyribonucleotide Deoxyribonucleotides are the monomers that make up a DNA strand. Each
deoxyribonucleotide consists of a phosphate group, a deoxyribose sugar, and a nitrogenous
heterocyclic base. The identity of the nitrogenous base distinguishes each nucleotide.
16

FIGURE 2.3: Nitrogenous Bases in DNA The four nitrogenous heterocyclic bases found in DNA. Adenine and guanine are
purine bases, while thymine and cytosine are pyrimidine bases. Each base is typically
referred to by its single letter abbreviation: A = Adenine, G = Guanine, T = Thymine, and C
= Cytosine. These single letter abbreviations are also used to designate the nucleotides of
DNA. It should be noted that in the above figures the deoxyribose sugar is denoted simply as
sugar.
17

FIGURE 2.4: Chain Form of DNA Fragment of DNA linked by 3’, 5’phosphodiester bonds. Only a single base was
shown which is a guanosine. The rest of the bases were not shown for simplicity. Instead,
their position in a chain is marked with letter N, which could be any of the nucleobases. Also,
note that only the functional hydrogen atoms are shown. The chain direction is from 5’ to 3’-
end as shown by arrow.
18

FIGURE 2.5: Watson-Crick Base Pair
Schematic description of the Watson-Crick base pairs. The top pair is A : T pair
which results from adenine base pairing with thymine via two hydrogen bonds. The pair at
the bottom are G : C pair resulting from guanine pairing with cytosine via three hydrogen
bonds. For simplicity, only the functional hydrogen atoms are shown and the deoxyribose
sugar is not shown.
19

FIGURE 2.6: Hoogsteen Base Pair
Schematic description of the Hoogsteen base pair illustrated with A : T pair. These
pairs are not isomorphous with Watson-Crick pairs because the glycosidic bond orientation is
different.
20

FIGURE 2.7: Ribonucleotide
Ribonucleotides are the monomers that make up an RNA strand. Each ribonucleotide
consists of a phosphate group, a ribose sugar, and a nitrogenous base. The identity of the
nitrogenous base distinguishes each nucleotide. A key difference between the nucleotides
found in DNA and the nucleotides found in RNA is the presence of a hydroxyl group on the
2’ position of the ribose sugar. Base denotes any of the nitrogenous heterocyclic base, which
for RNA will be A, G, C or U (see figure 2.7).
21

FIGURE 2.8: Uracil and Pseudouridine
The base thymine in DNA is replaced by uracil in RNA (left). The difference between
thymine and uracil is the absence of a methyl group in uracil. Uracil is typically referred to
by its single letter abbreviation of U. The base pseudouridine is one the most common
modified nucleobases found in RNA (right). The orientation of the functional groups in this
base is different from uridine. Pseudouridine is typically referred to by its single letter
abbreviation of ψ. Note that the only the functional hydrogens are shown and ribose denotes
the location of the ribose sugar.
22

FIGURE 2.9: RNA Secondary Structure
RNA is typically single stranded, however; it has the ability to base pair and to form
structures. RNA secondary structures are comprised of helices, hairpin loops, internal and
asymmetric loops, bulges, and junctions.
23

N + 1O
OHO
O
O
OH
ON−1
O
P O−O
O
5'
N + 1
OHO
O
O
O
ON−1
O
P Oδ−−δO
O
5'
N + 1O
OHO
HO
O
O
ON−1
O
PO
O
5'
3'3'3'
O−
FIGURE 2.10: Chemical Steps of Self-Splicing and Self-Cleaving Reactions of
Ribozymes
(A) The small ribozymes catalyze the reversible self-cleaving reaction where the 2’
hydroxyl which is part of the ribozyme is the attacking nucleophile and the bridging oxygen
is the leaving group. (B) The self-splicing reactions of RNase P and self-splicing introns
involve attack of an exogenous nucleophile on the phosphodiester backbone. The nucleophile
varies from ribozyme to ribozyme. It can be 3’ hydroxyl of an exogenous guanosine (group I
introns) or 3’ hydroxyl of an adenosine within the ribozyme (group II introns) or a water
molecule (RNase P). All the different nucleophiles are generalized as ROH. For self-splicing
reactions, the bridging 3’ oxygen is the leaving group. The second step of the self-splicing
reaction is simply the reverse of the scheme shown above. Both self-cleaving and self-
splicing reactions proceed with an inversion of the stereochemical configuration at the
reaction center implying the attack of the nucleophile is SN2 type. N-1 and N+1 denote the
nucleosides on the 5’ and 3’ sides of the reactive phosphodiester.
O
N + 1O
OHO
O
O
OH
N−1O
P O−O
O
5'
ORH
N + 1O
OHO
O
O
OH
ON−1
O
POδ−
−δO
O
5'
OR
N + 1O
OHO
O
O
OH
ON−1
O
P
O−
O
OH
5'
OR
3' 3'
3'
A
B
N + 1O
OHO
O
O
OH
N−1O
P O−O
O
5'
N + 1
OHO
O
O
O
ON−1
O
P Oδ−−δO
O
5'
N + 1O
OHO
HO
O
O
ON−1
O
PO
O
5'
3'3'3'
O−
O
O
O
N + 1O
OHO
O
O
OH
N−1O
P O−O
O
5'
ORH
N + 1O
OHO
O
O
OH
ON−1
O
POδ−
−δO
O
5'
OR
N + 1O
OHO
O
O
OH
ON−1
O
P
O−
O
OH
5'
OR
3' 3'
3'
A
B
O
24

FIGURE 2.11: Predicted Secondary Structure of the Pneumocystis carinii Self-Splicing
Group I Intron
The primary and the predicted secondary structure of the self-splicing intron from the
opportunistic pathogen Pneumocystis carinii (9). The helices P1-P9 are marked. Solid lines
indicate a direct connection in the primary sequence and arrowheads emphasize the
directionality of the chain. Watson-Crick base pairs (▬) and non-Watson-Crick base pairs
(●) are indicated. The uppercase lettering denotes intron sequences whereas the endogenous
exons are in lowercase. The catalytic core of the intron is enclosed in grey. The catalytic core
contains recognition elements RE1, RE2, and RE3. These recognition elements form helices
25

P1, P9.0 and P10 respectively. The guanosine binding site, in helix P7, is shown with the
grey oval and the bases involved in G binding are shown in bold. The circled guanosine at
the 3’ end of the intron binds to the guanosine binding site. The cleavage sites for the two
steps of self-splicing are shown by bold arrows.
26

FIGURE 2.12: Self-Splicing Reaction of a Group I Intron
Scheme of the group I intron self-splicing reaction (10). The intron is in gray and the
endogenous exons are in black. The intron, in presence of metal ions folds into its
catalytically active form and base pairs with the endogenous exons. Three important
interactions for target identification are helices P1 (base pairs with 5’ exons), P9.0 (within the
intron) and P10 (base pairs with 3’ exons). An exogenous guanosine nucleotide binds a
particular site in the intron (known as the guanosine binding site) and the 3’ hydroxyl group
of this nucleotide acts as a nucleophile to attack the 5’ splice site in the first reaction step.
The phosphodiester backbone is cleaved at the 5’ splice site, resulting in a 3’ hydroxyl on the
27

terminal nucleotide of the 5’ exon (typically a uridine). The guanosine cofactor becomes
attached to the end of the intron.
In the second step , the 3’ hydroxyl on the terminal nucleotide of the 5’ exon acts as a
nucleophile and attacks the 3’ splice site which is immediately after a guanosine (referred to
as ωG; shown as gray circle). This attack results in ligation of the two exons and release of
the intron.
28

P1(RE1)
P10(RE3)
P5b
P5c
P5a
P5
P4
P6
P6b
P6a
P2.1
P2
P8
P3
P7
P9.0 (RE2)
P9
gacu
A
G
U
G
5'
G
G
U
3'
AUu
g
c
c
AU
ua
CUAG
344
P1(RE1)
P10(RE3)P10(RE3)
P5b
P5c
P5a
P5
P4
P6
P6b
P6a
P2.1
P2
P8
P3
P7
P9.0 (RE2)P9.0 (RE2)
P9
gacu
A
G
U
G
5'
G
G
U
3'
AUu
g
c
c
AU
ua
CUAG
344
FIGURE 2.13: Predicted Secondary Structure of the Pneumocystis carinii Ribozyme
Predicted secondary structure of the Pneumocystis carinii group I intron-derived
ribozyme. Primary structure is essentially identical to the intron as depicted in Figure 2.11.
The chief difference being that the 8 bases from the 5’ end and last 4 bases from the 3’ end of
the intron are missing. The last base at the 3’ end of the ribozyme, a guanosine, is marked
(position is 344). The heavy black lines schematically show the secondary structure of the
ribozyme and red lines indicate a direct connection between sequence elements. The
arrowheads emphasize the directionality of the chain. The helices P1-P10 are labeled. Shown
29

are only those ribozyme bases that pair with an exogenous substrate. The uppercase letters
signify the ribozyme while the lower case letters the exon mimics. The ribozyme recognition
elements (RE1, RE2 and RE3) are in bold. The 5’ and 3’ exons pair with recognition
elements RE1 and RE2 to form P1 and P10 helices. The P9.0 helix does not form with the
particular substrate shown because of lack of complementary bases. The arrows designate the
two splice sites.
30

FIGURE 2.14: Trans Excision-Splicing Reaction
Schematic representation of the trans excision-splicing reaction. The bridge region,
being excised out, is in blue, the flanking exons are in black, and the TES ribozyme is in
gray. The sequence targeted for excision is further distinguished with a broken line. The
recognition elements from the self-splicing intron are used for substrate binding. RE1 base
31

pairs with the 5’ exon (to form the P1 helix), RE3 base pairs with the 3’ exon (to form the
P10 helix) and RE2 base pairs with the insert (when longer than a single nucleotide) targeted
for excision (to form P9.0). A nucleophilic attack by the 3’ terminal G344 of the ribozyme
(see Figure 2.13) cleaves the backbone at the 5’ splice site in the first reaction step (5’
cleavage), resulting in a 3’ hydroxyl on the terminal nucleotide of the 5’ exon (typically a
uridine). In the second reaction step (exon-ligation), the 3’ hydroxyl of the terminal
nucleotide of the 5’ exon performs a nucleophilic attack on the 3’ splice site, immediately
after a guanosine that defines the end of the insert region (termed ωG). This results in exon
ligation and excises out the bridge region. It should be noted that the excised segment is
attached to the 3’ end of the ribozyme after the second step.
32

FIGURE 2.15: Site Directed Mutagenesis A mismatched oligonucleotide (G to an A) is annealed to a DNA template and
extended with DNA polymerase. The template is then digested with DpnI restriction enzyme
and cloned into E. coli to obtain mutant DNA.
33

CHAPTER THREE- STUDYING MOLECULAR RECOGNITION OF SPLICE SITES IN A TRANS EXCISION SPLICING REACTION
Introduction
The trans excision-splicing (TES) reaction, as discussed in the previous chapter,
consists of two consecutive phosphotransesterification reactions (Figure 3.1): a 3’ terminal
G344-mediated 5’ cleavage (P.P. Dotson, unpublished results) followed by exon ligation. It
has been shown, in an earlier study from our lab that the TES reaction ribozyme can excise a
variety of sequences, including the excised segment as little as a single nucleotide (10). It has
also been demonstrated that different substrates can be targeted by rationally modifying the
substrate recognition elements of the ribozyme (10, 15).
While developing the TES reaction, and in previous studies on this reaction, two
highly conserved elements of self-splicing group I introns were maintained. The rationale
behind retaining these two conserved elements originated from their role in defining the
splice sites in group I introns. The two conserved elements are: the u-G wobble pair at the
end of P1 helix and (2) the last base of the 3’ exon, known as ωG (Figure 3.1). The u-G
wobble pair specifies the 5’ splice site (9, 10, 76, 96-99) whereas ωG is known to a major
determinant of the 3’ splice site (57, 100-105). To distinguish between the ribozyme and
substrate, lowercase nucleotide abbreviations refer to the substrate, uppercase refers to the
ribozyme, and the 5’ splice site refers to the base pair that forms between -1 of the substrate
and position 12 of the ribozyme (Figure 3.1).
Mutagenesis of the highly conserved u-G wobble pair to any other base pairs
significantly reduces ribozyme’s activity (76, 106). However, two well-known exceptions are
c-A and c-G base pairs, which can substitute the u-G wobble pair at the 5’ splice site (76,
105, 107). It has also been reported that ωG can be substituted with ωA, with either no
change required to the catalytic core (108) or by modifying the guanosine binding site of the
ribozyme so that it can accommodate adenosine (107, 109). These previous results suggest
that the sequence requirement for the splice sites for group I intron/ribozyme is not absolute.
In the context of the TES reaction, a highly specific requirement for the splice site will limit
the choice of targets. Therefore, it is of interest to analyze the sequence specificity of the
34

splice site in the TES reaction. I worked with another member of the Testa lab, Dana Baum,
to analyze the sequence specificity at the splice sites.
In this investigation, all 16 combinations of base pairs at the 5’ splice site and all four
bases at the 3’ splice site were used for the TES reaction. To limit the reaction variables and
simplify analysis, a simple RNA substrate was employed. A single nucleotide, analogous to
the ω position in group I introns, is excised from this substrate. In addition, these substrates
can not form the P9.0 helix because of lack of complementary bases in the ribozyme (10)
(Figure 3.1). These studies were undertaken to provide a more thorough understanding of the
sequence requirements for the TES reaction, specifically at the 5’ splice site and for the ω
position of the 3’ splice site. Furthermore, this information will be invaluable for developing
guidelines for what sequences the ribozymes can target, what sequences can be excised, and
the specificity of these reactions. These studies will also provide insight into the molecular
recognition of the splice sites by this P. carinii ribozyme.
Materials and Methods
Oligonucleotide Synthesis and Purification
DNA oligonucleotides were obtained from Integrated DNA Technologies (Coralville,
IA) and used without further purification. RNA oligonucleotides were obtained from
Dharmacon (Lafayette, CO). These RNA oligonucleotides contained an orthoester protecting
groups at the 2’ positions, which were removed following the manufacturer’s protocol using
100 mM acetate-TEMED buffer (pH 3.8). Unlabeled oligonucleotides were used without any
further purification. Radiolabeled RNAs were prepared by phosphorylation of the 5’-terminal
hydroxyl group with T4 polynucleotide kinase (New England Biolabs; Beverly, MA) and [γ-32P] ATP (Amersham Pharmacia Biotech; Piscataway, NJ). Labeled RNA oligonucleotides
were gel purified on a 20% native polyacrylamide gel and the products were isolated from
the gel slices by crush-soak elution as described (9).
35

Plasmid Construction and Synthesis
The P.carinii ribozyme plasmid precursor, P-8/4x, was constructed as described
previously (10). Modifications to alter the guanosine in the 12 position of the ribozyme,
which is part of the wobble pair at the 5’ splice site and to delete the RE3 sequences that are
involved in P10 formation were made using site-directed mutagenesis. The following pairs of
primers were used for altering the ribozyme at the 12 position (underlined base represents the
altered bases as compared to P-8/4x): 5’ CGACTCACTATAGAGCGTCATGAAAGCGGC3’
and 5’ GCCGCTTTCATGACGCTCTATAGTGAGTCG3 to create P-8/4x-5’C; 5’
CGACTCACTATAGAGAGTCATGAAAGCGGC3’ and 5’
GCCGCTTTCATGACTCTCTATAGTGAGTCG3 to create P-8/4x-5’A 5’
CGACTCACTATAGAGTGTCATGAAAGCGGC3’ and 5’
GCCGCTTTCATGACACTCTATAGTGAGTCG3’ to create P-8/4x-5’U. The following
primer pair was used to create P-8/4x-noP10: 5’CGACTCACTATAGGTCATGAAAGCGGC3’ and 5’GCCGCTTTCATGACCTATAGTGAGTCG3’. The site-directed mutagenesis reactions
were conducted with 15 pmol of each primer, 25 ng P-8/4x parental plasmid, 2.5 units of Pfu
DNA polymerase (Stratagene; La Jolla, CA), and 0.5 µM dNTPs in a buffer consisting of 10
mM KCl, 10 mM (NH4)2SO4, 20 mM Tris-HCl (pH 8.8), 2 mM MgSO4, 0.1% Triton X-100,
and 0.1 mg/mL BSA in a total reaction volume of 50 µL. The reaction mixtures were initially
subjected to denaturation at 95 OC for 30 s. The reaction mixtures were then run through 16
cycles; each cycle consisted of the following steps: 95 OC for 30 s, either 55 OC or 60 OC for
2 min, and 68 OC for 6 min. After the site directed mutagenesis, the parental plasmids were
then digested with 20 units of DpnI (Invitrogen; Carlsbad, CA) in 4.2 µL of manufacturer’s
buffer for at least 2 h at 37 OC. A 3 µL aliquot of this mixture was used to transform
Escherichia coli DH5α competent cells (Invitrogen). The resultant plasmids were then
purified using a QIAprep Spin Miniprep kit (QIAGEN; Valencia, CA), and sequenced for
confirmation (Davis Sequencing; Davis, CA).
36

Transcription
All ribozyme precursor plasmids were linearized with XbaI restriction enzyme. The
linearized plasmids were purified from the reaction mixture using a QIAquick PCR
Purification kit (QIAGEN). The ribozyme was synthesized by run-off transcription from the
XbaI linearized plasmid. A typical transcription reaction contained 40 mM Tris-HCl (pH
7.4), 1.25 mg/mL BSA, 5 mM spermidine, 5 mM dithiothreitol, 5 mM MgCl2, 1.5 mM each
rNTP, 1 µg of linearized plasmid, 4 µL of T7 RNA polymerase (10,000 units/µL) in 80 µL
and was incubated for at least 2 h at 37 OC. The resultant RNAs were purified using
QIAGEN-tip 100 anion-exchange columns. First, each column was equilibrated with 4.0 mL
of buffer I (750 mM NaCl, 50 mM MOPS (pH 7.0), 15% ethanol, and 0.15% Triton X-100).
Second, the transcription reactions were loaded onto the column, and the columns were
washed with 7.0 mL of buffer I. Third, the ribozymes were eluted using 4.0 mL of buffer II
(1.0 mM NaCl, 50 mM MOPS (pH 7.0) and 15% ethanol). The eluted ribozymes were
precipitated with 2-propanol and further purified with an ethanol precipitation. Finally, the
ribozymes were dissolved in sterile water. The ribozyme concentration was determined
spectrophotometrically at 260 nm using a Beckman DU-650 UV-Vis spectrophotometer,
assuming an extinction coefficient that was sum of those for the individual nucleotides (ε =
3.2 x 10⁶).
TES Reactions
All reactions were single turnover with ribozyme in excess of radiolabeled substrate.
The reactions were conducted at 44 OC in H10Mg buffer consisting of 50 mM HEPES (25
mM NaHEPES), 135 mM KCl, and 10 mM MgCl2. Prior to each reaction, 200 nM ribozyme
in 5 µL H10Mg buffer was preincubated at 60 OC for 5 min for creating a homogenously
folded ribozyme population prior to cooling to 44 OC. The reactions were initiated by
addition of 1 µL of an 8 nM radiolabeled substrate (110) (also in a H10Mg solution). The
final concentrations of the ribozyme and substrate in the reaction mixture were 166 nM and
1.3 nM respectively. Reaction times for the TES reactions investigating the 5’ splice site
were either 15 min or 1 h. The 3’ splice site studies and the rP-8/4x-noP10 reactions were
allowed to proceed for 1 h. All reactions were terminated by addition of an equal volume of
37

2x stop buffer (10 mM urea, 0.1x TBE, 3mM EDTA). The products and reactants were
denatured at 90 OC for 1 min and then separated on a denaturing 12.5% polyacrylamide gel.
The gel was placed on chromatography paper (Whatman 3MM CHR) and dried under
vacuum for 1 h at 70 OC. The bands were visualized on a Molecular Dynamics Storm 860
PhosphorImager and the radioactivity in the bands was quantified using Imagequant
(Molecular Dynamics). All data reported are the average of at least two independent assays.
Kinetics of the Trans Excision-Splicing Reaction
The observed rate constants for TES reactions with various base pairs at the 5’ splice
site were obtained under single turnover conditions. A 200 nM solution of the ribozyme in 25
µL H10Mg buffer was preincubated at 60 OC for 5 min for creating a homogenously folded
ribozyme population prior to cooling to 44 OC. Then 5 µL of an 8 nM solution of
radiolabeled substrate in H10Mg buffer at 44 OC was added to initiate the reaction. Product
yields were determined by withdrawing a 3 µL aliquot at designated times and quenching
with an equal volume of 2x stop buffer. Reactions were followed to completion and reaction
products were resolved on a denaturing 12.5% polyacrylamide gel. Before loading on a gel,
the reactants and products were denatured by heating at 90 OC for 1 min. The gel was dried
under vacuum and the bands were visualized and quantified as described above. The
observed rate constants were obtained from Sigmaplot (Jandel) by using a single exponential
equation [P]t = [P]∞(1-e-kt). In this equation, [P]t and [P]∞ are the percentages of product
formed at time t and end point, respectively; t equals time and k is the first order rate
constant. Each observed rate constant represents an average of values from at least two
independent assays with a standard deviation less than 10%.
Competition Studies
The competition studies were also conducted under ribozyme excess condition. 200
nM ribozyme was preannealed in H10Mg buffer for 5 min at 60 OC, slow cooled to 44 OC
and 8 nM of the radiolabeled substrate in H10Mg buffer was added to initiate the reaction.
The reaction was allowed to proceed for 5 min and then 1000-fold excess of unlabeled TES
product (over substrate) in H10Mg buffer was added to the reaction mixture to chase the
38

reaction. Addition of the competitor or chase ensures that the dissociated radiolabeled
substrate/product/intermediate will not rebind the ribozyme. Following the addition of the
competitor, the time course of the reaction was followed over a period of 90 min. The
substrate and products were denatured by heating at 90 OC for 1 min prior to loading on a
12.5% denaturing polyacrylamide gel. The products were separated, visualized, and
quantified as described above.
Results
Molecular Recognition at the 5’ Splice Site.
To investigate the molecular recognition of the 5’ splice site, the simplest TES
substrate system was chosen, from which a single nucleotide is excised (Figure 3.1). The
P9.0 helix is not utilized in this test system and the excised nucleotide corresponds to ωG.
Four different 10-mer substrates (5’ augacygcuc 3’; y stands for a, c, g or u) were synthesized,
each containing a different nucleoside at position -1. These substrates were allowed to react
with four different ribozymes, where the position 12 of each ribozyme has been mutated to
incorporate different nucleoside (shown in Figure 3.3). Therefore, between four substrates
and four ribozymes allowed for testing all 16 possible base pair combinations at the 5’ splice
site (Figure 3.3). Previous reports have suggested that the optimum reaction time for the TES
reaction was 1 h (10). Therefore, initially the reactions were allowed to proceed for 1 h. It
was found that under these conditions, all 16 base pair combinations produced 5’ cleavage
product (first step-product). However, the extent of reaction varied significantly depending
on the base pair at the 5’ splice site (Figure 3.4). As the product of the second reaction step
(exon-ligation) must necessarily have undergone the first reaction step (5’ cleavage), the
reported values for the 5’ cleavage product reflect the combined total of both first and second
steps of the TES reaction. It was also observed that seven out of sixteen base pair
combinations gave an appreciable amount (>10%) of complete TES product (Figure 3.4).
However, some base pairs (u-A, a-U, c-G, g-C, and c-C) showed cleavage infidelity or
cryptic splicing (defined as the propensity of the ribozyme to cleave at positions other than
the normal splice site) and these base pairs produced an appreciable amount of side products
(termed as cryptic products). Interestingly, all the cryptic products were shorter than the 9-
39
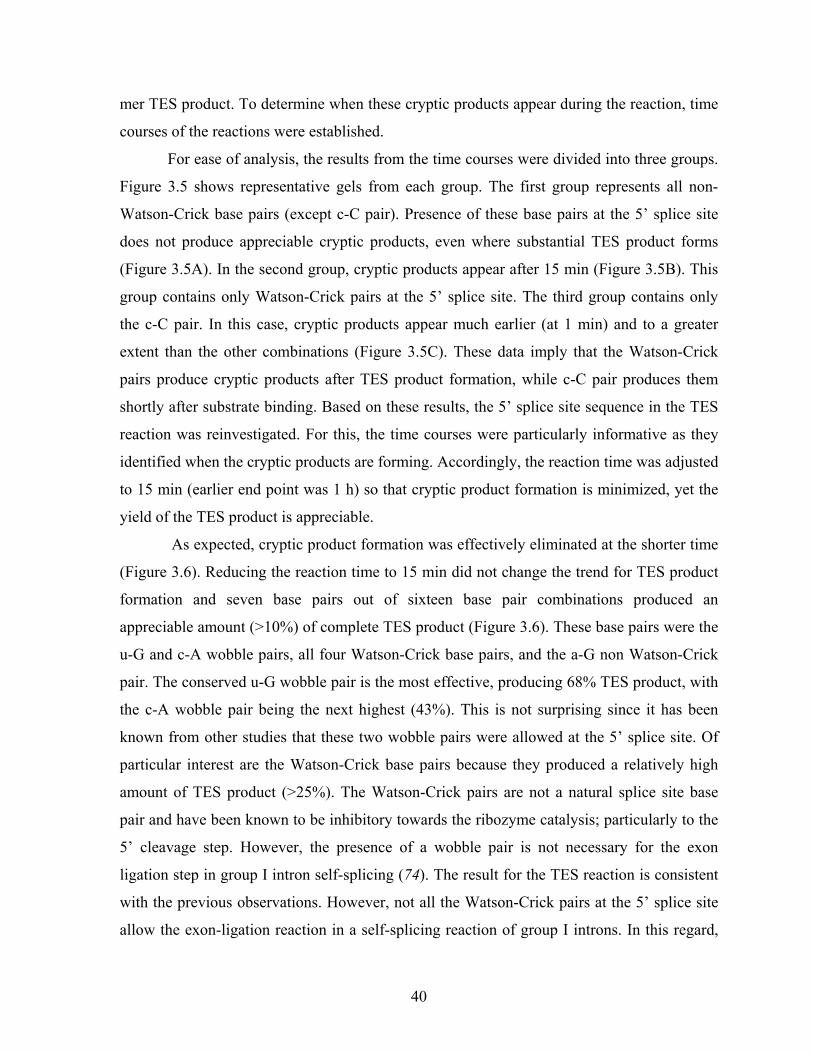
mer TES product. To determine when these cryptic products appear during the reaction, time
courses of the reactions were established.
For ease of analysis, the results from the time courses were divided into three groups.
Figure 3.5 shows representative gels from each group. The first group represents all non-
Watson-Crick base pairs (except c-C pair). Presence of these base pairs at the 5’ splice site
does not produce appreciable cryptic products, even where substantial TES product forms
(Figure 3.5A). In the second group, cryptic products appear after 15 min (Figure 3.5B). This
group contains only Watson-Crick pairs at the 5’ splice site. The third group contains only
the c-C pair. In this case, cryptic products appear much earlier (at 1 min) and to a greater
extent than the other combinations (Figure 3.5C). These data imply that the Watson-Crick
pairs produce cryptic products after TES product formation, while c-C pair produces them
shortly after substrate binding. Based on these results, the 5’ splice site sequence in the TES
reaction was reinvestigated. For this, the time courses were particularly informative as they
identified when the cryptic products are forming. Accordingly, the reaction time was adjusted
to 15 min (earlier end point was 1 h) so that cryptic product formation is minimized, yet the
yield of the TES product is appreciable.
As expected, cryptic product formation was effectively eliminated at the shorter time
(Figure 3.6). Reducing the reaction time to 15 min did not change the trend for TES product
formation and seven base pairs out of sixteen base pair combinations produced an
appreciable amount (>10%) of complete TES product (Figure 3.6). These base pairs were the
u-G and c-A wobble pairs, all four Watson-Crick base pairs, and the a-G non Watson-Crick
pair. The conserved u-G wobble pair is the most effective, producing 68% TES product, with
the c-A wobble pair being the next highest (43%). This is not surprising since it has been
known from other studies that these two wobble pairs were allowed at the 5’ splice site. Of
particular interest are the Watson-Crick base pairs because they produced a relatively high
amount of TES product (>25%). The Watson-Crick pairs are not a natural splice site base
pair and have been known to be inhibitory towards the ribozyme catalysis; particularly to the
5’ cleavage step. However, the presence of a wobble pair is not necessary for the exon
ligation step in group I intron self-splicing (74). The result for the TES reaction is consistent
with the previous observations. However, not all the Watson-Crick pairs at the 5’ splice site
allow the exon-ligation reaction in a self-splicing reaction of group I introns. In this regard,
40

the P. carinii ribozyme can be thought of as unique. Nevertheless, these data suggest that
similar to the 5’ cleavage step, multiple base pair combinations at the 5’ splice site allow the
exon ligation step (second step) in a TES reaction.
It seems that the sequence of both the exon (the substrate) and the ribozyme (at the 5’
splice site) is important for each reaction step. Only some general trends are noted here.
Guanosine is favored in the IGS of the ribozyme, with all four possible combinations giving
over 60% first step (5’ cleavage) and only the g-G combination producing less than 10% TES
product during the 1 h reaction. Cytosine in either the ribozyme or substrate is unfavorable
for TES product formation. However, a cytosine in Watson-Crick pair or c-A wobble pair is
favorable. In addition, a high level of 5’ cleavage product does not necessarily translate to a
high level of TES product; a good example being the presence of an adenosine at the -1
position in the substrate (Figure 3.6). Adenosine at this position leads to at least 30% 5’
cleavage reaction with all four ribozymes, but only a-U and a-G pairs lead to significant
amounts of TES product (Figure 3.6).
The observed rate constants for product formation (in the absence of the cryptic
products) were also obtained from the time courses. Table 1 summarizes the effect of base
pairs at the 5’ splice site on the observed rate constants (kobs) of the TES reactions. It should
be noted that kobs values were determined for only those base pair combinations where
appreciable amount of TES product (>10%) was formed. It was found that the conserved u-G
wobble pair has the fastest rate of TES product formation. The ribozyme-substrate complex
containing either c-G or g-C base pair was only two-fold slower than a u-G wobble pair
(second fastest). The reaction with either a-U or u-A base pair at the 5’ splice site was 3-fold
slower than the rate of either c-G or g-C, and around 10-fold slower. Although the c-A can
adopt a wobble conformation and produced the second highest amount of TES product, it is
over 10-fold slower than u-G pair. The slowest rate constant was with the a-G pair at the 5’
splice site. This implies that the identity of the base pair at the 5’ splice site does affect the
observed rate constant of the TES reaction.
41

The Source of Cryptic Products.
Presence of a Watson-Crick base pair at the 5’ splice site led to formation of cryptic
products. Such cryptic product formations have been observed previously in group I
ribozyme reactions, although all the reported occurrences involved cryptic cleavage of the
substrate (74, 111, 112). Time courses of the TES reaction showed that the cryptic products
form only after 15 min implying that the source is not the substrates. This leaves either 5’
exon intermediate or TES product as the probable source for the cryptic products. To
determine the source of cryptic products, time course of TES reactions were followed
utilizing a mimic (6-mer) of the 5’ exon product of the 5’ cleavage reaction, and a mimic (9-
mer) of the expected TES product. In these assays, the ribozyme-substrate complex produced
either u-A pair (Figure 3.8) or c-G pair (data not shown) at the 5’ splice site. Degradation of
the 6-mer mimic would imply that source of the cryptic product is the 5’ exon intermediate
while degradation of the 9-mer mimic would imply that the source of the cryptic product is
the TES product. The results show that only the 9-mer, and not the 6-mer, produces cryptic
products (Figure 3.8). An identical result was obtained with a c-G pair at the 5’ splice site
using an identical assay. Therefore, this evidence suggests that the origin of the cryptic
product is the TES products themselves, and not the 5’ exon intermediate generated from the
5’ cleavage step. In this pathway product build up is required before cryptic splicing can
proceed and that explains why cryptic products occur only at relatively long reaction time.
Interestingly, it was observed that along with the cryptic sites the TES product was also
cleaved at the correct 5’ splice site. This implies that some amount of 5’ cleavage product (6-
mer) originated from the TES product.
The Mechanism of Cryptic Product Formation
There could be two possible routes for 5’ cleavage infidelity resulting in cryptic
product formation. First, the TES product stays bound to the ribozyme, but changes binding
register through exon slippage (113). Variation of this route has been reported where instead
of exon slippage, cryptic sites were created due to P1 helix translocation (76, 97, 114). An
alternative route for cryptic product formation involves dissociation of the product from the
ribozyme, followed by rebinding in alternative binding registers creating a different 5’ splice
42

site. To characterize which of these two routes the TES reaction follows for cryptic product
formation, competition assays were utilized. In these competition assays, TES reactions were
allowed to proceed for a time, and before cryptic products started to form, a large excess of
unlabeled TES product was added. If the labeled product dissociates, the excess unlabeled
product will out compete the labeled product for rebinding a free ribozyme. Therefore, the
labeled product dissociation is essentially irreversible under these conditions and would lead
to a decrease in the amount of cryptic product. If the product remains bound, the excess
competitor would have no effect and the amount of cryptic product would remain the same.
These studies utilized ribozyme-substrate combinations having either u-A pair (Figure 3.8) or
c-G pair (data not shown) at the 5’ splice site. The presence of the competitor leads to an
almost total elimination of cryptic products (Figure 3.9, data not shown for c-G). This
supports the route where the TES products dissociate and then rebind free ribozyme creating
alternative splice sites, which are utilized to generate cryptic product.
Molecular Recognition at the 3’ Splice Site.
Guanosine is universally conserved at the ω position of group I introns and specifies
the 3’ splice site through binding to the guanosine binding site (GBS) (105, 115). In the
simple 10-mer substrate utilized herein, the excised nucleotide corresponds to the ω position
of the self-splicing introns. To assess for the sequence specificity of the 3’ splice site the 10-
mer substrate was again used and the ω position was altered in these substrates such that it
contains different nucleoside in each substrate (total of four substrates were used). It was
found that the 5’ cleavage step proceeds with all four substrates (Figure 3. 9) although the
reactivity varies. A guanosine at the ω position gave the maximum amount of 5’ cleavage
product. Strikingly, the TES product was observed only when guanosine is at the ω position
(Figure 3.9) implying that the sequence specificity is absolute for the second step. It has been
reported that the sequence specificity at the ω position could be altered by modifying the
GBS so that it can bind adenosine (104, 116). However, such modifications in the P. carinii
ribozyme did not produce the desired result (data not shown).
For group I intron-catalyzed reactions, three distinct RNA-RNA interactions are
known to participate in the determination of the 3’ splice site. These interactions are the
43

binding of the conserved ωG (which precedes the reactive 3’ splice site phosphodiester bond)
to the guanosine binding site, the P9.0 and the P10 helices (57, 100-105, 115, 117-120).
Although these individual elements are important, not all of them are required at once for
correct determination of the 3’ splice-site (82, 83, 103, 121, 122). In TES reactions with the
simplest substrate system (single nucleotide excision), the helix P9.0 cannot form because
complementary bases are absent. Therefore, of the three RNA-RNA interactions, only ωG
and P10 are present. The ωG binding to the GBS was reported to be a weak interaction (72)
and hence, the formation of P10 helix would expected to be important for binding the 3’ exon
intermediate generated from the 5’ cleavage reaction. To test this hypothesis, the RE3
recognition element of the rP-8/4x ribozyme was deleted to obtain rP-8/4x-noP10 ribozyme.
This modification lowered the extent of the TES reaction (~10% maximum) but more
importantly TES product formed in the absence of P9.0 and P10. This implies that of the
three interactions, ωG is sufficient for the recognition of 3’ splice site in the TES reactions.
Discussion
Molecular Recognition at the 5’ Splice Site.
In self-splicing reactions group I introns determine the 5’ splice site with remarkable
specificity. The basis for the 5’ splice site specificity is primarily due to a phylogenetically
conserved u-G wobble pair at the end of the P1 helix. Exceptions at the 5’ splice site are
limited solely to c-G pair (107). Hence, it is expected that the 5’ splice site in a TES reaction
will be limited to either a u-G pair (74, 99, 123-127) or a c-G base pair (107). In these cases,
the guanosine is present at position 12 of the ribozyme (located in RE1, as shown in Figure
3.1), and uracil or cytosine is at the -1 position of the substrate. Changing this u-G pair to any
other base pair significantly alters the ribozyme’s activity. However, among all the natural
base combinations at the 5’ splice site, only a c-A pair retains the greatest reactivity (74, 128,
129). A protonated form of the c-A pair can base pair in a wobble configuration. Therefore, it
was postulated that the geometry (or shape) rather than a specific functional group of the
bases is important for the correct determination of the 5’ splice site (76, 106, 130).
The model for the 5’ splice site recognition by wobble pairs proposes an important
role for its unique backbone structure. X-ray crystallography studies on tRNAPhe (131, 132)
44

and an NMR structure of a model of a P1 helix (52) showed that a u-G wobble pair perturbs
the RNA helix by positioning U closer to the helix axis and G away from it. This distorted
backbone of the wobble pairs is now accessible for nucleophilic attack in the 5’ cleavage
reaction and plays an important role in determining the correct 5’ splice site. In addition, the
u-G wobble pairs create a unique site in the minor groove of RNA by exposing its free
exocyclic amine group of guanosine (at ribozyme position 12) to the solvent. This exposed
exocyclic amine is now ideally positioned for tertiary interactions contributing to the
recognition of the correct 5’ splice site (98, 99, 106). However, there are well documented
differences in molecular recognition between different introns (9, 133-140). Therefore, it is
of interest to identify and understand the sequence requirements of the 5’ splice site for P.
carinii ribozymes. This knowledge will be useful for developing effective and specific TES
ribozymes. In this work, the activity, effectiveness, and consequence of all the 16 possible
base pair combinations at the 5’ splice site in the TES reaction were tested.
The results presented herein show that substituting the highly conserved u-G wobble
pair with any other natural base pair combinations does not prevent the ribozyme from
recognizing the 5’ splice site through the 5’ cleavage step. However, not all these base pair
lead to appreciable amount of TES product through the exon ligation step. Only seven
combinations produce appreciable amount of TES product. These base pairs are the u-G and
c-A wobble pairs, all four Watson-Crick pairs, and the a-G pair. Nevertheless, all base pair
combinations at the 5’ splice site allow the 5’ cleavage reaction. The result suggests that the
interactions involved in 5’ splice site determination are not stringent. This substrate
promiscuity at the 5’ splice site was unexpected and is in contrast to results reported for
analogous reactions using Tetrahymena ribozyme (74, 125). The interpretation of these
results is that, for P. carinii-derived ribozymes, the 5’ splice site determination is not entirely
dependent on having specific functional groups in the ribozyme at position 12 or the
substrate at -1 position. Out of 16 combinations, 7 combinations give an appreciable amount
of TES product suggesting that the last base of the substrate at the 5’ splice site is not crucial
for the second step (exon-ligation reaction). It has been reported that sequence specificity for
the exon ligation reaction is not stringent (74) and therefore, the lax sequence requirement for
the exon-ligation step in a TES reaction is not unexpected. Nevertheless, some inferences
concerning the TES reaction can be drawn. First, a purine in the IGS of the ribozyme is
45

beneficial and there is a strong bias for the u-G pair at the 5’ splice site. Second, the Watson-
Crick base pairs at the 5’ splice site produce substantial amount of cryptic products. Third, it
is interesting that although u-G and c-A give substantial amounts of TES products, g-U and
a-C combinations do not. This observation implies that merely the presence of a wobble pair
is not enough for ensuring an efficient TES reaction. The wobble pair must have a purine in
the ribozyme and a pyrimidine in the substrate. Fourth, a high level of 5’ cleavage activity
does not necessarily translate into effective exon ligation reaction. For example, a-A, a-C,
and g-G combinations produce reasonable amounts of 5’ cleavage product, yet they each
produce only about 2% TES product (Figure 3.6). This particular observation leads to a
model in which a thermodynamically stable base pair at the 5’ splice site is beneficial for the
exon-ligation reaction. This requirement for a thermodynamically stable base pair is
primarily for precise positioning of the newly created 3’-OH group in the vicinity of the 3’
splice site. This model is consistent with the previously proposed model for the exon ligation
reaction in the Tetrahymena ribozyme (74).
One key test for this model will be a correlation between the observed rate constants
(kobs) for the TES product formation and base pair strength at the 5’ splice site. The kobs
values were obtained for reactions producing appreciable amount of TES (>10%) product.
For ease of analysis, these values can be divided into four groups. The fastest TES reaction
was with u-G wobble pair at the 5’ splice site. This result is expected as u-G wobble pair is
the natural choice for the 5’ splice site and the ribozyme has evolved to exploit this pairing. If
the 5’ splice site contains the stronger Watson-Crick base pairs, c-G and g-C, the kobs is
reduced 2.5-fold compared to the native system. This kinetic data implies that cytidine at
position 12 does not severely affect the rate. This also implies that the tertiary interactions
required for native splice site determination are either absent or sequence independent. The
presence of weaker Watson-Crick pairs, u-A and a-U, reduced the kobs by 11-fold compared
to the u-G pair. The slowest reactions were with c-A and a-G base pair combinations; each
being approximately 20-fold slower than the u-G wobble pair. It is remarkable that the c-A
wobble pair is one of the slowest pair although it produces the second highest amount of TES
product. Taken together, these results suggest that there is a significant correlation between
base pair strength at the 5’ splice site and the observed rate constant of TES reactions.
46

Therefore, it supports the proposed model in which a thermodynamically stable base pair at
the 5’ splice site is beneficial for the exon ligation reaction of the TES reaction.
Molecular Recognition at the 3’ Splice Site.
The molecular recognition of the 3’ splice site was determined by altering the
nucleotide at the ω position, which is the base excised from the 10-mer substrate. The results
indicate that any base at the ω position allowed the 5’ cleavage step. However, only the
presence of ωG allowed the exon ligation step (second step) (Figure 3. 10). Therefore, the
sequence requirement at the 3’ splice site is absolute. The ω position must be a guanosine for
the complete TES reaction. This is presumably due to the required and specific binding of the
ωG with the guanosine binding site (GBS). Simply stated, in its current incarnation, P.
carinii ribozyme requires a guanosine as the last (or only) base to be excised from the
substrate. Switching this specificity would require an alteration of the GBS of the ribozyme
and this has been done with the Tetrahymena ribozyme to change the specificity from
guanosine to adenosine (104, 116). These same mutations, however, did not produce the
same change in specificity for the P. carinii ribozyme (data not shown). Evidently, existing
knowledge on ωG-guanosine binding site interactions for the P. carinii ribozyme is not
enough and more information is required for rational redesigning of the GBS. Nevertheless,
one possible conclusion is that there could be a difference between the recognition of the ωG
by the Tetrahymena and P. carinii ribozymes.
P9.0 and P10 are not Required for TES Reactions.
Three RNA-RNA interactions, ωG, P10, and P9.0, have been shown to be at least
partially responsible for the molecular recognition of the 3’ splice site in self-splicing
reactions. The experiments for studying sequence specificity of the 3’ splice site utilized TES
substrates from which a single nucleotide is excised. The corresponding ribozyme-substrate
complex does not have the P9.0 helix as substrate bases complementary to RE2 are absent
and its absence does not seem to have any significant detrimental effect on the TES reaction
(124). Therefore, of the three interactions, only ωG and P10 are present in these experimental
set ups (Figure 3. 1). In the reaction pathway of group I ribozyme reactions, ωG binds to the
47

guanosine binding site after the 5’ cleavage step (55, 57, 108, 115, 141, 142). Furthermore, it
has been reported that ωG binding to the GBS is a relatively weak interaction (72, 119, 141,
143). Therefore, it was expected that the formation of P10 helix would be crucial in binding
the 3’ exon intermediate to the ribozyme. Evidence presented in this study however show
that P10 is not required for either step of the TES reaction. The established model of group I
intron/ribozyme catalyzed reactions proposes the primary role of P10 to bind the 3’ exon.
The unanswered question then is why the 3’ exon intermediate does not dissociate from the
ribozyme between the two steps of the TES reaction in the absence of P10. In the proposed
reaction pathway of the TES reaction, the 3’ exon after the first nucleophile attack is attached
to the 3’ end of the ribozyme preventing its dissociation.
This result is surprising because the same ribozyme without the P9.0 and P10 helices
loses its ability to catalyze the complete TES reaction when excising a 20 nucleotide segment
(91). However, addition of a P9.0 interaction to the ribozyme restored reactivity (91).
Therefore, the absence of TES product while excising a longer segment can be attributed to
the dissociation of the 3’ exon intermediate after the 5’ cleavage step. This problem of the 3’
exon intermediate dissociation seems to be not as overwhelming for a single nucleotide
excision. This indicates that there are functional differences between TES reactions where a
single base is excised relative to excising multiple bases.
A Mechanism for Ribozyme-Mediated TES Product Degradation.
Experiments illustrated that at long reaction times TES products dissociate and rebind
the ribozyme. The TES product after rebinding, is degraded through a 5’ cleavage reaction at
one or more alternative 5’ splice sites. Neither P1 helix translocation nor slippage of the
docked 5’ exon was detected in these studies. However, based on current evidence, a model
for cryptic splicing can be established where the product dissociates and then rebinds to
activate the cryptic splice sites. It should be noted that c-C is a special case where the
substrate also appears to be involved in the cryptic splicing. Nevertheless, these results show
an undiscovered alternative mechanism for cryptic splicing where the ribozymes needs to
bind the dissociated TES product. Of course, effects of the reaction conditions (ribozyme
48

excess and long reaction times) cannot be ruled out and probably have a significant effect on
this degradation mechanism.
Non-Watson-Crick Base Pairs at the 5’ Splice Site Can Play a Role in Determining the
Binding Register of Reaction Substrates.
Previous investigations of the self-splicing reaction (96-99, 114) have shown that the
cryptic splice sites are activated in 5’ cleavage reactions due to the substrate shifting from the
original binding register to another register without dissociation (114). Such a mechanism
probably exists in the TES reactions when there is a c-C base pair at the 5’ splice site.
However, for other base pair combinations at the 5’ splice site, especially with Watson-Crick
base pairs, cryptic sites are activated only after the correct TES product forms, dissociates
from the ribozyme and rebinds. As translocation of the substrate was not detected, a priori,
the TES products must rebind to the ribozyme in the wrong binding register to activate the
cryptic sites. However, TES products with non-Watson-Crick combinations at the 5’ splice
site do not undergo cryptic splicing implying an important role for the non-Watson-Crick
base pair at the 5’ splice site. In this role, the non-Watson-Crick base pair, using the
structural perturbation of the sugar-phosphate backbone at the 5’ splice site caused by its
presence, specifies the binding register of the substrates. The perturbation of the backbone
would prevent the formation of a continuous P1-P1ex (extended) helix. On the other hand,
Watson-Crick pairs at the 5’ splice site would allow formation of a structurally uniform
continuous P1-P1ex helix. A continuous P1-P1ex helix would be structurally uniform and
contain no distortion of the sugar phosphate backbone to define the 5’ splice site. Without
this key molecular recognition element, the P1 helix (resulting from 5’ exon binding the
ribozyme) docks to the catalytic core of the ribozyme in multiple registers, activating various
cryptic sites within the P1 helix for subsequent 5’ cleavage reactions. It should be noted that
the roles of a stable base pair and those of a non-Watson-Crick base pair in defining the
correct 5’ splice site are not mutually exclusive for the exon ligation step. Their roles must be
combined in order to allow the exon ligation step to proceed.
Evidence presented herein suggests that the TES product is the source of the cryptic
products, c-C pair being an exception. This implies that at 1 h, the yield of the TES products
49

with Watson-Crick pairs at the 5’ splice site should be higher than originally calculated. The
actual yield of the TES product then will be the sum of the yields of the TES and cryptic
products. Therefore, for all Watson-Crick pairs, the extent of the TES reaction increases to
over 50% in 1 h reactions. In addition, as some of the TES products were cleaved into 6-mers
(which is the same size as the expected 5’ exon intermediate), the quantified 5’ cleavage
product in all the TES reactions would have originated from the cleavage of TES products.
Therefore, the quantified TES products obtained herein, at all time points is at a minimum. It
is also of interest to note that the TES reaction conditions, e.g. huge excess of ribozyme, are
perhaps aiding the formation of cryptic product. Product degradation may not be as prevalent
under conditions utilizing lower ribozyme concentrations.
What is the Role of ωG in Determining the Binding Register of Substrates?
The cryptic splicing observed herein originates from the TES products having a
Watson-Crick base pair at the 5’ splice site; not from the TES substrates having a Watson-
Crick base pair at the 5’ splice site. The difference between the substrates and the products is
the presence of ωG in the former, suggesting a role of the ωG. In this role, ωG specifies the
correct binding register of the substrate and prevents its subsequent cryptic splicing. This can
be achieved either by thermodynamic stabilization or due to a structural peculiarity.
However, it has been reported that guanosine binding to the GBS is very weak (Kd = 5 µM)
(72, 73, 119, 143). Therefore, it is unlikely that the ωG imparts a substantial thermodynamic
stability to the substrate and thus, stability can be excluded from its possible roles. The ωG
located immediately after the 5’ splice site (Figure 3.1), could have a single nucleotide bulge
conformation. The single nucleotide bulge might aid in determining proper binding registers
by distorting of the uniform sugar-phosphate backbone at the correct 5’ splice site. This
structural perturbation can then be recognized by the ribozyme for directing proper docking
of the substrate to the IGS. Because the 5’ cleavage reaction proceeds with any base at the ω
position, it is not even necessary to have a guanosine at this position. It should be noted that
the ωG is not known to play any role in 5’ cleavage or in determining the 5’ splice site in the
self-splicing reaction. However, there is a simple reason behind ωG not being involved in
defining the 5’ splice site in the self-splicing reaction; it is part of the intron (instead of the
50

substrate) and distant to the 5’ splice site. The role of ωG in determining the correct 5’ splice
site in a TES reaction, proposed above, is in contrast to the established role of ωG. From the
current results, it is unclear whether the ribozyme’s use of ωG as a molecular recognition
component is accidental or has some evolutionary significance. Nevertheless, in the context
of the TES reaction, this unexpected function for ωG in aiding the fidelity of the reaction is
important.
Implications.
Accurate splicing is essential for a successful ribozyme catalyzed reaction and an
important question is the processes involved in determining the splice sites. The results
presented herein reveal an outline of the molecular recognition processes involved in the
selection of splice sites for both steps of the TES reaction. The implication of this study is
that it facilitates improvement of the design principles for developing effective target systems
for these trans excision-splicing ribozymes. It is now possible to target a wider range of TES
substrates, and with more sequence specificity, particularly with regard to the 5’ splice site.
This information will provide a foundation for rational designing of TES ribozymes as
potential biochemical and therapeutic tools. In addition, this study unraveled a previously
undiscovered and unexpected molecular recognition principles exploited by group I intron-
mediated catalytic reactions. Lastly, a new mechanism for cryptic splicing was detected in
this study. However, these results do not provide a complete picture of the molecular
recognition processes. A much more comprehensive understanding requires a detailed
structural study.
Copyright © Joy Sinha 2006
51

Table 3.1: Observed Rate Constants for Base Pair Combinations Producing
Appreciable TES Product in 15 Minutes.
Table 1. Observed Rate Constants for Base Pair Combinations Producing Appreciable TES Product In 15 Minutes.
Base Pair kobs (min-1) u·G 1.96 c-G 0.79 g-C 0.67 a-U 0.20 u-A 0.16 c·A 0.11 a-G 0.08
The data show the observed rate constants (kobs) for the base pairs at the 5’ splice site
that produce appreciable TES product after 15 minutes (92). Reactions were conducted with
1.3 nM 5’ end labeled substrate and 166nM ribozyme at 44 OC in 10 mM MgCl2. Aliquots
were periodically removed over a period of 15 minutes. Data were fit to a single exponential
equation to obtain the observed rate constants. Each observed rate constant is the average of
two independent assays with a standard deviation of less than 10%.
52

G
g(RE3)UA
a5’
U
UA
augacu
UA
gcuc
GG
AU
5’
G
cuc
augacu
UA
G
(RE2)
3’5’augacugcuc
augacucuc
Product Dissociation
Bind to Ribozyme
5’ Cleavage
P1(RE1)
P10(RE3) A
G5'
G
C
5’
3’
Ribozyme
P1(RE1)
(RE2)
ugacu
A
G
U
G5'
G
CAU
3'uc
c
3’
(10-mer substrate)
Step 1
Ribozyme
P1(RE1)
P10(RE3)
(RE2)A
G
U
G5'
C
3’
Ribozyme
Step 2 Exon Ligation
5’ 3’
(9-mer product)
G
G
gG
G
g(RE3)UA
a5’
U
UA
augacu
UA
gcuc
GG
AU
5’
G
cuc
augacu
UA
G
(RE2)
3’5’augacugcuc
augacucuc
Product Dissociation
Bind to Ribozyme
5’ Cleavage
P1(RE1)
P1(RE1)
P10(RE3)P10
(RE3) AG
5'
G
C
5’
3’
Ribozyme
P1(RE1)
P1P1(RE1)
(RE2)
ugacu
A
G
U
G5'
G
CAU
3'uc
cuc
c
3’
(10-mer substrate)
Step 1
Ribozyme
P1(RE1)
P1(RE1)
P10(RE3)
(RE2)A
G
U
G5'
C
3’
Ribozyme
Step 2 Exon Ligation
5’ 3’
(9-mer product)
G
G
gG
FIGURE 3.1: Scheme of the Two Step Trans Excision-Splicing Reaction
The rP-8/4x ribozyme (only the catalytic core is shown) is in uppercase lettering, the
10-mer substrate is in lowercase lettering, and the single guanosine nucleotide to be excised
is in italics and against grey background (92). The base to be excised corresponds to the ω
position of the self-splicing introns, and so will be referred to as the substrate ω position. The
ribozyme recognition elements RE1, RE2, and RE3 base pair with the substrate to form the
P1, P9.0, and P10 helices respectively. It should be noted that the P9.0 helix does not form in
this system because of a lack of complementary bases. The sites of catalysis for the first (5’
cleavage) and the second step (exon ligation) are shown with arrows in the uppermost
diagram. The P10 helix is boxed. The -1 position of the substrate and the 12 position of the
ribozyme are shown in white lettering in the uppermost diagram and define the 5’ splice site.
53

FIGURE 3.2: The G●U Wobble Pair
The structure of a G●U wobble pair which is commonly found in RNA structures.
This base pair is highly conserved at the 5’ splice site of group I introns. The formation of
this wobble pair requires a sideways shift of one base relative to its position in the regular
Watson-Crick geometry resulting in a distorted backbone. The hydrogen bonding interactions
also free two functional groups: an exocyclic amine group on the guanosine and a carboxyl
group on the uracil.
54

FIGURE 3.3: Test System for 5’ Splice Site Sequence Requirements
Diagram of the model TES reaction used (92). See Figure 3.1 for more detailed
information. All the substrates were 10 nucleotide long (depicted in lowercase lettering). The
-1 position of the substrate (designated as y, where y = u, g, c, or a) and the 12 position of the
ribozyme (designated as x, where x = G, C, A, or U) are shown in white lettering and define
the position of the native 5’ splice site. Every combination of the four nucleotides at x and y
was analyzed.
55

FIGURE 3.4: Results for the 5’ Splice Site During 1 Hour Reaction Times
A representative polyacrylamide gel using all 16 base pair combinations at the
5′ splice site (top) and graph of the of all products formed in 1 h in the TES reactions as a
function of 5′ splice site sequence (bottom) (92). The complete substrate sequence used in
each reaction and the base at ribozyme position 12 (in uppercase lettering) is shown above its
corresponding lane. The position on the gel of the 10-mer substrate, the 9-mer product, and
the 6-mer intermediate are labeled. All other bands represent cryptic products. Note that there
is some sequence-dependent migration variability between these lanes. The lanes marked
“buffer” had substrate augacugcuc incubated as a typical reaction in the absence of ribozyme,
56

both with (+) and without (-) added buffer. The black bars on the graph represent 9-mer TES
products, the white bars represent 6-mer 5’ cleavage products, and the gray bars represent all
the cryptic products formed. The results are the average of three independent assays, and the
standard deviation in all cases is less than 10%. It should be noted that the order of the data in
the graph does not correspond to the loading order of the representative gel.
57

FIGURE 3.5: Time Courses Following the Appearance of Cryptic Products
Reactions were conducted with 166 nM ribozyme and 1.3 nM 5’ end labeled substrate
at 44 OC in H10Mg buffer. Time points were taken by removing aliquots at specified times
listed above each lane. The bands are labeled as: 10-mer substrates (S), the 9-mer TES
products (P), the 6-mer intermediates (I), and the cryptic products (C). The lane labeled (+)
Buffer contains a 120 min reaction in the absence of ribozyme. (A) TES reaction with the
substrate augacugcuc and the ribozyme rP-8/4x places a u-G wobble pair at the 5’ splice site,
which is conserved at the 5’ splice site in group I introns and ribozymes derived from them
(92). No cryptic products form in this case. This combination is representative (in terms of
58

cryptic product formation) of all the other base pair combinations (excluding the Watson-
Crick base pairs and the c-C pair). (B) TES reaction with the substrate augaccgcuc and the
ribozyme rP-8/4x places a c-G pair at the 5’ splice site (92). The cryptic products begin to
appear after the 15 min and this combination is representative of all Watson-Crick base pair
combinations at the 5’ splice site. (C) TES reaction with the substrate augaccgcuc and the
ribozyme rP-8/4x-5’C places a c-C pair at the 5’ splice site (92). Note that cryptic products
begin to appear after 1 min.
59

FIGURE 3.6: Results for the 5’ Splice Site During 15 Minute Reaction Times
Reactions were conducted with 1.3 nM 5’ end labeled substrate and 166 nM ribozyme
for 15 min at 44 OC in 10 mM MgCl2. (Top) Representative polyacrylamide gel using all 16
base pair combinations at the 5’ splice site (92). Each complete substrate sequence and the
base at ribozyme position 12 (in uppercase lettering) is shown above its corresponding lane.
The position on the gel of the 10-mer substrates, the 9-mer products, and the 6-mer
intermediates are labeled. All other bands represent cryptic sites. Note that there is some
sequence-dependent migration variability between these lanes. The lanes marked ‘buffer’ had
substrate augacugcuc incubated as a typical reaction in the absence of ribozyme, both with
(+) and without (-) added buffer. (Bottom) Graph of the percent of all products formed in 15
60

min in the TES reactions as a function of 5’ splice site sequence (92). The black and white
bars on the graph represent 9-mer TES and 6-mer 5’ cleavage products respectively. The
gray bars represent all the cryptic products formed. The results are the average of four
independent assays and the standard deviation in all cases is less than 10%. Note that the
order of the data in the graph does not correspond to the loading order of the representative
gel. Data has been ordered according to percent TES product formation.
61
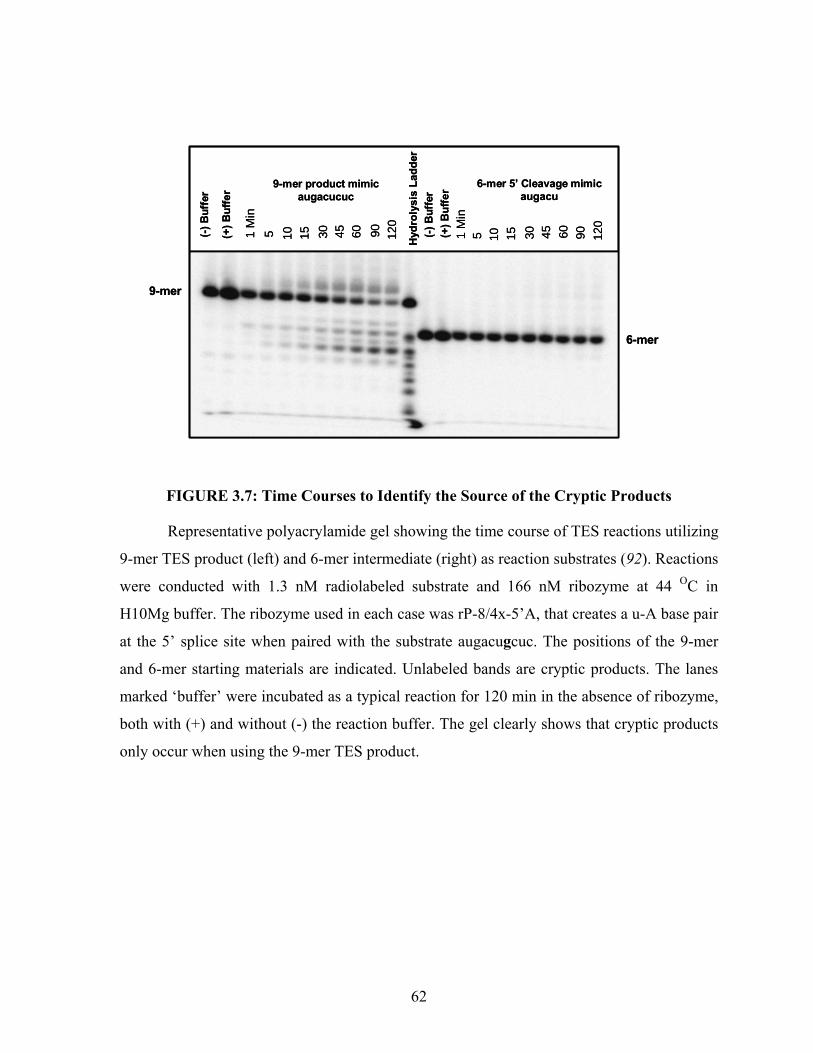
Buf
fe
(-
(-) B
uffe
r
(+) B
uffe
r 9-mer product mimicaugacucuc
6-mer 5’ Cleavage mimicaugacu
Hyd
roly
sis
Ladd
er)
r(+
) Buf
fer
1 M
in
120
9060453015105 120
90604530151051 M
in
9-mer
6-mer
(-) B
uffe
r
(+) B
uffe
r 9-mer product mimicaugacucuc
6-mer 5’ Cleavage mimicaugacu
Hyd
roly
sis
Ladd
er(-)
Buf
fer
(+) B
uffe
r
1 M
in
120
9060453015105 120
90604530151051 M
in
9-mer
6-mer
FIGURE 3.7: Time Courses to Identify the Source of the Cryptic Products
Representative polyacrylamide gel showing the time course of TES reactions utilizing
9-mer TES product (left) and 6-mer intermediate (right) as reaction substrates (92). Reactions
were conducted with 1.3 nM radiolabeled substrate and 166 nM ribozyme at 44 OC in
H10Mg buffer. The ribozyme used in each case was rP-8/4x-5’A, that creates a u-A base pair
at the 5’ splice site when paired with the substrate augacugcuc. The positions of the 9-mer
and 6-mer starting materials are indicated. Unlabeled bands are cryptic products. The lanes
marked ‘buffer’ were incubated as a typical reaction for 120 min in the absence of ribozyme,
both with (+) and without (-) the reaction buffer. The gel clearly shows that cryptic products
only occur when using the 9-mer TES product.
62

Without competitor With competitor
0 20 40 60 80 1000
20
40
60
0 20 40 60 80 1000
20
40
60
Time (min) Time (min)
% P
rodu
ct
% P
rodu
ct
Without competitor With competitor
0 20 40 60 80 1000
20
40
60
0 20 40 60 80 1000
20
40
60
Time (min) Time (min)
% P
rodu
ct
% P
rodu
ct
FIGURE 3.8: Competition Studies Investigating Product Dissociation and Rebinding
Reactions were conducted with 1.3 nM radiolabeled substrate and 166 nM ribozyme
at 44 OC in 10 mM MgCl2. The ribozyme used in each case was rP-8/4x-5’A, which creates a
u-A base pair at the 5’ splice site by pairing with the substrate augacugcuc. The reaction were
allowed to proceed for 5 min and then 1.3 µM of the unlabeled TES product (1000-fold
excess over substrate) was added to the reactions. Shown are graphs comparing reactions in
the absence (left) and presence (right) of the unlabeled competitor (92). TES products are
represented by black circles, 6-mer 5’ cleavage products by white circles, and all cryptic
products by white triangles. The addition of competitor prevents the formation of cryptic
products indicating that the products dissociate and in the presence of competitor, are unable
to rebind ribozymes for cryptic cleavage.
63

0
20
40
60
80
100
G C A U
% P
rodu
ct
A
B
0
20
40
60
80
100
G C A U
% P
rodu
ct
0
20
40
60
80
100
G C A U
% P
rodu
ct
A
B
FIGURE 3.9: Results for the 3’ Splice Site for 1 Hour Reaction Times
Reactions were conducted with 1.3 nM radiolabeled substrate and 166 nM ribozyme
for 1 h at 44 OC in 10 mM MgCl2. (A) Diagram of the TES reaction used (92). All the four
substrates used were 10-mers (lowercase lettering), where y is one of each of the four
nucleotides. Note that y represents the substrate position analogous to the ω position of self-
splicing introns. The recognition elements from ribozyme rP-8/4x are shown in uppercase
lettering. (B) Graph of the percent of all products formed in the TES reactions as a function
of 3’ splice site sequence (92). The black and white bars represent 9-mer TES products and
6-mer 5’ cleavage products respectively. The results are the average of two independent
assays and the standard deviation in all cases is less than 10%. Note that only ωG produces
TES product.
64

A
B
A
B
FIGURE 3.10: Results for Reactions Where No P10 Formation Is Possible
Reactions were conducted with 1.3 nM 5’ end labeled substrate and 166 nM ribozyme
for 1 h at 44 OC at the MgCl2 concentrations listed on the graph. (A) Diagram of the TES
system used (92). The substrate 10-mer is in lowercase lettering and the ribozyme catalytic
core is in uppercase lettering. P10 does not form in this system as recognition element RE3 is
absent (RE3 is located above RE1 in the unmodified ribozyme). (B) Representative
polyacrylamide gel of TES reactions in the absence of P9.0 and P10 (92). The 10-mer
substrate, the 9-mer product, and the 6-mer intermediate on the gel are indicated at the right.
The far left lane is a positive control using the 10-mer substrate and rP-8/4x ribozyme with
P10. The average product yield was 10% from two independent assays.
65

CHAPTER FOUR - KINETIC FRAMEWORK OF THE FIRST STEP OF THE TRANS EXCISION-SPLICING REACTION
Introduction
As discussed in the previous two chapters, a group I intron-derived ribozyme from the
rRNA of the opportunistic pathogen, Pneumocystis carinii, can catalyze the trans excision-
splicing (TES) reaction. In this reaction, the ribozyme sequence specifically excises out a
segment from an exogenous RNA transcript.
A serious impediment to the mechanistic understanding of TES reaction is a lack of
information on its kinetic pathway. Over the last two decades several studies have dissected
the individual steps of RNA catalyzed reactions by establishing kinetic framework of the
corresponding reactions (12-14, 144-147). This approach has been mechanistically
informative and has greatly advanced our understanding of the chemical basis for the RNA
catalysis. For the TES reaction, observed rate constants of the two steps have been measured
and based on prior knowledge of the ribozyme reactions, a possible reaction pathway has
been proposed. However, rate constants for various binding and dissociation steps associated
with the two TES reaction steps have not yet been determined. A detailed kinetic scheme
would provide a detailed view of its reaction pathway and facilitate further mechanistic
understanding of the TES reaction. Therefore, towards a detailed understanding of the TES
reaction, the elemental rate constants associated with the 5’ cleavage reaction were
determined using a combination of kinetic and equilibrium binding assays. In addition,
identifying the kinetic pathway provides a basis for comparing the 5’ cleavage reaction (and
TES reaction) with other characterized group I ribozymes. Furthermore, these results provide
insights into the mechanistic and biological function of the TES reaction and establish a basis
for further studies on its mechanism.
66

Materials and Methods
Nucleic Acid Synthesis and Purification
RNA substrate oligonucleotides were obtained from Dharmacon (Lafayette, CO) and
orthoester protection of its 2’ hydroxyl groups were removed using 100 mM acetate-TEMED
buffer following the manufacturer’s protocol. Unlabeled RNAs were used without any
further purification. The substrate RNAs were 5’-end radiolabeled with T4 polynucleotide
kinase (New England Biolabs; Beverly, MA) and [γ-32P] ATP (Amersham Pharmacia
Biotech; Piscataway, NJ). Labeled oligonucleotides were gel purified on a 20%
nondenaturing polyacrylamide gel and purified by crush-soak method as described (9). The
ribozyme precursor plasmid, P-8/4x, was generated as described (9).
Transcription
Prior to run-off transcription, the ribozyme plasmid, P-8/4x was linearized with XbaI
and purified from the reaction using a QIAquick PCR Purification kit (QIAGEN, Valencia,
CA) following the manufacturer’s protocol. Ribozyme, rP-8/4x, was prepared by run-off
transcription of XbaI digested ribozyme plasmid P-8/4x using T7 RNA polymerase.
Transcription of the ribozyme was conducted under the conditions previously described (10)
and following transcription, the resultant RNA was isolated as described previously (10). The
ribozyme was 2-propanol precipitated and further purified with an ethanol precipitation.
Finally, the ribozyme was dissolved in sterile water and concentration was determined
spectrophotometrically at 260 nm using a Beckman DU-650 UV-Vis spectrophotometer,
assuming an extinction coefficient that was the sum of those for the individual nucleotides (ε
= 3.2 x 10⁶).
Analysis of 5’ Cleavage Reaction Catalyzed by rP-8/4x Ribozyme.
All the experiments reported here were conducted at 44 OC in H10Mg buffer
consisting of 50 mM HEPES (25 mM NaHEPES), 135 mM KCl and 10 mM MgCl2. These
conditions were previously reported as optimal conditions for trans excision splicing reaction
and thus were used for this kinetic study. Before the reactions, the 200 nM ribozyme in 25
67

µL of H10Mg buffer was preincubated at 60 OC for 5 min and then allowed to slow cool to
44 OC. The reaction was initiated by adding 5 µL of an 8 nM radiolabeled substrate, also
preincubated in H10Mg buffer at 44 OC, to the ribozyme solution. To assay for cleavage, 3
µL aliquots were removed at times and further reaction was quenched by adding an equal
volume of 2x stop buffer. The substrate and products were denatured at 90 OC for 1 min and
then separated on a 12.5% denaturing polyacrylamide gel. The bands were visualized and
quantified as described above. To obtain values for observed rate constant of substrate
cleavage, data were fit with Kaleidagraph (Synergy Software; Reading, PA) curve-fitting
program using the single exponential equation,
[P]t = [P]∞(1-e-kt) (1)
where [P]t and [P]∞ are the percentages of product formed at time t and end point,
respectively; t equals time and k is the first order rate constant.
pH/ Rate Determinations
All ribozyme reactions were performed in 50 mM buffer containing 10 mM MgCl2
and 135 mM KCl at 44 OC. Buffers were MES (pH 5.0-6.8), HEPES (pH 6.8, 7.0, 7.5), or
EPPS (pH 7.5, 8.0, 8.5). The observed rate constants of substrate cleavage (kobs) were
obtained under single turnover conditions. In all cases, 200 nM ribozyme in 25 µL total
volume was preincubated at 60 OC for 5 min (in reaction buffer), then slow cooled to 44 OC.
Reactions were initiated by adding 5 µL of 8 nM radiolabeled substrate (also preincubated at
44 OC in the same buffer). The final concentrations of the ribozyme and radiolabeled
substrate in each reaction mixture were 166 nM and 1.3 nM respectively. Aliquots were
removed from the reaction mixture at specified times and quenched with an equal volume of
stop buffer. The reactions were followed to completion and reactants were separated on
12.5% denaturing polyacrylamide gels. The bands were visualized and quantified as
described above. The observed rate constants were determined using Equation 1.
Measurement of the substrate dissociation rate constant (k-1)
Pulse-chase experiments were used to measure the rate of ribozyme-substrate
dissociation, k-1. In these experiments, 200 nM of ribozyme in 10 µL H10Mg buffer was first
68

allowed to react with 2 µL of 8 nM 5’ radiolabeled substrate (also in H10Mg buffer) for a
period of t1 = 30 s. Then the chase phase was initiated by diluting 5 µL of reaction mixture
with 25 µL of H10Mg buffer so that [E] < KM. During the chase period, t2, dissociation of
labeled substrate from the ribozyme was essentially irreversible. During the chase period,
aliquots were removed from time to time and further reaction was quenched by adding an
equal volume of 2x stop buffer. An otherwise identical reaction, but without the dilution, was
carried out in parallel. The pseudo-first-order rate constants of the chase and control reactions
(after t1) were obtained from single-exponential fit to the plot of product formation against t2.
The observed cleavage rate during the chase period will be the sum of cleavage and
dissociation as shown in equation 2:
kobs, chase = kobs, control + k-1 (2)
In this equation kobs, control is the observed rate constant of the control reaction under ribozyme
excess conditions and kobs, chase is the observed rate constant of the chase reaction.
Measurement of the Substrate Association Rate Constant (k1).
The rate constant for substrate binding, k1, was measured using a series of pulse-chase
experiments. At least five concentrations of ribozyme ranging from 36-240 nM in 5 µL
H10Mg buffer were combined with 1 µL of 8 nM 5’ end labeled substrate in H10Mg reaction
buffer and allowed to react in total reaction volume of 6 µL. The concentration of ribozyme
ranged from 30-200 nM and radiolabeled substrate was 1.3 nM. For each ribozyme
concentration, several chase reactions were initiated by removing 1 µL of reaction mixture
and diluted five-fold at various times, t1 ranging from 15 to 120 s. The addition of chase
makes the dissociation of the substrate essentially irreversible. The chase reaction was
allowed to proceed for 15 min (t2 = 15 min) at which point the 5’ cleavage reaction is
essentially complete. The reaction was then quenched with an equal volume of 2x stop buffer
and amount of product was measured. The percent of product formed during the chase period
was plotted against time t2. Observed rate constants (kobs) were obtained by fitting the data to
Equation 1 and were plotted against ribozyme concentration. Under the reaction conditions,
the observed rate constant is related as, kobs = k1 [E] + k-1 (12, 148).
69
Measurement of the Dissociation Constant, KdP of the Ribozyme-Product Complex.
The equilibrium dissociation constant KdP
of the 5’ exon mimic binding to the
ribozyme was determined using native polyacrylamide gel electrophoresis (9, 11, 145, 149).
In this assay, several concentrations of ribozyme (final concentrations ranging from 1.5 nM
to 350 nM were preannealed in 5 µL total volume containing 3.4% glycerol and H10Mg
buffer for 5 min at 60 OC. The solutions were then allowed to cool to 44 OC. Then, 2.5 µL of
a stock of 1 nM radiolabeled 5’ exon mimic in H10Mg buffer at 44 OC was added. The
mixture was incubated at 44 OC for 90 min. To maintain integrity of the bound species during
gel electrophoresis, the gel and the running buffer were made of H10Mg buffer and were
prewarmed to 44 OC before the samples were loaded. The bound and unbound 5’ exon
mimics were separated from each other by running 6 µL of each reaction on a 10% native
polyacrylamide gel. The gel was placed on chromatography paper (Whatman 3MM CHR)
and dried under vacuum for 30 min at 70 OC. The bands were visualized as described above.
Data were fit with Kaleidagraph curve fitting program using the equation: θ = [ribozyme]u
/([ribozyme]u + Kd) (9, 150). In this equation, Kd is the equilibrium dissociation constant of
the 5’ exon mimic, θ is the fraction of 5’ exon mimic bound to the ribozyme, and [ribozyme]u
is the concentration of unbound ribozyme in the reaction.
Measurement of Rate Constant of 5’ Cleavage Product Dissociation (k-3).
The dissociation rate constant of the 5’ exon intermediate (k-3), was measured by a
pulse-chase protocol, followed by analysis of the ribozyme/product complex using native
polyacrylamide gel electrophoresis. In a typical experimental to measure k-3, A solution of
350 nM ribozyme in 10 µL H10Mg buffer containing 3.4% glycerol were preincubated for 5
min at 60 OC and then allowed to slow cool to 44 OC. Then 5 µL of 1 nM 5’ end labeled 5’
exon intermediate was added and the reaction mixture was incubated at 44 OC for 30 min to
allow complete binding. A chase reaction was then initiated by the addition of 40 µL of 5.4
µM unlabeled 5’ exon intermediate in reaction buffer to follow the practically irreversible
dissociation of 5’ exon intermediate from the ribozyme-5’ exon complex. The final
concentrations of the reactants in the chase reaction were 54 nM ribozyme, 45 pmol 5’ end
labeled 5’ cleavage product, and 4 µM unlabeled 5’ exon intermediate (as chase) in 50 µL
70

reaction volume. Time points were taken by withdrawing 5 µL aliquot from the reaction
mixture and immediately loaded onto a running 10% native polyacrylamide gel. Dissociation
rate was obtained using equation 1.
Results
Substrate for Kinetic Characterization of the First Step of TES Reaction
One potential problem in studying only the 5’ cleavage step of the TES reaction is
that the second step, exon ligation, cannot be prevented with the unmodified 10-mer TES
substrate (where a single nucleotide is excised). Therefore, a modified substrate system was
employed in which the second step of the TES reaction was prevented using a substrate with
a deoxyribose-ωG [r(5’AUGACUdGCUC3’)] (Figure 4.1). To test the ability of this new
deoxy-ωG substrate to undergo the 5’ cleavage reaction, it was allowed to react with the
ribozyme under optimized TES reaction conditions. The deoxy substrate has a kobs value of 3
± 0.5 min-1 (Figure 4.1) whereas a value of 3.7 min-1 was obtained with the ribose-ωG
substrate from a control reaction. The values of the observed rate with both the modified and
unmodified substrates are in reasonable agreement with the previously reported value of 4
min-1 (10). Therefore, deoxyguanosine-ωG substrate can reasonably mimic the ribose-ωG
substrate. Importantly, the deoxyguanosine-ωG substitution inhibits the exon-ligation step
and thus only the 5’ cleavage step can be studied. Note that unless mentioned otherwise, all
kinetic data presented herein were obtained from this deoxyribose-ωG substrate.
Rate Constant of Substrate Cleavage, k2.
Experiments under ribozyme excess conditions were used to determine the pseudo-
first-order rate constant for cleavage of substrate. Under these conditions, the ribozyme-
product complex is ultimately denatured by addition of stop buffer and hence product
dissociation is not observable. Therefore, these experiments typically measure the rate of
substrate cleavage from the ribozyme-substrate complex.
The observed rate constants were measured in reactions containing various ribozyme
concentrations (5-300 nM) and 1.3 nM of 5’ end labeled substrate (Figure 4.3B). The
71

observed rate constants of substrate cleavage (kobs) at the lower ribozyme concentrations (5-
40 nM) increased linearly with the ribozyme concentration. This linear dependence reflects
the apparent second order rate constant, k2/KM′ and the slope gave a value of (2.8 ± 0.5) x 107
M-1 min-1 (Figure 4.4A).
The observed rate constants were also plotted in an Eadie-Hofstee type plot. From
these Eadie-Hofstee plots, the value of k2 = 3.9 ± 0.2 min-1 was obtained from the y-intercept
(Figure 4.4B). This value of k2 implies the maximum first order rate of substrate cleavage
under single turnover conditions. The absolute value of the slope gives a value of apparent
Michaelis constant KM′ = 98.3 ± 0.5 nM. This value of apparent Michaelis constant implies
the ribozyme concentration at which the reaction rate is half-maximal.
Dependence of Rate Constant of Substrate Cleavage on pH.
For ribozyme-mediated reactions, the attacking nucleophile needs to be deprotonated
prior to chemical step. This information is usually obtained from studying the dependence of
the rate of corresponding reaction on pH. The rate of cleavage step of Tetrahymena (151-
154), Anabaena (143) and Azoarcus (155) group I introns and several small ribozymes (156-
158) show a log-linear increase in rate with pH in the acid range, consistent with a single
deprotonation step that must take place to cleave the substrate.
The effect of pH to the 5’ cleavage reaction was determined by measuring the
observed rate constants (kobs) in the pH ranging from 5.0 to 8.5. The logarithm of the
observed rate constants for substrate cleavage in the 5’ cleavage reaction increases linearly
with pH between pH 5-7 with a slope of 0.5 ± 0.03 (Figure 4.5). The pH-rate profile also
shows an observable leveling after pH 7 and good evidence has been provided with
Tetrahymena group I intron-derived ribozyme that this represents a pH dependent
conformational change of the ribozyme (153, 154). This conformational change thus sets a
limit that cannot be exceeded even though the rate of chemistry (kc) continues to increase
with increasing pH (153, 154). As the rate constant of substrate cleavage (k2) is masked by a
conformational change, k2 will not be equivalent to the rate of chemistry. The cleavage rate
of 0.3 min-1 at pH 5.0 can be extrapolated to pH 7.5 providing a value of 5.7 ± 1.1 min-1 for
the rate constant of chemistry (kc).
72

The observed rate constant of the 5’ cleavage reaction was determined in multiple
buffers with overlapping pH (pH 6.8: MES and HEPES; pH 7.5: HEPES and EPPS). These
control experiments have indicated that there is no buffer-specific effect on the observed rate
constants (kobs). It should be noted that the rate constants of substrate cleavage were not
determined outside the pH range depicted because protonation or deprotonation of
nucleotides is expected to cause general chemical denaturation of the ribozyme (159).
Rate Constant of Substrate Dissociation (k-1)
The rate constant for substrate dissociation was determined in a pulse-chase
experiment where 166 nM ribozyme and a trace amount of 5’ end labeled substrate were
used in the 5’ cleavage reaction (Figure 4.6A). The reaction was allowed to proceed for time
t1= 30s, at which the reaction mixture was diluted by addition of a large volume of reaction
buffer so that [E] < KM′. The time t1 was so chosen that it is enough for substrate binding
while a significant fraction of substrate remain unreacted. The chase period, t2, was followed
for a period of 15 min. The first-order rate constants of the chase (kobs, chase) and control
reactions (kobs, control) after t1 were obtained from single-exponential fit to the plot of product
formation against t2 (Figure 4.6B). The observed rate constant of the chase reaction is faster
than that of control reaction because the ribozyme-substrate complex decays via parallel
pathways of substrate dissociation and 5’ cleavage step. The dissociation rate constant was
calculated using equation 2 giving a value of k-1 = 0.9 ± 0.04 min-1.
It should be noted that this value should only be regarded as a lower limit for k-1
because the ribozyme-substrate complex might reach the maximal amount before the first
time point (30 s). However, these data indicates that the substrate cleavage does not follow a
Michaelis-Menten kinetic mechanism because the rate constant for substrate dissociation (k-1)
is comparable to the cleavage rate constant (k2). Thus, the ribozyme-substrate complex did
not reach thermodynamic equilibrium with free ribozyme before proceeding to the chemistry
step. In addition, the rate-limiting step under substrate subsaturating (k2/KM′) conditions is
not simply substrate association (k1) but a combination of k1, k-1, and k2, because k2 is only
slightly slower than k-1.
73

Rate Constant of Substrate Association (k1).
The substrate dissociation being comparable to the cleavage step implies that the
second-order rate constant, k2/KM′, will be a combination of substrate association (k1),
dissociation (k-1) and chemical (k2) steps. Thus, the second-order rate constant can be
represented as k2/KM′ = k1k2/(k-1 + k2) (160). As discussed earlier, a value of 2.8 x 10⁷ M-1
min-1 was obtained for the apparent second order rate constant, k2/KM′. Using this value of
k2/KM′ and the values of k2 and k-1 (3.9 min-1 and 0.9 min-1 respectively), the calculated value
for rate constant of substrate association will be 3.4 x 10⁷ M-1 min-1.
This value was confirmed by measuring it directly by pulse-chase method outlined in
Figure 4.6A. Ribozyme and radiolabeled substrate were combined for varying times, tl (15 s
to 120 s, before the reaction was complete), followed by addition of excess buffer to prevent
further binding. Following addition of the chase, the mixture was left for a time t2 = 15 min
to ensure that essentially every radiolabeled substrate that had complexed to ribozyme during
tl, was converted to product. The amount of product formed was plotted against time t1
(Figure 4.7A). The kobs values reflect the rate of approach to the equilibrium of ribozyme-
substrate complex formation and is the sum of the association and dissociation rates (kobs = k1
[E] + k-1). The slope of the plot kobs against ribozyme concentration gives the rate constant of
substrate association, kl = (1 ± 0.01) x 107 M-1 min-l (Figure 4.7B). This value reasonably
agrees with the calculated value of 3.4 x 10⁷ M-1 min-1.
Reversibility of 5’ Cleavage Reaction.
Under single turnover conditions, the kobs of 5’ cleavage reaction with 166 nM
ribozyme is 3.9 min-1 with a typical end point of 70-80%. The time course shows a plateau
around 10 min and over a period of 15-60 min, this does not change. This suggests either
existence of an internal equilibrium or only 70-80% of the substrate is reactive. To test
whether an internal equilibrium between ribozyme-substrate and ribozyme-product
complexes exists, a pulse-chase experiment was used as described before (85). In this assay,
the 5’ cleavage reaction was first allowed to proceed to completion and then an excess of
unlabeled 5’ exon intermediate was added (Figure 4.8A). The addition of a large excess of
unlabeled 5’ exon mimic will prevent rebinding of radiolabeled substrate and 5’ exon
74

intermediate. The result shows that bound radiolabeled product can be converted back to
radiolabeled substrate although the conversion is not quantitative (Figure 4.8B).
Regeneration of the substrate indicates that an internal equilibrium exists. This also provides
further proof that product dissociation is slower than substrate dissociation. If the product
dissociation is faster than the substrate then addition of chase would force product to
dissociate and further 5’ cleavage reaction will be observed. Regeneration of radiolabeled
substrate indicates that chase is displacing the substrate and the bound intermediates are
reacting to generate the substrate. This shows that an internal equilibrium exists and the 5’
cleavage reaction is reversible. This also implies that at least some of the 3’ exon does
remain bound to the ribozyme and not completely dissociate as suggested earlier (10, 15).
This makes sense as the 3’ exon intermediate is attached to the 3’ end of the ribozyme as
proposed recently (P. P. Dotson, unpublished results).
Equilibrium Dissociation Constant of Substrate and Product.
A trace amount of 5’ end-labeled 5’ cleavage product mimic was allowed to bind with
different concentrations of ribozyme (1-200 nM) for 90 min at 44 OC in H10Mg buffer. The
ribozyme-product complex and unbound 5’ cleavage product mimic were then separated on a
native polyacrylamide gel. The equilibrium dissociation constant, KdP, of the 5’ cleavage
product mimic 69 ± 6 nM was determined from the plot of fraction bound against ribozyme
concentration as mentioned before (9, 150) (Figure 4.9). It should be noted that the value
obtained here is over 5-fold higher than the previously reported value of 13 nM (9, 11). This
discrepancy could be explained by the reaction conditions. Change in reaction conditions,
especially temperature, weakens the stability of RNA-RNA helix and affect the values of
equilibrium dissociation constant (161). The assays used in this study to obtain Kd, were
conducted at 44 OC in 10 mM MgCl2; whereas the previously reported assays were
conducted at 37 OC in H15Mg buffer.
The equilibrium dissociation constant of the substrate was not directly determined, as
the binding equilibrium could not be established prior to the 5’ cleavage reaction. However,
the equilibrium dissociation constant of the substrate, KdS, can be estimated from the ratio of
75

substrate association (k1) and dissociation (k-1) rate constants. The value of KdS determined
through this method was 90 nM.
Rate Constant of 5’ Cleavage Product (5’ Exon Intermediate) Dissociation (k-3).
The dissociation rate constant (k-3) of the 5’ cleavage product (5’ exon intermediate)
was determined using a pulse-chase assay, combined with native polyacrylamide gel
electrophoresis. In this assay, an excess of ribozyme was mixed with ~1 nM of 5’ end labeled
5’ exon mimic in H10Mg buffer containing 3.4 % glycerol and then incubated at 44 OC for
30 min to allow binding to reach equilibrium. An excess amount of unlabeled 5’ exon mimic
was then added to initiate the chase (Figure 4.10A). The time course of the chase period was
followed by removing aliquots at designated times. These aliquots were directly loaded onto
a running native polyacrylamide gel. The fraction of 5’ exon product dissociated after chase,
was corrected for the unbound fraction at time t1 (before the chase was initiated), and then
plotted against time t2. The rate constant of product dissociation obtained using equation 1
was 0.05 ± 0.002 min-1 (Figure 4.10B). This value of 5’ exon product dissociation shows that
its dissociation is slower than substrate dissociation and implies that under multiple turnover
conditions, 5’ exon product dissociation will be the rate-limiting step.
Discussion
Summary of Kinetic Results.
The ribozyme from P. carinii pre-rRNA catalyzes sequence-specific excision of
nucleotides as shown in Figure 3.1 (for a schematic diagram see Figure 2.14). To discuss the
kinetic data, it is useful to consider a simple reaction scheme for the 5’ cleavage step (first
step) of the TES reaction as shown in Figure 4.2. The following is a brief description of the
5’ cleavage reaction proceeding from left to right as shown in Figure 4.2.
Under single turnover condition, the substrate binds the ribozyme at a rate
approaching the lower limit of the RNA helix formation. After formation of the ribozyme-
substrate complex, it can partition between the cleavage step and dissociation. However, it
was found that the rate of substrate dissociation is comparable to the rate of cleavage step..
76

This suggests that the ribozyme-substrate complex is not in thermodynamic equilibrium with
free substrate and ribozyme. The fraction of substrate that goes on to the cleavage step
generates two exon intermediates, 5’ exon and 3’ exon. A significant fraction of these
intermediates remains docked to the catalytic core and has the ability to undergo the reverse
reaction. The 5’ exon is released at a rate that is slower than the dissociation of substrate.
Release of the 5’ exon is so slow that it is rate limiting for multiple-turnover reaction.
However, the slow release of the 5’ exon product makes good biological sense for the TES
reaction. It ensures that the 5’ exon is docked to the ribozyme long enough, thereby allowing
its ligation with the 3’ exon in the second step of the TES reaction. It should be noted that
after the 5’ cleavage step, the 3’ exon intermediate is covalently attached to the ribozyme.
This implies that its dissociation is not a limiting factor for the TES reaction and therefore, its
dissociation was not determined.
Rate Constants of Substrate and 5’ Exon Intermediate Binding.
The rate constants of substrate and 5’ exon product association, determined herein,
are 1 x 10⁷ M-1 min-1 and 3.5 x 10⁷ M-1 min-1 respectively. It should be noted that these
values are far below the diffusional limit of 1011 M-1 min-1 for collision of small molecules
(162). However, the values of 1 x 10⁷ M-1 min-1 and 3.5 x 10⁷ M-1 min-1 are well within the
range of expected values for the formation of RNA duplexes, value of which is estimated to
be 107-109 M-1 min-1 (163-167). Substrate and product association rate constants of
hammerheads (14, 148), hepatitis delta viruses (168), hairpins (169) and Tetrahymena group
I ribozyme (12, 170) have also been found to be in the range of 107-108 M-1 min-1. Based on
this comparison, the substrate and 5’ exon product association rate constants determined
herein are close to the expected value. Thus, like other ribozyme-catalyzed reactions, the
assembly of either ribozyme-substrate or ribozyme-5’ exon product complex in the TES
reaction, is also due to the process of simple helix formation.
Rate Constant of Substrate Cleavage.
The rate constant for the 5’ cleavage reaction, k2, under single turnover conditions is
3.9 min-1. Catalytic power of an RNA-cleaving ribozyme can be estimated by comparing the
77
observed rate constant of a catalyzed reaction to that of an equivalent uncatalyzed reaction.
In simulated physiological conditions the uncatalyzed rate constant of the
phosphotransesterification reaction (knoncat) is estimated to be 10-9 min-1 (12, 171). Thus, a
rate of 3.9 min-1 for the 5’ cleavage reaction represents a catalytic rate enhancement
(k2/knoncat) of approximately 109-fold. This rate enhancement also corresponds to
approximately 13 kcal/mol of transition-state stabilization. This value is obtained from the
equation ∆GO = -RT ln (k2/knoncat), as discussed (12). Although P. carinii ribozyme is
providing 109-fold rate increase, it is still two orders of magnitude slower than the self-
splicing Tetrahymena ribozyme cleavage reaction (kc = 350 min-1) (12). However,
Tetrahymena ribozyme can undergo 3’ terminal guanosine-mediated 5’ cleavage reaction (5,
79, 84, 85) which is ~10-fold slower than the corresponding reaction in P. carinii ribozyme
(85). It should be noted that since these cleavage rates were not obtained under the same
reaction conditions, the significance of this comparison is limited. Furthermore, the observed
rate of substrate cleavage shows pH independence between pH 7 and 8.5 implying that at this
range the rate of chemistry associated with substrate cleavage is masked by a conformational
change. The simplest interpretation of this result is that the rate of substrate cleavage, k2, is
not equivalent to the rate of chemistry.
Helix P10 Forms After the First Step.
The TES reaction proceeds by two consecutive phosphotransesterification reactions.
In the first step, the substrate binds the ribozyme and the reaction is initiated by the 3’
terminal G344 of the ribozyme (Figure 2.11) which binds to the guanosine binding site. The
nucleophilic attack by the 3’ hydroxyl of the 3’ terminal G344 breaks the phosphodiester
bond at the 5’ splice site (Figure 2.14). This result in a 5’ exon intermediate with a free 3’-
hydroxyl group and the 3’ exon intermediate is covalently attached to the ribozyme. Prior to
the second step, there is a conformational change, which replaces the 3’ terminal guanosine
with the ωG of the substrate in the guanosine binding site. The structural rearrangement also
leads to the formation of the P10 helix, suggesting that P10 helix does not form before the
first step. This is consistent with the established pathway of group I intron-derived ribozyme
reactions. However, as an extreme possibility, the P10 helix could still form before the 5’
78

cleavage step. Compared to the 5’ exon product of the 5’ cleavage reaction, the substrate is
longer by four nucleotides (see Figure 4.1). Therefore, it is expected that if P10 helix forms
before the 5’ cleavage step, the substrate will bind the ribozyme more strongly. However, the
data shows that the equilibrium dissociation constants of the substrate and 5’ exon product
are similar (Figure 4.2). This implies that the 3’ exon does not provide additional stability to
the substrate and P10 helix is not forming before the first step.
ωG Does Not Interact with the GBS Prior to or During the 5’ Cleavage Reaction.
In the TES reaction, the ωG, which is part of the substrate, lies just 3’ to 5’ splice site.
This configuration could allow ωG to bind to the guanosine binding site prior to the 5’
cleavage reaction. This model is reasonable because the TES reaction does not utilize
exogenous G, which would normally compete with ωG for binding the guanosine binding
site prior to the 5’ cleavage step (in the self-splicing reaction). There are three pieces of
evidence, however, that suggest that ωG does not interact with the guanosine binding site
prior to or during the 5’ cleavage reaction. First, the 3’ terminal G344 has to bind the
guanosine binding site to catalyze the first step and G344 can be considered as analogous to
the exogenous G. Second, the presence or absence of the 2’-hydroxyl group of ωG does not
significantly alter the 5’ cleavage reaction (data not shown). Third, the presence or absence
of ωG itself does not significantly alter the observed rate constant of the 5’ cleavage reaction
(data not shown). This conclusion, then, is consistent with the established pathway of self-
splicing, in which ωG plays no determinable role in the 5’ cleavage step (7).
Intervening Conformational Change Between the Two Reaction Steps.
The kinetic framework shows that substrate dissociation is faster than the product
dissociation (Figure 4.2) implying the presence of some additional interactions to prevent
product dissociation. A simple explanation is that there exists a local conformational change
of the ribozyme catalytic core although the current set of data does not distinguish between
whether the conformational change occurs during or after the reaction. However, from the
prior knowledge of the pathway of the self-splicing reaction, a possible role for the
conformational change in the TES reaction can be established. The self-splicing reaction
79

requires a local conformational change between the two reaction steps; replacement of the
exogenous G at the guanosine binding site with the ωG and formation of P10 helix (7, 104,
108, 109). It has been shown that ωG is required in the TES reaction for the correct
determination of the 3’ splice site. To accomplish this it needs to bind the guanosine binding
site (92). The absence of ωG does not change the rate constant of the 5’ cleavage reaction
(data not shown) implying that ωG is not interacting with the guanosine binding site prior to
the 5’ cleavage step. Furthermore, P10 helix is not forming before the first step. Therefore, it
is reasonable to propose that the local conformational change in the TES reaction is similar to
the self-splicing reaction.
Implications.
Implication Regarding Sequence Specificity.
The 5’ cleavage reaction outlined in this report appears to be following a kinetic
mechanism in which substrate cleavage and substrate dissociation are comparable.
Furthermore, the apparent second order rate constant, k2/KM′, approaches the rate of substrate
association (k1). These results suggest that, at least in vitro, if the P. carinii ribozyme utilizes
P1 pairing to bind a substrate for the 5’ cleavage reaction, the TES reaction, then the resultant
reaction will be sequence specific. This is primarily because, under these conditions, partially
complementary targets will dissociate before reacting. Hence, to increase sequence
specificity for the TES reaction, mismatches in the P1 helix can be introduced. It is one of the
most suggested method for enhancing ribozyme sequence specificity (13) and is likely to be
an effective strategy for the P. carinii ribozyme. However, it should be noted that the 5’
splice site is not sequence specific in a TES reaction (92) and thus, to increase sequence
specificity the mismatches must be introduced at other positions in the P1 helix as
demonstrated in other ribozymes (11, 13, 172).
Comparison to Other Ribozymes.
Having described the pathway of the TES reaction, one question arises: how similar
(or different) is the 5’ cleavage reaction compared to similar reactions catalyzed by other
80

group I introns? Two main participants for the comparison are Tetrahymena and Anabaena
group I ribozymes, whose 5’ cleavage reactions have been characterized before (12, 143). It
should be noted that one key difference is that the 5’ cleavage step in Tetrahymena and
Anabaena has been characterized in presence of exogenous G, whereas for P. carinii the 5’
cleavage requires 3’ terminal G344.
All three ribozymes bind their substrate and products with a rate constant that is close
to the value of RNA-RNA helix formation. However, under single turnover conditions, the
first order rate constant of Tetrahymena ribozyme is faster than both the Anabaena and
Pneumocystis carinii ribozymes. In a multiple turnover reaction, Anabaena ribozyme is
faster than both Tetrahymena and P. carinii. Because of Anabaena’s weaker P1 base pairing
(only 3 bp P1 helix), it is not rate-limited by product dissociation. However, both
Tetrahymena and P. carinii (both have 6 bp P1 helix) ribozymes are rate-limited by their 5’
exon intermediate product dissociation. Finally, the 5’ cleavage reaction rate increases for all
the three ribozymes with pH between pH 5 and 7 which is indicative of a single
deprotonation step prior to substrate cleavage. In addition, all three become insensitive to pH
after pH 7, apparently due to a rate-limiting conformational change. Thus, these three group I
ribozymes, differing in the identity of their active site nucleotides, are nevertheless
functionally very similar.
Copyright © Joy Sinha 2006
81

FIGURE 4.1: Test System for Kinetic Characterization of the 5’ Cleavage Reaction
Diagram of the model 5’ cleavage reaction used. The rP-8/4x ribozyme (only the
catalytic core is shown) is in uppercase lettering, the 10-mer substrate is in lowercase
lettering, and the deoxyguanosine nucleotide used for freezing the reaction after the 5’
cleavage step is distinguished with a grey background. This deoxyguanosine base
corresponds to the ω position of the self-splicing introns, and so will be referred to as the
substrate ω position. The ribozyme recognition elements RE1, RE2, and RE3 base pair with
the substrate to form the P1, P9.0, and P10 helices respectively. It should be noted that the
P9.0 helix does not form in this system because of a lack of complementary bases. The sites
of catalysis for the 5’ cleavage step is shown with arrow. The P10 helix is boxed. The 5’
splice site is defined by the G-U wobble pair at the 3’ end of P1 helix.
82

E E●*S
k2 = 3.9 min-1
E●Pk1 = 1x10⁷ M-1 min-1
k-1 = 0.9 min-1
k-3 = 0.05 min-1
k3 = 3.5 x 10⁷ M-1min-1
KdS = 90 nM kc = 5.7 min-1
E + P
KdP = 69 nM
E E●*Sk2 = 3.9 min-1
E●Pk1 = 1x10⁷ M-1 min-1
k-1 = 0.9 min-1
k-3 = 0.05 min-1
E + P
KdP = 69 nM
k3 = 3.5 x 10⁷ M-1min-1
KdS = 90 nM kc = 5.7 min-1
FIGURE 4.2: The Minimal Kinetic Scheme for 5’ Cleavage Reaction.
Values were measured at 44 OC in 10 mM MgCl2, 50 mM HEPES (pH 7.5), and 135
mM KCl. E denotes rP-8/4x ribozyme, S, substrate and P, 6-mer 5’ cleavage product. The
equilibrium and rate constants determined in this study are indicated next to the individual
steps. The calculated rate constants are in bold and further distinguished with red lettering.
83

imT e (min)
% P
rodu
ct
A
B
0.25
min
0.5
0.75
1 2 3 4 5 10 15 m
in
Substrate
Product
(+) B
uffe
r
Time (min)
% P
rodu
ct
A
B
0.25
min
0.5
0.75
1 2 3 4 5 10 15 m
in
Substrate
Product
(+) B
uffe
r
FIGURE 4.3: 5’ Cleavage Reactions under Single Turnover Conditions.
(A) Representative polyacrylamide gel with the 5’ end labeled substrate and 166 nM
rPC ribozyme. The positions of the substrate and the 5’ cleavage product on the gel are
labeled. The lane marked (+) buffer contains a 15 min reaction in the absence of the
ribozyme. The time point (minutes) is shown above each lane. (B) Representative plot of the
5’ cleavage reaction at 10 nM (○), 20 nM (□), 43 nM (◊), 166 nM (∆), and 300 nM (●) rP-
8/4x ribozyme concentration. Observed rate constants (kobs) were obtained from these plots,
and are the average of two independent assays. All data points between the two independent
assays have a standard deviation less than 15%.
84

A
Ribozyme (nM)
k obs
(min
-1)
k obs
(min
-1)
kobs/[R] (µM-1 min-1)
B
A
Ribozyme (nM)
k obs
(min
-1)
k obs
(min
-1)
kobs/[R] (µM-1 min-1)
BRibozyme (nM)
k obs
(min
-1)
k obs
(min
-1)
kobs/[R] (µM-1 min-1)
B
FIGURE 4.4: Determination of k2 and k2/KM’
(A) Representative plot of the kobs values from Figure 4.4 B versus ribozyme
concentration (5-40 nM). The resulting k2/KM′ value (2.8 ± 0.5 x 10⁷ M-1 min-1) is the average
of the two independent assays. (B) A representative Eadie-Hofstee plot of the data in panel
B. The plot resulted in a value of k2 = 3.9 ± 0.2 min-1 from the y-intercept and KM′ = 98.3 ±
0.5 nM from the slope. These values are the average of the two independent assays.
85

lo
g k ob
s
pH
log
k obs
pH
FIGURE 4.5: The pH Dependence of the 5’ Cleavage Reaction.
The plot shows observed rate of cleavage as a function of pH. The observed rate
constants of 5’ cleavage reaction were determined with 166 nM rP-8/4x ribozyme and 1.3
nM 5’ end labeled substrate at 44 OC. The following buffers were used: sodium acetate pH
4.6-5.0; MES, pH 5.0-6.8; HEPES, pH 6.8-7.5; EPPES, pH 7.5-8.5; CHES, pH 8.5-9.5. The
concentration of each buffer was 50 mM and contained 135 mM KCl and 10 mM MgCl2.
Each point on the graph is from at least two independent experiments with a standard
deviation less than 15%. The data were fitted with a linear equation. The y-intercept with the
dotted line depicts the calculated value of the observed rate of cleavage at pH 7.5.
86

Time (min)
% P
rodu
ct D
urin
g t 2
B
A
Time (min)
% P
rodu
ct D
urin
g t 2
B
A
FIGURE 4.6: Determination of Rate Constant for Substrate Dissociation (k-1).
(A) Scheme of the pulse-chase experiment, which was conducted in H10Mg buffer at
44 OC and 166 nM ribozyme. The chase was initiated by diluting the reaction mixture with
H10Mg buffer. (B) Representative plot of hydrolyzed substrate, after t1, versus time (t2) with
(closed circles) and without (open circles) added chase. The resultant first order rate
constants obtained with (kobs, chase = 2.5 ± 0.04) and without (kobs, control = 1.5 ± 0.01 min-1) the
chase are the average of two independent assays. All data points between the two
independent assays have a standard deviation less than 10%. The rate of substrate
dissociation, k-1, is 0.9 ± 0.04 min-1 from the equation kobs, chase = kobs, control + k-1.
87

Time (t1) (min)%
Pro
duct
Ribozyme (nM)
k obs
(min
-1)
A
B
Time (t1) (min)%
Pro
duct
Ribozyme (nM)
k obs
(min
-1)
A
B
FIGURE 4.7: Determination of the Rate Constant for Substrate Association (k1).
(A) Representative plot of pulse-chase experiments in H10Mg buffer at 44 OC with
five different ribozyme concentrations: 30 nM (○), 50 nM (▲), 100 nM (◊), 150 nM (♦), and
200 nM (●). The quantified kobs values for the ribozyme concentrations are 0.4 ± 0.04, 0.6 ±
0.01, 1.2 ± 0.02, 1.4 ± 0.03 and 2.1 ± 0.03 min-1, respectively. These values are the average
of two independent assays. All data points between the two independent assays have a
standard deviation less than 10%. (B) Representative plot of the kobs values obtained from
Figure 6A against ribozyme concentration. The line is fit to the equation kobs = k1[E] + k-1 and
the substrate association rate (k1 = 1 ± 0.01 x 10⁷ M-1 min-l) was calculated from the slope.
Note that these values are the average of the two independent assays.
88

Time (min)
% S
ubst
rate
A
B
Time (min)
% S
ubst
rate
A
B
FIGURE 4.8: 5’ Cleavage Products Can Undergo the Reverse Reaction and Existence
of an Internal Equilibrium.
Regeneration of the substrate provides evidence for the existence of the internal
equilibrium. (A) Scheme of the pulse-chase experiment, which was conducted using 166 nM
ribozyme and a trace amount of 5’ end labeled substrate in H10Mg buffer at 44 OC. The
reaction was allowed to proceed for 15 min (t1) followed by addition of excess unlabeled 5’
exon product as the chase. (B) A plot of the disappearance of substrate in a normal reaction
(no chase, closed circles) and reappearance of the substrate in presence of chase (open
circles). Each point on the plot is the average of two independent experiments, and have a
standard deviation less than 15%.
89

Ribozyme (nM)
% P
rodu
ct B
ound
Ribozyme (nM)
% P
rodu
ct B
ound
FIGURE 4.9: Determination of Equilibrium Dissociation Constant, KdP.
In the reaction, varying concentrations of rP-8/4x was mixed with trace amounts of 5’
end radiolabeled 5’ cleavage product in H10Mg buffer containing 3.4 % glycerol. Shown is a
representative plot of the percent 5’ cleavage product bound versus ribozyme concentration.
The resultant value of KdP is 69 ± 6 nM, and it is the average of two independent assays. All
data points between the two independent assays have a standard deviation less than 15%.
90

Time (min)
% U
nbou
nd P
rodu
ct
A
B
Time (min)
% U
nbou
nd P
rodu
ct
A
B
FIGURE 4.10: The Dissociation Rate Constant of the 5’ Cleavage Product (k-3).
(A) Scheme of the pulse-chase experiment conducted with rP-8/4x ribozyme and 5’
end labeled 5’ exon mimic in H10Mg buffer containing 3.4% glycerol at 44 OC. In this
reaction t1 = 30 min. Excess unlabeled 5’ exon mimic was added to initiated the chase, and
product dissociation was followed by a native gel-shift assay. (B) Representative plot of the
fraction of unbound product versus chase time, t2. The rate of product dissociation, k-3, is
0.054 ± 0.002 min-1, which is the average of two independent assays. All data points between
the two independent assays have a standard deviation less than 15%.
91

CHAPTER FIVE - CONCLUSIONS
It has been shown that the Pneumocystis carinii group I intron-derived ribozyme can
catalyze the trans excision-splicing (TES) reaction in vitro (10, 15). However, there are
unanswered questions about the molecular basis for the reaction, particularly regarding the
selection of splice sites, as well as the mechanism and kinetic pathway. The work presented
herein further characterizes the P. carinii ribozyme in vitro and gives insight into the
molecular recognition of the 5’ and 3’ splice sites by this ribozyme. This study also provides
a kinetic framework of the first step of the TES reaction.
Molecular Recognition of Splice Sites in a TES Reaction
The work investigating the sequence requirements of the trans excision-splicing
ribozyme at the 5’ and 3’ splice sites has provided further insight into the molecular
recognition of this ribozyme. The sequence requirement at the 5’ splice site is not absolute,
as all base pair combinations allow the 5’ cleavage reaction to proceed. Mutating the highly
conserved u-G wobble pair to other base pair combinations did not prevent the TES reaction.
TES product yields were appreciable in several cases. We showed that appreciable amount of
TES product formation (>25%) required a stable base pair (either Watson-Crick or wobble
pair) at the 5’ splice site, indicative of a much stricter sequence requirement for the exon
ligation step. The data also show that some combinations at the 5’ splice site produced
cryptic products, the source being the TES products. We developed a model for the
mechanism of cryptic splicing and identified a pathway for cryptic product formation. It was
also found that cryptic splicing occurred only with Watson-Crick base pairs at the 5’ splice
site. This suggests that the ribozyme recognizes a structural perturbation in the P1 helix.
Non-Watson-Crick base pairs and ωG can play a role in 5’ splice site determination by
creating this perturbation and suppressing the cryptic cleavage. The role of structural
perturbation in suppressing cryptic splicing had never been demonstrated before.
The sequence requirement at the 3’ splice site on the other hand is absolute. Presence
of only a guanosine at the ω position allows the exon-ligation reaction leading to the
formation of TES product. The specificity of the ribozyme for ωG is guided by the guanosine
binding site of the ribozyme. Attempts at redesigning this site to interact with a different
92

nucleotide were unsuccessful. Therefore, in its current incarnation, the TES ribozyme is only
able to remove single guanosine insertions or sequences ending in guanosine from RNA
substrates.
The results of this study provided a framework of the molecular recognition processes
involved in both steps of the TES reaction (and the analogous steps of self-splicing). These
results particularly advance our knowledge regarding the selection of the splice sites.
Knowledge gained from this study could be employed for improvement of the design
principles for further development and future application of these ribozyme-mediated
excision reactions. The improved design principles will be useful for developing new TES
target systems, particularly in terms of the 5’ splice site. In addition, this study unraveled a
new mechanism for cryptic splicing. Taken together, these results indicate that group I
intron-derived ribozymes catalyze reactions using pathways that are much more diverse than
previously thought.
Kinetic Characterization of the 5’ Cleavage Step of the TES Reaction
The work investigating the kinetic characterization provided an insight into the
elemental rate constants associated with the 5’ cleavage reaction. These values of the
elemental rate constants were used to establish a minimal kinetic scheme of the 5’ cleavage
reaction. The scheme suggests that under single turnover condition, the substrate binds the
ribozyme in a random manner to form the ribozyme-substrate complex. After formation of
ribozyme-substrate complex, it can partition between either the cleavage step or dissociation,
with dissociation being comparable to the cleavage step. The fraction of substrate that is
cleaved generates two exon intermediates, 5’ exon and 3’ exon. As the 3’ exon intermediate
gets covalently attached to the 3’ end of the ribozyme its dissociation is not a limiting factor
on either the 5’ cleavage or TES reaction. However, 5’ exon intermediate dissociation is so
slow that it is rate limiting for the 5’ cleavage reaction under multiple turnover condition.
Identifying the limits of this reaction will be useful for developing guidelines for more
efficient TES reactions, particularly in terms of the turnover.
Although kinetic framework for the 5’ cleavage reaction was established, it also
provided insight into the second step of the TES reaction. One stated goal for this study was
93

to answer several intriguing unanswered questions regarding the mechanism of the TES
reaction. Our data suggest that helix P10 does not form before the 5’ cleavage step. In
addition, it was found that there exists a conformational change between the two steps of the
TES reaction. When combined with the proposed reaction pathway of the TES reaction, a
probable function of this conformational change emerges. Simply stated, the conformational
change in the TES reaction, removes the 3’ terminal guanosine from the guanosine binding
site, puts the ωG in the guanosine binding site, and forms P10 helix. Taken together, these
two results in particular are very informative because they indicate a similarity between the
self-splicing and TES reaction.
Having established a model for the mechanism of the TES reaction, several questions
arise: are other group I intron-derived ribozymes can catalyze this reaction and more
efficiently? Are there qualitative differences in the way they catalyze the TES reaction?
Unfortunately, at this time there is no straightforward answer to these questions because
answering these questions will require a series of exhaustive studies with other group I
intron-derived ribozymes.
Copyright © Joy Sinha 2006
94

REFERENCES
1. Guerrier-Takada, C., Gardiner, K., Marsh, T., Pace, N., and Altman, S. (1983) The RNA moiety of ribonuclease P is the catalytic subunit of the enzyme, Cell 35, 849-857.
2. Kruger, K., Grabowski, P. J., Zaug, A. J., Sands, J., Gottschling, D. E., and Cech, T. R. (1982) Self-splicing RNA: autoexcision and autocyclization of the ribosomal RNA intervening sequence of Tetrahymena, Cell 31, 147-157.
3. Teixeira, A., Tahiri-Alaoui, A., West, S., Thomas, B., Ramadass, A., Martianov, I., Dye, M., James, W., Proudfoot, N. J., and Akoulitchev, A. (2004) Autocatalytic RNA cleavage in the human beta-globin pre-mRNA promotes transcription termination, Nature 432, 526-530.
4. Salehi-Ashtiani, K., Luptak, A., Litovchick, A., and Szostak, J. W. (2006) A genomewide search for ribozymes reveals an HDV-like sequence in the human CPEB3 gene, Science 313, 1788-1792.
5. Zaug, A. J., Been, M. D., and Cech, T. R. (1986) The Tetrahymena ribozyme acts like an RNA restriction endonuclease, Nature 324, 429-433.
6. Zaug, A. J., and Cech, T. R. (1986) The intervening sequence RNA of Tetrahymena is an enzyme, Science 231, 470-475.
7. Cech, T. R. (1990) Self-splicing of group I introns, Annu Rev Biochem 59, 543-568.
8. Sullenger, B. A., and Cech, T. R. (1994) Ribozyme-mediated repair of defective mRNA by targeted, trans-splicing, Nature 371, 619-622.
9. Testa, S. M., Haidaris, C. G., Gigliotti, F., and Turner, D. H. (1997) A Pneumocystis carinii Group I Intron Ribozyme that Does Not Require 2' OH Groups on its 5' Exon Mimic for Binding to the Catalytic Core, Biochemistry 36, 15303-15314.
10. Bell, M. A., Johnson, A. K., and Testa, S. M. (2002) Ribozyme-catalyzed excision of targeted sequences from within RNAs, Biochemistry 41, 15327-15333.
11. Johnson, A. K., Baum, D. A., Tye, J., Bell, M. A., and Testa, S. M. (2003) Molecular recognition properties of IGS-mediated reactions catalyzed by a Pneumocystis carinii group I intron, Nucleic Acids Res 31, 1921-1934.
12. Herschlag, D., and Cech, T. R. (1990) Catalysis of RNA cleavage by the Tetrahymena thermophila ribozyme. 1. Kinetic description of the reaction of an RNA substrate complementary to the active site, Biochemistry 29, 10159-10171.
13. Herschlag, D., and Cech, T. R. (1990) Catalysis of RNA cleavage by the Tetrahymena thermophila ribozyme. 2. Kinetic description of the reaction of an RNA substrate that forms a mismatch at the active site, Biochemistry 29, 10172-10180.
95

14. Fedor, M. J., and Uhlenbeck, O. C. (1992) Kinetics of Intermolecular Cleavage by Hammerhead Ribozymes, Biochemistry 31, 12042-12054.
15. Bell, M. A., Sinha, J., Johnson, A. K., and Testa, S. M. (2004) Enhancing the Second Step of the Trans Excision-Splicing Reaction of a Group I Ribozyme by Exploiting P9.0 and P10 for Intermolecular Recognition, Biochemistry 43, 4323-4331.
16. Johnson, A. K., Sinha, J., and Testa, S. M. (2005) Trans Insertion-Splicing: Ribozyme-Catalyzed Insertion of Targeted Sequences into RNAs, Biochemistry 44, 10702-10710.
17. Alexander, R. C., Baum, D. A., and Testa, S. M. (2005) 5' Transcript Replacement In Vitro Catalyzed by a Group I Intron-Derived Ribozyme, Biochemistry 44, 7796-7804.
18. Crick, F. (1970) Central dogma of molecular biology, Nature 227, 561-563.
19. Blackburn, G. M., and Gait, M. J. (1990) Nucleic acids in chemistry and biology, IRL Press at Oxford University Press; Oxford University Press, Oxford; New York, NY.
20. Hecht, S. M. (1996) Bioorganic chemistry: nucleic acids, Oxford University Press, New York.
21. Hoogsteen, K. (1963) Crystal and Molecular Structure of a Hydrogen-Bonded Complex between 1-Methylthymine and 9-Methyladenine, Acta Crystallographica 16, 907-&.
22. Thirumalai, D., Lee, N., Woodson, S. A., and Klimov, D. (2001) Early events in RNA folding, Annu Rev Phys Chem 52, 751-762.
23. Brion, P., and Westhof, E. (1997) Hierarchy and dynamics of RNA folding, Annu Rev Biophys Biomol Struct 26, 113-137.
24. Tinoco, I., Jr., and Bustamante, C. (1999) How RNA folds, J Mol Biol 293, 271-281.
25. Holbrook, S. R. (2005) RNA structure: the long and the short of it, Curr Opin Struct Biol 15, 302-308.
26. Brion, P., and Westhof, E. (1997) Hierarchy and dynamics of RNA folding, Annu. Rev. Biophys. Biomol. Struct. 26, 113-137.
27. Batey, R. T., Rambo, R. P., and Doudna, J. A. (1999) Tertiary Motifs in RNA Structure and Folding, Angew. Chem. Int. Ed. Engl. 38, 2326-2343.
28. Murphy, F. L., and Cech, T. R. (1993) An independently folding domain of RNA tertiary structure within the Tetrahymena ribozyme, Biochemistry 32, 5291-5300.
29. Schroeder, R. (1994) Translation. Dissecting RNA function, Nature 370, 597-598.
96

30. Battiste, J. L., Mao, H., Rao, N. S., Tan, R., Muhandiram, D. R., Kay, L. E., Frankel, A. D., and Williamson, J. R. (1996) α helix-RNA major groove recognition in an HIV-1 rev peptide-RRE RNA complex, Science 273, 1547-1551.
31. Padgett, R. A., Grabowski, P. J., Konarska, M. M., Seiler, S., and Sharp, P. A. (1986) Splicing of messenger RNA precursors, Annu Rev Biochem 55, 1119-1150.
32. Berget, S. M., Moore, C., and Sharp, P. A. (1977) Spliced segments at the 5' terminus of adenovirus 2 late mRNA, Proc Natl Acad Sci U S A 74, 3171-3175.
33. Hastings, M. L., and Krainer, A. R. (2001) Pre-mRNA splicing in the new millennium, Curr Opin Cell Biol 13, 302-309.
34. Sharp, P. A. (1981) Speculations on RNA splicing, Cell 23, 643-646.
35. Brody, E., and Abelson, J. (1985) The "spliceosome": yeast pre-messenger RNA associates with a 40S complex in a splicing-dependent reaction, Science 228, 963-967.
36. Cech, T. R., Zaug, A. J., and Grabowski, P. J. (1981) In vitro splicing of the ribosomal RNA precursor of Tetrahymena: involvement of a guanosine nucleotide in the excision of the intervening sequence, Cell 27, 487-496.
37. Hutchins, C. J., Rathjen, P. D., Forster, A. C., and Symons, R. H. (1986) Self-cleavage of plus and minus RNA transcripts of avocado sunblotch viroid, Nucleic Acids Res. 14, 3627-3640.
38. Forster, A. C., and Symons, R. H. (1987) Self-cleavage of virusoid RNA is performed by the proposed 55-nucleotide active site, Cell 50, 9-16.
39. Feldstein, P. A., Buzayan, J. M., and Bruening, G. (1989) Two sequences participating in the autolytic processing of satellite tobacco ringspot virus complementary RNA, Gene 82, 53-61.
40. Hampel, A., and Tritz, R. (1989) RNA catalytic properties of the minimum (-)sTRSV sequence, Biochemistry 28, 4929-4933.
41. Taylor, J. M. (1992) The structure and replication of hepatitis delta virus, Annu Rev Microbiol 46, 253-276.
42. Saville, B. J., and Collins, R. A. (1991) RNA-mediated ligation of self-cleavage products of a Neurospora mitochondrial plasmid transcript, Proc Natl Acad Sci U S A 88, 8826-8830.
43. Bonen, L., and Vogel, J. (2001) The ins and outs of group II introns, Trends Genet 17, 322-331.
97

44. van der Veen, R., Arnberg, A. C., van der Horst, G., Bonen, L., Tabak, H. F., and Grivell, L. A. (1986) Excised group II introns in yeast mitochondria are lariats and can be formed by self-splicing in vitro, Cell 44, 225-234.
45. Perlman, P. S., Jarrell, K. A., Dietrich, R. C., Peebles, C. L., Romiti, S. L., and Benatan, E. J. (1986) Mitochondrial gene expression in yeast: further studies of a self-splicing group II intron, Basic Life Sci 40, 39-55.
46. Winkler, W. C., Nahvi, A., Roth, A., Collins, J. A., and Breaker, R. R. (2004) Control of gene expression by a natural metabolite-responsive ribozyme, Nature 428, 281-286.
47. Steitz, T. A., and Moore, P. B. (2003) RNA, the first macromolecular catalyst: the ribosome is a ribozyme, Trends Biochem. Sci. 28, 411-418.
48. Saville, B. J., and Collins, R. A. (1990) A site-specific self-cleavage reaction performed by a novel RNA in Neurospora mitochondria, Cell 61, 685-696.
49. Frank, D. N., and Pace, N. R. (1998) Ribonuclease P: unity and diversity in a tRNA processing ribozyme, Annu Rev Biochem 67, 153-180.
50. Michel, F., and Ferat, J. L. (1995) Structure and activities of group II introns, Annu. Rev. Biochem. 64, 435-461.
51. Jacquier, A. (1996) Group II Introns: Elaborate Ribozymes, Biochimie 78, 474-487.
52. Allain, F. H., and Varani, G. (1995) Structure of the P1 helix from group I self-splicing introns, J. Mol. Biol. 250, 333-353.
53. Colmenarejo, G., and Tinoco, I., Jr. (1999) Structure and thermodynamics of metal binding in the P5 helix of a group I intron ribozyme, J Mol Biol 290, 119-135.
54. Cech, T. R., and Bass, B. L. (1986) Biological catalysis by RNA, Annu Rev Biochem 55, 599-629.
55. Stahley, M. R., and Strobel, S. A. (2005) Structural Evidence for a Two-Metal-Ion Mechanism of Group I Intron Splicing, Science 309, 1587-1590.
56. Guo, F., Gooding, A. R., and Cech, T. R. (2004) Structure of the Tetrahymena ribozyme: base triple sandwich and metal ion at the active site, Mol Cell 16, 351-362.
57. Adams, P. L., Stahley, M. R., Kosek, A. B., Wang, J., and Strobel, S. A. (2004) Crystal structure of a self-splicing group I intron with both exons, Nature 430, 45-50.
58. Cate, J. H., Gooding, A. R., Podell, E., Zhou, K., Golden, B. L., Kundrot, C. E., Cech, T. R., and Doudna, J. A. (1996) Crystal structure of a group I ribozyme domain: principles of RNA packing, Science 273, 1678-1685.
98

59. Grosshans, C. A., and Cech, T. R. (1989) Metal ion requirements for sequence-specific endoribonuclease activity of the Tetrahymena ribozyme, Biochemistry 28, 6888-6894.
60. Steitz, T. A., and Steitz, J. A. (1993) A general two-metal-ion mechanism for catalytic RNA, Proc. Natl. Acad. Sci. U S A 90, 6498-6502.
61. Fedor, M. J. (2002) The role of metal ions in RNA catalysis, Curr Opin Struct Biol 12, 289-295.
62. Pyle, A. M. (1993) Ribozymes: a distinct class of metalloenzymes, Science 261, 709-714.
63. Shan, S., Yoshida, A., Sun, S., Piccirilli, J. A., and Herschlag, D. (1999) Three metal ions at the active site of the Tetrahymena group I ribozyme, Proc Natl Acad Sci U S A 96, 12299-12304.
64. Lilley, D. M. (2005) Structure, folding and mechanisms of ribozymes, Curr Opin Struct Biol 15, 313-323.
65. DeRose, V. J. (2003) Metal ion binding to catalytic RNA molecules, Curr Opin Struct Biol 13, 317-324.
66. DeRose, V. J. (2002) Two decades of RNA catalysis, Chem Biol 9, 961-969.
67. Podar, M., Perlman, P. S., and Padgett, R. A. (1995) Stereochemical selectivity of group II intron splicing, reverse splicing, and hydrolysis reactions, Mol Cell Biol 15, 4466-4478.
68. McSwiggen, J. A., and Cech, T. R. (1989) Stereochemistry of RNA cleavage by the Tetrahymena ribozyme and evidence that the chemical step is not rate-limiting, Science 244, 679-683.
69. Uhlenbeck, O. C. (1987) A small catalytic oligoribonucleotide, Nature 328, 596-600.
70. Damberger, S. H., and Gutell, R. R. (1994) A comparative database of group I intron structures, Nucleic Acids Res 22, 3508-3510.
71. Cech, T. R., Damberger, S. H., and Gutell, R. R. (1994) Representation of the secondary and tertiary structure of group I introns, Nat Struct Biol 1, 273-280.
72. Bass, B. L., and Cech, T. R. (1986) Ribozyme Inhibitors: Deoxyguanosine and Dideoxyguanosine Are Competitive Inhibitors of Self-Splicing of the Tetrahymena Ribosomal Ribonucleic Acid Precursor, Biochemistry 25, 4473-4477.
73. Bass, B. L., and Cech, T. R. (1984) Specific interaction between the self-splicing RNA of Tetrahymena and its guanosine substrate: implications for biological catalysis by RNA, Nature 308, 820-826.
99

74. Barfod, E. T., and Cech, T. R. (1989) The conserved U.G pair in the 5' splice site duplex of a group I intron is required in the first but not the second step of self-splicing, Mol Cell Biol 9, 3657-3666.
75. Been, M. D., and Cech, T. R. (1986) One binding site determines sequence specificity of Tetrahymena pre-rRNA self-splicing, trans-splicing, and RNA enzyme activity, Cell 47, 207-216.
76. Doudna, J. A., Cormack, B. P., and Szostak, J. W. (1989) RNA structure, not sequence, determines the 5' splice-site specificity of a group I intron, Proc. Natl. Acad. Sci. U S A 86, 7402-7406.
77. Zaug, A. J., and Cech, T. R. (1982) The intervening sequence excised from the ribosomal RNA precursor of Tetrahymena contains a 5-terminal guanosine residue not encoded by the DNA, Nucleic Acids Res 10, 2823-2838.
78. Inoue, T., Sullivan, F. X., and Cech, T. R. (1985) Intermolecular exon ligation of the rRNA precursor of Tetrahymena: oligonucleotides can function as 5' exons, Cell 43, 431-437.
79. Inoue, T., Sullivan, F. X., and Cech, T. R. (1986) New reactions of the ribosomal RNA precursor of Tetrahymena and the mechanism of self-splicing, J Mol Biol 189, 143-165.
80. Waring, R. B., and Davies, R. W. (1984) Assessment of a model for intron RNA secondary structure relevant to RNA self-splicing--a review, Gene 28, 277-291.
81. Cech, T. R. (1988) Conserved sequences and structures of group I introns: building an active site for RNA catalysis--a review, Gene 73, 259-271.
82. Price, J. V., and Cech, T. R. (1988) Determinants of the 3' splice site for self-splicing of the Tetrahymena pre-rRNA, Genes Dev 2, 1439-1447.
83. Michel, F., Netter, P., Xu, M. Q., and Shub, D. A. (1990) Mechanism of 3' splice site selection by the catalytic core of the sunY intron of bacteriophage T4: the role of a novel base-pairing interaction in group I introns, Genes Dev 4, 777-788.
84. Zaug, A. J., Grosshans, C. A., and Cech, T. R. (1988) Sequence-specific endoribonuclease activity of the Tetrahymena ribozyme: enhanced cleavage of certain oligonucleotide substrates that form mismatched ribozyme-substrate complexes, Biochemistry 27, 8924-8931.
85. Mei, R., and Herschlag, D. (1996) Mechanistic Investigations of a Ribozyme Derived from the Tetrahymena Group I Intron: Insights into Catalysis and the Second Step of Self-Splicing, Biochemistry 35, 5796-5809.
86. Chowrira, B. M., Berzal-Herranz, A., and Burke, J. M. (1995) Novel system for analysis of group I 3' splice site reactions based on functional trans-interaction of the
100

P1/P10 reaction helix with the ribozyme's catalytic core, Nucleic Acids Res 23, 849-855.
87. Chowrira, B. M., Berzal-Herranz, A., and Burke, J. M. (1993) Novel RNA polymerization reaction catalyzed by a group I ribozyme, Embo J 12, 3599-3605.
88. Liu, Y., and Leibowitz, M. J. (1993) Variation and in vitro splicing of group I introns in rRNA genes of Pneumocystis carinii, Nucleic Acids Res. 21, 2415-2421.
89. Liu, Y., Rocourt, M., Pan, S., Liu, C., and Leibowitz, M. J. (1992) Sequence and variability of the 5.8S and 26S rRNA genes of Pneumocystis carinii, Nucleic Acids Res 20, 3763-3772.
90. Sogin, M. L., and Edman, J. C. (1989) A self-splicing intron in the small subunit rRNA gene of Pneumocystis carinii, Nucleic Acids Res 17, 5349-5359.
91. Bell, M. A., Sinha, J., Johnson, A. K., and Testa, S. M. (2004) Enhancing the second step of the trans excision-splicing reaction of a group I ribozyme by exploiting P9.0 and P10 for intermolecular recognition, Biochemistry 43, 4323-4331.
92. Baum, D. A., Sinha, J., and Testa, S. M. (2005) Molecular Recognition in a Trans Excision-Splicing Ribozyme: Non-Watson-crick Base Pairs at the 5 ' Splice Site and ωG at the 3 ' Splice Site Can Play a Role in Determining the Binding Register of Reaction Substrates, Biochemistry 44, 1067-1077.
93. Pelc, S. R. (1972) Theory of autoradiography. In "Autoradiography for Biologists" (P.B. Graham, Ed.), Academic Press, New York.
94. Hamaoka, T. (1990) Autoradiography of new era replacing traditional X-ray film., Cell Technol. 9, 456-462.
95. Shortle, D., DiMaio, D., and Nathans, D. (1981) Directed mutagenesis, Annu. Rev. Genet. 15, 265-294.
96. Barfod, E. T., and Cech, T. R. (1989) The conserved U.G pair in the 5' splice site duplex of a group I intron is required in the first but not the second step of self-splicing, Mol. Cell. Biol. 9, 3657-3666.
97. Knitt, D. S., Narlikar, G. J., and Herschlag, D. (1994) Dissection of the role of the conserved G.U pair in group I RNA self-splicing, Biochemistry 33, 13864-13879.
98. Pyle, A. M., Moran, S., Strobel, S. A., Chapman, T., Turner, D. H., and Cech, T. R. (1994) Replacement of the conserved G.U with a G-C pair at the cleavage site of the Tetrahymena ribozyme decreases binding, reactivity, and fidelity, Biochemistry 33, 13856-13863.
101

99. Strobel, S. A., and Cech, T. R. (1996) Exocyclic amine of the conserved G.U pair at the cleavage site of the Tetrahymena ribozyme contributes to 5'-splice site selection and transition state stabilization, Biochemistry 35, 1201-1211.
100. Burke, J. M., Esherick, J. S., Burfeind, W. R., and King, J. L. (1990) A 3' splice site-binding sequence in the catalytic core of a group I intron, Nature 344, 80-82.
101. Suh, E. R., and Waring, R. B. (1990) Base pairing between the 3' exon and an internal guide sequence increases 3' splice site specificity in the Tetrahymena self-splicing rRNA intron, Mol. Cell. Biol. 10, 2960-2965.
102. Burke, J. M. (1989) Selection of the 3'-splice site in group I introns, FEBS Lett. 250, 129-133.
103. van der Horst, G., and Inoue, T. (1993) Requirements of a group I intron for reactions at the 3' splice site, J. Mol. Biol. 229, 685-694.
104. Michel, F., Hanna, M., Green, R., Bartel, D. P., and Szostak, J. W. (1989) The guanosine binding site of the Tetrahymena ribozyme, Nature 342, 391-395.
105. Price, J. V., and Cech, T. R. (1988) Determinants of the 3' splice site for self-splicing of the Tetrahymena pre-rRNA, Genes Dev. 2, 1439-1447.
106. Strobel, S. A., and Cech, T. R. (1995) Minor groove recognition of the conserved G.U pair at the Tetrahymena ribozyme reaction site, Science 267, 675-679.
107. Hur, M., and Waring, R. B. (1995) Two group I introns with a C.G basepair at the 5' splice-site instead of the very highly conserved U.G basepair: is selection post-translational? Nucleic Acids Res 23, 4466-4470.
108. Golden, B. L., and Cech, T. R. (1996) Conformational Switches Involved in Orchestrating the Successive Steps of Group I RNA Splicing, Biochemistry 35, 3754-3763.
109. Been, M. D., and Perrotta, A. T. (1991) Group I intron self-splicing with adenosine: evidence for a single nucleoside-binding site, Science 252, 434-437.
110. England, T. E., and Uhlenbeck, O. C. (1978) 3'-terminal labelling of RNA with T4 RNA ligase, Nature 275, 560-561.
111. Price, J. V., Engberg, J., and Cech, T. R. (1987) 5' exon requirement for self-splicing of the Tetrahymena thermophila pre-ribosomal RNA and identification of a cryptic 5' splice site in the 3' exon, J Mol Biol 196, 49-60.
112. Been, M. D., and Cech, T. R. (1985) Sites of circularization of the Tetrahymena rRNA IVS are determined by sequence and influenced by position and secondary structure, Nucleic Acids Res 13, 8389-8408.
102

113. Barfod, E. T., and Cech, T. R. (1989) The conserved U.G pair in the 5' splice site duplex of a group I intron is required in the first but not the second step of self-splicing, Mol. Cell. Biol. 9, 3657-3666.
114. Herschlag, D. (1992) Evidence for processivity and two-step binding of the RNA substrate from studies of J1/2 mutants of the Tetrahymena ribozyme, Biochemistry 31, 1386-1399.
115. Adams, P. L., Stahley, M. R., Gill, M. L., Kosek, A. B., Wang, J., and Strobel, S. A. (2004) Crystal structure of a group I intron splicing intermediate, RNA 10, 1867-1887.
116. Been, M. D., and Perrotta, A. T. (1991) Group I intron self-splicing with adenosine: evidence for a single nucleoside-binding site, Science 252, 434-437.
117. Michel, F., Netter, P., Xu, M. Q., and Shub, D. A. (1990) Mechanism of 3' splice site selection by the catalytic core of the sunY intron of bacteriophage T4: the role of a novel base-pairing interaction in group I introns, Genes Dev. 4, 777-788.
118. Karbstein, K., Carroll, K. S., and Herschlag, D. (2002) Probing the Tetrahymena group I ribozyme reaction in both directions, Biochemistry 41, 11171-11183.
119. Karbstein, K., and Herschlag, D. (2003) Extraordinarily slow binding of guanosine to the Tetrahymena group I ribozyme: implications for RNA preorganization and function, Proc. Natl. Acad. Sci. U S A 100, 2300-2305.
120. Russell, R., and Herschlag, D. (1999) Specificity from steric restrictions in the guanosine binding pocket of a group I ribozyme, RNA 5, 158-166.
121. Suh, E., and Waring, R. B. (1993) The conserved terminal guanosine of a group I intron can help prevent reopening of the ligated exons, J. Mol. Biol. 232, 375-385.
122. Burke, J. M. (1989) Selection of the 3'-splice site in group I introns, FEBS Lett 250, 129-133.
123. Testa, S. M., Haidaris, C. G., Gigliotti, F., and Turner, D. H. (1997) A Pneumocystis carinii group I intron ribozyme that does not require 2' OH groups on its 5' exon mimic for binding to the catalytic core, Biochemistry 36, 15303-15314.
124. Bell, M. A., Johnson, A. K., and Testa, S. M. (2002) Ribozyme-catalyzed excision of targeted sequences from within RNAs, Biochemistry 41, 15327-15333.
125. Doudna, J. A., Cormack, B. P., and Szostak, J. W. (1989) RNA structure, not sequence, determines the 5' splice-site specificity of a group I intron, Proc Natl Acad Sci U S A 86, 7402-7406.
126. Knitt, D. S., Narlikar, G. J., and Herschlag, D. (1994) Dissection of the role of the conserved G.U pair in group I RNA self- splicing, Biochemistry 33, 13864-13879.
103

127. Pyle, A. M., Moran, S., Strobel, S. A., Chapman, T., Turner, D. H., and Cech, T. R. (1994) Replacement of the conserved G.U with a G-C pair at the cleavage site of the Tetrahymena ribozyme decreases binding, reactivity, and fidelity, Biochemistry 33, 13856-13863.
128. Doudna, J. A., Cormack, B. P., and Szostak, J. W. (1989) RNA structure, not sequence, determines the 5' splice-site specificity of a group I intron, Proc Natl Acad Sci U S A 86, 7402-7406.
129. Green, R., Szostak, J. W., Benner, S. A., Rich, A., and Usman, N. (1991) Synthesis of RNA containing inosine: analysis of the sequence requirements for the 5' splice site of the Tetrahymena group I intron, Nucleic Acids Res 19, 4161-4166.
130. Masquida, B., and Westhof, E. (2000) On the GoU and related pairs, RNA 6, 9-15.
131. Westhof, E., Dumas, P., and Moras, D. (1985) Crystallographic refinement of yeast aspartic acid transfer RNA, J Mol Biol 184, 119-145.
132. Quigley, G. J., and Rich, A. (1976) Structural domains of transfer RNA molecules, Science 194, 796-806.
133. Disney, M. D., Gryaznov, S. M., and Turner, D. H. (2000) Contributions of individual nucleotides to tertiary binding of substrate by a Pneumocystis carinii group I intron, Biochemistry 39, 14269-14278.
134. Bevilacqua, P. C., and Turner, D. H. (1991) Comparison of binding of mixed ribose-deoxyribose analogues of CUCU to a ribozyme and to GGAGAA by equilibrium dialysis: evidence for ribozyme specific interactions with 2' OH groups, Biochemistry 30, 10632-10640.
135. Sugimoto, N., Tomka, M., Kierzek, R., Bevilacqua, P. C., and Turner, D. H. (1989) Effects of substrate structure on the kinetics of circle opening reactions of the self-splicing intervening sequence from Tetrahymena thermophila: evidence for substrate and Mg2+ binding interactions, Nucleic Acids Res 17, 355-371.
136. Pyle, A. M., and Cech, T. R. (1991) Ribozyme recognition of RNA by tertiary interactions with specific ribose 2'-OH groups, Nature 350, 628-631.
137. Berzal-Herranz, A., Chowrira, B. M., Polsenberg, J. F., and Burke, J. M. (1993) 2'-Hydroxyl groups important for exon polymerization and reverse exon ligation reactions catalyzed by a group I ribozyme, Biochemistry 32, 8981-8986.
138. Caprara, M. G., and Waring, R. B. (1993) Important 2'-hydroxyl groups within the core of a group I intron, Biochemistry 32, 3604-3610.
139. Disney, M. D., Haidaris, C. G., and Turner, D. H. (2001) Recognition elements for 5' exon substrate binding to the Candida albicans group I intron, Biochemistry 40, 6507-6519.
104

140. Disney, M. D., Matray, T., Gryaznov, S. M., and Turner, D. H. (2001) Binding enhancement by tertiary interactions and suicide inhibition of a Candida albicans group I intron by phosphoramidate and 2'-O-methyl hexanucleotides, Biochemistry 40, 6520-6526.
141. Vicens, Q., and Cech, T. R. (2006) Atomic level architecture of group I introns revealed, Trends Biochem Sci 31, 41-51.
142. Golden, B. L., Kim, H., and Chase, E. (2005) Crystal structure of a phage Twort group I ribozyme-product complex, Nat Struct Mol Biol 12, 82-89.
143. Zaug, A. J., Davila-Aponte, J. A., and Cech, T. R. (1994) Catalysis of RNA cleavage by a ribozyme derived from the group I intron of Anabaena pre-tRNA(Leu), Biochemistry 33, 14935-14947.
144. Pyle, A. M., McSwiggen, J. A., and Cech, T. R. (1990) Direct measurement of oligonucleotide substrate binding to wild-type and mutant ribozymes from Tetrahymena, Proc Natl Acad Sci U S A 87, 8187-8191.
145. Pyle, A. M., and Green, J. B. (1994) Building a kinetic framework for group II intron ribozyme activity: quantitation of interdomain binding and reaction rate, Biochemistry 33, 2716-2725.
146. Franzen, J. S., Zhang, M., and Peebles, C. L. (1993) Kinetic analysis of the 5' splice junction hydrolysis of a group II intron promoted by domain 5, Nucleic Acids Res. 21, 627-634.
147. Smith, D., and Pace, N. R. (1993) Multiple Magnesium Ions in the Ribonuclease P Reaction Mechanism, Biochemistry 32, 5273-5281.
148. Hertel, K. J., Herschlag, D., and Uhlenbeck, O. C. (1994) A Kinetic and Thermodynamic Framework for the Hammerhead Ribozyme Reaction, Biochemistry 33, 3374-3385.
149. Pyle, A. M., McSwiggen, J. A., and Cech, T. R. (1990) Direct measurement of oligonucleotide substrate binding to wild-type and mutant ribozymes from Tetrahymena, Proc. Natl. Acad. Sci. U S A 87, 8187-8191.
150. Weeks, K. M., and Crothers, D. M. (1992) RNA Binding Assays for Tat-derived Peptides: Implications for Specificity, Biochemistry 31, 10281-10287.
151. Herschlag, D., Eckstein, F., and Cech, T. R. (1993) Contributions of 2'-hydroxyl groups of the RNA substrate to binding and catalysis by the Tetrahymena ribozyme. An energetic picture of an active site composed of RNA, Biochemistry 32, 8299-8311.
105

152. Herschlag, D., Eckstein, F., and Cech, T. R. (1993) The Importance of Being Ribose at the Cleavage Site in the Tetrahymena Ribozyme Reaction, Biochemistry 32, 8312-8321.
153. Knitt, D. S., and Herschlag, D. (1996) pH dependencies of the Tetrahymena ribozyme reveal an unconventional origin of an apparent pKa, Biochemistry 35, 1560-1570.
154. Herschlag, D., and Khosla, M. (1994) Comparison of pH dependencies of the Tetrahymena ribozyme reactions with RNA 2'-substituted and phosphorothioate substrates reveals a rate-limiting conformational step, Biochemistry 33, 5291-5297.
155. Kuo, L. Y., Davidson, L. A., and Pico, S. (1999) Characterization of the Azoarcus ribozyme: tight binding to guanosine and substrate by an unusually small group I ribozyme, Biochim. Biophys. Acta 1489, 281-292.
156. Dahm, S. C., Derrick, W. B., and Uhlenbeck, O. C. (1993) Evidence for the Role of Solvated Metal Hydroxide in the Hammerhead Cleavage Mechanism, Biochemistry 32, 13040-13045.
157. Curtis, E. A., and Bartel, D. P. (2001) The hammerhead cleavage reaction in monovalent cations, RNA 7, 546-552.
158. Dahm, S. C., and Uhlenbeck, O. C. (1991) Role of Divalent Metal Ions in the Hammerhead RNA Cleavage Reaction, Biochemistry 30, 9464-9469.
159. Saenger, W. (1988) Principles of nucleic acid structure, 2nd ed., Springer-Verlag GmbH & Co KG, Berlin, Germany.
160. Fersht, A. (1999) Structure and mechanism in protein science: a guide to enzyme catalysis and protein folding, W.H. Freeman, New York.
161. Pyle, A. M., Murphy, F. L., and Cech, T. R. (1992) RNA substrate binding site in the catalytic core of the Tetrahymena ribozyme, Nature 358, 123-128.
162. Eigen, M., and Hammes, G. G. (1963) Elementary Steps In Enzyme Reactions (As Studied By Relaxation Spectrometry), Adv. Enzymol. Relat. Areas Mol. Biol. 25, 1-38.
163. Porschke, D., and Eigen, M. (1971) Co-operative non-enzymic base recognition. 3. Kinetics of the helix-coil transition of the oligoribouridylic--oligoriboadenylic acid system and of oligoriboadenylic acid alone at acidic pH, J. Mol. Biol. 62, 361-381.
164. Nelson, J. W., and Tinoco, I., Jr. (1982) Comparison of the Kinetics of Ribooligonucleotide, Deoxyribooligonucleotide, and Hybrid Oligonucleotide Double-Strand Formation by Temperature-Jump Kinetics, Biochemistry 21, 5289-5295.
165. Craig, M. E., Crothers, D. M., and Doty, P. (1971) Relaxation kinetics of dimer formation by self complementary oligonucleotides, J. Mol. Biol. 62, 383-401.
106

166. Ravetch, J., Gralla, J., and Crothers, D. M. (1974) Thermodynamic and kinetic properties of short RNA helices: the oligomer sequence AnGCUn, Nucleic Acids Res. 1, 109-127.
167. Breslauer, K. J., and Bina-Stein, M. (1977) Relaxation kinetics of the helix-coil transition of a self-complementary ribo-oligonucleotide: A7U7, Biophys Chem 7, 211-216.
168. Shih, I., and Been, M. D. (2000) Kinetic Scheme for Intermolecular RNA Cleavage by a Ribozyme Derived from Hepatitis Delta Virus RNA, Biochemistry 39, 9055-9066.
169. Esteban, J. A., Banerjee, A. R., and Burke, J. M. (1997) Kinetic mechanism of the hairpin ribozyme. Identification and characterization of two nonexchangeable conformations, J. Biol. Chem. 272, 13629-13639.
170. Bevilacqua, P. C., Kierzek, R., Johnson, K. A., and Turner, D. H. (1992) Dynamics of ribozyme binding of substrate revealed by fluorescence-detected stopped-flow methods, Science 258, 1355-1358.
171. Li, Y., and Breaker, R.R. (1999) Kinetics of RNA Degradation by Specific Base Catalysis of Transesterification Involving the 2’-Hydroxyl Group., J. Am. Chem. Soc. 121, 5364-5372.
172. Murphy, F. L., and Cech, T. R. (1989) Alteration of substrate specificity for the endoribonucleolytic cleavage of RNA by the Tetrahymena ribozyme, Proc Natl Acad Sci U S A 86, 9218-9222.
Copyright © Joy Sinha 2006
107

Vita
Joy was born on September 7, 1976 in Calcutta, India. In 1998, he received a
Bachelor of Science degree in Chemistry from Visva Bharati University in West Bengal,
India. In 2000, he obtained a Master of Science degree in Chemistry with a concentration in
Organic Chemistry from the same university. After graduation, he joined Indian Institute of
Technology, Kharagpur as a Junior Research Fellow and left after six months to start his
graduate study at the University of Kentucky in the fall of 2001. Since then he conducted his
dissertation research in the lab of Dr. Stephen M. Testa.
List of Publications:
1. Sinha, J., Dotson, P. P., Testa, S. M. Kinetic Characterization of the First Step of
the Trans Excision-Splicing Reaction Catalyzed by a Group I Intron-Derived
Ribozyme. (Manuscript in preparation).
2. Dotson, P. P., Sinha, J., Testa, S. M. Revised Mechanism of the Trans Excision-
Splicing Reaction. (Manuscript in preparation).
3. Johnson, A. K., Sinha, J., Testa, S. M. Trans Insertion-Splicing: Ribozyme
Catalyzed Insertion of Targeted Sequences into RNAs. Biochemistry 44 (31),
10702-10710.
4. Baum, D. A*., Sinha, J.*, Testa, S. M. (2005) Molecular recognition in a trans
excision-splicing ribozyme: Non-Watson-crick base pairs at the 5’ splice site and
ωG at the 3’ splice site can play a role in determining the binding register of
reaction substrates. Biochemistry 44 (3), 1067-1077.
* These two authors contributed equally to this work and thus should be regarded as
joint first authors.
108

5. Bell, M. A., Sinha, J., Johnson, A. K., Testa, S. M. (2004) Enhancing the second
step of the trans excision-splicing reaction of a group I ribozyme by exploiting
P9.0 and P10 for intermolecular recognition. Biochemistry 43 (14), 4323-4331.
6. Sinha, J., Layek, S., Mandal, G. C., Bhattacharjee, M. (2001) A green
Hunsdiecker reaction: synthesis of β-bromostyrenes from the reaction of α, β-
unsaturated aromatic carboxylic acids with KBr and H2O2 catalysed by Na2MoO4.
H2O in aqueous medium. Chem. Comm. 19, 1916-1917.
Joy Sinha
2006
109