The biology of intron gain and loss
7
The biology of intron gain and loss Daniel C. Jeffares 1,2 , Tobias Mourier 1,2 and David Penny 3 1 Wellcome Trust Sanger Institute, Wellcome Trust Genome Campus, Hinxton, Cambridge, UK, CB10 1SA 2 Department of Evolutionary Biology, Biological Institute, University of Copenhagen, Denmark 3 Allan Wilson Center for Molecular Ecology and Evolution, Massey University, PO Box 11-222, Palmerston North, New Zealand Intron density in eukaryote genomes varies by more than three orders of magnitude, so there must have been extensive intron gain and/or intron loss during evolution. A favored and partial explanation for this range of intron densities has been that introns have accumulated stochastically in large eukaryote genomes during their evolution from an intron-poor ancestor. However, recent studies have shown that some eukar- yotes lost many introns, whereas others accumulated and/or gained many introns. In this article, we discuss the growing evidence that these differences are subject to selection acting on introns depending on the biology of the organism and the gene involved. Intron accumulation and loss: the debate Spliceosomal introns appear to be a universal feature of eukaryote genomes but are absent from bacterial and archaeal genomes. This discrepancy has fuelled consider- able debate about the initial origin of introns and the spliceosome, and the extent to which intron-dense genomes are an ancestral or a derived state (Box 1). The debate continues and currently there is no clear consensus about the initial origin of introns. For detailed reviews, see Refs [1–4]. Because prokaryotes have no spliceosomal introns, our understanding of intron gain or loss (IGL) must come from analysis of eukaryote genomes. A large body of research into eukaryote IGL has shown that although the positions of certain introns (10–40%) are conserved between highly divergent eukaryotes, the number and placement of most introns is dynamic during evolution [5–8]. Comparative eukaryote genomics is showing the dynamic range of intron density (see Glossary) ever more clearly. The intron density of annotated eukaryotic genomes varies by more than three orders of magnitude: from w140 000 introns in the human genome (intron density 8.4 introns per gene) to only 15 introns in the microsporidian Encepalitozoon cuniculi (intron density 0.0075 introns per gene) [9–11]. Early models of intron evolution were based primarily on examining introns in sets of orthologous genes from model eukaryotes, mostly metazoans and higher plants (Refs [1,2,4] and references therein). These studies often assumed that probabilities of IGL were similar among all taxa, and that patterns of IGL observed in any particular group of genes could be extrapolated across the entire genome. We review recent genomic studies showing that rates of IGL differ significantly between eukaryotic genomes; some have undergone extensive intron loss, whereas others have accumulated and retained many introns. We also describe studies showing that intron dynamics differ between particular types of genes. We present the view that IGL is affected by selective pressures that depend on the biology of the organism and the gene concerned. Eukaryotes differ in their tendencies to gain and lose introns The eukaryotic tree displays a range of intron densities. An examination of intron density and eukaryote phylo- geny shows that it is not always the case that early branching eukaryotes are intron poor and that late branching eukaryotes are intron rich (Figures 1 and 2). The current view from several recent studies is that differences in intron densities are due to different histories of IGL dynamics – some groups of organisms appear to have gained many introns, whereas others have lost many introns [6,11–15]. For example, a paucity of introns in some specialized eukaryotes is now being interpreted as a result of extensive intron loss (Box 2). Rates of IGL also differ significantly between lineages. An analysis of orthologs from distantly related eukaryotes (crown group and Plasmodium) concluded that rates of intron gain vary tenfold between these species, whereas the rates of intron loss varied by approximately eightfold. The ratio of the rate of intron gain to the rate of intron loss varied by O20-fold [15]. An important conclusion of this study was that all species (including metazoan genomes) had more losses than gains. Glossary Nucleomorph: a eukaryote endosymbiont alga whose cellular structure is reduced to the point that only a membrane-bound nucleus and a chloroplast remain. Nucleomorph genomes are compact compared with those of free living eukaryotes. 5 0 intron bias: an excess of introns in the 5 0 regions of genes. Many unicellular eukaryotes have 5 0 intron biases, multicellular genomes have no bias of intron positions. Intron density: the average number of introns per gene over an entire genome (or set of genes). r-selection: natural selection on the basis of maximum reproductive and/or growth rate (e.g. Escherichia coli or baker’s yeast). K-selection: natural selection that favors organisms with slow growth and long life cycles that live in stable environments. cDNA recombination: the process of transcription, splicing, reverse transcrip- tion by endogenous reverse transcriptases and recombination of the intron-less cDNAs with the genome. It is known to occur in many eukaryote genomes. Ultraconserved elements: a class of conserved elements identified in metazoan genomes that share 100% identity across at least 200 bp [28].[28] Corresponding author: Jeffares, D.C. ([email protected]). Available online 14 November 2005 Opinion TRENDS in Genetics Vol.22 No.1 January 2006 www.sciencedirect.com 0168-9525/$ - see front matter Q 2005 Elsevier Ltd. All rights reserved. doi:10.1016/j.tig.2005.10.006
Transcript of The biology of intron gain and loss

The biology of intron gain and lossDaniel C. Jeffares1,2, Tobias Mourier1,2 and David Penny3
1Wellcome Trust Sanger Institute, Wellcome Trust Genome Campus, Hinxton, Cambridge, UK, CB10 1SA2Department of Evolutionary Biology, Biological Institute, University of Copenhagen, Denmark3Allan Wilson Center for Molecular Ecology and Evolution, Massey University, PO Box 11-222, Palmerston North, New Zealand
Intron density in eukaryote genomes varies by more
than three orders of magnitude, so there must have
been extensive intron gain and/or intron loss during
evolution. A favored and partial explanation for this
range of intron densities has been that introns have
accumulated stochastically in large eukaryote genomes
during their evolution from an intron-poor ancestor.
However, recent studies have shown that some eukar-
yotes lost many introns, whereas others accumulated
and/or gained many introns. In this article, we discuss
the growing evidence that these differences are subject
to selection acting on introns depending on the biology
of the organism and the gene involved.
Glossary
Nucleomorph: a eukaryote endosymbiont alga whose cellular structure is
reduced to the point that only a membrane-bound nucleus and a chloroplast
remain. Nucleomorph genomes are compact compared with those of free living
eukaryotes.
5 0 intron bias: an excess of introns in the 5 0 regions of genes. Many unicellular
eukaryotes have 5 0 intron biases, multicellular genomes have no bias of intron
positions.
Intron density: the average number of introns per gene over an entire genome
(or set of genes).
r-selection: natural selection on the basis of maximum reproductive and/or
growth rate (e.g. Escherichia coli or baker’s yeast).
K-selection: natural selection that favors organisms with slow growth and long
life cycles that live in stable environments.
cDNA recombination: the process of transcription, splicing, reverse transcrip-
tion by endogenous reverse transcriptases and recombination of the intron-less
cDNAs with the genome. It is known to occur in many eukaryote genomes.
Intron accumulation and loss: the debate
Spliceosomal introns appear to be a universal feature ofeukaryote genomes but are absent from bacterial andarchaeal genomes. This discrepancy has fuelled consider-able debate about the initial origin of introns and thespliceosome, and the extent to which intron-densegenomes are an ancestral or a derived state (Box 1). Thedebate continues and currently there is no clear consensusabout the initial origin of introns. For detailed reviews, seeRefs [1–4].
Because prokaryotes have no spliceosomal introns, ourunderstanding of intron gain or loss (IGL) must come fromanalysis of eukaryote genomes. A large body of researchinto eukaryote IGL has shown that although the positionsof certain introns (10–40%) are conserved between highlydivergent eukaryotes, the number and placement of mostintrons is dynamic during evolution [5–8]. Comparativeeukaryote genomics is showing the dynamic range ofintron density (see Glossary) ever more clearly. The introndensity of annotated eukaryotic genomes varies by morethan three orders of magnitude: from w140 000 introns inthe human genome (intron density 8.4 introns per gene) toonly 15 introns in the microsporidian Encepalitozooncuniculi (intron density 0.0075 introns per gene) [9–11].
Early models of intron evolution were based primarilyon examining introns in sets of orthologous genes frommodel eukaryotes, mostly metazoans and higher plants(Refs [1,2,4] and references therein). These studies oftenassumed that probabilities of IGL were similar among alltaxa, and that patterns of IGL observed in any particulargroup of genes could be extrapolated across theentire genome.
Corresponding author: Jeffares, D.C. ([email protected]).Available online 14 November 2005
www.sciencedirect.com 0168-9525/$ - see front matter Q 2005 Elsevier Ltd. All rights reserved
We review recent genomic studies showing that rates ofIGL differ significantly between eukaryotic genomes;some have undergone extensive intron loss, whereasothers have accumulated and retained many introns. Wealso describe studies showing that intron dynamics differbetween particular types of genes. We present the viewthat IGL is affected by selective pressures that depend onthe biology of the organism and the gene concerned.
Eukaryotes differ in their tendencies to gain and lose
introns
The eukaryotic tree displays a range of intron densities.An examination of intron density and eukaryote phylo-geny shows that it is not always the case that earlybranching eukaryotes are intron poor and that latebranching eukaryotes are intron rich (Figures 1 and 2).The current view from several recent studies is thatdifferences in intron densities are due to different historiesof IGL dynamics – some groups of organisms appear tohave gained many introns, whereas others have lost manyintrons [6,11–15]. For example, a paucity of introns insome specialized eukaryotes is now being interpreted as aresult of extensive intron loss (Box 2).
Rates of IGL also differ significantly between lineages.An analysis of orthologs from distantly related eukaryotes(crown group and Plasmodium) concluded that rates ofintron gain vary tenfold between these species, whereasthe rates of intron loss varied by approximately eightfold.The ratio of the rate of intron gain to the rate of intron lossvaried by O20-fold [15]. An important conclusion of thisstudy was that all species (including metazoan genomes)had more losses than gains.
Opinion TRENDS in Genetics Vol.22 No.1 January 2006
Ultraconserved elements: a class of conserved elements identified in metazoan
genomes that share 100% identity across at least 200 bp [28].[28]
. doi:10.1016/j.tig.2005.10.006

Box 1. The origin of introns
The ubiquity of spliceosomal introns in eukaryotes and their absence
in prokaryotes has prompted three different theories regarding the
initial origin of introns and the spliceosome.
(i) Introns late: according to this theory, introns and the spliceosome
arose within the eukaryote lineage (depicted as ‘L’ in Figure Ia) and
then the intronsaccumulated in eukaryotegenomes (seeRefs [1,2,4]
for more details). Subsequent sources of new introns include
‘reverse splicing’ and insertion of transposable elements [46–48].
(ii) Introns early: this model proposes that the intron-exon structure of
genes was present in the last universal common ancestor (LUCA)
(‘E’ in Figure Ib) – and possibly earlier – where primordial protein
domains were shuffled to facilitate protein evolution [49]; for a
review,seeRef. [3]. Intronsweresubsequentlylostfromarchaeaand
bacteria. The molecular mechanism for intron loss via the
recombinationofsplicedcDNAs[50],andtheantiquityofthereverse
transcriptaserequiredpresentaclearmechanismofloss.Thismodel
depends (as does the introns first model) only on known processes.
(iii) Introns first: this is similar to the introns early theory, but
proposes that introns and the spliceosome are remnants from
the RNA world (‘F’ in Figure Ib) [45,51]. This model was initiated
from the observation that putatively ancient snoRNA genes are
often encoded by introns. Because RNAs were the only catalysts
for the assembly of an all-RNA ribosome before the advent of
proteins, snoRNAs must have been used for the assembly of the
proto-ribosome as it evolved towards full protein producing
capacity [42]. Hence, the introns that contain snoRNAs pre-date
the protein-coding exons that surround them. The splicing of
snoRNA-encoding introns from transcripts with no protein
coding potential, and the processing of pre-rRNA and pre-
tRNAs by RNase P are examples of how RNA processing might
have occured before proteins evolved [45,51].
TRENDS in Genetics
Bacteria Archaea Eukaryotes
Bacteria Archaea Eukaryotes
E
F
L
Loss
Loss
(a)
(b)
Gradualloss
Intron invasionand evolution ofspliceosomal complex
LUCA with no introns
RNA world
Gradualloss
LUCA with introns
RNA world
Figure I. The tree of life. The origin of introns as explained by (a) the introns late
theory and (b) the introns early and introns first theories. The green branches
indicate lineages containing introns, the black branches denote pre-intron
stages and the red branches indicate secondary loss of introns.
TRENDS in Genetics
0
8.82
7.16
8.43
8.08
3.32
4.84
0.053
0.048
0.95
1.89
1.70
2.68
2.22
0.75
2.63
0.0075
1.31
4.38
3.25
0.0075
0.005
1.39
0.005
(a)
(b)
Pro
port
ion
of in
tron
s
Relative intron position
1 2 3 4 5 6 7 8 9 10
0.4
0.3
0.2
0.1
H. sapiens
M. musculus
R. norvegicus
G. gallus
D. melanogaster
C. elegans
S. cerevisiae
A. gossypii
S. pombe
M. grisea
N. crassa
F. graminearum
A. nidulans
U. maydis
P. chrysosporium
E. cuniculi
D. discoideum
A. thaliana
O. sativa
G. theta
C. merolae
P. falciparum
C. parvum
Figure 1. Intron density and 5 0 bias in eukaryote genomes. (a) General eukaryotic
phylogeny. The number of introns per gene in each species is shown alongside a
schematic illustration of the relative intron position in each species colored
according the type of intron bias [green, no bias of intron distribution; orange, 5 0
biased introns; blue, other bias; a full explanation of the format is given in (b)]. The
general tree topology was adapted from Ref. [55], and the topology of the fungal
clade was provided by Jason Stajich (personal communication) (http://www.duke.
edu/wjes12/sequenced_fungi_tree.html). The intron data were obtained from the
following sources: UCSC Genome Browser (http://genome.ucsc.edu/) (Drosophila
melanogaster, Caenorhabditis elegans, Mus musculus, Gallus gallus, Rattus
norvegicus and Homo sapiens); Motomichi Matsuzaki provided information
about Cyanidioschyzon merolae; Ashbya gossypii Genome Browser (http://agd.
unibas.ch/) (A. gossypii); TIGR Rice Genome Project (http://www.tigr.org/tdb/e2k1/
Opinion TRENDS in Genetics Vol.22 No.1 January 2006 17
www.sciencedirect.com

TRENDS in Genetics
0
10
20
30
40
50
60
0
Intron density (introns per gene)
Ave
rage
intr
on p
ositi
on
1 2 3 4 5 6 7 8 9 10
Figure 2. Intron position bias and intron density. For the 23 different genomes
(shown in Figure 1a), the average intron position (for all introns in the genome) with
respect to the coding sequence was plotted against the intron density. Genomes
with no bias of intron position will have an average intron position at 50% of the
length of the coding sequence. Those with an increasingly strong 5 0 bias of intron
positions have average positions approaching zero. Data and calculations are as
described in Figure 1.
Box 2. Extensive intron loss
One mechanism for intron loss is by reverse transcription of spliced
mRNAs (which do not contain introns), followed by homologous
recombination of the cDNA with the genomic copy of the gene.
Because reverse transcription proceeds in 5 0–3 0 direction and often
terminates prematurely (see Figure 1b), this process would result in
a preferential loss of introns at the 3 0 end of transcripts. It has been
shown that reverse transcription and cDNA recombination does
occur in vivo [52], and several analyses of eukaryote genomes have
indicated that 3 0 intron loss has occurred in unicellular eukaryotes
[11,14,48,53].
The microsporidian Encephalitozoon cuniculi (an intracellular
parasite of mammals) and the Guillardia theta nucleomorph (an
endosymbiont alga) provide clear examples of extensive intron loss
at the 3 0 end of transcripts. Both organisms contain !20 introns each
per genome [33,35], and all introns are located at the extreme 5 0 ends
of genes. Because both organisms are related to relatively intron-
rich groups of eukaryotes (see Figure 1a), they do not appear to have
been ancestrally intron poor.
The genomes of these ‘mini-eukaryotes’ have been derived by
reduction from more complex, free-living organisms; E. cuniculi is
an amitochondrial fungus, and G. theta is derived from a red alga
that is now reduced to a organelle-like nucleomorph [33,35]. Many
features of their genomes are highly reduced or compact; they have
overlapping genes, shorter coding regions than typical eukaryote
homologs and their genomes contain few genes and lack some of
the core eukaryote protein set [33,35,54].
The derived nature of the E. cuniculi and G. theta nucleomorph
genomes, their phylogenetic placement within relatively intron-rich
eukaryote groups and the association of 5 0 biased intron density with
intron loss provide strong evidence that these two organisms have
undergone extensive intron loss.
The intestinal parasite Giardia lamblia also appears to be derived
from a more intron-rich ancestor. Although only one intron has been
found in the Giardia genome so far, conservative criteria have
identified 27 spliceosomal proteins in this species, representing a
complex spliceosome [43]. The scenario that one or a few introns
have necessitated the evolution of a complex spliceosome with
dozens of proteins and five small nuclear RNAs appears unlikely. It
seems more likely that the complex spliceosome of Giardia is a
molecular fossil of its intron-rich ancestry.
Opinion TRENDS in Genetics Vol.22 No.1 January 200618
Metazoan genomes provide the best examples ofdiffering IGL rates over similar evolutionary timescales.Mammalian genomes appear almost static in terms of IGLbecause a loss of only 0.003 introns per gene and no clearintron gains could be identified between human andmouse genomes (separated by w90 million years) [16].By contrast, a comparison of Caenorhabditis elegans andCaenorhabditis briggsae genomes (separated by w100million years) identified w0.5 IGL events per gene [17],and a comparison of the Drosophila and Anophelesgenomes (separated by 125 million years) identifiedapproximately one IGL event per gene [17].
In the remainder of this article we attempt to explainsuch differences in intron dynamics. In particular, weargue that life cycle parameters are important for under-standing intron evolution.
The selective advantages of intron loss
Using population genetics theory, Lynch has shown that ifintron-containing alleles are slightly deleterious, they willbe less tolerated in small organisms that have largepopulations [18]. There is an inverse relationship betweenthe size of organism and its effective population size;
osa1/) (Oryza sativa); National Center for Biotechnology Information (http://www.
ncbi.nlm.nih.gov) [Arabidopsis thaliana, Encephalitozoon cuniculi, Guillardia theta,
Saccharomyces cerevisiae, Neurospora crassa, Schizosaccharomyces pombe,
Dictyostelium discoideum (Chromosome 2) and Cryptosporidium parvum];
GenBank (Plasmodium falciparum); The US Department of Energy Joint Genome
Institute (http://www.jgi.doe.gov/) (P. chrysosporium); Broad Institute of MIT and
Harvard (http://www.broad.mit.edu) (Magnaporthe grisea, Ustilago maydis,
Aspergillus nidulans and Fusarium graminearum); Fungal Genomics Laboratory
at North Carolina State University (http://www.fungalgenomics.ncsu.edu) and
Broad Institute of MIT and Harvard (http://www.broad.mit.edu/) (Magnaporthe
grisea). (b) A detailed relative intron-position plot for S. pombe. For each intron, its
relative position is calculated as: the number of base pairs upstream of the intron in
the coding sequence (i.e. the intronic sequence was removed) O the total number
of base pairs of coding sequence. Values are then pooled into ten classes. The
proportion of introns (y-axis) that fall into each of the ten classes (x-axis) is shown.
www.sciencedirect.com
therefore, single-cell organisms will usually have muchlarger populations than multicellular organisms, and thuswill experience selection against even slightlydeleterious introns.
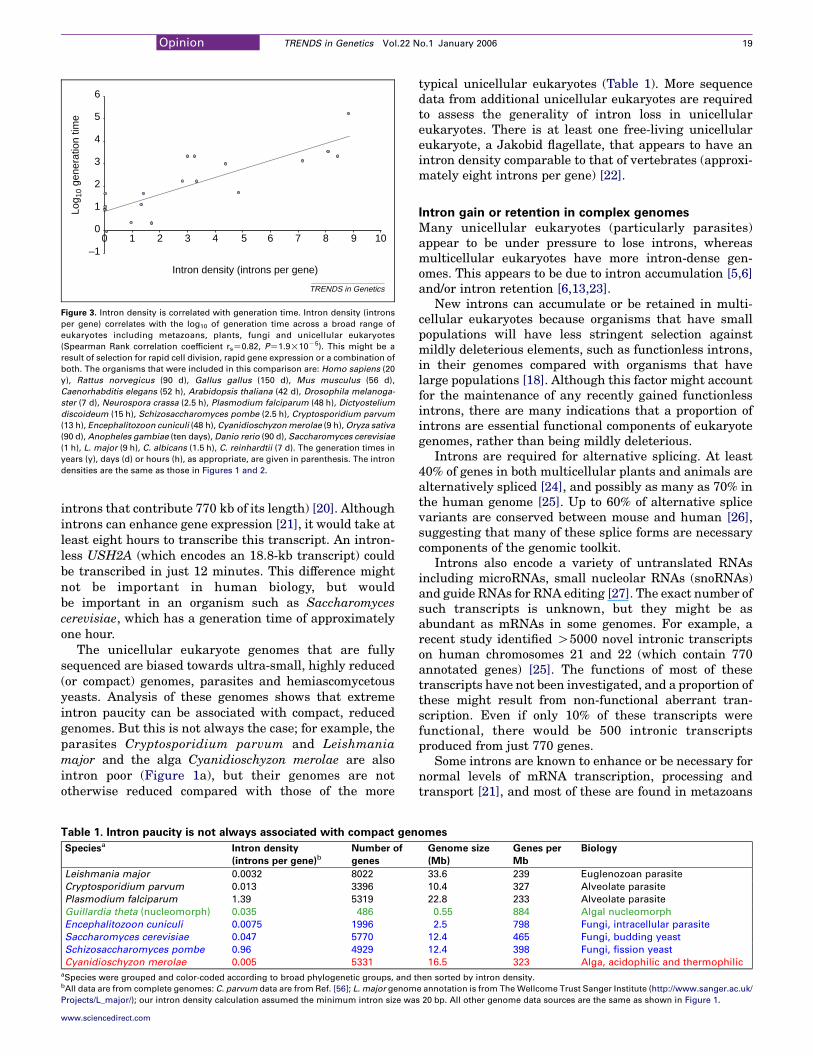
We found that intron density correlates with thelogarithm of generation time (Figure 3). That is, organ-isms that reproduce rapidly tend to have fewer intronsthan organisms that have longer life cycles. Thiscorrelation could be due to selection for smaller genomes,selection for genes that can produce proteins quickly inresponse to external stimuli (e.g. heat shock proteins),or both.
We expect that small, r-selected organisms willexperience selection pressure to reduce processing timesfor mRNAs. RNA polymerase II proceeds at 1–1.5 kb perminute and intron excision takes approximately threeminutes [19]; therefore, intron removal is a significantpart of mRNA-processing time. The consideration of anextreme example illustrates how these RNA-processingtimes might be crucial in organisms with short generationtimes, and unimportant in organisms with much longergeneration times. The human Usher syndrome 2A gene(USH2A) encodes a 790-kb transcript (including w70
TRENDS in Genetics
–1
0
1
2
3
4
5
6
Intron density (introns per gene)
Log 1
0 ge
nera
tion
time
0 1 2 3 4 5 6 7 8 9 10
Figure 3. Intron density is correlated with generation time. Intron density (introns
per gene) correlates with the log10 of generation time across a broad range of
eukaryotes including metazoans, plants, fungi and unicellular eukaryotes
(Spearman Rank correlation coefficient rsZ0.82, PZ1.9!10K5). This might be a
result of selection for rapid cell division, rapid gene expression or a combination of
both. The organisms that were included in this comparison are: Homo sapiens (20
y), Rattus norvegicus (90 d), Gallus gallus (150 d), Mus musculus (56 d),
Caenorhabditis elegans (52 h), Arabidopsis thaliana (42 d), Drosophila melanoga-
ster (7 d), Neurospora crassa (2.5 h), Plasmodium falciparum (48 h), Dictyostelium
discoideum (15 h), Schizosaccharomyces pombe (2.5 h), Cryptosporidium parvum
(13 h), Encephalitozoon cuniculi (48 h), Cyanidioschyzon merolae (9 h), Oryza sativa
(90 d), Anopheles gambiae (ten days), Danio rerio (90 d), Saccharomyces cerevisiae
(1 h), L. major (9 h), C. albicans (1.5 h), C. reinhardtii (7 d). The generation times in
years (y), days (d) or hours (h), as appropriate, are given in parenthesis. The intron
densities are the same as those in Figures 1 and 2.
Opinion TRENDS in Genetics Vol.22 No.1 January 2006 19
introns that contribute 770 kb of its length) [20]. Althoughintrons can enhance gene expression [21], it would take atleast eight hours to transcribe this transcript. An intron-less USH2A (which encodes an 18.8-kb transcript) couldbe transcribed in just 12 minutes. This difference mightnot be important in human biology, but wouldbe important in an organism such as Saccharomycescerevisiae, which has a generation time of approximatelyone hour.
The unicellular eukaryote genomes that are fullysequenced are biased towards ultra-small, highly reduced(or compact) genomes, parasites and hemiascomycetousyeasts. Analysis of these genomes shows that extremeintron paucity can be associated with compact, reducedgenomes. But this is not always the case; for example, theparasites Cryptosporidium parvum and Leishmaniamajor and the alga Cyanidioschyzon merolae are alsointron poor (Figure 1a), but their genomes are nototherwise reduced compared with those of the more
Table 1. Intron paucity is not always associated with compact gen
Speciesa Intron density
(introns per gene)b
Number of
genes
Leishmania major 0.0032 8022
Cryptosporidium parvum 0.013 3396
Plasmodium falciparum 1.39 5319
Guillardia theta (nucleomorph) 0.035 486
Encephalitozoon cuniculi 0.0075 1996
Saccharomyces cerevisiae 0.047 5770
Schizosaccharomyces pombe 0.96 4929
Cyanidioschyzon merolae 0.005 5331aSpecies were grouped and color-coded according to broad phylogenetic groups, and tbAll data are from complete genomes: C. parvum data are from Ref. [56]; L. major genom
Projects/L_major/); our intron density calculation assumed the minimum intron size wa
www.sciencedirect.com
typical unicellular eukaryotes (Table 1). More sequencedata from additional unicellular eukaryotes are requiredto assess the generality of intron loss in unicellulareukaryotes. There is at least one free-living unicellulareukaryote, a Jakobid flagellate, that appears to have anintron density comparable to that of vertebrates (approxi-mately eight introns per gene) [22].
Intron gain or retention in complex genomes
Many unicellular eukaryotes (particularly parasites)appear to be under pressure to lose introns, whereasmulticellular eukaryotes have more intron-dense gen-omes. This appears to be due to intron accumulation [5,6]and/or intron retention [6,13,23].
New introns can accumulate or be retained in multi-cellular eukaryotes because organisms that have smallpopulations will have less stringent selection againstmildly deleterious elements, such as functionless introns,in their genomes compared with organisms that havelarge populations [18]. Although this factor might accountfor the maintenance of any recently gained functionlessintrons, there are many indications that a proportion ofintrons are essential functional components of eukaryotegenomes, rather than being mildly deleterious.
Introns are required for alternative splicing. At least40% of genes in both multicellular plants and animals arealternatively spliced [24], and possibly as many as 70% inthe human genome [25]. Up to 60% of alternative splicevariants are conserved between mouse and human [26],suggesting that many of these splice forms are necessarycomponents of the genomic toolkit.
Introns also encode a variety of untranslated RNAsincluding microRNAs, small nucleolar RNAs (snoRNAs)and guide RNAs for RNA editing [27]. The exact number ofsuch transcripts is unknown, but they might be asabundant as mRNAs in some genomes. For example, arecent study identified O5000 novel intronic transcriptson human chromosomes 21 and 22 (which contain 770annotated genes) [25]. The functions of most of thesetranscripts have not been investigated, and a proportion ofthese might result from non-functional aberrant tran-scription. Even if only 10% of these transcripts werefunctional, there would be 500 intronic transcriptsproduced from just 770 genes.
Some introns are known to enhance or be necessary fornormal levels of mRNA transcription, processing andtransport [21], and most of these are found in metazoans
omes
Genome size
(Mb)
Genes per
Mb
Biology
33.6 239 Euglenozoan parasite
10.4 327 Alveolate parasite
22.8 233 Alveolate parasite
0.55 884 Algal nucleomorph
2.5 798 Fungi, intracellular parasite
12.4 465 Fungi, budding yeast
12.4 398 Fungi, fission yeast
16.5 323 Alga, acidophilic and thermophilic
hen sorted by intron density.
e annotation is from The Wellcome Trust Sanger Institute (http://www.sanger.ac.uk/
s 20 bp. All other genome data sources are the same as shown in Figure 1.

TRENDS in Genetics
Organism-specific factorsGeneration timer–K-selection strategyPopulation sizeSingle cell or multicellularity
Gene-specific factorsExpression levelAlternative splicingActivity in time and spaceGene function?
Intron-specific factorsPositionPresence of functionalelements
Figure 4. Factors that can affect the gain and loss of introns. The fate of any given
intron is dependent on three facets of the genes biology. Organism-specific factors
will determine the overall rates of gain or loss. Gene-specific factors differentiate
between particular groups of genes, such as those with extensive alternative
splicing. Finally, certain introns within a gene are more likely to be gained or lost,
such as the bias for loss in 5 0 introns (Box 2). Examples of possible factors at each
level are shown.
Opinion TRENDS in Genetics Vol.22 No.1 January 200620
or higher plants. Introns also contain many highlyconserved elements that can function at the DNA level.More than a fifth of the 481 ultraconserved elements(100/481) shared by human, mouse and rat that wereidentified recently [28] are intronic. There are O5000shorter ultraconserved elements (of at least 100 bp),suggesting that there might be 1000 ultraconservedintronic elements in mammalian genomes.
The indications from alternative splicing, intronic non-coding transcripts and ultraconserved elements are that acertain proportion of introns have important functions inmulticellular eukaryotes, but just how many introns arefunctional has yet to be determined [29]. Nevertheless,some intronic functions appear to have become essentialfor the production of complex multicellular organisms[30], and, therefore, once they accumulate they cannotbe lost.
Some genes use introns more than others
Many studies of intron evolution implicitly assume thatpatterns of intron evolution displayed by one gene arerepresentative of the entire genome. However, there isevidence that different functional classes of genes havedifferent propensities for intron gain and loss. Even inmetazoans, which have smaller populations than unicells,some genes are apparently under selective pressure tominimize introns. Genes that are highly expressed inhumans and C. elegans, and human genes that areexpressed in all tissues (probably a similar set of genes)tend to have short introns [31,32], arguably reflectingselection against the expense and time of transcriptionand processing.
By contrast, introns are more abundant in theribosomal genes of E. cuniculi, Guillardia theta andS. cerevisiae and its related yeasts than in the rest oftheir genomes [14,33–35]. These introns might have beenretained because ribosomal proteins are more likely tocontain intron-encoded snoRNAs [36], or because theirexpression is coupled to the transcription-splicing-mRNAtransport process [34,37]. Intron length also appears to bepositively correlated with expression in unicellular eukar-yotes and negatively correlated in multicellulareukaryotes [38].
Several studies have shown that certain groups ofgenes have different rates of IGL, illustrating howdifferent intron densities are established. Rates of IGLvary in genes that have been duplicated; paralogs differmore than orthologs in Plasmodium species [39], andgenes that have undergone lineage-specific expansionshave increased rates of intron gain [23].
The ancient evolutionary history of introns in the tree
of life
The factors determining the evolutionary fate of any givenintron will depend on the intron itself (e.g. introns thatcontain untranslated RNA genes), the gene in which itresides (which might be highly expressed or an alter-natively spliced gene) and the host organism (dependingon population size and generation time) (Figure 4).Different intron densities might be selected for becauseof ‘incidental’ facets of the biology of genes; for example,
www.sciencedirect.com
human genes involved in cell communication and enzymeregulation are more likely to be alternatively spliced,which will constrain loss of introns [40]. It follows thatdifferent evolutionary ‘rules’ apply to different introns.
Because intron density can vary so much under theinfluence of selection, we cannot yet make a realisticestimation of the intron density or genome size of theearliest eukaryotes. Our understanding of the processesoccurring in extant eukaryotes, however, relates totheories about the absence of introns in prokaryotes (Box1). The observation that introns have been almost entirelypurged from highly reduced genomes [11,33,35] indicatesthat even prokaryote genomes could be derived from anintron-containing ancestor [41,42].
If this were so, we would expect the spliceosome to be anancient component of cells, and the biology of thespliceosome appears to be consistent with this idea.First, many spliceosomal proteins are conserved acrossall eukaryotes including basal eukaryotes [43]. Thediscovery that modern spliceosomes might be the largestRNA-protein complex in the cell, exceeding even the size ofribosomes [44], and the coupling between splicing andessential RNA-processing steps [37] is consistent with amodel of the spliceosome evolving gradually over a longperiod of time. This could have occurred in the (possiblylong) branch of the tree of life between the divergence ofprokaryotes and eukaryotes and earliest the divergenceof the first eukaryote taxa (Box 1). But the involvement of

Opinion TRENDS in Genetics Vol.22 No.1 January 2006 21
RNA at the core of the spliceosome and the catalyticpotential of the RNA components of the spliceosome isconsistent with the evolution of the spliceosome muchearlier, in the RNA world [45].
Whatever the initial origins of intron and the spliceo-some were, at present it is apparent that intron evolutionis a dynamic process in eukaryotes. Introns are gained andlost to varying extents in different genomes in response tostrong selective pressures, so that intron use is animportant component of genome adaptation. Only a fewof the factors that influence intron density have beenidentified to date, we can expect many more to becomeapparent in the future.
AcknowledgementsD.C.J. was supported by The Carlsberg Foundation and by the WellcomeTrust. T.M. was supported by The Carlsberg Foundation. D.P. wassupported by The Marsden Fund. We thank A. Ivens for permission to usethe L. major genome annotation, Jason Stajich for use of the fungalphylogeny, Motomichi Matsuzaki for the C. merolae annotation and allthose who assisted with critical reading of this article.
References
1 Logsdon, J.M., Jr. (1998) The recent origins of spliceosomal intronsrevisited. Curr. Opin. Genet. Dev. 8, 637–648
2 de Souza, S.J. (2003) The emergence of a synthetic theory of intronevolution. Genetica 118, 117–121
3 Roy, S.W. (2003) Recent evidence for the exon theory of genes. Genetica118, 251–266
4 Lynch, M. and Richardson, A.O. (2002) The evolution of spliceosomalintrons. Curr. Opin. Genet. Dev. 12, 701–710
5 de Souza, S.J. et al. (1998) Toward a resolution of the introns early/latedebate: only phase zero introns are correlated with the structure ofancient proteins. Proc. Natl. Acad. Sci. U. S. A. 95, 5094–5099
6 Rogozin, I.B. et al. (2003) Remarkable interkingdom conservation ofintron positions and massive, lineage-specific intron loss and gain ineukaryotic evolution. Curr. Biol. 13, 1512–1517
7 Fedorov, A. et al. (2002) Large-scale comparison of intron positionsamong animal, plant, and fungal genes. Proc. Natl. Acad. Sci. U. S. A.99, 16128–16133
8 Sverdlov, A.V. et al. (2005) Conservation versus parallel gains in intronevolution. Nucleic Acids Res. 33, 1741–1748
9 Gilson, P.R. and McFadden, G.I. (1996) The miniaturized nucleargenome of eukaryotic endosymbiont contains genes that overlap,genes that are cotranscribed, and the smallest known spliceosomalintrons. Proc. Natl. Acad. Sci. U. S. A. 93, 7737–7742
10 Lander, E.S. et al. (2001) Initial sequencing and analysis of the humangenome. Nature 409, 860–921
11 Mourier, T. and Jeffares, D.C. (2003) Eukaryotic intron loss. Science300, 1393
12 Nielsen, C.B. et al. (2004) Patterns of intron gain and loss in fungi.PLoS Biol. 2, e422
13 Banyai, L. and Patthy, L. (2004) Evidence that human genes ofmodular proteins have retained significantly more ancestral intronsthan their fly or worm orthologues. FEBS Lett. 565, 127–132
14 Bon, E. et al. (2003) Molecular evolution of eukaryotic genomes:hemiascomycetous yeast spliceosomal introns. Nucleic Acids Res. 31,1121–1135
15 Roy, S.W. and Gilbert, W. (2005) Rates of intron loss and gain:implications for early eukaryotic evolution. Proc. Natl. Acad. Sci. U. S.A. 102, 5773–5778
16 Roy, S.W. et al. (2003) Large-scale comparison of intron positions inmammalian genes shows intron loss but no gain. Proc. Natl. Acad. Sci.U. S. A. 100, 7158–7162
17 Zdobnov, E.M. et al. (2002) Comparative genome and proteomeanalysis of Anopheles gambiae and Drosophila melanogaster. Science298, 149–159
18 Lynch, M. (2002) Intron evolution as a population-genetic process.Proc. Natl. Acad. Sci. U. S. A. 99, 6118–6123
www.sciencedirect.com
19 Neugebauer, K.M. (2002) On the importance of being co-transcrip-tional. J. Cell Sci. 115, 3865–3871
20 van Wijk, E. et al. (2004) Identification of 51 novel exons of the Ushersyndrome type 2A (USH2A) gene that encode multiple conservedfunctional domains and that are mutated in patients with Ushersyndrome type II. Am. J. Hum. Genet. 74, 738–744
21 Le Hir, H. et al. (2003) How introns influence and enhance eukaryoticgene expression. Trends Biochem. Sci. 28, 215–220
22 Archibald, J.M. et al. (2002) The chaperonin genes of jakobid andjakobid-like flagellates: implications for eukaryotic evolution. Mol.Biol. Evol. 19, 422–431
23 Babenko, V.N. et al. (2004) Prevalence of intron gain over intron loss inthe evolution of paralogous gene families. Nucleic Acids Res. 32,3724–3733
24 Brett, D. et al. (2002) Alternative splicing and genome complexity.Nat. Genet. 30, 29–30
25 Kampa, D. et al. (2004) Novel RNAs identified from an in-depthanalysis of the transcriptome of human chromosomes 21 and 22.Genome Res. 14, 331–342
26 Thanaraj, T.A. et al. (2003) Conservation of human alternative spliceevents in mouse. Nucleic Acids Res. 31, 2544–2552
27 Mattick, J.S. and Gagen, M.J. (2001) The evolution of controlledmultitasked gene networks: the role of introns and other noncodingRNAs in the development of complex organisms. Mol. Biol. Evol. 18,1611–1630
28 Bejerano, G. et al. (2004) Ultraconserved elements in the humangenome. Science 304, 1321–1325
29 Johnson, J.M. et al. (2005) Dark matter in the genome: evidence ofwidespread transcription detected by microarray tiling experiments.Trends Genet. 21, 93–102
30 Graveley, B.R. (2001) Alternative splicing: increasing diversity in theproteomic world. Trends Genet. 17, 100–107
31 Castillo-Davis, C.I. et al. (2002) Selection for short introns in highlyexpressed genes. Nat. Genet. 31, 415–418
32 Eisenberg, E. and Levanon, E.Y. (2003) Human housekeeping genesare compact. Trends Genet. 19, 362–365
33 Katinka, M.D. et al. (2001) Genome sequence and gene compaction ofthe eukaryote parasite Encephalitozoon cuniculi. Nature 414, 450–453
34 Ares, M., Jr. et al. (1999) A handful of intron-containing genesproduces the lion’s share of yeast mRNA. RNA 5, 1138–1139
35 Douglas, S. et al. (2001) The highly reduced genome of an enslavedalgal nucleus. Nature 410, 1091–1096
36 Maxwell, E.S. and Fournier, M.J. (1995) The small nucleolar RNAs.Annu. Rev. Biochem. 64, 897–934
37 Maniatis, T. and Reed, R. (2002) An extensive network of couplingamong gene expression machines. Nature 416, 499–506
38 Vinogradov, A.E. (2001) Intron length and codon usage. J. Mol. Evol.52, 2–5
39 Castillo-Davis, C.I. et al. (2004) Accelerated rates of intron gain/lossand protein evolution in duplicate genes in human and mouse malariaparasites. Mol. Biol. Evol. 21, 1422–1427
40 Johnson, J.M. et al. (2003) Genome-wide survey of human alternativepre-mRNA splicing with exon junction microarrays. Science 302,2141–2144
41 Forterre, P. and Philippe, H. (1999) Where is the root of the universaltree of life? BioEssays 21, 871–879
42 Poole, A. et al. (1999) Early evolution: prokaryotes, the new kids on theblock. BioEssays 21, 880–889
43 Collins, L. and Penny, D. (2005) Complex spliceosomal organizationancestral to extant eukaryotes. Mol. Biol. Evol. 22, 1053–1066
44 Jurica, M.S. and Moore, M.J. (2003) Pre-mRNA splicing: awash in asea of proteins. Mol. Cell 12, 5–14
45 Jeffares, D.C. et al. (1998) Relics from the RNA world. J. Mol. Evol. 46,18–36
46 Giroux, M.J. et al. (1994) De novo synthesis of an intron by the maizetransposable element dissociation. Proc. Natl. Acad. Sci. U. S. A. 91,12150–12154
47 Coghlan, A. and Wolfe, K.H. (2004) Origins of recently gained intronsin Caenorhabditis. Proc. Natl. Acad. Sci. U. S. A. 101, 11362–11367
48 Sverdlov, A.V. et al. (2004) Preferential loss and gain of introns in 3 0
portions of genes suggests a reverse-transcription mechanism ofintron insertion. Gene 338, 85–91
49 Gilbert, W. (1978) Why genes in pieces? Nature 271, 501

Opinion TRENDS in Genetics Vol.22 No.1 January 200622
50 Fink, G.R. (1987) Pseudogenes in yeast? Cell 49, 5–651 Poole, A.M. et al. (1998) The path from the RNA world. J. Mol. Evol.
46, 1–1752 Derr, L.K. and Strathern, J.N. (1993) A role for reverse transcripts in
gene conversion. Nature 361, 170–17353 Roy, S.W. and Gilbert, W. (2005) The pattern of intron loss. Proc. Natl.
Acad. Sci. U. S. A. 102, 713–718
Endea
the quarterly magaziand philosophy
You can access EndeScienceDirect, whecollection of beaut
articles on the historreviews and edito
featuri
Selling the silver: country house libraries and the hisCarl Schmidt – a chemical tourist in V
The rise, fall and resurrection of gMary Anning: the fossilist as
Caroline Herschel: ‘the unqScience in the 19th-century
The melancholy of an
and comin
Etienne Geoffroy St-Hillaire, Napoleon’s Egyptian camLosing it in New Guinea: The voyage o
The accidental conservatPowering the porter bre
Female scientists in fi
and much, muc
Locate Endeavour on ScienceDirect
www.sciencedirect.com
54 Keeling, P.J. and Fast, N.M. (2002) Microsporidia: biology andevolution of highly reduced intracellular parasites. Annu. Rev.Microbiol. 56, 93–116
55 Baldauf, S.L. et al. (2000) A kingdom-level phylogeny of eukaryotesbased on combined protein data. Science 290, 972–977
56 Abrahamsen, M.S. et al. (2004) Complete genome sequence of theapicomplexan, Cryptosporidium parvum. Science 304, 441–445
vour
ne for the historyof science
avour online viare you’ll find aifully illustratedy of science, bookrial comment.
ng
tory of science by Roger Gaskell and Patricia Faraictorian Britain by R. Stefan Ross
roup selection by M.E. Borelloexegete by T.W. Goodhueuiet heart’ by M. Hoskinzoo by Oliver Hochadelatomy by P. Fara
g soon
paign and a theory of everything by P. Humphriesf HMS Rattlesnake by J. Goodmanionist by M.A. Andreiwery by J. Sumner
lms by B.A. Jones
h more . . .
(http://www.sciencedirect.com)