
Mathematical Biology: I. An Introduction, Third ... - CiteSeerX
Upload
khangminh22Category
view
0download
0
MEDICINEAND BIOLOGYIEEE ENGINEERING IN
Magazine
VOLUME 26 • NUMBER 1 ■ http://EMB-Magazine.bme.uconn.edu ■ JANUARY/FEBRUARY 2007


15 Respiratory Sound Analysis Zahra M.K. Moussavi
16 Computerized Multichannel Lung Sound Analysis Raymond Murphy
20 Separating Heart Sounds from Lung SoundsJanuary Gnitecki and Zahra M.K. Moussavi
30 Empirical Mode Decomposition and Fractal Dimension FilterLeontios J. Hadjileontiadis
40 Crackle Sounds Analysis by Empirical Mode DecompositionSonia Charleston-Villalobos, Ramón González-Camarena, Georgina Chi-Lem,and Tomás Aljama-Corrales
48 Modeling Human Respiratory ImpedanceBill Diong, Homayoun Nazeran, Patricia Nava, and Michael Goldman
56 Acoustical Respiratory FlowAzadeh Yadollahi and Zahra M.K. Moussavi
62 Smart Smooth Muscle Spring-Dampers Ricardo L. Armentano, Juan Gabriel Barra, Franco Martin Pessana, Damian O. Craiem, Sebastián Graf, Daniel Bia Santana, and Ramiro A. Sánchez
1IEEE ENGINEERING IN MEDICINE AND BIOLOGY MAGAZINE JANUARY/FEBRUARY 2007
VOLUME 26 • NUMBER 1JANUARY/FEBRUARY 2007http://EMB-Magazine.bme.uconn.edu MEDICINEAND BIOLOGY
IEEE ENGINEERING IN
Magazine
Themes
Features
RESPIRATORY SOUND ANALYSIS
© BRAND X PICTURES, TECH POOL STUDIOS
IEEE ENGINEERING IN MEDICINE AND BIOLOGY MAGAZINE JANUARY/FEBRUARY 20072
NOTES FOR CONTRIBUTORSComing AttractionsFuture issues of the magazine will have the themes of Teaching Engineeringin Medicine and Biology. Tissue Engineering, Biotechnology, and WearableSensors/Systems and Their Impact on BME. Contributions on theme topicsare invited. Other technical articles and feature stories of interest to biomed-ical engineers are also welcome. All articles are submitted anonymously forpeer review. Letters to the editor, notes, commentaries, and other pieces ofpersonal opinion will be published as such. We also seek press releases relatedto activities in your company, organization, or school.
Manuscripts are ONLY accepted in electronic format through ManuscriptCentral at the Web site http://embs-ieee.manuscriptcentral.com. Instructions forcreating an account and how to electronically submit a manuscript are availableat the Web site. Do not send original submissions or revisions directly to theEditor-in-Chief. If you are unable to submit your contribution electronically orhave questions on manuscripts style, please contact the Editor-in-Chief: Dr.John D. Enderle, Biomedical Engineering Director, University of Connecticut,260 Glenbrook Road, Storrs, CT 06269-2247. Voice: +1 860 486 5521. Fax:+1 860 486 2500. E-mail: [email protected].
As per IEEE policy on standards for publications, review and editorialhandling of manuscripts are part of the paper submision process to guaranteequality control.
Make the DeadlineIn order to have your news published in the magazine in a timely fashion,please submit your notices to the editor by the following dates:
Issue DeadlineJan/Feb October 1Mar/April December 1May/June February 1July/Aug April 1Sep/Oct June 1Nov/Dec August 1
IEEE Engineering in Medicine & Biology Magazine (ISSN 0739-5175) (IEMBDE) is pub-lished bimonthly by The Institute of Electrical and Electronics Engineers, Inc., IEEEHeadquarters: 3 Park Ave., 17th Floor, New York, NY 10016-5997. NY Telephone +1 212419 7900. NY Telecopier +1 212 752 4929. NY Telex: 236-411 (International messagesonly). IEEE Service Center (for orders, subscriptions, address changes, EducationalActivities, Region/Section/Student Services): 445 Hoes Lane, Piscataway, NJ 08854. NJTelephone: +1 732 981 0060. Price/Publication Information: Individual copies: IEEEMembers $10.00 (first copy only), nonmembers $20.00 per copy. (Note: add $4.00 postageand handling charge to any order from $1.00 to $50.00, including prepaid orders). $5.00 peryear (included in Society fee) for each member of the IEEE Engineering in Medicine andBiology Society. Member and nonmember subscription prices available on request.Available in microfiche and microfilm. Copyright and Reprint Permissions: Abstractingis permitted with credit to the source. Libraries are permitted to photocopy beyond the lim-its of U.S. Copyright Law for private use of patrons: (1) those post-1977 articles that carrya code at the bottom of the first page, provided the per-copy fee indicated in the code ispaid through the Copyright Clearance Center, 222 Rosewood Drive, Danvers, MA 01923USA; (2) pre-1978 articles without fee. For all other copying, reprint, or republicationinformation, write to: Copyrights and Permission Department, IEEE Publishing Services,445 Hoes Lane, Piscataway, NJ 08854 USA. Copyright © 2003 by the Institute ofElectrical and Electronics Engineers, Inc. All rights reserved. Printed in U.S.A. Periodicalspostage paid at New York, NY and at additional mailing offices. Postmaster: Send addresschanges to IEEE Engineering in Medicine & Biology Magazine, IEEE, 445 Hoes Lane,Piscataway, NJ 08854 USA.
Printed in USA
NOTES FOR CONTRIBUTORSIEEE Engineering in Medicine and Biology Magazine is a theme-article publica-tion that covers the full range of fields within biomedical engineering (BME),with each issue covering one theme. Articles are written for technically knowl-edgeable readers who are not necessarily specialists in the theme topic. A sam-ple list of theme topics of interest includes: biochemical engineering,biocontrols, bioinformatics, biomems, biomaterials, biomechanics, biosignalprocessing, biotechnology, cellular and tissue engineering, clinical engineering,imaging and image processing, information technology, instrumentation, sensorsand measurements, micro- and nanotechnolgy, neural systems and engineering,physiological systems modeling, proteomics, radiology, rehabilitation engineer-ing, robotics in surgery, and telemedicine. In addition to the theme articles,which are invited contributions, the magazine also publishes unsolicited featuresthat are of interest to a broad segment of IEEE Engineering in Medicine andBiology Magazine readers.
IEEE Engineering in Medicine and Biology Magazine also publishes over 20regularly scheduled columns for readers interested in industry, academia, andgovernment. All articles are peer reviewed and written by experts in the field.On occasion, the magazine publishes comprehensive, in-depth review, tutorial,and survey articles. Letters to the editor, notes, commentaries, and other piecesof personal opinion will be published as such. We also seek press releasesrelated to activities in your company, organization, or school.
Manuscripts are ONLY accepted in electronic format through ManuscriptCentral at the Web site http://embs-ieee.manuscriptcentral.com. Instructions forcreating an account and how to electronically submit a manuscript are available atthe Web site. Do not send original submissions or revisions directly to the editor-in-chief. If you are unable to submit your contribution electronically or have ques-tions on manuscripts style, please contact the editor-in-chief: John D. Enderle,Program Director for Biomedical Engineering, University of Connecticut, Room217, 260 Glenbrook Road, Storrs, CT 06269-2247 USA. Voice: +1 860 486 5521.Fax: +1 860 486 2500. E-mail: [email protected].
As per IEEE policy on standards for publications, review and editorialhandling of manuscripts are part of the paper submision process to guaranteequality control.
Make the DeadlineIn order to have your news published in the magazine in a timely fashion,please submit your notices to the editor by the following dates:
Issue DeadlineJan/Feb September 1Mar/Apr November 1May/June January 1July/Aug March 1Sep/Oct May 1Nov/Dec July 1
IEEE Engineering in Medicine and Biology Magazine (ISSN 0739-5175) (IEMBDE) ispublished bimonthly by The Institute of Electrical and Electronics Engineers, Inc., IEEEHeadquarters: 3 Park Ave., 17th Floor, New York, NY 10016-5997. NY Telephone +1 212419 7900. NY Telecopier +1 212 752 4929. NY Telex: 236-411 (International messagesonly). IEEE Service Center (for orders, subscriptions, address changes, EducationalActivities, Region/Section/Student Services): 445 Hoes Lane, Piscataway, NJ 08854. NJTelephone: +1 732 981 0060. Price/Publication Information: Individual copies: IEEEMembers $20.00 (first copy only), nonmembers $63.00 per copy. Subscriptions: $5.00 peryear (included in Society fee) for each member of the IEEE Engineering in Medicine andBiology Society. Nonmember subscription prices available on request. Available in micro-fiche and microfilm. Copyright and Reprint Permissions: Abstracting is permitted withcredit to the source. Libraries are permitted to photocopy beyond the limits of U.S.Copyright Law for private use of patrons: (1) those post-1977 articles that carry a code atthe bottom of the first page, provided the per-copy fee indicated in the code is paid throughthe Copyright Clearance Center, 222 Rosewood Drive, Danvers, MA 01923 USA; (2) pre-1978 articles without fee. For all other copying, reprint, or republication information, writeto: Copyrights and Permission Department, IEEE Publishing Services, 445 Hoes Lane,Piscataway, NJ 08854 USA. Copyright © 2007 by the Institute of Electrical and ElectronicsEngineers, Inc. All rights reserved. Printed in U.S.A. Periodicals postage paid at New York,NY and at additional mailing offices. Postmaster: Send address changes to IEEEEngineering in Medicine and Biology Magazine, IEEE, 445 Hoes Lane, Piscataway, NJ08854 USA.
Printed in USA
Mission StatementThe Engineering in Medicine and Biology Society of theIEEE advances the application of engineering sciences andtechnology to medicine and biology, promotes the profes-sion, and provides global leadership for the benefit of itsmembers and humanity by disseminating knowledge, settingstandards, fostering professional development, and recogniz-ing excellence.
4 From the EditorWishing the Best for Everyone in the New Year!
6 President’s MessageState of the EMBS
7 Society NewsBenefits of Membership
10 Around the WorldStrengthening BME in Southeast Asia
11 Student’s CornerReflections on the 2006 AnnualConference
13 GOLDNew York City’s EMBS-GOLD NetworkingReception
71 PatentsThe Case of the Secret Sale
72 Engineering in GenomicsEnsemble-Based RNA Secondary Structure Characterization
87 Government AffairsInteroperability: The Cure for What Ails Us
91 Regulatory AffairsFDA-Regulated Validation in Clinical andNonclinical Environments
97 Book Reviews
102 Conference Calendar
107 2006 Annual Index
Departments

4
From the Editor
John Enderle
IEEE ENGINEERING IN MEDICINE AND BIOLOGY MAGAZINE JANUARY/FEBRUARY 2007
wishing the best for everyone in the new year!
Iwish to extend my best wishes to allfor a Happy New Year! This yearshapes up to be an exciting one withgreat issues like this on respiratory
sound analysis put together by GuestEditor Zahra Moussavi. Following thisissue, there will be issues on machinelearning, recent technologicaladvances in Europe, optical imaging,and E-health.
As some of you know, I havebeen involved in accreditation ofbiomedical engineering programs inthe United States for over ten yearsas program evaluator, and for thepast three years as a member of theEngineering Accreditation Commis-sion and Team chair. This coming
fall, our BME program at UConnwill undergo our first accreditationvisit, along with the next generalreview of the rest of the programsin the School of Engineering. Ithought I would share my personalexperiences in preparing for anaccreditation visit in this columnthroughout this year. For some, ourexperiences will be of little value,but my guess is that for many, someof the issues discussed will be ofgreat value given the number ofnew BME BS degree programs inthe United States that will be goingthrough an accreditation visit in thefuture. A few years ago, a numberof program evaluators published an
article on the ABCs of having a suc-cessful accreditation visit [1]. Areader interested in learning moreabout the accreditation processshould consult that article. Here, Iwill focus on issues pertinent to ourparticular program.
Our BME program was started in2001 with accreditation in mindwhen developing the curriculum.While a program has the ability todecide what BME flavor they wishto be, there are still minimum curric-ular requirements for accreditationthat must be met (criterion 1-7). Wealso developed and used our first setof program educational objectives atthe start of the program. Rather than
IEEE ENGINEERING IN MEDICINE AND BIOLOGY MAGAZINE IEEE PERIODICALS MAGAZINES DEPARTMENT
Editorial Correspondence: Address to John D. Enderle, Program Director for Biomedical Engineering, University of Connecticut, Room 223 B, 260 Glenbrook Road,U-2157, Storrs, CT 06269-2157 USA. Voice: +1 860 486 5521. Fax: +1 860 486 2500. E-mail: [email protected] in: Current Contents (Clinical Practice), Engineering Index (Bioengineering Abstracts), Inspec, Excerpta Medica, Index Medicus, MEDLINE, RECALInformation Services, and listed in Citation Index.
All materials in this publication represent the views of the authors only and not those of the EMBS or IEEE.
Senior Managing EditorGeraldine Krolin-Taylor
Art DirectorJanet Dudar
Asst. Art DirectorGail A. Schnitzer
Business Development ManagerSusan Schneiderman+1 732 562 [email protected]: +1 732 981 1855
Senior Advertising Production CoordinatorCathline Tanis
Production DirectorRobert Smrek
Editorial DirectorDawn Melley
Staff Director, Publishing OperationsFran Zappulla
Editor-in-ChiefJohn EnderleUniversity of Connecticut
Editorial BoardHojjat AdeliThe Ohio State UniversityHoward I. BassenFood and Drug AdministrationKrzysztof J. CiosUniv. of Colorado at Denver andHealth Sciences CenterPouran FaghriUniversity of ConnecticutLimin LuoSoutheast University, NanjingJasjit SuriBiomedical Technologies Inc.Eugene VeklerovLawrence Berkeley Laboratory
Associate EditorsA Look At Jean-Louis CoatrieuxUniversity of Rennes, FranceBook ReviewsPaul KingVanderbilt University
Cellular & Tissue EngineeringNenad BursacDuke UniversityClinical EngineeringStephen L. GrimesGENTECHCOMARDennis BlickIndependent ConsultantEmerging TechnologiesDorin PanescuSt. Jude MedicalFaces and PlacesAndrew SzetoSan Diego State UniversityGenomicsHarold (Skip) GarnerUniversity of TexasSouthwestern Medical Ctr.Government AffairsLuis KunNational Defense UniversityIndustry AffairsSemahat DemirNational Science FoundationIssues in EthicsJohn FielderVillanova University
International NewsJohn WebsterUniversity of Wisconsin, MadisonPatentsMaurice M. KleeFairfield, CTPoint of ViewGail BauraKeck Graduate Institute,Claremont, CARegulatory IssuesRobert MunznerDoctorDevice.comGrace BartooInstrumentation for Scienceand MedicineRetrospectroscopeL.A. GeddesPurdue UniversitySenior DesignJay GoldbergMarquette UniversitySociety NewsJorge MonzonUniversidad Nacional delNordesteStudent ActivitiesJennifer FlexmanUniversity of Washington
IEEE ENGINEERING IN MEDICINE AND BIOLOGY MAGAZINE JANUARY/FEBRUARY 2007 5
wait until the year before our firstaccreditation visit as some new pro-grams do, we began to develop ourassessment and evaluation processbased on direct measures shortlyafter the start of the program.
The process for assessing our pro-gram outcomes involved the use ofrubrics to minimize work over thelong term. While developing ourown rubrics, I attended a presenta-tion on rubrics for BME programassessment and evaluation by JohnGassert at an ASEE meeting.Combined with our own work, weborrowed, with permission, many ofthe nuggets contained in John's pre-sentation to fine tune our rubrics. Beaware that the development ofassessment and evaluation rubrics isa large task that needs to be tailoredto an individual program, and ittakes a lot of work to do it right. We
field tested the rubrics on a smallsample of student work in 2004 anddiscovered parts of the process didnot work as desired. Our goal was tohave an efficient process that wasrobust enough to yield the results toallow us to make curricular changes,but required a minimum amount oftime. After another revision, ourrubrics were used on statistical sam-ple of direct measure of studentwork in 2005-2006. It worked verywell and we are in the process ofmaking some revisions to the rubricsfor application in 2006-2007.
According to ABET policies, aprogram can go through an accredi-tation visit as long as it has at leastone graduate. Because we had trans-fer students into the program, wecould have undergone accreditationvisit a few years ago, but we decid-ed to wait to make sure all our
assessment processes were in placeand we completed a cycle of evalua-tion of our program educationalobjectives. My guess is that if wehad put our program up for reviewtoo early, we would have run therisk of significant shortcomingswith “a not to accredit decision.”The second reason for delay wasthat we would have had to repeat allthe work over again for our nextgeneral review in 2007.
In the next column, I will discussthe school wide effort in preparing foran accreditation visit.
Until the next time,John Enderle
[1] J.D. Enderle, J. Gassert, S.M. Blanchard, P.King, D. Beasley, P. Hale, Jr., and D. Aldridge, “TheABCs of Preparing for ABET,” IEEE Eng. Med.Biol. Mag., vol. 22, no. 4, pp. 122-132, 2003.
6 IEEE ENGINEERING IN MEDICINE AND BIOLOGY MAGAZINE JANUARY/FEBRUARY 2007
President’s Message
state of the EMBS
Iwelcome this opportunity to write toyou for the first time as president ofthe IEEE Engineering in Medicineand Biology Society (EMBS),
reporting on the state of our Society.The EMBS is doing well on manyfronts, including conferences, publica-tions, membership, and finances. Ourcurrent success has not occurred byaccident but rather through the dedicat-ed efforts of the Executive Committeeunder the leadership of outgoingPresident Yongmin Kim, theAdministrative Committee, and theEMBS Executive Office staff (LauraWolf and Jodi Strock). This success isalso thanks to the participation andsupport of volunteer members. It is notcoincidental that the four areas men-tioned—conferences, publications,membership, and finances—are in factthe purviews of our four vice-presi-dents—Zhi Pei Liang, Bin He, JorgeMonzon, and Craig Hartley. All haveundertaken enormous challenges withvery positive results.
ConferencesOur 2006 conference in New York Citywas a success by all measures, with1,752 accepted papers, a keynoteaddress, and seven plenary presenta-tions. The quality of papers and presen-tations was high. This conference builtupon the strengths and successes of ourconferences over the past few years.While always having broad-based inter-national membership, the EMBS didnot hold a meeting outside the UnitedStates until the 1992 meeting in Paris,followed shortly by the 1995, 1996, and1998 meetings in Montreal, Am-sterdam, and Hong Kong. More recent-ly, EMBS leadership has decided toestablish a pattern of holding the annualinternational conference outside theUnited States on a regular basis, withintervening meetings geographically
rotating within the United States tofacilitate attendance of as many mem-bers as possible. The 2001 meeting washeld in Istanbul, 2002 in Houston, 2003in Cancun, 2004 in San Francisco, 2005in Shanghai, and 2006 in New York.We are all looking forward to the 2007meeting in Lyon, France, for whichplans are well underway. The 2008meeting will be in Vancouver, while the2009 event will be in Minneapolis.
PublicationsOur publications continue to do well andare holding their own in terms of prof-itability in spite of the many challengesthat have arisen with electronic publish-ing and open access. Impact factorshave improved for IEEE Transactionson Biomedical Engineering and IEEETransactions on Neural Systems andRehabilitation Engineering; they remainsteady for IEEE Transactions onInformation Technology in Biomedicineand IEEE Engineering in Medicine andBiology Magazine. Among EMBScosponsored publications, IEEETransactions on Medical Imaging hasthe highest impact factor of all IEEEjournals, and IEEE Transactions onNanobioscience is doing well with agood impact factor. The EMBS is acosponsor of the IEEE Circuits andSystems Society’s newly approvedIEEE Transactions on BiomedicalCircuits and Systems.
MembersWhile many professional organizationsare losing membership, including theIEEE, the EMBS has had a modestincrease in membership over the lastyear. In addition, the number of localChapters grew by an amazing 50 newChapters in 2006 due to the efforts of adedicated volunteer member, NathalieGosset. We hope that these newChapters will add value to our member-
ship, particularly to industrial memberswho often are unable to attend ourannual conference. Information onforming and sustaining Chapters can befound at http://www.thewisesource.org/chapterwisdom/.
FinancesThe EMBS is also doing wellfinancially, with steadily increasingreserves due to our stable publicationincome, our increasingly profitable con-ferences, and prudent societal spendingpractices. We must, however, continueto be vigilant due to future uncertaintiesin shifting publication revenue as wellas unexpected events that may affectconferences.
ChallengesWhile maintaining our traditionalactivities, the EMBS needs to focus onsegments of our membership that wemay not be fully serving through ourcurrent activities. These include ourindustrial members, who constitutemore than 40% of our membership. Inthe coming year, we will focus on cre-ating higher visibility for Chapteractivities on the EMBS Web site,including details on ways in which theEMBS can help local Chapters, such asthe Distinguished Lecturer Program.This program provides 2:1 matchingfunds for speakers from the approvedlist for local Chapter meetings (http://www.embs.org/distlect.html). We alsoneed input from industrial membersregarding specific ways that the EMBScan add value to their professionallives. Please e-mail me ([email protected]) with any suggestions.
The IEEE is also focusing attentionon industry-based members by modify-ing the qualifications for attaining IEEE
Donna Hudson
(continued on page 8)
IEEE ENGINEERING IN MEDICINE AND BIOLOGY MAGAZINE JANUARY/FEBRUARY 2007 7
benefits of membership
Chapter development was thehallmark of IEEE Engineer-ing in Medicine and BiologySociety (EMBS) growth in
2006. We almost doubled the numberof EMBS Chapters around the world.And by using Chapter structures as thenecessary tools, we will devote 2007 to membership development. Moremembers mean more services and astronger Society.
For 2006, IEEE higher grade andSociety memberships showed someweakness. Fortunately, the EMBS isamong the 16 (out of 39) Societiesshowing growth over the previous year.The overall change in EMBS member-ship was a 3.3% increase (2.3%increase in higher grade members and10.1% in student members), up to atotal of 7,997 members. Although posi-tive, let us agree that these are modestfigures. Our Society needs to growstronger. I encourage every EMBSmember to become a recruiter. We mustdemonstrate to our colleagues or fellowclassmates the benefits of EMBSmembership.
Benefits, as the IEEE points out, canbe summarized as bringing togetherknowledge, community, and profes-sion. The EMBS is the world’s largestmember-based biomedical engineeringsociety, providing members withaccess to the most essential academic,professional, and technical informa-tion, networking opportunities, andcareer development tools, as well asmany other exclusive benefits. Corebenefits include staying current withthe fast-changing world of technologythrough our sponsored publications—IEEE Engineering in Medicine andBiology Magazine (available to everymember), IEEE Transactions onBiomedical Engineering (the oldestand largest refereed journal in biomed-ical engineering), IEEE Transactions
on Neural Systems and RehabilitationEngineering, and IEEE Transactionson Information Technology inBiomedicine—or our cosponsoredpublications—IEEE Transactions onMedical Imaging and IEEE Trans-actions on NanoBioscience, amongothers. Members can network andengage with others in the local com-munity through technical meetings atthe Section or Chapter level or partici-pate in regional and international activ-ities such as summer schools, specialtopic conferences, or the EMBSAnnual Conference.
We illustrate some recruitment bestpractices that can be followed by ourmembers everywhere.
Section/Chapter Meetings➤ Advertise Section and Chapter
events effectively. Get your eventcovered in a local newspaper. Ifpeople see your advertisement, itmay spark their interest in attend-ing your event and joining theSociety.
➤ Bring a friend or colleague to aSection or Chapter meeting.
➤ Include membership recruitmentreminders in Section and Chapternewsletters.
➤ Plan joint Section/Chapter activitieswith student branches. Highlightcareer discussion exchanges withstudents and also emphasize theimportance of continued member-ship after graduation.
➤ Demonstrate the capabilities ofIEEE Xplore at Chapter meetings.
Students/GOLD➤ Initiate Graduates of the Last
Decade (GOLD) affinity groups inSections to foster a greater sense ofbelonging for young professionalswhile also providing these memberswith leadership opportunities.
➤ Contact graduating students andinvite them to a Chapter meeting.Form a committee comprised ofmembers from various EMBSemployers in the area, available toact as company liaisons or mentorsfor these new members.
➤ Contact a representative at a localcollege or university to announcespecial EMBS student rates andnetworking or career growthopportunities.
➤ Sponsor a job fair or career work-shop and invite graduating studentmembers to network and learn ofthe values of EMBS membership.
Recruitment Promotions➤ Aggressively promote EMBS
membership during technicalconferences. Distribute member-ship applications to conferenceattendees.
➤ Use the half-year dues period as apeak recruitment time. This allowspeople to test membership for asmaller initial monetary outlay. Newmembers pay half-year dues whenthey sign up from 1 March through31 August. Services commenceimmediately upon joining and con-tinue through December of that year.
➤ Announce and provide informationon the Member-Get-a-Member andStudent-Get-a-Student Programs at Section, student branch, andChapter meetings.
➤ Use the Conference MembershipRecruitment Program to offer a freeSociety membership to anyone whojoins the IEEE at a conference. Thisprogram runs from 1 Septemberthrough 15 August.
➤ Run programs concurrently withnational or local engineering events(National Engineers Week in theUnited States, for example). IEEESections and EMBS Chapters can
Jorge E. Monzon
Society News
8 IEEE ENGINEERING IN MEDICINE AND BIOLOGY MAGAZINE JANUARY/FEBRUARY 2007
Society News (continued)
sponsor exhibits, local science fairs, andcontests to promote these events.
Professional Setting➤ With company permission, post
notices of IEEE and EMBS activi-ties on office bulletin boards andelectronic communications. Submitarticles on employee EMBSinvolvement and show how thiscan reap benefits for the companyas well.
➤ Conduct a Professional SocietyDay and have a table exhibit ofIEEE/EMBS benefits and services,such as continuing educationcourses and Standards committeeparticipation.
➤ Share positive EMBS experienceswith your colleagues during profes-sional meetings. This will showpotential members what EMBSmeans to you.
➤ Plan national engineering days andweek-long celebration displays
and exhibits for local schools andbusinesses.
We also encourage these retentionbest practices.➤ Train Chapter officers to give mini-
presentations on membership value. ➤ Invite students and Life Members to
take an active role and participate inthe unit’s membership developmentprograms and activities.
➤ Organize efforts to contact lapsedSociety members from amongthose who have renewed theirIEEE membership.
➤ Remind members who have notrenewed their membership of thebenefits that they will lose, in par-ticular, subscription to publications,IEEE Xplore’s easy access to thelatest technical information, profes-sional networking opportunities,conference discounts, technical pro-grams, and Standards activities.
➤ Have your Section's officers pro-vide your outreach volunteers
with the names of new membersto be contacted each month andinvited to attend Section/Chaptermeetings.
➤ Send out press releases praisinglocal employers who supportIEEE/EMBS membership and vol-unteer services.
➤ Sections and Societies can encour-age prospective members to attendtheir events by offering professionalseminars that help engineers toupgrade their skills or maintainlicensure. Develop a continuingeducation program to offer informa-tion on awarding continuing educa-tion units (CEUs) to engineers forattending a workshop, seminar,tutorial, or self-study course thatmeets their company's trainingrequirements.
Membership development strategiesrepresent a challenge for every EMBSmember, but also an opportunity togrow stronger.
President’s Message (continued from page 6)
Fel low s ta tus to recognize theentire spectrum of engineering dis-ciplines, from research to applica-tion-related fields, and to stimulatemore nominations of highly quali-fied application engineers and prac-ti t ioners. Details can be found athttp://www.ieee.org/web/aboutus/fel-lows/program_changes.html. We also
need to maintain and expand activitiesfor students who will become the nextgeneration of EMBS members andleaders. Our conferences include manyactivities for students, including thestudent paper competition, meetingswith leaders in biomedical engineer-ing, and tours of universities in thevicinity of the conference. The EMBS
is also participating in the IEEEGraduates of the Last Decade (GOLD)program (http://www.ieee.org/organi-zations/rab/gold/goldcomm16.html).The EMBS GOLD coordinator is LisaLazareck.
I welcome your comments and sug-gestions on ways in which the EMBScan better serve you.

» OVER 1 MILLION SCIENTIFIC DOCUMENTSEASILY WITHIN REACH, FROM IEEE
The IEEE Xplore® digital library opens the door to scientific/technical information you need — easily searchableand instantlyaccessible.
Any new patent application
or existing patent defense
must be built on a foundation
of solid research — and demands
comprehensive access to scientific
and technical literature. IEEE is
cited 7 times more frequently than
any other publisher in this realm.
And the IEEE Xplore® digital library
puts it all at your fingertips:
» Magazine and journal articles
» Conference papers
» Standards
» ...for a wide range of technologies including
electronics, computer hardware/software,
semiconductors, aerospace and defense,
telecommunications, medical devices, optics
and photonics, and others
You get instant access to high-quality, full-text documents.
Free keyword searching and unlimited viewing of basic
abstracts help you hone in on exactly what you need.
Then, purchase the documents you need immediately
online, via credit card. Or, subscribe to IEEE Enterprise,
a prepurchase plan offering 3 different subscription levels
based on your usage.
With IEEE Xplore®, your search is over.
Visit www.ieee.org/priorart to learn more and get started today.

10 IEEE ENGINEERING IN MEDICINE AND BIOLOGY MAGAZINE JANUARY/FEBRUARY 2007
Around the World
strengthening BME in southeast asia
AEurope Aid-funded projectwithin the well-known Asia Link Program—“Development of Core
Competencies in the Areas ofBiomedical and Clinical Engineering inthe Philippines and Indonesia”—isbeing hailed as one of the most success-ful human resource development pro-grams supported by the EuropeanCommission. Involving twoEuropean biomedical engi-neering (BME) academicinstitutions and two Asianpartners, the two-year projectis focused on providing post-graduates and young univer-sity faculty of De La SalleUniversity (DLSU) and theUniversity of Indonesia withpractical background andteaching skills to enablethem to initiate undergradu-ate and graduate courses inbiomedical and clinicalengineering.
The project’s objective isto provide the two Asianpartners with adequate train-ing (through intensive cours-es, seminars, workshops, andaccess to overseas courses and researchopportunities), sufficient skills, experi-ence, and know-how to enable them toset up BME courses contextualized forthe country’s particular needs.
The project was launched with akick-off workshop in Manila in April2005, attended by all partners and keyofficials from the Manila HealthService, World Health Organization(WHO) representatives, and Embassyand European Union staff. This wasfollowed by a series of intensive train-ing courses, attended by faculty mem-bers and health care professionals,
conducted over a 12-month period bythe European universities at the Asianuniversities. Over 100 books on bio-engineering, as well as specializedequipment, were also donated to theAsian universities.
Both DLSU and the University ofIndonesia, in addition to the projectimplementation, were able to set up acore team of competent and committed
faculty staff from different fields ofmedicine, engineering, and science.With the help of the European staff, thecore teams have started the develop-ment of a new curriculum for the BMEprograms, as well as the preparation ofcourse content and teaching materials.
An important milestone for the pro-ject was the involvement of other stake-holders outside the university, such asthe Ministry/Department of Health,industry, prominent health institutionsin the country, and faculty membersbelonging to other universities. In thePhilippines, in particular, preliminary
discussions are being held to discuss thecreation of the first BME society of thePhilippines. This is thanks to the enthu-siasm that the leading university is shar-ing with the other stakeholders on theimportance of creating professional fig-ures in this specific field.
Ongoing preparations are nowunderway for a series of research col-laborations in which eight members of
staff from DLSU and theUniversity of Indonesia willengage in biomedicalresearch in Europe. Themain purpose of theexchange and research col-laboration visit is toimmerse the candidates inthe role of biomedical engi-neer from a research andclinical point of view. Theresearch collaborations willpave the way for an interna-tional conference in Jakarta,which will be organizedbefore the end of the projectand will provide a venue toshare the success of the pro-ject with other scientists andprofessionals. Details willbe posted on the project
Web site (http://www.web.ing. unipi.it/didattica/es/home). Participants inter-ested in human resource developmentin the field of biomedical engineeringare encouraged to attend.
Those interested in attaining moreinformation should contact projectcoordinator Arti Ahluwalia (Universityof Pisa), [email protected];Mannan Mridha (Royal Institute ofTechnology, Stockholm) [email protected]; Nilo Bugtai (DLSU, Manila)[email protected]; or TresnaSoemardi (University of Indonesia,Jakarta) [email protected].
John Webster
The hand-over ceremony at DLSU in Manila. Prof. Gaspillo (left),dean of the Faculty of Engineering at DLSU, and Prof.Quebengo (right), DLSU president, are presented with booksand equipment donated by the University of Pisa by Prof.Ahluwalia, project coordinator (center).
IEEE ENGINEERING IN MEDICINE AND BIOLOGY MAGAZINE JANUARY/FEBRUARY 2007 11
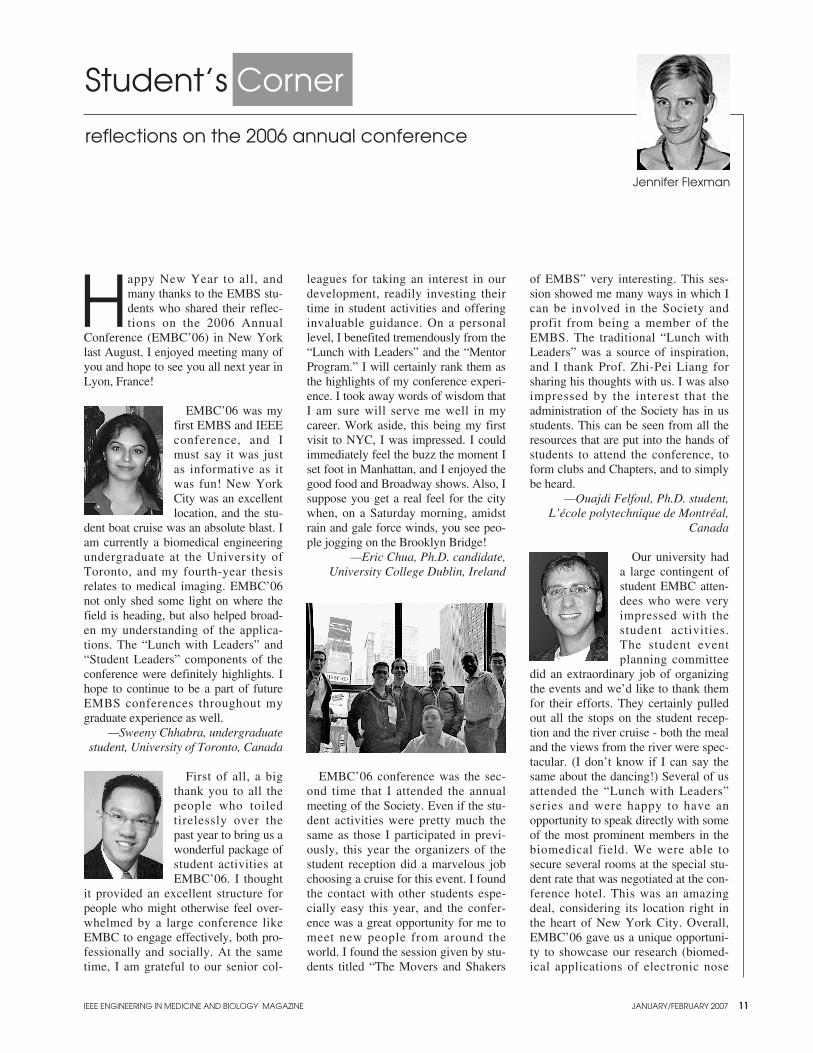
reflections on the 2006 annual conference
Happy New Year to all, andmany thanks to the EMBS stu-dents who shared their reflec-tions on the 2006 Annual
Conference (EMBC’06) in New Yorklast August. I enjoyed meeting many ofyou and hope to see you all next year inLyon, France!
EMBC’06 was myfirst EMBS and IEEEconference, and Imust say it was justas informative as itwas fun! New YorkCity was an excellentlocation, and the stu-
dent boat cruise was an absolute blast. Iam currently a biomedical engineeringundergraduate at the University ofToronto, and my fourth-year thesisrelates to medical imaging. EMBC’06not only shed some light on where thefield is heading, but also helped broad-en my understanding of the applica-tions. The “Lunch with Leaders” and“Student Leaders” components of theconference were definitely highlights. Ihope to continue to be a part of futureEMBS conferences throughout mygraduate experience as well.
—Sweeny Chhabra, undergraduatestudent, University of Toronto, Canada
First of all, a bigthank you to all thepeople who toiledtirelessly over thepast year to bring us awonderful package ofstudent activities atEMBC’06. I thought
it provided an excellent structure forpeople who might otherwise feel over-whelmed by a large conference likeEMBC to engage effectively, both pro-fessionally and socially. At the sametime, I am grateful to our senior col-
leagues for taking an interest in ourdevelopment, readily investing theirtime in student activities and offeringinvaluable guidance. On a personallevel, I benefited tremendously from the“Lunch with Leaders” and the “MentorProgram.” I will certainly rank them asthe highlights of my conference experi-ence. I took away words of wisdom thatI am sure will serve me well in mycareer. Work aside, this being my firstvisit to NYC, I was impressed. I couldimmediately feel the buzz the moment Iset foot in Manhattan, and I enjoyed thegood food and Broadway shows. Also, Isuppose you get a real feel for the citywhen, on a Saturday morning, amidstrain and gale force winds, you see peo-ple jogging on the Brooklyn Bridge!
—Eric Chua, Ph.D. candidate,University College Dublin, Ireland
EMBC’06 conference was the sec-ond time that I attended the annualmeeting of the Society. Even if the stu-dent activities were pretty much thesame as those I participated in previ-ously, this year the organizers of thestudent reception did a marvelous jobchoosing a cruise for this event. I foundthe contact with other students espe-cially easy this year, and the confer-ence was a great opportunity for me tomeet new people from around theworld. I found the session given by stu-dents titled “The Movers and Shakers
of EMBS” very interesting. This ses-sion showed me many ways in which Ican be involved in the Society andprofit from being a member of theEMBS. The traditional “Lunch withLeaders” was a source of inspiration,and I thank Prof. Zhi-Pei Liang forsharing his thoughts with us. I was alsoimpressed by the interest that theadministration of the Society has in usstudents. This can be seen from all theresources that are put into the hands ofstudents to attend the conference, toform clubs and Chapters, and to simplybe heard.
—Ouajdi Felfoul, Ph.D. student,L’école polytechnique de Montréal,
Canada
Our university hada large contingent ofstudent EMBC atten-dees who were veryimpressed with thestudent activities.The student eventplanning committee
did an extraordinary job of organizingthe events and we’d like to thank themfor their efforts. They certainly pulledout all the stops on the student recep-tion and the river cruise - both the mealand the views from the river were spec-tacular. (I don’t know if I can say thesame about the dancing!) Several of usattended the “Lunch with Leaders”series and were happy to have anopportunity to speak directly with someof the most prominent members in thebiomedical field. We were able tosecure several rooms at the special stu-dent rate that was negotiated at the con-ference hotel. This was an amazingdeal, considering its location right inthe heart of New York City. Overall,EMBC’06 gave us a unique opportuni-ty to showcase our research (biomed-ical applications of electronic nose
Jennifer Flexman
Student’s Corner

12 IEEE ENGINEERING IN MEDICINE AND BIOLOGY MAGAZINE JANUARY/FEBRUARY 2007
Student’s Corner (continued)
technology) to representatives from anumber of disciplines, including biolo-gy, chemistry, and industry scientists.
—Geoff Green, Ph.D. student,Carleton University, Canada
I believe thatEMBC’06 was agreat success. Thelocation was indeedoptimal, offeringaccess to almostevery means of pub-lic transportation
available in NYC as well as JFK air-port. I believe that the best studentactivity during EMBC’06 was the stu-dent welcome reception on theMajesty Yacht. The idea of a recep-tion dinner with a river cruise on theHudson River was brilliant! Whoevermissed it missed a great chance to seethe whole of Manhattan from a uniquepoint of view. I have been in NYConce in the past, and I thought NYCwouldn't have anything more to offerto me in terms of sightseeing. Now Iadmit that this experience was reallyworth a lot. Finally, for those whothink that nobody ever mentionsthings that went wrong or didn’t workduring such a conference, I have tosay that such things always happenand the organizing committee alwaysdoes its best. I really enjoyed peoplewho even thought they could not pre-sent their work (e.g., lost posters dur-
ing flights) as they didn’t lose theirexcellent sense of humor! I am look-ing forward to seeing all of you, bothorganizing committee members andparticipants, next summer at EMBC07in Lyon, France!
—Ilias Kitsas, graduate student,Aristotle University of Thessaloniki,
Greece
I became involvedwith the EMBS whenI saw the opportunityto start an EMBSstudent club at theUniversity of Water-loo during my under-graduate years. Havingpersonally experi-
enced the difficulties of starting a newclub—including the critical elementsof team building, securing resources,and organizing and promotingevents—I found the “Movers andShakers” session of good value. I tookhome excellent ideas from othergroups, and I hope more ideas fromsuccessful Chapters and clubs will bepresented in the future. The “BMECareers at a Glance” were excellentsessions. They were great opportuni-ties to learn about the diversity ofcareer paths possible through BME,and they provided me with an excel-lent overall perspective of the field.The boat cruise student reception wasa great way to see NYC from a differ-
ent perspective and a good chance tomeet some fantastic students from allaround the world. Finally, I recom-mend dropping by Katz’s Delicatessenwhen you are in NYC. Their delicious,juicy pastrami sandwiches, classicNYC atmosphere, and When HarryMet Sally connection make for a won-derful experience.
—Vincent Ling, Master’s student,University of Toronto, Canada
I had a great timein NYC, being able tomeet up with tons ofexperts in my field.Through attendingtheir inspiring talksand interacting withthem personally, new
ideas and directions were generated formy own research. It was definitely afruitful trip! I’m also very thankful toall the student helpers for organizingthe various activities. My friends and Ihad lots of fun on the dance floor dur-ing the NY Skyline View Cruise. TheDJ did a great job stirring up thecrowd. Last but not least, I’d like toexpress my gratitude for getting us thestudent-discounted rate at the confer-ence hotel. That’s pretty important forstudents like us! Can’t wait to meetmore of you next year in Lyon!
—Carmen Poon, Ph.D. student,The Chinese University of Hong Kong,
Hong Kong
IEEE ENGINEERING IN MEDICINE AND BIOLOGY MAGAZINE JANUARY/FEBRUARY 2007 13
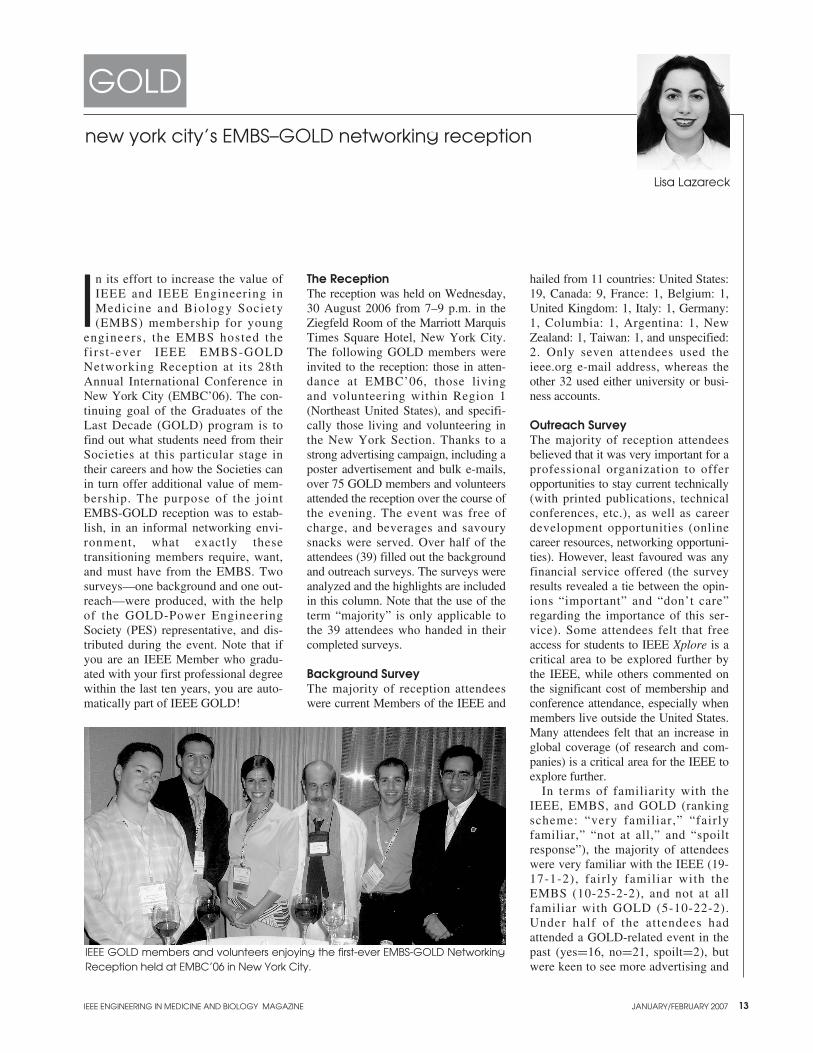
new york city’s EMBS–GOLD networking reception
In its effort to increase the value ofIEEE and IEEE Engineering inMedicine and Biology Society(EMBS) membership for young
engineers, the EMBS hosted thefirst-ever IEEE EMBS-GOLDNetworking Reception at its 28thAnnual International Conference inNew York City (EMBC’06). The con-tinuing goal of the Graduates of theLast Decade (GOLD) program is tofind out what students need from theirSocieties at this particular stage intheir careers and how the Societies canin turn offer additional value of mem-bership. The purpose of the jointEMBS-GOLD reception was to estab-lish, in an informal networking envi-ronment, what exactly thesetransitioning members require, want,and must have from the EMBS. Twosurveys—one background and one out-reach—were produced, with the helpof the GOLD-Power EngineeringSociety (PES) representative, and dis-tributed during the event. Note that ifyou are an IEEE Member who gradu-ated with your first professional degreewithin the last ten years, you are auto-matically part of IEEE GOLD!
The ReceptionThe reception was held on Wednesday,30 August 2006 from 7–9 p.m. in theZiegfeld Room of the Marriott MarquisTimes Square Hotel, New York City.The following GOLD members wereinvited to the reception: those in atten-dance at EMBC’06, those living and volunteering within Region 1(Northeast United States), and specifi-cally those living and volunteering inthe New York Section. Thanks to astrong advertising campaign, including aposter advertisement and bulk e-mails,over 75 GOLD members and volunteersattended the reception over the course ofthe evening. The event was free ofcharge, and beverages and savourysnacks were served. Over half of theattendees (39) filled out the backgroundand outreach surveys. The surveys wereanalyzed and the highlights are includedin this column. Note that the use of theterm “majority” is only applicable tothe 39 attendees who handed in theircompleted surveys.
Background SurveyThe majority of reception attendeeswere current Members of the IEEE and
hailed from 11 countries: United States:19, Canada: 9, France: 1, Belgium: 1,United Kingdom: 1, Italy: 1, Germany:1, Columbia: 1, Argentina: 1, NewZealand: 1, Taiwan: 1, and unspecified:2. Only seven attendees used theieee.org e-mail address, whereas theother 32 used either university or busi-ness accounts.
Outreach SurveyThe majority of reception attendeesbelieved that it was very important for aprofessional organization to offeropportunities to stay current technically(with printed publications, technicalconferences, etc.), as well as careerdevelopment opportunities (onlinecareer resources, networking opportuni-ties). However, least favoured was anyfinancial service offered (the surveyresults revealed a tie between the opin-ions “important” and “don’t care”regarding the importance of this ser-vice). Some attendees felt that freeaccess for students to IEEE Xplore is acritical area to be explored further bythe IEEE, while others commented onthe significant cost of membership andconference attendance, especially whenmembers live outside the United States.Many attendees felt that an increase inglobal coverage (of research and com-panies) is a critical area for the IEEE toexplore further.
In terms of familiarity with theIEEE, EMBS, and GOLD (rankingscheme: “very familiar,” “fairlyfamiliar,” “not at all,” and “spoiltresponse”), the majority of attendeeswere very familiar with the IEEE (19-17-1-2), fairly familiar with theEMBS (10-25-2-2), and not at allfamiliar with GOLD (5-10-22-2).Under half of the attendees hadattended a GOLD-related event in thepast (yes=16, no=21, spoilt=2), butwere keen to see more advertising and
Lisa Lazareck
GOLD
IEEE GOLD members and volunteers enjoying the first-ever EMBS-GOLD NetworkingReception held at EMBC’06 in New York City.
14 IEEE ENGINEERING IN MEDICINE AND BIOLOGY MAGAZINE JANUARY/FEBRUARY 2007
Gold (continued)
information pertaining to such eventsin the future.
The majority of attendees had readboth IEEE and EMBS publications andfound them very useful, with severalattendees wishing for an increase in freeaccess to their online counterparts.
Attendees were also asked to rankthe EMBS (ranking scheme: 1–5,with 1=outstanding) in seven differ-ent areas including: helping membersstay current technically; helpingmembers advance in their currentjob; and providing career develop-ment opportunit ies , networkingopportunities, volunteer opportuni-ties, useful products and services,and information that is relevant tothe needs of their current job.Overall, each area received a valuebetween 2.6 (good) and 3.0 (aver-age). Suggestions for “other areas ofcritical focus” included preparingstudents for nonacademic careers and
providing some form of graduate fel-lowship and/or studentships.
AcknowledgmentsThis reception would not have been sosuccessful if it weren’t for the supportof the EMBS Executive Office—Ms.Laura Wolf and Ms. Jodi Strock;EMBC’06 organizers—Dr. AtamDhawan, Dr. Andrew Laine, Dr. MetinAkay, and Dr. Ki Chon; GOLD ExecutiveOffice—Ms. Cathy Downer; GOLDChair—Mr. Darrel Chong; Past GOLDChair and GOLD-Society Interaction pro-ject leader—Mr. Gerald Anleitner; andGOLD Region and Society representa-tives. Mr. Anleitner and Mr. Soon Wan(Region 1 coordinator) also spearhead-ed the fundraising campaign, and theirconstant encouragement, interest, andopinions were very much appreciated.The volunteers of Region 1/New Yorkdid a superb job of advertising theevent, offering assistance and attending
the reception. And the GOLD membersattending the reception clearly support-ed the event by arriving and conversingwith a smile. This reception was finan-cially sponsored by the EMBS, GOLDRegion 1, and GOLD New YorkSection.
Reader…What are your thoughts regarding thesurvey results? Would you like to seeany of the above suggestions imple-mented in 2007? Also note that a sec-ond installment of the EMBS-GOLDNetworking Reception has been con-firmed for EMBC’07 in Lyon,France—tell your friends and col-leagues! As ever, your ideas, com-ments, and constructive criticismregarding what EMBS can do for youare most welcome. Please contact yourGOLD Coordinator Lisa Lazareck([email protected]). Shewould love to hear from you!
>>IEEE ENTERPRISEdelivers desktop access to articlesand papers from IEEE magazines,journals, transactions and confer-ence proceedings, at price levelsyour company can afford.
If your companyhad instant accessto the bestnew technologyresearch, howmuch more couldyou accomplish?
ASK FOR YOURFREE TRIAL TODAY:www.ieee.org/enterprise
IEEE ENGINEERING IN MEDICINE AND BIOLOGY MAGAZINE JANUARY/FEBRUARY 2007 15
RESPIRATO
RY SOU
ND
AN
ALYSIS
0739-5175/07/$25.00©2007IEEE
Respiratory Sound Analysis
Introduction for the Special Issue
ZAHRA M.K. MOUSSAVI
© BRAND X PICTURES, TECH POOL STUDIOS
The history of chest auscultation by unaided ears goesback to almost 2000 years ago. But the discovery anduse of respiratory lung sounds as indicators of healthand disease began with Laënnec, who formalized the
relationship between human pulmonary diseases and respi-ratory auscultation in 1819. He then invented stethoscopein 1921. Stethoscope enabled physicians to listen to respira-tory sounds of their patients and detect any symptomaticsigns. Modern technology can help physicians even morethese days. Breath sound analysis using digital signal pro-cessing techniques has recently drawn much attentionbecause of its diagnostic capabilities.
The articles in this special issue focus on how computer-ized respiratory sound analysis can quantify changes in lungsounds, store records of the measurements made, de-noisethe signals of interest from any artifacts and interference, andproduce graphical representations of characteristic featuresof the respiratory sounds to help with the diagnosis and treat-ment of patients suffering from lung diseases.
Ray Murphy reviews the combined use of stethoscopeand computerized lung sound analysis in the clinicalassessment of lung infectious diseases in the first paperpublished in this volume.
One issue of interest for both physicians and researchers inthis field is to find features which best describe the relation-ship between the respiratory flow and the lung sounds ofpatients compared to that of healthy individuals. Since lungsounds have relatively low frequency and low intensity, it iscrucial to remove the noise and other interfering sounds (i.e.,heart sounds) from the lung sounds prior to any diagnosticanalysis.
Many researchers around the world have been involved inthis research applying linear and nonlinear digital signal pro-cessing techniques to develop novel methods that removeadventitious sounds form the lung sound record. The paperby Gnitecki and Moussavi reviews a number of heart sound
cancellation methods, and the authors discuss some advan-tages and problems associated with different methods.
Adventitious lung sounds that are of diagnostic value includecrackles, wheezes, squawks, rhonchi, and stridor. Out of thesesounds, detection of crackles (both fine and coarse) is moreimportant because of its diagnostic values at the early stages ofdisease. Nowadays specialists rely on computer aided analysisto count the number of crackles at different locations of chest.Hence, this area of research is concerned with developing moreaccurate and efficient methods for detecting crackles. The nexttwo papers by Hadjileontiadis and Charleston et al. present twomethods for crackle detection using empirical mode decompo-sition and fractal dimension analysis.
Respiratory system modeling is another area of interestinvestigated from different perspectives. Some early worksfocused on deriving a mathematical model for crackles andacoustical models for sound transmission in respiratory systemwith the use of electrical circuits. Recent efforts have concen-trated on using impulse oscilimetry data to derive the electricalmodels of the lung. The paper by Diong et al. in this seriespresents an extended RIC model using impulse oscilimetrydata with promising prospects for disease detection.
Finally, Yadollahi and Moussavi address recent attempts byengineers to simplify the respiratory measurements in the lastpaper of this collection. Airflow measurement is almost alwaysnecessary in any respiratory sound assessment and recording.However, when dealing with children or patients with neurologicalimpairments, flow measurement devices are not easily applicable.For this reason, airflow estimation from the respiratory sounds hasreceived considerable attention in recent years. This article reviewsand validates the current airflow estimation techniques.
In summary, these six articles address some key researchissues in respiratory sound analysis. As this area continues toevolve rapidly, it is hoped that these articles serve researchersin developing more fully integrated diagnostic and assessmentsystems in both engineering and medicine.
16 IEEE ENGINEERING IN MEDICINE AND BIOLOGY MAGAZINE JANUARY/FEBRUARY 2007
Computerized MultichannelLung Sound Analysis
Development of Acoustic Instruments for Diagnosis and Management of Medical Conditions
BY RAYMOND MURPHY
© BRAND X PICTURES, TECH POOL STUDIOS
RESP
IRA
TORY
SO
UN
D A
NA
LYSI
S
0739-5175/07/$25.00©2007IEEE
The stethoscope has been so widely used by clinicians inthe diagnosis and management of patients’ illnesses thatit has virtually become a symbol of the medical profes-sion. Indeed, as pointed out by Reiser in Scientific
American, the invention of the stethoscope by Laënnec revolu-tionized medicine, changing it from an art to a science [1].Another revolution is now going on. Auscultation of the chestis now being computerized. One of the forces driving thiscomputerization is that it offers the promise of providingimproved instruments for noninvasive diagnosis, i.e., tools thatdo not invade the body or involve the harmful effects of radia-tion. Comprehensive reviews of the stethoscope’s use in aus-cultation of the lung and of the development of computerizedanalysis of lung sounds have been presented [2]–[4]. There arealso some more recent publications that report on employingadvanced signal processing techniques for the detection ofadventitious sounds that have been developed by a few groupsin the field of lung sounds research [6], [7]. This discussionwill focus on clinically important applications of this type ofinvestigation and, in particular, on the development of multi-channel lung sound analysis and its clinical importance.
The invention of the chest X ray had a large impact on theclinical utility of the stethoscope. There was no doubt that chestX rays were more reliable than auscultation with an acousticstethoscope in the detection of important lung diseases such astuberculosis and cancer. Physical examination of the chest alsosuffers from a variety of problems. Observer variability is aparticularly troublesome one as has been shown in numerousstudies. There are differences between clinicians in their educa-tion and in their use of nomenclature for sounds. There areeven differences in the importance they place on auscultation inthe first place. Consequently, it is difficult to know when anobservation is made whether it is accurate or not; thus, in themedical literature, a number of derogatory statements can befound about the stethoscope. In the 1961 edition of Rubin andRubin’s Textbook of Chest Medicine, the following quote canbe found: “The stethoscope is largely a decorative instrumentinsofar as its value in diagnosis of pulmonary diseases is con-cerned. Nevertheless, it occupies an important role in the art ofmedicine. Apprehensive patients with functional complaintsare often relieved when they feel the chest piece on their pec-toral muscles” [5]. There was even a radiologist who had a
framed stethoscope on the wall of a hospital in Boston underwhich was the following caption: “This is a stethoscope, aninstrument formerly used in the diagnosis of lung diseases.”One of the most famous investigators into the physiologyunderlying respiratory sounds, Paul Forgacs, claimed that aus-cultation had been reduced to a perfunctory ritual [8].
Despite these problems and opinions, the stethoscoperemains one of the most common devices used by medical pro-fessionals. Physicians, nurses, and respiratory therapists rou-tinely use stethoscopes in their daily practice to assessconditions that affect the lung. But as noted, its reliability is inquestion, presenting a paradox: an unreliable tool that everyoneuses. Modern medical science has developed a host of moreobjective methods for the diagnosis and management of lungconditions. These include computed tomography (CT) scans,magnetic resonance imaging, chest X rays, a variety of bloodtests, sophisticated pulmonary function tests, pulmonary arteri-ography, and radioisotope scanning techniques. Biopsy of thelung is also used in some instances to make definitive diag-noses of lung conditions. The general opinion is that these testsare more reliable and valuable than auscultation via the stetho-scope. On the other hand, when a clinician is presented with apatient in severe acute respiratory distress, these tests are notlikely the first ones to be used. In this situation, the stethoscopein the hands of a knowledgeable clinician can provide informa-tion that can be life saving. Auscultation, particularly whencombined with the other modalities of physical diagnosis, canguide steps taken in patient management before any of theadvanced technologies are employed. Examples are as follows: ➤ a sound called stridor can be heard when foreign bodies are
in large airways (this is a potentially life threatening situa-tion, and action can be taken to remove the offending mate-rial once this sound is recognized, e.g., a Heimlichmaneuver can be performed)
➤ diffuse wheezing points toward a diagnosis of acutebronchial asthma and bronchodilators are often adminis-tered before other testing is done
➤ collapse of one lung can be detected by the absence or markeddecrease of lung sounds on one side; treatment for this condi-tion is often done immediately based on auscultatory findings
➤ fluid can be withdrawn from the pleural space reliablybased on physical findings
IEEE ENGINEERING IN MEDICINE AND BIOLOGY MAGAZINE JANUARY/FEBRUARY 2007
➤ the presence of numerous crackles on auscultation inpatients presenting with lung congestion secondary to heartfailure is used to guide the administration of medications toreduce the fluid prior to more definitive testing.
These clinical applications, in part, explain why the stetho-scope remains in common use despite its shortcomings.Computerized lung sound analysis has the potential of beingapplied in emergency situations such as the ones just describedto improve diagnostic accuracy.
An early application of computerized lung sound analysiswas an outgrowth of an observation that a group of pipecoverersexposed to asbestos as a result of working in a shipyard wasnoted to have an abnormal number of crackling noises on aus-cultation. Initial investigations employed an acoustic stetho-scope using a method of mapping the lung sounds at prescribedsites on the chest wall of the workers exposed directly toasbestos and comparing these findings to the findings in an agematched group of shipyard workers not directly exposed.Blinded auscultation, i.e., examinations in which the observerwas unaware of the exposure history, clearly showed that thepresence of fine end inspiratory crackles was significantly morecommon in workers directly exposed to asbestos [9]. Operatingon the belief that the sounds heard over the chest were not ran-dom events but reflected the pathophysiology of the underlyinglung and that if this information could be captured, it would beuseful in the development of powerful tools for diagnosis andmonitoring of cardiopulmonary conditions, a physician-engi-neering team began employing methods to make graphical dis-plays of the sounds. They began to apply modern technology tothe acoustical signal from the lung, in particular, advances inacoustical knowledge and computer science [10]. A series ofinvestigations to explore the utility of quantifying lung ausculta-tory phenomena began. There were a number of other investiga-tors worldwide with similar interests, and the International LungSounds Association was founded to promote investigation in thefield of medical acoustic research in 1976 [11]. (The 31st annualmeeting of this organization was held 6–7 October 2006).
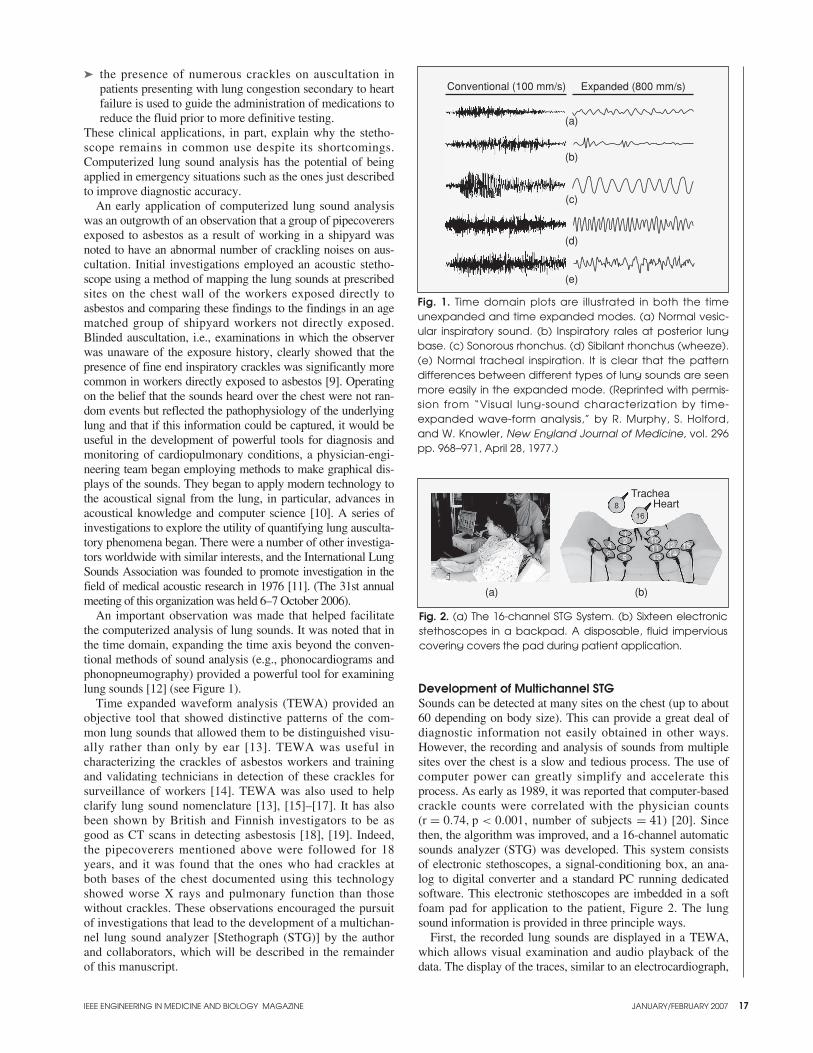
An important observation was made that helped facilitatethe computerized analysis of lung sounds. It was noted that inthe time domain, expanding the time axis beyond the conven-tional methods of sound analysis (e.g., phonocardiograms andphonopneumography) provided a powerful tool for examininglung sounds [12] (see Figure 1).
Time expanded waveform analysis (TEWA) provided anobjective tool that showed distinctive patterns of the com-mon lung sounds that allowed them to be distinguished visu-ally rather than only by ear [13]. TEWA was useful incharacterizing the crackles of asbestos workers and trainingand validating technicians in detection of these crackles forsurveillance of workers [14]. TEWA was also used to helpclarify lung sound nomenclature [13], [15]–[17]. It has alsobeen shown by British and Finnish investigators to be asgood as CT scans in detecting asbestosis [18], [19]. Indeed,the pipecoverers mentioned above were followed for 18years, and it was found that the ones who had crackles atboth bases of the chest documented using this technologyshowed worse X rays and pulmonary function than thosewithout crackles. These observations encouraged the pursuitof investigations that lead to the development of a multichan-nel lung sound analyzer [Stethograph (STG)] by the authorand collaborators, which will be described in the remainderof this manuscript.
Development of Multichannel STG Sounds can be detected at many sites on the chest (up to about60 depending on body size). This can provide a great deal ofdiagnostic information not easily obtained in other ways.However, the recording and analysis of sounds from multiplesites over the chest is a slow and tedious process. The use ofcomputer power can greatly simplify and accelerate thisprocess. As early as 1989, it was reported that computer-basedcrackle counts were correlated with the physician counts(r = 0.74, p < 0.001, number of subjects = 41) [20]. Sincethen, the algorithm was improved, and a 16-channel automaticsounds analyzer (STG) was developed. This system consistsof electronic stethoscopes, a signal-conditioning box, an ana-log to digital converter and a standard PC running dedicatedsoftware. This electronic stethoscopes are imbedded in a softfoam pad for application to the patient, Figure 2. The lungsound information is provided in three principle ways.
First, the recorded lung sounds are displayed in a TEWA,which allows visual examination and audio playback of thedata. The display of the traces, similar to an electrocardiograph,
17
Fig. 2. (a) The 16-channel STG System. (b) Sixteen electronicstethoscopes in a backpad. A disposable, fluid imperviouscovering covers the pad during patient application.
TracheaHeart
(b)(a)
816
1234
567
91011 12
13 1415
Fig. 1. Time domain plots are illustrated in both the timeunexpanded and time expanded modes. (a) Normal vesic-ular inspiratory sound. (b) Inspiratory rales at posterior lungbase. (c) Sonorous rhonchus. (d) Sibilant rhonchus (wheeze).(e) Normal tracheal inspiration. It is clear that the patterndifferences between different types of lung sounds are seenmore easily in the expanded mode. (Reprinted with permis-sion from “Visual lung-sound characterization by time-expanded wave-form analysis,” by R. Murphy, S. Holford,and W. Knowler, New England Journal of Medicine, vol. 296pp. 968–971, April 28, 1977.)
Conventional (100 mm/s) Expanded (800 mm/s)
(c)
(d)
(e)
(a)
(b)
18
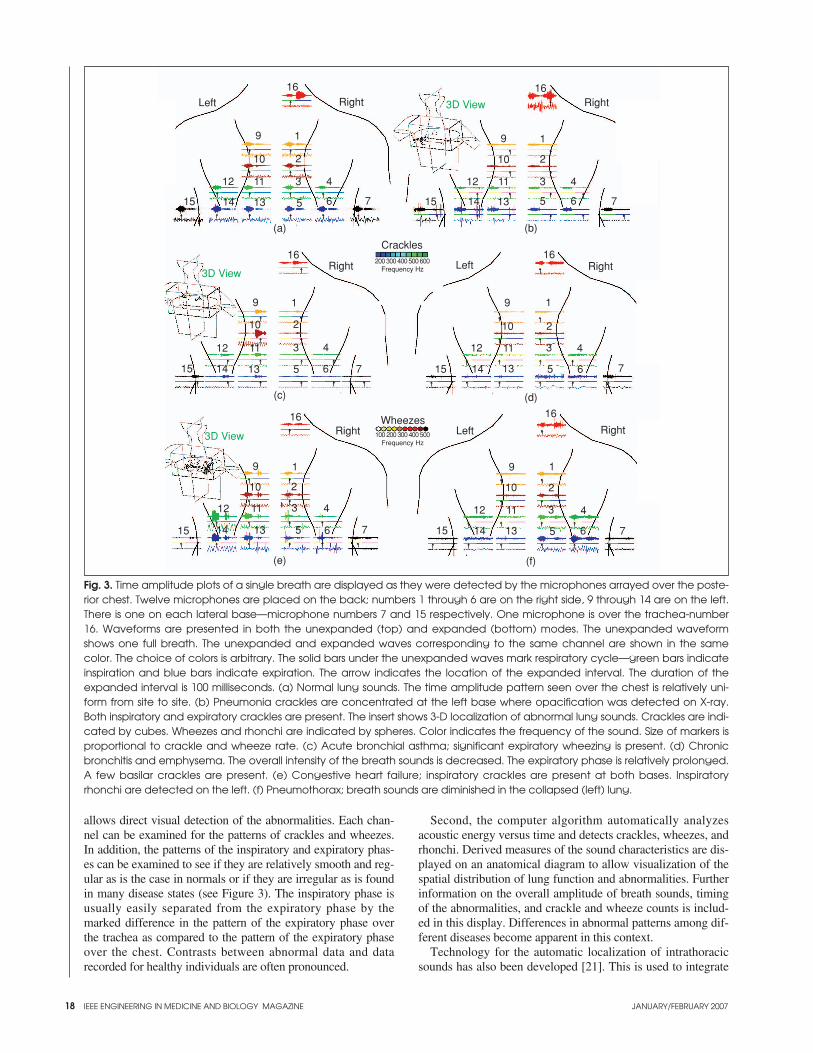
allows direct visual detection of the abnormalities. Each chan-nel can be examined for the patterns of crackles and wheezes.In addition, the patterns of the inspiratory and expiratory phas-es can be examined to see if they are relatively smooth and reg-ular as is the case in normals or if they are irregular as is foundin many disease states (see Figure 3). The inspiratory phase isusually easily separated from the expiratory phase by themarked difference in the pattern of the expiratory phase overthe trachea as compared to the pattern of the expiratory phaseover the chest. Contrasts between abnormal data and datarecorded for healthy individuals are often pronounced.
Second, the computer algorithm automatically analyzesacoustic energy versus time and detects crackles, wheezes, andrhonchi. Derived measures of the sound characteristics are dis-played on an anatomical diagram to allow visualization of thespatial distribution of lung function and abnormalities. Furtherinformation on the overall amplitude of breath sounds, timingof the abnormalities, and crackle and wheeze counts is includ-ed in this display. Differences in abnormal patterns among dif-ferent diseases become apparent in this context.
Technology for the automatic localization of intrathoracicsounds has also been developed [21]. This is used to integrate
IEEE ENGINEERING IN MEDICINE AND BIOLOGY MAGAZINE JANUARY/FEBRUARY 2007
Fig. 3. Time amplitude plots of a single breath are displayed as they were detected by the microphones arrayed over the poste-rior chest. Twelve microphones are placed on the back; numbers 1 through 6 are on the right side, 9 through 14 are on the left.There is one on each lateral base—microphone numbers 7 and 15 respectively. One microphone is over the trachea-number16. Waveforms are presented in both the unexpanded (top) and expanded (bottom) modes. The unexpanded waveformshows one full breath. The unexpanded and expanded waves corresponding to the same channel are shown in the samecolor. The choice of colors is arbitrary. The solid bars under the unexpanded waves mark respiratory cycle—green bars indicateinspiration and blue bars indicate expiration. The arrow indicates the location of the expanded interval. The duration of theexpanded interval is 100 milliseconds. (a) Normal lung sounds. The time amplitude pattern seen over the chest is relatively uni-form from site to site. (b) Pneumonia crackles are concentrated at the left base where opacification was detected on X-ray.Both inspiratory and expiratory crackles are present. The insert shows 3-D localization of abnormal lung sounds. Crackles are indi-cated by cubes. Wheezes and rhonchi are indicated by spheres. Color indicates the frequency of the sound. Size of markers isproportional to crackle and wheeze rate. (c) Acute bronchial asthma; significant expiratory wheezing is present. (d) Chronicbronchitis and emphysema. The overall intensity of the breath sounds is decreased. The expiratory phase is relatively prolonged.A few basilar crackles are present. (e) Congestive heart failure; inspiratory crackles are present at both bases. Inspiratoryrhonchi are detected on the left. (f) Pneumothorax; breath sounds are diminished in the collapsed (left) lung.
(b)
(c) (d)
(e) (f)
(a)
1
2
3 4
515 14 13
12 11
10
9
6 7
1
2
3 4
515 14 13
12 11
10
9
6 7
1
2
3 4
515 14 13
12 11
10
9
6 7
1
2
3 4
515 14 13
12 11
10
9
6 7
1
2
3 4
515 14 13
12 11
10
9
6 7
1
2
3 4
515 14 13
12 11
10
9
6 7
RightRightLeft
RightLeftRight
RightLeftRight
Crackles200 300 400 500 600
Frequency Hz
100 200 300 400 500Frequency Hz
16
16
16
16
16
16 Wheezes
3D View
3D View
3D View
IEEE ENGINEERING IN MEDICINE AND BIOLOGY MAGAZINE JANUARY/FEBRUARY 2007 19
information from multiple channels to generate a three-dimen-sional (3-D) view of the human thorax with crackles andwheezes localized to specific lung regions. Advanced visual-ization software also allows 360-degree rotation, extraction ofsectional views, and comparative views. The 3-D feature ofthe STG can help minimize radiation exposure in neonatalpatients by providing sound lung mapping potentially reduc-ing the number of X rays.
Recently, a paper was published showing that an acousticscore generated by computer utilizing the variations in breathsounds separated patients with pneumonia from normalpatients with a sensitivity of 0.84, a specificity of 0.94, and apositive predictive power of 0.93 [22]. When that paper waspublished, it was accompanied by an editorial. The authorcommented on the efficiencies of computerized auscultationas compared to a well-executed lung exam with an acousticstethoscope, pointing out that this could take up to 10 min. Hetitled the editorial “Is the Stethoscope on the Verge ofBecoming Obsolete” [23]. The principal investigator repliedto the editorial with a letter to the editor expressing the opin-ion that the stethoscope is not becoming obsolete but is get-ting married to the computer [24]. Indeed, stethoscopes thatare connected to personal digital assistants (PDAs) have beendeveloped and are on the market [25]–[27]. Automated analy-sis of sounds is now available at the bedside.
The advances in computer technology in the past decades nowallow more precise quantification of sound, improved documen-tation, and archiving and can aid in the diagnosis of many car-diopulmonary conditions. Indeed, pneumonia has been detectedby computerized lung sound analyses that were missed by chestX ray and even by CT scan. The diagnostic utility of chest Xrays in the intensive care unit setting is notoriously poor becauseof a variety of factors, including a patient’s ability to cooperatewith the examination when they are very sick or sedated. Theuse of CT scans in the intensive care setting is extremely diffi-cult. Computerized acoustic technology can be used in this set-ting, even in severely ill patients on ventilators [22].
In summary, computerized analysis of lung sounds canplay a very important role in management of patients with avariety of medical conditions, particularly those who areseriously ill. While single-channel devices can play animportant role in making auscultation more objective, multi-channel instruments greatly improve the efficiency of datacollection. This has a particular advantage in the rapidassessments of patients who are in acute distress from car-diopulmonary conditions. As noted, it has the distinct advan-tage of being noninvasive. This is a particular advantage inthe case of children and pregnant women. A number of othergroups are currently working with multichannel devices, buthave not yet reported their findings. The future will likelysee improved acoustic instruments useful in diagnosis andmanagement of medical conditions.
Raymond Murphy has been a practicingphysician since 1966. He holds degrees inpublic health and occupational medicine.He was serving as chief of pulmonary medi-cine at the Faulkner and Lemuel ShattuckHospitals, Boston, Massachusetts, for morethan 25 years. He is professor of Medicineat the Tufts University School of Medicine.
In 1975, he cofounded the International Lung Sounds
Association. He has published more than 50 articles andpapers. He holds a B.S. degree from Holy Cross College, anM.D. from New York University, and both an M.P.H. andSc.D. from Harvard University. He has retired from Harvard’sSchool of Public Health after serving on the faculty for 25years. In 1998, he founded Stethographics, Inc., and serves asa company chief medical officer.
Address for Correspondence: Raymond Murphy, MD,MPH, DSc, Dept. of Pulmonary Medicine, Brigham &Women at Faulkner Hospital, 1153 Centre St, Boston, MA02130 USA. Phone: 617 983 4436. Fax: 617 522 4156. E-mail: [email protected].
References[1] S.J. Reiser, “The Medical influence of the stethoscope,” Sci. Amer., vol. 240,no. 2, pp. 148–150, 153–156, Feb. 1979.[2] R. Loudon and R.L. Murphy, Jr., “Lung sounds,” Amer. Rev. Respir. Dis., vol.130, no. 4, pp. 663–673, Oct. 1984.[3] J. Earis, “Lung sounds,” Thorax, vol. 47, no. 9, pp. 671–672, Sept. 1992.[4] H. Pasterkamp, S.S. Kraman, and G.R. Wodicka, “Respiratory sounds.Advances beyond the stethoscope,” Amer. J. Respir. Crit. Care Med., vol. 156, no.3, Pt. 1, pp. 974–987, Sept. 1997.[5] E.H. Rubin and M. Rubin, Thoracic Diseases. Philadelphia, PA: Saunders, 1961.[6] I. Guler, H. Polat, and U. Ergun, “Combining neural network and genetic algorithmfor prediction of lung sounds,” J. Med. Syst., vol. 29, no. 3, pp. 217–231, Jun. 2005.[7] L.J. Hadjileontiadis, “Wavelet-based enhancement of lung and bowel soundsusing fractal dimension thresholding,” IEEE Trans. Biomed. Eng., vol. 52, no. 6,pp. 1143–1164, Jun. 2005.[8] P. Forgacs, Lung Sounds. London, UK: Cassel, 1978.[9] R.L. Murphy Jr., B.G. Ferris Jr., W.A. Burgess, J. Worcester, and E.A.Gaensler, “Effects of low concentrations of asbestos. Clinical, environmental,radiologic and epidemiologic observations in shipyard pipe coverers and controls,”New Eng. J. Med., vol. 285, no. 23, p. 8, 1971. [10] R.L. Murphy Jr. and K. Sorensen, “Chest auscultation in the diagnosis of pul-monary asbestosis,” J. Occup. Med., vol. 15, no. 3, pp. 272–276, Mar. 1973.[11] R.G. Loudon and R.L.H. Murphy, Proceeds of International Lung SoundAssociation, vol. 1, no. 1. Boston, MA: 1976. [12] R.L.H. Murphy, S.K. Holford, and W.C. Knowler, “Visual lung sound char-acterization by time-expanded waveform analysis,” New Eng. J. Med., vol. 296, Apr 28;296(17):968-71, pp. 968–971, 1977.[13] D.W. Cugell, “Sounds of the lungs,” Chest, vol. 73, no. 3, pp. 311–312,Mar. 1978.[14] R.L. Murphy Jr., E.A. Gaensler, S.K. Holford, E.A. Del Bono, and G. Epler,“Crackles in the early detection of asbestosis,” Amer. Rev. Respir. Dis., vol. 129,no. 3, pp. 375–379, Mar. 1984. [15] J.E. Earis and B.M.G. Cheetham, “Current methods used for computerizedrespiratory sound analysis,” Eur. Respiratory Rev., vol. 10, pp. 586–590, 2000. [16] A.R.A. Sovijärvi, L.P. Malmberg, G. Charbonneau, I. Vanderschoot, F.Dalmasso, C. Sacco, M. Rossi, and I.E. Earis, “Characteristics of breath soundsand adventitious respiratory sounds,” Eur. Respiratory Rev., vol. 10, pp.591–596, 2000. [17] G. Charbonneau, E. Ademovic, B.M.G. Cheetham, L.P. Malmberg, I.Vanderschoot, and A.R.A. Sovijärvi, “Basic techniques for respiratory soundanalysis,” Eur. Respiratory Rev., vol. 10, pp. 625–635, 2000.[18] A.R.A. Sovijärvi, J. Vanderschoot, and J.E. Earis, “Standardization of com-puterized respiratory sound analysis,” Eur. Respiratory Rev., vol. 10, p. 585, 2000.[19] N. al Jarad, B. Strickland, G. Bothamley, S. Lock, R. Logan-Sinclair, andR.M. Rudd, “Diagnosis of asbestosis by a time expanded wave form analysis, aus-cultation and high resolution computed tomography: A comparative study,”Thorax, vol. 48, no. 4, pp. 347–353, Apr. 1993.[20] R.L. Murphy Jr., E.A. Del Bono, and F. Davidson, “Validation of an automat-ic crackle (rale) counter,” Amer. Rev. Respir. Dis., vol. 140, no. 4, pp. 1017–1020,Oct. 1989.[21] R.L.H. Murphy, “Localization of chest sounds with 3D display and lungsound mapping,” U.S. Patent 5 844 997, Dec. 1, 1998.[22] R.L. Murphy, A. Vyshedskiy, V.A. Power-Charnitsky, D.S. Bana, P.M.Marinelli, A. Wong-Tse, and R. Paciej, “Automated lung sound analysis inpatients with pneumonia,” Respir. Care, vol. 49, no. 12, pp. 1490–1497, Dec. 2004.[23] R.L. Wilkins, “Is the stethoscope on the verge of becoming obsolete?,”Respir. Care, vol. 49, no. 12, pp. 1488–1489, Dec. 2004.[24] R. Murphy, “The stethoscope—obsolescence or marriage?,” Respir. Care, vol. 50 , no. 5, pp. 660–661, May 2005.[25] Cardionics. [Online] Available: http://www.cardionics.com/productdescrip-tions.htm#Pocket%20Monitor[26] 3M Littmann, “Software bundled with Littmann E4000” [Online]. Available:http://www.3m.com/us/healthcare/professionals/littmann/ jhtml/e4100.jhtml[27] Andromed. [Online]. Available: http://www.andromed.com/en/products/ipaq/documents/ hp_stg_istethos_01.pdf
20 IEEE ENGINEERING IN MEDICINE AND BIOLOGY MAGAZINE JANUARY/FEBRUARY 2007
Separating Heart Soundsfrom Lung Sounds
Accurate Diagnosis of Respiratory Disease Depends on Understanding Noises
BY JANUARY GNITECKI ANDZAHRA M.K. MOUSSAVI
© BRAND X PICTURES, TECH POOL STUDIOS
RESP
IRA
TORY
SO
UN
D A
NA
LYSI
S
0739-5175/07/$25.00©2007IEEE
Heart sounds interfere with lung sounds in a mannerthat hampers the potential of respiratory sound analy-sis in terms of diagnosis of respiratory disease. Thisreview categorizes 15 methods that have been applied
for filtering heart sounds from lung-sound recordings as thosethat require a separate noise reference and those that do not,namely linear adaptive filters and filters employing time-fre-quency based methods respectively. Whether joint assessmentof reduction in heart sounds and alteration to lung sounds byfiltering was presented is determined for each study reviewed.
Respiratory sounds present noninvasive measures of lungairway conditions [1]. However, features of lung sounds maybe contaminated by heart sounds because lung and heartsounds overlap in terms of time domain and spectral content[2]. Heart sounds are clearly audible in lung sounds recordedon the anterior chest and may be heard to a lesser extent inlung sounds recorded over posterior lung lobes. High-pass fil-tering of lung-sound recordings to reduce heart sounds wouldremove significant components of lung sounds.
This study reviews the adaptive methods of canceling heartsounds from lung sounds that have been investigated overapproximately 20 years. Filtering techniques are categorizedas linear adaptive filters and filters employing time-frequencybased methods. Several filtering schemes are outlined withinthese two categories. Methods of heart sound localization areindicated in conjunction with the studies of heart-sound can-cellation. Details such as digitization parameters, the locationof heart and lung sound recordings, and the number of subjectsused in each study are outlined in Table 1. The two subsec-tions below present background on the generation and charac-teristics of lung and heart sounds.
What Are Lung Sounds?Lung sounds are produced by vortical and turbulent flow [3]within lung airways during inspiration and expiration of air [4].Lung sounds recorded on the chest wall represent not only gen-erated sound in lung airways but also the effects of thoracic tis-sues and sound sensor characteristics on sound transmittedfrom the lungs to a data acquisition system [5]. Lung soundsexhibit a power spectral density (PSD) that is broadband withpower decreasing as frequency increases [6]. The logarithm ofamplitude and the logarithm of frequency are approximately
linearly related in healthy subjects [6] provided that the signalsdo not contain adventitious sounds. As the flow in lung airwaysincreases, sound intensity increases and several mathematicalrelations between lung sounds and airflow have been proposed[7], [8].It is important to note that inspiratory and expiratorylung sounds differ in terms of both amplitude and frequencyrange. At comparable flows, inspiratory lung sounds will exhibitgreater intensity than expiratory sounds [9], [10].
What Are Heart Sounds?Heart sounds are produced by the flow of blood into and out ofthe heart and by the movement of structures involved in thecontrol of this flow [11]. The first heart sound results whenblood is pumped from the heart to the rest of the body, duringthe latter half of the cardiac cycle, and it is comprised of soundsresulting from the rise and release of pressure within the leftventricle along with the increase in ascending aortic pressure[11]. After blood leaves the ventricles, the simultaneous closingof the semilunar valves, which connect the ventricles with theaorta and pulmonary arteries, causes the second heart sound[12]. The first and second heart sounds were the primary foci ofeach study reviewed, and it is therefore beyond the scope of thispaper to present detail with respect to other heart sounds.
The electrocardiogram (ECG) represents the depolariza-tion and repolarization of heart muscles during each cardiaccycle [12]. Depolarization of ventricular muscles during ven-tricular contraction results in three signals known as the Q,R, and S-waves of the ECG [12]. The first heart soundimmediately follows the QRS complex [2]. In health, the last30–40% of the interval between successive R-wave peakscontains a period that is void of first and second heart sounds[2]. Examples of the use of this phenomenon in evaluation ofheart sound cancellation from lung sounds will be shown inthis review.
Characteristics of heart sound signals have been assessed interms of both intensity and frequency [13]. Though peak fre-quencies of heart sounds have been shown to be much lowerthan those of lung sounds [13], comparisons between lung-sound recordings acquired over the anterior right upper lobecontaining and excluding heart sounds [14] show that PSD inboth cases is maximal below 150 Hz. Phonocardiographic api-cal sound recordings from 74 healthy men and women indicated
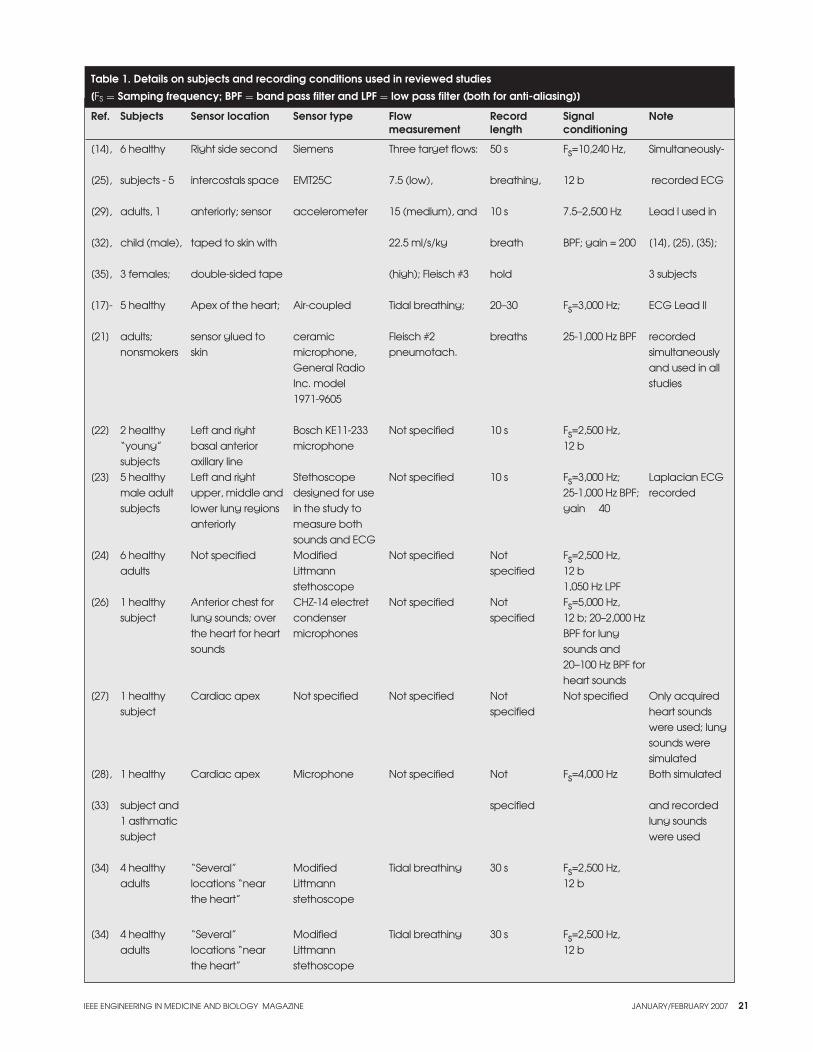
IEEE ENGINEERING IN MEDICINE AND BIOLOGY MAGAZINE JANUARY/FEBRUARY 2007 21
Table 1. Details on subjects and recording conditions used in reviewed studies
[FS = Samping frequency; BPF = band pass filter and LPF = low pass filter (both for anti-aliasing)]
Ref. Subjects Sensor location Sensor type Flow Record Signal Notemeasurement length conditioning
[14], 6 healthy Right side second Siemens Three target flows: 50 s Fs=10,240 Hz, Simultaneously-
[25], subjects - 5 intercostals space EMT25C 7.5 (low), breathing, 12 b recorded ECG
[29], adults, 1 anteriorly; sensor accelerometer 15 (medium), and 10 s 7.5–2,500 Hz Lead I used in
[32], child (male), taped to skin with 22.5 ml/s/kg breath BPF; gain = 200 [14], [25], [35];
[35], 3 females; double-sided tape (high); Fleisch #3 hold 3 subjects
[17]- 5 healthy Apex of the heart; Air-coupled Tidal breathing; 20–30 Fs=3,000 Hz; ECG Lead II
[21] adults; sensor glued to ceramic Fleisch #2 breaths 25-1,000 Hz BPF recorded nonsmokers skin microphone, pneumotach. simultaneously
General Radio and used in all Inc. model studies 1971-9605
[22] 2 healthy Left and right Bosch KE11-233 Not specified 10 s Fs=2,500 Hz, “young” basal anterior microphone 12 bsubjects axillary line
[23] 5 healthy Left and right Stethoscope Not specified 10 s Fs=3,000 Hz; Laplacian ECG male adult upper, middle and designed for use 25-1,000 Hz BPF; recordedsubjects lower lung regions in the study to gain 40
anteriorly measure both sounds and ECG
[24] 6 healthy Not specified Modified Not specified Not Fs=2,500 Hz, adults Littmann specified 12 b
stethoscope 1,050 Hz LPF [26] 1 healthy Anterior chest for CHZ-14 electret Not specified Not Fs=5,000 Hz,
subject lung sounds; over condenser specified 12 b; 20–2,000 Hz the heart for heart microphones BPF for lung sounds sounds and
20–100 Hz BPF for heart sounds
[27] 1 healthy Cardiac apex Not specified Not specified Not Not specified Only acquired subject specified heart sounds
were used; lung sounds were simulated
[28], 1 healthy Cardiac apex Microphone Not specified Not Fs=4,000 Hz Both simulated
[33] subject and specified and recorded 1 asthmatic lung sounds subject were used
[34] 4 healthy “Several” Modified Tidal breathing 30 s Fs=2,500 Hz, adults locations “near Littmann 12 b
the heart” stethoscope
[34] 4 healthy “Several” Modified Tidal breathing 30 s Fs=2,500 Hz, adults locations “near Littmann 12 b
the heart” stethoscope
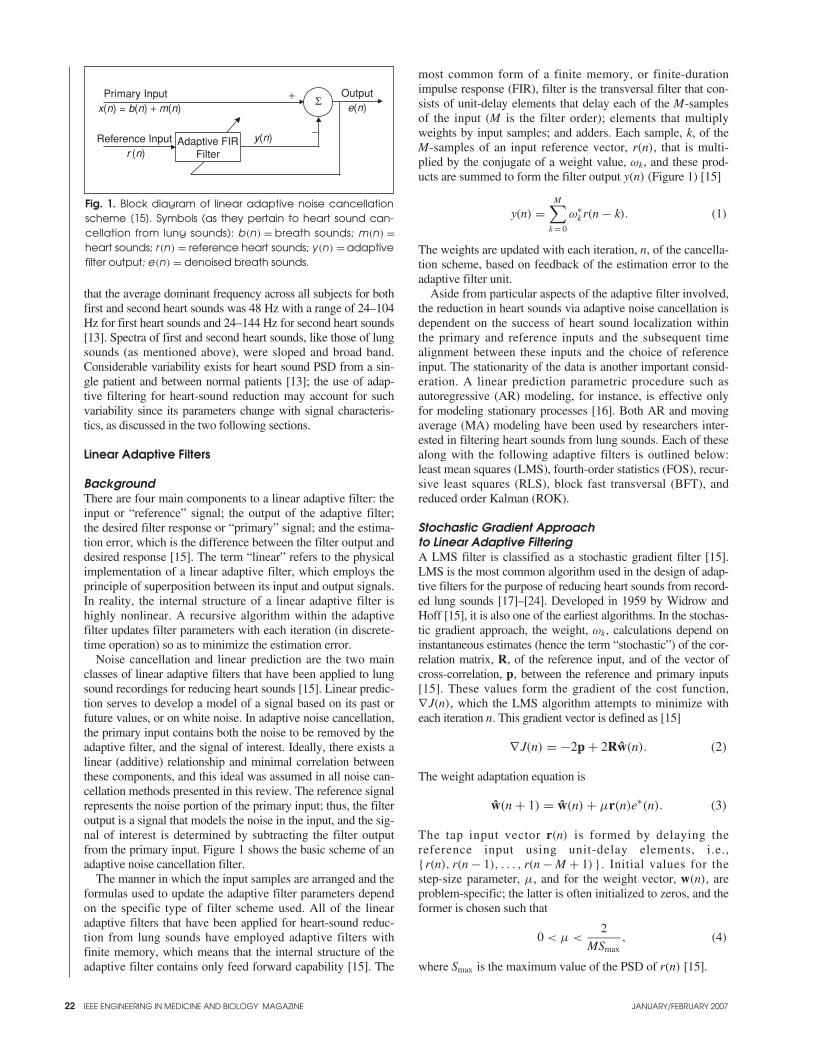
22 IEEE ENGINEERING IN MEDICINE AND BIOLOGY MAGAZINE JANUARY/FEBRUARY 2007
that the average dominant frequency across all subjects for bothfirst and second heart sounds was 48 Hz with a range of 24–104Hz for first heart sounds and 24–144 Hz for second heart sounds[13]. Spectra of first and second heart sounds, like those of lungsounds (as mentioned above), were sloped and broad band.Considerable variability exists for heart sound PSD from a sin-gle patient and between normal patients [13]; the use of adap-tive filtering for heart-sound reduction may account for suchvariability since its parameters change with signal characteris-tics, as discussed in the two following sections.
Linear Adaptive Filters
BackgroundThere are four main components to a linear adaptive filter: theinput or “reference” signal; the output of the adaptive filter;the desired filter response or “primary” signal; and the estima-tion error, which is the difference between the filter output anddesired response [15]. The term “linear” refers to the physicalimplementation of a linear adaptive filter, which employs theprinciple of superposition between its input and output signals.In reality, the internal structure of a linear adaptive filter ishighly nonlinear. A recursive algorithm within the adaptivefilter updates filter parameters with each iteration (in discrete-time operation) so as to minimize the estimation error.
Noise cancellation and linear prediction are the two mainclasses of linear adaptive filters that have been applied to lungsound recordings for reducing heart sounds [15]. Linear predic-tion serves to develop a model of a signal based on its past orfuture values, or on white noise. In adaptive noise cancellation,the primary input contains both the noise to be removed by theadaptive filter, and the signal of interest. Ideally, there exists alinear (additive) relationship and minimal correlation betweenthese components, and this ideal was assumed in all noise can-cellation methods presented in this review. The reference signalrepresents the noise portion of the primary input; thus, the filteroutput is a signal that models the noise in the input, and the sig-nal of interest is determined by subtracting the filter outputfrom the primary input. Figure 1 shows the basic scheme of anadaptive noise cancellation filter.
The manner in which the input samples are arranged and theformulas used to update the adaptive filter parameters dependon the specific type of filter scheme used. All of the linearadaptive filters that have been applied for heart-sound reduc-tion from lung sounds have employed adaptive filters withfinite memory, which means that the internal structure of theadaptive filter contains only feed forward capability [15]. The
most common form of a finite memory, or finite-durationimpulse response (FIR), filter is the transversal filter that con-sists of unit-delay elements that delay each of the M-samplesof the input (M is the filter order); elements that multiplyweights by input samples; and adders. Each sample, k, of theM-samples of an input reference vector, r(n), that is multi-plied by the conjugate of a weight value, ωk, and these prod-ucts are summed to form the filter output y(n) (Figure 1) [15]
y(n) =M∑
k = 0
ω∗k r(n − k). (1)
The weights are updated with each iteration, n, of the cancella-tion scheme, based on feedback of the estimation error to theadaptive filter unit.
Aside from particular aspects of the adaptive filter involved,the reduction in heart sounds via adaptive noise cancellation isdependent on the success of heart sound localization withinthe primary and reference inputs and the subsequent timealignment between these inputs and the choice of referenceinput. The stationarity of the data is another important consid-eration. A linear prediction parametric procedure such asautoregressive (AR) modeling, for instance, is effective onlyfor modeling stationary processes [16]. Both AR and movingaverage (MA) modeling have been used by researchers inter-ested in filtering heart sounds from lung sounds. Each of thesealong with the following adaptive filters is outlined below:least mean squares (LMS), fourth-order statistics (FOS), recur-sive least squares (RLS), block fast transversal (BFT), andreduced order Kalman (ROK).
Stochastic Gradient Approach to Linear Adaptive FilteringA LMS filter is classified as a stochastic gradient filter [15].LMS is the most common algorithm used in the design of adap-tive filters for the purpose of reducing heart sounds from record-ed lung sounds [17]–[24]. Developed in 1959 by Widrow andHoff [15], it is also one of the earliest algorithms. In the stochas-tic gradient approach, the weight, ωk, calculations depend oninstantaneous estimates (hence the term “stochastic”) of the cor-relation matrix, R, of the reference input, and of the vector ofcross-correlation, p, between the reference and primary inputs[15]. These values form the gradient of the cost function,∇J(n), which the LMS algorithm attempts to minimize witheach iteration n. This gradient vector is defined as [15]
∇J(n) = −2p + 2Rw(n). (2)
The weight adaptation equation is
w(n + 1) = w(n) + µr(n)e∗(n). (3)
The tap input vector r(n) is formed by delaying the reference input using unit-delay elements, i.e.,{r(n), r(n − 1), . . . , r(n − M + 1)}. Initial values for thestep-size parameter, µ, and for the weight vector, w(n), areproblem-specific; the latter is often initialized to zeros, and theformer is chosen such that
0 < µ <2
MSmax, (4)
where Smax is the maximum value of the PSD of r(n) [15].
Fig. 1. Block diagram of linear adaptive noise cancellationscheme [15]. Symbols (as they pertain to heart sound can-cellation from lung sounds): b(n) = breath sounds; m(n) =heart sounds; r (n) = reference heart sounds; y(n) = adaptivefilter output; e(n) = denoised breath sounds.
Primary Input Output
Adaptive FIRFilter
Reference Input
+
−y(n)
e(n)
r (n)
x(n) = b(n) + m(n)Σ
IEEE ENGINEERING IN MEDICINE AND BIOLOGY MAGAZINE JANUARY/FEBRUARY 2007 23
The earliest study to have employed LMS filtering forthe purpose of removing heart sounds from lung sounds iscredited to Iyer et al. [17]. Five papers were writtenbetween 1986 and 1990 by this group [17]–[21] based ontheir initial study [17], with each subsequent study referringto the 1986 paper.
The LMS filter used by Iyer et al. had an order of 300,and µ was chosen by trial and error (it had been “opti-mized”) per subject ranging between 0.05 and 0.1 [18]. Thechoice of reference input was an augmented ECG: the QRScomplex of an ECG signal recorded congruently with respi-ratory sounds was used to represent the first heart sound,and the ECG delayed by 350 ms was superimposed on theoriginal ECG such that the QRS complex of the delayedsignal corresponded (approximately) with the second heartsound. The filter order was chosen to be slightly longerthan the time interval between the R-wave peak and thefirst heart sound. Their justification for using ECG wasexpressed in two of their publications as follows: “Theheart sound is the output of a system whose input is theECG” [23]; and, “The ECG signals had all the frequencycomponents of the heart sounds” [19]. Regarding the laststatement, the structure of an ECG signal does not resemblethat of a heart sound signal in terms of either amplitude orfrequency (this was clear in the graphs presented by theauthors [17]). Furthermore, the primary and referenceinputs to an adaptive filtering scheme should be of thesame type, i.e., both should be sound signals, and bothshould have common background noise so that this noise ineffect cancels with the subtraction of the filter output fromthe primary input.
To gauge the success of the LMS filter’s performance inreducing heart sounds from lung sounds in the 1986 paper[17], the authors compared the PSD of a 170.7 ms (512 sam-ple) segment of the LMS-filtered lung sound recording withthe corresponding segment of the original signal. In addition,two sixth-order Butterworth high-pass filtered signals wereused in the assessment with cut off frequencies of 75 and 100Hz. The region of PSD between 50–150 Hz was focused on,though results were presented based on only one 170.7 mssegment of one recording; results averaged across subjectswere not shown. Nonetheless, the authors claimed a reductionin heart sounds by 50–80% without a description of howthese figures were obtained, aside from indicating that thiscan be “easily noted” in the 2 s time domain portions of anunfiltered, LMS- and high-pass-filtered waveform that wereshown in the study. Through listening to the original data andto each filtered signal, the authors found that adaptive filter-ing preserved lung sounds whereas high-pass filtering did not;visual inspection of time domain and PSD representations didattest to this as well, though no formal quantitative assess-ment was presented.
A quantitative indication of heart sound reduction wasdeveloped by the authors in a later study [20] that involvedcalculating root mean square (RMS) power estimates over onebreath cycle (inspiration followed by expiration) per subjectfor original, LMS-and-high-pass-filtered data. This measure,labeled the lung sounds to heart sounds ratio, LHR, was deter-mined based on RMS power for lung sounds over the wholebreath (which inevitably included heart sounds), Pl+ h, and onRMS of manually-extracted regions of lung sounds in betweenheart sounds, Pl.
LHR(dB) = 20 log10
( √Pl√
Pl+ h − √Pl
). (5)
The highest LHR defined the best filtering technique. LMSfiltering was deemed far superior to high-pass filtering for allfive subjects and was found to reduce the power of heartsounds in lung-sound recordings by 34.9–40.8 dB. The averag-ing of power across breath phases is curious, since inspiratoryand expiratory sounds exhibit different signal characteristics[10]. The manual extraction of lung sounds between heartsounds also is not ideal; automated localization of these regionswill be discussed below [2], [14], [21].
Mean, median, and mode frequencies of the PSD per eachof the signals mentioned above, excluding high-pass-filteredsignals with the 100 Hz cut off, were assessed in anotherstudy [19] to examine the success of heart-sound reduction.PSD was calculated across five random breaths per subjectand the results were not separated in terms of breath phase.Overall, original signals and those high-pass filtered with a 75Hz cut off frequency were significantly different in terms ofmean, median, and mode frequencies, with high-pass-filtereddata exhibiting higher frequency values in each case.Adaptively filtered data, however, had significantly highermean and median frequencies than original data for only threeof the five subjects (consistently for the subjects labeled 1, 2,and 3), and for only one subject (subject 1) in terms of modefrequency. In all cases, the frequency values for LMS filter-ing were lower than those of high pass filtering. The authorsjustify the results by claiming that high pass filtering affectsboth heart sounds and low-frequency lung sounds, whereasLMS filtering removes only heart sounds. This seems to betoo bold a claim, considering that filtered data were not quan-titatively compared with original data in regions of lungsounds excluding heart sounds.
A subsequent study [21] resolved this latter issue using atechnique termed “ECG blanking,” in which regions of anoriginal lung sound recording corresponding to the QRSwave location of the augmented ECG were “blanked” (pre-sumably, set to zero) to allow for the calculation of PSD forthe original data with “blanked” heart sounds. Inspiratoryand expiratory lung sounds were analyzed separately for fivebreaths per subject, and median frequency was assessed.Median frequencies were lowest for original data, and suc-cessively increased with blanking, LMS filtering, and 75 Hz,high-pass filtering.
Among all of the aforementioned studies, the effect of LMSadaptive filtering on reduction of heart sounds was assessedboth quantitatively through the LHR and PSD methods out-lined above [19]–[21] and qualitatively [17], [19]–[21] byvisual inspection of time domain and PSD graphs as well aslistening to original and filtered data. Such qualitative analysiswas applied to the evaluation of the impact of filtering on lungsounds, quantification of which was provided by median fre-quencies [21].
Neither a qualitative nor quantitative assessment of alter-ation of lung sounds was used in another study employingthe LMS filter for heart-sound reduction [22]. In this study,the reference signal for LMS filtering was derived from therecorded lung sounds by low-pass filtering of the originaldata, squaring the filtered signal, and “smoothing” thesquared signal by passing it through a second low-pass fil-ter; cut off frequencies of these filters were not specified.
24 IEEE ENGINEERING IN MEDICINE AND BIOLOGY MAGAZINE JANUARY/FEBRUARY 2007
This procedure produced a waveform containing impulseswhere heart sounds occurred. The first and second heartsounds were separated into two signals, and one LMS filterwas used per heart-sound signal with both filters identicalin terms of order, which was 200 (other filter parameterswere not mentioned). Signal to noise ratio (SNR) was cal-culated for 10 s of original and filtered data using the aver-age of 10 s of breath-hold sounds as the noise reference inthe SNR. Thus, the more the SNR decreased after filtering,the more heart sounds were considered to be reduced,assuming, as the authors did, that lung sounds were totallyunaffected by the filtering procedure. The reduction inheart sounds ranged between 24%–49% across two healthysubjects and two recording sites per subject (Table 1).Listening to filtered data indicated that heart sounds werereduced but still audible.
In 2001, an approach to LMS filtering that combined theuse of ECG as the reference [17] with the use of dataacquired with a single sensor for primary and referenceinputs [22] was developed [23]. Rather than standard ECG,Laplacian ECG (LECG) was used, and the LECG along withlung sound recordings were acquired with a single sensor thatseemed to be comprised of two sensing devices, one for eachtype of signal. Since only the first heart sound may beaccounted for when using LECG as a reference signal, the fil-ter order was chosen such that both first and second heartsounds would be included in the reference signal at everyiteration; this order was 1,000 (approximately 333 ms). Thevalue of µ was chosen as 0.001. Quantitative analysis ofheart-sound reduction was achieved by subtracting the fol-lowing ratio from 100%
(E{x2(n)} − E{y2(n)}
E{x2(n)})
· 100%. (6)
Here, parameters are defined as per Figure 1. The percentageof the reduction in heart sounds for sounds acquired at sixrecording locations (Table 1) during tidal breathing and forbreath-hold sounds, each 10 s long, were shown as mean val-ues across five subjects; values range from 75.13%–82.76%for lung sounds and from 80.23%–85.55% for breath-holdsounds. Preservation of lung sounds after adaptive filteringwas not addressed quantitatively or qualitatively.
A combination of the LMS structure and fourth-order sta-tistics (FOS), rather than second-order statistics, was anotherapproach used for adaptive heart sound reduction from lungsounds [24]. Basically, the modification to the LMS algo-rithm involved replacing the correlation matrix of the refer-ence input (R, described above) with the fourth-ordercumulant of the reference, and the cross-correlation betweenthe reference and primary inputs with the fourth-order cross-cumulant of these two inputs. The rationale for using thisapproach rested on the ability of the techniques based onhigher-order statistics to preserve phase relationships amongharmonic components of a signal and to suppress Gaussiannoise [24]. Thus, heart and lung sounds were considered sta-tionary, zero-mean non-Gaussian random processes, and anyGaussian (white) noise in primary or reference signals wouldnot affect filter performance as it would in standard, correla-tion-based LMS schemes. The reference input was derivedfrom the primary input by band-pass filtering the primaryinput between 65–180 Hz and using an algorithm to automat-
ically detect first and second heart sounds, which involvedthe use of heart rate information as in a previous study [22].Any regions outside of these two sounds were set to zero[24]. The adaptive filter order was three, and the step size (µ)was 0.9090. The performance of the filter was evaluatedusing a heart-noise reduction percentage (HNRP), which wasequivalent to that shown in (6) except that e(n) was used inplace of y(n) (Figure 1). The data were segmented accordingto the regions where first and second heart sounds occurred.HNRP values calculated within these regions indicated thatheart sounds were reduced by 90%–95% across subjects afterFOS adaptive filtering. Given that the regions of sound out-side of first and second heart sounds were set to zero, theadaptive filter would not have affected these segments oflung sounds in the primary input, which is an advantage overany other methods of LMS filtering discussed above. Nocomment was made with regard to the audible change orpreservation of lung sounds. The filter order used in thisstudy, i.e., three, is dramatically lower than the orders of 200[22], 300 [17], and 1,000 [23] that were used in the studiesoutlined above. However, the filter based on FOS requiredmore computations than the standard LMS filter.
Least Squares EstimationFilters that use the method of least squares in their imple-mentation include the RLS, ROK, and BFT filters. The stan-dard RLS adaptive filtering scheme consists of a FIRtransversal filter and a RLS adaptation algorithm, whichupdates the tap weights ωk of the transversal filter so that themean square error (MSE) between the filter output anddesired response (primary input) is minimized [15].Reference data in a RLS filter are arranged in anM -by-(N-M + 1) rectangular matrix, U(n) , using thecovariance method of data windowing, where M is the filterorder, and N is the length of the reference input. The algo-rithm serves to process the data in U(n) column-by-column,u(n), and the primary signal x(n) sample-by-sample witheach iteration n, to estimate updates to the tap weights ωk
such that the actual output of the RLS adaptive filter, y(n)
(Figure 1), closely models the interference component of theprimary input [15]. Likewise, the output of the adaptivenoise cancellation filter, e(n) (Figure 1), is the minimummean square error (MMSE) estimate of the information-bearing component of the primary input, which would be thelung-sound signal without heart sounds in the context of thisreview. The RLS algorithm adapts to changes in ωk byweighting the values of u(n) with a “forgetting factor,”λ(0 < λ ≤ 1), or in other words by “forgetting” values ofu(n) by replacing them with new values [15].
The most recent application of the RLS filter for heart-sound reduction [14], [25] used it not only for cancellation butalso for localization of heart sounds. Localization wasachieved by using the original lung-sound recording as theprimary input to the filter, and a delayed version of this signalas the reference input. The delay, 100 ms (1,024 samples),was chosen to prevent alignment between the heart sounds inthe primary and reference inputs but to preserve alignmentbetween regions containing only lung sounds. The error out-put of the adaptive noise canceller contained peaks corre-sponding to regions where heart sounds in the primary inputwere aligned with lung sounds of the reference input. Theselocations were applied to a 20–300 Hz band-pass filtered
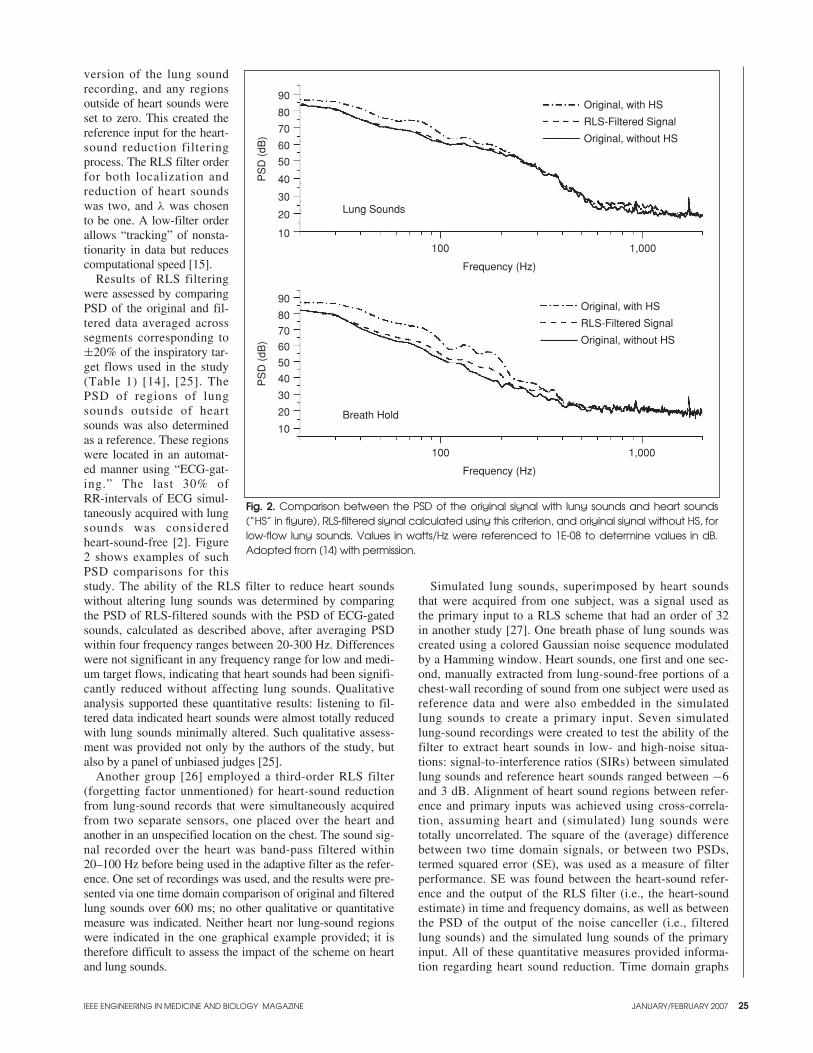
IEEE ENGINEERING IN MEDICINE AND BIOLOGY MAGAZINE JANUARY/FEBRUARY 2007 25
version of the lung soundrecording, and any regionsoutside of heart sounds wereset to zero. This created thereference input for the heart-sound reduction filteringprocess. The RLS filter orderfor both localization andreduction of heart soundswas two, and λ was chosento be one. A low-filter orderallows “tracking” of nonsta-tionarity in data but reducescomputational speed [15].
Results of RLS filteringwere assessed by comparingPSD of the original and fil-tered data averaged acrosssegments corresponding to±20% of the inspiratory tar-get flows used in the study(Table 1) [14], [25]. ThePSD of regions of lungsounds outside of heartsounds was also determinedas a reference. These regionswere located in an automat-ed manner using “ECG-gat-ing.” The last 30% ofRR-intervals of ECG simul-taneously acquired with lungsounds was consideredheart-sound-free [2]. Figure2 shows examples of suchPSD comparisons for thisstudy. The ability of the RLS filter to reduce heart soundswithout altering lung sounds was determined by comparingthe PSD of RLS-filtered sounds with the PSD of ECG-gatedsounds, calculated as described above, after averaging PSDwithin four frequency ranges between 20-300 Hz. Differenceswere not significant in any frequency range for low and medi-um target flows, indicating that heart sounds had been signifi-cantly reduced without affecting lung sounds. Qualitativeanalysis supported these quantitative results: listening to fil-tered data indicated heart sounds were almost totally reducedwith lung sounds minimally altered. Such qualitative assess-ment was provided not only by the authors of the study, butalso by a panel of unbiased judges [25].
Another group [26] employed a third-order RLS filter (forgetting factor unmentioned) for heart-sound reductionfrom lung-sound records that were simultaneously acquiredfrom two separate sensors, one placed over the heart andanother in an unspecified location on the chest. The sound sig-nal recorded over the heart was band-pass filtered within20–100 Hz before being used in the adaptive filter as the refer-ence. One set of recordings was used, and the results were pre-sented via one time domain comparison of original and filteredlung sounds over 600 ms; no other qualitative or quantitativemeasure was indicated. Neither heart nor lung-sound regionswere indicated in the one graphical example provided; it istherefore difficult to assess the impact of the scheme on heartand lung sounds.
Simulated lung sounds, superimposed by heart soundsthat were acquired from one subject, was a signal used asthe primary input to a RLS scheme that had an order of 32in another study [27]. One breath phase of lung sounds wascreated using a colored Gaussian noise sequence modulatedby a Hamming window. Heart sounds, one first and one sec-ond, manually extracted from lung-sound-free portions of achest-wall recording of sound from one subject were used asreference data and were also embedded in the simulatedlung sounds to create a primary input. Seven simulatedlung-sound recordings were created to test the ability of thefilter to extract heart sounds in low- and high-noise situa-tions: signal-to-interference ratios (SIRs) between simulatedlung sounds and reference heart sounds ranged between −6and 3 dB. Alignment of heart sound regions between refer-ence and primary inputs was achieved using cross-correla-tion, assuming heart and (simulated) lung sounds weretotally uncorrelated. The square of the (average) differencebetween two time domain signals, or between two PSDs,termed squared error (SE), was used as a measure of filterperformance. SE was found between the heart-sound refer-ence and the output of the RLS filter (i.e., the heart-soundestimate) in time and frequency domains, as well as betweenthe PSD of the output of the noise canceller (i.e., filteredlung sounds) and the simulated lung sounds of the primaryinput. All of these quantitative measures provided informa-tion regarding heart sound reduction. Time domain graphs
Fig. 2. Comparison between the PSD of the original signal with lung sounds and heart sounds(“HS” in figure), RLS-filtered signal calculated using this criterion, and original signal without HS, forlow-flow lung sounds. Values in watts/Hz were referenced to 1E-08 to determine values in dB.Adopted from [14] with permission.
10
20
30
40
50
60
70
80
90
10
20
30
40
50
60
70
80
90
Lung Sounds
Breath Hold
Original, with HS
RLS-Filtered Signal
Original, without HS
Original, with HS
RLS-Filtered Signal
Original, without HS
100 1,000
100 1,000
Frequency (Hz)
Frequency (Hz)
PS
D (
dB)
PS
D (
dB)
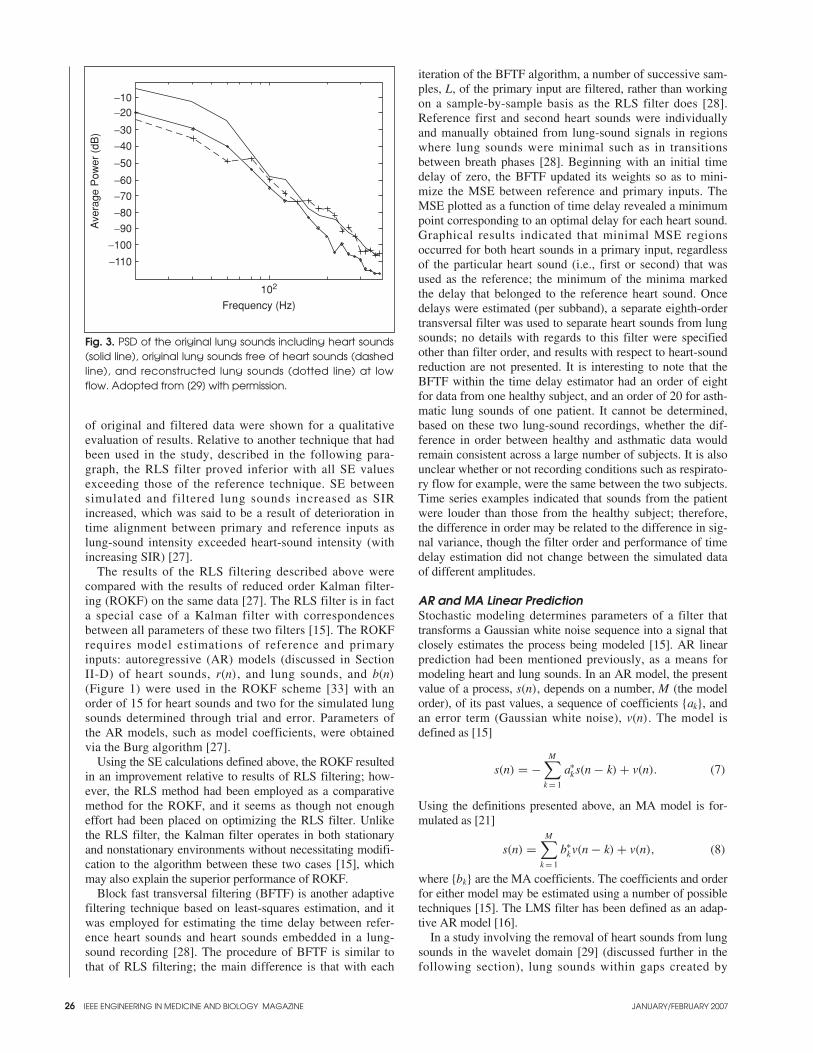
26 IEEE ENGINEERING IN MEDICINE AND BIOLOGY MAGAZINE JANUARY/FEBRUARY 2007
of original and filtered data were shown for a qualitativeevaluation of results. Relative to another technique that hadbeen used in the study, described in the following para-graph, the RLS filter proved inferior with all SE valuesexceeding those of the reference technique. SE betweensimulated and filtered lung sounds increased as SIRincreased, which was said to be a result of deterioration intime alignment between primary and reference inputs aslung-sound intensity exceeded heart-sound intensity (withincreasing SIR) [27].
The results of the RLS filtering described above werecompared with the results of reduced order Kalman filter-ing (ROKF) on the same data [27]. The RLS filter is in facta special case of a Kalman filter with correspondencesbetween all parameters of these two filters [15]. The ROKFrequires model estimations of reference and primaryinputs: autoregressive (AR) models (discussed in SectionII-D) of heart sounds, r(n), and lung sounds, and b(n)
(Figure 1) were used in the ROKF scheme [33] with anorder of 15 for heart sounds and two for the simulated lungsounds determined through trial and error. Parameters ofthe AR models, such as model coefficients, were obtainedvia the Burg algorithm [27].
Using the SE calculations defined above, the ROKF resultedin an improvement relative to results of RLS filtering; how-ever, the RLS method had been employed as a comparativemethod for the ROKF, and it seems as though not enougheffort had been placed on optimizing the RLS filter. Unlikethe RLS filter, the Kalman filter operates in both stationaryand nonstationary environments without necessitating modifi-cation to the algorithm between these two cases [15], whichmay also explain the superior performance of ROKF.
Block fast transversal filtering (BFTF) is another adaptivefiltering technique based on least-squares estimation, and itwas employed for estimating the time delay between refer-ence heart sounds and heart sounds embedded in a lung-sound recording [28]. The procedure of BFTF is similar tothat of RLS filtering; the main difference is that with each
iteration of the BFTF algorithm, a number of successive sam-ples, L, of the primary input are filtered, rather than workingon a sample-by-sample basis as the RLS filter does [28].Reference first and second heart sounds were individuallyand manually obtained from lung-sound signals in regionswhere lung sounds were minimal such as in transitionsbetween breath phases [28]. Beginning with an initial timedelay of zero, the BFTF updated its weights so as to mini-mize the MSE between reference and primary inputs. TheMSE plotted as a function of time delay revealed a minimumpoint corresponding to an optimal delay for each heart sound.Graphical results indicated that minimal MSE regionsoccurred for both heart sounds in a primary input, regardlessof the particular heart sound (i.e., first or second) that wasused as the reference; the minimum of the minima markedthe delay that belonged to the reference heart sound. Oncedelays were estimated (per subband), a separate eighth-ordertransversal filter was used to separate heart sounds from lungsounds; no details with regards to this filter were specifiedother than filter order, and results with respect to heart-soundreduction are not presented. It is interesting to note that theBFTF within the time delay estimator had an order of eightfor data from one healthy subject, and an order of 20 for asth-matic lung sounds of one patient. It cannot be determined,based on these two lung-sound recordings, whether the dif-ference in order between healthy and asthmatic data wouldremain consistent across a large number of subjects. It is alsounclear whether or not recording conditions such as respirato-ry flow for example, were the same between the two subjects.Time series examples indicated that sounds from the patientwere louder than those from the healthy subject; therefore,the difference in order may be related to the difference in sig-nal variance, though the filter order and performance of timedelay estimation did not change between the simulated dataof different amplitudes.
AR and MA Linear PredictionStochastic modeling determines parameters of a filter thattransforms a Gaussian white noise sequence into a signal thatclosely estimates the process being modeled [15]. AR linearprediction had been mentioned previously, as a means formodeling heart and lung sounds. In an AR model, the presentvalue of a process, s(n), depends on a number, M (the modelorder), of its past values, a sequence of coefficients {ak}, andan error term (Gaussian white noise), v(n). The model isdefined as [15]
s(n) = −M∑
k = 1
a∗ks(n − k) + v(n). (7)
Using the definitions presented above, an MA model is for-mulated as [21]
s(n) =M∑
k = 1
b∗kv(n − k) + v(n), (8)
where {bk} are the MA coefficients. The coefficients and orderfor either model may be estimated using a number of possibletechniques [15]. The LMS filter has been defined as an adap-tive AR model [16].
In a study involving the removal of heart sounds from lungsounds in the wavelet domain [29] (discussed further in thefollowing section), lung sounds within gaps created by
Fig. 3. PSD of the original lung sounds including heart sounds(solid line), original lung sounds free of heart sounds (dashedline), and reconstructed lung sounds (dotted line) at lowflow. Adopted from [29] with permission.
−110
−100
−90
−80
−70
−60
−50
−40
−30
−20−10
Ave
rage
Pow
er (
dB)
102
Frequency (Hz)
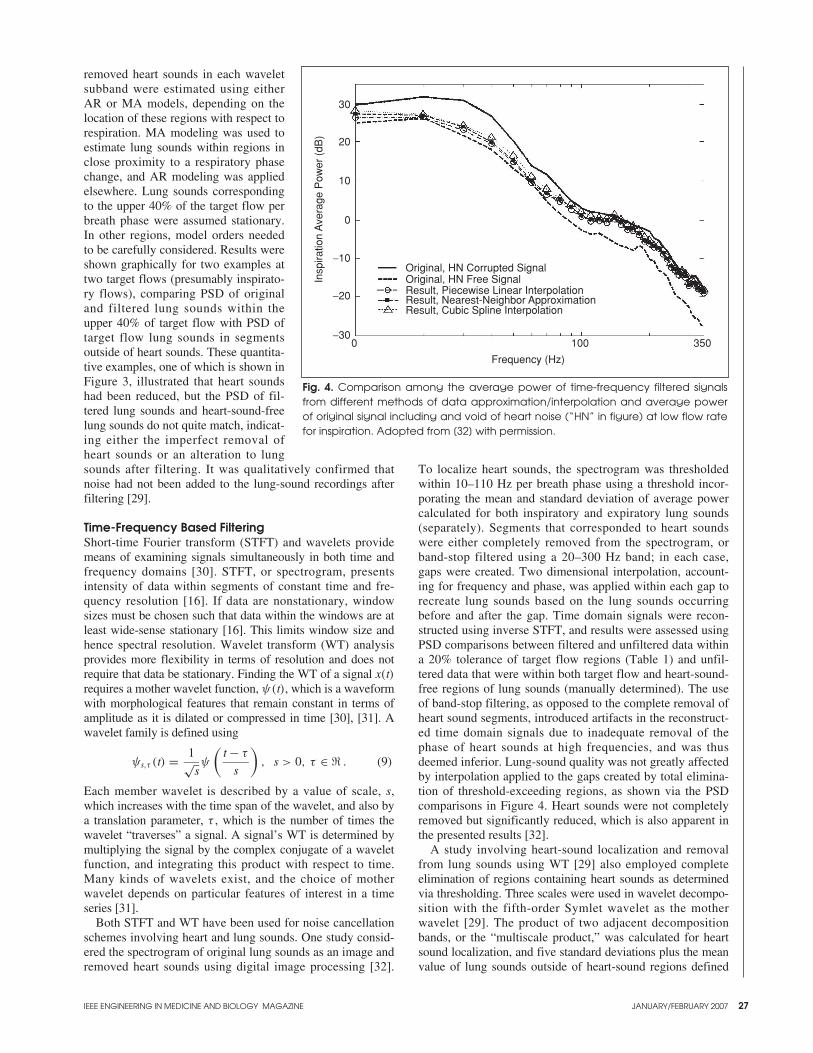
IEEE ENGINEERING IN MEDICINE AND BIOLOGY MAGAZINE JANUARY/FEBRUARY 2007 27
removed heart sounds in each waveletsubband were estimated using eitherAR or MA models, depending on thelocation of these regions with respect torespiration. MA modeling was used toestimate lung sounds within regions inclose proximity to a respiratory phasechange, and AR modeling was appliedelsewhere. Lung sounds correspondingto the upper 40% of the target flow perbreath phase were assumed stationary.In other regions, model orders neededto be carefully considered. Results wereshown graphically for two examples attwo target flows (presumably inspirato-ry flows), comparing PSD of originaland filtered lung sounds within theupper 40% of target flow with PSD oftarget flow lung sounds in segmentsoutside of heart sounds. These quantita-tive examples, one of which is shown inFigure 3, illustrated that heart soundshad been reduced, but the PSD of fil-tered lung sounds and heart-sound-freelung sounds do not quite match, indicat-ing either the imperfect removal ofheart sounds or an alteration to lungsounds after filtering. It was qualitatively confirmed thatnoise had not been added to the lung-sound recordings afterfiltering [29].
Time-Frequency Based FilteringShort-time Fourier transform (STFT) and wavelets providemeans of examining signals simultaneously in both time andfrequency domains [30]. STFT, or spectrogram, presentsintensity of data within segments of constant time and fre-quency resolution [16]. If data are nonstationary, windowsizes must be chosen such that data within the windows are atleast wide-sense stationary [16]. This limits window size andhence spectral resolution. Wavelet transform (WT) analysisprovides more flexibility in terms of resolution and does notrequire that data be stationary. Finding the WT of a signal x(t)requires a mother wavelet function, ψ(t), which is a waveformwith morphological features that remain constant in terms ofamplitude as it is dilated or compressed in time [30], [31]. Awavelet family is defined using
ψs,τ (t) = 1√sψ
(t − τ
s
), s > 0, τ ∈ � . (9)
Each member wavelet is described by a value of scale, s,which increases with the time span of the wavelet, and also bya translation parameter, τ , which is the number of times thewavelet “traverses” a signal. A signal’s WT is determined bymultiplying the signal by the complex conjugate of a waveletfunction, and integrating this product with respect to time.Many kinds of wavelets exist, and the choice of motherwavelet depends on particular features of interest in a timeseries [31].
Both STFT and WT have been used for noise cancellationschemes involving heart and lung sounds. One study consid-ered the spectrogram of original lung sounds as an image andremoved heart sounds using digital image processing [32].
To localize heart sounds, the spectrogram was thresholdedwithin 10–110 Hz per breath phase using a threshold incor-porating the mean and standard deviation of average powercalculated for both inspiratory and expiratory lung sounds(separately). Segments that corresponded to heart soundswere either completely removed from the spectrogram, orband-stop filtered using a 20–300 Hz band; in each case,gaps were created. Two dimensional interpolation, account-ing for frequency and phase, was applied within each gap torecreate lung sounds based on the lung sounds occurringbefore and after the gap. Time domain signals were recon-structed using inverse STFT, and results were assessed usingPSD comparisons between filtered and unfiltered data withina 20% tolerance of target flow regions (Table 1) and unfil-tered data that were within both target flow and heart-sound-free regions of lung sounds (manually determined). The useof band-stop filtering, as opposed to the complete removal ofheart sound segments, introduced artifacts in the reconstruct-ed time domain signals due to inadequate removal of thephase of heart sounds at high frequencies, and was thusdeemed inferior. Lung-sound quality was not greatly affectedby interpolation applied to the gaps created by total elimina-tion of threshold-exceeding regions, as shown via the PSDcomparisons in Figure 4. Heart sounds were not completelyremoved but significantly reduced, which is also apparent inthe presented results [32].
A study involving heart-sound localization and removalfrom lung sounds using WT [29] also employed completeelimination of regions containing heart sounds as determinedvia thresholding. Three scales were used in wavelet decompo-sition with the fifth-order Symlet wavelet as the motherwavelet [29]. The product of two adjacent decompositionbands, or the “multiscale product,” was calculated for heartsound localization, and five standard deviations plus the meanvalue of lung sounds outside of heart-sound regions defined
Fig. 4. Comparison among the average power of time-frequency filtered signalsfrom different methods of data approximation/interpolation and average powerof original signal including and void of heart noise (“HN” in figure) at low flow ratefor inspiration. Adopted from [32] with permission.
−30
−20
−10
0
10
20
30
Original, HN Corrupted SignalOriginal, HN Free SignalResult, Piecewise Linear InterpolationResult, Nearest-Neighbor ApproximationResult, Cubic Spline Interpolation
0 100 350
Frequency (Hz)
Insp
iratio
n A
vera
ge P
ower
(dB
)
28 IEEE ENGINEERING IN MEDICINE AND BIOLOGY MAGAZINE JANUARY/FEBRUARY 2007
the threshold for heart-sound localization. After removal ofregions within each wavelet resolution level that correspondedto multiscale products that exceed the threshold, the lungsounds within these regions were modeled using either AR orMA modeling as discussed in the previous section.
Wavelet-like multiresolution analysis for heart-soundlocalization was applied in another study in which subbandswere created by filtering lung-sound recordings using half-band low-pass and high-pass filters and decimating each fil-tered sequence by a factor of two [28], [33]. This procedurewas repeated for each low-pass-filtered subband, creating Nlevels, each successive level having half the bandwidth, twicethe frequency resolution, and half the time resolution of itspredecessor, which is what results from WT as well. Usingthe time delay estimation scheme based on BFTF (describedearlier) [28], time delays were determined within subbandlevels four and five, which consistently matched. This delaywas then applied to each of eight subbands of the referenceheart-sound signal, and eight corresponding subbands of theprimary input (lung sounds containing heart sounds) wereadaptively filtered for heart-sound removal (details of whichwere not presented in the study, as indicated above). The fil-ter output and error signals per subband were reconstructedusing an inverse scheme.
Daubechies quadrature mirror filters of eight coefficientswere used for WT calculation in two studies employingwavelets for the removal of heart from lung sounds [34],[35]. Both studies were based on the same overall adaptivefiltering method, which had first been presented in [34]. Inthat method, a threshold was applied to wavelet coefficientswithin each of 11 scales, which was defined by the standarddeviation of the WT multiplied by a constant adjusting multi-plicative factor chosen experimentally based on data record-ings from individual subjects. The coefficients wereseparated per scale as those larger than the threshold andthose smaller than the threshold. Reconstruction of coherentand residual signals from these groups of coefficients wasperformed across scales, representing the heart sounds (noise)and lung sounds (denoised data), respectively. The procedurewas repeated in an iterative manner on the residual signalsuntil the difference between the expected values of two suc-cessive residuals was less than a small constant (chosen as0.00001). This stopping criterion implies that these wave-forms were correlated and any coherent signal was no longersignificantly present [36]. After the last iteration, the coherentparts obtained at each iteration of the procedure weresummed, forming the heart sounds removed from lungsounds. The residual at the final iteration was considered thedenoised lung sounds.
The studies in which the above-described filtering tech-nique had been used [34], [35] differed in terms of data andthe way results were assessed. The group that had devel-oped the method [34] used their HNRP, presented in thepreceding section, to evaluate the percentage in reduction ofheart sounds. Results were shown for only one of the foursubjects from which data were acquired, and the valueswere 67.8% for lung sounds and 84.1% for breath-hold sig-nals. PSD and time domain plots based on a short segmentof original, adaptively denoised and high-pass filtered (75Hz cut off) lung sounds also were shown for one subjectwith no overall results reported. The PSD of adaptively fil-tered sounds was lower than that of original data at low fre-
quencies, indicating a reduction in heart sounds, but anychange in lung sounds was not discussed. Time domainwaveforms seemed to indicate that lung sounds betweenheart sounds were unchanged.
The other group that had employed the WT technique [35]worked with lung sounds from more subjects that wereacquired at low- and medium-flow rates (Table 1). Theresults were analyzed using the same PSD comparisons pre-sented above in conjunction with a RLS filtering study [25],which allowed for the simultaneous measurement of heart-sound reduction and the effect of filtering on lung sounds.This analysis indicated that the WT-based filtering resultedin considerable loss in energy across all frequencies; PSD ofthe adaptively filtered lung sounds was reduced relative toPSD of original lung sounds outside of heart sounds. Suchchange in the WT-filtered data was quite audible [25]. As for[34], judging by the time series plots, the lung soundsappeared unaffected. The PSD assessment thus revealedgreater detail with regard to the impact of filtering on lungsounds as well as heart sounds [35]. Coupled with the audi-tory analysis [25], the assessment also shows that qualitativeevaluation that is limited to time-domain graphical examina-tion may prove misleading.
ConclusionsFifteen methods for filtering heart sounds from lung soundshave been presented in this article. Of the ten linear adaptivemethods involved in the reduction of heart sounds from lungsounds, four schemes were based on LMS filtering[17]–[24]; three on RLS filtering methods [14], [17]–[27];one on ROKF [27]; one on BFTF [28]; and two employedlinear prediction using AR [27], [29] and MA modeling [29].Other filtering techniques involved STFT [32] and WT [28],[29], [33]–[35].
Different data were involved in each study, as presented inTable 1, which poses a challenge for determining the mostsuccessful heart-sound cancellation technique. Furthermore,different measures of filtering success were employed, andnot all measures addressed both reduction in heart soundsand effect of filtering on lung sounds. Of the techniques thatwere used to assess results, PSD comparison between fil-tered data and original lung sounds within and outside ofheart sound regions is the most useful [14], [21], [25], [29],[32], [35], because it allows for quantitative evaluation ofboth of these criteria. Strict qualitative analysis is alsoimportant; this was achieved in only one study [25] by hav-ing a panel of unbiased researchers listen to lung soundsbefore and after heart-sound reduction, and fill out a ques-tionnaire focused on heart-sound removal and the preserva-tion of lung sounds.
It is worth noting that not one study had examined theperformance of heart-sound cancellation in the presence ofspontaneous artifacts. Indeed, all studies were based on datathat had been acquired under ideal conditions, such as aquiet environment, and also in known cardiac and respirato-ry states, with most subjects being healthy. In addition,heart-sound cancellation studies did not account for heartsounds other than first and second sounds, and only one ofthese studies involved analysis of data from a patient [28].
Since a primary objective of respiratory sound research isto bring about improvements to monitoring and diagnosis ofrespiratory disease, the potential usefulness of any method
IEEE ENGINEERING IN MEDICINE AND BIOLOGY MAGAZINE JANUARY/FEBRUARY 2007 29
for filtering heart sounds from lung sounds rests on its abilityto perform in a clinical setting. Thus, future studies on filter-ing heart sounds from lung sounds and on heart-sound local-ization need to focus on challenging the performance oftechniques employed for these purposes by incorporatingconditions in data recording that are pertinent to clinicalapplication in terms of environment and respiratory and car-diac ailments.
January Gnitecki is a Ph.D. candidate inelectrical engineering at the University ofManitoba. Her research is based on devel-oping a clinically useful method to incorpo-rate respiratory sound signal analysis intotraditional pulmonary function testing,through modeling the effects of airway sta-tus on generation and transmission of respi-
ratory sounds. Her research has been supported by theUniversity of Manitoba, the Manitoba Institute of Child HealthBiology of Breathing Group, the Canadian AsthmaFoundation, and the Natural Sciences and EngineeringResearch Council of Canada (NSERC).
Zahra M.K. Moussavi received her B.Sc.from Sharif University of Technology, Iran,in 1987, her M.Sc. from the University ofCalgary in 1993, and her Ph.D. from theUniversity of Manitoba, Canada in 1997,all in electrical engineering. She thenjoined the respiratory research group at theWinnipeg Children’s Hospital and worked
as a research associate for one and one half years. In 1999, shejoined the Biomedical Engineering Department of JohnsHopkins University and worked there as a postdoctoral fellowfor one year. Following that, she joined the University ofManitoba, Department of Electrical and ComputerEngineering as a faculty member, where she is currently anassociate professor. She is also an adjunct scientist at theTRLab of Winnipeg. Her current research includes respiratoryand swallowing sound analysis, postural control and balance,rehabilitation and human motor learning. Dr. Moussavi is aSenior Member of the IEEE Engineering in Medicine andBiology Society, the International Lung Sounds Association(ILSA). She is currently the chapter chair of the EMBSWinnipeg Section.
Address for Correspondence: Zahra M.K. Moussavi, Dept.of Electrical and Computer Engineering, University ofManitoba, Winnipeg, MB Canada R3T 5V6. Tel: (204) 474-7023. Fax: (204) 261-4639. E-mail: [email protected].
References[1] H. Pasterkamp, S.S. Kraman, and G.R. Wodicka, “Respiratory sounds.advances beyond the stethoscope,” Amer. J. Respir. Crit Care Med., vol. 156, no.3, Pt 1, pp. 974–987, Sept. 1997.[2] H. Pasterkamp, R. Fenton, A. Tal, and V. Chernick, “Interference of cardiovas-cular sounds with phonopneumography in children,” Am. Rev. Respir. Dis., vol.131, no. 1, pp. 61–64, Jan. 1985.[3] W.K. Blake, Mechanics of Flow-Induced Sound and Vibration. Orlando, FL:Academic Press, 1986.[4] J.C. Hardin and J.L. Patterson, Jr., “Monitoring the state of the human airways byanalysis of respiratory sound,” Acta Astronaut., vol. 6, no. 9, pp. 1137–1151, Sept. 1979.[5] I.V. Vovk, V.T. Grinchenko, and V.N. Oleinik, “Modeling the acoustic proper-ties of the chest and measuring breath sounds,” Acoustical Physics, vol. 41, no. 5,pp. 667–676, 1995.[6] N. Gavriely, Y. Palti, and G. Alroy, “Spectral characteristics of normal breath
sounds,” J. Appl. Physiol, vol. 50, no. 2, pp. 307–314, Feb. 1981.[7] I. Hossain and Z. Moussavi, “Relationship between airflow and normal lungsounds,” in Proc. 24th Ann. Int. Conf. IEEE Eng. Medicine Biology Soc.,EMBC’02, Oct. 2002, pp. 1120–1122.[8] N. Gavriely and D.W. Cugell, “Airflow effects on amplitude and spectral con-tent of normal breath sounds,” J. Appl. Physiol, vol. 80, no. 1, pp. 5–13, Jan. 1996.[9] G.R. Manecke Jr, J.P. Dilger, L.J. Kutner, and P.J. Poppers, “Auscultation revis-ited: The waveform and spectral characteristics of breath sounds during generalanesthesia,” Int. J. Clin. Monit. Comput., vol. 14, no. 4, pp. 231–240, Nov. 1997.[10] N. Gavriely, M. Nissan, A.H. Rubin, and D.W. Cugell, “Spectral characteris-tics of chest wall breath sounds in normal subjects,” Thorax, vol. 50, no. 12, pp.1292–1300, Dec. 1995.[11] A.A. Luisada, “The areas of auscultation and the two main heart sounds,”Med. Times, vol. 92, pp. 8–11, Jan. 1964.[12] L. Sherwood, Human Physiology: From Cells to Systems, 4th ed. PacificGrove, CA: Brooks/Cole, 2001.[13] P.J. Arnott, G.W. Pfeiffer, and M.E. Tavel, “Spectral analysis of heart sounds:Relationships between some physical characteristics and frequency spectra of firstand second heart sounds in normals and hypertensives,” J Biomed. Eng., vol. 6, no.2, pp. 121–128, Apr. 1984.[14] J. Gnitecki, Z. Moussavi, and H. Pasterkamp, “Recursive least squares adap-tive noise cancellation filtering for heart sound reduction in lung soundsrecordings,” in Proc. 25th Ann. Int. Conf. IEEE Eng. Medicine Biology Soc.,EMBC’03, Sept. 2003, pp. 2416–2419.[15] S. Haykin, Adaptive Filter Theory, 4th ed. Upper Saddle River, NJ: Prentice-Hall, 2002.[16] A. Cohen, Biomedical Signal Processing, Volume 1: Time and FrequencyDomains Analysis. Boca Raton, FL: CRC Press, 1986.[17] V.K. Iyer, P.A. Ramamoorthy, H. Fan, and Y. Ploysongsang, “Reduction ofheart sounds from lung sounds by adaptive filtering,” IEEE Trans. Biomed. Eng.,vol. 33, no. 12, pp. 1141–1148, Dec. 1986. [published erratum appears in IEEETrans. Biomed. Eng., vol. 35, no. 1, p. 76, Jan. 1988]. [18] V.K. Iyer, Y. Ploysongsang, and P.A. Ramamoorthy, “Adaptive filtering in bio-logical signal processing,” Crit Rev. Biomed. Eng., vol. 17, no. 6, pp. 531–584, 1990.[19] Y. Ploysongsang, V.K. Iyer, and P.A. Ramamoorthy, “Characteristics of nor-mal lung sounds after adaptive filtering,” Am. Rev. Respir. Dis., vol. 139, no. 4, pp.951–956, Apr. 1989.[20] V.K. Iyer, P.A. Ramamoorthy, and Y. Ploysongsang, “Quantification of heartsounds interference with lung sounds,” J. Biomed. Eng, vol. 11, no. 2, pp.164–165, Mar. 1989.[21] Y. Ploysongsang, V.K. Iyer, and P.A. Ramamoorthy, “Inspiratory and expira-tory vesicular breath sounds,” Respiration, vol. 57, no. 5, pp. 313–317, 1990.[22] M. Kompis and E. Russi, “Adaptive heart-noise reduction of lung soundsrecorded by a single microphone,” in Proc. 14th Ann. Int. Conf. IEEE Eng.Medicine Biology Soc., EMBC ’92, 1992, pp. 691–692.[23] L. Yip and Y.T. Zhang, “Reduction of heart sounds from lung sound record-ings by automated gain control and adaptive filtering techniques,” in Proc. 23rdAnn. Int. Conf. IEEE Eng. Medicine Biology Soc., EMBC’01, pp. 2154–2156, 2001.[24] L.J. Hadjileontiadis and S.M. Panas, “Adaptive reduction of heart soundsfrom lung sounds using fourth-order statistics,” IEEE Trans. Biomed. Eng., vol.44, no. 7, pp. 642–648, July 1997.[25] J. Gnitecki, I. Hossain, H. Pasterkamp, and Z. Moussavi, “Qualitative andquantitative evaluation of heart sound reduction from lung sound recordings,”IEEE Trans. Biomed. Eng., vol. 52, no. 10, pp. 1788–1792, Oct. 2005.[26] L. Yang-Sheng, L. Wen-Hui, and Q. Guang-Xia, “Removal of the heart soundnoise from the breath sound,” in Proc. 10th Ann. Int. Conf. IEEE Eng. MedicineBiology Soc., EMBC’88, 1988, pp. 175–176.[27] S. Charleston and M.R. Azimi-Sadjadi, “Reduced order Kalman filtering forthe enhancement of respiratory sounds,” IEEE Trans. Biomed. Eng., vol. 43, no. 4,pp. 421–424, Apr. 1996.[28] S. Charleston, M.R. Azimi-Sadjadi, and R. Gonzalez-Camarena, “Interference can-cellation in respiratory sounds via a multiresolution joint time-delay and signal-estima-tion scheme,” IEEE Trans. Biomed. Eng., vol. 44, no. 10, pp. 1006–1019, Oct. 1997.[29] Z. Moussavi, D. Flores, and G. Thomas, “Heart sound cancellation based onmultiscale products and linear prediction,” in Proc. 26th Ann. Int. Conf. IEEE Eng.Medicine Biology Soc., EMBC’04, Sept. 2004, pp. 3840–3843.[30] L.T. Hall, J.L. Maple, J. Agzarian, and D. Abbott, “Sensor system for heartsound biomonitor,” Microelectronics J., vol. 31, no. 7, pp. 583–592, 2000.[31] O. Bratteli and P. Jorgenson, Wavelets Through a Looking Glass: The Worldof the Spectrum. Boston, MA: Birkhauser, 2002.[32] M.T. Pourazad, Z.K. Moussavi, and G. Thomas, “Heart sound cancellationfrom lung sound recordings using adaptive threshold and 2D interpolation in time-frequency domain,” in Proc. 25th Ann. Int. Conf. IEEE Eng. Medicine BiologySoc., EMBC’03, 2003, pp. 2586–2589.[33] S. Charleston and M.R. Azimi-Sadjadi, “Multi-resolution joint time delay andsignal estimation for processing lung sounds,” in Proc. 17th Ann. Int. Conf. IEEEEng. Medicine Biology Soc., EMBC’95, 1995, pp. 985–986.[34] L.J. Hadjileontiadis and S.M. Panas, “A wavelet-based reduction of heart soundnoise from lung sounds,” Int. J. Med. Inf., Oct. 1998, vol. 52, no. 1–3, pp. 183–190.[35] I. Hossain and Z. Moussavi, “An overview of heart-noise reduction of lungsound using wavelet transform based filter,” in Proc. 25th Ann. Int. Conf. IEEEEng. Medicine Biology Soc., EMBC’03, Sept. 2003, pp. 458–461.[36] R.R. Coifman and M.V. Wickerhauser, “Adapted waveform ‘denoising’ formedical signals and images,” IEEE Eng. Med. Biol. Mag., vol. 14, no. 5, pp. 578–586, 1995.
30 IEEE ENGINEERING IN MEDICINE AND BIOLOGY MAGAZINE JANUARY/FEBRUARY 2007
Empirical ModeDecomposition and Fractal Dimension FilterA Novel Technique for Denoising Explosive Lung Sounds
BY LEONTIOS J. HADJILEONTIADIS
© BRAND X PICTURES, TECH POOL STUDIOS
RESP
IRA
TORY
SO
UN
D A
NA
LYSI
S
0739-5175/07/$25.00©2007IEEE
Anovel technique for denoising explosive lungsounds (ELSs), such as fine/coarse crackles andsquawks (SQs), is presented here. A combination ofempirical mode decomposition (EMD) and fractal
dimension (FD) analysis is proposed to form a denoisingEMD-FD filter. The latter decomposes the data into a numberof intrinsic mode functions and automatically selects theirimportant and unimportant portions, which lead to the estima-tion of the denoised ELS signal and the background noise,respectively. Experimental results prove efficient performanceof the EMD-FD filter (mean detectability 98.4%; sensitivity98.1%; specificity 97.7%) in sustaining both time location andstructural characteristics of ELS.
Lung sounds facilitate the noninvasive diagnosis of pul-monary diseases, since the acoustic energy generated bybreathing is highly associated with the relevant pulmonary dys-function [1], [2]. One of the major issues that attracts attentionin the field of lung sound research is the accurate detectionof lung sounds, such as ELSs. This is due to the nonstation-ary nature of ELSs given that they behave as transient sig-nals of a short time duration superimposed on the underlyingvesicular sound.
The most common types of ELSs are crackles and SQs [1],[2], with crackles being further categorized to fine crackles (FCs)and coarse crackles (CCs), according to their time- and frequen-cy-domain features [3], [4]. In particular, FCs are exclusivelyinspiratory high-pitched events met in mid to late inspirationwith repetitive, pattern-like behavior over subsequent breaths [5].They are primarily initiated by explosive reopening of small air-ways that had closed during the previous expiration [5]. UnlikeFCs, CCs are both inspiratory and expiratory events with a fre-quency content lower than that of FCs, and they tend to be lessreproducible across subsequent breaths [5]. Their productionmechanism is considered to be the existence of fluid in small air-ways; thus, CCs can change pattern or clear after coughing. FCsare heard in congestive heart failure or pulmonary fibrotic dis-ease (asbestosis and idiopathic fibrosis [1]), while CCs are relat-ed to chronic bronchitis [1]. SQs are a combination of FCs andwheezes [1], similar to a short wheeze initiated with an FC. Theyare produced by explosive reopening and fluttering of the unsta-ble airway, which causes the short wheeze [5] and are associatedwith allergic alveolitis and interstitial fibrosis [5].
Many research efforts in extracting ELS from the remainingvesicular sound, which is defined as background noise in thisstudy, have shown promise, especially when involvingadvanced signal processing methodologies, such as higher-order statistics, neuro-fuzzy modeling, wavelet transform(WT), and FD. Comparative results of these approaches canbe found in [6]. Recently, a combination of WT with FD hasbeen proposed, amalgamating the advantages of both method-ologies and forming an efficient denoising tool, namely WT-FD filter [7], [8].
In this article, the combinatory approach followed in theWT-FD filter is extended to the field of EMD [9]. Instead ofWT, the EMD is employed to decompose the sound signalinto components with well-defined instantaneous frequency.Each characteristic oscillatory mode extracted, namely intrin-sic mode function (IMF), is symmetric and has a unique localfrequency, and different IMFs do not exhibit the same fre-quency at the same time [9]. In this way, the oscillatory char-acteristics of ELS are reflected to the IMFs analysis domain.Consequently, by applying FD analysis in the latter, theimportant (high FD value) and unimportant (low FD value)portions of IMFs can be identified, corresponding to ELSs andbackground noise, respectively. Since none of the signal is lostin the EMD procedure, the sum of the selected portions ofIMFs per category gives back the denoised ELSs and thebackground noise, accordingly.
The aforementioned approach forms a new denoisingtool, namely EMD-FD filter, which adaptively captures thenonstationary aspect of ELSs and successfully extracts themfrom the background noise, as demonstrated from experi-mental results drawn from the EMD-FD-based analysis ofreal lung sound recordings. This makes the EMD-FD filterapplicable to similar separation problems involving nonsta-tionary transient signals mixed with uncorrelated back-ground noise, which is considered wide-sense stationarywithin consistent segments.
Methods
EMDThe oscillatory behavior of lung sound recordings is analyzedusing EMD [9]. The EMD method is necessary to deal with

IEEE ENGINEERING IN MEDICINE AND BIOLOGY MAGAZINE JANUARY/FEBRUARY 2007
both nonstationary and nonlinear data and, contrary to almostall the previous methods, EMD is intuitive, i.e., the basis ofthe expansion is generated in a direct, a posteriori, and adap-tive way, derived from the data [9]. The main idea behindEMD is that all data consist of different simple intrinsic modesof oscillations, represented by the IMFs. An IMF represents asimple oscillatory mode as a counterpart of the simple har-monic function, yet it allows amplitude and frequency modu-lation; thus, it is much more general. According to Huang etal. [9], an IMF satisfies two conditions:➤ in the whole dataset, the number of extrema and the number
of zero-crossings must either be equal or differ at most by one➤ at any point, the mean value of the envelope defined by the
local maxima and the envelope defined by the local minimais zero. The EMD method considers the signals at their local oscil-
lation scale, subtracts the faster oscillation, and iterates the
residual. In particular, by virtue of the IMF definition, theEMD procedure for a given signal x(t ) can be summarized asfollows [9]:1) Identify the successive extrema of x(t ) based on the sign
alterations across the derivative of x(t ).2) Extract the upper and lower envelopes by interpolation,
i.e., the local maxima (minima) are connected by a cubicspline interpolation to produce the upper (lower) envelope;these envelopes should cover all the data between them.
3) Compute the average of upper and lower envelopes,m1(t ).
4) Calculate the first component h1(t ) = x(t ) − m1(t ).5) Ideally, h1(t ) should be an IMF. In reality, however, over-
shoots and undershoots are common, which also generatenew extrema and shift or exaggerate the existing ones [9].To correct this, the shifting process has to be repeated asmany times as is required to reduce the extracted signal as
31
Fig. 1. Characteristics and a working example of the proposed approach. (a) A schematic representation of the nonitera-tive structure of the EMD-FD filter. (b) Original data [Signal x (t) with arrowheads pointing out the signal of interest (ELS),eleven intrinsic modes (c1(t), l = 1, 2, . . . , 11 )] and the residue r11(t). (c) The estimated ηλ, λ = 1, 2, . . . , 11, parameter, corre-sponding to the eleven intrinsic modes of (b), from where the value of L = 3 is deduced according to (2). (d) A workingexample of the production procedure of the binary thresholds SBTH1(t) and NBTH1(t) (see Steps A3 and A4), derived from thefirst intrinsic mode C1(t).
Normalized Input Vectorx(k), k = 1,2,...,M
EMD Process (IMFs and Residue)ci (k), i = 1,2,...,N; rN (k), k = 1,2,...,M
FDD [FD-PPA] Process
Binary Thresholds
[SBTHj (k), NBTHj (k)],
j = 1,2,...,L; k = 1,2,...,M
Selection of IMFs Portions
[cjELS (k),cj
BN (k)],
j = 1,2,...,L; k = 1,2,...,M
Estimation of the EMD-FD FilterOutputs [see (5) and (6)]
[ELS : xELS (k), Noise : xBN (k)],
k = 1,2,...,M
1
0.9
0.8
0.7
0.6
0.50.4
0.3
0.2
0.1
01 2 3 4 5 6 7 8 9 10 11
L = 3
η λ
λ
1
−1
1
0.5
−0.5
−0.5
0
0.50
−0.05
0.050
−0.05
0.05
0
−0.05
0.050
−0.05
0.050
−0.1
0.1
0
−0.1
0.10
−0.1
0.1
0
−0.2
0.2
0
−0.2
0.20
−0.1
−0.1
0.1
0
0
r 11(t
)c 11
(t)
c 10(t
)c 9(
t)c 8(
t)c 7(
t)c 6(
t)c 5(
t)c 4(
t)c 3(
t)c 2(
t)c 1(
t)S
igna
l x(t
)
0.05 0.1 0.15 0.2
Time (s)
1
1.05
0
1
1.05
0.5
1
1
0
0.5
1
0
−1
0.05 0.1 0.15 0.2
0.05 0.1 0.15 0.2
0.05 0.1 0.15 0.2
0.05 0.1 0.15 0.2
0.05 0.1 0.15 0.2
Selection of L IMFs Based on the
Energy Criterion ( ηλ, λ = 1,2,...,N)
NB
TH
1(t)
SB
TH
1(t)
FD
PP
1(t)
FD
1(t)
C1(
t)
StepA1
StepA2
StepA3
StepA4
StepA5
StepA6
(a)
(b) (d)
(c)
Time (s)

32
an IMF. To this end, treat h1(t ) as a new set of data, andrepeat steps 1–4 up to k times (e.g., k = 7) until h1k(t )becomes a true IMF. Then set c1(t ) = h1k(t ). Overall, c1(t )should contain the finest scale or the shortest period compo-nent of the signal.6) Obtain the residue r1(t ) = x(t ) − c1(t ).7) Treat r1(t ) as a new set of data and repeat steps 1–6 up to
N times until the residue rN(t ) becomes a constant, amonotonic function, or a function with only one cycle fromwhich no more IMFs can be extracted. Note that even fordata with zero mean, rN(t ) still can differ from zero.
8) Finally
x(t ) =N∑
i=1
ci(t ) + rN(t ), (1)
where ci(t ) is the ith IMF and rN(t ) the final residue. The above procedure results in a decomposition of the data
into N-empirical modes and a residue rN(t ), which can beeither a monotonic function or a single cycle. It is noteworthythat, in order to apply the EMD method, there is no need for amean or zero reference; EMD only needs the locations of the
local extrema to generate the zero reference for each compo-nent (except for the residue) through the shifting process.
A useful characteristic of (1) is the potential of filtering thatit provides. Indeed, using the IMF components, a time-spacefiltering can be devised simply by selecting a specific range ofthem in the reconstruction procedure [e.g., in (1), for high-pass filtering: i = 1 : k, k < N or for bandpass one:i = b : k, 1 < b, k < N ]. This time-space filtering has theadvantage that its results preserve the full nonlinearity andnonstationary property in the physical space [10].
FD AnalysisAlthough the ability of time-space filtering offered by (1)seems to provide a solution to the denoising of ELS, it is notsufficient on its own. In fact, even when a number of IMFsare excluded from the reconstruction procedure, due to theirstrong correlation with the noise, some noise terms stillexist within the remaining IMFs, which mainly correlatewith the ELS.
A solution to this problem may be deduced from an FD-based analysis [7], [8], [11]. This is due to the property of FDto provide a relative measure of the number of basic building
IEEE ENGINEERING IN MEDICINE AND BIOLOGY MAGAZINE JANUARY/FEBRUARY 2007
Fig. 2. Extension of the EMD-FD filter to an iterative structure. (i) A schematic representation of the iterative structure of the EMD-FD filter. (ii) The performance of the EMD-FD filter when applied to (a) an ELS signal, x(t), containing FC (denoted by the arrow-heads) resulting in (b) noniterative denoised ELS output, xELS(t), (c) noniterative background noise output, xBN(t), (d) iterativedenoised ELS output, xELS
i t (t), and (e) iterative background noise output, xBNi t (t). From subplots (ii)(b) and (ii)(d), the refinement in
the performance of the EMD-FD filter due to the employment of the iterative procedure is obvious.
Step B1
Step B2
Step B3
Set xl (k) l = 1 = x(k)
For l = 1,2,...,(C)
Input xl (k) to the EMD-FD Filterand Estimate Its Output Following
Steps A1–A6[ELS: xl
ELS (k), Noise: xlBN (k)],
k = 1,2,...,M
STCl < ε xl+1 (k) = xlBN (k)No
Yes (l = C)
Normalized Input Vectorx(k), k = 1,2,...,M
Estimation of the EMD-FD FilterOutput [see (8)]
[ELS xitELS (k), Noise: xit
BN (k)],k = 1,2,...,M
−101
−1
0
1
−1
0
1
−1
0
1
−1
0
1
x itB
N(t
)x i
tELS
(t)
xELS
(t)
x(t)
xBN(t
)
0.05 0.1 0.15
0.05 0.1 0.15
0.05 0.1 0.15
0.05 0.1 0.15
0.05 0.1 0.15
Time (s)
(e)
(b)
(a)
(d)
(e)
(c)
(i)(ii)
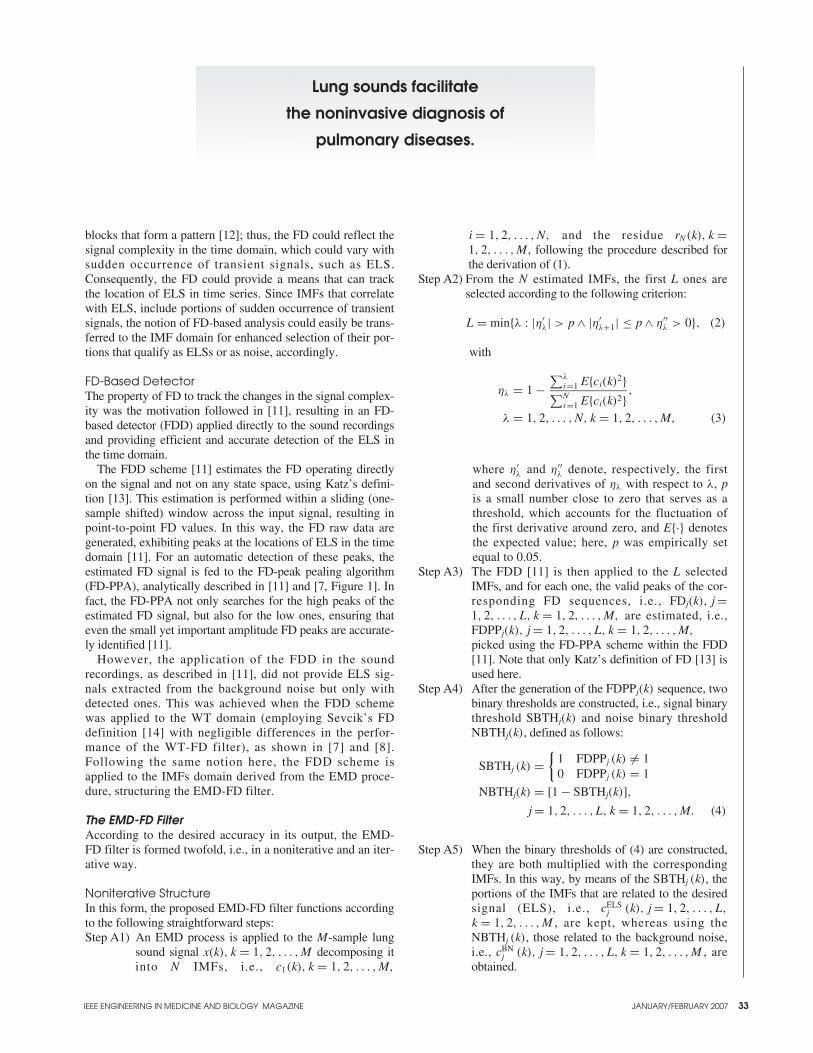
IEEE ENGINEERING IN MEDICINE AND BIOLOGY MAGAZINE JANUARY/FEBRUARY 2007 33
blocks that form a pattern [12]; thus, the FD could reflect thesignal complexity in the time domain, which could vary withsudden occurrence of transient signals, such as ELS.Consequently, the FD could provide a means that can trackthe location of ELS in time series. Since IMFs that correlatewith ELS, include portions of sudden occurrence of transientsignals, the notion of FD-based analysis could easily be trans-ferred to the IMF domain for enhanced selection of their por-tions that qualify as ELSs or as noise, accordingly.
FD-Based DetectorThe property of FD to track the changes in the signal complex-ity was the motivation followed in [11], resulting in an FD-based detector (FDD) applied directly to the sound recordingsand providing efficient and accurate detection of the ELS inthe time domain.
The FDD scheme [11] estimates the FD operating directlyon the signal and not on any state space, using Katz’s defini-tion [13]. This estimation is performed within a sliding (one-sample shifted) window across the input signal, resulting inpoint-to-point FD values. In this way, the FD raw data aregenerated, exhibiting peaks at the locations of ELS in the timedomain [11]. For an automatic detection of these peaks, theestimated FD signal is fed to the FD-peak pealing algorithm(FD-PPA), analytically described in [11] and [7, Figure 1]. Infact, the FD-PPA not only searches for the high peaks of theestimated FD signal, but also for the low ones, ensuring thateven the small yet important amplitude FD peaks are accurate-ly identified [11].
However, the application of the FDD in the soundrecordings, as described in [11], did not provide ELS sig-nals extracted from the background noise but only withdetected ones. This was achieved when the FDD schemewas applied to the WT domain (employing Sevcik’s FDdefinition [14] with negligible differences in the perfor-mance of the WT-FD filter), as shown in [7] and [8].Following the same notion here, the FDD scheme isapplied to the IMFs domain derived from the EMD proce-dure, structuring the EMD-FD filter.
The EMD-FD FilterAccording to the desired accuracy in its output, the EMD-FD filter is formed twofold, i.e., in a noniterative and an iter-ative way.
Noniterative StructureIn this form, the proposed EMD-FD filter functions accordingto the following straightforward steps:Step A1) An EMD process is applied to the M-sample lung
sound signal x(k), k = 1, 2, . . . , M decomposing itinto N IMFs, i.e., c1(k), k = 1, 2, . . . , M,
i = 1, 2, . . . , N, and the residue rN(k), k =1, 2, . . . , M, following the procedure described forthe derivation of (1).
Step A2) From the N estimated IMFs, the first L ones areselected according to the following criterion:
L = min{λ : |η′λ| > p ∧ |η′
λ+1| ≤ p ∧ η′′λ > 0}, (2)
with
ηλ = 1 −∑λ
i=1 E{ci(k)2}∑N
i=1 E{ci(k)2} ,
λ = 1, 2, . . . , N, k = 1, 2, . . . , M, (3)
where η′λ and η′′
λ denote, respectively, the firstand second derivatives of ηλ with respect to λ, pis a small number close to zero that serves as athreshold, which accounts for the fluctuation ofthe first derivative around zero, and E{·} denotesthe expected value; here, p was empirically setequal to 0.05.
Step A3) The FDD [11] is then applied to the L selectedIMFs, and for each one, the valid peaks of the cor-responding FD sequences, i.e., FDj(k), j =1, 2, . . . , L, k = 1, 2, . . . , M, are estimated, i.e.,FDPPj(k), j = 1, 2, . . . , L, k = 1, 2, . . . , M,
picked using the FD-PPA scheme within the FDD[11]. Note that only Katz’s definition of FD [13] isused here.
Step A4) After the generation of the FDPPj(k) sequence, twobinary thresholds are constructed, i.e., signal binarythreshold SBTHj(k) and noise binary thresholdNBTHj(k), defined as follows:
SBTHj (k) ={
1 FDPPj (k) �= 10 FDPPj (k) = 1
NBTHj(k) = [1 − SBTHj(k)],
j = 1, 2, . . . , L, k = 1, 2, . . . , M. (4)
Step A5) When the binary thresholds of (4) are constructed,they are both multiplied with the correspondingIMFs. In this way, by means of the SBTHj (k), theportions of the IMFs that are related to the desiredsignal (ELS), i.e., cELS
j (k), j = 1, 2, . . . , L,
k = 1, 2, . . . , M , are kept, whereas using theNBTHj (k), those related to the background noise,i.e., cBN
j (k), j = 1, 2, . . . , L, k = 1, 2, . . . , M , areobtained.
Lung sounds facilitate
the noninvasive diagnosis of
pulmonary diseases.
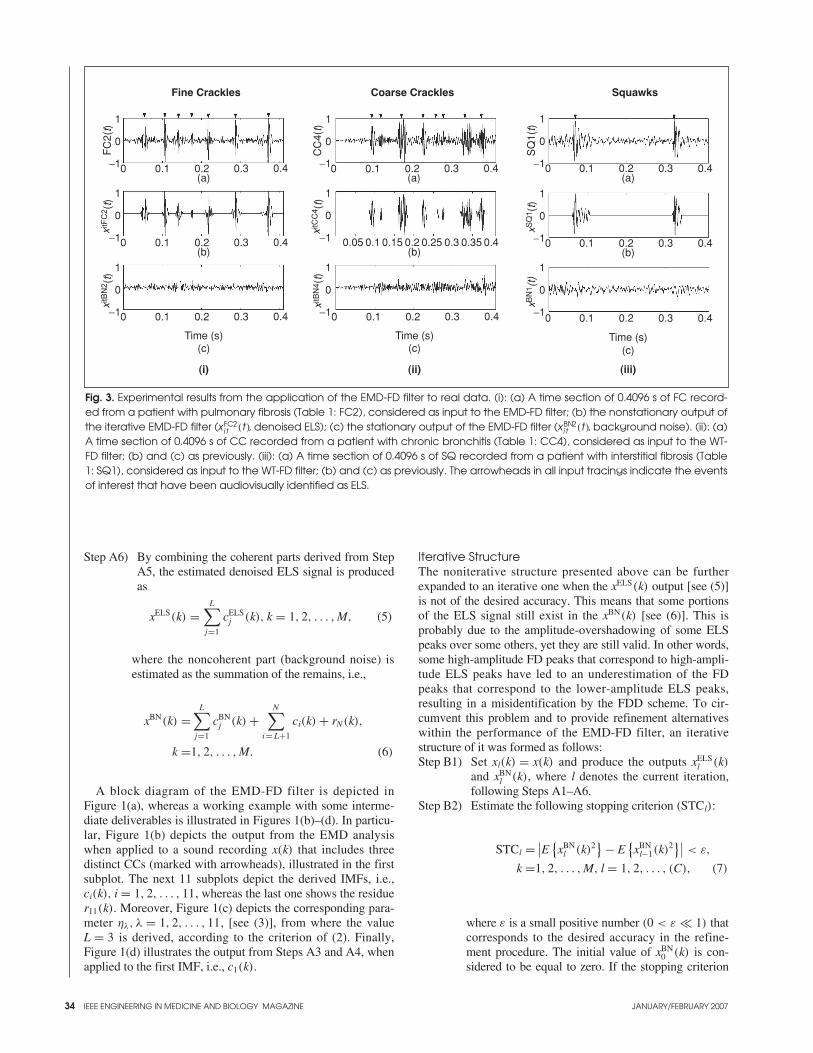
34
Step A6) By combining the coherent parts derived from StepA5, the estimated denoised ELS signal is producedas
xELS(k) =L∑
j=1
cELSj (k), k = 1, 2, . . . , M, (5)
where the noncoherent part (background noise) isestimated as the summation of the remains, i.e.,
xBN(k) =L∑
j=1
cBNj (k) +
N∑
i= L+1
ci(k) + rN(k),
k =1, 2, . . . , M. (6)
A block diagram of the EMD-FD filter is depicted inFigure 1(a), whereas a working example with some interme-diate deliverables is illustrated in Figures 1(b)–(d). In particu-lar, Figure 1(b) depicts the output from the EMD analysiswhen applied to a sound recording x(k) that includes threedistinct CCs (marked with arrowheads), illustrated in the firstsubplot. The next 11 subplots depict the derived IMFs, i.e.,ci(k), i = 1, 2, . . . , 11, whereas the last one shows the residuer11(k). Moreover, Figure 1(c) depicts the corresponding para-meter ηλ, λ = 1, 2, . . . , 11, [see (3)], from where the valueL = 3 is derived, according to the criterion of (2). Finally,Figure 1(d) illustrates the output from Steps A3 and A4, whenapplied to the first IMF, i.e., c1(k).
Iterative StructureThe noniterative structure presented above can be furtherexpanded to an iterative one when the xELS(k) output [see (5)]is not of the desired accuracy. This means that some portionsof the ELS signal still exist in the xBN(k) [see (6)]. This isprobably due to the amplitude-overshadowing of some ELSpeaks over some others, yet they are still valid. In other words,some high-amplitude FD peaks that correspond to high-ampli-tude ELS peaks have led to an underestimation of the FDpeaks that correspond to the lower-amplitude ELS peaks,resulting in a misidentification by the FDD scheme. To cir-cumvent this problem and to provide refinement alternativeswithin the performance of the EMD-FD filter, an iterativestructure of it was formed as follows:Step B1) Set xl(k) = x(k) and produce the outputs xELS
l (k)and xBN
l (k), where l denotes the current iteration,following Steps A1–A6.
Step B2) Estimate the following stopping criterion (STCl):
STCl = ∣∣E{xBN
l (k)2} − E
{xBN
l−1(k)2}∣∣ < ε,
k =1, 2, . . . , M, l = 1, 2, . . . , (C), (7)
where ε is a small positive number (0 < ε � 1) thatcorresponds to the desired accuracy in the refine-ment procedure. The initial value of xBN
0 (k) is con-sidered to be equal to zero. If the stopping criterion
IEEE ENGINEERING IN MEDICINE AND BIOLOGY MAGAZINE JANUARY/FEBRUARY 2007
Fig. 3. Experimental results from the application of the EMD-FD filter to real data. (i): (a) A time section of 0.4096 s of FC record-ed from a patient with pulmonary fibrosis (Table 1: FC2), considered as input to the EMD-FD filter; (b) the nonstationary output ofthe iterative EMD-FD filter (xFC2
i t (t), denoised ELS); (c) the stationary output of the EMD-FD filter (xBN2i t (t), background noise). (ii): (a)
A time section of 0.4096 s of CC recorded from a patient with chronic bronchitis (Table 1: CC4), considered as input to the WT-FD filter; (b) and (c) as previously. (iii): (a) A time section of 0.4096 s of SQ recorded from a patient with interstitial fibrosis (Table1: SQ1), considered as input to the WT-FD filter; (b) and (c) as previously. The arrowheads in all input tracings indicate the eventsof interest that have been audiovisually identified as ELS.
Fine Crackles
1
0
−1
1
0
−1
1
0
−1
1
0
−1
1
0
−1
1
0
−1
0 0.1 0.2 0.3 0.4
FC
2(t)
(a)
0 0.1 0.2 0.3 0.4(b)
0 0.1 0.2 0.3 0.4
(c)
0 0.1 0.2 0.3 0.4
(c)
0 0.1 0.2 0.3 0.4(a)
xitF
C2 (
t)xi
tBN
2 (t)
Time (s)
Coarse Crackles
CC
4(t)
0.05 0.1 0.15 0.2 0.25 0.3 0.35 0.4(b)
Time (s)
xitB
N4 (
t)xi
tCC
4 (t)
(ii)(i)
1
0
−1
1
0
−1
1
0
−1
Squawks
0 0.1 0.2 0.3 0.4(a)
0 0.1 0.2 0.3 0.4(b)
0 0.1 0.2 0.3 0.4
(c)Time (s)
SQ
1(t)
xSQ
1 (t)
xBN
1 (t)
(iii)

IEEE ENGINEERING IN MEDICINE AND BIOLOGY MAGAZINE JANUARY/FEBRUARY 2007 35
of (7) is not satisfied, set l = l + 1, xl(k) = xBNl−1(k) and repeat
Steps B1 and B2.Step B3) When convergence is achieved and the STCC of (7)
is met after the Cth iteration, the final output of theEMD-FD filter, i.e., denoised ELS, xELS
it (k), andbackground noise, xBN
it (k), are given as
xELSi t (k) =
C∑
l =1
xELSl (k)
and xBNi t (k) = xBN
C (k), k = 1, 2, . . . , M . (8)
From the above procedure, it is clear that the denoised ELSsignal is formed bit-by-bit, adding all the estimated ELS sig-nals derived at each iteration. In addition, the backgroundnoise estimated at the Cth iteration qualifies as the final ver-sion of the background noise, since further analysis con-tributes nothing more to the refinement procedure.
A block diagram of the iterative form of the EMD-FD filteris depicted in Figure 2(i), whereas an example of the outputderived from its noniterative form and iterative one whenapplied to a sound recording with five FCs is illustrated inFigure 2(ii). In particular, Figure 2(ii)(a) shows the recordedsounds (FCs are marked with arrowheads), while Figures2(ii)(b) and (ii)(c) present the denoised FC, xELS(k), and theestimated background noise, xBN(k), derived from the noniter-ative form of the EMD-FD filter. Clearly, the second and partof the fourth FC are still included in the xBN(k); moreover, aportion of the background noise can be identified around the
fifth FC in xBN(k) . These problems are adequatelyaddressed by the iterative form of the EMD-FD filter, as itcan be seen from its output, i.e., xELS
it (k) and xBNit (k)
(ε = 0.01; STC1 = 0.0106 ; STC2 = 0.0043 ) , presented inFigures 2(ii)(d) and (ii)(e), respectively.
Qualitative and Quantitative EvaluatorsThe evaluation procedure involved qualitative and quantita-tive evaluation of the performance of the EMD-FD filter, sim-ilar to the one followed in [8].
Briefly, the noised input and the denoised output of theEMD-FD filter were reviewed by independent experiencedpneumonologists. They classified their acoustical impressionwhen inspecting and listening to the output signals of theEMD-FD filter following the same grading procedure as in[8], for the clarity (elimination of the background noise) andelimination of distortion (preservation of the correct morphol-ogy) from the denoised ELS signals.
Similarly, the quantitative measures used in [7] and [8]were also adopted here, i.e., rate of detectability (%)[DR = (NE/NR) · 100], where NE and NR denote the numberof estimated ELSs using the EMD-FD filter and the onesaudiovisually recognized by the expert physicians, respec-tively; total performance (%) [TDR = mean(DR)]; qualityfactor
[0 ≤ SQ =
(1 − area|xELS(k)|
area|x(k)|)
≤ 1, k = 1, 2, . . . , M
]
Table 1. Performance of the EMD-FD filter for the same cases of ELS used by the WTST-NST [18] and WT-FD filters [7], [8].
ELS Diagnosis N-IT IT (%) (%)
FC1 PF 2,048 18 16 18 100 0.4306
FC2 PF 1,024 7 7 7 100 0.3445 0.368
FC3 PF 1,024 9 9 9 100 98.2
0.3428
FC4 PF 1,024 9 7 8 88.9 0.3119 0.04
FC5 PF 1,024 11 10 11 100 0.3935
FC6 IF 2,048 19 17 19 100 0.3858
CC1 CB 2,048 7 6 7 100 0.5178
CC2 CB 2,048 7 6 6 85.7 0.4070 0.403
CC3 CB 1,024 8 7 8 100 97.1 0.3137
CC4 CB 1,024 8 8 8 100 0.4511 0.08
CC5 CB 1,024 11 11 11 100 0.3260
SQ1 IF 1,024 2 2 2 100 0.6121
SQ2 IF 1,024 4 4 4 100 0.4692 0.439
SQ3 IF 1,024 5 5 5 100 100
0.6237
SQ4 AA 1,024 6 6 6 100 0.3675 0.20
SQ5 AA 2,048 26 24 26 100 0.1230
FC: Fine Crackles; CC: Coarse Crackles; SQ: Squawks. PF: Pulmonary Fibrosis; IF: Interstitial Fibrosis; CB: Chronic Bronchitis; AA: Allergic Alveolitis. M: Number of samples. NR:Number of audiovisually recognized ELS by physicians; NE: Number of estimated ELS using the EMD-FD filter in its noniterative (N-IT) and the iterative (IT) form; DR: Rate ofdetectability of the EMD-FD filter for best values of NE; TDR: Total performance; SQ: Quality factor; SQ ± std: Sample mean and sample standard deviation of the estimated SQ.Used values: ε = 0.01; p = 0.05; Sliding window length in the FD analysis Wr = 15 samples; acc = 0.01used in the FDD scheme [11].

36
[note that the same definition holds for xELSit (k)]; sensitivity
(%) [SE = 100 · TP/(TP+ FN)] and specificity (%) [SP =100 · TN/(TN + FP)], where TP, TN, FP and FN are thenumber of true positive, true negative, false positive, andfalse negative of ELS peaks, respectively [8].
Experimental Dataset and Implementation IssuesThe dataset used in the study (see Table 1) included preclassi-fied lung sound recordings corresponding to six cases of FCs(Table 1: FC1-FC6), recorded from patients with pulmonaryand interstitial fibrosis, five cases of CCs (Table 1: CC1-CC5)recorded from patients with chronic bronchitis, and five casesof SQs (Table 1: SQ1-SQ5) recorded from patients with inter-stitial fibrosis and allergic alveolitis. These recordings weredrawn from three lung sound databases [15]–[17], which areavailable to anyone, can easily be found, and secure reliablecategorization of both the pulmonary pathology and the asso-ciated lung sounds, as they are reference databases. The latterare used to train the inexperienced physicians in the interpreta-tion of the findings from a patient’s auscultation. Althoughspecific values of the flow are not given in [15]–[17], lookingat the spectrogram of the recorded sounds, it can be deducedthat data were recorded during normal breathing with moreand less constant flow. The microphone was placed whereverthe sounds were best heard. It is noteworthy that the datasetadopted here is the same as the one used for the evaluation ofother similar approaches, such as the WT stationary-nonsta-tionary (ST-NST) [18] and the WT-FD [8] filters and othersmentioned in [8]. Since the FC, CC, and SQ in the acquiredbreath sound signals present a variety in their characteristics(e.g., amplitude, level of contamination, frequency of occur-rence), this dataset can serve as a benchmark for performanceevaluation and comparison between the EMD-FD filter andprevious approaches.
The EMD-FD filter was implemented on an IBM-PC(Pentium IV/3.2 GHz) using MATLAB 6.5. After antialiasingfiltering, the lung sounds were digitized by a 12-b analog-to-digital (A/D) converter at a sampling rate of 2.5 kHz and a sec-tion of 15 s of every signal divided into successive records of1,024 or 2,048 samples each and processed by the EMD-FDfilter. The accuracy levels ε [see (7)] and acc (see [7, Figure1(b)]) were both chosen equal to 0.01, whereas the length ofthe sliding window WL, employed in the FD estimation (see [7,Sec II-B3]), was selected equal to 15 samples. The choice ofthese values has already been justified in [7], [11].
Results
Experimental ResultsSome examples of the experimental results derived from theapplication of the EMD-FD filter on the dataset (Table 1) are
depicted in Figure 3. In all cases, the position of waves audio-visually identified (by the expert physicians) as ELS weremarked with arrowheads; hence, the comparison with thoseautomatically estimated by the EMD-FD filter was facilitated.In Figure 3, for each case, parts (a)–(c) correspond to recordedlung sounds, denoised ELS, and background noise, respective-ly. In particular, Figure 3(i)(a) illustrates raw data of 1,024samples of FC, i.e., FC2(t) (Table 1: FC2). The output of theEMD-FD filter (iterative structure) in this case is shown inFigures 3(i)(b) and 3(i)(c), i.e., xFC2
it (t) and xBN2it (t), respective-
ly. When comparing xFC2it (t) with FC2(t), all structural compo-
nents of FC are easily recognized, alongside their morphologyand location, despite the existence of any amplitude variationin the FC2(t). Furthermore, no extra FP peak is generated inthe xFC2
it (t) signal, whereas the background noise xBN2it (t) is
faithfully reproduced, retaining its original amplitude and struc-ture between successive FC events, showing the adaptiveperformance of the EMD-FD filter. A similar situation can beseen in the other parts of Figure 3 for the cases of CC and SQ.In particular, Figures 3(ii)(a) and 3(iii)(a) display a time sectionof 1,024 samples of CC, CC4(t), (Table 1: CC4) and SQ,SQ1(t), (Table 1: SQ1), respectively, while Figures 3(ii)(b),3(iii)(b) and Figures 3(ii)(c), 3(iii)(c) illustrate, for each case,the denoised ELS, i.e., xCC4
it (t), xSQ1(t), and the backgroundnoise, i.e., xBN4
it (t), xBN1(t), accordingly. It should be noted thatin the case of SQ1, the displayed results are derived with thenoniterative structure of the EMD-FD filter.
From the comparison of xCC4it (t) with CC4(t), [Figure 3(ii)]
it is clear that the EMD-FD filter successfully accommodatesthe time duration and amplitude variations noticed in the latter,with the fifth and eighth CC being an exception, as their end-ing is not totally retained in the xCC4
it (t) output. However, thisdid not affect the overall auditory impressions of the twopneumonologists for the performance of the EMD-FD filter inthis case. As in Figure 3(i)(c), the background noise is adap-tively estimated here as well [Figure 3(ii)(c)].
Looking at the case of SQ depicted in Figure 3(iii) and bycomparing xSQ1(t) with SQ1(t), it is clear that the EMD-FDfilter sustains the morphology of the SQ. This is important,since SQs include both an FC and a short wheeze [1]; hence,not only their initial part corresponding to FCs but the partwith the fluctuation corresponding to the short wheeze shouldbe identified and separated from the background noise. This isclearly achieved by the EMD-FD filter, as it can be deducedfrom Figure 3(iii). Again, as in FC and CC cases, the adaptiveperformance of the EMD-FD filter is justified by the estimatedbackground noise output, xBN1(t), [Figure 3(iii)(c)].
Evaluation ResultsFrom Table 1, it is clear that the EMD-FD filter exhibits a suc-cessful performance in denoising ELSs, since it accurately
IEEE ENGINEERING IN MEDICINE AND BIOLOGY MAGAZINE JANUARY/FEBRUARY 2007
Many research efforts in extracting ELS
from the remaining vesicular sound
have shown promise.

IEEE ENGINEERING IN MEDICINE AND BIOLOGY MAGAZINE JANUARY/FEBRUARY 2007 37
identifies and extracts from the background noise almost allELS previously indicated as valid peaks by the expert pneu-monologists. This is reflected in the high values of TDR esti-mated for the best DR values of FC (TDFC
R = 98.2%), CC(TDCC
R = 97.1%), and SQ (TDSQR = 100%), as tabulated in
Table 1. Furthermore, the mean values of SQ for all ELSs, i.e.,FCs, CCs, and SQs, express high quality in the reproductionof the ELS in the nonstationary output of the EMD-FD filter,as they are far enough from zero or one, values that corre-spond to low separation quality, i.e., overestimation or under-estimation of ELS, respectively [18].
Extensive search for the presence of FP and FN per ELStype has resulted in values of SE and SP (considering 40samples as the analysis step for the estimation of TN) asfollows: SEFC = 98.6%, SPFC = 98.5%; SECC = 95.0%, SPCC = 97.2%; SESQ = 100%, SPSQ = 98.3%, and in anoverall one, i.e., SE = 98.1% and SP = 97.7%.
The results from the qualitative analysis of the perfor-mance of the EMD-FD filter, carried out by two indepen-dent pneumonologist following the same marking procedureas in [8], are illustrated in Figure 4. Clearly, experts’ mark-ings mainly include the classification categories of highlyincreased clarity (∼97% of the total ELS peaks) and undis-torted morphology (∼98% of the total ELS peaks), justify-ing the ability of the EMD-FD filter to efficiently denoiseELS and, hence, increase their audiovisual clarity andreveal their original structure.
DiscussionFrom the results presented so far, it is plausible that the EMD-FD filter attains high performance standards regarding its abil-ity to enhance ELSs by accurately extracting them from thebackground noise. Table 1 shows that the EMD-FD filtermaximizes its performance in the case of SQ. This is probablydue to the structural characteristics of SQ (FC combined withshort wheeze) that facilitate its identification at the EMDdomain, compared to the ones of FC and CC, where theirshorter duration makes their identification harder. However,as DR values indicate (see Table 1), the iterative structure ofthe EMD-FD filter refines the output of the noniterative one,achieving detailed identification of the portions of ELSsmixed with noise. In that way, the whole structure of the ELSsignals is revealed, almost in all cases.
It should be noted that in all cases of Table 1, the iterativeform of EMD-FD filter converged in two iterations for anaccuracy level of ε = 0.01, whereas the maximum value of Lwas four, while the most common value was three.Moreover, analysis suggested that further reduction of theaccuracy level ε did not account for significant gain, as far asthe recovery of possible missing ELS details in the nonsta-tionary output of the EMD-FD filter is concerned. All thesefindings indicate that the EMD-FD filter accomplishes itsefficient performance in an economical way in terms of com-putational cost, giving rise to its potential feasibility in a real-time context, using either an ordinary PC or optimized,dedicated hardware. This is further supported by the fact thatthe two parts of the EMD-FD filter, i.e., EMD and FD, actdirectly on the signal in the time domain [7], [9], [11], with-out employing any complicated transformations, whichincrease the computational complexity.
In addition to the above, the EMD-FD filter can possiblyserve as a means for potential reduction in the amount of data
that need to be archived for the analyzed input signal.Actually, by posing some criteria in its nonstationary outputderived from its generalization under different recording con-ditions, such as flows, sensor types, locations, and noise lev-els, the EMD-FD filter could help an expert system to comeup with a decision whether to store or discard the nonstation-ary signal, hence, to facilitate data-volume reduction. Thiscould be of great use in long-term recordings, such as sleeplaboratories and intensive care units.
Since the EMD-FD filter extends the idea of FD in the fieldof EMD, a comparison between the performance of the WT-FD and EMD-FD filters is desirable. Figure 4, illustrates thiscomparison based on the mean values of the qualitative evalu-ation indexes reported in [8]. From Figure 4, it is clear thatnegligible differences exist in the results from the qualitativeanalysis of both filters, indicating that the notion of FD cansuccessfully be applied to the field of EMD as in the case ofWT. This stems from the findings of Flandrin’s et al. [19],who indicate that the EMD can spontaneously realize a dyadicdecomposition, wavelet-like, in the case of the broadbandspectrum. Looking at the two different decomposition analy-ses used in the WT-FD and EMD-FD filters, i.e., waveletanalysis and EMD, respectively, the following can be noted:➤ The EMD process is built on the idea of identifying the
quantities of great physical significance, placing the focusnot on the orthogonality but on the various scales in thedata [9]. This is a clear advantage of the EMD, since thedecomposed IMFs, defined based on the local properties ofthe data, may or may not be orthogonal; hence, the EMDprocess can be applied both to linear and nonlinear data[9]. On the contrary, the discrete wavelet analysis used inthe WT-FD filter is basically a linear analysis, which miss-es physical signals having scale different from the selecteddiscrete set of its scaling parameter.
➤ In the EMD process, all data are used effectively. In theshifting process, the longest scale is defined by the full
Fig. 4. Qualitative evaluation indexes (mean values) corre-sponding to the performance of the EMD-FD and WT-FD [7],[8] filters, when applied to the dataset of Table 1. S-DIM:Severely diminished clarity; DIM: Diminished clarity; INCR:Increased clarity; H-INCR: Highly increased clarity, S-DIST:Severe distortion; M-DIST: moderate distortion; UNDIST:Undistorted sound.
100
90
80
70
60
50
40
30
20
10
0
Qua
litat
ive
Eva
luat
ion
Inde
xes
(%) (
Mea
n Va
lues
)
EMD-FDWT-FD
97.1 97.8 97.8 99.1
0.92.202.22.900
S-DIM DIMINCR
H-INCR
S-DIST
M-DIST
UMDIST
Clarity Distortion
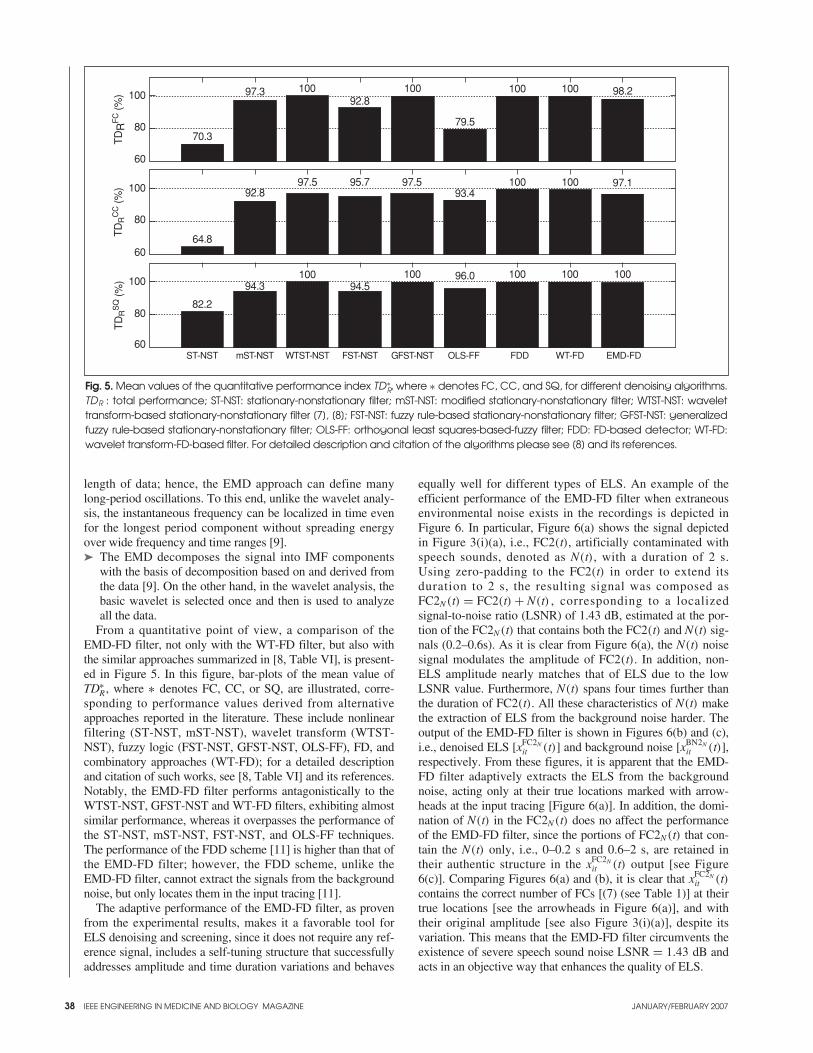
38
length of data; hence, the EMD approach can define manylong-period oscillations. To this end, unlike the wavelet analy-sis, the instantaneous frequency can be localized in time evenfor the longest period component without spreading energyover wide frequency and time ranges [9].➤ The EMD decomposes the signal into IMF components
with the basis of decomposition based on and derived fromthe data [9]. On the other hand, in the wavelet analysis, thebasic wavelet is selected once and then is used to analyzeall the data.
From a quantitative point of view, a comparison of theEMD-FD filter, not only with the WT-FD filter, but also withthe similar approaches summarized in [8, Table VI], is present-ed in Figure 5. In this figure, bar-plots of the mean value ofTD∗
R , where ∗ denotes FC, CC, or SQ, are illustrated, corre-sponding to performance values derived from alternativeapproaches reported in the literature. These include nonlinearfiltering (ST-NST, mST-NST), wavelet transform (WTST-NST), fuzzy logic (FST-NST, GFST-NST, OLS-FF), FD, andcombinatory approaches (WT-FD); for a detailed descriptionand citation of such works, see [8, Table VI] and its references.Notably, the EMD-FD filter performs antagonistically to theWTST-NST, GFST-NST and WT-FD filters, exhibiting almostsimilar performance, whereas it overpasses the performance ofthe ST-NST, mST-NST, FST-NST, and OLS-FF techniques.The performance of the FDD scheme [11] is higher than that ofthe EMD-FD filter; however, the FDD scheme, unlike theEMD-FD filter, cannot extract the signals from the backgroundnoise, but only locates them in the input tracing [11].
The adaptive performance of the EMD-FD filter, as provenfrom the experimental results, makes it a favorable tool forELS denoising and screening, since it does not require any ref-erence signal, includes a self-tuning structure that successfullyaddresses amplitude and time duration variations and behaves
equally well for different types of ELS. An example of theefficient performance of the EMD-FD filter when extraneousenvironmental noise exists in the recordings is depicted inFigure 6. In particular, Figure 6(a) shows the signal depictedin Figure 3(i)(a), i.e., FC2(t), artificially contaminated withspeech sounds, denoted as N(t), with a duration of 2 s.Using zero-padding to the FC2(t) in order to extend itsduration to 2 s, the resulting signal was composed asFC2N(t) = FC2(t) + N(t) , corresponding to a localized signal-to-noise ratio (LSNR) of 1.43 dB, estimated at the por-tion of the FC2N(t) that contains both the FC2(t) and N(t) sig-nals (0.2–0.6s). As it is clear from Figure 6(a), the N(t) noisesignal modulates the amplitude of FC2(t). In addition, non-ELS amplitude nearly matches that of ELS due to the lowLSNR value. Furthermore, N(t) spans four times further thanthe duration of FC2(t). All these characteristics of N(t) makethe extraction of ELS from the background noise harder. Theoutput of the EMD-FD filter is shown in Figures 6(b) and (c),i.e., denoised ELS [xFC2N
it (t)] and background noise [xBN2Nit (t)],
respectively. From these figures, it is apparent that the EMD-FD filter adaptively extracts the ELS from the backgroundnoise, acting only at their true locations marked with arrow-heads at the input tracing [Figure 6(a)]. In addition, the domi-nation of N(t) in the FC2N(t) does no affect the performanceof the EMD-FD filter, since the portions of FC2N(t) that con-tain the N(t) only, i.e., 0–0.2 s and 0.6–2 s, are retained intheir authentic structure in the xFC2N
it (t) output [see Figure6(c)]. Comparing Figures 6(a) and (b), it is clear that xFC2N
it (t)contains the correct number of FCs [(7) (see Table 1)] at theirtrue locations [see the arrowheads in Figure 6(a)], and withtheir original amplitude [see also Figure 3(i)(a)], despite itsvariation. This means that the EMD-FD filter circumvents theexistence of severe speech sound noise LSNR = 1.43 dB andacts in an objective way that enhances the quality of ELS.
IEEE ENGINEERING IN MEDICINE AND BIOLOGY MAGAZINE JANUARY/FEBRUARY 2007
Fig. 5. Mean values of the quantitative performance index TD∗R, where ∗ denotes FC, CC, and SQ, for different denoising algorithms.
TDR : total performance; ST-NST: stationary-nonstationary filter; mST-NST: modified stationary-nonstationary filter; WTST-NST: wavelettransform-based stationary-nonstationary filter [7], [8]; FST-NST: fuzzy rule-based stationary-nonstationary filter; GFST-NST: generalizedfuzzy rule-based stationary-nonstationary filter; OLS-FF: orthogonal least squares-based-fuzzy filter; FDD: FD-based detector; WT-FD:wavelet transform-FD-based filter. For detailed description and citation of the algorithms please see [8] and its references.
100
80
60
TD
RF
C (%
)
70.3
97.3 10092.8
100
79.5
100 100 98.2
100
80
60
TD
RC
C (%
)
64.8
92.897.5 95.7 97.5
93.4100 100 97.1
100
80
60ST-NST GFST-NST FST-NST OLS-FF FDD WT-FD EMD-FD
TD
RS
Q (%
)
82.2
94.3100
94.5100 96.0 100 100 100
mST-NST WTST-NST
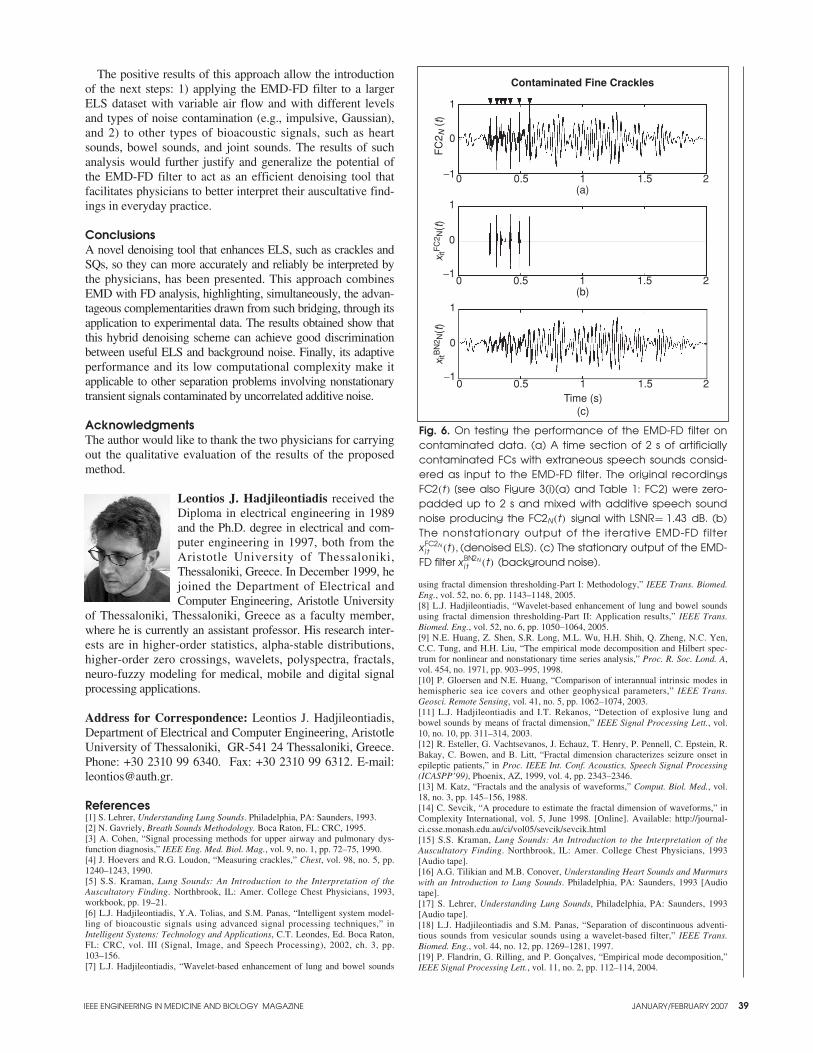
IEEE ENGINEERING IN MEDICINE AND BIOLOGY MAGAZINE JANUARY/FEBRUARY 2007 39
The positive results of this approach allow the introductionof the next steps: 1) applying the EMD-FD filter to a largerELS dataset with variable air flow and with different levelsand types of noise contamination (e.g., impulsive, Gaussian),and 2) to other types of bioacoustic signals, such as heartsounds, bowel sounds, and joint sounds. The results of suchanalysis would further justify and generalize the potential ofthe EMD-FD filter to act as an efficient denoising tool thatfacilitates physicians to better interpret their auscultative find-ings in everyday practice.
ConclusionsA novel denoising tool that enhances ELS, such as crackles andSQs, so they can more accurately and reliably be interpreted bythe physicians, has been presented. This approach combinesEMD with FD analysis, highlighting, simultaneously, the advan-tageous complementarities drawn from such bridging, through itsapplication to experimental data. The results obtained show thatthis hybrid denoising scheme can achieve good discriminationbetween useful ELS and background noise. Finally, its adaptiveperformance and its low computational complexity make itapplicable to other separation problems involving nonstationarytransient signals contaminated by uncorrelated additive noise.
AcknowledgmentsThe author would like to thank the two physicians for carryingout the qualitative evaluation of the results of the proposedmethod.
Leontios J. Hadjileontiadis received theDiploma in electrical engineering in 1989and the Ph.D. degree in electrical and com-puter engineering in 1997, both from theAristotle University of Thessaloniki,Thessaloniki, Greece. In December 1999, hejoined the Department of Electrical andComputer Engineering, Aristotle University
of Thessaloniki, Thessaloniki, Greece as a faculty member,where he is currently an assistant professor. His research inter-ests are in higher-order statistics, alpha-stable distributions,higher-order zero crossings, wavelets, polyspectra, fractals,neuro-fuzzy modeling for medical, mobile and digital signalprocessing applications.
Address for Correspondence: Leontios J. Hadjileontiadis,Department of Electrical and Computer Engineering, AristotleUniversity of Thessaloniki, GR-541 24 Thessaloniki, Greece.Phone: +30 2310 99 6340. Fax: +30 2310 99 6312. E-mail:[email protected].
References[1] S. Lehrer, Understanding Lung Sounds. Philadelphia, PA: Saunders, 1993.[2] N. Gavriely, Breath Sounds Methodology. Boca Raton, FL: CRC, 1995.[3] A. Cohen, “Signal processing methods for upper airway and pulmonary dys-function diagnosis,” IEEE Eng. Med. Biol. Mag., vol. 9, no. 1, pp. 72–75, 1990. [4] J. Hoevers and R.G. Loudon, “Measuring crackles,” Chest, vol. 98, no. 5, pp.1240–1243, 1990. [5] S.S. Kraman, Lung Sounds: An Introduction to the Interpretation of theAuscultatory Finding. Northbrook, IL: Amer. College Chest Physicians, 1993,workbook, pp. 19–21.[6] L.J. Hadjileontiadis, Y.A. Tolias, and S.M. Panas, “Intelligent system model-ling of bioacoustic signals using advanced signal processing techniques,” inIntelligent Systems: Technology and Applications, C.T. Leondes, Ed. Boca Raton,FL: CRC, vol. III (Signal, Image, and Speech Processing), 2002, ch. 3, pp.103–156.[7] L.J. Hadjileontiadis, “Wavelet-based enhancement of lung and bowel sounds
using fractal dimension thresholding-Part I: Methodology,” IEEE Trans. Biomed.Eng., vol. 52, no. 6, pp. 1143–1148, 2005.[8] L.J. Hadjileontiadis, “Wavelet-based enhancement of lung and bowel soundsusing fractal dimension thresholding-Part II: Application results,” IEEE Trans.Biomed. Eng., vol. 52, no. 6, pp. 1050–1064, 2005.[9] N.E. Huang, Z. Shen, S.R. Long, M.L. Wu, H.H. Shih, Q. Zheng, N.C. Yen,C.C. Tung, and H.H. Liu, “The empirical mode decomposition and Hilbert spec-trum for nonlinear and nonstationary time series analysis,” Proc. R. Soc. Lond. A,vol. 454, no. 1971, pp. 903–995, 1998. [10] P. Gloersen and N.E. Huang, “Comparison of interannual intrinsic modes inhemispheric sea ice covers and other geophysical parameters,” IEEE Trans.Geosci. Remote Sensing, vol. 41, no. 5, pp. 1062–1074, 2003.[11] L.J. Hadjileontiadis and I.T. Rekanos, “Detection of explosive lung andbowel sounds by means of fractal dimension,” IEEE Signal Processing Lett., vol.10, no. 10, pp. 311–314, 2003.[12] R. Esteller, G. Vachtsevanos, J. Echauz, T. Henry, P. Pennell, C. Epstein, R.Bakay, C. Bowen, and B. Litt, “Fractal dimension characterizes seizure onset inepileptic patients,” in Proc. IEEE Int. Conf. Acoustics, Speech Signal Processing(ICASPP’99), Phoenix, AZ, 1999, vol. 4, pp. 2343–2346.[13] M. Katz, “Fractals and the analysis of waveforms,” Comput. Biol. Med., vol.18, no. 3, pp. 145–156, 1988.[14] C. Sevcik, “A procedure to estimate the fractal dimension of waveforms,” inComplexity International, vol. 5, June 1998. [Online]. Available: http://journal-ci.csse.monash.edu.au/ci/vol05/sevcik/sevcik.html[15] S.S. Kraman, Lung Sounds: An Introduction to the Interpretation of theAuscultatory Finding. Northbrook, IL: Amer. College Chest Physicians, 1993[Audio tape].[16] A.G. Tilikian and M.B. Conover, Understanding Heart Sounds and Murmurswith an Introduction to Lung Sounds. Philadelphia, PA: Saunders, 1993 [Audiotape]. [17] S. Lehrer, Understanding Lung Sounds, Philadelphia, PA: Saunders, 1993[Audio tape].[18] L.J. Hadjileontiadis and S.M. Panas, “Separation of discontinuous adventi-tious sounds from vesicular sounds using a wavelet-based filter,” IEEE Trans.Biomed. Eng., vol. 44, no. 12, pp. 1269–1281, 1997. [19] P. Flandrin, G. Rilling, and P. Gonçalves, “Empirical mode decomposition,”IEEE Signal Processing Lett., vol. 11, no. 2, pp. 112–114, 2004.
Fig. 6. On testing the performance of the EMD-FD filter oncontaminated data. (a) A time section of 2 s of artificiallycontaminated FCs with extraneous speech sounds consid-ered as input to the EMD-FD filter. The original recordingsFC2(t) [see also Figure 3(i)(a) and Table 1: FC2] were zero-padded up to 2 s and mixed with additive speech soundnoise producing the FC2N(t) signal with LSNR= 1.43 dB. (b)The nonstationary output of the iterative EMD-FD filterxFC2N
i t (t), (denoised ELS). (c) The stationary output of the EMD-FD filter xBN2N
i t (t) (background noise).
1
0
−10 0.5 1 21.5
(c)Time (s)
x itB
N2 N
(t)
1
0
−10 0.5 1 21.5
(b)
x itF
C2 N
(t)
Contaminated Fine Crackles
1
0
−10 0.5 1 21.5(a)
FC
2 N (
t)
40 IEEE ENGINEERING IN MEDICINE AND BIOLOGY MAGAZINE JANUARY/FEBRUARY 2007
Crackle Sounds Analysis By Empirical ModeDecompositionNonlinear and Nonstationary Signal Analysis forDistinction of Crackles in Lung Sounds
BY SONIA CHARLESTON-VILLALOBOS,RAMÓN GONZÁLEZ-CAMARENA, GEORGINA CHI-LEM, AND TOMÁS ALJAMA-CORRALES
© BRAND X PICTURES, TECH POOL STUDIOS
RESP
IRA
TORY
SO
UN
D A
NA
LYSI
S
0739-5175/07/$25.00©2007IEEE
After the first qualitative description of normal andabnormal thoracic sounds made by Laënnec in1819 [1], formal quantitative analysis was suggest-ed and pursued by Forgacs in 1969 [2]. Such analy-
sis was mainly based on time and frequency domains, wherethe quantitative description was limited to intensity and spec-tral content of the thoracic sound signals. In this sense, furtherstudies resulted in a general classification scheme of respira-tory sounds, as proposed by the American Thoracic Society(ATS) in 1980 [3]. Respiratory sounds were classified as nor-mal, abnormal, and adventitious sounds, where adventitioussounds were divided as continuous and discontinuous.Continuous adventitious sounds were characterized by a fun-damental frequency, which is higher than 400 Hz for wheezesand lower than 200 Hz for rhonchi; they both last 250 ms ormore [3]. Discontinuous adventitious sounds, includingcrackles and squawks, showed a wide frequency bandbetween 50 and 2,000 Hz and were of shorter duration [3].
Murphy et al. [4] implemented another adventitious soundsdescription in 1977 through the time expanded waveformanalysis (TEWA). With this method, continuous sounds weredescribed as an almost sinusoidal waveform, whereas discon-tinuous sounds displayed a more complex and short wave-form. Time-domain parameters of discontinuous sounds, suchas the initial deflection width (IDW), the two cycles duration(2CD), the largest deflection width (LDW), and the short sinu-soidal pattern in the case of squawks, were later described byLoudon and Murphy [5].
Wheezes and rhonchi are relatively simple to analyze in anautomated manner on a time-frequency representation due totheir intensity, frequency content, and duration. In the cases ofcrackles and squawks, the characteristics of any particularevent, their number and timing are clinically significant, asthese features might define the type and severity of the respira-tory pathology [6]. Several efforts have been made to automati-cally detect fine and coarse crackles based on amplitude andtime-domain waveform characteristics [7], nonlinear digital fil-ters [8], and time-frequency representation [9], [10], but suchdetection and analysis have become difficult. Particularly, thetime-domain parameters IDW, 2CD, and LDW are unclear if asignal’s high-pass filtering is not considered [11], and theseparameters are vague when two or more crackles overlap.
A major problem for analyzing normal and abnormal respi-ratory sounds is their nonstationary behavior. Some attempts,such as subband filtering techniques, have been used in respi-ratory sounds analysis to deal with this behavior [12], [13],obtaining good results in terms of separating discontinuousadventitious sounds, when compared with expert visual detec-tion as gold standard.
Huang et al. [14] developed the empirical mode decomposi-tion (EMD) technique, which allows dealing with nonstation-ary and nonlinear signals. They demonstrated that EMDcorresponds to an automatic and adaptive time-varying filter-ing [14], [15]. Prompted by the characteristics of this tech-nique, the goal of this article is to explore the use of EMD toenhance crackles information from basic respiratory sounds,investigating its qualitative performance on simulated and realrespiratory data.
Methods
The Empirical Mode DecompositionThe essence of EMD is to empirically identify the intrinsicoscillatory modes of a signal by its characteristic time scales[14]. These modes, the so-called intrinsic mode functions(IMFs), represent the data by means of local zero mean oscil-lating waves obtained by a sifting process. It is worthy to notethat EMD preserves physical properties in separate IMFsbeing a complete, orthogonal, local, and adaptive decomposi-tion [14].
In the EMD technique, an IMF satisfies two conditions: 1)the number of extrema and the number of zero crossings mustbe equal or differ, at most, by one in the whole data set and 2)at any point, the mean value of the envelopes defined by thelocal maxima and the local minima is zero. Hence, a complexsignal s(t) can be represented, in terms of the IMFs, by the fol-lowing expansion:
s(t) =N∑
k =1
IMFk(t) + rN(t), (1)
where N indicates the total number of IMFs and rN(t) repre-sents a residual signal. The sifting process obtains automati-cally the IMFs as follows:
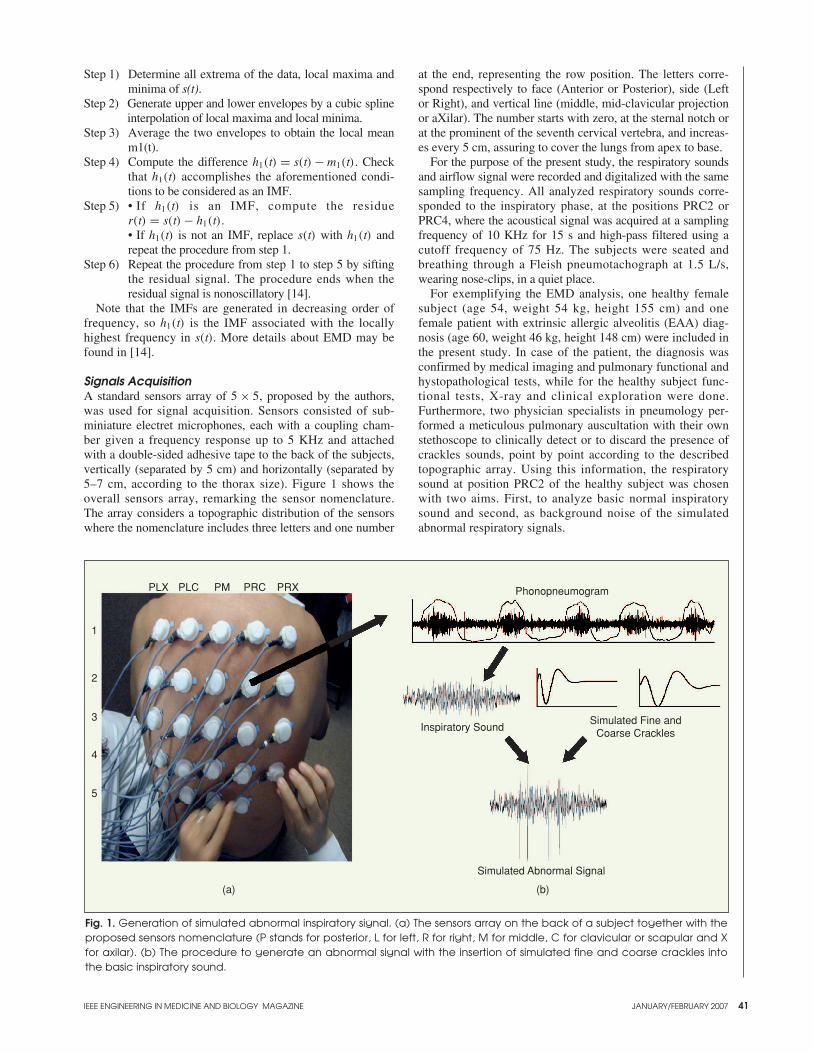
IEEE ENGINEERING IN MEDICINE AND BIOLOGY MAGAZINE JANUARY/FEBRUARY 2007
Step 1) Determine all extrema of the data, local maxima andminima of s(t).
Step 2) Generate upper and lower envelopes by a cubic splineinterpolation of local maxima and local minima.
Step 3) Average the two envelopes to obtain the local meanm1(t).
Step 4) Compute the difference h1(t) = s(t) − m1(t). Checkthat h1(t) accomplishes the aforementioned condi-tions to be considered as an IMF.
Step 5) • If h1(t) is an IMF, compute the residuer(t) = s(t) − h1(t).• If h1(t) is not an IMF, replace s(t) with h1(t) andrepeat the procedure from step 1.
Step 6) Repeat the procedure from step 1 to step 5 by siftingthe residual signal. The procedure ends when theresidual signal is nonoscillatory [14].
Note that the IMFs are generated in decreasing order offrequency, so h1(t) is the IMF associated with the locallyhighest frequency in s(t). More details about EMD may befound in [14].
Signals AcquisitionA standard sensors array of 5 × 5, proposed by the authors,was used for signal acquisition. Sensors consisted of sub-miniature electret microphones, each with a coupling cham-ber given a frequency response up to 5 KHz and attachedwith a double-sided adhesive tape to the back of the subjects,vertically (separated by 5 cm) and horizontally (separated by5–7 cm, according to the thorax size). Figure 1 shows theoverall sensors array, remarking the sensor nomenclature.The array considers a topographic distribution of the sensorswhere the nomenclature includes three letters and one number
at the end, representing the row position. The letters corre-spond respectively to face (Anterior or Posterior), side (Leftor Right), and vertical line (middle, mid-clavicular projectionor aXilar). The number starts with zero, at the sternal notch orat the prominent of the seventh cervical vertebra, and increas-es every 5 cm, assuring to cover the lungs from apex to base.
For the purpose of the present study, the respiratory soundsand airflow signal were recorded and digitalized with the samesampling frequency. All analyzed respiratory sounds corre-sponded to the inspiratory phase, at the positions PRC2 orPRC4, where the acoustical signal was acquired at a samplingfrequency of 10 KHz for 15 s and high-pass filtered using acutoff frequency of 75 Hz. The subjects were seated andbreathing through a Fleish pneumotachograph at 1.5 L/s,wearing nose-clips, in a quiet place.
For exemplifying the EMD analysis, one healthy femalesubject (age 54, weight 54 kg, height 155 cm) and onefemale patient with extrinsic allergic alveolitis (EAA) diag-nosis (age 60, weight 46 kg, height 148 cm) were included inthe present study. In case of the patient, the diagnosis wasconfirmed by medical imaging and pulmonary functional andhystopathological tests, while for the healthy subject func-tional tests, X-ray and clinical exploration were done.Furthermore, two physician specialists in pneumology per-formed a meticulous pulmonary auscultation with their ownstethoscope to clinically detect or to discard the presence ofcrackles sounds, point by point according to the describedtopographic array. Using this information, the respiratorysound at position PRC2 of the healthy subject was chosenwith two aims. First, to analyze basic normal inspiratorysound and second, as background noise of the simulatedabnormal respiratory signals.
Fig. 1. Generation of simulated abnormal inspiratory signal. (a) The sensors array on the back of a subject together with theproposed sensors nomenclature (P stands for posterior, L for left, R for right, M for middle, C for clavicular or scapular and Xfor axilar). (b) The procedure to generate an abnormal signal with the insertion of simulated fine and coarse crackles intothe basic inspiratory sound.
1
2
3
4
5
PLX PLC PM PRC PRX Phonopneumogram
Inspiratory SoundSimulated Fine and
Coarse Crackles
Simulated Abnormal Signal
(a) (b)
41
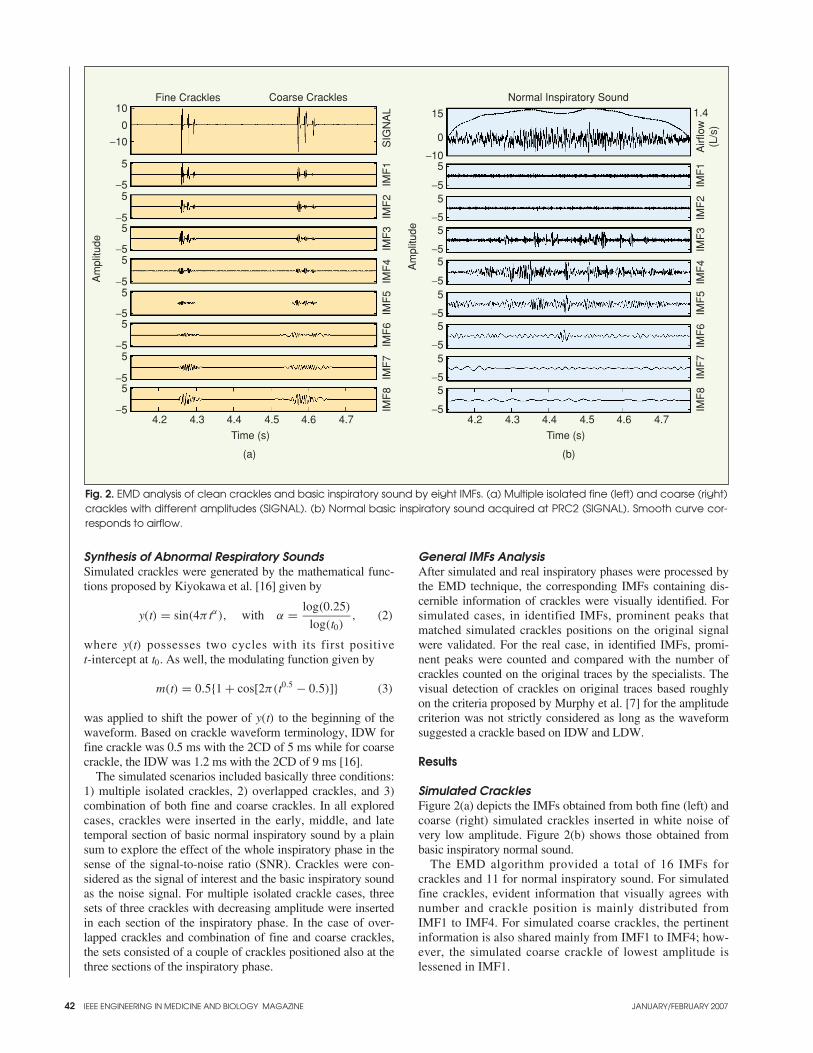
42
Synthesis of Abnormal Respiratory SoundsSimulated crackles were generated by the mathematical func-tions proposed by Kiyokawa et al. [16] given by
y(t) = sin(4π tα), with α = log(0.25)
log(t0), (2)
where y(t) possesses two cycles with its first positive t-intercept at t0. As well, the modulating function given by
m(t) = 0.5{1 + cos[2π(t0.5 − 0.5)]} (3)
was applied to shift the power of y(t) to the beginning of thewaveform. Based on crackle waveform terminology, IDW forfine crackle was 0.5 ms with the 2CD of 5 ms while for coarsecrackle, the IDW was 1.2 ms with the 2CD of 9 ms [16].
The simulated scenarios included basically three conditions:1) multiple isolated crackles, 2) overlapped crackles, and 3)combination of both fine and coarse crackles. In all exploredcases, crackles were inserted in the early, middle, and latetemporal section of basic normal inspiratory sound by a plainsum to explore the effect of the whole inspiratory phase in thesense of the signal-to-noise ratio (SNR). Crackles were con-sidered as the signal of interest and the basic inspiratory soundas the noise signal. For multiple isolated crackle cases, threesets of three crackles with decreasing amplitude were insertedin each section of the inspiratory phase. In the case of over-lapped crackles and combination of fine and coarse crackles,the sets consisted of a couple of crackles positioned also at thethree sections of the inspiratory phase.
General IMFs AnalysisAfter simulated and real inspiratory phases were processed bythe EMD technique, the corresponding IMFs containing dis-cernible information of crackles were visually identified. Forsimulated cases, in identified IMFs, prominent peaks thatmatched simulated crackles positions on the original signalwere validated. For the real case, in identified IMFs, promi-nent peaks were counted and compared with the number ofcrackles counted on the original traces by the specialists. Thevisual detection of crackles on original traces based roughlyon the criteria proposed by Murphy et al. [7] for the amplitudecriterion was not strictly considered as long as the waveformsuggested a crackle based on IDW and LDW.
Results
Simulated Crackles Figure 2(a) depicts the IMFs obtained from both fine (left) andcoarse (right) simulated crackles inserted in white noise ofvery low amplitude. Figure 2(b) shows those obtained frombasic inspiratory normal sound.
The EMD algorithm provided a total of 16 IMFs forcrackles and 11 for normal inspiratory sound. For simulatedfine crackles, evident information that visually agrees withnumber and crackle position is mainly distributed fromIMF1 to IMF4. For simulated coarse crackles, the pertinentinformation is also shared mainly from IMF1 to IMF4; how-ever, the simulated coarse crackle of lowest amplitude islessened in IMF1.
IEEE ENGINEERING IN MEDICINE AND BIOLOGY MAGAZINE JANUARY/FEBRUARY 2007
Fig. 2. EMD analysis of clean crackles and basic inspiratory sound by eight IMFs. (a) Multiple isolated fine (left) and coarse (right)crackles with different amplitudes (SIGNAL). (b) Normal basic inspiratory sound acquired at PRC2 (SIGNAL). Smooth curve cor-responds to airflow.
10
0
5
5−5
−55
−55
−55
−55
−55
−55
−5
−10
Am
plitu
de
15
0
5
5−5
−55
−55
−55
−55
−55
−55
−5
−10
Am
plitu
de4.2 4.3 4.4 4.5 4.6 4.7
Time (s)
4.2 4.3 4.4 4.5 4.6 4.7
Time (s)
IMF
8IM
F7
IMF
6IM
F5
IMF
4IM
F3
IMF
2IM
F1
SIG
NA
L
IMF
8IM
F7
IMF
6IM
F5
IMF
4IM
F3
IMF
2IM
F1
Airf
low
(L/s
)
1.4Fine Crackles Coarse Crackles Normal Inspiratory Sound
(a) (b)
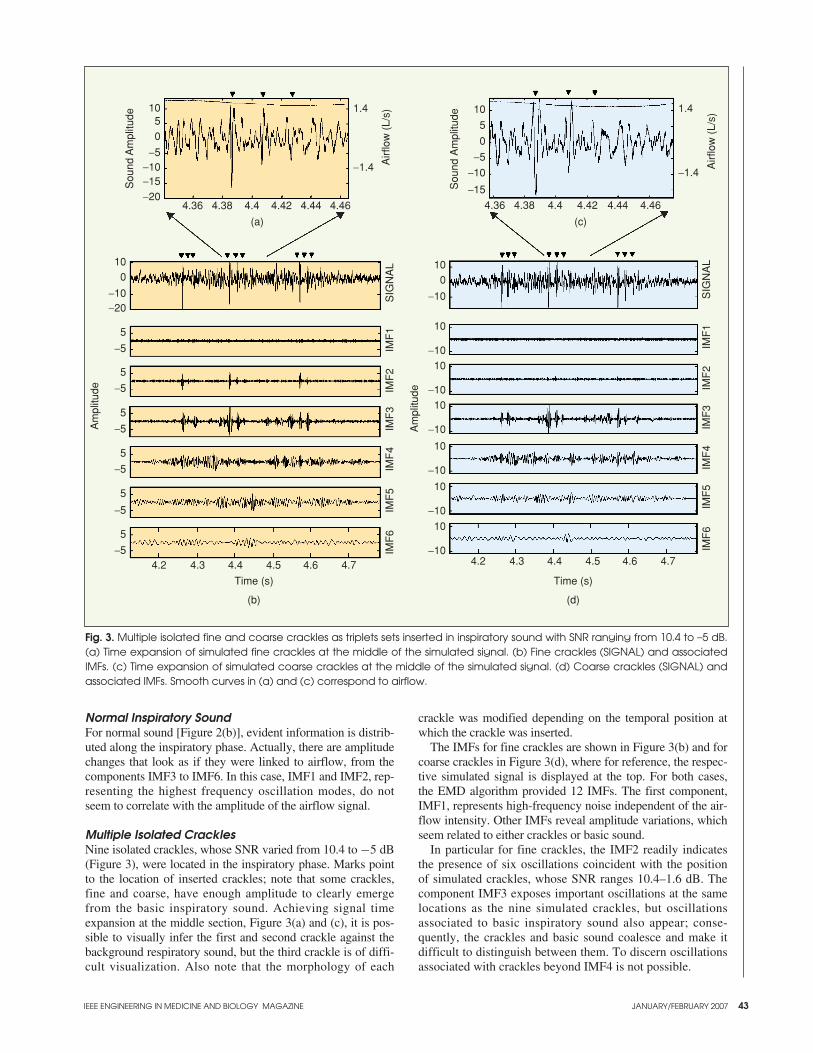
IEEE ENGINEERING IN MEDICINE AND BIOLOGY MAGAZINE JANUARY/FEBRUARY 2007 43
Normal Inspiratory SoundFor normal sound [Figure 2(b)], evident information is distrib-uted along the inspiratory phase. Actually, there are amplitudechanges that look as if they were linked to airflow, from thecomponents IMF3 to IMF6. In this case, IMF1 and IMF2, rep-resenting the highest frequency oscillation modes, do notseem to correlate with the amplitude of the airflow signal.
Multiple Isolated Crackles Nine isolated crackles, whose SNR varied from 10.4 to −5 dB(Figure 3), were located in the inspiratory phase. Marks pointto the location of inserted crackles; note that some crackles,fine and coarse, have enough amplitude to clearly emergefrom the basic inspiratory sound. Achieving signal timeexpansion at the middle section, Figure 3(a) and (c), it is pos-sible to visually infer the first and second crackle against thebackground respiratory sound, but the third crackle is of diffi-cult visualization. Also note that the morphology of each
crackle was modified depending on the temporal position atwhich the crackle was inserted.
The IMFs for fine crackles are shown in Figure 3(b) and forcoarse crackles in Figure 3(d), where for reference, the respec-tive simulated signal is displayed at the top. For both cases,the EMD algorithm provided 12 IMFs. The first component,IMF1, represents high-frequency noise independent of the air-flow intensity. Other IMFs reveal amplitude variations, whichseem related to either crackles or basic sound.
In particular for fine crackles, the IMF2 readily indicatesthe presence of six oscillations coincident with the positionof simulated crackles, whose SNR ranges 10.4–1.6 dB. Thecomponent IMF3 exposes important oscillations at the samelocations as the nine simulated crackles, but oscillationsassociated to basic inspiratory sound also appear; conse-quently, the crackles and basic sound coalesce and make itdifficult to distinguish between them. To discern oscillationsassociated with crackles beyond IMF4 is not possible.
Fig. 3. Multiple isolated fine and coarse crackles as triplets sets inserted in inspiratory sound with SNR ranging from 10.4 to –5 dB.(a) Time expansion of simulated fine crackles at the middle of the simulated signal. (b) Fine crackles (SIGNAL) and associatedIMFs. (c) Time expansion of simulated coarse crackles at the middle of the simulated signal. (d) Coarse crackles (SIGNAL) andassociated IMFs. Smooth curves in (a) and (c) correspond to airflow.
(a) (c)
1050
−5−10−15−20
Sou
nd A
mpl
itude
4.36 4.38 4.4 4.42 4.44 4.46
1.4
−1.4 Airf
low
(L/
s)
100
5
−5
5
−5
5
−5
5
−5
5
−5
5
−5
−10−20
Am
plitu
de
10
10
0
−10
−1010
−1010
−10
10
−10
10
−10
10
−10
Am
plitu
de
IMF
6IM
F5
IMF
4IM
F3
IMF
2IM
F1
SIG
NA
L
IMF
6IM
F5
IMF
4IM
F3
IMF
2IM
F1
SIG
NA
L
10
5
0
−5
−10
−15Sou
nd A
mpl
itude
4.36 4.38 4.4 4.42 4.44 4.46
1.4
−1.4
Airf
low
(L/
s)
4.2 4.3 4.4 4.5 4.6 4.7
Time (s)
(b)
4.2 4.3 4.4 4.5 4.6 4.7
Time (s)
(d)
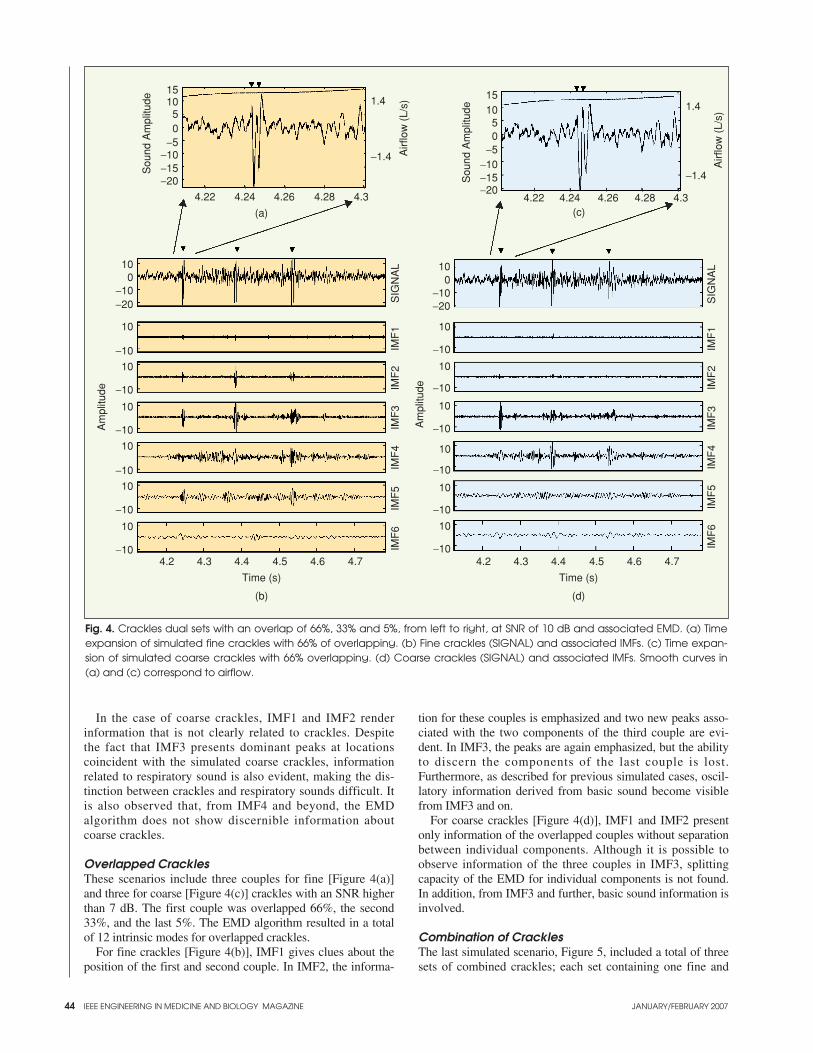
44
In the case of coarse crackles, IMF1 and IMF2 renderinformation that is not clearly related to crackles. Despitethe fact that IMF3 presents dominant peaks at locationscoincident with the simulated coarse crackles, informationrelated to respiratory sound is also evident, making the dis-tinction between crackles and respiratory sounds difficult. Itis also observed that, from IMF4 and beyond, the EMDalgorithm does not show discernible information aboutcoarse crackles.
Overlapped Crackles These scenarios include three couples for fine [Figure 4(a)]and three for coarse [Figure 4(c)] crackles with an SNR higherthan 7 dB. The first couple was overlapped 66%, the second33%, and the last 5%. The EMD algorithm resulted in a totalof 12 intrinsic modes for overlapped crackles.
For fine crackles [Figure 4(b)], IMF1 gives clues about theposition of the first and second couple. In IMF2, the informa-
tion for these couples is emphasized and two new peaks asso-ciated with the two components of the third couple are evi-dent. In IMF3, the peaks are again emphasized, but the abilityto discern the components of the last couple is lost.Furthermore, as described for previous simulated cases, oscil-latory information derived from basic sound become visiblefrom IMF3 and on.
For coarse crackles [Figure 4(d)], IMF1 and IMF2 presentonly information of the overlapped couples without separationbetween individual components. Although it is possible toobserve information of the three couples in IMF3, splittingcapacity of the EMD for individual components is not found.In addition, from IMF3 and further, basic sound information isinvolved.
Combination of CracklesThe last simulated scenario, Figure 5, included a total of threesets of combined crackles; each set containing one fine and
IEEE ENGINEERING IN MEDICINE AND BIOLOGY MAGAZINE JANUARY/FEBRUARY 2007
Fig. 4. Crackles dual sets with an overlap of 66%, 33% and 5%, from left to right, at SNR of 10 dB and associated EMD. (a) Timeexpansion of simulated fine crackles with 66% of overlapping. (b) Fine crackles (SIGNAL) and associated IMFs. (c) Time expan-sion of simulated coarse crackles with 66% overlapping. (d) Coarse crackles (SIGNAL) and associated IMFs. Smooth curves in(a) and (c) correspond to airflow.
(a)
1015
50
−5−10−15−20
Sou
nd A
mpl
itude
4.22 4.24 4.26 4.28 4.3
1.4
−1.4 Airf
low
(L/
s)
10
10
−10
−10
10
−10
10
−10
10
−10
10
−10
10
−10
0
−20
Am
plitu
de
IMF
6IM
F5
IMF
4IM
F3
IMF
2IM
F1
SIG
NA
L 10
10
0−10−20
−10
10
−10
10
−10
10
−10
10
−10
10
−10
Am
plitu
de
IMF
6IM
F5
IMF
4IM
F3
IMF
2IM
F1
SIG
NA
L
1510
50
−5−10−15−20
Sou
nd A
mpl
itude
4.22 4.24 4.26 4.28 4.3
1.4
−1.4
Airf
low
(L/
s)
4.2 4.3 4.4 4.5 4.6 4.7
Time (s)
4.2 4.3 4.4 4.5 4.6 4.7
Time (s)
(d)(b)
(c)
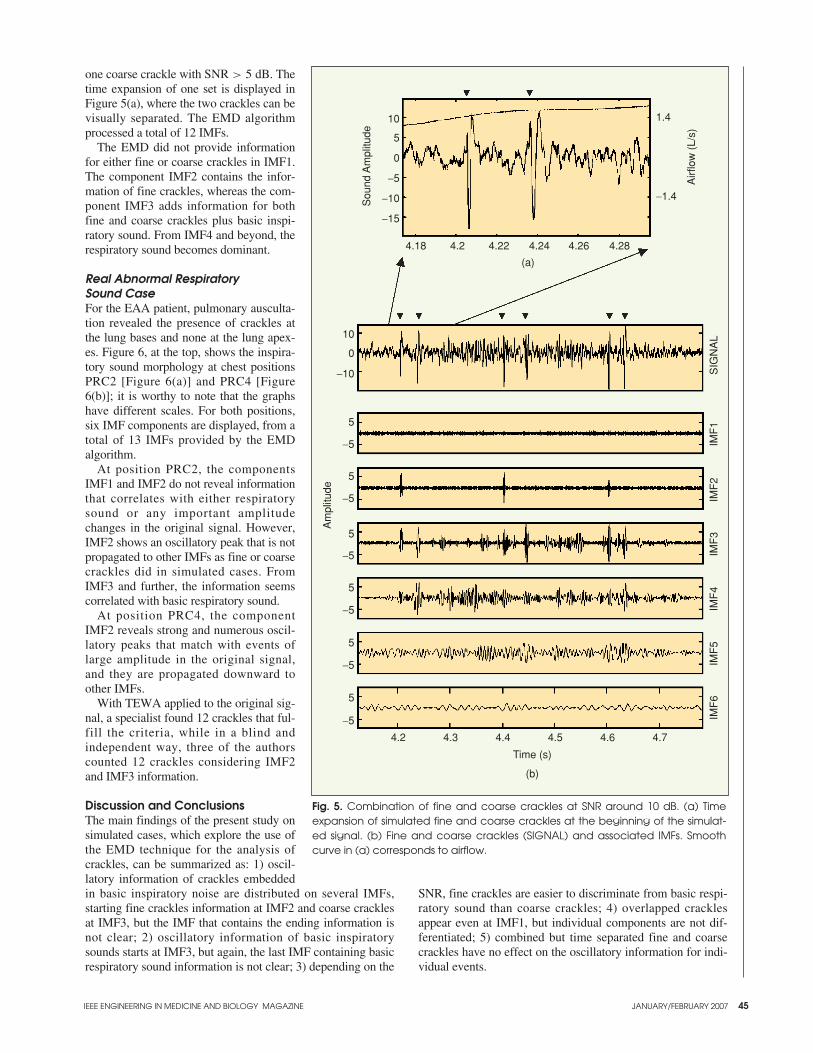
IEEE ENGINEERING IN MEDICINE AND BIOLOGY MAGAZINE JANUARY/FEBRUARY 2007 45
one coarse crackle with SNR > 5 dB. Thetime expansion of one set is displayed inFigure 5(a), where the two crackles can bevisually separated. The EMD algorithmprocessed a total of 12 IMFs.
The EMD did not provide informationfor either fine or coarse crackles in IMF1.The component IMF2 contains the infor-mation of fine crackles, whereas the com-ponent IMF3 adds information for bothfine and coarse crackles plus basic inspi-ratory sound. From IMF4 and beyond, therespiratory sound becomes dominant.
Real Abnormal Respiratory Sound CaseFor the EAA patient, pulmonary ausculta-tion revealed the presence of crackles atthe lung bases and none at the lung apex-es. Figure 6, at the top, shows the inspira-tory sound morphology at chest positionsPRC2 [Figure 6(a)] and PRC4 [Figure6(b)]; it is worthy to note that the graphshave different scales. For both positions,six IMF components are displayed, from atotal of 13 IMFs provided by the EMDalgorithm.
At position PRC2, the componentsIMF1 and IMF2 do not reveal informationthat correlates with either respiratorysound or any important amplitudechanges in the original signal. However,IMF2 shows an oscillatory peak that is notpropagated to other IMFs as fine or coarsecrackles did in simulated cases. FromIMF3 and further, the information seemscorrelated with basic respiratory sound.
At position PRC4, the componentIMF2 reveals strong and numerous oscil-latory peaks that match with events oflarge amplitude in the original signal,and they are propagated downward toother IMFs.
With TEWA applied to the original sig-nal, a specialist found 12 crackles that ful-fill the criteria, while in a blind andindependent way, three of the authorscounted 12 crackles considering IMF2and IMF3 information.
Discussion and ConclusionsThe main findings of the present study onsimulated cases, which explore the use ofthe EMD technique for the analysis ofcrackles, can be summarized as: 1) oscil-latory information of crackles embeddedin basic inspiratory noise are distributed on several IMFs,starting fine crackles information at IMF2 and coarse cracklesat IMF3, but the IMF that contains the ending information isnot clear; 2) oscillatory information of basic inspiratorysounds starts at IMF3, but again, the last IMF containing basicrespiratory sound information is not clear; 3) depending on the
SNR, fine crackles are easier to discriminate from basic respi-ratory sound than coarse crackles; 4) overlapped cracklesappear even at IMF1, but individual components are not dif-ferentiated; 5) combined but time separated fine and coarsecrackles have no effect on the oscillatory information for indi-vidual events.
Fig. 5. Combination of fine and coarse crackles at SNR around 10 dB. (a) Timeexpansion of simulated fine and coarse crackles at the beginning of the simulat-ed signal. (b) Fine and coarse crackles (SIGNAL) and associated IMFs. Smoothcurve in (a) corresponds to airflow.
(b)
(a)
10
5
0
−5
−10
−15
Sou
nd A
mpl
itude
4.18 4.2 4.22 4.24 4.26 4.28
1.4
−1.4
10
0
−10
5
−5
5
−5
5
−5
5
−5
5
−5
5
−5
Am
plitu
de
IMF
6IM
F5
IMF
4IM
F3
IMF
2IM
F1
SIG
NA
L
4.2 4.3 4.4 4.5 4.6 4.7
Time (s)
Airf
low
(L/
s)
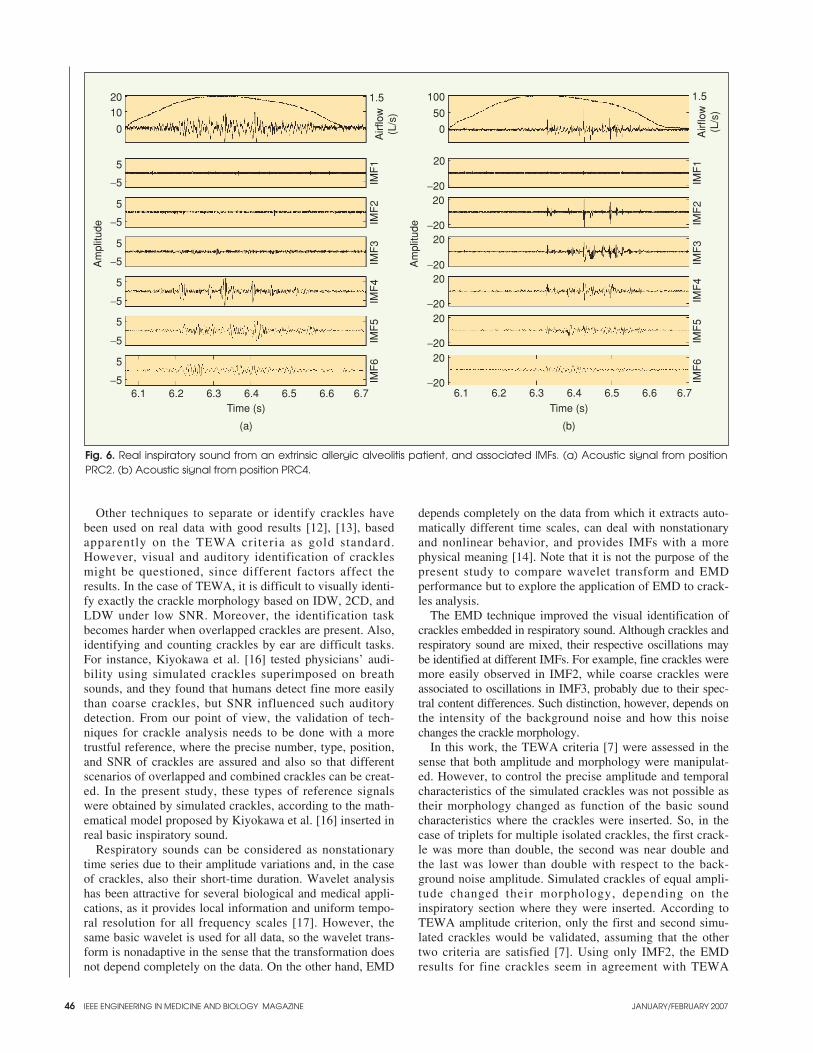
46
Other techniques to separate or identify crackles havebeen used on real data with good results [12], [13], basedapparently on the TEWA criteria as gold standard.However, visual and auditory identification of cracklesmight be questioned, since different factors affect theresults. In the case of TEWA, it is difficult to visually identi-fy exactly the crackle morphology based on IDW, 2CD, andLDW under low SNR. Moreover, the identification taskbecomes harder when overlapped crackles are present. Also,identifying and counting crackles by ear are difficult tasks.For instance, Kiyokawa et al. [16] tested physicians’ audi-bility using simulated crackles superimposed on breathsounds, and they found that humans detect fine more easilythan coarse crackles, but SNR influenced such auditorydetection. From our point of view, the validation of tech-niques for crackle analysis needs to be done with a moretrustful reference, where the precise number, type, position,and SNR of crackles are assured and also so that differentscenarios of overlapped and combined crackles can be creat-ed. In the present study, these types of reference signalswere obtained by simulated crackles, according to the math-ematical model proposed by Kiyokawa et al. [16] inserted inreal basic inspiratory sound.
Respiratory sounds can be considered as nonstationarytime series due to their amplitude variations and, in the caseof crackles, also their short-time duration. Wavelet analysishas been attractive for several biological and medical appli-cations, as it provides local information and uniform tempo-ral resolution for all frequency scales [17]. However, thesame basic wavelet is used for all data, so the wavelet trans-form is nonadaptive in the sense that the transformation doesnot depend completely on the data. On the other hand, EMD
depends completely on the data from which it extracts auto-matically different time scales, can deal with nonstationaryand nonlinear behavior, and provides IMFs with a morephysical meaning [14]. Note that it is not the purpose of thepresent study to compare wavelet transform and EMDperformance but to explore the application of EMD to crack-les analysis.
The EMD technique improved the visual identification ofcrackles embedded in respiratory sound. Although crackles andrespiratory sound are mixed, their respective oscillations maybe identified at different IMFs. For example, fine crackles weremore easily observed in IMF2, while coarse crackles wereassociated to oscillations in IMF3, probably due to their spec-tral content differences. Such distinction, however, depends onthe intensity of the background noise and how this noisechanges the crackle morphology.
In this work, the TEWA criteria [7] were assessed in thesense that both amplitude and morphology were manipulat-ed. However, to control the precise amplitude and temporalcharacteristics of the simulated crackles was not possible astheir morphology changed as function of the basic soundcharacteristics where the crackles were inserted. So, in thecase of triplets for multiple isolated crackles, the first crack-le was more than double, the second was near double andthe last was lower than double with respect to the back-ground noise amplitude. Simulated crackles of equal ampli-tude changed their morphology, depending on theinspiratory section where they were inserted. According toTEWA amplitude criterion, only the first and second simu-lated crackles would be validated, assuming that the othertwo criteria are satisfied [7]. Using only IMF2, the EMDresults for fine crackles seem in agreement with TEWA
IEEE ENGINEERING IN MEDICINE AND BIOLOGY MAGAZINE JANUARY/FEBRUARY 2007
Fig. 6. Real inspiratory sound from an extrinsic allergic alveolitis patient, and associated IMFs. (a) Acoustic signal from positionPRC2. (b) Acoustic signal from position PRC4.
20
5
10
0
−5
5
−5
5
−5
5
−5
5
−5
5
−56.1 6.2 6.3 6.4 6.5 6.6 6.7 6.1 6.2 6.3 6.4 6.5 6.6 6.7
100
20
50
0
−2020
−2020
−2020
−2020
−2020
−20
Am
plitu
de
Am
plitu
de1.5
Airf
low
(L/s
)
IMF
1IM
F2
IMF
3IM
F4
IMF
5IM
F6
1.5
Airf
low
(L/s
)
IMF
1IM
F2
IMF
3IM
F4
IMF
5IM
F6
Time (s) Time (s)
(b)(a)

IEEE ENGINEERING IN MEDICINE AND BIOLOGY MAGAZINE JANUARY/FEBRUARY 2007 47
criteria results. However, oscillations associated with thelowest amplitude fine crackles and the triplet sets for coarsecrackles could be distinguished in IMF3 and subsequentmodes. Since crackles information is propagated to morethan one IMF, combining information from different IMFscould help to identify even low amplitude fine and coarsecrackles and discard artifacts. Therefore, the EMD analysismay assist, in addition to crackles counting, to determinethe crackles type.
A major TEWA drawback is the case of crackles overlap-ping, when the morphology is largely distorted. Thus, theTEWA criteria are not useful and overlapped crackles mightbe considered as artifacts. Conversely, EMD analysis isadvantageous because it generates oscillations that are associ-ated with crackle locations, and it could separate individualfine crackles that overlapped by a small amount.
Since the presence of fine and coarse crackles within thesame signal had no effect on each other, combined cracklesresults resemble and reinforce observations derived from mul-tiple isolated crackles.
The present study had some limitations that should be men-tioned. First, simulated signals were generated using only onebasic inspiratory sound from a healthy subject, and the possi-ble influence of pulmonary diseases was not explored.Second, since just the sound at position PRC2 was used asbackground noise, spatial differences were also not consid-ered. Third, the analysis of EMD results were qualitative, soautomatic procedure to detect and to count crackles was notdeveloped. Fourth, exploration on real cases was done asexample in only one patient, so additional work to generalizeEMD results is necessary.
In conclusion, this article proposes the application of anewly developed signal analysis technique, the EMD, to detectfine and coarse crackles. The qualitative evaluation by inspect-ing the results of simulated and real cases demonstrates thatEMD application is promising, especially for low SNR and forisolated or overlapped fine crackles. For coarse crackles, thetask to identify their position and type is more demanding.Future work includes joining EMD with other signal process-ing techniques, to determine whether identification of cracklesor any other adventitious events may be improved.
Sonia Charleston-Villalobos received thePh.D. degree in science in 1996 from theUniversidad Autónoma Metropolitana ofMexico City, Mexico (UAM). Currently,she is a professor, and her interests arerelated to digital signal and image process-ing as applied to biomedical engineeringproblems.
Ramón González-Camarena received theM.D. degree in 1978 from the UniversidadNacional Autónoma de México, and thePh.D. degree in 2000 from UAM. Hisresearch interests are in the general areas ofcardiopulmonary physiology, respiratoryacoustic, and biomedical signal processing.
Georgina Chi-Lem received the M.D. degree and herFRCPC Pneumology in 1994 from the Universidad Nacional
Autónoma de México. She is now working at the RespiratorySounds Laboratory where her research interests are focusedon medical applications of computerized respiratory soundanalysis for the diagnosis of respiratory diseases.
Tomás Aljama-Corrales received thePh.D. degree in science in 2001 from UAM.His Ph.D. research activities were conductedat the Electrical Engineering Departments of Colorado State University and TexasTech University. He is working now as aprofessor for the Electrical EngineeringDepartment at UAM, and his interests are
related to biomedical signal and image processing.
Address for Correspondence: Sonia Charleston-Villalobos,Electrical Engineering Department (T-163), UniversidadAutónoma Metropolitana-Iztapalapa, Av. San RafaelAtlixco 186, Col. Vicentina, Iztapalapa, Mexico City09340, México. Phone: +52 55 5 804 4903 to 4905, ext.210. Fax: +52 55 5 804 4628. E-mail: [email protected], [email protected].
References[1] R.T.H. Laënnec, De l’auscultation mediate ou traité du diagnostic de mal-adiesd des poumons et du Coeur, fondé principalement sur ce nouveau moyend’exploration. Paris: Brosson et Chaudé, 1819.[2] P. Forgacs, “Lung sounds,” Brit. J. Dis. Chest., vol. 63, no. 1, pp. 1–12, 1969.[3] R.L. Murphy and S.K. Holford, “Lung sounds,” ATS News, vol. 8, no. 4, pp.24–29, 1980.[4] R.L. Murphy, S.K. Holford, and W.C. Knowler, “Visual lung sound characteri-zation by time-expanded waveform analysis,” N. Eng. J. Med., vol. 296, no. 17,pp. 968–971, 1977.[5] R. Loudon and R.L. Murphy, “Lung sounds,” Amer. Rev. Respir. Dis., vol.130, no. 4, pp. 663–673, 1984. .[6] H. Pasterkamp, S.S. Kraman, and G.R. Wodicka, “Respiratory sounds:Advances beyond the stethoscope,” Amer. J. Respir. Crit. Care Med., vol. 156, no.3 pt. 1, pp. 974–987, 1997.[7] R.L.H. Murphy, E.A. Del Bono, and F. Davidson, “Validation of an automat-ic crackle (rale) counter,” Amer. Rev. Respir. Dis., vol. 140, no. 4, pp.1017–1020, 1989.[8] M. Ono, K. Arakawa, M. Mori, T. Sugimoto, and H. Harashima, “Separationof fine crackles from vesicular sounds by a nonlinear digital filter,” IEEE Trans.Biomed. Eng., vol. 36, no. 2, pp. 286–291, 1989.[9] T.K. Kaisla, A. Sovijärvi, P. Piirilä, H.M. Rajala, S. Haltsonen, and T.Rosqvist, “Validated method for automatic detection of lung sounds crackles,”Med. Biol. Eng. Comput., vol. 29, no. 5, pp. 517–521, 1991. [10] T. Rosqvist, et al., “Toolkit for lung sound analysis,” Med. Biol. Eng.Comput., vol. 33, no. 2, pp. 190–195, 1995.[11] T. Katila, P. Piirila, K. Kallio, E. Paajanen, T. Rosqvist, and A.R.A.Sovijarvi, “Original waveform of lung sound crackles: a case study of the effect ofhigh-pass filtration,” J. Appl. Physiol., vol. 71, no. 6, pp. 2173–2177, 1991.[12] L.J. Hadjileontiadis and S.M. Panas, “Separation of discontinuous adventi-tious sounds from vesicular sounds using a wavelet-based filter,” IEEE Trans.Biomed. Eng., vol. 44, no. 12, pp. 1269–1281, 1997.[13] Y.A. Tolias, L.J. Hadjileontiadis, and S.M. Panas, “Real-time separation ofdiscontinuous adventitious sounds from vesicular sounds using a fuzzy rule-basedfilter,” IEEE Trans. Inf. Technol. Biomed., vol. 2, no. 3, pp. 204–215, 1998.[14] N.E. Huang, et al., “The empirical mode decomposition and Hilbert spectrumfor nonlinear and non-stationary time series analysis,” Proc. R. Soc. London, Ser.A, vol. 454, no. 1971, pp. 903–995, 1998.[15] P. Flandrin, G. Rillings, and P. Goncalves, “Empirical mode decompositionas a filter bank,” IEEE Signal Processing Let., vol. 10, no. 2 pt. 1, pp. 112–114,2003. [16] H. Kiyokawa, M. Greenberg, K. Shirota, and H. Pasterkamp, “Auditorydetection of simulated crackles in breath sounds,” Chest, vol. 119, no. 6, pp.1886–1892, 2001. [17] A. Aldroubi and M. Unser, Wavelets in Medicine and Biology. Boca Raton,FL: CRC, 1996.
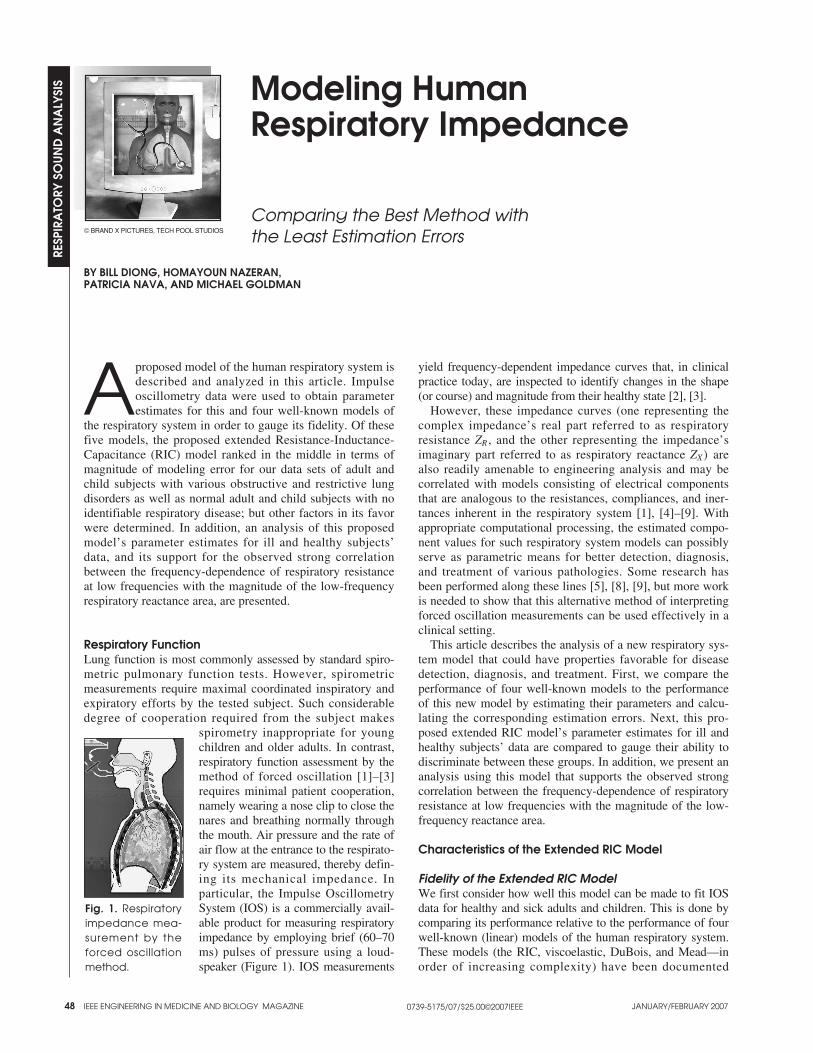
Aproposed model of the human respiratory system isdescribed and analyzed in this article. Impulseoscillometry data were used to obtain parameterestimates for this and four well-known models of
the respiratory system in order to gauge its fidelity. Of thesefive models, the proposed extended Resistance-Inductance-Capacitance (RIC) model ranked in the middle in terms ofmagnitude of modeling error for our data sets of adult andchild subjects with various obstructive and restrictive lungdisorders as well as normal adult and child subjects with noidentifiable respiratory disease; but other factors in its favorwere determined. In addition, an analysis of this proposedmodel’s parameter estimates for ill and healthy subjects’data, and its support for the observed strong correlationbetween the frequency-dependence of respiratory resistanceat low frequencies with the magnitude of the low-frequencyrespiratory reactance area, are presented.
Respiratory FunctionLung function is most commonly assessed by standard spiro-metric pulmonary function tests. However, spirometricmeasurements require maximal coordinated inspiratory andexpiratory efforts by the tested subject. Such considerabledegree of cooperation required from the subject makes
spirometry inappropriate for youngchildren and older adults. In contrast,respiratory function assessment by themethod of forced oscillation [1]–[3]requires minimal patient cooperation,namely wearing a nose clip to close thenares and breathing normally throughthe mouth. Air pressure and the rate ofair flow at the entrance to the respirato-ry system are measured, thereby defin-ing its mechanical impedance. Inparticular, the Impulse OscillometrySystem (IOS) is a commercially avail-able product for measuring respiratoryimpedance by employing brief (60–70ms) pulses of pressure using a loud-speaker (Figure 1). IOS measurements
yield frequency-dependent impedance curves that, in clinicalpractice today, are inspected to identify changes in the shape(or course) and magnitude from their healthy state [2], [3].
However, these impedance curves (one representing thecomplex impedance’s real part referred to as respiratoryresistance ZR , and the other representing the impedance’simaginary part referred to as respiratory reactance ZX) arealso readily amenable to engineering analysis and may becorrelated with models consisting of electrical componentsthat are analogous to the resistances, compliances, and iner-tances inherent in the respiratory system [1], [4]–[9]. Withappropriate computational processing, the estimated compo-nent values for such respiratory system models can possiblyserve as parametric means for better detection, diagnosis,and treatment of various pathologies. Some research hasbeen performed along these lines [5], [8], [9], but more workis needed to show that this alternative method of interpretingforced oscillation measurements can be used effectively in aclinical setting.
This article describes the analysis of a new respiratory sys-tem model that could have properties favorable for diseasedetection, diagnosis, and treatment. First, we compare theperformance of four well-known models to the performanceof this new model by estimating their parameters and calcu-lating the corresponding estimation errors. Next, this pro-posed extended RIC model’s parameter estimates for ill andhealthy subjects’ data are compared to gauge their ability todiscriminate between these groups. In addition, we present ananalysis using this model that supports the observed strongcorrelation between the frequency-dependence of respiratoryresistance at low frequencies with the magnitude of the low-frequency reactance area.
Characteristics of the Extended RIC Model
Fidelity of the Extended RIC ModelWe first consider how well this model can be made to fit IOSdata for healthy and sick adults and children. This is done bycomparing its performance relative to the performance of fourwell-known (linear) models of the human respiratory system.These models (the RIC, viscoelastic, DuBois, and Mead—inorder of increasing complexity) have been documented
48 IEEE ENGINEERING IN MEDICINE AND BIOLOGY MAGAZINE JANUARY/FEBRUARY 2007
Modeling Human Respiratory Impedance
Comparing the Best Method with the Least Estimation Errors
BY BILL DIONG, HOMAYOUN NAZERAN, PATRICIA NAVA, AND MICHAEL GOLDMAN
© BRAND X PICTURES, TECH POOL STUDIOS
RESP
IRA
TORY
SO
UN
D A
NA
LYSI
S
0739-5175/07/$25.00©2007IEEE
Fig. 1. Respiratoryimpedance mea-surement by theforced oscillationmethod.
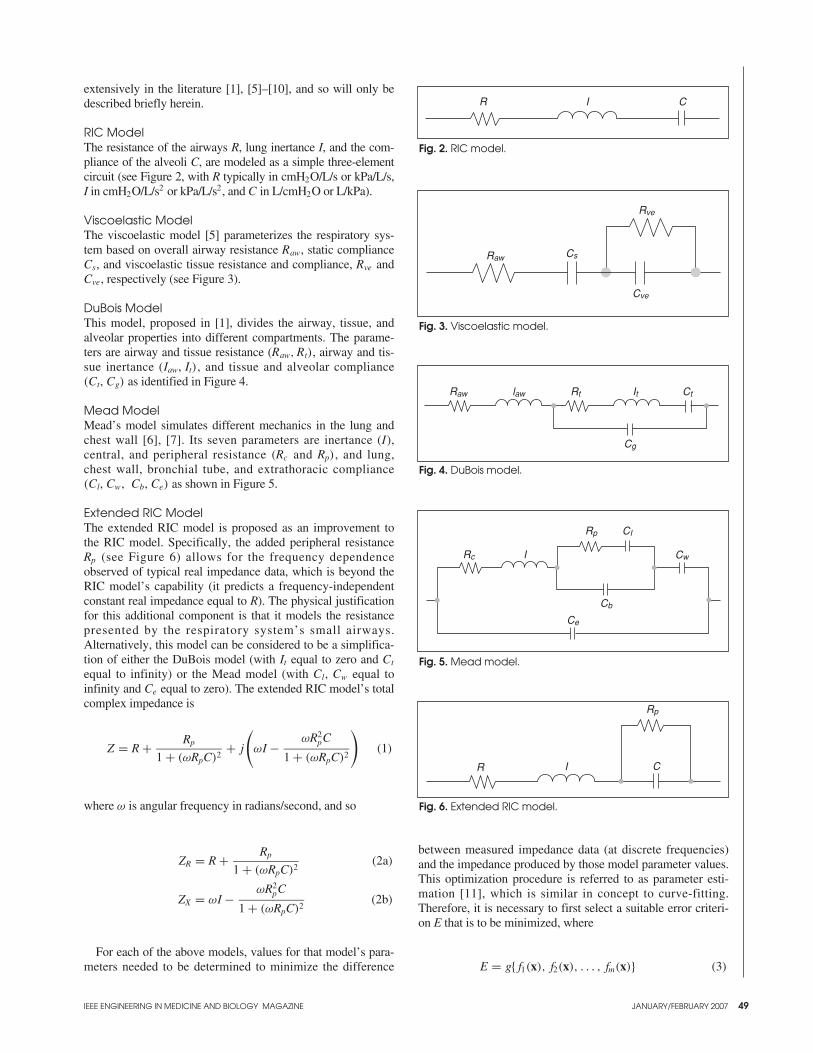
extensively in the literature [1], [5]–[10], and so will only bedescribed briefly herein.
RIC Model The resistance of the airways R, lung inertance I, and the com-pliance of the alveoli C, are modeled as a simple three-elementcircuit (see Figure 2, with R typically in cmH2O/L/s or kPa/L/s,I in cmH2O/L/s2 or kPa/L/s2, and C in L/cmH2O or L/kPa).
Viscoelastic ModelThe viscoelastic model [5] parameterizes the respiratory sys-tem based on overall airway resistance Raw, static complianceCs, and viscoelastic tissue resistance and compliance, Rve andCve, respectively (see Figure 3).
DuBois ModelThis model, proposed in [1], divides the airway, tissue, andalveolar properties into different compartments. The parame-ters are airway and tissue resistance (Raw, Rt), airway and tis-sue inertance (Iaw, It), and tissue and alveolar compliance(Ct, Cg) as identified in Figure 4.
Mead ModelMead’s model simulates different mechanics in the lung andchest wall [6], [7]. Its seven parameters are inertance (I), central, and peripheral resistance (Rc and Rp), and lung, chest wall, bronchial tube, and extrathoracic compliance(Cl, Cw, Cb, Ce) as shown in Figure 5.
Extended RIC ModelThe extended RIC model is proposed as an improvement tothe RIC model. Specifically, the added peripheral resistanceRp (see Figure 6) allows for the frequency dependenceobserved of typical real impedance data, which is beyond theRIC model’s capability (it predicts a frequency-independentconstant real impedance equal to R). The physical justificationfor this additional component is that it models the resistancepresented by the respiratory system’s small airways.Alternatively, this model can be considered to be a simplifica-tion of either the DuBois model (with It equal to zero and Ct
equal to infinity) or the Mead model (with Cl, Cw equal toinfinity and Ce equal to zero). The extended RIC model’s totalcomplex impedance is
Z = R + Rp
1 + (ωRpC)2+ j
(ωI − ωR2
pC
1 + (ωRpC)2
)(1)
where ω is angular frequency in radians/second, and so
ZR = R + Rp
1 + (ωRpC)2(2a)
ZX = ωI − ωR2pC
1 + (ωRpC)2(2b)
For each of the above models, values for that model’s para-meters needed to be determined to minimize the difference
between measured impedance data (at discrete frequencies)and the impedance produced by those model parameter values.This optimization procedure is referred to as parameter esti-mation [11], which is similar in concept to curve-fitting.Therefore, it is necessary to first select a suitable error criteri-on E that is to be minimized, where
E = g{ f1(x), f2(x), . . . , fm(x)} (3)
IEEE ENGINEERING IN MEDICINE AND BIOLOGY MAGAZINE JANUARY/FEBRUARY 2007 49
Fig. 5. Mead model.
Rc I
Rp CI
Cw
Cb
Ce
Fig. 4. DuBois model.
Raw law Rt It Ct
Cg
Fig. 3. Viscoelastic model.
Rve
CsRaw
Cve
Fig. 2. RIC model.
R I C
Fig. 6. Extended RIC model.
Rp
IR C
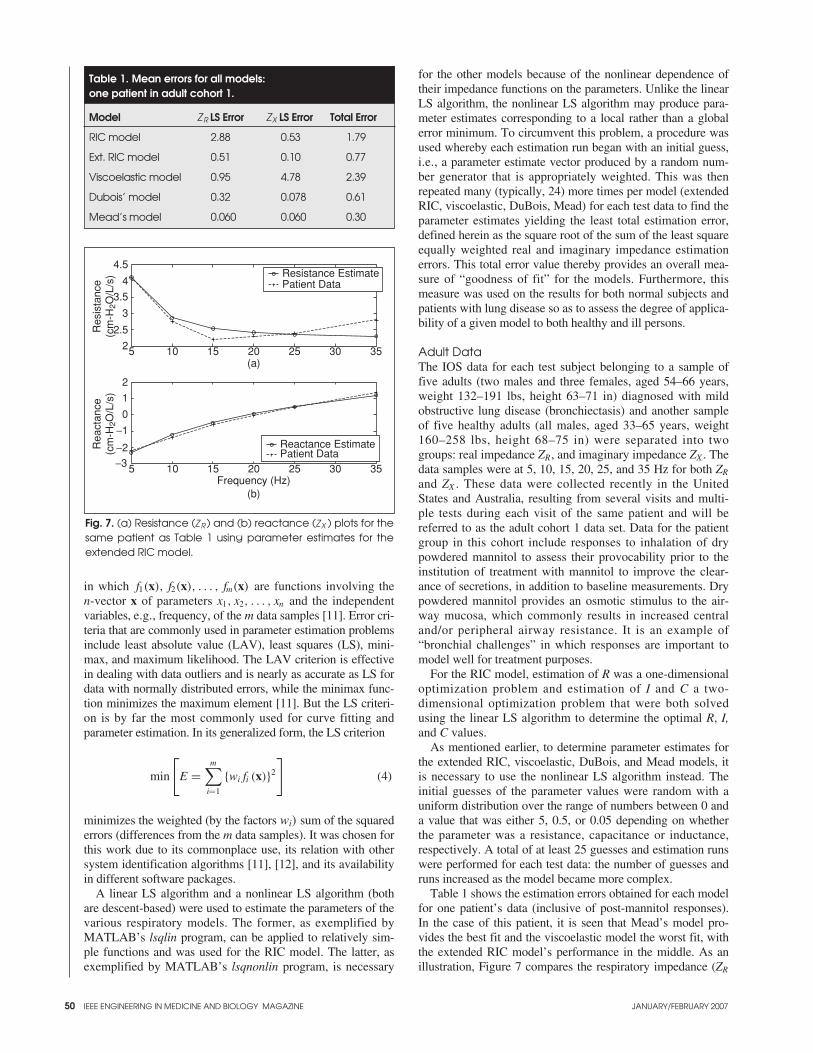
in which f1(x), f2(x), . . . , fm(x) are functions involving the n-vector x of parameters x1, x2, . . . , xn and the independentvariables, e.g., frequency, of the m data samples [11]. Error cri-teria that are commonly used in parameter estimation problemsinclude least absolute value (LAV), least squares (LS), mini-max, and maximum likelihood. The LAV criterion is effectivein dealing with data outliers and is nearly as accurate as LS fordata with normally distributed errors, while the minimax func-tion minimizes the maximum element [11]. But the LS criteri-on is by far the most commonly used for curve fitting andparameter estimation. In its generalized form, the LS criterion
min
[E =
m∑
i=1
{wi fi (x)}2
](4)
minimizes the weighted (by the factors wi) sum of the squarederrors (differences from the m data samples). It was chosen forthis work due to its commonplace use, its relation with othersystem identification algorithms [11], [12], and its availabilityin different software packages.
A linear LS algorithm and a nonlinear LS algorithm (bothare descent-based) were used to estimate the parameters of thevarious respiratory models. The former, as exemplified byMATLAB’s lsqlin program, can be applied to relatively sim-ple functions and was used for the RIC model. The latter, asexemplified by MATLAB’s lsqnonlin program, is necessary
for the other models because of the nonlinear dependence oftheir impedance functions on the parameters. Unlike the linearLS algorithm, the nonlinear LS algorithm may produce para-meter estimates corresponding to a local rather than a globalerror minimum. To circumvent this problem, a procedure wasused whereby each estimation run began with an initial guess,i.e., a parameter estimate vector produced by a random num-ber generator that is appropriately weighted. This was thenrepeated many (typically, 24) more times per model (extendedRIC, viscoelastic, DuBois, Mead) for each test data to find theparameter estimates yielding the least total estimation error,defined herein as the square root of the sum of the least squareequally weighted real and imaginary impedance estimationerrors. This total error value thereby provides an overall mea-sure of “goodness of fit” for the models. Furthermore, thismeasure was used on the results for both normal subjects andpatients with lung disease so as to assess the degree of applica-bility of a given model to both healthy and ill persons.
Adult DataThe IOS data for each test subject belonging to a sample offive adults (two males and three females, aged 54–66 years,weight 132–191 lbs, height 63–71 in) diagnosed with mildobstructive lung disease (bronchiectasis) and another sampleof five healthy adults (all males, aged 33–65 years, weight160–258 lbs, height 68–75 in) were separated into twogroups: real impedance ZR, and imaginary impedance ZX . Thedata samples were at 5, 10, 15, 20, 25, and 35 Hz for both ZR
and ZX . These data were collected recently in the UnitedStates and Australia, resulting from several visits and multi-ple tests during each visit of the same patient and will bereferred to as the adult cohort 1 data set. Data for the patientgroup in this cohort include responses to inhalation of drypowdered mannitol to assess their provocability prior to theinstitution of treatment with mannitol to improve the clear-ance of secretions, in addition to baseline measurements. Drypowdered mannitol provides an osmotic stimulus to the air-way mucosa, which commonly results in increased centraland/or peripheral airway resistance. It is an example of“bronchial challenges” in which responses are important tomodel well for treatment purposes.
For the RIC model, estimation of R was a one-dimensionaloptimization problem and estimation of I and C a two-dimensional optimization problem that were both solvedusing the linear LS algorithm to determine the optimal R, I,and C values.
As mentioned earlier, to determine parameter estimates forthe extended RIC, viscoelastic, DuBois, and Mead models, itis necessary to use the nonlinear LS algorithm instead. Theinitial guesses of the parameter values were random with auniform distribution over the range of numbers between 0 anda value that was either 5, 0.5, or 0.05 depending on whetherthe parameter was a resistance, capacitance or inductance,respectively. A total of at least 25 guesses and estimation runswere performed for each test data: the number of guesses andruns increased as the model became more complex.
Table 1 shows the estimation errors obtained for each modelfor one patient’s data (inclusive of post-mannitol responses).In the case of this patient, it is seen that Mead’s model pro-vides the best fit and the viscoelastic model the worst fit, withthe extended RIC model’s performance in the middle. As anillustration, Figure 7 compares the respiratory impedance (ZR
50 IEEE ENGINEERING IN MEDICINE AND BIOLOGY MAGAZINE JANUARY/FEBRUARY 2007
Fig. 7. (a) Resistance (Z R ) and (b) reactance (ZX ) plots for thesame patient as Table 1 using parameter estimates for theextended RIC model.
Reactance EstimatePatient Data
5 10 15 20 25 30 35
5 10 15 20 25 30 35−3
−2
−1
0
1
2
2
2.5
3
3.5
4
4.5
Res
ista
nce
(cm
-H2O
/L/s
)R
eact
ance
(cm
-H2O
/L/s
)
(a)
(b)Frequency (Hz)
Resistance EstimatePatient Data
Table 1. Mean errors for all models:one patient in adult cohort 1.
Model ZR LS Error ZX LS Error Total Error
RIC model 2.88 0.53 1.79
Ext. RIC model 0.51 0.10 0.77
Viscoelastic model 0.95 4.78 2.39
Dubois’ model 0.32 0.078 0.61
Mead’s model 0.060 0.060 0.30
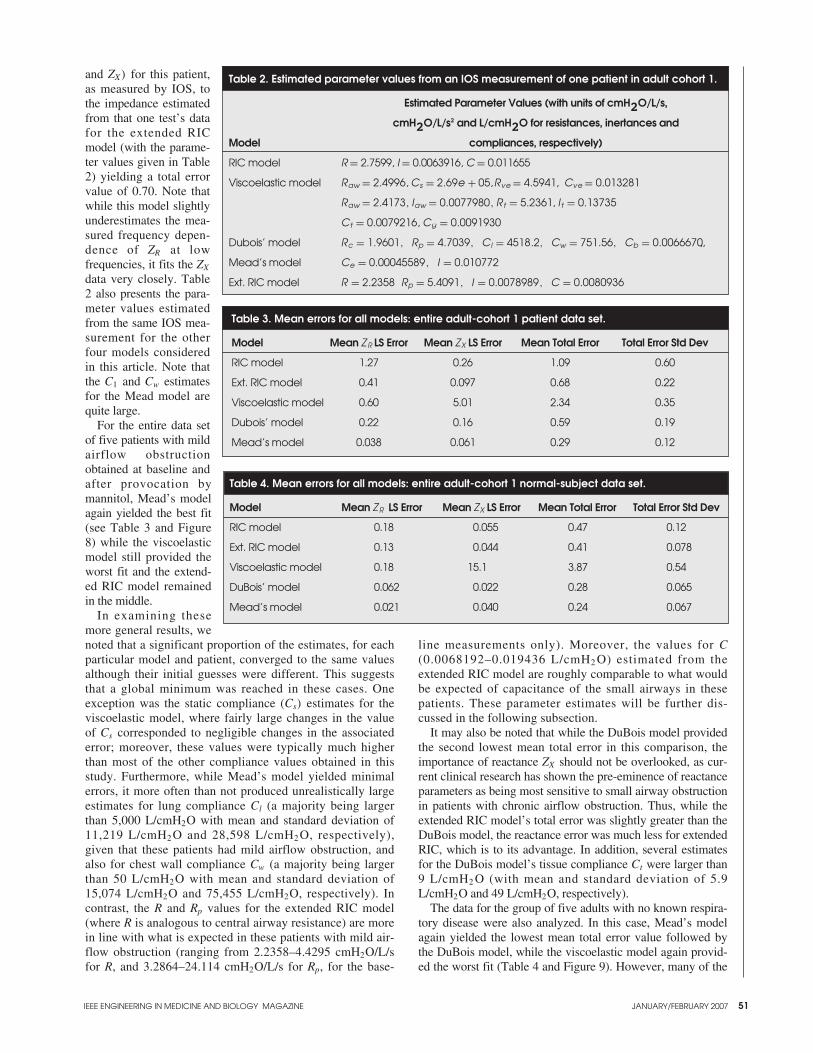
and ZX) for this patient,as measured by IOS, tothe impedance estimatedfrom that one test’s datafor the extended RICmodel (with the parame-ter values given in Table2) yielding a total errorvalue of 0.70. Note thatwhile this model slightlyunderestimates the mea-sured frequency depen-dence of ZR at lowfrequencies, it fits the ZX
data very closely. Table2 also presents the para-meter values estimatedfrom the same IOS mea-surement for the otherfour models consideredin this article. Note thatthe C1 and Cw estimatesfor the Mead model arequite large.
For the entire data setof five patients with mildairflow obstructionobtained at baseline andafter provocation bymannitol, Mead’s modelagain yielded the best fit(see Table 3 and Figure8) while the viscoelasticmodel still provided theworst fit and the extend-ed RIC model remainedin the middle.
In examining thesemore general results, wenoted that a significant proportion of the estimates, for eachparticular model and patient, converged to the same valuesalthough their initial guesses were different. This suggeststhat a global minimum was reached in these cases. Oneexception was the static compliance (Cs) estimates for theviscoelastic model, where fairly large changes in the valueof Cs corresponded to negligible changes in the associatederror; moreover, these values were typically much higherthan most of the other compliance values obtained in thisstudy. Furthermore, while Mead’s model yielded minimalerrors, it more often than not produced unrealistically largeestimates for lung compliance Cl (a majority being largerthan 5,000 L/cmH2O with mean and standard deviation of11,219 L/cmH2 O and 28,598 L/cmH2 O, respectively),given that these patients had mild airflow obstruction, andalso for chest wall compliance Cw (a majority being largerthan 50 L/cmH2O with mean and standard deviation of15,074 L/cmH2O and 75,455 L/cmH2O, respectively). Incontrast, the R and Rp values for the extended RIC model(where R is analogous to central airway resistance) are morein line with what is expected in these patients with mild air-flow obstruction (ranging from 2.2358–4.4295 cmH2O/L/sfor R, and 3.2864–24.114 cmH2O/L/s for Rp, for the base-
line measurements only). Moreover, the values for C(0.0068192–0.019436 L/cmH2 O) estimated from theextended RIC model are roughly comparable to what wouldbe expected of capacitance of the small airways in thesepatients. These parameter estimates will be further dis-cussed in the following subsection.
It may also be noted that while the DuBois model providedthe second lowest mean total error in this comparison, theimportance of reactance ZX should not be overlooked, as cur-rent clinical research has shown the pre-eminence of reactanceparameters as being most sensitive to small airway obstructionin patients with chronic airflow obstruction. Thus, while theextended RIC model’s total error was slightly greater than theDuBois model, the reactance error was much less for extendedRIC, which is to its advantage. In addition, several estimatesfor the DuBois model’s tissue compliance Ct were larger than9 L/cmH2 O (with mean and standard deviation of 5.9L/cmH2O and 49 L/cmH2O, respectively).
The data for the group of five adults with no known respira-tory disease were also analyzed. In this case, Mead’s modelagain yielded the lowest mean total error value followed bythe DuBois model, while the viscoelastic model again provid-ed the worst fit (Table 4 and Figure 9). However, many of the
IEEE ENGINEERING IN MEDICINE AND BIOLOGY MAGAZINE JANUARY/FEBRUARY 2007 51
Table 3. Mean errors for all models: entire adult-cohort 1 patient data set.
Model Mean ZR LS Error Mean ZX LS Error Mean Total Error Total Error Std Dev
RIC model 1.27 0.26 1.09 0.60
Ext. RIC model 0.41 0.097 0.68 0.22
Viscoelastic model 0.60 5.01 2.34 0.35
Dubois’ model 0.22 0.16 0.59 0.19
Mead’s model 0.038 0.061 0.29 0.12
Table 2. Estimated parameter values from an IOS measurement of one patient in adult cohort 1.
Estimated Parameter Values (with units of cmH2O/L/s,
cmH2O/L/s2 and L/cmH2O for resistances, inertances and
Model compliances, respectively)
RIC model R = 2.7599, I = 0.0063916, C = 0.011655
Viscoelastic model Raw = 2.4996, Cs = 2.69e + 05,Rve = 4.5941, Cve = 0.013281
Raw = 2.4173, Iaw = 0.0077980, Rt = 5.2361, I t = 0.13735
Ct = 0.0079216, Cg = 0.0091930
Dubois’ model Rc = 1.9601, Rp = 4.7039, CI = 4518.2, Cw = 751.56, Cb = 0.0066670,,
Mead’s model Ce = 0.00045589, I = 0.010772
Ext. RIC model R = 2.2358 Rp = 5.4091, I = 0.0078989, C = 0.0080936
Table 4. Mean errors for all models: entire adult-cohort 1 normal-subject data set.
Model Mean ZR LS Error Mean ZX LS Error Mean Total Error Total Error Std Dev
RIC model 0.18 0.055 0.47 0.12
Ext. RIC model 0.13 0.044 0.41 0.078
Viscoelastic model 0.18 15.1 3.87 0.54
DuBois’ model 0.062 0.022 0.28 0.065
Mead’s model 0.021 0.040 0.24 0.067

Mead model estimates for lung compliance Cl and for chestwall compliance Cw were again unreasonably large (withmeans of 6,541 L/cmH2O and 928 L/cmH2O, respectively).
In addition to the data for these 10 adults, a second set ofadult data that had been collected a few years ago in Australiawas used for model parameter estimation. These 105 adults (tobe referred to collectively as cohort 2) were all diagnosed witha respiratory disorder of either obstructive or restrictive type,including asthma, chronic obstructive pulmonary disease(COPD) and sarcoidosis. The data consist of only one baseline
test result per patient andso did not include anydeliberately provokedresponses. Table 5 andFigure 10 show the sametrend in modeling-errorperformance that has beennoted for the first set of illand normal adult data. Butmany unreasonably largeestimates for the Meadmodel’s lung complianceCl and chest wall compli-ance Cw (with means of5,131 L/cmH2O and 258L/cmH2 O, respectively),and for the DuBoismodel’s tissue complianceCt (with mean of 198L/cmH2O), were obtainedonce again.
Children’s DataIn similar fashion, a dataset of IOS measurementsfor three asthmatic chil-dren (two males and onefemale, aged 6.5–9 years,weight 77–84 lbs, height47–54 in) and one healthychild (female, aged 7years, weight 75 lbs,height 50 in), consistingof pre- and post-bron-
chodilator responses for the asthmatics, were processed tocompare the five models’ performance. Table 6 and Figure11, and Table 7 and Figure 12 show that Mead’s model againyielded the best fit while the viscoelastic model still providedthe worst fit, with the extended RIC model performing just abit worse than the DuBois model but significantly better than
52 IEEE ENGINEERING IN MEDICINE AND BIOLOGY MAGAZINE JANUARY/FEBRUARY 2007
Fig. 8. Mean total estimation errors for all models: entire adultcohort 1 patient data set.
0
0.5
1
1.5
2
2.5
Mea
n To
tal E
rror
RICModel
Ext RICModel
ViscoelasticModel
Dubois’Model
Mead’sModel
Table 5. Mean errors for all models: entire adult-cohort 2 patient data set.
Model Mean ZR LS Error Mean ZX LS Error Mean Total Error Total Error Std Dev
RIC model 3.02 0.58 1.66 0.93
Ext. RIC model 0.29 0.16 0.62 0.23
Viscoelastic model 0.86 5.80 2.53 0.50
Dubois’ model 0.15 0.097 0.46 0.18
Mead’s model 0.098 0.12 0.43 0.16
Table 6. Mean errors for all models: entire child-patient data set.
Model Mean ZR LS Error Mean ZX LS Error Mean Total Error Total Error Std Dev
RIC model 5.47 1.46 2.43 1.01
Ext. RIC model 1.44 0.47 1.35 0.30
Viscoelastic model 2.11 13.1 3.82 0.80
Dubois’ model 1.18 0.32 1.19 0.28
Mead’s model 0.24 0.24 0.67 0.16
Table 7. Mean errors for all models: the child-normal subject data set.
Model Mean ZR LS Error Mean ZX LS Error Mean Total Error Total Error Std Dev
RIC model 3.06 1.13 2.05 0.020
Ext. RIC model 0.98 0.56 1.24 0.030
Viscoelastic model 1.96 20.9 4.78 0.012
DuBois’ model 0.86 0.29 1.07 0.048
Mead’s model 0.22 0.25 0.69 0.022
Fig. 9. Mean total estimation errors for all models: entire adultcohort 1 normal subject data set.
0
0.5
1
1.5
2
2.5
3
3.5
4
Mea
n To
tal E
rror
RICModel
Ext RICModel
ViscoelasticModel
Dubois’Model
Mead’sModel
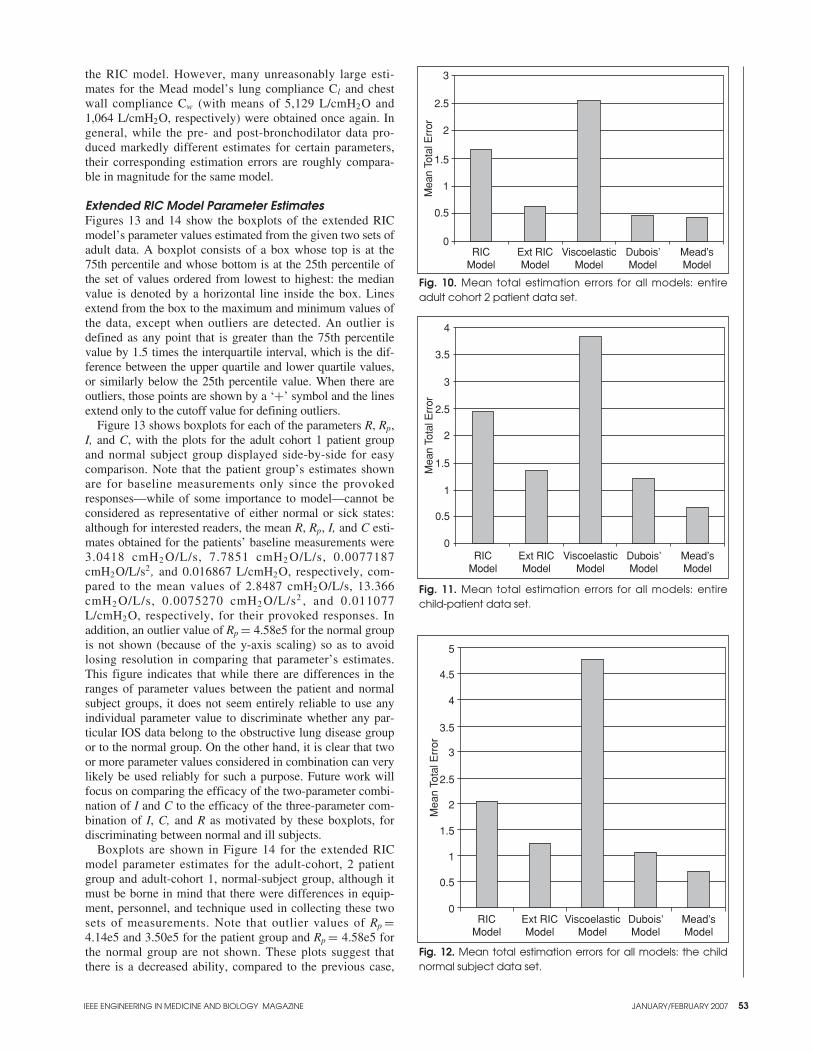
the RIC model. However, many unreasonably large esti-mates for the Mead model’s lung compliance Cl and chestwall compliance Cw (with means of 5,129 L/cmH2O and1,064 L/cmH2O, respectively) were obtained once again. Ingeneral, while the pre- and post-bronchodilator data pro-duced markedly different estimates for certain parameters,their corresponding estimation errors are roughly compara-ble in magnitude for the same model.
Extended RIC Model Parameter EstimatesFigures 13 and 14 show the boxplots of the extended RICmodel’s parameter values estimated from the given two sets ofadult data. A boxplot consists of a box whose top is at the75th percentile and whose bottom is at the 25th percentile ofthe set of values ordered from lowest to highest: the medianvalue is denoted by a horizontal line inside the box. Linesextend from the box to the maximum and minimum values ofthe data, except when outliers are detected. An outlier isdefined as any point that is greater than the 75th percentilevalue by 1.5 times the interquartile interval, which is the dif-ference between the upper quartile and lower quartile values,or similarly below the 25th percentile value. When there areoutliers, those points are shown by a ‘+’ symbol and the linesextend only to the cutoff value for defining outliers.
Figure 13 shows boxplots for each of the parameters R, Rp,I, and C, with the plots for the adult cohort 1 patient groupand normal subject group displayed side-by-side for easycomparison. Note that the patient group’s estimates shownare for baseline measurements only since the provokedresponses—while of some importance to model—cannot beconsidered as representative of either normal or sick states:although for interested readers, the mean R, Rp, I, and C esti-mates obtained for the patients’ baseline measurements were3.0418 cmH2 O/L/s, 7.7851 cmH2 O/L/s, 0.0077187cmH2O/L/s2 , and 0.016867 L/cmH2O, respectively, com-pared to the mean values of 2.8487 cmH2O/L/s, 13.366cmH2 O/L/s, 0.0075270 cmH2 O/L/s2 , and 0.011077L/cmH2O, respectively, for their provoked responses. Inaddition, an outlier value of Rp = 4.58e5 for the normal groupis not shown (because of the y-axis scaling) so as to avoidlosing resolution in comparing that parameter’s estimates.This figure indicates that while there are differences in theranges of parameter values between the patient and normalsubject groups, it does not seem entirely reliable to use anyindividual parameter value to discriminate whether any par-ticular IOS data belong to the obstructive lung disease groupor to the normal group. On the other hand, it is clear that twoor more parameter values considered in combination can verylikely be used reliably for such a purpose. Future work willfocus on comparing the efficacy of the two-parameter combi-nation of I and C to the efficacy of the three-parameter com-bination of I, C, and R as motivated by these boxplots, fordiscriminating between normal and ill subjects.
Boxplots are shown in Figure 14 for the extended RICmodel parameter estimates for the adult-cohort, 2 patientgroup and adult-cohort 1, normal-subject group, although itmust be borne in mind that there were differences in equip-ment, personnel, and technique used in collecting these twosets of measurements. Note that outlier values of Rp =4.14e5 and 3.50e5 for the patient group and Rp = 4.58e5 forthe normal group are not shown. These plots suggest thatthere is a decreased ability, compared to the previous case,
Fig. 10. Mean total estimation errors for all models: entireadult cohort 2 patient data set.
0
0.5
1
1.5
2
2.5
3
Mea
n To
tal E
rror
RICModel
Ext RICModel
ViscoelasticModel
Dubois’Model
Mead’sModel
IEEE ENGINEERING IN MEDICINE AND BIOLOGY MAGAZINE JANUARY/FEBRUARY 2007
Fig. 11. Mean total estimation errors for all models: entirechild-patient data set.
0
0.5
1
1.5
2
2.5
3
3.5
4
Mea
n To
tal E
rror
RICModel
Ext RICModel
ViscoelasticModel
Dubois’Model
Mead’sModel
Fig. 12. Mean total estimation errors for all models: the childnormal subject data set.
0
0.5
1
1.5
2
2.5
3
3.5
4
4.5
5
Mea
n To
tal E
rror
RICModel
Ext RICModel
ViscoelasticModel
Dubois’Model
Mead’sModel
53

to discriminate between the group with restrictive or obstruc-tive lung disease and the normal group. However, it againseems indicated that two or more parameter values consid-ered in combination can very likely be used reliably to dis-criminate between these two groups whereas using only oneparameter value could not.
For the child groups, there were insufficient data in hand toperform a meaningful comparison of the parameter values inhealth and disease. This will be done in the near future whensufficient data have been obtained.
Relationship Between Frequency-Dependence of ZR and AXSkloot et al. [13] documented a close correlation between fre-quency-dependence of real impedance at low frequencies(specifically the difference between ZR,5 and either ZR,15 orZR,20) and the magnitude of the integral of ZX from 5 Hz toresonant frequency fres (where ZX = 0), referred to as reac-tance area AX [3]. In ironworkers exposed to air pollution at
“ground zero” after 9/11, the correlation coefficient was 0.92.Goldman et al. [14] also observed a similar correlationbetween these parameters in patients with COPD.
In the following, we present a quantitative analysis based onthe extended RIC model to confirm this strong correlationbetween in-phase and out-of-phase pressure-flow relationshipsat low frequencies. Note first that AX is approximately the areaof a triangle with base of ( fres − 5) and height of |ZX,5 |. Using(2b) and then (2a), it can be easily shown that this model yields
ZX,5 = −(2∗π∗5)RpC(ZR,5 − ZR, fres) ,
which therefore implies that
AX ≈ 1
2(2∗π∗5)RpC(ZR,5 − ZR, fres)( fres − 5) .
The approximation is exact only if the ZX curve is truly lin-ear with respect to frequency all the way from 5 Hz to fres .Furthermore, this relationship also holds for frequencies otherthan 5 Hz (with the appropriate substitutions). As for theessential feature of the model that yields this relationship, acomparison to the RIC model (which does not predict any dif-ference between ZR,5 and ZR, fres) suggests that the presence ofthe parallel resistor Rp in the extended RIC model is necessaryfor such a prediction.
High-Frequency Limitation of the Extended RIC ModelThis subsection discusses the behavior of the real imped-ance ZR for the extended RIC model to provide a betterunderstanding of its limitations. Tables 1–7 indicate thatthe mean LS error in ZR is quite a bit worse than the meanLS error in ZX for this model when compared to the perfor-mance of DuBois’ model and Mead’s model. From (2a), wenote that ZR for the extended RIC model decreases asymp-totically with frequency to the constant value of R. Hence,trying to fit ZR data that does otherwise with this modelwill usually result in a larger LS error in ZR than for caseswhere ZR is asymptotically decreasing. Moreover, in tryingto minimize the error by not having ZR decrease too rapidly(with respect to frequency), Rp will sometimes tend towardslarger values.
As for the cause of the measured increase in ZR with higherfrequencies, this is thought to be due to upper airways shunteffects (and represented by the extrathoracic compliance Ce ofMead’s model) [3]. If so, this particular parameter may be oneof the main contributors to the superior modeling performanceof Mead’s model.
ConclusionsBased on a comparison of the parameter estimation errors forfour commonly-used respiratory system models and the pro-posed extended RIC model, it has been found that Mead’smodel yielded the least estimation errors for the given datasets of normal adults and adults with either obstructive orrestrictive respiratory disorders, and normal and asthmaticchildren. However, some of the Mead model’s parameter esti-mates are not quite realistic while those of the extended RICmodel are more so. Indeed, it may be considered that the latterextracts the essential features of Mead’s model while exclud-ing lung compliance (clinical data have shown similar depar-tures in reactance from normality in patients with both
54
Fig. 13. Extended RIC model parameter estimates: adult-cohort1 patients compared to normal-adult-cohort 1 subjects.
2
3
4
5
10
15
20
25
Rp
(cm
H2O
/L/s
)R
(cm
H2O
/L/s
)
C (
L/cm
H2O
)I (
cmH
2O/L
/s2 )
0.008
0.01
0.012
0.001
0.02
0.03
0.014
0.016
Patient NormalAdult Group
Patient NormalAdult Group
Patient NormalAdult Group
Patient NormalAdult Group
Fig. 14. Extended RIC model parameter estimates: adult-cohort 2 patients compared to normal-adult-cohort 1 subjects.
2
0
20
40
3
4
5
6
R (
cmH
2O/L
/s)
Patient NormalAdult Group
Patient NormalAdult Group
Patient NormalAdult Group
Patient NormalAdult Group
Rp
(cm
H2O
/L/s
)
I (cm
H2O
/L/S
2 )C
(L/
cmH
2O)
0.0040.0060.0080.01
0.0120.0140.016
0.0050.01
0.0150.02
0.0250.03
0.0350.004
IEEE ENGINEERING IN MEDICINE AND BIOLOGY MAGAZINE JANUARY/FEBRUARY 2007
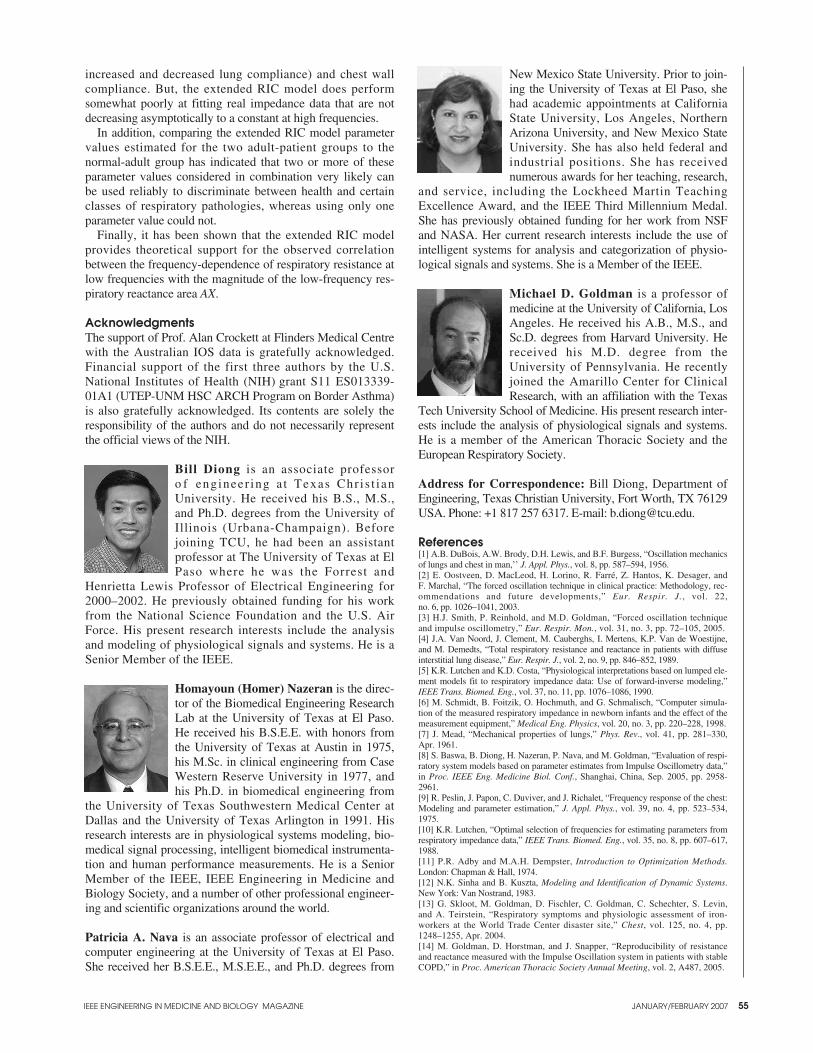
increased and decreased lung compliance) and chest wallcompliance. But, the extended RIC model does performsomewhat poorly at fitting real impedance data that are notdecreasing asymptotically to a constant at high frequencies.
In addition, comparing the extended RIC model parametervalues estimated for the two adult-patient groups to the normal-adult group has indicated that two or more of theseparameter values considered in combination very likely canbe used reliably to discriminate between health and certainclasses of respiratory pathologies, whereas using only oneparameter value could not.
Finally, it has been shown that the extended RIC modelprovides theoretical support for the observed correlationbetween the frequency-dependence of respiratory resistance atlow frequencies with the magnitude of the low-frequency res-piratory reactance area AX.
AcknowledgmentsThe support of Prof. Alan Crockett at Flinders Medical Centrewith the Australian IOS data is gratefully acknowledged.Financial support of the first three authors by the U.S.National Institutes of Health (NIH) grant S11 ES013339-01A1 (UTEP-UNM HSC ARCH Program on Border Asthma)is also gratefully acknowledged. Its contents are solely theresponsibility of the authors and do not necessarily representthe official views of the NIH.
Bill Diong is an associate professoro f engineer ing a t Texas Chr is t ianUniversity. He received his B.S., M.S.,and Ph.D. degrees from the University ofIllinois (Urbana-Champaign). Beforejoining TCU, he had been an assistantprofessor at The University of Texas at ElPaso where he was the Forrest and
Henrietta Lewis Professor of Electrical Engineering for2000–2002. He previously obtained funding for his workfrom the National Science Foundation and the U.S. AirForce. His present research interests include the analysisand modeling of physiological signals and systems. He is aSenior Member of the IEEE.
Homayoun (Homer) Nazeran is the direc-tor of the Biomedical Engineering ResearchLab at the University of Texas at El Paso.He received his B.S.E.E. with honors fromthe University of Texas at Austin in 1975,his M.Sc. in clinical engineering from CaseWestern Reserve University in 1977, andhis Ph.D. in biomedical engineering from
the University of Texas Southwestern Medical Center atDallas and the University of Texas Arlington in 1991. Hisresearch interests are in physiological systems modeling, bio-medical signal processing, intelligent biomedical instrumenta-tion and human performance measurements. He is a SeniorMember of the IEEE, IEEE Engineering in Medicine andBiology Society, and a number of other professional engineer-ing and scientific organizations around the world.
Patricia A. Nava is an associate professor of electrical andcomputer engineering at the University of Texas at El Paso.She received her B.S.E.E., M.S.E.E., and Ph.D. degrees from
New Mexico State University. Prior to join-ing the University of Texas at El Paso, shehad academic appointments at CaliforniaState University, Los Angeles, NorthernArizona University, and New Mexico StateUniversity. She has also held federal andindustrial positions. She has receivednumerous awards for her teaching, research,
and service, including the Lockheed Martin TeachingExcellence Award, and the IEEE Third Millennium Medal.She has previously obtained funding for her work from NSFand NASA. Her current research interests include the use ofintelligent systems for analysis and categorization of physio-logical signals and systems. She is a Member of the IEEE.
Michael D. Goldman is a professor ofmedicine at the University of California, LosAngeles. He received his A.B., M.S., andSc.D. degrees from Harvard University. Hereceived his M.D. degree from theUniversity of Pennsylvania. He recentlyjoined the Amarillo Center for ClinicalResearch, with an affiliation with the Texas
Tech University School of Medicine. His present research inter-ests include the analysis of physiological signals and systems.He is a member of the American Thoracic Society and theEuropean Respiratory Society.
Address for Correspondence: Bill Diong, Department ofEngineering, Texas Christian University, Fort Worth, TX 76129USA. Phone: +1 817 257 6317. E-mail: [email protected].
References[1] A.B. DuBois, A.W. Brody, D.H. Lewis, and B.F. Burgess, “Oscillation mechanicsof lungs and chest in man,’’ J. Appl. Phys., vol. 8, pp. 587–594, 1956.[2] E. Oostveen, D. MacLeod, H. Lorino, R. Farré, Z. Hantos, K. Desager, and F. Marchal, “The forced oscillation technique in clinical practice: Methodology, rec-ommendations and future developments,” Eur. Respir. J., vol. 22, no. 6, pp. 1026–1041, 2003.[3] H.J. Smith, P. Reinhold, and M.D. Goldman, “Forced oscillation techniqueand impulse oscillometry,” Eur. Respir. Mon., vol. 31, no. 3, pp. 72–105, 2005.[4] J.A. Van Noord, J. Clement, M. Cauberghs, I. Mertens, K.P. Van de Woestijne,and M. Demedts, “Total respiratory resistance and reactance in patients with diffuseinterstitial lung disease,” Eur. Respir. J., vol. 2, no. 9, pp. 846–852, 1989.[5] K.R. Lutchen and K.D. Costa, “Physiological interpretations based on lumped ele-ment models fit to respiratory impedance data: Use of forward-inverse modeling,”IEEE Trans. Biomed. Eng., vol. 37, no. 11, pp. 1076–1086, 1990.[6] M. Schmidt, B. Foitzik, O. Hochmuth, and G. Schmalisch, “Computer simula-tion of the measured respiratory impedance in newborn infants and the effect of themeasurement equipment,” Medical Eng. Physics, vol. 20, no. 3, pp. 220–228, 1998.[7] J. Mead, “Mechanical properties of lungs,” Phys. Rev., vol. 41, pp. 281–330,Apr. 1961.[8] S. Baswa, B. Diong, H. Nazeran, P. Nava, and M. Goldman, “Evaluation of respi-ratory system models based on parameter estimates from Impulse Oscillometry data,”in Proc. IEEE Eng. Medicine Biol. Conf., Shanghai, China, Sep. 2005, pp. 2958-2961.[9] R. Peslin, J. Papon, C. Duviver, and J. Richalet, “Frequency response of the chest:Modeling and parameter estimation,” J. Appl. Phys., vol. 39, no. 4, pp. 523–534,1975.[10] K.R. Lutchen, “Optimal selection of frequencies for estimating parameters fromrespiratory impedance data,” IEEE Trans. Biomed. Eng., vol. 35, no. 8, pp. 607–617,1988.[11] P.R. Adby and M.A.H. Dempster, Introduction to Optimization Methods.London: Chapman & Hall, 1974.[12] N.K. Sinha and B. Kuszta, Modeling and Identification of Dynamic Systems.New York: Van Nostrand, 1983.[13] G. Skloot, M. Goldman, D. Fischler, C. Goldman, C. Schechter, S. Levin,and A. Teirstein, “Respiratory symptoms and physiologic assessment of iron-workers at the World Trade Center disaster site,” Chest, vol. 125, no. 4, pp.1248–1255, Apr. 2004.[14] M. Goldman, D. Horstman, and J. Snapper, “Reproducibility of resistanceand reactance measured with the Impulse Oscillation system in patients with stableCOPD,” in Proc. American Thoracic Society Annual Meeting, vol. 2, A487, 2005.
IEEE ENGINEERING IN MEDICINE AND BIOLOGY MAGAZINE JANUARY/FEBRUARY 2007 55
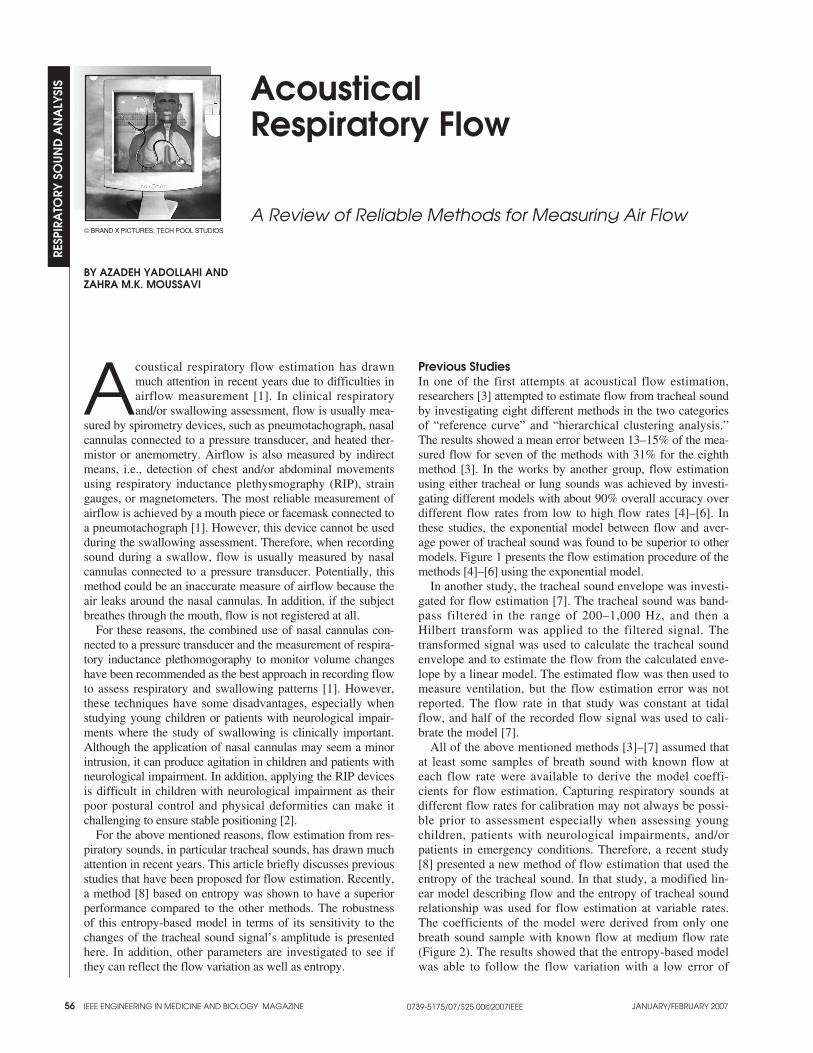
56 IEEE ENGINEERING IN MEDICINE AND BIOLOGY MAGAZINE JANUARY/FEBRUARY 2007
AcousticalRespiratory Flow
A Review of Reliable Methods for Measuring Air Flow
BY AZADEH YADOLLAHI ANDZAHRA M.K. MOUSSAVI
© BRAND X PICTURES, TECH POOL STUDIOS
RESP
IRA
TORY
SO
UN
D A
NA
LYSI
S
0739-5175/07/$25.00©2007IEEE
Acoustical respiratory flow estimation has drawnmuch attention in recent years due to difficulties inairflow measurement [1]. In clinical respiratoryand/or swallowing assessment, flow is usually mea-
sured by spirometry devices, such as pneumotachograph, nasalcannulas connected to a pressure transducer, and heated ther-mistor or anemometry. Airflow is also measured by indirectmeans, i.e., detection of chest and/or abdominal movementsusing respiratory inductance plethysmography (RIP), straingauges, or magnetometers. The most reliable measurement ofairflow is achieved by a mouth piece or facemask connected toa pneumotachograph [1]. However, this device cannot be usedduring the swallowing assessment. Therefore, when recordingsound during a swallow, flow is usually measured by nasalcannulas connected to a pressure transducer. Potentially, thismethod could be an inaccurate measure of airflow because theair leaks around the nasal cannulas. In addition, if the subjectbreathes through the mouth, flow is not registered at all.
For these reasons, the combined use of nasal cannulas con-nected to a pressure transducer and the measurement of respira-tory inductance plethomogoraphy to monitor volume changeshave been recommended as the best approach in recording flowto assess respiratory and swallowing patterns [1]. However,these techniques have some disadvantages, especially whenstudying young children or patients with neurological impair-ments where the study of swallowing is clinically important.Although the application of nasal cannulas may seem a minorintrusion, it can produce agitation in children and patients withneurological impairment. In addition, applying the RIP devicesis difficult in children with neurological impairment as theirpoor postural control and physical deformities can make itchallenging to ensure stable positioning [2].
For the above mentioned reasons, flow estimation from res-piratory sounds, in particular tracheal sounds, has drawn muchattention in recent years. This article briefly discusses previousstudies that have been proposed for flow estimation. Recently,a method [8] based on entropy was shown to have a superiorperformance compared to the other methods. The robustnessof this entropy-based model in terms of its sensitivity to thechanges of the tracheal sound signal’s amplitude is presentedhere. In addition, other parameters are investigated to see ifthey can reflect the flow variation as well as entropy.
Previous StudiesIn one of the first attempts at acoustical flow estimation,researchers [3] attempted to estimate flow from tracheal soundby investigating eight different methods in the two categoriesof “reference curve” and “hierarchical clustering analysis.”The results showed a mean error between 13–15% of the mea-sured flow for seven of the methods with 31% for the eighthmethod [3]. In the works by another group, flow estimationusing either tracheal or lung sounds was achieved by investi-gating different models with about 90% overall accuracy overdifferent flow rates from low to high flow rates [4]–[6]. Inthese studies, the exponential model between flow and aver-age power of tracheal sound was found to be superior to othermodels. Figure 1 presents the flow estimation procedure of themethods [4]–[6] using the exponential model.
In another study, the tracheal sound envelope was investi-gated for flow estimation [7]. The tracheal sound was band-pass filtered in the range of 200–1,000 Hz, and then aHilbert transform was applied to the filtered signal. Thetransformed signal was used to calculate the tracheal soundenvelope and to estimate the flow from the calculated enve-lope by a linear model. The estimated flow was then used tomeasure ventilation, but the flow estimation error was notreported. The flow rate in that study was constant at tidalflow, and half of the recorded flow signal was used to cali-brate the model [7].
All of the above mentioned methods [3]–[7] assumed thatat least some samples of breath sound with known flow ateach flow rate were available to derive the model coeffi-cients for flow estimation. Capturing respiratory sounds atdifferent flow rates for calibration may not always be possi-ble prior to assessment especially when assessing youngchildren, patients with neurological impairments, and/orpatients in emergency conditions. Therefore, a recent study[8] presented a new method of flow estimation that used theentropy of the tracheal sound. In that study, a modified lin-ear model describing flow and the entropy of tracheal soundrelationship was used for flow estimation at variable rates.The coefficients of the model were derived from only onebreath sound sample with known flow at medium flow rate(Figure 2). The results showed that the entropy-based modelwas able to follow the flow variation with a low error of
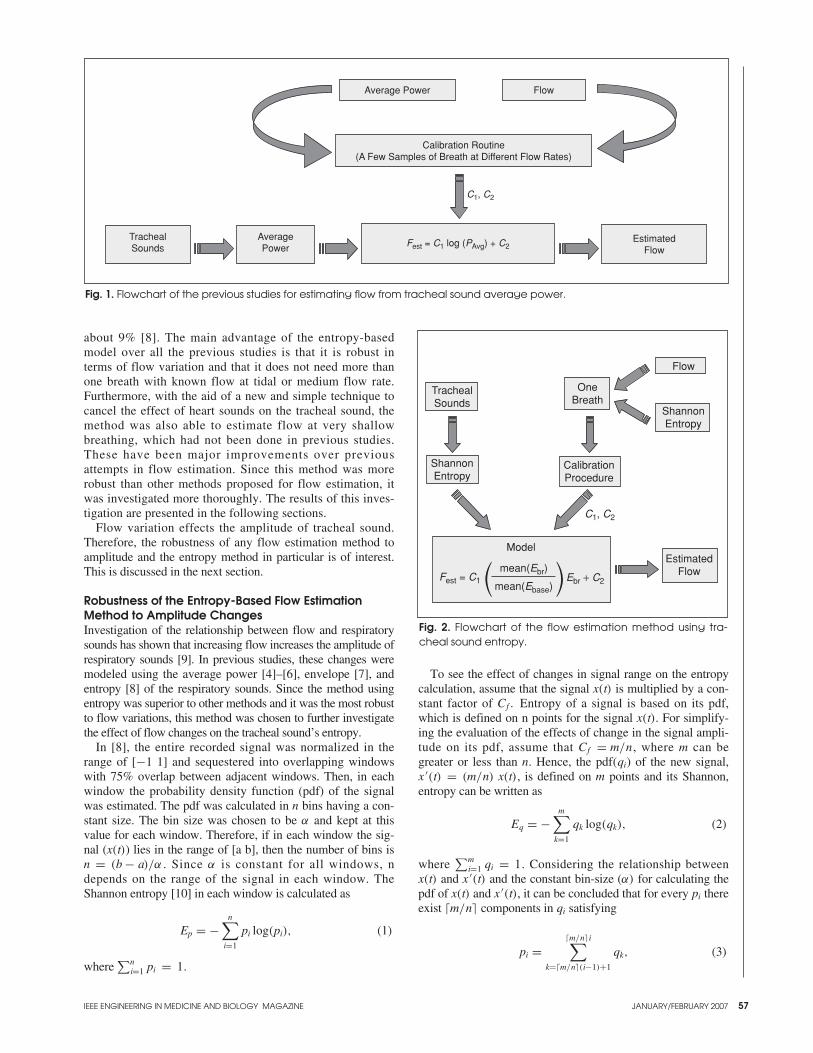
IEEE ENGINEERING IN MEDICINE AND BIOLOGY MAGAZINE JANUARY/FEBRUARY 2007
about 9% [8]. The main advantage of the entropy-basedmodel over all the previous studies is that it is robust interms of flow variation and that it does not need more thanone breath with known flow at tidal or medium flow rate.Furthermore, with the aid of a new and simple technique tocancel the effect of heart sounds on the tracheal sound, themethod was also able to estimate flow at very shallowbreathing, which had not been done in previous studies.These have been major improvements over previousattempts in flow estimation. Since this method was morerobust than other methods proposed for flow estimation, itwas investigated more thoroughly. The results of this inves-tigation are presented in the following sections.
Flow variation effects the amplitude of tracheal sound.Therefore, the robustness of any flow estimation method toamplitude and the entropy method in particular is of interest.This is discussed in the next section.
Robustness of the Entropy-Based Flow EstimationMethod to Amplitude ChangesInvestigation of the relationship between flow and respiratorysounds has shown that increasing flow increases the amplitude ofrespiratory sounds [9]. In previous studies, these changes weremodeled using the average power [4]–[6], envelope [7], andentropy [8] of the respiratory sounds. Since the method usingentropy was superior to other methods and it was the most robustto flow variations, this method was chosen to further investigatethe effect of flow changes on the tracheal sound’s entropy.
In [8], the entire recorded signal was normalized in therange of [−1 1] and sequestered into overlapping windowswith 75% overlap between adjacent windows. Then, in eachwindow the probability density function (pdf) of the signalwas estimated. The pdf was calculated in n bins having a con-stant size. The bin size was chosen to be α and kept at thisvalue for each window. Therefore, if in each window the sig-nal (x(t)) lies in the range of [a b], then the number of bins isn = (b − a)/α . Since α is constant for all windows, ndepends on the range of the signal in each window. TheShannon entropy [10] in each window is calculated as
Ep = −n∑
i=1
pi log(pi), (1)
where ∑n
i=1 pi = 1.
To see the effect of changes in signal range on the entropycalculation, assume that the signal x(t) is multiplied by a con-stant factor of Cf . Entropy of a signal is based on its pdf,which is defined on n points for the signal x(t). For simplify-ing the evaluation of the effects of change in the signal ampli-tude on its pdf, assume that Cf = m/n, where m can begreater or less than n. Hence, the pdf (qi) of the new signal,x ′(t) = (m/n) x(t), is defined on m points and its Shannon,entropy can be written as
Eq = −m∑
k=1
qk log(qk), (2)
where ∑m
i=1 qi = 1. Considering the relationship betweenx(t) and x ′(t) and the constant bin-size (α) for calculating thepdf of x(t) and x ′(t), it can be concluded that for every pi thereexist �m/n� components in qi satisfying
pi =�m/n�i∑
k=�m/n�(i−1)+1
qk, (3)
57
Fig. 1. Flowchart of the previous studies for estimating flow from tracheal sound average power.
Average Power Flow
Calibration Routine(A Few Samples of Breath at Different Flow Rates)
C1, C2
TrachealSounds
AveragePower Fest = C1 log (PAvg) + C2
EstimatedFlow
Fig. 2. Flowchart of the flow estimation method using tra-cheal sound entropy.
TrachealSounds
ShannonEntropy
OneBreath
CalibrationProcedure
ShannonEntropy
Flow
Model
mean(Ebr)
mean(Ebase)Fest = C1 Ebr + C2
EstimatedFlow
C1, C2
(( ))

58
where �m/n� is the smallest integer value greater than orequal to (m/n) . For simplicity, it is assumed that the proba-bility of all components in the qk corresponding to each pi isthe same and equal to
qk = n
mpi, (4)
where i = ⌈nkm
⌉. Thus, (2) can be written as
Eq = −m∑
k = 1
qk log(qk)
= −m∑
k = 1
n
mp� nk
m � log( n
mp� nk
m �)
= − n
mlog
( n
m
) m∑
k = 1
p� nkm � − n
m
m∑
k = 1
p� nkm � log
(p� nk
m �)
.
(5)
Replacing �nk/m� with j, it is clear that⌈
nk
m
⌉= j → k = m
n( j− 1) + 1 , · · · ,
m
nj. (6)
Thus, each j corresponds to m/n components in pi. Therefore,(5) can be rewritten as
Eq = − n
mlog
( n
m
) n∑
i=1
(m
n
)pi − n
m
n∑
i=1
(m
n
)pi log (pi)
= − log( n
m
)+ Ep ⇒ Eq − log (m)
= Ep − log (n) . (7)
From (7), it can be concluded that multiplication of the sig-nal, x(t), by a factor (m/n) causes a term [-log(n)] to be addedto its entropy. Depending on how this factor is defined, thisextra term in entropy represents an increase (or decrease) ofthe original signal amplitude that is supposedly changing incorrespondence to flow. Remember that n represents the sig-nal range in each window, and therefore, log(n) is the loga-rithm of the signal range. Thus, instead of entropy with itshigh computational cost, one may use the range factor,L = log (n), of the signal for flow estimation and yet obtain arobust flow estimation. Three variations of the range factor tobe used as parameters to reflect the changes in tracheal soundamplitude with respect to flow are described next. The para-meters are used for flow estimation and their performance iscompared with the entropy based method.
Relationship Between Flow and Tracheal Sound RangeRecall that n and m in (7) are
n = max(x) − min(x)
binsize,
m = max(x ′) − min(x ′)binsize
, (8)
and L = log (n) for the signal x( t) or L = log (m) for the sig-
IEEE ENGINEERING IN MEDICINE AND BIOLOGY MAGAZINE JANUARY/FEBRUARY 2007
Fig. 4. Regression coefficients between E and L for differentsubjects.
97.00
96.50
96.00
95.50
95.00
94.50
94.00S1 S2 S3 S4 S5 S6 S7 S8 S9 S10
Subjects
Reg
ress
ion
Fig. 5. The effect of parameter r on the overall error aver-aged between the subjects when estimating flow from Lr.
Err
or(%
)
46
810
121416
0 1 2 3 4 5 6 7 8 9r
Fig. 3. A typical example of a) the band-pass filtered tra-cheal sound, along with b) its correspondent actual flow(solid curve) and its absolute value (dashed curve), and c)the corresponding values of L..
0.1
0.05
0
−0.05
0 2 4 6 8 10 12 14 16 18 20Time (s)
TS
20
10
0
−10
(a)
0 2 4 6 8 10 12 14 16 18 20Time (s)
(b)
0 2 4 6 8 10 12 14 16 18 20Time (s)
(c)
54321
Flo
w (
ml/k
g/s)
L
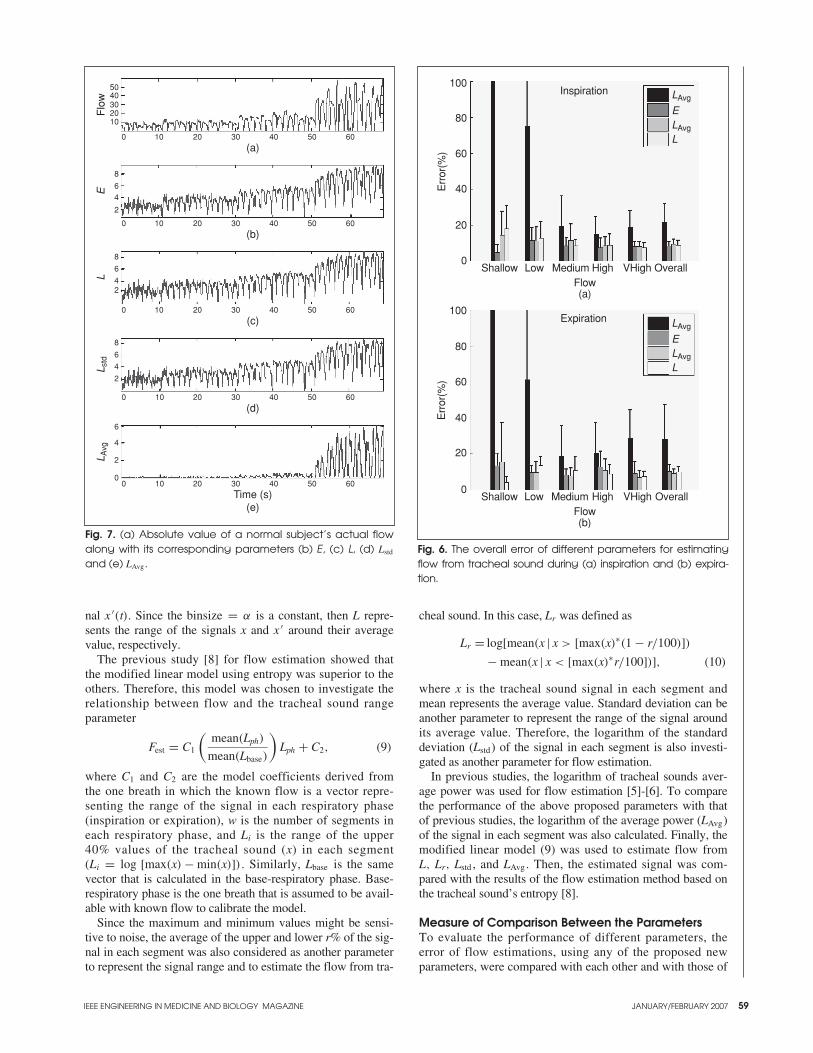
IEEE ENGINEERING IN MEDICINE AND BIOLOGY MAGAZINE JANUARY/FEBRUARY 2007 59
nal x ′(t). Since the binsize = α is a constant, then L repre-sents the range of the signals x and x ′ around their averagevalue, respectively.
The previous study [8] for flow estimation showed thatthe modified linear model using entropy was superior to the others. Therefore, this model was chosen to investigate therelationship between flow and the tracheal sound rangeparameter
Fest = C1
(mean(Lph)
mean(Lbase)
)Lph + C2, (9)
where C1 and C2 are the model coefficients derived fromthe one breath in which the known flow is a vector repre-senting the range of the signal in each respiratory phase(inspiration or expiration), w is the number of segments ineach respiratory phase, and Li is the range of the upper40% values of the tracheal sound (x) in each segment(Li = log [max(x) − min(x)]) . Similarly, Lbase is the samevector that is calculated in the base-respiratory phase. Base-respiratory phase is the one breath that is assumed to be avail-able with known flow to calibrate the model.
Since the maximum and minimum values might be sensi-tive to noise, the average of the upper and lower r% of the sig-nal in each segment was also considered as another parameterto represent the signal range and to estimate the flow from tra-
Fig. 6. The overall error of different parameters for estimatingflow from tracheal sound during (a) inspiration and (b) expira-tion.
100
80
60
40
20
0Shallow Low Medium High VHigh Overall
LAvg
ELAvg
L
Expiration
Flow
Err
or(%
)
(b)
100
80
40
20
0Shallow Low Medium High VHigh Overall
LAvg
ELAvg
L
Inspiration
Flow
Err
or(%
)
(a)
60
Fig. 7. (a) Absolute value of a normal subject’s actual flowalong with its corresponding parameters (b) E, (c) L, (d) Lstd
and (e) LAvg.
1020304050
0 10 20 30 40 50 60
2
46
8
24
6
8
2
4
6
8
2
0
4
6
Flo
wE
LL A
vgL s
td
(e)Time (s)
(a)
0 10 20 30 40 50 60
(b)
0 10 20 30 40 50 60
(c)
0 10 20 30 40 50 60
0 10 20 30 40 50 60
(d)
cheal sound. In this case, Lr was defined as
Lr = log[mean(x | x > [max(x)∗(1 − r/100)])
− mean(x | x < [max(x)∗r/100])], (10)
where x is the tracheal sound signal in each segment andmean represents the average value. Standard deviation can beanother parameter to represent the range of the signal aroundits average value. Therefore, the logarithm of the standarddeviation (Lstd) of the signal in each segment is also investi-gated as another parameter for flow estimation.
In previous studies, the logarithm of tracheal sounds aver-age power was used for flow estimation [5]-[6]. To comparethe performance of the above proposed parameters with thatof previous studies, the logarithm of the average power (LAvg)of the signal in each segment was also calculated. Finally, themodified linear model (9) was used to estimate flow fromL, Lr, Lstd , and LAvg. Then, the estimated signal was com-pared with the results of the flow estimation method based onthe tracheal sound’s entropy [8].
Measure of Comparison Between the ParametersTo evaluate the performance of different parameters, theerror of flow estimations, using any of the proposed newparameters, were compared with each other and with those of
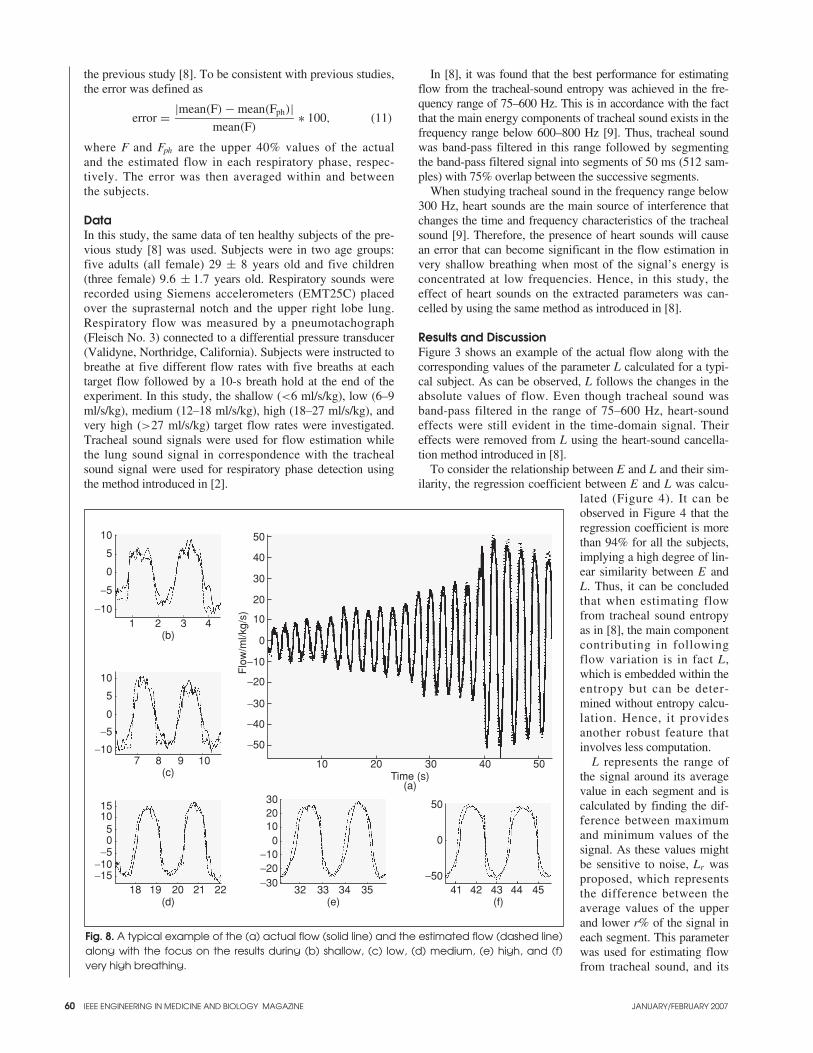
60
the previous study [8]. To be consistent with previous studies,the error was defined as
error = |mean(F) − mean(Fph)|mean(F)
∗ 100, (11)
where F and Fph are the upper 40% values of the actualand the estimated flow in each respiratory phase, respec-tively. The error was then averaged within and betweenthe subjects.
DataIn this study, the same data of ten healthy subjects of the pre-vious study [8] was used. Subjects were in two age groups:five adults (all female) 29 ± 8 years old and five children(three female) 9.6 ± 1.7 years old. Respiratory sounds wererecorded using Siemens accelerometers (EMT25C) placedover the suprasternal notch and the upper right lobe lung.Respiratory flow was measured by a pneumotachograph(Fleisch No. 3) connected to a differential pressure transducer(Validyne, Northridge, California). Subjects were instructed tobreathe at five different flow rates with five breaths at eachtarget flow followed by a 10-s breath hold at the end of theexperiment. In this study, the shallow (<6 ml/s/kg), low (6–9ml/s/kg), medium (12–18 ml/s/kg), high (18–27 ml/s/kg), andvery high (>27 ml/s/kg) target flow rates were investigated.Tracheal sound signals were used for flow estimation whilethe lung sound signal in correspondence with the trachealsound signal were used for respiratory phase detection usingthe method introduced in [2].
In [8], it was found that the best performance for estimatingflow from the tracheal-sound entropy was achieved in the fre-quency range of 75–600 Hz. This is in accordance with the factthat the main energy components of tracheal sound exists in thefrequency range below 600–800 Hz [9]. Thus, tracheal soundwas band-pass filtered in this range followed by segmentingthe band-pass filtered signal into segments of 50 ms (512 sam-ples) with 75% overlap between the successive segments.
When studying tracheal sound in the frequency range below300 Hz, heart sounds are the main source of interference thatchanges the time and frequency characteristics of the trachealsound [9]. Therefore, the presence of heart sounds will causean error that can become significant in the flow estimation invery shallow breathing when most of the signal’s energy isconcentrated at low frequencies. Hence, in this study, theeffect of heart sounds on the extracted parameters was can-celled by using the same method as introduced in [8].
Results and DiscussionFigure 3 shows an example of the actual flow along with thecorresponding values of the parameter L calculated for a typi-cal subject. As can be observed, L follows the changes in theabsolute values of flow. Even though tracheal sound wasband-pass filtered in the range of 75–600 Hz, heart-soundeffects were still evident in the time-domain signal. Theireffects were removed from L using the heart-sound cancella-tion method introduced in [8].
To consider the relationship between E and L and their sim-ilarity, the regression coefficient between E and L was calcu-
lated (Figure 4). It can beobserved in Figure 4 that theregression coefficient is morethan 94% for all the subjects,implying a high degree of lin-ear similarity between E andL. Thus, it can be concludedthat when estimating flowfrom tracheal sound entropyas in [8], the main componentcontributing in followingflow variation is in fact L,which is embedded within theentropy but can be deter-mined without entropy calcu-lation. Hence, it providesanother robust feature thatinvolves less computation.
L represents the range ofthe signal around its averagevalue in each segment and iscalculated by finding the dif-ference between maximumand minimum values of thesignal. As these values mightbe sensitive to noise, Lr wasproposed, which representsthe difference between theaverage values of the upperand lower r% of the signal ineach segment. This parameterwas used for estimating flowfrom tracheal sound, and its
IEEE ENGINEERING IN MEDICINE AND BIOLOGY MAGAZINE JANUARY/FEBRUARY 2007
Fig. 8. A typical example of the (a) actual flow (solid line) and the estimated flow (dashed line)along with the focus on the results during (b) shallow, (c) low, (d) medium, (e) high, and (f)very high breathing.
10
5
0
−5
−101 2 3 4
(b)
10
5
0
−5
−107 8 9 10
(c)
15105
−5−10
0
−1518 19 20 21 22
(d)
3020100
−10−20−30
32 33 34 35(e)
50
40
30
20
10
0
−10
−20
−30
−40
−50
10 20 30 40 50Time (s)
(a)
Flo
w/m
l/kg/
s)
50
0
−5041 42 43 44 45
(f)
IEEE ENGINEERING IN MEDICINE AND BIOLOGY MAGAZINE JANUARY/FEBRUARY 2007 61
performance for different values of r was evaluated. For thispurpose, the overall error of estimating flow from a modifiedlinear model using Lr was calculated for different values of r(Figure 5). As it can be observed, the error is maximum whenr = 0. This result was expected as for r = 0, Lr becomesequal to L and it is more sensitive to noise. On the other hand,for values of r > 0 the changes in the overall error were negli-gible;. This implies that the model is not very sensitive to thechanges of r. This observation might also be due to the effectsof band-pass filtering of the tracheal sound in the range of75–600 Hz, which removes high frequency noises.
Finally, the flow estimation error using any of the LAvg, L,Lstd , and E parameters of the tracheal sound is shown inFigure 6. As can be observed, the performance of L, Lstd, andE are similar at all flow rates in both respiratory phases, whilethe error of flow estimation using LAvg was consistently high-er than those of the other parameters especially at the shallowand low flow rates. This result was expected since LAvg cannotfollow the flow variation as good as the other parameters. Infact, at shallow flow rates, it completely fails. This result is inagreement with the results reported in [8]. Figure 7 shows theabsolute value of the actual flow acquired from a typical sub-ject at different flow rates along with its corresponding para-meters Lstd,L, LAvg, and E; it clearly depicts the incapability ofLAvg at shallow flow rates.
Entropy of a signal represents the changes in its pdf.Therefore, accurate estimation of the pdf is of great impor-tance in calculating entropy. When calculating entropy of tra-cheal sound, the pdf of the signal in each segment is estimatedusing a kernel estimator, which is the most time consumingpart of the flow-estimation process [8]. Although it wasshown that the method proposed for estimating flow from tra-cheal sound entropy can be performed in real time, its compu-tational cost was more than that of other methods based on theaverage power of tracheal sound [8]. On the other hand, thecomputational cost of estimating flow using either L or Lstd isalmost equal to that of the methods using LAvg, which is muchless than that of the method using entropy.
The results of using the modified linear model with the Lstd
and E parameters are very similar to those using the parameterL. This parameter was chosen as the superior parameter of thetracheal sound to follow flow variation and estimate flowacoustically due to its better performance and its reducedcomputational cost. Figure 8 shows a typical example of flowestimation using the parameter L for a typical subject.
ConclusionsThe goal of this study was to investigate the relationshipbetween flow and tracheal-sound entropy more thoroughly.The objective was to extract an embedded feature in theentropy of tracheal sound that reflects the flow variation mostclearly and to investigate its robustness for flow estimation. Itwas shown that when calculating entropy using a constantbin-size, there exists a term (L) that represents the range of thesignal around its average. As the results suggest, L follows thevariation of the absolute value of flow from very shallowbreathing to very high flow rate quite well. The model usingthis parameter resulted in flow estimation with an averageerror of 8.82 ± 2.79% and 10.15 ± 2.73% during inspirationand expiration respectively. Thus, this feature can be used forestimating flow with essentially the same performance asentropy but with a much lower computational cost.
Azadeh Yadollahi received both her B.Sc.and her M.Sc. degrees from SharifUniversity of Technology, Iran, in 2003 and2005, respectively. Currently, she is a Ph.D.candidate at the University of Manitoba inthe Department of Electrical and ComputerEngineering. Her current research interestsinclude respiratory and swallowing sounds
analysis. She is a Student Member of the IEEE and a memberof the IEEE Engineering in Medicine and Biology Society.
Zahra M.K. Moussavi received her B.Sc.from Sharif University of Technology,Iran, in 1987, her M.Sc. from theUniversity of Calgary in 1993, and herPh.D. from the University of Manitoba,Canada, in 1997, all in electrical engineer-ing. She then joined the respiratoryresearch group at the Winnipeg Children’s
Hospital and worked as a research associate for one and onehalf years. In 1999, she joined the Biomedical EngineeringDepartment of Johns Hopkins University and worked thereas a postdoctoral fellow for one year. Following that, shejoined the University of Manitoba, Department of Electricaland Computer Engineering, where she is currently an associ-ate professor. She is also an adjunct scientist at the TRLab ofWinnipeg. Her current research includes respiratory andswallowing sound analysis, postural control and balance,rehabilitation and human motor learning. She is a SeniorMember of the IEEE, a member of the IEEE Engineering inMedicine and Biology Society, and a member of theInternational Lung Sounds Association (ILSA). She is alsocurrently the EMBS chapter chair, Winnipeg section.
Address for Correspondence: Zahra M.K. Moussavi, Dept.of Electrical and Computer Engineering, University ofManitoba, Winnipeg, MB R3T 5V6, Canada. E-mail:[email protected].
References[1] S. Tarrant, R. Ellis, F. Flack, and W. Selley, “Comparative review of tech-niques for recording respiratory events at rest and during deglutition,” Dysphagia,vol. 12, no. 1, pp. 24–38, 1997.[2] Z. Moussavi, M. Leopando, H. Pasterkamp, and G. Rempel, “Computerizedacoustical respiratory phase detection without airflow measurement,” J. Med. andBiolog. Eng. and Comp., vol. 38, no. 4, pp. 198–203, 2000.[3] G. Souffet, G. Charbonneau, M. Polit, P. Attal, A. Denjean, P. Escourrou, andC. Gaultier, “Interaction between tracheal sound and flow rare: A comparison ofsome different flow evaluations from lung sounds,” IEEE Trans. Biomed. Eng.,vol. 37, no. 4, pp. 384–391, 1990.[4] I. Hossain and Z. Moussavi, “Respiratory airflow estimation by acousticalmeans,” in Proc. IEEE 2nd joint EMBS/BMES Conf., Houston, TX, pp.1476–1477, 2002.[5] Y. Yap and Z. Moussavi, “Acoustic airflow estimation from tracheal soundpower,” in Proc. IEEE Canadian Conf. Elec. Comp. Eng., 2002, pp. 1073–1076. [6] M. Golabbakhsh, “Tracheal breath sound relationship with respiratory flow:Modeling, the effect of age and airflow estimation,” M.Sc. thesis, Elec. and Comp.Eng. Dept., Univ. Manitoba, 2004.[7] C. Que, C. Kolmaga, L. Durand, S. Kelly, and P. Macklem, “Phonospirometryfor noninvasive measurement of ventilation: methodology and preliminaryresults,” J. Appl. Physical., vol. 93, no. 4, pp. 1515–1526, 2002. [8] A. Yadollahi and Z. Moussavi, “A robust method for estimating respiratoryflow using tracheal sound entropy,” IEEE Trans. Biomed. Eng., vol. 53, no. 4, pp.662-668, 2006. .[9] A. Sovijarvi, L. Malmberg, G. Charbonneau, J. Vanderschoot, F. Dalmasso, C.Sacco, M. Rossi, and J. Earis, “Characteristic of breath sounds and adventitiousrespiratory sounds,” Eur. Resp. Rev. J., pp. 591–596, 2000. [10] A. Papoulis, Probability, Random Variables and Stochastic Processes. NewYork: McGraw-Hill Co., 1991.
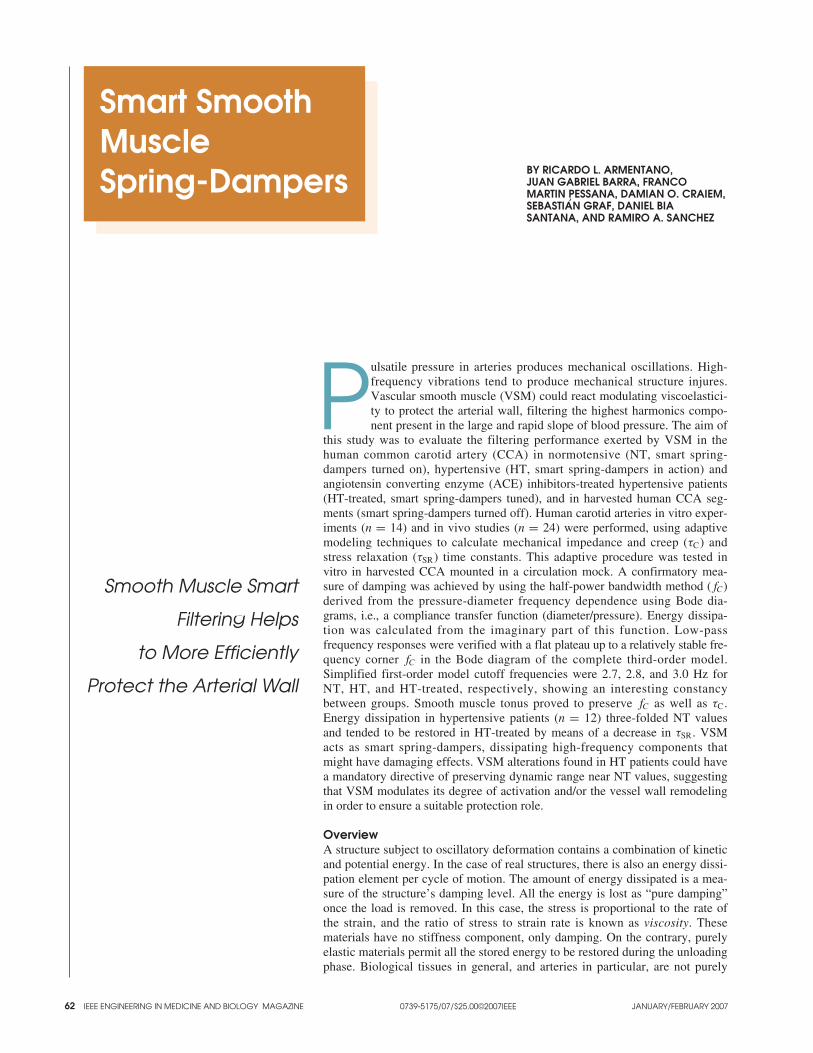
62 IEEE ENGINEERING IN MEDICINE AND BIOLOGY MAGAZINE JANUARY/FEBRUARY 20070739-5175/07/$25.00©2007IEEE
Smooth Muscle Smart
Filtering Helps
to More Efficiently
Protect the Arterial Wall
BY RICARDO L. ARMENTANO,JUAN GABRIEL BARRA, FRANCOMARTIN PESSANA, DAMIAN O. CRAIEM,SEBASTIAN GRAF, DANIEL BIASANTANA, AND RAMIRO A. SANCHEZ
Smart SmoothMuscleSpring-Dampers
Pulsatile pressure in arteries produces mechanical oscillations. High-frequency vibrations tend to produce mechanical structure injures.Vascular smooth muscle (VSM) could react modulating viscoelastici-ty to protect the arterial wall, filtering the highest harmonics compo-nent present in the large and rapid slope of blood pressure. The aim of
this study was to evaluate the filtering performance exerted by VSM in thehuman common carotid artery (CCA) in normotensive (NT, smart spring-dampers turned on), hypertensive (HT, smart spring-dampers in action) andangiotensin converting enzyme (ACE) inhibitors-treated hypertensive patients(HT-treated, smart spring-dampers tuned), and in harvested human CCA seg-ments (smart spring-dampers turned off). Human carotid arteries in vitro exper-iments (n = 14) and in vivo studies (n = 24) were performed, using adaptivemodeling techniques to calculate mechanical impedance and creep (τC) andstress relaxation (τSR) time constants. This adaptive procedure was tested invitro in harvested CCA mounted in a circulation mock. A confirmatory mea-sure of damping was achieved by using the half-power bandwidth method ( fC)derived from the pressure-diameter frequency dependence using Bode dia-grams, i.e., a compliance transfer function (diameter/pressure). Energy dissipa-tion was calculated from the imaginary part of this function. Low-passfrequency responses were verified with a flat plateau up to a relatively stable fre-quency corner fC in the Bode diagram of the complete third-order model.Simplified first-order model cutoff frequencies were 2.7, 2.8, and 3.0 Hz forNT, HT, and HT-treated, respectively, showing an interesting constancybetween groups. Smooth muscle tonus proved to preserve fC as well as τC.Energy dissipation in hypertensive patients (n = 12) three-folded NT valuesand tended to be restored in HT-treated by means of a decrease in τSR. VSMacts as smart spring-dampers, dissipating high-frequency components thatmight have damaging effects. VSM alterations found in HT patients could havea mandatory directive of preserving dynamic range near NT values, suggestingthat VSM modulates its degree of activation and/or the vessel wall remodelingin order to ensure a suitable protection role.
OverviewA structure subject to oscillatory deformation contains a combination of kineticand potential energy. In the case of real structures, there is also an energy dissi-pation element per cycle of motion. The amount of energy dissipated is a mea-sure of the structure’s damping level. All the energy is lost as “pure damping”once the load is removed. In this case, the stress is proportional to the rate ofthe strain, and the ratio of stress to strain rate is known as viscosity. Thesematerials have no stiffness component, only damping. On the contrary, purelyelastic materials permit all the stored energy to be restored during the unloadingphase. Biological tissues in general, and arteries in particular, are not purely
’
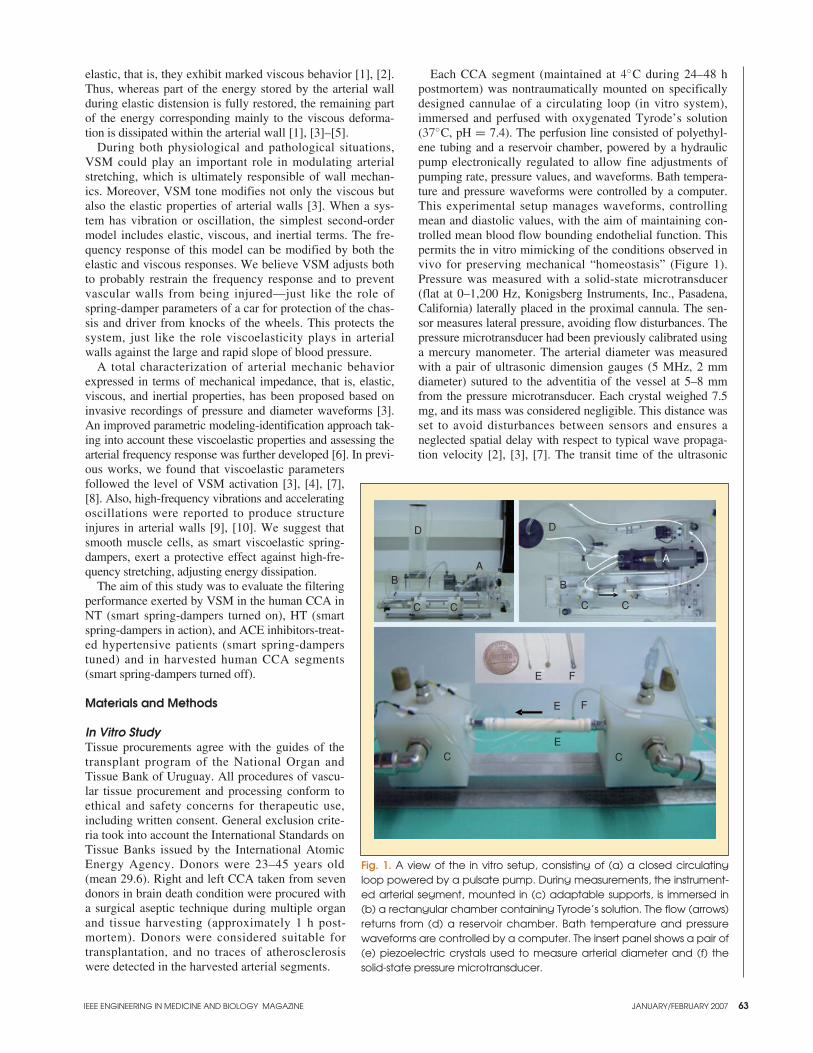
IEEE ENGINEERING IN MEDICINE AND BIOLOGY MAGAZINE JANUARY/FEBRUARY 2007 63
elastic, that is, they exhibit marked viscous behavior [1], [2].Thus, whereas part of the energy stored by the arterial wallduring elastic distension is fully restored, the remaining partof the energy corresponding mainly to the viscous deforma-tion is dissipated within the arterial wall [1], [3]–[5].
During both physiological and pathological situations,VSM could play an important role in modulating arterialstretching, which is ultimately responsible of wall mechan-ics. Moreover, VSM tone modifies not only the viscous butalso the elastic properties of arterial walls [3]. When a sys-tem has vibration or oscillation, the simplest second-ordermodel includes elastic, viscous, and inertial terms. The fre-quency response of this model can be modified by both theelastic and viscous responses. We believe VSM adjusts bothto probably restrain the frequency response and to preventvascular walls from being injured—just like the role ofspring-damper parameters of a car for protection of the chas-sis and driver from knocks of the wheels. This protects thesystem, just like the role viscoelasticity plays in arterialwalls against the large and rapid slope of blood pressure.
A total characterization of arterial mechanic behaviorexpressed in terms of mechanical impedance, that is, elastic,viscous, and inertial properties, has been proposed based oninvasive recordings of pressure and diameter waveforms [3].An improved parametric modeling-identification approach tak-ing into account these viscoelastic properties and assessing thearterial frequency response was further developed [6]. In previ-ous works, we found that viscoelastic parametersfollowed the level of VSM activation [3], [4], [7],[8]. Also, high-frequency vibrations and acceleratingoscillations were reported to produce structureinjures in arterial walls [9], [10]. We suggest thatsmooth muscle cells, as smart viscoelastic spring-dampers, exert a protective effect against high-fre-quency stretching, adjusting energy dissipation.
The aim of this study was to evaluate the filteringperformance exerted by VSM in the human CCA inNT (smart spring-dampers turned on), HT (smartspring-dampers in action), and ACE inhibitors-treat-ed hypertensive patients (smart spring-damperstuned) and in harvested human CCA segments(smart spring-dampers turned off).
Materials and Methods
In Vitro StudyTissue procurements agree with the guides of thetransplant program of the National Organ andTissue Bank of Uruguay. All procedures of vascu-lar tissue procurement and processing conform toethical and safety concerns for therapeutic use,including written consent. General exclusion crite-ria took into account the International Standards onTissue Banks issued by the International AtomicEnergy Agency. Donors were 23–45 years old(mean 29.6). Right and left CCA taken from sevendonors in brain death condition were procured witha surgical aseptic technique during multiple organand tissue harvesting (approximately 1 h post-mortem). Donors were considered suitable fortransplantation, and no traces of atherosclerosiswere detected in the harvested arterial segments.
Each CCA segment (maintained at 4◦C during 24–48 hpostmortem) was nontraumatically mounted on specificallydesigned cannulae of a circulating loop (in vitro system),immersed and perfused with oxygenated Tyrode’s solution(37◦C, pH = 7.4). The perfusion line consisted of polyethyl-ene tubing and a reservoir chamber, powered by a hydraulicpump electronically regulated to allow fine adjustments ofpumping rate, pressure values, and waveforms. Bath tempera-ture and pressure waveforms were controlled by a computer.This experimental setup manages waveforms, controllingmean and diastolic values, with the aim of maintaining con-trolled mean blood flow bounding endothelial function. Thispermits the in vitro mimicking of the conditions observed invivo for preserving mechanical “homeostasis” (Figure 1).Pressure was measured with a solid-state microtransducer(flat at 0–1,200 Hz, Konigsberg Instruments, Inc., Pasadena,California) laterally placed in the proximal cannula. The sen-sor measures lateral pressure, avoiding flow disturbances. Thepressure microtransducer had been previously calibrated usinga mercury manometer. The arterial diameter was measuredwith a pair of ultrasonic dimension gauges (5 MHz, 2 mmdiameter) sutured to the adventitia of the vessel at 5–8 mmfrom the pressure microtransducer. Each crystal weighed 7.5mg, and its mass was considered negligible. This distance wasset to avoid disturbances between sensors and ensures aneglected spatial delay with respect to typical wave propaga-tion velocity [2], [3], [7]. The transit time of the ultrasonic
Fig. 1. A view of the in vitro setup, consisting of (a) a closed circulatingloop powered by a pulsate pump. During measurements, the instrument-ed arterial segment, mounted in (c) adaptable supports, is immersed in(b) a rectangular chamber containing Tyrode’s solution. The flow (arrows)returns from (d) a reservoir chamber. Bath temperature and pressurewaveforms are controlled by a computer. The insert panel shows a pair of(e) piezoelectric crystals used to measure arterial diameter and (f) thesolid-state pressure microtransducer.
D
BA
C C
B
C C
D
A
E
E F
F
ECC
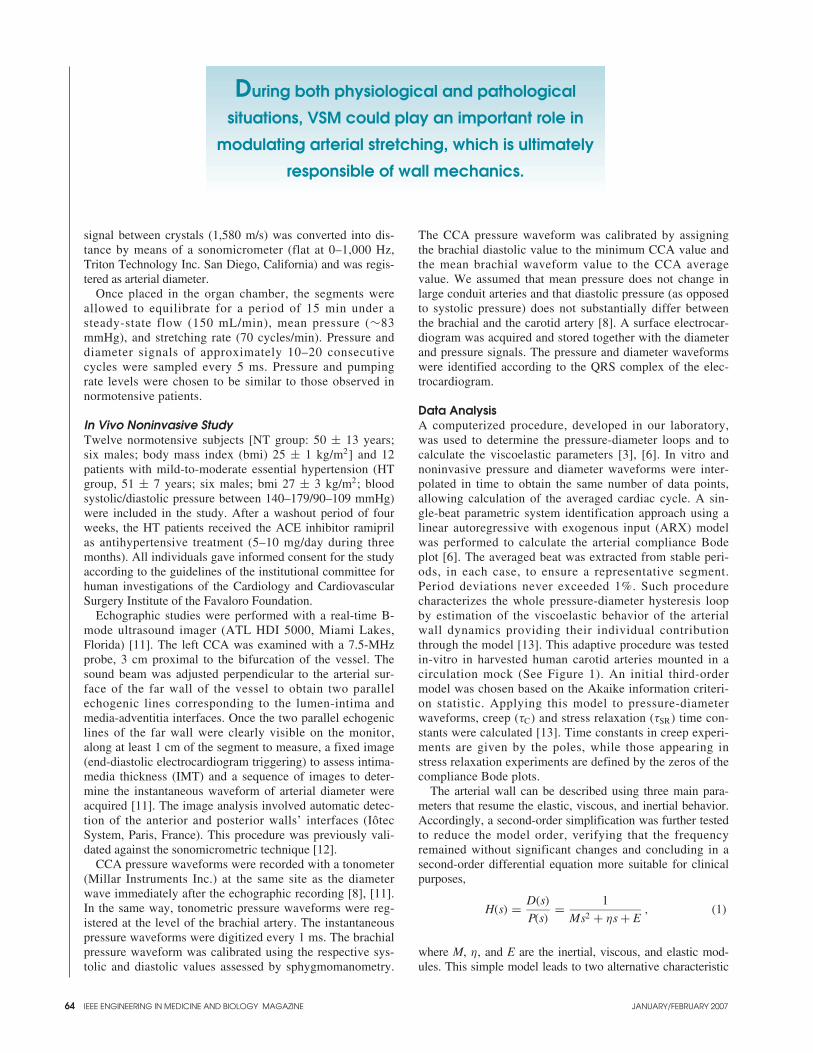
64
signal between crystals (1,580 m/s) was converted into dis-tance by means of a sonomicrometer (flat at 0–1,000 Hz,Triton Technology Inc. San Diego, California) and was regis-tered as arterial diameter.
Once placed in the organ chamber, the segments wereallowed to equilibrate for a period of 15 min under asteady-state flow (150 mL/min), mean pressure (∼83mmHg), and stretching rate (70 cycles/min). Pressure anddiameter signals of approximately 10–20 consecutivecycles were sampled every 5 ms. Pressure and pumpingrate levels were chosen to be similar to those observed innormotensive patients.
In Vivo Noninvasive StudyTwelve normotensive subjects [NT group: 50 ± 13 years; six males; body mass index (bmi) 25 ± 1 kg/m2] and 12patients with mild-to-moderate essential hypertension (HTgroup, 51 ± 7 years; six males; bmi 27 ± 3 kg/m2; bloodsystolic/diastolic pressure between 140–179/90–109 mmHg)were included in the study. After a washout period of fourweeks, the HT patients received the ACE inhibitor ramiprilas antihypertensive treatment (5–10 mg/day during threemonths). All individuals gave informed consent for the studyaccording to the guidelines of the institutional committee forhuman investigations of the Cardiology and CardiovascularSurgery Institute of the Favaloro Foundation.
Echographic studies were performed with a real-time B-mode ultrasound imager (ATL HDI 5000, Miami Lakes,Florida) [11]. The left CCA was examined with a 7.5-MHzprobe, 3 cm proximal to the bifurcation of the vessel. Thesound beam was adjusted perpendicular to the arterial sur-face of the far wall of the vessel to obtain two parallelechogenic lines corresponding to the lumen-intima andmedia-adventitia interfaces. Once the two parallel echogeniclines of the far wall were clearly visible on the monitor,along at least 1 cm of the segment to measure, a fixed image(end-diastolic electrocardiogram triggering) to assess intima-media thickness (IMT) and a sequence of images to deter-mine the instantaneous waveform of arterial diameter wereacquired [11]. The image analysis involved automatic detec-tion of the anterior and posterior walls’ interfaces (IôtecSystem, Paris, France). This procedure was previously vali-dated against the sonomicrometric technique [12].
CCA pressure waveforms were recorded with a tonometer(Millar Instruments Inc.) at the same site as the diameterwave immediately after the echographic recording [8], [11].In the same way, tonometric pressure waveforms were reg-istered at the level of the brachial artery. The instantaneouspressure waveforms were digitized every 1 ms. The brachialpressure waveform was calibrated using the respective sys-tolic and diastolic values assessed by sphygmomanometry.
The CCA pressure waveform was calibrated by assigningthe brachial diastolic value to the minimum CCA value andthe mean brachial waveform value to the CCA averagevalue. We assumed that mean pressure does not change inlarge conduit arteries and that diastolic pressure (as opposedto systolic pressure) does not substantially differ betweenthe brachial and the carotid artery [8]. A surface electrocar-diogram was acquired and stored together with the diameterand pressure signals. The pressure and diameter waveformswere identified according to the QRS complex of the elec-trocardiogram.
Data AnalysisA computerized procedure, developed in our laboratory,was used to determine the pressure-diameter loops and tocalculate the viscoelastic parameters [3], [6]. In vitro andnoninvasive pressure and diameter waveforms were inter-polated in time to obtain the same number of data points,allowing calculation of the averaged cardiac cycle. A sin-gle-beat parametric system identification approach using alinear autoregressive with exogenous input (ARX) modelwas performed to calculate the arterial compliance Bodeplot [6]. The averaged beat was extracted from stable peri-ods, in each case, to ensure a representative segment.Period deviations never exceeded 1%. Such procedurecharacterizes the whole pressure-diameter hysteresis loopby estimation of the viscoelastic behavior of the arterialwall dynamics providing their individual contributionthrough the model [13]. This adaptive procedure was testedin-vitro in harvested human carotid arteries mounted in acirculation mock (See Figure 1). An initial third-ordermodel was chosen based on the Akaike information criteri-on statistic. Applying this model to pressure-diameterwaveforms, creep (τC) and stress relaxation (τSR) time con-stants were calculated [13]. Time constants in creep experi-ments are given by the poles, while those appearing instress relaxation experiments are defined by the zeros of thecompliance Bode plots.
The arterial wall can be described using three main para-meters that resume the elastic, viscous, and inertial behavior.Accordingly, a second-order simplification was further testedto reduce the model order, verifying that the frequencyremained without significant changes and concluding in asecond-order differential equation more suitable for clinicalpurposes,
H(s) = D(s)
P(s)= 1
Ms2 + ηs + E, (1)
where M, η, and E are the inertial, viscous, and elastic mod-ules. This simple model leads to two alternative characteristic
IEEE ENGINEERING IN MEDICINE AND BIOLOGY MAGAZINE JANUARY/FEBRUARY 2007
During both physiological and pathological
situations, VSM could play an important role in
modulating arterial stretching, which is ultimately
responsible of wall mechanics.
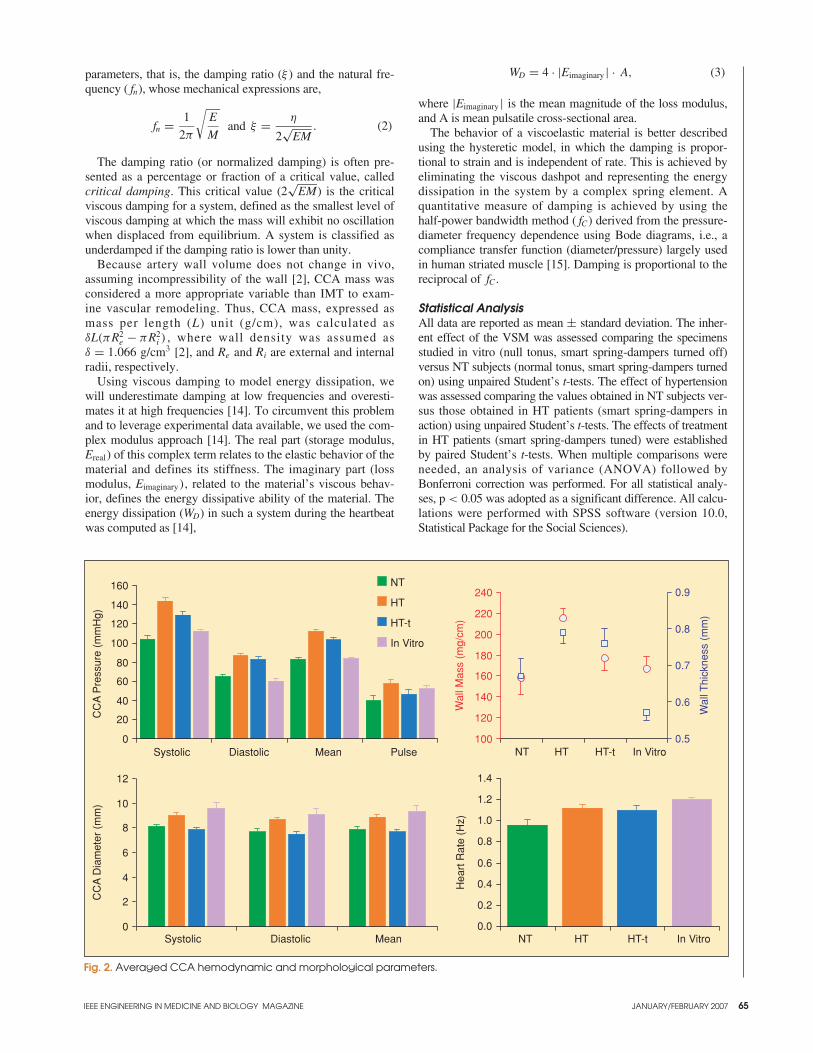
IEEE ENGINEERING IN MEDICINE AND BIOLOGY MAGAZINE JANUARY/FEBRUARY 2007 65
parameters, that is, the damping ratio (ξ ) and the natural fre-quency ( fn), whose mechanical expressions are,
fn = 1
2π
√E
Mand ξ = η
2√
EM. (2)
The damping ratio (or normalized damping) is often pre-sented as a percentage or fraction of a critical value, calledcritical damping. This critical value (2
√EM) is the critical
viscous damping for a system, defined as the smallest level ofviscous damping at which the mass will exhibit no oscillationwhen displaced from equilibrium. A system is classified asunderdamped if the damping ratio is lower than unity.
Because artery wall volume does not change in vivo,assuming incompressibility of the wall [2], CCA mass wasconsidered a more appropriate variable than IMT to exam-ine vascular remodeling. Thus, CCA mass, expressed asmass per length (L) unit (g/cm), was calculated asδL(πR2
e − πR2i ) , where wall density was assumed as
δ = 1.066 g/cm3 [2], and Re and Ri are external and internalradii, respectively.
Using viscous damping to model energy dissipation, wewill underestimate damping at low frequencies and overesti-mates it at high frequencies [14]. To circumvent this problemand to leverage experimental data available, we used the com-plex modulus approach [14]. The real part (storage modulus,Ereal) of this complex term relates to the elastic behavior of thematerial and defines its stiffness. The imaginary part (lossmodulus, Eimaginary), related to the material’s viscous behav-ior, defines the energy dissipative ability of the material. Theenergy dissipation (WD) in such a system during the heartbeatwas computed as [14],
WD = 4 · |Eimaginary | · A, (3)
where |Eimaginary | is the mean magnitude of the loss modulus,and A is mean pulsatile cross-sectional area.
The behavior of a viscoelastic material is better describedusing the hysteretic model, in which the damping is propor-tional to strain and is independent of rate. This is achieved byeliminating the viscous dashpot and representing the energydissipation in the system by a complex spring element. Aquantitative measure of damping is achieved by using thehalf-power bandwidth method ( fC) derived from the pressure-diameter frequency dependence using Bode diagrams, i.e., acompliance transfer function (diameter/pressure) largely usedin human striated muscle [15]. Damping is proportional to thereciprocal of fC .
Statistical AnalysisAll data are reported as mean ± standard deviation. The inher-ent effect of the VSM was assessed comparing the specimensstudied in vitro (null tonus, smart spring-dampers turned off)versus NT subjects (normal tonus, smart spring-dampers turnedon) using unpaired Student’s t-tests. The effect of hypertensionwas assessed comparing the values obtained in NT subjects ver-sus those obtained in HT patients (smart spring-dampers inaction) using unpaired Student’s t-tests. The effects of treatmentin HT patients (smart spring-dampers tuned) were establishedby paired Student’s t-tests. When multiple comparisons wereneeded, an analysis of variance (ANOVA) followed byBonferroni correction was performed. For all statistical analy-ses, p < 0.05 was adopted as a significant difference. All calcu-lations were performed with SPSS software (version 10.0,Statistical Package for the Social Sciences).
Fig. 2. Averaged CCA hemodynamic and morphological parameters.
Systolic Diastolic Mean Pulse
CC
A P
ress
ure
(mm
Hg)
NT
HT
HT-t
In Vitro
0
20
40
60
80
100
120
140
160
0
2
4
6
8
10
12
Systolic Diastolic Mean
CC
A D
iam
eter
(m
m)
NT HT HT-t In Vitro
Wal
l Mas
s (m
g/cm
)
0.5
0.6
0.7
0.8
0.9
Wal
l Thi
ckne
ss (
mm
)
100
120
140
160
180
200
220
240
0.0
0.2
0.4
0.6
0.8
1.0
1.2
1.4
NT HT HT-t In Vitro
Hea
rt R
ate
(Hz)

66
ResultsFigure 2 shows averaged CCA hemodynamic parameters fornoninvasive and in vitro studies. Initial values for IMT in theHT group were significantly higher than in the NT group.These remained unchanged after ACE inhibition.Representative pressure-diameter loops among the differentconditions are shown in Figure 3.
Smart Spring-Dampers Turned OffThe effect of vasomotor tone was studied under virtually isobaric conditions between NT and in vitro specimens.
Viscoelastic results are presented in Figure 4. The presenceof VSM tone in NT subjects caused an elastic decrease(43%, p < 0.05) concomitant with increased arterial wall vis-cosity (112%, p < 0.01), modifying damping ratio ξ (22%, p< 0.05), and dramatically decreasing fC (67%, p < 0.01).Figure 5 shows the derived viscoelastic constants. The pres-ence of VSM tone was evidenced through a sixfold increase(p < 0.01) in the stress relaxation time constant shifting pres-sure-diameter loops to the left (Figure 3). Bode responses areshown in Figure 6, where the transfer function H(s) wasassumed as a frequency compliance function from the com-
plete third-order model. Low-pass frequencies’responses can be verified with a flat plateau up to arelatively stable frequency corner fC .
Smart Spring-Dampers in ActionHypertension increased pressure, diameter, IMT,circumferential stress (37%, p < 0.01), and CCAwall mass per unit length (36%, p = 0.01; seeFigures 2 and 3) concomitantly with M increase(40%, p < 0.01; see Figure 4), shifting a more steeppressure-diameter loop to the right (Figure 3). Bothelastic (79%, p < 0.01) and viscous (82%, p < 0.01)behavior increased with hypertension as shown inFigure 4. At the same time, energy dissipationalmost tripled the normal values (p < 0.01), where-as all damping parameters ( fC, τC, ξ) remainedconstant (Figures 4–6).
IEEE ENGINEERING IN MEDICINE AND BIOLOGY MAGAZINE JANUARY/FEBRUARY 2007
Fig. 4. Averaged biomechanical parameters obtained from application of the viscoelastic model. E, η and M: elastic, viscous and inertial parameters.
0
3
6
9
12
15
18
Nat
ural
Fre
quen
cy (
Hz)
0.0
0.2
0.4
0.6
0.8
1.0
Dam
ping
Fac
tor
0
50
100
150
200
250
NT HT HT-t In Vitro NT HT HT-t In Vitro NT HT HT-t In Vitro
E (
mm
Hg/
mm
)
0
2
4
6
8
10
12
14
16
η (m
mH
g.s/
mm
)
0.0
0.1
0.2
0.3
0.4
0.5
0.6
0.7
M (
mm
Hg.
s2 /m
m)
NT HT HT-t In Vitro NT HT HT-t In Vitro
Fig. 3. Graphs showing a representative pressure-diameter loopobtained in each study situation.
5060708090
100110120130140150
7.0 7.5 8.0 8.5 9.0 9.5 10.0
NTHTHT-tIn Vitro
CCA Diameter (mm)
CC
A P
ress
ure
(mm
Hg)
IEEE ENGINEERING IN MEDICINE AND BIOLOGY MAGAZINE JANUARY/FEBRUARY 2007 67
Smart Spring-Dampers TunedACE inhibition had a modulating effect on local VSM, inde-pendently from its peripheral action, evidenced by a 35%diminution in τSR (p < 0.05; Figure 5), restoring the pres-sure-diameter loop to the normal location (Figure 3). Wallelasticity (26%, p < 0.05), viscosity (27%, p < 0.01), andenergy dissipation (41%, p < 0.01) decreased with ACEinhibitor treatment, maintaining enhanced damping parame-ters ( fC, τC, and ξ ; see Figures 4–6).
DiscussionDamping refers to the extraction of mechanical energyfrom a vibrating system usually by conversion of thisenergy into heat. Damping serves to control the steady-state resonant response and to attenuate traveling wavesin the structure [5]. Passive supplemental damping strate-gies are well understood and are recognized as a meansfor mitigating the effects of dynamic loadings. Smartdamping (also known as semiactive control) strategies areparticularly promising in addressing many of the chal-lenges to this technology, offering the reliability of pas-sive devices but maintaining the versat i l i ty andadaptability of fully active systems [16].
In this sense, there is a strong similitude with the smartsmooth muscle spring-damping mechanism such as pres-sure-dependent myogenic response, flow-dependentresponse mediated by endothelium, or vascular remodel-ing [17]. These adaptive mechanisms are also described tomaintain circumferential wall stress, within a normal and
uniform level. It is well known that hypertensive wallthickening is one of the main compensatory mechanismsto preserve circumferential wall stress [18]. Moreover,arterial wall viscosity is associated with higher IMT, sug-gesting that media thickening might be related to thesmooth muscle alterations found in hypertension [11]. Inlight of this finding, we postulate that VSM dissipatesenergy to avoid high-frequency components in the pres-sure wave to be transferred to vascular diameter. Duringhypertension, energy dissipation is highly increased, pro-tecting arterial wall but producing an additional load tothe heart. Besides, the VSM modulates its degree of acti-vation and vessel wall remodeling, thus preventing high-frequency vibrations from damaging the wall constituents.Recent works argue that over 30 Hz, noticeable damagingeffects can be evidenced in certain tissues [9], [10]. Weconsidered that oscillations around and beyond 30 Hzmight represent injurious high frequencies for arteriesshowing a progressive reduction of finger blood flowafter exposure to vibrations of frequencies ranging from31.5–250 Hz [10].
In vitro tests of harvested human arteries, allowing anull tonus analysis, could imply some limitations: 1) theabsence of surrounding tissues could modify energy esti-mation, 2) some possible differences in the pressure/flowlevels and waveforms, including the absence of wavereflections, 3) the elimination of neural innervations main-ly affects vascular smooth muscle (warranting null tonusstate), whereas endothelin, nitric oxide, and other
Fig. 5. Time constants obtained from the application of the model. WD : beat-to-beat energy dissipation.
0
20
40
60
80
100
120
Tim
e C
onst
ant (
ms)
NT HT HT-t In Vitro NT HT HT-t In Vitro
Creep
Stress Relaxation
0
10
20
30
40
WD
(105
erg/
cm2 )
We suggest that smooth muscle cells,
as smart viscoelastic spring-dampers,
exert a protective effect against high-frequency
stretching, adjusting energy dissipation.
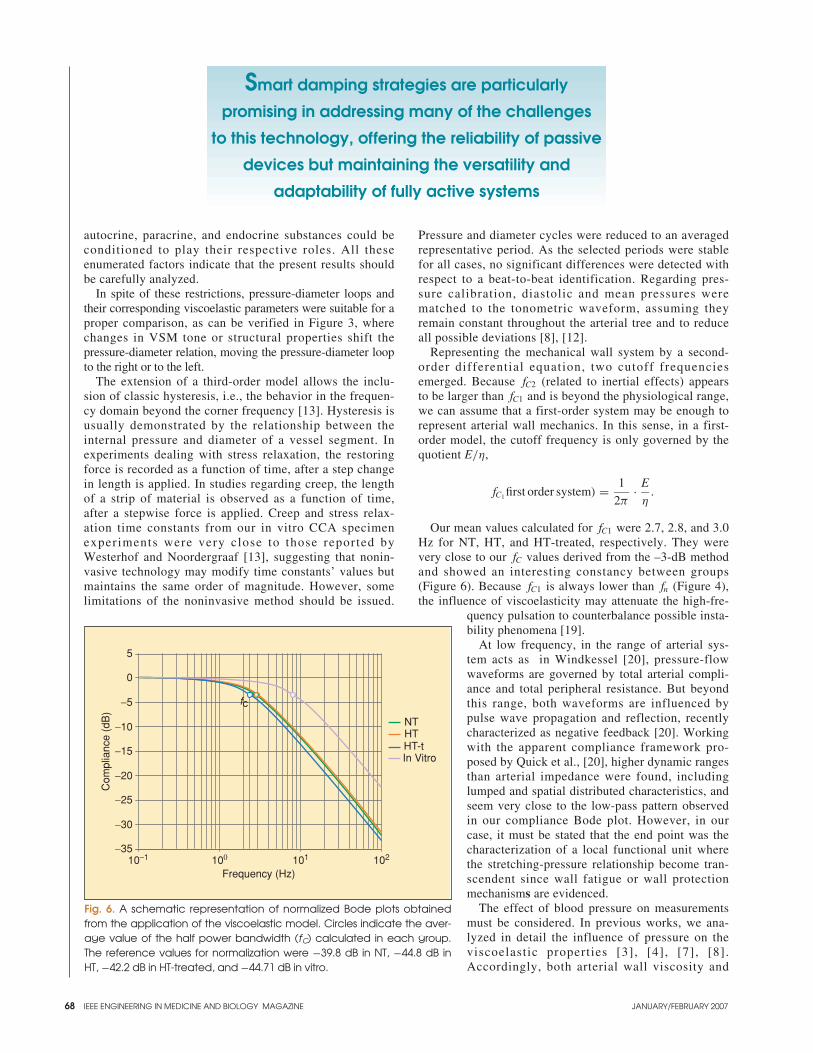
68
autocrine, paracrine, and endocrine substances could beconditioned to play their respective roles. All theseenumerated factors indicate that the present results shouldbe carefully analyzed.
In spite of these restrictions, pressure-diameter loops andtheir corresponding viscoelastic parameters were suitable for aproper comparison, as can be verified in Figure 3, wherechanges in VSM tone or structural properties shift the pressure-diameter relation, moving the pressure-diameter loopto the right or to the left.
The extension of a third-order model allows the inclu-sion of classic hysteresis, i.e., the behavior in the frequen-cy domain beyond the corner frequency [13]. Hysteresis isusually demonstrated by the relationship between theinternal pressure and diameter of a vessel segment. Inexperiments dealing with stress relaxation, the restoringforce is recorded as a function of time, after a step changein length is applied. In studies regarding creep, the lengthof a strip of material is observed as a function of time,after a stepwise force is applied. Creep and stress relax-ation time constants from our in vitro CCA specimenexperiments were very close to those reported byWesterhof and Noordergraaf [13], suggesting that nonin-vasive technology may modify time constants’ values butmaintains the same order of magnitude. However, somelimitations of the noninvasive method should be issued.
Pressure and diameter cycles were reduced to an averagedrepresentative period. As the selected periods were stablefor all cases, no significant differences were detected withrespect to a beat-to-beat identification. Regarding pres-sure calibration, diastolic and mean pressures werematched to the tonometric waveform, assuming theyremain constant throughout the arterial tree and to reduceall possible deviations [8], [12].
Representing the mechanical wall system by a second-order differential equation, two cutoff frequenciesemerged. Because fC2 (related to inertial effects) appearsto be larger than fC1 and is beyond the physiological range,we can assume that a first-order system may be enough torepresent arterial wall mechanics. In this sense, in a first-order model, the cutoff frequency is only governed by thequotient E/η,
fC1 first order system) = 1
2π· E
η.
Our mean values calculated for fC1 were 2.7, 2.8, and 3.0Hz for NT, HT, and HT-treated, respectively. They werevery close to our fC values derived from the –3-dB methodand showed an interesting constancy between groups(Figure 6). Because fC1 is always lower than fn (Figure 4),the influence of viscoelasticity may attenuate the high-fre-
quency pulsation to counterbalance possible insta-bility phenomena [19].
At low frequency, in the range of arterial sys-tem acts as in Windkessel [20], pressure-flowwaveforms are governed by total arterial compli-ance and total peripheral resistance. But beyondthis range, both waveforms are influenced bypulse wave propagation and reflection, recentlycharacterized as negative feedback [20]. Workingwith the apparent compliance framework pro-posed by Quick et al., [20], higher dynamic rangesthan arterial impedance were found, includinglumped and spatial distributed characteristics, andseem very close to the low-pass pattern observedin our compliance Bode plot. However, in ourcase, it must be stated that the end point was thecharacterization of a local functional unit wherethe stretching-pressure relationship become tran-scendent since wall fatigue or wall protectionmechanisms are evidenced.
The effect of blood pressure on measurementsmust be considered. In previous works, we ana-lyzed in detail the influence of pressure on theviscoelastic properties [3], [4], [7], [8].Accordingly, both arterial wall viscosity and
IEEE ENGINEERING IN MEDICINE AND BIOLOGY MAGAZINE JANUARY/FEBRUARY 2007
Fig. 6. A schematic representation of normalized Bode plots obtainedfrom the application of the viscoelastic model. Circles indicate the aver-age value of the half power bandwidth (fC) calculated in each group.The reference values for normalization were −39.8 dB in NT, −44.8 dB inHT, −42.2 dB in HT-treated, and −44.71 dB in vitro.
10−1 100 101 102
Frequency (Hz)
NTHTHT-tIn Vitro
−35
−30
−25
−20
−15
−10
−5
0
5
Com
plia
nce
(dB
)
fc
Smart damping strategies are particularly
promising in addressing many of the challenges
to this technology, offering the reliability of passive
devices but maintaining the versatility and
adaptability of fully active systems
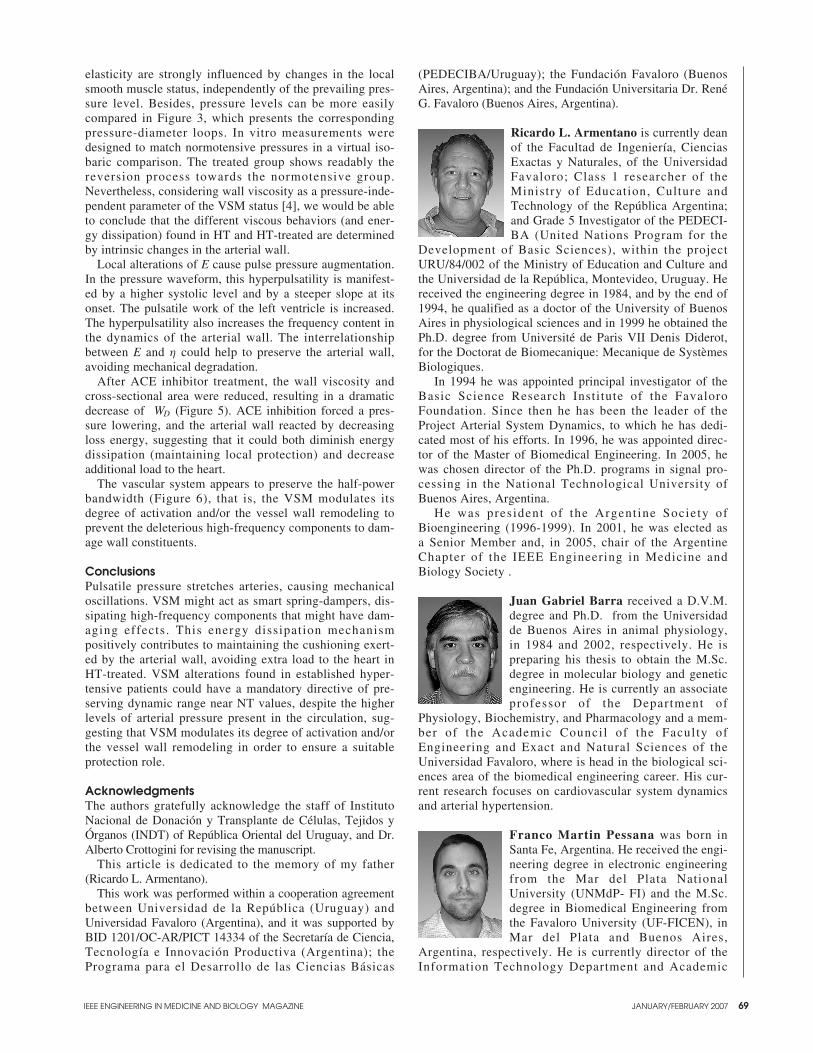
IEEE ENGINEERING IN MEDICINE AND BIOLOGY MAGAZINE JANUARY/FEBRUARY 2007 69
elasticity are strongly influenced by changes in the localsmooth muscle status, independently of the prevailing pres-sure level. Besides, pressure levels can be more easilycompared in Figure 3, which presents the correspondingpressure-diameter loops. In vitro measurements weredesigned to match normotensive pressures in a virtual iso-baric comparison. The treated group shows readably thereversion process towards the normotensive group.Nevertheless, considering wall viscosity as a pressure-inde-pendent parameter of the VSM status [4], we would be ableto conclude that the different viscous behaviors (and ener-gy dissipation) found in HT and HT-treated are determinedby intrinsic changes in the arterial wall.
Local alterations of E cause pulse pressure augmentation.In the pressure waveform, this hyperpulsatility is manifest-ed by a higher systolic level and by a steeper slope at itsonset. The pulsatile work of the left ventricle is increased.The hyperpulsatility also increases the frequency content inthe dynamics of the arterial wall. The interrelationshipbetween E and η could help to preserve the arterial wall,avoiding mechanical degradation.
After ACE inhibitor treatment, the wall viscosity andcross-sectional area were reduced, resulting in a dramaticdecrease of WD (Figure 5). ACE inhibition forced a pres-sure lowering, and the arterial wall reacted by decreasingloss energy, suggesting that it could both diminish energydissipation (maintaining local protection) and decreaseadditional load to the heart.
The vascular system appears to preserve the half-powerbandwidth (Figure 6), that is, the VSM modulates itsdegree of activation and/or the vessel wall remodeling toprevent the deleterious high-frequency components to dam-age wall constituents.
ConclusionsPulsatile pressure stretches arteries, causing mechanicaloscillations. VSM might act as smart spring-dampers, dis-sipating high-frequency components that might have dam-aging effects. This energy dissipation mechanismpositively contributes to maintaining the cushioning exert-ed by the arterial wall, avoiding extra load to the heart inHT-treated. VSM alterations found in established hyper-tensive patients could have a mandatory directive of pre-serving dynamic range near NT values, despite the higherlevels of arterial pressure present in the circulation, sug-gesting that VSM modulates its degree of activation and/orthe vessel wall remodeling in order to ensure a suitableprotection role.
AcknowledgmentsThe authors gratefully acknowledge the staff of InstitutoNacional de Donación y Transplante de Células, Tejidos yÓrganos (INDT) of República Oriental del Uruguay, and Dr.Alberto Crottogini for revising the manuscript.
This article is dedicated to the memory of my father(Ricardo L. Armentano).
This work was performed within a cooperation agreementbetween Universidad de la República (Uruguay) andUniversidad Favaloro (Argentina), and it was supported byBID 1201/OC-AR/PICT 14334 of the Secretaría de Ciencia,Tecnología e Innovación Productiva (Argentina); thePrograma para el Desarrollo de las Ciencias Básicas
(PEDECIBA/Uruguay); the Fundación Favaloro (BuenosAires, Argentina); and the Fundación Universitaria Dr. RenéG. Favaloro (Buenos Aires, Argentina).
Ricardo L. Armentano is currently deanof the Facultad de Ingeniería, CienciasExactas y Naturales, of the UniversidadFavaloro; Class 1 researcher of theMinistry of Education, Culture andTechnology of the República Argentina;and Grade 5 Investigator of the PEDECI-BA (United Nations Program for the
Development of Basic Sciences), within the projectURU/84/002 of the Ministry of Education and Culture andthe Universidad de la República, Montevideo, Uruguay. Hereceived the engineering degree in 1984, and by the end of1994, he qualified as a doctor of the University of BuenosAires in physiological sciences and in 1999 he obtained thePh.D. degree from Université de Paris VII Denis Diderot,for the Doctorat de Biomecanique: Mecanique de SystèmesBiologiques.
In 1994 he was appointed principal investigator of theBasic Science Research Institute of the FavaloroFoundation. Since then he has been the leader of theProject Arterial System Dynamics, to which he has dedi-cated most of his efforts. In 1996, he was appointed direc-tor of the Master of Biomedical Engineering. In 2005, hewas chosen director of the Ph.D. programs in signal pro-cessing in the National Technological University ofBuenos Aires, Argentina.
He was president of the Argent ine Society ofBioengineering (1996-1999). In 2001, he was elected asa Senior Member and, in 2005, chair of the ArgentineChapter of the IEEE Engineering in Medicine andBiology Society .
Juan Gabriel Barra received a D.V.M.degree and Ph.D. from the Universidadde Buenos Aires in animal physiology,in 1984 and 2002, respectively. He ispreparing his thesis to obtain the M.Sc.degree in molecular biology and geneticengineering. He is currently an associateprofessor of the Department of
Physiology, Biochemistry, and Pharmacology and a mem-ber of the Academic Council of the Faculty ofEngineering and Exact and Natural Sciences of theUniversidad Favaloro, where is head in the biological sci-ences area of the biomedical engineering career. His cur-rent research focuses on cardiovascular system dynamicsand arterial hypertension.
Franco Martin Pessana was born inSanta Fe, Argentina. He received the engi-neering degree in electronic engineeringfrom the Mar del Plata NationalUniversity (UNMdP- FI) and the M.Sc.degree in Biomedical Engineering fromthe Favaloro University (UF-FICEN), inMar del Plata and Buenos Aires,
Argentina, respectively. He is currently director of theInformation Technology Department and Academic
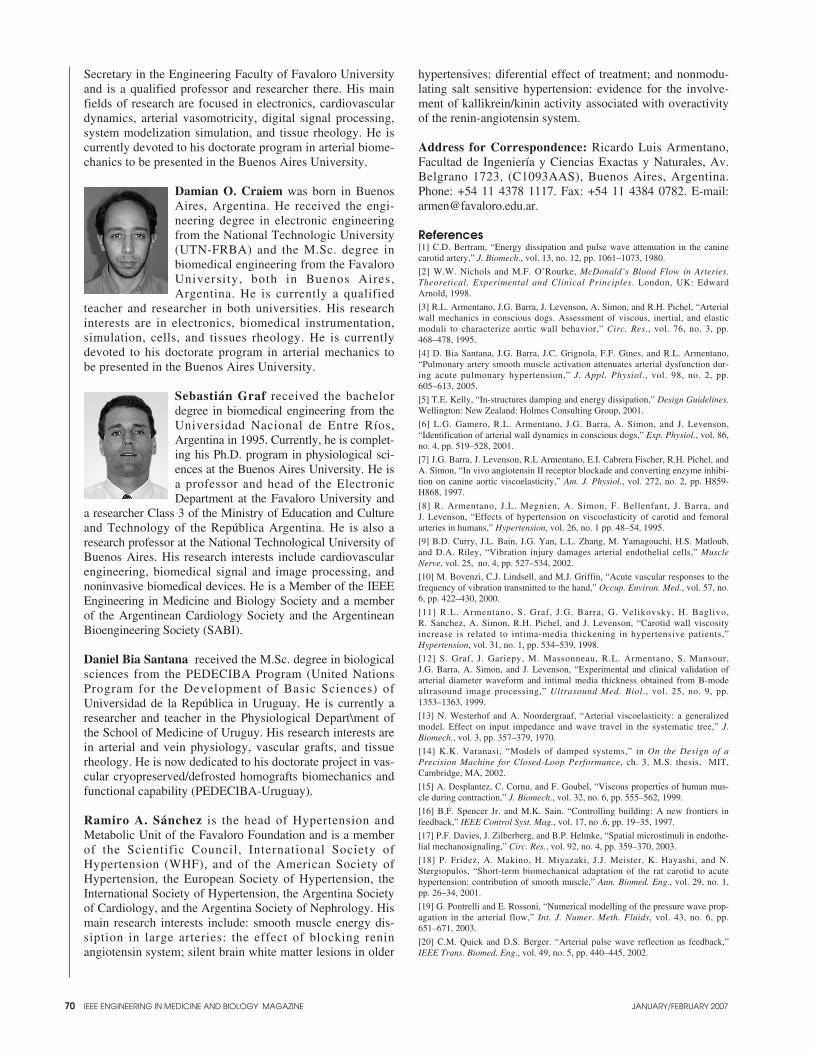
70
Secretary in the Engineering Faculty of Favaloro Universityand is a qualified professor and researcher there. His mainfields of research are focused in electronics, cardiovasculardynamics, arterial vasomotricity, digital signal processing,system modelization simulation, and tissue rheology. He iscurrently devoted to his doctorate program in arterial biome-chanics to be presented in the Buenos Aires University.
Damian O. Craiem was born in BuenosAires, Argentina. He received the engi-neering degree in electronic engineeringfrom the National Technologic University(UTN-FRBA) and the M.Sc. degree inbiomedical engineering from the FavaloroUniversity, both in Buenos Aires,Argentina. He is currently a qualified
teacher and researcher in both universities. His researchinterests are in electronics, biomedical instrumentation,simulation, cells, and tissues rheology. He is currentlydevoted to his doctorate program in arterial mechanics tobe presented in the Buenos Aires University.
Sebastián Graf received the bachelordegree in biomedical engineering from theUniversidad Nacional de Entre Ríos,Argentina in 1995. Currently, he is complet-ing his Ph.D. program in physiological sci-ences at the Buenos Aires University. He isa professor and head of the ElectronicDepartment at the Favaloro University and
a researcher Class 3 of the Ministry of Education and Cultureand Technology of the República Argentina. He is also aresearch professor at the National Technological University ofBuenos Aires. His research interests include cardiovascularengineering, biomedical signal and image processing, andnoninvasive biomedical devices. He is a Member of the IEEEEngineering in Medicine and Biology Society and a memberof the Argentinean Cardiology Society and the ArgentineanBioengineering Society (SABI).
Daniel Bia Santana received the M.Sc. degree in biologicalsciences from the PEDECIBA Program (United NationsProgram for the Development of Basic Sciences) ofUniversidad de la República in Uruguay. He is currently aresearcher and teacher in the Physiological Depart\ment ofthe School of Medicine of Uruguy. His research interests arein arterial and vein physiology, vascular grafts, and tissuerheology. He is now dedicated to his doctorate project in vas-cular cryopreserved/defrosted homografts biomechanics andfunctional capability (PEDECIBA-Uruguay).
Ramiro A. Sánchez is the head of Hypertension andMetabolic Unit of the Favaloro Foundation and is a memberof the Scientific Council, International Society ofHypertension (WHF), and of the American Society ofHypertension, the European Society of Hypertension, theInternational Society of Hypertension, the Argentina Societyof Cardiology, and the Argentina Society of Nephrology. Hismain research interests include: smooth muscle energy dis-siption in large arteries: the effect of blocking reninangiotensin system; silent brain white matter lesions in older
hypertensives: diferential effect of treatment; and nonmodu-lating salt sensitive hypertension: evidence for the involve-ment of kallikrein/kinin activity associated with overactivityof the renin-angiotensin system.
Address for Correspondence: Ricardo Luis Armentano,Facultad de Ingeniería y Ciencias Exactas y Naturales, Av.Belgrano 1723, (C1093AAS), Buenos Aires, Argentina.Phone: +54 11 4378 1117. Fax: +54 11 4384 0782. E-mail:[email protected].
References[1] C.D. Bertram, “Energy dissipation and pulse wave attenuation in the caninecarotid artery,” J. Biomech., vol. 13, no. 12, pp. 1061–1073, 1980.
[2] W.W. Nichols and M.F. O’Rourke, McDonald’s Blood Flow in Arteries.Theoretical, Experimental and Clinical Principles. London, UK: EdwardArnold, 1998.
[3] R.L. Armentano, J.G. Barra, J. Levenson, A. Simon, and R.H. Pichel, “Arterialwall mechanics in conscious dogs. Assessment of viscous, inertial, and elasticmoduli to characterize aortic wall behavior,” Circ. Res., vol. 76, no. 3, pp.468–478, 1995.
[4] D. Bia Santana, J.G. Barra, J.C. Grignola, F.F. Gines, and R.L. Armentano,“Pulmonary artery smooth muscle activation attenuates arterial dysfunction dur-ing acute pulmonary hypertension,” J. Appl. Physiol., vol. 98, no. 2, pp.605–613, 2005.
[5] T.E. Kelly, “In-structures damping and energy dissipation,” Design Guidelines.Wellington: New Zealand: Holmes Consulting Group, 2001.
[6] L.G. Gamero, R.L. Armentano, J.G. Barra, A. Simon, and J. Levenson,“Identification of arterial wall dynamics in conscious dogs,” Exp. Physiol., vol. 86,no. 4, pp. 519–528, 2001.
[7] J.G. Barra, J. Levenson, R.L Armentano, E.I. Cabrera Fischer, R.H. Pichel, andA. Simon, “In vivo angiotensin II receptor blockade and converting enzyme inhibi-tion on canine aortic viscoelasticity,” Am. J. Physiol., vol. 272, no. 2, pp. H859-H868, 1997.
[8] R. Armentano, J.L. Megnien, A. Simon, F. Bellenfant, J. Barra, and J. Levenson, “Effects of hypertension on viscoelasticity of carotid and femoralarteries in humans,” Hypertension, vol. 26, no. 1 pp. 48–54, 1995.
[9] B.D. Curry, J.L. Bain, J.G. Yan, L.L. Zhang, M. Yamagouchi, H.S. Matloub,and D.A. Riley, “Vibration injury damages arterial endothelial cells,” MuscleNerve, vol. 25, no. 4, pp. 527–534, 2002.
[10] M. Bovenzi, C.J. Lindsell, and M.J. Griffin, “Acute vascular responses to thefrequency of vibration transmitted to the hand,” Occup. Environ. Med., vol. 57, no.6, pp. 422–430, 2000.
[11] R.L. Armentano, S. Graf, J.G. Barra, G. Velikovsky, H. Baglivo, R. Sanchez, A. Simon, R.H. Pichel, and J. Levenson, “Carotid wall viscosityincrease is related to intima-media thickening in hypertensive patients,”Hypertension, vol. 31, no. 1, pp. 534–539, 1998.
[12] S. Graf, J. Gariepy, M. Massonneau, R.L. Armentano, S. Mansour, J.G. Barra, A. Simon, and J. Levenson, “Experimental and clinical validation ofarterial diameter waveform and intimal media thickness obtained from B-modeultrasound image processing,” Ultrasound Med. Biol., vol. 25, no. 9, pp.1353–1363, 1999.
[13] N. Westerhof and A. Noordergraaf, “Arterial viscoelasticity: a generalizedmodel. Effect on input impedance and wave travel in the systematic tree,” J.Biomech., vol. 3, pp. 357–379, 1970.
[14] K.K. Varanasi, “Models of damped systems,” in On the Design of aPrecision Machine for Closed-Loop Performance, ch. 3, M.S. thesis, MIT,Cambridge, MA, 2002.
[15] A. Desplantez, C. Cornu, and F. Goubel, “Viscous properties of human mus-cle during contraction,” J. Biomech., vol. 32, no. 6, pp. 555–562, 1999.
[16] B.F. Spencer Jr. and M.K. Sain. “Controlling building: A new frontiers infeedback,” IEEE Control Syst. Mag., vol. 17, no .6, pp. 19–35, 1997.
[17] P.F. Davies, J. Zilberberg, and B.P. Helmke, “Spatial microstimuli in endothe-lial mechanosignaling,” Circ. Res., vol. 92, no. 4, pp. 359–370, 2003.
[18] P. Fridez, A. Makino, H. Miyazaki, J.J. Meister, K. Hayashi, and N.Stergiopulos, “Short-term biomechanical adaptation of the rat carotid to acutehypertension: contribution of smooth muscle,” Ann. Biomed. Eng., vol. 29, no. 1,pp. 26–34, 2001.
[19] G. Pontrelli and E. Rossoni, “Numerical modelling of the pressure wave prop-agation in the arterial flow,” Int. J. Numer. Meth. Fluids, vol. 43, no. 6, pp.651–671, 2003.
[20] C.M. Quick and D.S. Berger. “Arterial pulse wave reflection as feedback,”IEEE Trans. Biomed. Eng., vol. 49, no. 5, pp. 440–445, 2002.
IEEE ENGINEERING IN MEDICINE AND BIOLOGY MAGAZINE JANUARY/FEBRUARY 2007
IEEE ENGINEERING IN MEDICINE AND BIOLOGY MAGAZINE JANUARY/FEBRUARY 2007 71
The case of the secret sale
When does the clock on theone-year grace period forfiling a U.S. patent appli-cation begin to run? Does
a patentee’s purchase of its productfrom its supplier start the clock?That was the question before the Court ofAppeals for the Federal Circuit (CAFC)in Brasseler v. Stryker Sales Corp.
The case involved saw blades for usein orthopedic surgery. Brasseler, aGeorgia company, had an idea for animproved blade with a double row ofcutting teeth. Brasseler contracted withDS Manufacturing, a California compa-ny, to develop the blade. The compa-nies worked together on the blade and,once it was completed, Brasselerordered 3,000 units from DS and beganselling the blades to hospitals.
Less than a year after its first sale toa hospital, but more than a year afterits purchase of the blades from DS,Brasseler applied for a patent. After anuneventful prosecution, Brasseler’spatent was issued in 1994. Three yearslater, Brasseler sued its competitor,Stryker, for patent infringement.
Through discovery, Stryker learnedof the purchase of the 3,000 units fromDS and brought a summary judgmentmotion asking the trial court to find asa matter of law that Brasseler’s patentwas invalid for violation of the one-year on-sale bar. The trial court agreedthat the facts regarding DS’s sale wereclear and that, under the law,Brasseler’s patent was invalid becausethe blades claimed in the patent hadbeen on sale more than one year beforethe patent’s filing date.
Brasseler immediately appealed tothe CAFC. There it presented a panoplyof arguments as to why the purchase ofblades from DS should not be found tohave triggered the on-sale bar. None ofthose arguments was even remotelysuccessful.
Brasseler first argued that it and DSwere joint developers and, thus, theon-sale bar did not apply. In support ofthis contention, Brasseler pointed tothe fact that its patent named twoBrasseler employees, the president ofDS, and one DS employee as jointinventors. In rejecting this argument,the CAFC looked at the situation fromDS’s point of view, concluding thatDS and its inventors had plainly bene-fited “commercially” from the sale ofthe 3,000 blades. As discussed by thecourt, such a commercial activity isprecisely the type of event that routine-ly starts the one-year clock for filing apatent application. That Brasseler andDS had engaged in joint developmentefforts did not make the sale any lesscommercial.
Brasseler next argued that the bladesit purchased from DS were not readyfor sale to customers. The companyexplained that after receiving theblades, it marked, packaged, and steril-ized them before shipping them to hos-pitals. In response to this argument, theCAFC looked to the claims ofBrasseler’s patent. Those claims readdirectly on the blades as sold by DS anddid not mention marking, packaging, orsterilizing. Accordingly, the court heldthat the blades that had been sold wereprecisely those that had been claimed inBrasseler’s patent and thus their sale byDS started the one-year clock.
Brasseler then argued that, withregard to its saw blade business, DSshould be considered an integral partof Brasseler since DS had promised tomake the blades exclusively forBrasseler. In making this argument,Brasseler relied on the principle that,to have an on-sale bar, there must betwo separate entities. In rejecting thisargument, the CAFC pointed to one ofits prior decisions in which an on-salebar had been found even though the
buyer and seller shared a common par-ent which owned all of the seller and49% of the buyer. If that had not beenenough to invoke the rule that you can-not sell something to yourself, thencertainly the rule did not apply toBrasseler and DS since they were com-pletely separate corporations.
Finally, Brasseler argued that the DSsale was not in the public and thus wasnot the type of invalidating sale contem-plated by the patent statute. The CAFCquickly dismissed this argument by not-ing that a secret sale is still a sale forpurposes of starting the one-year clock.
Clearly, the CAFC had little sympa-thy for Brasseler’s position. Unlike anindividual inventor who “takes adesign to a fabricator and pays the fab-ricator for its services in fabricating afew sample products,” DS had madeand Brasseler had bought “a largenumber of the agreed-upon product forgeneral marketing.” Brasseler had afull year from that event to file for apatent. By waiting longer, it lost itsrights—the proper result according tothe CAFC.
Dr. Klee practices patent, trade-mark, and copyright law in Fairfield,Connecticut. He received a B.S. degreein physics from the University ofIllinois, a Ph.D. in biomedical engi-neering from Case Western ReserveUniversity, and a J.D. from GeorgeWashington University. He is a mem-ber of Phi Beta Kappa and Order of theCoif. He is a former assistant professorin the College of Engineering atMichigan State University and a for-mer staff fellow at the NationalInstitutes of Health. A copy of the fulltext of the Brasseler v. Stryker SalesCorp. decision can be obtained on theWeb at http://www.ll.georgetown.edu/federal/judicial/fed/opinions/98opinions/98-1512.html.
Maurice M. Klee
Patents
72
ensemble-based RNA secondary structure characterization
Stephen P. Crozierand Harold R. Garner
IEEE ENGINEERING IN MEDICINE AND BIOLOGY MAGAZINE JANUARY/FEBRUARY 2007
Engineering in Genomics
Free energy minimization meth-ods of predicting RNA sec-ondary structure have provenvaluable to the interpretation of
experimental data but suffer from theinability to meaningfully address theensemble of structures expected bystatistical thermodynamic principles.Methods to address the ensemblehave been developed but rely on visu-al inspection or suboptimal clusteringtechniques. This restricts the useful-ness of these methods in automated insilico experiments. A recent statisticalalgorithm allows the generation of alarge ensemble of secondary struc-tures on a given sequence that sam-ples the Boltzmann distribution ofsuch structures.
ResultsWe present here a method of extract-ing the “most probable” structure orstructures from this ensemble anddemonstrate that characterization ofsuch an ensemble can yield structureinformation with biological rele-vance not readily attainable by freeenergy minimization methods, suchas the prediction of two stable struc-tures for the L. collosoma splicedleader RNA molecule.
ConclusionThe method presented here has signifi-cant advantages: the level of granulari-ty is the entire structure, not the basepair, motif, or region; the use of the rig-orously sampled Boltzmann ensembleobviates the use of arbitrary “differ-ence” constraints as are often used togenerate suboptimal structures; and it isamenable to automated use as no man-ual steps are required. This methodmay be generally applicable to RNAsecondary structure prediction andcharacterization and especially usefulin automated applications.
BackgroundOriginally considered little more than apassive messenger between DNA and
its protein product, the recognition ofthe importance of RNAs to cellular lifehas grown rapidly in recent decades,arguably spurred by the discovery in theearly 1980s of the first ribozymes(RNAs with enzymatic activity) in self-splicing introns [1] and ribonuclease P[2]. With a multitude of cellular roles forRNAs now firmly established, the abili-ty to understand these functional roles inthe context of the structure of the RNAmolecules involved is highly desirable.Yet RNA structure determination lagsthe understanding of protein structurefor reasons both historical and technical.
Because of the difficulty in experi-mentally determining the structure ofRNAs, theoretical approaches havereceived much attention, particularlywith the growing power of computation,both in terms of raw processing powerand in terms of novel and improvedalgorithms. Comparative sequenceanalysis methods have yielded the bestresults when the assumption of con-served structure can reliably be madeand when a sufficient number of homol-ogous sequences is available. When oneor both of these conditions is lacking, themethod of choice is free energy mini-mization, for which a number of algo-rithms and implementations are available[3]–[6]. The dynamic programmingalgorithm due to Zuker [5] and its imple-mentation in the mfold software is apopular choice and has been widely usedin published studies. Herein, mfold willserve as the reference minimum freeenergy (MFE) method. There are manycaveats to the prediction of RNA sec-ondary structure by MFE methodsincluding, but not limited to, 1) the RNAstructure is predicted without considera-tion for cellular binding partners, 2)energy parameters are not known withhigh accuracy, 3) a simplifying assump-tion of equilibrium is made, 4) tertiaryinteractions are generally ignored, and 5)no allowance is made for the ensembleof structures expected (or equivalently,the probability of a given structure)given the thermal energy of the system.Practical applications of MFE methods,usually combined with experimental orcomparative sequence data, or both, havebeen remarkably successful in spite ofthese caveats.
The issue of the thermodynamicensemble of RNA molecules has re-ceived a great deal of attention, begin-ning with McCaskill’s work in 1990.McCaskill noted that there are an“embarrassing abundance of struc-
A recent statistical
algorithm allows the
generation of a
large ensemble of
secondary structures
on a given sequence
that samples the
Boltzmann distribution
of such structures.
0739-5175/07/$25.00©2007IEEE
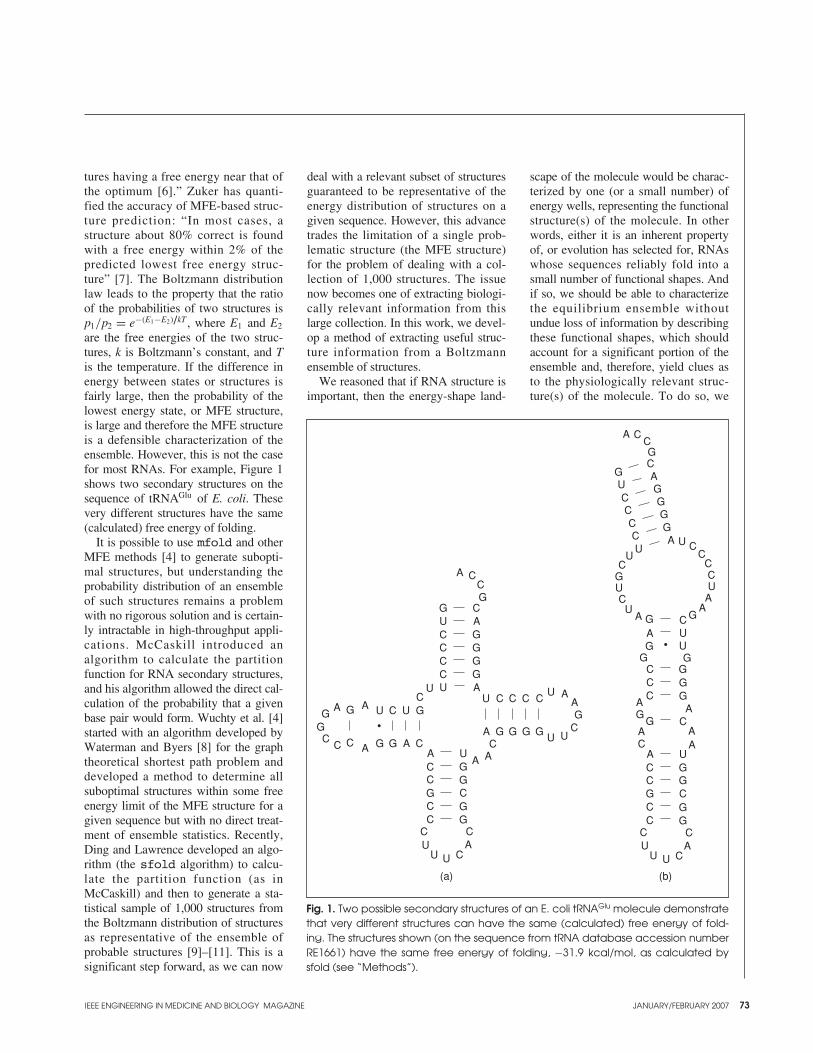
IEEE ENGINEERING IN MEDICINE AND BIOLOGY MAGAZINE JANUARY/FEBRUARY 2007 73
tures having a free energy near that ofthe optimum [6].” Zuker has quanti-fied the accuracy of MFE-based struc-ture prediction: “In most cases, astructure about 80% correct is foundwith a free energy within 2% of thepredicted lowest free energy struc-ture” [7]. The Boltzmann distributionlaw leads to the property that the ratioof the probabilities of two structures isp1/p2 = e−(E1−E2)/kT , where E1 and E2
are the free energies of the two struc-tures, k is Boltzmann’s constant, and Tis the temperature. If the difference inenergy between states or structures isfairly large, then the probability of thelowest energy state, or MFE structure,is large and therefore the MFE structureis a defensible characterization of theensemble. However, this is not the casefor most RNAs. For example, Figure 1shows two secondary structures on thesequence of tRNAGlu of E. coli. Thesevery different structures have the same(calculated) free energy of folding.
It is possible to use mfold and otherMFE methods [4] to generate subopti-mal structures, but understanding theprobability distribution of an ensembleof such structures remains a problemwith no rigorous solution and is certain-ly intractable in high-throughput appli-cations. McCaskill introduced analgorithm to calculate the partitionfunction for RNA secondary structures,and his algorithm allowed the direct cal-culation of the probability that a givenbase pair would form. Wuchty et al. [4]started with an algorithm developed byWaterman and Byers [8] for the graphtheoretical shortest path problem anddeveloped a method to determine allsuboptimal structures within some freeenergy limit of the MFE structure for agiven sequence but with no direct treat-ment of ensemble statistics. Recently,Ding and Lawrence developed an algo-rithm (the sfold algorithm) to calcu-late the partition function (as inMcCaskill) and then to generate a sta-tistical sample of 1,000 structures fromthe Boltzmann distribution of structuresas representative of the ensemble ofprobable structures [9]–[11]. This is asignificant step forward, as we can now
deal with a relevant subset of structuresguaranteed to be representative of theenergy distribution of structures on agiven sequence. However, this advancetrades the limitation of a single prob-lematic structure (the MFE structure)for the problem of dealing with a col-lection of 1,000 structures. The issuenow becomes one of extracting biologi-cally relevant information from thislarge collection. In this work, we devel-op a method of extracting useful struc-ture information from a Boltzmannensemble of structures.
We reasoned that if RNA structure isimportant, then the energy-shape land-
scape of the molecule would be charac-terized by one (or a small number) ofenergy wells, representing the functionalstructure(s) of the molecule. In otherwords, either it is an inherent propertyof, or evolution has selected for, RNAswhose sequences reliably fold into asmall number of functional shapes. Andif so, we should be able to characterizethe equilibrium ensemble withoutundue loss of information by describingthese functional shapes, which shouldaccount for a significant portion of theensemble and, therefore, yield clues asto the physiologically relevant struc-ture(s) of the molecule. To do so, we
Fig. 1. Two possible secondary structures of an E. coli tRNAGlu molecule demonstratethat very different structures can have the same (calculated) free energy of fold-ing. The structures shown (on the sequence from tRNA database accession numberRE1661) have the same free energy of folding, −31.9 kcal/mol, as calculated bysfold (see “Methods”).
A A
A AA
A
A A
A
AA
A
A CC
C
CCCC
C C C C
C
C
GG
GGGG
G G G G
G
U
UU
U U
U
U U
U AC
GGG
G
G
GG
GG
G
G
CC C
C
C
C
C
CC
C
CC
C
U
UU U
A
A
A
AA
A
A
AA
AA
A
A
A
CCG
GGGG
G
G
GG
GG
GG
GGG
GGGG
G
CGU
UU
U
U
U
UU
U
CCC
C
C
C
CCC
C
C
CCC
CC
C
C
C
CC
CC
C
U
UUU
(a) (b)
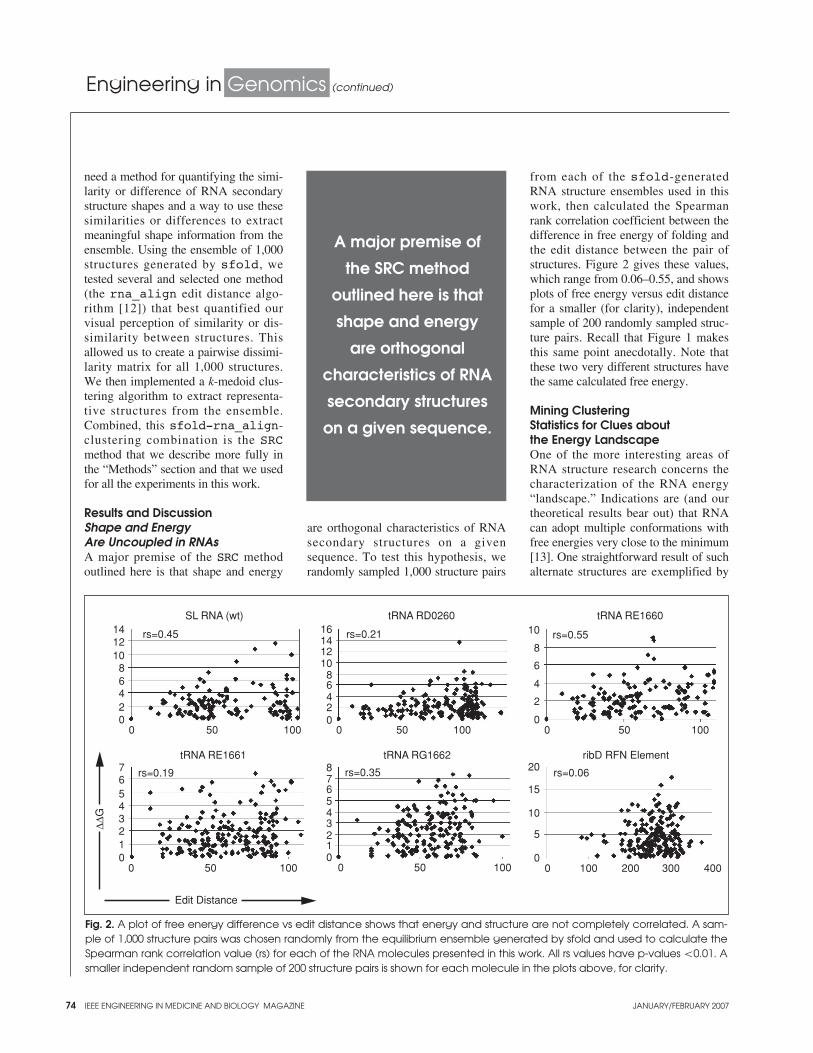
74 IEEE ENGINEERING IN MEDICINE AND BIOLOGY MAGAZINE JANUARY/FEBRUARY 2007
Engineering in Genomics (continued)
need a method for quantifying the simi-larity or difference of RNA secondarystructure shapes and a way to use thesesimilarities or differences to extractmeaningful shape information from theensemble. Using the ensemble of 1,000structures generated by sfold, wetested several and selected one method(the rna_align edit distance algo-rithm [12]) that best quantified ourvisual perception of similarity or dis-similarity between structures. Thisallowed us to create a pairwise dissimi-larity matrix for all 1,000 structures.We then implemented a k-medoid clus-tering algorithm to extract representa-tive structures from the ensemble.Combined, this sfold-rna_align-clustering combination is the SRCmethod that we describe more fully inthe “Methods” section and that we usedfor all the experiments in this work.
Results and DiscussionShape and EnergyAre Uncoupled in RNAsA major premise of the SRC methodoutlined here is that shape and energy
are orthogonal characteristics of RNAsecondary structures on a givensequence. To test this hypothesis, werandomly sampled 1,000 structure pairs
from each of the sfold-generatedRNA structure ensembles used in thiswork, then calculated the Spearmanrank correlation coefficient between thedifference in free energy of folding andthe edit distance between the pair ofstructures. Figure 2 gives these values,which range from 0.06–0.55, and showsplots of free energy versus edit distancefor a smaller (for clarity), independentsample of 200 randomly sampled struc-ture pairs. Recall that Figure 1 makesthis same point anecdotally. Note thatthese two very different structures havethe same calculated free energy.
Mining ClusteringStatistics for Clues aboutthe Energy LandscapeOne of the more interesting areas ofRNA structure research concerns thecharacterization of the RNA energy“landscape.” Indications are (and ourtheoretical results bear out) that RNAcan adopt multiple conformations withfree energies very close to the minimum[13]. One straightforward result of suchalternate structures are exemplified by
Fig. 2. A plot of free energy difference vs edit distance shows that energy and structure are not completely correlated. A sam-ple of 1,000 structure pairs was chosen randomly from the equilibrium ensemble generated by sfold and used to calculate theSpearman rank correlation value (rs) for each of the RNA molecules presented in this work. All rs values have p-values <0.01. Asmaller independent random sample of 200 structure pairs is shown for each molecule in the plots above, for clarity.
SL RNA (wt) tRNA RD0260 tRNA RE1660
02468
101214
0 50 100
0 50 100 0 50 10001234567
012345678
tRNA RE1661
rs=0.19 rs=0.35
tRNA RG1662
0
5
10
15
20 rs=0.06
ribD RFN Element
rs=0.55
0
2
4
6
8
10
Edit Distance
∆∆G
0 100 200 300 400
0 50 1000 50 10002468
1210
1416 rs=0.21rs=0.45
A major premise of
the SRC method
outlined here is that
shape and energy
are orthogonal
characteristics of RNA
secondary structures
on a given sequence.
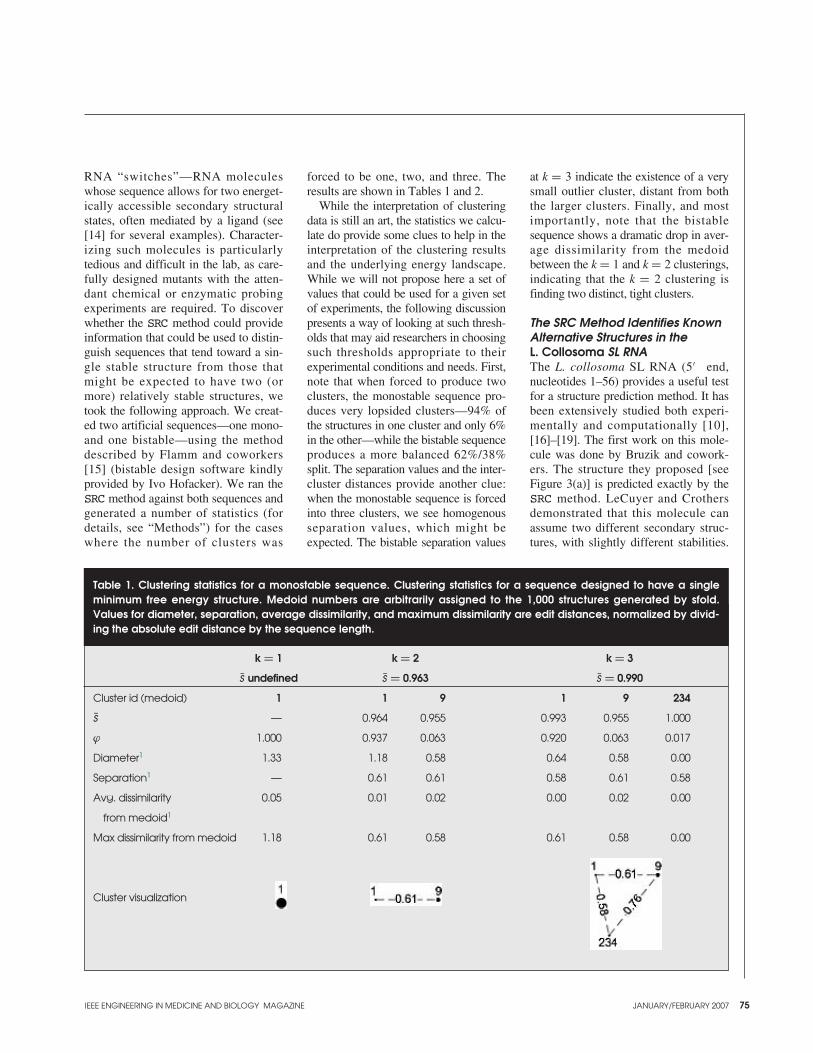
IEEE ENGINEERING IN MEDICINE AND BIOLOGY MAGAZINE JANUARY/FEBRUARY 2007 75
RNA “switches”—RNA moleculeswhose sequence allows for two energet-ically accessible secondary structuralstates, often mediated by a ligand (see[14] for several examples). Character-izing such molecules is particularlytedious and difficult in the lab, as care-fully designed mutants with the atten-dant chemical or enzymatic probingexperiments are required. To discoverwhether the SRC method could provideinformation that could be used to distin-guish sequences that tend toward a sin-gle stable structure from those thatmight be expected to have two (ormore) relatively stable structures, wetook the following approach. We creat-ed two artificial sequences—one mono-and one bistable—using the methoddescribed by Flamm and coworkers[15] (bistable design software kindlyprovided by Ivo Hofacker). We ran theSRC method against both sequences andgenerated a number of statistics (fordetails, see “Methods”) for the caseswhere the number of clusters was
forced to be one, two, and three. Theresults are shown in Tables 1 and 2.
While the interpretation of clusteringdata is still an art, the statistics we calcu-late do provide some clues to help in theinterpretation of the clustering resultsand the underlying energy landscape.While we will not propose here a set ofvalues that could be used for a given setof experiments, the following discussionpresents a way of looking at such thresh-olds that may aid researchers in choosingsuch thresholds appropriate to theirexperimental conditions and needs. First,note that when forced to produce twoclusters, the monostable sequence pro-duces very lopsided clusters—94% ofthe structures in one cluster and only 6%in the other—while the bistable sequenceproduces a more balanced 62%/38%split. The separation values and the inter-cluster distances provide another clue:when the monostable sequence is forcedinto three clusters, we see homogenousseparation values, which might beexpected. The bistable separation values
at k = 3 indicate the existence of a verysmall outlier cluster, distant from boththe larger clusters. Finally, and mostimportantly, note that the bistablesequence shows a dramatic drop in aver-age dissimilarity from the medoidbetween the k = 1 and k = 2 clusterings,indicating that the k = 2 clustering isfinding two distinct, tight clusters.
The SRC Method Identifies KnownAlternative Structures in the L. Collosoma SL RNAThe L. collosoma SL RNA (5′ end,nucleotides 1–56) provides a useful testfor a structure prediction method. It hasbeen extensively studied both experi-mentally and computationally [10],[16]–[19]. The first work on this mole-cule was done by Bruzik and cowork-ers. The structure they proposed [seeFigure 3(a)] is predicted exactly by theSRC method. LeCuyer and Crothersdemonstrated that this molecule canassume two different secondary struc-tures, with slightly different stabilities.
Table 1. Clustering statistics for a monostable sequence. Clustering statistics for a sequence designed to have a singleminimum free energy structure. Medoid numbers are arbitrarily assigned to the 1,000 structures generated by sfold.Values for diameter, separation, average dissimilarity, and maximum dissimilarity are edit distances, normalized by divid-ing the absolute edit distance by the sequence length.
k = 1 k = 2 k = 3
s undefined s = 0.963 s = 0.990
Cluster id (medoid) 1 1 9 1 9 234
s — 0.964 0.955 0.993 0.955 1.000
ϕ 1.000 0.937 0.063 0.920 0.063 0.017
Diameter1 1.33 1.18 0.58 0.64 0.58 0.00
Separation1 — 0.61 0.61 0.58 0.61 0.58
Avg. dissimilarity 0.05 0.01 0.02 0.00 0.02 0.00
from medoid1
Max dissimilarity from medoid 1.18 0.61 0.58 0.61 0.58 0.00
Cluster visualization

76 IEEE ENGINEERING IN MEDICINE AND BIOLOGY MAGAZINE JANUARY/FEBRUARY 2007
Engineering in Genomics (continued)
They denoted the Bruzik structure asForm 2 and the other structure as Form1 (because their experiments indicatedthat Form 1 is the one assumed by thewild-type sequence). We applied theSRC method to the wild-type SL RNAas well as to the three mutants generat-ed and evaluated by LeCuyer andCrothers. For the wild-type sequence,the SRC method results point toward theexistence of two clusters of structures(Table 3). Note the well-separated clus-ters, though they are somewhat diffuseand the ϕ values are biased towardCluster 2. The representative structuresof these two clusters are given in Figure3(b). As expected, these results are con-sistent with the results reported by Dingand Lawrence [10] in their manualanalysis of a generated ensemble ofstructures on this sequence. One of thestructures predicted by the SRC methodwas exactly the same as the originalBruzik structure and the Form 2 struc-
ture model of LeCuyer and Crothers.The other structure predicted by SRCwas not the same as the Form 1 modelof LeCuyer and Crothers, so we exam-ined their nuclease cutting and basemodification data (Figure 4). Note thatthe SRC prediction is as consistent withthe experimental data as is the structureproposed by LeCuyer and Crothers.
LeCuyer and Crothers also createdseveral mutants of the SL RNA. M1(G28A) was designed to disrupt a helixin the Form 2 structure; M2 (G20A)was designed to probe a potentialpseudoknot interaction; and C2 con-tains the G20A mutation as well as acompensatory mutation (C40U) torestabilize the pseudoknot. We ran theSRC method against each of thesemutants. The results are given inTables 4, 5, and 6 and are compared tothe experimental results of LeCuyerand Crothers in Table 7. These resultson the L. collosoma SL RNA make
clear a significant advantage of the SRCmethod. Note that SRC correctly pre-dicts the dominant form for all variantsand shows evidence for the alternativestructures in the WT and C2 mutant.These results are available with noexperiments and no manual analysis,which holds promise for large-scaleand genomic computational studies.The results further suggest the possibil-ity that a reconsideration of previousRNA structure determination results inwhich only an “optimal” structure wasdetermined may uncover the existenceof alternate conformations. Such alter-nate conformations might provide addi-tional clues to function or mechanism.
The SRC Method Reliably Extractsthe Canonical CloverleafStructure from Ensembles of tRNAStructures and finds Evidence for Alternate ConformationstRNA structures from many species
Table 2. Clustering statistics for a bistable sequence.
k = 1 k = 2 k = 3
s undefined s = 0.895 s = 0.910
Cluster id (medoid) 1 1 3 1 3 83
s — 0.925 0.849 0.923 0.890 0.855
ϕ 1.000 0.620 0.380 0.620 0.374 0.006
Diameter 1.94 1.76 1.82 1.76 1.21 0.67
Separation — 0.61 0.61 0.61 0.61 0.67
Avg. dissimilarity 0.31 0.04 0.07 0.04 0.05 0.11
from medoid
Max dissimilarity 1.67 1.33 1.52 1.33 0.73 0.67
from medoid
Cluster visualization
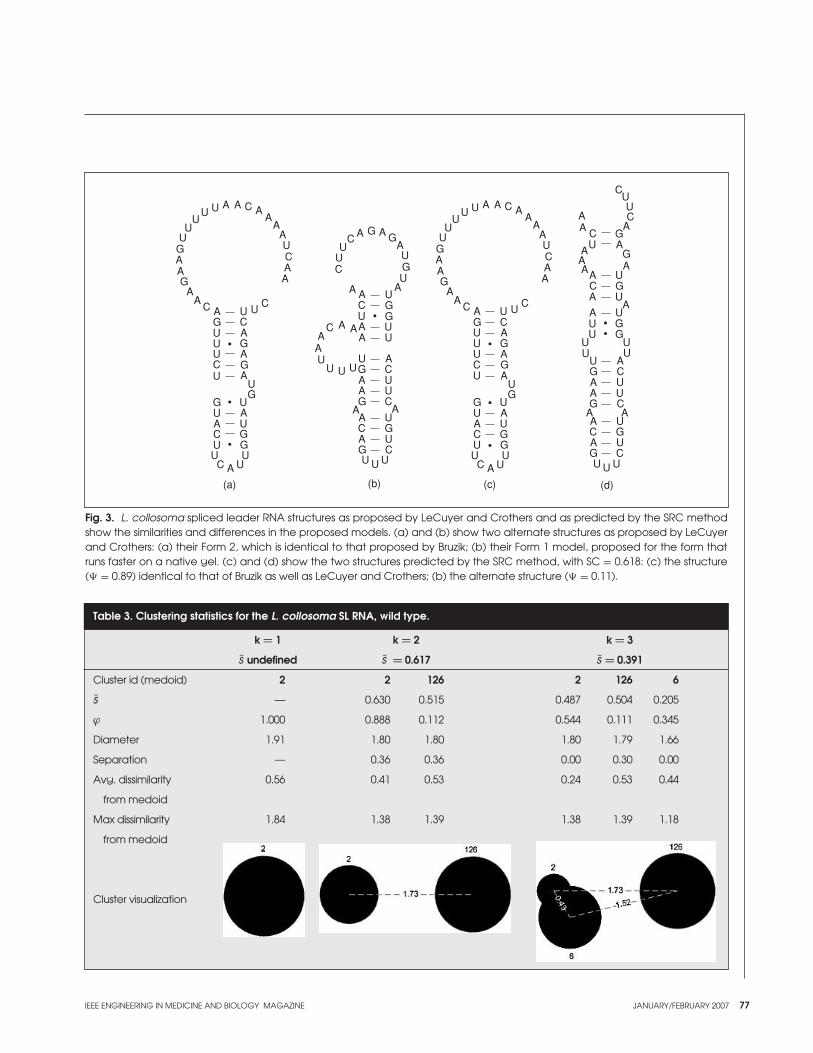
IEEE ENGINEERING IN MEDICINE AND BIOLOGY MAGAZINE JANUARY/FEBRUARY 2007 77
Fig. 3. L. collosoma spliced leader RNA structures as proposed by LeCuyer and Crothers and as predicted by the SRC methodshow the similarities and differences in the proposed models. (a) and (b) show two alternate structures as proposed by LeCuyerand Crothers: (a) their Form 2, which is identical to that proposed by Bruzik; (b) their Form 1 model, proposed for the form thatruns faster on a native gel. (c) and (d) show the two structures predicted by the SRC method, with SC = 0.618: (c) the structure(� = 0.89) identical to that of Bruzik as well as LeCuyer and Crothers; (b) the alternate structure (� = 0.11).
A AA
AA
AA
A
AA
AA
A
A
A
A
AA
A
UUU
U
U U
UUU
U
UU
UU U
U
U
U
UU
G
G
G
G
G
C
C
CCC
C
C
C
GG
GG
A AA
AA A
AA
AA
A
AAA
A
A
AA
A
C
C
C
C
C
C
C
C
U
U
UU
U
UU U
UU
U
U
U U U
UU
U
U
U
GG
G
GG
G
G
G
G
A AA
AA
AA A
A A
A AAA
AA
A
AA
A
AA
AA
A
UUU
U
U U
UU
G
G
C
C
CC
A
A
A
AA
A
UUU
U
UU
UU U
U
U
U
G
G
G
C
C
C
C
GG
GG
CUU
U
C
C
C
G
G
GU
UUU
UU
UU
U
UU
U
UA
GG
G
G
G
G
CA
AA
A
A
AC
C
CU
U U U
(a) (b) (c) (d)
Table 3. Clustering statistics for the L. collosoma SL RNA, wild type.
k = 1 k = 2 k = 3
s undefined s = 0.617 s = 0.391
Cluster id (medoid) 2 2 126 2 126 6
s — 0.630 0.515 0.487 0.504 0.205
ϕ 1.000 0.888 0.112 0.544 0.111 0.345
Diameter 1.91 1.80 1.80 1.80 1.79 1.66
Separation — 0.36 0.36 0.00 0.30 0.00
Avg. dissimilarity 0.56 0.41 0.53 0.24 0.53 0.44
from medoid
Max dissimilarity 1.84 1.38 1.39 1.38 1.39 1.18
from medoid
Cluster visualization
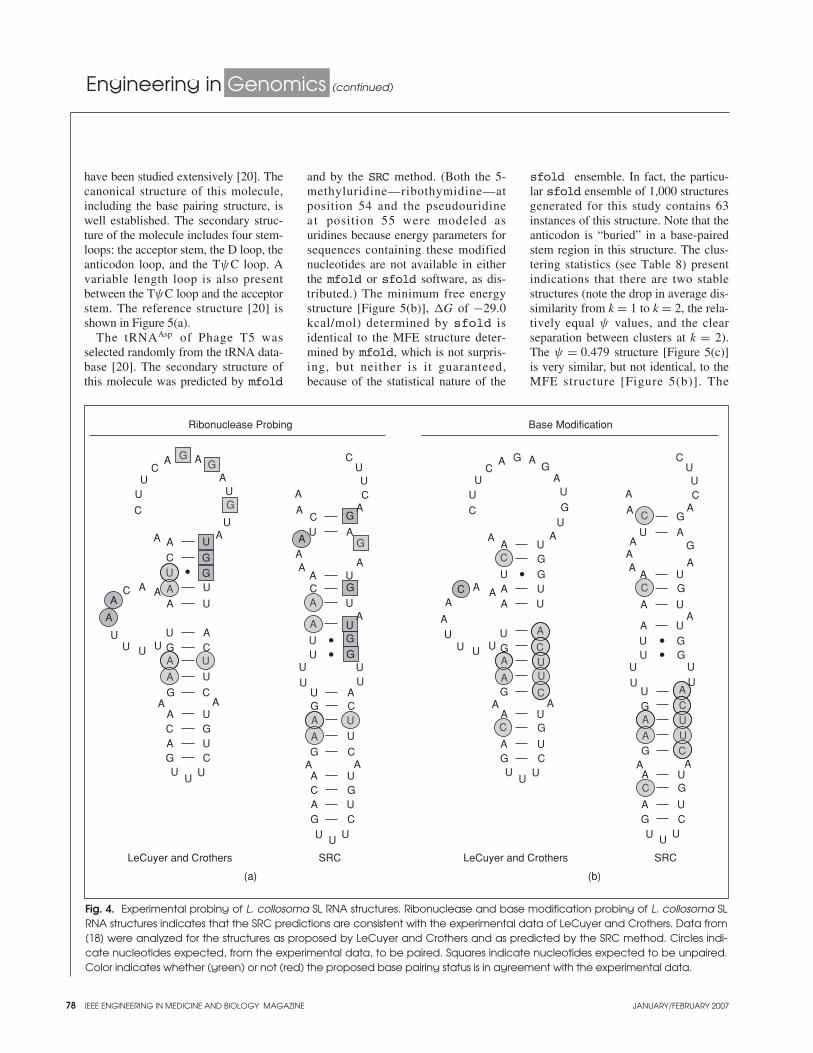
78 IEEE ENGINEERING IN MEDICINE AND BIOLOGY MAGAZINE JANUARY/FEBRUARY 2007
Engineering in Genomics (continued)
have been studied extensively [20]. Thecanonical structure of this molecule,including the base pairing structure, iswell established. The secondary struc-ture of the molecule includes four stem-loops: the acceptor stem, the D loop, theanticodon loop, and the TψC loop. Avariable length loop is also presentbetween the TψC loop and the acceptorstem. The reference structure [20] isshown in Figure 5(a).
The tRNAAsp of Phage T5 wasselected randomly from the tRNA data-base [20]. The secondary structure ofthis molecule was predicted by mfold
and by the SRC method. (Both the 5-methyluridine—ribothymidine—atposition 54 and the pseudouridinea t position 55 were modeled as uridines because energy parameters forsequences containing these modifiednucleotides are not available in eitherthe mfold or sfold software, as dis-tributed.) The minimum free energystructure [Figure 5(b)], �G of −29.0kcal/mol) determined by sfold isidentical to the MFE structure deter-mined by mfold, which is not surpris-ing, but neither is it guaranteed,because of the statistical nature of the
sfold ensemble. In fact, the particu-lar sfold ensemble of 1,000 structuresgenerated for this study contains 63instances of this structure. Note that theanticodon is “buried” in a base-pairedstem region in this structure. The clus-tering statistics (see Table 8) presentindications that there are two stablestructures (note the drop in average dis-similarity from k = 1 to k = 2, the rela-tively equal ψ values, and the clearseparation between clusters at k = 2).The ψ = 0.479 structure [Figure 5(c)]is very similar, but not identical, to theMFE structure [Figure 5(b)]. The
Fig. 4. Experimental probing of L. collosoma SL RNA structures. Ribonuclease and base modification probing of L. collosoma SLRNA structures indicates that the SRC predictions are consistent with the experimental data of LeCuyer and Crothers. Data from[18] were analyzed for the structures as proposed by LeCuyer and Crothers and as predicted by the SRC method. Circles indi-cate nucleotides expected, from the experimental data, to be paired. Squares indicate nucleotides expected to be unpaired.Color indicates whether (green) or not (red) the proposed base pairing status is in agreement with the experimental data.
G
G
U
A A
A
A A
AA
A
A
C
C
C
C
C
C
UU
U
U
UU U U
U
U
U
U
U
U
UU U
A
AA
A
A
G
G
G
GC
C
CUU
U
U
UU
U
UU
U
U
UU
U
A
AA
A
A
A
A
A AC
C
C
A
AA
A
A
G
G
G
G
C
C
C
C
U
U U U
G
G
G
G
G
G
G
G
G
AA
A
A
A
A
AA
A
A
A A AA
AA
C
C
UU
U
UU U
U
U
U
UU
UU
UU
U
U
U
C
U
UA
AA A
G
G
G
CU U U
CUU
U
U
U
U
U
UU
U
UU
U
A
AA
A
A
AA
A
A
A
A AC
G
G
G
G
GG
Ribonuclease Probing Base Modification
LeCuyer and Crothers SRC LeCuyer and Crothers SRC
A
AUG
G
G
G
A
C
GG
G
U
U
U
UU
UU
A
A
A
A
A
A
A
A
A
C
C
C
C
C
C
C
C
C
A
AA
G
A
(a) (b)
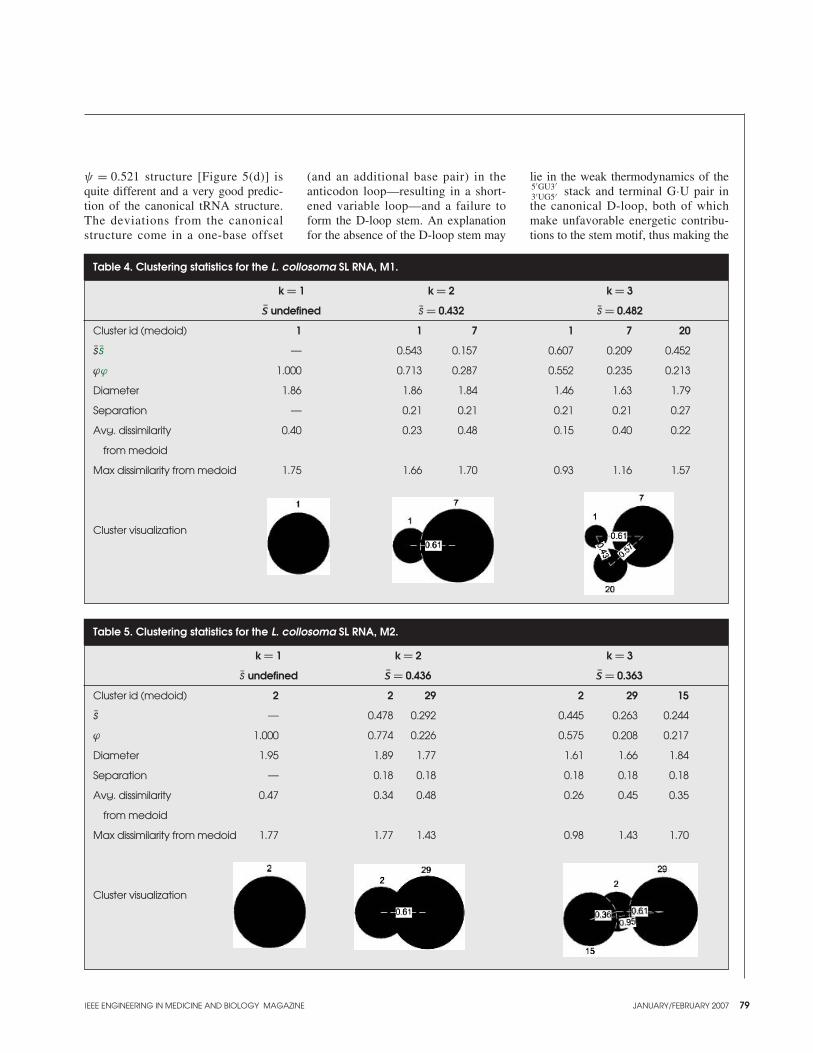
IEEE ENGINEERING IN MEDICINE AND BIOLOGY MAGAZINE JANUARY/FEBRUARY 2007 79
ψ = 0.521 structure [Figure 5(d)] isquite different and a very good predic-tion of the canonical tRNA structure.The deviations from the canonicalstructure come in a one-base offset
(and an additional base pair) in theanticodon loop—resulting in a short-ened variable loop—and a failure toform the D-loop stem. An explanationfor the absence of the D-loop stem may
lie in the weak thermodynamics of the5′GU3′3′UG5′ stack and terminal G·U pair inthe canonical D-loop, both of whichmake unfavorable energetic contribu-tions to the stem motif, thus making the
Table 5. Clustering statistics for the L. collosoma SL RNA, M2.
k = 1 k = 2 k = 3
s undefined s = 0.436 s = 0.363
Cluster id (medoid) 2 2 29 2 29 15
s — 0.478 0.292 0.445 0.263 0.244
ϕ 1.000 0.774 0.226 0.575 0.208 0.217
Diameter 1.95 1.89 1.77 1.61 1.66 1.84
Separation — 0.18 0.18 0.18 0.18 0.18
Avg. dissimilarity 0.47 0.34 0.48 0.26 0.45 0.35
from medoid
Max dissimilarity from medoid 1.77 1.77 1.43 0.98 1.43 1.70
Cluster visualization
Table 4. Clustering statistics for the L. collosoma SL RNA, M1.
k = 1 k = 2 k = 3
s undefined s = 0.432 s = 0.482
Cluster id (medoid) 1 1 7 1 7 20
s s — 0.543 0.157 0.607 0.209 0.452
ϕϕ 1.000 0.713 0.287 0.552 0.235 0.213
Diameter 1.86 1.86 1.84 1.46 1.63 1.79
Separation — 0.21 0.21 0.21 0.21 0.27
Avg. dissimilarity 0.40 0.23 0.48 0.15 0.40 0.22
from medoid
Max dissimilarity from medoid 1.75 1.66 1.70 0.93 1.16 1.57
Cluster visualization

80 IEEE ENGINEERING IN MEDICINE AND BIOLOGY MAGAZINE JANUARY/FEBRUARY 2007
Engineering in Genomics (continued)
D-loop stem as a whole weakly stable,at least as determined by these theoreti-cal nearest-neighbor energy rules.
This particular example is also inter-esting in that the cluster whose repre-sentative structure has a greaternegative free energy has a smaller ψvalue. This is only possible because of alarge number of structures in theensemble similar in shape to the repre-sentative structure of the cluster with
the larger ψ value. In other words, thegeneral shape has been preserved,although not the exact secondary struc-ture binding pattern. This presentsanother way to evaluate the “welldefinedness” of a particular structurewithin an energy landscape and pre-sents initial evidence that this character-istic of tRNA molecules, explored byWuchty and co-workers [4], may evenhold for alternative tRNA structures.
We characterized three other ran-domly selected tRNA sequences. Theresults for the four tRNAs are given inTable 9. These tRNA results areprovocative for several reasons. TheSRC method performed especially wellon these sequences compared tomfold. This is particularly interestingbecause the tRNA cloverleaf has oftenbeen a target structure for the refine-ment of thermodynamic and algorith-mic parameters for RNA structureprediction, including those in mfold.The existence of alternate conforma-tions of tRNA molecules has been doc-umented [21]–[23] and appears to berelated to the ubiquitous presence ofmodified bases in transfer RNA. Sincethere are no experimentally establishednearest neighbor energy parameters thattake these modified bases into account,it is interesting that the SRC methodreadily identified two stable structuresin two of the four tRNA molecules test-ed (based on analyses of the clusteringstatistics similar to those above; datanot shown) and suggests that a more
Table 6. Clustering statistics for the L. collosoma SL RNA, C2.
k = 1 k = 2 k = 3
s undefined s = 0.583 s = 0.446
Cluster id (medoid) 2 2 5 2 5 139
s - 0.577 0.611 0.446 0.606 0.268
ϕ 1.000 0.809 0.191 0.641 0.191 0.168
Diameter 1.89 1.77 1.61 1.71 1.61 1.63
Separation - 1.18 1.18 0.21 1.18 0.21
Avg. dissimilarity 0.69 0.46 0.44 0.35 0.44 0.49
from medoid
Max dissimilarity from medoid 1.80 1.46 1.29 1.16 1.29 1.23
Cluster visualization
Table 7. Summary of SRC method predictions for L. collosoma SL RNA wild typeand variants. SRC method predictions for the wild type and mutant L. colloso-ma SL RNA sequences, as in [18], demonstrate the ability of the method toextract alternate conformational information from the equilibrium ensemble.M1, M2, and C2 are mutants (see text) designed to probe certain structuralfeatures and differentiate between the alternate conformations.
WT M1 M2 C2
LeCuyer and Both Form 1
Crothers Form 1 Form 1 Form 2 and Form 2
SRC Form 1 (� = 0.888) Form 1 Form 2 Form 2 (� = 0.809)
Form 2 (� = 0.112) Form 1 (� = 0.191)
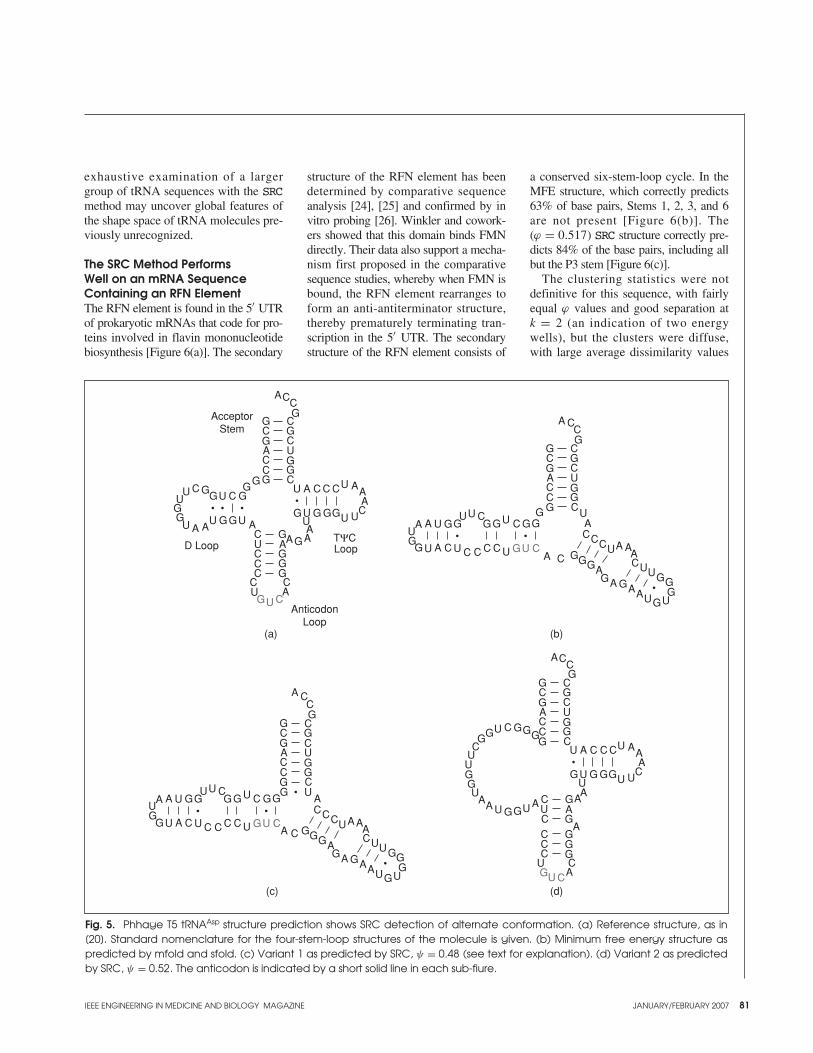
IEEE ENGINEERING IN MEDICINE AND BIOLOGY MAGAZINE JANUARY/FEBRUARY 2007 81
exhaustive examination of a largergroup of tRNA sequences with the SRCmethod may uncover global features ofthe shape space of tRNA molecules pre-viously unrecognized.
The SRC Method PerformsWell on an mRNA SequenceContaining an RFN ElementThe RFN element is found in the 5′ UTRof prokaryotic mRNAs that code for pro-teins involved in flavin mononucleotidebiosynthesis [Figure 6(a)]. The secondary
structure of the RFN element has beendetermined by comparative sequenceanalysis [24], [25] and confirmed by invitro probing [26]. Winkler and cowork-ers showed that this domain binds FMNdirectly. Their data also support a mecha-nism first proposed in the comparativesequence studies, whereby when FMN isbound, the RFN element rearranges toform an anti-antiterminator structure,thereby prematurely terminating tran-scription in the 5′ UTR. The secondarystructure of the RFN element consists of
a conserved six-stem-loop cycle. In theMFE structure, which correctly predicts63% of base pairs, Stems 1, 2, 3, and 6are not present [Figure 6(b)]. The(ϕ = 0.517) SRC structure correctly pre-dicts 84% of the base pairs, including allbut the P3 stem [Figure 6(c)].
The clustering statistics were notdefinitive for this sequence, with fairlyequal ϕ values and good separation at k = 2 (an indication of two energywells), but the clusters were diffuse,with large average dissimilarity values
Fig. 5. Phhage T5 tRNAAsp structure prediction shows SRC detection of alternate conformation. (a) Reference structure, as in[20]. Standard nomenclature for the four-stem-loop structures of the molecule is given. (b) Minimum free energy structure aspredicted by mfold and sfold. (c) Variant 1 as predicted by SRC, ψ = 0.48 (see text for explanation). (d) Variant 2 as predictedby SRC, ψ = 0.52. The anticodon is indicated by a short solid line in each sub-fiure.
A
A
AAA
A
A A A
AAAA
A
CC
C
C C C
C
CC
CC
C
C
CCC
CC
CC
GG
GG
GG
GG
G G GG
GG
GG GG
G
GG
GG
GG
U
UU U U
UUUU
U U U
U
U
U
AcceptorStem
D Loop Loop
AnticodonLoop
TΨC
GU C
GU C
A
A
A
A
A
A
A AA
A AA
A
A
CC
C
CC
CC
C
C C CC
CCC
CC C
C
C
GGG
GGGG G
GGG
G
GGG
GG
GG
GG
GG
GG
U
UU
U
U
U
U
UU
U
UU
UU U
GU C
A
A
CC
C
CC
CC
C
C
C
CCC
CC
CGGGGGG
GG
GGG
G
GGG
GG
GG
GG
U
AAA
A
AA A
A
AA
A
A
C C C
CG G GGU U U
UU
U
UU
U
U
U
U
U
U
A
A
CC
C
CC
CC
C
C
GG
GG
GG
GG
U
AA
A C
GG
GG UU
UU
C
C C C C
CC
GGGGU
U
U U U
GU C
A
A AA
A
A
A AA
CC
CGGG
G GGG
GGU
U
U
UU
(a) (b)
(c) (d)
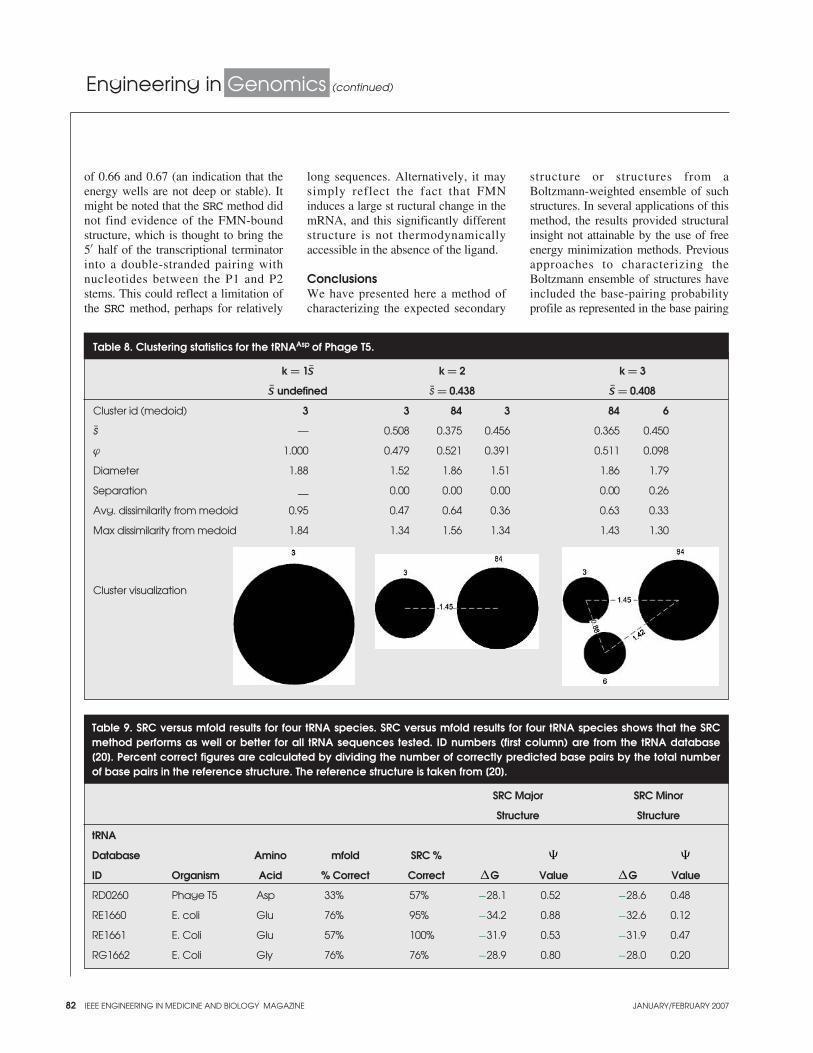
82 IEEE ENGINEERING IN MEDICINE AND BIOLOGY MAGAZINE JANUARY/FEBRUARY 2007
Engineering in Genomics (continued)
of 0.66 and 0.67 (an indication that theenergy wells are not deep or stable). Itmight be noted that the SRC method didnot find evidence of the FMN-boundstructure, which is thought to bring the5′ half of the transcriptional terminatorinto a double-stranded pairing withnucleotides between the P1 and P2stems. This could reflect a limitation ofthe SRC method, perhaps for relatively
long sequences. Alternatively, it maysimply reflect the fact that FMNinduces a large st ructural change in themRNA, and this significantly differentstructure is not thermodynamicallyaccessible in the absence of the ligand.
ConclusionsWe have presented here a method ofcharacterizing the expected secondary
structure or structures from aBoltzmann-weighted ensemble of suchstructures. In several applications of thismethod, the results provided structuralinsight not attainable by the use of freeenergy minimization methods. Previousapproaches to characterizing theBoltzmann ensemble of structures haveincluded the base-pairing probabilityprofile as represented in the base pairing
Table 8. Clustering statistics for the tRNAAsp of Phage T5.
k = 1s k = 2 k = 3
s undefined s = 0.438 s = 0.408
Cluster id (medoid) 3 3 84 3 84 6
s — 0.508 0.375 0.456 0.365 0.450
ϕ 1.000 0.479 0.521 0.391 0.511 0.098
Diameter 1.88 1.52 1.86 1.51 1.86 1.79
Separation — 0.00 0.00 0.00 0.00 0.26
Avg. dissimilarity from medoid 0.95 0.47 0.64 0.36 0.63 0.33
Max dissimilarity from medoid 1.84 1.34 1.56 1.34 1.43 1.30
Cluster visualization
Table 9. SRC versus mfold results for four tRNA species. SRC versus mfold results for four tRNA species shows that the SRCmethod performs as well or better for all tRNA sequences tested. ID numbers (first column) are from the tRNA database[20]. Percent correct figures are calculated by dividing the number of correctly predicted base pairs by the total numberof base pairs in the reference structure. The reference structure is taken from [20].
SRC Major SRC Minor
Structure Structure
tRNA
Database Amino mfold SRC % � �
ID Organism Acid % Correct Correct �G Value �G Value
RD0260 Phage T5 Asp 33% 57% −28.1 0.52 −28.6 0.48
RE1660 E. coli Glu 76% 95% −34.2 0.88 −32.6 0.12
RE1661 E. Coli Glu 57% 100% −31.9 0.53 −31.9 0.47
RG1662 E. Coli Gly 76% 76% −28.9 0.80 −28.0 0.20
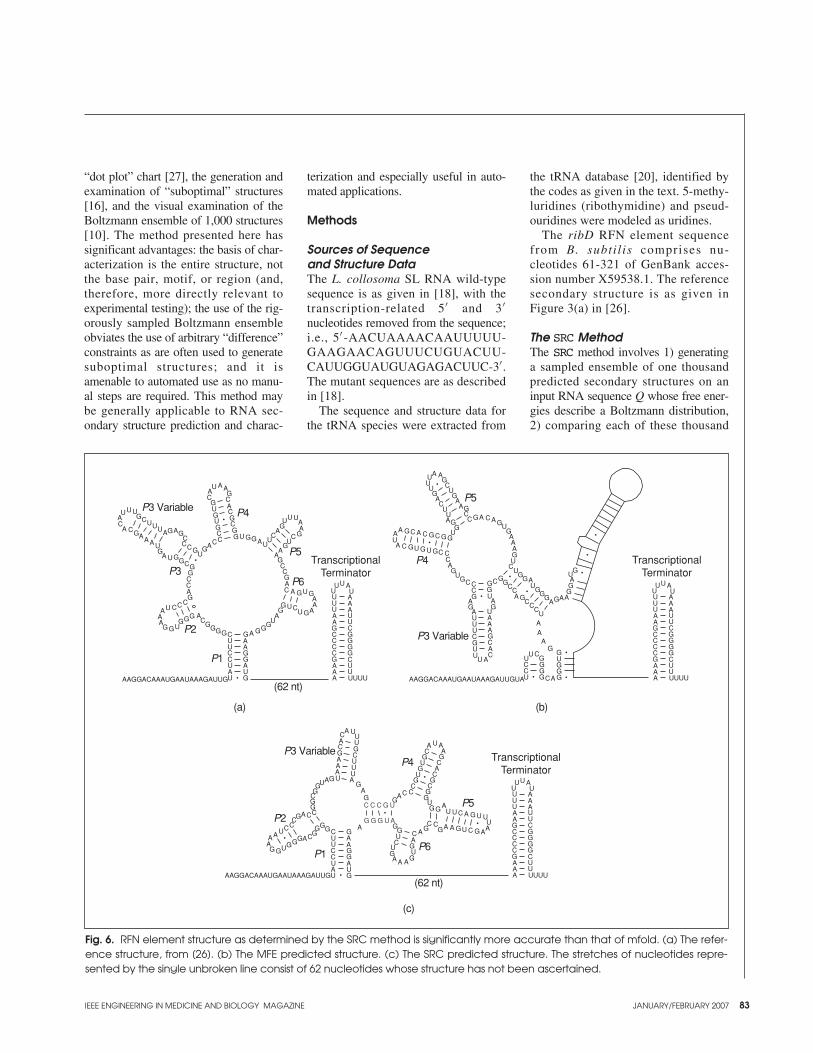
IEEE ENGINEERING IN MEDICINE AND BIOLOGY MAGAZINE JANUARY/FEBRUARY 2007 83
“dot plot” chart [27], the generation andexamination of “suboptimal” structures[16], and the visual examination of theBoltzmann ensemble of 1,000 structures[10]. The method presented here hassignificant advantages: the basis of char-acterization is the entire structure, notthe base pair, motif, or region (and,therefore, more directly relevant toexperimental testing); the use of the rig-orously sampled Boltzmann ensembleobviates the use of arbitrary “difference”constraints as are often used to generatesuboptimal structures; and it isamenable to automated use as no manu-al steps are required. This method maybe generally applicable to RNA sec-ondary structure prediction and charac-
terization and especially useful in auto-mated applications.
Methods
Sources of Sequence and Structure DataThe L. collosoma SL RNA wild-typesequence is as given in [18], with thetranscription-related 5′ and 3′nucleotides removed from the sequence;i.e., 5′ -AACUAAAACAAUUUUU-GAAGAACAGUUUCUGUACUU-CAUUGGUAUGUAGAGACUUC-3′ .The mutant sequences are as describedin [18].
The sequence and structure data forthe tRNA species were extracted from
the tRNA database [20], identified bythe codes as given in the text. 5-methy-luridines (ribothymidine) and pseud-ouridines were modeled as uridines.
The ribD RFN element sequencefrom B. subtil is comprises nu-cleotides 61-321 of GenBank acces-sion number X59538.1. The referencesecondary structure is as given inFigure 3(a) in [26].
The SRC MethodThe SRC method involves 1) generatinga sampled ensemble of one thousandpredicted secondary structures on aninput RNA sequence Q whose free ener-gies describe a Boltzmann distribution,2) comparing each of these thousand
Fig. 6. RFN element structure as determined by the SRC method is significantly more accurate than that of mfold. (a) The refer-ence structure, from [26]. (b) The MFE predicted structure. (c) The SRC predicted structure. The stretches of nucleotides repre-sented by the single unbroken line consist of 62 nucleotides whose structure has not been ascertained.
A AA
A
A
AAA
AA
AA
A
AA
A
A
A
A
A
AAA
AA
AAA
AA
GG
G G
GG
GG
GG
G
G
G
GGGG
GGGGG
G
G
GGG
G
GG
G
G
G
G G
GG
GGG
G
G
GG
G
GGGGG
G
GG
U
U
UU
U
UU UU
UU
U
UU U
UUU
CC
C
C C
CC
C
CC
CC
CC
C
C
C
CC
CCC
C
C
CC
CC U
UUU
UUUU
UU
UUUUUU
U
U
U
U
UU
UU
U
C
CCCC
C
C
A
AA
A
A
AAA
A
A
AA
AA
U
U
AAGGACAAAUGAAUAAAGAUUG
TranscriptionalTerminator
A
AAA
AA
AAA
GGGGG
G
UUUUUU
UU
UUUUUU
U
CCCC
C
C
TranscriptionalTerminator
A
AAA
AA
AAA
GGGGG
G
UUUUUU
UU
UUUUUU
U
CCCC
C
C
TranscriptionalTerminator
AAGGACAAAUGAAUAAAGAUUGUA
A A
A
A
A
A AA
AA
A
A
AA
A
A
A
AAAA
A
A
AA
A
A
A A
AAA
AA
UUU
UU
U
U
U
G
GG
GG
GGGG
G G G
GG
G
GG
G
G G G
GG
GGG
GGGG
GG
G
GG
GG
G
G G
GG
G
G
G
G
G
C
C
C
CCC
CC C
C
CC
CC
C
C
C
CCC
C
C
C
CC
U
U
U
UU
U
U
U
U
UUUU
U
UU
U
C
C
CC
UU U
U
A UUU
UU
UU
U
U
U
GG
GG
G
GG
GG
GGG
G GG
G
GG
G
G
G GG
GG
G
G
G
GG
G
G GG
GG
G
G
G G
GGG
C
C
C
CC
CC
CC
A
AAA
A
A
A
C
CCC
A
A
A
A
AA
AA
AAA
A AA
A
A
AAA
AA
UU
U U
UUU
AAGGACAAAUGAAUAAAGAUUGU
C
CC
C
C
C
U U U
U
UU
U
U
U
U
AA
A
A
A
C
CC
C
CC
C
C C C G U
G G G U A
P3 Variable
P3
P4
P5
P6
P1
P2
(62 nt)
P5
P4
P3 Variable
P3 Variable
P2
P1P6
P5
P4
(62 nt)
(a) (b)
(c)
84 IEEE ENGINEERING IN MEDICINE AND BIOLOGY MAGAZINE JANUARY/FEBRUARY 2007
Engineering in Genomics (continued)
structures to all others, generating499,500 pairwise dissimilarities in adiagonal half-matrix, 3) using thisdissimilarity matrix to cluster the struc-tures, and 4) representing the structureensemble (or equivalently, the structureprobabilities) as a set of ordered pairs,(S, ψ), where S is the representativestructure of a cluster and ψ is a naïveprobability-like value that structures sim-ilar to S will be found in an equilibriumensemble of structures on sequence Q.(The value ψ is discussed further in thesection “Clustering Statistics.”)
Generation of the BoltzmannEnsemble of StructuresAll ensembles of structures on agiven sequence were generated by theSrna application module of thesfold Web server at http://sfold.wadsworth.org/ in batch mode withdefault settings (37 ◦C, 1M NaCl, nodivalent ions). The results are a set of onethousand secondary structure representa-tions as well as additional informationsuch as the free energy of folding of eachstructure. The reasoning and demonstra-tion of the validity of the choice of onethousand structures for sequences up tomore than one thousand bases is detailedin the original sfold paper [10].
DissimilarityWe tried several dissimilarity measures,including the Euclidian distance, acoarse distance measure introduced byShapiro [28], the base pair distance (thenumber of pairs present in only one ofthe two structures being compared), atree distance measure, also by Shapiro[29], and both the published and anunpublished version of the rna_alignalgorithm [12]. Using both publishedRNA sequences and artificial sequences,we used each dissimilarity measure tocompare sfold ensembles, then clusteredthese ensembles with the PAM algo-rithm (see below). We visually examinedthe clusters, looking for both a) structur-al similarity among the members of acluster, and b) structural dissimilaritybetween the representative structures ofdifferent clusters (data not shown). Ourconclusion was that the rna_align
algorithm produced clustering resultsmost consonant with our perception ofsimilarity and difference of these struc-tures. There was no appreciable differ-ence between the published andunpublished versions of rna_align.
Consequently, for the experimentsdescribed herein, quantification of thedissimilarity of two structures was doneusing the improved, unpublished ver-sion (kindly provided by K. Zhang) ofthe rna_align software implementingthe edit distance algorithm of Jiang et al.[12]. The version of the software usedhere differs from the published and dis-tributed version in that it has improvedperformance and uses an affine gappenalty with gap initiation cost of 4 andextension cost of 1 (K. Zhang, personalcommunication).
Generation ofthe Dissimilarity MatrixEach of the one thousand structuresgenerated by sfold was compared toall other structures, resulting in a diago-nal half matrix of 499,500 pairwise dis-similarities for each input sequence.The calculation of this dissimilaritymatrix, required for the clustering step,was done in a 58-processor cluster com-puting environment.
ClusteringClustering of the one thousand struc-tures was done by our implementationof the PAM (partitioning aroundmedoids) algorithm [30] in Java. PAMis a non-hierarchical clustering methodin which k medoids are chosen suchthat the total dissimilarity of all objectsin the data set (the one thousand sec-ondary structures generated by sfold)from the nearest medoid (also referredto as the “representative structure” of a cluster) is minimized. We chose k-medoid clustering as the method inthe classification literature most applic-able to the problem at hand. It avoidsthe problems and overinterpretationconcerns of hierarchical clustering tech-niques when there is no rational basisfor forcing the data into a hierarchy. Itis similar to the more familiar k-meansclustering, and is applicable to data
where dissimilarities can be computedbut a “mean” structure is difficult orimpossible to construct. Instead, clus-ters are represented by a structure cho-sen from the input data, a “centrotype”or “medoid” structure whose averagedissimilarity to all objects in the givencluster is minimal. The PAM algorithmchooses representative structures in twosteps. In the first (“Build”) step, poten-tial medoids are chosen sequentially,such that the choice of each subsequentmedoid minimizes the average distanceof all the input structures to their nearestmedoid, without changing previouslychosen medoids. A second (“Swap”)step is necessary to optimize themedoid choices over all possible alter-natives, until the dissimilarity of allinput structures to their nearest medoidis minimized. The structures are thenassigned to a cluster by simply choos-ing the nearest medoid. The medoidsthen become the “representative struc-tures” of their respective clusters.
An obvious question is that of how kis chosen. Theoretically, this is a diffi-cult problem. In practice, one often hasan idea what reasonable values for kmight be. Since an understanding of theenergy landscape of RNA molecules isstill in its infancy, we have taken a rela-tively naïve approach: 1) the function ofmany RNA molecules can be readilyexplained by a single secondary struc-ture; therefore, we always try k = 1; 2)there are numerous well-characterizedRNA switches that have two biological-ly relevant structures; therefore, wealways try k = 2; 3) while we have notfound any published instances of RNAmolecules that have more than two bio-logically active structures, we also try k= 3, as this may give us insight asanother set of statistics to compare to thek = 1 and k = 2 cases.
Clustering Statistics
sA “silhouette” value (so called becausea bar chart of a set of such values formsa “silhouette” of the cluster structure),s (i), is calculated for each structure inthe ensemble:
IEEE ENGINEERING IN MEDICINE AND BIOLOGY MAGAZINE JANUARY/FEBRUARY 2007 85
s (i) = b (i) − a(i)
max {a(i) , b (i)} ,
where i is a structure from the ensembleof 1,000 structures and a(i) and b (i)are defined as follows.
a(i) is the average dissimilaritybetween i and all other structures in itscluster A, and
b (i) = minC �=A
d (i, C) ,
where d (i, C) is the average dissimilar-ity between i and all objects in somecluster C. In other words, b (i ) is thedistance between i and its “second best”cluster assignment.
If we take the average value of s (i )over the entire ensemble, we get a mea-sure, s, of the degree to which the struc-tures in the ensemble fall into k groups,accounting for both the tightness (a(i))and the separation (b (i)) of the clusters.The value of k which maximizes s istaken as the optimal number of clustersand is referred to as the silhouette coef-ficient, abbreviated SC. That is,
SC = maxk
s(k).
Values for s and SC range from −1 to 1.Kaufman and Rousseeuw provide aclassification of the meaning of variousranges of the s or SC value, based onexperience applying this and other clus-tering techniques to a variety of data:0.71–1.00, strong structure; 0.51–0.70,reasonable structure; 0.26–0.50, weakstructure; and ≤0.25, no substantialstructure. Although we presently consid-er only values of 1, 2, and 3 for k (seethe discussion under “Clustering,”above), this is based only on the lack ofempirical evidence in the literature for k> 2. This does not preclude the possibil-ity that there are RNA sequences thathave more than two thermodynamicallyaccessible conformations, and this is aninteresting subject for further research.
ψ
A naïve probability-like value ψ is cal-culated for each representative structureas the number of structures in theensemble that were assigned to that
medoid in the clustering step. We avoidreferring to this as a true probability, asthere are many factors not being takeninto account with this measure, the mostobvious being that assignment of astructure to a medoid by the clusteringalgorithm indicates only that it is closerto that medoid than to any other; it doesnot indicate that it is actually similar inany qualitative sense.
DiameterThe diameter of a cluster is defined asthe (normalized) edit distance betweenthe two most dissimilar structures inthe cluster.
SeparationSeparation is defined as the smallest dis-similarity between a structure in the clus-ter under consideration and a structurenot in the cluster under consideration.
Average and MaximumDissimilarity from MedoidThese two values are calculated by tak-ing the average or maximum edit dis-tance dissimilarity between the medoidof the cluster under consideration andall other structures in that cluster. Thesevalues give an indication of the “tight-ness” of the cluster.
Cluster Visualization DiagramsThe cluster visualization diagramsshown in various tables in this publica-tion are created as follows. Each clusteris represented by a black circle whosediameter is the average dissimilarityfrom the medoid of that cluster (in unitsof edit distance). For k > 1, multipleclusters are shown, and they are sepa-rated from each other by the edit dis-tance between the medoids of eachcluster, indicated by a gray dashed linewith the edit distance value shown. Thenumbers by each cluster refer back tothe (arbitrary) cluster medoid identifiergiven in each table.
Using the Clustering Data to Characterize the Structural EnsembleWhen k = 2, the ensemble is character-ized as having two alternative struc-
tures, which are represented by S1 andS2, and are equivalent to the medoidscalculated by the clustering algorithm.
Free Energy Minimization MethodWe used the Web server version ofmfold [27], [31] to generate the MFEstructures used for comparison herein.The mfold Web server uses version3.1 of mfold. The folding tempera-ture is fixed at 37 °C and the ionicconditions are 1M NaCl and no diva-lent ions (which is the same assfold). All parameters were left atdefaults (maximum interior/bulgeloop size, 30; maximum asymmetryof an interior/bulge loop, 30; no limiton maximum distance between pairedbases) except the upper bound on thenumber of computed foldings, whichwas set to 1, as we were interestedonly in the “optimal” structure. Bothsfold—upon which the SRC methodrelies for the ensemble of structures—and mfold version 3.1 use the energyparameters of and [31] and [32].
Designing Mono- and BistableRNA SequencesTo create the monostable artificial RNAsequence, we used the RNAinversesoftware from the Vienna RNAPackage via its Web interface athttp://rna.tbi.univie.ac.at/cgi-bin/RNAinverse.cgi. The target structurewas the “V-shaped” structure given inFigure 2 in [15]. Default parameterswere used for RNAinverse, except thatthe stop condition was set to 0.1kcal/mol. The output sequence wasGCCGUCUUAUGACGGCGGCCCGCUC-CUGCGGGU.
To create the bistable artificial RNAsequence, we used the Perl programswitch.pl kindly provided by IvoHofacker. The input structures were the“V-shaped” and the “rodlike” structuresfrom Figure 2 in [15]. Default parame-ters were used. The output sequencewas GUCCUUGCGUGAGGACAGCCCU-UAUGUGAGGGC.
PerformanceOur eventual goal for the SRC methodis to automate large-scale in silico
86 IEEE ENGINEERING IN MEDICINE AND BIOLOGY MAGAZINE JANUARY/FEBRUARY 2007
Engineering in Genomics (continued)
RNA experiments. The methoddescribed here takes a step toward thatend by eliminating manual inspectionsteps and providing a set of quantita-tive characteristics of the equilibriumensemble that can be used to makechoices regarding the number of rele-vant structures in the ensemble. Thesfold step runs in O(n3) time and hasproven to be quite fast in practice, onsequences up to 1,000 bases in length.The clustering step is quite fast as welland effectively runs in constant time,since the ensemble is always 1,000structures. The most computationallyintensive step is the computation of the499,500 pairwise edit distances. Therna_align algorithm is also O(n3).On our 58-processor Intel processorLinux cluster, the dissimilarity calcula-tion step takes from hours (sequencelength of around 100 bases) to days(up to 300 bases). (The pairwise dis-similarity calculations are independentof each other and were queued for par-allel execution on the cluster.)
Authors’ ContributionsHarold R. Garner proposed the researchdirection, contributed to the clusteringstatistics, provided guidance and insightas to values for k, and edited the manu-script. Stephen P. Crozier conceived ofthe SRC method, wrote the programscomprising that method, designed thesequences, gathered and analyzed thedata from the SRC runs, and wrote themanuscript.
AcknowledgmentsThis work was supported by PGA Grant5-U01-HL066880-04, National Institutesof Health Grant 1RO1-CA096901-01A1,the Hudson Foundation, and the P.O’B.Montgomery Chair Fund. We thankKhaizong Zhang for providing animproved version of his rna_alignalgorithm, Ivo Hofacker for providinghis switch.pl software to design bi-stable RNA sequences, and BrynWeiser for his XRNA software and helptherewith. The authors declare theyhave no competing financial interests.
Address for Correspondence: StephenP. Crozier, University of TexasSouthwestern Medical Center, 5323Harry Hines Blvd, Dallas, TX 75390USA. E-mail: [email protected].
References[1] K. Kruger, P.J. Grabowski, A.J. Zaug, J. Sands,D.E. Gottschling, and T.R. Cech, “Self-splicingRNA: Autoexcision and autocyclization of the ribo-somal RNA intervening sequence of Tetrahymena,”Cell., vol. 31, no. 1, pp. 147–157, 1982.[2] C. Guerrier-Takada, K. Gardiner, T. Marsh, N.Pace, and S. Altman, “The RNA moiety of ribonu-clease P is the catalytic subunit of the enzyme,”Cell., vol. 35, no. 3, Pt. 2, pp. 849–857, 1983.[3] R. Nussinov and A.B. Jacobson, “Fast algorithmfor predicting the secondary structure of single-stranded RNA,” Proc. Natl. Acad. Sci. USA, vol. 77,no. 11, pp. 6309–6313, 1980.[4] S. Wuchty, W. Fontana, I.L. Hofacker, and P.Schuster, “Complete suboptimal folding of RNA andthe stability of secondary structures,” Biopolymers,vol. 49, no. 2, pp. 145–165, 1999.[5] M. Zuker and P. Stiegler, “Optimal computerfolding of large RNA sequences using thermody-namics and auxiliary information,” Nucleic. Acids.Res., vol. 9, no. 1, pp. 133–148, 1981.[6] J.S. McCaskill, “The equilibrium partition func-tion and base pair binding probabilities for RNA sec-ondary structure,” Biopolymers, vol. 29, no. 6–7, pp. 1105–1119, 1990.[7] M. Zuker, J.A. Jaeger, and D.H. Turner, “Acomparison of optimal and suboptimal RNA sec-ondary structures predicted by free energy mini-mization with structures determined byphylogenetic comparison,” Nucleic. Acids. Res.,vol. 19, no. 10, pp. 2707–2714, 1991.[8] M. Waterman and T. Byers, “A dynamic pro-gramming algorithm to find all solutions in a neigh-borhood of the optimum,” Mathematic. Biosci., vol.77, pp. 179–188, 1985.[9] Y. Ding, C.Y. Chan, and C.E. Lawrence, “Sfoldweb server for statistical folding and rational designof nucleic acids,” Nucleic Acids Res., vol. 32, (WebServer issue), pp. W135–W141, 2004.[10] Y. Ding and C.E. Lawrence, “A statistical sam-pling algorithm for RNA secondary structure predic-tion,” Nucleic. Acids. Res., vol. 31, no. 24, pp. 7280–7301, 2003.[11] Y. Ding and C.E. Lawrence, “Statistical predic-tion of single-stranded regions in RNA secondarystructure and application to predicting effective anti-sense target sites and beyond,” Nucleic. Acids. Res.,vol. 29, no. 5 pp. 1034–1046, 2001.[12] T. Jiang, G. Lin, B. Ma, and K. Zhang “A gen-eral edit distance between RNA structures,” J.Comput. Biol., vol. 9, no. 2, pp. 371–388, 2002.[13] S.J. Chen and K.A. Dill, “RNA folding energylandscapes,” Proc. Natl. Acad. Sci. USA, vol. 97, no.2, pp. 646–651, 2000.[14] B.J. Tuckera and R.R. Breaker, “Riboswitchesas versatile gene control elements,” Curr. Opin.Struct. Biol., vol. 15, no. 3, pp. 342–348, 2005.[15] C. Flamm, I.L. Hofacker, S. Maurer-Stroh, P.F.Stadler, and M. Zehl, “Design of multistable RNAmolecules,” RNA., vol. 7, no. 2, pp. 254–265, 2001.[16] R. Giegerich, D. Haase, and M. Rehmsmeier,“Prediction and visualization of structural switches in
RNA,” in Pac. Symp. Biocomput., 1999, pp. 126–137.[17] J.P. Bruzik, K.V. Doren, D. Hirsh, and J.A.Steitz, “Trans splicing involves a novel form ofsmall nuclear ribonucleoprotein particles,” Nature,vol. 335, no. 6190, pp. 559–562, 1988.[18] K.A. LeCuyer, and D.M. Crothers, “TheLeptomonas collosoma spliced leader RNA canswitch between two alternate structural forms,”Biochem., vol. 32, no. 20, pp. 5301–5311, 1993.[19] B. Voss, C. Meyer, and R. Giegerich,“Evaluating the predictability of conformationalswitching in RNA,” Bioinformatics, vol. 20, no. 10,pp. 1573–1582, 2004.[20] M. Sprinzl, C. Horn, M. Brown, A. Ioudovitch,and S. Steinberg, “Compilation of tRNA sequencesand sequences of tRNA genes,” Nucleic. Acids. Res.,vol. 26, no. 1, pp. 148–153, 1998.[21] R. Ishitani, O. Nureki, N. Nameki, N. Okada, S.Nishimura, and S. Yokoyama, “Alternative tertiarystructure of tRNA for recognition by a posttranscrip-tional modification enzyme,” Cell., vol. 113, no. 3,pp. 383–394, 2003.[22] M. Helm, H. Brule, F. Degoul, C. Cepanec, J.P.Leroux, R. Giege, and C. Florentz, “The presence ofmodified nucleotides is required for cloverleaf fold-ing of a human mitochondrial tRNA,” Nucleic.Acids. Res., vol. 26, no. 7, pp. 1636–1643, 1998.[23] E. Madore, C. Florentz, R. Giege, and J.Lapointe, “Magnesium-dependent alternativefoldings of active and inactive Escherichia colitRNA(Glu) revealed by chemical probing,”Nucleic. Acids. Res. , vol . 27, no. 17, pp.3583–3588, 1999.[24] M.S. Gelfand, A.A. Mironov, J. Jomantas, Y.I.Kozlov, and D.A. Perumov, “A conserved RNAstructure element involved in the regulation of bacte-rial riboflavin synthesis genes,” Trends. Genet., vol. 15, no. 11, pp. 439–442, 1999.[25] A.G. Vitreschak, D.A. Rodionov, A.A. Mironov,and M.S. Gelfand, “Regulation of riboflavin biosyn-thesis and transport genes in bacteria by transcription-al and translational attenuation,” Nucleic. Acids. Res.,vol. 30, no. 14, pp. 3141–3151, 2002.[26] W.C. Winkler, S. Cohen-Chalamish, and R.R.Breaker, “An mRNA structure that controls geneexpression by binding FMN,” Proc. Natl. Acad. Sci.USA, vol. 99, no. 25, pp. 15908–15913, 2002.[27] M. Zuker, “Mfold web server for nucleic acidfolding and hybridization prediction,” Nucleic AcidsRes., vol. 31 no. 13, pp. 3406–3415, 2003.[28] B.A. Shapiro, “An algorithm for comparingmultiple RNA secondary structures,” Comput. Appl.Biosci., vol. 4, no. 3, pp. 387–393, 1988.[29] B.A. Shapiro and K.Z. Zhang, “Comparing multiple RNA secondary structures using tree comparisons,” Comput. Appl. Biosci., vol. 6 no. 4,pp. 309–318, 1990.[30] L. Kaufman and P.J. Rousseeuw, “PartitioningAround Medoids (Program PAM),” in FindingGroups in Data: An Introduction to Cluster Analysis.New York: Wiley, pp. 68–125, 1990.[31] D.H. Mathews, J. Sabina, M. Zuker, and D.H.Turner, “Expanded sequence dependence of thermo-dynamic parameters improves prediction of RNAsecondary structure,” J. Mol. Biol., vol. 288 no. 5, pp.911–940, 1999.[32] T. Xia, J. SantaLucia, Jr., M.E. Burkard, R.Kierzek, S.J. Schroeder, X. Jiao, C. Cox, and D.H.Turner, “Thermodynamic parameters for an expandednearest-neighbor model for formation of RNAduplexes with Watson-Crick base pairs,” Biochem.,vol. 37 no. 42, pp. 14719–14735, 1998.

IEEE ENGINEERING IN MEDICINE AND BIOLOGY MAGAZINE JANUARY/FEBRUARY 2007 87
interoperability: the cure for what ails us
While working in the areaof pacemakers almostthree decades ago, I recalldiscussing the artificial
heart with some fellow biomedicalengineers. At first the discussion wasstrictly devoted to the physiological,mechano-electrical, and systems levels.Slowly, however, the technical discus-sion moved into the matter of econom-ics and the cost-effectiveness of thedevice as it related to the entireprocess. At a point in that debate, itbecame clear that there was a chasmbetween the wonderful opportunitiesthat such devices could offer withrespect to saving or prolonging some-one’s life and the stark economic reali-ties as related to affordability, nomatter where in the world a patientlived. Part of this discussion dealt withthe fact that for the price of a singleartificial heart, 100 people could have apacemaker implanted or replaced.
Today, as we examine the risingoperational costs in the U.S. healthcareindustry (i.e., malpractice insurance,administrative costs, pharmaceuticals,managed care, hospitals, changingtechnologies, etc.), we can easilyunderstand how these runaway costsnot only hold a plethora of negativerepercussions for our national economybut also impact healthcare at the locallevel, such as affecting just how well alocal hospital’s emergency department(ED) can properly allocate its capaci-ties and capabilities. The same thoughtmust be extended to the prospect ofoperating effectively during a majorcrisis. It has come to light, for example,that the 41 million individuals withoutmedical insurance in the United Statesnow look to use these same EDs as theprimary providers of their healthcare.Naturally, having to extend care to theuninsured degrades normal ED opera-tional capabilities and capacities—to
the point that about once every minutean ambulance is turned away from ahospital and sent to another [1]. Ofcourse, rising costs produce other cas-cading, unanticipated, and possiblyundesirable effects. For instance, theydrive consumers to more desirable out-lets and venues—in this case, makingmedical outsourcing [2] a viable choicefor the consumer.
Additionally, this now flattenedworld a la Friedman [3] purports tohave opened up unique, worldwidecost-controlling opportunities to many.Friedman describes the role of informa-tion technology as a social and econom-ic equalizer for the “have nots” of theworld. Particularly in the United States,the complexity involved in the exten-sion of healthcare to both the “haves”and “have nots” is ever increasing, fromthe sheer volume of tests administeredto the number of specialists that arelikely to be involved in a case to theadministration of therapies. At everyjuncture, information technologies (IT)have become a powerful decisive forcein the administration and quality ofcare. Given this area of immense impor-tance, there is one associated problemarea that very few have focused on todate. For the uninitiated, it is importantto highlight that this one area throws animposing shadow not only over the U.S.healthcare system and public health butover national and international securityas well. That vastly mysterious area isinteroperability. As an example ofinteroperability, imagine an individualwho has had an electronic healthrecord (EHR) in his or her private lifefor 20 years. This individual proceedsto have a career in the armed forces fora period of 25 years, and after retire-ment becomes a part of the VeteransAdministration (VA)’s health record-keeping system. Today, there is a needfor this veteran’s EHR to transition
smoothly from one system to the next[civilian, Department of Defense(DoD), and VA], and to do so withoutsuffering any exceptions (missing orinaccurate records) in the process. Yet,there is little that anyone can offer inthe way of knowledge or assurancethat this expectation can be met!
A Turning of the TideRecently, at a seminal IEEE-sponsoredJune meeting in Cambridge,Massachusetts, titled “Special Sessionon Integration and Interoperability ofNational Security InformationSystems,” a fundamentally intellectualturning of the tide on the nature of unin-teroperability took place. Discussionsthere served to confirm that de factoadoption of any preexisting definitionsof interoperability, such as the oneinked by the DoD, amounted to a viola-tion of intellectual due-process whendiscussing the perennially intractableproblem of uninteroperability.
The special session—a veritablegathering of the world’s who’s who incomputing, communications, innova-tions, and policymaking—succeededimmensely in spotlighting the array ofmisunderstandings and complexitiesrelated to interoperability. Gene Amdahl,Simon Ramo, Marcian “Ted” Hoff, Jr.,James Treybig, Gordon Bell, William J.Harris, Rona Stillman, Jeffrey Hunker,and Brenton Greene were some of theluminaries featured at this event. Theystressed a systems approach, which is asyet absent from all efforts thus far toachieve interoperability.
Dr. Robert Mathews, distinguishedsenior research scholar on nationalsecurity affairs and U.S. industrial pre-paredness at the Center for StrategicAdvancement of Telematics andInformatics, and perhaps the world’sleading authority on interoperability,has said that the manner in which we
Luis KunGovernment Affairs

88 IEEE ENGINEERING IN MEDICINE AND BIOLOGY MAGAZINE JANUARY/FEBRUARY 2007
Government Affairs (continued)
have been studying the interoperabilityof information systems for more thanhalf a century is in essence incorrect.He suggests that we are ignoring keymultidisciplinary and interdisciplinaryaspects of the problem in our considera-tions in addition to not using a systemsapproach. Dr. Mathews, who organizedthis historic IEEE gathering, includingits intellectually compelling mix of sub-jects and themes, added that existingintellectual orientations and the defini-tions for interoperability are profoundlypuzzling and full of equivocations. Hesays that such orientations have at bestserved to wage a disinformation cam-paign against those in the scientific andoperational communities, tearing muchneeded attention and resources awayfrom a holistic (comprehensive) treat-ment of the problem. IEEE-USA hasfundamentally reaffirmed this view,acknowledging the boundless usage ofthe term interoperability, while notingdiscernible vagueness of meaning incommon use [4]. Moving forward witha systems approach has been difficult atbest for the scientific community, forthere is an insufficient appreciation ofthe processes involved.
A Confounding Evolutionary PathThe dawn of the information age hasbrought with it profound societalchanges, to which we humans have notadjusted well. Vast populations of com-putational hardware, communicationsystems, applications, and subordinatedsupport systems make up an intricate,ultracomplex, and highly distributedinterdependent super-infrastructurebehind every decision-making path.While, metaphorically, the oceans ofthe world have been reduced to mereponds, and transcontinental fiber opticbridges have brought the world’s land-masses and their respective populationscloser together and economically moreinterdependent, the curse of the infor-mation age is that the aforementionedsuper-infrastructures must now notonly synchronously cohabitate withhumans everywhere but also must sup-port the way human beings tend tomake decisions.
This complicated “arrangement forcoexistence,” and the process of satis-fying the “man, machine, and theenterprise/support systems” equation,where elaborate processes are involvedin the extension of support towarddecision making by human beings,“have never really been fully under-stood,” according to Mathews. He sub-mits that the “man, machine, and theenterprise/support systems” must bebetter represented in a more fundamen-tal, more holistic (comprehensive)manner.
Course CorrectionAside from the fanciful yet blearydefinitions carved up by many, andthose that exist in popular lore,Mathews attempts to orient us towardinteroperability, defining it as “thatability for people to interact with eachother, between organizations, acrossdomains of influence and geographical boundaries—supported by the properdecisioning tools and services—toachieve a goal/objective/decision, with-in set/accepted limits of performance.”He suggests that interoperability cannotbe hurriedly consigned to the realm ofany technology or any of the systemcomponents alone. Rather interoperabil-ity must factor in all aspects of theequation that concerning the establish-ment, maintenance, and improvementof synchrony among all parties that arerequired to interact to achieve a com-mon goal, objective, or decision.Therefore, Mathews says “every aspectof the man, machine, and enterprise/support system must be properlyaccounted for, considered, and treatedto solve the uninteroperability prob-lem.” According to the HonorableRobert Cresanti, Under Secretary ofCommerce for Technology, at the spe-cial session,” Dr. Mathews has definedinteroperability in a most fundamentalway—as being about people and orga-nizations working together to achievecommon goals; that it is not just aboutthe technology but about how peoplethink and relate to information sharingand the costs of careless or irresponsi-ble handling of that information.”
Role of Interoperability in U.S. Healthcare ReformOn 17 July 2003, a one-year-old baby,Jeanella Aranda, received a transplantedliver from her father at the Children’sMedical Center in Dallas, following asurgical procedure to remove a hamar-toma. Damage to blood vessels sus-tained during the removal of thehamartoma required the surgeons toremove Jeanella’s liver. Jeanella’s par-ents were immediately solicited aspotential donors for a partial liver fortheir daughter; a blood test was quicklyadministered to each parent to deter-mine who was to be the likely trans-plant donor. The laboratory firstreported that Mrs. Aranda was a matchand then subsequently issued a revisedreport stating that Mr. Aranda was theappropriate donor. In truth, the lab’sfirst determination was correct.
Following a partial liver transplantfrom Mr. Aranda, baby Jeanella’s con-dition quickly began to deteriorate asshe developed a postoperative blooddisorder, fever, kidney problems, lunghemorrhages, and severe jaundice. On5 August, 19 days after the transplant,Mrs. Aranda noticed that baby Jeanellawas receiving type O blood transfu-sions, which seemed to be inconsistentwith her husband’s blood type (A), andenquired whether there was a trans-plant-related mismatch. Officials thendetermined that Mrs. Aranda was cor-rect in her observations. By then, it wasalready too late. Baby Jeanella died thenext day, 20 August [5]. This case sur-faced on the heels of another terrible,nationally prominent case of blood typemismatch. Less than six months earlier,17-year-old Jesica Santillán died afterundergoing a heart-lung transplant atDuke University Hospital in NorthCarolina [6].
In a report titled “To Err Is Human:Building a Safer Health System” [7],the Institute of Medicine of the NationalAcademies reported that medical errorsclaim more lives in the United Statesthan motor vehicle accidents, breastcancer, or AIDS and that “adverseevents” directly related to medicalerrors cost the nation on the order of
IEEE ENGINEERING IN MEDICINE AND BIOLOGY MAGAZINE JANUARY/FEBRUARY 2007 89
US$37.6 billion a year, of which US$17billion are completely preventable(These figures represent the lowest esti-mate as presented by the Institute.). In amore recent report [8], also by theInstitute of Medicine, a study conductedat the Brigham and Women's Hospitalin Massachusetts revealed 70 separateincidents of adverse drug events(ADEs) and 194 potential ADEs. Thereport also notes that, upon furtheranalysis of the data, a system analysisgroup found 334 errors associated withthe documented 264 events in total.
The system analysis group discov-ered that defects in drug knowledgedistribution, dose and identity check-ing, availability of patient information,order transcription, allergy defense sys-tems, medication order tracking, andinterservice communications presentedkey problem areas, accounting for over75% of the errors identified. They con-cluded that there were pervasive sys-tem-of-systems problems that led to themany errors.
In mulling over this information, Dr.Mathews reminded us that “whenever asystem-of-system problem has beenidentified as such, what people are reallyreferring to is an interoperability prob-lem. We must remember that the verynotion of interoperability presupposes asynchronous interworking of all compo-nents in constituting systems to achievethe desired goal. When the many stepsin the interoperability processes aren’tproperly qualified, quantified, associat-ed, monitored, assessed, and improved,things are bound to go wrong. All rela-tionships–however subtle in composingsystems—must be properly accountedfor.” He continued to state that hewasn’t surprised by these statistics, andalarmingly questioned whether the actu-al numbers may indeed be much higherthan those declared by the Institute ofMedicine. According to Matthews,"since most aren’t able to properlydefine the processes as (it) pertains tointeroperability, let alone qualify andquantify the many aspects of anydomain of concern well—in this particu-lar case of Brigham and Women’sHospital—there may very well be many
dimensions that go either unreported orunderreported as a result.”
After reviewing the prepublicationcopy of the Institute’s latest report, Dr.Mathews’s observations seem to havebeen proven accurate. A second studyconducted at the Brigham andWomen’s Hospital in fact uncoveredADEs at a higher rate than certain otherstudies involving computerized surveil-lance. This was due to the fact that thecomputerized surveillance system usedin the new study was adjusted to bemore sensitive and was undeniably ableto detect milder ADEs, as the surveil-lance system was governed by a newlyminted set of rules for identifying awider range of ADEs. As Dr. Mathewssaid, in this case, improving qualifica-tion and quantification of the domainand translating that knowledge toimprove the computerized surveillancesystem then permitted the discovery ofadditional ADEs that would otherwisehave gone unnoticed or unreported.
The Future of Interoperability Dr. Noah Porter, president of Yale,once said “few persons are so familiarwith each of the several lines of argu-ment in which lies its strength if it betrue, and its weakness if it is false, as tobe able to judge of any considerablenumber. Fewer still are competent topronounce upon the relation of eachpart to every other, and the cumulativeforce of all as they bear upon the grandconclusion.” [10] If I had to account forjust one extraordinarily brilliant mes-sage that the IEEE Special Session onIntegration and Interoperability ofNational Security Information Systemsuncovered, it was that thus far inter-operability has been studied andapproached quite incorrectly, and that itmust be viewed with an interdiscipli-nary and multidisciplinary perspective(holistic) using a systems approach.With the cerebral assistance of geneti-cists, seismic engineers, electrical engi-neers, bridge builders, computerscientists, biologists, structural engi-neers, metallurgists, economists, physi-cists, management scientists, policymakers, and analysts, Dr. Mathews both
THE MILITARY ANDINTEROPERABILITYComputers were born of war, and
they are still at war. The American
military has had the longest tenure
and the most diversified experi-
ence with computers and elec-
tronic communications technology
in the United States federal govern-
ment, and indeed the world.
Therefore, it would appear logical
that a definition for information sys-
tems’ interoperability per a U.S.
DoD dictate should become ubiq-
uitously acceptable as an intellec-
tual point of departure for
discussions relating to uninteroper-
ability, and indeed it has.
Government wide, the DoD defini-
tion for interoperability has given
rise to similar definitions, with a hint
of familiar DoD phraseology. The
DoD defines interoperability as that
“ability of systems, units, or forces
to provide data, information, mate-
rial, and services to and accept
the same from other systems, units,
or forces and to use the data, infor-
mation, material, and services so
exchanged to enable them to
operate effectively together.
According to the DoD, “interoper-
ability is more than just information
exchange. It includes systems,
processes, procedures, organiza-
tions, and missions over the life
cycle and must be balanced with
information assurance.” [9] And
according to the IEEE Standards
Computer Dictionary, interoper-
ability is defined as that “ability of
two or more systems or compo-
nents to exchange information and
to use the information that has
been exchanged.”
90 IEEE ENGINEERING IN MEDICINE AND BIOLOGY MAGAZINE JANUARY/FEBRUARY 2007
Government Affairs (continued)
cleverly and uniquely proved that ifhuman beings and information tech-nologies are to have an arrangement ofcoexistence to be interoperable—for thepurpose of successfully attaining com-mon goals in a timely, efficient, andeffective manner—then going forwardwe must have a very intimate under-standing of any such arrangement forcoexistence.
Let’s go back to the example usedearlier—an individual with an electronichealth record in the civilian, military,and VA sectors—and imagine the con-sequences of having an interoperableand longitudinal “unique” recordthroughout the individual’s lifetime.This individual’s life may be saved afew times by having the right informa-tion in the right place at the right time.The quality of life may improve, and thenumber of potential medication or aller-gy errors may be eliminated. Theknowledge stored could also provideinformation related to environmentalfactors (e.g., quality of the water andair), as well as short- and long-termeffects of diet, exercise, and vaccines. Inmy view, all these factors, when com-
bined with personal genetic information(while, of course, protecting the rightsof privacy), will allow us to move intotrue disease prevention. True interoper-ability will help improve the quality ofour healthcare and public health systemswhile significantly reducing expenses.
References[1] “The future of emergency care in the UnitedStates health system,” Institute of Medicine, June 14,2006. [2] J. Lancaster, “Surgeries, side trips for ‘medicaltourists’: Affordable care at India’s private hospitalsdraws growing number of foreigners,” WashingtonPost Foreign Service, October 21, 2004 [Online].Available: http://www.washingtonpost.com/wp-dyn/articles/A49743-2004Oct20.html; B. Simon,“Vacation, adventure and surgery? Elective surgeriesby world-class doctors at third-world prices,” 60Minutes [CBS], September 4, 2005 [Online].Available: http://www.cbsnews.com/stories/2005/04/21/60minutes/main689998.shtml; and “UK tosend heart patients to India,” Press Trust of India,June 29, 2003 [Online]. Available: http://economic-times.indiatimes.com/cms.dll/html/uncomp/arti-cleshow?msid=49583[3] T.L. Friedman, The World Is Flat: A BriefHistory of the Twenty-First Century, 1st ed., NewYork: Farrar, Strauss & Giroux, 2005.
[4] IEEE, IEEE-USA position statement on“Interoperability for the national health informationnetwork,” approved by Board of Directors,Piscataway, NJ, November 11, 2005 [Online].Available: [https://www.ieeeusa.org/policy/positions/NHINinteroperability.html]
[5] D. Grady and L.K. Altman, “Suit says transplanterror was cause in baby’s death,” NY Times, March 12,2003 [Online]. Available: http://query.nytimes.com/gst/fullpage.html?res=9805E7DB153EF931A25750C0A9659C8B63&sec=health&pagewanted=print[6] E. Bradley, “Anatomy of a mistake,” CBSBroadcasting Inc., Sept. 7, 2003 [Online]. Available:http://www.cbsnews.com/stories/2003/03/16/60minutes/main544162.shtml[7] T. Kohn, J.M. Corrigan, and M.S. Donaldson,Eds., “To err is human: Building a safer health sys-tem,” Institute of Medicine’s Committee on Qualityof Health Care in America, Washington, D.C., 1999.[8] P. Aspden, J. Wolcott, J. Lyle Bootman, and L.R.Cronenwett, Eds., “Preventing medication errors”(Quality Chasm Series), Institute of Medicine’sCommittee on Identifying and PreventingMedication Errors–Board on Health Care Services,Washington, D.C., 2007 [prepublication copy].[9] “Interoperability and supportability of informa-tion technology (IT) and national security systems(NSS),” Department of Defense Directive 4630.5,May 5, 2004.[10] N. Porter, “Physiological metaphysics; or, theapotheosis of science by suicide,” The PrincetonReview, vol. 2, July–Dec. 1878, and N. Porter,Science and Sentiment with Other Papers ChieflyPhilosophical, New York: Charles Scribner’s Sons,Franklin Press, 1882.
The views expressed in thiseditorial/paper are those of the authorand do not reflect the official policy orposition of the National DefenseUniversity, the Department of Defense,or the U.S. Government.
IEEE ENGINEERING IN MEDICINE AND BIOLOGY MAGAZINE JANUARY/FEBRUARY 2007 91
FDA-regulated validation in clinical and nonclinical environments
System validation is a multiphaseprocess which demonstrates thata laboratory instrument or pieceof medical equipment functions
as intended, is “fit” for use per accep-tance criteria, and meets the Food andDrug Administration’s (FDA’s) guide-lines and user expectations. It is fieldtesting from the end user’s perspective,above and beyond the detailed testingperformed by developers and manufac-turers. The clinical environment (i.e.,involving humans) has more validationrequirements than the preclinical envi-ronment (i.e., involving animals or in-vitro) due to the different usage, yet thefoundation is the same [1]–[5]. Systemvalidation is performed at the end-usercompany’s site, except for devices iden-tified by the FDA that are to be tested atthe manufacturer’s site.
Per the FDA regulations, system vali-dation must occur before the system orsoftware is put into service by the enduser [1]–[5]. Hardware and softwareengineers are often recruited to performvalidation services. Engineers may rec-ognize the various validation phaseslisted below because the same projectprocesses are performed during a sys-tem’s development and manufacturing,prior to its release for sale to an end-user company. When devices are soldfrom a manufacturer directly to an enduser, the manufacturer has the regulato-ry burden of final system validationfrom the user’s perspective (e.g., single-user insulin pump).
System validation of a purchased sys-tem is similar to the software develop-ment lifecycle (SDLC), or waterfallmethod, of software development. TheFDA refers to its method as the soft-ware life-cycle (SLC) [6].
FDA RegulationsThe FDA governs the activities of med-ical and pharmaceutical research and
healthcare organizations through regula-tions including, but not limited to, goodlaboratory practices (GLPs), currentgood manufacturing practices (CGMPs),good clinical practices (GCPs), andelectronic records and electronic signa-tures (ERESs). These good practicesand ERESs cite various requirementsthat comprise “validation” [1]–[5].These regulations cover both the clinicaland nonclinical environments.
The FDA requires many differenttypes of validation, such as methodsand data validations. This article pre-sents an overview of two validationtypes: a system validation and computersystem validation (CSV).
A system validation includes testingand documentation of a system’s hard-ware and software with all componentsconfigured and connected as they willbe used when placed into service. Asystem validation includes both instru-ments and equipment.
CSV includes testing and documenta-tion of only software, with its configu-rations and interfaces as they will beused when placed into service by theend-user company. One typical CSVproject is validation of a laboratoryinformation management system(LIMS), a large software applicationthat may connect to several instrumentsto import and analyze the data.
System validation and CSV have thesame deliverable documents for a vali-dation project. End-user companies thatpurchase laboratory instruments, bio-medical equipment, and medical ser-vices must comply with systemvalidation and CSV to ensure the systemor software operates as expected and canperform its intended functions in theenvironment in which it will be used.
With insufficient or no validation, theFDA can stop use of the instrument andrefuse to accept results for any tests per-formed prior to validation, or possibly
shut down a laboratory facility until theproblem is resolved (a worst-case sce-nario that is extremely rare).
System Validation and CSV ActivitiesFormal training is required to fullyunderstand each activity’s prerequisites,requirements, and variations foundamong systems and uses. Some activi-ties occur simultaneously or are ongo-ing through a major portion of theproject.
The system validation and CSVactivities typically performed include:➤ creating a validation master plan➤ assigning roles and responsibilities➤ defining system requirements➤ defining required security➤ showing traceability ➤ performing risk assessment ➤ performing a vendor assessment➤ writing a system description ➤ testing
• creating and executing an installa-tion qualification (IQ)
• creating and executing an opera-tional qualification (OQ)
• creating and executing a perfor-mance qualification (PQ)
➤ writing a validation summary➤ establishing support and mainte-
nance infrastructure➤ writing a retirement/decommission-
ing plan➤ writing a disaster recovery plan, if
one is not already in place➤ ensuring a business continuity plan
is in place.Approvals by appropriate managers
and authors are obtained throughout thevalidation process [1]–[5].
The validation master plan is essen-tially a project plan. It defines theapproach to the overall process. It mayinclude the assignment of roles andresponsibilities, a preliminary list ofrequirements, and a preliminary risk
Connie CurtsRegulatory Affairs
92 IEEE ENGINEERING IN MEDICINE AND BIOLOGY MAGAZINE JANUARY/FEBRUARY 2007
Regulatory Affairs (continued)
assessment. At this point, the list ofrequirements would be used to evaluateinstruments on the market and to makea purchasing decision.
For an end-user company, therequirements cite the functionalityneeded by the end user, including regu-latory requirements. Depending on thesystem, an end-user company mayrequire installation of extra electrical,water, or other utility capacity. For sys-tems that include a computer, therequirements would include➤ computer hardware and software
minimum specifications issued bythe instrument/equipment/devicemanufacturer, and
➤ additional software applications andversion numbers which would beused with the system or its raw data(e.g. Microsoft Office 2002, Excelfor systems that export data toExcel, or proprietary software infor-mation).
Security requirements commonlyinclude physical facility security, suchas campus guards or key cards to accessa room. Requirements also include soft-ware security, such as mandatory loginsand passwords with a minimum numberof characters, or data protections to con-form to privacy requirements per theHealth Insurance Portability andAccountability Act (HIPAA).
The requirements document may beupdated during the project to includeadditional functions or features notoriginally envisioned. For example, thepurchase of a data acquisition systemmay have an audit trail report with mul-tiple sort functions; this type of sortingfunctionality may become a require-ment for future system purchases. Withthe new function listed in the require-ments document, an end-user companycould issue the same document to mul-tiple vendors for future purchases. Notall companies stay with their initial sys-tem manufacturer.
The traceability aspect is the crossreference for each system requirementto its test and documentation in the OQand/or PQ, which are discussed below.A requirement may be traced to a stan-dard operating procedure (SOP) or to an
action in the IQ (discussed below),depending on the system environmentand corporate situation. In the event arequirement cannot be met at all, thebusiness management may choose toschedule its usage for a later time, orthey may deem it unnecessary.
The risk assessment may be conduct-ed as part of the validation master planand is often an ongoing activity duringthe entire validation process. It docu-ments anticipated problems and optionsto fix or avoid these problems. Risks tosaving original data, to privacy, or topatients are of utmost importance.
The higher the risk, the more end-user company testing is required to ver-ify operation and accuracy of thefunctions to be used and to resolve asmany problems as necessary prior tousage of the system. Also needed is theuse of a change control procedure toresolve all problems and provide docu-mentation that the system’s validatedstate is maintained. One high-risk situa-tion is an instrument or medical devicethat has proprietary software with mini-mal or no documentation from the man-ufacturer. This would require a detailedIQ and a very detailed OQ/PQ test plan.System documentation, such as a sys-tem description and manuals, must becreated by the end-user company whenit is not provided by the manufacturerand/or vendor.
Another high-risk situation is thecase of statistical analysis software thathas not been used previously in a regu-lated laboratory environment. High-risk software typically does notconform to the ERES requirements,such as having an audit trail or ensur-ing that original data is not overwritten.Or it may not have a separate login andpassword to ensure that only authorizedindividuals access the software. Therisk could be reduced by adding securi-ty through an SOP, installing a cus-tomized software addition, or limitingaccess to a room. High-risk softwareneeds to be tested thoroughly for itscalculation accuracy and the compa-ny’s ability to save the original data,even if that raw data is only on a paperprint out. An example of a low-risk sit-
uation is a laboratory-designated net-work printer being offline.
The vendor assessment is the end-user company’s audit of the vendor’smethodologies, quality, and integrity.Its purpose is to provide high confi-dence in the vendor, its products, and itsservices. To accomplish the audit, cus-tomers may visit the vendor’s site orconduct the audit via telephone confer-ences, e-mails, or letters. The FDAexpects due diligence. End-user compa-nies look for standards that have beenused in the development and manufac-ture of the equipment (e.g. IEEE andISO standards), and they often look forany valid certifications, such as a cer-tificate of ISO 9000:2000 or its subsec-tion ISO 9001:2000. This certificateindicates that the vendor company fol-lows an international standard for quality management systems with amanagement method that aims to pre-vent problems and provide quality andcustomer satisfaction from the initialconcept of the product to its retirement[7]–[9].
The system description defines thesystem’s final environment. Usually,diagrams are used to show how the sys-tem is connected to other equipment orto an animal or human. If a computer isused as part of the system, a final sys-tem description would include the actu-al computer’s specifications, whichmight exceed the manufacturer’s speci-fications.
The installation qualification (IQ) is atest plan or protocol that demonstratesthat the installation has been performedcorrectly and in a reproducible manneraccording to the manufacturer’srequirements. It also indicates specificconfigurations needed for the actualusage at the end-user company. It is notuncommon to have the IQ refer to themanufacturer’s instructions within thedocument so as not to rewrite a well-written set of instructions.
The operational qualification (OQ) isthe test plan or protocol that checks thesystem’s functionality when things goright or wrong with the usage. It veri-fies that the system or software consis-tently operates within established limits
IEEE ENGINEERING IN MEDICINE AND BIOLOGY MAGAZINE JANUARY/FEBRUARY 2007 93
and tolerances. Tests usually includethe printing and verification of contentaccuracy of all the reports that end userswill print. The OQ includes significanttesting of error handling and limita-tions, such as how the system handlesinvalid data entries or blocks unautho-rized attempts to change or delete data.The OQ may be written or executed bya technical person other than the enduser, such as an information technology(IT) person or an engineer.
The OQ is not to be confused withthe more detailed unit testing performedby hardware and software engineers toprove every nuance of the systembefore it is sold. There may be morethan 2,000 unit tests, whereas the OQmay have only 50 tests to demonstratethe bulk of functionality the end userswill employ. Also, unit testing is con-ducted prior to release of the system orsoftware for sale to customers. OQ test-ing is performed at the end-user’s site,after the sale and before release to endusers. The OQ testing may be per-formed by an end user, an IT person, aquality assurance person, or a manufac-turer’s representative. Sometimes acombination of these individuals per-forms the testing.
The performance qualification (PQ)is a test plan or protocol that checks theend user’s intended usage to provideconfidence that the business processesare effective and reproducible. It isintended to test when things go right.The PQ may have some security teststhat were previously qualified in theOQ; however, the PQ is not as detailedas the OQ. Additionally, it is commonlyexecuted by an actual end user.
Over the years, the term “qualifica-tion” has been confused with, and usedinterchangeably with, the term “valida-tion.” There is a difference. A qualifica-tion is a single protocol to accuratelyassess the quality, reliability, and repro-ducibility of a system’s usage. The testplan’s execution must meet designatedacceptance criteria to “qualify.” A vali-dation is a final conclusion, based onthe successful qualifications, that a sys-tem meets the needs for the intendedusage. In the trenches, however, the
term qualification usually refers to thehardware’s performance, while the termvalidation is used for software perfor-mance. Rely on each business environ-ment’s context for guidance.
Before the validation can be complet-ed and the system released to the endusers, a support and maintenance infra-structure must be in place. Provision oftraining, user manuals, SOPs, contactinformation for technical support, databack-up procedures, and more comprisethe infrastructure. Critical to the infra-structure is change control.
Change control is the management ofall modifications to the hardware orsoftware after it has been qualified orvalidated. It provides assurance that thesame system environment can be repro-duced if necessary. The change controlprocedure should define what approvalsare needed and when they are needed.
A retirement or decommissioningplan should indicate how to archive rawdata for long-term storage and how toretrieve that data. Documentation shouldalso indicate how long the raw data willbe retained and determine a final dispo-sition for the data and its media.
A disaster recovery plan and a busi-ness continuity plan differ in theiremphasis. The former focuses on gettinga company back into business followinga catastrophic event. The latter focuseson keeping the company in operationthroughout a catastrophic event.
Finally, there is a formal summary ofthe validation. This brief statement indi-cates that the validation master planwas carried out. If there were deviationsor problems, it states why they occurredand how they were handled. This state-ment is the final conclusion that thecomponent or multicomponent systemis “validated.” With this conclusion, anend-user company may release themechanism for usage.
The FDA does not require specifictitles for the various documents, and itpermits some documents to be com-bined into one project document. Forexample, the final system descriptionmay be detailed in the IQ; and the OQand PQ may be combined into one testplan called an OQ/PQ.
A system validation can take a fewdays, weeks, or months, depending onthe system’s complexity, intendedusage, and available resources. Amulticomponent data acquisition sys-tem that connects to animals mayrequire three months, whereas a sin-gle high-performance liquid chro-matograph (HPLC) may require lessthan a week. However, both systemswill have gone through the same sys-tem validation process.
Impact on EngineersThe services most often being soughtfrom vendors, manufacturers, and con-tractors are the creation and/or execu-tion of the IQ, OQ, and PQ. Somehardware and software engineers arealready engaged in these system valida-tion or CSV services because the engi-neers either know the system or canlearn it quickly. An engineer can writeand/or execute these documents moreeasily for end-user companies than acontracted technical writer who has noknowledge of instrumentation or a bio-medical environment.
The validation process requirespatience and a lot of documentation, yetit can be a very satisfying experience.Currently, it is very difficult to find abook that discusses the entire systemvalidation process, but help is on thehorizon. The Drug InformationAssociation (DIA) based in Horsham,Pennsylvania, organized and hosted anupdate of the original Red AppleConference–the Red Apple IIConference. In 1987, the Office ofRegulatory Affairs of the FDA, theNational Center for ToxicologicalResearch (NCTR), and the NCTRAssociated Universities, Inc. conducteda conference at the Red AppleConference Center in Heber Springs,Arkansas, on quality assurance of com-puterized systems used in nonclinicalsafety assessment. The Red AppleConference, as it became known, was amilestone event in establishing bestpractices in the design and validation of
(continued on page 101)
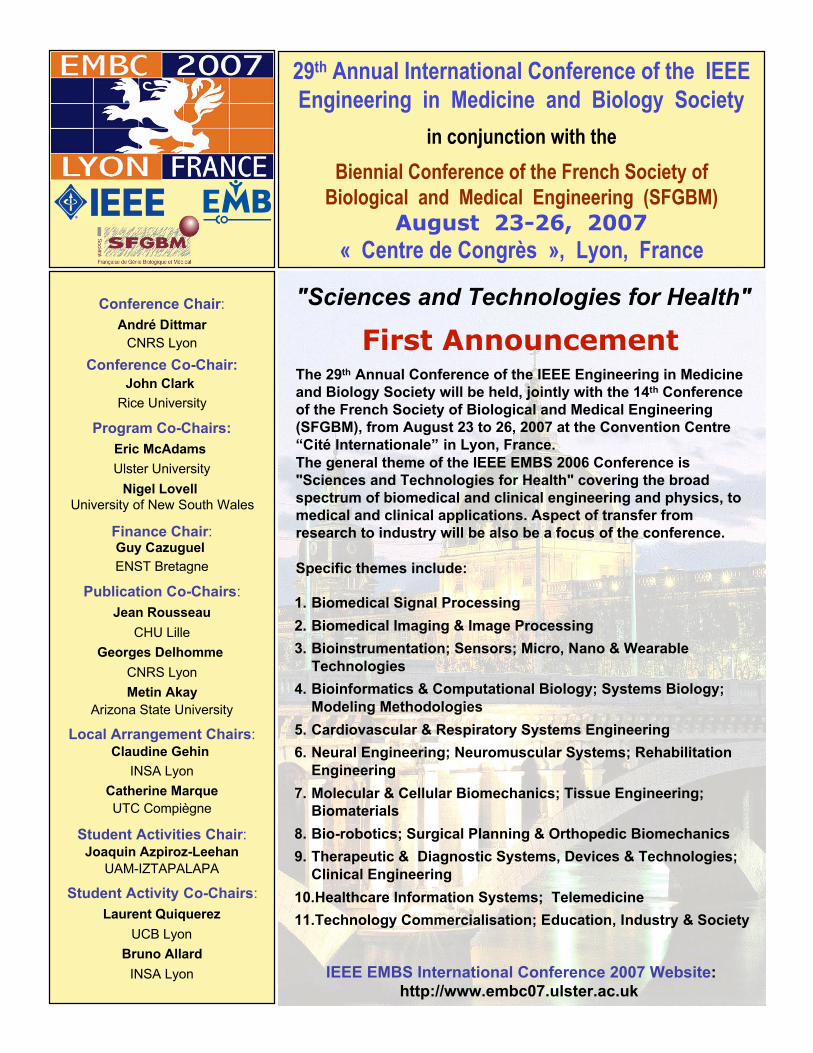
Conference Chair:
André Dittmar
CNRS Lyon
Conference Co-Chair:
John Clark
Rice University
Program Co-Chairs:
Eric McAdams
Ulster University
Nigel Lovell
University of New South Wales
Finance Chair:Guy Cazuguel
ENST Bretagne
Publication Co-Chairs:
Jean Rousseau
CHU Lille
Georges Delhomme
CNRS Lyon
Metin Akay
Arizona State University
Local Arrangement Chairs:Claudine Gehin
INSA Lyon
Catherine Marque
UTC Compiègne
Student Activities Chair:Joaquin Azpiroz-Leehan
UAM-IZTAPALAPA
Student Activity Co-Chairs:
Laurent Quiquerez
UCB Lyon
Bruno Allard
INSA Lyon
First Announcement
"Sciences and Technologies for Health"
IEEE EMBS International Conference 2007 Website:
http://www.embc07.ulster.ac.uk
The 29th Annual Conference of the IEEE Engineering in Medicine
and Biology Society will be held, jointly with the 14th Conference
of the French Society of Biological and Medical Engineering
(SFGBM), from August 23 to 26, 2007 at the Convention Centre
“Cité Internationale” in Lyon, France.
The general theme of the IEEE EMBS 2006 Conference is
"Sciences and Technologies for Health" covering the broad
spectrum of biomedical and clinical engineering and physics, to
medical and clinical applications. Aspect of transfer from
research to industry will be also be a focus of the conference.
Specific themes include:
1. Biomedical Signal Processing
2. Biomedical Imaging & Image Processing
3. Bioinstrumentation; Sensors; Micro, Nano & Wearable
Technologies
4. Bioinformatics & Computational Biology; Systems Biology;
Modeling Methodologies
5. Cardiovascular & Respiratory Systems Engineering
6. Neural Engineering; Neuromuscular Systems; Rehabilitation
Engineering
7. Molecular & Cellular Biomechanics; Tissue Engineering;
Biomaterials
8. Bio-robotics; Surgical Planning & Orthopedic Biomechanics
9. Therapeutic & Diagnostic Systems, Devices & Technologies;
Clinical Engineering
10.Healthcare Information Systems; Telemedicine
11.Technology Commercialisation; Education, Industry & Society
29th Annual International Conference of the IEEE
Engineering in Medicine and Biology Society
in conjunction with the
Biennial Conference of the French Society of
Biological and Medical Engineering (SFGBM)
August 23-26, 2007
« Centre de Congrès », Lyon, France
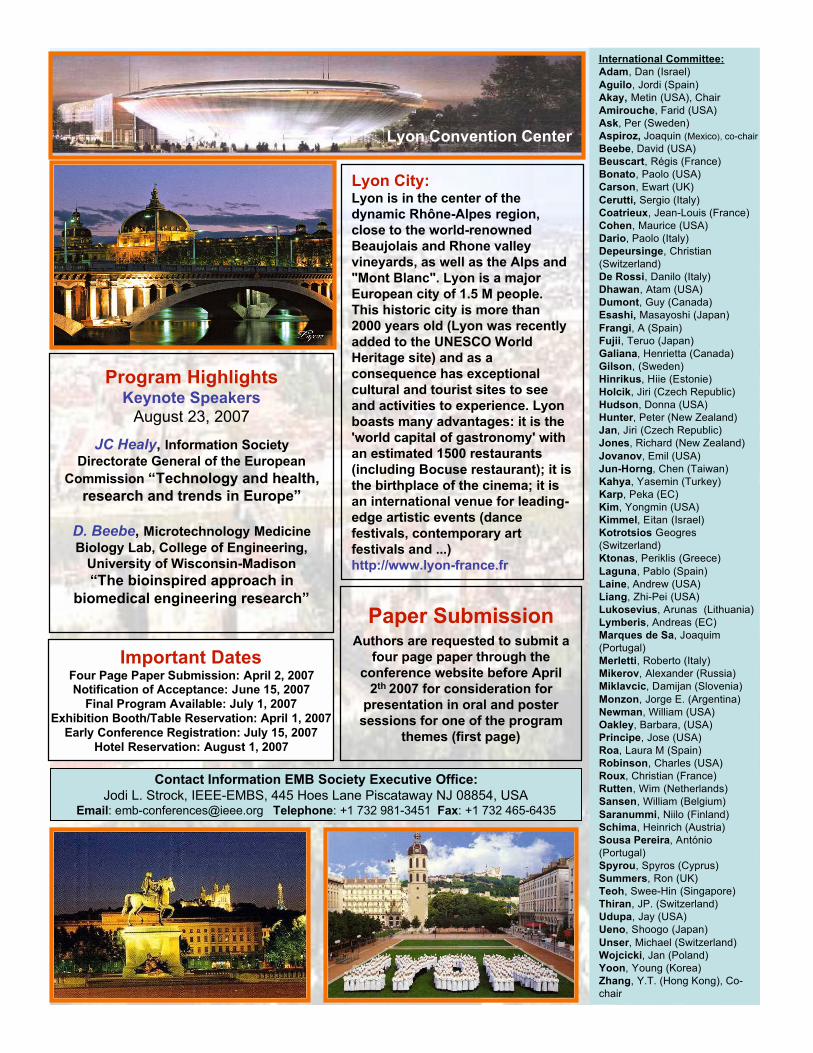
Lyon City:Lyon is in the center of the
dynamic Rhône-Alpes region,
close to the world-renowned
Beaujolais and Rhone valley
vineyards, as well as the Alps and
"Mont Blanc". Lyon is a major
European city of 1.5 M people.
This historic city is more than
2000 years old (Lyon was recently
added to the UNESCO World
Heritage site) and as a
consequence has exceptional
cultural and tourist sites to see
and activities to experience. Lyon
boasts many advantages: it is the
'world capital of gastronomy' with
an estimated 1500 restaurants
(including Bocuse restaurant); it is
the birthplace of the cinema; it is
an international venue for leading-
edge artistic events (dance
festivals, contemporary art
festivals and ...)
http://www.lyon-france.fr
Important DatesFour Page Paper Submission: April 2, 2007Notification of Acceptance: June 15, 2007
Final Program Available: July 1, 2007
Exhibition Booth/Table Reservation: April 1, 2007
Early Conference Registration: July 15, 2007
Hotel Reservation: August 1, 2007
Paper SubmissionAuthors are requested to submit a
four page paper through the
conference website before April
2th 2007 for consideration for
presentation in oral and poster
sessions for one of the program
themes (first page)
Lyon Convention Center
Contact Information EMB Society Executive Office:
Jodi L. Strock, IEEE-EMBS, 445 Hoes Lane Piscataway NJ 08854, USAEmail: [email protected] Telephone: +1 732 981-3451 Fax: +1 732 465-6435
International Committee:
Adam, Dan (Israel)
Aguilo, Jordi (Spain)
Akay, Metin (USA), Chair
Amirouche, Farid (USA)
Ask, Per (Sweden)
Aspiroz, Joaquin (Mexico), co-chair
Beebe, David (USA)
Beuscart, Régis (France)
Bonato, Paolo (USA)
Carson, Ewart (UK)
Cerutti, Sergio (Italy)
Coatrieux, Jean-Louis (France)
Cohen, Maurice (USA)
Dario, Paolo (Italy)
Depeursinge, Christian
(Switzerland)
De Rossi, Danilo (Italy)
Dhawan, Atam (USA)
Dumont, Guy (Canada)
Esashi, Masayoshi (Japan)
Frangi, A (Spain)
Fujii, Teruo (Japan)
Galiana, Henrietta (Canada)
Gilson, (Sweden)
Hinrikus, Hiie (Estonie)
Holcik, Jiri (Czech Republic)
Hudson, Donna (USA)
Hunter, Peter (New Zealand)
Jan, Jiri (Czech Republic)
Jones, Richard (New Zealand)
Jovanov, Emil (USA)
Jun-Horng, Chen (Taiwan)
Kahya, Yasemin (Turkey)
Karp, Peka (EC)
Kim, Yongmin (USA)
Kimmel, Eitan (Israel)
Kotrotsios Geogres
(Switzerland)
Ktonas, Periklis (Greece)
Laguna, Pablo (Spain)
Laine, Andrew (USA)
Liang, Zhi-Pei (USA)
Lukosevius, Arunas (Lithuania)
Lymberis, Andreas (EC)
Marques de Sa, Joaquim
(Portugal)
Merletti, Roberto (Italy)
Mikerov, Alexander (Russia)
Miklavcic, Damijan (Slovenia)
Monzon, Jorge E. (Argentina)
Newman, William (USA)
Oakley, Barbara, (USA)
Principe, Jose (USA)
Roa, Laura M (Spain)
Robinson, Charles (USA)
Roux, Christian (France)
Rutten, Wim (Netherlands)
Sansen, William (Belgium)
Saranummi, Niilo (Finland)
Schima, Heinrich (Austria)
Sousa Pereira, António
(Portugal)
Spyrou, Spyros (Cyprus)
Summers, Ron (UK)
Teoh, Swee-Hin (Singapore)
Thiran, JP. (Switzerland)
Udupa, Jay (USA)
Ueno, Shoogo (Japan)
Unser, Michael (Switzerland)
Wojcicki, Jan (Poland)
Yoon, Young (Korea)
Zhang, Y.T. (Hong Kong), Co-
chair
Program HighlightsKeynote Speakers
August 23, 2007
JC Healy, Information Society
Directorate General of the European
Commission “Technology and health,
research and trends in Europe”
D. Beebe, Microtechnology Medicine
Biology Lab, College of Engineering,
University of Wisconsin-Madison
“The bioinspired approach in
biomedical engineering research”

Conference Committee
Metin Akay, Chair
Dominique Durand
Haluk Ogmen
Holly Jimison
Jose Principe
Paolo Bonato
The 3rd International IEEE EMBS Conference on Neural
Engineering will be held in in Kohala Coast, Kona, Hawaii from
2 May through 5 May, 2007. The objective of this conference was
to highlight the emerging field, Neural Engineering that unites
engineering, physics, chemistry, mathematics, and computer
science with molecular, cellular, cognitive and behavioral
neuroscience and encompasses such areas as replacing or
restoring lost sensory and motor abilities, defining the organizing
principles and underlying mechanisms of neural systems,
neurorobotics, neuroelectronics, brain imaging and mapping,
cognitive science and neuroscience.
Contributions are invited in the following areas:
1. Imaging and Mapping the Brain (Functional, Molecular and Cellular)
2. Brain-Computer Interface 3. Neural Signal Processing and Modeling 4. Neuro-Nanotechnology 5. Neural Prostheses 6. Neuro-Robotics 7. Cognitive Engineering and Science 8. Neural Informatics 9. Others
Important Dates
Online Paper Submission Opens: 1 November 2006 Paper Submission Deadline: 29 Jan 2007 Notification of Acceptance: 23 Feb 2007 Early Registration Deadline: 5 Mar 2007 Hotel Reservation Deadline: 26 Mar 2007
If you are interested in joining us, and have any questions about the Neural Engineering
Conference or registration, please visit our web page or contact Ms. Jodi L. Strock at
http://www.fulton.asu.edu/~ne2007
IEEE ENGINEERING IN MEDICINE AND BIOLOGY MAGAZINE JANUARY/FEBRUARY 2007 97
Measurement and Data Analysisfor Engineering and Science (05Edition)Patrick F. Dunn, McGraw-Hill HigherEducation, 2004, ISBN: 0072825383,540 pages, US$152.
One of ABET’s requirements for bio-medical engineering programs is thatstudents know how to make measure-ments on living systems. Indeed, manyBME departments are teaching a coursewith a title like “Medical Measure-ments.” However, many of these cours-es are taught with books that don’tfocus on measurements, but rather oninstruments, where instrumentationbooks tend to teach students how spe-cific medical instruments work, not thegeneral theory of making measurementson living systems.
However, it is not just BiomedicalEngineering that lacks a selection oftextbooks aimed at measurement theo-ry. Dr Patrick Dunn’s new bookMeasurement and Data Analysis forEngineering and Science, published byMcGraw Hill in 2005, attempts to fill asimilar gap in mechanical engineering.While not ideal for all biomedical engi-neering measurement courses, with sup-plementation, Dunn’s book is a viablealternative for some.
Dunn’s book is probably best used byjunior undergraduates, or perhapsseniors. It has many excellent featuresthat distinguish it from its peers. It iswell written with clear and stated learn-ing objectives for each chapter.
The author is clearly aware that notall students approach measurement the-ory with innate enthusiasm. As such,the chapters contain motivating diver-sions. Each chapter contains a cross-word puzzle review of the materialcovered in that section. Also, eachchapter opens with a historical vignette.For example, chapter one opens with apicture of Leeuwenhoek’s microscope
and an interesting three paragraphs onthe history of the device, the way thedevice worked, and why the measure-ments it made mattered.
The first two chapters of the book(introduction to experiments, units, andsignificant figures) cover topics that areoften overlooked in engineering educa-tion. Even measurement textbooksoften fail to cover these important top-ics. Many faculty teaching measure-ment theory from an instrumentationtextbook are forced to supplement thetext to teach these topics.
The third chapter, on technical com-munication, is also an important topic.However, it is often covered elsewherein the BME curriculum. Also, the chap-ter is too brief to be helpful, if this is theonly exposure to the topic an engineergets. For example, little more than onepage is given to proper grammar andpunctuation. Just a bit more is given topower point presentations. It is unlikelythat a high school education devoid ofgrammar training can be undone withthis brief treatment.
Chapter four would be appropriatefor those BME curricula that do not
require a circuits class as a prerequisiteto measurements. However, it is verychallenging to cover in one chapterwhat many departments cover in onesemester. Yet, Dunn does an admirablejob. Dunn attempts to start wherephysics stops and continue up to thetransistor. This is a large territory tocover, and will certainly leave somefaculty unsatisfied. For example, incovering such a broad base, nomencla-ture becomes a problem: First �� isused for voltage, then V and then later,E. Nevertheless, when faced with teach-ing measurements without circuits, thischapter does expose the student to therequired basics.
The chapter on calibration and sys-tems comes next. With a good numberof examples and a solid section on sys-tems, this chapter is typical of measure-ment texts.
Chapter six begins to dramatically dif-ferentiate this book from a traditionalbook on instrumentation for biomedicalengineers. Absent is a long list of sensorsand their physical principals. Rather,Dunn elects to present a few select sen-sors. This is certainly in keeping with thefocus of the book—measurements—butmay leave some faculty having to sup-plement with their favorite sensor.Rather than focusing on sensors, thischapter adds concepts typically taught incircuits: passive and active analog filters.
Unfortunately, chapter six ends witha section on digital filters and analog-to-digital conversion. This topic doesnot play a role in the immediately fol-lowing chapters and is quite differentfrom the analog material. It would bemore common to cover these two topicswhen digital signals are treated near theend of the book.
Chapters 7, 8, 9, and 10 deal with sta-tistics and probability. These topicspose a difficult problem for a measure-ments textbook. On the one hand, they
Paul H. King
Book Reviews
The author is clearly
aware that not all
students approach
measurement theory
with innate enthusiasm.
As such, the chapters
contain motivating
diversions.
98 IEEE ENGINEERING IN MEDICINE AND BIOLOGY MAGAZINE JANUARY/FEBRUARY 2007
Book Reviews (continued)
are critically important to understandingmeasurements. On the other hand,many schools require a statistics coursein their curriculum. However, if the sta-tistics course is not a prerequisite forthe measurements course, it does littlegood for the student in this context.Dunn has decided to cover the materialin depth in his book. The advantage ofthis approach is that the critical materialis at the students’ fingertips, with a con-sistent nomenclature. If the instructorchooses, he can cover this section, skipthis section, or assign it as a reading(though it is a large fraction of the bookto assign for self-study).
The chapters on statistics andprobability cover all the basics, includ-ing probability, probability density,hypothesis testing, experimental design,uncertainty analysis, regression and cor-relation. Including the sections onexperimental design and regression isunique to most measurement books.These sections are well written, butbrief, perhaps making them a challengefor students with no other statistics intheir curriculum. For those curriculawhere statistics is a pre-requisite for themeasurements course, most faculty willelect to skip these chapters. However,as these four chapters make up close tohalf of the book, this decision mayeliminate this book from consideration.
Chapter eleven moves on to the fre-quency domain. Again, some curricularequire a transforms class as a pre-req-uisite to measurements. In that case,this chapter would also be skipped.Unfortunately, for biomedical engi-neering, this chapter is probably toobrief to be useful. For example, theconcept of phase is not treated in depthin this chapter. However, phase is socritical to the operation of the ear andeye, for example, that it is often morestrongly emphasized in a biomedicalengineering curriculum.
The final chapter of this book coversdigital signal processing. Though it isnot traditional to include time-domainprocessing in an introductory measure-ments class, now that data analysis toolssuch as MATLAB and LabView havebecome more powerful and more com-
mon, more and more biomedical engi-neering signals are treated solely, orlargely, in the time-domain. Hearingaids, for example, have largely movedaway from analog processing towarddigital processing. While the treatmentof the topic might be too light for someinstructors, the material that is present-ed is clear and easily understood. Thismaterial, along with the MATLABexercises throughout, would form a rea-sonable foundation for a biomedicalengineer in digital signal processing.
The MATLAB exercises form morethan just a set of simulations to helpteach the material in this text. MAT-LAB programming fundamentals aretaught. Using this text, students canstart with no MATLAB or program-ming background and leave this coursewith the rudiments in hand.
Among the appendices of this book isa companion lab manual. Dunn hasrealized that coordinating the laboratorycan be more time consuming thanteaching the course! Therefore, it is awelcome addition to see a well struc-tured laboratory sequence included withthis text. The labs cover the basics ofhow to operate the bench-top instru-ments as well as more advanced topicslike building small measurement sys-tems. Many, though not all, of the labscould be easily adapted to biomedicalengineering students. However, in orderto take full advantage of the lab manual,departments would have to purchaseexactly the same equipment (not just anoscilloscope, but a PM3380-A scope).
The Web site promises to be well-populated with homework problems,solutions manuals, MATLAB files andWebCT files (for those using thatcourseware).
Overall, instructors selecting thisbook will be disappointed if they areexpecting a traditional instrumentationtext. For example, the circuits and sen-sors portion of the text is just a fractionof the size of the section on probabilityand statistics. However, if the focus ofthe class is to be measurements, thisbook does an excellent job of taking astudent from basic physics up to signalprocessing. Like many books, the lack
of biomedical engineering examplesmeans that an instructor will have tosupplement the text throughout. Despitethese limitations, Dunn’s new text is awelcome addition to the possibilities forbiomedical measurements classes.
—Robert Malkin Duke University
Review of Biomedical Signal and Image ProcessingKayvan Najarian and Robert SplinterCRC/Taylor & Francis, Boca Raton,2006 ISBN 0824748034, US$99.95,448 pages.
This book presents wide variety oftopics pertaining to biomedical signaland image processing. It is a very read-able presentation at the introductorylevel. Each topic is presented with a bal-ance of introductory mathematics, exam-ples executed in MATLAB, andMATLAB based exercises. The exercis-es are detailed and lead the reader toappreciate the various steps in the phe-nomena or application being studied.The mathematics does not “get-in-the-way.” The level is meant for the noviceand one can get a good first understand-ing and a preparation for further study.In addition there is a wealth of introduc-tory information in the discussion sec-tions of each chapter. One can downloadall of the book’s figures, and script anddata used in the examples from the pub-lisher’s Web site. If one is interested insignal and image processing as a concen-tration, one could use this book as anintroduction for several different courses.
The book is divided into three sec-tions and contains 17 chapters. Becauseso many topics are briefly presented, itis easier to summarize each chapter’scontents. Section I contains sevenchapters and is designed to be a simpleconceptual introduction to signal andimage processing.➤ Many terms describing signals and
images are defined.➤ Makes an overview of Fourier
transforms (FT) and system transferfunctions, 2D FT, and filter proper-ties in frequency domain.
➤ Presents various techniques forimage enhancement such as
IEEE ENGINEERING IN MEDICINE AND BIOLOGY MAGAZINE JANUARY/FEBRUARY 2007 99
histogram equalization and thenmasking techniques, smoothing, andnoise filtering.➤ Defines a potpourri of edge detection
techniques and then discusses imagesegmentation using line detectionand luminance thresholding.
➤ Uses nonstationary signals as a ratio-nale for needing wavelets and pro-vides a cursory definition of 1 and 2D wavelets using MATLAB tools.
➤ Presents a variety of definitions butconcentrates on stochastic signalsStationarity, auto- and cross-corre-lation functions, and power spectraare defined. Interestingly, entropy andHuffman coding are also defined.
➤ Defines clusters and clustering andreviews the K-means algorithm.Then widely used classificationtechniques, such as Bayes and max-imum likelihood, and perceptronare defined.
➤ Section II deals with basics and pro-cessing of biomedical signals; itcontains five chapters.
➤ Ion transport is reviewed as a mech-anism for generating action poten-tials. Then the Hodgkin-Huxleyequations and wave propagation arepresented.
➤ A good summary of the mechanicalfunction of the heart and its con-comitant/causal electrical activity ispresented. Electrode placement formeasuring electrocardiogram (ECG)and typical normal ECG sets thestage for understanding the variouscardiac abnormalities and theirpathologic ECG patterns.
➤ A schematic of the brain and thegeneration of the electroencephalo-gram (EEG) are discussed. Themontage for measuring the EEG isshown and the various waves andtheir significance are discussed.This is followed by various braindysfunctions and how they are rep-resented in the EEG and evokedpotentials. The chapter ends with adiscussion of coherence.
The structure of skeletal muscle ispresented and then force generation inmuscles as a consequence of ionicactivity is summarized. The excitation
contraction coupling leads to the defin-ition of intramuscular and extramuscu-lar electromyograms (EMG). Thenneuromuscular pathologies and howthey affect the EMG is discussed. (Thechapters on ECG, EMG, and EEG endwith brief summaries of analysisapproaches in the time, frequency, andwavelet domains).
Several of other biomedical signals,such as blood pressure, are described.
Section III deals with the processingof biomedical images; it contains sixchapters.
This chapter contains a mathematicaltreatment of computed tomography.Source-attenuation relationships andprojection functions using parallelbeams are described.
The next several chapters, except16, present specific imaging modali-ties, starting with X-ray imaging andthe importance of dosage. Attenuationis mathematically defined and howvarious tissues attenuate energy isshown. Finally the various detectionmedia and their sensitivity to anatomicstructures are discussed. A similarapproach is used to present MRI andfMRI. Special emphasis is given tofMRI and the capability for imagingtime-varying cortical activity.
Ultrasound imaging is overviewed,including the mathematics of soundgeneration, attenuation, reflection, anddetection. The mathematics of themodalities for attenuation, time-of-flight, and reflection are presented sepa-rately. The challenges of artifacts,image reconstruction, and registrationare briefly discussed.
—Richard ShiaviVanderbilt University
Science and Technology inMedicine, An Illustrated AccountBased on Ninety-Nine LandmarkPublications From Five Centuries,by Andras GedeonSpringer Press, 2006, ISBN 0-387-27874-5, vii + 551 pages, US$89.95
This is a coffee table and teaching textthat covers some 99 well-selected scien-tific and technical discoveries over the
past five centuries that have had a signif-icant impact on the practice of medicine.The text has over 1,130 illustrations.Each chapter begins with a short biogra-phy of the inventors or discoverers of thetechnology (such as Michael Phelps), adescription of the technology (such as“Application of Annihilation Coin-cidence Detection to Transaxial Recon-struction Tomography,”) a perspective ofthe field, and a brief discussion of majormodifications since the inception of thetechnology. The topics are wide-ranging,and include the discovery of ether, theDoppler Effect, invention of the ophthal-moscope, antiseptic surgery, the modernECG recorder, etc. The chapters are wellreferenced and very well illustrated, theoriginal text or cover sheets of many arti-cles are to be found in many of the chap-ters (in their original language.) The textas a whole is a pleasure to read. Oncestarted, it is difficult to put down.
As a coffee table text, this bookbelongs in the waiting room of everyBME department chairman’s office! It isa motivator for anyone thinking about theinteraction of technology, engineering,and medicine. It is appropriate for manyother offices such as medical physics andhistory of medicine departments.
A great deal of effort has gone intothe generation of this text. I wish onlythat there were an accompanying CDwith all the illustrations on it (at least)such that one could pick and chooseillustrations for teaching purposes!
—Paul H. KingVanderbilt University
Wiley Encyclopedia of BiomedicalEngineering, Edited by Metin AkayWiley Interscience Press, 2006, ISBN0-471-24967-X, 4,037 pages. US$1,950.
Wiley, after publishing the six vol-ume Encyclopedia of Medical Devicesand Instrumentation by Webster, hasdone it again with the publication of thesix volume Encyclopedia of BiomedicalEngineering! In 3,881 pages, 350 arti-cles describe from accelerometer toxenotransplantation various engineeringtopics relevant to biomedical engineer-ing and the educational pursuit thereof.
100 IEEE ENGINEERING IN MEDICINE AND BIOLOGY MAGAZINE JANUARY/FEBRUARY 2007
Book Reviews (continued)
There are so many topical articles thatthe index alone adds 156 pages! Thereare over 2,000 figures, tables, and illus-trations. The authors of the articles arebased worldwide. This is not a UnitedStates centric publication.
Generally speaking, the articles arepresented at an advanced undergraduatelevel, with some material at the graduatelevel. The coverage of material is quitebroad, though I expect that, given thediversity of our efforts, every profession-al will find some minor material lacking.I was disappointed to find little coverageof the design process per se, and botheredthat the one article on education com-pletely ignored it as a mandatory course.I was surprised that ISO 9000 was not tobe found, among other standards.
Most articles are well written andillustrated, though colored illustrationsand plates are once again missing. Mostarticles are fairly comprehensive, with afairly generic layout. Some articles havea section on the future of the device orprocess, a valuable addition. Most arti-cles have a good bibliography, some areexceptional. Some of the articles have asuggested reading list, for some this islargely a Web site listing, with its asso-ciated lifespan issues. The text could use(as per Webster’s Encyclopedia) a “seealso” section at the end of each article.Furthermore, each volume could use apages xx-xy listing on the spine. It isirritating to go from the index to eachvolume in turn to find a given page.
Wiley, as they have for Webster’stext above, also has generated a Website for the material covered in this text(see www.interscience.wiley.com/mrw/akay). This material will be updat-ed on a periodic basis. This service maybe done on an annual subscription or ona one-time basis. Browsing apparentlymay be done on many of the articles,the coverage is not spelled out.
Dr. Akay deserves a commendationfor the effort he has put into this ency-clopedia. It is a monumental work andis a contribution to the definition andmaturation of our profession.
—Paul H. KingVanderbilt University
Review for Medicine by Design;The Practice and Promise ofBiomedical Engineering:Fen Montaigne The Johns HopkinsUniversity Press; Baltimore, MD
In his book, Medicine by Design,author Fen Montaigne takes us on ajourney across the field of biomedicalengineering. This journey brings usinto American universities whereresearchers are applying biomedicalengineering solutions to medicalproblems and students are trained tobecome the new generation ofresearchers, but also into privatecompanies and hospitals letting ussee the personal stories of patientswhose lives were saved because ofbiomedical engineering advance-ments. The book presents this fieldwhere medicine and engineeringinterface, and provides us with a his-tory of the field, an overview ofapplications ranging from commonpacemakers to artificial hearts, nan-otechnology, and genetics.
The strength of this book is that itpresents stories of both people whohave devoted their lives to applyingengineering tools and methods to tack-le the greatest clinical challenges ofour time as well as people who havegreatly benefited from biomedicalengineering applications and devices.In the first group, the author includesnot only accomplished researchers butalso undergraduate and graduate stu-dents. Their profiles highlight theirbackground, their discovery of thefield and their dedication. The authortakes a class of students in BostonUniversity’s biomedical engineeringdepartment and presents the stories ofsome of the students of that cohort toshowcase the diversity of their profes-sional and personal backgrounds.These profiles allow us to explore thepopularity of the field and its ability,according to the author, to attract largenumbers of female students into engi-neering, a domain traditionally attract-ing primarily male students. Theauthor describes a course at that insti-tution aiming to instruct seniors onhow to handle their senior project and
prepare for their professional lives inthe real world. This example providesinsight into the minds and ambitionsof future researchers and developersand the dedication of their mentors. Atthe other end of the spectrum, we findinterviews with or narratives aboutestablished scientists who have sys-tematically explored and advanced thefield over the years, like Ali Rezai atthe Cleveland Clinic, one of thenation’s leading practitioners of brainpacing for Parkinson’s disease orRalph deVere White, the director ofthe University of California, Davis,Cancer Center that is investigatingways of imaging and treating tumorswith highly targeted molecular agents.The author manages to point out thebenefit of a diverse set of devices anddiscoveries focusing not on clinicaltrials or statistical description of out-comes but rather personal accounts ofindividuals who have benefited fromthe advances in biomedical engineer-ing, such as the first quadriplegicpatient to receive a network ofimplanted electrodes in his arms or apatient with ventricular fibrillationthat requires him to receive animplantable defibrillator. These casesincorporate the patient’s perspectiveand demonstrate how specific applica-tions saved people’s lives.
The book starts with a chapter onthe field and a brief history of its for-mation. The second chapter describesthe new generation of biomedicalengineers, namely undergraduate andgraduate students who are devoted tothis field and aspired to solve med-ical problems. The next few chaptersfocus on specific body parts or clini-cal conditions as application domainsfor biomedical engineering (startingwith cardiovascular condit ions,spinal cord injuries and focusing onthe brain in Chapters 6 and 7) .Chapter 8 is titled “The da Vinci”and focuses on a robotic surgical sys-tem. The focus of surgery is furtherexplored in the next chapter with areview of “haptics” advancements.Chapter 10 focuses on musculoskele-tal research, whereas Chapters 11

IEEE ENGINEERING IN MEDICINE AND BIOLOGY MAGAZINE JANUARY/FEBRUARY 2007 101
Book Reviews (continued)
and 12 describe medical imagingprinciples and applications. Chapters13 and 14 describe two companies(Medtronic and Neurotech) and pro-vide insight into the business modeland plans of the private sector. Theremaining chapters provide anoverview of tissue engineering andthe future of the field, which theauthor describes as an effort tounderstand genes and explore thegenome and protein production, andan advancement of nanotechnology.
The book is well written and eventhough there are many names andexamples included of researchers, stu-dents, health care providers, and insti-tutions, it is easy to follow all thestories. The author visited severalsites throughout the country and inter-
viewed many researchers, studentsand patients and is to be commendedfor his thorough investigation.Perhaps one could argue that the solefocus on US-based academic researchand training institutions does notaccurately capture all trends anddevelopments of the field of biomed-ical engineering as it excludes cuttingedge research in other countries.
The chapters provide an overviewof the field of biomedical engineer-ing for a lay audience and as such thebook does not provide an in depthdiscussion of principles or technicalbackground behind the applicationsnor does it require any prior back-ground in engineering or knowledgeof the field. While this book wouldnot be the right choice as a textbook
of an undergraduate or graduatecourse in biomedical engineering dueto its superficial coverage of materialcustomized for a broader audience, itis an excellent resource for peoplewho want to learn more about thefield in general, but also for studentsin medicine, nursing and other healthprofessions who need an overview ofways with which technology is revolu-tionizing health care delivery. The com-pelling stories of pioneering engineers,patients and health care providers inthis book have the potential to recruitstudents into the field and inspire futureresearchers, and to increase the public’sknowledge and appreciation of biomed-ical engineering.
—George Demiris University of Washington
computerized systems in nonclinicallaboratories. The outcome of the confer-ence was a reference published by theDIA, Computerized Data Systems forNonclinical Safety Assessment: CurrentConcepts and Quality Assurance, whichis used throughout the world [10].
For the Red Apple II Conference, aselect group of international participantsfrom industry, government, and acade-mia was selected to participate on thevarious committees of the conference.The participants represented therequired mixture of skills and a crosssection of pertinent organizational affil-iations. The international conference,which was held 22–24 March 2006, hadas its objective the creation of a singleupdated book with significant insightinto current system validation processesfor preclinical instruments. The publica-tion date has been scheduled for early2007. Validations performed in clinicalenvironments may refer to this book, asmany of the concepts and illustrationsare GxP. The book may be supplement-ed by research to cover the additional
clinical details required (e.g., data pro-tection, HIPAA) [10].
ConclusionsAs baby boomers age, the demand willincrease for more drugs and betterhealth care. In turn, the demand forinstrumentation, biomedical equipment,and medical devices will increase,along with the demand for qualifiedpeople to provide validation services.Due to the nature of validation, hard-ware and software engineers can suc-cessfully expand into the end-usercompany validation niche.
References[1] “Good laboratory practice for nonclinical labo-ratory studies,” U.S. Government Printing Office,Washington DC, 21 Code of Federal RegulationsPart 58, Apr. 1, 2005.[2] “Current good manufacturing practice in manu-facturing, processing, packing, or holding of drugs,”Government Printing Office, Washington DC, U.S. 21Code of Federal Regulations Part 210, Dec. 6, 2005.[3] “Current good manufacturing practice for fin-ished pharmaceuticals,” U.S. Government PrintingOffice, Washington DC, 21 Code of FederalRegulations Part 211, Dec. 6, 2005.[4] “General principles of software validation; Finalguidance for industry and FDA staff ,” U.S.
Department of Health and Human Services, Foodand Drug Administration, Center for Devices andRadiological Health, Center for Biologics Evaluationand Research, U.S. Government Printing Office,Washington DC, Jan. 11, 2002.[5] “Guidance for industry, Part 11, electronic records;electronic signatures—Scope and application,” U.S.Government Printing Office, Washington, DC, 21 Codeof Federal Regulations Part 11, Aug. 2003. [6] Stephen H. Kan, Metrics and Models in SoftwareQuality Engineering , 2nd ed. Reading, MA:Addison-Wesley, 2003.[7] “What is ISO 9001:2000?” BSI Management SystemsWeb site, July 14, 2006 [Online]. Available: http://www.bsiamericas.com/QualityGateway/index.xalter[8] J. Ketola and K. Roberts, ISO 9000 in a Nutshell,2nd ed. Chico, CA: Paton Press, 2001.[9] D. Hoyle, ISO 9000 Quality Systems Handbook,3rd ed. Woburn, MA: Butterworth-Heinemann, 1998.[10] E. Hulihan, private communication, July 17, 2006.[11] J. Chen, private communication, “Qualification ofLaboratory Instruments” seminar, New York, July 2003.[12] L. Milum, private communication, July 29, 2006.[13] R. Temple, private communication, August 1,2006. [14] L. Ouderback, private communication, August2, 2006. [15] “Guidance for industry, FDA reviewers andcompliance on off-the-shelf software use in medicaldevices,” U.S. Department of Health and HumanServices, Food and Drug Administration, Center forDevices and Radiological Health, Center forBiologics Evaluation and Research, U.S. GovernmentPrinting Office, Washington, DC, Sept. 9, 1999.[16] “Food and Drug Administration glossary”[Online]. Available: http://www.fda.gov/ora/inspect_ref/igs/gloss.html
Regulatory Affairs (continued from page 93)

102 IEEE ENGINEERING IN MEDICINE AND BIOLOGY MAGAZINE JANUARY/FEBRUARY 2007
Conference Calendar
17-20 JANUARY 2007Society for Technology in AnesthesiaAnnual MeetingRosen Plaza Hotel, Orlando, FloridaContact: Anne MaggiorePhone +1 216 447 7864Fax: +1 216 642 1127Web: http://www.anestech.org/meetings_staanual.htmE-mail: [email protected]
26-28 MARCH 2007IEEE International Conference on RFID 2007Aachen, GermanyContact: Dr. James E. Moore, Jr. Web: http://divisions.asme.org/bed/events/index/html
13-15 APRIL 2007
Rocky Mountain BioengineeringSymposiumDenver, ColoradoWeb: http://www.rmbs.org/
20–22 APRIL 2007
Fourth International Conference onEthical Issues In Biomedical Engineering Marriott New York at the Brooklyn BridgeContact: Subrata Saha Web: http://138.5.102.101/grad/bmephd/Ethics2007.pdfE-mail: [email protected]
2–5 MAY 20073rd IEEE EMBS Special TopicConference on Neural EngineeringKohala Coast, HawaiiContact: Prof. Metin AkayPhone: +1 603 646 2230Fax: +1 603 646 3856E-mail: [email protected]
20-24 JUNE 20072007 ASME Summer BioengineeringConferenceKeystone, ColoradoContact: Dr. James E. Moore, Jr.Web: http://divisions.asme.org/bed/events/index/html
24-27 JUNE 2007ASEE Annual Conference &ExpositionHonolulu, HawaiiWeb: http://asee.org
27-30 JUNE 2007CARS 2007-Computer AssistedRadiology and SurgeryBerlin, GermanyContact: Dagmar HarrisonPhone +49 7742 922 434Fax: +49 7742 922 438E-mail: [email protected]:http://www.cars-int.org
22–27 AUGUST 200729th Annual InternationalConference of the IEEE Engineeringin Medicine and Biology SocietyLyon, FranceContact: EMBS Executive OfficePhone: +1 732 981 3451Fax: +1 732 465 6435E-mail: [email protected]
21–24 AUGUST 2008
30th Annual International Conferenceof the IEEE Engineering in Medicineand Biology SocietyVancouver, Canada Contact: EMBS Executive OfficePhone: 732 981 3451Fax: 732 465 6435E-mail: [email protected]
3–6 SEPTEMBER 2009
31st Annual International Conferenceof the IEEE Engineering in Medicineand Biology SocietyMinneapolis, MinnesotaContact: EMBS Executive OfficePhone: +1 732 981 3451Fax: +1 732 465 6435E-mail: [email protected]
13–18 SEPTEMBER 2009World Congress on Medical Physicsand Biomedical Engineering 2009Munich, GermanyContact: Prof. Dr. Olaf DösselPhone: +49 (0)721 608 2650Fax: +49 (0)721 608 2789Web: http://www.wc2009.deE-mail: [email protected]

Call for Nominations 2007 IEEE EMBS Achievement and Service Awards
Submission Deadline: 1 APRIL 2007
Nominations are being sought for the following IEEE Engineering in Medicine and Biology Society Awards for the year 2007. Each award recipient will receive a plaque, a honorarium, and reimbursement in travel expenses associated with attending the EMBS Awards Presentation at the 29th Annual International Conference of the Society. This year’s conference will be in Lyon, France, 23 August – 26 August 2007 (http://www.embc07.ulster.ac.uk/). The IEEE EMBS Career Achievement Award (Honorarium $2,500 USD/Travel Reimbursement up to $1,500 USD) For outstanding contribution and achievement in the field of Biomedical Engineering as an educator, researcher,
developer, or administrator who has had a distinguished career of twenty years or more in the field of biomedical
engineering and a current member of EMBS. Accomplishments may be technological or theoretical and need not
have proceeded the award date by any specific period of time.
The IEEE EMBS Early Career Achievement Award (Honorarium $1,000 USD/Travel Reimbursement up to $1,500 USD) For significant contributions to the field of biomedical engineering as evidenced by innovative research design,
product development, patents, and/or publications made by an individual who is within 10 years of completing their
highest degree at the time of the nomination and a current member of EMBS.
The EMBS Service Award (Honorarium $1,000 USD/Travel Reimbursement up to $1,500 USD) For outstanding service and contributions to the Engineering in Medicine and Biology Society. Accomplishments
should be related to direct Society service and need not have preceded the award date by any specific period of
time and a current member of EMBS.
EMBS Outstanding Chapter Award (Honorarium $1000 USD/Travel Reimbursement of up to $1,000 USD) For Achievement in member development and delivering services to members of an EMBS chapter during the
previous calendar year.
EMBS Best New Chapter Award (Honorarium $500 USD/Travel Reimbursement of up to $1000) For outstanding activities performed by a new EMBS Chapter within the first 12 months of Chapter formation.
EMBS Outstanding Performance Award (OPA) for and EMBS Student Club or Chapter (Honorarium $500 USD/Travel Reimbursement up to $1000 USD) For Achievement in demonstrating outstanding performance in promoting student interest and involvement in
Biomedical Engineering .
EMBS Best New Student Chapter/Club Award (Honorarium $300 USD/Travel Reimbursement of up to $1000) For outstanding activities performed by a new EMBS Student Chapter/Club within the first 12 months of Chapter
formation.
Nomination Procedures A nomination packet consists of a two page nomination form, a current CV, and letters from three references with
their addresses, telephone, facsimile numbers and e-mail address included. It is the responsibility of the nominator to
contact the references and solicit letters of endorsement. The complete nomination packet, including reference
letters, must be received by 1 APRIL 2007 for the nominee to be considered in 2007. It is very desirable to submit
nominations well before the deadline. All nomination submissions should be completed online from the EMBS website
or by downloading the form in WORD document or in PDF Format and emailing to [email protected]. Nomination
Forms may be obtained from the EMBS Executive Office or at the EMBS website by selecting the Information tab then
the Awards link on the left.
Additional information and nomination forms are available at: http://www.embs.org.
? Questions ?
Please contact the EMB Executive Office ([email protected]), EMBS Member Recognition Chair, Metin Akay
([email protected]) or the Awards Chair, Z.P. Liang ([email protected])
J. Crayton Pruitt Family Chair in Biomedical Engineering
Eminent Scholar Professorship
––––––––––––––––––
The J. Crayton Pruitt Family Department of Biomedical Engineering in the College of Engineering at the University of Florida invites applications and
nominations for a new eminent scholar professorship starting as soon as Fall 2007. Candidates are expected to possess academic credentials sufficient to
meet requirements for a full professorship in Biomedical Engineering. Candidates should be leaders in their field capable of making a significant impact
through their research. Salary will be competitive and commensurate with qualifications of the candidate.
Candidates from all areas of biomedical engineering are invited to apply. Areas of particular interest include but not limited to biomedical imaging,
biomedical systems analysis, molecular and cellular engineering, biomaterials, and neuroengineering.
With a strong institutional commitment from the University of Florida to create graduate and undergraduate programs, we are building a department where
innovation, risk-taking, creativity, interdisciplinary research and collegiality are nurtured and encouraged.
Our proximity to and close ties with the Evelyn F. & William L. McKnight Brain Institute, the National High Magnetic Field Laboratory, the Particle
Engineering Research Center, the University of Florida Health Science Center, the VA Hospital, Shands HealthCare at the University of Florida, the
University of Florida Genetic Institute, the University of Florida Shands Cancer Center, the Halogen Therapy Center, the Nanoscience Institute for
Medical and Engineering Technology, the Howard Hughes Medical Institute and the Scripps Research Center will provide unparalleled opportunities for
cross-fertilization and collaborative research.
Review of applications will begin on January 8, 2007, and will continue until the position is filled. The University of Florida is an Equal Opportunity
Institution. Women and minorities are encouraged to apply. Candidates should send curriculum vitae with the names of at least four references to:
Dr. Huabei Jiang, Chair of Search Committee
J. Crayton Pruitt Family Department of Biomedical Engineering
University of Florida
130 BME Building/PO Box 116131
Gainesville, FL 32611-6131
Telephone: (352) 846-2950
Email: [email protected] Website: http://www.bme.ufl.edu
The Institute of Bioengineering at EPFL seekstenure track assistant professors in the broad fieldof Bioengineering. Bioengineering at EPFL iswell integrated between the School of Engineer-ing, Life Sciences and Basic Sciences. Appoint-ments within the School of Engineering aresought. The Institute enjoys close links to a clini-cal environment through collaboration with theCentre Hospitalier Universitaire Vaudois and theSchool of Biology and Medicine of the Univer-sity of Lausanne.
The open faculty positions are offered in an en-vironment of both theoretical and experimentalresearch, rich for both seeking deeper understan-ding of integrative (patho)physiological mecha-nisms and developing novel technologial andbiotherapeutic approaches at the levels of genes,biomolecules, cells and tissues.
The Institute seeks to grow at the interface ofengineering with experimental and theoreticalbiology. Areas including biological imaging,biological systems dynamics and computationalbiology, biological transport phenomena, bio-photonics, biosensing and biodiagnostics, func-tional genomics and proteomics, integrated sys-tems, lab-on-a-chip, man-machine interface, mo-lecular and cellular biomechanics, nanobiotech-nology, neural engineering, and prosthetics areparticularly invited. Facilities for research are
particularly strong, including in imaging, cyto-metry and micro/nanofabrication.
Successful candidates are expected to initiate in-dependent, creative research programs and par-ticipate in undergraduate and graduate teaching.We offer internationally competitive salaries,start-up resources and benefits.
Applications should include a resume with a listof publications, a concise statement of researchand teaching interests, and the names and ad-dresses (including e-mail) of at least five referees.
Applications should be uploaded (as PDFs) byMarch 15th, 2007 to http://biomed-rec.epfl.ch
Inquiries may be sent to :
Professor Jeffrey A. HubbellChair of the Search CommissionStation 15CH-1015 Lausanne, Switzerland
E-mail: [email protected]
For additional information on the EPFL and theInstitute of Bioengineering, please consult:
- http://www.epfl.ch,- http://sti.epfl.ch- http://sv.epfl.ch- http://ibi.epfl.ch.
The EPFL is an equal opportunity employer
Tenure Track AssistantProfessorships in Bioengineering
at Ecole Polytechnique Fédérale de Lausanne (EPFL)
CLASSIFIED EMPLOYMENTTo conform to the Age Discrimination inEmployment Act, and to discourage age dis-crimination, IEEE may reject any advertise-ment containing any of these phrases, orsimilar ones: “recent college grad,” “1-4years maximum experience,” “up to 5 yearsexperience,” or “10 years maximum experi-ence.” IEEE reserves the right to append toany advertisement, without specific notices tothe advertiser, “Experience ranges are sug-gested minimum requirements, not maxi-mums.” IEEE assumes that, since advertisershave been notified of this policy in advance,they agree that any experience requirements,whether stated as ranges or otherwise, will beconstrued by the reader as minimum require-ments only. While IEEE does not ban the useof the term “entry level” its use is discour-aged since, to some, it connotes an age ratherthan experience designation.
To place an ad in the IEEE Engineeringin Medicine and Biology MagazineEmployment Opportunities section, call:
Susan E. SchneidermanBusiness Development Manager
+1 732 562 3946
IEEE ENGINEERING IN MEDICINEAND BIOLOGY MAGAZINE

Senior Scientist/Faculty Position in Image-Guided and Information-intensive
Interventional Medicine The Johns Hopkins University’s Whiting School of Engineering and
Department of Radiology are seeking a senior researcher to fill a leadership role in multidisciplinary transitional research in image-guided and information-intensive interventional medicine. The goal of this effort is development of systems that combine innovative algorithms, robotic devices, imaging systems and image analysis methods, sensors, and human-machine interfaces to work cooperatively with physicians in the planning and execution of surgery and other interventional procedures. This position is being created as part of a larger Johns Hopkins University initiative directed toward Integration of Imaging, Intervention, and Informatics in Medicine (I
4M).
Specific responsibilities include:
• Define and lead systems-oriented, multi-disciplinary research projects combining novel technology and imaging systems and methods with clinical applications.
• Collaborate closely with engineering faculty, staff engineers, and clinical faculty in the conduct of research.
• Provide leadership in research projects as a principal investigator and co-investigator. This will require development of funded proposals as well as conducting research.
• Supervise graduate and post-doctoral students and assist in mentoring relevant activities by clinical residents and fellows.
• Assist in defining and teaching appropriate trans-disciplinary short courses for engineering/medical students and physicians in training.
• Participate in definition, development, and execution of programs within JHU’s I
4M initiative.
• As part of a transformation to I4M, coordinate multiple research
and education efforts within the NSF Engineering Research Center for Computer-Integrated Surgical Systems and Technology (CISST ERC; http://cisst.org) and participate in Center Leadership activities. .
Applicants should have a Ph.D. in an appropriate engineering discipline such as computer science, biomedical, electrical, or mechanical engineering or in an appropriate clinical discipline such as radiology. Applicants also should have significant experience in systems-oriented research targeted at clinical applications, with a demonstrated ability to work successfully both with clinicians and engineering research staff. It is anticipated that the successful applicant will receive an appropriate primary academic appointment within the Whiting School of Engineering or in Radiology commensurate with his or her experience. We anticipate that person will also receive appropriate secondary appointments in other divisions of Johns Hopkins University.
Interested persons should submit a single PDF file containing the following material: curriculum vitae; the names of three references; a research statement; and relevant research publications. Materials and questions should be sent to:
Prof. Russell H. Taylor Chair, I
4M Search Committee
The Johns Hopkins University 3400 N. Charles Street, NEB 322 Baltimore, MD 21218 [email protected]; 410-516-6299; fax 410-515-5553 Assistant: [email protected]; 410-516-0740
ASSISTANT RESEARCH PROFESSOR
Candidates should hold a Ph.D. or equivalent in Biomedical Engineering or a related fi eld; demonstrated expertise in ultrasonic physics and continuum mechanics, dynamics, and fi nite element methods (FEM) modeling of tissue; experience with clinical imaging research protocols; and a willingness to work with undergraduate and graduate students and instruct FEM modeling courses.
Applicants should submit a curriculum vitae, names and contact information for three references, and expected date of availability to: Connie Keen, Department of Biomedical Engineering, Duke University, Box 90281, Durham, NC 27708-0281. Applications received by March 1, 2007 will be given consideration.
Duke University is An Equal Opportunity/Affi rmative Action Employer.

The Engineering in Medicine and Biology Society
CONGRATULATES
The EMB Members newly confirmed by the IEEE Board of Directors as
IEEE Fellows
Maximus Viergever, University Medical Center Utrecht, Netherlands
"for leadership and contributions to medical imaging"
Jaakko Malmivuo, Tampere University of Technology, Finland
"for contributions to theoretical and experimental aspects of bioelectromagnetic phenomena"
Shangkai Gao, Tsinghua University, China
"for contributions to the study of brain-computer interface"
Amir Amini, University of Louisville, Kentucky, USA
"for contributions to cardiovascular imaging and medical image analysis"
Yuang-Ting Zhang, Chinese University of Hong Kong, Hong Kong
"for contributions to the field of wearable devices and signal processing algorithms for mobile
healthcare""
Jerome Liang, State University of New York at Stony Brook, New York, USA
"for contributions to medical image reconstruction and virtual colonoscopy"
Alan Sahakian, Northwestern University, Evanston, Illinois
"for contributions to electrophysiology of atrial cardiac arrhythmias"
Xiaochuan Pan, University of Chicago, Illinois, USA “for contributions to nuclear and non-invasive imaging”
Ronald Aarts, Philips Research Labs, Eindhoven, Netherlands
“for research and application in signal processing for acoustics and sound reproduction”
Zeungnam Bien, Korea Advanced Institute of Science and Technology, Daejeon, Korea
"for contributions to development of assistive robots and human-robot interaction systems"
Dmitry Goldgof, University of South Florida, Tampa, Florida, USA
"for contributions to computer vision and biomedical applications"

IEEE ENGINEERING IN MEDICINE AND BIOLOGY MAGAZINE JANUARY/FEBRUARY 2007 107
2006 Annual IndexIEEE Engineering in Medicine and Biology
Vol. 25
This index covers all technical items — papers, correspondence,reviews, etc. — that appeared in this periodical during 2006, and itemsfrom previous years that were commented upon or corrected in 2006.Departments and other items may also be covered if they have beenjudged to have archival value.
The Author Index contains the primary entry for each item, listedunder the first author’s name. The primary entry includes the coauthors’names, the title of the paper or other item, and its location, specified bythe publication abbreviation, year, month, and inclusive pagination. TheSubject Index contains entries describing the item under all appropriatesubject headings, plus the first author’s name, the publication abbrevia-tion, month, and year, and inclusive pages. Subject cross-references areincluded to assist in finding items of interest. Note that the item title isfound only under the primary entry in the Author Index.
AUTHOR INDEX
A
Abugharbieh, R., see McKeown, M.J., EMB-M Mar-Apr 06 91-101Adali, T., see Calhoun, V.D., EMB-M Mar-Apr 06 79-90Al-angari, H., see Petrutiu, S., EMB-M Nov-Dec 06 24-30Allessie, M.A., see Houben, R.P.M., EMB-M Nov-Dec 06 40-51Amos, Q., see Flood, E.M., EMB-M May-Jun 06 84-87Anderson, D., G. Madhavan, and NY SUNY Binghamton, USA.
Usability and Internationalization of Information Technology (Akin,N.; 2004) [book review]; EMB-M Jan-Feb 06 16
Ansermino, J.M., see Brouse, C., EMB-M Jul-Aug 06 76-82Archip, N., see Dimaio, S.P., EMB-M Sep-Oct 06 67-73Astola, J., see Nicorici, D., EMB-M Jan-Feb 06 82-89Astolfi, L., F. Cincotti, D. Mattia, F. de Vico Fallani, S. Salinari, M.
Ursino, M. Zavaglia, M.G. Marciani, and F. Babiloni. Estimation ofthe cortical connectivity patterns during the intention of limb move-ments; EMB-M Jul-Aug 06 32-38
B
Babiloni, F., see Astolfi, L., EMB-M Jul-Aug 06 32-38Bansard, J.-Y., see Kerbaol, M., EMB-M Mar-Apr 06 6-9Bansard, J.-Y., M. Kerbaol, and J.L. Coatrieux. An analysis of IEEE
publications in biomedical engineering [A Look At]; EMB-M Sep-Oct 06 6, 8, 10-12
Bardyn, T., see Sidler, R., EMB-M Jul-Aug 06 63-69Bartolini, P., see Calcagnini, G., EMB-M Nov-Dec 06 71-78Battail, G. Should genetics get an information-theoretic education?;
EMB-M Jan-Feb 06 34-45Baura, G.D. A proposal for ABET criterion 9 [Point of View]; EMB-M
Jan-Feb 06 26Baura, G.D. Janie needs relevance [Point of View]; EMB-M Jul-Aug 06
85-86Baura, G.D. Vacation: All I ever wanted [Point of View]; EMB-M Nov-
Dec 06 94Bin He, see Zhongming Liu, EMB-M Jul-Aug 06 46-53Binseng Wang Event-Related Potentials: A Methods Handbook
(Handy, T., Ed.; 2005) [book review]; EMB-M Mar-Apr 06 14Bitzer, D.L., see May, E.E., EMB-M Jan-Feb 06 90-97Black, P.M., see Dimaio, S.P., EMB-M Sep-Oct 06 67-73Blinowska, K.J., see Malinowska, U., EMB-M Jul-Aug 06 26-31Blu, T., see Van de Ville, D., EMB-M Mar-Apr 06 65-78Bollmann, A., and F. Lombardi. Electrocardiography of atrial fibrilla-
tion; EMB-M Nov-Dec 06 15-23Bollmann, A., see Stridh, M., EMB-M Nov-Dec 06 31-39Bonel, H.M., see Sidler, R., EMB-M Jul-Aug 06 63-69Brouse, C., G.A. Dumont, F.J. Herrmann, and J.M. Ansermino. A
wavelet approach to detecting electrocautery noise in the ECG;EMB-M Jul-Aug 06 76-82
Bunce, S.C., M. Izzetoglu, K. Izzetoglu, B. Onaral, and K. Pourrezaei.Functional near-infrared spectroscopy; EMB-M Jul-Aug 06 54-62
C
Calcagnini, G., F. Censi, A. Michelucci, and P. Bartolini. Descriptorsof wavefront propagation; EMB-M Nov-Dec 06 71-78
Calhoun, V.D., and T. Adali. Unmixing fMRI with independent compo-nent analysis; EMB-M Mar-Apr 06 79-90
Censi, F., see Calcagnini, G., EMB-M Nov-Dec 06 71-78Cerutti,S., see Mainardi, L., EMB-M Nov-Dec 06 14Cerutti, S., see Mainardi, L.T., EMB-M Nov-Dec 06 63-70Choong Leong Tan, see Rajapakse, J.C., EMB-M Mar-Apr 06 102-111Christensen, M.S., see Nielsen, F.A., EMB-M Mar-Apr 06 112-119Cincotti, F., see Astolfi, L., EMB-M Jul-Aug 06 32-38Coatrieux, J.L. Shape and function from motion in medical imaging:
part 2; EMB-M Jan-Feb 06 6-21Coatrieux, J.L., see Kerbaol, M., EMB-M Mar-Apr 06 6-9Coatrieux, J.L., see Bansard, J.-Y., EMB-M Sep-Oct 06 6, 8, 10-12Corino, V.D.A., see Mainardi, L.T., EMB-M Nov-Dec 06 63-70Creane, P. The science of volunteering; EMB-M May-Jun 06 20-22Cross, D.J., see Flexman, J.A., EMB-M Jul-Aug 06 70-75
D
Dario, P., see Kassim, I., EMB-M May-Jun 06 49-56Demir, S.S. A microsystem design house [BME Company Profiles];
EMB-M Jan-Feb 06 19-21Demir, S.S. CleveMed, Orbital Research, and their spin-offs [BME
Company Profiles]; EMB-M May-Jun 06 12-15de Vico Fallani, F., see Astolfi, L., EMB-M Jul-Aug 06 32-38Dimaio, S.P., N. Archip, N. Hata, I.-F. Talos, S.K. Warfield, A.
Majumdar, N. McDannold, K. Hynynen, P.R. Morrison, W.M.I.I.I.Wells, D.F. Kacher, R.E. Ellis, A.J. Golby, P.M. Black, F.A. Jolesz,and R. Kikinis. Image-guided neurosurgery at Brigham andWomen’s Hospital; EMB-M Sep-Oct 06 67-73
Ding Lei, see Zhongming Liu, EMB-M Jul-Aug 06 46-53Donoghue, J.P., see Hochberg, L.R., EMB-M Sep-Oct 06 32-38Dumont, G.A., see Brouse, C., EMB-M Jul-Aug 06 76-82Durka, P.J., see Malinowska, U., EMB-M Jul-Aug 06 26-31
E
Ellis, R.E., see Dimaio, S.P., EMB-M Sep-Oct 06 67-73Enderle, J.D. Senior design for persons with disabilities; EMB-M May-
Jun 06 25-29Ernst, R.R. Science, engineering, and humanity; EMB-M May-Jun 06
18-19
F
Farhadi, J., C. Jaquiery, M. Haug, G. Pierer, H.F. Zeilhoefer, and I.Martin. Bone and cartilage tissue engineering for facial reconstruc-tive surgery; EMB-M Jan-Feb 06 106-109
Feng Gong, see Kassim, I., EMB-M May-Jun 06 49-56Ferraioli, A. Diagnostic Ultrasound - Imaging and Blood Flow
Measurement (Shung, K.K.; 2006) [book review]; EMB-M Mar-Apr06 15
Fielder, J. Moral blindness and the Guidant recall; EMB-M Jan-Feb 0698-99
Fielder, J. Understanding organizational wrongdoing II; EMB-M Mar-Apr 06 120-123
Fielder, J. Ethics and the FDA; EMB-M Jul-Aug 06 13-17
Annual Index
108 IEEE ENGINEERING IN MEDICINE AND BIOLOGY MAGAZINE JANUARY/FEBRUARY 2007
Annual Index (continued)
Fielder, J. Sex and stem cell research [Issues in Ethics]; EMB-M Nov-Dec 06 96-98
Flexman, J. A portrait of a biomedical engineer as a blogger [Student’sCorner]; EMB-M Nov-Dec 06 9-10
Flexman, J.A., S. Minoshima, Yongmin Kim, S. Miyoshi, B.L.Lewellen, and D.J. Cross. A viral envelope as a vehicle for tracer,drug, and gene delivery; EMB-M Jul-Aug 06 70-75
Flood, E.M., R.S. Kumar, R. Shah, Q. Amos, J.D. Wren, R.V. Shohet,and H.R. Garner. Melatonin administration does not affect isopro-terenol-induced LVH; EMB-M May-Jun 06 84-87
France, D. Misadventures in Health Care - Inside Stories (Bogner,M.S., Ed.; 2004) [book review]; EMB-M May-Jun 06 10
Fries, R.C. Biomedical Engineering Principles (Ritter, A.B. et al.; 2005)[book review]; EMB-M Sep-Oct 06 80
Fujikado, T., see Ohta, J., EMB-M Sep-Oct 06 47-59Furumiya, T., see Ohta, J., EMB-M Sep-Oct 06 47-59
G
Galloway, R.L. Design and Development of Medical ElectronicInstrumentation (Prutchi, D. and Norris, M.; 2004) [book review];EMB-M May-Jun 06 10-11
Garner, H.R., see Flood, E.M., EMB-M May-Jun 06 84-87Geddes, L. Where did the big E come from?; EMB-M Mar-Apr 06 122-
123Geddes, L.A. Who was the first genetic engineer?; EMB-M Jan-Feb 06
101Geddes, L.A. Did Wheatstone build a bridge? (Wheatstone’s bridge cir-
cuit); EMB-M May-Jun 06 88-90Geddes, L.A. Engineering contributions to the life sciences; EMB-M
Jul-Aug 06 88-91Geddes, L.A. The qualifications of a modern biomedical engineer;
EMB-M Sep-Oct 06 82Geddes, L.A. The first experiments on electrical safety [Retrospective];
EMB-M Nov-Dec 06 92-93Geocadin, R.G., see Thakor, N.V., EMB-M Jul-Aug 06 20-25Gestrelius, S., and M. Oerum. Cluster formation as a tool for develop-
ment in Medicon Valley; EMB-M Jan-Feb 06 102-105Giannerini, S., see Gonzalez, D.L., EMB-M Jan-Feb 06 69-81Golby, A.J., see Dimaio, S.P., EMB-M Sep-Oct 06 67-73Goldberg, J.R. Providing senior design students with a clinical perspec-
tive; EMB-M Mar-Apr 06 20-21Goldberg, J.R. Senior design capstone courses and ABET outcomes;
EMB-M Jul-Aug 06 84-86Goldberg, J.R. Design projects [Senior Design]; EMB-M Nov-Dec 06
90-93Gong Feng, see Kassim, I., EMB-M May-Jun 06 49-56Gonzalez, D.L., S. Giannerini, and R. Rosa. Detecting structure in pari-
ty binary sequences; EMB-M Jan-Feb 06 69-81Gonzalez Ballester, M.A., see Sidler, R., EMB-M Jul-Aug 06 63-69Gupta, M.K. The quest for error correction in biology; EMB-M Jan-
Feb 06 46-53
H
Haddad, S.A.P., R.P.M. Houben, and W.A. Serdijin. The evolution ofpacemakers; EMB-M May-Jun 06 38-48
Handy, T.C., see McKeown, M.J., EMB-M Mar-Apr 06 91-101Hansen, L.K., see Nielsen, F.A., EMB-M Mar-Apr 06 112-119Hata, N., see Dimaio, S.P., EMB-M Sep-Oct 06 67-73Haug, M., see Farhadi, J., EMB-M Jan-Feb 06 106-109He Bin, see Zhongming Liu, EMB-M Jul-Aug 06 46-53Helgesson, C.I. Engineers without borders and their role in humanitari-
an relief; EMB-M May-Jun 06 32-35Herrmann, F.J., see Brouse, C., EMB-M Jul-Aug 06 76-82Hochberg, L.R., and J.P. Donoghue. Sensors for brain-computer inter-
faces; EMB-M Sep-Oct 06 32-38Hoffmann, R.G., see Rowe, D.B., EMB-M Mar-Apr 06 60-64Hongxuan Zhang, S. Venkatesha, R. Minahan, D. Sherman, Y. Oweis,
A. Natarajan, and N.V. Thakor. Intraoperative neurological monitor-ing; EMB-M Jul-Aug 06 39-45
Houben, R.P.M., see Haddad, S.A.P., EMB-M May-Jun 06 38-48Houben, R.P.M., and M.A. Allessie. Processing of intracardiac electro-
grams in atrial fibrillation; EMB-M Nov-Dec 06 40-51Humayun, M.S., see Weiland, J.D., EMB-M Sep-Oct 06 60-66
Hynynen, K., see Dimaio, S.P., EMB-M Sep-Oct 06 67-73Hyun-Chool Shin, see Thakor, N.V., EMB-M Jul-Aug 06 20-25
I
Izzetoglu, K., see Bunce, S.C., EMB-M Jul-Aug 06 54-62Izzetoglu, M., see Bunce, S.C., EMB-M Jul-Aug 06 54-62
J
Jacquemet, V., A. van Oosterom, J.-M. Vesin, and L. Kappenberger.Analysis of electrocardiograms during atrial fibrillation; EMB-MNov-Dec 06 79-88
Jaquiery, C., see Farhadi, J., EMB-M Jan-Feb 06 106-109Jolesz, F.A., see Dimaio, S.P., EMB-M Sep-Oct 06 67-73Jun Zhao, see Mingui Sun, EMB-M Sep-Oct 06 39-46Justin, G.A., see Mingui Sun, EMB-M Sep-Oct 06 39-46
K
Kacher, D.F., see Dimaio, S.P., EMB-M Sep-Oct 06 67-73Kagawa, K., see Ohta, J., EMB-M Sep-Oct 06 47-59Kanyan Yang, see Rajapakse, J.C., EMB-M Mar-Apr 06 102-111Kappenberger, L., see Jacquemet, V., EMB-M Nov-Dec 06 79-88Kassim, I., L. Phee, W.S. Ng, Feng Gong, P. Dario, and C.A. Mosse.
Locomotion techniques for robotic colonoscopy; EMB-M May-Jun06 49-56
Kerbaol, M., J.-Y. Bansard, and J.L. Coatrieux. An analysis of IEEEpublications; EMB-M Mar-Apr 06 6-9
Kerbaol, M., see Bansard, J.-Y., EMB-M Sep-Oct 06 6, 8, 10-12Kikinis, R., see Dimaio, S.P., EMB-M Sep-Oct 06 67-73Kim Yongmin, see Flexman, J.A., EMB-M Jul-Aug 06 70-75King, P. Neurophysiological Monitoring During Intensive Care and
Surgery (Smith, N.J. et al.; 2006) [book review]; EMB-M Nov-Dec06 13
King, P.H. Engineering for Patient Safety: Issues in Minimally InvasiveProcedures (Dankelman, J. et al., Eds.; 2005) [book review]; EMB-M Jan-Feb 06 14
King, P.H. Creative 3-D Display and Interaction Interfaces (Blundell,B.G. and Schwartz, A.J.; 2006) [book review]; EMB-M May-Jun 069-10
King, P.H. Virtual Reconstruction: A Primer on Computer-AssistedPaleontology and Biomedicine (Zollikofer, C.P. and Ponce de Leon,M.S.; 2005) [book review]; EMB-M May-Jun 06 11
King, P.H. Introduction to Mechatronics and Measurement Systems,3rd edition (Alciatore, D. and Histand, M.); EMB-M Jul-Aug 06 10-11
King, P.H. Encyclopedia of Medical Devices and Instrumentation, 6Volume Set, 2nd edition (Webster, J.G., Ed.; 2006); EMB-M Jul-Aug 06 12
Klee, M.M. What a difference a day made [interpreting patent claims];EMB-M Jan-Feb 06 100
Klee, M.M. The U.S. patent that reached around the world (patentinfringement); EMB-M May-Jun 06 76-83
Klee, M.M. Knowing when to quit (patents); EMB-M Sep-Oct 06 81Kostler, W., see Sidler, R., EMB-M Jul-Aug 06 63-69Kumar, R.S., see Flood, E.M., EMB-M May-Jun 06 84-87
L
Lei Ding, see Zhongming Liu, EMB-M Jul-Aug 06 46-53Leong Tan Choong, see Rajapakse, J.C., EMB-M Mar-Apr 06 102-111Lewellen, B.L., see Flexman, J.A., EMB-M Jul-Aug 06 70-75Liu Zhongming, see Zhongming Liu, EMB-M Jul-Aug 06 46-53Lombardi, F., see Bollmann, A., EMB-M Nov-Dec 06 15-23Lombardi, F., see Mainardi, L.T., EMB-M Nov-Dec 06 63-70Lombardi, L., see Mainardi, L.T., EMB-M Nov-Dec 06 63-70Lund, T.E., see Nielsen, F.A., EMB-M Mar-Apr 06 112-119
M
Mac Donaill, D.A. Digital parity and the composition of the nucleotidealphabet; EMB-M Jan-Feb 06 54-61
Madhavan, G., see Anderson, D., EMB-M Jan-Feb 06 16Madhaven, G. Ionizing Radiation Detectors for Medical Imaging
IEEE ENGINEERING IN MEDICINE AND BIOLOGY MAGAZINE JANUARY/FEBRUARY 2007 109
(Del Guerra, A.; 2004); EMB-M Jul-Aug 06 10Madhaven, G. Handbook of Nanoscience, Engineering and Technology
(Goddard, William, III et al., Eds.; 2002); EMB-M Jul-Aug 06 11-12Madhaven, G. How Professionals Make Decisions (Montgomery, H. et
al.; 2004) [book review]; EMB-M Nov-Dec 06 12-13Madsen, K.H., see Nielsen, F.A., EMB-M Mar-Apr 06 112-119Mainardi, L., . Cerutti, and L. Sornmo. An introduction from the guest
editors: Processing interpretation of cardiac signals during atrial fib-rillation [special section intro.]; EMB-M Nov-Dec 06 14
Mainardi, L.T., V.D.A. Corino, L. Lombardi, C. Tondo, M. Mantica, F.Lombardi, and S. Cerutti. Linear and nonlinear coupling betweenatrial signals; EMB-M Nov-Dec 06 63-70
Majumdar, A., see Dimaio, S.P., EMB-M Sep-Oct 06 67-73Malinowska, U., P.J. Durka, K.J. Blinowska, W. Szelenberger, and A.
Wakarow. Micro- and macrostructure of sleep EEG; EMB-M Jul-Aug 06 26-31
Malkin, R. The humanitarian efforts of biomedical engineers [specialsection intro.]; EMB-M May-Jun 06 16, 19
Mantica, M., see Mainardi, L.T., EMB-M Nov-Dec 06 63-70Marciani, M.G., see Astolfi, L., EMB-M Jul-Aug 06 32-38Martin, I., see Farhadi, J., EMB-M Jan-Feb 06 106-109Mattia, D., see Astolfi, L., EMB-M Jul-Aug 06 32-38May, E.E. Communication theory and molecular biology at the cross-
roads [special section intro.]; EMB-M Jan-Feb 06 28-29May, E.E. Communication theory and molecular biology at the cross-
roads; EMB-M Jan-Feb 06 28-29May, E.E., M.A. Vouk, and D.L. Bitzer. Classification of Escherichia
coli K-12 ribosome binding sites; EMB-M Jan-Feb 06 90-97McDannold, N., see Dimaio, S.P., EMB-M Sep-Oct 06 67-73McKeown, M.J., Z.J. Wang, R. Abugharbieh, and T.C. Handy.
Increasing the effect size in event-related fMRI studies; EMB-MMar-Apr 06 91-101
Mehra, R., P. Ziegler, S. Sarkar, D. Ritscher, and E. Warman.Management of atrial tachyarrhythmias; EMB-M Nov-Dec 06 52-62
Michelucci, A., see Calcagnini, G., EMB-M Nov-Dec 06 71-78Minahan, R., see Hongxuan Zhang, EMB-M Jul-Aug 06 39-45Mingui Sun, G.A. Justin, P.A. Roche, Jun Zhao, B.L. Wessel, Yinghe
Zhang, and R.J. Sclabassi. Passing data and supplying power toneural implants; EMB-M Sep-Oct 06 39-46
Minoshima, S., see Flexman, J.A., EMB-M Jul-Aug 06 70-75Miyoshi, S., see Flexman, J.A., EMB-M Jul-Aug 06 70-75Morrison, P.R., see Dimaio, S.P., EMB-M Sep-Oct 06 67-73Mosse, C.A., see Kassim, I., EMB-M May-Jun 06 49-56Mukhopadhyay, S., see Rajapakse, J.C., EMB-M Mar-Apr 06 102-111Muljo, W., see Ng, E.Y.K., EMB-M May-Jun 06 68-74Mumford, J.A., and T. Nichols. Modeling and inference of multisubject
fMRI data; EMB-M Mar-Apr 06 42-51Murthy, R., and I. Pavlidis. Noncontact measurement of breathing
function; EMB-M May-Jun 06 57-67
N
Natarajan, A., see Hongxuan Zhang, EMB-M Jul-Aug 06 39-45Ng, E.Y.K., W. Muljo, and B.S. Wong. Study of facial skin and aural
temperature; EMB-M May-Jun 06 68-74Ng, J., see Petrutiu, S., EMB-M Nov-Dec 06 24-30Ng, W.S., see Kassim, I., EMB-M May-Jun 06 49-56Nichols, T., see Mumford, J.A., EMB-M Mar-Apr 06 42-51Nicorici, D., O. Yli-Harja, and J. Astola. Finding large domains of simi-
larly expressed genes; EMB-M Jan-Feb 06 82-89Nielsen, F.A., M.S. Christensen, K.H. Madsen, T.E. Lund, and L.K.
Hansen. fMRI neuroinformatics; EMB-M Mar-Apr 06 112-119Nijm, G.M., see Petrutiu, S., EMB-M Nov-Dec 06 24-30Nolte, L.-P., see Sidler, R., EMB-M Jul-Aug 06 63-69
O
Oerum, M., see Gestrelius, S., EMB-M Jan-Feb 06 102-105Ohta, J., T. Tokuda, K. Kagawa, T. Furumiya, A. Uehara, Y. Terasawa,
M. Ozawa, T. Fujikado, and Y. Tano. Silicon LSI-based smart stim-ulators for retinal prosthesis; EMB-M Sep-Oct 06 47-59
Olsson, S.B., see Stridh, M., EMB-M Nov-Dec 06 31-39Onaral, B., see Bunce, S.C., EMB-M Jul-Aug 06 54-62Oweis, Y., see Hongxuan Zhang, EMB-M Jul-Aug 06 39-45Ozawa, M., see Ohta, J., EMB-M Sep-Oct 06 47-59
P
Panescu, D. MEMS in medicine and biology; EMB-M Sep-Oct 06 19-28Papadaki, M. Tissue engineering and Eucomed news in brief; EMB-M
May-Jun 06 91Pavlidis, I., see Murthy, R., EMB-M May-Jun 06 57-67Pekar, J.J. A brief introduction to functional MRI; EMB-M Mar-Apr 06
24-26Perraioli, A. Introduction to Biomedical Engineering, 2nd edition
(Enderle, J. et al., Eds.; 2005) [book review]; EMB-M Jan-Feb 0614, 16
Petrutiu, S., J. Ng, G.M. Nijm, H. Al-angari, S. Swiryn, and A.V.Sahakian. Atrial fibrillation and waveform characterization; EMB-MNov-Dec 06 24-30
Phee, L., see Kassim, I., EMB-M May-Jun 06 49-56Pierer, G., see Farhadi, J., EMB-M Jan-Feb 06 106-109Pourrezaei, K., see Bunce, S.C., EMB-M Jul-Aug 06 54-62
R
Rajapakse, J.C. , Choong Leong Tan, Xuebin Zheng, S.Mukhopadhyay, and Kanyan Yang. Exploratory analysis of brainconnectivity with ICA; EMB-M Mar-Apr 06 102-111
Richter, M. Smart Technology for Aging, Disability and Independence(Mann, W.C.; 2005) [book review]; EMB-M Mar-Apr 06 14-15
Rise, M.T., see Testerman, R.L., EMB-M Sep-Oct 06 74-78Ritscher, D., see Mehra, R., EMB-M Nov-Dec 06 52-62Roche, P.A., see Mingui Sun, EMB-M Sep-Oct 06 39-46Rosa, R., see Gonzalez, D.L., EMB-M Jan-Feb 06 69-81Rosen, G. Examining coding structure and redundancy in DNA; EMB-
M Jan-Feb 06 62-68Rowe, D.B., and R.G. Hoffmann. Multivariate statistical analysis in
fMRI; EMB-M Mar-Apr 06 60-64Russell, G. Prescription for success (one program corrects the problems
of hospitals in the developing world); EMB-M May-Jun 06 30-31
S
Sahakian, A.V., see Petrutiu, S., EMB-M Nov-Dec 06 24-30Salinari, S., see Astolfi, L., EMB-M Jul-Aug 06 32-38Sarkar, S., see Mehra, R., EMB-M Nov-Dec 06 52-62Savoy, R.L. Using small numbers of subjects in fMRI-based research;
EMB-M Mar-Apr 06 52-59Schneider, T.S. Claude Shannon: biologist (information theory used in
biology); EMB-M Jan-Feb 06 30-33Sclabassi, R.J., see Mingui Sun, EMB-M Sep-Oct 06 39-46Serdijin, W.A., see Haddad, S.A.P., EMB-M May-Jun 06 38-48Shah, R., see Flood, E.M., EMB-M May-Jun 06 84-87Shanbao Tong, see Thakor, N.V., EMB-M Jul-Aug 06 20-25Shanbao Tong, see Thakor, N.V., EMB-M Sep-Oct 06 30-31Sherman, D., see Hongxuan Zhang, EMB-M Jul-Aug 06 39-45Shiavi, R. Electromyography: Physiology, Engineering, and
Noninvasive Applications (Merletti, R. and Parker, P.; 2004) [bookreview]; EMB-M Nov-Dec 06 11-12
Shin Hyun-Chool, see Thakor, N.V., EMB-M Jul-Aug 06 20-25Shohet, R.V., see Flood, E.M., EMB-M May-Jun 06 84-87Sidler, R., M.A. Gonzalez Ballester, H.M. Bonel, M. Styner, T. Bardyn,
L.-P. Nolte, N.P. Sudkamp, and W. Kostler. Computer-assistedarthroplasty using bioengineered autografts; EMB-M Jul-Aug 06 63-69
Sornmo, L., see Mainardi, L., EMB-M Nov-Dec 06 14Sornmo, L., see Stridh, M., EMB-M Nov-Dec 06 31-39Stridh, M., A. Bollmann, S.B. Olsson, and L. Sornmo. Detection and
feature extraction of atrial tachyarrhythmias; EMB-M Nov-Dec 0631-39
Strother, S.C. Evaluating fMRI preprocessing pipelines; EMB-M Mar-Apr 06 27-41
Styner, M., see Sidler, R., EMB-M Jul-Aug 06 63-69Stypulkowski, P.H., see Testerman, R.L., EMB-M Sep-Oct 06 74-78Sudkamp, N.P., see Sidler, R., EMB-M Jul-Aug 06 63-69Sun Mingui, see Mingui Sun, EMB-M Sep-Oct 06 39-46SUNY Binghamton, NY, USA, see Anderson, D., EMB-M Jan-Feb 06
16Swiryn, S., see Petrutiu, S., EMB-M Nov-Dec 06 24-30Szelenberger, W., see Malinowska, U., EMB-M Jul-Aug 06 26-31

110 IEEE ENGINEERING IN MEDICINE AND BIOLOGY MAGAZINE JANUARY/FEBRUARY 2007
Annual Index (continued)
+ check author entry for coauthors
T
Taflin, C. A low-cost solution to rural water disinfection; EMB-M May-Jun 06 36-37
Talos, I.-F., see Dimaio, S.P., EMB-M Sep-Oct 06 67-73Tan Choong Leong, see Rajapakse, J.C., EMB-M Mar-Apr 06 102-111Tano, Y., see Ohta, J., EMB-M Sep-Oct 06 47-59Teninty, B. International Aid’s medical equipment training program;
EMB-M May-Jun 06 23-24Terasawa, Y., see Ohta, J., EMB-M Sep-Oct 06 47-59Testa, D.M. Biomedical Imaging Principles and Applications in
Engineering Series (Mudry, K.M. et al.; 2003) [book review]; EMB-M May-Jun 06 9
Testerman, R.L., M.T. Rise, and P.H. Stypulkowski. Electrical stimula-tion as therapy for neurological disorders; EMB-M Sep-Oct 06 74-78
Thakor, N.V., and S. Tong. From bench to bedside [intro. to the specialsection on neuroengineering]; EMB-M Jul-Aug 06 18-19
Thakor, N.V., Hyun-Chool Shin, Shanbao Tong, and R.G. Geocadin.Quantitative EEG assessment; EMB-M Jul-Aug 06 20-25
Thakor, N.V., see Hongxuan Zhang, EMB-M Jul-Aug 06 39-45Thakor, N.V., and Shanbao Tong. Therapeutic technologies in neuro-
engineering; EMB-M Sep-Oct 06 30-31Tokuda, T., see Ohta, J., EMB-M Sep-Oct 06 47-59Tondo, C., see Mainardi, L.T., EMB-M Nov-Dec 06 63-70Tong, S., see Thakor, N.V., EMB-M Jul-Aug 06 18-19Tong Shanbao, see Thakor, N.V., EMB-M Jul-Aug 06 20-25Tong Shanbao, see Thakor, N.V., EMB-M Sep-Oct 06 30-31
U
Uehara, A., see Ohta, J., EMB-M Sep-Oct 06 47-59Unser, M., see Van de Ville, D., EMB-M Mar-Apr 06 65-78Ursino, M., see Astolfi, L., EMB-M Jul-Aug 06 32-38
V
Van de Ville, D., T. Blu, and M. Unser. Surfing the brain; EMB-M Mar-Apr 06 65-78
van Oosterom, A., see Jacquemet, V., EMB-M Nov-Dec 06 79-88Venkatesha, S., see Hongxuan Zhang, EMB-M Jul-Aug 06 39-45Vesin, J.-M., see Jacquemet, V., EMB-M Nov-Dec 06 79-88Vouk, M.A., see May, E.E., EMB-M Jan-Feb 06 90-97
W
Wakarow, A., see Malinowska, U., EMB-M Jul-Aug 06 26-31Wang, Z.J., see McKeown, M.J., EMB-M Mar-Apr 06 91-101Wang Binseng, see Binseng Wang, EMB-M Mar-Apr 06 14Warfield, S.K., see Dimaio, S.P., EMB-M Sep-Oct 06 67-73Warman, E., see Mehra, R., EMB-M Nov-Dec 06 52-62Weiland, J.D., and M.S. Humayun. Intraocular retinal prosthesis; EMB-
M Sep-Oct 06 60-66Wells, W.M.I.I.I., see Dimaio, S.P., EMB-M Sep-Oct 06 67-73Wessel, B.L., see Mingui Sun, EMB-M Sep-Oct 06 39-46Wong, B.S., see Ng, E.Y.K., EMB-M May-Jun 06 68-74Wren, J.D., see Flood, E.M., EMB-M May-Jun 06 84-87
X
Xuebin Zheng, see Rajapakse, J.C., EMB-M Mar-Apr 06 102-111
Y
Yang Kanyan, see Rajapakse, J.C., EMB-M Mar-Apr 06 102-111Yinghe Zhang, see Mingui Sun, EMB-M Sep-Oct 06 39-46Yli-Harja, O., see Nicorici, D., EMB-M Jan-Feb 06 82-89Yongmin Kim, see Flexman, J.A., EMB-M Jul-Aug 06 70-75
Z
Zavaglia, M., see Astolfi, L., EMB-M Jul-Aug 06 32-38Zeilhoefer, H.F., see Farhadi, J., EMB-M Jan-Feb 06 106-109
Zhang Hongxuan, see Hongxuan Zhang, EMB-M Jul-Aug 06 39-45Zhang Yinghe, see Mingui Sun, EMB-M Sep-Oct 06 39-46Zhao Jun, see Mingui Sun, EMB-M Sep-Oct 06 39-46Zheng Xuebin, see Rajapakse, J.C., EMB-M Mar-Apr 06 102-111Zhongming Liu, Lei Ding, and Bin He. Integration of EEG/MEG with
MRI and fMRI; EMB-M Jul-Aug 06 46-53Ziegler, P., see Mehra, R., EMB-M Nov-Dec 06 52-62
SUBJECT INDEX
A
Acceleration measurementmed. and biol., MEMS. Panescu, D., EMB-M Sep-Oct 06 19-28
Aerospace engineeringinterview with Robert Schmidt, chairman and founder of CleveMed,
Orbital Research, and their spin-offs. Demir, S.S., EMB-M May-Jun 06 12-15
Algebra; cf. Group theoryArrays
similarly expressed genes, finding large domains. Nicorici, D., + ,EMB-M Jan-Feb 06 82-89
Auditory systemfacial skin and aural temp. Ng, E.Y.K., + , EMB-M May-Jun 06 68-
74Awards
IEEE Engineering in Medicine and Biology Society congratulatesthe recipients of the 2006 EMBS awards. EMB-M Nov-Dec 06 89
B
Bayes proceduresE. coli K-12 ribosome binding sites, class. May, E.E., + , EMB-M
Jan-Feb 06 90-97Behavioral sciences; cf. PsychologyBioelectric phenomena
claude Shannon, biologist (information theory used biol.).Schneider, T.S., EMB-M Jan-Feb 06 30-33
life sciences, engng. contribs. Geddes, L.A., EMB-M Jul-Aug 06 88-91neural implants, passing data and supplying power. Mingui Sun, + ,
EMB-M Sep-Oct 06 39-46neuroengineering, therapeutic technols. Thakor, N.V., + , EMB-M
Sep-Oct 06 30-31neurological disorders, elec. stimulation, therapy. Testerman, R.L.,
+ , EMB-M Sep-Oct 06 74-78quantitat. EEG assess. Thakor, N.V., + , EMB-M Jul-Aug 06 20-25
Bioelectric phenomena; cf. Bioelectric potentialsBioelectric potentials
book review; Event-Related Potentials: A Methods Handbook(Handy, T., Ed.; 2005). Binseng Wang, EMB-M Mar-Apr 06 14
event-related fMRI studies, increasing effect size. McKeown, M.J.,+ , EMB-M Mar-Apr 06 91-101
intraoperative neurological monitoring. Hongxuan Zhang, + , EMB-M Jul-Aug 06 39-45
Bioelectric potentials; cf. ElectromyographyBiological cells
brief, tissue engng. and Eucomed news. Papadaki, M., EMB-M May-Jun 06 91
computer-assisted arthroplasty, bioengineered autografts. Sidler, R.,+ , EMB-M Jul-Aug 06 63-69
facial reconstructive surgery, bone and cartilage tissue engng.Farhadi, J., + , EMB-M Jan-Feb 06 106-109
melatonin admin., not, isoproterenol-induced LVH. Flood, E.M., + ,EMB-M May-Jun 06 84-87
neural implants, passing data and supplying power. Mingui Sun, + ,EMB-M Sep-Oct 06 39-46
similarly expressed genes, finding large domains. Nicorici, D., + ,EMB-M Jan-Feb 06 82-89
was 1st. genetic engineer. Geddes, L.A., EMB-M Jan-Feb 06 101Biological effects of microwaves
IEEE ENGINEERING IN MEDICINE AND BIOLOGY MAGAZINE JANUARY/FEBRUARY 2007 111
+ check author entry for coauthors
first experiments on electrical safety. Geddes, L.A., EMB-M Nov-Dec 06 92-93
Biological effects of radiation; cf. Biological effects of microwavesBiological organs; cf. BrainBiological system modeling
brain connectivity, ICA, exploratory anal. Rajapakse, J.C., + , EMB-M Mar-Apr 06 102-111
fMRI, multivariate stat. anal. Rowe, D.B., + , EMB-M Mar-Apr 0660-64
fMRI neuroinformatics. Nielsen, F.A., + , EMB-M Mar-Apr 06 112-119
Biological thermal factorsbreathing fn., noncontact meas. Murthy, R., + , EMB-M May-Jun 06
57-67facial skin and aural temp. Ng, E.Y.K., + , EMB-M May-Jun 06 68-
74quantitat. EEG assess. Thakor, N.V., + , EMB-M Jul-Aug 06 20-25
Biological tissues; cf. SkinBiology; cf. Cardiology; Genetics; PhysiologyBiomagnetism; cf. MagnetoencephalographyBiomechanics
book review; Biomedical Engineering Principles (Ritter, A.B. et al.;2005). Fries, R.C., EMB-M Sep-Oct 06 80
brain-computer interfaces, sens. Hochberg, L.R., + , EMB-M Sep-Oct 06 32-38
cortical connectivity patterns, intention of limb movements, estim.Astolfi, L., + , EMB-M Jul-Aug 06 32-38
functional near-IR spectrosc. Bunce, S.C., + , EMB-M Jul-Aug 0654-62
Biomedical computingcomputer-assisted arthroplasty, bioengineered autografts. Sidler, R.,
+ , EMB-M Jul-Aug 06 63-69E. coli K-12 ribosome binding sites, class. May, E.E., + , EMB-M
Jan-Feb 06 90-97Biomedical education
biomedical student design projects. Goldberg, J.R., EMB-M Nov-Dec 06 90-93
book review; Introduction to Biomedical Engineering, 2nd edition(Enderle, J. et al., Eds.; 2005). Perraioli, A., EMB-M Jan-Feb 0614, 16
Biomedical electronicsbook review; Design and Development of Medical Electronic
Instrumentation (Prutchi, D. and Norris, M.; 2004). Galloway,R.L., EMB-M May-Jun 06 10-11
book review; Encyclopedia of Medical Devices and Instrumentation,6 Volume Set, 2nd edition (Webster, J.G., Ed.; 2006). King, P.H.,EMB-M Jul-Aug 06 12
Biomedical electronics; cf. DefibrillatorsBiomedical engineering
book review; Biomedical Engineering Principles (Ritter, A.B. et al.;2005). Fries, R.C., EMB-M Sep-Oct 06 80
book review; Design and Development of Medical ElectronicInstrumentation (Prutchi, D. and Norris, M.; 2004). Galloway,R.L., EMB-M May-Jun 06 10-11
book review; Electromyography: Physiology, Engineering, andNoninvasive Applications (Merletti, R. and Parker, P.; 2004).Shiavi, R., EMB-M Nov-Dec 06 11-12
book review; Introduction to Biomedical Engineering, 2nd edition(Enderle, J. et al., Eds.; 2005). Perraioli, A., EMB-M Jan-Feb 0614, 16
interview with Robert Schmidt, chairman and founder of CleveMed,Orbital Research, and their spin-offs. Demir, S.S., EMB-M May-Jun 06 12-15
Medicon Valley, cluster form., tool. Gestrelius, S., + , EMB-M Jan-Feb 06 102-105
neuroengineering, therapeutic technols. Thakor, N.V., + , EMB-MSep-Oct 06 30-31
rural water disinfection, low-cost soln. Taflin, C., EMB-M May-Jun06 36-37
sci., engng., humanity. Ernst, R.R., EMB-M May-Jun 06 18-19Biomedical engineering; cf. Biomedical educationBiomedical engineering education
borders and their role, humanitarian relief, engineers. Helgesson,C.I., EMB-M May-Jun 06 32-35
International Aid’s med. equipt. training program. Teninty, B., EMB-M May-Jun 06 23-24
pers., disabilities, senior design. Enderle, J.D., EMB-M May-Jun 0625-29
providing senior design students, clinical perspective. Goldberg,J.R., EMB-M Mar-Apr 06 20-21
senior design capstone courses and ABET outcomes. Goldberg, J.R.,EMB-M Jul-Aug 06 84-86
success (one program corrects problems of hospitals, developingworld), prescription. Russell, G., EMB-M May-Jun 06 30-31
volunteering, sci. Creane, P., EMB-M May-Jun 06 20-22Biomedical equipment
book review; Encyclopedia of Medical Devices and Instrumentation,6 Volume Set, 2nd edition (Webster, J.G., Ed.; 2006). King, P.H.,EMB-M Jul-Aug 06 12
book review; Smart Technology for Aging, Disability andIndependence (Mann, W.C.; 2005). Richter, M., EMB-M Mar-Apr06 14-15
brief, tissue engng. and Eucomed news. Papadaki, M., EMB-M May-Jun 06 91
International Aid’s med. equipt. training program. Teninty, B., EMB-M May-Jun 06 23-24
providing senior design students, clinical perspective. Goldberg,J.R., EMB-M Mar-Apr 06 20-21
success (one program corrects problems of hospitals, developingworld), prescription. Russell, G., EMB-M May-Jun 06 30-31
Biomedical image processingevaluating fMRI preprocessing pipelines. Strother, S.C., EMB-M
Mar-Apr 06 27-41event-related fMRI studies, increasing effect size. McKeown, M.J.,
+ , EMB-M Mar-Apr 06 91-101fMRI, multivariate stat. anal. Rowe, D.B., + , EMB-M Mar-Apr 06
60-64fMRI neuroinformatics. Nielsen, F.A., + , EMB-M Mar-Apr 06 112-
119image-guided neurosurgery, Brigham and Women’s Hospital.
Dimaio, S.P., + , EMB-M Sep-Oct 06 67-73motion, med. imaging, part 2, shape and fn. Coatrieux, J.L., EMB-M
Jan-Feb 06 6-21surfing brain. Van de Ville, D., + , EMB-M Mar-Apr 06 65-78unmixing fMRI, ICA. Calhoun, V.D., + , EMB-M Mar-Apr 06 79-90
Biomedical imagingbook review; Diagnostic Ultrasound - Imaging and Blood Flow
Measurement (Shung, K.K.; 2006). Ferraioli, A., EMB-M Mar-Apr 06 15
book review; Ionizing Radiation Detectors for Medical Imaging (DelGuerra, A.; 2004). Madhaven, G., EMB-M Jul-Aug 06 10
book review; Virtual Reconstruction: A Primer on Computer-Assisted Paleontology and Biomedicine (Zollikofer, C.P. andPonce de Leon, M.S.; 2005). King, P.H., EMB-M May-Jun 06 11
methods for functional magnetic resonance imaging (fMRI) dataanalysis (special issue). EMB-M Mar-Apr 06 22-119
methods for functional magnetic resonance imaging (fMRI) dataanalysis (special issue intro.). EMB-M Mar-Apr 06 22-23
neuroengineering, therapeutic technols. Thakor, N.V., + , EMB-MSep-Oct 06 30-31
providing senior design students, clinical perspective. Goldberg,J.R., EMB-M Mar-Apr 06 20-21
Biomedical imaging; cf. Biomedical MRI; Biomedical ultrasonicsBiomedical measurement; cf. Blood flow measurement; Blood pres-
sure measurementBiomedical measurements
breathing fn., noncontact meas. Murthy, R., + , EMB-M May-Jun 0657-67
Biomedical monitoringbreathing fn., noncontact meas. Murthy, R., + , EMB-M May-Jun 06
57-67detecting electrocautery noise, ECG, wavelet approach. Brouse, C.,
+ , EMB-M Jul-Aug 06 76-82intraoperative neurological monitoring. Hongxuan Zhang, + ,
112 IEEE ENGINEERING IN MEDICINE AND BIOLOGY MAGAZINE JANUARY/FEBRUARY 2007
Annual Index (continued)
+ check author entry for coauthors
EMB-M Jul-Aug 06 39-45providing senior design students, clinical perspective. Goldberg,
J.R., EMB-M Mar-Apr 06 20-21quantitat. EEG assess. Thakor, N.V., + , EMB-M Jul-Aug 06 20-25
Biomedical MRIclinical neuroengineering, part 1 - neurodiagnostics (special section).
EMB-M Jul-Aug 06 18-62clinical neuroengineering, part 1 - neurodiagnostics (special section
intro.). Thakor, N.V., + , EMB-M Jul-Aug 06 18-19methods for functional magnetic resonance imaging (fMRI) data
analysis (special issue). EMB-M Mar-Apr 06 22-119methods for functional magnetic resonance imaging (fMRI) data
analysis (special issue intro.). EMB-M Mar-Apr 06 22-23Biomedical power supplies
neural implants, passing data and supplying power. Mingui Sun, + ,EMB-M Sep-Oct 06 39-46
Biomedical signal processingcortical connectivity patterns, intention of limb movements, estim.
Astolfi, L., + , EMB-M Jul-Aug 06 32-38detecting electrocautery noise, ECG, wavelet approach. Brouse, C.,
+ , EMB-M Jul-Aug 06 76-82intraoperative neurological monitoring. Hongxuan Zhang, + , EMB-
M Jul-Aug 06 39-45quantitat. EEG assess. Thakor, N.V., + , EMB-M Jul-Aug 06 20-25sleep EEG, micro- and macrostructure. Malinowska, U., + , EMB-M
Jul-Aug 06 26-31subjs., fMRI-based research, small nos. Savoy, R.L., EMB-M Mar-
Apr 06 52-59Biomedical ultrasonics
book review; Diagnostic Ultrasound - Imaging and Blood FlowMeasurement (Shung, K.K.; 2006). Ferraioli, A., EMB-M Mar-Apr 06 15
Biophysics; cf. Bioelectric phenomena; Biomechanics; Cellular bio-physics; Molecular biophysics
Bloodevaluating fMRI preprocessing pipelines. Strother, S.C., EMB-M
Mar-Apr 06 27-41
Blood flowmelatonin admin., not, isoproterenol-induced LVH. Flood, E.M., + ,
EMB-M May-Jun 06 84-87Blood flow measurement
book review; Diagnostic Ultrasound - Imaging and Blood FlowMeasurement (Shung, K.K.; 2006). Ferraioli, A., EMB-M Mar-Apr 06 15
Blood pressure measurementlife sciences, engng. contribs. Geddes, L.A., EMB-M Jul-Aug 06 88-91
Bonesfacial reconstructive surgery, bone and cartilage tissue engng.
Farhadi, J., + , EMB-M Jan-Feb 06 106-109Book reviews
Biomedical Engineering Principles (Ritter, A.B. et al.; 2005). Fries,R.C., EMB-M Sep-Oct 06 80
Biomedical Imaging Principles and Applications in EngineeringSeries (Mudry, K.M. et al.; 2003). Testa, D.M., EMB-M May-Jun06 9
Creative 3-D Display and Interaction Interfaces (Blundell, B.G. andSchwartz, A.J.; 2006). King, P.H., EMB-M May-Jun 06 9-10
Design and Development of Medical Electronic Instrumentation(Prutchi, D. and Norris, M.; 2004). Galloway, R.L., EMB-M May-Jun 06 10-11
Diagnostic Ultrasound - Imaging and Blood Flow Measurement(Shung, K.K.; 2006). Ferraioli, A., EMB-M Mar-Apr 06 15
Electromyography: Physiology, Engineering, and NoninvasiveApplications (Merletti, R. and Parker, P.; 2004). Shiavi, R., EMB-M Nov-Dec 06 11-12
Encyclopedia of Medical Devices and Instrumentation, 6 VolumeSet, 2nd edition (Webster, J.G., Ed.; 2006). King, P.H., EMB-MJul-Aug 06 12
Engineering for Patient Safety: Issues in Minimally InvasiveProcedures (Dankelman, J. et al., Eds.; 2005). King, P.H., EMB-MJan-Feb 06 14
Event-Related Potentials: A Methods Handbook (Handy, T., Ed.;2005) [book review]. Binseng Wang, EMB-M Mar-Apr 06 14
Handbook of Nanoscience, Engineering and Technology (Goddard,William, III et al., Eds.; 2002). Madhaven, G., EMB-M Jul-Aug 06 11-12
How Professionals Make Decisions (Montgomery, H. et al., Eds.;2004). Madhaven, G., EMB-M Nov-Dec 06 12-13
Introduction to Biomedical Engineering, 2nd edition (Enderle, J. etal., Eds.; 2005). Perraioli, A., EMB-M Jan-Feb 06 14, 16
Introduction to Mechatronics and Measurement Systems, 3rd edition(Alciatore, D. and Histand, M.). King, P.H., EMB-M Jul-Aug 0610-11
Ionizing Radiation Detectors for Medical Imaging (Del Guerra, A.;2004). Madhaven, G., EMB-M Jul-Aug 06 10
Misadventures in Health Care - Inside Stories (Bogner, M.S., Ed.;2004). France, D., EMB-M May-Jun 06 10
Neurophysiological Monitoring During Intensive Care and Surgery(Smith, N.J. et al.; 2006). King, P., EMB-M Nov-Dec 06 13
Smart Technology for Aging, Disability and Independence (Mann,W.C.; 2005). Richter, M., EMB-M Mar-Apr 06 14-15
Usability and Internationalization of Information Technology (Akin,N.; 2004). Anderson, D., + , EMB-M Jan-Feb 06 16
Virtual Reconstruction: A Primer on Computer-AssistedPaleontology and Biomedicine (Zollikofer, C.P. and Ponce deLeon, M.S.; 2005). King, P.H., EMB-M May-Jun 06 11
Brainbrain-computer interfaces, sens. Hochberg, L.R., + , EMB-M Sep-
Oct 06 32-38connectivity, ICA, exploratory anal. Rajapakse, J.C., + , EMB-M
Mar-Apr 06 102-111evaluating fMRI preprocessing pipelines. Strother, S.C., EMB-M
Mar-Apr 06 27-41event-related fMRI studies, increasing effect size. McKeown, M.J.,
+ , EMB-M Mar-Apr 06 91-101functional MRI, brief introduction. Pekar, J.J., EMB-M Mar-Apr 06 24-26functional near-IR spectrosc. Bunce, S.C., + , EMB-M Jul-Aug 06
54-62multisubject fMRI data, modeling and inference. Mumford, J.A., + ,
EMB-M Mar-Apr 06 42-51neuroengineering, therapeutic technols. Thakor, N.V., + , EMB-M
Sep-Oct 06 30-31subjs., fMRI-based research, small nos. Savoy, R.L., EMB-M Mar-
Apr 06 52-59surfing brain. Van de Ville, D., + , EMB-M Mar-Apr 06 65-78unmixing fMRI, ICA. Calhoun, V.D., + , EMB-M Mar-Apr 06 79-90
Brain; cf. Electroencephalography; Magnetoencephalography
Bridge circuitsWheatstone build, bridge. (Wheatstone’s bridge circuit). Geddes,
L.A., EMB-M May-Jun 06 88-90
C
Calibrationfacial skin and aural temp. Ng, E.Y.K., + , EMB-M May-Jun 06 68-74
Cardiac pacemakersevol. Haddad, S.A.P., + , EMB-M May-Jun 06 38-48
Cardiographymoral blindness and Guidant recall. Fielder, J., EMB-M Jan-Feb 06
98-99Cardiology
analysis of electrocardiograms during atrial fibrillation. Jacquemet,V., + , EMB-M Nov-Dec 06 79-88
atrial fibrillation and waveform characterization. Petrutiu, S., + ,EMB-M Nov-Dec 06 24-30
atrial fibrillation (special section). EMB-M Nov-Dec 06 14-88atrial fibrillation (special section intro.). Mainardi, L., + , EMB-M
Nov-Dec 06 14descriptors of wavefront propagation. Calcagnini, G., + , EMB-M
Nov-Dec 06 71-78detection and feature extraction of atrial tachyarrhythmias. Stridh,
M., + , EMB-M Nov-Dec 06 31-39electrocardiography of atrial fibrillation. Bollmann, A., + , EMB-M
IEEE ENGINEERING IN MEDICINE AND BIOLOGY MAGAZINE JANUARY/FEBRUARY 2007 113
+ check author entry for coauthors
Nov-Dec 06 15-23intracardiac electrograms in atrial fibrillation. Houben, R.P.M., + ,
EMB-M Nov-Dec 06 40-51linear and nonlinear coupling between atrial signals. Mainardi, L.T.,
+ , EMB-M Nov-Dec 06 63-70management of atrial tachyarrhythmias. Mehra, R., + , EMB-M Nov-
Dec 06 52-62Cardiology; cf. Cardiovascular system; ElectrocardiographyCardiovascular system
descriptors of wavefront propagation. Calcagnini, G., + , EMB-MNov-Dec 06 71-78
management of atrial tachyarrhythmias. Mehra, R., + , EMB-M Nov-Dec 06 52-62
Cells (electric); cf. Fuel cellsCellular biophysics
sex and stem cell research. Fielder, J., EMB-M Nov-Dec 06 96-98Codes
claude Shannon, biologist (information theory used biol.).Schneider, T.S., EMB-M Jan-Feb 06 30-33
ComparatorsWheatstone build, bridge. (Wheatstone’s bridge circuit). Geddes,
L.A., EMB-M May-Jun 06 88-90Computer applications; cf. Handicapped aids; Humanities; PublishingComputerized instrumentation; cf. Computerized tomographyComputerized tomography
book review; Ionizing Radiation Detectors for Medical Imaging (DelGuerra, A.; 2004). Madhaven, G., EMB-M Jul-Aug 06 10
Computer peripheral equipment; cf. Interactive devicesCurrent
life sciences, engng. contribs. Geddes, L.A., EMB-M Jul-Aug 06 88-91
D
Decision makingbook review; How Professionals Make Decisions (Montgomery, H.
et al., Eds.; 2004). Madhaven, G., EMB-M Nov-Dec 06 12-13Defibrillators
analysis of electrocardiograms during atrial fibrillation. Jacquemet,V., + , EMB-M Nov-Dec 06 79-88
atrial fibrillation and waveform characterization. Petrutiu, S., + ,EMB-M Nov-Dec 06 24-30
detection and feature extraction of atrial tachyarrhythmias. Stridh,M., + , EMB-M Nov-Dec 06 31-39
electrocardiography of atrial fibrillation. Bollmann, A., + , EMB-MNov-Dec 06 15-23
intracardiac electrograms in atrial fibrillation. Houben, R.P.M., + ,EMB-M Nov-Dec 06 40-51
linear and nonlinear coupling between atrial signals. Mainardi, L.T.,+ , EMB-M Nov-Dec 06 63-70
management of atrial tachyarrhythmias. Mehra, R., + , EMB-M Nov-Dec 06 52-62
moral blindness and Guidant recall. Fielder, J., EMB-M Jan-Feb 06 98-99Design engineering
biomedical student design projects. Goldberg, J.R., EMB-M Nov-Dec 06 90-93
Design of experimentsfirst experiments on electrical safety. Geddes, L.A., EMB-M Nov-
Dec 06 92-93Detectors
brain-computer interfaces, sens. Hochberg, L.R., + , EMB-M Sep-Oct 06 32-38
Display instrumentation; cf. Three-dimensional displaysDNA
examining coding struct. and redundancy. Rosen, G., EMB-M Jan-Feb 06 62-68
nucleotide alphabet, digital parity and comp. Mac Donaill, D.A.,EMB-M Jan-Feb 06 54-61
Document handling; cf. Text analysis
E
Education; cf. Biomedical education; Engineering education
Electric actuators; cf. Microactuators; Piezoelectric actuatorsElectrical safety
first experiments on electrical safety. Geddes, L.A., EMB-M Nov-Dec 06 92-93
Electric potential; cf. Bioelectric potentialsElectrocardiography
analysis of electrocardiograms during atrial fibrillation. Jacquemet,V., + , EMB-M Nov-Dec 06 79-88
atrial fibrillation and waveform characterization. Petrutiu, S., + ,EMB-M Nov-Dec 06 24-30
atrial fibrillation (special section). EMB-M Nov-Dec 06 14-88atrial fibrillation (special section intro.). Mainardi, L., + , EMB-M
Nov-Dec 06 14detecting electrocautery noise, ECG, wavelet approach. Brouse, C.,
+ , EMB-M Jul-Aug 06 76-82electrocardiography of atrial fibrillation. Bollmann, A., + , EMB-M
Nov-Dec 06 15-23pacemakers, evol. Haddad, S.A.P., + , EMB-M May-Jun 06 38-48
Electroencephalographyclinical neuroengineering, part 1 - neurodiagnostics (special section).
EMB-M Jul-Aug 06 18-62clinical neuroengineering, part 1 - neurodiagnostics (special section
intro.). Thakor, N.V., + , EMB-M Jul-Aug 06 18-19cortical connectivity patterns, intention of limb movements, estim.
Astolfi, L., + , EMB-M Jul-Aug 06 32-38EEG/MEG, MRI and fMRI, integrat. Zhongming Liu, + , EMB-M
Jul-Aug 06 46-53quantitat. EEG assess. Thakor, N.V., + , EMB-M Jul-Aug 06 20-25sleep EEG, micro- and macrostructure. Malinowska, U., + , EMB-M
Jul-Aug 06 26-31Electromyography
book review; Electromyography: Physiology, Engineering, andNoninvasive Applications (Merletti, R. and Parker, P.; 2004).Shiavi, R., EMB-M Nov-Dec 06 11-12
clinical neuroengineering, part 1 - neurodiagnostics (special section).EMB-M Jul-Aug 06 18-62
clinical neuroengineering, part 1 - neurodiagnostics (special sectionintro.). Thakor, N.V., + , EMB-M Jul-Aug 06 18-19
Electronic engineering; cf. NanoelectronicsElectronic mail
vacation, all I ever wanted. Baura, G.D., EMB-M Nov-Dec 06 94Electronic publishing
IEEE publications. Kerbaol, M., + , EMB-M Mar-Apr 06 6-9Emission tomography; cf. Positron emission tomography; Single pho-
ton emission computed tomographyEncoding
commun. theory and mol. biol., crossroads. May, E.E., EMB-M Jan-Feb 06 28-29
Encoding; cf. CodesEngineering; cf. Biomedical engineering; Design engineering;
Engineering educationEngineering education
biomedical student design projects. Goldberg, J.R., EMB-M Nov-Dec 06 90-93
engineering accreditation and Intelligent Design. Baura, G.D., EMB-M Jan-Feb 06 26
Janie needs relevance - women in engineering. Baura, G.D., EMB-MJul-Aug 06 85-86
Entropyparity binary seqs., detecting struct. Gonzalez, D.L., + , EMB-M Jan-
Feb 06 69-81Error correction
communication theory and molecular biology (special section).EMB-M Jan-Feb 06 28-97
communication theory and molecular biology (special sectionintro.). May, E.E., EMB-M Jan-Feb 06 28-29
Error correction codingbiol., quest. Gupta, M.K., EMB-M Jan-Feb 06 46-53DNA, examining coding struct. and redundancy. Rosen, G., EMB-M
Jan-Feb 06 62-68E. coli K-12 ribosome binding sites, class. May, E.E., + , EMB-M
Jan-Feb 06 90-97
114 IEEE ENGINEERING IN MEDICINE AND BIOLOGY MAGAZINE JANUARY/FEBRUARY 2007
Annual Index (continued)
+ check author entry for coauthors
parity binary seqs., detecting struct. Gonzalez, D.L., + , EMB-M Jan-Feb 06 69-81
should genetics, inform.-theoretic education. Battail, G., EMB-MJan-Feb 06 34-45
Error detection codingparity binary seqs., detecting struct. Gonzalez, D.L., + , EMB-M Jan-
Feb 06 69-81Estimation
cortical connectivity patterns, intention of limb movements, estim.Astolfi, L., + , EMB-M Jul-Aug 06 32-38
Ethical aspectssex and stem cell research. Fielder, J., EMB-M Nov-Dec 06 96-98
Expert systems; cf. Medical expert systems
F
Feature extractiondetection and feature extraction of atrial tachyarrhythmias. Stridh,
M., + , EMB-M Nov-Dec 06 31-39fMRI, multivariate stat. anal. Rowe, D.B., + , EMB-M Mar-Apr 06 60-64
Filteringintraoperative neurological monitoring. Hongxuan Zhang, + , EMB-
M Jul-Aug 06 39-45Flow measurement; cf. Blood flow measurementFrequency-domain analysis; cf. Time-frequency analysisFuel cells
neural implants, passing data and supplying power. Mingui Sun, + ,EMB-M Sep-Oct 06 39-46
G
Gender issuessex and stem cell research. Fielder, J., EMB-M Nov-Dec 06 96-98
Geneticscommun. theory and mol. biol., crossroads. May, E.E., EMB-M Jan-
Feb 06 28-29E. coli K-12 ribosome binding sites, class. May, E.E., + , EMB-M
Jan-Feb 06 90-97error correction, biol., quest. Gupta, M.K., EMB-M Jan-Feb 06 46-
53parity binary seqs., detecting struct. Gonzalez, D.L., + , EMB-M Jan-
Feb 06 69-81sex and stem cell research. Fielder, J., EMB-M Nov-Dec 06 96-98should genetics, inform.-theoretic education. Battail, G., EMB-M
Jan-Feb 06 34-45similarly expressed genes, finding large domains. Nicorici, D., + ,
EMB-M Jan-Feb 06 82-89viral envelope, vehicle for tracer, drug, gene delivery. Flexman, J.A.,
+ , EMB-M Jul-Aug 06 70-75Globalization
book review; Usability and Internationalization of InformationTechnology (Akin, N.; 2004). Anderson, D., + , EMB-M Jan-Feb06 16
Government policies; cf. Research initiatives
Group theorymultisubject fMRI data, modeling and inference. Mumford, J.A., + ,
EMB-M Mar-Apr 06 42-51
H
Handicapped aidsbiomedical engineering humanitarianism (special section intro.).
Malkin, R., EMB-M May-Jun 06 16, 19book review; Smart Technology for Aging, Disability and
Independence (Mann, W.C.; 2005). Richter, M., EMB-M Mar-Apr06 14-15
brain-computer interfaces, sens. Hochberg, L.R., + , EMB-M Sep-Oct 06 32-38
humanitarian efforts of biomedical engineers (special section). EMB-M May-Jun 06 16, 18-37
neuroengineering, therapeutic technols. Thakor, N.V., + , EMB-MSep-Oct 06 30-31
pers., disabilities, senior design. Enderle, J.D., EMB-M May-Jun 0625-29
Haptic interfacesbook review; Creative 3-D Display and Interaction Interfaces
(Blundell, B.G. and Schwartz, A.J.; 2006). King, P.H., EMB-MMay-Jun 06 9-10
Health carebook review; Misadventures in Health Care - Inside Stories (Bogner,
M.S., Ed.; 2004). France, D., EMB-M May-Jun 06 10Hemodynamics; cf. Blood flow measurement; Blood pressure measure-
mentHigher order statistics
unmixing fMRI, ICA. Calhoun, V.D., + , EMB-M Mar-Apr 06 79-90History
was 1st. genetic engineer. Geddes, L.A., EMB-M Jan-Feb 06 101Humanities
sci., engng., humanity. Ernst, R.R., EMB-M May-Jun 06 18-19Humanities; cf. HistoryHuman resource management
Janie needs relevance - women in engineering. Baura, G.D., EMB-MJul-Aug 06 85-86
I
IEEEanalysis of IEEE publications in biomedical engineering. Bansard,
J.-Y., + , EMB-M Sep-Oct 06 6, 8, 10-12Image classification
motion, med. imaging, part 2, shape and fn. Coatrieux, J.L., EMB-MJan-Feb 06 6-21
Image processing; cf. Computerized tomography; Image recognition;Image reconstruction; Image registration
Image recognitionfMRI neuroinformatics. Nielsen, F.A., + , EMB-M Mar-Apr 06 112-
119Image recognition; cf. Image classificationImage reconstruction
fMRI neuroinformatics. Nielsen, F.A., + , EMB-M Mar-Apr 06 112-119
Image registrationfMRI neuroinformatics. Nielsen, F.A., + , EMB-M Mar-Apr 06 112-
119image-guided neurosurgery, Brigham and Women’s Hospital.
Dimaio, S.P., + , EMB-M Sep-Oct 06 67-73Imaging; cf. Biomedical imaging; Infrared imagingIndexing
analysis of IEEE publications in biomedical engineering. Bansard,J.-Y., + , EMB-M Sep-Oct 06 6, 8, 10-12
Industrial property; cf. PatentsInformation analysis
analysis of IEEE publications in biomedical engineering. Bansard,J.-Y., + , EMB-M Sep-Oct 06 6, 8, 10-12
Information analysis; cf. Indexing; Text analysisInformation networks; cf. InternetInformation rates
claude Shannon, biologist (information theory used biol.).Schneider, T.S., EMB-M Jan-Feb 06 30-33
Information resources; cf. Web sitesInformation science; cf. Information analysis; Information servicesInformation services
IEEE publications. Kerbaol, M., + , EMB-M Mar-Apr 06 6-9Information technology
book review; Usability and Internationalization of InformationTechnology (Akin, N.; 2004). Anderson, D., + , EMB-M Jan-Feb06 16
Information theorycommunication theory and molecular biology (special section).
EMB-M Jan-Feb 06 28-97communication theory and molecular biology (special section
intro.). May, E.E., EMB-M Jan-Feb 06 28-29
IEEE ENGINEERING IN MEDICINE AND BIOLOGY MAGAZINE JANUARY/FEBRUARY 2007 115
+ check author entry for coauthors
commun. theory and mol. biol., crossroads. May, E.E., EMB-M Jan-Feb 06 28-29
Information theory; cf. Encoding; EntropyInfrared imaging
breathing fn., noncontact meas. Murthy, R., + , EMB-M May-Jun 0657-67
facial skin and aural temp. Ng, E.Y.K., + , EMB-M May-Jun 06 68-74
Infrared spectroscopyfunctional near-IR spectrosc. Bunce, S.C., + , EMB-M Jul-Aug 06
54-62Innovation management
interview with Robert Schmidt, chairman and founder of CleveMed,Orbital Research, and their spin-offs. Demir, S.S., EMB-M May-Jun 06 12-15
Instrumentationbook review; Design and Development of Medical Electronic
Instrumentation (Prutchi, D. and Norris, M.; 2004). Galloway,R.L., EMB-M May-Jun 06 10-11
Integrated circuit designpacemakers, evol. Haddad, S.A.P., + , EMB-M May-Jun 06 38-48
Interactive devicesbook review; Creative 3-D Display and Interaction Interfaces
(Blundell, B.G. and Schwartz, A.J.; 2006). King, P.H., EMB-MMay-Jun 06 9-10
Internetportrait of a biomedical engineer as a blogger. Flexman, J., EMB-M
Nov-Dec 06 9-10Interviews
interview with Diana Hodgins, managing director of ETB, amicrosystem design house. Demir, S.S., EMB-M Jan-Feb 06 19-21
interview with Robert Schmidt, chairman and founder of CleveMed,Orbital Research, and their spin-offs. Demir, S.S., EMB-M May-Jun 06 12-15
K
Kidneysmed. and biol., MEMS. Panescu, D., EMB-M Sep-Oct 06 19-28
L
Large-scale integrationretinal prosthesis, Si LSI-based smart stimulators. Ohta, J., + , EMB-
M Sep-Oct 06 47-59Least squares methods
event-related fMRI studies, increasing effect size. McKeown, M.J.,+ , EMB-M Mar-Apr 06 91-101
Legal factorsethics and FDA. Fielder, J., EMB-M Jul-Aug 06 13-17
M
Machining; cf. MicromachiningMacromolecules; cf. DNAMagnetic resonance imaging; cf. Biomedical MRIMagnetoencephalography
EEG/MEG, MRI and fMRI, integrat. Zhongming Liu, + , EMB-MJul-Aug 06 46-53
MaintenanceInternational Aid’s med. equipt. training program. Teninty, B., EMB-
M May-Jun 06 23-24success (one program corrects problems of hospitals, developing
world), prescription. Russell, G., EMB-M May-Jun 06 30-31Management
management of atrial tachyarrhythmias. Mehra, R., + , EMB-M Nov-Dec 06 52-62
Management; cf. Human resource managementManagement science
book review; How Professionals Make Decisions (Montgomery, H.et al., Eds.; 2004). Madhaven, G., EMB-M Nov-Dec 06 12-13
Mathematics; cf. Statistics
Measurement; cf. Acceleration measurement
Measurement systemsbook review; Introduction to Mechatronics and Measurement
Systems, 3rd edition (Alciatore, D. and Histand, M.). King, P.H.,EMB-M Jul-Aug 06 10-11
Mechanical factorslife sciences, engng. contribs. Geddes, L.A., EMB-M Jul-Aug 06 88-
91Mechanical variables measurement; cf. Pressure measurementMechanics; cf. BiomechanicsMechatronics
book review; Introduction to Mechatronics and MeasurementSystems, 3rd edition (Alciatore, D. and Histand, M.). King, P.H.,EMB-M Jul-Aug 06 10-11
Medical computingbiomedical engineering humanitarianism (special section intro.).
Malkin, R., EMB-M May-Jun 06 16, 19humanitarian efforts of biomedical engineers (special section). EMB-
M May-Jun 06 16, 18-37Medical computing; cf. Medical expert systems; Medical signal pro-
cessingMedical diagnosis
pacemakers, evol. Haddad, S.A.P., + , EMB-M May-Jun 06 38-48robotic colonoscopy, locomotion techs. Kassim, I., + , EMB-M May-
Jun 06 49-56Medical expert systems
detecting electrocautery noise, ECG, wavelet approach. Brouse, C.,+ , EMB-M Jul-Aug 06 76-82
Medical signal processingatrial fibrillation (special section). EMB-M Nov-Dec 06 14-88atrial fibrillation (special section intro.). Mainardi, L., + , EMB-M
Nov-Dec 06 14descriptors of wavefront propagation. Calcagnini, G., + , EMB-M
Nov-Dec 06 71-78Microactuators
med. and biol., MEMS. Panescu, D., EMB-M Sep-Oct 06 19-28Micromachining
med. and biol., MEMS. Panescu, D., EMB-M Sep-Oct 06 19-28Micromechanical devices; cf. Microactuators; MicrosensorsMicrosensors
interview with Diana Hodgins, managing director of ETB, amicrosystem design house. Demir, S.S., EMB-M Jan-Feb 06 19-21
med. and biol., MEMS. Panescu, D., EMB-M Sep-Oct 06 19-28Microsystems
interview with Diana Hodgins, managing director of ETB, amicrosystem design house. Demir, S.S., EMB-M Jan-Feb 06 19-21
Molecular biophysicscommunication theory and molecular biology (special section).
EMB-M Jan-Feb 06 28-97communication theory and molecular biology (special section
intro.). May, E.E., EMB-M Jan-Feb 06 28-29Molecules; cf. Molecular biophysicsMonitoring; cf. Patient monitoringMuscle; cf. ElectromyographyMuscles
brief, tissue engng. and Eucomed news. Papadaki, M., EMB-M May-Jun 06 91
N
Nanoelectronicsbook review; Handbook of Nanoscience, Engineering and
Technology (Goddard, William, III et al., Eds.; 2002). Madhaven,G., EMB-M Jul-Aug 06 11-12
Nanotechnologybook review; Handbook of Nanoscience, Engineering and
Technology (Goddard, William, III et al., Eds.; 2002). Madhaven,G., EMB-M Jul-Aug 06 11-12
Nanotechnology; cf. NanoelectronicsNatural sciences computing; cf. Medical computingNervous system
116 IEEE ENGINEERING IN MEDICINE AND BIOLOGY MAGAZINE JANUARY/FEBRUARY 2007
Annual Index (continued)
+ check author entry for coauthors
brain-computer interfaces, sens. Hochberg, L.R., + , EMB-M Sep-Oct 06 32-38
brain connectivity, ICA, exploratory anal. Rajapakse, J.C., + , EMB-M Mar-Apr 06 102-111
cortical connectivity patterns, intention of limb movements, estim.Astolfi, L., + , EMB-M Jul-Aug 06 32-38
EEG/MEG, MRI and fMRI, integrat. Zhongming Liu, + , EMB-MJul-Aug 06 46-53
evaluating fMRI preprocessing pipelines. Strother, S.C., EMB-MMar-Apr 06 27-41
event-related fMRI studies, increasing effect size. McKeown, M.J.,+ , EMB-M Mar-Apr 06 91-101
fMRI neuroinformatics. Nielsen, F.A., + , EMB-M Mar-Apr 06 112-119
functional MRI, brief introduction. Pekar, J.J., EMB-M Mar-Apr 0624-26
image-guided neurosurgery, Brigham and Women’s Hospital.Dimaio, S.P., + , EMB-M Sep-Oct 06 67-73
intraocular retinal prosthesis. Weiland, J.D., + , EMB-M Sep-Oct 0660-66
intraoperative neurological monitoring. Hongxuan Zhang, + , EMB-M Jul-Aug 06 39-45
multisubject fMRI data, modeling and inference. Mumford, J.A., + ,EMB-M Mar-Apr 06 42-51
neural implants, passing data and supplying power. Mingui Sun, + ,EMB-M Sep-Oct 06 39-46
neuroengineering, therapeutic technols. Thakor, N.V., + , EMB-MSep-Oct 06 30-31
subjs., fMRI-based research, small nos. Savoy, R.L., EMB-M Mar-Apr 06 52-59
Networks (circuits); cf. Bridge circuitsNetwork synthesis; cf. Integrated circuit designNeurophysiology
book review; Event-Related Potentials: A Methods Handbook(Handy, T., Ed.; 2005). Binseng Wang, EMB-M Mar-Apr 06 14
book review; Neurophysiological Monitoring During Intensive Careand Surgery (Smith, N.J. et al.; 2006). King, P., EMB-M Nov-Dec06 13
clinical neuroengineering, part 1 - neurodiagnostics (special section).EMB-M Jul-Aug 06 18-62
clinical neuroengineering, part 1 - neurodiagnostics (special sectionintro.). Thakor, N.V., + , EMB-M Jul-Aug 06 18-19
Noisedetecting electrocautery noise, ECG, wavelet approach. Brouse, C.,
+ , EMB-M Jul-Aug 06 76-82event-related fMRI studies, increasing effect size. McKeown, M.J.,
+ , EMB-M Mar-Apr 06 91-101
O
Optical sensors; cf. Wavefront sensorsOrganic compounds; cf. DNA; ProteinsOxygen
evaluating fMRI preprocessing pipelines. Strother, S.C., EMB-MMar-Apr 06 27-41
P
Paleontologybook review; Virtual Reconstruction: A Primer on Computer-
Assisted Paleontology and Biomedicine (Zollikofer, C.P. andPonce de Leon, M.S.; 2005). King, P.H., EMB-M May-Jun 06 11
Patentsinterpreting patent claims, What a difference a day made. Klee,
M.M., EMB-M Jan-Feb 06 100quit (patents), knowing. Klee, M.M., EMB-M Sep-Oct 06 81U.S. patent reached, world (patent infringement). Klee, M.M., EMB-
M May-Jun 06 76-83Patient care
book review; Engineering for Patient Safety: Issues in MinimallyInvasive Procedures (Dankelman, J. et al., Eds.; 2005). King, P.H.,EMB-M Jan-Feb 06 14
book review; Misadventures in Health Care - Inside Stories (Bogner,M.S., Ed.; 2004). France, D., EMB-M May-Jun 06 10
Patient diagnosis; cf. Biomedical imagingPatient monitoring
book review; Neurophysiological Monitoring During Intensive Careand Surgery (Smith, N.J. et al.; 2006). King, P., EMB-M Nov-Dec06 13
book review; Smart Technology for Aging, Disability andIndependence (Mann, W.C.; 2005). Richter, M., EMB-M Mar-Apr06 14-15
management of atrial tachyarrhythmias. Mehra, R., + , EMB-M Nov-Dec 06 52-62
Patient treatmentanalysis of electrocardiograms during atrial fibrillation. Jacquemet,
V., + , EMB-M Nov-Dec 06 79-88atrial fibrillation and waveform characterization. Petrutiu, S., + ,
EMB-M Nov-Dec 06 24-30book review; Engineering for Patient Safety: Issues in Minimally
Invasive Procedures (Dankelman, J. et al., Eds.; 2005). King, P.H.,EMB-M Jan-Feb 06 14
book review; Misadventures in Health Care - Inside Stories (Bogner,M.S., Ed.; 2004). France, D., EMB-M May-Jun 06 10
detection and feature extraction of atrial tachyarrhythmias. Stridh,M., + , EMB-M Nov-Dec 06 31-39
electrocardiography of atrial fibrillation. Bollmann, A., + , EMB-MNov-Dec 06 15-23
intracardiac electrograms in atrial fibrillation. Houben, R.P.M., + ,EMB-M Nov-Dec 06 40-51
management of atrial tachyarrhythmias. Mehra, R., + , EMB-M Nov-Dec 06 52-62
Patient treatment; cf. SurgeryPatient treatments
first experiments on electrical safety. Geddes, L.A., EMB-M Nov-Dec 06 92-93
Pattern classification; cf. Image classificationPattern recognition; cf. Feature extraction; Image recognitionPerformance evaluation
analysis of electrocardiograms during atrial fibrillation. Jacquemet,V., + , EMB-M Nov-Dec 06 79-88
Physiologybook review; Biomedical Imaging Principles and Applications in
Engineering Series (Mudry, K.M. et al.; 2003). Testa, D.M., EMB-M May-Jun 06 9
Physiology; cf. NeurophysiologyPiezoelectric actuators
interview with Diana Hodgins, managing director of ETB, amicrosystem design house. Demir, S.S., EMB-M Jan-Feb 06 19-21
Piezoelectric devices; cf. Piezoelectric actuatorsPositron emission tomography
book review; Ionizing Radiation Detectors for Medical Imaging (DelGuerra, A.; 2004). Madhaven, G., EMB-M Jul-Aug 06 10
viral envelope, vehicle for tracer, drug, gene delivery. Flexman, J.A.,+ , EMB-M Jul-Aug 06 70-75
Prejudicial factors; cf. Gender issuesPressure measurement
med. and biol., MEMS. Panescu, D., EMB-M Sep-Oct 06 19-28Pressure measurement; cf. Blood pressure measurementProfessional aspects
qualifications of a modern biomedical engineer. Geddes, L.A., EMB-M Sep-Oct 06 82
vacation, all I ever wanted. Baura, G.D., EMB-M Nov-Dec 06 94Prosthetics
brain-computer interfaces, sens. Hochberg, L.R., + , EMB-M Sep-Oct 06 32-38
computer-assisted arthroplasty, bioengineered autografts. Sidler, R.,+ , EMB-M Jul-Aug 06 63-69
intraocular retinal prosthesis. Weiland, J.D., + , EMB-M Sep-Oct 0660-66
med. and biol., MEMS. Panescu, D., EMB-M Sep-Oct 06 19-28neuroengineering, therapeutic technols. Thakor, N.V., + , EMB-M
Sep-Oct 06 30-31neurological disorders, elec. stimulation, therapy. Testerman, R.L.,

IEEE ENGINEERING IN MEDICINE AND BIOLOGY MAGAZINE JANUARY/FEBRUARY 2007 117
+ check author entry for coauthors
+ , EMB-M Sep-Oct 06 74-78providing senior design students, clinical perspective. Goldberg,
J.R., EMB-M Mar-Apr 06 20-21retinal prosthesis, Si LSI-based smart stimulators. Ohta, J., + , EMB-
M Sep-Oct 06 47-59Proteins
commun. theory and mol. biol., crossroads. May, E.E., EMB-M Jan-Feb 06 28-29
functional near-IR spectrosc. Bunce, S.C., + , EMB-M Jul-Aug 0654-62
Psychologybook review; How Professionals Make Decisions (Montgomery, H.
et al., Eds.; 2004). Madhaven, G., EMB-M Nov-Dec 06 12-13understanding organizational wrongdoing II. Fielder, J., EMB-M
Mar-Apr 06 120-123Publishing
analysis of IEEE publications in biomedical engineering. Bansard,J.-Y., + , EMB-M Sep-Oct 06 6, 8, 10-12
Publishing; cf. Electronic publishing
Q
Qualificationsqualifications of a modern biomedical engineer. Geddes, L.A., EMB-
M Sep-Oct 06 82
R
Radioactive materialsviral envelope, vehicle for tracer, drug, gene delivery. Flexman, J.A.,
+ , EMB-M Jul-Aug 06 70-75Radiology
book review; Ionizing Radiation Detectors for Medical Imaging (DelGuerra, A.; 2004). Madhaven, G., EMB-M Jul-Aug 06 10
RecruitmentJanie needs relevance - women in engineering. Baura, G.D., EMB-M
Jul-Aug 06 85-86Research and development
sex and stem cell research. Fielder, J., EMB-M Nov-Dec 06 96-98Research and development management; cf. Innovation managementResearch initiatives
biomedical student design projects. Goldberg, J.R., EMB-M Nov-Dec 06 90-93
ResistanceWheatstone build, bridge. (Wheatstone’s bridge circuit). Geddes,
L.A., EMB-M May-Jun 06 88-90Respiratory system
breathing fn., noncontact meas. Murthy, R., + , EMB-M May-Jun 0657-67
Reviewsbrain-computer interfaces, sens. Hochberg, L.R., + , EMB-M Sep-
Oct 06 32-38DNA, examining coding struct. and redundancy. Rosen, G., EMB-M
Jan-Feb 06 62-68pacemakers, evol. Haddad, S.A.P., + , EMB-M May-Jun 06 38-48pers., disabilities, senior design. Enderle, J.D., EMB-M May-Jun 06
25-29robotic colonoscopy, locomotion techs. Kassim, I., + , EMB-M May-
Jun 06 49-56
S
Semiconductor devicesretinal prosthesis, Si LSI-based smart stimulators. Ohta, J., + , EMB-
M Sep-Oct 06 47-59Sensors; cf. Microsensors; Tactile sensorsSet theory; cf. Group theorySignal classification; cf. Image classificationSignal processing; cf. Medical signal processingSignal reconstruction; cf. Image reconstructionSilicon
retinal prosthesis, Si LSI-based smart stimulators. Ohta, J., + , EMB-
M Sep-Oct 06 47-59Single photon emission computed tomography
book review; Ionizing Radiation Detectors for Medical Imaging (DelGuerra, A.; 2004). Madhaven, G., EMB-M Jul-Aug 06 10
Skinfacial skin and aural temp. Ng, E.Y.K., + , EMB-M May-Jun 06 68-
74med. and biol., MEMS. Panescu, D., EMB-M Sep-Oct 06 19-28
Social sciences; cf. TeachingSpecial issues and sections
atrial fibrillation (special section). EMB-M Nov-Dec 06 14-88atrial fibrillation (special section intro.). Mainardi, L., + , EMB-M
Nov-Dec 06 14biomedical engineering humanitarianism (special section intro.).
Malkin, R., EMB-M May-Jun 06 16, 19clinical neuroengineering, part 1 - neurodiagnostics (special section).
EMB-M Jul-Aug 06 18-62clinical neuroengineering, part 1 - neurodiagnostics (special section
intro.). Thakor, N.V., + , EMB-M Jul-Aug 06 18-19communication theory and molecular biology (special section).
EMB-M Jan-Feb 06 28-97communication theory and molecular biology (special section
intro.). May, E.E., EMB-M Jan-Feb 06 28-29humanitarian efforts of biomedical engineers (special section). EMB-
M May-Jun 06 16, 18-37methods for functional magnetic resonance imaging (fMRI) data
analysis (special issue). EMB-M Mar-Apr 06 22-119methods for functional magnetic resonance imaging (fMRI) data
analysis (special issue intro.). EMB-M Mar-Apr 06 22-23Spectroscopy; cf. Infrared spectroscopyStatistical analysis; cf. Design of experiments; Higher order statisticsStatistics
breathing fn., noncontact meas. Murthy, R., + , EMB-M May-Jun 0657-67
facial skin and aural temp. Ng, E.Y.K., + , EMB-M May-Jun 06 68-74
parity binary seqs., detecting struct. Gonzalez, D.L., + , EMB-M Jan-Feb 06 69-81
surfing brain. Van de Ville, D., + , EMB-M Mar-Apr 06 65-78Surgery
book review; Engineering for Patient Safety: Issues in MinimallyInvasive Procedures (Dankelman, J. et al., Eds.; 2005). King, P.H.,EMB-M Jan-Feb 06 14
computer-assisted arthroplasty, bioengineered autografts. Sidler, R.,+ , EMB-M Jul-Aug 06 63-69
facial reconstructive surgery, bone and cartilage tissue engng.Farhadi, J., + , EMB-M Jan-Feb 06 106-109
image-guided neurosurgery, Brigham and Women’s Hospital.Dimaio, S.P., + , EMB-M Sep-Oct 06 67-73
neuroengineering, therapeutic technols. Thakor, N.V., + , EMB-MSep-Oct 06 30-31
T
Tactile sensorsmed. and biol., MEMS. Panescu, D., EMB-M Sep-Oct 06 19-28
Teachingbiomedical student design projects. Goldberg, J.R., EMB-M Nov-
Dec 06 90-93Telecommunication services; cf. Electronic mail; TelegraphyTelegraphy
Wheatstone build, bridge. (Wheatstone’s bridge circuit). Geddes,L.A., EMB-M May-Jun 06 88-90
Text analysisanalysis of IEEE publications in biomedical engineering. Bansard,
J.-Y., + , EMB-M Sep-Oct 06 6, 8, 10-12Thermodynamic properties; cf. EntropyThesauri
analysis of IEEE publications in biomedical engineering. Bansard,J.-Y., + , EMB-M Sep-Oct 06 6, 8, 10-12
Three-dimensional displaysbook review; Creative 3-D Display and Interaction Interfaces

Annual Index (continued)
(Blundell, B.G. and Schwartz, A.J.; 2006). King, P.H., EMB-MMay-Jun 06 9-10
book review; Virtual Reconstruction: A Primer on Computer-Assisted Paleontology and Biomedicine (Zollikofer, C.P. andPonce de Leon, M.S.; 2005). King, P.H., EMB-M May-Jun 06 11
Time-domain analysis; cf. Time-frequency analysisTime-frequency analysis
detection and feature extraction of atrial tachyarrhythmias. Stridh,M., + , EMB-M Nov-Dec 06 31-39
sleep EEG, micro- and macrostructure. Malinowska, U., + , EMB-MJul-Aug 06 26-31
Tomography; cf. Computerized tomographyTraining
International Aid’s med. equipt. training program. Teninty, B., EMB-M May-Jun 06 23-24
Transforms; cf. Wavelet transforms
U
Ultrasonic applications; cf. Biomedical ultrasonicsUser interfaces; cf. Haptic interfaces
V
VisualizationfMRI neuroinformatics. Nielsen, F.A., + , EMB-M Mar-Apr 06 112-
119Visual system
big E from. Geddes, L., EMB-M Mar-Apr 06 122-123facial skin and aural temp. Ng, E.Y.K., + , EMB-M May-Jun 06 68-
74intraocular retinal prosthesis. Weiland, J.D., + , EMB-M Sep-Oct 06
60-66med. and biol., MEMS. Panescu, D., EMB-M Sep-Oct 06 19-28neuroengineering, therapeutic technols. Thakor, N.V., + , EMB-M
Sep-Oct 06 30-31retinal prosthesis, Si LSI-based smart stimulators. Ohta, J., + , EMB-
M Sep-Oct 06 47-59Vocabulary; cf. Thesauri
W
Water resourcesrural water disinfection, low-cost soln. Taflin, C., EMB-M May-Jun
06 36-37Waveform analysis
atrial fibrillation and waveform characterization. Petrutiu, S., + ,EMB-M Nov-Dec 06 24-30
Wavefront sensorsdescriptors of wavefront propagation. Calcagnini, G., + , EMB-M
Nov-Dec 06 71-78Waveguide components; cf. Waveguide couplersWaveguide couplers
linear and nonlinear coupling between atrial signals. Mainardi, L.T.,+ , EMB-M Nov-Dec 06 63-70
Wavelet transformssurfing brain. Van de Ville, D., + , EMB-M Mar-Apr 06 65-78
Wave propagationdescriptors of wavefront propagation. Calcagnini, G., + , EMB-M
Nov-Dec 06 71-78Web sites
portrait of a biomedical engineer as a blogger. Flexman, J., EMB-MNov-Dec 06 9-10
+ check author entry for coauthors

Introducing T-BME Letters.IEEE Engineering in Medicine and Biology Society
announces a new publication format for reports of high
quality, novel and high impact biomedical engineering
science and methodologies with a prompt publication
turn around time. T-BME Letters combines the rapid
dissemination of electronic journals with the archival
value of in-print publications. Peer review, decision and
electronic posting of accepted manuscripts in IEEEXplore
take place within two months, after which accepted
papers can be downloaded by the research community
and can be referenced as “in Press” until printing.
Get the Recognition you deserve.T-BME Letters is a publication of the 8,000 member
IEEE Engineering in Medicine and Biology Society and
is managed as part of the prestigious and oldest
biomedical engineering journal, the IEEE Transactions
on Biomedical Engineering. It's the source engineers,
biomedical researchers and professionals turn to for up-
to-date and informative research on important advances
in biomedical engineering and applied biophysics.
Submitting a manuscript is easy.Manuscripts are to be short (4 pages), complete,
accurate and clear as all manuscripts are either
accepted “as is” (with only very minor modifications
possible), or rejected. They may be submitted to
the T-BME Manuscript Central website at
http://embs-ieee.manuscriptcentral.com
Put our fast-track publishing guarantee to the test.See for yourself what instant gratification feels like. Submit
your original manuscript to T-BME Letters and we promise
you’ll hear from us immediately. In fact, we guarantee it.
T-BME Letters is indexed by Medline/PubMed For
full submission details, please consult the journal website
at http://bme.cnel.ufl.edu
2 months fromsubmission topublication?
Now that’smore like it.
James A. VickStaff Director, Advertising Businesses
+1 212 419 7767; Fax: +1 212 419 [email protected]
Susan E. SchneidermanBusiness DevelopmentManager+1 732 562 3946; Fax: +1 732 981 [email protected]
Marion DelaneyAdvertising Sales Director+1 415 863 4717; Fax + 1 415 863 [email protected]
Product AdvertisingMidatlanticLisa Rinaldo+1 732 772 0160; Fax: +1 732 772 [email protected], NJ, PA, DE, MD, DC, KY, WV
ConnecticutStan Greenfield+1 203 938 2418; Fax: +1 203 938 [email protected]
New England/Eastern CanadaJody Estabrook+1 978 244 0192; Fax: +1 978 244 [email protected], VT, NH, MA, RI Canada: Nova Scotia, PrinceEdward Island, Newfoundland, New Brunswick, Quebec
SoutheastBill Holland+1 770 435 6549;Fax: +1 770 435 [email protected], NC, SC, GA, FL, AL, MS, TN
Midwest/Central CanadaDave Jones+1 708 442 5633Fax: +1 708 442 [email protected], IA, KS, MN, MO, NE, ND, SD,WI,Canada: Manitoba, Saskatchewan,Alberta
OhioJoe DiNardo+1 440 248 2456Fax: +1 440 248 [email protected]
Midwest/Ontario, CanadaWill Hamilton+1 269 381 2156Fax: +1 269 381 [email protected], MI Canada: Ontario
SouthwestSteve Loerch+1 847 498 4520Fax: +1 847 498 [email protected], LA, TX, OK
Southern California/Mt. StatesMarshall Rubin+1 818 888 2407Fax: +1 818 888 [email protected], CO, HI, NM, NV,UT,CA 93400 & below
Northern California/Northwest/Western CanadaPeter D. Scott+1 415 421 7950Fax: +1 415 398 [email protected], ID, MT, WY, OR, WA, CA 93401 & above.Canada: British Columbia,
Europe/Africa/Middle EastHeleen Vodegel+44 1875 825 700;Fax: +44 1875 825 [email protected], Africa, Middle East
Asia/Far East/Pacific RimSusan Schneiderman+1 723 562 3946;Fax: +1 723 981 [email protected], Far East, Pacific Rim,Australia, New Zealand
Recruitment AdvertisingMidatlanticLisa Rinaldo+1 732 772 0160Fax: +1 732 772 [email protected], NJ, CT, PA, DE, MD, DC, KY, WV
New England/Eastern CanadaJohn Restchack+1 212 419 7578;Fax: +1 212 419 [email protected], VT, NH, MA, RICanada: Quebec Nova Scotia,Prince Edward Island,Newfoundland, New Brunswick
SoutheastThomas Flynn+1 770 645 2944Fax: +1 770 993 [email protected], NC, SC, GA, FL, AL, MS, TN
Midwest/Texas/Central CanadaDarcy Giovingo+1 847 498 4520Fax: +1 847 498 [email protected], IL, IN, IA, KS, LA, MI, MN,MO, NE, ND, SD, OH, OK, TX,WI,Canada: Ontario, Manitoba,Saskatchewan, Alberta
West Coast/Southwest/Mountain StatesTim Matteson+1 310 836 4064; Fax: +1 310 836 [email protected], AZ, CA, CO, HI, ID, MT,NM, NV, OR, UT, WA, WY Canada: British Columbia
Europe/Africa/Middle EastHeleen Vodegel+44 1875 825 700;Fax: +44 1875 825 [email protected], Africa, Middle East
ADVERTISERS’ INDEX
The Advertisers’ Index contained in this issue is compiled as a service to our readers and advertisers: the publisher is not liable for errors or omissionsalthough every effort is made to ensure its accuracy. Be sure to let our advertisers know you found them through IEEE Engineering in Medicine andBiology Magazine.
Advertiser Page URL Phone
Ad Instruments . . . . . . . . . . . . . . . . . . . . . . . . . . . . . . . . . . . . . . .3 . . . . . . . . . . .www.adinstruments.com . . . . . . . . . . . . .+1 888 965 6040Biopac Systems,Inc . . . . . . . . . . . . . . . . . . . . . . . . . . . . . . .CVR 4 . . . . . . . . . . .www.biopac.com . . . . . . . . . . . . . . . . . . .+1 805 685 0066IEEE Enterprise . . . . . . . . . . . . . . . . . . . . . . . . . . . . . . . . . . . . . .9 . . . . . . . . . . .www.ieee.org/try_enterprise . . . . . . . . . . .+1 732 981 0060MathWorks,Inc. . . . . . . . . . . . . . . . . . . . . . . . . . . . . . . . . . .CVR2 . . . . . . . . . . .www.mathworks.com . . . . . . . . . . . . . . . .+1 508 647 7040
RecruitmentDuke University . . . . . . . . . . . . . . . . . . . . . . . . . . . . . . . . . . . .105EPFL . . . . . . . . . . . . . . . . . . . . . . . . . . . . . . . . . . . . . . . . . . . .104John Hopkins University . . . . . . . . . . . . . . . . . . . . . . . . . . . . .105University of Florida . . . . . . . . . . . . . . . . . . . . . . . . . . . . . . . .104
Coming in MarchMachine Learning
Call your local advertising sales representative today!
Space reservations: 2/2Material deadline: 2/8
Susan E. Schneiderman +1 732 562 3946 Tel.;Business Development Manager +1 732 981 1855 [email protected]
IEEE MAGAZINES445 Hoes Lane, Piscataway NJ 08855
www.ieee.org/ieeemedia
ADVERTISING SALES OFFICES

2007 EMBS ADMINISTRATIVE COMMITTEE
(Term expires December 31 of year indicated)
Executive Committee
President 2007-2008
Past President 2007
Finance2007-2008
Conferences 2006-2007
Member & Student Activities
2006-2007 Publications 2007-2008
Donna Hudson Yongmin Kim Craig Hartley Zhi Pei Liang Jorge Monzon Bin He University of
California University of Washington
Baylor College of Medicine
University of Illinois, Champaign
Northeastern National University
University of Minnesota
[email protected] yongmin.kim @ieee.org
[email protected] [email protected] [email protected]
1.206.685.2271 1.559.499.6671 1.713.798.4195 1.217.244.4023 54.3783.423126 x102 1.612.626.1115
Administrative Committee EMBS North America
Paolo Bonato ‘07 Harvard Medical School [email protected] 1.617.573.277
Robert Butera ‘07 Georgia Institute of Technology [email protected] 1.404.895.2935
Carole Carey ‘08 FDA/[email protected] 1.301.776.9882
Stephen Davies ‘08 University of Toronto [email protected]
Nathalie Gosset ‘09 University of Southern [email protected]
Andrew Laine ‘09 Columbia University [email protected] 1.212.854.6539
Elliot Sloane ‘09 Villanova University [email protected] 1.610.519.6432
EMBS Europe Student Representative Christian Roux ‘07 ENST Brest [email protected] 33.2. 9801.8107
Claudio Cobelli ‘09 University of Padova [email protected]+39.049.8277616
Gudrun Zahlmann ‘09
Siemens Medical
+49.9131.84.4944
Jennifer Flexman ‘07 University of Washington [email protected] 206.427.5040
EMBS Asia Pacific Kenji Sunagawa ‘07 Kyushu University/School of
Medicine
hu-u.ac.jp
81.92.642.5855
Young Ro Yoon ‘08 Yonsei University [email protected]
Jyh-Horng Chen ‘09 National Taiwan [email protected]
886.2.2369.9465
EMBS Middle East & Africa EMBS Latin America Executive Director Ahmed Morsy ‘07 Cairo University [email protected]
2 010 259 6417
Emilio Sacristan ‘08 Innovamedica / UAM [email protected] 52.5804.4630
Laura J. Wolf IEEE EMBS [email protected] 1.732.981.3433
Editors Ex-Officio Without Vote John Enderle ‘08 EMB Magazine [email protected] 1.860.486.5521
Bruce Wheeler ‘09 Transactions on Biomedical [email protected]
Nitish Thakor ‘08 Transactions on Neural Systems & Rehabilitation [email protected] 1.410.955.7093
Niilo Saranummi ‘07 Transactions on Information Technology in Biomedicine [email protected] 1.358-3-316 3300
Metin Akay ‘07 EMBS Book Series [email protected] 1.480.727.7120

Copyright © 2022 FDOKUMEN