A Three-Dimensional Model of a Group II Intron RNA and Its Interaction with the Intron-Encoded...
14
Molecular Cell Article A Three-Dimensional Model of a Group II Intron RNA and Its Interaction with the Intron-Encoded Reverse Transcriptase Lixin Dai, 1,5,7 Dinggeng Chai, 1,7 Shan-Qing Gu, 3,4 Jesse Gabel, 1 Sergei Y. Noskov, 1,2 Forrest J.H. Blocker, 3,4,6 Alan M. Lambowitz, 3,4 and Steven Zimmerly 1, * 1 Department of Biological Sciences 2 Institute for Biocomplexity and Informatics University of Calgary, Calgary, AB T2N 1N4, Canada 3 Department of Chemistry and Biochemistry, Institute for Cellular and Molecular Biology 4 Section of Molecular Genetics and Microbiology, School of Biological Sciences University of Texas at Austin, Austin, TX 78712, USA 5 Present address: Department of Molecular Biology and Genetics, Johns Hopkins University School of Medicine, Baltimore, MD 21205, USA. 6 Present address: AlarmPharm Consulting, San Francisco, CA 94117, USA. 7 These authors contributed equally to this work. *Correspondence: [email protected] DOI 10.1016/j.molcel.2008.04.001 SUMMARY Group II introns are self-splicing ribozymes believed to be the ancestors of spliceosomal introns. Many group II introns encode reverse transcriptases that promote both RNA splicing and intron mobility to new genomic sites. Here we used a circular permuta- tion and crosslinking method to establish 16 intra- molecular distance relationships within the mobile Lactococcus lactis Ll.LtrB-DORF intron. Using these new constraints together with 13 established tertiary interactions and eight published crosslinks, we mod- eled a complete three-dimensional structure of the intron. We also used the circular permutation strat- egy to map RNA-protein interaction sites through fluorescence quenching and crosslinking assays. Our model provides a comprehensive structural framework for understanding the function of group II ribozymes, their natural structural variations, and the mechanisms by which the intron-encoded protein promotes RNA splicing and intron mobility. The model also suggests an arrangement of active site elements that may be conserved in the spliceosome. INTRODUCTION Group II introns are ribozyme-based retroelements found in bac- teria, mitochondria, and chloroplasts (Lambowitz and Zimmerly, 2004). They are the putative ancestors of both nuclear spliceoso- mal introns and non-LTR retroelements and thus may have played a major role in the evolution of eukaryotic genomes (Eick- bush, 1999). A large number of mobile group II introns have been identified, each consisting of a structurally complex RNA and a multifunctional intron-encoded protein (IEP) having reverse transcriptase (RT) activity. The intron RNA catalyzes its own splicing from precursor RNA and also its integration into DNA during intron mobility. The IEP assists these reactions by stabiliz- ing the catalytic RNA structure, by providing access to DNA targets, and by reverse transcribing the integrated intron RNA (Lambowitz and Zimmerly, 2004). In addition to their evolutionary significance, group II introns have been harnessed to function as gene-targeting vectors (‘‘targetrons’’) that can be programmed to insert into virtually any DNA sequence (Perutka et al., 2004). However, in the absence of a complete three-dimensional struc- ture for a mobile group II intron, the mechanisms of group II intron splicing and mobility remain incompletely understood. Group II intron RNAs have a conserved secondary structure consisting of six helical domains (DI–DVI) arranged around a cen- tral wheel (Figure 1A). There are three major subclasses (IIA, IIB, and IIC), each distinguished by specific structural variations (Lambowitz and Zimmerly, 2004; Pyle and Lambowitz, 2006). The six domains fold into a catalytically active tertiary structure aided by 14 known long-range interactions, which were identi- fied by phylogenetic covariation and biochemical analyses (Figure 1A). Eight of these interactions involve Watson-Crick base pairs (a-a 0 , b-b 0 , g-g 0 , d-d 0 , 3-3 0 , IBS1-EBS1, IBS2-EBS2, and IBS3-EBS3), three are tetraloop-receptor interactions of known geometries (z-z 0 , h-h 0 , and q-q 0 ), and the other three are less defined (l-l 0 , k-k 0 , and m-m 0 ). Group II ribozymes catalyze splicing via two transesterification reactions that yield spliced exons and an intron lariat, analogous to the splicing mechanism of nuclear spliceosomal introns. Dur- ing these reactions, the 5 0 splice site is positioned at the active site by the IBS1-EBS1 and IBS2-EBS2 pairings (Figure 1A), while the 3 0 splice site is positioned by the interaction d-d 0 (IIA introns) or IBS3-EBS3 (IIB and IIC introns) as well as by the g-g 0 pairing of the last nucleotide of the intron (Costa et al., 2000; Pyle and Lam- bowitz, 2006). In IIB and probably IIC introns, the branchpoint A is positioned by a conserved region of DId dubbed the coordina- tion loop, which brings together the bulged A and both exons; however, a conserved motif corresponding to the coordination loop is not present in IIA introns (Pyle and Lambowitz, 2006). 472 Molecular Cell 30, 472–485, May 23, 2008 ª2008 Elsevier Inc.
-
Upload
independent -
Category
Documents
-
view
5 -
download
0
Transcript of A Three-Dimensional Model of a Group II Intron RNA and Its Interaction with the Intron-Encoded...

Molecular Cell
Article
A Three-Dimensional Modelof a Group II Intron RNA and Its Interactionwith the Intron-Encoded Reverse TranscriptaseLixin Dai,1,5,7 Dinggeng Chai,1,7 Shan-Qing Gu,3,4 Jesse Gabel,1 Sergei Y. Noskov,1,2 Forrest J.H. Blocker,3,4,6
Alan M. Lambowitz,3,4 and Steven Zimmerly1,*1Department of Biological Sciences2Institute for Biocomplexity and InformaticsUniversity of Calgary, Calgary, AB T2N 1N4, Canada3Department of Chemistry and Biochemistry, Institute for Cellular and Molecular Biology4Section of Molecular Genetics and Microbiology, School of Biological Sciences
University of Texas at Austin, Austin, TX 78712, USA5Present address: Department of Molecular Biology and Genetics, Johns Hopkins University School of Medicine, Baltimore, MD 21205, USA.6Present address: AlarmPharm Consulting, San Francisco, CA 94117, USA.7These authors contributed equally to this work.
*Correspondence: [email protected] 10.1016/j.molcel.2008.04.001
SUMMARY
Group II introns are self-splicing ribozymes believedto be the ancestors of spliceosomal introns. Manygroup II introns encode reverse transcriptases thatpromote both RNA splicing and intron mobility tonew genomic sites. Here we used a circular permuta-tion and crosslinking method to establish 16 intra-molecular distance relationships within the mobileLactococcus lactis Ll.LtrB-DORF intron. Using thesenew constraints together with 13 established tertiaryinteractions and eight published crosslinks, we mod-eled a complete three-dimensional structure of theintron. We also used the circular permutation strat-egy to map RNA-protein interaction sites throughfluorescence quenching and crosslinking assays.Our model provides a comprehensive structuralframework for understanding the function of group IIribozymes, their natural structural variations, and themechanisms by which the intron-encoded proteinpromotes RNA splicing and intron mobility. Themodel also suggests an arrangement of active siteelements that may be conserved in the spliceosome.
INTRODUCTION
Group II introns are ribozyme-based retroelements found in bac-
teria, mitochondria, and chloroplasts (Lambowitz and Zimmerly,
2004). They are the putative ancestors of both nuclear spliceoso-
mal introns and non-LTR retroelements and thus may have
played a major role in the evolution of eukaryotic genomes (Eick-
bush, 1999). A large number of mobile group II introns have been
identified, each consisting of a structurally complex RNA and
a multifunctional intron-encoded protein (IEP) having reverse
transcriptase (RT) activity. The intron RNA catalyzes its own
472 Molecular Cell 30, 472–485, May 23, 2008 ª2008 Elsevier Inc.
splicing from precursor RNA and also its integration into DNA
during intron mobility. The IEP assists these reactions by stabiliz-
ing the catalytic RNA structure, by providing access to DNA
targets, and by reverse transcribing the integrated intron RNA
(Lambowitz and Zimmerly, 2004). In addition to their evolutionary
significance, group II introns have been harnessed to function as
gene-targeting vectors (‘‘targetrons’’) that can be programmed
to insert into virtually any DNA sequence (Perutka et al., 2004).
However, in the absence of a complete three-dimensional struc-
ture for a mobile group II intron, the mechanisms of group II intron
splicing and mobility remain incompletely understood.
Group II intron RNAs have a conserved secondary structure
consisting of six helical domains (DI–DVI) arranged around a cen-
tral wheel (Figure 1A). There are three major subclasses (IIA, IIB,
and IIC), each distinguished by specific structural variations
(Lambowitz and Zimmerly, 2004; Pyle and Lambowitz, 2006).
The six domains fold into a catalytically active tertiary structure
aided by 14 known long-range interactions, which were identi-
fied by phylogenetic covariation and biochemical analyses
(Figure 1A). Eight of these interactions involve Watson-Crick
base pairs (a-a0, b-b0, g-g0, d-d0, 3-30, IBS1-EBS1, IBS2-EBS2,
and IBS3-EBS3), three are tetraloop-receptor interactions of
known geometries (z-z0, h-h0, and q-q0), and the other three are
less defined (l-l0, k-k0, and m-m0).
Group II ribozymes catalyze splicing via two transesterification
reactions that yield spliced exons and an intron lariat, analogous
to the splicing mechanism of nuclear spliceosomal introns. Dur-
ing these reactions, the 50 splice site is positioned at the active
site by the IBS1-EBS1 and IBS2-EBS2 pairings (Figure 1A), while
the 30 splice site is positioned by the interaction d-d0 (IIA introns)
or IBS3-EBS3 (IIB and IIC introns) as well as by the g-g0 pairing of
the last nucleotide of the intron (Costa et al., 2000; Pyle and Lam-
bowitz, 2006). In IIB and probably IIC introns, the branchpoint A
is positioned by a conserved region of DId dubbed the coordina-
tion loop, which brings together the bulged A and both exons;
however, a conserved motif corresponding to the coordination
loop is not present in IIA introns (Pyle and Lambowitz, 2006).

Molecular Cell
Group II Intron RNA Structure
The stem-loop DV is both the catalytic and structural core of
group II ribozymes (Figure 1A). The catalytic face of DV interacts
with the 50 and 30 splice sites, the J2/3 linker, and 3-30, with cat-
alytic metal ions proposed in both the AGC triad and AC bulge of
DV (Figure 1A) (Pyle and Lambowitz, 2006, and references
therein). The opposite (‘‘binding’’) face of DV interacts with DI
through the z-z0 and k-k0 interactions. A minimal ribozyme con-
sisting of DV and DI can catalyze 50 splice site hydrolysis (Koch
et al., 1992); however, the inclusion of DIII increases catalytic ef-
ficiency (Fedorova and Pyle, 2005). DII is less critical for catalysis
but interacts with DVI and DIc1, presumably anchoring these
regions (Costa et al., 1997). Notably, the interaction h-h0 be-
tween DII and DVI (Figure 1A) has been proposed to be dynamic,
being formed between the first and second steps of splicing and
corresponding to movement of the branch site A between the
steps (Chanfreau and Jacquier, 1996).
Virtually all group II introns in bacteria and about half in organ-
elles encode IEPs that promote RNA splicing and/or intron mo-
bility. The IEP is encoded in a ‘‘loop’’ of DIV that extends outside
the intron’s catalytic core (Figure 1A). Canonical group II IEPs,
exemplified by the LtrA protein encoded by the IIA intron Lacto-
coccus lactis Ll.LtrB, have four conserved domains: RT, which
corresponds to the finger and palm regions of retroviral RTs;
X/thumb, which corresponds to the RT thumb region and con-
Figure 1. Structure of the Ll.LtrB Group IIA Intron and Its Intron-
Encoded Protein
(A) RNA secondary structure. The intron is indicated by thin black lines and
exons by thick black lines. Sequence elements involved in long-range Wat-
son-Crick and non-Watson-Crick interactions are indicated by gray shading
and boxes, respectively. The ORF is encoded within a ‘‘loop’’ of DIV (dashed
lines).
(B) The group II IEP has four domains: reverse transcriptase (RT) with
conserved sequence blocks 0–7; X/thumb domain; D, DNA binding; and En,
DNA endonuclease.
tributes to RNA splicing (‘‘maturase’’) activity; D, involved in
DNA binding; and En, a DNA endonuclease (Figure 1B). Studies
with the Ll.LtrB intron showed that the RT and X/thumb domains
bind specifically to the ribozyme to stabilize its catalytic structure
for RNA splicing and reverse splicing, while the D and En do-
mains are not required for splicing but interact with DNA target
sites during intron mobility (Lambowitz and Zimmerly, 2004).
The interactions between the IEP and intron RNA are critical
for both RNA splicing and intron mobility. The LtrA protein binds
to a high-affinity binding site in DIVa of the Ll.LtrB intron and
makes additional contacts with core regions to stabilize the ribo-
zyme structure (Matsuura et al., 2001; Wank et al., 1999). After
splicing, the IEP remains tightly bound to the lariat RNA in a ribo-
nucleoprotein (RNP) that promotes intron mobility. The RNP rec-
ognizes DNA targets for intron mobility using both its RNA and
protein subunits. For Ll.LtrB, the IEP recognizes the distal re-
gions of the �35 bp target, while the RNA recognizes the central
region via the IBS1-EBS1, IBS2-IBS2, and d-d0 base pairings (re-
viewed in Lambowitz and Zimmerly, 2004). After base pairing,
the intron RNA reverse splices into the top DNA strand between
IBS1 and d, while the IEP uses the En domain to cleave the bot-
tom DNA strand and then uses the cleaved 30 end as a primer for
reverse transcription of the inserted intron RNA.
Three-dimensional models have proven useful for understand-
ing ribozymes and guiding experimentation. For both RNase P
and group I introns, three-dimensional models with essentially
correct topologies were constructed based on constraints of
crosslinks, pseudoknot pairings, tetraloop-receptor interactions,
and phylogenetic covariations (Harris et al., 1997; Lehnert et al.,
1996). The Harris and Pace model of RNase P, for example, was
based on 14 crosslinks and five pseudoknot constraints in
a �400 nt RNA.
In this study, we adapted the circular permutation and cross-
linking method of Harris and Pace (Harris et al., 1997; Thomas
et al., 2000) to determine 16 intramolecular distances within
the IIA L. lactis Ll.LtrB-DORF intron. By combining these new
constraints with 13 established tertiary interactions and eight
published UV crosslinks, we constructed a complete three-
dimensional model of the ribozyme. Further, we probed the
RNA-IEP interactions using the same circularly permuted (CP)
RNAs in fluorescence quenching and crosslinking assays. The
model provides a structural framework for understanding the
ribozyme activity of group II introns and how the IEP and RNA
interact to promote RNA splicing and intron mobility.
RESULTS
Crosslinking StrategyOur crosslinking strategy was adapted from that used for RNase
P (Harris et al., 1997; Thomas et al., 2000), in which a photoacti-
vatable azidophenacyl group (APA; crosslinking radius 9 A) is
attached to the 50 end of CP RNAs. Crosslinking is induced by
UV irradiation, and intramolecular contacts are mapped by
primer extension. To analyze a group II intron, CP sequences
were generated from a plasmid (pKS-tandem) containing tan-
dem copies of the Ll.LtrB-DORF intron separated by a 423 bp ex-
onic linker (Figure 2A). PCR amplification with appropriate
primers resulted in CP sequences preceded by a T7 promoter.
Molecular Cell 30, 472–485, May 23, 2008 ª2008 Elsevier Inc. 473

Molecular Cell
Group II Intron RNA Structure
Figure 2. Experimental Strategy and Representative Crosslinking Data
(A) Circularly permuted (CP) Ll.LtrB intron was PCR amplified from plasmid pKS-tandem template by using a 50 primer that appends a T7 promoter. The PCR
product was transcribed by T7 RNA polymerase, with GMPS (GM) incorporated at the 50 end, to which azidophenacyl (APA) was coupled. The CP RNA was
self-spliced, UV-irradiated, and electrophoresed in a nondenaturing agarose gel. The indicated bands were excised, and crosslinks were mapped by primer
extension. Four reactions for each CP RNA determined dependence on APA, UV irradiation, and splicing.
(B–H) Representative primer extension data. Black and gray numbering indicates reproducible and irreproducible stops, respectively. In some cases, the position
of the stop was confirmed in a separate gel with greater resolution of the ladder. (B and C) Crosslinks demonstrating the interaction a-a0. (D) Reciprocal crosslink
for a-a0. (E) The splicing-dependent crosslink G2453xU416, which is in proximity to the h-h0 interaction (see Figure 3). (F) A splicing-dependent local crosslink in
domain II (see Figure 3). (G and H) Reciprocal splicing-dependent crosslinks G37xG374 and G374xG38.
Transcription produced RNAs with guanosine 50-monophos-
phorothioate (GMPS) at their 50 end, to which APA was conju-
gated via the thio group. The RNA was self-spliced and irradiated
474 Molecular Cell 30, 472–485, May 23, 2008 ª2008 Elsevier Inc.
with UV light to induce crosslinking, and the products were sep-
arated on a native agarose gel, from which the spliced intron
band was isolated and analyzed by primer extension.

Molecular Cell
Group II Intron RNA Structure
Two key elements of our strategy were the induction of cross-
linking after splicing and the separation of products on a nonde-
naturing agarose gel. Together, these steps ensured that cross-
links were produced from functional, spliced introns and not
misfolded or trans-spliced RNAs. Spliced CP introns are Y
shaped rather than lariats (Figure 2A), but on a nondenaturing
agarose gel, all spliced introns comigrate regardless of their
crosslinking or permutation state. Thus, all crosslinks for a given
CP RNA can be mapped in a single primer extension reaction.
Four reactions were done in parallel for each CP RNA. In the
first control reaction, CP intron was transcribed without GMPS
and the sample was not spliced or UV irradiated (Figure 2A,
lane 1), thus identifying nonspecific stops during primer exten-
sion of unspliced intron. In the second control, transcription
was also without GMPS, but the RNA was spliced and cross-
linked, which identified APA-independent crosslinks formed dur-
ing UV irradiation and nonspecific primer extension stops from
spliced intron template (lane 2). In the third reaction, RNAs
were labeled with GMPS and APA but were incubated in splicing
buffer without Mg2+, thereby distinguishing crosslinks in un-
spliced and/or incompletely folded intron (lane 3). In the final
reaction, the intron was labeled with GMPS and APA and was
spliced and UV irradiated, which identified crosslinks in spliced
intron (lane 4). A primer extension stop was considered a putative
crosslink if signal was present in lane 4, but not in lanes 1 or 2, as
this indicated dependence on both APA and UV. A signal in lane
4, but not in lane 3, could reflect either a conformational change
when the RNA assumes a catalytic structure upon Mg2+ addition
or a conformational change during the splicing reaction. Notably,
80% of primer extension stops were the same in lanes 3 and 4,
consistent with previous data showing substantial tertiary struc-
ture formation in the Ll.LtrB-DORF intron in the absence of Mg2+
(Noah and Lambowitz, 2003). The few stops observed in lane 3,
but not lane 4, were not used for modeling.
Generation of DataRepresentative crosslinking data are shown in Figures 2B–2H.
The crosslinking method was optimized using a CP RNA with
its 50 end at G52, which is part of the a-a0 interaction (Figure 1A).
As expected, this substrate gave strong crosslinks in the
a0 region, with reproducible primer extension stops at positions
264–269, 300, and 303 (Figures 2B and 2C; Table S1). Ninety-
two CP substrates were then assayed, some with A-to-G substi-
tutions at their 50 ends to allow analysis at positions lacking Gs.
The method’s ability to detect intramolecular contacts was con-
firmed by seven constructs that yielded crosslinks consistent
with known tertiary interactions (Table S1) and 15 that gave
short-range crosslinks consistent with the secondary structure
(Table S2). Fourteen constructs generated 16 crosslinks that
were ultimately deemed informative for structure modeling
(below) (Table 1). The remaining constructs produced insuffi-
cient RNA substrate (e.g., poor PCR or T7 transcription) or no
crosslinks.
In confirmation of the G52 crosslinks, a reciprocal crosslink
occurred from G264 to G52 (Figure 2D). As expected, neither
the G52 nor G264 crosslinks were splicing dependent, indicating
that a-a0 is a ground-state interaction that persists throughout
splicing. Similar crosslinking data were obtained for the b-b0, 3-30,
and q-q0 interactions, with all of these crosslinks also being splic-
ing independent as expected for ground-state interactions (Fig-
ure S1; Table S1). By contrast, the G2453xU416 crosslink near
the h-h0 interaction was observed only in lariat RNA (Figure 2E),
consistent with the formation of h-h0 between the first and sec-
ond steps of splicing (Chanfreau and Jacquier, 1996). Two other
crosslinks near h-h0 were also splicing dependent (G2475xA446,
G410xA454; Figure 2F; Figure S1; Table S2), possibly reflecting
the same conformational change.
The most valuable constructs were the 14 that provided 16
new crosslinking constraints for modeling (Table 1; Figure 3).
Some of these were corroborated by consistency with other
crosslinks or published data. For example, G374xG38 was
reciprocated by G37xG374 (Figures 2G and 2H); G2453xU416
and G2475xA446 are consistent with h-h0. The combination of
G14xA76, G14xA110, G38xA110, G37xG374, and G374xG38
suggest the positioning of five sequences along a helical turn
of DI(ii). G5xC469/G470 coincides with a prominent crosslink
(C6xC469) in a previous study (Noah and Lambowitz, 2003).
Three crosslinks indicate a sharp bend in DIII (G501xA523,
G126xA493/G494/500, G126xG520/G521/A523), consistent
with the m-m0 interaction (Fedorova and Pyle, 2005). Finally, the
G151xU222 crosslink agrees with the previously observed
crosslink C(�6)xC153 (Noah and Lambowitz, 2003) in position-
ing DIc2 next to IBS2-EBS2.
A potential artifact is that some crosslinks may affect the ability
of the RNA to unfold during the primer extension step, or change
the propensity for spontaneous RNA cleavage at specific sites
(e.g., CA sequences), resulting in primer extension stops that
are not crosslinks. Indeed, it was found that eight constructs pro-
duced stops at 303, a physical impossibility that we attribute to
such artifacts. We reasoned that a small number of stops might
not correspond to crosslinks, and we excluded three putative
crosslinks because of inconsistency with either known interac-
tions or the combined set of experimental crosslinks (Table S4).
Table 1. New Crosslinks for Use in Structure Modeling
APA Position Mapped Crosslink
Splicing
Dependence
G5 C469/G470 No
G14 A76 No
G14 A110 No
G37 G374 Yes
G38 A110 Yes
A64 G117 No
G126 A493/G494/C500 No
G126 G520/G521/A523 No
G151 U222 Yes
G347 G192 Yes
G374 G38 No
G410 A454 Yes
G501 A523 No
G2417 G279 Yes
G2453 U416 Yes
G2475 A446 Yes
Molecular Cell 30, 472–485, May 23, 2008 ª2008 Elsevier Inc. 475

Molecular Cell
Group II Intron RNA Structure
Figure 3. Summary of Crosslinks and Other Constraints Used in Modeling
Crosslinks obtained in this study are indicated by red lines; conserved tertiary interactions are indicated by Greek letters and green lines; crosslinks from a
previous study with unspliced Ll.LtrB intron are shown by dark blue lines (Noah and Lambowitz, 2003); crosslinks mapped to the active site of unspliced aI5g
are indicated by light blue lines (de Lencastre et al., 2005).
Constructing the Three-Dimensional ModelThe three-dimensional model was constructed based on 37 dis-
tance constraints, including the 16 new crosslinks, 13 conserved
tertiary interactions, four crosslinks obtained from unspliced
Ll.LtrB-DORF intron (Noah and Lambowitz, 2003), and four
crosslinks from the active site region of unspliced aI5g intron
(de Lencastre et al., 2005) (Figure 3; Table S3). The model was
assembled in four successive de novo constructions using the
program ERNA-3D with progressive adjustments to optimize
satisfaction of distance constraints. Crystal structure data from
other RNAs were used to specify the tetraloop-receptor confor-
mations for z�z0, q�q0, and h�h0 (Table S3). The remaining heli-
ces were arranged manually. The structure was energy mini-
mized using the program CHARMM to eliminate steric clashes
476 Molecular Cell 30, 472–485, May 23, 2008 ª2008 Elsevier Inc.
and bond discontinuities, and to optimize distance constraints
(see the Experimental Procedures). The final model satisfies all
constraints with an average distance of 8.4 ± 3.2 A between con-
strained atoms (Table S3).
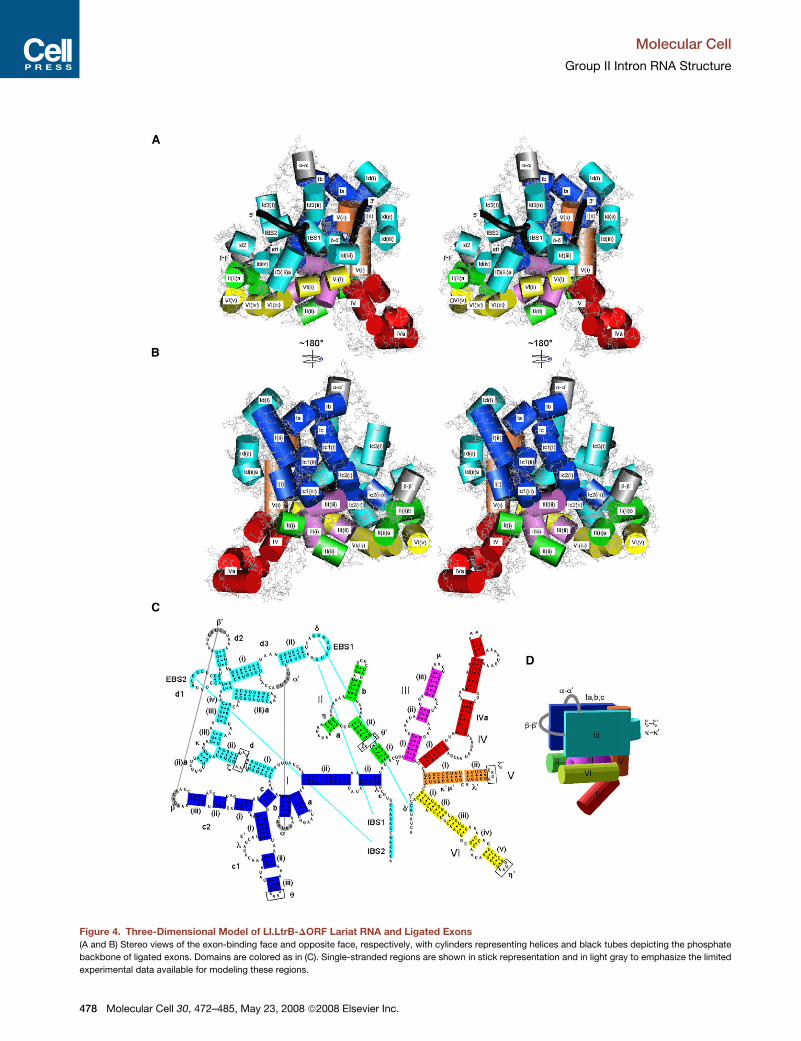
Figure 4 presents the model with cylinders indicating helices
and black tubes representing the backbone of ligated exons.
The core of the molecule consists of DI wrapping around DV,
with one face (dark blue) formed by DI(i, ii), Ia, Ib, Ic1, and Ic2
and the other face (light blue) formed by DId(iii, iv), Id1, Id2,
and Id3 (Figures 4A and 4B). The z�z0 and k�k0 interactions
serve as a hinge/turn element to allow the two DI faces to fold to-
ward each other on opposite sides of DV, becoming locked into
place by the a-a0 and b-b0 interactions (gray). DIII is mostly inter-
nal, just below the core region, with contacts to both DI halves.

Molecular Cell
Group II Intron RNA Structure
DII and DVI are on either side of DIII with their distal regions inter-
acting via h-h0 and other contacts. DIV is connected to the bot-
tom of the molecule in a position dictated mainly by steric re-
quirements of DIII and DV. DIVa, the high-affinity binding site
for the IEP is arbitrarily angled toward the exon-binding face of
DI, where it is near other IEP-binding sites (see below). We
note that none of the six CP RNAs tested in DIV gave specific
crosslinks to other regions (data not shown), and it is possible
that DIV and/or DIVa are flexible to accommodate changing
RNA-protein interactions during RNA splicing and intron mobility
(see the Discussion).
The 50 and 30 exons bind mostly on the surface of the ribozyme
via the EBS-IBS and d-d0 pairings, but the exon junction is posi-
tioned at an internal active site in proximity to 3-30, g-g0, the
branchpoint A of DVI, and the AGC triad and bulged AC of DV.
The overall topology is similar but not identical to two active site
models of IIB introns (Costa et al., 2000; de Lencastre et al.,
2005) (Figure S4). Aside from the known differences between
IIA and IIB introns, namely the coordination loop and EBS3-
IBS3 pairing of IIB introns, the most significant difference in the
models is the position of the exons, which are largely internalized
in the IIB models, either explicitly or implicitly because of the
location of the unmodeled regions. Whether the differences in
the models reflect structural differences between the introns or
differences in modeling strategies remains to be determined.
Our model is consistent with previously reported protection
experiments with the Ll.LtrB-DORF ribozyme. Phosphate-back-
bone and base probes both showed protection of DIII, DIc1(ii, iii),
DII(ii)b, and DVI(iv, v), as well as DV to a lesser degree (see Fig-
ures 3 and 4 of Matsuura et al. [2001]). In our model, all of these
structures are either internal or on the protected sides of surface
helices. Exposed regions in the chemical protection experiments
were DId(iii, iiia, iv)/Id1, the five-way junction of of DIa, Ib, Ic, Id,
and I(ii), the base of DVI, and virtually all of DIVa; all of these
regions are on the surface in our model. In addition, the major
regions judged to be protected by the LtrA protein (DIVa, DIc2,
Did[iii]a, DII[ii]a, and DVI[ii, iii]) are on the surface of the model
(Matsuura et al., 2001).
Our model is also consistent with hydroxyl radical protection
experiments for the minimal D135 construct of aI5g. In those
experiments, the most protected region was DV, followed by
the internal loop of DIII, DId(ii), EBS1, and DIb (Figure 5 of
Swisher et al. [2001]). These structures are wholly or partly pro-
tected in our model except for DIb. Also buried in both the aI5g
construct and the Ll.LtrB model is the active site region with
the catalytically important 3-30 and g-g0 elements. Further, our
model agrees with aI5g data in having a noncoaxial arrange-
ment of IBS1-EBS1 and IBS2-EBS2 (Qin and Pyle, 1999) and
greater exposure of EBS2 compared to EBS1 (Swisher et al.,
2001).
Phylogenetic Consistency of the ModelGroup II introns in nature have many variations in their secondary
structures, and a valid model should accommodate these differ-
ences without perturbing the catalytic core. Major variations
among intron classes include the following: the presence of
DId(iii)a and the absence of the EBS3 motif in IIA introns; the ab-
sence of a DId1 stem in IIB introns; and the absence of DIc2, Id1,
and Id2 in IIC introns. Additional variations among subgroups are
summarized in Figure 5C and Table S6. When the sites of these
deletions and insertions are mapped onto the Ll.LtrB model (Fig-
ures 5A and 5B), they are seen to be peripheral, suggesting that
their presence or absence does not disrupt the active site core.
We conclude that the model is consistent with the natural struc-
tural diversity of group II introns and that all group II intron sub-
classes can be represented in a similar three-dimensional
form, with a common core containing the active site.
Sites of Protein Interaction with the RibozymeTo identify IEP-ribozyme interaction sites, we conjugated a fluo-
rescent probe to the 50 ends of 77 CP RNAs and assayed fluores-
cence quenching as a function of LtrA concentration. These
experiments were done in a medium containing 50 mM Mg2+ be-
cause under these conditions (unlike 5 mM Mg2+) the intron RNA
folds into an active conformation that self-splices. Moreover,
LtrA still binds to the intron RNA and remains tightly associated
with the spliced lariat (Matsuura et al., 2001). Hence, strong
quenching in this medium is most likely due to protein binding
rather than RNA conformational changes. Figure 6A shows rep-
resentative data, with fluorescence quenching seen for G561,
which lies in the DIVa protein-binding site, and for G2472 in do-
main VI. In contrast, G155 and G2459 do not show quenching
upon LtrA binding, suggesting a lack of proximity to LtrA. Using
this assay, we identified 17 positions as giving the highest fluo-
rescence quenching (R40%) upon addition of LtrA protein
(Table S5, Figure 7E).
To obtain further evidence for protein contacts, the same 77
CP RNAs were tested for crosslinking to LtrA by constructing
CP RNAs with azidophenacyl and 35S attached simultaneously
to their 50 ends (Experimental Procedures). The LtrA-intron
complexes were UV irradiated and digested with RNase T1 to
remove all RNA except the 50-radiolabeled G. Crosslinked pro-
teins were then detected by SDS-PAGE and autoradiography.
Crosslinking was carried out in the presence of nonspecific
competitor RNA, and parallel reactions were performed with
the basic protein N. crassa CYT-18 as a control for nonspecific
crosslinks. These assays corroborated the quenching data
for the four constructs above (Figure 6B). In all, 16 positions
that crosslink to the IEP were identified (Figure 7E, Figure S2,
Table S5).
Figure 7E summarizes protein interaction data from crosslink-
ing and fluorescence quenching assays, as well as published
data from phosphate backbone and base protection experi-
ments (Matsuura et al., 2001). Although the four methods identify
somewhat different sets of potential contacts, when mapped
onto the model they depict a coherent protein-binding sur-
face. The high-affinity binding site in DIVa is a major site of in-
teraction identified by all four methods, and the interaction sur-
face extends across the bottom of the RNA, with major contact
regions in DIc1(ii, iii), Id(iia, iii, iiia), DII(i, ii), and DVI(ii, iii). In con-
trast, there is little indication of protein binding on the upper re-
gion of the RNA in Figures 7E and 7F (e.g., DIb, Id2, and Id3).
Notably, LtrA interacts near the exon-binding region, thereby
positioning the protein to bind DNA exons during intron mobil-
ity. The crosslinked residue G99 is not exposed on the surface
of the model, but it is sufficiently close that crosslinking may be
Molecular Cell 30, 472–485, May 23, 2008 ª2008 Elsevier Inc. 477
Molecular Cell
Group II Intron RNA Structure
Figure 4. Three-Dimensional Model of Ll.LtrB-DORF Lariat RNA and Ligated Exons
(A and B) Stereo views of the exon-binding face and opposite face, respectively, with cylinders representing helices and black tubes depicting the phosphate
backbone of ligated exons. Domains are colored as in (C). Single-stranded regions are shown in stick representation and in light gray to emphasize the limited
experimental data available for modeling these regions.
478 Molecular Cell 30, 472–485, May 23, 2008 ª2008 Elsevier Inc.

Molecular Cell
Group II Intron RNA Structure
due to perturbation of the CP RNA’s 50 end, and so the closest
exposed residue is indicated (Figures 7E and 7F). In addition,
we attribute fluorescence quenching at the internal residue
G2422 in DV to global compaction of the RNA structure upon
protein binding.
DISCUSSION
We have constructed a complete three-dimensional model of
a group IIA intron ribozyme by using a crosslinking approach
with CP RNAs. The model depicts lariat intron bound to ligated
exons before exon release. In addition, IEP contact sites were
mapped onto the ribozyme structure, providing insight into pro-
tein facilitation of the RNA splicing and intron mobility reactions.
Although the model is of low resolution, it nevertheless provides
a comprehensive structural framework for understanding the
splicing and mobility reactions of group II introns.
Ribozyme Structure and FunctionIn our model, the core of the ribozyme consists of DV bound in
a pocket between the two halves of DI, with the k-k0 and z-z0
region being a hinge/turn element on one side, and a-a0 and
b-b0 sealing the two halves together on the other side (Figures
4A, 4B, and 4D). DIII is largely internalized, with contacts to DV
and both halves of DI, potentially stabilizing the bending of DI
and its interaction with DV. This organization explains how DIII
might function as a catalytic effector of a minimal ribozyme con-
sisting of DI and DV (Pyle and Lambowitz, 2006). The model is
also consistent with multiple contacts reported between DIII,
DI, and DV (Jestin et al., 1997; Su et al., 2005).
Importantly, in the active site region of the model, the catalytic
face of DV is oriented inward, where it interacts with the catalyt-
ically important elements J2/3, g-g0, 3-30, and the branch A. Thus,
the exon junction must be delivered to an internal position for
catalysis. This is accomplished in the model by the helical turn
of IBS1-EBS1, which allows the 50 exon to bind mostly on the
surface of the ribozyme through the IBS1-EBS1 and IBS2-
EBS2 pairings, while the exon junction penetrates internally
into the active site. Notably, the d-d0 pairing is extended to
exon position +2 in the model, consistent with biochemical
data for the second base pair (Lambowitz and Zimmerly,
2004). The coordination loop, which positions the splice sites
and branchpoint A residue in IIB and IIC introns (Costa et al.,
2000; de Lencastre et al., 2005), is not present in IIA introns,
and other interactions presumably fulfill its functions. Neverthe-
less, the Id(iii) segment that contains the coordination loop in IIB
and IIC introns is located near the Ll.LtrB active site, consistent
with the expected position of the coordination loop.
In addition to explaining known structural features, the model
makes several predictions. Three semiconserved regions of DI
are predicted to help dock DV: the internal loop of DI(i)/(ii) (also
suggested by data in Jestin et al. [1997]), the DId(ii)a loop near k,
and the loop of DIa. The model also predicts that the single-
stranded ‘‘wheel’’ sequences converge at the active site to form
a precise network of interactions that may be critical for catalytic
function. During modeling, we found the configuration of these
strands to be highly constrained by the positioning of helical
domains determined by crosslinking data (Figure S5). Notably,
the wheel sequences are conserved among intron subclasses,
to a degree similar to the 3-30 motif, a critical active site compo-
nent (de Lencastre et al., 2005; Toor et al., 2001). An analogous
complex RNA structure formed by single-stranded joining nucle-
otides has been proposed for the active site of RNase P (Kazant-
sev et al., 2005).
RNA Folding and Conformational ChangesThe Ll.LtrB-DORF model explains key aspects of folding of
group II ribozymes. Folding of the aI5g ribozyme was initially de-
scribed as a slow, apparent two-state process, with a sudden
transition from secondary structure to catalytic tertiary structure.
Subsequently, the slow step was proposed to be the indepen-
dent folding of DI to form a scaffold for the docking of DV and
DIII (Pyle et al. [2007] and references therein). The rate-limiting
step governing assembly of DI is thought to be the introduction
of a sharp bend in the z and k region, dubbed a ‘‘folding control
element.’’ Folding of DI is rapidly followed by the binding of DV
and DIII and then the remaining group II intron domains.
However, both in our model and in the active site model of
aI5g (de Lencastre et al., 2005), the docking of DV into a fully
folded, rigid DI structure would be difficult, particularly after for-
mation of the a-a0 and b-b0 interactions. One possibility sug-
gested by the models is that partial docking of DV occurs before
the a-a0 and b-b0 pairings, potentially facilitating the bending and
final folding of DI. Once the DI-DV structure is formed, our model
readily shows how it could serve as a scaffold for rapid docking
of DIII, DII, DIV, and DVI, as proposed (Pyle et al., 2007). While
this same folding pathway may apply to all group II ribozymes
due to their shared core structure, the rate-limiting steps and sta-
bilizing interactions may vary. In the Ll.LtrB-DORF intron, for ex-
ample, the bend in DI occurs readily, as shown by the formation
of a-a0 and b-b0 pairings even in the absence of Mg2+ (this work;
Matsuura et al., 2001; Noah and Lambowitz, 2003), while in aI5g,
the bend occurs very slowly unless stabilized by high Mg2+.
The model also explains the exon-binding properties reported
for the Pylaiella LSU I2 intron, namely that tight 50 exon binding is
dependent on formation of the catalytic core. Indeed, our model
suggests that the EBS1, EBS2, and d0 elements are surrounded
by other ribozyme structures. EBS1 in the model interacts with
DV, while EBS2 forms contacts with DIc2. The latter contacts
are directly supported by the G151xU222 and C(�6)xC153
crosslinks and are consistent with exon-dependent protections
reported for DIc2 (Costa and Michel, 1999). While 50 exon bind-
ing was inferred to be the final step of ribozyme folding, it is also
possible that IBS-EBS pairings occur during secondary struc-
ture formation but that docking into the core occurs late in
folding.
(C) Color coding of RNA domains. Boxed nucleotides indicate single strands for which specific conformations could be predicted based on crystal structures of
tetraloop-receptor interactions. Several base pairs at the ends of helices were unpaired during modeling to allow connection of strands (indicated by the absence
of a dot).
(D) Schematic showing the arrangement of domains in the ribozyme model.
Molecular Cell 30, 472–485, May 23, 2008 ª2008 Elsevier Inc. 479

Molecular Cell
Group II Intron RNA Structure
Figure 5. Consistency of the Model with Known Phylogenetic Variations of Group II Introns
(A and B) Semitransparent helices depict substructures in Ll.LtrB that are absent in other intron subclasses, while CPK representations indicate sites of insertions.
(C) Secondary structure of Ll.LtrB showing helices absent in other subclasses (gray) or sites of insertions (numbered arrowheads). See Table S6 for additional
details.
(D) Geometry of the group II intron structures having potential analogs in the spliceosome. DV is potentially analogous to U6-ISL, DVI to the U2/UACUAAC box
pairing, 3-30 to the ACAGAGA box/intron pairing, and IBS1-EBS1 and d-d0 to the exon/U5 pairings. CPK atoms depict the branch A in DVI and the AC bulge and
AGC triad in DV.
Lastly, our detection of three splicing-dependent crosslinks
near h-h0 is consistent with the proposed conformational change
that repositions the branch site between the two splicing steps
(Chanfreau and Jacquier, 1996). Other data have indicated that
all reactive groups are in proximity prior to splicing, with no large
conformational changes being necessary (de Lencastre et al.,
480 Molecular Cell 30, 472–485, May 23, 2008 ª2008 Elsevier Inc.
2005). It remains possible, however, that the observed conforma-
tional changes in the distal region of DVI correspond to fine move-
ments of the branchpoint at the activesite. Another conformational
change would appear to be required to release the tightly bound
exons after splicing, perhaps the reverse of the conformational
change proposed for exon binding (Costa and Michel, 1999).

Molecular Cell
Group II Intron RNA Structure
Figure 6. Fluorescence Quenching and Crosslinking Assays for IEP-Ribozyme Interactions
(A) Representative fluorescence quenching data. CP RNAs with fluorescein conjugated to their 50 ends were titrated for quenching by 0–200 nM LtrA protein
(Experimental Procedures). Data for all constructs tested are summarized in Table S5.
(B) Representative crosslinking data. CP RNAs with 35S and azidophenacyl at their 50 ends were incubated with LtrA protein. The complexes were UV irradiated
to induce crosslinking and digested with RNase T1 to leave a single 35S-labeled nucleotide attached to LtrA (Experimental Procedures). Samples were resolved
on a 0.1%SDS/7% polyacrylamide gel, which was dried and analyzed by phosphorimaging. CYT-18 was substituted for LtrA as a specificity control, as was
BSA for some experiments (data not shown). Data for all positive crosslinking signals are shown in Figure S2, and a summary of all constructs assayed is in
Table S5.
Facilitation of Splicing by the Intron-Encoded ProteinSplicing of Ll.LtrB requires the LtrA protein to stabilize the cata-
lytic RNA structure both in vivo and at low Mg2+ concentrations
in vitro. Previous studies identified a high-affinity LtrA binding
site in DIVa, with additional contacts in DI, DII, and DVI (Matsuura
et al., 2001; Wank et al., 1999). In this study, we used fluores-
cence quenching and protein crosslinking assays to delineate
more precisely the protein-interaction region. Cumulatively, the
data suggest that LtrA binding nucleates on DIVa and extends
around the bottom half of the molecule, interacting on the
exon-binding side with DId(ii)a, Id(iii), Id(iii)a, and Id1; along the
bottom with DII(i, ii) and DVI(ii, iii); and on the opposite side
with DIc1(ii, iii) and to a lesser extent DIc2 (Figure 7). Consistent
with a relatively large RNA binding surface, LtrA binds the intron
as a dimer (Saldanha et al., 1999) with predicted dimensions of
190 A 3 90 A 3 90 A (Blocker et al., 2005), compared to 126 A 3
94 A 3 75A for the RNA, excluding DIVa (this work).
The protein interaction sites suggest that LtrA could stabilize
interactions between the two halves of DI, as well as between
domains. Tight binding of LtrA to DIVa would anchor the matur-
ase, while contacts on both the front and back sides may stabi-
lize tertiary interactions thoughout the RNA, particularly in the ac-
tive site region of DV. Such indirect stabilization may account for
the fluorescence quenching observed at G2422 in DV, which is
internal and unlikely to interact directly with LtrA (Figure 7). Unlike
the aI5g intron, the tertiary structure of the Ll.LtrB-DORF intron is
largely formed at least transiently at low Mg2+ concentrations
(this work; Noah and Lambowitz, 2003). Hence LtrA may act
late in the folding pathway, either by tertiary structure nucleation,
tertiary structure capture, or a combination of the two mecha-
nisms.The large binding surface with contacts to multiple do-
mains may help bring together the two ends of intron (DI-III,
DV-VI), which are ordinarily separated by a long ORF sequence.
Additionally, it may enable group II intron maturases to compen-
sate for a variety of structural deficiencies acquired during the
evolution of different non-self-splicing group II introns.
Mechanism of Intron MobilityDuring intron mobility, the DNA target is recognized by both the
IEP and the intron RNA. Initial recognition of distal 50-exon se-
quences by the IEP is thought to lead to local DNA melting,
which enables the intron RNA to base pair to the adjacent
DNA exon sequences via the EBS-IBS and d-d0 pairings (Singh
and Lambowitz, 2001). Importantly, in our model, protein con-
tacts extend up to the exon-binding region of the RNA (Fig-
ure 7), thus enabling the IEP and intron RNA to simultaneously
contact the DNA target site. The most critical IEP-RNA interac-
tions involve the RT and X/thumb domains, leaving the D and
En domains free to interact with the DNA target site. During
the initial stages of the mobility reaction, the IEP must simulta-
neously maintain some or all of the RT/X domain contacts with
the intron RNA in order to stabilize the active ribozyme structure
for reverse splicing.
After reverse splicing, additional contacts between the IEP
and 30 exon are required for bottom-strand cleavage by the En
domain. The 30 end of cleaved DNA must then reposition from
the En to the RT active site, where it acts as the primer for reverse
transcription of the integrated intron RNA. These steps may
correspond to the observed bending of the DNA exons into pro-
gressively sharper angles (Noah et al., 2006). cDNA synthesis
ensues by first copying 9–10 nt of 30 exon DNA and then extend-
ing into the intron. According to our model, reverse transcription
of DVI, which is located on the surface of the ribozyme, would
not necessarily disrupt other intron structures, but reverse
Molecular Cell 30, 472–485, May 23, 2008 ª2008 Elsevier Inc. 481

Molecular Cell
Group II Intron RNA Structure
Figure 7. Interaction Sites between the IEP and Intron RNA
(A and D) Surface representation of the ribozyme model, color coded as in Figures 4 and 5. Exons are black. (B and E) Gray surface representation of the RNA
model, with putative protein contact sites color coded according to the method of detection. Nucleotide positions identified by crosslinking and fluorescence
quenching are specified with residue numbers; a few residues are not visible from the angle shown. (C and F) Alternative view of the model with putative protein
482 Molecular Cell 30, 472–485, May 23, 2008 ª2008 Elsevier Inc.

Molecular Cell
Group II Intron RNA Structure
transcription of DV would require gross unfolding of the RNA
structure and thus may be rate limiting. Indeed, in vitro mobility
reactions show strong reverse transcription stops between DVI
and DV, which are exacerbated by high Mg2+ concentrations
(Matsuura et al., 1997).
Parallels with the SpliceosomeIt is generally believed that nuclear pre-mRNA introns and the
spliceosome are evolutionary descendents of group II introns,
with snRNAs corresponding to ribozyme fragments that assem-
ble onto the intron and reconstitute an RNA-based catalytic cen-
ter. If so, the geometry of key active site components may be
conserved between the two types of introns. Figure 5D shows
the segments of the group II model that have putative analogs
in the spliceosome, namely DV (analogous to U6-ISL [intramo-
lecular stem loop of U6]), DVI (U2/UACUAAC box pairing), 3-30
(ACAGAGA/intron pairing), and IBS1-EBS1/d-d0 (exon/U5 pair-
ings). An equivalent geometry in the spliceosome would place
the U6-ISL helix perpendicular to the U2/intron helix, with the
ACAGAGA box and exon junctions between them. Consistent
with such an arrangement, a study of the B* complex of the spli-
ceosome showed proximity of four RNA elements in activated
spliceosomes: the 50 end of intron (position +10), the ACAGAGA
box, the U6-ISL, and the U2 sequence that pairs with the branch
A motif (Rhode et al., 2006). Although tantalizing, further work is
needed to evaluate more precisely the structural relationships
between the two types of introns.
Finally, we note that the organization of group II intron domains
in our model provides a rationale for why these introns readily
evolved into trans-splicing forms, a phenomenon that has oc-
curred multiple times in evolution (Bonen, 1993). The extensive
interactions between DI and DV would provide a powerful source
of specificity for the reassociation of trans-splicing RNAs, and
the assembled core structure of DI wrapped around DV would
provide a scaffold for the assembly of the remaining domains.
Proteins such as group II IEPs or host-encoded splicing factors
could assist trans-splicing by bridging the separated RNA
domains and stabilizing their interactions. Indeed, the modular
organization of group II intron RNAs, with interdomain RNA con-
tacts stabilized by proteins, may be what enabled the evolution
of group II introns into spliceosomal introns and snRNAs.
EXPERIMENTAL PROCEDURES
Generation of Crosslinking Data
The plasmid pKS-tandem contains two tandem copies of Ll.LtrB-DORF intron
(962 bp) separated by a 423 bp spacer (see the Supplemental Experimental
Procedures). To make CP templates, BamHI/ClaI-digested pKS-tandem was
PCR amplified with a 50 primer consisting of 18 nt of intron sequence preceded
by a T7 promoter sequence (50CTAATACGACTCACTATA) and a 30 primer con-
sisting of 27 nt of intron sequence. Products were either used directly as tem-
plates or gel purified using a QIAGEN Minielute kit (QIAGEN, Valencia, CA).
CP RNAs were transcribed with wild-type or R9C mutant T7 RNA polymer-
ase (expression constructs provided by Dr. William McAllister, University of
Medicine and Dentistry of New Jersey [UMDNJ]) at 37�C for 1.5 hr in 30 ml of
40 mM Tris-HCl (pH 7.5), 50 mM NaCl, �400 ng DNA template, 1 mM ATP,
1 mM UTP, 1 mM CTP, 1 mM GMPS (guanosine-50-monophosphorothioate;
Biolog, Bremen, Germany), 0.3 mM GTP, 0.1% Triton X-100, 5 mM spermi-
dine, 5 mM DTT, 12 mM MgCl2, and 1 ml RNA polymerase (�0.1 mg). The
R9C polymerase was necessary because the presence of a class II terminator
within DI of Ll.LtrB prevented clean gel purifications of some CP RNAs. Sam-
ples were digested with 10 U DNase I (Amersham, Piscataway, NJ), extracted
by phenol-CIA (25:24:1 phenol:chloroform:isoamyl alcohol), ethanol precipi-
tated, and incubated in 100 ml of 20 mM NaHCO3 (pH 9.0), 1% SDS, 5 mM
azidophenacyl bromide (Sigma-Aldrich, St. Louis, MO) and 40% methanol at
room temperature for 1 hr in the dark, followed by two phenol-CIA extractions
and ethanol precipitation.
End-modified CP RNAs (25 ml in TE; 10 mM Tris-HCl [pH 7.5], 1 mM EDTA)
were renatured in a PCR machine as follows: 90�C, 1 min; 75�C, 5 min; and
gradual cooling to 43�C over 10 min. After addition of 25 ml of splicing buffer
(final concentration of 40 mM Tris-HCl [pH 7.5], 1 M NH4Cl, and 100 mM
MgCl2), the RNA was incubated for a 25 min at 43�C, then irradiated for
45 min at 4�C with 302 nm UV light. Irradiation was in microfuge tubes with
open lids at a distance of 2 cm, screened by a polystyrene Petri dish. Cross-
linked RNAs were ethanol precipitated and resolved in a 1.5% agarose gel
in TBE. Bands were extracted using a QIAGEN Minelute kit, resuspended in
10 mM Tris-HCl [pH 7.5]. Crosslinks were mapped by primer extension (Sup-
plemental Experimental Procedures). All putative crosslinks were repeated,
and nonrepeatable data were discarded.
Modeling of the Intron
The three-dimensional model was assembled by four iterative de novo
constructions using the program ERNA-3D (http://www.erna-3d.de/), with
progressive satisfaction of distance constraints in each cycle. Geometries
for z-z0, h-h0, and q-q0 were specified by copying motifs from crystal structures
(Table S3). The structure was refined by energy minimization using CHARMM
(Brooks et al., 1983), interspersed with manual corrections (see the Supple-
mental Experimental Procedures). In the final construction, helices generated
by MC-SYM (Major et al., 1991) were substituted into the model, as well as the
crystal structure geometries, to give ideal conformations for these elements.
The final model contains no steric clashes or bond discontinuities as moni-
tored by NUCheck of the Protein Data Bank (PDB) Validation Suite (http://
sw-tools.pdb.org/apps/VAL/index.html). Agreement with data is shown in Ta-
ble S3. We were unable to produce a model with significantly different topol-
ogy that satisfies the crosslinking data and other constraints. The PDB file is
available as a Supplemental Data file and also on our website (http://www.
fw.ucalgary.ca/group2introns/).
Fluorescence Quenching and RNA-Protein Crosslinking
For fluorescence quenching experiments, CP RNAs were generated as de-
scribed above, with GMPS at the 50 end, and conjugated with 2 mM 50-IAF
(5-iodacetamidofluorescein; Invitrogen, Carlsbad, CA) for 2 hr at room tem-
perature in dim light. Unincorporated 50-IAF was removed by addition of
5 mM DTT and gel filtration through a Bio-Spin P-30 column (BioRad; Hercu-
les, CA), followed by phenol-CIA extraction and ethanol precipitation. The
RNA was dissolved in 40 mM Tris-HCl (pH 8.0). For fluorescence quenching
measurements, 50 nM RNA was incubated with increasing concentrations of
LtrA protein (0–200 nM) in 200 ml of reaction medium containing 500 mM
NH4Cl, 50 mM MgCl2, and 40 mM Tris-HCl (pH 8.0). The high salt concentra-
tion is required for optimal LtrA function and also reduces nonspecific bind-
ing (Saldanha et al., 1999). RNA and protein were allowed to equilibrate for
at least 10 min before measuring fluorescence in a fluorimeter (Photon Tech-
nology International, Birmingham, NJ), with excitation and emission
wavelengths of 492 and 515 nm, respectively, using a high-intensity xenon
light source. Titration curves of LtrA binding to Ll.LtrB RNA were fit to the
contacts shown as spheres. (G) Summary of protein contact data, and definition of the color-coding scheme for (B), (C), (E), and (F). Backbone and base pro-
tections are from Matsuura et al. (2001) and include all strong protections in Figures 3 and 4 of that work, as well as moderate protections in regions deemed
to be sites of protein contacts as discussed in that manuscript. For residues that gave data by more than one method, the color was determined by the priority
of red > orange > green > yellow. The red open circle indicates the nearest exposed residue to G99.
Molecular Cell 30, 472–485, May 23, 2008 ª2008 Elsevier Inc. 483

Molecular Cell
Group II Intron RNA Structure
hyper decay equation with KaleidaGraph software (Synergy Software,
Reading, PA).
For RNA-protein crosslinking assays, CP RNAs (500 ng) with 50 triphosphate
ends were dephosphorylated by 25 U Antarctic phosphatase (New England
Biolabs, Beverly, MA) according to the manufacturer’s protocol. After phe-
nol-CIA-extraction and ethanol precipitation, the RNAs were 50-labeled with
[g-35S]-ATP (25 mCi; 1250 Ci/mmol; Perkin Elmer, Boston, MA) and T4 polynu-
cleotide kinase (50 U; New England Biolabs) in 50 ml of 70 mM Tris-HCl
(pH 7.6), 10 mM MgCl2, and 5 mM DTT for 3 hr at 37�C. Samples were phe-
nol-CIA extracted, filtered through a Bio-Rad spin column, ethanol precipi-
tated, and dissolved in 20 ml water. Finally, the RNAs were incubated with 5
mM azidophenacyl bromide in 50 ml of 20 mM Na2CO3 (pH 9.0), 50% methanol
for 2 hr at room temperature in dim light to couple the crosslinker to the 50 end
via the thio group, and then phenol-CIA extracted, filtered through a spin
column, ethanol precipitated, and dissolved in distilled water. The coupling
efficiency was determined by scintillation counting.
For crosslinking assays, 250,000 cpm of 50-labeled RNA was renatured in
a PCR machine as described above and incubated for 30 min at 30�C with
100 nM LtrA protein in 8 ml of 500 mM NH4Cl, 50 mM MgCl2, 40 mM Tris-
HCl (pH 7.5), and 0.1 mg/ml yeast RNA (Sigma) as a nonspecific competitor.
As a negative control, 100 nM of N. crassa CYT-18 protein was substituted
for LtrA. The presence of the yeast RNA competitor was essential to eliminate
nonspecific crosslinking to CYT-18. Complexes were irradiated for 10 min by
two 8 W UV lamps (Spectroline, Westbury NY) with a 305 nm filter (Ocean Op-
tics, Dunedin, FL). Samples were boiled for 2 min, cooled to room temperature,
and digested with RNase T1 (100 units; Ambion, Austin, TX) for 45 min at 37�C,
to leave only the 50-35S-labeled nucleotide attached to the protein. Crosslinked
samples were analyzed in a 0.1% SDS/7% polyacrylamide gel, dried, and
scanned by phosphorimaging.
SUPPLEMENTAL DATA
Supplemental Data include six tables, five figures, Supplemental Experimental
Procedures, and Supplemental References and can be found with this article
online at http://www.molecule.org/cgi/content/full/30/4/472/DC1/.
ACKNOWLEDGMENTS
This work was supported by Canadian Institutes of Health Research (CIHR)
grant MOP-49457 and Natural Sciences and Engineering Research Council
of Canada (NSERC) grant RGP 203717 (S.Z.), National Institutes of Health
(NIH) grant RO1 GM37951 (A.M.L.), and NSERC grant RGPIN 340946-07
(S.Y.N.). Salary support for S.Z. was from the Alberta Heritage Foundation
for Medical Research.
Received: September 7, 2007
Revised: February 19, 2008
Accepted: April 3, 2008
Published online: April 17, 2008
REFERENCES
Blocker, F.J.H., Mohr, G., Conlan, L.H., Qi, L., Belfort, M., and Lambowitz,
A.M. (2005). Domain structure and three-dimensional model of a group II in-
tron-encoded reverse transcriptase. RNA 11, 14–28.
Bonen, L. (1993). Trans-splicing of pre-mRNA in plants, animals, and protists.
FASEB J. 7, 40–46.
Brooks, B.R., Bruccoleri, R.E., Olafson, B.D., States, D.J., Swaminathan, S.,
and Karplus, M. (1983). CHARMM: a program for macromolecular energy min-
imization and dynamics calculations. J. Comput. Chem. 4, 187–217.
Chanfreau, G., and Jacquier, A. (1996). An RNA conformational change
between the two chemical steps of group II self-splicing. EMBO J. 15, 3466–
3476.
Costa, M., and Michel, F. (1999). Tight binding of the 50 exon to domain I of
a group II self-splicing intron requires completion of the intron active site.
EMBO J. 18, 1025–1037.
484 Molecular Cell 30, 472–485, May 23, 2008 ª2008 Elsevier Inc.
Costa, M., Deme, E., Jacquier, A., and Michel, F. (1997). Multiple tertiary inter-
actions involving domain II of group II self-splicing introns. J. Mol. Biol. 267,
520–536.
Costa, M., Michel, F., and Westhof, E. (2000). A three-dimensional perspective
on exon binding by a group II self-splicing intron. EMBO J. 19, 5007–5018.
de Lencastre, A., Hamill, S., and Pyle, A.M. (2005). A single active-site region
for a group II intron. Nat. Struct. Mol. Biol. 12, 626–627.
Eickbush, T.H. (1999). Mobile introns: retrohoming by complete reverse splic-
ing. Curr. Biol. 9, R11–R14.
Fedorova, O., and Pyle, A.M. (2005). Linking the group II intron catalytic
domains: tertiary contacts and structural features of domain 3. EMBO J. 24,
3906–3916.
Harris, M.E., Kazantsev, A.V., Chen, J.L., and Pace, N.R. (1997). Analysis of the
tertiary structure of the ribonuclease P ribozyme-substrate complex by site-
specific photoaffinity crosslinking. RNA 3, 561–576.
Jestin, J.L., Deme, E., and Jacquier, A. (1997). Identification of structural ele-
ments critical for inter-domain interactions in a group II self-splicing intron.
EMBO J. 16, 2945–2954.
Kazantsev, A.V., Krivenko, A.A., Harrington, D.J., Holbrook, S.R., Adams, P.D.,
and Pace, N.R. (2005). Crystal structure of a bacterial ribonuclease P RNA.
Proc. Natl. Acad. Sci. USA 102, 13392–13397.
Koch, J.L., Boulanger, S.C., Dib-Hajj, S.D., Hebbar, S.K., and Perlman, P.S.
(1992). Group II introns deleted for multiple substructures retain self-splicing
activity. Mol. Cell. Biol. 12, 1950–1958.
Lambowitz, A.M., and Zimmerly, S. (2004). Mobile group II introns. Annu. Rev.
Genet. 38, 1–35.
Lehnert, V., Jaeger, L., Michel, F., and Westhof, E. (1996). New loop-loop
tertiary interactions in self-splicing introns of subgroup IC and ID: a complete
3D model of the Tetrahymena thermophila ribozyme. Chem. Biol. 3,
993–1009.
Major, F., Turcotte, M., Gautheret, D., Lapalme, G., Fillion, E., and Cedergren,
R. (1991). The combination of symbolic and numerical computation for three-
dimensional modeling of RNA. Science 253, 1255–1260.
Matsuura, M., Saldanha, R., Ma, H., Wank, H., Yang, J., Mohr, G., Cavanagh,
S., Dunny, G.M., Belfort, M., and Lambowitz, A.M. (1997). A bacterial group II
intron encoding reverse transcriptase, maturase, and DNA endonuclease ac-
tivities: biochemical demonstration of maturase activity and insertion of new
genetic information within the intron. Genes Dev. 11, 2910–2924.
Matsuura, M., Noah, J.W., and Lambowitz, A.M. (2001). Mechanism of matur-
ase-promoted group II intron splicing. EMBO J. 20, 7259–7270.
Noah, J.W., and Lambowitz, A.M. (2003). Effects of maturase binding and
Mg2+ concentration on group II intron RNA folding investigated by UV cross-
linking. Biochemistry 42, 12466–12480.
Noah, J.W., Park, S., Whitt, J.T., Perutka, J., Frey, W., and Lambowitz, A.M.
(2006). Atomic force microscopy reveals DNA bending during group II intron
ribonucleoprotein particle integration into double-stranded DNA. Biochemistry
45, 12424–12435.
Perutka, J., Wang, W., Goerlitz, D., and Lambowitz, A.M. (2004). Use of com-
puter-designed group II introns to disrupt Escherichia coli DExH/D-box protein
and DNA helicase genes. J. Mol. Biol. 336, 421–439.
Pyle, A.M., and Lambowitz, A.M. (2006). Group II introns: ribozymes that splice
RNA and invade DNA. In The RNA World, Third Edition, R.F. Gesteland, T.R.
Cech, and J.F. Atkins, eds. (Cold Spring Harbor, NY: Cold Spring Harbor
Press), pp. 469–506.
Pyle, A.M., Fedorova, O., and Waldsich, C. (2007). Folding of group II introns:
a model system for large, multidomain RNAs? Trends Biochem. Sci. 32,
138–145.
Qin, P.Z., and Pyle, A.M. (1999). Antagonistic substrate binding by a group II
intron ribozyme. J. Mol. Biol. 291, 15–27.
Rhode, B.M., Hartmuth, K., Westhof, E., and Luhrmann, R. (2006). Proximity of
conserved U6 and U2 snRNA elements to the 50 splice site region in activated
spliceosomes. EMBO J. 25, 2475–2486.

Molecular Cell
Group II Intron RNA Structure
Saldanha, R., Chen, B., Wank, H., Matsuura, M., Edwards, J., and Lambowitz,
A.M. (1999). RNA and protein catalysis in group II intron splicing and mobility
reactions using purified components. Biochemistry 38, 9069–9083.
Singh, N.N., and Lambowitz, A.M. (2001). Interaction of a group II intron ribo-
nucleoprotein endonuclease with its DNA target site investigated by DNA
footprinting and modification interference. J. Mol. Biol. 309, 361–386.
Su, L.J., Waldsich, C., and Pyle, A.M. (2005). An obligate intermediate along
the slow folding pathway of a group II intron ribozyme. Nucleic Acids Res.
33, 6674–6687.
Swisher, J., Duarte, C.M., Su, L.J., and Pyle, A.M. (2001). Visualizing the sol-
vent-inaccessible core of a group II intron ribozyme. EMBO J. 20, 2051–2061.
Thomas, B.C., Kazantsev, A.V., Chen, J.L., and Pace, N.R. (2000). Photoaffin-
ity cross-linking and RNA structure analysis. Methods Enzymol. 318, 136–147.
Toor, N., Hausner, G., and Zimmerly, S. (2001). Coevolution of group II intron
RNA structures with their intron-encoded reverse transcriptases. RNA 7,
1142–1152.
Wank, H., San Filippo, J., Singh, R.N., Matsuura, M., and Lambowitz, A.M.
(1999). A reverse transcriptase/maturase promotes splicing by binding at its
own coding segment in a group II intron RNA. Mol. Cell 4, 239–250.
Molecular Cell 30, 472–485, May 23, 2008 ª2008 Elsevier Inc. 485