Molecular profiling of activated neurons by phosphorylated ribosome capture
12
Resource Molecular Profiling of Activated Neurons by Phosphorylated Ribosome Capture Zachary A. Knight, 1, * Keith Tan, 1 Kivanc Birsoy, 1 Sarah Schmidt, 1 Jennifer L. Garrison, 1 Robert W. Wysocki, 1 Ana Emiliano, 1 Mats I. Ekstrand, 1 and Jeffrey M. Friedman 1, * 1 Laboratory of Molecular Genetics, Howard Hughes Medical Institute, The Rockefeller University, 1230 York Avenue, New York, NY 10021, USA *Correspondence: [email protected] (Z.A.K.), [email protected] (J.M.F.) http://dx.doi.org/10.1016/j.cell.2012.10.039 SUMMARY The mammalian brain is composed of thousands of interacting neural cell types. Systematic approaches to establish the molecular identity of functional populations of neurons would advance our under- standing of neural mechanisms controlling behavior. Here, we show that ribosomal protein S6, a structural component of the ribosome, becomes phosphory- lated in neurons activated by a wide range of stimuli. We show that these phosphorylated ribosomes can be captured from mouse brain homogenates, thereby enriching directly for the mRNAs expressed in discrete subpopulations of activated cells. We use this approach to identify neurons in the hypo- thalamus regulated by changes in salt balance or food availability. We show that galanin neurons are activated by fasting and that prodynorphin neu- rons restrain food intake during scheduled feed- ing. These studies identify elements of the neural circuit that controls food intake and illustrate how the activity-dependent capture of cell-type-specific transcripts can elucidate the functional organization of a complex tissue. INTRODUCTION A basic goal of neuroscience is to link the activity of specific neuronal cell types to the various functions of the brain. This task is complicated by the extraordinary cellular diversity of the mammalian central nervous system (CNS) (Lichtman and Denk, 2011; Masland, 2004; Nelson et al., 2006; Stevens, 1998) and the fact that most neurons cannot be identified based solely on their morphology or location (Isogai et al., 2011; Siegert et al., 2009). Comprehensive analyses of gene expression in the ner- vous system, such as the GENSAT project and the Allen Brain Atlas, have revealed extensive heterogeneity in gene expression across brain regions (Gong et al., 2003; Lein et al., 2007), but there are significant gaps in our understanding of how this molecular diversity is linked to function. The ability to profile the genes uniquely expressed in neurons that respond to a stimulus would facilitate the systematic molec- ular identification of the cell types that control behavior. The molecular identification of these cells would also enable their manipulation in vivo by using technologies that make it pos- sible to activate or inhibit neurons with light (Yizhar et al., 2011), generate transcriptional profiles from neurons by using tagged ribosomes (Heiman et al., 2008; Sanz et al., 2009), or label and record from neurons by using fluorescent reporters (Gong et al., 2003). These tools achieve their selectivity by target- ing protein expression using a promoter from a cell-type-specific marker gene, but in many cases, the marker genes that identify a functional population of neurons are unknown (Zhang et al., 2007). Immediate early genes such as c-fos have been widely used to visualize the neurons that respond to numerous stimuli (Morgan and Curran, 1991). However, despite its utility in marking neurons that have been biochemically activated, c-Fos staining does not reveal the genetic identity of the labeled cells. Characterizing the coexpression of an activation marker such as c-Fos with even a limited set of candidate genes requires processing large numbers of histologic sections (Isogai et al., 2011). For this reason, system- atic methods are needed to profile gene expression from discrete subpopulations of activated neurons in the brain. Here, we show that phosphorylation of the ribosome can be used as a molecular tag to retrieve RNA selectively from acti- vated neurons. This enables the unbiased discovery of the genes that are uniquely expressed in a functional population of neu- rons. By quantifying in parallel the enrichment of many such markers, it is possible to assess the activation or inhibition of numerous cell types in a complex tissue, revealing the coordi- nated regulation of ensembles of neurons in response to an external stimulus. We use this approach to identify cellular components of the neural circuit that controls feeding in the hypothalamus. RESULTS Ribosome Phosphorylation Often Correlates with Neural Activity Immediate early genes such as c-fos are widely used to visualize activated neurons in the mouse brain (Morgan and Curran, 1991), 1126 Cell 151, 1126–1137, November 21, 2012 ª2012 Elsevier Inc.
Transcript of Molecular profiling of activated neurons by phosphorylated ribosome capture
Resource
Molecular Profiling of ActivatedNeurons by PhosphorylatedRibosome CaptureZachary A. Knight,1,* Keith Tan,1 Kivanc Birsoy,1 Sarah Schmidt,1 Jennifer L. Garrison,1 Robert W. Wysocki,1
Ana Emiliano,1 Mats I. Ekstrand,1 and Jeffrey M. Friedman1,*1Laboratory of Molecular Genetics, Howard Hughes Medical Institute, The Rockefeller University, 1230 York Avenue, New York,
NY 10021, USA
*Correspondence: [email protected] (Z.A.K.), [email protected] (J.M.F.)http://dx.doi.org/10.1016/j.cell.2012.10.039
SUMMARY
The mammalian brain is composed of thousands ofinteracting neural cell types. Systematic approachesto establish the molecular identity of functionalpopulations of neurons would advance our under-standing of neural mechanisms controlling behavior.Here, we show that ribosomal protein S6, a structuralcomponent of the ribosome, becomes phosphory-lated in neurons activated by a wide range of stimuli.We show that these phosphorylated ribosomescan be captured from mouse brain homogenates,thereby enriching directly for the mRNAs expressedin discrete subpopulations of activated cells. Weuse this approach to identify neurons in the hypo-thalamus regulated by changes in salt balance orfood availability. We show that galanin neuronsare activated by fasting and that prodynorphin neu-rons restrain food intake during scheduled feed-ing. These studies identify elements of the neuralcircuit that controls food intake and illustrate howthe activity-dependent capture of cell-type-specifictranscripts can elucidate the functional organizationof a complex tissue.
INTRODUCTION
A basic goal of neuroscience is to link the activity of specific
neuronal cell types to the various functions of the brain. This
task is complicated by the extraordinary cellular diversity of the
mammalian central nervous system (CNS) (Lichtman and Denk,
2011; Masland, 2004; Nelson et al., 2006; Stevens, 1998) and
the fact that most neurons cannot be identified based solely on
their morphology or location (Isogai et al., 2011; Siegert et al.,
2009). Comprehensive analyses of gene expression in the ner-
vous system, such as the GENSAT project and the Allen Brain
Atlas, have revealed extensive heterogeneity in gene expression
across brain regions (Gong et al., 2003; Lein et al., 2007), but
there are significant gaps in our understanding of how this
molecular diversity is linked to function.
1126 Cell 151, 1126–1137, November 21, 2012 ª2012 Elsevier Inc.
The ability to profile the genes uniquely expressed in neurons
that respond to a stimulus would facilitate the systematic molec-
ular identification of the cell types that control behavior. The
molecular identification of these cells would also enable their
manipulation in vivo by using technologies that make it pos-
sible to activate or inhibit neurons with light (Yizhar et al.,
2011), generate transcriptional profiles from neurons by using
tagged ribosomes (Heiman et al., 2008; Sanz et al., 2009), or
label and record from neurons by using fluorescent reporters
(Gong et al., 2003). These tools achieve their selectivity by target-
ing protein expression using a promoter from a cell-type-specific
marker gene, but in many cases, the marker genes that identify
a functional population of neurons are unknown (Zhang et al.,
2007).
Immediate early genes such as c-fos have beenwidely used to
visualize the neurons that respond to numerous stimuli (Morgan
andCurran, 1991). However, despite its utility inmarking neurons
that have been biochemically activated, c-Fos staining does not
reveal the genetic identity of the labeled cells. Characterizing the
coexpression of an activation marker such as c-Fos with even a
limited set of candidate genes requiresprocessing largenumbers
of histologic sections (Isogai et al., 2011). For this reason, system-
aticmethods are needed to profile gene expression fromdiscrete
subpopulations of activated neurons in the brain.
Here, we show that phosphorylation of the ribosome can be
used as a molecular tag to retrieve RNA selectively from acti-
vated neurons. This enables the unbiased discovery of the genes
that are uniquely expressed in a functional population of neu-
rons. By quantifying in parallel the enrichment of many such
markers, it is possible to assess the activation or inhibition of
numerous cell types in a complex tissue, revealing the coordi-
nated regulation of ensembles of neurons in response to an
external stimulus. We use this approach to identify cellular
components of the neural circuit that controls feeding in the
hypothalamus.
RESULTS
RibosomePhosphorylationOftenCorrelateswith NeuralActivityImmediate early genes such as c-fos are widely used to visualize
activated neurons in themouse brain (Morgan andCurran, 1991),
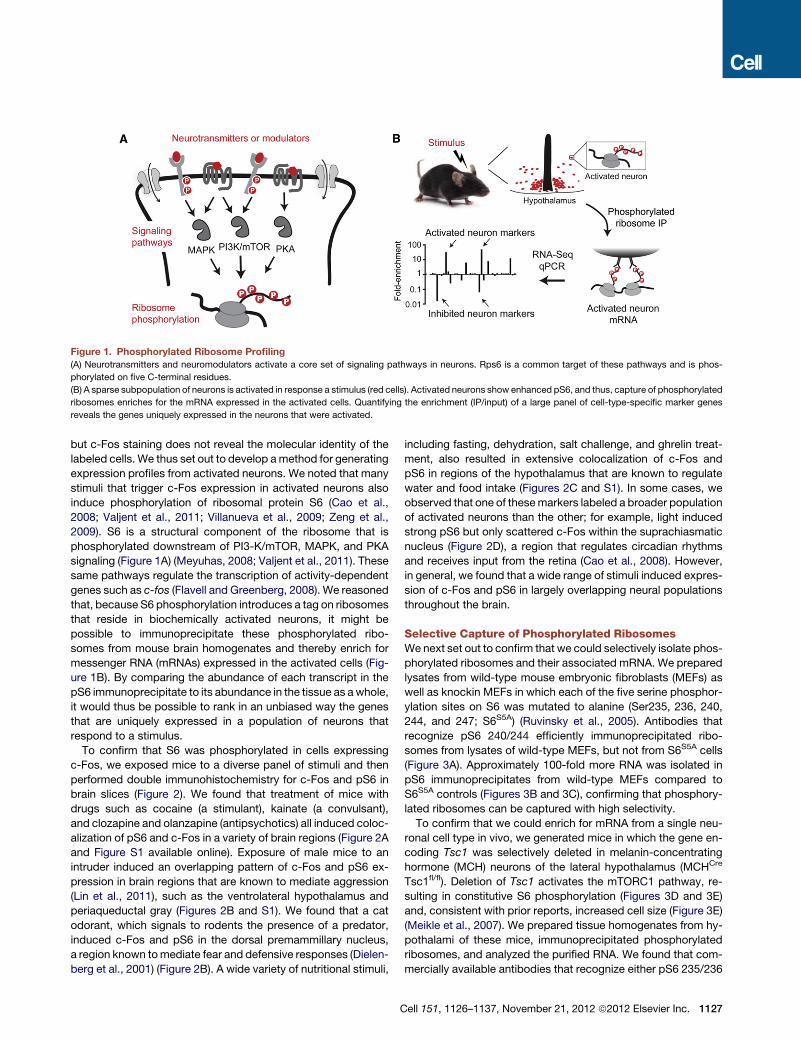
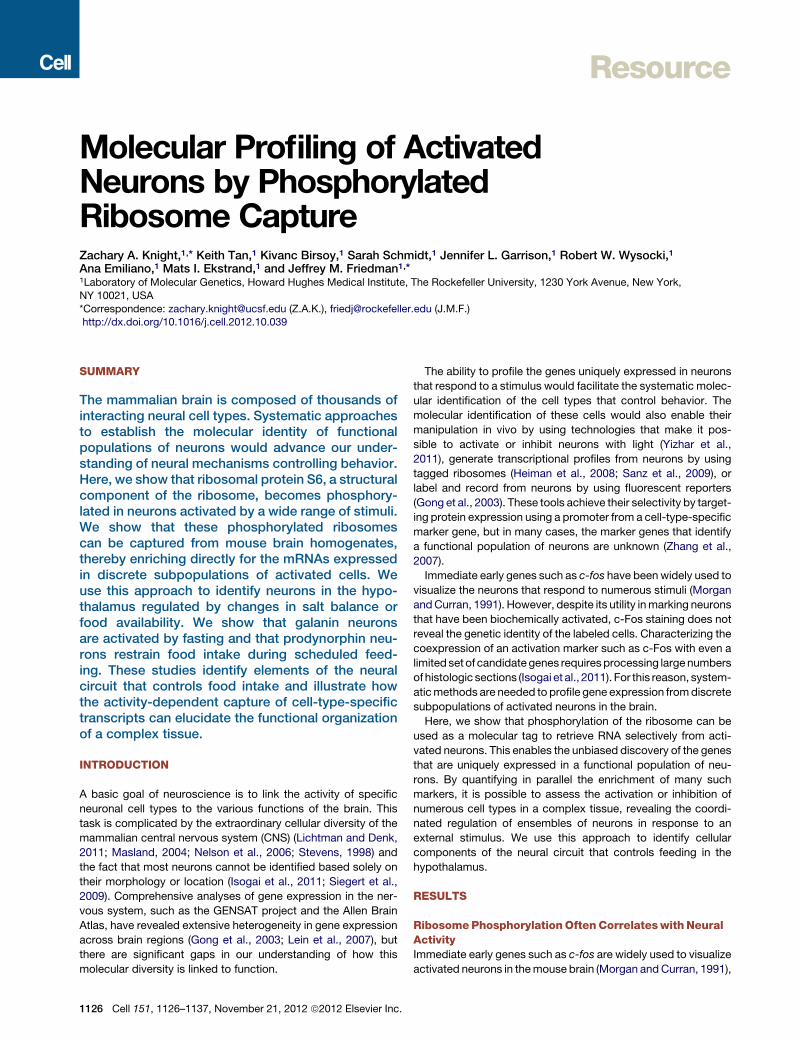
Figure 1. Phosphorylated Ribosome Profiling
(A) Neurotransmitters and neuromodulators activate a core set of signaling pathways in neurons. Rps6 is a common target of these pathways and is phos-
phorylated on five C-terminal residues.
(B) A sparse subpopulation of neurons is activated in response a stimulus (red cells). Activated neurons show enhanced pS6, and thus, capture of phosphorylated
ribosomes enriches for the mRNA expressed in the activated cells. Quantifying the enrichment (IP/input) of a large panel of cell-type-specific marker genes
reveals the genes uniquely expressed in the neurons that were activated.
but c-Fos staining does not reveal the molecular identity of the
labeled cells. We thus set out to develop amethod for generating
expression profiles from activated neurons. We noted that many
stimuli that trigger c-Fos expression in activated neurons also
induce phosphorylation of ribosomal protein S6 (Cao et al.,
2008; Valjent et al., 2011; Villanueva et al., 2009; Zeng et al.,
2009). S6 is a structural component of the ribosome that is
phosphorylated downstream of PI3-K/mTOR, MAPK, and PKA
signaling (Figure 1A) (Meyuhas, 2008; Valjent et al., 2011). These
same pathways regulate the transcription of activity-dependent
genes such as c-fos (Flavell and Greenberg, 2008). We reasoned
that, because S6 phosphorylation introduces a tag on ribosomes
that reside in biochemically activated neurons, it might be
possible to immunoprecipitate these phosphorylated ribo-
somes from mouse brain homogenates and thereby enrich for
messenger RNA (mRNAs) expressed in the activated cells (Fig-
ure 1B). By comparing the abundance of each transcript in the
pS6 immunoprecipitate to its abundance in the tissue as awhole,
it would thus be possible to rank in an unbiased way the genes
that are uniquely expressed in a population of neurons that
respond to a stimulus.
To confirm that S6 was phosphorylated in cells expressing
c-Fos, we exposed mice to a diverse panel of stimuli and then
performed double immunohistochemistry for c-Fos and pS6 in
brain slices (Figure 2). We found that treatment of mice with
drugs such as cocaine (a stimulant), kainate (a convulsant),
and clozapine and olanzapine (antipsychotics) all induced coloc-
alization of pS6 and c-Fos in a variety of brain regions (Figure 2A
and Figure S1 available online). Exposure of male mice to an
intruder induced an overlapping pattern of c-Fos and pS6 ex-
pression in brain regions that are known to mediate aggression
(Lin et al., 2011), such as the ventrolateral hypothalamus and
periaqueductal gray (Figures 2B and S1). We found that a cat
odorant, which signals to rodents the presence of a predator,
induced c-Fos and pS6 in the dorsal premammillary nucleus,
a region known tomediate fear and defensive responses (Dielen-
berg et al., 2001) (Figure 2B). A wide variety of nutritional stimuli,
C
including fasting, dehydration, salt challenge, and ghrelin treat-
ment, also resulted in extensive colocalization of c-Fos and
pS6 in regions of the hypothalamus that are known to regulate
water and food intake (Figures 2C and S1). In some cases, we
observed that one of thesemarkers labeled a broader population
of activated neurons than the other; for example, light induced
strong pS6 but only scattered c-Fos within the suprachiasmatic
nucleus (Figure 2D), a region that regulates circadian rhythms
and receives input from the retina (Cao et al., 2008). However,
in general, we found that a wide range of stimuli induced expres-
sion of c-Fos and pS6 in largely overlapping neural populations
throughout the brain.
Selective Capture of Phosphorylated RibosomesWenext set out to confirm that we could selectively isolate phos-
phorylated ribosomes and their associated mRNA. We prepared
lysates from wild-type mouse embryonic fibroblasts (MEFs) as
well as knockin MEFs in which each of the five serine phosphor-
ylation sites on S6 was mutated to alanine (Ser235, 236, 240,
244, and 247; S6S5A) (Ruvinsky et al., 2005). Antibodies that
recognize pS6 240/244 efficiently immunoprecipitated ribo-
somes from lysates of wild-type MEFs, but not from S6S5A cells
(Figure 3A). Approximately 100-fold more RNA was isolated in
pS6 immunoprecipitates from wild-type MEFs compared to
S6S5A controls (Figures 3B and 3C), confirming that phosphory-
lated ribosomes can be captured with high selectivity.
To confirm that we could enrich for mRNA from a single neu-
ronal cell type in vivo, we generated mice in which the gene en-
coding Tsc1 was selectively deleted in melanin-concentrating
hormone (MCH) neurons of the lateral hypothalamus (MCHCre
Tsc1fl/fl). Deletion of Tsc1 activates the mTORC1 pathway, re-
sulting in constitutive S6 phosphorylation (Figures 3D and 3E)
and, consistent with prior reports, increased cell size (Figure 3E)
(Meikle et al., 2007). We prepared tissue homogenates from hy-
pothalami of these mice, immunoprecipitated phosphorylated
ribosomes, and analyzed the purified RNA. We found that com-
mercially available antibodies that recognize either pS6 235/236
ell 151, 1126–1137, November 21, 2012 ª2012 Elsevier Inc. 1127
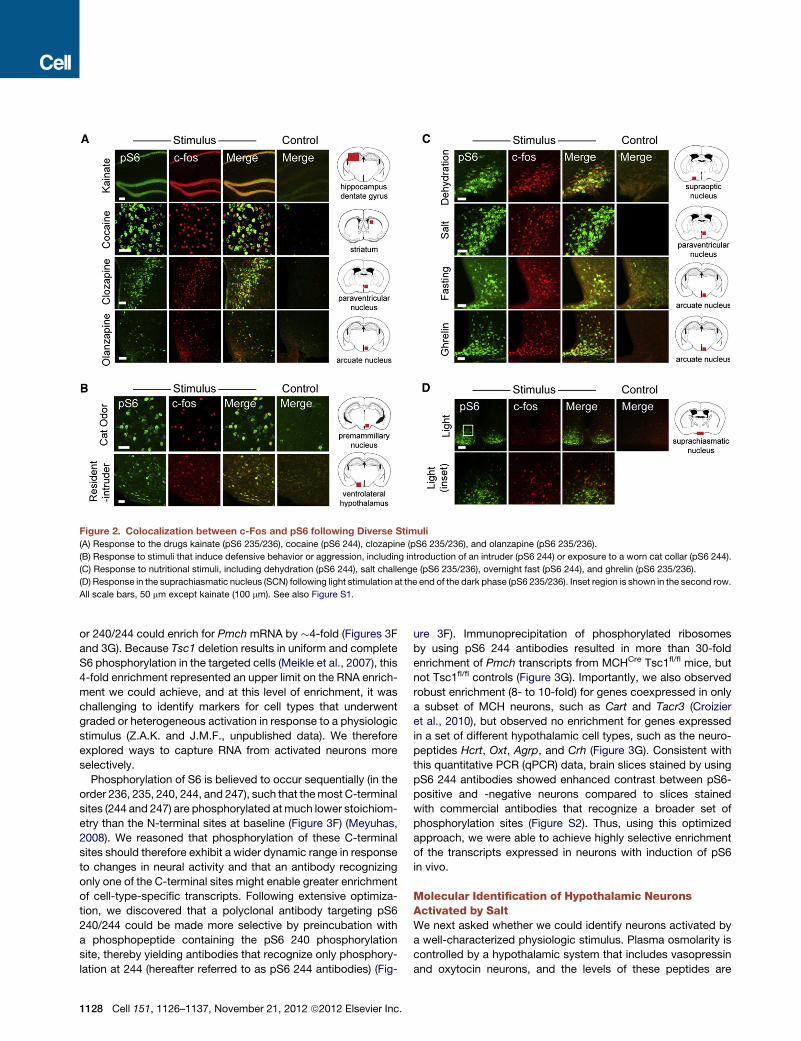
Figure 2. Colocalization between c-Fos and pS6 following Diverse Stimuli
(A) Response to the drugs kainate (pS6 235/236), cocaine (pS6 244), clozapine (pS6 235/236), and olanzapine (pS6 235/236).
(B) Response to stimuli that induce defensive behavior or aggression, including introduction of an intruder (pS6 244) or exposure to a worn cat collar (pS6 244).
(C) Response to nutritional stimuli, including dehydration (pS6 244), salt challenge (pS6 235/236), overnight fast (pS6 244), and ghrelin (pS6 235/236).
(D) Response in the suprachiasmatic nucleus (SCN) following light stimulation at the end of the dark phase (pS6 235/236). Inset region is shown in the second row.
All scale bars, 50 mm except kainate (100 mm). See also Figure S1.
or 240/244 could enrich for Pmch mRNA by �4-fold (Figures 3F
and 3G). Because Tsc1 deletion results in uniform and complete
S6 phosphorylation in the targeted cells (Meikle et al., 2007), this
4-fold enrichment represented an upper limit on the RNA enrich-
ment we could achieve, and at this level of enrichment, it was
challenging to identify markers for cell types that underwent
graded or heterogeneous activation in response to a physiologic
stimulus (Z.A.K. and J.M.F., unpublished data). We therefore
explored ways to capture RNA from activated neurons more
selectively.
Phosphorylation of S6 is believed to occur sequentially (in the
order 236, 235, 240, 244, and 247), such that themost C-terminal
sites (244 and 247) are phosphorylated atmuch lower stoichiom-
etry than the N-terminal sites at baseline (Figure 3F) (Meyuhas,
2008). We reasoned that phosphorylation of these C-terminal
sites should therefore exhibit a wider dynamic range in response
to changes in neural activity and that an antibody recognizing
only one of the C-terminal sites might enable greater enrichment
of cell-type-specific transcripts. Following extensive optimiza-
tion, we discovered that a polyclonal antibody targeting pS6
240/244 could be made more selective by preincubation with
a phosphopeptide containing the pS6 240 phosphorylation
site, thereby yielding antibodies that recognize only phosphory-
lation at 244 (hereafter referred to as pS6 244 antibodies) (Fig-
1128 Cell 151, 1126–1137, November 21, 2012 ª2012 Elsevier Inc.
ure 3F). Immunoprecipitation of phosphorylated ribosomes
by using pS6 244 antibodies resulted in more than 30-fold
enrichment of Pmch transcripts from MCHCre Tsc1fl/fl mice, but
not Tsc1fl/fl controls (Figure 3G). Importantly, we also observed
robust enrichment (8- to 10-fold) for genes coexpressed in only
a subset of MCH neurons, such as Cart and Tacr3 (Croizier
et al., 2010), but observed no enrichment for genes expressed
in a set of different hypothalamic cell types, such as the neuro-
peptides Hcrt, Oxt, Agrp, and Crh (Figure 3G). Consistent with
this quantitative PCR (qPCR) data, brain slices stained by using
pS6 244 antibodies showed enhanced contrast between pS6-
positive and -negative neurons compared to slices stained
with commercial antibodies that recognize a broader set of
phosphorylation sites (Figure S2). Thus, using this optimized
approach, we were able to achieve highly selective enrichment
of the transcripts expressed in neurons with induction of pS6
in vivo.
Molecular Identification of Hypothalamic NeuronsActivated by SaltWe next asked whether we could identify neurons activated by
a well-characterized physiologic stimulus. Plasma osmolarity is
controlled by a hypothalamic system that includes vasopressin
and oxytocin neurons, and the levels of these peptides are
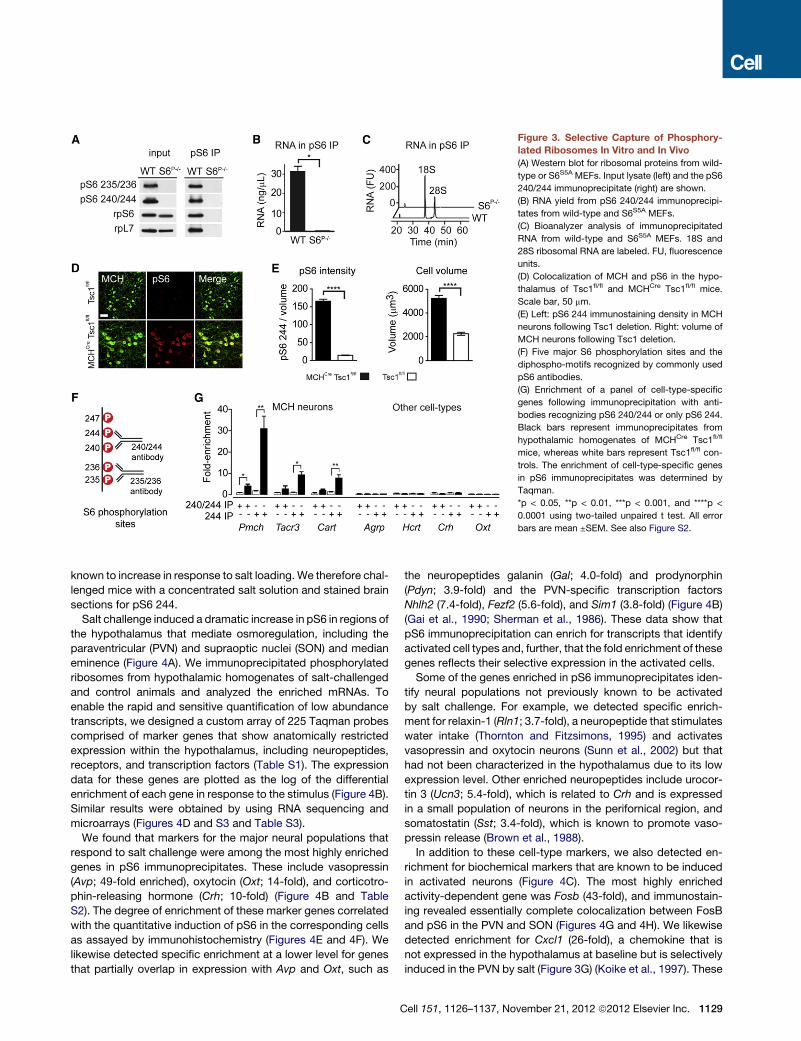
Figure 3. Selective Capture of Phosphory-
lated Ribosomes In Vitro and In Vivo
(A) Western blot for ribosomal proteins from wild-
type or S6S5A MEFs. Input lysate (left) and the pS6
240/244 immunoprecipitate (right) are shown.
(B) RNA yield from pS6 240/244 immunoprecipi-
tates from wild-type and S6S5A MEFs.
(C) Bioanalyzer analysis of immunoprecipitated
RNA from wild-type and S6S5A MEFs. 18S and
28S ribosomal RNA are labeled. FU, fluorescence
units.
(D) Colocalization of MCH and pS6 in the hypo-
thalamus of Tsc1fl/fl and MCHCre Tsc1fl/fl mice.
Scale bar, 50 mm.
(E) Left: pS6 244 immunostaining density in MCH
neurons following Tsc1 deletion. Right: volume of
MCH neurons following Tsc1 deletion.
(F) Five major S6 phosphorylation sites and the
diphospho-motifs recognized by commonly used
pS6 antibodies.
(G) Enrichment of a panel of cell-type-specific
genes following immunoprecipitation with anti-
bodies recognizing pS6 240/244 or only pS6 244.
Black bars represent immunoprecipitates from
hypothalamic homogenates of MCHCre Tsc1fl/fl
mice, whereas white bars represent Tsc1fl/fl con-
trols. The enrichment of cell-type-specific genes
in pS6 immunoprecipitates was determined by
Taqman.
*p < 0.05, **p < 0.01, ***p < 0.001, and ****p <
0.0001 using two-tailed unpaired t test. All error
bars are mean ±SEM. See also Figure S2.
known to increase in response to salt loading. We therefore chal-
lenged mice with a concentrated salt solution and stained brain
sections for pS6 244.
Salt challenge induced a dramatic increase in pS6 in regions of
the hypothalamus that mediate osmoregulation, including the
paraventricular (PVN) and supraoptic nuclei (SON) and median
eminence (Figure 4A). We immunoprecipitated phosphorylated
ribosomes from hypothalamic homogenates of salt-challenged
and control animals and analyzed the enriched mRNAs. To
enable the rapid and sensitive quantification of low abundance
transcripts, we designed a custom array of 225 Taqman probes
comprised of marker genes that show anatomically restricted
expression within the hypothalamus, including neuropeptides,
receptors, and transcription factors (Table S1). The expression
data for these genes are plotted as the log of the differential
enrichment of each gene in response to the stimulus (Figure 4B).
Similar results were obtained by using RNA sequencing and
microarrays (Figures 4D and S3 and Table S3).
We found that markers for the major neural populations that
respond to salt challenge were among the most highly enriched
genes in pS6 immunoprecipitates. These include vasopressin
(Avp; 49-fold enriched), oxytocin (Oxt; 14-fold), and corticotro-
phin-releasing hormone (Crh; 10-fold) (Figure 4B and Table
S2). The degree of enrichment of these marker genes correlated
with the quantitative induction of pS6 in the corresponding cells
as assayed by immunohistochemistry (Figures 4E and 4F). We
likewise detected specific enrichment at a lower level for genes
that partially overlap in expression with Avp and Oxt, such as
C
the neuropeptides galanin (Gal; 4.0-fold) and prodynorphin
(Pdyn; 3.9-fold) and the PVN-specific transcription factors
Nhlh2 (7.4-fold), Fezf2 (5.6-fold), and Sim1 (3.8-fold) (Figure 4B)
(Gai et al., 1990; Sherman et al., 1986). These data show that
pS6 immunoprecipitation can enrich for transcripts that identify
activated cell types and, further, that the fold enrichment of these
genes reflects their selective expression in the activated cells.
Some of the genes enriched in pS6 immunoprecipitates iden-
tify neural populations not previously known to be activated
by salt challenge. For example, we detected specific enrich-
ment for relaxin-1 (Rln1; 3.7-fold), a neuropeptide that stimulates
water intake (Thornton and Fitzsimons, 1995) and activates
vasopressin and oxytocin neurons (Sunn et al., 2002) but that
had not been characterized in the hypothalamus due to its low
expression level. Other enriched neuropeptides include urocor-
tin 3 (Ucn3; 5.4-fold), which is related to Crh and is expressed
in a small population of neurons in the perifornical region, and
somatostatin (Sst; 3.4-fold), which is known to promote vaso-
pressin release (Brown et al., 1988).
In addition to these cell-type markers, we also detected en-
richment for biochemical markers that are known to be induced
in activated neurons (Figure 4C). The most highly enriched
activity-dependent gene was Fosb (43-fold), and immunostain-
ing revealed essentially complete colocalization between FosB
and pS6 in the PVN and SON (Figures 4G and 4H). We likewise
detected enrichment for Cxcl1 (26-fold), a chemokine that is
not expressed in the hypothalamus at baseline but is selectively
induced in the PVN by salt (Figure 3G) (Koike et al., 1997). These
ell 151, 1126–1137, November 21, 2012 ª2012 Elsevier Inc. 1129
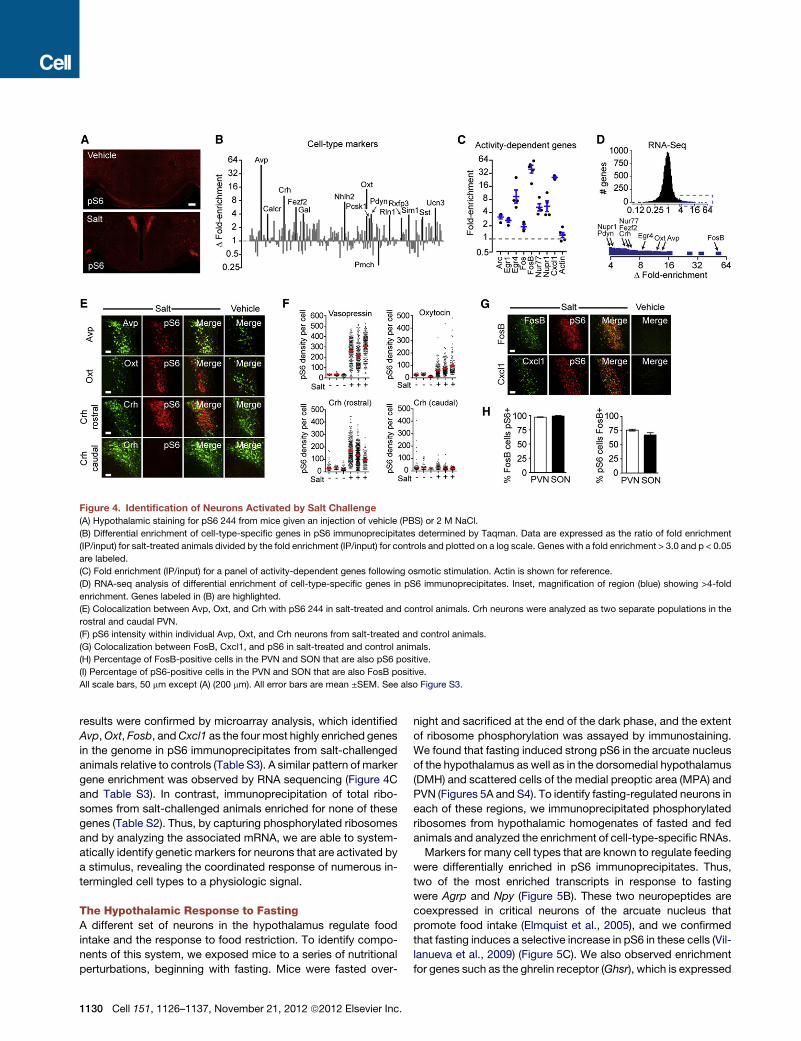
Figure 4. Identification of Neurons Activated by Salt Challenge
(A) Hypothalamic staining for pS6 244 from mice given an injection of vehicle (PBS) or 2 M NaCl.
(B) Differential enrichment of cell-type-specific genes in pS6 immunoprecipitates determined by Taqman. Data are expressed as the ratio of fold enrichment
(IP/input) for salt-treated animals divided by the fold enrichment (IP/input) for controls and plotted on a log scale. Genes with a fold enrichment > 3.0 and p < 0.05
are labeled.
(C) Fold enrichment (IP/input) for a panel of activity-dependent genes following osmotic stimulation. Actin is shown for reference.
(D) RNA-seq analysis of differential enrichment of cell-type-specific genes in pS6 immunoprecipitates. Inset, magnification of region (blue) showing >4-fold
enrichment. Genes labeled in (B) are highlighted.
(E) Colocalization between Avp, Oxt, and Crh with pS6 244 in salt-treated and control animals. Crh neurons were analyzed as two separate populations in the
rostral and caudal PVN.
(F) pS6 intensity within individual Avp, Oxt, and Crh neurons from salt-treated and control animals.
(G) Colocalization between FosB, Cxcl1, and pS6 in salt-treated and control animals.
(H) Percentage of FosB-positive cells in the PVN and SON that are also pS6 positive.
(I) Percentage of pS6-positive cells in the PVN and SON that are also FosB positive.
All scale bars, 50 mm except (A) (200 mm). All error bars are mean ±SEM. See also Figure S3.
results were confirmed by microarray analysis, which identified
Avp,Oxt, Fosb, andCxcl1 as the fourmost highly enriched genes
in the genome in pS6 immunoprecipitates from salt-challenged
animals relative to controls (Table S3). A similar pattern of marker
gene enrichment was observed by RNA sequencing (Figure 4C
and Table S3). In contrast, immunoprecipitation of total ribo-
somes from salt-challenged animals enriched for none of these
genes (Table S2). Thus, by capturing phosphorylated ribosomes
and by analyzing the associated mRNA, we are able to system-
atically identify genetic markers for neurons that are activated by
a stimulus, revealing the coordinated response of numerous in-
termingled cell types to a physiologic signal.
The Hypothalamic Response to FastingA different set of neurons in the hypothalamus regulate food
intake and the response to food restriction. To identify compo-
nents of this system, we exposed mice to a series of nutritional
perturbations, beginning with fasting. Mice were fasted over-
1130 Cell 151, 1126–1137, November 21, 2012 ª2012 Elsevier Inc.
night and sacrificed at the end of the dark phase, and the extent
of ribosome phosphorylation was assayed by immunostaining.
We found that fasting induced strong pS6 in the arcuate nucleus
of the hypothalamus as well as in the dorsomedial hypothalamus
(DMH) and scattered cells of the medial preoptic area (MPA) and
PVN (Figures 5A and S4). To identify fasting-regulated neurons in
each of these regions, we immunoprecipitated phosphorylated
ribosomes from hypothalamic homogenates of fasted and fed
animals and analyzed the enrichment of cell-type-specific RNAs.
Markers for many cell types that are known to regulate feeding
were differentially enriched in pS6 immunoprecipitates. Thus,
two of the most enriched transcripts in response to fasting
were Agrp and Npy (Figure 5B). These two neuropeptides are
coexpressed in critical neurons of the arcuate nucleus that
promote food intake (Elmquist et al., 2005), and we confirmed
that fasting induces a selective increase in pS6 in these cells (Vil-
lanueva et al., 2009) (Figure 5C). We also observed enrichment
for genes such as the ghrelin receptor (Ghsr), which is expressed
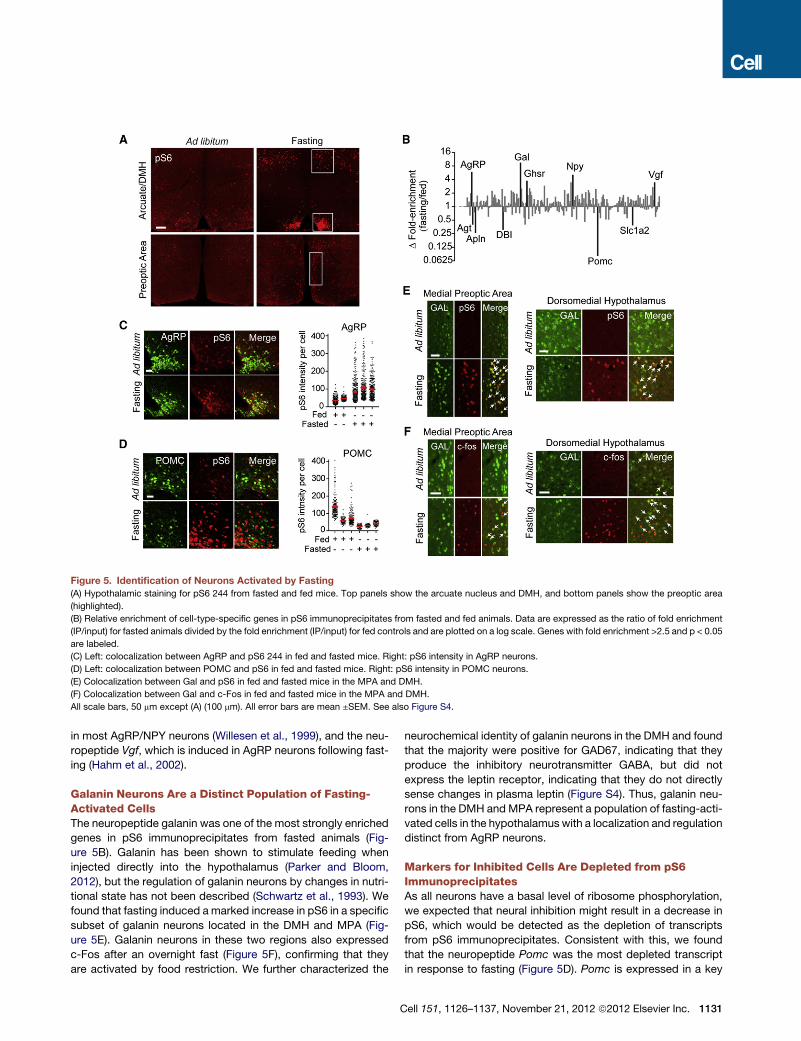
Figure 5. Identification of Neurons Activated by Fasting
(A) Hypothalamic staining for pS6 244 from fasted and fed mice. Top panels show the arcuate nucleus and DMH, and bottom panels show the preoptic area
(highlighted).
(B) Relative enrichment of cell-type-specific genes in pS6 immunoprecipitates from fasted and fed animals. Data are expressed as the ratio of fold enrichment
(IP/input) for fasted animals divided by the fold enrichment (IP/input) for fed controls and are plotted on a log scale. Genes with fold enrichment >2.5 and p < 0.05
are labeled.
(C) Left: colocalization between AgRP and pS6 244 in fed and fasted mice. Right: pS6 intensity in AgRP neurons.
(D) Left: colocalization between POMC and pS6 in fed and fasted mice. Right: pS6 intensity in POMC neurons.
(E) Colocalization between Gal and pS6 in fed and fasted mice in the MPA and DMH.
(F) Colocalization between Gal and c-Fos in fed and fasted mice in the MPA and DMH.
All scale bars, 50 mm except (A) (100 mm). All error bars are mean ±SEM. See also Figure S4.
in most AgRP/NPY neurons (Willesen et al., 1999), and the neu-
ropeptide Vgf, which is induced in AgRP neurons following fast-
ing (Hahm et al., 2002).
Galanin Neurons Are a Distinct Population of Fasting-Activated CellsThe neuropeptide galanin was one of the most strongly enriched
genes in pS6 immunoprecipitates from fasted animals (Fig-
ure 5B). Galanin has been shown to stimulate feeding when
injected directly into the hypothalamus (Parker and Bloom,
2012), but the regulation of galanin neurons by changes in nutri-
tional state has not been described (Schwartz et al., 1993). We
found that fasting induced amarked increase in pS6 in a specific
subset of galanin neurons located in the DMH and MPA (Fig-
ure 5E). Galanin neurons in these two regions also expressed
c-Fos after an overnight fast (Figure 5F), confirming that they
are activated by food restriction. We further characterized the
C
neurochemical identity of galanin neurons in the DMH and found
that the majority were positive for GAD67, indicating that they
produce the inhibitory neurotransmitter GABA, but did not
express the leptin receptor, indicating that they do not directly
sense changes in plasma leptin (Figure S4). Thus, galanin neu-
rons in the DMH and MPA represent a population of fasting-acti-
vated cells in the hypothalamus with a localization and regulation
distinct from AgRP neurons.
Markers for Inhibited Cells Are Depleted from pS6ImmunoprecipitatesAs all neurons have a basal level of ribosome phosphorylation,
we expected that neural inhibition might result in a decrease in
pS6, which would be detected as the depletion of transcripts
from pS6 immunoprecipitates. Consistent with this, we found
that the neuropeptide Pomc was the most depleted transcript
in response to fasting (Figure 5D). Pomc is expressed in a key
ell 151, 1126–1137, November 21, 2012 ª2012 Elsevier Inc. 1131
population of neurons in the Arc that inhibit food intake, and
Pomc expression is downregulated during food deprivation
(Elmquist et al., 2005), whereas leptin increases c-Fos in Pomc
neurons as well as the firing rate of these cells (Cowley et al.,
2001). Although fasting increases the level of pS6 in the Arc
overall (largely as a result of AgRP neuron activation, Figure 5A),
we showed by quantitative imaging that fasting decreases the
density of pS6 specifically within Pomc-expressing cells (Fig-
ure 5D). Thus, the depletion of specific transcripts from pS6
immunoprecipitates can reveal the identity of inhibited neurons.
It is important to emphasize that the depletion we observe for
Pomc is not the result of a change in its expression level, as
we analyze only the ratio of RNA in the immunoprecipitate versus
the tissue as a whole (immunoprecipitate [IP]/input). Rather,
we enrich or deplete for RNA from neurons based on whether
the state of activation of that neuron has changed. This ability
to detect inhibition by ribosome profiling contrasts with c-Fos
staining, which has a limited ability to detect downregulation
due to the low level of c-Fos expression in most cells at baseline.
In addition to Pomc, we observed depletion following fasting
of several additional neuropeptides that have been reported
to inhibit feeding (Figure 5B), including apelin (Apln, which is co-
expressed with Pomc), angiotensin (Agt), and diazopam-binding
inhibitor (Dbi), suggesting that each of these peptides may
reside in a population of fasting-inhibited cells (Porter and Po-
tratz, 2004; Reaux-Le Goazigo et al., 2011; de Mateos-Verchere
et al., 2001).
Scheduled Feeding Synchronizes RibosomePhosphorylation with Food AvailabilityAlthough fasting can reveal the response to chronic energy
deficit, most human feeding takes place intermittently at regular
times in the day, and the timing of meals is associated with
numerous biochemical and behavioral responses. Similarly,
rodents allowed daily access to food only during a scheduled
window are known to synchronize their metabolism and activity
to the time of food availability (Mistlberger, 2011). This behavioral
adaptation is known as food-anticipatory activity (FAA) and is
associated with the activation of neurons in multiple hypotha-
lamic regions, including prominently the DMH and Arc. Despite
extensive investigation into the mechanism of FAA, the identity
of the activated cell types and their specific roles, in particular
those in the DMH, are largely unknown. Thus, we sought to
identify neurons with a specialized function associated with
scheduled feeding. Unlike fasting, scheduled feeding also allows
for more precise synchronization of behavior, enabling a more
refined analysis of temporal changes in cell activation.
We restricted the access ofmice to food to a 3 hrwindow in the
middle of the light phase, which resulted in the emergence of
robust FAA within 10 days (Movies S1 and S2). We performed
pS6 staining of brain slices from these mice at several time
points to establish the dynamics of ribosome phosphorylation
in the hypothalamus. We found that scheduled feeding induced
intense pS6 staining in the DMH and Arc (Figure 6A) that peaked
within the meal window and declined to baseline thereafter (Fig-
ures 6B and 6C). This DMH staining was enriched in the compact
part of the DMH, a region that does not show a change in ribo-
some phosphorylation after a single overnight fast (Figure 5A).
1132 Cell 151, 1126–1137, November 21, 2012 ª2012 Elsevier Inc.
Once the mice were entrained, this pattern of S6 phosphoryla-
tion no longer depended on the presence of food because brain
sections from mice that were acclimated to scheduled feeding
but that were not fed on the day of the experiment showed
a similar pattern of pS6 (although with lower intensity in the
DMH; Figures 6B and 6C). This suggests the existence of
unidentified neural populations that are regulated in part by
a circadian signal entrained by food availability.
Scheduled FeedingActivates AgRPNeurons and InhibitsMCH NeuronsTo identify neurons activated during scheduled feeding, we
immunoprecipitated phosphorylated ribosomes from the hypo-
thalamus of animals sacrificed 2 hr after food presentation
and analyzed the enriched mRNAs. To provide a comparison
data set, we also performed ribosome profiling from mice that
received an injection of the hormone ghrelin. Levels of plasma
ghrelin increase prior to meals, and this increase has been
hypothesized to promote scheduled feeding (LeSauter et al.,
2009; Mistlberger, 2011; Verhagen et al., 2011). We found that
ghrelin induced strong pS6 in the Arc but had little effect on
pS6 in the DMH (Figure 6A). Thus, we compared these two
profiles in order to segregate enriched cell-type markers accord-
ing to their potential anatomic location (i.e., DMH versus Arc) and
function.
Ghrelin and scheduled feeding both induced strong enrich-
ment of Agrp (24- and 8.9-fold), Npy (22- and 7.8-fold), and
Ghsr (6.1- and 6.9-fold), and we confirmed extensive colocaliza-
tion between pS6 and AgRP/NPY neurons of the Arc under both
conditions (Figure 6E). The activation of AgRP/NPY neurons is
consistent with the voracious eating displayed by animals accli-
mated to scheduled feeding following food presentation (Movie
S3) and suggests that ghrelin and scheduled feeding activate
a common set of neural targets in the Arc.
In contrast to the enrichment of Agrp and Npy transcripts, we
noticed that Pmchwas consistently depleted from pS6 immuno-
precipitates after scheduled feeding (Figure 6D). We performed
double immunostaining for pS6 and MCH in brain slices from
these animals, which revealed a selective decrease in pS6 local-
ized to MCH neurons from mice subjected to scheduled feeding
relative to ad libitum controls (Figure S5). This decrease in
ribosome phosphorylation was specific to MCH neurons, as
neighboring pS6-positive cells were observed in the lateral hypo-
thalamus in the same sections. Thus, MCH neurons appear to be
selectively inhibited during scheduled feeding. Interestingly, we
also observed depletion of transcripts for a second neuropep-
tide, Nphx4, which is expressed in the lateral hypothalamus in
a pattern that resembles Pmch (Figure 6D). As deletion of both
Pmch and its receptor (Mch1r) has been reported to induce
hyperactivity activity in mice (Zhou et al., 2005), inhibition of
these neurons may be related to the locomotor phenotype
observed during scheduled feeding.
Molecular Identification of Activated Neurons inthe DMHWe focused our attention on identifying activated neurons in the
DMH because our understanding of the function and identity of
the cell types in this region that regulate feeding is limited. We
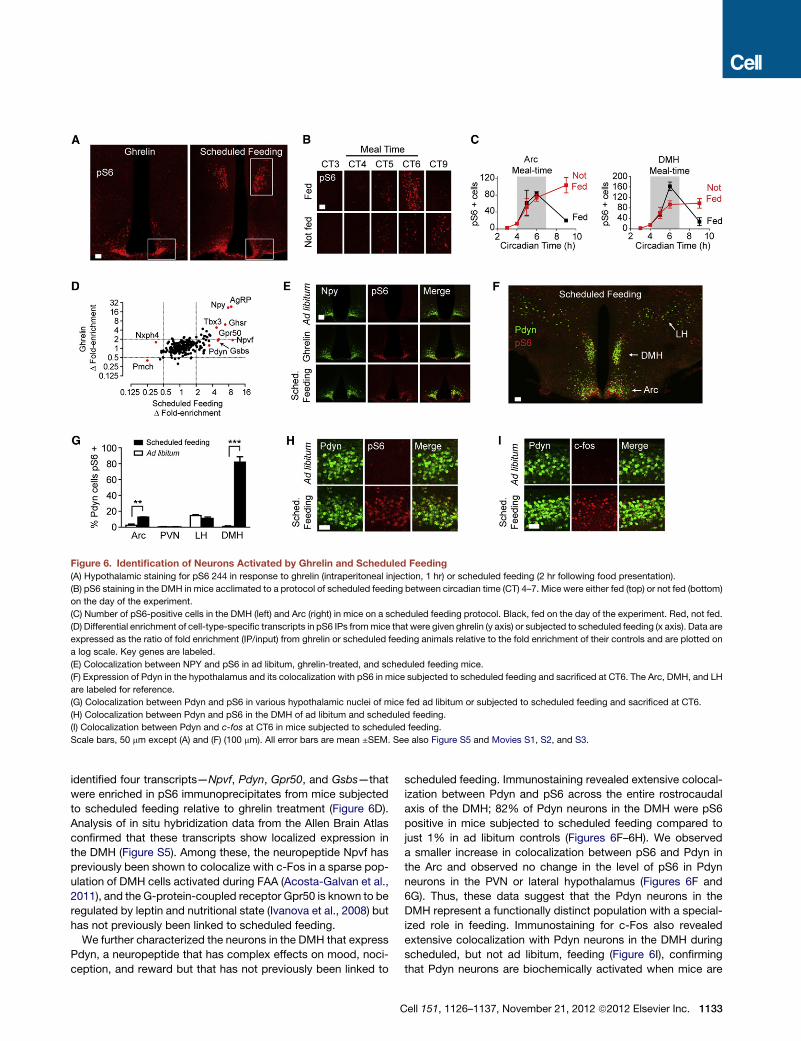
Figure 6. Identification of Neurons Activated by Ghrelin and Scheduled Feeding
(A) Hypothalamic staining for pS6 244 in response to ghrelin (intraperitoneal injection, 1 hr) or scheduled feeding (2 hr following food presentation).
(B) pS6 staining in the DMH in mice acclimated to a protocol of scheduled feeding between circadian time (CT) 4–7. Mice were either fed (top) or not fed (bottom)
on the day of the experiment.
(C) Number of pS6-positive cells in the DMH (left) and Arc (right) in mice on a scheduled feeding protocol. Black, fed on the day of the experiment. Red, not fed.
(D) Differential enrichment of cell-type-specific transcripts in pS6 IPs frommice that were given ghrelin (y axis) or subjected to scheduled feeding (x axis). Data are
expressed as the ratio of fold enrichment (IP/input) from ghrelin or scheduled feeding animals relative to the fold enrichment of their controls and are plotted on
a log scale. Key genes are labeled.
(E) Colocalization between NPY and pS6 in ad libitum, ghrelin-treated, and scheduled feeding mice.
(F) Expression of Pdyn in the hypothalamus and its colocalization with pS6 in mice subjected to scheduled feeding and sacrificed at CT6. The Arc, DMH, and LH
are labeled for reference.
(G) Colocalization between Pdyn and pS6 in various hypothalamic nuclei of mice fed ad libitum or subjected to scheduled feeding and sacrificed at CT6.
(H) Colocalization between Pdyn and pS6 in the DMH of ad libitum and scheduled feeding.
(I) Colocalization between Pdyn and c-fos at CT6 in mice subjected to scheduled feeding.
Scale bars, 50 mm except (A) and (F) (100 mm). All error bars are mean ±SEM. See also Figure S5 and Movies S1, S2, and S3.
identified four transcripts—Npvf, Pdyn, Gpr50, and Gsbs—that
were enriched in pS6 immunoprecipitates from mice subjected
to scheduled feeding relative to ghrelin treatment (Figure 6D).
Analysis of in situ hybridization data from the Allen Brain Atlas
confirmed that these transcripts show localized expression in
the DMH (Figure S5). Among these, the neuropeptide Npvf has
previously been shown to colocalize with c-Fos in a sparse pop-
ulation of DMH cells activated during FAA (Acosta-Galvan et al.,
2011), and the G-protein-coupled receptor Gpr50 is known to be
regulated by leptin and nutritional state (Ivanova et al., 2008) but
has not previously been linked to scheduled feeding.
We further characterized the neurons in the DMH that express
Pdyn, a neuropeptide that has complex effects on mood, noci-
ception, and reward but that has not previously been linked to
C
scheduled feeding. Immunostaining revealed extensive colocal-
ization between Pdyn and pS6 across the entire rostrocaudal
axis of the DMH; 82% of Pdyn neurons in the DMH were pS6
positive in mice subjected to scheduled feeding compared to
just 1% in ad libitum controls (Figures 6F–6H). We observed
a smaller increase in colocalization between pS6 and Pdyn in
the Arc and observed no change in the level of pS6 in Pdyn
neurons in the PVN or lateral hypothalamus (Figures 6F and
6G). Thus, these data suggest that the Pdyn neurons in the
DMH represent a functionally distinct population with a special-
ized role in feeding. Immunostaining for c-Fos also revealed
extensive colocalization with Pdyn neurons in the DMH during
scheduled, but not ad libitum, feeding (Figure 6I), confirming
that Pdyn neurons are biochemically activated when mice are
ell 151, 1126–1137, November 21, 2012 ª2012 Elsevier Inc. 1133
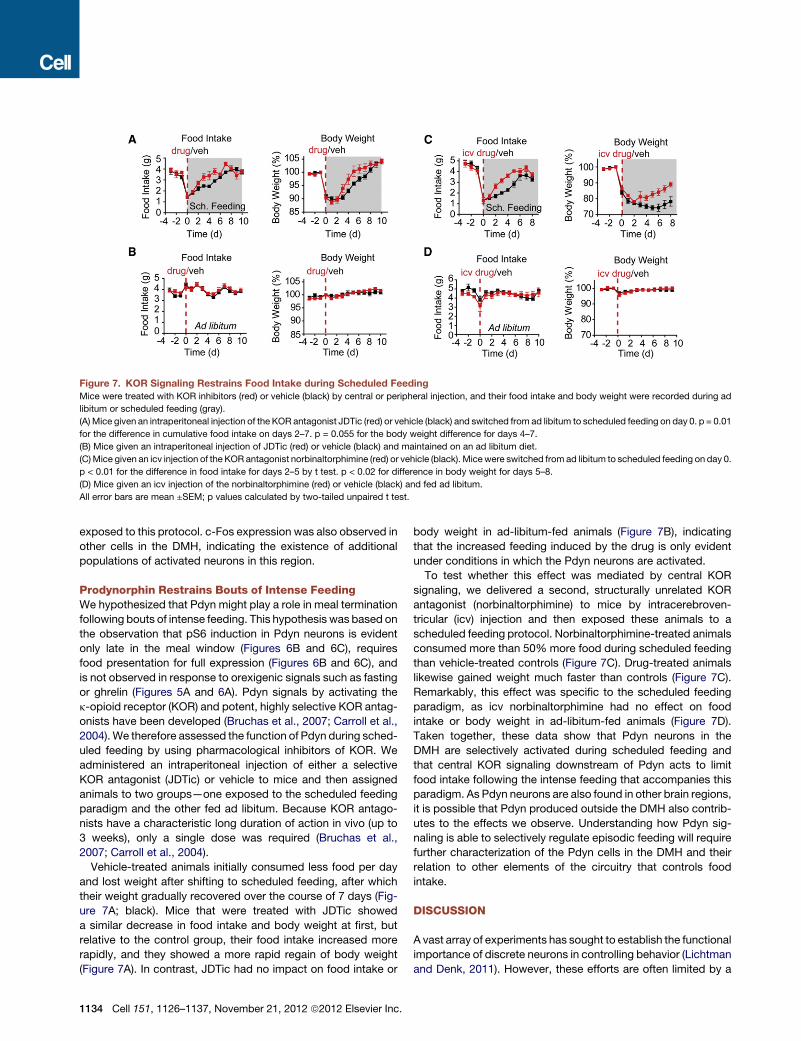
Figure 7. KOR Signaling Restrains Food Intake during Scheduled Feeding
Mice were treated with KOR inhibitors (red) or vehicle (black) by central or peripheral injection, and their food intake and body weight were recorded during ad
libitum or scheduled feeding (gray).
(A) Mice given an intraperitoneal injection of the KOR antagonist JDTic (red) or vehicle (black) and switched from ad libitum to scheduled feeding on day 0. p = 0.01
for the difference in cumulative food intake on days 2–7. p = 0.055 for the body weight difference for days 4–7.
(B) Mice given an intraperitoneal injection of JDTic (red) or vehicle (black) and maintained on an ad libitum diet.
(C)Mice given an icv injection of the KOR antagonist norbinaltorphimine (red) or vehicle (black). Micewere switched from ad libitum to scheduled feeding on day 0.
p < 0.01 for the difference in food intake for days 2–5 by t test. p < 0.02 for difference in body weight for days 5–8.
(D) Mice given an icv injection of the norbinaltorphimine (red) or vehicle (black) and fed ad libitum.
All error bars are mean ±SEM; p values calculated by two-tailed unpaired t test.
exposed to this protocol. c-Fos expression was also observed in
other cells in the DMH, indicating the existence of additional
populations of activated neurons in this region.
Prodynorphin Restrains Bouts of Intense FeedingWe hypothesized that Pdyn might play a role in meal termination
following bouts of intense feeding. This hypothesis was based on
the observation that pS6 induction in Pdyn neurons is evident
only late in the meal window (Figures 6B and 6C), requires
food presentation for full expression (Figures 6B and 6C), and
is not observed in response to orexigenic signals such as fasting
or ghrelin (Figures 5A and 6A). Pdyn signals by activating the
k-opioid receptor (KOR) and potent, highly selective KOR antag-
onists have been developed (Bruchas et al., 2007; Carroll et al.,
2004).We therefore assessed the function of Pdyn during sched-
uled feeding by using pharmacological inhibitors of KOR. We
administered an intraperitoneal injection of either a selective
KOR antagonist (JDTic) or vehicle to mice and then assigned
animals to two groups—one exposed to the scheduled feeding
paradigm and the other fed ad libitum. Because KOR antago-
nists have a characteristic long duration of action in vivo (up to
3 weeks), only a single dose was required (Bruchas et al.,
2007; Carroll et al., 2004).
Vehicle-treated animals initially consumed less food per day
and lost weight after shifting to scheduled feeding, after which
their weight gradually recovered over the course of 7 days (Fig-
ure 7A; black). Mice that were treated with JDTic showed
a similar decrease in food intake and body weight at first, but
relative to the control group, their food intake increased more
rapidly, and they showed a more rapid regain of body weight
(Figure 7A). In contrast, JDTic had no impact on food intake or
1134 Cell 151, 1126–1137, November 21, 2012 ª2012 Elsevier Inc.
body weight in ad-libitum-fed animals (Figure 7B), indicating
that the increased feeding induced by the drug is only evident
under conditions in which the Pdyn neurons are activated.
To test whether this effect was mediated by central KOR
signaling, we delivered a second, structurally unrelated KOR
antagonist (norbinaltorphimine) to mice by intracerebroven-
tricular (icv) injection and then exposed these animals to a
scheduled feeding protocol. Norbinaltorphimine-treated animals
consumed more than 50% more food during scheduled feeding
than vehicle-treated controls (Figure 7C). Drug-treated animals
likewise gained weight much faster than controls (Figure 7C).
Remarkably, this effect was specific to the scheduled feeding
paradigm, as icv norbinaltorphimine had no effect on food
intake or body weight in ad-libitum-fed animals (Figure 7D).
Taken together, these data show that Pdyn neurons in the
DMH are selectively activated during scheduled feeding and
that central KOR signaling downstream of Pdyn acts to limit
food intake following the intense feeding that accompanies this
paradigm. As Pdyn neurons are also found in other brain regions,
it is possible that Pdyn produced outside the DMH also contrib-
utes to the effects we observe. Understanding how Pdyn sig-
naling is able to selectively regulate episodic feeding will require
further characterization of the Pdyn cells in the DMH and their
relation to other elements of the circuitry that controls food
intake.
DISCUSSION
A vast array of experiments has sought to establish the functional
importance of discrete neurons in controlling behavior (Lichtman
and Denk, 2011). However, these efforts are often limited by a
lack of molecular information about the relevant cell types.
In 2001, Francis Crick and Christof Koch predicted that the
development of techniques ‘‘based on the molecular identifica-
tion and manipulation of discrete and identifiable subpopula-
tions’’ of neurons would enable the elucidation of the functional
anatomy of the CNS (Koch and Crick, 2001). With the develop-
ment of optogenetics and related methods, the means for
manipulating cells are now available. In contrast, there has
been less progress toward the development of approaches for
the molecular identification of functional populations of neurons,
and for many neural functions, the molecular identity of the rele-
vant cell types remains unknown (Lin et al., 2011;Wu et al., 2012;
Zhang et al., 2007). This problem of linking cell types to function
has persisted despite increasingly sophisticated analyses of the
molecular heterogeneity of the brain as a whole (Gong et al.,
2003; Lein et al., 2007).
We report here a conceptually distinct way to map the
functional organization of gene expression in the brain. This
approach takes advantage of the fact that marker genes can
be used to identify specific cell types within an anatomic region
such as the hypothalamus (Siegert et al., 2009). We have shown
that it is possible to capture RNA from cells in proportion to
their activity, quantify the enrichment of these cell-type-specific
marker genes, and then use this information to assay in parallel
the functional state of a large number of intermingled cell types.
A key advantage of this approach is that it enables the use of
powerful tools of molecular biology, such as qPCR or RNA
sequencing, to make a measurement of cellular activity that
would otherwise require analysis of large numbers of samples
by histology. As a result, it is possible to identify in an unbiased
way the specific genes that are most uniquely expressed in a
coregulated population of neurons in the brain. Once iden-
tified, such genes can serve as markers that enable the func-
tional interrogation of those cells by using optogenetics or other
approaches.
In this paper, we demonstrated that phosphorylation of
ribosomal protein S6 can be used as a tag to enable the capture
of mRNA from activated cells. This is possible because the
same signaling pathways that trigger S6 phosphorylation are
themselves often correlated with neural activity (Flavell and
Greenberg, 2008; Meyuhas, 2008; Valjent et al., 2011). As the
phosphorylation sites on S6 are evolutionarily conserved (Meyu-
has, 2008), this approach, in principle, can be used to study
a range of species, including those that are not amenable to
genetic modification. Moreover, as S6 phosphorylation is con-
trolled by extracellular stimuli in all cells (Meyuhas, 2008), this
strategy could also reveal the regulation of nonneuronal cell
types that reside in other complex tissues besides the brain,
such as the immune system, lung, intestine, kidney, and others.
We have validated the fidelity of this approach by identifying
many neurons known to be activated or inhibited in response
to well-characterized stimuli such as salt challenge and fasting.
In addition to recapitulating the known components of these
systems, we have also identified markers for activated neurons
that have been overlooked, such as Gal neurons during fasting
and Pdyn neurons during scheduled feeding. As many func-
tional populations of neurons have been visualized by c-Fos
staining, but not molecularly characterized (Dielenberg et al.,
C
2001; Lin et al., 2011; Wu et al., 2012), phosphorylated ribo-
some profiling provides a general way to identify these cells.
Once marker genes for these cell types have been identified,
techniques such as BacTRAP or Ribotag can be used to
genetically deliver tagged ribosomes to these cells, enabling
deep profiling of their transcriptomes (Heiman et al., 2008;
Sanz et al., 2009).
Although our data suggest that this approach will find broad
application in neuroscience, it is important to emphasize that
pS6, like other surrogates for neural activity such as c-Fos,
measures only one dimension of ‘‘neural activation’’ and there-
fore will not retrieve markers for all neurons that are activated
in all contexts. c-Fos and pS6 are induced by the biochemical
activation of neurons, and therefore, these markers may be
most responsive to stimuli that modulate neurons such as neuro-
peptides and biogenic amines. Although we have shown that
many stimuli that activate neurons induce pS6, it is not fully
understood to what extent the induction of pS6 is correlated
with changes in firing rate itself.
Different stimuli induce pS6 with varying efficiency, and for
this reason, it is important to optimize the stimulus protocol to
maximize the fold enrichment of the relevant neural markers
(see Extended Experimental Procedures for further discussion).
For the stimuli we have explored, we find that pS6 is induced
with kinetics that range from tens of minutes to 2 hr. This is
comparable to the expression of many immediate early genes
but is somewhat slower than c-fos transcription, which is often
complete within 20 min of stimulation. In addition, we have
focused in these experiments primarily on the hypothalamus,
but brain regions that have a high level of pS6 at baseline may
be less amenable to this approach.
Several large-scale efforts are currently underway to map
the functional organization of the mammalian brain (Alivisatos
et al., 2012; Gong et al., 2003; Koch and Reid, 2012). These
projects are being supported by efforts to develop new imaging
technologies that can probe the complex anatomy of this tissue
(Lichtman and Denk, 2011). The approach we describe here
represents a complementary way to link structure to function
in the nervous system. Unlike current efforts, our approach
suggests a way, in principle, to simultaneously measure the
activity of every cell type within a region of the brain, a goal
that is not addressed by any existing technology. Although
we have focused here on the use of ribosome phosphorylation
to identify activated neurons, it should also be possible to
capture RNA in response to other signals that reflect the func-
tional state of a cell. For example, many proteins dynamically
associate with polysomes in response to extracellular stimuli,
and these proteins could also function as ribosome tags that
enable enrichment of RNA from cells that received a specific
signal. Alternatively, it might be possible to engineer ribosomes
that are modified in response to the expression of immediate
early genes, such as c-fos, or to use mass spectrometry to iden-
tify posttranslational modifications of the ribosome that correlate
with specific stimuli. The combination of such approaches may
eventually enable the use of RNA sequencing to measure the
functional state of a complex tissue, such as the brain, along
multiple dimensions and at the resolution of molecularly defined
cell types.
ell 151, 1126–1137, November 21, 2012 ª2012 Elsevier Inc. 1135
EXPERIMENTAL PROCEDURES
Animal Treatment
Animal experiments were approved by the Rockefeller University IACUC. Male
C57Bl/6J mice were maintained on a 12 hr light-dark schedule and were 9–
13 weeks old at the time of sacrifice. All animals were sacrificed between
CT4 and CT6 except as noted. For osmotic stimulation experiments, animals
were given an intraperitoneal injection of 2MNaCl (350 ml), water was removed
from the cage, andmicewere sacrificed 120min later. For ghrelin experiments,
animals were given an intraperitoneal injection of ghrelin (66 mg), food was
removed from the cage, and mice were sacrificed 70 min later. For scheduled
feeding, mice were allowed access to food between CT4 and CT7 each day for
a minimum of 10 days, fed on the day of the experiment, and then sacrificed at
CT6. For fasting experiments, animals were transferred to a new cage without
food at CT7 and then sacrificed at CT23 the followingmorning. Control mice for
fasting experiments were fed ad libitum and sacrificed at the same time. For
drug treatments, mice were given an intraperitoneal injection of the following
dose and then sacrificed at the indicated time: cocaine (30 mg/kg, 60 min),
kainate (12.5 mg/kg, 120 min), olanzapine (20 mg/kg, 120 min), clozapine
(10 mg/kg, 45 min). For cat odor experiments, a domestic cat was fitted with a
fabric collar (SafeCat) for 3weeks; the collar was removed,micewere exposed
to the collar for 60min, and then they were sacrificed by perfusion. For the resi-
dent-intruder test, a male mouse was single caged for at least 2 weeks,
a foreign male was introduced into the cage, the animals were monitored for
attacks, and the resident was perfused after 60 min. For dehydration experi-
ments, water was removed from the cage, and mice were perfused 24 hr later.
Ribosome Immunoprecipitations
Mice were sacrificed by cervical dislocation. Hypothalami were rapidly
dissected on ice, pooled (10–20 per experiment), homogenized, and clarified
by centrifugation. Ribosomes were immunoprecipitated by using polyclonal
antibodies against pS6 240/244 combined with a pS6 240-containing peptide.
RNA from the tissue as a whole (input) and the immunoprecipitate were then
purified and analyzed. Detailed procedures are described in Extended Exper-
imental Procedures.
Immunohistochemistry
Free-floating sections were stained, mounted, and then imaged by using
a Zeiss LSM 810 confocal microscope. Image analysis and quantification
were performed by using Imaris software. Additional details are described in
Extended Experimental Procedures.
Treatment with KOR Antagonists during Scheduled Feeding
JDTic was delivered by intraperitoneal injection (10 mg/kg). Norbinaltorphi-
mine (5 ml of a 1 mg/ml solution) was delivered via Hamilton syringe into the
lateral ventricle by using the coordinates L/M 1.0 mm from Bregma, A/P
�0.4 mm from Bregma, and 2.5 mm beneath the cortex.
Taqman Array Analysis
Primers and internally quenched probes were synthesized to detect 225 genes
thatmark discrete populations of hypothalamic neurons. Complementary DNA
(cDNA) was prepared by using the QuantiTect Reverse Transcription Kit, and
the abundance of these genes in the pS6 IP and input RNA was quantified by
using Taqman Gene Expression Master Mix. Transcript abundance was
normalized to rpL27. Differential fold enrichment values were calculated by
dividing the average fold enrichment in the stimulus samples by the average
fold enrichment in the controls. The log-transformed fold enrichment values
for each gene were analyzed by calculating a p value (unpaired two-tailed
t test) and a q value to estimate the false discovery rate at different thresholds
of significance. See also Tables S1 and S2.
Microarray and RNA-Seq Analysis
For microarray analysis, amplified cDNA was prepared by using the
Ovation RNA Amplification System V2 and was hybridized to MouseRef-8 v2
BeadChips (Illumina). For RNA sequencing (RNA-seq) analysis, cDNA was
prepared by using the SMARTer Ultralow Input RNA for Illumina Sequencing
Kit and then sequenced by using an Illumina HiSeq 2000. See also Table S3.
1136 Cell 151, 1126–1137, November 21, 2012 ª2012 Elsevier Inc.
ACCESSION NUMBERS
The GEO accession number for the microarray and RNA-seq data reported in
this paper is GSE40995.
SUPPLEMENTAL INFORMATION
Supplemental Information includes Extended Experimental Procedures, five
figures, three tables, and three movies and can be found with this article online
at http://dx.doi.org/10.1016/j.cell.2012.10.039.
ACKNOWLEDGMENTS
This project was supported by funding from the JPB Foundation (J.M.F.) and
NIH grant DK083531 (Z.A.K.). The authors have filed a patent related to this
work. Dr. Friedman is a Founder of Envoy Therapeutics and holds equity in it
and receives a retainer from the company. Envoy holds an option to license
this technology from the Rockefeller University.
Received: June 1, 2012
Revised: August 20, 2012
Accepted: October 4, 2012
Published: November 20, 2012
REFERENCES
Acosta-Galvan, G., Yi, C.X., van der Vliet, J., Jhamandas, J.H., Panula, P., An-
geles-Castellanos, M., Del Carmen Basualdo, M., Escobar, C., and Buijs, R.M.
(2011). Interaction between hypothalamic dorsomedial nucleus and the supra-
chiasmatic nucleus determines intensity of food anticipatory behavior. Proc.
Natl. Acad. Sci. USA 108, 5813–5818.
Alivisatos, A.P., Chun, M., Church, G.M., Greenspan, R.J., Roukes, M.L., and
Yuste, R. (2012). The brain activity map project and the challenge of functional
connectomics. Neuron 74, 970–974.
Brown, M.R., Mortrud, M., Crum, R., and Sawchenko, P. (1988). Role of
somatostatin in the regulation of vasopressin secretion. Brain Res. 452,
212–218.
Bruchas, M.R., Yang, T., Schreiber, S., Defino, M., Kwan, S.C., Li, S., and
Chavkin, C. (2007). Long-acting kappa opioid antagonists disrupt receptor
signaling and produce noncompetitive effects by activating c-Jun N-terminal
kinase. J. Biol. Chem. 282, 29803–29811.
Cao, R., Lee, B., Cho, H.Y., Saklayen, S., and Obrietan, K. (2008). Photic regu-
lation of the mTOR signaling pathway in the suprachiasmatic circadian clock.
Mol. Cell. Neurosci. 38, 312–324.
Carroll, I., Thomas, J.B., Dykstra, L.A., Granger, A.L., Allen, R.M., Howard, J.L.,
Pollard, G.T., Aceto, M.D., and Harris, L.S. (2004). Pharmacological properties
of JDTic: a novel kappa-opioid receptor antagonist. Eur. J. Pharmacol. 501,
111–119.
Cowley, M.A., Smart, J.L., Rubinstein, M., Cerdan, M.G., Diano, S., Horvath,
T.L., Cone, R.D., and Low, M.J. (2001). Leptin activates anorexigenic POMC
neurons through a neural network in the arcuate nucleus. Nature 411, 480–484.
Croizier, S., Franchi-Bernard, G., Colard, C., Poncet, F., La Roche, A., and Ri-
sold, P.Y. (2010). A comparative analysis shows morphofunctional differences
between the rat and mouse melanin-concentrating hormone systems. PLoS
ONE 5, e15471.
de Mateos-Verchere, J.G., Leprince, J., Tonon, M.C., Vaudry, H., and Costen-
tin, J. (2001). The octadecaneuropeptide [diazepam-binding inhibitor (33-50)]
exerts potent anorexigenic effects in rodents. Eur. J. Pharmacol. 414,
225–231.
Dielenberg, R.A., Hunt, G.E., and McGregor, I.S. (2001). ‘‘When a rat smells
a cat’’: the distribution of Fos immunoreactivity in rat brain following exposure
to a predatory odor. Neuroscience 104, 1085–1097.
Elmquist, J.K., Coppari, R., Balthasar, N., Ichinose, M., and Lowell, B.B.
(2005). Identifying hypothalamic pathways controlling food intake, body
weight, and glucose homeostasis. J. Comp. Neurol. 493, 63–71.
Flavell, S.W., and Greenberg, M.E. (2008). Signaling mechanisms linking
neuronal activity to gene expression and plasticity of the nervous system.
Annu. Rev. Neurosci. 31, 563–590.
Gai, W.P., Geffen, L.B., and Blessing, W.W. (1990). Galanin immunoreactive
neurons in the human hypothalamus: colocalization with vasopressin-contain-
ing neurons. J. Comp. Neurol. 298, 265–280.
Gong, S., Zheng, C., Doughty,M.L., Losos, K., Didkovsky, N., Schambra, U.B.,
Nowak, N.J., Joyner, A., Leblanc, G., Hatten, M.E., and Heintz, N. (2003). A
gene expression atlas of the central nervous system based on bacterial artifi-
cial chromosomes. Nature 425, 917–925.
Hahm, S., Fekete, C.,Mizuno, T.M.,Windsor, J., Yan, H., Boozer, C.N., Lee, C.,
Elmquist, J.K., Lechan, R.M., Mobbs, C.V., et al. (2002). VGF is required for
obesity induced by diet, gold thioglucose treatment, and agouti and is differ-
entially regulated in pro-opiomelanocortin- and neuropeptide Y-containing
arcuate neurons in response to fasting. J. Neurosci. 22, 6929–6938.
Heiman, M., Schaefer, A., Gong, S., Peterson, J.D., Day, M., Ramsey, K.E.,
Suarez-Farinas, M., Schwarz, C., Stephan, D.A., Surmeier, D.J., et al. (2008).
A translational profiling approach for the molecular characterization of CNS
cell types. Cell 135, 738–748.
Isogai, Y., Si, S., Pont-Lezica, L., Tan, T., Kapoor, V., Murthy, V.N., and Dulac,
C. (2011). Molecular organization of vomeronasal chemoreception. Nature
478, 241–245.
Ivanova, E.A., Bechtold, D.A., Dupre, S.M., Brennand, J., Barrett, P., Luckman,
S.M., and Loudon, A.S. (2008). Altered metabolism in the melatonin-related
receptor (GPR50) knockout mouse. Am. J. Physiol. Endocrinol. Metab. 294,
E176–E182.
Koch, C., and Crick, F. (2001). Neural basis of consciousness. In International
Encyclopedia of the Social & Behavioral Sciences, N.J. Smelser and P.B.
Baltes, eds. (New York: Elsevier), pp. 2600–2604.
Koch, C., and Reid, R.C. (2012). Neuroscience: observatories of the mind.
Nature 483, 397–398.
Koike, K., Sakamoto, Y., Kiyama, H., Masuhara, K., Miyake, A., and Inoue, M.
(1997). Cytokine-induced neutrophil chemoattractant gene expression in the
rat hypothalamus by osmotic stimulation. Brain Res. Mol. Brain Res. 52,
326–329.
Lein, E.S., Hawrylycz, M.J., Ao, N., Ayres, M., Bensinger, A., Bernard, A., Boe,
A.F., Boguski, M.S., Brockway, K.S., Byrnes, E.J., et al. (2007). Genome-wide
atlas of gene expression in the adult mouse brain. Nature 445, 168–176.
LeSauter, J., Hoque, N., Weintraub, M., Pfaff, D.W., and Silver, R. (2009).
Stomach ghrelin-secreting cells as food-entrainable circadian clocks. Proc.
Natl. Acad. Sci. USA 106, 13582–13587.
Lichtman, J.W., and Denk, W. (2011). The big and the small: challenges of
imaging the brain’s circuits. Science 334, 618–623.
Lin, D., Boyle, M.P., Dollar, P., Lee, H., Lein, E.S., Perona, P., and Anderson,
D.J. (2011). Functional identification of an aggression locus in themouse hypo-
thalamus. Nature 470, 221–226.
Masland, R.H. (2004). Neuronal cell types. Curr. Biol. 14, R497–R500.
Meikle, L., Talos, D.M., Onda, H., Pollizzi, K., Rotenberg, A., Sahin, M., Jensen,
F.E., and Kwiatkowski, D.J. (2007). A mouse model of tuberous sclerosis:
neuronal loss of Tsc1 causes dysplastic and ectopic neurons, reduced myeli-
nation, seizure activity, and limited survival. J. Neurosci. 27, 5546–5558.
Meyuhas, O. (2008). Physiological roles of ribosomal protein S6: one of its kind.
Int. Rev. Cell Mol. Biol. 268, 1–37.
Mistlberger, R.E. (2011). Neurobiology of food anticipatory circadian rhythms.
Physiol. Behav. 104, 535–545.
Morgan, J.I., and Curran, T. (1991). Stimulus-transcription coupling in the
nervous system: involvement of the inducible proto-oncogenes fos and jun.
Annu. Rev. Neurosci. 14, 421–451.
Nelson, S.B., Sugino, K., and Hempel, C.M. (2006). The problem of neuronal
cell types: a physiological genomics approach. Trends Neurosci. 29, 339–345.
Parker, J.A., and Bloom, S.R. (2012). Hypothalamic neuropeptides and the
regulation of appetite. Neuropharmacology 63, 18–30.
C
Porter, J.P., and Potratz, K.R. (2004). Effect of intracerebroventricular angio-
tensin II on body weight and food intake in adult rats. Am. J. Physiol. Regul.
Integr. Comp. Physiol. 287, R422–R428.
Reaux-Le Goazigo, A., Bodineau, L., De Mota, N., Jeandel, L., Chartrel, N.,
Knauf, C., Raad, C., Valet, P., and Llorens-Cortes, C. (2011). Apelin and the
proopiomelanocortin system: a new regulatory pathway of hypothalamic
a-MSH release. Am. J. Physiol. Endocrinol. Metab. 301, E955–E966.
Ruvinsky, I., Sharon, N., Lerer, T., Cohen, H., Stolovich-Rain, M., Nir, T., Dor,
Y., Zisman, P., andMeyuhas, O. (2005). Ribosomal protein S6 phosphorylation
is a determinant of cell size and glucose homeostasis. Genes Dev. 19, 2199–
2211.
Sanz, E., Yang, L., Su, T., Morris, D.R., McKnight, G.S., and Amieux, P.S.
(2009). Cell-type-specific isolation of ribosome-associated mRNA from com-
plex tissues. Proc. Natl. Acad. Sci. USA 106, 13939–13944.
Schwartz, M.W., Sipols, A.J., Grubin, C.E., andBaskin, D.G. (1993). Differential
effect of fasting on hypothalamic expression of genes encoding neuropeptide
Y, galanin, and glutamic acid decarboxylase. Brain Res. Bull. 31, 361–367.
Sherman, T.G., Civelli, O., Douglass, J., Herbert, E., and Watson, S.J. (1986).
Coordinate expression of hypothalamic pro-dynorphin and pro-vasopressin
mRNAs with osmotic stimulation. Neuroendocrinology 44, 222–228.
Siegert, S., Scherf, B.G., Del Punta, K., Didkovsky, N., Heintz, N., and Roska,
B. (2009). Genetic address book for retinal cell types. Nat. Neurosci. 12, 1197–
1204.
Stevens, C.F. (1998). Neuronal diversity: toomany cell types for comfort? Curr.
Biol. 8, R708–R710.
Sunn, N., Egli, M., Burazin, T.C., Burns, P., Colvill, L., Davern, P., Denton, D.A.,
Oldfield, B.J., Weisinger, R.S., Rauch, M., et al. (2002). Circulating relaxin acts
on subfornical organ neurons to stimulate water drinking in the rat. Proc. Natl.
Acad. Sci. USA 99, 1701–1706.
Thornton, S.M., and Fitzsimons, J.T. (1995). The effects of centrally adminis-
tered porcine relaxin on drinking behaviour in male and female rats. J. Neuro-
endocrinol. 7, 165–169.
Valjent, E., Bertran-Gonzalez, J., Bowling, H., Lopez, S., Santini, E., Mata-
males, M., Bonito-Oliva, A., Herve, D., Hoeffer, C., Klann, E., et al. (2011). Halo-
peridol regulates the state of phosphorylation of ribosomal protein S6 via
activation of PKA and phosphorylation of DARPP-32. Neuropsychopharma-
cology 36, 2561–2570.
Verhagen, L.A., Egecioglu, E., Luijendijk, M.C., Hillebrand, J.J., Adan, R.A.,
and Dickson, S.L. (2011). Acute and chronic suppression of the central ghrelin
signaling system reveals a role in food anticipatory activity. Eur. Neuropsycho-
pharmacol. 21, 384–392.
Villanueva, E.C., Munzberg, H., Cota, D., Leshan, R.L., Kopp, K., Ishida-Taka-
hashi, R., Jones, J.C., Fingar, D.C., Seeley, R.J., and Myers, M.G., Jr. (2009).
Complex regulation of mammalian target of rapamycin complex 1 in the baso-
medial hypothalamus by leptin and nutritional status. Endocrinology 150,
4541–4551.
Willesen, M.G., Kristensen, P., and Rømer, J. (1999). Co-localization of growth
hormone secretagogue receptor and NPY mRNA in the arcuate nucleus of the
rat. Neuroendocrinology 70, 306–316.
Wu, Q., Clark, M.S., and Palmiter, R.D. (2012). Deciphering a neuronal circuit
that mediates appetite. Nature 483, 594–597.
Yizhar, O., Fenno, L.E., Davidson, T.J., Mogri, M., and Deisseroth, K. (2011).
Optogenetics in neural systems. Neuron 71, 9–34.
Zeng, L.H., Rensing, N.R., and Wong, M. (2009). The mammalian target of ra-
pamycin signaling pathway mediates epileptogenesis in a model of temporal
lobe epilepsy. J. Neurosci. 29, 6964–6972.
Zhang, F., Aravanis, A.M., Adamantidis, A., de Lecea, L., and Deisseroth, K.
(2007). Circuit-breakers: optical technologies for probing neural signals and
systems. Nat. Rev. Neurosci. 8, 577–581.
Zhou, D., Shen, Z., Strack, A.M., Marsh, D.J., and Shearman, L.P. (2005).
Enhanced running wheel activity of both Mch1r- and Pmch-deficient mice.
Regul. Pept. 124, 53–63.
ell 151, 1126–1137, November 21, 2012 ª2012 Elsevier Inc. 1137