Characterization of biomimetic calcium phosphate on phosphorylated chitosan films
Upload
johnshopkinsCategory
view
0download
0
Partial high-resolution structure of phosphorylated and non-phosphorylated leucine-rich amelogenin protein adsorbed tohydroxyapatite
David L. Masica†, Jeffrey J. Gray†,¥,*, and Wendy J. Shaw‡,*
†Program in Molecular Biophysics The Johns Hopkins University, Baltimore MD¥Dept. of Chemical and Biomolecular Engineering The Johns Hopkins University, Baltimore MD‡Pacific Northwest National Laboratory Richland, WA
AbstractThe formation of biogenic materials requires the interaction of organic molecules with the mineralphase. In forming enamel, the amelogenin proteins contribute to the mineralization ofhydroxyapatite (HAp). Leucine-rich amelogenin protein (LRAP) is a naturally occurring splicevariant of amelogenin that comprises amelogenin's predicted HAp binding domains. Wedetermined the partial structure of phosphorylated and non-phosphorylated LRAP variants boundto HAp using combined solid-state NMR (ssNMR) and ssNMR-biased computational structureprediction. New ssNMR measurements in the N-terminus indicate a largely extended structure forboth variants, though some measurements are consistent with a partially helical N-terminalsegment. The N-terminus of the phosphorylated variant is found to be consistently closer to theHAp surface than the non-phosphorylated variant. Structure prediction was biased using 21ssNMR measurements in the N- and C-terminus at five HAp crystal faces. The predicted fold ofLRAP is similar at all HAp faces studied, regardless of phosphorylation. Largely consistent withexperimental observations, LRAP's predicted structure is relatively extended with a helix-turn-helix motif in the N-terminal domain and some helix in the C-terminal domain, and the N-terminaldomain of the phosphorylated variant binds HAp more closely than the N-terminal domain of thenon-phosphorylated variant. Predictions for both variants show some potential binding specificityfor the {010} HAp crystal face, providing further support that amelogenins block crystal growthon the a and b faces to allow elongated crystals in the c-axis.
KeywordsLRAP; Amelogenin; RosettaSurface; Biomineralization; Solid-state NMR
IntroductionProteins play an important role in the formation of hard tissues and other structural andfunctional materials in vivo.1,2 Some examples include the silica-based optical waveguide ofthe sponge spicule,3 magnetite compasses of magnetotactic bacteria,4 and hydroxyapatite(HAp)-based dental and skeletal tissues in vertebrates.5 Proteins can directly bind to crystalfaces to accelerate6 or inhibit crystal growth,7,8 altering the resulting crystal morphology.9,10
Because the structure of interacting biomolecules influences function and mechanism,determining the structure of mineral-associated proteins is important.
*Correspondence: [email protected]; [email protected].
NIH Public AccessAuthor ManuscriptJ Phys Chem C Nanomater Interfaces. Author manuscript; available in PMC 2012 July 21.
Published in final edited form as:J Phys Chem C Nanomater Interfaces. 2011 July 21; 115(28): 13775–13785. doi:10.1021/jp202965h.
NIH
-PA Author Manuscript
NIH
-PA Author Manuscript
NIH
-PA Author Manuscript

Amelogenin and its proteolytic and genetic variants constitute over 90% of proteinaceousmass in developing tooth enamel.11 Several groups demonstrated the importance ofamelogenin in healthy enamel formation in vivo using genetic knock-out,12 transcriptionregulation,13 and mutagenesis.14 Amelogenin also binds HAp15 and alters HAp crystalgrowth kinetics16,17in vitro. In vivo, in the presence of amelogenin, HAp crystallizes inhighly elongated crystals that are ~3000 times longer than the HAp crystals in bone.18 Theobserved growth along the c-axis suggests a specific interaction with the {100} and {010}faces.
Typically, proteins involved in biomineralization have a high content of charged aminoacids which interact with the charged mineral surface; however, of amelogenin's 180residues, only 13 are charged. Most of amelogenin's charged residues are in the N- and C-terminal domains, suggesting these regions bind to the charged HAp surface. Only one ofthe charged amino acids is phosphorylated, phosphoserine at position 16. Thephosphorylation status of S16 can vary in wild-type amelogenin, making the role ofphosphorylation in contributing to HAp interaction unclear.
Biomineral-associated protein structure cannot be determined by X-ray crystallography orsolution NMR; as a result, the mechanism of protein biomineralization is not wellunderstood. Many experimental methods exist for studying proteins adsorbed to solidsurfaces, but cannot resolve atomic features.19 Using dipolar recoupling techniques such asDRAWS and REDOR, solid-state NMR (ssNMR) is uniquely suited for determining thedistance between a pair of spin-1/2 nuclei at the protein-surface interface, providingmolecular-level structure and orientation detail.20–23 However, the requirement for isolatedspin pairs limits studies to proteins that can be chemically synthesized (~60 amino acids orless), which precludes investigating full-length amelogenin. Leucine-rich amelogeninprotein (LRAP) is a 59-residue naturally occurring splice variant of amelogenin, comprisingamelogenin's N- and C-terminal domains,24 the domains that are thought to bind HAp.Because LRAP contains amelogenin's HAp interaction regions and can be chemicallysynthesized, it provides a tractable model for structural studies of the surface-bound proteinusing ssNMR. Using this technique, we previously determined the partial structure andorientation of LRAP's C-terminal domain adsorbed to HAp.20,23
While ssNMR is a good tool for investigating surface immobilized proteins, high-resolutionssNMR data exists for only two protein-biomineral complexes: LRAP20,21,23 andstatherin.25–31 Typically, a single isolated isotopic pair gives one or two data points, such asone backbone distance measurement and one orientation measurement. This requires thepreparation of many samples to investigate even a small region of any given protein, andlengthy experiment times make thorough structure analysis time consuming and incomplete.
Computational methods have the potential to reduce experiment time. For instance, methodscombining solution NMR and computational structure prediction have drastically reducedthe amount of NMR data required to solve high-resolution protein structures insolution.32–34 In particular, the Rosetta structure prediction method was combined withchemical shift,34 nuclear overhauser effect,35 or residual dipolar coupling NMR data.36,37 Inthese studies, protein structures predicted by Rosetta were at or near atomic-level accuracyrelative to the corresponding crystal structures.
Recently, we developed Rosetta to predict protein structure at the biomineral interface(RosettaSurface)38–42 and added the ability to bias structure prediction using ssNMR(RosettaSurface.NMR).43 As has been seen for solution NMR, RosettaSurface.NMR canenhance the utility and scope of relatively sparse ssNMR data. In a test case, we predictedthe structure of HAp-adsorbed statherin, a 43 amino acid enamel protein, and obtained
Masica et al. Page 2
J Phys Chem C Nanomater Interfaces. Author manuscript; available in PMC 2012 July 21.
NIH
-PA Author Manuscript
NIH
-PA Author Manuscript
NIH
-PA Author Manuscript

similar results with or without ssNMR bias, demonstrating the power of RosettaSurface tocomplement experimental studies.43 Structures predicted from ssNMR-biasedRosettaSurface.NMR provide a means to visualize data, extrapolate data to nearby regionsof the protein, and to focus subsequent experimental studies on the most relevant regions ofthe protein-crystal interface.
Here we extend these computational studies to understand and complement theexperimentally determined structure of LRAP bound to HAp. First we use ssNMR todetermine the partial HAp-adsorbed structure and orientation of LRAP's N-terminal domain(in the context of full-length LRAP). Then, we investigate the structure and preferentialadsorption of LRAP using ssNMR-biased RosettaSurface.NMR predictions at five HApcrystal faces. We also investigate the effect of phosphorylation at S16 on LRAP's structureand binding orientation to address the importance of phosphorylation on HAp interaction.
Materials and MethodsMaterials
Labeled amino acids were purchased from Cambridge Isotopes and used as received.Solvents were used without further purification. FMOC-protected labeled amino acids wereprepared according to standard procedures and used without further purification.44
Protein preparation, purification and characterizationProteins were prepared using standard FMOC chemistry45 by the University of Texas,Southwestern Medical Center (Dallas, TX). Proteins were purified using prep scale reversephase HPLC, buffer A: 0.1% trifluoroacetic acid in water, buffer B: 0.1% trifluoroaceticacid in acetonitrile. LRAP eluted at 54% B. Proteins were analyzed for molecular weightand purity using electrospray MS.
Sample preparation of the free proteinTo prepare a solid state sample of the free protein, 20 mg of LRAP was dissolved into 1 mLof phosphate buffer, consisting of a solution of 0.15M NaCl and saturated with respect tohydroxyapatite (PB), and diluted to 20 mL with water. The pH was adjusted to 7.4, thesolution was frozen in liquid nitrogen, lyophilized, and the entirety of the resulting powderpacked into the NMR rotor.
Sample preparation of the protein bound to HAPThe protein sample was bound to HAp as described previously. HAp crystals were preparedaccording to published procedures46 and had the expected needle-shaped morphology withapproximate dimensions of 50 × 50 × 200 nm, with the c-axis elongated. Briefly, a solutionof 0.33 mg/mL LRAP at pH 7.4 was bound to 75 mg of 94 m2/g HAP (protein to HApweight ratio of 1:3) for 1 hour. The amount of protein bound was determined by measuringthe change in concentration before and after binding and for each wash using UVabsorbance measurements (λ=275 nm). Amounts bound were: 12.8, 15.3, 13.1, 15.3, 14.5,15.9 and 16.4 mg for G8-Y12(pS), G8-Y12, L15-V19(pS), L15-V19, V19-L23(pS), V19-L23 and K24-S28 respectively, to 100 mg of HAp. The sample was packed into an NMRrotor as a wet paste for the hydrated, surface bound sample.
NMR experimentsNMR experiments were performed on a 3-channel Chemagnetics Infinity console operatingat 300 MHz proton frequency. A 3-channel, variable temperature Chemagnetics probe wasused, employing a 6 μs 90° pulse for 1H and a 0.5–1 ms contact time for cross polarization
Masica et al. Page 3
J Phys Chem C Nanomater Interfaces. Author manuscript; available in PMC 2012 July 21.
NIH
-PA Author Manuscript
NIH
-PA Author Manuscript
NIH
-PA Author Manuscript

experiments. Temperatures in the rotor were calibrated using 207Pb(NO3)2.47 Chemicalshifts were referenced to glycine, 177.0 ppm.
REDORFor Rotational Echo DOuble Resonance (REDOR) experiments, XY8 phase cycling wasused on both observe and dephasing channels. For both REDOR experiments, 13C{31P}and 13C{15N}, 180° pulses of 13.0–15.0 μs were used for both the observe and dephasingnuclei and samples were spun at 4 kHz. Two Pulse Phase Modulated (TPPM) decoupling48
with a 65 kHz decoupling field was used throughout. Data for the hydrated samples werecollected at −80 °C. Typically, 4096 scans were taken for shorter dephasing periods and8192–16384 scans were taken for longer dephasing times, with a 3 s pulse delay. Data wascollected at every 8 or every 16 rotor periods, out to 104 rotor periods for 13C{31P}and 13C{15N} REDOR. In all cases, the final dephasing curve represents the average of atleast 3–5 repetitions. The contribution of the natural abundance background (58 backbonecarbonyls and 7 sidechain carbonyls) has been removed from the 13C{31P} and 13C{15N}dephasing curves using the following equation:
where S is the signal from the dephasing experiment and S0 is the control experimentwithout the dephasing pulses, %NA is the percent of the signal resulting from the naturalabundance background (39.6%) and %L is the percentage of the signal resulting from theisotopic label (60.4%). Simulated REDOR dephasing curves were calculated usingnumerical methods that incorporated chemical shift anisotropies and experimentalparameters. 3-spin models assumed a 90° orientation between the C-P vectors.
The AlgorithmFor this study we used our recently developed RosettaSurface.NMR protocol.43 Briefly,each execution of RosettaSurface.NMR begins by folding a protein from a fully extendedconformation in solution using a united-atom model. At this low-resolution stage, proteinintramolecular ssNMR constraints are applied, but protein-surface intermolecular constraintsare not. Next, the high-resolution (all-atom) representation of the protein is refined insolution and adsorbed to the surface in a random orientation. The fold and orientation of theprotein are refined on the surface, resulting in one candidate adsorbed-state structure. Allcalculations on the surface include the biasing influence of both protein intramolecular andprotein-surface intermolecular ssNMR measurements. High-resolution refinement includesbackbone, side-chain, and rigid-body optimization using a Monte Carlo-plus-minimizationprotocol.
The full-atom energy (E) used for decoy discrimination is a linear combination of attractiveand repulsive Lennard-Jones interactions (Eatt and Erep), solvation (Esol), hydrogen bonding(Ehb), electrostatics (Ecoul), and a term to enforce ssNMR constraints (Econstraint):
(1)
where:
(2)
Masica et al. Page 4
J Phys Chem C Nanomater Interfaces. Author manuscript; available in PMC 2012 July 21.
NIH
-PA Author Manuscript
NIH
-PA Author Manuscript
NIH
-PA Author Manuscript

where:
(3)
In equation 3, ximeasured and xipredicted are the ith ssNMR determined distance andRosettaSurface. NMR predicted distance, respectively; σi is the experimental error of the ithmeasurement; n is the number of biasing constraints used during structure prediction(equation 2). Figure 1 shows the functional form of the constraint energy. During biasedstructure prediction, the constraint weight w (equation 1) modulates the strength of the biastoward experimental measurements; the units of the weight are kcal/mol. Because theRosettaSurface energy function used for structure generation in this study includes aconstraint energy term, a true binding energy is not calculated.
For all predictions, 105 candidate HAp-adsorbed LRAP structures were generated usingRosettaSurface.NMR, each resulting from ~35×103 sampled conformations. Each candidatestructure is assessed using the constraint energy Econstraint (for all n ssNMR measurements).Structures with the smallest constraint energy are used for further analysis and modelrepresentation.
LRAP ModelsFor the starting structures, we built extended molecular structures of phosphorylated andnon-phosphorylated LRAP variants using PyMol.49 The atomic parameter set waspreviously reported in Masica et al.39
Hydroxyapatite ModelsWe built monoclinic hydroxyapatite crystals using CrystalMaker.50 In total, five HApsurfaces were used in this study: {001}, {010}, {101}, and two differentially terminated{100} faces (Figure 2). The atomic parameter set was previously reported in Masica et al.39
ResultsExperimental data
Previously, we determined the partial structure of LRAP's C-terminal domain adsorbed toHAp using ssNMR. Here, we chemically synthesized seven new constructs labeled at uniquepositions for acquisition of ssNMR derived distance measurements and subsequent ssNMR-biased computational structure prediction. The labels were incorporated at atomic pairs ofamino acids in the N-terminal and middle domain of full-length LRAP, and include: G8-Y12, G8-Y12(pS), L15-V19, L15-V19(pS), V19-L23, V19-L23(pS), and K24-S28, wherepS indicates that the labeled pair was incorporated into the LRAP variant phosphorylated atresidue S16. In each labeled pair, the ito i + 4 residues were labeled at the backbonecarbonyl carbon (13C′) and backbone amide nitrogen (15N) atoms respectively. This labelingscheme allowed us to probe for helix, extended, and β-sheet secondary structure in themeasured regions, which have distinctly different REDOR dephasing curves as shown inFigure 3. In addition, all labeled constructs were subjected to measurements between the 13C′ isotopes and HAp-31P phosphorus atoms to determine proximity to the HAp surface; intotal, 14 new ssNMR measurements were acquired for this study. Table 1 shows results forthe new set of ssNMR distance measurements and all previously published measurements.
Masica et al. Page 5
J Phys Chem C Nanomater Interfaces. Author manuscript; available in PMC 2012 July 21.
NIH
-PA Author Manuscript
NIH
-PA Author Manuscript
NIH
-PA Author Manuscript

The structure of the N-terminus in both the phosphorylated and the non-phosphorylatedproteins bound to HAp is consistent with a largely extended structure (5.5 Å and longer),with the L15-V19 region showing a loosely helical structure (4.9 Å–5.4 Å). The shortermeasured distance for L15V19 could be consistent with either a less coiled helix resulting inweaker i to i+4 contacts, or multiple structures, one population which is helical and onewhich is not helical. These are indistinguishable based on the REDOR experiment as hasbeen discussed previously.20 The non-phosphorylated REDOR dephasing curves are shownin Figure 3 as symbols and the fits are shown as dashed lines. Solid lines shown for an α-helix (4.2 Å) and a β-sheet (10.4 Å) for comparison, as indicated, demonstrate the ease ofdistinguishing between an α-helix and a β-sheet using the designed labeling scheme.
While there is little difference in structure as a function of phosphorylation, there aresignificant structural changes in the N-terminus as a function of binding the protein to HAp,which are different for each construct. For the phosphorylated protein, the G8-Y12 regionbecomes more extended on the surface, while the region from L15 to L23 becomes morehelical. For the non-phosphorylated construct, the most remarkable change is in the K24-S28 region, where this region of the protein changes from nearly a perfect helix to anextended structure on the surface. Two of the other three regions investigated for the non-phosphorylated protein also exhibit a structural change upon binding to HAP: the regions atG8-Y12 and V19-L23 become more helical while L15-V19 has little change from its loosehelical character.
Orientation measurements from the 13C labels in the protein backbone to the 31P atoms inthe surface show that in all cases the backbone of the N-terminus was oriented next to thesurface. The backbone was consistently significantly closer to the surface for thephosphorylated protein than for the non-phosphorylated (Figure 4). To confirm that thepresence of the side-chain phosphorous (pS16) was not resulting in a falsely low protein-surface distance, the contribution of the side-chain phosphorous to the dephasing curves wasaccounted for. The intraprotein 13C-31P distance was determined from the off the surfacesample. Three site models were then generated for the surface-bound sample to account forthe non-HAp 31P contribution. These models assumed a 90 degree orientation between thetwo C-P vectors. In all cases, if the residue carbonyl-pS16 distance was assumed to remainthe same upon binding, the intraprotein contribution did not change the best fit distancemeasured between the protein and the surface. This was found to be true as long as theprotein-surface distance was the shorter of the two distances, as was always the case. Thishas been observed before for longer dipolar recoupling measurements.20 However, theRosettaSurface.NMR distances for the bound protein do indicate a change in the intraproteindistance based on the 100 lowest Econstraint structures. In the {010}-LRAP(pS) low-energyensemble, the L15-pS16 and pS16-V19 distances are 5.3 ± 0.6 Å and 8.2 ± 1.2 Å,respectively. If these values are used for the intraprotein distances instead of theexperimentally measured values determined for the unbound protein, the dephasing data isequally well fit with a 3-spin model of 5.3 Å for the L15- pS16 and 7.0 Å L15-HAp distance(Figure 5). Similarly, the 13C-31P dephasing data for V19 is equally well fit by a 3-spinmodel of 8.2Å pS16-V19 and a 7.5 Å L15-HAp distance.
RosettaSurface dataStructure prediction was biased using all new and previously published ssNMRmeasurements (Table 1). We performed ssNMR-biased structure prediction at five HApcrystal faces: {001}, {010}, two differentially terminated {100} faces ({100}-T1 and {100}-T2), and {101}. The {100}-T2 surface terminates with a higher density of calcium ions thanthe {100}-T1 surface. All other HAp surfaces were cut to expose approximately neutral(mixed-charge) surfaces. These faces were chosen because they are expressed in stable HApcrystals and have a range of surface geometries.51
Masica et al. Page 6
J Phys Chem C Nanomater Interfaces. Author manuscript; available in PMC 2012 July 21.
NIH
-PA Author Manuscript
NIH
-PA Author Manuscript
NIH
-PA Author Manuscript

For each surface, predictions were divided into 11 runs of ~9,100 candidate structures. Foreach of the 11 runs at each surface, the weight w (see Materials and Methods) was set to anumber between 0 and 1 kcal/mol evenly divisible by 0.1 (i.e., 0, 0.1, 0.2 …. 1). Thisresulted in a total of 105 candidate adsorbed-state structures at each of five surfaces forphosphorylated and non-phosphorylated variants of LRAP; i.e., 106 total structuresgenerated from ~35×109 sampled conformations (see Materials and Methods). Weemployed this approach to test whether the set of constraints is easier to match at particularLRAP-HAp interfaces. This result would manifest as predictions at one or more HApsurfaces exhibiting smaller Econstraint versus weight relative to predictions at the other HApsurfaces. This approach has the potential to probe surface specificity at protein-surfaceinterfaces while determining the experimentally biased structure of the adsorbed protein.
Figure 6 shows Econstraint versus weight for structures resulting from ssNMR-biasedpredictions. As expected, Econstraint decreases with increasing weight at all five HApsurfaces for both LRAP variants. RosettaSurface. NMR had greater difficulty meetingexperimental constraints for the phosphorylated variant (Figure 6A), relative to the non-phosphorylated variant (Figure 6B), resulting in a higher average constraint weight for thephosphorylated variant. On average, Econstraint is smallest at the HAp {010} surface forphosphorylated LRAP (Figure 6A) and non-phosphorylated LRAP (Figure 6B). That is, it iseasiest for RosettaSurface to create structures matching the experimental constraints whenLRAP variants bind the {010} surface, suggesting the {010} surface is more likely bound inthe ssNMR experiments. Convergence between prediction and experiment was slowest atthe {100}-T1 surface for both LRAP variants. Structures were similar for both LRAPvariants at all five HAp crystal surfaces; here we focus on structures predicted at the HAp{010} surface for both the phosphorylated and non-phosphorylated LRAP variants.
Figure 2 shows the dimensions of the smallest periodic motif of phosphate clusters on eachHAp surface used for these predictions ({100-T2} surface phosphate clusters are occupiedby calcium atoms). Periodic motifs of phosphates on the {100}-T1 and {010} surfaces aresimilar ({010} and {100} crystal lattices are identical aside from the direction of hydroxylgroups); however, terminations chosen here have different calcium positions. The {100}-T2and {010} surfaces are identical except for an additional calcium atom deposited into eachphosphate cluster on the {100}-T2 surface. The {101} surface has a unique geometry,whose dimensions are larger than other surfaces used for these predictions. Thecomplementarity of these motifs to the motif of LRAP's binding domain (and hence therelative positions of binding residues) plays an important role where convergence betweenssNMR and structure prediction are concerned (Figure 6).
Figure 7 shows ensemble structural statistics for the 100 structures with the smallestEconstraint for HAp {010}-LRAP(pS) (Figures 7A–C) and HAp {010}-LRAP (Figures7D–F).Figures 7A and 7D show similar secondary structure for the HAp {010}-LRAP(pS) andHAp {010}-LRAP complexes respectively. For both complexes, there is increasing locallyhydrogen-bonded turn-like secondary structure from residues ~3–11, with some propensityfor helix formation from residues ~10–20. Residues ~18–32 form a helix-turn-helix motif atboth interfaces with P22 being a common turn initiator (see also, Figure 8A). Residues ~30–48 are mostly extended or locally hydrogen-bonded turn-like secondary structure and the~10 most C-terminal residues have significant propensity to form turn-like secondarystructure with some helical structure from residue 48 to 56, at both interfaces.
Figures 7B and 7E show the computationally determined protein intramolecular contacts forthe HAp {010}-LRAP(pS) and HAp {101}-LRAP complexes respectively. The denseregions of i to i + 4 contacts from ~18–32 and the ~10 most C-terminal residues suggestsignificant helical content (in agreement with Figures 7A and 7C). There are few contacts
Masica et al. Page 7
J Phys Chem C Nanomater Interfaces. Author manuscript; available in PMC 2012 July 21.
NIH
-PA Author Manuscript
NIH
-PA Author Manuscript
NIH
-PA Author Manuscript
made between residues that are greater than five residues apart in primary sequence,suggesting little tertiary structure. However, there are significant off-diagonal contactsbetween residues ~30–48 owing to an abundance of hydrophobic residues in that region,particularly at the HAp {010}-LRAP interface. Additionally, there are significant off-diagonal contacts from residues ~20–30, particularly at the HAp {010}-LRAP(pS) interface,owing to an abundance of hydrophobic residues in that region. Those hydrophobic contactshelp facilitate the helix-turn-helix motif in that region (see Figure 8A).
Residues ~10–20 of the phosphorylated LRAP variant bind HAp more closely than the sameregion of the non-phosphorylated LRAP variant (Figures 7C and 7F respectively). Protein-surface distances in that region are almost exclusively within 10 Å at the HAp {010}-LRAP(pS) interface, whereas the {010}-LRAP interface shows an approximately evendistribution of contacts within 15 Å from residues ~10–20. Furthermore, most residues inthat region are predominately located within 3 Å of the HAp {010}-LRAP(pS) interface;these high-frequency direct contacts are mostly absent at the {010}-LRAP interface.
The C-terminal domain is tightly bound at both the HAp {010}-LRAP(pS) and HAp {010}-LRAP interfaces. Strong binding via the C-terminal domain is predominately mediated bythe charged residues in that region, i.e., E45, D51, K52, K54, R55, E56, E57, and D59.Which of those residues contact the surface is dictated by the conformation of the C-terminal domain, and varies within the individual structures of the ensemble (Figures 8B and8C).
Figure 9 shows a representative structural model from the 100 structures with smallestEconstraint from ssNMR-biased structure prediction at the {010}-LRAP(pS) interface. Thisstructure was chosen because it represents a dominant ensemble conformation (Figures 7A–C) of the ssNMR-biased structure (Table 1). Figure 9A shows a global view of the HAp{010}-LRAP(pS) complex; for that model, figures 9B–D show predicted distances forwhich biasing was applied. These figures directly show the extent of biasing at specificregions of the complex and the structure that was predicted in those regions. Table 1 showsall experimental measurements and the corresponding predictions from the representativemodel (Figure 9).
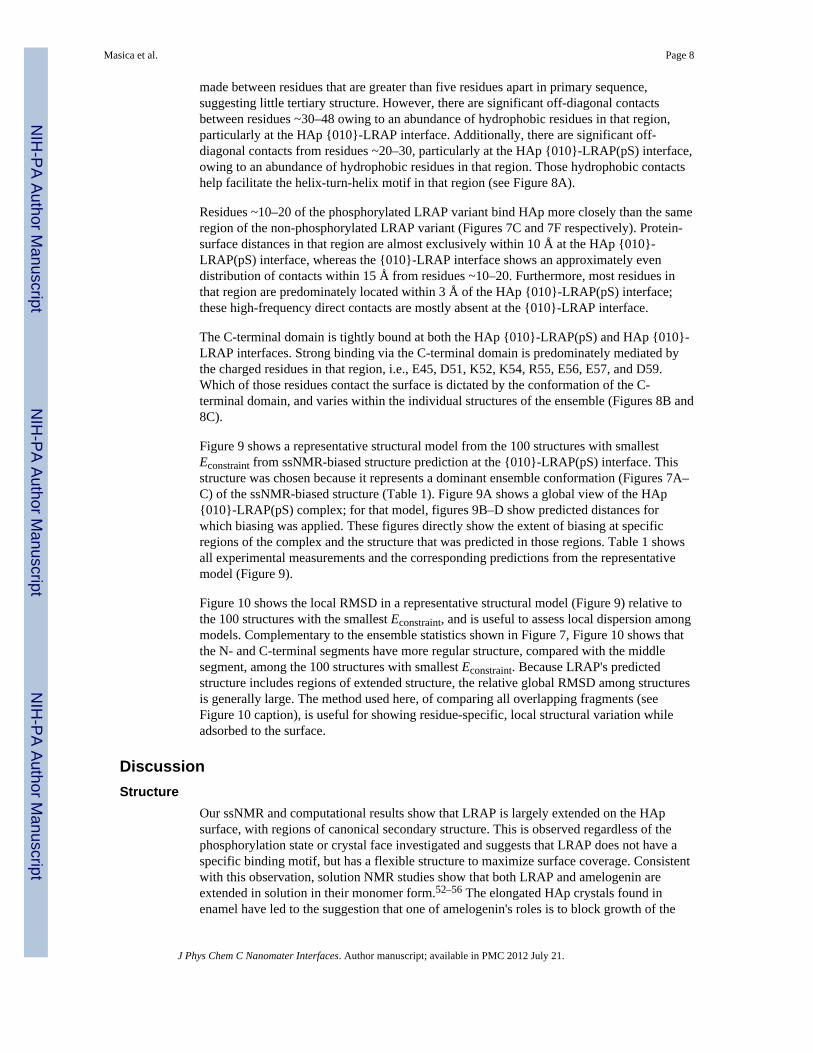
Figure 10 shows the local RMSD in a representative structural model (Figure 9) relative tothe 100 structures with the smallest Econstraint, and is useful to assess local dispersion amongmodels. Complementary to the ensemble statistics shown in Figure 7, Figure 10 shows thatthe N- and C-terminal segments have more regular structure, compared with the middlesegment, among the 100 structures with smallest Econstraint. Because LRAP's predictedstructure includes regions of extended structure, the relative global RMSD among structuresis generally large. The method used here, of comparing all overlapping fragments (seeFigure 10 caption), is useful for showing residue-specific, local structural variation whileadsorbed to the surface.
DiscussionStructure
Our ssNMR and computational results show that LRAP is largely extended on the HApsurface, with regions of canonical secondary structure. This is observed regardless of thephosphorylation state or crystal face investigated and suggests that LRAP does not have aspecific binding motif, but has a flexible structure to maximize surface coverage. Consistentwith this observation, solution NMR studies show that both LRAP and amelogenin areextended in solution in their monomer form.52–56 The elongated HAp crystals found inenamel have led to the suggestion that one of amelogenin's roles is to block growth of the
Masica et al. Page 8
J Phys Chem C Nanomater Interfaces. Author manuscript; available in PMC 2012 July 21.
NIH
-PA Author Manuscript
NIH
-PA Author Manuscript
NIH
-PA Author Manuscript

{100} and {010} faces. The less globular structure may facilitate this function by allowingthe unfolded protein to cover more surface nucleation sites.
The new ssNMR measurements from residues 8–28 of LRAP bound to HAp reveal a largelyextended structure, with L15-V19 exhibiting some loosely helical regions in both variantsbased on the shorter measured distances. An i to i+4 distance of 4.2 Å would be expectedfor a perfectly helical secondary structure, while distances out to 5.4 Å are interpreted ashelical or loosely helical and a well-defined β-sheet structure would have a measureddistance of 10.6 Å. A largely extended structure is consistent with i to i+4 distances longerthan 5.5 Å, based on the distance of 5.8 Å resulting from a linear combination of the torsionangles from 4.2 to 10.6 Å.20,21,28 While these designations are valuable, it is important tonote that the ssNMR measurement represents an average of the ensemble of structurespresent and could represent a single structure with small variations around it, a combinationof two or three structures with small variations in those structures or an ensemble ofstructures with a large structural deviation.28 This distinction is difficult to make withssNMR, and an added challenge is that tertiary structure, such as turns, is not included inthese definitions and could modulate any of the expected distances depending on turnlocation. RosettaSurface.NMR has the potential to distinguish between these possibilitiesand given the prediction of turns, has the potential to significantly impact our interpretationof the measured distances.
In reasonable agreement with our ssNMR data, our ssNMR biased computational analysisfound LRAP's HAp-adsorbed fold includes extended (non-locally hydrogen bonded) andturn-like (locally hydrogen bonded) secondary structure in the first ~18 residues. Fromresidues 18–21 there is increasing helical structure, which is moderately perturbed by thepresence of a proline at position 22, followed by a stable helix from residues ~24–30;proline is known to break and initiate helix formation owing to the lack of a backbone amidehydrogen atom and the presence of a constrained θ angle.57 These helical segments interactwith one another via several hydrophobic residues, forming a helix-turn-helix motif fromresidues 18–30. The C-terminal half of LRAP comprises extended and turn-like secondarystructure, with some propensity for helix formation in the predicted, low-energy ensemble.LRAP's observed fold appears to have little dependence on phosphorylation at S16.
While no structural change was observed as a function of phosphorylation, ssNMRmeasurements indicate surface induced structural changes for both variants. Of particularnote is the non-phosphorylated variant, where the region of K24-S28 exists as a nearlyperfect helix off the surface (4.5 Å), becoming largely extended upon binding (5.7 Å). Thismay suggest an important turn region or interaction region of the non-phosphorylatedprotein in the K24-S28 region. The RosettaSurface.NMR predictions indicate a turn awayfrom the surface at K24 (Figure 9C), which could be the cause of the structural change. Toincrease sampling of relevant adsorbed-state structures, ssNMR-measured off-surfacedistances were not used to bias RosettaSurface.NMR structure prediction; therefore, thechange in K24-S28 distance upon binding is not present in the predicted ensembles.Investigating surface-induced structural changes computationally is an area of futuredevelopment.
The last nine residues of LRAP contain seven charged residues, which is an unusually highcharge density for structured proteins.58 Several residues have high contact frequency atmultiple distances from the HAp surface in the C-terminal region (Figures 7C and 7F). Forinstance, E56 locates at either 2 Å or 7 Å; R55 has many short-range contacts at 2 Å fromthe HAp surface with a significant distribution centered at 6 Å; K54 has a distributioncentered at 7 Å in addition to a significant number of short-range contacts at 2 Å.Furthermore, LRAP's C-terminal region is predicted to adopt both helical and turn-like
Masica et al. Page 9
J Phys Chem C Nanomater Interfaces. Author manuscript; available in PMC 2012 July 21.
NIH
-PA Author Manuscript
NIH
-PA Author Manuscript
NIH
-PA Author Manuscript

secondary structures at the HAp interface (Figures 7A and 7D); these observations suggestthe possibility of surface-induced conformational preferences in the C-terminal segment ofboth LRAP variants. Figures 8B and 8C show LRAP charged residues in the C-terminalregion binding HAp differentially in a conformation-dependent manner. Because the ssNMRdistances are averages over the entire ensemble, this example highlights howRosettaSurface.NMR has the ability to provide additional insight into the structuralconformations that these distances could represent.
Biased RosettaSurface.NMR recovers the general structural trends of the ssNMR datareasonably well, with the exception of the structure at K24-S28 and K54-V58.Experimentally, these were found to be largely extended, while the computational modelpredicted that these regions were largely helical. These disparities are likely due to thesparse ssNMR constraints and the larger size of the protein in this study relative to previousstudies.43 It highlights the challenges of modeling surface-adsorbed proteins and emphasizesthe importance of benchmarking these models with known experimental data to providefurther development.
The general difficulties in protein structure prediction, such as developing an adequateenergy function and sampling strategy, are expected to be a limitation of the RosettaSurfaceprotocol. The RosettaSurface protocol as implemented in this study can only sample afraction of the conformation space associated with folding multiple protein variants at theinterface of five crystalline solids. We used RosettaSurface.NMR under the hypothesis thatthe addition of experimental bias will help compensate for some energy function limitationsand focus sampling to relevant conformation space; however, the space is likely still under-sampled, especially with respect to compact LRAP structures. Furthermore, in thesimulation constructs, HAp atomic coordinates were held fixed and not allowed to deviatefrom their lattice positions. All of these difficulties contribute to uncertainty in the modelswith respect to structure, orientation, and surface specificity.
OrientationWhile LRAP's structure was similar for both variants when bound to HAp, the boundorientation in the N-terminus differed. Phosphorylation of the serine side chain at residue 16decreased the average ssNMR measured distances from the backbone to the surface at G8,L15, and V19, and resulted in a more proximal segment from residues ~10–20 in thessNMR-biased RosettaSurface.NMR low-energy ensemble. This result was expected due tothe increased affinity of the additional charged residue for the charged HAp surface.Residues ~25–44 are predicted not to make high-affinity contacts with HAp (Figure 7C).The negatively charged segment from residues ~45–59 locate at the highly charged surface,regardless of the phosphorylation status of the distal S16 residue (Figures 7C and 7F).Despite the closer association with HAp upon binding, we observed 1–3 mg more proteinbinding in the non-phosphorylated protein. This result was unexpected since there is nocorresponding structural change. Combined, this data suggests that phosphorylation at S16 isnot required for binding, but does alter the binding interaction.
One confounding factor in ssNMR data acquisition in the phosphorylated variant is theuncertainty in signal origin (i.e., HAp phosphates and phosphoserine will produce similardephasing if they are both close to the 13C being investigated). Indeed, RosettaSurface.NMRpredictions suggest that L15-pS16 and pS16-V19 distances become shorter for the boundprotein compared to the protein off the surface (Table 1), to a degree that they becomesimilar to the experimentally measured distance. This is a measurement that cannot be madeindependently by experiment and this computational measurement allows reevaluation ofthe experimental data. Using the computationally derived intraprotein13C-31P distancesresults in longer backbone-HAp distances of 7.0 Å for L15-HAp and 7.5 Å for V19-HAp
Masica et al. Page 10
J Phys Chem C Nanomater Interfaces. Author manuscript; available in PMC 2012 July 21.
NIH
-PA Author Manuscript
NIH
-PA Author Manuscript
NIH
-PA Author Manuscript

(Figure 5), in much better agreement with the computationally derived data. It is importantto note that while these distances are longer then a single spin model suggests, they are stillshorter than the non-phosphorylated variant, indicating an increased interaction when thephosphoserine is present.
While the orientation of the representative model was largely consistent with theexperimental data, the ensemble distances were consistently longer, with 5 of the 10distances being on average 2 Å longer than the experimentally determined values. It isdifficult to determine exactly what the source of this difference might be. Differences in thesurface could be one source of error. In the experimental studies, we cannot distinguishwhich face of HAp we are binding to, due to its small size, and even though we expect apreference for {100} and {010}, it is likely that we are observing the average of proteinbound to all exposed faces. It is also possible that there is some dissolution of the surface insolution that could alter the surface morphology in an unpredictable way. Anotherpossibility is that LRAP preferentially binds a step-edge, a surface that we did not evaluatecomputationally and one that would be difficult to validate experimentally. Importantly, theoverall features of the protein-surface interaction have been captured with the model.Further refinements and benchmarking of this method will be aided by further experimentalconstraints.
Surface specificityAmelogenins are thought to bind the {010} and {100} faces of mature HAp crystals.59 Ourinvestigation did reveal some {010}-HAp crystal face specificity for both LRAP variants.However, the method we developed for probing specificity is novel, and it is unclear howsignificant our findings are. In a previous study, using ssNMR-biased RosettaSurface.NMR,we predicted that statherin could significantly discriminate some HAp surfaces.Furthermore, our method predicts that LRAP and statherin prefer different HAp surfaces.43
These predicted differences for statherin and LRAP indicate the algorithm has no intrinsicbias for a particular face.
One factor that might contribute to the increased specificity in the case of statherin is theexistence of a single, well-defined binding interface. Statherin's binding domain consists of asingle, stable helix. In the case of LRAP there are two predicted binding interfaces fromresidues ~10–20 and residues ~45–59. The predicted flexibility from residues ~30–45 andthe lack of predicted global tertiary structure results in an LRAP fold where the relativerigid-body positions of the binding interfaces vary in the low-energy ensembles. Because therelative rigid-body positions of the binding interfaces are not fixed, LRAP can adoptmultiple, energetically equivalent orientations on the HAp surfaces. Furthermore, our resultspredict that the C-terminal residues of LRAP bind differentially, in a conformation-dependent manner. This ability to adopt diverse conformations in the highly charged C-terminal binding domain could facilitate the binding of diverse surface geometries, resultingin decreased specificity and increased affinity.
Future directionWhile this study represents the ambitious effort of determining the adsorbed-state structurein a relatively large protein, the full structure remains underdetermined. One way to increasestructural resolution and certainty would be to identify residues that are distant in primarystructure, but proximal in tertiary structure, if they exist. For instance, our structures showsome hydrophobic packing in the segments intervening residues ~20–30 and residues ~30–48. Acquiring distance measurements in these segments would reveal the compactness ofLRAP in the HAp-adsorbed state. Because the compactness of the molecule affects therelative orientation of the binding interfaces, long-range contacts may also help confirm or
Masica et al. Page 11
J Phys Chem C Nanomater Interfaces. Author manuscript; available in PMC 2012 July 21.
NIH
-PA Author Manuscript
NIH
-PA Author Manuscript
NIH
-PA Author Manuscript

refute the existence of surface specificity. Additionally, a greater number of LRAP-HApdistance measurements might help address specificity.
In addition to a greater number of experimental measurements, development ofRosettaSurface could contribute to further refinement for the HAp-adsorbed LRAPstructure. Energy function calibration requires benchmarking on experimental data, whichare scarce. One obvious approach would be to increase the constraint weight; however, it isunclear to what extent the constraint weight should dominate relative to other terms in thephysical potential. Further algorithmic development coupled with an increased number ofexperimental measurements is expected to further increase the scope and utility of this noveland rigorous approach.
ConclusionsNew ssNMR data reveal that the N-terminus of the amelogenin LRAP is largely extended onthe surface of HAp. Computational data combining all of the N- and C-terminalexperimental measurements to date reproduce the experimental data reasonably well, andsuggest a very dynamic region of LRAP in the middle of the protein. Phosphorylation of theprotein did not alter the conformation of LRAP on the surface, however, the interaction withHAp was modulated with the addition of the charged residue. The conformation was alsonot sensitive to any of the surfaces studied, but predictions for both variants showed somepreference for the {010} face of HAp. Collectively, these observations are consistent with aprotein that is extended and interacting closely with HAp to maximize surface coverage. Thepredicted preferential binding is consistent with blocking growth on the a and b faces,allowing maximal growth along the c-axis to result in elongated crystals.
AcknowledgmentsThis research was supported by NIH-NIDCR Grant DE-015347 (WJS) and NSF CAREER award CBET 0846324(JJG). The research was performed at the Pacific Northwest National Laboratory (PNNL), a facility operated byBattelle for the U.S. Department of Energy, and at the W.R. Wiley Environmental Molecular Sciences Laboratory(EMSL), a national scientific user facility sponsored by the U.S. DOE Biological and Environmental Researchprogram.
References(1). Mann, S. Biomineralization. Principles and Concepts in Bioinorganic Materials Chemistry. Oxford
University Press; Oxford, England: 2001.(2). Dove, PM.; J. J. D. Y., S. Weiner Biomineralization. Vol. Vol. 54. Mineralogical Society of
America, Geochemical Society; Washington, DC: 2003.(3). Sundar VC, Yablon AD, Grazul JL, Ilan M, Aizenberg J. Nature. 2003; 424:899–900. [PubMed:
12931176](4). Faivre D, Schüler D. Chem. Rev. 2008; 108:4875–4898. [PubMed: 18855486](5). Ozawa H, Hoshi K, Amizuka N. Journal of Oral Biosciences. 2008; 50:1–14.(6). Elhadj S, De Yoreo JJ, Hoyer JR, Dove PM. Proc. Natl. Acad. Sci. USA. 2006; 103:19237–19242.
[PubMed: 17158220](7). Boskey AL, Maresca M, Ullrich W, Doty SB, Butler WT, Prince CW. Bone and Mineral. 1993;
22:147–159. [PubMed: 8251766](8). Shiraga H, Min W, VanDusen WJ, Clayman MD, Miner D, Terrell CH, Sherbotie JR, Foreman
JW, Przysiecki C, Neilson EG. Proc. Natl. Acad. Sci. USA. 1992; 89:426–430. [PubMed:1729712]
(9). Naka K, Chujo Y. Chem. Mater. 2001; 13:3245–3259.(10). Sollner C, Burghammer M, Busch-Nentwich E, Berger J, Schwarz H, Riekel C, Nicolson T.
Science. 2003; 302:282–286. [PubMed: 14551434]
Masica et al. Page 12
J Phys Chem C Nanomater Interfaces. Author manuscript; available in PMC 2012 July 21.
NIH
-PA Author Manuscript
NIH
-PA Author Manuscript
NIH
-PA Author Manuscript

(11). Termine JD, Belcourt AB, Christner PJ, Conn KM, Nylen MU. J. Biol. Chem. 1980; 255:9760–9768. [PubMed: 7430099]
(12). Gibson CW, Yuan Z-A, Hall B, Longenecker G, Chen E, Thyagarajan T, Sreenath T, Wright JT,Decker S, Piddington R, Harrison G, Kulkarni AB. J. Biol. Chem. 2001; 276:31871–31875.[PubMed: 11406633]
(13). Mitsiadis TA, Tucker AS, De Bari C, Cobourne MT, Rice DPC. Dev. Biol. 2008; 320:39–48.[PubMed: 18572158]
(14). Hu JCC, Chun YHP, Al Hazzazzi T, Simmer JP. Cells Tissues Organs. 2007; 186:78–85.[PubMed: 17627121]
(15). Moradian-Oldak J, Bouropoulos N, Wang L, Gharakhanian N. Matrix Biol. 2002; 21:197–205.[PubMed: 11852235]
(16). Aoba T, Fukae M, Tanabe T, Shimizu M, Moreno E. Calcif. Tissue Int. 1987; 41:281–289.[PubMed: 2825935]
(17). Tarasevich BJ, Howard CJ, Larson JL, Snead ML, Simmer JP, Paine M, Shaw WJ. J. Cryst.Growth. 2007; 304:407–415.
(18). Hunter GK. Curr. Opin. Solid State Mater. Sci. 1996; 1:430–435.(19). Gray JJ. Curr. Opin. Struct. Biol. 2004; 14:110–115. [PubMed: 15102457](20). Shaw WJ, Ferris K, Tarasevich B, Larson JL. Biophys. J. 2008; 94:3247–3257. [PubMed:
18192371](21). Shaw WJ, Campbell AA, Paine ML, Snead ML. J. Biol. Chem. 2004; 279:40263–40266.
[PubMed: 15299015](22). Stayton PS, Drobny GP, Shaw WJ, Long JR, Gilbert M. Crit. Rev. Oral Biol. Medicine. 2003;
14:370–376.(23). Shaw WJ, Ferris K. J. Phys. Chem. B. 2008; 112:16975–16981. [PubMed: 19368031](24). Gibson C, Golub E, Herold R, Risser M, Ding W, Shimokawa H, Young M, Termine J,
Rosenbloom J. Biochemistry. 1991; 30:1075–1079. [PubMed: 1989679](25). Long JR, Shaw WJ, Stayton PS, Drobny GP. Biochemistry. 2001; 40:15451–15455. [PubMed:
11747419](26). Gibson JM, Popham JM, Raghunathan V, Stayton PS, Drobny GP. J. Am. Chem. Soc. 2006;
128:5364–5370. [PubMed: 16620107](27). Gibson JM, Raghunathan V, Popham JM, Stayton PS, Drobny GP. J. Am. Chem. Soc. 2005;
127:9350–9351. [PubMed: 15984845](28). Shaw WJ, Long JR, Dindot JL, Campbell AA, Stayton PS, Drobny GP. J. Am. Chem. Soc. 2000;
122:1709–1716.(29). Goobes G, Goobes R, Schueler-Furman O, Baker D, Stayton PS, Drobny GP. Proc. Natl. Acad.
Sci. USA. 2006; 103:16083–16088. [PubMed: 17060618]30. Ndao M, Ash JT, Breen NF, Goobes G, Stayton PS, Drobny GP. Langmuir. 2009; 25:12136–
12143. [PubMed: 19678690](31). Ndao M, Ash JT, Stayton PS, Drobny GP. Surf. Sci. 2010; 604:L39–L42. [PubMed: 20676391](32). Cavalli A, Salvatella X, Dobson CM, Vendruscolo M. Proc. Natl. Acad. Sci. USA. 2007;
104:9615–9620. [PubMed: 17535901](33). Gong H, Shen Y, Rose GD. Protein Sci. 2007; 16:1515–1521. [PubMed: 17656574](34). Shen Y, et al. Proc. Natl. Acad. Sci. USA. 2008; 105:4685–4690. [PubMed: 18326625](35). Bowers PM, Strauss CEM, Baker D. J. Biomol. NMR. 2000; 18:311–318. [PubMed: 11200525](36). Meiler J, Baker D. Proc. Natl. Acad. Sci. USA. 2003; 100:15404–15409. [PubMed: 14668443](37). Rohl CA, Baker D. J. Am. Chem. Soc. 2002; 124:2723–2729. [PubMed: 11890823](38). Makrodimitris K, Masica DL, Kim ET, Gray JJ. J. Am. Chem. Soc. 2007; 129:13713–13722.
[PubMed: 17929924](39). Masica DL, Gray JJ. Biophys. J. 2009; 96:3082–3091. [PubMed: 19383454](40). Masica DL, Schrier SB, Specht EA, Gray JJ. J. Am. Chem. Soc. 2010; 132:12252–12262.
[PubMed: 20712308]
Masica et al. Page 13
J Phys Chem C Nanomater Interfaces. Author manuscript; available in PMC 2012 July 21.
NIH
-PA Author Manuscript
NIH
-PA Author Manuscript
NIH
-PA Author Manuscript

(41). Addison WN, Masica DL, Gray JJ, McKee MD. J. Bone Miner. Res. 2010; 25:695–705.[PubMed: 19775205]
(42). Chien Y-C, Masica DL, Gray JJ, Nguyen S, Vali H, McKee MD. J. Biol. Chem. 2009;284:23491–23501. [PubMed: 19581305]
(43). Masica DL, Ash JT, Ndao M, Drobny GP, Gray JJ. Structure. 2010; 18:1678–1687. [PubMed:21134646]
(44). Carpino LA, Han GY. J. Org. Chem. 1972; 37:3404–3409.(45). Meienhofer J, Waki M, Heimre EP, Lambros TJ, Makofske RC, Chang C-D. Int. J. Pept. Protein
Res. 1979; 13:35–42. [PubMed: 422322](46). Ebrahimpour A, Johnsson M, Nancollas CFRGH. J. Colloid Interface Sci. 1993; 159:158–163.(47). Bielecki A, Burum DP. Journal of Magnetic Resonance A. 1995; 116:215–220.(48). Bennett A, Rienstra C, Auger M, Lakshmi KV, Griffen RG. Journal of Chemical Physics. 1995;
103:6951–6958.(49). DeLano W. The PyMOL molecular graphics system. 2002(50). Palmer D. CrystalMaker: A computer program for plotting crystal structures. 2001; 5:3.(51). Astala R, Stott MJ. Physical Review B. 2008; 78:075427.(52). Matsushima N, Izumi Y, Aoba T. J. Biochem. 1998; 123:150–156. [PubMed: 9504422](53). Renugopalakrishnan V, Strawich ES, Horowitz PM, Glimcher MJ. Biochemistry. 1986; 25:4879–
4887. [PubMed: 3768319](54). Delak K, Harcup C, Lakshminarayanan R, Sun Z, Fan Y, Moradian-Oldak J, Evans JS.
Biochemistry. 2009; 48:2272–2281. [PubMed: 19236004](55). Buchko GW, Tarasevich BJ, Roberts J, Snead ML, Shaw WJ. Biochim. Biophys. Acta: Proteins
Proteomics. 2010; 1804:1768–1774.(56). Buchko G, Bekhazi J, Cort J, Valentine N, Snead M, Shaw W. Biomolecular NMR Assignments.
2008; 2:89–91. [PubMed: 19081741](57). Piela L, Némethy G, Scheraga HA. Biopolymers. 1987; 26:1587–1600. [PubMed: 3663874](58). Dyson HJ, Wright PE. Nat Rev Mol Cell Biol. 2005; 6:197–208. [PubMed: 15738986](59). Wallwork ML, Kirkham J, Zhang J, Smith DA, Brookes SJ, Shore RC, Wood SR, Ryu O,
Robinson C. Langmuir. 2001; 17:2508–2513.
Masica et al. Page 14
J Phys Chem C Nanomater Interfaces. Author manuscript; available in PMC 2012 July 21.
NIH
-PA Author Manuscript
NIH
-PA Author Manuscript
NIH
-PA Author Manuscript

Figure 1. Functional form of Econstraint for a single measured distance from equation 3, showingthe flat-bottom quadratic potential used to bias RosettaSurface. NMR structure predictionThe energetic penalty is zero for predictions within experimental error, and increasesquadratically with increasing deviation from ssNMR measurement for predictions outsidethe experimental error.
Masica et al. Page 15
J Phys Chem C Nanomater Interfaces. Author manuscript; available in PMC 2012 July 21.
NIH
-PA Author Manuscript
NIH
-PA Author Manuscript
NIH
-PA Author Manuscript

Figure 2. Hydroxyapatite model(A) Schematic of hexagonal HAp showing the five crystal faces (two differentiallyterminated surfaces at the {100} crystal plane) and the smallest periodic motif of openphosphate clusters at the (B) {001}, (C) {010}, (D) {100}-T1, (E) {100}-T2, and (F) {101}used for biased RosettaSurface. NMR structure prediction.
Masica et al. Page 16
J Phys Chem C Nanomater Interfaces. Author manuscript; available in PMC 2012 July 21.
NIH
-PA Author Manuscript
NIH
-PA Author Manuscript
NIH
-PA Author Manuscript

Figure 3. Representative REDOR 13C-15N dephasing curvesBecause of the similarity of the data, only the non-phosphorylated data are shown. G8-Y12(open navy diamonds), L15-V19 (open green squares), V19-L23 (open red triangles) andK24-S28 (open blue circles). Error bars are shown only for L15-V19 and K24-S28 forclarity, but are typical for all of the data. The dashed lines show fits to the data (4.9 Å, dash),(5.5 Å, 5.6 Å, 5.7 Å, dash-dot). The solids lines are 4.2 Å (α-helix) and 10.6 Å (β-sheet).
Masica et al. Page 17
J Phys Chem C Nanomater Interfaces. Author manuscript; available in PMC 2012 July 21.
NIH
-PA Author Manuscript
NIH
-PA Author Manuscript
NIH
-PA Author Manuscript

Figure 4. REDOR 13C-31P dephasing curvesG8 (open navy diamonds), G8–pS (closed navy diamonds), L15 (open green squares), L15–pS (closed green squares), V19 (open red triangles) V19–pS (closed red triangles), K24(open blue circles) and K24–pS (closed blue circles). Error bars are shown only for L15 andL15-pS for clarity, but are typical for all of the data. Lines show fits to the data (5.3 Å, dash-dot-dot; 6.5 Å, dash-dot; 7.0 Å, solid; 8.0 Å, dash; 9.0 Å, dot).
Masica et al. Page 18
J Phys Chem C Nanomater Interfaces. Author manuscript; available in PMC 2012 July 21.
NIH
-PA Author Manuscript
NIH
-PA Author Manuscript
NIH
-PA Author Manuscript

Figure 5. Modeled 13C-31P dephasing curvesIn the phosphorylated protein, 13C-31P measured distances could be a combination of ameasurement to the sidechain phosphoserine, as well as to the surface phosphate groups. Allsimulations assumed the 3 spins were oriented at 90 degrees. For the L15-V19 distance, 5.3Å and combinations of (5.3 Å and 5.3 Å), (5.3 Å and 6.0 Å) and (5.3 Å and 7.0 Å) areshown where the combination of (5.3 Å and 7.0 Å) is indistinguishable from a singledistance of 5.3 Å within experimental error. For V19-L23, 7.0 Å and combinations of (7.0 Åand 8.2 Å), (7.5 Å and 8.2 Å) and (8.0 Å and 8.2 Å) are shown and the combination of (7.5Å and 8.2 Å) is indistinguishable from a single distance of 7.0 Å.
Masica et al. Page 19
J Phys Chem C Nanomater Interfaces. Author manuscript; available in PMC 2012 July 21.
NIH
-PA Author Manuscript
NIH
-PA Author Manuscript
NIH
-PA Author Manuscript

Figure 6.Econstraint versus weight for phosphorylated (A) and non-phosphorylated (B) LRAP at fivedifferent HAp surfaces.
Masica et al. Page 20
J Phys Chem C Nanomater Interfaces. Author manuscript; available in PMC 2012 July 21.
NIH
-PA Author Manuscript
NIH
-PA Author Manuscript
NIH
-PA Author Manuscript

Figure 7. Ensemble structure of LRAP adsorbed to HAp for the 100 structures with smallestEconstraintDistributions of three basic secondary structure motifs at the (A) {010}-LRAP(pS) and (D){010}-LRAP interfaces. Pair-wise LRAP intramolecular residue-residue contacts at the (B){010}-LRAP(pS) and (E) {010}-LRAP interfaces. Pair-wise residue-surface distances at the(C) {010}-LRAP(pS) and (F) {010}-LRAP interfaces. The structural designations “Helix”and “Turn” were assigned using the DSSP definitions49; classification relied on Rosetta'shydrogen-bond function rather than the generalized hydrogen-bond function implementedby the DSSP package. An intramolecular residue-residue contact is declared if two residueshave an inter-residue atomic pair within 4 Å. A residue-surface distance reflects the closestatomic contact for that residue and the closest surface atom. Note for comparing contactswith ssNMR measurements: the intra or intermolecular atomic pairs that constitute a contactare not necessarily the same atoms that were isotopically labeled for ssNMR measurements.
Masica et al. Page 21
J Phys Chem C Nanomater Interfaces. Author manuscript; available in PMC 2012 July 21.
NIH
-PA Author Manuscript
NIH
-PA Author Manuscript
NIH
-PA Author Manuscript

Figure 8. Phosphorylated LRAP bound to HAp {010} crystal face(A) Helix-turn-helix motif in LRAP's N-terminal domain is partially stabilized by ahydrophobic interaction between residues L20, L23 and Y26. Conformation-dependentdifferential HAp binding of charged residues in LRAP's C-terminal domain shown usingtwo representative models, (B) and (C). In (B), a partially unfolded structure facilitatingsimultaneous binding of K52, K54, R55, E57, and D59. In (C), a helical secondary structurefacilitating simultaneous binding of D51, K52, R55, and D59.
Masica et al. Page 22
J Phys Chem C Nanomater Interfaces. Author manuscript; available in PMC 2012 July 21.
NIH
-PA Author Manuscript
NIH
-PA Author Manuscript
NIH
-PA Author Manuscript

Figure 9. The molecular structure of phosphorylated LRAP adsorbed to HAp {010} surface(A) Representative structure determined with a weight w of 1 kcal/mol. Opacity representsLRAP's molecular shape, cartoons represent secondary structure. Predicted distancemeasurements at constrained atoms for the (B) N-terminal, (C) middle, and (D) C-terminaldomains. For comparison with ssNMR measurements see Table 1.
Masica et al. Page 23
J Phys Chem C Nanomater Interfaces. Author manuscript; available in PMC 2012 July 21.
NIH
-PA Author Manuscript
NIH
-PA Author Manuscript
NIH
-PA Author Manuscript
Figure 10. Local RMSD of a representative structure (Figure 9) relative to the 100 structureswith lowest constraint energyTo show the dispersion among structures, we superimposed the Cα atoms of everyoverlapping 3mer in the representative structure and each of the 100 structures with lowestEconstraint, and calculated the RMSD of the central Cα atom in the 3mer. The color bar is inangstroms and corresponds to the opaque profile defining LRAP's shape. LRAP picturedfrom C-terminus (left) to N-terminus (right).
Masica et al. Page 24
J Phys Chem C Nanomater Interfaces. Author manuscript; available in PMC 2012 July 21.
NIH
-PA Author Manuscript
NIH
-PA Author Manuscript
NIH
-PA Author Manuscript

NIH
-PA Author Manuscript
NIH
-PA Author Manuscript
NIH
-PA Author Manuscript
Masica et al. Page 25
Tabl
e 1
Com
paris
on o
f all
ssN
MR
mea
sure
men
ts, e
nsem
ble
stat
istic
s at t
he {
010}
-LR
AP(
pS) a
nd {
010}
-LR
AP
inte
rfac
es (F
igur
e 7)
, and
a re
pres
enta
tive
stru
ctur
e fr
om b
iase
d st
ruct
ure
pred
ictio
n at
the
{010
}-LR
AP(
pS) i
nter
face
.
Mea
sure
men
tL
abel
Dis
tanc
e of
f (Å
)D
ista
nce
on (Å
){0
10}-
LR
AP(
pS)
{010
}-L
RA
PR
ep. M
odel
Ref
.
G8-
Y12
(pS)
13C′-15
N5.
4 ±
0.5
6.1±
0.5
7.1±
1.4
Å (2
1)6.
2 Å
New
G8-
Y12
13C′-15
N6.
1 ±
0.5
5.5±
0.5
6.5±
1.1
Å (1
5)N
ew
L15-
V19
(pS)
13C′-15
N5.
9 ±
0.5
5.0±
0.5
5.2±
0.9
Å (3
7)5.
4 Å
New
L15-
V19
13C′-15
N5.
0 ±
0.5
4.9±
0.5
5.4±
0.9
Å (2
6)N
ew
V19
-L23
(pS)
13C′-15
N6.
1 ±
0.5
5.6±
0.5
5.5±
1.3
Å (2
0)4.
3 Å
New
V19
-L23
13C′-15
N6.
8 ±
0.5
5.6±
0.5
5.3±
1.0
Å (2
3)N
ew
K24
-S28
13C′-15
N4.
5 ±
0.5
5.7±
0.5
4.7±
1.0
Å (6
)4.
9±0.
9 Å
(13)
4.7
ÅN
ew
L42-
A46
13C′-15
N5.
3 ±
0.5
5.6±
0.5
6.1±
1.0
Å (3
0)6.
2±1.
0 Å
(31)
7.3Å
20
A49
-T53
13C′-15
N5.
9 ±
0.5
6.9±
1.0
5.8±
1.6
Å (3
1)6.
1±1.
7 Å
(39)
4.6
Å20
K54
-V58
13C′-15
N5.
5 ±
0.5
5.5±
0.5
5.1±
1.4
Å (1
5)5.
0±1.
1 Å
(16)
3.9
Å21
G8-
HA
p (p
S)13
C′-31
p9.
0 ±
0.5
6.5±
0.5
8.6±
1.6
Å (1
0)8.
1 Å
New
G8-
HA
p13
C′-31
p>1
2± 1
.08.
0±0.
59.
3±1.
5 Å
(15)
New
L15-
HA
p (p
S)13
C′-31
p6.
0 ±
0.5
5.3±
0.5
7.7±
1.3
Å (6
)8.
5 Å
New
L15-
HA
p13
C′-31
p>1
2 ±
1.0
9.0±
1.0
10.1
±2.0
Å (3
6)N
ew
V19
-HA
p (p
S)13
C′-31
p9.
0 ±
0.5
7.0±
0.5
8.9±
1.3
Å (1
0)7.
3 Å
New
V19
-HA
p13
C′-31
p>1
0± 1
.09.
0±1.
010
.6±2
.0 Å
(28)
New
K24
-HA
p13
C′-31
p>1
2± 1
.09.
0±1.
012
.3±2
.5 Å
(12)
12.4
±2.6
Å (1
7)8.
1 Å
New
A46
-HA
p13
Cβ -
31p
>12
± 1.
08.
0±0.
59.
5±1.
8 Å
(17)
9.2±
1.9
Å (1
7)8.
5Å20
K52
-HA
p15
Nζ -31
p>1
0 ±
1.0
4.0±
1.0
6.6±
3.0
Å (4
1)6.
4±2.
8Å (4
5)3.
9 Å
20
K54
-HA
p13
C′-31
p>1
2 ±
1.0
6.5±
0.5
8.7±
1.2
Å (8
)8.
6±0.
1 Å
(5)
9.7
Å21
V58
-HA
p13
C′-31
p>1
2 ±
1.0
5.8±
0.5
7.9±
1.3
Å (1
0)7.
5±1.
3 Å
(13)
7.4
Å21
The
resi
due
for w
hich
the
Mea
sure
men
t was
acq
uire
d, th
e pl
acem
ent o
f the
isot
opic
Lab
el, t
he e
xper
imen
tally
det
erm
ined
Dis
tanc
e of
f (Å
)(di
stan
ce to
nea
rest
31 P
for d
esor
bed
LRA
P) a
nd D
ista
nce
on (Å
)
(dis
tanc
e to
nea
rest
31 P
for a
dsor
bed
LRA
P), e
nsem
ble
stat
istic
s at t
he {
010}
-LRA
P(pS
) and
{01
0}-L
RAP
inte
rfac
es fr
om b
iase
d pr
edic
tions
with
a w
eigh
t w o
f 1 k
cal/m
ol (v
alue
s are
mea
n di
stan
ces f
rom
the
100
stru
ctur
es w
ith lo
wes
t Eco
nstra
int,
erro
rs a
re st
anda
rd d
evia
tion,
val
ues i
n pa
rent
hesi
s ind
icat
e nu
mbe
r of s
truct
ures
from
the
100
stru
ctur
es w
ith lo
wes
t Eco
nstra
int t
hat m
et th
e m
easu
rem
ent
with
in e
xper
imen
tal e
rror
), an
d co
rres
pond
ing
pred
ictio
n fr
om a
repr
esen
tativ
e m
odel
(Rep
. Mod
el) a
t the
{01
0}-L
RA
P(pS
) int
erfa
ce. M
easu
rem
ents
mad
e fo
r des
orbe
d H
Ap
(Dis
tanc
e of
f) ar
e to
ens
ure
that
sign
al in
the
adso
rbed
stat
e (D
ista
nce
on) a
rise
from
HA
p-in
corp
orat
ed 3
1 P. T
he p
rimar
y st
ruct
ure
of L
RA
P(pS
) is:
MPL
PPH
PGSP
GY
INL
pSY
EV
LT
PLK
WY
QSM
IRQ
PPL
SPIL
PEL
PLE
AW
PAT
DK
TK
RE
EV
D
J Phys Chem C Nanomater Interfaces. Author manuscript; available in PMC 2012 July 21.
Copyright © 2022 FDOKUMEN