
Surface-enhanced Raman spectra of magnetic nanoparticles adsorbed on a silver electrode
9
This article was originally published in a journal published by Elsevier, and the attached copy is provided by Elsevier for the author’s benefit and for the benefit of the author’s institution, for non-commercial research and educational use including without limitation use in instruction at your institution, sending it to specific colleagues that you know, and providing a copy to your institution’s administrator. All other uses, reproduction and distribution, including without limitation commercial reprints, selling or licensing copies or access, or posting on open internet sites, your personal or institution’s website or repository, are prohibited. For exceptions, permission may be sought for such use through Elsevier’s permissions site at: http://www.elsevier.com/locate/permissionusematerial
Transcript of Surface-enhanced Raman spectra of magnetic nanoparticles adsorbed on a silver electrode

This article was originally published in a journal published byElsevier, and the attached copy is provided by Elsevier for the
author’s benefit and for the benefit of the author’s institution, fornon-commercial research and educational use including without
limitation use in instruction at your institution, sending it to specificcolleagues that you know, and providing a copy to your institution’s
administrator.
All other uses, reproduction and distribution, including withoutlimitation commercial reprints, selling or licensing copies or access,
or posting on open internet sites, your personal or institution’swebsite or repository, are prohibited. For exceptions, permission
may be sought for such use through Elsevier’s permissions site at:
http://www.elsevier.com/locate/permissionusematerial

Autho
r's
pers
onal
co
py
Surface-enhanced Raman spectra of magnetic nanoparticlesadsorbed on a silver electrode
Guilherme V.M. Jacintho a, Paola Corio b, Joel C. Rubim a,*
a Laboratorio de Materiais e Combustıveis (LMC), Instituto de Quımica da Universidade de Brasılia, CP 04478, 70919-970 Brasılia, DF, Brazilb Instituto de Quımica da Universidade de Sao Paulo, CP 26.077, 05513-970 Sao Paulo, SP, Brazil
Received 21 June 2006; received in revised form 30 January 2007; accepted 5 February 2007Available online 22 February 2007
This work is dedicated to the 80th anniversary of Professor Oswaldo Sala
Abstract
Maghemite (c-Fe2O3) nanoparticles dispersed in water and forming a magnetic fluid (MF) were characterized by Raman and FT-NIRspectroscopy and were also investigated by surface-enhanced Raman spectroscopy (SERS) and cyclic voltammetry (CV). The FT-NIRresults have shown that magnetite (Fe3O4) is not present on the particle as proposed by other investigators. The SER spectra and CVsresults have shown that the MF nanoparticles adsorbed on the Ag electrode undergo four reduction processes. At �0.14 V, a positivelycharged non-stoichiometric Fe(III) oxy-hydroxide surface layer is reduced to Fe3O4. At �0.62 and �0.88 V, d-FeOOH and c-Fe2O3,respectively, are reduced to Fe3O4. Finally, at potentials more negative than �1.1 V, Fe3O4 formed in the previous processes is reducedto Fe0. In the reverse voltammetric scan the SERS spectra are quite different showing that the process is irreversible, since during oxi-dation of the film Fe(OH)2 and Fe(OH)3 have also been characterized. The SERS and electrochemical results lead us to conclude that thenanoparticles are composed of a c-Fe2O3 (maghemite) nuclei that present a surface layer containing d-FeOOH and a positively chargednon-stoichiometric Fe(III) oxy-hydroxide surface layer.� 2007 Elsevier B.V. All rights reserved.
Keywords: SERS; Magnetic nanoparticles; Magnetic fluid; Silver electrode; Ferrofluid
1. Introduction
Magnetic iron oxide particles forming relatively stablecolloids were first obtained by Elmore [1]. In our days,water suspensions of magnetic particles, e.g. magnetite(Fe3O4), having diameters in the nanometric scale areknown as magnetic fluids (MFs) or ferrofluids (see Ref.[2] and references therein). In the last decade MFs havebeen used in several fields, especially in medicine and bio-sciences [3–8]. To design magnetic target carriers basedon MFs it is very important to know the chemical compo-sition of the iron oxide particles as well as their surfacestructure and composition.
Several groups have tried to use Raman spectroscopy toinvestigate the chemical structure of magnetic nanoparti-cles and the majority of the work was done using waterbased magnetic fluids [9–20]. However, Raman scatteringis a very weak process, with molecular cross sections rang-ing from 10�29 to 10�32 cm2 [21]. Therefore, the Ramanspectra of magnetic nanoparticles give information on thechemical species present in the bulk of the nanoparticle.Raman signals from species at the nanoparticle surfaceare quite difficult to be obtained. The majority of the workswith this goal was done using water based MF and focusedthe attention on the OH stretching and bending vibrations[9,10,13–15,19]. The main problem in this approach is thesolvent (water) that is at a much higher concentration thanthe species present in the nanoparticle surface. The firstreport on the characterization of a chemical species (differ-ent from OH) adsorbed on the surface of water based
0022-0728/$ - see front matter � 2007 Elsevier B.V. All rights reserved.
doi:10.1016/j.jelechem.2007.02.019
* Corresponding author.E-mail address: [email protected] (J.C. Rubim).
www.elsevier.com/locate/jelechem
Journal of Electroanalytical Chemistry 603 (2007) 27–34
Journal ofElectroanalytical
Chemistry
Autho
r's
pers
onal
co
py
maghemite nanoparticles was done by Souza et al. [12].They have observed the CH stretching mode of maghemiteparticles modified by aspartic and glutamic acids.
One way to get the Raman spectra of species at low con-centration is through the use of the resonance Raman effectthat can led to an enhancement of Raman intensities of 3–6orders of magnitude when the laser excitation matches theenergy of an allowed electronic transition of the target mol-ecule. In this sense, the adsorption of methylene blue [12]and tetrasulfonated zinc phthalocyanine [17] on maghemitesurfaces was characterized by resonance Raman scattering.
Using normal Raman scattering, Souza et al. [11] haveproposed that the surface of the maghemite nanoparticlescontains Fe(III) hydroxides or oxy-hydroxides. The featurenear 720 cm�1 was obtained by spectral subtraction and isattributed to the presence of such species. Chourpa et al.[20] have obtained Raman spectra of different maghemitesamples and claimed that none of their samples could berepresentative of a pure maghemite sample, since theyfound experimental evidences for the presence of maghe-mite and magnetite in all investigated samples. Their con-clusion was based on the fact that the intensity ratiobetween the features near 662 and 713 cm�1 varied fromsample to sample. They did not considered that the changesin the 713/662 intensity ratio could be a result of changes inthe surface concentration of Fe(III) hydroxides from sam-ple to sample. Further, these authors claimed that theyhave not found any experimental evidence for the presenceof Fe(III) hydroxides or oxy-hydroxides.
Dubois et al. [22] have investigated the voltammetricbehavior of maghemite nanoparticles dispersed in a pH13 solution of tetramethylamonium hydroxide using a Hgworking electrode. These authors have observed only tworeduction waves in the first cathodic scan, at �1.45 and�1.8 V (vs SCE). They have assigned these reduction wavesto the reduction of maghemite (c-Fe2O3) to magnetite(Fe3O4) and to the reduction of Fe3O4 to Fe0, respectively.According to these results only two species are expected tobe present on the maghemite structure. However, theirresults do not permit to conclude that the maghemite nano-particles they used were pure maghemite or a mixture ofmaghemite and magnetite as proposed by Chourpa et al.[20].
The different achievements of Souza et al. [11] andChoupra et al. [20] regarding to the presence of Fe(III)oxy-hydroxides (or hydroxides) on the maghemite surfaceas well as the above electrochemical results of Duboiset al. [22] strongly supports the idea that the investigationof the maghemite nanoparticles surface composition stilldeserves further experimental work.
It is well known that surface-enhanced Raman scatter-ing (SERS) is a powerful tool in the characterization ofchemical species adsorbed on SERS-active substrates(mainly Ag, Cu, and Au, for reviews see Refs. [21,23–26]). SERS combined to resonance Raman effect can pro-vide enhancement factors of 1014 making possible thedetection of molecules at trace levels or even a single mol-
ecule [26,27]. SERS is also useful to monitor the electro-chemical oxidation or reduction of species at electrode/electrolyte interfaces [28–30]. In this sense, we proposethe use of electrochemical SERS, i.e., SERS on a silver elec-trode, to investigate the chemical composition of maghe-mite nanoparticles. The strategy in this case will be torecord SERS spectra at different potentials applied to aSERS-active silver electrode to characterize the differentchemical species present on the maghemite nanoparticle.We believe that through the SERS effect it will be possibleto obtain information on the species present at the maghe-mite surface. This study will be conducted in 0.1 mol L�1
KCl solution.Differently from maghemite, magnetite absorbs light in
the near infrared (NIR) region at ca. 1400 nm [31,32].Inaba et al. [31] have observed that a Fe3O4 magnetic fluidpresent an absorption near 1400 nm and assigned thisabsorption to the excitation of the 3d6! 3d54s1 orbitaltransition process of Fe2+ in the Fe3O4 particle while others[32] have assigned this absorption to an intervalence(Fe2+! Fe3+) charge transfer process. Therefore, thisNIR optical absorption can be used to distinguish amongmagnetite and maghemite as it was already done by Tanget al. [32]. As further supports to the discussion regardingto the composition of maghemite nanoparticles we will alsomake use of FT-NIR spectroscopy. This experiment willhelp to answer the following question: do maghemite par-ticles prepared according to the method used in the presentwork contain magnetite in their composition?
2. Experimental
Iron oxide nanoparticles were synthesized by the copre-cipitation method as reported in the literature [33]. An acidsolution of FeSO4 Æ 7H2O (0.09 mol L�1) and FeCl3 Æ 6H2O(0.18 mol L�1) salts in deaerated distilled water was quicklyadded to a basic solution of NaOH 1.5 mol L�1 at 60 �Cand under vigorous stirring. The black precipitate (magne-tite) formed was washed several times until the pH 8 wasreached. The precipitate containing the nanoparaticleswas then submitted to a surface treatment as described inthe literature [34]: a 2 mol L�1 HNO3 solution was addedto the precipitate and kept at rest overnight (12 h). Thesupernatant liquid was removed and the precipitate waskept boiling for half an hour in a 0.5 mol L�1 Fe(NO3)3
solution. Then the precipitate was washed twice with ace-tone and the pH adjusted around 7 (point of zero charge,PZC) with a 0.5 mol L�1 (CH3)4NOH solution. At thePZC particles were coagulated and the resulting precipitatewas washed several times to remove the excess of ions.Finally, the pH was adjusted to 2 with HNO3 and a stableaqueous maghemite magnetic fluid was obtained. The totaliron concentration in the MF is 0.5 mol L�1. This MFstock solution was used in all experiments.
The Raman and SERS spectra were acquired on a Ren-ishaw Raman System 3000 equipped with an Olympusmicroscope (BTH2) with a 50· objective to focus the laser
28 G.V.M. Jacintho et al. / Journal of Electroanalytical Chemistry 603 (2007) 27–34
Autho
r's
pers
onal
co
py
beam on the sample. The spectra were excited by the 632.8nm line from an air cooled He/Ne laser (Spectra Physics).The spectral resolution was 6 cm�1. We have used threedifferent laser powers measured just before the sample: (i)in the Raman spectrum of maghemite as a powder we haveused 0.5 mW to avoid sample decomposition [35]; (ii) forthe maghemite MF (solution) in a sealed capillary the laserpower was adjusted to 5 mW – increasing or decreasing thelaser power does not cause changes in the Raman spec-trum; (iii) in the SERS measurements we have used5 mW – in this case, an increase in the laser power causeschanges in the spectra.
The SERS substrate (working electrode) was made froma silver rod (99.999%) with 0.2 cm2 of geometrical areainserted in polytetrafluorethylene. All the potentials arereferred to an Ag/AgCl reference electrode. The electro-chemical system used in the SERS measurements was aPAR 263 potentiostat/galvanostat from EG&G and theone used in the cyclic voltammetry (CV) experiments wasa MQPG-01 from Microquimica. In all experiments thetemperature was kept constant at 22 ± 1 �C.
The FT-NIR spectra were obtained on a Equinox 55spectrometer from Bruker equipped with an optical fiberaccessory coupled to a Ge detector. The nominal resolutionwas set to 8 cm�1 and each spectrum is the average of 32interferograms.
The transmission electron microscopic (TEM) images ofthe nanomagnetic particles were obtained on a Jeol JEM1011 transmission electron microscope.
3. Results and discussion
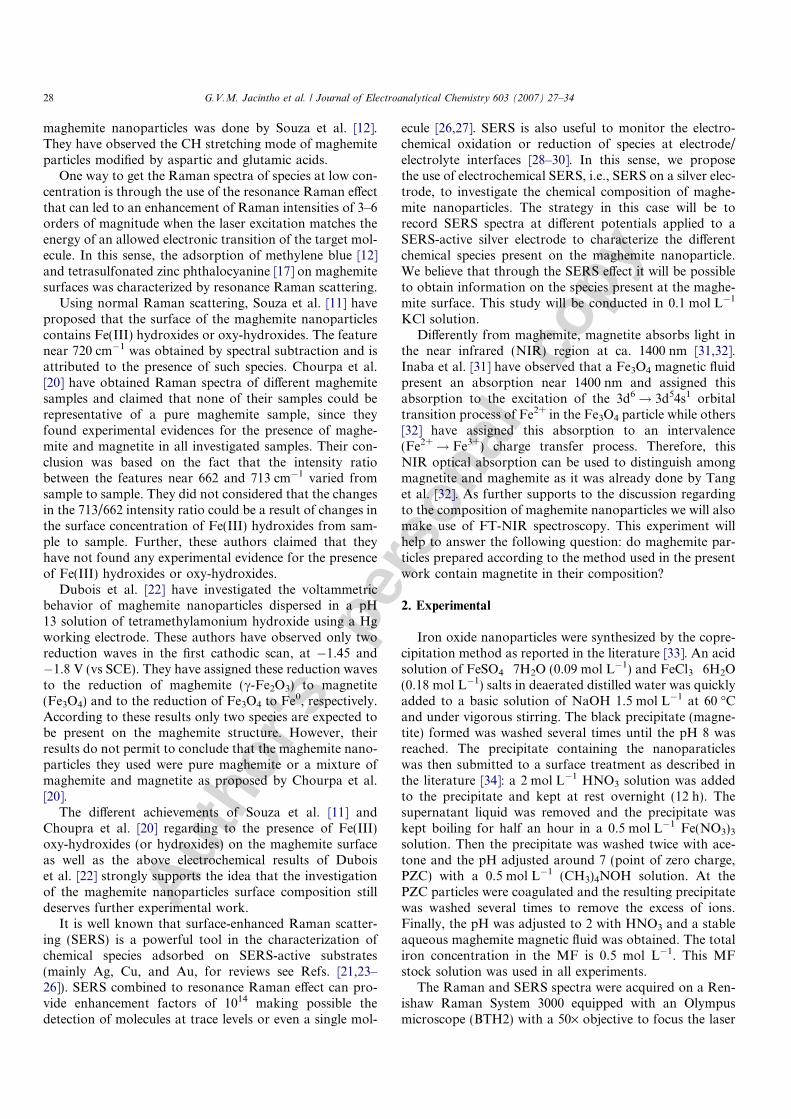
The Raman spectra of the maghemite MF in the solid(powder) and solution phases are presented in Fig. 1. Thefeatures at 1048 and 1624 cm�1 are due to NO�3 and water,respectively, while all the other Raman features are charac-teristic of maghemite [11,35]. The weak feature at ca.
190 cm�1 was also observed in the Raman spectrum ofpolycrystalline maghemite samples as it can be seen inFig. 1b of Ref. [35].
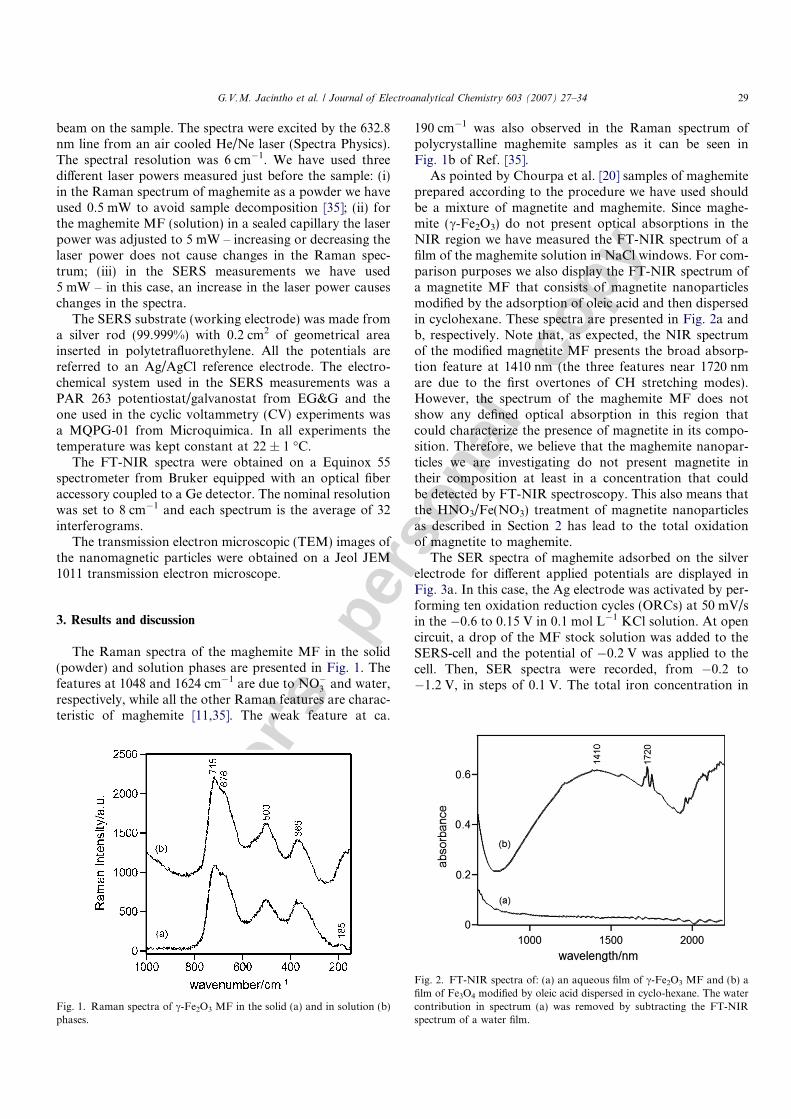
As pointed by Chourpa et al. [20] samples of maghemiteprepared according to the procedure we have used shouldbe a mixture of magnetite and maghemite. Since maghe-mite (c-Fe2O3) do not present optical absorptions in theNIR region we have measured the FT-NIR spectrum of afilm of the maghemite solution in NaCl windows. For com-parison purposes we also display the FT-NIR spectrum ofa magnetite MF that consists of magnetite nanoparticlesmodified by the adsorption of oleic acid and then dispersedin cyclohexane. These spectra are presented in Fig. 2a andb, respectively. Note that, as expected, the NIR spectrumof the modified magnetite MF presents the broad absorp-tion feature at 1410 nm (the three features near 1720 nmare due to the first overtones of CH stretching modes).However, the spectrum of the maghemite MF does notshow any defined optical absorption in this region thatcould characterize the presence of magnetite in its compo-sition. Therefore, we believe that the maghemite nanopar-ticles we are investigating do not present magnetite intheir composition at least in a concentration that couldbe detected by FT-NIR spectroscopy. This also means thatthe HNO3/Fe(NO3) treatment of magnetite nanoparticlesas described in Section 2 has lead to the total oxidationof magnetite to maghemite.
The SER spectra of maghemite adsorbed on the silverelectrode for different applied potentials are displayed inFig. 3a. In this case, the Ag electrode was activated by per-forming ten oxidation reduction cycles (ORCs) at 50 mV/sin the �0.6 to 0.15 V in 0.1 mol L�1 KCl solution. At opencircuit, a drop of the MF stock solution was added to theSERS-cell and the potential of �0.2 V was applied to thecell. Then, SER spectra were recorded, from �0.2 to�1.2 V, in steps of 0.1 V. The total iron concentration in
Fig. 1. Raman spectra of c-Fe2O3 MF in the solid (a) and in solution (b)phases.
Fig. 2. FT-NIR spectra of: (a) an aqueous film of c-Fe2O3 MF and (b) afilm of Fe3O4 modified by oleic acid dispersed in cyclo-hexane. The watercontribution in spectrum (a) was removed by subtracting the FT-NIRspectrum of a water film.
G.V.M. Jacintho et al. / Journal of Electroanalytical Chemistry 603 (2007) 27–34 29

Autho
r's
pers
onal
co
py
the SERS-cell was ca. 0.05 mol L�1. It is worth to mentionthat at the ionic strength corresponding to 0.1 mol L�1 KClpart of the particles have coagulated. However, some par-ticles remained in solution since it becomes pale yellow.Fig. 4 displays a TEM image of the working solution con-taining the maghemite particles in the KCl solution. Thismicrograph shows that maghemite particles with diametersin the range of 10–20 nm are still present in the KClsolution.
The SERS spectrum recorded at �0.2 V shows a Ramanfeature at 230 cm�1 that is not observed in the Ramanspectrum of maghemite. Since the measurements are per-formed in KCl 0.1 mol L�1, we believe that this feature isdue to the Ag–Cl stretching mode, characterizing the pres-ence of adsorbed chloride. Indeed, this feature disappearsas the potential is made more negative.
The results of Fig. 3a also show that at more negativepotentials, the features characteristic of maghemitedecrease in intensity and the half width at half maximum(fwhm) value of the broad signal centered at ca.700 cm�1 becomes smaller. Note also that the shouldernear 712 cm�1 (at �0.4 V) has practically disappeared at�0.9 V. At this potential the main observed Raman featureis centered at 671 cm�1 with a fwhm value of 60 cm�1,compatible with the value expected for magnetite [35–37].
There are some Raman spectra of magnetite reported inthe literature that present a feature near 180 cm�1 [35–37].However, as mentioned above, a feature near 190 cm�1 isalso observed in the Raman spectrum of maghemite (seeFig. 1 above and Refs. [11,20,35]). Therefore, we believethat the weak feature observed near 180 cm�1 is due tomaghemite. As demonstrated above (Fig. 2), the maghe-mite sample used in these experiments does not containmagnetite in its structure.
Due to maghemite particle flocculation, we believe thatmaghemite was depositing on the Ag surface causing adeterioration of the signal-to-noise ratio. This hypothesiswill be strengthened in the next experiment. To avoid floc-culation during the experiment, we have adopted a differentprocedure. First, the Ag electrode was activated by per-forming ORCs in a 0.1 mol L�1 KCl aqueous solution.Then the electrode was removed from the SERS-cell andthe Ag surface was exposed to a drop of the maghemiteMF solution for 60 s. After that, the electrode was thor-oughly washed with double distilled water and transferredback to the SERS-cell. Afterward, SERS spectra wererecorded from 0.0 to �1.2 V in steps of �0.1 V. TheseSERS spectra are displayed in Fig. 3b.
The broad SERS features near 365 and 500 cm�1
observed at the potential of 0.0 V in Fig. 3b are character-istic of maghemite. However, the two features near700 cm�1 are better defined than in the maghemite spectraof Fig. 1. At 0.0 V, the SERS feature at 712 cm�1 is sepa-rated from the other broad feature that appears at662 cm�1. At �0.3 V the intensity at 712 cm�1 has
Fig. 3. (a) SER spectra of c-Fe2O3 MF adsorbed on a silver electrode at the indicated potentials; (b) SER spectra of a MF film formed on the Ag electrodesurface (see text for details).
Fig. 4. TEM images of the maghemite nanoparticles dispersed in0.1 mol L�1 KCl solution.
30 G.V.M. Jacintho et al. / Journal of Electroanalytical Chemistry 603 (2007) 27–34
Autho
r's
pers
onal
co
py
decreased and the separation between the features aboveand below 700 cm�1 is no longer defined. For potentialsmore negative than �0.5 V the broad features characteris-tic of maghemite appearing below 600 cm�1 became almostindistinguishable. It is well known that d-FeOOH presentstwo broad features centered at 663 and 400 cm�1 withalmost the same intensity [35,38]. We believe that the pres-ence of d-FeOOH in the maghemite surface is responsiblefor the fact that the broad features of maghemite below600 cm�1 are not well defined in Fig. 3b.
For potentials more negative, e.g. �0.9 V, the shouldernear 700 cm�1 is no longer observed and a feature centeredat 671 cm�1 presents a fwhm value of 59 cm�1. These val-ues are compatible with those expected for Fe3O4. Thisresult suggests that maghemite and d-FeOOH were reducedto magnetite. At �1.2 V the intensity of the 671 cm�1 sig-nal decreases considerably indicating that magnetite isreduced at this potential.
It is worth to mention that the SERS intensity of themagnetite feature (at 671 cm�1) at �0.9 V in Fig. 3b isalmost three times as intense as in Fig. 3a. This result sup-ports our conclusion that in the first SERS experiment,Fig. 3a, the nanoparticles were depositing on the electrodesurface. The highest SERS enhancement factors areexpected for the species just in contact (first layer) withthe silver SERS-active sites [23,26]. If a thick film is cover-ing the species directly in contact to the Ag surface, lessexciting photons achieve the SERS-active site, causing adeterioration of the SERS signal from the first layer. Thiskind of behavior was already observed in the SERS studyof brass passivation by benzotriazole [39]. In that experi-ment the passive film growing process was monitored withtwo different laser radiations, at 514.5 and 647.1 nm. Thethicker was the passive film the more intense was the pas-sive film normal Raman signals at 514.5 nm excitation,while the SERS intensity of the first layer of the passivefilm decreased at 674.1 nm excitation.
One could argue, as did one of the reviewers, that in thecase of Fig. 3b we are not observing the SERS spectrarather the normal Raman spectra of a maghemite thickfilm. To verify this hypothesis we have recorded the Raman
spectrum of a Pt electrode in KCl solution at open circuitcondition. After that, the electrode was removed from thesolution and exposed to a drop of maghemite solutionfor 60 s. Then, the Pt electrode was thoroughly washedwith double distilled water and transferred back to theSERS-cell and another Raman spectrum was recorded. Inthis case we have just observed an increase in the back-ground intensity but no Raman signal from maghemite(see supporting information). Therefore, the spectra dis-played in Fig. 3b are surface-enhanced.
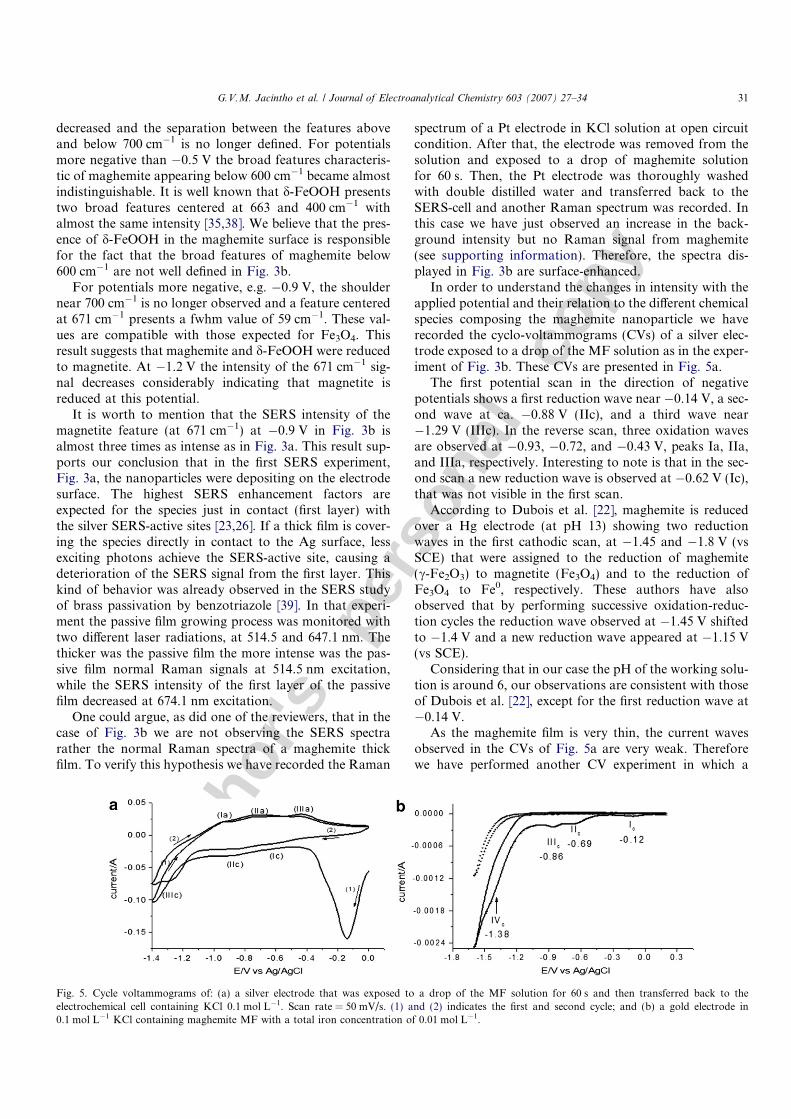
In order to understand the changes in intensity with theapplied potential and their relation to the different chemicalspecies composing the maghemite nanoparticle we haverecorded the cyclo-voltammograms (CVs) of a silver elec-trode exposed to a drop of the MF solution as in the exper-iment of Fig. 3b. These CVs are presented in Fig. 5a.
The first potential scan in the direction of negativepotentials shows a first reduction wave near �0.14 V, a sec-ond wave at ca. �0.88 V (IIc), and a third wave near�1.29 V (IIIc). In the reverse scan, three oxidation wavesare observed at �0.93, �0.72, and �0.43 V, peaks Ia, IIa,and IIIa, respectively. Interesting to note is that in the sec-ond scan a new reduction wave is observed at �0.62 V (Ic),that was not visible in the first scan.
According to Dubois et al. [22], maghemite is reducedover a Hg electrode (at pH 13) showing two reductionwaves in the first cathodic scan, at �1.45 and �1.8 V (vsSCE) that were assigned to the reduction of maghemite(c-Fe2O3) to magnetite (Fe3O4) and to the reduction ofFe3O4 to Fe0, respectively. These authors have alsoobserved that by performing successive oxidation-reduc-tion cycles the reduction wave observed at �1.45 V shiftedto �1.4 V and a new reduction wave appeared at �1.15 V(vs SCE).
Considering that in our case the pH of the working solu-tion is around 6, our observations are consistent with thoseof Dubois et al. [22], except for the first reduction wave at�0.14 V.
As the maghemite film is very thin, the current wavesobserved in the CVs of Fig. 5a are very weak. Thereforewe have performed another CV experiment in which a
Fig. 5. Cycle voltammograms of: (a) a silver electrode that was exposed to a drop of the MF solution for 60 s and then transferred back to theelectrochemical cell containing KCl 0.1 mol L�1. Scan rate = 50 mV/s. (1) and (2) indicates the first and second cycle; and (b) a gold electrode in0.1 mol L�1 KCl containing maghemite MF with a total iron concentration of 0.01 mol L�1.
G.V.M. Jacintho et al. / Journal of Electroanalytical Chemistry 603 (2007) 27–34 31

Autho
r's
pers
onal
co
py
Au electrode was used instead of Ag, and maghemite nano-particles were present in solution. Fig. 5b shows the CVs ofa gold electrode in 0.1 mol L�1 KCl solution prior andafter the addition of maghemite MF to the working solu-tion. The first reduction wave at �0.12 V is similar to theone observed for the silver electrode at �0.14 V. Therefore,we believe that at the silver electrode this reduction wavehas two sources: (i) the reduction of an Ag–Cl layer and(ii) the reduction of a Fe(III) species to an Fe(II) contain-ing species. We suggest that this first reduction process isdue to the following reaction:
3FeOx(OH)3�2x (x< 1) + Hþ+ e!Fe3O4 + (5�3x)H2O
ð1Þ
The non-stoichiometric oxy-hydroxide is then character-ized by the SERS feature at 712 cm�1. We do not believethat this species is reduced to Fe(OH)2 since the SERSspectrum at �0.3 does not show the broad Raman featurecharacteristic of Fe(OH)2 at ca. 535 cm�1 [40–43]. Further,when we fit this spectrum to a Lorentzian function, we findamong others a Raman signal at 671 cm�1 with a fwhm ofca. 60 cm�1 that is characteristic of magnetite (Fe3O4). It isworth to mention that Cepria et al. [44] have investigatedthe electrochemical behavior of maghemite microparticlesimmobilized in paraffin covered pyrolytic graphite elec-trodes. Their voltammetric results were obtained in0.5 mol L�1 HCl solution and show reduction processesat ca.�0.03 and �0.51 V vs Ag/AgCl/KClsat. Cepriaet al. [44] have interpreted theses processes as due to thereduction of a Fe(III) species do Fe(II) and to the reduc-tion of c-Fe2O3 to FeO, respectively. We agree that the firstprocess does involve an Fe(III) species as discussed above.However, we have not found evidences for the formation ofFeO that presents a Raman signal at 652 cm�1 [35]. Onecould argue that this reduction process could be due toFe(III) hydrated chloride species. As observed by Domen-ech et al. [45] such species present a well-defined reductionpeak at +0.25 V for a glassy carbon electrode in a 5 · 10�4
mol L�1 solution of FeCl3 Æ 6 H2O in 0.01 mol L�1 HCland 0.10 mol L�1 NaCl. Therefore, we can conclude thatsuch species is not present in the electrode surface. Proba-bly, the non-stoichiometric oxy-hydroxide is protonated,i.e., positively charged, and interacts with the silver surfacethrough the adsorbed chloride, characterized by the SERSfeature near 225 cm�1.
The CV of Fig. 5b shows other three reduction waves, at�0.69, �0.86, and �1.38 V, in a sequence similar to thethree cathodic peaks observed in Fig. 5a for the silver elec-trode. The reduction wave at �0.86 V on Au correspondsto the one observed at �0.88 V for the Ag electrode andthe cathodic current at this potential is attributed to thereaction:
3c-Fe2O3 + 2Hþ+ e�! 2Fe3O4 + H2O ð2Þ
This reduction process is similar to the one observed byDubois et al. [22] for the Hg electrode at the potential of
�1.45 V and pH 13. At 0.5 mol L�1 HCl (pH 0), maghe-mite microparticles reduce at �0.51 V (vs Ag/AgCl) [44].Further, it was also observed that the reduction potentialof the Fe(III) oxide microparticles follows the linear rela-tionship: �0.5 to 0.05 pH and that it also depends on thecomplexing capability of the supporting electrolyte anion[44]. Therefore, the differences in the reduction potentialsof maghemite in relation to those presented in the literature[22,44] are due to differences in pH and type of supportingelectrolyte.
The reduction waves at �1.38 and �1.29 V for Au andAg, respectively, corresponds to the reduction of magnetiteto Fe0 according to the following reaction:
Fe3O4 + 8Hþ+ 8e�! 3Fe0 + H2O ð3Þ
This reaction was observed by Dubois et al. [22] at �1.8 V.The reduction of magnetite at these potentials is evidencedby the decrease in the intensity of the 671 cm�1
(fwhm = 56 cm�1) SERS feature at the potential of �1.2 V.As mentioned above, the cathodic peak Ic, observed in
Fig. 5a and b at �0.62 and �0.68 V, respectively, was alsoobserved by Dubois et al. [22] at �1.15 V. However, thiscathodic wave is not apparent in the first scan of Fig. 5anor in the first scan in the experiment of Dubois et al.[22] with the Hg electrode. However, this reduction peakis well defined in the CV of Au in the first scan. We tenta-tively assign this cathodic current peak to the reduction ofanother oxy-hydroxide species present on the nanoparticlesurface, probably the d-FeOOH, according to the reaction:
3d-FeOOH + Hþ+ e�!Fe3O4 + 2H2O ð4Þ
In order to understand the origin of this reduction pro-cess we have investigated the SERS spectra during the ano-dic scan of the maghemite film experiment correspondingto the Ag CV displayed in Fig. 5a. In the anodic scan, from�1.2 to 0.0 V, we have observed three oxidation waves andthe corresponding SERS spectra are displayed in Fig. 6a.Note that at �0.8 V the feature at ca. 669 cm�1 broadensand a broad feature in the 400–550 cm�1 range emerges.At less negative potentials the peaks become more definedand at �0.4 V we see a feature centered near 664 cm�1
(fwhm = 100 cm�1) and another broad feature at534 cm�1. At these potentials the Fe0 formed upon reduc-tion of the adsorbed magnetic particles was oxidized toFe(OH)2 and d-FeOOH, characterized by the features at534 and 664 cm�1, respectively [38–41]. The presence ofmagnetite can not be disregarded since the following reac-tion can occur [46]:
Fe(OH)2 + 2d-FeOOH!Fe3O4 + 2H2O ð5Þ
As the potential is made less negative (e.g. 0.0 V) the664 cm�1 feature increases in intensity in relation to thefeature at 534 cm�1, indicating that the Fe(OH)2 is furtheroxidized to d-FeOOH.
After the spectrum at 0.0 V of Fig. 6a was recorded theelectrode potential was scanned from 0.0 to 0.15 V andback to �0.2 V at 50 mV/s. Then, SERS spectra were
32 G.V.M. Jacintho et al. / Journal of Electroanalytical Chemistry 603 (2007) 27–34

Autho
r's
pers
onal
co
py
recorded at different potentials, from �0.2 to �1.2 V.These spectra are displayed in Fig. 6b. The feature at ca.224 cm�1 is due to the Ag–Cl vibration. The broad featureat 534 cm�1 is due to Fe(OH)2 and the signal at 664 cm�1 isassigned to d-FeOOH. The shoulder near 705 cm�1 can notbe assigned to the non-stoichiometric oxi-hydroxide, sincethe reduction wave characteristic of this species, at�0.14 V, is not observed in the second scan of the CV inFig. 5a. The SERS spectrum of Fig. 6b recorded at�0.2 V was submitted to a curve fitting procedure (see Sup-porting information, Fig. 1S). The fitted spectrum shows afeature at 705 cm�1 that is assigned to Fe(OH)3, two broadfeatures at 663 and 420 cm�1 that are assigned to d-FeOOH, and another broad feature at 534 cm�1 that isdue to Fe(OH)2. As the potential is made more negative,Fe(OH)3 and d-FeOOH are reduced to Fe(OH)2 andFe3O4 [38]. Note that at the potential of �0.6 V theFe(OH)2 characteristic Raman signal at 534 cm�1 presentsits highest intensity. Therefore, we attribute the cathodicpeak Ic, at �0.62 V to the reduction of d-FeOOH. SinceFe(OH)3 has a broad Raman signal near 700 cm�1 [47], thisspecies may also be present. We can not rule out the pres-ence of these species on the maghemite nanoparticles sur-face since this cathodic wave was also observed in the CVof Au with maghemite MF in solution as in Fig. 5b. Thiscathodic wave is not seen in the first scan of the Ag CVof Fig. 5a due to the very low surface concentration of d-FeOOH. This can also be the reason why Dubois et al.[22] have also not seen this cathodic wave in their experi-ment at the first scan.
The results of Fig. 6b also show that as the potential ismade more negative, the Fe(OH)2 peak disappears remain-ing a Raman feature at ca. 669 cm�1 with a fwhm of ca.60 cm�1, characterizing the formation of Fe3O4 that canbe formed as a reduction product of Fe(III) hydroxidesor oxy-hydroxide and due to reaction (5).
It is worth to mention that the SERS spectra of the filmat potentials less negative than �0.4 V (Fig. 6a and b) are
quite different from those observed in Fig. 3b at the samepotentials. These results clearly show that the reductionprocess of nanoparticles adsorbed on the silver surfaceforming the film is not reversible. At the beginning, i.e.,before reduction, the film consists of nanoparticles com-posed of c-Fe2O3 and a surface layer composed of d-FeOOH, probably Fe(OH)3, and a non-stoichiometricoxy-hydroxide positively charged as depicted in the sche-matic picture of Fig. 7. At �0.14 V the non-stoichiometricoxy-hydroxide is reduced to magnetite. For potentialsmore negative than �0.2 V, d-FeOOH and Fe(OH)3 arereduced to magnetite. Finally, for potentials more negativethan �1.2 V the magnetite film is reduced to Fe0 and itsfurther oxidation leads to the formation of Fe3O4, d-FeOOH, Fe(OH)3 and Fe(OH)2 but no evidence is foundfor the formation of c-Fe2O3.
4. Conclusion
The results presented in this work have clearly shownthat the nanoparticles of maghemite based MF preparedaccording to the method described in Ref. [34] do not con-tain magnetite (Fe3O4) in their composition. We have also
Fig. 6. SER spectra of maghemite nanoparticles adsorbed on a silver electrode at the indicated potentials. The SERS spectra were recorded: (a) in thepositive scan of electrode potentials and (b) in the negative scan, after a previous SERS activation procedure corresponding to varying the appliedpotential up to 0.15 V (silver oxidation) and then returning to �0.2 V.
Fig. 7. Schematic picture of the maghemite particle adsorbed at the Agelectrode surface.
G.V.M. Jacintho et al. / Journal of Electroanalytical Chemistry 603 (2007) 27–34 33

Autho
r's
pers
onal
co
py
shown that the SERS effect on electrodes can be used tocharacterize the different species present on the maghemitesurface. The SERS and electrochemical measurementspresent evidences that the magnetic nanoparticles investi-gated in this work are composed by:
(i) A nuclei of c-Fe2O3, characterized by a broad SERSfeatures near 700 (composed by a peak at 662 and ashoulder at �710 cm�1), 500, and 365 cm�1. The c-Fe2O3 is reduced to Fe3O4 near �0.9 V.
(ii) A surface layer containing a non-stoichiometricoxy-hydroxide characterized by a SERS feature at712 cm�1, that is reduced to Fe3O4 at �0.14 V. Thesurface layer also contain d-FeOOH, characterizedby two broad (fwhm � 100 cm�1) features at 663and 410–420 cm�1 and may also contain Fe(OH)3.These latter two species are reduced to Fe3O4 near�0.6 V. The presence of magnetite was detected onlyupon reduction of the Fe(III) species present on themaghemite nanoparticle. Its characteristic SERS sig-nal was observed at ca. 671 cm�1 (fwhm � 60 cm�1)and its reduction to Fe0 was observed for potentialsmore negative than �1.0 V.
Acknowledgements
The authors thank CNPq, FAPDF, FINATEC, andFAPESP for research grants. G.V.M.J. thanks CAPESand P.C., PAZS, and J.C.R. thank CNPq for researchfellowships.
Appendix A. Supplementary data
Supplementary data associated with this article can befound, in the online version, at doi:10.1016/j.jelechem.2007.02.019.
References
[1] W.C. Elmore, Phys. Rev. 54 (1938) 309.[2] F.A. Tourinho, J. Depeyrot, G.J. da Silva, M.C.L. Lara, Braz. J.
Phys. 28 (1998) 413.[3] T. Neuberger, B. Schopf, H. Hofmann, M. Hofmann, B. von
Rechenberg, J. Magn. Magn. Mater. 293 (2005) 483.[4] A.S. Lubbe, C. Bergemann, H. Riess, F. Schriever, P. Reichardt, K.
Possinger, M. Matthias, B. Dorken, F. Herrmann, R. Gurtler, P.Hohenberger, N. Haas, R. Sohr, B. Sander, A.J. Lemke, D.Ohlendorf, W. Huhnt, D. Huhn, Cancer Res. 56 (1996) 4686.
[5] M.C. Bautista, O. Bomati-Miguel, X. Zhao, M.P. Morales, T.Gonzalez-Carreno, R. Perez de Alejo, J. Ruiz-Cabello, S. Veintem-illas-Verdaguer, Nanotechnology 15 (2004) S154.
[6] F.Y. Cheng, C.H. Su, Y.S. Yang, C.S. Yeh, C.Y. Tsai, C.L. Wu, M.T.Wu, D.B. Shieh, Biomaterials 26 (2005) 729.
[7] D.K. Kim, Y. Zhang, J. Kehr, T. Klason, B. Bjelke, M. Muhammed,J. Magn. Magn. Mater. 225 (2001) 256.
[8] D.C.F. Chan, D.B. Kirpotin, P.A. Bunn, J. Magn. Magn. Mater. 122(1993) 374.
[9] P.C. Morais, S.W. da Silva, M.A.G. Soler, M.H. Sousa, F.A.Tourinho, J. Magn. Magn. Mater. 201 (1999) 105.
[10] M.H. Sousa, F.A. Tourinho, J.C. Rubim, J. Raman Spectrosc. 31(2000) 185.
[11] M.H. Sousa, J.C. Rubim, P.G. Sobrinho, F.A. Tourinho, J. Magn.Magn. Mater. 225 (2001) 67.
[12] J.C. Rubim, M.H. Sousa, J.C.O. Silva, F.A. Tourinho, Braz. J. Phys.31 (2001) 402.
[13] P.C. Morais, S.W. da Silva, M.A.G. Soler, N. Buske, Biomol. Eng. 17(2001) 41.
[14] J.E. Weber, A.R. Goni, C. Thomsen, J. Magn. Magn. Mater. 277(2004) 96.
[15] M.C. Bautista, O. Bomati-Miguel, X. Zhao, M.P. Morales, S.W. daSilva, M.A.G. Soler, C. Gansau, N. Buske, P.C. Morais, J. Magn.Magn. Mater. 226–230 (2001) 1890.
[16] J.C.O. Silva, M.H. Sousa, F.A. Tourinho, J.C. Rubim, Langmuir 18(2002) 5511.
[17] S.W. da Silva, T.F.O. Melo, M.A.G. Soler, E.C.D. Lima, M.F. daSilva, P.C. Morais, IEEE Trans. Magn. 39 (2003) 2645.
[18] M.A.G. Soler, T.F.O. Melo, S.W. da Silva, E.C.D. Lima, A.C.M.Pimenta, V.K. Garg, A.C. Oliveira, P.C. Morais, J. Magn. Magn.Mater. 272–276 (2004) 2357.
[19] K.S.K. Varadwaj, M.K. Panigrahi, J. Ghose, J. Sol. State Chem. 177(2004) 4286.
[20] I. Chourpa, L. Douziech-Eyrolles, L. Ngaboni-Okassa, J.F. Fouque-net, S. Cohen-Jonathan, M. Souce, H. Marchais, P. Dubois, Analyst130 (2005) 1395.
[21] G.A. Baker, D.S. Moore, Anal. Bioanal. Chem. 382 (2005) 1751.[22] E. Dubois, J. Chevalet, R. Massart, J. Mol. Liq. 83 (1999) 243.[23] A. Otto, I. Mrozek, H. Grabhorn, W. Akemann, J. Phys. Condens.
Matter 4 (1992) 1143.[24] Z.Q. Tian, B. Ren, Annu. Rev. Phys. Chem. 55 (2004) 197.[25] R.F. Aroca, R.A. Alvarez-Puebla, N. Pieczonka, S. Sanchez-Cortez,
J.V. Garcia-Ramos, Adv. Coll. Interf. Sci. 116 (2005) 116.[26] K. Kneipp, H. Kneipp, J. Kneipp, Acc. Chem. Res. 39 (2006) 443.[27] F.J.P. Gouveia, I.G.R. Gutz, J.C. Rubim, J. Electroanal. Chem. 371
(1994) 113.[28] J.C. Rubim, J. Electroanal. Chem. 220 (1987) 339.[29] Z.Q. Tian, J. Raman Spectrosc. 36 (2005) 466.[30] S.H.A. Nicolai, P.R.P. Rodrigues, S.M.L. Agostinho, J.C. Rubim, J.
Electroanal. Chem. 527 (2002) 103.[31] N. Inaba, H. Miyajuma, H. Takahashi, S. Taketomi, S. Chikazumi,
IEEE Trans. Magn. 25 (1989) 3866.[32] J. Tang, M. Myers, K.A. Bosnick, L.E. Brus, J. Phys. Chem. B 107
(2003) 7501.[33] N.M. Gribanov, E.E. Bibik, O.V. Buzunov, V.N. Naumov, J. Magn.
Magn. Mater. 85 (1990) 7.[34] F.A. Tourinho, R. Franck, R. Massart, J. Mater. Sci. 25 (1990) 3249.[35] D.L.A. de Faria, S.V. Silva, M.T. de Oliveira, J. Raman Spectrosc. 28
(1997) 873.[36] L.V. Gasparov, D.B. Tanner, D.B. Romero, H. Berger, G. Marga-
ritondo, L. Forro, Phys. Rev. B 62 (2000) 7939.[37] O.N. Shebanova, P. Lazor, J. Sol. State Chem. 174 (2003) 424.[38] N. Boucherit, A.H.-L. Goff, S. Joiret, Corros. Sci. 32 (1991) 497.[39] J.C. Rubim, Chem. Phys. Lett. 167 (1990) 209.[40] J.C. Rubim, J. Dunnwald, J. Electroanal. Chem. 258 (1989) 327.[41] I.C.G. Thanos, Electrochim. Acta 31 (1986) 811.[42] J. Gui, T.M. Devine, Corros. Sci. 37 (1995) 1177.[43] L.J. Simpson, C.A. Melendres, Electrochim. Acta 41 (1996) 727.[44] G. Cepria, A. Uson, J. Perez-Arantegui, J.R. Castillo, Anal. Chim.
Acta 477 (2003) 157.[45] A. Domenech, J. Perez-Ramırez, A. Ribera, G. Mul, F. Kapteijn,
I.W.C.E. Arends, J. Electroanal. Chem. 519 (2002) 72.[46] M. Stratmann, K. Bohnenkamp, H.J. Engell, Corros. Sci. 23 (1983)
969.[47] J. Dunnwald, A. Otto, Corros. Sci. 29 (1989) 1167.
34 G.V.M. Jacintho et al. / Journal of Electroanalytical Chemistry 603 (2007) 27–34