Triangles to Capture Social Cohesion
19
apport de recherche ISSN 0249-6399 ISRN INRIA/RR--7686--FR+ENG INSTITUT NATIONAL DE RECHERCHE EN INFORMATIQUE ET EN AUTOMATIQUE Triangles to Capture Social Cohesion Adrien Friggeri — Guillaume Chelius — Eric Fleury N° 7686 8 July 2011 arXiv:1107.3231v1 [cs.SI] 16 Jul 2011
-
Upload
independent -
Category
Documents
-
view
3 -
download
0
Transcript of Triangles to Capture Social Cohesion
appor t de r ech er ch e
ISS
N02
49-6
399
ISR
NIN
RIA
/RR
--76
86--
FR+E
NG
INSTITUT NATIONAL DE RECHERCHE EN INFORMATIQUE ET EN AUTOMATIQUE
Triangles to Capture Social Cohesion
Adrien Friggeri — Guillaume Chelius — Eric Fleury
N° 7686
8 July 2011
arX
iv:1
107.
3231
v1 [
cs.S
I] 1
6 Ju
l 201
1


Centre de recherche INRIA Grenoble – Rhône-Alpes655, avenue de l’Europe, 38334 Montbonnot Saint Ismier
Téléphone : +33 4 76 61 52 00 — Télécopie +33 4 76 61 52 52
Triangles to Capture Social Cohesion
Adrien Friggeri , Guillaume Chelius , Eric Fleury
Theme : Reseaux et telecommunicationsEquipe-Projet DNET
Rapport de recherche n° 7686 — 8 July 2011 — 16 pages
Abstract: Although community detection has drawn tremendous amount ofattention across the sciences in the past decades, no formal consensus has beenreached on the very nature of what qualifies a community as such. In this arti-cle we take an orthogonal approach by introducing a novel point of view to theproblem of overlapping communities. Instead of quantifying the quality of a setof communities, we choose to focus on the intrinsic community-ness of one givenset of nodes. To do so, we propose a general metric on graphs, the cohesion,based on counting triangles and inspired by well established sociological consid-erations. The model has been validated through a large-scale online experimentcalled Fellows in which users were able to compute their social groups on Face-book and rate the quality of the obtained groups. By observing those ratingsin relation to the cohesion we assess that the cohesion is a strong indicator ofusers subjective perception of the community-ness of a set of people.
Key-words: No keywords

Des Triangles pour Capturer la Cohesion Sociale
Resume : Bien que la problematique de detection de communautes dans lesreseaux sociaux ait attire une attention grandissante a travers les sciences cesdernieres annees, aucun consensus formel n’a ete atteint sur la nature de ce quidefinit une communaute. Nous introduisons ici un point de vue novateur auprobleme de communautes recouvrantes. Au lieu de quantifier la qualite d’unensemble de communautes, nous nous concentrons sur l’aspect intrinsequementcommunautaire d’un ensemble donne de nuds. Pour ce faire, nous proposonsune metrique generique sur les graphes, la cohesion, se fondant sur la notionde triangles et inspiree par des resultats etablis en sociologie. Ce modele aete valide a travers Fellows, une experience a large echelle sur Facebook danslaquelle les utilisateurs avaient la possibilite de calculer de maniere automatiqueleurs groupes d’amis puis de noter la qualite de ceux ci. En observant ces noteset la cohesion des groupes obtenus, nous concluons que la cohesion est une bonneevaluation de la perception subjective de l’aspect communautaire d’un ensemblede nœuds par un utilisateur.
Mots-cles : reseaux sociaux, reseaux complexes, graphes reels, detection decommunautes, communautes recouvrantes, data mining, modelisation

Triangles to Capture Social Cohesion 3
Introduction
The term community relates to a wide range of phenomena and hasbeen used as an omnibus word loaded with diverse associations.
The Social Science Encyclopedia, Adam Kuper
Although community detection has drawn tremendous amount of attentionacross the sciences in the past decades, no formal consensus has been reached onthe very nature of what qualifies a community as such. In 1955, George Hillery,Jr. analyzed 94 different sociological definitions of the term community [1] bothfrom a quantitative and qualitative standpoint only to conclude that their onlycommon defining feature was that they all dealt with people. Despite this fact,there were other traits on which the majority of definitions agreed, and he statedthat “of the 94 definitions, 69 are in accord that social interaction, area, and acommon tie or ties are commonly found in community life”. Fast-forward halfa century, through the emergence of network science in the last two decades,the communities community has expanded to encompass scientists coming frombackgrounds as diverse as, among others, computer science, theoretical physicsor biology who brought along their own ideas and baggage on what should becalled a community.
In this context, where social networks are modeled as graphs of individualslinked when they share a social connection in real life, all authors concur on theintuitive notion that a community is a relatively tightly interconnected groupof nodes which somehow features less links to the rest of the network. Unfortu-nately, this agreement does not extend to the specific formal meanings of tightlyinterconnected and less links. The important aspect to consider, however, isthat the defining concept of community in network science resides in topologi-cal features of the network. In real life, however, one rarely describes a group ofpeople as “this set of 10 people of density 0.8, featuring on average 2 outboundlink per individual”, understandably preferring clearer – and yet less formal –labels such as ‘family’, ‘people at work’ or ‘the poker group’.
The whole idea behind community detection in social networks is due tothe observation that there is a correlation between the topology of the networkand some kind of labels which relate to social interactions1, and that thereforeit should be possible to infer the socio-semantic structure of the network byobserving some of its topological traits.
Social networks are a peculiar beast in the sense that they only exist asdescriptions of a fragment of what one would call The Social Network, an un-measurable, exhaustive and dynamic multigraph of all social interactions atmankind scale. For example, Zachary’s famous karate club dataset [2] is noth-ing more than Zachary’s description of a subset of all social interactions, limitedin terms of people (members of a karate club in a US university), nature (friend-ship) and time (at some point in time in the 1970s).
It is therefore important to keep in mind that any structural properties ofcommunities are constrained by the nature of the network. The emergence ofonline social networks such as Facebook and Twitter in the last years and the
1For obvious reasons, this assertion does not hold for arbitrarily defined groups, considerfor example the set of people of even height or any other group sharing a randomly distributedfeature: chances that this group present a distinctive topological structure which separates itfrom the rest of the network are pretty slim.
RR n° 7686

4 Adrien Friggeri , Guillaume Chelius , Eric Fleury
availability of high computational power has led to a unique situation wherethere are not only rich datasets to study but also the ability to do so. Butthe richness of these networks lead them not only shine by their size but alsotheir intricate complexity, as they encompass social links which may vary bothin nature and in intensity. For example, people add close friends as well asprofessional acquaintances on Facebook, treating both categories as equals –in Facebook’s terms, all social links are friendships – effectively flattening acomplex multi-graph into a very slightly less complex graph.
In that case, what meaning should one give to less links? It is obvious, forexample, that excluding an employee’s boss from their “family” group should notbe detrimental to the group’s community-ness, whereas excluding their mothershould. And yet in both cases the topological implications are the same: a edgein the network links someone inside the group to someone outside. Thus, giventhat all links are not equal in the network, the considered topological featuresshould go beyond the simple notion of edges in order to discriminate those typeof cases.
In this article, we introduce in Section 1 the cohesion, a new graph met-ric, inspired by well established sociological results, which rates the intrinsiccommunity-ness of a set of nodes of a social network, independently from theexistence of other communities. We then describe in Section 2 the experimentalsetup of Fellows, a large scale online experiment on Facebook which we launchedto prove the validity of the cohesion. Finally in Section 3 we exhibit the highcorrelation between the cohesion of social groups and the subjective perceptionof those groups by users.
1 Cohesion
Before introducing the cohesion, let us reflect on the way community detectionhas blossomed in the past few years. In 2004, at the junction of graph parti-tioning in graph theory and hierarchical clustering in sociology, Newman andGirvan proposed an algorithm to partition a network into several communities.In order to assess the quality of the partitions which were produced by theiralgorithm, they introduced the modularity [3], a quantity which measures “thefraction of the edges in the network that connect vertices of the same type (i.e.,within-community edges) minus the expected value of the same quantity in anetwork with the same community divisions but random connections betweenthe vertices.”
In the following years, the modularity attracted attention, with severalheuristics being proposed to attempt to find maximal partitions modularity-wise – see for example the Louvain method [4]. During the same time, otherhave exhibited several shortcomings of the modularity itself: that it has a resolu-tion limit and therefore that modularity optimization techniques cannot detectsmall communities in large networks, that some random networks are modular.
Going further, when partitioning a network, each node is affected to a uniquecommunity, which has the rather unfortunate side effect of tearing families apart:an individual cannot be at the same time part of their family and their company.
In order to overcome these limitations, it is natural to shift to a context ofoverlapping communities, in which the one-node-to-one-community constraintdisappears. This however has an incidence on modularity. “If vertices may
INRIA

Triangles to Capture Social Cohesion 5
belong to more clusters,” says Fortunato in his 2010 review, “it is not obvioushow to find a proper generalization of modularity. In fact, there is no uniquerecipe.” Naturally, other techniques such as clique the percolation method [5]which do not rely on modularity were introduced – clique percolation goes evenfurther as the method does not evaluate the quality of communities.
Behind the beautiful simplicity of the modularity actually lie two subtly dif-ferent measures. First, the modularity encompasses the individual and intrinsicquality of each community’s content by comparing them to a null model. Sec-ond, but no less important, it implicitly judges the quality of the division incommunities. While this makes sense in the context of a partition because boththose aspects are linked – one cannot change the content of a community with-out affecting other communities – there is no equivalent notion in an overlappingcontext.
1.1 A Word on Judging Divisions
Judging the quality of the division largely depends on the data one wishes tostudy. While it is obvious that two completely disjoint communities S1 ∩ S2 =∅ form a good division of the network (S1 ∪ S2, E) and that two completelyoverlapping communities S1 = S2 = S form a really bad division of the network(S,E), the intermediate overlapping cases are less trivial.
On the one hand, in some occurrences, there is a case for allowing small fuzzyoverlaps in order to model an vertex-based interface between groups instead ofpurely edges. On the other hand, there also are extreme cases where commu-nities should be allowed to overlap at a great extent – consider for examplecollege classes – or even be allowed to be fully embedded one in another (e.g.a computer science lab might be a small community inside a bigger universitycommunity).
For those reasons, we assess that their is no swiss army knife of division rat-ing: the tools used to rate the division in communities itself should be carefullycrafted to fit the data analysis.
1.2 Rating the Content of Communities
It is however possible to rate the quality of one given community embeddedin a network, independently from the rest of the network. The idea is to givea score to a specific set of nodes describing wether the underlying topology iscommunity like. In order to encompass the vastness of the definitions of whata community is, we propose to build such a function, called cohesion, upon thethree following assumptions:
1. the quality of a given community does not depend on the collateral exis-tence of other communities;
2. nor it is affected by remote nodes of the network;
3. a community is a “dense” set of nodes in which information flows moreeasily than towards the rest of the network.
The first point is a direct consequence of the previously exhibited dichotomybetween content and boundaries. The second one encapsulates an important
RR n° 7686

6 Adrien Friggeri , Guillaume Chelius , Eric Fleury
and often overlooked aspect of communities, namely their locality. A usefulexample is to consider an individual and his communities; if two people meetin a remote area of the network, this should not ripple up to him and affect hiscommunities.
The last point is by far the most important in the construction of the co-hesion. The fundamental principle is linked to the commonly accepted notionthat a community is denser on the inside than towards the outside world, witha twist.
As hinted earlier, the purely vertex/edge based approach to community rat-ing has flaws. As an example, the toy network in Figure 1 consists of a group ofdark nodes and a group of light nodes. Both groups contain the same number(4) of nodes and the same number (6) of internal edges (connecting two nodes inthe same group). Moreover, both groups have the same number (4) of externaledges (connecting one node inside the group to one node outside). That is, witha network vision restricted to nodes and edges, both groups are virtually indis-tinguishable, and yet one would say that the dark group is a “good” community,whereas the light group is a “bad” community. The asymmetry between bothgroups arises when observing triangles – sets of three pairwise connected nodes– in the network: there are 6 outbound triangles, that is having two verticesinside the dark group and one vertex in the light group.
Figure 1: Two sets of nodes of identical size, featuring the same number of linksboth inside the set and towards the rest of the network. Despite those structuralsimilarities, the darker set appears like a worse community than the lighter one.
The use of triangles does not only stem from the asymmetry they cause inthe treatment of different group but is in line with the notions of triadic clo-sure and weak ties introduced by Anatol Rapoport and Mark Granovetter [6,7].Granovetter defines weak ties as edges connecting acquaintances, and arguesthat “[. . . ] social systems lacking in weak ties will be fragmented and incoher-ent. New ideas will spread slowly, scientific endeavors will be handicapped, andsubgroups separated by race, ethnicity, geography, or other characteristics willhave difficulty reaching a modus vivendi.”. Furthermore, he states that a “weaktie [. . . ] becomes not merely a trivial acquaintance tie but rather a crucial bridgebetween the two densely knit clumps of close friends”.
From there triadic closure is the property on triplets u, v, w that if thereexist a strong tie between u and v and between u and w then there is at leasta weak tie between v and w. In the context of complex layered networks whereties can be of different nature – blood-related, co-workers – one can extend thisnotion by requiring the two strong ties to be of the same nature. In that case,when one observes a triangle in a network, there are chances than the threeedges are of the same type, whereas edges which do not belong to triangles maybe considered as weak ties, and as such serve as a bridge between communitiesand thus their exclusion from a community should not be detrimental to its
INRIA

Triangles to Capture Social Cohesion 7
quality. For the same reasons, only outbound triangles should negatively affectthe quality of a group of nodes.
Building on this observation, we now formally define the cohesion. Let G =(V,E) be a network and S ∈ V a set of nodes. We define a triangle as beinga triplet of nodes (u, v, w) ∈ V 3 which are pairwise connected, ie. such that((u, v), (v, w), (u,w)) ∈ E3. In respect to S, 4i(S) denotes the number oftriangles where all nodes belong to S and 4o(S) is the number of outboundtriangles of S, that is having exactly two vertices in S.
C(S) =4i(S)(|S|
3
)︸ ︷︷ ︸4 “density”
× 4i(S)
4i(S) +4o(S)︸ ︷︷ ︸isolation
(1)
From there, we define the cohesion of S in Equation 1 as a product of twofactors. The first one is a triangular analog to the usual definition of density:it denotes the fraction of all possible triangles in a set of given size |S| whichare present in S. The second factor is an isolation factor where, intuitively, apenalty is awarded to the set when there exist outbound triangles, an exampleis given on Figure 2.
Figure 2: In this example, the set of dark nodes contains 4 nodes, features 2inbound triangles and only 1 outbound triangles, leading to a cohesion C = 1
3 .
The absence of impact of weak ties is naturally encompassed by the definitionof the cohesion: given that the it only relies on counting triangles, deleting edgeswhich do not belong to any triangles do not affect the number of triangles andtherefore does not impact the value of the cohesion.
1.3 Evaluation on simple models
Random Networks In a random network G(n, p), the expected number oftriangles in a set Sk of size k is 4i = p3
(k3
)and the expected number of out-
bound triangle is given by 4o = p3(n − k)(k2
). From there, the expected value
(for large k and n) of the cohesion is given by C(Sk) ∼ p3 kn . This exhibits
the absence of expected community structure in random networks as the bestpossible community is the whole network.
Four groups The “four groups” test was introduced by Newman and Girvanto test the accuracy of a community detection algorithm. We here use thesame framework to illustrate the pertinence of the cohesion. The setup is thefollowing: consider a network of size 4n consisting of 4 groups of size n. Edgesare placed independently between vertex pairs with probability pin for an edgeto fall inside a community and pout for an edge to fall between communities. The
cohesion of such a group is given, for large n, by C ∼ p5in
p2in+9p2
out, which increases
when pin increases or pout decreases as one would expect from a quality function.
RR n° 7686

8 Adrien Friggeri , Guillaume Chelius , Eric Fleury
2 Fellows
Defining a new metric of such a subjective notion as “how community-like is thisset of nodes ?” raises the critical issue of its evaluation – or put another way,how does one defines the quality of a quality function. While in the previoussection we exhibited that the cohesion makes sense on simple models, this isnot enough to validate its use on real data. We now present Fellows [8], a largescale online experiment on Facebook which was conducted in order to providean empirical evaluation of the cohesion. The gist of the idea behind Fellows isto quantify the accuracy of the cohesion by comparing it to subjective ratingsgiven to communities by real persons.
2.1 The Experiment
‘Fellows’ is a single page web application which provides the user with a shortdescription2 of the experiment and its motivations. When a visitor wishes totake part in the experiment, they authorize the application to access their per-sonal data on Facebook. From that point, the application connects to Facebookthrough the Facebook API [9] and downloads the list of their friends and in-terconnections between pairs of friends to reconstruct the social neighborhoodof the user N (u). The application also publishes a message on the user’s Face-book wall to invite their friends to participate. Using a simple greedy algo-rithm [10], similar in spirit rather than in metric to one previously introducedby Clauset [11], the application computes the user’s groups of friends in theirimmediate social neighborhood by locally maximizing the groups’ cohesion. Itis important to note that all computation is done in JavaScript inside the user’sbrowser and that no identifiable information is ever transmitted back to theapplication’s server. Statistics on each of the groups are then sent to the serveralong with an anonymous unique user and session identifier (to be able to ex-clude users participating several times). The user’s and their friends’ birthdaysand genders are also anonymously recorded.
Once those groups are computed, the application displays a list of namesand pictures of friends which are present in the group featuring the highestcohesion (Fig. 3). The user is asked to give a numerical rating between 1 and4 stars, answering the question “would you say that this list of friends formsa group for you?” They then have the opportunity to create a Friend List onFacebook, which is a feature which allows a better control on the diffusion of theinformation they publish on the social network. Once they submit the rating,it is uploaded to the application server where it is associated to the relevantgroup. In case the user has created a Friend List, the name they have given isalso recorded. The user is then presented with another group and the process isrepeated until either i) the user exits the application or ii) all groups are ratedand a message is displayed to thank the user for their involvement.
2.2 Progress
Fellows was launched on February 8th, 2011. The authors published a link to theapplication on their Facebook walls and sent the url to several active mailinglists. In less than a day, 500 users had taken part in the experiment and at the
2In English, French, Portuguese and Spanish.
INRIA

Triangles to Capture Social Cohesion 9
Figure 3: Screenshot of the application displaying a group.
0
500
1000
1500
2000
2500
3000
02/01 03/01 04/01 05/01 06/01 07/01 08/01
Tot
al U
niqu
e U
sers
Date (mm/dd)
Figure 4: Evolution of total unique users through time.
time of writing, participations totaled 2635 persons (Fig. 4). Although unrelatedto the evaluation of the cohesion, their are several facts which are interestingin the spread of the experiment. We observed a pattern of daily increase andnightly stagnation in the number of participants, corresponding to WesternEurope timezone, which is coherent with data obtained from Google Analytics3
indicating that the vast majority of Fellows’ visitor came from France.
3A service from Google which provides detailed statistics of visitors access
RR n° 7686

10 Adrien Friggeri , Guillaume Chelius , Eric Fleury
100
75
50
25
0
25
50
20 30 40 50 60 70 80
Num
ber
of m
ales
/ fe
mal
es
Age in years
malefemale
Figure 5: Densities of ages of male and female participants.
Moreover, the total number of unique users increases by bursts: observe howon March 23rd the number of users rises from ∼ 1700 to ∼ 2000 in a single dayafter having increased by 200 in two weeks. We have been able to trace backthis sudden influx of participants to the publication of an article on a high trafficFrench blog on that date. Although this event was the most notable, we havebeen able to manually track down the origin of several different bursts – e.g. anemail on a large mailing list on February 14th, a tweet by an influent twittereron February 28th.
As stated above, when a user started the application for the first time, amessage was automatically published on their Facebook wall to invite theirfriends to participate. Despite that fact, less than half the incoming traffic onthe website came from Facebook. We conclude unfortunately that either themessage was not appealing enough or that Fellows did not have the same viralpotential as, for example, a double rainbow.
2.3 Population
In some cases, the participations were corrupted or incomplete – e.g. the usertemporarily lost their internet connection. As a consequence, 78 participationshad to be discarded, leaving 2557 valid contributions (1797 males, 698 femalesand 62 persons of unknown gender). The participants were on average 29.31±8.99 years old – male subjects: 29.76 ± 8.80 yo, female subjects: 28.03 ± 9.24(age distributions for male and female subjects are given in Figure 5).
On Facebook, the number of friends one might have cannot exceed 5000.The distribution of the number of friends is heterogeneous (Fig. 6), with 10%users having less than 74 friends and 90% users having less than 581, the medianbeing at 237 friends.
INRIA

Triangles to Capture Social Cohesion 11
3 Experimental Validation
In this section, we present the main contribution of this article, namely that thecohesion captures well the community-ness of a set of nodes. We first presentstatistics on the ratings which were obtained through the experiment and thenexhibit how both cohesion and ratings are correlated.
3.1 Ratings overview
The 2157 valid subjects lead to the detection of 67750 groups. Given the factthat a user could stop the experiment at any time, 51161 groups received arating – however, 78% of the subjects rated more than 90% of their groups.There are several explanations to those forfeitures, among others: i) that theuser felt the groups they were presented with were of poor quality (the non-ratedgroups have on average a cohesion C = 0.108 ± 0.107) or ii) that the user hadtoo many groups to rate – although the number of groups is bounded, if a userhas a lot of friends, that bound can be sufficiently high to discourage them.
Out of the 43589 rated groups, 25.1% received a rating of 1 star, 21.8%received 2 stars, 22.5% were rated 3 stars and 30.7% were awarded 4 stars. Itis important to note here that the aim of the experiment was not to obtain thehighest possible proportion of 4 stars ratings.
The first thing to notice is that the algorithm assigns all nodes of degreegreater than 3 to at least one group. In practice, there is no reason that allnodes belong to at least one socially cohesive group: a social neighborhoodmight be constituted of an heterogeneous set of communities linked throughweak ties and/or sparse meshes. Moreover, the social topology on Facebookand in the real world are not isomorphic, not only because people tend to addmore distant acquaintances as Facebook friends, but also due to the presenceof non-human profiles representing brands – incidentally, those would be better
0
500
1000
1500
2000
2500
10 100 1000
Number of Friends
Figure 6: Distribution of users’ number of friends.
RR n° 7686

12 Adrien Friggeri , Guillaume Chelius , Eric Fleury
★
★★
★★★
★★★★
0 0.25 0.5 0.75 1
Ave
rage
Rat
ing
Cohesion
Figure 7: Average rating obtained by groups as a function of their cohesion.
represented as Facebook pages, but for some reasons some organizations preferthis structure.
Second, and perhaps more important, is that the aim of the experiment isnot to evaluate the quality of the – rather simple – algorithm, but that of theunderlying metric. In this context, obtaining low ratings is perfectly acceptable– and desirable – as long as they correlate to the cohesion.
3.2 Cohesion ∼F
We now exhibit the experimental links between a structural metric, the cohesionC, and the subjective appreciation of a group’s pertinence expressed as theaverage rating R given by users. On Figure 7, we discretize the cohesion of allgroups in increments of 0.01 and we represent the average rating obtained bygroups in the same increment. Both quantities are rank correlated (Spearman’scorrelation ρ = 0.90, p-value = 9.1×10−37). Thus, when the cohesion increases,so does the average rating, and conversely. Furthermore, ln C and lnR arelinearly correlated (Pearson’s correlation r = 0.97, p-value = 2× 10−61).
On Figure 8 we plot the distributions of cohesions of each of the four sets ofgroups of rating 1, 2, 3 and 4 stars. From this, we observe that the higher therating, the higher the probability of obtaining high cohesions. Therefore, weconclude that the cohesion in a pertinent measure to evaluate the community-ness of a set of nodes, as it is highly correlated to its subjective evaluation.
Furthermore, it is interesting to look at the relation, if there is any, betweenthe ratings and other graph metrics, such as the density of the considered set.On Figure 9 we plot the average rating obtained for groups of a given density.Groups having a density greater than 1
3 tend to have the same average rating(between 2 and 3 stars). There seems however that for densities smaller than13 the rating increases with the density. To explain this fact, consider that
INRIA

Triangles to Capture Social Cohesion 13
0
0.1
0.2
0.3
0.4
0.5
0.6
0.7
0.8
0.9
1
0 0.1 0.2 0.3 0.4 0.5 0.6 0.7 0.8 0.9 1
P[co
hesi
on≥
X |
rat
ing=
N]
Cohesion
★ ★★
★★★★★★★
Figure 8: Normalized reversed cumulative distribution of cohesion for groupsrated 1,2,3 or 4 stars (P[cohesion ≥ X|rating = N ]).
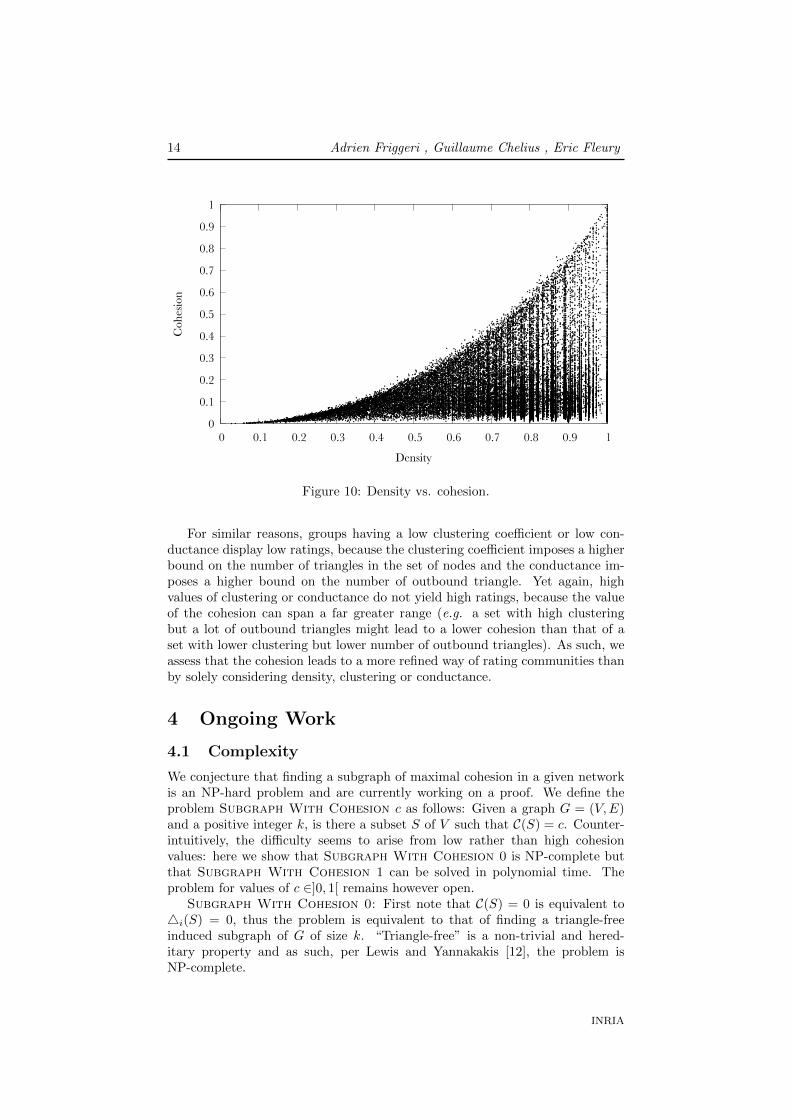
C(S) < 4i(S)
(|S|3 )
. Given that 4i(S) < m√m where m is the number of edges in
S, there exist a bounding relation between density and cohesion as exhibitedin Figure 10. Therefore, the lower ratings obtained by less dense groups canbe explained by the fact that those have low cohesion, which itself is highlycorrelated to ratings.
★
★★
★★★
★★★★
0 0.25 0.5 0.75 1
Ave
rage
Rat
ing
Density
Figure 9: Average rating obtained by groups as a function of their density.
RR n° 7686
14 Adrien Friggeri , Guillaume Chelius , Eric Fleury
0
0.1
0.2
0.3
0.4
0.5
0.6
0.7
0.8
0.9
1
0 0.1 0.2 0.3 0.4 0.5 0.6 0.7 0.8 0.9 1
Coh
esio
n
Density
Figure 10: Density vs. cohesion.
For similar reasons, groups having a low clustering coefficient or low con-ductance display low ratings, because the clustering coefficient imposes a higherbound on the number of triangles in the set of nodes and the conductance im-poses a higher bound on the number of outbound triangle. Yet again, highvalues of clustering or conductance do not yield high ratings, because the valueof the cohesion can span a far greater range (e.g. a set with high clusteringbut a lot of outbound triangles might lead to a lower cohesion than that of aset with lower clustering but lower number of outbound triangles). As such, weassess that the cohesion leads to a more refined way of rating communities thanby solely considering density, clustering or conductance.
4 Ongoing Work
4.1 Complexity
We conjecture that finding a subgraph of maximal cohesion in a given networkis an NP-hard problem and are currently working on a proof. We define theproblem Subgraph With Cohesion c as follows: Given a graph G = (V,E)and a positive integer k, is there a subset S of V such that C(S) = c. Counter-intuitively, the difficulty seems to arise from low rather than high cohesionvalues: here we show that Subgraph With Cohesion 0 is NP-complete butthat Subgraph With Cohesion 1 can be solved in polynomial time. Theproblem for values of c ∈]0, 1[ remains however open.
Subgraph With Cohesion 0: First note that C(S) = 0 is equivalent to4i(S) = 0, thus the problem is equivalent to that of finding a triangle-freeinduced subgraph of G of size k. “Triangle-free” is a non-trivial and hered-itary property and as such, per Lewis and Yannakakis [12], the problem isNP-complete.
INRIA

Triangles to Capture Social Cohesion 15
Subgraph With Cohesion 1: In this case, a set S such that C(S) = 1 isa clique which has 0 outbound triangles. We introduce the notion of triangleconnectivity, an equivalence relation on edges of the network defined as such:two edges e and e′ are said to be triangle connected if there exist a sequenceof triangles (ti)0≤i≤N of G such that e is an edge of t0, e′ is an edge of tN and∀i < N, ti and ti+1 share a common edge. From there, if there exist a set Sof cohesion 1, then all the edges of its induced subgraph must be in the sameequivalence class and moreover the equivalence class cannot contain any otheredges – if so, the associated subgraph would contain an outbound triangle forS. In conclusion, a set of size k with cohesion 1 exists if and only if there isan equivalence class containing
(k2
)edges. Given that it is possible to list all
triangles in polynomial time and that by using a union-find algorithm one cancompute all triangle connected equivalence classes in a time polynomial in thenumber of triangles, the problem of finding a set of nodes of size k having acohesion 1 can be solved in polynomial time.
4.2 Extension to weighted networks
Besides complexity analysis, future works will also focus on the evaluation ofweighted cohesion to quantify the quality of weighted social communities. In asimple unweighted model of social networks, when two people know each other,their is a link between them. In real life however, things are more subtle, asthe relationships are not quite as binary: two close friends have a stronger bondthan two acquaintances. In this case, weighted networks are a better modelto describe social connections, this is why we deem necessary to introduce anextension of the cohesion to those networks.
The definition of the cohesion can, as a matter of fact, be extended to takethe weights on edges into account. We make the assumption on the underlyingnetwork that all weights on edges are normalized between 0 and 1. A weightW (u, v) = 0 meaning that there is no edge (or a null edge) between u and v,and a weight of 1 indicating a strong tie. We define the weight of a triplet ofnodes as the product of its edges weights W (u, v, w) = W (u, v)W (u,w)W (v, w).It then comes that a triplet has a strictly positive weight if and only if it is atriangle. We then define inbound and outbound weights of triangles and finallyextend the cohesion.
4wi (S) =
1
3
∑(u,v,w)∈S3
W (u, v, w)
4wo (S) =
1
2
∑u6∈S,(v,w)∈S2
W (u, v, w)
Cw(S) =4w
i (S)(|S|3
) × 4wi (S)
4wi (S) +4w
o (S)
Conclusion
We have presented and justified the introduction of a novel measure, the co-hesion, which quantifies the intrinsic community-ness of a set of nodes of agiven network. We have then confronted the measure to real-world perception
RR n° 7686

16 Adrien Friggeri , Guillaume Chelius , Eric Fleury
during a large-scale experiment on Facebook and found that the cohesion ishighly correlated to the subjective appreciation of communities of Facebookusers. Moreover, we have shown that there were no correlation between othermetrics such as density and ratings. As such, we conclude that the use of thecohesion allows a good quantification of the community-ness of a set of nodes.Future works lie among others in the study of the cohesion from an algorithmicpoint of view and extensions to the metric to weighted networks.
References
[1] J. Hillery, George A., “Definitions of Community: Areas of Agreement,”Rural Sociology, vol. 20, pp. 111 – 123, 1955.
[2] W. Zachary, “An information flow model for conflict and fission in smallgroups,” Journal of Anthropological Research, vol. 33, pp. 452–473, 1977.
[3] M. Newman and M. Girvan, “Finding and evaluating community structurein networks,” Physical Review E, vol. 69, no. 2, 2004.
[4] V. D. Blondel, J. L. Guillaume, R. Lambiotte, and E. Lefebvre, “Fast un-folding of communities in large networks,” Journal of Statistical Mechanics:Theory and Experiment, 2008.
[5] G. Palla, I. Derenyi, I. Farkas, and T. Vicsek, “Uncovering the overlappingcommunity structure of complex networks in nature and society,” Nature,vol. 435, no. 7043, pp. 814–818, 2005.
[6] A. Rapoport, “Contributions to the Theory of Random and Biased Nets,”Bulletin of Mathematical Biophysics, vol. 19, pp. 257–277, 1957.
[7] M. Granovetter, “The Strength of Weak Ties,” Amer. J. of Sociology,vol. 78, no. 6, pp. 1360–1380, 1973.
[8] A. Friggeri, G. Chelius, and E. Fleury, “Fellows, a social experiment,”2011. [Online]. Available: http://fellows-exp.com
[9] Facebook, “Graph API,” 2011. [Online]. Available: http://developers.facebook.com/docs/api
[10] A. Friggeri, G. Chelius, and E. Fleury, “Egomunities, Exploring SociallyCohesive Person-based Communities,” INRIA, Research Report RR-7535,02 2011. [Online]. Available: http://hal.inria.fr/inria-00565336/en/
[11] A. Clauset, “Finding local community structure in networks,” Physical Re-view E, vol. 72, no. 2, aug 2005.
[12] J. M. Lewis and M. Yannakakis, “The node-deletion problem for heredi-tary properties is np-complete,” Journal of Computer and System Sciences,vol. 20, no. 2, pp. 219 – 230, 1980.
INRIA

Centre de recherche INRIA Grenoble – Rhône-Alpes655, avenue de l’Europe - 38334 Montbonnot Saint-Ismier (France)
Centre de recherche INRIA Bordeaux – Sud Ouest : Domaine Universitaire - 351, cours de la Libération - 33405 Talence CedexCentre de recherche INRIA Lille – Nord Europe : Parc Scientifique de la Haute Borne - 40, avenue Halley - 59650 Villeneuve d’Ascq
Centre de recherche INRIA Nancy – Grand Est : LORIA, Technopôle de Nancy-Brabois - Campus scientifique615, rue du Jardin Botanique - BP 101 - 54602 Villers-lès-Nancy Cedex
Centre de recherche INRIA Paris – Rocquencourt : Domaine de Voluceau - Rocquencourt - BP 105 - 78153 Le Chesnay CedexCentre de recherche INRIA Rennes – Bretagne Atlantique : IRISA, Campus universitaire de Beaulieu - 35042 Rennes Cedex
Centre de recherche INRIA Saclay – Île-de-France : Parc Orsay Université - ZAC des Vignes : 4, rue Jacques Monod - 91893 Orsay CedexCentre de recherche INRIA Sophia Antipolis – Méditerranée : 2004, route des Lucioles - BP 93 - 06902 Sophia Antipolis Cedex
ÉditeurINRIA - Domaine de Voluceau - Rocquencourt, BP 105 - 78153 Le Chesnay Cedex (France)
http://www.inria.frISSN 0249-6399