THE EFFECTS OF COHESION ON ORGANIZATIONAL ...
162
THE EFFECTS OF COHESION ON ORGANIZATIONAL PERFORMANCE: A TEST OF TWO MODELS by LEONARD WONG, B.S., M.S. A DISSERTATION IN BUSINESS ADMINISTRATION Submitted to the Graduate Faculty of Texas Tech University in Partial Fulfillment of the Requirements for the Degree of DOCTOR OF PHILOSOPHY Approved May, 1992
-
Upload
khangminh22 -
Category
Documents
-
view
1 -
download
0
Transcript of THE EFFECTS OF COHESION ON ORGANIZATIONAL ...

THE EFFECTS OF COHESION ON ORGANIZATIONAL
PERFORMANCE: A TEST OF TWO MODELS
by
LEONARD WONG, B.S., M.S.
A DISSERTATION
IN
BUSINESS ADMINISTRATION
Submitted to the Graduate Faculty of Texas Tech University in
Partial Fulfillment of the Requirements for
the Degree of
DOCTOR OF PHILOSOPHY
Approved
May, 1992

' i, ^^ ACKNOWLEDGEMENTS ^ , .
C^TO XJ"^ would not be possible to adequately express my
appreciation to my adviaor. Dr. Robert L. Phillipa, for hia
assistance and advice not only on thia diaaertation, but
also for my entire graduate atudy and professional
development.
I also am deeply grateful to Dr. Howard McFann of the
Army Reaearch Inatitute for making the National Training
Center data available and adviaing me on ita uae.
11

TABLE OF CONTENTS
ACKNOWLEDGEMENTS ii
LIST OF TABLES v
LIST OF FIGURES vii
CHAPTER
I. INTRODUCTION 1
Limitationa 8
II. THE THEORETICAL FRAMEWORK 12
The Conceptualization of Coheaion 12
Organizational Commitment 34
Leaderahip 38
III. THE THEORETICAL SETTING 47
The Organizational Synergy model 47
Leader-group Interactiona Model 51
Hypotheaea 54
IV. FIESEARCH DESIGN 56
Method 5 6
Sample 56
Operationalization of the Conatructa 60
Performance 67
V. DATA ANALYSIS. . . • 70
Meaaurement Model 70
Results of Regression Analysis 75
VI. IMPLICATIONS 96
Hypotheses Results 96
Model Implications 99
I I
111

Future Research 100
REFERENCES 104
APPENDICES
A. LISREL 7 OUTPUT FOR ORGANIZATIONAL SYNERGY MODEL 115
B. LISREL 7 OUTPUT FOR LEADER-GROUP INTEFIACTIONS MODEL 122
C. FIEGRESSION RESULTS FOR ORGANIZATIONAL SYNERGY MODEL 128
D. FIEGRESSION RESULTS FOR LEADER-GROUP INTERACTIONS MODEL 143
E. REVISED MODEL REGRESSION RESULTS 155
IV

LIST OF TABLES
5.1 Reliability of measures for the organizational synergy model 81
5.2 T-values for the organizational synergy model. . . 82
5.3 Reliability of measures for the leader-group interactions model 83
5.4 T-values for the leader-group interactiona model . 84
5.5 Covariance matrix for the organizational synergy model 85
5.6 Covariance matrix for the leader-group interactions model 8 6
5.7 Regreaaion reaulta for the organizational aynergy model for combined platoona, armor only, and infantry only aubgroupa; Performance = C + OC + L 87
5.8 Regreaaion reaulta for the organizational aynergy model for combined platoona, armor only, and infantry only aubgroupa; Performance = C + OC + L + (Lx OC) 88
5.9 Regreaaion reaulta for the organizational aynergy model for combined platoona, armor only, and infantry only aubgroupa; Performance = C + OC + L + (C x L) 89
5.10 Regreaaion reaulta for the organizational aynergy model for combined platoona, armor only, and infantry only aubgroupa; Performance = C + O C + L + (Cx OC) 90
5.11 Regreaaion reaulta for the organizational aynergy model for combined platoona, armor only, and infantry only subgroups; Performance = OC + L + (L x OC) + (C X L) + (C X OC) + (C X L X OC) 91
5.12 Regression reaulta for the leader-group interactiona model for combined platoona, armor only, and infantry only aubgroupa; Performance = Inatr + Supp + Drive + Goal 92

5.13 Regression resulta for the leader-group interactiona model for combined platoona, armor only, and infantry only aubgroupa; Drive = Inatr + Supp 93
5.14 Regreasion reaulta for the leader-group interactiona model for combined platoona, armor only, and infantry only aubgroupa; Coheaion = Inatr + Supp 94
5.15 Regreaaion reaulta for the leader-group interactiona model for combined platoona, armor only, and infantry only aubgroupa; Performance = Drive + Goal + (Drive x Goal) + (C X Drive) + (C x Goal) + (Drive X C X Goal) 95
VI

LIST OF FIGURES
1.1 Organizational aynergy model 10
1.2 Leader-group interactiona model 11
4.1 Organizational chart for platoona 68
4.2 Normal probability plot for performance
criterion 69
5.1 Organizational aynergy meaaurement model 79
5.2 Leader-group interactiona meaaurement model. . . . 80
Vll
CHAPTER I
INTRODUCTION
Coheaion haa traditionally been a fundamental element
in the military'a formula for combat aucceaa. Ardant du
Picq (1947), the French military writer, noted that "four
brave men who do not know each other will not dare to attack
a lion. Four leaa brave, but knowing each other well, aure
of their reliability and conaequently of mutual aid, will
attack reaolutely" (p. 110). S.L.A. Marahall, a noted
hiatorian of the U.S. Army, addreaaed the queation of what
inducea a man to face death bravely. He atated, "I hold it
to be one of the aimpleat trutha that the thing which
enablea an infantry aoldier to keep going with hia weapona
ia the near preaence or the preaumed near preaence of a
comrade" (Marahall, 1966, p. 42) .
Deapite the enthuaiaam in the context-apecific realm of
the military, the context-free literature haa yet to produce
clear and conaiatent relationahipa between coheaion and
performance. For example, Stogdill (1972) reviewed 34
atudiea which attempted to relate coheaiveneaa and
productivity. He found coheaive groupa to be more
productive in twelve atudiea, less productive in eleven
atudiea, and unrelated to productivity in the remaining
eleven studies.
More recently, Greene (1989) noted that although
cohesion of work groups is considered by practitioners and
researchers to be an important determinant of organizational
effectiveness, the importance stems from a presumed effect
on group productivity. He went on to state that textbooks
such as those by Griffin and Moorhead (1986) and
Schermerhorn, Hunt, and Osborn (1988) "directly contend that
cohesion results in high productivity when group and
organizational goals are compatible, but they fail to cite
any empirical evidence in aupport of thia view" (p. 71). In
other worda, the literature readily recognizea that coheaion
when coupled with norms enhancea performance. Thia
preaumption haa yet to receive conaiatent empirical aupport,
however.
Adding to the confuaion concerning the coheaion-
performance relationahip, the coheaion literature haa
yielded a number of different waya in which coheaion haa
been defined and operationalized. For example, coheaion haa
been conceptualized aa interperaonal attraction (e.g., Lott
& Lott, 1965); attraction to group (e.g., Seaahore, 1954); a
bidimenaional conatruct of taak and aocial coheaion (e.g.,
Anderson, 1975); and a multidimenaional construct with a
wide variety of dimensions (e.g., Yukelson, Weinberg, &
Jackson, 1984).
In an effort to overcome the ambiguity of the
cohesion-performance relationship, two models have appeared

in the literature using similar constructs of cohesion,
organizational commitment, and leadership. Phillipa, Blair,
and Schmitt (1987) propoaed the organizational aynergy model
and Schrieaheim, Mowday, and Stogdill (1979) propoaed the
leader-group interactiona model. Both modela auggeat that
cohesion haa to be directed toward performance. The
organizational aynergy model propoaea that coheaion affecta
performance when interacting with leaderahip and
organizational commitment. Figure 1.1 ahowa the
organizational aynergy model. The leader-group interactiona
model auggeata that coheaion ia moderated by group drive and
group goal acceptance. According to the Schrieaheim et al.
(1979) model, leaderahip ia an antecedent to coheaion and
group drive. Figure 1.2 illuatratea the leader-group inter
actiona model. Thia preaent atudy teata the propoaed rela
tionahipa between coheaion and performance poaited by the
two modela.
The modela are teated uaing data obtained from U.S.
Army unita. The unit performance meaaure uaed in thia atudy
ia the degree of unit battle aucceaa at the U.S. Army'a
National Training Center in Fort Irwin, California.
Testing the models is significant for several reasons.
First, both models attempt to clarify the ambiguous
cohesion-performance relationship found in the literature.
As stated earlier, Stogdill (1959, 1972) found that the link
between cohesion and performance was not consistently

empirically supported. Since that review, some atudiea have
provided evidence for the poaitive relationahip between
coheaion and performance (Ball & Carron, 1976; Bird, 1977;
Keller, 1986; Martena & Peteraon, 1971; Peteraon & Martena,
1972; Nixon, 1977; Widmeyer & Martena, 1978). Other atudiea
auggeated a negative relationahip (Landera & Luachen, 1971;
Zaccaro & Lowe, 1988), a aituational relationahip (Greene,
1989; Hoogatraten & Vorat, 1982; Mieaing & Preble, 1985;
Tziner and Vardi, 1982) or no relationahip at all (Melnick &
Chemera, 1974; Williama & Hacker, 1982). Even in the
atudiea that ahowed a poaitive relationahip, cauaality waa
not alwaya eatabliahed aince moat of the atudiea were croaa
aectional. Thua, with the coheaion-performance relationahip
lacking conaiatent aupport, any findinga from the teat of
either model add to the current literature.
A aecond related aignificant aapect ia the performance
meaaure and the environment in which the performance meaaure
waa aaaeaaed. Other coheaion atudiea have involved taaka
auch aa folding paper (e.g., Zaccaro & Lowe, 1988); aport
team performance (e.g., Landera et al., 1982); routine
military duties (e.g., Tziner & Vardi, 1982); and buaineaa
games (e.g., Miesing & Preble, 1985). In the present study,
the task takes place in an environment that allows group
processes to fully develop.
The uniqueness of the National Training Center (NTC)
cannot be overstated. No other training approaches the

realism routinely achieved at the NTC. A unit rotation at
the NTC lasts three weeks and pits the unit against an enemy
force trained in Soviet tactics. Unita employed in battle
are kept "honest" through the use of lasers and sensors
mounted on fighting vehicles and worn by soldiers to detect
hits and near misses of weapon systems. The task of
engaging highly competent enemy forces during day and night
missions in a maneuver area the size of Rhode Island, in
addition to the harsh deaert environment, providea the beat
external validity poaaible ahort of actual combat. The
dirt, duat, tear gaa, amoke, simulated chemical agents, and
relentless sun all contribute to the realism of an ideal
testing ground for coheaion and ita effecta on performance.
Another aignificant aapect of thia atudy ia the uae of
a narrow conceptualization of the coheaion conatruct. Aa
atated earlier, the current coheaion literature reflecta
preferencea for unitary, bidimenaional, or multidimenaional
conceptualizationa. The organizational aynergy model
advocatea a reatricted way of operationalizing coheaion.
Schrieaheim et al. (1987) acknowledge the many
conceptualizationa of coheaion, but do not apecify which
approach would be more appropriate for their model. Thia
study avoids previoua criticiams of the coheaion literature
concerning broad baaed conceptualizations. A thorough
discussion of the many conceptualizations of cohesion will
follow later in this study.

Finally, this study is significant to the U.S. military
since it addresses a key element in current doctrine.
Jacobs (in press) writes that "within the military, there is
perhaps no more important task than building cohesive combat
units." Indeed, the Army haa adopted thia view and ia
evident in U.S. Army policy publicationa auch as Operations
Field Manual FM 100-5 (1986) which states that "well-
trained, coheaive unita under good leaderahip suatain far
higher average effectiveneaa" (p. 26). The Army haa aaaumed
that higher coheaion leada to better performance without
regard to moderator variablea aa auggeated by the modela to
be teated. Thia atudy teata two modela that aeek to clarify
the moderator relationahipa. Thia atudy'a findinga are alao
relevant to policy deciaiona concerning individual and group
rotation policiea. Rotation policiea are often deaigned
with coheaion building aa a focua. Should coheaion not have
an impact aa it ia preaumed to have, theae policiea may be
premature.
Thua, the aignificance of thia atudy can be aeen in
both the context-free and context-apecific arenaa. In the
context-free, thia atudy teata modela poaited to clarify the
currently tenuoua link between coheaion and performance.
Additionally, it tests the usefulness of adopting a narrow
conceptualization of the cohesion construct. Concerning
context-specific military research, the study provides more
research addressing the military's reliance on the cohesion

concept in its search for the determinants of unit
effectiveness.
Lewin and Minton (1986) noted that "for academic
efforts to be maximally useful to interested practitioners,
they must be approached, engineered, and presented
specifically with thia uaer/conaumer orientation in mind"
(p. 525). They go on to call for reaearch in organizational
effectiveness to offer remedies for the two major problems
of effectiveneaa reaearch. Firat, the reaearch ahould
provide practitionera acceaa to and uae of relevant reaearch
findinga. Second, researchera ahould have acceaa and
experimentation with "real world" aituationa. Thia atudy
focuaea on modela that are extremely relevant to the
military practitioner. Indeed, the organizational aynergy
model waa developed by Phillipa, Blair, and Schmitt (1987)
using a military unit effectiveneaa focua. Aa pointed out
earlier, thia atudy uaea data obtained from an extremely
realiatic taak environment. Hence, teating two relevant
modela with rich data bridgea the gap between the military
practitioner and the academic.
Thia atudy teated parta of the organizational aynergy
model and leader-group interactiona model. Itema reflecting
the constructs contained in the models were selected from an
instrument administered to U.S. Army units. The measurement
properties of the items selected to represent both models
were assessed using LISREL for confirmatory factor analysis.

Reliabilities for the items as well as discriminant validity
were examined. Once the measurement models for the
organizational synergy model and the leader-group
interactions model were deemed acceptable, the actual
propositions of the two models were tested with regreaaion
analysia.
Limitationa
The atudy ia limited mainly through the uae of
aecondary data. Becauae the itema uaed to operationalize
the conatructa were not deaigned apecifically for that
purpoae, there may be aome alippage between the conatructa
and what the itema actually meaaure. Additionally, the
actual inatrument uaed to collect the data waa aixteen pagea
long. With auch a long instrument, respondent fatigue and
hence reaponae error may be preaent in the data. Another
limitation of thia atudy ia the outcome variable uaed. Unit
performance ia the outcome variable in thia atudy. An
examination of the diatribution of the performance across
units included in the study shows that although it is close
to being normally distributed, it is not. Violating a
normality assumption may affect the interpretation of the
regression analysis. Trying to correct for non-normality
may affect the more crucial linearity assumption. Finally,
both models contained triple interaction terms. Testing
such terms is difficult because of the multicollinearity
8

a.isin, fro. t.e inclusion of tUe .ouMe interaction ter.s
in the regression equation. Multicollinearity ™ay distort
the parameter estimates.

0)
o s > 1 en U <D c > 1
CO
G O
-H U fd N
-H c (T3 Cn v-i O
0) M
- H CL4
10

O
w c o
- H J-) U (tJ
<D
C
o
I U 0) -o (T3 0)
CM
<D
- H

CHAPTER II
THE THEOFIETICAL FF(AMEWORK
In order to analyze the two models in this study, it is
first necessary to examine the theoretical underpinnings of
the models. This literature review consists of three sec
tions. First, a review of the literature is presented to
show the evolution of the main conatruct of coheaion in the
modela to be teated. The coheaion literature review
includea a brief diacuaaion concerning why a narrow
conceptualization of coheaion ia uaed in thia atudy. The
aecond aection of the literature review examines the
development of the organizational commitment conatruct and
ita role in determining performance. Laatly, the leaderahip
component ia diacusaed in relation to ita interactive
effecta with organizational commitment, coheaion, and
performance.
The Conceptualization of Coheaion
For the laat forty yeara, the concept of coheaion haa
played a major role in group dynamica, organizational
behavior, and group therapy. The concept haa maintained ita
importance in the aocial and induatrial/organizational
psychology field through its contributions to areaa aa
diverae as decision making (Janis, 1972) , business
performance (Keller, 1976), subordinate satisfaction
(Dobbins & Zaccaro, 1986), protection from illness (Manning
12

& Fullerton, 1988), combat effectiveness (Goodacre, 1951),
conformity (Back, 1951), sport team effectiveness (Carron,
1982) and group membership (Latham & Lichtman, 1984) .
Despite the widespread use of the cohesion construct, the
research has been "dominated by confusion, inconsistency,
and almost inexcusable sloppiness with regard to defining
the construct" (Mudrack, 1989, p. 45) .
Probably the most popular definition of group cohesion
(alao referred to aa coheaiveneaa) ia that propoaed by
Festinger, Schachter, and Back (1950) who defined cohesion
as "the total field of forces which act on members to remain
in the group" (p. 164). Disagreement continues as to how
this "total field of forces" should be conceptualized,
operationalized and aaaeaaed. Throughout the literature,
coheaion haa been interpreted aa a unitary, a bidimenaional,
or a multidimenaional concept.
This section of the literature review will examine the
various interpretations of the construct of coheaion. While
mainly focusing on the recent literature (the last decade),
it is often necessary to examine the long lasting effecta of
aeveral older atudiea that permeate the coheaion literature.
The cohesion review conaiata of five parta. The firat three
parts review the context-free cohesion literature and
examine the development of various unitary, bidimensional,
and multidimensional conceptualizations of cohesion. The
fourth part examines the context-specific domain of cohesion
13

in the military. The last part of the cohesion literature
review specifically addresses studies examining the
cohesion-performance link.
Unitary Approaches
Festinger et al. (1950) pointed out two factors that
will affect the magnitude of the "force field" and can be
readily distinguished and conceptualized: attraction to
group and means control of the group. Deapite thia apparent
bidimenaional approach, Featinger and hia aaaociatea choae
to operationalize coheaion with only a aingle item--"What
three people in Weatgate or Weatgate Weat do you aee moat of
aocially?" Thia unitary operational definition of coheaion
focuaing on interperaonal attraction haa been widely uaed in
the literature. The latter view of coheaion aa the meana
control of the group waa never adopted by aubaequent
coheaion literature. The other predominant unitary view of
coheaion ia the conceptualization of coheaion as attraction
to group.
Cohesion as Interpersonal Attraction
Lott and Lott (1965) reviewed the literature from 1950
to 1962 concerning cohesion as interpersonal attraction.
Interestingly, they noted that defining cohesivenesa in
terms of interperaonal liking ia "relatively arbitrary"
since other dimensions could be used. Nevertheless, much of
the recent literature has still used the single dimension of
14

interpersonal attraction as an operational definition of
cohesion.
Scott and Rowland (1970) related.cohesion to morale in
their study of semantic differential scales. In their My
Fellow Workers scale, they essentially measured the inter
personal attraction between workers.
Callaway and Esser (1984) tested Janis' (1972) group-
think formulation in the laboratory by manipulating group
cohesiveness and adequacy of decision procedures. Coheaive
neaa waa conceptualized aa interperaonal attraction and waa
operationalized by uaing Back'a (1951) deceptive communica-
tiona to the aubjecta. Subjecta in the high coheaiveneaa
group were led to believe that they were membera of a ae-
lect, congenial, and effective group whoae membera had been
matched on peraonality and demographic information. Low
coheaiveneaa conditiona were obtained by telling aubjecta
that auch a match waa impoaaible. The uae of Back'a cohe
siveness manipulation is noteworthy since thirty years
earlier Gross and Martin (1952) had strongly criticized
Back's unitary definition of cohesion and hia artificial
manipulation due to ita ephemeral effecta. The Callaway amd
Esser (1984) study found that highly cohesive groups without
adequate decision procedures tended to make the poorest
decisions.
Latham and Lichtman (1984) tested the prepotency of
social linkages in predicting commitment in voluntary
15

organizations. Their study compared cohesion and status in
explaining the level of commitment in church members.
Cohesion was conceptualized as interpersonal attraction and
was indicated by the degree of friendship, acceptance, and
love shown by other church members. Latham and Lichtman's
results showed a strong relationship between cohesion aa
interperaonal attraction and organizational commitment. In
this case, brotherly love served as the unitary conceptuali
zation of cohesion.
Etzioni took a restrictive position on the
conceptualization of coheaion. He atated that "by coheaion,
we mean a poaitive expreaaive relationahip among two or more
actora" (Etzioni, 1975, p. 280) .
Coheaion aa Attraction to Group
Seaahore (1954) auggeated the aecond unitary concept of
cohesion as attraction to group, although he noted that the
clarity of this definition could not be entirely maintained
in the operationalized definition used in his study.
Attraction to group differs from interpersonal attraction in
that attraction to group is a group phenomenon whereas
interpersonal attraction is an individual process. Group
measures of interpersonal attraction, therefore, can be
obtained only through the imprecise aggregation of
individual attractions.
Janet Schriesheim (1980) examined group cohesiveness as
a moderator of dyadic leader-subordinate relations. In her
16
discussion of cohesiveness and group development,
Schriesheim noted that cohesiveness was associated with two
stages of Tuckman's (1965) four stage group development
process. In the norming stage, coheaiveneaa reaulta aa
group membera accept each other, the group atructure, and
the rolea the group haa developed for them. In the
performing atage, orientation toward taak becomea the focus
of group interactiona. Coheaiveneaa ia then associated with
acceptance of task-related rolea. Deapite the bidimenaional
conceptualization of coheaion, Schrieaheim operationalized
coheaion on one dimension and uaed Stogdill'a (1965) five
item aelf-report which aaka reapondenta to deacribe the
group of individuala who report to the aame auperviaor.
Turner, Hogg, Turner, and Smith (1984) examined failure
and defeat aa determinanta of group coheaiveneaa. They
choae to conceptualize coheaion aa attraction to group aince
it ia poaaible to produce poaitive attitudea towarda other
group membera even when there ia no interperaonal contact.
According to the authora, once people are defined aa membera
of a group, they perceive themaelvea aa having aimilar or
identical attributea that define the group aa a whole.
While being very aimilar to the coheaiveneaa aa manipulated
by Back (1951), the conceptualization of coheaion by Turner
and his associates is attraction to group, not interpersonal
attraction. Results of the study suggested that failure and
defeat can lead to increases in cohesion as attraction to
17

group since identification with the group helps justify and
explain behavior that incura a coat.
Dobbins and Zaccaro (1986) examined the effects of
group cohesiveness and leader behavior on subordinate satis
faction in a military organization. Although they addreaaed
taak related norma and taak clarity in their diacuaaion of
the definition of coheaion, they operationalized coheaion aa
the degree of attraction to the group.
Bidimenaional Approachea
Aa pointed out earlier, Featinger'a (1950) original
definition of coheaion waa bidimenaional (attraction to
group and meana control of the group) although the
operational definition (interperaonal attraction) waa
unitary. Groaa and Martin (1952) found three indicatora of
coheaion in a atudy of 13 women'a living groupa at a
univeraity and criticized the Featinger et al. unitary
definition. In a reply, Schachter (1952) regarded the
problem aa empirical, not theoretical. Eisman (1959) found
five different indicators of cohesion and also questioned
the nominal definition. In 1965, Hagstrom and Selvin
applied factor analysis to data collected from 20 women's
living groups at the University of California. Their
results suggested two dimensions of social satisfaction
(satisfaction with the group and social life) and
sociometric cohesion (the proportion of best friends in the
18

group). More important than the specific dimensions, the
authors suggested that different dimensions may be necessary
for differing conditions.
The controversy continued in the literature concerning
the dimensionality of cohesion. In 1978, Bednar and Kaul
reviewed the group psychotherapy research and criticized the
ambiguity of the construct, lack of agreement between
construct and operational definition, inadequate information
on a coheaiveneaa operational definition, and the difficulty
in comparing reaulta becauae of the many waya of
operationalizing the conatruct. Evana and Jarvia (1980)
alao reviewed the literature and noted that confuaion aroae
when attraction to group, an individual conatruct, waa uaed
to approximate coheaiveneaa, a group conatruct. They
auggeated aeparating the diatinct conatructa of attraction
to group and coheaiveneaa and later developed the Group
Attitude Scale aa a aeparate meaaure of attraction to group
(Evana and Jarvia, 1986). Researchers began to make a
distinction between cohesion at a group level (attraction to
group) and cohesion at an individual level (interpersonal
attraction). The separation of interpersonal cohesion and
attraction to group was supported by Wright and Duncan
(1986) who studied 27 graduate students in 12 weekly
experiential training sessions. Wright and Duncan found
that conceptualizing cohesion as attraction to group was
better than an interpersonal attraction definition when
19

using cohesion as a predictor of individual outcome in
groups.
Carron and Chelladurai (1981) specifically sought to
determine if cohesiveness is a single or multidimensional
construct. They studied 99 male athletes and administered
portions of the Sport Cohesiveness Questionnaire (Martens,
Landers, and Loy, 1972) over two occaaiona. Factor analyaia
revealed two factora accounting for 83.5% of the variance.
The firat factor waa labeled "individual to group coheaion"
and was the degree the individual perceived a sense of
association with the total group. The first factor
contained items measuring enjoyment, aenae of belonging, and
value of memberahip. The aecond factor waa labeled "group
aa a unit coheaion" and waa the individual'a perception of
the group aa a total unit. The aecond factor contained
items measuring teamwork and closeness. The two factors
identified by Carron and Chelladurai approximated the
previously used unitary dimensions of attraction to group
and interpersonal attraction. Carron and Chelladurai also
noted that although the perception of team cohesion was
moderated by the type of group membership (individual
performance and team performance), only task motivation
showed consistency across the two sport types.
Six years earlier, Anderson (1975) pointed out that
before understanding cohesion, it was first necessary to
make a distinction between types of groups. One type of
20

group is the friendship, psyche, or socioemotional group.
Members belong to them for emotional satisfaction. The
other type of group is the task oriented group that exists
to accomplish a task. Anderson also noted that these two
types of groups are not mutually exclusive and can be
present in all groups. His study using 386 female
undergraduates in task and socioemotional triads provided
support for attraction to the group and interpersonal
attraction dimensions of cohesion. More significantly,
however, Anderaon auggeated that while value aimilarity led
to interperaonal attraction, goal-path clarity in taak
oriented groupa led to a coheaiveneaa other than
interperaonal attraction.
Wheeleaa, Wheeleaa, and Dickaon-Markham (1982) examined
the aocial and taak dimenaiona of amall group communication
and developed a meaaure of group coheaion with 75
undergraduatea participating in a two-week aocial action
project. Wheeleaa et al. conceptualized coheaion aa
interperaonal attraction, but more importantly, they made a
diatinction between the aocial and taak dimensions of the
group.
Instead of keeping the task dimension separate from
cohesion, Tziner (1982) pointed out that two types of
cohesion exist: socioemotional cohesion and instrumental
(task) cohesion. Zaccaro and Lowe (1988) set out to
empirically verify this bidimensional nature of cohesion.
21
Hypothesizing the two dimensions of interpersonal and task
cohesion, they manipulated interpersonal cohesion by placing
subjects in the high interpersonal cohesion group in an
exercise designed to enhance member liking (e.g.,
introductions and discussion about themselves). Subjects in
the low interpersonal cohesion conditions performed an
exercise designed to inhibit member attraction and stimulate
perceived diaaimilarity. High-taak coheaive groupa received
a cover story that emphasized the importance of both the
atudy and the member taak performance. The taak waa folding
sheeta of paper into "moon tenta" in a 15 minute period.
The atudy ahowed that high taak coheaion increaaed group
performance while high group interperaonal coheaiveneaa did
not reault in any greater performance effort. Thua, by
using a bidimenaional approach, they were able to aee the
differing effecta of taak and interperaonal coheaion on
performance. Zaccaro and McCoy (1988) performed the aame
experiment with a diajunctive taak (i.e., the group muat
adopt a aingle aolution to the excluaion of all other
aolutiona). The factor analyaia done in their atudy alao
aupported the taak and interperaonal dimenaiona of coheaion.
Johnaon and Fortman (1988) examined the dimenaiona of
cohesion by uaing factor analyaia and cluster analysis on
the Gross Cohesivenesa Scale (Gross, 1957) administered to
144 undergraduates participating in an unrelated study. The
authors noted that although cohesion consists of social and
22

task cohesion, the Gross Cohesiveness Scale only measures
social cohesion. Additionally, their analysis supported
dividing social cohesion into affective and cognitive
components.
Anderson's (1975) distinctions between types of groups
highlights a major reason for the disagreement on the
interpretation of coheaion. Featinger et al. (1950)
originally uaed the coheaion concept with aocial groupa.
Thus, interperaonal attraction became important aa evidenced
by their operationalization of coheaion. Therapy group
researchers used the cohesion concept in determining how to
maintain group memberahip. Conaequently, attraction to
group became a major conaideration (Evana and Jarvia, 1986).
Aa aport teama and intact organizationa became intereated in
coheaion, the concept waa often linked to performance (e.g..
Ball and Carron, 1976). Taak coheaion then became aalient.
It appeara that the diaagreement over the dimenaiona of
coheaion may not originate from the concept itaelf, but
inatead reaulta from the varied applicationa of the concept.
With the identification of two diatinctiona in the
conceptualization of coheaion--the individual veraua the
group and taak veraua aocial concerna, it became neceaaary
to move to a multidimenaional conceptualization of cohesion.
Multidimensional Approaches
Yukelson, Weinberg, and Jackson (1984) modified items
contained in past cohesion studies, developed their own
23

items based on the literature, and interviewed coaches for
their perceptions on the dimensions of the cohesion concept.
They developed a 41 item instrument which they administered
to 196 male and female intercollegiate basketball players on
16 teams. Factor analysis revealed four factors. The first
factor was labeled quality of teamwork and represented a
sense of how well teammates work together toward successful
team performance. The second factor waa attraction to group
which aignified the attraction dimenaion of coheaion
previoualy uaed in unitary conceptualizationa. The third
factor waa unity of purpoae which reflected a commitment to
the norma and atrategiea the team waa atriving to achieve.
The final factor waa labeled valued rolea and reflected a
aenae of identification with group memberahip. The obvious
criticism of this atudy waa that although it recognized the
poaaible multidimenaionality of the coheaion concept, it waa
clearly poat hoc analyaia without any a priori theory driven
dimenaiona poaited.
Carron, Widmeyer, and Brawley (1985) attempted to aolve
the many equivocal reaulta coming from atudiea in coheaion.
They pointed out that inadequate meaaurement procedurea
stemmed from the lack of conceptual clarity in the cohesion
research. They proposed that cohesion consists of two
categories consisting of two constructs each. The first
category was labeled group integration which represented the
closeness, similarity, and bonding within the group as a
24

whole. Individual attractions to group was the second
category posited and represented the interaction of motives
working on the individual to remain in the group. Each
category then consisted of task and social orientations.
Thus, the distinction between group and individual
attractions, and task and social concerns were adopted in
the Carron et al. model.
Carron and his aaaociatea developed the Group
Environment Queationnaire (GEQ) which contained all four
dimenaiona of the coheaion concept. The GEQ waa
adminiatered to 247 athletea from 26 intact teama from
intercollegiate and municipal adult leaguea in Canada.
Factor analyaia aupported the authora' conceptualization.
Aaide from making the dimenaionality diatinctiona of the
coheaion concept, thia atudy waa noteworthy in the
realization of the impact of aocial deairability biaaea in
aelf-reporting coheaion in an intact team or organization.
Piper et al. (1983) examined the effecta of coheaion on
group memberahip in a therapeutic aetting. Uaing 45 adulta
in 9 therapy groupa. Piper and hia aaaociatea adminiatered
questionnaires to explore the different types of bonding
occurring in the groups. They pointed out that bonding may
occur between participants, between participanta and the
leader, and between participanta and the group. Factor
analysis confirmed the three types of bonding with
additional subtypes in each factor. Interestingly, Piper et
25

al. advocated that despite subtypes such as compatibility to
the group, mutual stimulation and effect, and compatibility
with the leader, only commitment to the group should be used
as a conceptualization of cohesion. They argued that
adopting a broad definition of cohesion brings in many more
group processes than suggested in the original Festinger et
al. (1950) formulation. Thus, although Piper et al.
confirmed the multidimensionality of cohesion, they proposed
to restrict cohesion to a narrow definition to avoid future
problems in conceptual clarity.
Military Coheaion
In the military context, coheaion ia often interpreted
aa aome level of bonding or aupport. Aa in the context-free
literature, the conceptualizationa have been unitary and
multidimenaional. A unitary conceptualization ia evidenced
by Manning and Fullerton (1988) who demonatrated that highly
coheaive unita provide their membera protection from the
stresses of military life. They argued that the
conceptualization of cohesion as interpersonal attraction
falls short of the cohesion as interpersonal bonding
characteristic in military units. They suggested instead
conceptualizing cohesion as social support which is an
individual's belief that he or she is cared for, loved,
esteemed, and a member of a network of mutual obligations.
They measured unit cohesion by asking soldiers for their
26

perceived social support from family, friends, unit, and
Army. Thus, cohesion was defined unitarily, but the support
group was multidimensional.
Many other military atudiea have focuaed on coheaion aa
the reaistance to diaintegration. Thia focua ia much like
the alternative nominal definition auggeated by Groaa and
Martin (1952) in their criticiam of Featinger et al. (1950).
In their classic study of World War II Wehrmacht soldiers,
Shils and Janowitz (1948) argued that:
When the individual's immediate group, and ita aupporting formationa, met hia baaic organic needa, offered him affection and eateem from both officera and comradea, aupplied him with a aenae of power and adequately regulated hia relationa with authority, the element of aelf-concern in battle, which would lead to diaruption of the effective functioning of hia primary group, waa minimized, (p. 281)
Significant in the Shila and Janowitz atudy waa the
incluaion of taak and aocial coheaion and the incluaion of
the role of the leader.
The definition offered by a atudy done at the National
Defenae Univeraity defines military coheaion aa the bonding
together of membera of a unit or organization in auch a way
aa to auatain their will and commitment to each other,
their unit, and the miaaion (Johna et al., 1984). The
dimensions found in this broad conceptualization of cohesion
can be viewed as peer, organizational, and task cohesion
(Henderson, 1985). By focusing on the bonding to others and
group, instead of attraction to others and group, the
definition focuses on the ability of the group to avoid
27

disintegration under stress. This definition is exemplary
of the current military view of cohesion. It should be
noted that this conceptualization specifically posits that
cohesion is positively related to mission accomplishment.
Siebold and Kelly (1988) hypothesized three types of
bonding in Army unita. Theae were horizontal bonding among
peera, vertical bonding between leadera and aubordinates,
and organizational bonding between all membera and their
unit and the Army. Each level of bonding alao had affective
and inatrumental componenta. An inatrument containing itema
reflecting the three dimenaiona waa given to 70 platoona
(1015 aoldiera) at four Army poata. Factor analyaia of the
data aupported the three dimenaiona and aubtypea. Siebold
and Kelly'a multidimenaional approach with affective and
inatrumental (taak) componenta ia certainly comprehenaive,
but auffera from much of what Piper et al. (1983) warned
againat: comprehenaiveneaa at the expenae of conceptual
clarity. For example, it ia difficult to aeparate the
bonding between aubordinatea and their leadera from
relationahip-oriented leaderahip.
Griffith (1988) aurveyed 8,869 aoldiera in 93 U.S. Army
companies and found four dimensions of cohesion with factor
analysis. The first factor was the quality of instrumental
and affective relationships among junior enlisted men
(peers). The second factor was the quality of relationships
between subordinates and their leaders. The third factor
28

was the internalization of Army values. The fourth factor
was soldier confidence in weaponry and leaders. The first
three factors can be viewed as analogous to the familiar
attraction to others, group, and leaders.
Little (1969) in his classic work, "Buddy Relations and
Combat Performance," observed American soldiers during the
Korean War. From hia obaervationa of coheaion and combat
performance. Little warned againat a broad conceptualization
of coheaion. He atated that:
Even in the amalleat unit there ia an "iron framework" of organization which aervea aa a baaia of aocial control. However, the contribution of theae reaearch findinga to military primary groupa haa often been overinterpreted and overextended to the point of creating a "human relationa" theory of organization which faila to give aufficient emphaaia to authority, power atructure, the environmental context, and organizational goala aufficient acope. (pp. 191-192)
The Piper et al. (1983), Etzioni (1975), and Little
(1969), atudiea are aimilar in that deapite many yeara and
many atudiea apent aearching for the varioua dimenaiona of
cohesion, these researchers suggested a move back to a
unitary conceptualization of cohesion. A narrow definition
permits the researcher to sharply focus on one aspect of
group dynamics called cohesion and then avoid labeling other
emerging group processes as dimensions of cohesion. The
many dimensions that arose in the literature may have been
an attempt to account for the unexplained variance due to
moderating and intervening variables. Unfortunately, such
variables and dimensions are endless (e.g., confidence in
29

weaponry as a dimension of cohesion?). Adding to the
confusion was the multitude of cohesion instruments that
evolved while the concept of cohesion was explored.
Phillipa, Blair, and Schmitt (1987) take a narrow
approach for the aame reaaons. In order to avoid a "human
relations theory" (Little, 1969) based on a multidimensional
conceptualization, their organizational synergy model uses a
narrow definition of cohesion. Somewhat similar to Etzioni
(1975), the authora define peer coheaion aa "the degree of
positive, affective relationships between peer group
members" (p. 152).
Coheaion and Performance
Stogdill'a (1972) review of the coheaion-performance
literature aet the tone for aubaequent reaearch into
clarifying the coheaion-performance relationahip. Stogdill
propoaed that there muat be aomething to give the coheaion
direction. In hia review, he auggeated that group drive
would provide the interactive effecta with coheaion.
Keller (1986) uaed Seaahore'a five item meaaurement of
coheaion aa attraction to group in hia atudy of performance
in research and development project groups. Using
independent variables of cohesiveness, physical propinquity,
job satisfaction, and innovative orientation, he found that
only cohesiveness significantly correlated with all four
criteria used to measure performance. It should be noted
30

that physical propinquity was suggested by Lott and Lott
(1965) as an antecedent of cohesion as interpersonal
attraction. in Keller's atudy, phyaical propinquity ahowed
no significant relationship with performance and was
independent of cohesiveness as attraction to group. The
construct of innovative orientation parallels that of
Stogdill's (1972) group drive in that it provided a
direction for the group's efforts.
Miesing and Preble (1985) examined cohesion in groups
participating in a complex business simulation. Cohesion
was found to be a significant factor in explaining high
performance. The researchera noted, however, that in order
to attain high performance in a aimulation aetting, high-
performance norma muat be preaent. Thia view ia aimilar to
that propoaed earlier by Seaahore (1954). High-performance
norma can be introduced by group proceaaea or through a
atrong and aecure leader willing to provide direction yet to
ahare power with group membera.
Tziner and Vardi (1982) attempted to teat the effecta
of different combinationa of group coheaiveneaa and command
style on the performance effectiveness of active tank crews.
Level of cohesivenesa waa determined by comparing who the
subjects had for their tank crew versus their desires of who
they wanted in their crew. The results showed performance
effectiveness increased in combinations of low cohesiveness
with people oriented command style and high cohesiveness
31

with a command style oriented to both people and task.
Tziner and Vardi noted that their conceptualization of
cohesion focused on interpersonal relations. Thus, by
definition, this aspect of the group may not necessarily
contribute directly to performance effectiveness. Group
norms, ability, and size may moderate effectiveness more
than interpersonal attraction.
Interestingly, Tziner and Vardi (1982) noted that
personal compatibility may be inadequate as a measure of
cohesiveness They suggested future reaearch in examining
inatrumental or taak relationahipa to include a notion of
the norma involved in determining performance. Tziner and
Vardi'a atudy can be compared with the poaition taken by
Etzioni (1975). He argued that actora will have "poaitive
emotional inveatment in each other and that theae
inveatmenta ... are governed by norma" (p. 280). When
conaidering coheaion aa interperaonal attraction and ita
relationahip to performance, the valence of group norma
becomes important. This parallels Seashore's (1954)
moderating role of norms.
Williams and Hacker (1982) examined whether team
cohesion in women's intercollegiate field hockey was a cause
for or an effect of aucceaaful aport performance. Their
study was prompted by the many studies advocating a positive
relationship between cohesion and performance in sport teams
(e.g.. Ball & Carron, 1976; Martens & Peterson, 1971;
32

widmeyer & Martens, 1978). The authors conceptualized
cohesion as the unity of a team and was operationalized as
seven items measuring interpersonal attraction, personal
power or influence, value membership, sense of belonging,
enjoyment, teamwork, and closeness. Their results showed a
causal flow from succeaa to increaaed coheaiveneaa and from
increased cohesiveness to greater satisfaction. Thus, they
noted that while coaches may not need to be concerned with
building cohesivenesa (friendahipa) in order for their team
to be more aucceaaful, coheaiveneaa may atill be important
aince it leada to more aatiafaction. Nevertheleaa, the
Williama and Hacker atudy providea no aupport for the
coheaion-performance link.
Zaccaro and Lowe (1988) manipulated taak baaed coheaion
and interperaonal coheaion for aubjecta required to perform
an additive taak. The atudy'a findinga ahowed that high
taak coheaion facilitatea performance, whereaa interperaonal
attraction had no effect. Zaccaro and McCoy (1988)
manipulated taak and interperaonal coheaion for aubjecta
performing a diajunctive taak and found that both types were
necessary for higher performance.
The Seashore (1954), Stogdill (1972), Tziner and Vardi
(1982), Etzioni, (1975), and Miesing and Preble (1985)
studies all point to the need for direction in the form of
"high-performance norms," "group drive," or "innovative
orientation" to clarify the cohesion-performance linkage.
33

The cohesion literature shows an evolutionary process
in the conceptualization of the construct. As researchers
attempted to broaden the use of the cohesion construct, the
conceptualization of the construct itself began to broaden.
With multidimensional views, the link to performance became
increasingly ambiguous. The cohesion-performance
literature showa the utility of a narrow conceptualization
of coheaion with aome interactive conatruct providing
direction. Taak coheaion can be viewed aa interperaonal
attraction baaed on a mutual deaire to accompliah a goal.
Thua, it may be beneficial to reatrict coheaion to
interperaonal attraction and then add goal acceptance or
norma aa aeparate componenta of a model to ahow the
coheaion-performance relationahip. The organizational
synergy model assumes a narrow conceptualization of cohesion
and introduces direction through organizational commitment
and leadership. The next part of this literature review
concerns the construct of organizational commitment.
Organizational Commitment
Conceptualizations of organizational commitment have
gone through a developmental process similar to that of
cohesion. An extensive review of the theoretical and
empirical work done on the concept of organizational
commitment is found in Mowday, Porter, and Steers' (1982)
book on the psychology of commitment and other employee-
organization linkage variables. Reichers (1985) also
34

reviewed the commitment literature and current
conceptualizations. Instead of a similar extensive review
of the literature, this literature review will focus on
possible alternative conceptualizations of organizational
commitment, and more importantly, the link from
organizational commitment to performance.
Conceptualizations of Organizational Commitment
Reichers (1985) pointed out three possible
conceptualizationa of organizational commitment. The firat
definition ia baaed on Becker'a (1960) notion of aide beta.
With thia definition, commitment ia a function of the coata
and benefita aaaociated with organizational memberahip. A
aide bet conceptualization aaaumea that individuala atake
aome unrelated aapect of their Uvea on continued
organizational memberahip. For example, individuala can
have increaaed commitment due to atatua, age, tenure, or the
possession of organization-specific skills. Becker's side
bet conceptualization haa been uaed by reaearchera auch aa
Hrebiniak and Alluto (1972), Farrell and Ruabult (1981), and
Sheldon (1971).
The second conceptualization of organizational
commitment takes an attributional approach. With this
approach, attributions are made in order to maintain
consistency between one's behavior and attitudes. Salancik
(1977) argued that behaviors that are explicit, irrevocable,
35

volitional, and public bind the individual to the behavior
and hence increase organizational commitment. This approach
is also supported by the work of O'Reilly and Caldwell
(1980).
The third conceptualization found in the organizational
commitment literature views commitment aa occurring when
individuala identify with and extend effort towarda
organizational goala and valuea. The moat common veraion of
thia goal congruence conceptualization ia that of Porter,
Steera, Mowday, and Boulian (1974) and later popularized by
Mowday, Porter, and Steera (1982). Porter et al. (1974)
poaited that organizational commitment conaiata of (a) a
belief in and acceptance of organizational goala and valuea,
(b) the willingneaa to exert effort towarda organizational
goal accompliahment, and (c) a atrong deaire to maintain
organizational memberahip. Thia view of organizational
commitment ia much like that of coheaion except it ia at a
higher level of analyaia.
Organizational Commitment and Performance
Moat of the atudiea examining organizational commitment
have either viewed it aa a dependent variable or aa an
independent variable in the prediction of turnover and
abaenteeiam. Concerning the main effect of organizational
commitment and performance, Meyer and Allen (1984; Allen &
Meyer, 1987) made an intereating diatinction between the
36

Becker (1960) aide bet conceptualization and Porter'a (1974,
1982) goal congruence definition. They uaed the terms
c^ntj-nuance commitm. nt and affective commitment,
respectively, to characterize the two approaches. Although
both conceptualizations reflect links between the employee
and the organization, the nature of the links is quite
different. In the goal congruence conceptualization,
employees remain with the organization because they want to
do so, whereas those individuala with the aj^e bet
commitment remain becauae they need to do ao. Meyer et al.
(1989) examined the relationahip of affective and
continuance commitment to performance in a atudy of food
aervice organization managera in Canada. Performance waa
meaaured by auperviaor ratinga. The atudy found that
affective (goal congruence) commitment correlated poaitively
with performance while continuance (aide bet) commitment
correlated negatively.
O'Reilly and Chatman (1986) alao provided aupport for a
main effect relationahip between goal congruence commitment
and performance. In their atudy, aide bet commitment waa
poaited aa being derived from Kelman'a (1958) compliance
basis for attitude change. Similarly, goal congruence
commitment was posited as being derived from the
internalization or identification bases for attitude change.
Their findings suggested that commitments based on
internalization or identification are important correlates
37

of individuals' willingness to expend time, effort, and
money on behalf of the organization. Commitments based on
compliance, on the other hand, were significantly correlated
only with an intent to stay with the organization.
Angle and Perry (1981) examined the organizational
commitment relationship to performance with a sample of 24
bus aervice organizationa. Uaing the goal congruence
commitment, their findinga indicated that organizational
commitment waa aaaociated with organizational adaptability,
turnover, and tardineaa rate, but not with the operating
coata performance meaaure.
Decotiia and Summera (1987) uaed a goal congruence
approach in their atudy of 367 managerial employeea.
Intereatingly, they found that organizational commitment waa
predictive of individual motivation and objective job
performance, but not of auperviaora' ratinga of job
performance.
Leaderahip
After reviewing aeveral thouaand empirical atudiea of
leadership, Stogdill (1974) failed to find any single type
of leader behavior consistently related to higher
performance. Leadership then either moderates other
relationships or is moderated by other factors in its
relationship to performance. The two models to be tested in
this study approach the leadership-performance link
differently. The Phillips et al. (1987) model assigns
38

leadership a direct effect on performance and interactive
effects with organizational commitment and cohesion. The
Schriesheim et al. (1979) model posits that leadership has
no direct effect yet is moderated by cohesion and group
drive. This section of the literature review consists of
three parts. The first part reviews the literature
examining the roles of leadership and cohesion in relation
to performance. The aecond part examinea the atudiea
addreaaing leaderahip, and group drive. Finally, a akilla
approach to leaderahip ia diacuaaed aince thia atudy
examinea the poaaibility of auch an approach. More detailed
reviewa of the leaderahip field can be found in recent
reviewa by Yukl (1989a, 1989b), Smith and Peteraon (1989),
and Baaa (1990).
Leaderahip and Coheaion
Throughout the development of the leaderahip field,
reaearchera have aought to find a conaiatent element related
to leader effectiveneaa. After reaearcher failed to find
univeral traita that led to leader effectiveneaa,
researchers began examining leader behaviors. The search
continued, except instead of traits, universally effective
leader behaviors were studied (e.g., Blake and Mouton,
1964). In the early 1960's, the focus of leadership
researchers shifted to the realization that situational
factors interacted with leader behavior to produce differing
39
degrees of effectiveness. A trend through many of the
leader behavior studies, however, was the dichotomization of
behaviors into instrumental and supportive (task and
relationship, initiating structure and consideration)
behaviors (e.g., Schriesheim & Stogdill, 1975; Likert, 1967;
Hersey & Blanchard, 1977). It should be noted that the
cohesion literature, aa diacuaaed earlier, developed in a
similar manner with taak and aocial diatinctiona.
One of the firat aituational leaderahip theoriea to
conaider the interaction of leaderahip and coheaion waa
Houae's (Houae, 1971) path-goal theory. According to thia
theory, atructuring leader behaviora are effective and
acceptable to a aubordinate only if the work environment
lacka other aourcea of role clarification auch aa coheaion.
Schrieaheim (1980) argued that coheaion ia aaaociated with
acceptance of taak-related rolea. In her atudy,
Schrieaheim examined the moderator effecta of coheaion on
leaderahip. Her findinga aupported the hypotheaia that
leader atructuring behavior waa more poaitively related with
performance in groupa with low coheaion. Converaely, her
atudy alao found that leader conaideration ia more
positively related to performance in groups with high
cohesion. It should be noted, however, that the study used
a self-rated performance measure. Social desirability
biases are probable with such methods.
Tziner and Vardi (1982) studied the performance of tank
40

crews under different combinations of group cohesion and
leader style. Interestingly, their findings were opposite
those of Schriesheim (1980). In the Tziner and Vardi study,
groups with low cohesion performed better with a leadership
style that emphasized a people orientation. Groups with
high cohesion performed better with leaders using a task-
oriented command style. The conflicting findings can be
resolved when considering the groups analyzed in each study.
Schriesheim studied public utility workers with over 70% of
the subjects being clerical workers. In her atudy, role
clarification waa a major factor in determining self-rated
performance. It would be expected that task-oriented leader
style would provide the role clarification not provided by
group cohesion.
In the Tziner and Vardi study, the groups were tank
crews who had well defined roles. Groups with low cohesion
were not lacking role clarity, but inatead lacked
interperaonal attraction. Thua, in the latter atudy,
aupportive leader behavior waa more effective in groupa with
low coheaion. The diacrepanciea between the atudiea can be
seen as resulting from the conceptualization of cohesion
discussed earlier. Schriesheim viewed low cohesion as
lacking role clarity. Tziner and Vardi viewed low cohesion
as lacking personal attraction. It should be noted that
this study uses a conceptualization more in line with the
Tziner and Vardi study.
41
Fiedler (1967), in his contingency model of leadership,
addressed the interaction of leadership and cohesion in the
assessment of the leader-member relations component of the
situational favorableness scale. The underlying hypothesis
for the use of cohesion as an element of the leader-member
relations scale is derived from Fiedler's (1958) work.
Specifically, Fiedler hypothesized that the leader's ability
to contribute to the group's productivity requires that the
group's structure enable him to communicate effectively with
all membera, and that the membera be willing to follow the
directiona of the leader. Fiedler pointa out that coheaion
fulfilla the taak of providing atructure to allow the leader
to communicate with the group and allowa the leader to
devote his influence to the task rather than having to
direct his efforts mainly toward group maintenance. Fiedler
and Garcia (1987) alao aummarized the leader member
relationa reaearch which includea coheaion. Other
leaderahip reaearch that addreaaea coheaion can be found in
comprehenaive reviewa auch aa Baaa (1990).
In another atudy, Fiedler (1963) uaed four aeparate
experimenta that provided conaiatent aupport that the
leader'a intelligence predicta group performance in coheaive
groups, but not in uncohesive groups. He argued that the
leader directly influences the effectiveness of the group
only if the group is cohesive. If the group is uncohesive,
the power of the leader is diverted from performance to
42
maintenance of the group. This assertion contradicts the
organizational synergy model (Phillips et al., 1987) which
proposes that a leader can overcome the low cohesion of a
group and still directly affect performance.
Kerr and Jermier (1978) addressed the effect of
cohesion on leadership and proposed that group cohesion can
reduce the effectiveneaa of both aupportive and inatrumental
leader behavior. Their argumenta for their hypotheaia
parallel thoae given by Schrieaheim (1980) and Tziner and
Vardi (1982). Kerr and hia colleaguea (Howell et al., 1990)
later modified their position and stated that an enhancer
for leader directiveneaa and aupportiveneaa ia the creation
of coheaive work groupa with high performance norma. Thua,
coheaion enhancea leaderahip rather than merely aubatituting
for it.
Leaderahip and Group Drive
Early behavioral reaearchera auch aa Lewin, Lippitt,
and White (1939) provided the baaia for aupport that
instrumental and supportive leadership positively impacted
on group drive. Group drive is conceptualized as
representing the "intensity with which members invest
expectation and energy on^ehalf of the group." (Stogdill,
p. 27). Schriesheim et al. (1979) cite a study
done by Greene and Schriesheim (1977) that found that both
types of leader behaviors led to group drive. More
recently, Podsakoff and Todor (1985) examined the
43

relationship of leader reward and punishment behavior with
group drive. They found that leader contingent reward and
contingent punishment behavior was positively related to
group drive. They also found that noncontingent punishment
and reward behavior were negatively related to group drive.
In this present atudy, leaderahip ia viewed with two
perspectives. In the organizational synergy model (Phillips
et al., 1987), no distinction is made between instrumental
or supportive leadership. Indeed, the model simply aaaerts
that effective leaderahip interacta with coheaion and
organizational commitment. The leader-group interactiona
model, on the other hand, uaea the familiar dichotomy of
inatrumental and aupportive leaderahip. In keeping with the
original model formulationa, the atudy will uae a leader
effectiveneaa rating baaed on leader competenciea for the
organizational aynergy model and a dichotomized leaderahip
rating (inatrumental and aupportive) for the leader-
interactiona model.
A Skilla Approach to Leaderahip
The majority of recent leaderahip theoriea have dealt
with leader behaviora. Reaearchera have deacribed what
leaders do, what leaders should do to be more effective, and
what leaders should do in order to be more effective in
different leadership situations (Wright & Taylor, 1984).
Consequently, leader behavior was described in very general
44

terms (e.g., democratic, autocratic, considerate,
authoritarian, relationship-oriented, task-oriented).
Unfortunately, the theories do not specify how to perform
this type of behavior. Thus, a well meaning, but
incompetent democratic leader can destroy an organization.
As Wright and Taylor (1984) pointed out, "it is not merely
what leaders do, but how well they do it which determines
how effective they are" (p. 15). A akilla approach to
leaderahip (e.g., Katz, 1955; Hollander, 1960; Miachel,
1968) attempta to account for thia notion of competency of
the leader.
Thia atudy alao uaea a akilla approach to leaderahip
due to a practical conaideration of the atudy. The atudy
focuaea on organizational leadera who are placed in the role
of a leader with organizational atructure already in place
and organizational objectivea already eatabliahed. If
lieutenanta become platoon leadera by fiat, then a major
concern ia how to develop the lieutenanta prior to them
becoming platoon leadera. Skilla can be developed and theae
may later prove to be the baaea for leader behaviora. For
the purpoaea of leader training, a akilla approach to
leadership is advantageous.
The skills addressed in this study are similar to
Clement and Ayres' (1976) nine leader competencies. Clement
and Ayres pointed out that their nine competencies were
developed to "classify skills and competencies representing
45

essential requirements for effective organizational
leadership functioning" (p. 4). The nine leader skills
proposed in their study are: communication, human
relations, counseling, supervision, technical, management
science, decision making, planning, and ethics.
Importantly, they also proposed that necessary leadership
skills vary according to organizational level. Thus, at the
platoon leader level, Clement and Ayres would argue that
communication, human relations, counseling, supervision, and
technical skills are more relevant to performance. The
skill approach to leaderahip cloaely parallela the
competenciea propoaed by Quinn (1988), Mintzberg (1973),
Wright and Taylor (1984), or Kotter (1982).
46

CHAPTER III
THE THEORETICAL SETTING
The review of the coheaion literature pointa out that
the cohesion-performance relationship has not been
consistently empirically supported. The two modela teated
in this study attempt to clarify the relationship by
bringing in leadership and group processes.
The Organizational Synergy Model
According to Phillips, Blair, and Schmitt (1987),
organizational synergy may be viewed as consisting of three
main and interactional components: peer cohesion,
leaderahip, and organizational commitment. Organizational
aynergy ia more than the aum of ita componenta. Inatead,
organizational aynergy ia a quantum leap in performance due
to the interactive nature of ita componenta. Peer coheaion
ia defined aa the degree of poaitive, affective
relationahipa between peer group membera. Leaderahip ia not
apecified exactly, but the authora auggeat leader behaviora
ranging from initiating atructure and conaideration to
Bass's (1985) model of transactional and transformational
leadership. Whatever method of operationalizing is used,
the authors state that the focus is on effective leadership.
Finally, the authors suggest a definition of organizational
commitment such as that posited by Mowday, Porter, and
Steers (1982). In this conceptualization, organizational
47

commitment can be portrayed as having three major
components: (a) a person's strong belief in and an
acceptance of the organization's goals, (b) a person's
willingness to exert considerable effort on behalf of the
organization, and a (c) a person's definite desire to
maintain membership (Porter et al., 1974).
In the military context, the role of organizational
commitment in the organizational synergy model can be viewed
as a mid-range response to the extreme views of military
cohesion. Prior to World War II, military researchers
stressed that military cohesion was to a great extent a
function of the belief in the "rightness" of the larger
cause which was at issue in the war (e.g., the "Why We
Fight" films prior to WWII). After the war, Shils and
Janowitz (1948) found that the tenacity of the Wehrmacht was
not due to ideological reasons, but due to the bonds of the
primary group. Gabriel and Savage (1978) took this view to
the extreme by asserting that for the German soldier, "the
"cause," Nazi ideology, or even nationalism, waa never the
driving force in hia capacity to fight" (p. 36). Inatead,
Gabriel and Savage attribute coheaion with effective leader
ship as the main aspect of unit effectiveness. The organi
zational synergy model softens the Gabriel and Savage ap
proach and re-introduces the "larger cause" through the
construct of organizational commitment.
48

The components of organizational synergy can have both
main and interactive effects, except for peer cohesion which
only has an interactive effect on increased performance.
The essence of the organizational synergy concept can be
seen in the equation:
OS = L + OC + (L X OC) + (C X L) + (C x OC) + (C x L x OC)
where OS = organizational synergy, C = peer cohesion, L =
leader effectiveness, and OC = organizational commitment.
Phillips et al. (1987) provided six examples to illustrate
the interactive aspects of the model. They can be summa
rized as follows:
Case 1: Peer cohesion is very high, leader influence
is low, and organizational commitment is low. In this case,
organizational synergy and hence performance would be low
despite the high coheaion. Thia condition waa exemplified
in the Hawthorne atudiea.
Caae 2: Peer coheaion ia very high, leader influence
is very high, and organizational commitment is relatively
low. In this situation, organizational synergy would be
high due to the interaction between cohesion and leadership.
This is the condition described by Shils and Janowitz (1948)
when analyzing the German Army during World War II.
Case 3: Peer cohesion is low, leader influence is
high, and organizational commitment is low. In this
situation, the model suggests a moderate degree of
organizational synergy due to leadership. Leadership thus
49

overcomes the negative effects of cohesion and poor
organizational commitment.
Case 4: Peer cohesion is low, leader influence is
high, and organizational commitment is fair. This situation
would result in higher organizational synergy than described
in Case 3 due to the interactive leadership and organiza
tional commitment effect in addition to main effects.
Case 5: Peer cohesion is high, leader influence is
low, and organizational commitment ia high. In this situa
tion, the model asserts that in spite of the leader, organi
zational synergy may still be high.
Case 6: All componenta are high. Thia ia the
aituation that Phillipa et al. (1987) argue organizational
synergy takes place. Performance goes beyond a mere
additive effect of cohesion, leadership, and organizational
commitment. Inatead, the additive effect ia enhanced by the
powerful interactive effecta.
Peer coheaion will lead to greater aynergy only when
combined with linkagea to the leader, to the organization,
or to both. Peer coheaion, by itaelf, can have no impact on
unit performance. Thua, unit performance will be influenced
by the main effecta of leaderahip and organizational
commitment, and the interactive effecta of any combination
of the three componenta of organizational synergy. The
model posits that the key components may substitute for one
another. That is, there can be effective unit performance
50

without a high degree of peer cohesion, if there is
effective leadership or a high degree of organizational
commitment. Organizational synergy will be the highest,
however, when all three components are high.
Leader-group Interactions Model
Schriesheim, Mowday, and Stogdill (1979) proposed a
leader-group interactions model that is similar to the model
posited by Phillips et al. (1987). Like the organizational
synergy model, the leader-group interactions model rests on
the proposition that coheaion doea not have a direct effect
on performance. The modela differ in the role of leaderahip
and the direct effect of organizational commitment on per
formance. In the Phillipa et al. model, leaderahip haa an
interactive effect with coheaion on performance. In the
Schrieaheim et al. model, leaderahip ia an antecedent to
group drive and group coheaion. Group drive ia the group'a
vigor or enthuaiaam (Stogdill, 1972) that parallela the
willingneaa-to-expend-effort component of the Porter et al.
(1974) conceptualization of organizational commitment. Goal
acceptance ia the parallel conatruct to the ahared values
and goals component of the Porter et al. conceptualization
of organizational commitment. The essence of the
Schriesheim et al. model is that leader behavior influences
group performance through its impact on group drive and
cohesion. Group drive and cohesion interact and are
moderated by group goal acceptance. The leader-group
51

interaction model indicates that group performance is more
highly related to the group characteristics of drive and
cohesiveness than to leadership. This is contrasted by the
organizational synergy model's asaertion that leaderahip can
have a direct effect on group performance and can overcome
the low coheaion and low organizational commitment.
Integrating the commitment literature with the coheaion
literature, it ia poaaible to aee a dual role for
organizational commitment in the organizational aynergy
model. Firat, the coheaion literature auggeata a need for a
normative moderator to clarify the coheaion-performance
relationahip. The goal congruence conceptualization of
organizational commitment bringa into the model ahared
valuea and direction for the coheaion exiating in the group.
Second, the commitment-performance literature auggeata that
the goal congruence commitment conceptualization alao haa a
main effect on performance (e.g., Decotiia & Summera, 1987).
The organizational aynergy model adopta both theae viewa in
poaiting a moderator effect upon coheaion and a direct
effect upon performance from organizational commitment.
The Schrieaheim et al. (1979) model doea not uae the
label organizational commitment. Inatead, the leader-group
interactions model divides the previously discussed Porter
et al. (1974) conceptualization into group drive and group
goal acceptance. Group drive is conceptualized as
representing the "intensity with which members invest
52

expectation and energy on behalf of the group" (Stogdill,
p. 27). This definition parallels the willingness to expend
effort component of the Porter et al. (1974)
conceptualization of organizational commitment except it is
at the group level instead of the organizational level.
Likewise, the group goal acceptance component of the
Schriesheim et al. model parallels the shared values and
goals component of the Porter et al. (1974) definition.
Schriesheim et al. posit that group drive provides
motivation while the goal acceptance provides the direction
of the energy of the group. One can see how it strongly
parallels the organizational synergy model by dissecting the
organizational commitment conceptualization into the two
components of group drive and group goal acceptance.
Empirical support of the effects of group drive and
goal acceptance was provided by a atudy done by Greene
(1989). In hia atudy, goal acceptance, and to a leaaer
degree, group drive were identified aa aourcea of variance
in productivity and both were found to moderate the
relationship between cohesion and productivity. The
findings suggest, contrary to the Schriesheim et al. (1979)
model, that group goal acceptance is antecedent to group
drive. Greene qualified his findings, however, by raising
the possibility that causation may be hard to interpret due
to his use of developing rather than mature groups. For the
purposes of this study, however, Greene's findings provide
53

empirical support for the moderating effects of group drive
and goal acceptance on the cohesion and performance rela
tionship.
Hypotheses
The hypotheses tested in this study can be categorized
by each model. For the organizational synergy model, the
hypotheses are:
H j : Cohesion will not have a direct effect on
performance.
H2: Effective leadership will have a direct, positive
effect on performance.
H^: Organizational commitment will have a positive,
direct effect on performance.
H^: Effective leadership and organizational commitment
will have an interactive effect on performance.
He: Coheaion and leaderahip will have an interactive
effect on performance.
H/-: Coheaion and organizational commitment will have
an interactive effect on performance.
HT: Coheaion, organizational commitment, and
leaderahip will have an interative effect on performance.
The organizational aynergy model doea not hypotheaize a
direct effect of coheaion on performance. H-j is included as
a test of the null hypothesis.
54

The hypotheses based on the leader-group interactions
model are:
Kg: Neither instrumental nor supportive leader behav
iors will have a direct effect on performance.
Hg: Instrumental and supportive leader behaviors will
have a positive, direct effect on group drive.
H-J Q: Instrumental and supportive leader behaviors will
have a positive, direct effect on cohesion.
Hii: Group drive, coheaion, and goal acceptance will
have an interactive effect on performance.
H-|2* Group drive will not have a direct effect on
performance.
H]_3: Group goal acceptance will not have a direct
effect on performance.
Aa with the teat of the organizational aynergy model,
several null hypotheses were included to verify the
postulates of the model. Thus, Hg, H ^ , and H-|2 were
included.
55

CHAPTER IV
RESEARCH DESIGN
Method
Approximately two weeks prior to deployment to the
National Training Center, U. S. Army units were administered
instruments by Army Research Institute researchers. Items
from this questionnaire were aggregated at the platoon level
to operationalize the constructs of cohesion, organizational
commitment, group goal acceptance, group drive, instrumental
leadership, supportive leaderahip, and leaderahip
effectiveneaa. During the actual rotation at the National
Training Center, the unita were evaluated on a aeriea of
miaaiona to include attacka, defenaea, movementa, and live
fire exerciaea. Subject matter experta accompanied each
unit and gave a rating of aucceaaful or unaucceaaful per
formance.
The data were aubjected to a confirmatory factor
analyaia uaing LISREL 7 (Joreakog and Sorbom, 1989). Once
the meaaurement model waa aaaeaaed, the hypotheaea were
teated uaing linear regreaaion. LISREL waa not uaed for all
tests due to the large number of interactive relationships.
A detailed discussion of the methodology used in this study
follows.
Sample
The sample consists of 101 platoons from U.S. Army
armor and infantry units. Forty-two platoons were infantry
56
platoons and fifty-nine were armor platoons. An armor
platoon contains sixteen men and an infantry platoon
contains thirty-two men. The data were collected from four
rotations (separate deployments) at the National Training
Center.
The unit of analysis for this study is the platoon.
Figure 4.1 shows the organizational structure of the two
types of platoons uaed in thia analyaia. Coheaion,
organizational commitment, group drive, and group goal
acceptance are meaaured at the platoon level by aggregating
individual reaponaea. Leaderahip concerna the leaderahip of
apecific platoon leadera, except for the meaaurement of
aupportive leaderahip which could only be meaaured by uaing
the aubordinate leadera' perception of platoon leaderahip in
general (i.e., the platoon leader or the platoon aergeant).
Thus, any findings including the supportive leadership
construct must be qualified by pointing out that the process
of leadership is the focus rather than a single individual's
behaviors. Performance is also measured at the platoon
level. Haney (1980) noted that there are four
considerations when addressing unit of analysis: (a)
purpose, (b) evaluation design, (c) statistical
considerations, and (d) practical considerations. The
following discussion will address the level of analysis used
in this study in relation to these considerations.
57

The purpose of both models being tested is to determine
effectiveness at the unit level while considering group
processes. Indeed, the main construct in the study is
cohesion which is a group construct. In the military con
text, early researchers such as Shils and Janowitz (1948)
implied that squad or team level was where cohesion was moat
important. In a military organization, companiea are
compriaed of platoona which are aubdivided into aquada which
are divided into teams. Marlowe et al. (1985) argued that
the coheaion waa beat atudied at the company level. It ia
at the platoon level, however, that aoldiera are often croaa
attached to other unita. Additionally, the coheaion at the
aquad level ia often affected by policiea at the platoon
level. The preaent atudy uaea data gathered from an
inatrument uaing a platoon level of analyaia in the phraaing
of the itema concerning coheaion. Thua, coheaion ia the
aggregation of individuala' reaponaea about their
perceptiona of the platoon'a coheaion. Additionally, the
deaign of the National Training Center'a evaluation ayatem
providea a performance rating at the platoon level and
higher.
Statiatical conaiderationa include the effect on
reliability of aggregating individual reaponaea at the
platoon level as opposed to using only individual responses.
Shaycroft (1962) proposed that group mean reliability will
be higher than individual score reliabilities. When
58
aggregating, the expected value of the error term approaches
zero. Justification for aggregation is also provided by
Schneider and Bowen (1985) and Schneider (1975, 1983) and
George (1990). A disadvantage of using a platoon level of
analysis is the reduced sample size. Since structural
equation modeling usually requires a large sample size, a
reduced N may affect the significance of the findings.
A practical consideration when addressing the unit of
analysis issue is determining how to mitigate the impact of
missing data. By uaing the platoon level, a low reaponae
rate in a particular aquad ia not problematic aince the unit
of analyaia ia ahifted to the higher platoon level. It muat
be aaaumed, however, that the reapondenta that are
aggregated at the platoon level are repreaentative of the
entire platoon. For the infantry platoona, the mean number
of aquad membera who were aggregated to meaaure group
conatructa of coheaion, group goal acceptance, group drive,
and organizational commitment waa 14.6 aoldiera. For armor
platoons, it ^^^ Q - 7 qnl (;i-i pra. The mean number of squad
leaders in infantry platoons aggregated to measure
leadership was 3.4 sergeants. For armor platoons, the mean
number of tank commanders (squad leaders and platoon
sergeant) was 2.5 sergeants.
Rousseau (1985) also argued that when unit
characteristics are to be assessed through perceptual data,
the unit members should be divided into groups to avoid
59

common method bias. In this study, cohesion, organizational
commitment (to include group drive, and group goal
acceptance) were measured using perceptiona by the aquad
members. Leadership of the platoon leader was assessed by
the perceptions of the squad leaders and the platoon
sergeant (the subordinate leaders). Finally, performance
was determined by the subject matter experts. Common method
bias is minimized in this study since the constructs are
measured using three different sources.
The present atudy takea individual perceptiona
concerning group proceaaea and examinea the affect upon
group performance. Eaaentially, all conatructa are raiaed
to the group level. Another method that may have been uaed
ia the varient paradigm (Danaereau, Alutto, & Yammarino,
1984) . The unique aapect of the varient approach ia that it
allowa one to conduct analyaea that permit choicea among
hypotheaized relationahipa among variablea at multiple
levela of analyaia.
Operationalization of the Conatructa
The itema were taken from a larger 17 page inatrument
administered by the Army Research Institute. In the
organizational synergy model, cohesion was operationalized
by using responses from the squad members (not the leaders)
to two items:
60

A. Almost All
B. Most
C. Some
D. Few
E. Nearly None
C12. of the squad members in this platoon trust each other.
C13. of the squad members in this platoon care about each other.
As stated earlier, the organizational synergy model
advocated a narrow definition of cohesion along the lines of
the Etzioni (1975) conceptualization. The two items shown
above focus sharply on the affective bonds between group
membera and exclude other factora auch aa attraction to the
group. It ahould be noted that the coheaion evaluated by
the itema ia only between aquad membera. Thua, a coheaion
between aquad membera and aquad leadera (vertical coheaion)
ia not being addreaaed. Thia ia a key aapect of the organi
zational aynergy conceptualization of coheaion. Theae two
itema, aa well aa all the itema in the inatrument, were
reverse coded. With reverse coding, higher numbers reflect
higher levels of the construct being measured.
Organizational commitment in the organizational synergy
model is composed of three facets: (a) a belief and
acceptance of organizational goals, and values, (b) a
willingness to exert effort toward organizational goal
accomplishment, and (c) a strong desire to maintain
organizational membership (Porter et al., 1974). Two items
from the squad member instruments were used to
61

operationalize the belief and acceptance of organizational
goals and values (group goal acceptance).
A. B. C. D. E. Almost Most Some Few Nearly All None
CI. of the squad members in this platoon uphold and support Army values such as loyalty, honesty, and devotion to duty.
Cll. of the squad members feel they are serving their country.
One item also from the squad member instrument was used to
measure willingness to exert effort towards organizational
goal accomplishment (group drive).
A. B. C. D. E. Very More than About the Less than Very Hard Most Same as Most Little
People Most People People
CDl. How hard do you work and try to do as good a job as possible?
Two items from squad members were used to operationalize the
willingness to maintain organizational membership (group
membership).
A. Almost All
CA8. platoon.
B. C. D. E. Most Some Few Nearly
None
of the squad members are proud to be i
A. B. C. D. E. Strongly Agree Neither Disagree Strongly Agree Agree Nor Disagree
Disagree
CA14. In combat, I would rather serve with this platoon than with some other platoon.
62

A key issue here is the level of analysis when
addressing the organization. In operationalizing the goal
acceptance component of organizational commitment, the items
infer that the organization is the Army as a whole. The
group effort component moves away from the Army aa the
organization and leavea the reapondent free to decide to
which goala the item refera. The group memberahip component
of organizational commitment ia meaaured by itema referring
to memberahip to the platoon rather than the Army. Thua, a
limitation in uaing theae itema ia that the organization to
which commitment may be directed may be the Army, the
platoon, or even the reapondent'a company or battalion.
Leaderahip aa deacribed in the organizational aynergy
model ia equated with hierarchical coheaion. The authora
atate, however that "the aame factora that reault in
effective leaderahip in general alao reault in improving
hierarchical coheaion" (Phillipa et al., 1987, p. 153).
Thua, the organizational aynergy model ia more concerned
with effective leaderahip than breaking it down into
componenta auch aa inatrumental or aupportive.
Thia atudy uaed an index of four leaderahip akilla
poasessed by the platoon leader aa perceived by the aquad
leaders. This approach uses the "master manager" concept of
Quinn (1988). According to the competing values approach
(Quinn, 1988) leader effectiveness is determined by the
ability of the leader to have behavior in each of the four
63

competing quadrants consisting of the open systems model,
the rational goal model, the human relations model, and the
internal process model. Thus, leader effectiveness is not
the resulting level of group performance. Instead, it is
the ability of the leader to be skilled in many different
leader behaviors.
Squad leader and platoon sergeant responses to the
following items were used to measure effective leadership.
How well does [your platoon leader] perform these akilla?
Exceptionally Very Well Barely Poorly Well Well Adequate
L4. Deciaion making
L8. Technical and Tactical Proficiency
L9. Initiative
L13. Soldier team development
The firat item tapa the rational goal quadrant. The aecond
item addreaaea the internal proceaa quadrant. The open
systems quadrant is measured by the third item, and the
human relations quadrant is reflected by the fourth item.
The original instrument had thirteen leader skills. Only
four were chosen because the responses were so highly
correlated (average r = .800).
The leader-group interactions model also uses cohesion
as a construct. Cohesion is operationalized the same as
described above for the organizational synergy model. The
leader-group interactions model does not use organizational
commitment, but instead uses only two components of it:
64

group effort (drive) and goal acceptance. These two
concepts are also operationalized as described above for the
organizational synergy model. As stated earlier, the exact
level of analysis for the items are not specified for the
respondent.
The leader-group interactiona model dichotomizea lead
erahip into the two familiar typea of leader behavior.
Inatrumental leader behaviora are directed toward taak
accompliahment, while aupportive leader behaviora are di
rected toward group maintenance (Stogdill, 1974; Schrieaheim
et al., 1979).
Originally, this atudy aet out to divide the leader
akilla deacribed above into thoae reflecting inatrumental
and thoae reflecting aupportive behaviora. Thua, inatrumen
tal akilla would include:
L2. Planning
L3. Superviaion
• L4 . Deciaion making
L6. Management
^L8. Technical and Tactical Proficiency
Supportive skills or those directed toward group maintenance
would include:
LI. Communication
Lll. Flexibility
^L13. Soldier team development
65

Unfortunately, confirmatory factor analysis showed that the
leader skills could not be dichotomized into instrumental
and supportive behavior.
Hence, an alternate method of tapping instrumental and
supportive leadership had to be used. Items were selected
from the questionnaire that addressed supportive and
instrumental leader behaviors instead of supportive or
instrumental skills. The instrumental leadership items
taken from the squad leader and platoon sergeant instruments
are:
A. Almost Always
B. Often
C. Sometimes
D. Seldom
E. Almost Never
[My platoon leader]
T10PL4. Tells soldiers specifically what they do right.
T10PL6. Tells soldiers specifically how to improve.
The items used to operationalize supportive leader behavior
are:
A. B. C. D. E. Strongly Agree Neither Disagree Strongly Agree Agree Nor Disagree
Disagree
CA3. Leaders in this platoon encourage me to train and do my best.
CA5. Leaders in this platoon keep soldiers informed about what is going on in the unit.
As stated earlier, any findings using the supportive
leadership construct must be qualified that the leadership
was not the specific behaviors of the platoon leader.
66
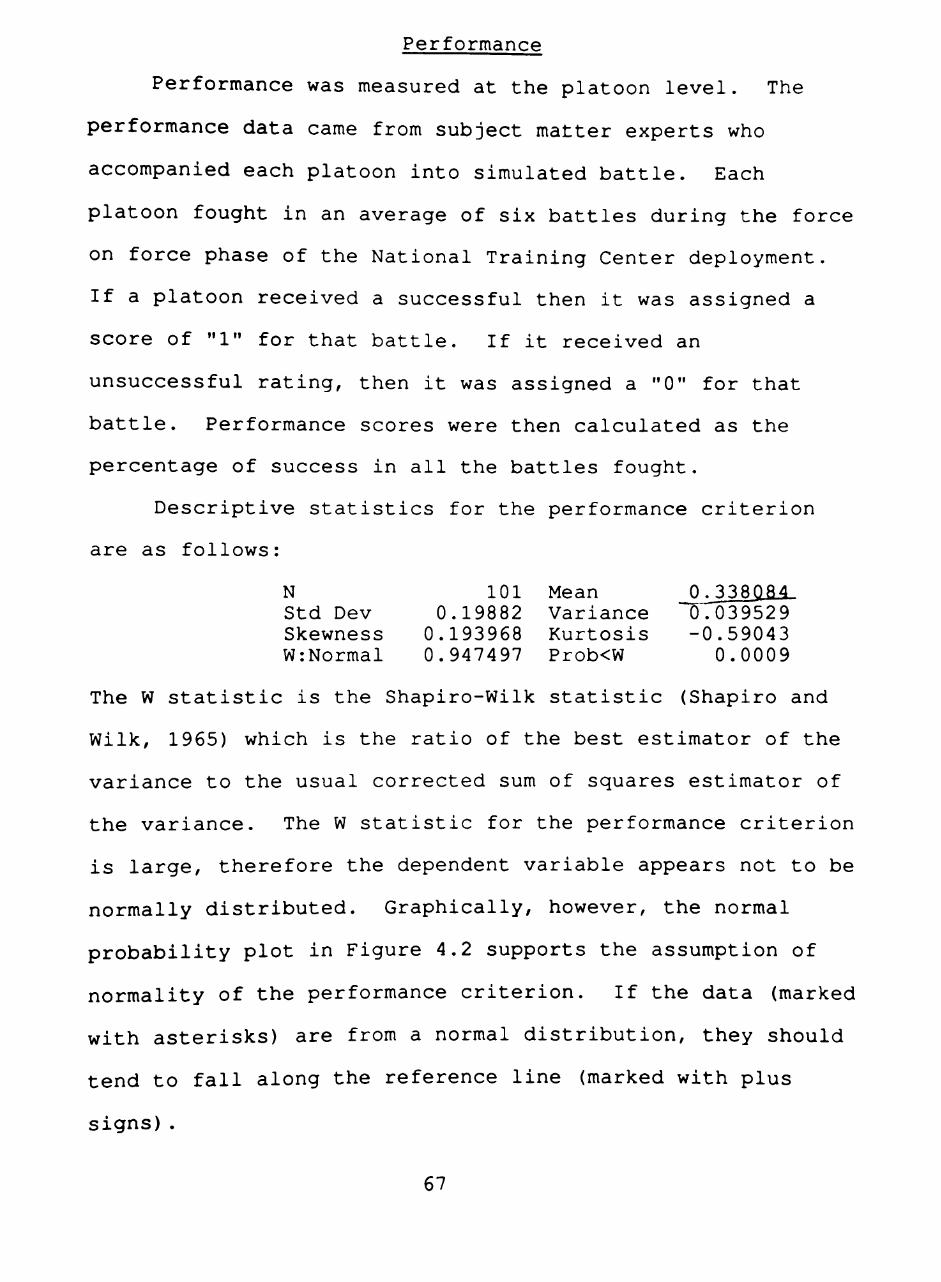
Performance
Performance was measured at the platoon level. The
performance data came from subject matter experts who
accompanied each platoon into simulated battle. Each
platoon fought in an average of six battles during the force
on force phase of the National Training Center deployment.
If a platoon received a successful then it was assigned a
score of "1" for that battle. If it received an
unsuccessful rating, then it was assigned a "0" for that
battle. Performance scores were then calculated as the
percentage of success in all the battles fought.
Descriptive statistics for the performance criterion
are as follows:
N 101 Mean _0^J3Q^LM-Std Dev 0.19882 Variance 0.039529 Skewness 0.193968 Kurtosis -0.59043 W:Normal 0.947497 Prob<W 0.0009
The W statistic is the Shapiro-Wilk atatiatic (Shapiro and
Wilk, 1965) which ia the ratio of the beat eatimator of the
variance to the uaual corrected aum of aquarea eatimator of
the variance. The W atatiatic for the performance criterion
ia large, therefore the dependent variable appeara not to be
normally diatributed. Graphically, however, the normal
probability plot in Figure 4.2 aupporta the aaaumption of
normality of the performance criterion. If the data (marked
with asterisks) are from a normal distribution, they should
tend to fall along the reference line (marked with plus
aigns).
67

Infantry Platoon Armor Platoon
Platoon Leader Platoon Leader I I (3 men)
Platoon Sergeant Platoon Sergeant I I (3 men)
I 1 1 I 1 Squad Ldr Squad Ldr Squad Ldr Tank Cdr Tank Cdr (10 men) (10 men) (10 men) (3 men) (3 men)
Figure 4.1 Organizational chart for platoons.
68

0 . 8 2 5 +
0 . 4 2 5 +
0 . 0 2 5 + * +•
+ *
++ •k-k
* * * * *
* * * + +++
+ * + * * * *
* * * * *
+++ * * * * * * *
+++ * * * * * *
+ + + + + + + + + + - 2 - 1 0 +1 +2
Figure 4.2 Normal probability plot for performance criterion.
69
CHAPTER V
DATA ANALYSIS
Measurement Model
Once the constructs were operationalized, two
measurement models were tested. Figure 5.1 and Figure 5.2
show the measurement models for the organizational synergy
model and the leader-group interactions model, respectively.
Reliability and validity were then assessed. Reliabilities
from previous studies using identical items were not
available. Reliabilities were calculated in thia atudy uaing
aeveral techniquea. Cronbach'a alpha (Cronbach, 1951) waa
first computed for the items. Although Cronbach's alpha is
widely used, it equals reliability only if the itema are
atrictly parallel or, at leaat, eaaentially tau-equivalent.
Otherwiae alpha only aervea aa a lower bound for reliability
(Novick and Lewia, 1967). Theta (Zeller and Carminea,
1980), a reliability more appropriate for itema that are not
homogeneoua, waa also computed from principal componenta
analyaia. Individual reliabilitiea (aquared multiple
correlationa) and compoaite reliabilitiea were calculated
using LISREL (Bagozzi and Yi, 1988). Diacriminant validity
was also calculated with a confirmatory factor analysis
using LISREL. The LISREL output for the organizational
synergy model is found in Appendix A and the output for the
leader-group interactions model is found in Appendix B.
70
Regression analysis followed the confirmatory factor
analysis.
Organizational Synergy Measurement Model
Table 5.1 shows the reliabilities for individual items
and constructs contained in the organizational synergy
model. For composite reliabilities, values greater than
about .6 are desirable (Bagozzi and Yi, 1988). For the
organizational synergy model, all composite reliabilities
are adequate. One of the items included in the
organizational commitment construct, CDl, has a low
individual reliability with a squared multiple correlation
of only .195. Since it was only one of five itema included
in the conatruct and it waa the only available item to tap
the effort component of organizational commitment, it waa
retained. The T-valuea (Table 5.2) alao eatimate the preci-
aion of each parameter eatimate. Aa expected, the T-value
for CDl pointa to poaaible problema with that item.
Fornell and Larcker (1981) atate that a teat of
diacriminant validity ia to compare the compoaite
reliabilitiea of the latent conatructa with the aquare of
the phi matrix. If the compoaite reliabilitiea are larger,
discriminant validity is supported. For the organizational
aynergy model, all compoaite reliabilitiea are larger than
the aquare of the phi valuea. Diacriminant validity ia
supported.
71

The confirmatory factor analyaia of the meaaurea used
in testing the organizational synergy model (Appendix A)
reveals a chi-square of 41.74 (d.f. = 41) and a p-value
of .439. Nonsignificant chi-square values are desirable.
The model has an adjusted goodness-of-fit index (AGFI)
of .889 indicating a satisfactory fit and good discriminant
validity. Another measure of model fit to the data is the
root mean aquare reaidual. Low valuea are deairable. The
value for the organizational aynergy model ia .016, again
pointing toward a good fit. It ia important to note,
however, that LISREL worka beat for larger aample aizea (N =
200) . With a aample aize of 101, a Type II error may reault
(Bagozzi and Yi, 1988).
Wold'a (1985) partial leaat aquarea (PLS) technique ia
aimilar to LISREL in that both atructural relationa among
latent variablea and relationahipa between latent variablea
and obaerved variablea may be modelled. The PLS technique,
however, ia more auitable for the analyaia of amaller
samples such as the present study. LISREL was used in the
present study because it is more widely used in the
literature and the effects of a smaller sample size can be
assessed with the program.
Since the AGFI is only satisfactory and not excellent
(above .90), examining the modification indices provides
some insight to where the model is losing fit. Modification
indices greater than 3.84 suggest that freeing the
72

corresponding parameter will significantly improve the model
(Bagozzi and Yi, 1988) . In the organizational synergy
model, the fit would be increased if item CI was allowed to
load with the cohesion construct. Item CI asks:
CI. of the squad members in this platoon uphold and support Army values such as loyalty, honesty, and devotion to duty.
The high modification indice may be a reault of a theoreti
cal or a methodological reaaon. Theoretically, item CI
determinea the amount of ahared valuea held in the platoon.
Researchers (Festinger, 1950; Goodnow and Tagiuri, 1952)
have long held that shared values may lead to cohesion,
although the reaearch haa been unable to determine which ia
the antecedent. Methodologically, item CI may load on the
cohesion measure because it was on the same page as the
other two items measuring cohesion. Freeing the item to
load on cohesion would increase the fit, but modifications
other than trivial changes should be treated cautiously and
cross validated (Bagozzi and Yi, 1988). Since the fit is
already satisfactory, no adjustments were made.
Leader-group Interactions Measurement Model
Table 5.3 shows the reliability of measures for the
leader-group interactions model. Group drive, the single
item CDl, is the same item that had a low reliability when
used with the organizational synergy model. Because the
leader-group interactions model proposes that group drive is
the vigor or enthusiasm rather than the effort of the group,
73

and the actual item is very susceptible to social
desirability biases, the error variance was set at 30%.
Thus, the reliability was based on item CDl only measuring
70% of the actual construct of group drive. With that
adjustment, the reliability of group drive changes to .699
reflecting the preset reliability. Supportive leadership
did not achieve the .6 composite reliability rule of thumb.
Item CA3 has a very low individual reliability, but since
the alpha and theta reliabilities were adequate, the item
was not deleted. An examination of the T-values (Table 5.4)
also points to item CA3 being weak on measuring supportive
behavior.
The confirmatory factor analysis for the leader-group
interactions model (Appendix B) reveals a chi-aquare of
21.60 (d.f. = 18) with a p-value of .250. Aa with the
organizational aynergy model, a nonaignifleant chi-aquare
value ia deairable. The model yielda an AGFI of .891 which
ia a aatiafactory fit. The root mean aquare reaidual ia a
small .015, also indicating a good model fit. Thus, the
data fit the model well. Using the Fornell and Larcker
(1981) test of discriminant validity, however, the phi value
for goal acceptance exceeds the composite reliability for
cohesion. This indicates that cohesion and goal acceptance
may be explaining the same variance and thus discriminant
validity may be threatened. The possible problems in
discriminant validity are mitigated, however, by the
74

satisfactory adjusted goodness of fit index and the
modification indices indicating that letting items in goal
acceptance load on cohesion would not provide any
significantly better model fit. Examining the modification
indices for values higher than 3.84 also shows that
adjusting item CA3 would not affect the model fit.
Analysis of the measurement models for both the
organizational synergy model and the leader-group
interactions model reveals satisfactory model fit.
Reliabilities were satisfactory except for a questionable
supportive leader behavior in the leader-group interactions
model. Discriminant validity waa aupported with good AGFI
valuea for the confirmatory factor analyaia. Further
validity aaaeaament waa not poaaible given the limited
aecondary data. Ideally, validity would be aaaeaaed through
multiple group analyaia, croaa validation, or validity
generalization (Bagozzi and Yi, 1988) .
Reaulta of Regreaaion Analyaia
Multiple linear regreaaion analyaia waa performed to
test the hypotheses of the organizational synergy model and
the leader-group interactions model. The covariance matrix
for the items are found in Table 5.5 and Table 5.6. The
regressions were performed on three groups. First, the
hypotheses were tested with infantry and armor platoons
combined (N = 101). Then only armor platoons were tested
75
(N = 59), followed by only infantry platoons (N = 42). A
theoretical difference between infantry and armor results
was possible because of structural differences. In an
infantry platoon, the soldiers see and interact with each
other in a field environment. In a tank platoon, soldiers
may see and interact with mainly their fellow tank crew
members instead of the entire platoon. This may affect
group variables such as cohesion due to differences in
"sheer contact" (Festinger, 1953).
Constructs were entered into the regression equations
using an index formed by the items assessed in the
measurement model. Index coefficients were the lambdas
(loadings) as determined by the confirmatory factor analysis
using LISREL. The main effect variables were entered into a
regression equation. Each interactive term was then placed
in the equation (without other interactive terms) and the
relationships were examined.
Organizational Synergy Model Regression Results
The organizational synergy model can be expressed in
equation form as:
OS = L + OC + (L X OC) + (C X L) + (C X OC) + (C x L x OC)
where OS = organizational synergy (performance), C = peer
cohesion, L = leader effectiveness, and OC = organizational
commitment. Five regressions were run for the combined.
76

armor only, and infantry only groups. The regression
equations analyzed were:
(1) Performance = C + OC + L
(2) Performance = C + O C + L + (Lx OC)
(3) Performance = C + OC + L -i- (C x L)
(4) Performance = C + O C + L + (Cx OC)
(5) Performance = OC + L + (L x OC) + (C x L) +
(C X OC) + (C X L X OC) .
Because the multiplicative interaction terms are, by
definition, highly correlated with the terms included in it,
multicollinearity allowa the parameter eatimates to be
subject to large fluctuations. To overcome these "bouncing
betas," a technique propoaed by Smith and Saaaki (1979) waa
implemented. Eaaentially, the multicollinearity ia greatly
reduced by centering the conatituent variablea around
minimizing conatanta before forming the multiplicative
function. Aa a check for multicollinearity, the variance
inflation factor (VIF) waa calculated for each of the
interaction terma. A VIF above 10 indicatea
multicollinearity problema. With the Smith and Saaaki
method, the VIF'a for all interaction terma were well below
10. The organizational aynergy model regreaaion reaults, to
include the VIF's, are found in Appendix C. The adjusted
R^, beta weights, and p-values for each group and each
regression equation specified above are summarized in Tables
5.7 through 5.11.
77

Although cohesion does not have a main effect on
performance according to the organizational synergy model,
it was included in several regression equations as a test of
the null hypothesis.
Leader-group Interactions Model Regression Results
Hypotheses concerning the leader-group interactions
model were tested with three subgroups of combined, infantry
only, and armor only platoons with four regression
equations. The four equations tested (using the notation of
Instr = inatrumental leaderahip, Supp = aupportive
leaderahip. Goal = group goal acceptance. Drive = group
drive, and C = coheaion) were:
(1) Performance = Inatr + Supp + Drive + Goal
(2) Drive = Inatr + Supp
(3) Coheaion = Inatr -i- Supp
(4) Performance = Drive + Goal + (Drive x Goal) +
(C X Drive) + (C x Goal) + (Drive x C x Goal).
Aa with the organizational aynergy model, the predicted
null hypotheaea concerning the effecta of inatrumental and
aupportive leaderahip are teated in aome of the regreaaion
equationa. The leader-group interactiona model regreaaion
results are found in Appendix D. Summarized results of the
adjusted R values, beta weights, and p-values are found in
Tables 5.12 through 5.15.
78
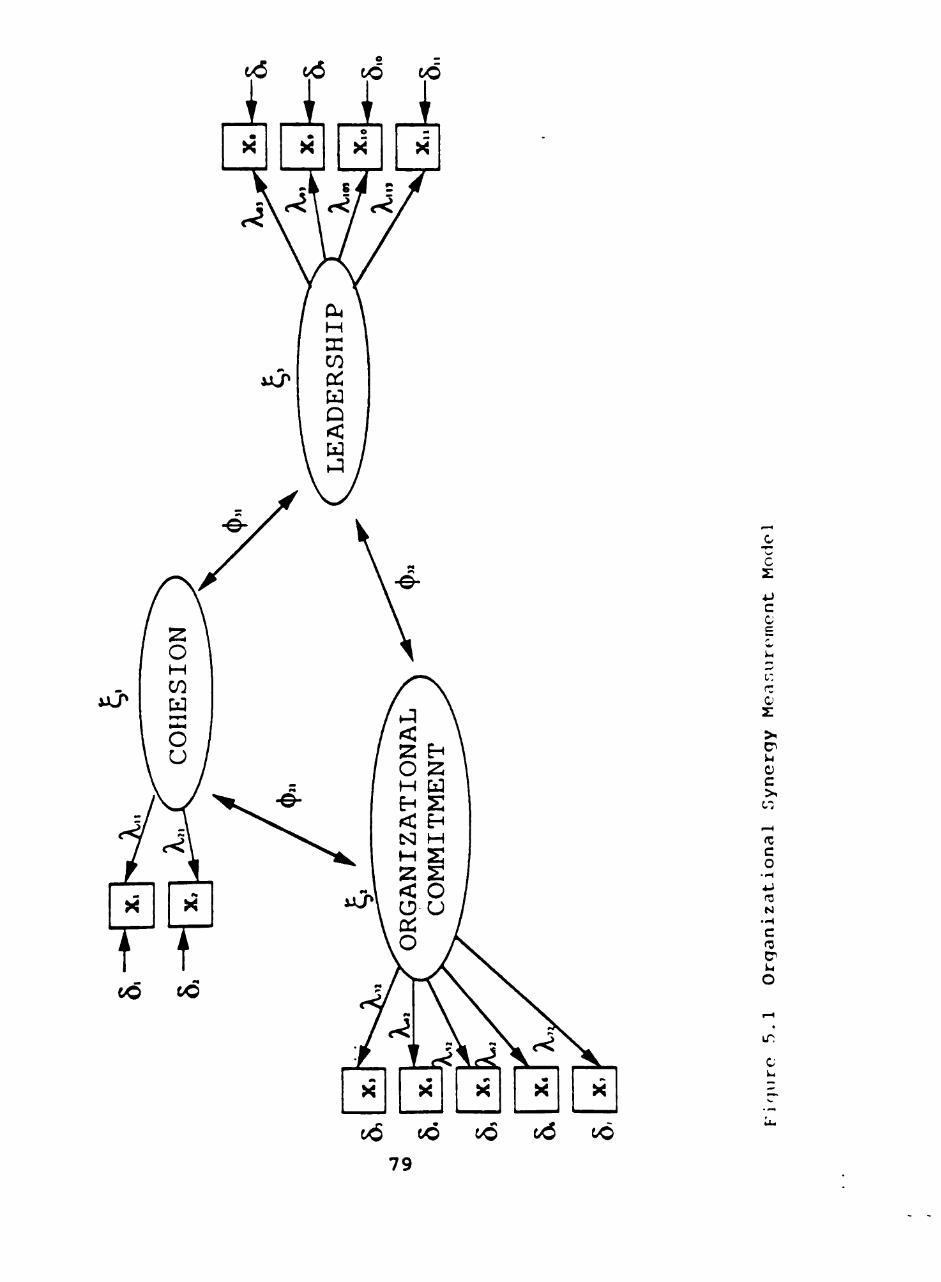
c^ t^ t o ^0
LllA
AJLP
X X X X X
c z
c c c
O
O
c
c o
•H 4J r3 N
•H
c
o
c
t^ to
79
CO c/tf CO

U-P
CO CO CO C O CO c ^ c ^ (^6 c/6
o T3
z C
a E C
c z w c o
o c
c (J
c
CM
c
80

Table 5.1: Reliability of measures for the organizational synergy model.
Measure
Cohesion
C12
C13
squared multiple correlation
.784
.907
Organizational Commitment
CI
Cll
C8
CA14
CDl
.405
.688
.879
.756
.195
Leadership Effectiveness
alpha theta composite reliabilty
.915 .918 .919
.856 .865 .817
.947 .947 .853
L4 .763
L8
L9
L13
.842
.872
.789
81

Table 5.2: T-values for the organizational synergy model.
Cohesion Organizationl Commitment Leadership
C12 10.953 .000 TOOO
C13 12.302 .000 .000
6.947 .000
10.034 .000
12.253 .000
10.804 .000
4.511 .000
.000 10.951
.000 11.903
.000 12.266
.000 11.259
CI
Cll
C8
CA14
CDl
L4
L8
L9
L13
.000
.000
.000
.000
.000
.000
.000
.000
.000
82

Table 5.3: Reliability of measures for the leader-group interactions model.
Measure
Cohesion
C12 C13
squared multiple c correlation
.760
.935
alpha
.915
theta
918
composite reliabilty
.918
Goal Acceptance
CI .487
Cll 563
.687 .687 .691
Group Drive
CDl .699
Instrumental Leadership
T10PL4
T10PL6
.493
.878
.794 .795 .811
Supportive Leadership
CA3
CA5
.171
.589
.715 .700 .500
83

Table 5.4: T-values for the leader-group interactions model. (Goal = group goal acceptance. Drive = group drive, Instr = instrumental leadership, Supp = supportive leadership)
C12
C13
CI
Cll
CDl
T10PL4
T10PL6
CA3
CA5
Cohesion
10
12
.692
.602
.000
.000
.000
.000
.000
.000
.000
Goal
.000
.000
7.443
8.087
.000
.000
.000
.000
.000
Drive
.000
.000
.000
.000
.000
.000
.000
.000
.000
Instr
.000
.000
.000
.000
.000
6.635
8.507
.000
.000
Supp
.000
.000
.000
.000
.000
.000
.000
3.546
5.1250
84

0)
o B > i u 0) c > l
to
(0 c o
•H 4-> (0 N
•H C (0
o 0)
V4 O
r)
•J
ON •J
00
Q O
00 CJ
.470
.0
91
.085
76
6
•
.012
.0
21
723
•
595
•
.03
3 .0
23
.65
4
vo in CO in vo in . .
CO n o in vo in . .
^ (N 00 vo in in • .
(N o o o
rg vo tH CM
o o
n r) fsj vo ON ON H r» n ON n o o iH in ^ o o o o o
I I I
U
^ O O O O O V O f M O O V O r » i n o i n v o r » i H ^ o n n o o o o o
u
(0
0)
u c to
•H u to > o u in
in
0) •H
to EH
U
H
CN
u
o t ^ ^ O N i n o n v o o r H ^ o ^ i n ^ o o r g M H C M H O O O O O
r r r r i n n r ^ O N r » < N r ^ O N ^ i n r ^ i n r j c o n i n n r H i H n C J H C M t N C M O O O O O
i I I I
o o O N c o o o i n ^ ^ O N v o o o r * v o f s i n o N v o c M i n n i H O o C M f N H i H C N f M O O O O O
( M r ) i H f H c o ' * » H ^ e o o N r > i H r H U r - l U « H Q t J l J 3 t - 3 f H O O U < U iJ
O
85
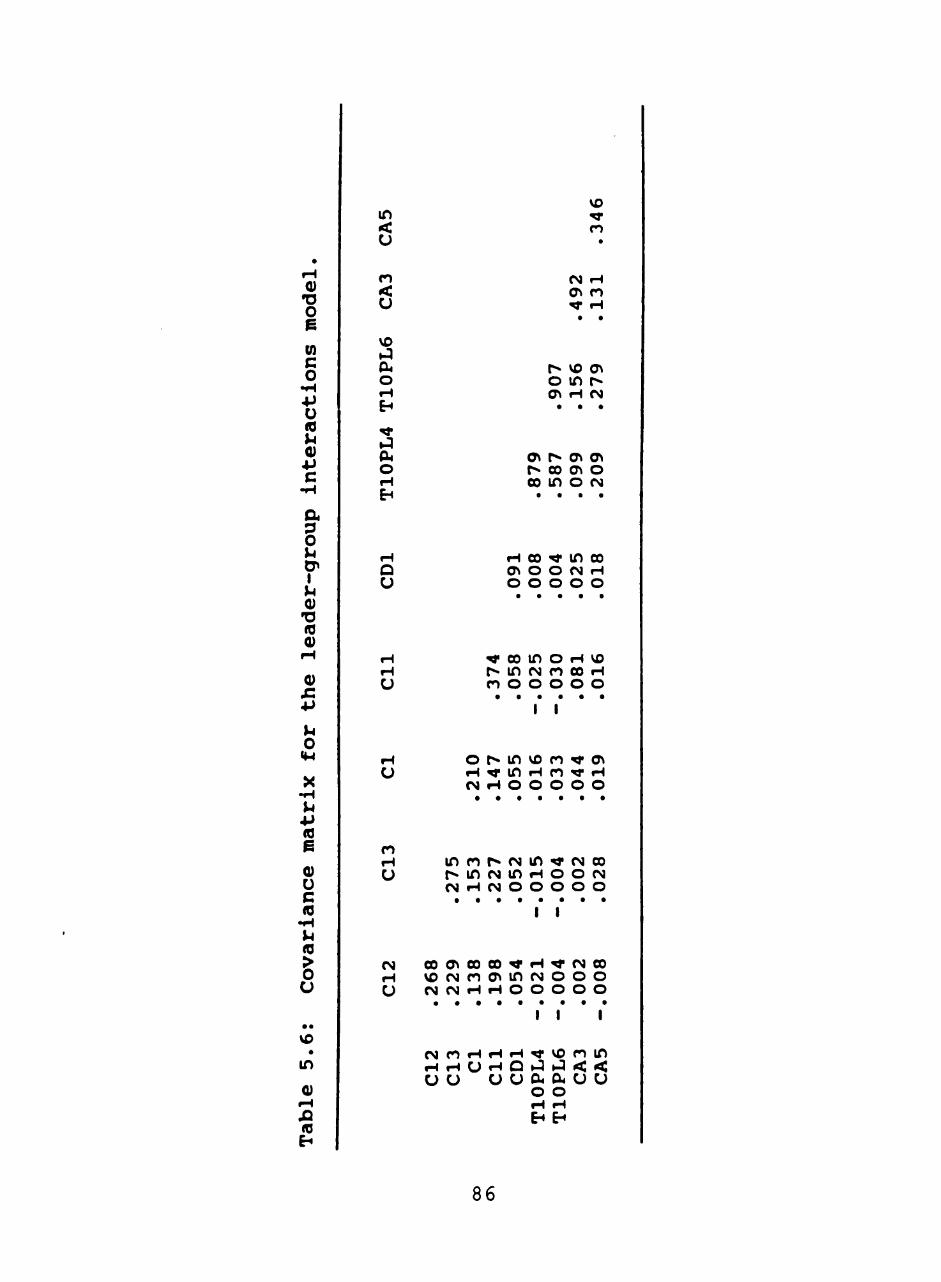
in <
vo
n
Q) •O O m cn c o •H +> o to u Q) 4J C
<
vo •J o
o
CM H ON n ^ H
r* vo ON o in r ON H <N
ON r ON ON r- 00 ON o 00 in o CM
a o u ON I
u •a 0)
o
+> (0 g
U c (0 •H u to > o u
vo
in
o »H
10
Q
U
U
H
U
iH 00 in 00 ON O O CM H
o o o o o
^ 00 in o H vo t in <N n 00 H cn o o o o o
<N H U
I I
o r*- in VO cn ** ( H ^ in H n ^ H CM H o o o o o
i n c n r * c N i n ^ f g o o r « . i n c M i n « H O O f M C M H C M O O O O O
' ' ' ' I \
O O O N O O C O ^ H ^ C M O O ^ o c ^ ^ n ( ^ l n ( N O O O O J C M H H O O O O O
I I I
c j n t H H H ^ v o o i n f H f H U < H Q | . Q l J < <
o o
86

Table 5.7: Regression results for the organizational synergy model for combined platoons, armor only, and infantry only subgroups. (C = cohesion, OC = organizational commitment, L = leadership)
Performance = C + OC + L
Beta Weight p-value adj. R'
Combined platoons
C
OC
L
-.037
.081
.049
777
517
148
-.003
Armor only
C
OC
L
.059
.006
.029
.716
.971
.519
-.037
Infantry only
OC
.123
.226
.097
.565
.221
.050
197
87

Table 5.8 Regression results for the organizational synergy model for combined platoons, armor only, and infantry only subgroups. (C = cohesion, OC = organizational commitment, L = leadership)
Performance = C + O C + L + (Lx OC)
OC
L
L X OC
Armor on
C
OC
L
L X OC
ly
Beta Weight
Combined platoons
-.035
.073
.051
-.048
065
009
024
051
p-value
.794
.568
.139
.709
693
954
609
761
adj. R'
-.013
-.054
Infantry only
OC
L
L X OC
.118
.189
.096
.134
585
333
056
548
.182
88

Table 5.9: Regression results for the organizational synergy model for combined platoons, armor only, and infantry only subgroups. (C = cohesion, OC = organizational commitment, L = leadership)
Performance = C + OC + L +" (C x L)
2 Beta Weight p-value adj. R
Combined platoons
C -.053 .695 -.010
OC .084 .507
L .053 .127
C X L -.086 .553
Armor only
C -.045 .786 -.049
OC -.008 .961
L .015 .752
C X L .115 .546
Infantry only
C .022 .915 .261
OC .184 .302
L .077 .112
C X L -.507 .052
89

Table 5.10 Regression results for the organizational synergy model for combined platoons, armor only, and infantry only subgroups. (C = cohesion, OC = organizational commitment, L leadership)
Performance = C + O C + L + (Cx OC)
Beta Weight p-value adj. R'
Combined platoons
C
OC
L
C X OC
-.039
.092
.053
-.093
.771
.465
.127
.749
-.009
Armor only
C
OC
L
C X OC
.083
.007
.022
.377
.622
.965
.623
.369
-.039
Infantry only
OC
L
C X OC
.106
.213
.098
.224
.626
.255
.051
.591
180
90

Table 5.11: Regression results for the organizational synergy model for combined platoons, armor, and infantry only subgroups. (C = cohesion, OC = organizational commitment, L = leadership)
Performance = OC + L + (L x" OC) + (C x L) -i-(C X OC) + (C X L X OC)
Combined OC
L
L X OC
C X L
C X OC
C X L X (
platoons
DC
Beta Wei
.030
.045
-.021
.134
.329
-.142
.ght p-value
.802
.408
.920
.866
.829
.787
adj. R2
-.0274
Armor only OC
L
L X OC
C X L
C X
C X
OC
L X
Infantry OC
L
L X OC
OC
on ly
C X L
C X OC
C X L X OC
.113
.010
.078
.572
1.16
.269
.146
1.57
.178
2.07
5.89
2.15
.519
.891
.756
.554
.552
.674
-.0699
.615
.317
.649
.323
.154
.145
318
91

Table 5.12 Regression results for the leader-group interactions model for combined platoons, armor only, and infantry only subgroups. (Instr = instrumental leadership, Supp = supportive leadership. Drive = group drive. Goal = group goal acceptance)
Performance = Instr + Supp + Drive + Goal
Beta Weight p-value ad j . R'
Combined platoons
Instr
Supp
Drive
Goal
.020
.137
-.467
.136
.539
.197
.104
.233
.026
Armor only
Instr
Supp
Drive
Goal
.025
.208
.435
.067
541
104
269
605
006
Infantry only
Instr
Supp
Drive
Goal
.049
.131
.293
.423
390
516
461
010
182
92

Table 5.13: Regression results for the leader-group interactions model for combined platoons, armor only, and infantry only subgroups. (Instr = instrumental leadership, Supp = supportive leadership. Drive = group drive)
Drive = Instr + Supp
Beta Weight
Combined platoons
p-value adj. R'
Instr
Supp
-.001
.019
922
635
-.018
Armor only
Instr
Supp
010
030
.488
.510
-.023
Infantry only
Instr
Supp
032
094
.188
.279
-.002
93

Table 5.14 Regression results for the leader-group interactions model for combined platoons, armor only, and infantry only subgroups. (Instr = instrumental leadership, Supp = supportive leadership)
Cohesion = Instr + Supp
Beta Weight p-value adj. R^
Combined platoons
Instr
Supp
-.011
.030
.788
.817
-.019
Armor only
Instr
Supp
.034
.017
499
910
-.024
Infantry only
Instr
Supp
.064
.101
349
683
-.029
94

CO Z < o >-
< OS OC < OQ Q^ Z i CO
"J -
CN O O O
I
>
-5 »-0) _J-v> O O Si X -Q «> 3
u o a
c o
a C
I is i/i o a.
lo O O 00
T3
"o U v> u* 0) u
a X
"D O c 0) a o o
4>
o >
'6 a
O w
a X
UJ
cn 5 J 2 « o J. a>
3 2
Q) C2.
o £ S I O OC
s -I c 0.
<A
o Of
^ o
.sion results for the leader-group ictions model for combined platoons, armor and infantry only subgroups. (Drive = drive. Goal = group goal acceptance, C = on)
mance = Drive + Goal + (Drive x Goal) + rive) + (C X Goal) + (Drive x C x Goal)
Beta Weight
.547
7.18
.208
3.57
.478
4.76
p-value
104
434
925
069
294
442
adj. R'
.054
D D D -.278 .552 -.012
Goal
Drive X Goal
C X Drive
C X Goal
DriveCGoal
. 268
•1 .08
•2.94
1 .36
. 2 8 5
.984
. 7 2 1
.240
. 0 6 9
.974
I n f a n t r y o n l y D r i v e
G o a l
D r i v e x G o a l
C X D r i v e
C X G o a l
D r i v e C G o a l
• .519
1 2 . 9
3 . 6 4
7 . 9 4
.010
8 . 4 8
. 247
. 2 5 8
. 2 6 1
. 1 1 8
. 9 8 5
. 272
. 3 5 7
95
CHAPTER VI
IMPLICATIONS
Hypotheses Results
As a result of the regression analysis, specific
hypotheses were supported or unsupported as follows.
Organizational Synergy Model
H-j : Coheaion will not have a direct effect on perform
ance. This hypothesis was supported in all three subgroups
since there were no aignificant parameter eatimatea for
coheaion in any of the regreaaion analyaea..
H2: Leaderahip will have a direct, poaitive effect on
performance. Intereatingly, thia hypotheaia waa only aup
ported in the infantry aubgroup. With infantry platoona,
leaderahip effectiveneaa waa aignificant at the p < .050
level. Aa atated earlier, thia ia probably due to the
organizational atructure differencea between armor and
infantry platoona. In an armor platoon, the platoon leader
may have far leaa leaderahip diacretion (Hunt and Oaborn,
1982) due to the phyaical aeparation of the four tank crewa.
Ho: Organizational commitment will have a poaitive,
direct effect on performance. Thia hypotheaia waa
unsupported in all subgroups. It should be noted, however,
that this conceptualization of organizational commitment was
the three component construct of Mowday et al. (1974). The
narrower construct of group goal acceptance was tested in
96

the leader-group interactions model regression analysis. In
that analysis, group goal acceptance was significant at the
p < .01 level.
H^: Leadership and organizational commitment will have
an interactive effect on performance. This hypothesis was
unsupported in all subgroups.
H^: Cohesion and leadership will have an interactive
effect on performance. This hypothesis was unsupported in
the combined and armor only samples. In the infantry only
sample, it was significant at the p > .052 level and the
parameter was negative. To examine the effects of the
interaction, the partial derivative of the regression
equation (where Y = performance, X-j = cohesion, and X2 =
leadership) over X2 yields the following:
dY = .077 - ,501X-^, dX2
This equation will yield zero when X-j has a value
of .15, so when X- ia above .15, the equation will be
negative, and it will be poaitive when X-j ia below .15.
Thua the inflection point of the alope—the value of X- at
which a change in the direction of the alope occura--ia .15.
The values of cohesion for the infantry subsample range from
1.02 to 1.97 with a mean of 1.45 and a median of 1.41.
Comparing the inflection point with the range in values for
platoon cohesion, it appears that higher leadership
effectiveness is associated with higher levels of unit
performance in those platoons with low cohesion. In
97

platoons with high cohesion, leadership effectiveness tends
to affect performance adversely. This is similar to the
Kerr and Jermier (1978) view of cohesion as a substitute for
leadership, and actually may suggest that cohesion may act
as a neutralizer of leadership.
Hg: Cohesion and organizational commitment will have
an interactive effect on performance. This hypothesis was
unsupported in all aubgroupa.
H-y: Coheaion, organizational commitment, and
leadership will have an interactive effect on performance.
This hypothesis was not supported. It should be noted,
however, that multicollinearity may have affected the
parameter values when the triple interaction term was
included.
The Leader-group Interactions Model
Hg: Neither instrumental nor supportive leader behav
iors will have a direct effect on performance. This was
supported in all the subgroups, but like H-^, it may be due
more to a lack of statistical power.
HQ: Instrumental and supportive leader behaviors will
have a positive, direct effect on group drive. This
hypothesis was not supported.
H-IQ: Instrumental and supportive leader behaviors will
have a positive, direct effect on cohesion. This hypothesis
was not supported.
98

H-J 2' Group drive, cohesion, and goal acceptance will
have an interactive effect on performance. This hypothesis
was not supported. As with the organizational synergy
model, multicollinearity may have affected the parameter
values due to the inclusion of the triple interaction term.
^12* Group drive does not have a direct effect on
performance. This hypothesis was supported but may be due
to lack of statistical power rather than the lack of
existence of a relationship.
^12' Group goal acceptance does not have a direct
effect on performance. This hypothesis was supported in the
combined and armor only subgroups. Interestingly, group
goal acceptance waa aignificant at the p > .01 level for the
infantry platoona.
Model Implications
This study did not support either the organizational
synergy model or the leader-group interactions model. Both
models attempted to clarify the relationship between
cohesion and performance. The most salient reason for both
models to be unsupported by the data is the exclusion of
other necessary variables. For example, Schriesheim et al.
(1979) also proposed that group task moderates the effects
of cohesion on productivity. Phillips and Wong (1990)
augmented the organizational synergy model with variables
such as training and equipment readiness. Perhaps with a
dependent variable such as platoon battle performance,
99

cohesion is moderated by many more variables than specified
in either model. More comprehensive models, however, are
difficult to test.
Another reason for the nonsupport of the models may
focus on the site of the performance criterion, the National
Training Center. Because it is the National Training Center
and not the National Evaluation Center, units are allowed to
fail and learn from their mistakes. In this type of
learning environment, units may fail, but still maintain and
build high cohesion in the learning process. Cohesion may,
as the models propose, impact on unit performance. The
effect, however, may be hidden by the succesa/unaucceaful
rating found in the criterion variable.
Finally, aa atated in the meaaurement model diacuaaion,
conatruct validity waa not totally eatabliahed for the
measurement model. Secondary data analysis does not include
the choice and selection of indicants nor any aspects of
instrument construction. Thus, in this study since the items
do not come from standard scales, measurement properties of
the items have not been established. More critical,
however, is the potential limitation of invalidity. Items
chosen to represent a construct may, in fact, be measuring
something else. The items measuring organizational
commitment do not exactly match the Mowday, Porter, and
Steers' (1982) conceptualization of organizational
commitment. Additionally, group drive may have to be
100

measured with only a single indicant. A slippage between
what the item measures and how it is used may make
interpretation difficult. As Hyman (1972) pointed out,
however, "one must take what one can find" (p. 23).
It appears then, that the cohesion-performance
relationship remains elusive. What then did the study
reveal other than nonsupport for the organizational synergy
model and the leader-group interactions model? First, the
test of the organizational synergy model showed that
leadership does indeed make a difference. Effective
leadership was found to have an effect on performance in
infantry platoons. This study provides longitudinal,
empirical support to studies such as Smith, Carson and
Alexander (1984) that leadership does lead to increased
organizational performance. Of course, to completely follow
up on this finding, a validation study must be done.
The test of the leader-group interactions model showed
that group (or organizational) goal acceptance also led to
better unit performance. It is important to keep in mind
that goal acceptance was operationalized as the shared
values of devotion to duty and the belief that the soldiers
were serving their country. Support for the relationship
between notions of patriotism and performance contrasts with
views of theorists such as Gabriel and Savage (1978) who
believed that "the 'cause' ... was never the driving force
in [the German soldier's] capacity to fight" (p. 36). If
101

values and a belief in a larger cause can affect
performance, then maybe leadership or any means that affects
these values (transformational leadership) may significantly
raise performance.
Future Reaearch
The aignificant relationahip between leaderahip and
performance for infantry unita deaervea a cloaer look. To
aee how much variance would be explained by the goal
acceptance and leaderahip variablea, a atepwiae regression
was done (Appendix E). Goal acceptance explains 19% while
leadership explains nearly 8% of the variance in unit
performance (in infantry units). Both parameter estimates
were significant. Of course, thia analyaia ia purely poat
hoc and muat be explored in further reaearch.
On a more general level, thia atudy examinea only one
facet of the many determinanta of organizational
effectiveneaa. Both the organizational aynergy model and
the leader-group interactiona model addreaa only the "human"
aide of organizational effectiveneaa. Quinn and Rohrbaugh
(1983) point out that the human relationa view ia only one
of four competing approachea. The adaptive, integrative,
and goal-attainment functiona of organizationa alao have to
be considered. Future reaearch would include other factora
such as training, environment, or equipment.
102

This study used a narrow conceptualization of cohesion.
It did not, however, compare the effects on performance when
using a broader conceptualization. Both the organizational
synergy model and the leader-group interactions model
include constructs that cohesion researchers have included
in their conceptualizations of cohesion. Future research is
needed in testing the power of using a more restrictive
definition.
Finally, effective leadership was associated with
higher performance in infantry platoons, but not in the
armor platoons. It was posited that such differences might
have resulted from atructural differencea. Further reaearch
could explore the effecta of atructure on the impact of
leaderahip on performance in auch unita.
103

REFERENCES
Anderson, A. B. (1975). Combined effects of interpersonal attraction and goal path clarity on cohesiveness of task oriented groups. Journal of Personality and Social Psychology. 31, 68-75.
Anderson, J. C , & Gerbing, D. W. (1988). Structural equation modeling in practice: A review and recommended two-step approach. Psychological Bulletin, 103, 411-423.
Angle, H. L., & Perry, J. L. (1981). An empirical assessment of organizational commitment and organizational effectiveness. Administrative Science Quarterly, 26, 1-14.
Assael, H., & Keon, J. (1982). Nonsampling vs. sampling error in survey research. Journal of Marketing, 46, 114-123.
Back, K. W. (1951). Influence through aocial communication. Journal of Abnormal and Social Paychology, 46, 9-23.
Bagozzi, R. P., & Phillipa, L. W. (1982). Repreaenting and testing organizational theories: A holistic construal. Administrative Science Quarterly, 27, 459-489.
Bagozzi, R. P., & Yi, Y. (1988). On the evaluationn of structural equation models. Journal of the Academy of Marketing Science, 16, 74-94.
Ball, J. R., & Carron, A. (1976). The influence of team cohesion and participation motivation upon performance success in intercollegiate ice hockey. Canadian Journal of Applied Sport Sciences, j , 271-275.
Bass, B. M. (1985). Leadership beyond performance. New York: Free Press.
Bass, B. M. (1990). Bass and Stogdill's handbook of leadership: Theory, research, and managerial applications (3rd ed.). New York: Free Press.
Becker, H. S. (1960). Notes on the concept of commitment. American Journal of Sociology, 66, 32-40.
Berscheid, E. (1985). Interpersonal attraction. In G. Lindzey & E. Aronson (Eds.), The handbook of social psychology (pp. 413-484). New York: Random House.
104

Bird, A. M. (1977). Development of a model for predicting team performance. Research Quarterly. 48, 24-32.
Blake, R. R. & Mouton, J. S. (1964). The managerial grid. Houston: Gulf Publishing.
Bednar, R. L., & Kaul, T. J. (1978). Experimental group research: Current perspectives. In S. Garfield and A. Bergin (Eds.), Handbook for psychotherapy and behavior change. New York: John Wiley.
Callaway, M. R., & Esser, J. K. (1984). Groupthink: Effects of cohesiveness and problem-solving procedures on group decision making. Social Behavior and Personality, 12, 157-164.
Carron, A. V. (1982). Cohesiveness in sport groups: Interpretations and considerations. Journal of Sport Psychology, 4., 123-138.
Carron, A. V., & Chelladurai, P. (1981). The dynamics of group cohesion in sport. Journal of Sport Psychology, 1, 123-139.
Carron, A. V., Widmeyer, W. N., & Brawley, L. R. (1985). The development of an instrument to assess cohesion in sport teams: The group environment queationnaire. Journal of Sport Psychology, 1_, 244-266.
Clement, S. D., & Ayrea, D. B. (1976). A matrix of organizational leaderahip dimenaiona. Leaderahip Monograph Seriea, 8. (whole) .
Cronbach, L. J. (1951) Coefficient alpha and the internal structure of tests. Psychometrika, 16, 297-334.
DeCotiis, T. A., & Summers, T. P. (1987). A path analysis of a model of the antecedents and consequences of organizational commitment. Human Relations, 40, 445-470.
Department of the Army. (1986). Operations (FM 100-5). Washington, DC.
Dobbins, G. H., & Zaccaro, S. J. (1986). The effects of group cohesion and leader behavior on subordinate satisfaction. Group and Organization Studies. 11, 203-219.
du Picq, A. (1947). Battle studies. Harrisburg: The Military Service Publishing Company.
105

Eisman, B. (1959) . Some operational measures of cohesiveness and their relations. Human Relations, 2., 183-189.
Etzioni, A. (1975). A comparative analysis of complex organizations. New York: Free Press.
Evans, N. J., & Jarvis, P. A. (1980). Group cohesion: A review and reevaluation. Small Group Behavior, 11, 359-370.
Evans, N. J., & Jarvia, P. A. (1986). The group attitude scale: A measure of attraction to group. Small Group Behavior, 17, 203-216.
Farrell, D. & Rusbult, C. E. (1963). Exchange variables as predictors of job satisfaction, job commitment, and turnover: The impact of rewards, costs, alternatives, and investments. Organizational Behavior and Human Performance, 28, 78-95.
Festinger, L. (1950). Laboratory experiments: The role of group belongingness. In J. G. Miller (Ed.), Experiments in social process (pp. 31-46). New York: McGraw-Hill.
Festinger, L., Schachter, S., & Back, K. (1950). Social pressures in informal groups: A study of human factors in housing. New York: Harper Row.
Fiedler, F. E. (1958). Leader attitudes and group effectiveness. Urbana, IL: Illinois Preaa.
Fiedler, F. E. (1967). A theory of leader effectiveneaa. New York: McGraw-Hill.
Fiedler, F. E., & Garcia, J. E. (1989). New approchea to leader effectiveneaa: Cognitive reaourcea and organizational performance. New York: Wiley.
Fiedler, F. E., & Meuweae, W. A. T. (1963). Leader'a contribution to taak performance in coheaive and uncohesive groups. Journal of Abnormal and Social Psychology, 67, 83-87.
Fornell, C , & Larcker, D. F. (1981). Structural equation models with unobservable variables and measurement error. Journal of Marketing Research, 18, 382-388.
Gabriel, R. A., & Savage, P. L. (1978). Crisis in command: Mismanagement in the Army. New York: Hill and Wang.
106
George, J. M. (1990). Personality, affect, and behavior in groups. Journal of Applied Psychology. 75, 107-116.
Goodacre, D. M. (1953). Group characteristics of good and poor performing combat units. Sociometry, 16, 168-179.
Goodnow, R. E., & Taguiri, R. (1952). Religious ethnocentrism and its recognition among adolescent boys. Journal of Abnormal and Social Psychology, 47, 316-320.
Greene, C. E. (1989). Coheaion and productivity in work groups. Small Group Behavior. 20, 70-86.
Griffin, R. W. & Moorhead, G. (1986). Organizational behavior. Dallas: Houghton-Mifflin.
Griffith, J. (1988). Measurement of group cohesion in U.S. Army units. Basic and Applied Social Psychology, 9_, 149-171.
Gross, N., & Martin, W. E. (1952). On group cohesiveness. American Journal of Sociology, 57, 546-554(a).
Hagstrom, W. 0., & Selvin, G. C. (1965). Two dimensions of cohesiveness in amall groupa. Sociometry, 28, 30-43.
Haney, W. (1980). Unita and levela of analyaia in large acale evaluation. New directiona for methodology of aocial and behavioral acience, 6^, 1-16.
Hayduk, L. A. (1987). Structural eguation modeling with LISREL. Baltimore: Johna Hopkina Univeraity.
Henderson, D. W. (1985). Cohesion: The human element in combat. Washington, DC: National Defense University Press.
Hersey, P., & Blanchard, K. H. (1969). Life cycle theory of leadership. Training and Development Journal. 23 (2), 26-34.
Hollander, E. P. (1960). Competence and conformity in the acceptance of influence. Journal of Abnormal and Social Psychology, 61, 361-365.
Hoogstraten, J. & Vorst, H. C. M. (1978) . Group cohesion, task performance, and the experimenter expectancy effect. Human Relations, 31, 939-956.
107

Howell, J. P., Bowen, D. E., Dorfman, P. W., Kerr, S., & Podsakoff, P. M. (1990). Substitutes for leadership: Effective Alternatives to ineffective leadership. Organizational Dynamics. Summer, 21-38.
Hrebiniak, L. G. & Alutto, J. A. (1972). Personal and role related factors in the development of organizational commitment. Administrative Science Quarterly, 17, 555-572.
Hunt, J. G., & Osborn, R. N. (1982). Toward a macro-oriented model of leadership: An odyssey. In J. G. Hunt, U. Sekaran, & C. Schriesheim (Eds.), Leadership: Beyond establishment views (pp. 196-221). Carbondale, IL: Southern Illinois Press.
James, L. R., Demaree, R. G., & Wolf, G. (1984). Estimating within-group interrater reliability with and without response bias. Journal of Applied Psychology, ii, 85-98.
Janis, I. L. (1972). Victims of groupthink. Boaton: Houghton Mifflin.
Johna, J. H., Bickel, M. D., Bladea, A. C , Creel, J. B., Catling, W. S., Hinkle, J. M., Kindred, J. D., & Stocka, S. E. (1984). Coheaion in the U.S. military. Waahington, DC: National Defenae Univeraity Preaa.
Johnaon, M. E., & Fortman, J. B. (1988). Internal structure of the Gross Cohesivenesa Scale. Small Group Behavior, 19, 146-152.
Joreskog, K. G., & Sorbom, D. (1989). LISREL 7: A guide to the program and applicationa (2nd ed.). Chicago: SPSS Inc.
Katz, R. L. (1955, Jan - Feb). Skilla of an effective adminiatrator. Harvard Buaineaa Review, 33-42.
Keller, R. T. (1986). Predictora of the performance of project groupa in R & D organizationa. Academy of Management Journal, 29, 715-726.
Kelman, H. C. (1950). Compliance, identification, and internalization: Three proceases of attitude change. Journal of Conflict Reaolution, g, 51-60.
108

Kerr, S., & Jermier, J. M. (1978). Subatitutes for leadership: Their meaning and measurement. Organizational Behavior and Human Performance, 22, 375-403.
Landers, D., & Lueschen, G. (1974). Team performance outcome and cohesiveness of competitive coaching groups. International Review of Sport Sociology, i, 57-71.
Latham, V. M., & Lichtman, C. M. (1984). Social linkages and organizational commitment in voluntary organizations. Social Behavior and Peraonality, 12, 165-170.
Lewin, A. Y. & Minton, J. W. (1986). Determining organizational effectiveneaa: Another look and an agenda for reaearch. Management Science, 32, 514-538.
Lewin, K., Lippitt, R., & White, R. K. (1939). Patterns of aggressive behavior in experimentally created social climates. Journal of Social Psychology, 10, 271-301.
Little, R. W. (1969). Buddy relations and combat performance. In M. Janowitz (Ed.), The new military: Changing patterns of organization (pp. 195-224). New York: Ruaaell Sage Foundation.
Lott, A. J., & Lott, B. E. (1965). Group coheaiveness as interpersonal attraction: A review of relationships with antecedent and consequent variables. Psychological Bulletin, 64, 259-309.
Manning, F. T., & Fullerton, T. D. (1988). Health and well-being in highly cohesive units in the U.S. Army. Journal of Applied Social Psychology, 18, 503-519.
Marlowe, D. H., Furukawa, T. P., Griffith, J. E., Ingraham, L. H., Kirkland, F. R., Martin, J. A., Schneider, R. J., & Teitelbaum, J. M. (1985). New manning system field evaluation. (Tech. Rep. No. 1). Washington, D.C.: Walter Reed Army Institute of Research.
Martens, R., & Peterson, J. A. (1972). Group cohesiveness as a determinant of success and member satisfaction in team performance. International Review of Sport Sociology, S, 49-61.
McGrath, J. E. (1962). The influence of interpersonal relations on adjustment and effectiveness in rifle teams. Journal of Abnormal and Social Psychology, 65, 365-375.
109

Melnick, M. J., & Chemers, M. M. (1978). Effects of group social structure on the success of basketball teams. Research Quarterly, 45, 1-8.
Meyer, J. P., & Allen, N. J. (1984). Testing the "side-bet" theory of organizational commitment: Reexamination of the affective and continuance commitment scales. Journal of Applied Psychology, 69, 372-378.
Meyer, J. P., & Allen, N. J. (1987). A longitudinal analysis of the early development and consequences of organizational commitment. Canadian Journal of Behavioural Science, 19, 199-215.
Meyer, J. P., Paunonen, S. V., & Gellatly, I. R. (1989). Organzizational commitment and job performance: It's the nature of the commitment that counts. Journal of Applied Paychology. 74, 152-156.
Mieaing, P. & Preble, J. F. (1985). Group proceaaea and performance in a complex buaineaa aimulation. Small Group Behavior, 16, 323-338.
Miachel, W. (1968). Peraonality and assessment. New York: Wiley.
Mowday, R. T., Porter, L. M., & Steera, R. M. (1982). Employee-organization linkagea: The paychology of commitment, abaenteeiam, and turnover. New York: Academic Preaa.
Mudrack, P. E. (1989). Defining group coheaiveneaa: A legacy of confuaion? Small Group Behavior, 20, 37-49.
Nixon, H. L. (1977). Coheaiveneaa and team aucceaa: A theoretical reformation. Review of Sport and Leiaure, 2, 36-57.
Novick, M. R., & Lewia, L. (1967). Cofficient alpha and the reliability of compoaite meaaurementa. Psychometrika, 32, 1-13.
O'Reilly, C , & Caldwell, D. (1980). Job choice: The impact of intrinsic and extrinsic factors on subsequent satisfaction and commitment. Journal of Applied Psychology, 65, 559-569.
110

O'Reilly, C , & Chatman, J. (1986). Organizational commitment and psychological attachment: The effects of compliance, identification, and internalization on prosocial behavior. Journal of Applied Psychology, 71, 492-499. ~
Peterson, J. A., & Martens, R. (1972). Success and residential affiliation as determinants of team cohesiveness. Research Quarterly. 43, 62-76.
Phillips, R. L., Blair, J. D., & Schmitt, N. (1987). Beyond group cohesion: The concept of organizational synergy and its impact on performance. National Journal of Sociology, 1, 141-170.
Phillips, R. L, & Wong, L. (1990, November). An integrated model of military unit effectiveness. Paper presented at the meeting of the Southern Managment Association, Orlando, FL.
Podsakoff, P. M., & Todor, W. D. (1985). Relationships between leader reward and punishment behavior and group processes and productivity. Journal of Management, 11, 55-73.
Porter, L. W., Steers, R. M., Mowday, R. T., & Boulian, P. V. (1974). Organizational commitment, job satisfaction, and turnover among psychiatric techniciana. Journal of Applied Paychology, 59, 603-609.
Quinn, R. E. (1988). Beyond rational management. San Franciaco: Joaaey-Baaa.
Quinn, R. E. & Rohrbaugh, J. (1983). A apatial model of effectiveneaa criteria: Towarda a competing valuea approach to organizational analyaia. Management Science, £9, 363-377.
Reichers, A. E. (1985). A review and reconceptualization of organizational commitment. Academy of Management Review, 10, 465-476.
Rousseau, D. M. (1985). Issues of level in organizational research. In B. M. Staw and L. L. Cummings (Eds.), Research in organizational behavior: Vol. 7. (pp. l-37) . Greenwich, CT: JAI Press.
Salancik, G. R. (1977). Commitment and the control of organizational behavior and belief. In B. M. Staw & G. R. Salancik (Eds.), New directions in organizational behavior (pp. 1-54). Chicago: St. Clair.
Ill

Schachter, S. (1952). Comment on the paper by Gross and Martin, American Journal of Sociology, 57, 554-562.
Schermerhorn, J. R., Hunt, J. G., & Osborn, R. N. (1988). Managing organizational behavior. New York: John Wiley.
Schneider, B. (1975). Organizational climate: An essay. Personnel Psychology, 28, 447-449.
Schneider, B. (1983). Work climates: An interactionist perspective. In N. W. Feimer & E. S. Geller (Eds.), Environmental Psychology: Directions and perspectives. New York: Praeger.
Schneider, B. & Bowen, D. E. (1985). Employee and customer perceptions of service in banks: Replication and extension. Journal of Applied Psychology, 70, 423-433.
Schriesheim, J. F. (1980). The social context of leader-subordinate relations: An investigation of the effects of group cohesiveness. Journal of Applied Psychology, ^ , 183-194.
Scott, W. E., & Rowland, K. M. (1970). The generality and signficance of semantic differential scales as measures of morale. Organizational Behavior and Human Performance, 5., 576-591.
Seashore, S. E. (1954). Group cohesiveness in the industrial work group. Ann Arbor: University of Michigan Press.
Shapiro, S. S., & Wilk, M. B. (1965). An analysis of variance test for normality (complete samples). Biometrika, 5^, 591-211.
Shaycroft, M. (1962). The statistical characteristics of school means. In J. Flanagan & others (Eds.), Studies of the American High School. Pittsburgh: University of Pittsburgh.
Sheldon, M. W. (1971). Investments and involvements as mechanisms producing commitment to the organization. Administrative Science Quarterly, 16, 142-150.
Shils, E. A., & Janowitz, M. (1948). Cohesion and disintegration in the Wehrmacht in World War II. Public Opinion Quarterly, 12, 281-315.
112

Siebold, G. L., & Kelley, D. R. (1988). Development of the combat platoon cohesion questionnaire. Alexandria, VA: U.S. Army Research Institute.
Smith, J. E., Carson, K. P., & Alexander, R. A. (1984). Leadership: It can make a difference. Academy of Management Journal. 27, 765-776.
Smith, P. B., & Peterson, M. F. (1989). Leadership, organizations, and culture. London: Sage.
Smith, K. W., & Sasaki, M. S. (1979). Decreasing multicollinearity. Sociological Methods & Research, 8_, 35-56.
Stogdill, R. M. (1948). Personal factors associated with leadership: A survey of the literature. Journal of Psychology, 25, 35-71.
Stogdill, R. M. (1959). Individual behavior and group achievement. New York: Oxford.
Stogdill, R. M. (1972). Group productivity, drive, and cohesiveness. Organizational Performance and Human Behavior, 8., 26-43.
Stogdill, R. M. (1974). Handbook of leaderahip: A aurvey of the literature. New York: Free Preaa.
Turner, J. C , Hogg, M. A., Turner, P. J., & Smith, P. M. (1984) . Failure and defeat aa determinanta of group coheaiveneaa. Britiah Journal of Social Paychology, 21, 97-111.
Tziner, A., & Vardi, Y. (1982). Effecta of command atyle and group coheaiveneaa on the performance effectiveneaa of self-selected tank crews. Journal of Applied Psychology, 67, 769-775.
Widmeyer, W. N., & Martens, R. (1978). When cohesion predicts performance outcome in sports. Research Quarterly, 19, 372-380.
Williams, J. M., & Hacker, C. M. (1982). Causal relationships among cohesion, satisfaction, and performance in women's intercollegiate field hockey teams. Journal of Sport Psychology, 4., 324-337.
Wold, H. (1985). System analysis by partial least squares, in P. Nijkamp, H. Leitner, and N. Wrigley (Eds.), Measuring the unmeasurable (pp. 221-252). Dordrecht, Netherlands: Martinus Nijhoff.
113
Wright, T. L., & Duncan, D. (1986). Attraction to group, group cohesiveness, and individual outcome: A study of training groups. Small Group Behavior. 17, 487-492.
Wright, P. L., & Taylor, D. S. (1984)." The implications of a skills approach to leadership. Journal of Management Development, 1(3), 15-29.
Yukelson, D., Weinberg, R., & Jackson, A., (1984). A multidimensional group cohesion instrument for intercollegiate basketball teams. Journal of Sport Psychology, 6, 103-117.
Yukl, G. (1989a). Managerial leadership: A review of theory and research. Journal of Management, 15, 251-289.
Yukl, G. (1989b). Leadership in organizations. Englewood Cliffs, NJ: Prentice-Hall.
Zaccaro, S. J., & Lowe, C. A., (1988). Cohesiveness and performance on an additive task: Evidence for multidimensionality. Journal of Social Psychology, 128, 547-558.
Zaccaro, S. J., & McCoy, M. C. (1988). The effects of task and interpersonal cohesiveness on performance of a disjunctive group task. Journal of Applied Social Psychology, 18, 837-851.
Zeller, R. A., & Carmines, E. G. (1980). Measurement in the social sciences. London: Cambridge University Press.
114
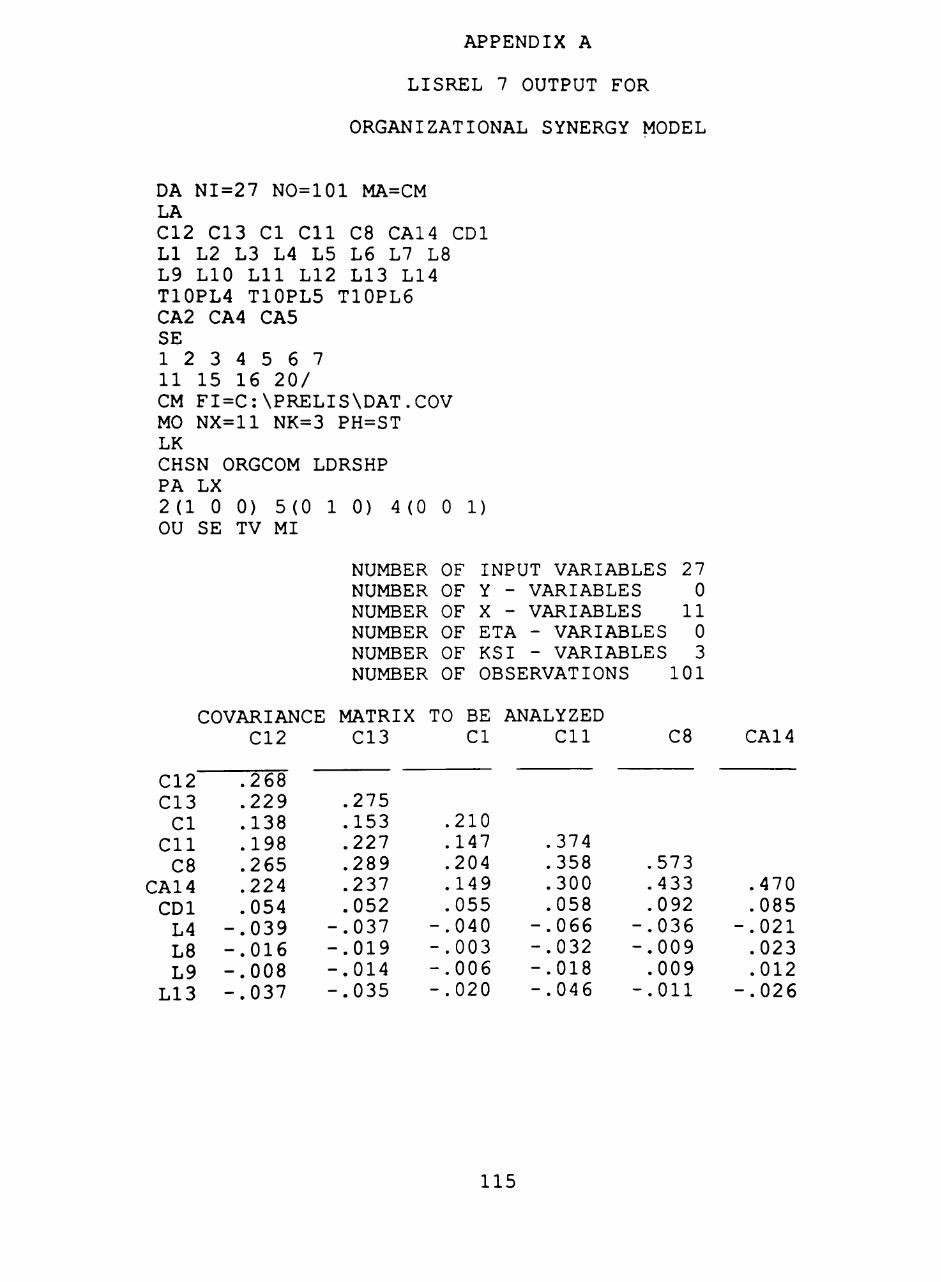
APPENDIX A
LISREL 7 OUTPUT FOR
ORGANIZATIONAL SYNERGY MODEL
DA NI=27 NO=101 MA=CM LA C12 C13 CI Cll C8 CA14 CDl LI L2 L3 L4 L5 L6 L7 L8 L9 LIO Lll L12 L13 L14 T10PL4 T10PL5 T10PL6 CA2 CA4 CA5 SE 1 2 3 4 5 6 7 11 15 16 20/ CM FI=C:\PRELIS\DAT.COV MO NX=11 NK=3 PH=ST LK CHSN ORGCOM LDRSHP PA LX 2(10 0) 5(0 1 0) 4 (0 0 1) OU SE TV MI
COVARIANCE
C12 C13 CI
Cll C8
CA14 CDl L4 L8 L9
L13
C12
.268
.229
.138
.198
.265
.224
.054 -.039 -.016 -.008 -.037
NUMBER NUMBER NUMBER NUMBER NUMBER NUMBER
OF INPUT VARIABLES 27 OF Y -OF X -OF ETA OF KSI
VARIABLES VARIABLES
0 11
- VARIABLES 0 - VARIABLES 3
OF OBSERVATIONS
MATRIX TO BE ANALYZED C13
.275
.153
.227
.289
.237
.052 -.037 -.019 -.014 -.035
CI
.210
.147
.204
.149
.055 -.040 -.003 -.006 -.020
Cll
.374
.358
.300
.058 -.066 -.032 -.018 -.046
101
C8
.573
.433
.092
.036
.009
.009
.011
CA14
.470
.085 -.021 .023 .012
-.026
115

COVARIANCE MATRIX TO BE ANALYZED CDl L4 L8
PARAMETER SPECIFICATIONS LAMBDA X
CHSN
C12 C13 CI
Cll C8
CA14 CDl L4 L8 L9
L13 PHI
1 2 0 0 0 0 0 0 0 0 0
CHSN
CHSN 0 ORGCOM 12 LDRSHP 13
THETA DELTA C12 C13
15 THETA DELTA
CDl
21
16
ORGCOM
0 0 3 4 5 6 7 0 0 0 0
ORGCOM
0 14
CI
TT"
L4
22
LDRSHP
0 0 0 0 0 0 0 8 9
10 11
LDRSHP
0
Cll
18
L8
23
L9 L13
CDl L4 L8 L9
L13
. 0 9 1
. 0 1 2
. 0 3 3
. 0 2 7
. 0 0 4
. 7 6 6
. 5 9 5
. 584
. 562
. 7 2 3
. 6 0 8
. 5 5 3 . 6 8 6 . 5 5 5 654
C8
"T9"
L9
"2?
CA14
To"
L13
""2^
116

INITIAL ESTIMATES (TSLS) LAMBDA
C12 C13 CI
Cll C8
CA14 CDl L4 L8 L9
L13
PHI
CHSN ORGCOM LDRSHP
THETA DELTA C12 C13
X CHSN
.458
.499
.000
.000
.000
.000
.000
.000
.000
.000
.000
CHSN
1.000 .854
-.070
CI
ORGCOM
.000
.000
.350
.501
.664
.597
.129
.000
.000
.000
.000
ORGCOM
1.000 -.037
LDRSHP
.0.00
.000
.000
.000
.000
.000
.000
.769
.779
.767
.722
LDRSHP
1.000
Cll C8 CA14
.058 .026 THETA DELTA
CDl L4
087
L8
123
L9
132
L13
.113
.074 .175 .117 .098 .132 SQUARED MULTIPLE CORRELATIONS FOR X - VARIABLES
C12 C13 CI Cll C8 CA14
.784 .906 .584 .670 .769 SQUARED MULTIPLE CORRELATIONS FOR X - VARIABLES CDl L4 L8 L9 L13
.760
.183 .772 .839 .857 .798 TOTAL COEFFICIENT OF DETERMINATION FOR X - VARS IS 999
117

LISREL ESTIMATES (MAXIMUM LIKELIHOOD) LAMBDA X
CHSN ORGCOM LDRSHP
C12 C13 CI
Cll C8
CA14 CDl L4 L8 L9
L13 PHI
CHSN ORGCOM LDRSHP
THETA DELTA C12
.058 THETA DELTA
CDl
.458
.499
.000
.000
.000
.000
.000
.000
.000
.000
.000
CHSN
1.000 .835
-.062
C13
.026
L4
.000
.000
.292
.507
.709
.596
.133
.000
.000
.000
.000
ORGCOM
1.000 -.021
CI
.125
L8
.000
.000
.000
.000
.000
.000
.000
.764
.780
.773
.718
LDRSHP
1.000
Cll
.117
L9
C8
.070
CA14
.115
L13
.073 .182 .114 .088 SQUARED MULTIPLE CORRELATIONS FOR X - VARIABLES C12 C13 CI Cll C8
138
CA14
.784 .907 .405 .688 .879 .756
SQUARED MULTIPLE CORRELATIONS FOR X - VARIABLES CDl L4 L8 L9 L13
nr95 .763 .842 .872 .789 TOTAL COEFFICIENT OF DETERMINATION FOR X - VARS IS .999
CHI-SQUARE WITH 41 DEGREES OF FREEDOM = 41 GOODNESS OF FIT INDEX = .931
ADJUSTED GOODNESS OF FIT INDEX = ROOT MEAN SQUARE RESIDUAL =
SUMMARY STATISTICS FOR FITTED RESIDUALS SMALLEST FITTED RESIDUAL = -.058 MEDIAN FITTED RESIDUAL = .000 LARGEST FITTED RESIDUAL = .035
74 (P = .439)
.889
.016
118

STEMLEAF PLOT - 518 - 41 - 3185 - 21544 - 11876633210 - 019777644322211110000000000000
01233456666 110034466 211269 31135
SUMMARY STATISTICS FOR STANDARDIZED RESIDUALS STANDARDIZED STANDARDIZED STANDARDIZED PLOT
RESIDUAL = RESIDUAL = RESIDUAL =
-2 473 000 041
SMALLEST MEDIAN LARGEST STEMLEAF - 215 - 11764211100 - 0 187777 6555544433311100000000000000
011133334677889 111123578 2 137 310
LARGEST POSITIVE STANDARDIZED RESIDUALS RESIDUAL FOR CI AND C13 = 3 RESIDUAL FOR CA14 AND C8 = 2
041 658
STANDARD ERRORS LAMBDA X
CHSN ORGCOM LDRSHP
C12 C13 CI
Cll C8
CA14 CDl L4 L8 L9
L13 PHI
.042
.041
.000
.000
.000
.000
.000
.000
.000
.000
.000
CHSN
.000
.000
.042
.051
.058
.055
.029
.000
.000
.000
.000
ORGCOM
.000
.000
.000
.000
.000
.000
.000
.070
.066
.063
.064
LDRSHP
CHSN .000 ORGCOM .040 LDRSHP .106
THETA DELTA C12 C13
.013 .013
CI
019
.000
.106 .000
Cll
019
C8
.019
CA14
.021
119

THETA DELTA CDl L4 L8 L9 L13
.010
T-VALUES
.031
LAMBDA
C12 C13 CI
Cll C8
CA14 CDl L4 L8 L9
L13 PHI
CHSN ORGCOM LDRSHP
10 12
2C
X CHSN
.953
.302
.000
.000
.000
.000
.000
.000
.000
.000
.000
CHSN
.000 1.972 -.585
.023
ORGCOM
.000
.000 6.947
10.034 12.253 10.804 4.511 .000 .000 .000 .000
ORGCOM
.000 -.202
.020
LDRSHP
.000
.000
.000
.000
.000
.000
.000 10.951 11.903 12.266 11.259
LDRSHP
.000
.025
THETA DELTA C12 C13 CI Cll C8
4.454 2.049 THETA DELTA
CDl
6.751
L4
5.982
L8
3.567
L9
CA14
5.493
L13
6.959 5.830 4.957 4.399 5.619
MODIFICATION INDICES AND ESTIMATED CHANGE MODIFICATION INDICES FOR LAMBDA X
CHSN ORGCOM LDRSHP
C12 C13 CI
Cll C8
CA14 CDl L4 L8 L9
L13
.000
.000 9.622 2.326 2.770 1.620 .067 .655 .163 .885 .684
.000
.000
.000
.000
.000
.000
.000 1.213 .173
1.023 .423
.000
.000
.121 1.293 .083 .238
1.243 .000 .000 .000 .000
120

ESTIMATED CHANGE FOR LAMBDA X CHSN ORGCOM LDRSHP
C12 C13 CI
Cll C8
CA14 CDl L4 L8 L9
L13 NO NON-ZERO NO NON-ZERO
.000
.000
.247
.131 -.169 -.118 -.015 -.039 .017 .036
-.035 MODIFICATION MODIFICATION
MAXIMUM MODIFICATION
.001 -.001 .000 .000 .000 .000 .000
-.053 .017 .039
-.028 INDICES INDICES
INDEX IS
FOR FOR 9. ,62
.000
.000 -.013 -.044 .011 .019 .031 .000 .000 .000 .000 PHI THETA DELTA ! FOR ELEMENT ( 3, 1) OF
LAMBDA X
121

APPENDIX B
LISREL 7 OUTPUT FOR
LEADER-GROUP INTERACTIONS MODEL
DA NI=27 NO=101 MA=CM LA C12 C13 CI Cll C8 CA14 CDl LI L2 L3 L4 L5 L6 L7 L8 L9 LIO Lll L12 L13 L14 T10PL4 T10PL5 T10PL6 CA3 CA4 CA5 SE 1 2 3 4 7 22 24 25 27/ CM FI=C:\PRELIS\DAT.COV MO NX=9 NK=5 PH=ST LK CHSN GOAL DRIVE PA LX 2(1 0 0 0 0) 2(0 1 0 0 2(0 0 0 1 0) 2 (0 0 0 0 VA 1 LX(5,3) VA .0273 TD(5,5) OU SE TV MI
INSTR SUPP
0) 1)
1 (0 0 0 0 0)
COVARIANCE
NUMBER OF NUMBER OF NUMBER OF NUMBER OF NUMBER OF NUMBER OF
MATRIX TO BE C12 C13
INPUT VARIABLES 27 Y - VARIABLES 0 X - VARIABLES 9 ETA - VARIABLES 0 KSI - VARIABLES 5 OBSERVATIONS 101
ANALYZED CI Cll CDl T10PL4
C12 C13 CI
Cll CDl
T10PL4 T10PL6
CA3 CA5
.268
.229
.138
.198
.054 -.021 -.004 .002
-.008 COVARIANCE
T10PL6
.275
.153
.227
.052 •.015 •.004 .002 .028 MATRIX
.210
.147
.055
.016
.033
.044
.019 TO BE CA3
.374
.058 -.025 -.030 .081 .016
ANALYZED CA5
091 008 004 025 018
879 587 099 209
T10PL6 CA3 CA5
907 156 279
.492
.131 .346
122

PARAMETER SPECIFICATIONS LAMBDA X
C12 C13 CI
Cll CDl
T10PL4 T10PL6
CA3 CA5
CHSN
1 2 0 0 0 0 0 0 0
PHI
CHSN GOAL
DRIVE INSTR SUPP
CHSN
0 9
10 12 15
THETA DELTA C12 C13
GOAL
0 0 3 4 0 0 0 0 0
GOAL
0 11 13 16
CI
DRIVE
0 0 0 0 0 0 0 0 0
DRIVE
0 14 17
Cll
INSTR
0 0 0 0 0 5 6 0 0
INSTR
0 18
CDl
SUPP
0 0 0 0 0 0 0 7 8
SUPP
0
T10PL4
19 20 THETA DELTA
T10PL6 CA3
21 22 23 24
CA5
25 26 27
INITIAL ESTIMATES LAMBDA X
C12 C13 CI
Cll CDl
T10PL4 T10PL6
CA3 CA5
PH]
CHSN GOAL
DRIVE INSTR SUPP
CHSN
.452
.506
.000
.000
.000
.000
.000
.000
.000
CHSN
1.000 .960 .435
-.027 .033
(TSLS)
GOAL
.000
.000
.318
.461
.000
.000
.000
.000
.000
GOAL
1.000 .560
-.020 .300
DRIVE
.000
.000
.000
.000
.252
.000
.000
.000
.000
DRIVE
1.000 .029 .230
INSTR
.000
.000
.000
.000
.000
.666
.882
.000
.000
INSTR
1.000 .618
SUPP
.000
.000
.000
.000
.000
.000
.000
.418
.314
SUPP
1.000
123

THETA DELTA C12 C13
063 .019 THETA DELTA T10PL6 CA3
CI
109
CA5
Cll
.161
CDl
027
T10PL4
.436
.129 .318 .247 SQUARED MULTIPLE CORRELATIONS FOR X - VARIABLES
C12 C13 CI Cll CDl T10PL4
.763 .932 .482 .569 .699 .505 SQUARED MULTIPLE CORRELATIONS FOR X - VARIABLES
T10PL6 CA3 CA5
.858 .354 .284 TOTAL COEFFICIENT OF DETERMINATION FOR X - VARS IS 999
LISREL ESTIMATES (MAXIMUM LIKELIHOOD) LAMBDA X
CHSN GOAL DRIVE INSTR SUPP
C12 C13 CI
Cll CDl
T10PL4 T10PL6
CA3 CA5
PHI
CHSN 1 GOAL
DRIVE INSTR SUPP
THETA DELTA C12
.064 THETA DELTA
T10PL6
.451
.507
.000
.000
.000
.000
.000
.000
.000
CHSN
.000
.961
.418
.014
.083
C13
.018
CA3
.000
.000
.320
.459
.000
.000
.000
.000
.000
GOAL
1.000 .579 .003 .157
CI
.108
CA5
.000
.000
.000
.000
.252
.000
.000
.000
.000
DRIVE
1.000 .023 .178
Cll
.164
.000
.000
.000
.000
.000
.658
.892
.000
.000
INSTR
1.000 .682
CDl
.027
.000
.000
.000
.000
.000
.000
.000
.290
.451
SUPP
1.000
T10PL4
.446
.111 .408 .142 SQUARED MULTIPLE CORRELATIONS FOR X - VARIABLES C12 C13 CI Cll CDl
.760 .935 .487 .563 .699
T10PL4
.493
124

SQUARED MULTIPLE CORRELATIONS FOR X -T10PL6 CA3 CA5
VARIABLES
.878 .171 .589 TOTAL COEFFICIENT OF DETERMINATION FOR X - VARIABLES IS .999
CHI-SQUARE WITH 18 DEGREES OF FREEDOM = GOODNESS OF FIT INDEX = .956
ADJUSTED GOODNESS OF FIT INDEX = ROOT MEAN SQUARE RESIDUAL =
21.60 (P = .250)
.891
.015
RESIDUAL RESIDUAL
SUMMARY STATISTICS FOR FITTED SMALLEST FITTED RESIDUAL =
FITTED FITTED PLOT
21 650 7600 9943321110000000000000 124456789 25
MEDIAN LARGEST STEMLEAF - 3 - 2 - 1 - 0
RESIDUALS -.032 .000 .060
0 1 2 3 4 5 6
02
0 SUMMARY STATISTICS FOR STANDARDIZED RESIDUALS SMALLEST MEDIAN LARGEST STEMLEAF - 1 - 1 - 0
0 0 0 1 1
STANDARDIZED STANDARDIZED STANDARDIZED PLOT
7 332100 8765 33332210000000000000 1234 77 0123333 6
RESIDUAL = RESIDUAL = RESIDUAL =
-1 663 000 616
125
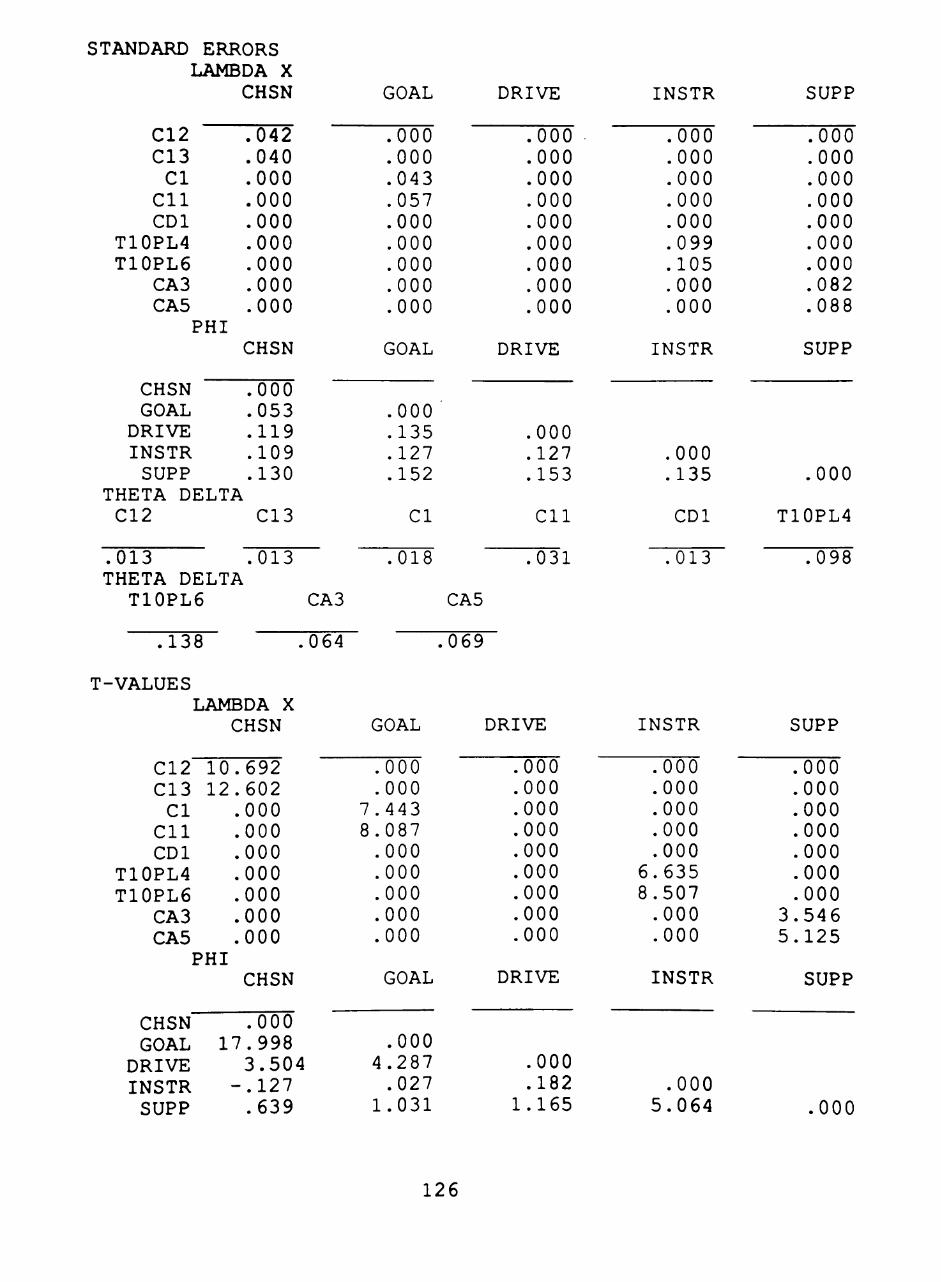
STANDARD ERRORS LAMBDA X
C12 C13 CI Cll CDl
T10PL4 T10PL6
CA3 CA5
PHI
CHSN GOAL
DRIVE INSTR SUPP
CHSN
.042
.040
.000
.000
.000
.000
.000
.000
.000
CHSN
.000
.053
.119
.109
.130 THETA DELTA C12
.013
C13
.013 THETA DELTA
T10PL6
.138
T-VALUES
1
CA3
.064
LAMBDA X
C12 C13 CI
Cll CDl
T10PL4 T10PL6
CA3 CA5
(
10 12
PHI
CHSN GOAL
DRIVE INSTR SUPP
CHSN
.692
.602
.000
.000
.000
.000
.000
.000
.000
CHSN
.000 17.998 3.504 -.127 .639
GOAL
.000
.000
.043
.057
.000
.000
.000
.000
.000
GOAL
.000
.135
.127
.152
CI
.018
•
GOAL
.000
.000 7.443 8.087 .000 .000 .000 .000 .000
GOAL
.000 4.287 .027
1.031
DRIVE
.000
.000
.000
.000
.000
.000
.000
.000
.000
DRIVE
.000
.127
.153
Cll
.031
CA5
069
DRIVE
.000
.000
.000
.000
.000
.000
.000
.000
.000
DRIVE
.000
.182 1.165
INSTR
.000
.000
.000
.000
.000
.099
.105
.000
.000
INSTR
.000
.135
CDl
.013
INSTR
.000
.000
.000
.000
.000 6.635 8.507 .000 .000
INSTR
.000 5.064
SUPP
.000
.000
.000
.000
.000
.000
.000
.082
.088
SUPP
.000
T10PL4
.098
SUPP
.000
.000
.000
.000
.000
.000
.000 3.546 5.125
SUPP
.000
126

THETA DELTA C12 C13
4.764 1.404 THETA DELTA
T10PL6
CI Cll
5.867 5.225
CA3 CA5
CDl
2.131
T10PL4
4.561
.800 6.395 2.066
MODIFICATION INDICES AND ESTIMATED CHANGE MODIFICATION INDICES FOR LAMBDA X
CHSN GOAL DRIVE INSTR
NO NO NON-ZERO MODIFICATION INDICES FOR THETA DELTA MAXIMUM MODIFICATION INDEX IS 2.76 FOR ELEMENT (8,4) LAMBDA X
SUPP
C12 C13 CI
Cll CDl
T10PL4 T10PL6
CA3 CA5
.000
.000 1.290 1.290 .000 .125 .125 .015 .015
ESTIMATED
C12 C13 CI
Cll CDl
T10PL4 T10PL6
CA3 CA5
CHSN
.000
.000 -.293 .420 .000
-.026 .035
-.009 .013
.090
.090
.000
.000
.000
.080
.080
.043
.043 CHANGE FOR
GOAL
.060 -.068 .000 .000 .000
-.021 .028 .015
-.023
.790
.790 1.610 1.610 .000 .019 .019 .776 .776
LAMBDA X DRIVE
.036 -.041 .084
-.121 .000 .012
-.016 .073
-.114 NON-ZERO MODIFICATION INDICES FOR PHI
.053
.053 1.533 1.533 .000 .000 .000
2.764 2.763
INSTR
-.007 .008 .057
-.081 .000 .000 .000
-.503 .781
1.601 1.601 .516 .516 .000 .000 .000 .000 .000
SUPP
-.042 .048 .037
-.054 .000 .004
-.006 .000 .000
OF
127

APPENDIX C
REGRESSION RESULTS FOR
ORGANIZATIONAL SYNERGY MODEL
Model 1: Direct effects with infantry and armor combined
Analysis of Variance
Source DF
Model 3 Error 95 C Total 98
Sum of Squares
0.10443 3.72651 3.83094
0 0
Mean Square
03481 03923
F Value
0.887
Prob>F
0.4506
Root MSE Dep Mean C.V.
0.19806 0.33910
58.40659
R-square Adj R-sq
0.0273 -0.0035
Parameter Estimates
Variable DF
INTERCEP 1 COHESION 1 ORGCOM 1 LEADER 1
Parameter Estimate
0.148721 -0.037586 0.081278 0.048937
Standard Error
0.16282920 0.13224840 0.12496908 0.03358756
T for HO: Parameter=0
0 . 9 1 3 0 . 2 8 4 0 . 6 5 0 1 .457
ProbIT
0.3634 0.7769 0.5170 0.1484
128

Model 2 Leadership x Organizational Commitment interaction term (infantry and armor combined).
Analysis of Variance
Source Sum of
DF Squares Mean
Square F Value Prob>F
Model 4 Error 94 C Total 98
0.10998 3.72096 3.83094
0.02749 0.03958
0.695 0.5975
Root MSE Dep Mean C.V.
0.19896 0.33910 58.67271
R-square Adj R-sq
0.0287 -0.0126
Parameter Estimates
Parameter Standard T for HO Variable
INTERCEP COHESION ORGCOM LEADER LOC
Variable INTERCEP COHESION ORGCOM LEADER LOC
DF
1 1 1 1 1
DF 1 1 1 1 1
Estimate
0, -0, 0, 0
-0
.151433
.034826
.072955
.050936
.048206
Error Parameter=0
0.16373134 0.13305524 0.12749150 0.03416009 0.12875322
Variance Inflat ion
0.00000000 2.54683584 2.60948324 1.03079951 1.07494278
0.925 -0.262 0.572 1.491
-0.374
Prob
0, 0. 0. 0. 0,
> IT
.3574
.7941
.5685
.1393
.7089
129

Model 3: Cohesion x Leadership interaction term (infantry and armor combined).
Analysis of Variance
Source DF Squares
Model 4 Error 94 C Total 98
0.11840 3.71254 3.83094
Sum of Square
0.02960 0.03950
Mean F Value
0.749
Prob>F
0.5608
Root MSE Dep Mean C.V.
0.19873 0.33910
58.60625
R-square Adj R-sq
0.0309 -0.0103
Parameter Estimates
Variable DF Parameter Estimate
Standard T for HO: Error Parameter=0 Prob >
INTERCEP 1 0.157538 0 COHESION 1 -0.053067 0 ORGCOM 1 0.083610 0 LEADER 1 0.052801 0 CL 1 -0.085558 0
16405680 13522881 12545754 03432253 14383686
0 . 9 6 0 - 0 . 3 9 2
0 . 6 6 6 1 .538
- 0 . 5 9 5
0 0 0 0 0
3394 6956 5068 1273 5534
Variable DF Variance Inflation
INTERCEP 1 0 COHESION 1 2 ORGCOM 1 2 LEADER 1 1 CL 1 1
00000000 63669474 53261967 04298770 12103759
130

Model 4: Cohesion x Organizational Commitment interaction term (infantry and armor combined).
Analysis of Variance
Source DF
Model 4 Error 95 C Total 99
Sum of Squares
0.12536 3.81942 3.94478
0 0
Mean Square
03134 04020
F Value
0.780
Prob>F
0.5412
Root MSE Dep Mean C.V.
0.20051 0.33571
59.72745
R-square Adj R-sq
0.0318 -0.0090
Parameter Estimates
Variable DF Parameter Estimate
Standard T for HO: Error Parameter=0 Prob > IT
INTERCEP 1 0.126182 COHESION 1 -0.039124 ORGCOM 1 0.092576 LEADER 1 0.052606 COC 1 -0.093318
0.16417834 0.769 0.4441 0.13388490 -0.292 0.7708 0.12630422 0.733 0.4654 0.03416537 1.540 0.1269 0.29028254 -0.321 0.7486
Variable DF Variance Inflation
INTERCEP 1 COHESION 1 ORGCOM 1 LEADER 1 COC 1
0.00000000 2.54653741 2.53777987 1.01727331 1.01177065
131
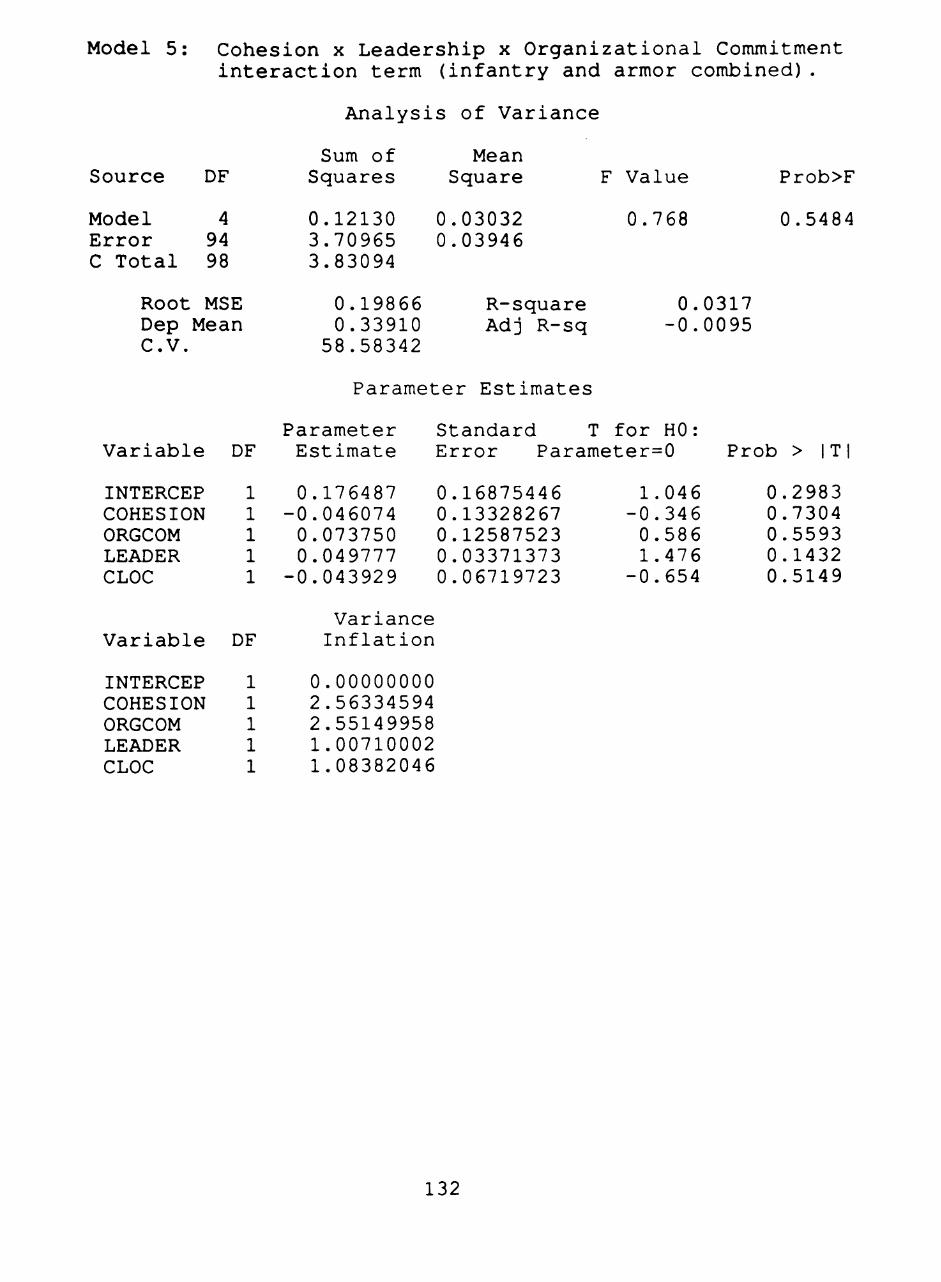
Model 5: Cohesion x Leadership x Organizational Commitment interaction term (infantry and armor combined).
Analysis of Variance
Source DF
Model 4 Error 94 C Total 98
Sum of Squares
0.12130 3.70965 3.83094
Mean Square
0.03032 0.03946
F Value
0.768
Prob>F
0.5484
Root MSE Dep Mean C.V.
0.19866 0.33910
58.58342
R-square Adj R-sq
0.0317 -0.0095
Parameter Estimates
Variable DF Parameter Estimate
Standard T for HO: Error Parameter=0 Prob >
INTERCEP 1 0.176487 0 COHESION 1 -0.046074 0 ORGCOM 1 0.073750 0 LEADER 1 0.04 9777 0 CLOC 1 -0.043929 0
16875446 13328267 12587523 03371373 06719723
1 -0 0 1
-0
046 346 586 476 654
0 0 0 0 0
2983 7304 5593 1432 5149
Variable DF Variance Inflation
INTERCEP 1 0 COHESION 1 2 ORGCOM 1 2 LEADER 1 1 CLOC 1 1
00000000 56334594 55149958 00710002 08382046
132

Model 6: Direct effects with armor only.
Analysis of Variance
im of Mean Source DF Squares Square F Value Prob>F
Model 3 0.03461 0.01154 0.282 0.8379 Error 57 C Total 60
Root MSE 0.20214 R-square 0.0146 Dep Mean 0.31344 Adj R-sq -0.0372 C.V.
Sum of Squares
0.03461 2.32912 2.36373
0.20214 0.31344 64.49091
Mean Square
0.01154 0.04086
R-square Adj R-sq
Parameter Estimates
Parameter Standard T for HO: Variable DF Estimate Error Parameter=0 Prob > |T|
INTERCEP 1 0.320072 0.23029031 1.390 0.1700 COHESION 1 -0.059507 0.16264601 -0.366 0.7158 ORGCOM 1 0.005911 0.16239878 0.036 0.9711 LEADER 1 0.028834 0.04447241 0.648 0.5194
133

Model 7:
Source
Model Error C Total
Leadership x Organizational Commitment interaction term with armor only.
Analysis of Variance
Root MSE Dep Mean C.V.
Sum of DF Squares
4 0.03849 56 2.32524 60 2.36373
0.20377 0.31344 65.00993
Mean Square
0.00962 0.04152
R-square Adj R-sq
F Value
0.232
Prob>F
0.9194
0.0163 -0.0540
Parameter Estimates
Variable DF Parameter Estimate
Standard T for HO: Error Parameter=0 Prob > |T|
INTERCEP 1 COHESION 1 ORGCOM 1 LEADER 1 LOC 1
Variable DF
0.337233 0.065426 0.009430 0.024314 0.050396
Variance Inflation
0.23883226 0.16509390 0.16410984 0.04720519 0.16482387
1 0 0 0 0
412 396 057 515 306
0 0 0 0 0
1635 6934 9544 6085 7609
INTERCEP 1 COHESION 1 ORGCOM 1 LEADER 1 LOC 1
0.00000000 2.43779166 2.35872469 1.15252839 1.11306175
134

Model 8 Cohesion x Leadership interaction term with armor only.
Analysis of Variance
Source DF
Model 4 Error 56 C Total 60
Sum of Squares
0.04985 2.31389 2.36373
Mean Square
0.01246 0.04132
F Value
0.302
Prob>F
0.8757
Root MSE Dep Mean C.V.
0.20327 0.31344 64.85105
R-square Adj R-sq
0.0211 -0.0488
Parameter Estimates
Variable DF Parameter Estimate
Standard T for HO: Error Parameter=0 Prob > T|
INTERCEP 1 0.357977 0 COHESION 1 -0.045022 0 ORGCOM 1 -0.007935 0 LEADER 1 0.015772 0 CL 1 0.114973 0
23984340 16528490 16489014 04962626 18935551
1, 0, 0, 0, 0,
.493
.272
.048
.318
.607
0. 0. 0. 0. 0.
.1412
.7863
.9618
.7518
.5462
Variable DF Variance Inflation
INTERCEP 1 COHESION 1 ORGCOM 1 LEADER 1 CL 1
0.00000000 2.45542253 2.39288990 1.28003142 1.28307326
135

Model 9: Cohesion x Organizational Commitment interaction term with armor only.
Analysis of Variance
Source
Model Error C Total
Root Dep C.V.
DF
4 56 60
MSE Mean
Sum of Squares
0.07334 2.37951 2.45285
0.20613 0.30980 66.53753
Mean Square
0.01834 0.04249
R-square Adj R-sq
F Value
0.432
0.0299 -0.0394
0.7853
Parameter Estimates
Variable
INTERCEP COHESION ORGCOM LEADER COC
Variable
INTERCEP COHESION ORGCOM LEADER COC
DF
1 1 1 1 1
DF
1 1 1 1 1
Parameter Standard T for HO: Estimate Error Parameter=0
0.351562 0.24793386 1. -0.083355 0.16811153 -0. 0.007239 0.16634819 0. 0.022616 0.04668215 0. 0.376832 0.41576796 0.
Variance Inflation
0.00000000 2.37716452 2.33195384 1.10175243 1.13099445
.418
.496
.044
.484
.906
Prob
0. 0. 0. 0. 0.
> ITI
.1617
.6220
.9654
.6299
.3686
136

Model 10: Cohesion x Leadership x Organizational Commmitment interaction term with armor only.
Analysis of Variance
Sum of Mean Source DF Squares Square F Value Prob>F
Model 4 0.07303 0.01826 0.446 0.7746 Error 56 2.29070 0.04091 C Total 60 2.36373
Root MSE 0.20225 R-square 0.0309 Dep Mean 0.31344 Adj R-sq -0.0383 C.V. 64.52534
Parameter Estimates
Parameter Standard T for HO: Variable DF Estimate Error Parameter=0 Prob >|T|
INTERCEP 1 0.354372 0.23311573 1.520 0.1341 COHESION 1 -0.055521 0.16278481 -0.341 0.7343 ORGCOM 1 -0.000924 0.16263849 -0.006 0.9955 LEADER 1 0.014526 0.04688162 0.310 0.7578 CLOC 1 0.090788 0.09368165 0.969 0.3367
Variance Variable DF Inflation
INTERCEP 1 0.00000000 COHESION 1 2.40580870 ORGCOM 1 2.35154575 LEADER 1 1.15392121 CLOC 1 1.11653470
137

Model 11: Direct effects with infantry only.
Analysis of Variance
Sum of Mean Source DF Squares Square F Value Prob>F
Model 3 0.36158 0.12053 4.114 0.0134 Error 35 1.02537 0.02930 C Total 38 1.38695
Root MSE 0.17116 R-square 0.2607 Dep Mean 0.37623 Adj R-sq 0.1973 C.V. 45.49365
Parameter Estimates
Parameter Standard T for HO: Variable DF Estimate Error Parameter=0 Prob > |T|
INTERCEP 1 -0.358711 0.22028479 -1.628 0.1124 COHESION 1 0.123058 0.21186467 0.581 0.5651 ORGCOM 1 0.226118 0.18140285 1.246 0.2209 LEADER 1 0.097307 0.04800730 2.027 0.0503
138

Model 12: Leadership x Organizational interaction term and infantry only.
Analysis of Variance
Source
Model Error C Total
Root Dep C.V.
DF
4 34 38
MSE Mean
Sum of Squares
0.37255 1.01439 1.38695
0.17273 0.37623
45.91015
Mean Square
0.09314 0.02984
R-square Adj R-sq
F Value
3.122
0.2686 0.1826
Prob>F
0.0273
Parameter Estimates
Parameter Standard T for HO: Variable DF Estimate Error Parameter=0 Prob > |T
INTERCEP 1 -0.292348 0.24777127 -1.180 0.2462 COHESION 1 0.117866 0.21397557 0.551 0.5853 ORGCOM 1 0.189349 0.19284094 0.982 0.3331 LEADER 1 0.095931 0.04849995 1.978 0.0561 LOC 1 -0.134797 0.22225331 -0.607 0.5482
Variance Variable DF Inflation
INTERCEP 1 0.00000000 COHESION 1 2.66528848 ORGCOM 1 2.94275124 LEADER 1 1.01486931 LOC 1 1.35255845
139

Model 13: Cohesion x Leadership interaction term with infantry only.
Analysis of Variance
Sum of Mean Source DF Squares Square F Value Prob>F
Model 4 0.47073 0.11768 4.367 0.0059 Error 34 0.91621 0.02695 C Total 38 1.38695
Root MSE 0.16416 R-square 0.3394 Dep Mean 0.37623 Adj R-sq 0.2617 C.V. 43.63193
Parameter Estimates
Parameter Standard T for HO: Variable DF Estimate Error Parameter=0 Prob > IT
INTERCEP 1 -0.088694 0.25026968 -0.354 0.7252 COHESION 1 0.022526 0.20924423 0.108 0.9149 ORGCOM 1 0.183677 0.17525267 1.048 0.3020 LEADER 1 0.076910 0.04714497 1.631 0.1120 CL 1 -0.506808 0.25181804 -2.013 0.0521
Variance Variable DF Inflation
INTERCEP 1 0.00000000 COHESION 1 2.82183370 ORGCOM 1 2.69087148 LEADER 1 1.06171198 CL 1 1.38302995
140

Model 14: Cohesion x Organizational Commitment interaction term with infantry only.
Analysis of Variance
Sum of Mean Source DF Squares Square F Value Prob>F
Model 4 0.37037 0.09259 3.097 0.0282 Error 34 1.01657 0.02990 C Total 38 1.38695
Root MSE 0.17291 R-square 0.2670 Dep Mean 0.37623 Adj R-sq 0.1808 C.V. 45.95951
Parameter Estimates
Parameter Standard T for HO: Variable DF Estimate Error Parameter=0 Prob > |T|
INTERCEP 1 -0.307934 0.24143805 -1.275 0.2108 COHESION 1 0.106316 0.21624953 0.492 0.6261 ORGCOM 1 0.213528 0.18472530 1.156 0.2558 LEADER 1 0.097865 0.04850979 2.017 0.0516 COC 1 -0.224582 0.41415448 -0.542 0.5912
Variance Variable DF Inflation
INTERCEP 1 0.00000000 COHESION 1 2.71639352 ORGCOM 1 2.69447609 LEADER 1 1.01310118 COC 1 1.17431256
141

Model 15 Cohesion x Leadership x Organizational Commitment interaction term with infantry only.
Analysis of Variance
Source
Model Error C Total
DF
6 32 38
Sum of Squares
0.59028 0.79667 1.38695
Mean Square
0.09838 0.02490
F Value
3.952
Prob>F
0.0046
Root MSE Dep Mean C.V.
0.15778 0.37623
41.93804
R-square Adj R-sq
0 0
4256 3179
Parameter Estimates
Variable DF Parameter Estimate
Standard T for HO: Error Parameter=0 Prob > Tj
INTERCEP 1 1.100934 0 ORGCOM 1 -0.146438 0 LEADER 1 -0.157065 0 COC 1 5.899596 4 LOC 1 0.178822 0 CL 1 2.078627 2 COCL 1 -2.154656 1
83509150 1.318 28816842 -0.508 15457753 -1.016 04400576 1.459 38996352 0.459 07132183 1.004 44532667 -1.491
0 0 0 0 0 0 0
1967 6148 3172 1544 6496 3231 1458
Variable DF Variance Inflation
INTERCEP 1 ORGCOM 1 LEADER 1 COC 1 LOC 1 CL 1 COCL 1
0.00000000 7.87496993 12.35438929
134.46741666 4.99009233
101.28509470 345.11059119
142

APPENDIX D
REGRESSION RESULTS FOR
LEADER-GROUP INTERACTIONS MODEL
Model 1 Performance = instrumental leadership + supportive leadership + group drive + group goal acceptance (infantry and armor combined).
Analysis of Variance
Source
Model Error C Total
DF
4 94 98
Sum of Squares
0.25129 3.57965 3.83094
Mean Square F Value
0.06282 0.03808
1.650
Prob>F
0.1683
Root MSE Dep Mean C.V.
0.19514 0.33910
57.54781
R-square Adj R-sq
0.0656 0.0258
Parameter Estimates
Variable DF Parameter Estimate
Standard T for HO: Error Parameter=0 Prob > |T|
INTERCEP 1 0.390470 0 INSTR 1 0.020170 0 SUPP 1 0.137248 0 DRIVE 1 -0.467352 0 GOAL 1 0.135899 0
29349405 1.330 03271185 0.617 10573110 1.298 28450496 -1.643 11328594 1.200
0.1866 0.5390 0.1974 0.1038 0.2333
Variable DF Variance Inflation
INTERCEP 1 INSTR 1 SUPP 1 DRIVE 1 GOAL 1
0.00000000 1.24845118 1.25910427 1.18880849 1.19992161
143

Model 2 Drive = instrumental leadership + supportive leadership (infantry and armor combined).
Analysis of Variance
Source
Model Error C Total
DF
2 96 98
Sum of Squares
0.00141 0.55789 0.55930
Mean Square
0.00070 0.00581
F Value
0.121
Prob>F
0.8860
Root MSE Dep Mean C.V.
0.07623 1.01056 7.54359
R-square Adj R-sq
0 -0
0025 0183
Parameter Estimates
Variable DF Parameter Estimate
Standard T for HO: Error Parameter=0 Prob >
INTERCEP 1 INSTR 1 SUPP 1
0.985880 -0.001251 0.019540
0.05467528 0.01275773 0.04106067
18.032 -0.098 0.476
0.0001 0.9221 0.6352
Variable DF Variance Inflation
INTERCEP 1 INSTR 1 SUPP 1
0.00000000 1.24434852 1.24434852
144

Model 3 Cohesion = instrumental leadership + supportive leadership (infantry and armor combined).
Analysis of Variance
Source DF Sum of
Squares Mean
Square F Value Prob>F
Model Error C Total
2 96 98
0.00524 5.68938 5.69462
0.00262 0.05926
0.044 0.9568
Root MSE Dep Mean C.V.
0.24344 1.52768 15.93547
R-square Adj R-sq
0.0009 -0.0199
Parameter Estimates
Variable DF Parameter Eatimate
Standard T for HO: Error Parameter=0 Prob >
INTERCEP 1 INSTR 1 SUPP 1
1.514850 -0.010968 0.030490
0.17460162 0.04074091 0.13112431
8.676 -0.269 0.233
0.0001 0.7883 0.8166
Variable DF Variance Inflation
INTERCEP 1 INSTR 1 SUPP 1
0.00000000 1.24434852 1.24434852
145
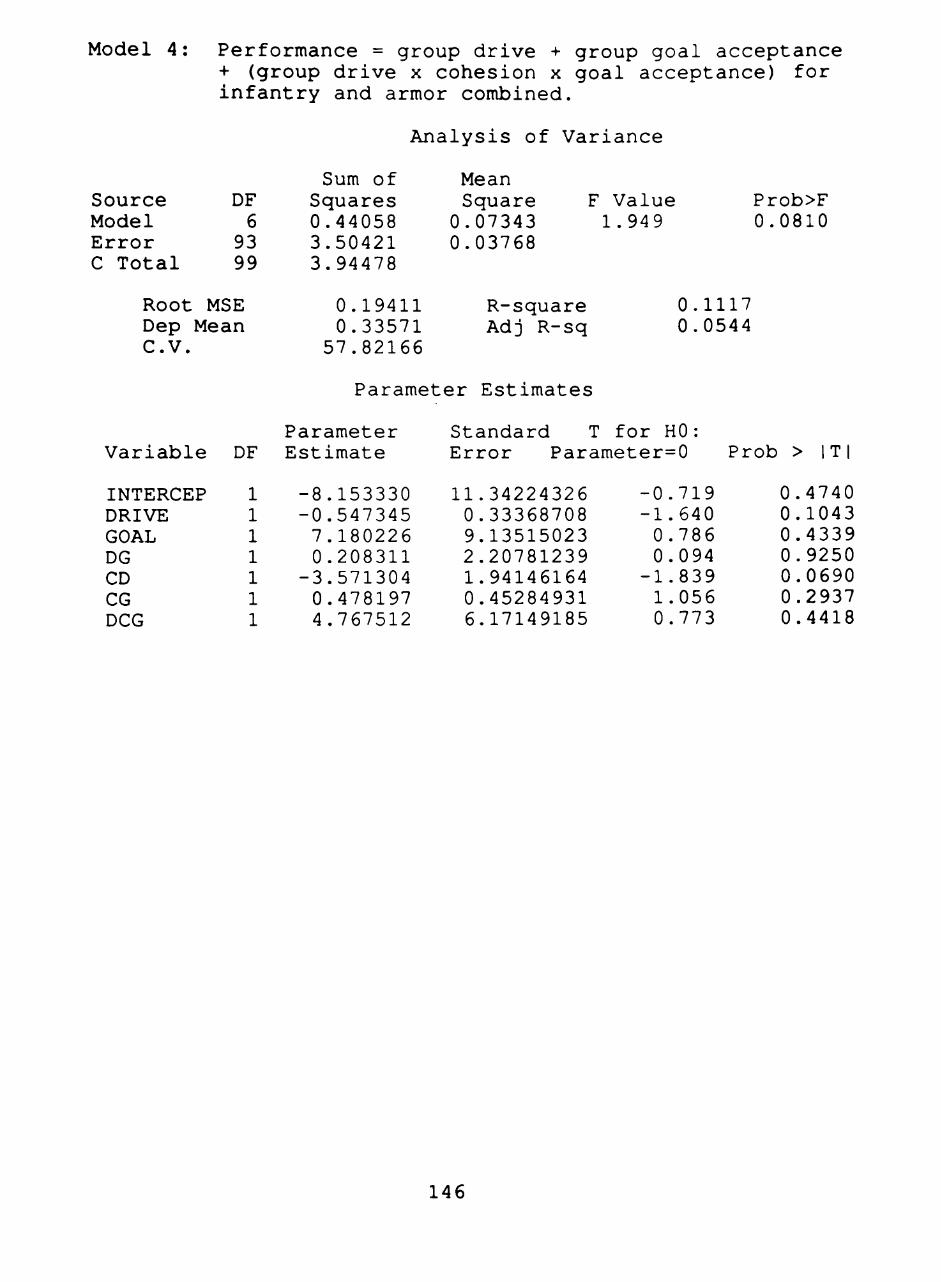
Model 4: Performance = group drive + group goal acceptance + (group drive x cohesion x goal acceptance) for infantry and armor combined.
Analysis of Variance
Source Model Error C Total
Root Dep C.V.
DF 6
93 99
MSE Mean
Sum of Squares 0.44058 3.50421 3.94478
0.19411 0.33571
57.82166
Mean Square F Value Prob>F 0.07343 1.949 0.0810 0.03768
R-square 0.1117 Adj R-sq 0.0544
Parameter Estimates
Variable DF Parameter Estimate
Standard T for HO: Error Parameter=0 Prob > IT I
INTERCEP 1 -8.153330 11 DRIVE 1 -0.547345 0 GOAL 1 7.180226 9 DG 1 0.208311 2 CD 1 -3.571304 1 CG 1 0.478197 0 DCG 1 4.767512 6
34224326 33368708 13515023 20781239 94146164 45284931 17149185
0. 1. 0. 0. 1, 1, 0,
.719
.640
.786
.094
.839
.056
.773
0. 0. 0. 0, 0, 0, 0,
.4740
.1043
.4339
.9250
.0690
.2937
.4418
146

Model 5: Performance = instrumental leadership + supportive leadership + group drive + group goal acceptance with armor only.
Analysis of Variance
Source DF Sum of
Squares Mean
Square F Value Prob>F
Model Error C Total
4 55 59
0.17190 2.18338 2.35527
0.04297 0.03970
1.083 0.3741
Root MSE Dep Mean C.V.
0.19924 0.31496 63.25888
R-square Adj R-sq
0 0
0730 0056
Parameter Estimates
Variable DF Parameter Estimate
Standard T for HO: Error Parameter=0 Prob > IT
INTERCEP 1 0.612384 0 INSTR 1 -0.025323 0 SUPP 1 0.208238 0 DRIVE 1 -0.435468 0 GOAL 1 -0.067375 0
40942788 1.490 04117917 -0.615 12598025 1.653 39009969 -1.116 16276937 -0.414
0.1404 0.5411 0.1040 0.2691 0.6805
Variable DF Variance Inflation
INTERCEP 1 INSTR 1 SUPP 1 DRIVE 1 GOAL 1
0.00000000 1.21964875 1.19470101 1.17792715 1.22144327
147

Model 6 Drive = instrumental leadership -i- supportive leadership with armor only.
Analysis of Variance
Source
Model Error C Total
Root Dep C.V.
DF
2 57 59
MSE Mean
Sum of Squares
0.00358 0.30370 0.30728
0.07299 1.02520 7.11994
Mean Square
0.00179 0.00533
R-square Adj R-sq
F Value
0.336
0.0117 -0.0230
Prob>F
0.7160
Parameter Estimates
Variable DF Parameter Estimate
Standard T for HO Error Parameter=0 Prob > |T|
INTERCEP 1 INSTR 1 SUPP 1
1.010045 -0.010298 0.030260
0.06488831 0.01476402 0.04563701
15.566 -0.698 0.663
0.0001 0.4883 0.5100
Variable DF Variance Inflation
INTERCEP 1 INSTR 1 SUPP 1
0.00000000 1.16811718 1.16811718
148

Model 7: Cohesion = instrumental leadership + supportive leadership with armor only.
Analysis of Variance
Source
Model Error C Total
Root Dep C.V.
DF
2 57 59
MSE Mean
Sum of Squares
0.03821 3.50277 3.54098
0.24790 1.57999 15.68965
Mean Square
0.01910 0.06145
R-square Adj R-sq
F Value Prob>F
0.311 0.7340
0.0108 -0.0239
Parameter Estimates
Parameter Standard T for HO: Variable DF Estimate Error Parameter=0 Prob > |T|
INTERCEP 1 1.702646 0.22036918 7.726 0.0001 INSTR 1 -0.034046 0.05014052 -0.679 0.4999 SUPP 1 -0.017564 0.15498924 -0.113 0.9102
Variance Variable DF Inflation
INTERCEP 1 0.00000000 INSTR 1 1.16811718 SUPP 1 1.16811718
149

Model 8 Performance = group drive + group goal acceptance + (group drive x cohesion x goal acceptance) with armor only.
Analysis of Variance
Source
Model Error C Total
Root Dep C.V.
MSE Mean
DF
6 54 60
Sum of Squares
0.21875 2.23410 2.45285
0.20340 0.30980 65.65550
Mean Square
0.03646 0.04137
R-square Adj R-sq
F Value
0.881
0.0892 -0.0120
Prob>F
0.5150
Parameter Estimates
Variable DF Parameter Estimate
Standard T for HO: Error Parameter=0 Prob > IT
INTERCEP 1 DRIVE 1 GOAL 1 DG 1 CD 1 CG 1 DCG 1
0.239411 16 -0.278634 0 0.268036 13
-1.078116 3 -2.943137 2 1.366114 0 0.285756 8
42947771 46935592 21654902 00108194 47707594 73880381 93629806
0, 0, 0, 0, 1, 1, 0,
.015
.594
.020
.359
.188
.849
.032
0. 0, 0, 0, 0, 0, 0,
.9884
.5552
.9839
.7208
.2400
.0699
.9746
150

Model 9 Performance = instrumental leadership + supportive leadership + group drive + group goal acceptance with infantry only.
Analysis of Variance
Source DF
Model 4 Error 34 C Total 38
Sum of Squares
0.37158 1.01537 1.38695
0 0
Mean Square
09289 02986
F Value
3.111
Prob>F
0.0277
Root MSE Dep Mean C.V.
0.17281 0.37623
45.93225
R-square Adj R-sq
0 0 2679 1818
Parameter Estimates
Variable DF Parameter Estimate
Standard T for HO: Error Parameter=0 Prob > ITI
INTERCEP 1 -0.145261 0 INSTR 1 0.049341 0 SUPP 1 0.130887 0 DRIVE 1 -0.293249 0 GOAL 1 0.42364 3 0
45391368 -0.320 05668342 0.870 19955447 0.656 39336372 -0.745 15527086 2.728
0 0 0 0 0
7509 3901 5163 4611 0100
Variable DF Variance Inflation
INTERCEP 1 0 INSTR 1 1 SUPP 1 1 DRIVE 1 1 GOAL 1 1
00000000 70803366 62053304 13665081 15911922
151
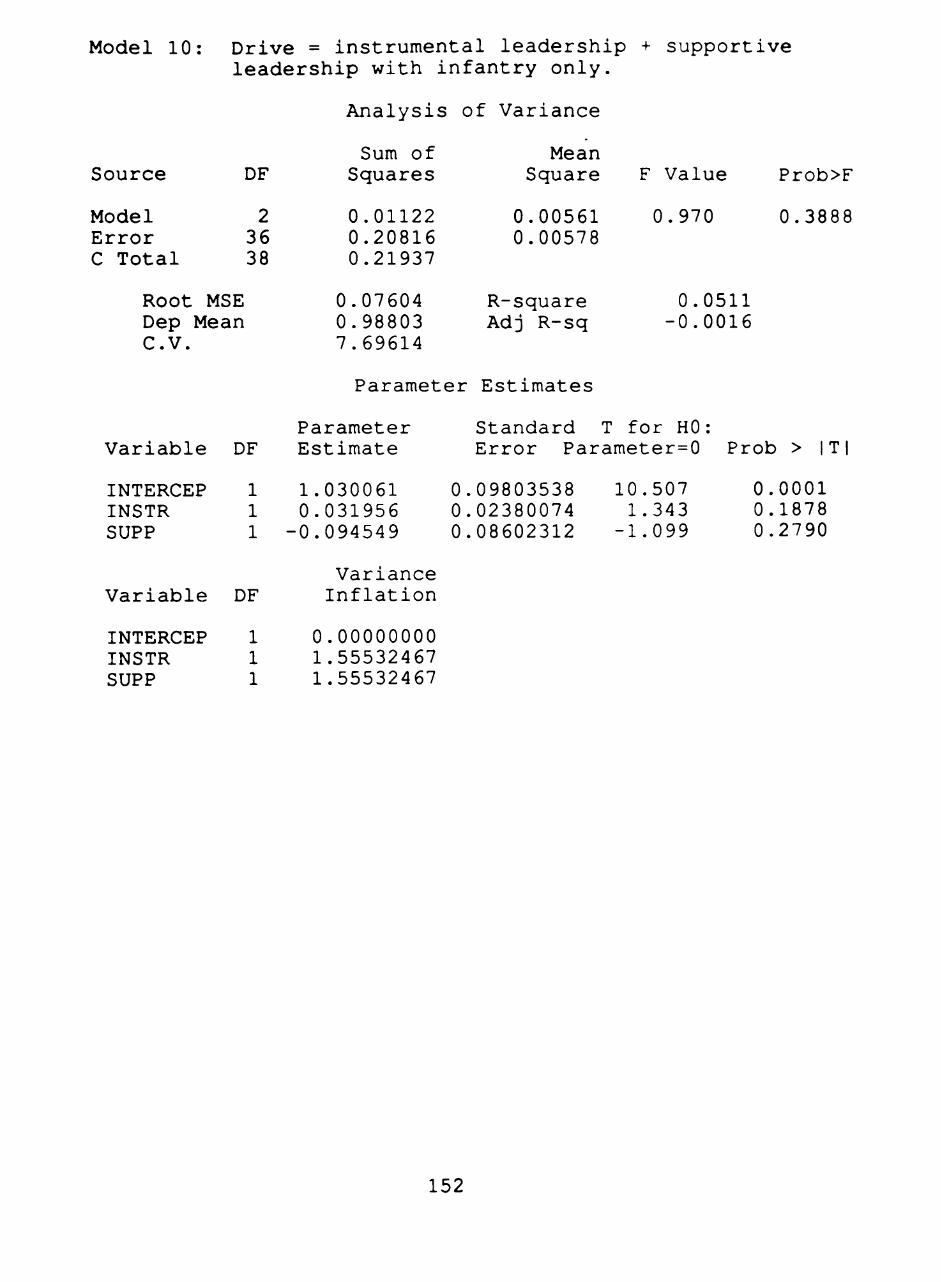
Model 10 Drive = instrumental leadership + supportive leadership with infantry only.
Analysis of Variance
Source DF Sum of
Squares Mean
Square F Value Prob>F
Model Error C Total
2 36 38
0.01122 0.20816 0.21937
0.00561 0.00578
0.970 0.3888
Root MSE Dep Mean C.V.
0.07604 0.98803 7.69614
R-square Adj R-sq
0 -0
0511 0016
Parameter Estimates
Variable DF Parameter Eatimate
Standard T for HO Error Parameter=0 Prob > ITI
INTERCEP 1 INSTR 1 SUPP 1
1.030061 0.031956 0.094549
0.09803538 0.02380074 0.08602312
10.507 1.343
-1.099
0.0001 0.1878 0.2790
Variable DF Variance Inflation
INTERCEP 1 INSTR 1 SUPP 1
0.00000000 1.55532467 1.55532467
152

Model 11: Coheaion = inatrumental leaderahip + supportive leadership with infantry only.
Analysis of Variance
Sum of Mean Source DF Squares Square F Value Prob>F
Model 2 0.04419 0.02210 0.470 0.6288 Error 36 1.69258 0.04702 C Total 38 1.73677
Root MSE 0.21683 R-square 0.0254 Dep Mean 1.44719 Adj R-sq -0.0287 C.V. 14.98295
Parameter Estimates
Parameter Standard T for HO: Variable DF Estimate Error Parameter=0 Prob > IT I
INTERCEP INSTR SUPP
Variable
INTERCEP INSTR SUPP
1 1 1
DF
1 1 1
1.405372 0.064454
-0.100843
Variance Inflation
0.00000000 1.55532467 1.55532467
0, 0, 0,
.27955131
.06786865
.24529793
5.027 0.950
-0.411
0.0001 0.3486 0.6834
153

Model 12 Performance = group drive + group goal acceptance + (group drive x cohesion x goal acceptance) with infantry only.
Analysis of Variance
Source
Model Error C Total
Root Dep C.V.
MSE Mean
DF
6 32 38
Sum of Squares
0.63663 0.75031 1.38695
0.15313 0.37623
40.69972
Mean Square
0.10611 0.02345
R-square Adj R-sq
F Value
4.525
0.4590 0.3576
Prob>F
0.0020
Parameter Estimates
Variable DF Parameter Estimate
Standard T for HO: Error Parameter=0 Prob > IT
INTERCEP 1 -15.325778 13 DRIVE 1 -0.519642 0 GOAL 1 12.913594 11 DG 1 3.641123 3 CD 1 -7.941529 2 CG 1 0.010867 0 DCG 1 8.480422 7
90928920 44067525 22110630 18153450 97521242 57468800 59687081
•1 1 1 1 2 0 1
102 179 151 144 669 019 116
0 0 0 0 0 0 0
2788 2470 2583 2609 0118 9850 2726
154

APPENDIX E
Model 1
Source
Model Error C Total
REVISED MODEL REGRESSION RESULTS
Performance = leadership + group goal acceptance.
Analysis of Variance
DF
2 36 38
Root MSE Dep Mean C.V.
Sum of Squares
0.37191 1.01504 1.38695
0.16792 0.37623
44.63092
Mean Square F Value
0.18595 0.02820
R-square Adj R-sq
6.595
0.2681 0.2275
Prob>F
0.0036
Parameter Estimates
Variable DF
INTERCEP 1 LEADER 1 GOAL 1
Parameter Estimate
-0.331550 0.091475 0.414522
Standard T for HO Error Parameter=0
0.19684082 0.04686935 0.14033614
-1.684 1.952 2.954
Prob > IT
0.1008 0.0588 0.0055
Stepwise Regression
Step
1 2
Var Number Entered In
GOAL LEADER
1 2
Partial R**2
0.1907 0.0774
Model R**2
0.1907 0.2681
C(p)
3.831 2.115
8.7191 3.8091
Prob>F
0.0054 0.0588
155