Ex post Evaluation of Cohesion Policy Programmes 2000 ...
625
ADE s.a. Rue de Clairvaux, 40 B-1348 Louvain-la-Neuve Belgium Tel.: +32 10 45 45 10 Fax: +32 10 45 40 99 E-mail: [email protected] Web: www.ade.be Ex post Evaluation of Cohesion Policy Programmes 2000-2006 co- Financed by the European Fund for Regional Development (Objectives 1 and 2) – Work Package 5b: Environment and Climate Change Final Report – Volume 2 October 2009
-
Upload
khangminh22 -
Category
Documents
-
view
0 -
download
0
Transcript of Ex post Evaluation of Cohesion Policy Programmes 2000 ...

ADE s.a. Rue de Clairvaux, 40
B-1348 Louvain-la-Neuve Belgium
Tel.: +32 10 45 45 10 Fax: +32 10 45 40 99 E-mail: [email protected]
Web: www.ade.be
Ex post Evaluation of Cohesion Policy Programmes 2000-2006 co-Financed by the European Fund for Regional Development (Objectives 1 and 2) – Work Package 5b: Environment and Climate Change
FFiinnaall RReeppoorrtt –– VVoolluummee 22
October 2009


TThhiiss rreeppoorrtt hhaass bbeeeenn pprreeppaarreedd bbyy AADDEE aatt tthhee rreeqquueesstt ooff tthhee EEuurrooppeeaann CCoommmmiissssiioonn..
TThhee vviieewwss eexxpprreesssseedd aarree tthhoossee ooff tthhee CCoonnssuullttaanntt aanndd ddoo nnoott rreepprreesseenntt tthhee ooffffiicciiaall vviieewwss ooff tthhee EEuurrooppeeaann CCoommmmiissssiioonn..
RReepprroodduuccttiioonn oorr ttrraannssllaattiioonn iiss ppeerrmmiitttteedd,, pprroovviiddeedd tthhaatt tthhee ssoouurrccee iiss dduullyy aacckknnoowwlleeddggeedd aanndd nnoo mmooddiiffiiccaattiioonnss ttoo tthhee tteexxtt aarree mmaaddee..


EX-POST EVALUATION OF COHESION POLICY PROGRAMMES 2000-2006 CO-FINANCED BY THE EUROPEAN FUND FOR REGIONAL DEVELOPMENT (OBJECTIVES 1 AND 2) - WORK PACKAGE 5B: ENVIRONMENT AND CLIMATE CHANGE ADE
Final Report – Volume 2 – October 2009 Table of contents
Table of Contents
CHAPTER 1 : REGIONAL CASE STUDY
1.1 REGIONAL CASE STUDY OUTLINE
1.2 FINLAND - SOUTH FINLAND
1.3 FRANCE - MIDI-PYRÉNÉES
1.4 GREECE - CENTRAL MACEDONIA
1.5 ITALY - LAZIO
1.6 LATVIA
1.7 POLAND - PODKARPACKIE
1.8 PORTUGAL - NORTE REGION
1.9 SLOVAKIA - EASTERN SLOVAKIA
1.10 SPAIN - VALENCIA REGION
1.11 UNITED KINGDOM - WEST WALES AND THE VALLEYS CHAPTER 2 : WASTE PREVENTION AND MANAGEMENT OF WASTE CASE STUDIES
2.1 GERMANY - BRANDENBURG
2.2 HUNGARY
2.3 SPAIN - CATALONIA CHAPTER 3 : CLIMATE CHANGE CASE STUDY
3.1 CZECH REPUBLIC
3.2 GERMANY - SACHSEN-ANHALT
3.3 PORTUGAL - THE AUTONOMOUS REGION OF THE AZORES
ANNEX 1: METHODOLOGY FOR THE WASTE PREVENTION AND MANAGEMENT OF WASTE
CASE STUDIES
ANNEX 2: EVALUATION GRID FOR CLIMATE CHANGE CASE STUDIES


EX-POST EVALUATION OF COHESION POLICY PROGRAMMES 2000-2006 CO-FINANCED BY THE EUROPEAN FUND FOR REGIONAL DEVELOPMENT (OBJECTIVES 1 AND 2) - WORK PACKAGE 5B: ENVIRONMENT AND CLIMATE CHANGE ADE
Final Report – Volume 2 – October 2009 Introduction / Page 1
Introduction
This report is the volume 2 of the final report which concerns the Ex-post evaluation of cohesion policy programmes 2000-2006 co-financed by the European Fund for Regional Development (Objectives 1 and 2) – Work Packages 5B: Environment and Climate change. Volume 2 presents the various case studies conducted in the frame of this evaluation. This includes 10 regional case studies (chapter 1), three waste prevention and management of waste case studies (chapter 2) and the three climate change case studies (chapter 3). The final selection proposed for the case studies is summarized in the table below. One of the criteria has been that each of the 14 selected Member States has to be covered by at least one case study (effectiveness of major sectoral programmes1 or regional case studies or waste prevention and management of waste or climate change). The other criteria and the objective of the case studies are described in the next sections.
Selection of Member States for the case studies
Source: ADE, 2008.
1 The six case studies on the effectiveness of major sectoral programmes are presented in the first volume of the final report –
Annex 5.
Member States Effectiveness of major sectoral
programmes (6)
Regional case studies (10)
Waste prevention and management of
waste (3)
Climate change (3)
Spain Communidad De Valenciana Catalonia Region
Italy Lazio Germany Brandenburg Sachsen-Anhalt
Greece X Central
Macedonia Portugal X Norte Açores France Midi Pyrénées Poland Podkarpackie Ireland X
United Kingdom West Wales &
the Valleys Czech Republic X Czech Republic Slovakia X Eastern Slovakia Hungary X Hungary Latvia Latvia
Finland South Finland

EX-POST EVALUATION OF COHESION POLICY PROGRAMMES 2000-2006 CO-FINANCED BY THE EUROPEAN FUND FOR REGIONAL DEVELOPMENT (OBJECTIVES 1 AND 2) - WORK PACKAGE 5B: ENVIRONMENT AND CLIMATE CHANGE ADE
Final Report – Volume 2 – October 2009 Introduction / Page 2
Regional case studies
Objective
The aim of the regional case studies was to provide a comprehensive analysis of how environmental expenditures were integrated in the OPs (both sectoral and regional) and in national and regional strategies, and of the results they have achieved (or are expected to achieve) in terms of environmental progress as well as of economic and social development. The field visits in the ten selected regions provided a large part of the data and analysis needed to make the assessment and in particular provided the opportunity of arriving at an integrated picture of the various interactions. The regional case studies aimed particularly at analysing
The main characteristics of the region in the environmental fields as well as its socio/economic situation (Objective 1 or 2 region; main engine of growth and competitiveness position) at the beginning of the 2000-2006 period and the evolution.
the rationale and quality of EU support: how have environmental measures supported by the ERDF contributed to the regional public investments strategy ? How is it integrated in a sectoral/regional strategy and articulated to other sources of funds ?
The main results achieved in terms of the environmental situation. The main effects on the economic/social situation by distinguishing if possible
direct/indirect effects as well as short/long term effects.
The regional case study outline used to carry out the case study is presented in chapter 1.
Selection of the case studies The case studies had to allow comparisons of how regions with different characteristics tackled environmental issues by using ERDF during the 2000-2006 programming period, that is to say more developed vis-à-vis less developed regions with a convergence approach (development of the less favoured regions – Objective 1 or a conversion approach, compared with Objective 2 for regions with higher concentrations of industrialised activity; or which face higher risks of climate change or other environmental problems).
The selection was made according to the following criteria:
the level of GDP per head which permitted analysis of the link between the level of development and the impact of environmental investments on economic activity. Four groups was identified based on an index EU27=100 : (1) <=75; (2) >75, <=100; (3) >100, <=125; (4) >125. Each group is covered in the selection;
the type of programme (Objective1/Objective2), to ensure both are represented equally;
the economic structure of the regions and the importance of the industrial sector: the share of agriculture, industry and services in employment has been taken into consideration;
the importance of environmental investment as a whole and in the ERDF programmes in particular.

EX-POST EVALUATION OF COHESION POLICY PROGRAMMES 2000-2006 CO-FINANCED BY THE EUROPEAN FUND FOR REGIONAL DEVELOPMENT (OBJECTIVES 1 AND 2) - WORK PACKAGE 5B: ENVIRONMENT AND CLIMATE CHANGE ADE
Final Report – Volume 2 – October 2009 Introduction / Page 3
The level of environmental expenditures varies greatly from one country to another. The case studies must cover all types of country or region but even so should focus on countries and regions where environmental investments are significant (see table below) or at least where a large share of ERDF is targeted on environmental measures. Table below gives an overview of the importance of environmental expenditures in ERDF programmes including environmental components (mainly Objectives 1 and 2). Within these countries the team proposed a selection of regions where the share of ERDF environmental expenditures in the ERDF budget is among the highest. The team has also checked that a significant part of these expenditures was devoted to environmental infrastructures (FOI code: 34, 341 to 345).
Environmental investment by the public sector and the industry % of GDP)
Public sector Industry 2000 2004 2000 2004
EU (25 countries) 0.14 0.15 0.09 Czech Republic 0.49 0.36 0.40 0.29 Germany 0.15 : : : Ireland : : : : Greece : : : : Spain 0.10 0.10 0.14 0.11 France 0.08 0.09 : 0.06 Italy 0.14 0.15 : 0.06 Latvia 0.00 0.02 : 0.11 Hungary : 0.36 0.40 0.21 Poland 0.41 0.31 0.39 0.22 Portugal 0.24 0.15 0.20 0.18 Slovakia 0.10 0.04 0.30 0.44 Finland 0.09 0.07 0.17 0.10 United Kingdom 0.02 0.08 0.15 0.05
Source: Eurostat, 2008.

EX-POST EVALUATION OF COHESION POLICY PROGRAMMES 2000-2006 CO-FINANCED BY THE EUROPEAN FUND FOR REGIONAL DEVELOPMENT (OBJECTIVES 1 AND 2) - WORK PACKAGE 5B: ENVIRONMENT AND CLIMATE CHANGE ADE
Final Report – Volume 2 – October 2009 Introduction / Page 4
Importance of environmental expenditures in programmes funded by ERDF including an environment component2
Country ERDF amounts
(in m€) National funds
(in m€)
Total environment
(in m€)
% in ERDF programmes
% Nat. Funds
%total
GR 2657.4 939.6 3597.0 31.5% 26.7% 30.1%HU 196.1 69.3 265.4 31.0% 30.1% 30.8%SP 6935.5 3723.5 10659.0 28.9% 21.3% 25.7%IT 4137.3 4799.6 8936.9 27.9% 22.6% 24.8%CZ 267.7 115.0 382.7 27.9% 30.0% 28.5%PT 2777.2 1321.7 4098.8 25.9% 16.9% 22.1%DE 3418.7 2306.5 5725.2 24.8% 17.1% 21.0%FR 2004.2 3188.4 5192.5 24.6% 22.6% 23.4%PL 929.7 309.9 1239.6 24.6% 19.6% 23.1%FI 119.2 177.9 297.1 20.7% 14.1% 16.1%UK 1412.0 1414.6 2826.7 20.3% 15.2% 17.4%SK 119.0 60.2 179.2 19.5% 22.4% 20.4% IE 238.0 167.3 405.4 13.8% 10.8% 12.4%LV 49.3 17.0 66.2 12.9% 7.7% 11.0%
Source: Financial data, WP 1. ADE calculations. A final criterion for selection must be coherence with other case studies within this evaluation as well as field visits scheduled in the other Work Packages.
Based on the foregoing, it was proposed that regional case studies be organised in the following countries: Greece, Spain, France, Germany, Portugal, Poland, Slovakia, Finland, Latvia, and UK, Hungary and the Czech Republic, which all have quite interesting profiles.
Table below presents the selection of regions and programmes within these countries. This set of regions covers seven Objective 1 programmes, three Objective 2 programmes3, five regions with a GDP per head below 75 (index EU27=100), two between 75 and 100, two between 100 and 125 and one over 125. The different economic structures are also covered (four have more than 10% of employment in the agriculture, four more than 30% in industry, and three have more than 70% in services).
2 Not all programmes are covered but nearly all objectives 1and 2 programmes are in.
3 Or 6 Objective 1 and 4 Objective 2 if an Objective 2 region is choosen in the United Kingdom

EX-POST EVALUATION OF COHESION POLICY PROGRAMMES 2000-2006 CO-FINANCED BY THE EUROPEAN FUND FOR REGIONAL DEVELOPMENT (OBJECTIVES 1 AND 2) - WORK PACKAGE 5B: ENVIRONMENT AND CLIMATE CHANGE ADE
Final Report – Volume 2 – October 2009 Introduction / Page 5
Regional case studies
Member State
Region or thematic
programme Obj.
Level of GDP/capit
a
Population density
Share (%) of employment
% of environment in
ERDF4
Agri. Industry Services TOT env.
FOI 345
Regional case studiesGreece Central
Macedonia O1 68.2 101.2 12.6 24.9 62.5 20.3% 6.7%
France Midi-Pyrénées
O2 100.2 59.9 6.4 22.6 71.1 n.a n.a
Spain Comunidad de Valenciana
O1
93.9 191.7 3.8 34.3 61.9 35.2% 26.1%
Portugal Norte O1 58.8 174.8 12.8 39.6 47.5 32.8% 13.2%UK West Wales
& the valleys O1 80.3 142.8 2.6 23.0 74.4 19.8% 4.0%
Italy Lazio O2 131.8 310 1.5 18.7 79.8 n.a n.aFinland South
Finland O2 102 22.8 6.2 30.5 63.3 24.5% 6.6%
Latvia O1 45.5 37.1 11.8 26.5 61.7 12.9% 7.7% Slovakia Eastern
Slovakia O1 42.3 99.5 4.6 40.1 55.3 23.1% 21.7%
Poland Podkarpackie O1 35.4 117.5 25.6 28.3 46.0 n.a n.aSource: ADE, 2008.
The pilot study was carried out in Portugal where environmental infrastructures amounted for 13.2% of the whole O1 programme (ERDF budget for environmental infrastructures reached 286 m€).
Case studies on waste prevention and management of waste
Objective
The three case studies aimed to explore the impact of ERDF interventions in the field of waste prevention and management of waste and to highlight their main success and failure factors. The methodology differentiates between waste prevention and waste management is given in annex 1.
4 Based on all programmes containing an environmental dimension.
5 FOI 34: environmental infrastructures

EX-POST EVALUATION OF COHESION POLICY PROGRAMMES 2000-2006 CO-FINANCED BY THE EUROPEAN FUND FOR REGIONAL DEVELOPMENT (OBJECTIVES 1 AND 2) - WORK PACKAGE 5B: ENVIRONMENT AND CLIMATE CHANGE ADE
Final Report – Volume 2 – October 2009 Introduction / Page 6
Selection of the case studies
The three case studies were selected with the aim of representing a variety of situations in respect of ERDF interventions in the fields of waste prevention and waste management, mainly for municipal solid waste. The ToR request a Spanish case study but leave to the contractor the choice of the other two countries and of the individual case studies at national or regional levels. In order to select the case studies, the following criteria have been applied:
Regional versus national considerations, that is, depending on the principal level at which waste management policy (in the specific fields of the identified ERDF interventions) is defined and implemented. This was to allow detailed evaluation of the impact of ERDF interventions on waste management performance and on the environmental situation at the appropriate authority level. For example, in Spain the “Autonomic Communities” are in charge of implementation of waste management policies.
Variety of ERDF interventions, this criterion taking account of the range of interventions, that is the waste flows concerned (municipal, industrial, construction and demolition (C&D)), and the types of intervention (support for prevention, collection systems, sorting and recycling infrastructure, composting plants, incineration plants, landfill closure and rehabilitation, construction of controlled landfills, etc.).
Variety of contexts, as the selection of the three case studies was aimed at providing a review of different contexts. This takes into account the geographical diversity, the diverse status of waste management at the beginning of the programming period, and the individual national waste management contexts.
Importance and influence of ERDF funds, this criterion aiming to reflect, first, their magnitude (total extent of ERDF intervention in the waste management field in the selected area) and, second, the proportion of the total investment in waste management in the selected region.
This leads the team to have proposed selection of the following case studies, with the main reasons:
1) Catalonia Region (Spain): regional context, varied range of ERDF interventions, advanced waste management policy context, focus on municipal waste;
2) Hungary: national level, limited number of ERDF interventions (two) but very specific waste flows (animal waste and C&D waste), new Member State situation with less advanced waste management policy “acquis”;
3) Brandenburg (Germany): regional level, varied ERDF interventions, high level of ERDF investments, focus on waste prevention, recycling and disposal.

EX-POST EVALUATION OF COHESION POLICY PROGRAMMES 2000-2006 CO-FINANCED BY THE EUROPEAN FUND FOR REGIONAL DEVELOPMENT (OBJECTIVES 1 AND 2) - WORK PACKAGE 5B: ENVIRONMENT AND CLIMATE CHANGE ADE
Final Report – Volume 2 – October 2009 Introduction / Page 7
The pilot case study was carried out in Catalonia (Spain).
Climate change
Objective
These case studies had two functions:
1. Identifying and describing measures or operations that were aimed to combat climate change or affected GHG decrease.
2. Provide experience for future interventions with similar objectives.
Regarding provision of experience for future interventions with similar objectives, the case study related as far as possible to:
experience concerning the management of such interventions; methods to assess the contribution of ERDF interventions to reducing GHG emissions; evolution to the 2007-2013 programming period: the question of expanding the measures
implemented during the 2000-2006 programming period. Evaluation grid used to carry out the case study is given in annex 2.
Selection of the case studies
Climate change was not on the political agenda when the Cohesion Policy programmes 2000-2006 were negotiated and adopted. Therefore Task 5 was exploratory. Three case studies was carried out.
Selected operational programmes for the implementaion of the climate change case studies
MS/ Region Programme
Name Main characteristics Czech Republic Industry and
Enterprise operational programme (IEOP)
Implementation at national level Investments in renewable energies Investments to improve energy efficiency
Germany/ Sachsen-Anhalt
Sachsen-Anhalt operational programme
Implementation at regional level Investments to improve energy efficiency
Portugal/ Região Autónoma dos Açores
Região Autónoma dos Açores operational programme
Implementation at regional level Investments in renewable energies
Source: ADE 2008.
The pilot case study was carried out in the Czech Republic.


Chapter 1 : Regional case study reports


ADE s.a. Rue de Clairvaux, 40
B-1348 Louvain-la-Neuve Belgium
Tel.: +32 10 45 45 10 Fax: +32 10 45 40 99 E-mail: [email protected]
Web: www.ade.be
Ex post evaluation of cohesion policy programmes 2000-2006 co-financed by the European Fund for Regional Development (Objectives 1 and 2) – Work package 5b: Environment and Climate Change
RReeggiioonnaall CCaassee ssttuuddyy oouuttlliinnee
October 2009


TThhiiss rreeppoorrtt hhaass bbeeeenn pprreeppaarreedd bbyy AADDEE aatt tthhee rreeqquueesstt ooff tthhee EEuurrooppeeaann CCoommmmiissssiioonn..
TThhee vviieewwss eexxpprreesssseedd aarree tthhoossee ooff tthhee CCoonnssuullttaanntt aanndd ddoo nnoott rreepprreesseenntt tthhee ooffffiicciiaall vviieewwss ooff tthhee EEuurrooppeeaann CCoommmmiissssiioonn..
RReepprroodduuccttiioonn oorr ttrraannssllaattiioonn iiss ppeerrmmiitttteedd,, pprroovviiddeedd tthhaatt tthhee ssoouurrccee iiss dduullyy aacckknnoowwlleeddggeedd aanndd nnoo mmooddiiffiiccaattiioonnss ttoo tthhee tteexxtt aarree mmaaddee..


EX POST EVALUATION OF COHESION POLICY PROGRAMMES 2000-2006 CO-FINANCED BY THE EUROPEAN FUND FOR REGIONAL DEVELOPMENT (OBJECTIVES 1 AND 2) - WORK PACKAGE 5B: ENVIRONMENT AND CLIMATE CHANGE ADE
Regional Case study outline – October 2009 Table of Contents
Table of Contents
ACRONYMS
1. STATUS AND FEATURES OF THE REGION .............................................................. 1
1.1 ECONOMIC SITUATION (IN 2000) .................................................................................... 1 1.2 ENVIRONMENTAL SITUATION (IN 2000) ........................................................................ 1 1.3 INSTITUTIONAL SET UP AND POLICY MAKING PROCESS ............................................... 3
1.3.1 Regional development .............................................................................................. 3 1.3.2 Environmental sector ............................................................................................... 3
2. REGIONAL POLICIES AND THE ROLE OF ERDF .................................................. 5
2.1 ECONOMIC POLICIES ......................................................................................................... 5 2.2 ENVIRONMENTAL POLICIES ............................................................................................. 5
2.2.1 Description of the policies implemented .............................................................. 5 2.2.2 Interactions with EU policies .................................................................................. 5
2.3 ACTIONS TAKEN ................................................................................................................ 6 2.3.1 Environmental expenditures and main sources of funds ................................... 6
2.4 PLANNING PROCESS AND COORDINATION BETWEEN ALL STAKEHOLDERS ............. 8
3. TRENDS OVER THE PROGRAMMING PERIOD ........................................................ 9
3.1 ECONOMIC SITUATION (2000-2006, AND OVER) ........................................................... 9 3.2 ENVIRONMENTAL SITUATION (2000-2006 AND OVER) ................................................ 9
4. ANALYSIS OF THE ERDF CONTRIBUTION .......................................................... 11
4.1 RELEVANCE OF THE 2000-2006 ERDF STRATEGY IN THE ENVIRONMENTAL
SECTOR FOR ENHANCING TERRITORIAL DEVELOPMENT ........................................... 11 4.2 QUALITY OF THE PLANNING AND IMPLEMENTATION PROCESS TO MEET
REGIONAL CHALLENGES IN THE COVERED FIELDS .................................................... 11 4.3 CONTRIBUTION OF ERDF TO IMPROVE THE ENVIRONMENTAL SITUATION ......... 11 4.4 CONTRIBUTION OF ERDF TO REGIONAL ECONOMIC DEVELOPMENT ................... 11 4.5 CONTRIBUTION OF ERDF TO IMPROVE THE QUALITY OF LIFE ............................... 11
LIST OF TABLES
TABLE 1: SOCIO-ECONOMIC DATA ............................................................................................. 1 TABLE 2: ENVIRONMENTAL DATA .............................................................................................. 2 TABLE 3: ESTIMATE OF ENVIRONMENTAL EXPENDITURES DURING THE 2000-2006
PERIOD ........................................................................................................................... 6 TABLE 4: ENVIRONMENTAL MEASURES – APPROVED EXPENDITURES 2000-2008 .............. 7 TABLE 5: MAIN OUTPUT AND RESULT INDICATORS ................................................................. 8 TABLE 6: REGIONAL DATA – BUSINESS STATISTICS ................................................................ 11


EX POST EVALUATION OF COHESION POLICY PROGRAMMES 2000-2006 CO-FINANCED BY THE EUROPEAN FUND FOR REGIONAL DEVELOPMENT (OBJECTIVES 1 AND 2) - WORK PACKAGE 5B: ENVIRONMENT AND CLIMATE CHANGE ADE
Regional Case study outline – October 2009 Acronyms
Acronyms


EX POST EVALUATION OF COHESION POLICY PROGRAMMES 2000-2006 CO-FINANCED BY THE EUROPEAN FUND FOR REGIONAL DEVELOPMENT (OBJECTIVES 1 AND 2) - WORK PACKAGE 5B: ENVIRONMENT AND CLIMATE CHANGE ADE
Regional Case study outline – October 2009 Page 1
1. Status and features of the region
1.1 Economic situation (in 2000)
What are the economic issues and challenges at the beginning of the programming period, i.e. in 2000? What is the position of the regional economy (GDP/employment etc) compared to other EU regions ?
Did the region face competitiveness problem in 2000 ? What are the challenges in this field at the beginning of the programming period ?
Did the private sector suffer in 2000 from inadequate wastewater treatment or solid waste collection ? Did the private sector face high cost for cleaning water/soil/air in the region ?
Table 1: Socio-economic data Region characteristics 2000 2006GDP/capitaPopulation densityEconomic structure (share of employement) Agriculture Industry ServicesUrban/rural
Economic performance 2000 2001 2002 2003 2004 2005 2006GDP/capitaEmployement rate (of the group 15-64)GDP Annual growth rate in primary sector in secondary sector in tertiary sectorInvestment in % GDPR&D in % GDPMigration flowsLabour producitivity (GDPper employed in PPS)
1.2 Environmental situation (in 2000)
Water supply and wastewater treatment
Did the region face some challenges in terms of safe water supply ? What was the position of the region in 2000 compared to EU requirements in the
framework of the Directive 91/271/EEC Urban wastewater treatment ? What were the challenges in terms of wastewater collection and treatment ?

EX POST EVALUATION OF COHESION POLICY PROGRAMMES 2000-2006 CO-FINANCED BY THE EUROPEAN FUND FOR REGIONAL DEVELOPMENT (OBJECTIVES 1 AND 2) - WORK PACKAGE 5B: ENVIRONMENT AND CLIMATE CHANGE ADE
Regional Case study outline – October 2009 Page 2
Solid waste
Did solid waste volume increased in the past years (1995-2000) rapidly and for what reasons (growth, population increase,…?) ? What is the position of the region compared to national/EU average ?
What are the challenges in terms of solid waste collection and treatment ? Did any regional prevention plans in terms of solid waste management exist in the region ?
Air
Was air quality a problem in 2000 in the region ? If yes, please provide details Did the air issue lead to health problems in the region ?
Soil
Was soil quality a problem in 2000 in the region ? If yes, please provide details Did the soil issue lead to health problems in the region ?
Climate change and renewable energies
Where regional GHG emissions an issue in 2000? Was energy efficiency low in the regional enterprises/economy ? What is the share of renewable energy used in the regional economy ? Did the region
produce a lot of renewable energies ? What type of renewable energy sources ?
Others
Is the polluter-pays principle applied in the region ? How ?
Table 2: Environmental data Environmental situation 2000 2001 2002 2003 2004 2005 2006Air quality in main urban placesWater pollutionForest (% of land)CoastFish resources % population connected to the public water supply system % population connetcted to the public sewerage systemCollected solid waste / capitaMortality rate for <65 from heart disease and respiratory illness

EX POST EVALUATION OF COHESION POLICY PROGRAMMES 2000-2006 CO-FINANCED BY THE EUROPEAN FUND FOR REGIONAL DEVELOPMENT (OBJECTIVES 1 AND 2) - WORK PACKAGE 5B: ENVIRONMENT AND CLIMATE CHANGE ADE
Regional Case study outline – October 2009 Page 3
1.3 Institutional set up and policy making process
1.3.1 Regional development
Does the region have a clear competence to lead its own economic development ? in which fields ?
Are the main drivers of regional economic development covered by the regional strategy/policies ?
Are regional development strategies differenciated throughout the country according to regional specificities ? and more particularly in the environmental sector ?
1.3.2 Environmental sector
Please describe the institutional set up in terms of environment management ? How are responsibilities shared in the region ? How are competences distributed between the national, the regional and the local authorities to manage environmental issues ?
How is the private sector involved for providing some of the services? Upstream/downstream ?
What are the roles and competences of local authorities in waste collection and treatment, in water supply and water collection and treatment, in climate change issues, in protection of biodiversity and landscape, in urban rehabilitation and territorial planning ?
Is any national company involved (partially/completely) in the whole regional environmental system ?
Is the user-pay-principle applied ? Which body is in charge of collecting revenues ? How are revenues used ?


EX POST EVALUATION OF COHESION POLICY PROGRAMMES 2000-2006 CO-FINANCED BY THE EUROPEAN FUND FOR REGIONAL DEVELOPMENT (OBJECTIVES 1 AND 2) - WORK PACKAGE 5B: ENVIRONMENT AND CLIMATE CHANGE ADE
Regional Case study outline – October 2009 Page 5
2. Regional policies and the role of ERDF
2.1 Economic policies
Is there a regional strategy is clearly elaborated/set up ? If yes what are its objectives and what are the means devoted to this strategy ?
Does the regional strategy address the main socio-economic challenges facing the region ? Does it cover the main competitiveness factors ?
Is the regional OP an instrument to support the regional strategy? What is the role of ERDF?
2.2 Environmental policies
2.2.1 Description of the policies implemented
Have regional environmental policies clear objectives ? Are they well formulated taking into account environmental challenges of the region ? have action plans been elaborated ?
Do environmental measures contribute to the regional economic strategy? Notably by enhancing regional attractiveness/quality of the place ?
Is the objective of in the water sector to reach EU directive requirements ? Is policy in terms of solid waste oriented to a reduction of waste per capita ? Does this
policy intend to improve treatment modalities as required by EU Directive ? Is the policy focus on setting up of new infrastructures/upgrading existing
infrastructures ? Are incentives provided to increase the use of renewable energies and energy efficiency
in the region ? Are other instruments applied to improve the environmental situation? Please provide
details.
2.2.2 Interactions with EU policies
Are the regional policies in line with EU policies ? How do they interact with EU policies ?
What is the srategic role of ERDF in the environmental policies in the region compared to other external sources of funds (cohesion fund, EIB, ISPA) ?

EX POST EVALUATION OF COHESION POLICY PROGRAMMES 2000-2006 CO-FINANCED BY THE EUROPEAN FUND FOR REGIONAL DEVELOPMENT (OBJECTIVES 1 AND 2) - WORK PACKAGE 5B: ENVIRONMENT AND CLIMATE CHANGE ADE
Regional Case study outline – October 2009 Page 6
2.3 Actions taken
2.3.1 Environmental expenditures and main sources of funds
How much resources have been allocated to environmental expenditures in the region during the 2000-2006 period? Please make a difference between capital expenditures (investments) and recurrent outlays.
What has been the contribution of public resources versus private resources, own resources versus external resources, subsidies versus loans ?
What was the strategy behind this way of funding environmental expenditures ? Did the role of each source have been clearly specified/delimited ?
Did the region faced a lack of resources ?
Table 3: Estimate of environmental expenditures during the 2000-2006 period
Norte Region
Environmental
expenditures
Of which
investment
Waste
management
Water supply ‐
waste water
management
General Govt
of which local authorities
ERDF National Counterpart Fund
ERDF OP Norte
ERDF Ambiente
Cohesion Fund
EIB
Private sector
Total
Per capita (annual average)
% Of GDP

EX POST EVALUATION OF COHESION POLICY PROGRAMMES 2000-2006 CO-FINANCED BY THE EUROPEAN FUND FOR REGIONAL DEVELOPMENT (OBJECTIVES 1 AND 2) - WORK PACKAGE 5B: ENVIRONMENT AND CLIMATE CHANGE ADE
Regional Case study outline – October 2009 Page 7
2.3.2 ERDF contribution to environmental expenditures in the region
Table 4: Environmental measures – Approved expenditures 2000-2008 ERDF amounts Expenditures (end 2008?)
FOI code FOI Initial budget Revision in % of budget Planned Disbursed
127Improving and maintaining the ecological stability of
protected woodlands
1312Preservation of the environment inconnection with land,
forestry and landscape conservation as well as with the
improvement of animal welfare
152Environment‐friendly technologies, clean and economical
energy technologies
162Environment‐friendly technologies, clean and economical
energy technologies
33 Energy infrastructures (production, delivery)
332
Renewable sources of energy (solar power, wind power,
hydro‐electricity, biomass)
333 Energy efficiency, cogeneration, energy control
34 Environmental infrastructure (including water)
341 Air
342 Noise
343
Urban and industrial waste (including hospital and
dangerous waste)
344
Drinking water (collection, storage, treatment and
distribution)
345 Sewerage and purification
35 Planning and rehabilitation
351 Upgrading and Rehabilitation of industrial and military sites
352 Rehabilitation of urban areas
353
Protection, improvement and regeneration of the natural
environment
354 Maintenance and restoration of the cultural heritage
Total What is the contribution of ERDF in the field of environment in the region ?
- Detailed amounts spent through the regional OP 2000-2006 (by FOI; allocated/disbursed)
- Are they other ERDF sources used in the region (i.e. national ERDF programme implemented in the region)?
Description of ERDF 2000-2006 OP – including objectives devoted to environmental
challenges in the region – Main outputs and results Main problems for reaching the targeted outputs.

EX POST EVALUATION OF COHESION POLICY PROGRAMMES 2000-2006 CO-FINANCED BY THE EUROPEAN FUND FOR REGIONAL DEVELOPMENT (OBJECTIVES 1 AND 2) - WORK PACKAGE 5B: ENVIRONMENT AND CLIMATE CHANGE ADE
Regional Case study outline – October 2009 Page 8
Table 5: Main output and result indicators
Indicator name
Baseline value (2000)
Target Achieved value
1 Number of projects on water supply
2 Number of projects on wastewater
3 Number of projects on municipal solid waste
4 Number of additional population served by water supply projects
5 % increase of the additional population served by water supply projects (compared to the baseline value)
6 Reduction of leakage from the water supply network
7 Increase in population served by wastewater projects
8 % increase in population served by wastewater projects (compared to the baseline value)
9 New waste treatment capacity created
10 Number of unauthorised landfills closed or rehabilitated
11 % of unauthorised landfills in the total number of the landfills operated in 2000 (for EU10 Member States only)
12 Other specific indicators
2.4 Planning process and coordination between all stakeholders
What is the role of the different stakeholders involved in the management of ERDF programmes (Ministries, management authorities, beneficiaries, etc.)?
What was the institutional set up for the decision process related to ERDF ? How have environmental measures/activities been planned ? What instruments have been used to select the projects (cost/benefits analysis,…) ? How is organized the follow up of the projects ? Did a specific body coordinate all interventions? Did cooperation take place between the various stakeholders? Please provide details.

EX POST EVALUATION OF COHESION POLICY PROGRAMMES 2000-2006 CO-FINANCED BY THE EUROPEAN FUND FOR REGIONAL DEVELOPMENT (OBJECTIVES 1 AND 2) - WORK PACKAGE 5B: ENVIRONMENT AND CLIMATE CHANGE ADE
Regional Case study outline – October 2009 Page 9
3. Trends over the programming period
3.1 Economic situation (2000-2006, and over)
What are the trends in terms of regional socio-economic situation (GDP, employment, R&D, migration flows, labour productivity, etc.) during the 2000-2006 programming period and over?
Please provide 2000-2006 (and over) available values for indicators related to the above-mentioned fields (see table 1).
3.2 Environmental situation (2000-2006 and over)
What are the 2000-2006 (and over) regional trends in terms of environmental situation in the following fields: - Water supply; - Wastewater collection and treatment; - (Municipal) solid waste; - Renewable energies?
Please provide 2000-2006 (and over) available values for indicators related to the above-mentioned fields (see table 2 and more disaggregated data if useful).


EX POST EVALUATION OF COHESION POLICY PROGRAMMES 2000-2006 CO-FINANCED BY THE EUROPEAN FUND FOR REGIONAL DEVELOPMENT (OBJECTIVES 1 AND 2) - WORK PACKAGE 5B: ENVIRONMENT AND CLIMATE CHANGE ADE
Regional Case study outline – October 2009 Page 11
4. Analysis of the ERDF contribution
4.1 Relevance of the 2000-2006 ERDF strategy in the environmental sector for enhancing territorial development
4.2 Quality of the planning and Implementation process to meet regional challenges in the covered fields
4.3 Contribution of ERDF to improve the environmental situation
In terms of waste collection and treatment In terms of water supply and waste water collection and treatment In terms of reducing GHG emission In terms of air and natural resources quality
4.4 Contribution of ERDF to regional economic development
Contribution of ERDF environmental measures to macroeconomic stability Contribution of ERDF environmental measures to the adjustment process (in the short
and in the medium term) Specific sectoral effects
- Activities in the environmental sector - Effects on the building sector - Indirect effects on sectors related to natural resources (rural activities, tourism,…)
Table 6: Regional data – business statistics
Activities linked to environment 2000 2001 2002 2003 2004 2005 2006 Recycling Collection, purification and distribution of water Waste collection and treatment (Eurostat) –( Employment, Number of local units, Gross investment in tangible goods, Growth rate of employment, Investment per person employed)
4.5 Contribution of ERDF to improve the quality of life
This part will be discussed by evaluators. In this perspective, each
stakeholder interviewed is invited to provide her/his opinion about the below-mentioned themes


ADE s.a. Rue de Clairvaux, 40
B-1348 Louvain-la-Neuve Belgium
Tel.: +32 10 45 45 10 Fax: +32 10 45 40 99 E-mail: [email protected]
Web: www.ade.be
Ex post evaluation of cohesion policy programmes 2000-2006 co-financed by the European Fund for Regional Development (Objectives 1 and 2) – Work package 5b: Environment and Climate Change
RReeggiioonnaall ccaassee ssttuuddyy SSoouutthh FFiinnllaanndd
October 2009


TThhiiss rreeppoorrtt hhaass bbeeeenn pprreeppaarreedd bbyy AADDEE aatt tthhee rreeqquueesstt ooff tthhee EEuurrooppeeaann CCoommmmiissssiioonn..
TThhee vviieewwss eexxpprreesssseedd aarree tthhoossee ooff tthhee CCoonnssuullttaanntt aanndd ddoo nnoott rreepprreesseenntt tthhee ooffffiicciiaall vviieewwss ooff tthhee EEuurrooppeeaann CCoommmmiissssiioonn..
RReepprroodduuccttiioonn oorr ttrraannssllaattiioonn iiss ppeerrmmiitttteedd,, pprroovviiddeedd tthhaatt tthhee ssoouurrccee iiss dduullyy aacckknnoowwlleeddggeedd aanndd nnoo mmooddiiffiiccaattiioonnss ttoo tthhee tteexxtt aarree mmaaddee..


EX-POST EVALUATION OF COHESION POLICY PROGRAMMES 2000-2006 CO-FINANCED BY THE EUROPEAN FUND FOR REGIONAL DEVELOPMENT (OBJECTIVES 1 AND 2) - WORK PACKAGE 5B: ENVIRONMENT AND CLIMATE CHANGE ADE
Regional Case Study – South Finland – October 2009 Table of Contents
Table of Contents ACRONYMS
SUMMARY – KEY MESSAGES FROM THE SOUTH FINLAND CASE STUDY
1. STATUS AND FEATURES OF THE REGION .............................................................. 1
1.1 ECONOMIC SITUATION (IN 2000) .................................................................................... 1 1.2 ENVIRONMENTAL SITUATION (IN 2000) ........................................................................ 2 1.3 INSTITUTIONAL SET UP AND POLICY MAKING PROCESS ............................................... 4
1.3.1 Regional development .............................................................................................. 4 1.3.2 Environmental sector ............................................................................................... 4
2. REGIONAL POLICIES AND THE ROLE OF THE ERDF ........................................... 7
2.1 ECONOMIC POLICIES ......................................................................................................... 7 2.2 ENVIRONMENTAL POLICIES ............................................................................................. 7
2.2.1 Main objectives pursued and contribution of the ERDF ................................... 7 2.2.2 Funding strategies ..................................................................................................... 9
2.3 ACTIONS TAKEN ................................................................................................................ 9 2.3.1 Environmental expenditures and main sources of funds ................................... 9 2.3.2 ERDF contribution to environmental expenditures in the region .................. 11
2.4 ERDF DECISION AND PLANNING PROCESS ................................................................. 16
3. ANALYSIS OF THE ERDF CONTRIBUTION .......................................................... 19
3.1 RELEVANCE OF THE 2000-2006 ERDF STRATEGY IN THE ENVIRONMENTAL SECTOR FOR ENHANCING TERRITORIAL DEVELOPMENT ........................................... 19 3.2 QUALITY OF THE PLANNING AND IMPLEMENTATION PROCESS TO MEET REGIONAL CHALLENGES IN THE COVERED FIELDS .................................................... 19 3.3 CONTRIBUTION OF THE ERDF TO IMPROVING THE ENVIRONMENTAL
SITUATION ........................................................................................................................ 20 3.3.1 Environmental situation: trends over the programming period ...................... 20 3.3.2 Contribution of the ERDF .................................................................................... 21
3.4 CONTRIBUTION OF THE ERDF TO REGIONAL ECONOMIC DEVELOPMENT ........... 22 3.4.1 Economic situation: trends over the programming period .............................. 22 3.4.2 Contribution of the ERDF .................................................................................... 22
3.5 CONTRIBUTION OF THE ERDF TO IMPROVING THE QUALITY OF LIFE .................. 23
ANNEX: PROGRAMME OF THE FIELD STUDY IN SOUTH FINLAND (MAY 25TH-29TH 2009) ............................................................................. 25
LIST OF FIGURES
FIGURE 1 : REGIONS OF SOUTH FINLAND ............................................................................... 1 LIST OF TABLES
TABLE 1: SOCIO-ECONOMIC DATA ......................................................................................... 2 TABLE 2: ENVIRONMENTAL DATA ......................................................................................... 3 TABLE 3: ENVIRONMENTAL EXPENDITURES RELATED TO ERDF-SUPPORTED PROJECTS IN THE 4 VISITED REGIONS OF SOUTH FINLAND ............................. 10 TABLE 4: MAIN OUTPUT AND RESULT INDICATORS ........................................................... 11 TABLE 5: SOUTH FINLAND DATA – BUSINESS STATISTICS ................................................. 23


EX POST EVALUATION OF COHESION POLICY PROGRAMMES 2000-2006 CO-FINANCED BY THE EUROPEAN FUND FOR REGIONAL DEVELOPMENT (OBJECTIVES 1 AND 2) - WORK PACKAGE 5B: ENVIRONMENT AND CLIMATE CHANGE ADE
Regional Case Study – South Finland – October 2009 Acronyms
Acronyms
EEDC Employment and Economic Development Centre
GHG Green House Gas
MoE Ministry of Environment
OP Operational Programme
PPP Polluter-pays principle
PPS Purchasing Power Standards
RMC Regional Monitoring Committee
UPP User-pays principle
WTP Wastewater Treatment Plant


EX POST EVALUATION OF COHESION POLICY PROGRAMMES 2000-2006 CO-FINANCED BY THE EUROPEAN FUND FOR REGIONAL DEVELOPMENT (OBJECTIVES 1 AND 2) - WORK PACKAGE 5B: ENVIRONMENT AND CLIMATE CHANGE ADE
Regional Case Study – South Finland – October 2009 Summary
Summary – Key messages from the South Finland case study
South Finland contains objective 2 areas that were characterised by an economy based on low added value industry partly dependent on the Soviet Union. The reconversion process had not been fully achieved by the end of the 1990s. In terms of environmental infrastructure, the necessary investments had already been made, and the levels of collection and treatment were satisfactory at the beginning of the 2000s, complying with EU Directives, except for nitrogen removal. Reaching EU standards is not the main driver of environmental policies. Even though EU Directives are taken into account, national interest and characteristics usually prevail. The main environmental challenges of South Finland were not covered by the regional Operational Programme (OP) because they concern areas which are not Ojective 2. The first issue is the state of the Baltic Sea, polluted by wastewater and farms from Russia and by agricultural nutrients. The second is linked to the urban problems in the Metropolitan Area of Helsinki, namely small-sized particles. This shows the difficulty of dealing with pollution-related issues when using very geographically-targeted funds. ERDF financing for environmental projects was relatively limited, especially in low-populated objective 2 areas, as the funds were allocated between the regions of South Finland on the basis of their population in objective 2 areas. However, these isolated places often faced important environmental challenges that necessitated costly investments. This explains why the impact of the environmental projects remained mainly local. ERDF support has been, in almost all cases, used as seed money, to finance planning, feasibility studies and pilot projects. In many cases, these projects, which involved private money, could not have been started without the ERDF. Even though the environment was not a strategic objective, the ERDF contributed significantly to the reconversion of the region of Lahti as a greentech business centre. This shows the efficiency of EU funds when they are focused and concentrated on the strengths of the region. Given the satisfactory level of connection of the population to water treatment, environmental infrastructure projects generally aimed at solving very specific local problems linked to isolated habitations or farms, which were not connected to the municipal water system and threatened strategic areas such as drinking reservoirs or the archipelago. These projects concerned thus the construction of new infrastructure whereas the ERDF was also implicated in projects aiming at upgrading existing infrastructure, namely to comply with EU Directive regarding nitrogene removal. The majority of the projects concerned territorial upgrade and rehabilitation. They were small and numerous, not obviously included in a regional development strategy and their impact was

EX POST EVALUATION OF COHESION POLICY PROGRAMMES 2000-2006 CO-FINANCED BY THE EUROPEAN FUND FOR REGIONAL DEVELOPMENT (OBJECTIVES 1 AND 2) - WORK PACKAGE 5B: ENVIRONMENT AND CLIMATE CHANGE ADE
Regional Case Study – South Finland – October 2009 Summary
very local and difficult to assess. Many of these projects were related to the restoration and protection of lakes and catchment areas and were designed to comply with the Water Framework Directive (WFD). In some cases, these projects were designed in order to complete other projects such as the development of greentech business centres. The ERDF was used for regional development, which included environmental measures. Environment cannot be considered as a horizontal priority as such in programming documents of the regional OP. The strategy for South Finland was excessively general and could not be used in the project-selection process. However, thanks to the regional strategies, the regional OP has been efficiently planned and coordinated by the regions of South Finland. One of the main impacts of the OP has been the improved cooperation in environmental fields between private and public stakeholders, regarding both financing and knowledge. The ERDF has also allowed for better coordination of the innovation strategy and the increasing of awareness, even though the quality of the link of environmental investment to the remaining parts of the programming documents was poor, which limited the contribution to regional development.

EX POST EVALUATION OF COHESION POLICY PROGRAMMES 2000-2006 CO-FINANCED BY THE EUROPEAN FUND FOR REGIONAL DEVELOPMENT (OBJECTIVES 1 AND 2) - WORK PACKAGE 5B: ENVIRONMENT AND CLIMATE CHANGE ADE
Regional Case Study – South Finland – October 2009 Page 1
1. Status and features of the region
The geographical area of South Finland (NUTS 2) is composed of 7 regions (NUTS 3). South Finland region is not an administrative body as such and has no competence in terms of economic development. The strategy of the area is determined by its regional bodies.
1.1 Economic situation (in 2000)
The main characteristics of the South Finland economy at the beginning of the period were: The GDP per capita amounted to 132% of the average EU level whereas the national
level accounts for 112% of the EU average. However, with an economy based on industry (26% of employment) and services (71%), South Finland suffered from high production and maintenance costs by European measure and its remote location far from the main European market.
South Finland is a transport corridor to Russia. It had faced difficulties due the collapse of the Soviet Union in the early 1990s. Some sub-regional areas such as the region of Lahti were very dependent on the Soviet Union as one third of their products were destined to be exported there. Many of these industries (especially wood, metal, plastic, textile industries, as well as water pipe construction, machinery for paper mills etc) were closed or delocalised. In 2000, the reconversion of the economy was still in progress.
Even though South Finland is not characterised by a high unemployment rate (7.7% compared to 9.8% at national level), workforce demand and supply faced difficulties. In some sub-regions, unemployment was higher: around 12% in Päijät-Häme and Kymenlaakso.
Private companies did not suffer from inadequate or expensive environmental infrastructure in 2000 as the necessary investments had already been made.
Figure 1 : Regions of South Finland

EX POST EVALUATION OF COHESION POLICY PROGRAMMES 2000-2006 CO-FINANCED BY THE EUROPEAN FUND FOR REGIONAL DEVELOPMENT (OBJECTIVES 1 AND 2) - WORK PACKAGE 5B: ENVIRONMENT AND CLIMATE CHANGE ADE
Regional Case Study – South Finland – October 2009 Page 2
Table 1: Socio-economic data
Socio-economic indicators 2000 2001 2002 2003 2004 2005 2006
GDP/capita (at PPS; EU-25=100) 131.9 130.0 129.1 125.0 129.3 127.9 n.a.
Employment rate (of the group 15-64 years old; %) 71.2 72.3 72.1 71.3 70.8 71.7 72.6
Unemployment rate (%) 7.7 7.0 7.1 7.5 7.3 6.9 6.3
GDP annual growth rate (%) 5.4 3.0 1.2 0.8 4.0 3.0 5.1
Economic structure (share of employment; %): Agriculture 3.0 n.a. n.a. n.a. n.a. 2.5 n.a.
Industry 25.9 n.a. n.a. n.a. n.a. 23.9 n.a.
Services 71.1 n.a. n.a. n.a. n.a. 73.6 n.a.
Investment in % GDP 18.5 19.2 17.1 17.9 17.6 n.a. n.a.
R&D in % GDP 3.6 3.5 3.6 3.6 3.5 3.5 n.a.
Population growth; % 0.7 0.6 0.6 0.5 0.5 0.5 0.6
Population density (pers/km²) 61.7 62.1 62.5 62.8 63.1 63.4 63.8Source: Work package 1, Eurostat
1.2 Environmental situation (in 2000)
Water supply and wastewater treatment
In terms of wastewater treatment and water supply, the connections and the quality of treatment were satisfactory as early as 2000. The Ministry of Agriculture and Forestry estimates that 95% (see table 2 below) of the South Finland population was served by a public water supply (90% for the whole country) and 85% was connected to total treatment, according to the wastewater directive (80% for the whole country). The situation in the Kymenlaakso region was an exception as the water supply and wastewater network and treatment facilities were outdated, requiring extensive new investments. One of the two main challenges concerned nitrogen removal at municipal wastewater treatment plants (WTPs) in some areas. According to the government, only WTPs having a direct impact on the Baltic Sea should have full nitrogen removal and not all WTPs serving a population over 10,000 people, as stated by the Urban Wastewater Directive. As Southern Finland is completely part of the Gulf of Finland watershed, many cities being located at the cost or rivers directly discharging to the Gulf, nitrogen removal is more important in this region than in more inland regions. Therefore, most main cities had already invested to nitrogen removal before 2000. For example, in the Metropolitan area of Helsinki, forming a large part of the region, the investments to comply with the requirements had been made in the 1990s and the issue was no longer an important challenge at the beginning of the period. The second challenge was the connection of isolated habitations, farms and resorts to water network. This issue was particularly important due to two characteristics of the South Finland population. Firstly, the tendency of the Finnish population to migrate from city centres to suburbs where numerous new houses were being built. Secondly, the tendency of the Finnish to own a summer cottage which is often isolated and located in an environmentally strategic area.

EX POST EVALUATION OF COHESION POLICY PROGRAMMES 2000-2006 CO-FINANCED BY THE EUROPEAN FUND FOR REGIONAL DEVELOPMENT (OBJECTIVES 1 AND 2) - WORK PACKAGE 5B: ENVIRONMENT AND CLIMATE CHANGE ADE
Regional Case Study – South Finland – October 2009 Page 3
Table 2: Environmental data
South Finland 1999 2000 2001 2002 2003 2004 2005 2006 2007 Population served by public water supply (%)*
n.a. n.a. n.a. n.a. n.a. n.a. n.a. n.a. 95.0
Population served by total wastewater treatment (%)*
n.a. n.a. n.a. n.a. n.a. n.a. n.a. n.a. 85.0
Proportion of wastewater treated (%)** n.a. n.a. n.a. n.a. n.a. n.a. n.a. n.a. 100.0
Municipal solid waste (kg/hab)*** 499.5 526.2 501.3 520.4 499.5 480.9 498.0 503.8 495.3 Municipal waste selectively collected (kg/hab)*** 183.1 180.8 181.9 188.1 160.4 184.6 191.5 195.7 193.2 Proportion of municipal waste selectively collected (%)*** 36.9 34.4 36.2 35.8 32.4 38.7 38.5 38.8 38.6
Sources: Regional councils * Estimation of the Ministry of Agriculture and Forestry ** Varsinais-Suomi and Uusimaa only *** Till 2001, Uusimaa and Päijät-Häme only; as of 2002, Uusimaa, Päijät-Häme and Varsinais-Suomi Finland had an extensive reporting system on water supply from 1971 until 1999. The system was stopped in 1999 for replacement by a new system (VELVET). However, the new system is only now starting to function, and therefore no exact data is available for the period 2000-2008.
Solid waste
The level of solid waste generation per capita was slightly lower than the national and EU average and no increasing trend in volume was being observed. The solid waste issue is easier to deal with than in the rest of Finland thanks to the higher density of population that allows a more efficient collection and treatment of waste. However, as in the rest of Finland, an excessively large amount of waste was still destined for landfills. There is rather little experience on incineration in Finland and the amount of municipal waste generated per capita has been increasing during the 2000-06 period. Some legal complaints launched during the period have delayed the investment in new incineration infrastructure. The focus of the waste-related regional strategy is on increasing recycling and supporting companies which develop recycling systems. Recycling was already well developed, especially from industrial and commercial sources (less from municipal sources) and for paper, glass and metal. This is due to the fact that the responsibility of recycling has been put on the shoulders of producers (of cars, paper, electronic, packaging etc). Public also has a strong tradition of recycling paper and glass items. For packaging, the results were less convincing but Finland complied with the EU Directive.
Climate change and renewable energies
Regarding GHG emissions, the main issue concerned the metropolitan area of Helsinki and the development of land used to solve transport and traffic issues, especially with the present urban sprawl. As regards energy efficiency, the challenge concerned more population’s use (heating in particular) than enterprises’ use. As in the rest of the country, the share of renewable energy was high due to wood energy. In 2000, renewable energy accounted for 23.9% of primary energy consumption in Finland,

EX POST EVALUATION OF COHESION POLICY PROGRAMMES 2000-2006 CO-FINANCED BY THE EUROPEAN FUND FOR REGIONAL DEVELOPMENT (OBJECTIVES 1 AND 2) - WORK PACKAGE 5B: ENVIRONMENT AND CLIMATE CHANGE ADE
Regional Case Study – South Finland – October 2009 Page 4
compared to an EU average level of 5.8%. Some pilot projects were being carried out to develop wind energy more widely.
Other issues
The main environmental challenge for South Finland in 2000 was the state of the Gulf of Finland, especially along the southern coast and in the archipelago, where there is mainly shallow water. The pollution is mainly due to wastewater from Russia as well as from nutrients of Finnish and Russian agriculture and oil spills and other cargo traffic accidents. The main related problems are eutrophication, loss of biodiversity and hazardous substances in catchment areas.
1.3 Institutional set up and policy making process
1.3.1 Regional development
The seven regions have a clear competence as regards economic development of their area. Each regional council is responsible for the regional development and planning and for land-use planning, as well as promotion of regional interest and international cooperation. They determine the long-term strategy (currently the horizon is 2035). They are responsible for national and EU-funded development programmes. Each regional council determines its strategy according to its specificities and in consultation with the Employment and Economic Development Centre (EEDC) and the Regional Environment Centre. These two regional bodies of state administration are important partners in regional development. However, their geographical regions do not fully comply with the ones of the councils.
1.3.2 Environmental sector
In water supply, the Ministry of Agriculture and Forestry has the main responsibility at State level for developing water supply services. The Ministry of Environment has the main responsibility for water protection. The MoE is also responsible for national waste management. The regional environmental administration is based on Regional Environment Centres, subordinated to the Ministry of Environment. South Finland is covered by 4 Regional Environment Centres: Uusimaa (around Helsinki), Varsinais-Suomi (South-west), Kymenlaakso (South-East), and Päijät-Häme (around Lahti). Their responsibilities include the issuing of permits (major permits, whereas smaller permits are handled by municipalities), regional planning on environmental issues, environmental monitoring, and support for implementation of environmental investments.1 Finland has a strong tradition of municipal self-governance. Thereby, municipalities are responsible for local environmental management, including issue of permits (permits with local impact) and development of municipal environmental infrastructure. In the future, 1 The environmental administration is currently undergoing major restructuring. In the future, the environment centres
will be integrated into wider regional centres, covering economic and commercial administration, traffic and transport, and environmental management. Issue of all regional permits (environmental included) will be transferred under a new regional structure managed by the Ministry of Finance.

EX POST EVALUATION OF COHESION POLICY PROGRAMMES 2000-2006 CO-FINANCED BY THE EUROPEAN FUND FOR REGIONAL DEVELOPMENT (OBJECTIVES 1 AND 2) - WORK PACKAGE 5B: ENVIRONMENT AND CLIMATE CHANGE ADE
Regional Case Study – South Finland – October 2009 Page 5
the municipal permit system will be simplified by replacing some of the permits with environmental norms. The responsibility for practical implementation of the environmental infrastructure lies within the municipalities. In practice they have to organise the water supply and the wastewater network to all planned areas and also to rural settlements with a justified need. Most of the current water companies are combined water supply and sewerage providers. Municipalities are also responsible for the management of municipal waste whereas industries are responsible for industrial waste. Municipalities are able to make some arrangements with each other. For example, a large municipality may treat the wastewater of a smaller one. The additional investment costs (connections between the two networks) will be covered by the government as long as this solution is more efficient. Municipalities also cooperate on solid waste, as a group of municipalities can create a public company that will manage all their waste. Industries are responsible for their own water supply and waste infrastructure but otherwise private companies are not widely involved in environmental infrastructure. They can be hired for outsourcing (to build or run treatment plants) but are never responsible for the organisation and never own the infrastructure. In most cases, the management of environmental infrastructure remains entirely public and the private sector is not involved at all. In solid waste management, private companies are becoming increasingly involved, namely for recyclable waste (especially paper and metal). Another form of private involvement is the “cooperatives” in rural areas. These small private companies are created and owned by a group of isolated households to manage their water network and treatment. Often the cooperatives are responsible for water distribution and sewerage whereas they may buy the water from the bigger municipal water company. Also the sewers are normally connected to the municipal network whereby the treatment takes place in the municipal treatment plant. Some cooperatives also have their own water sources and treatment facilities.


EX POST EVALUATION OF COHESION POLICY PROGRAMMES 2000-2006 CO-FINANCED BY THE EUROPEAN FUND FOR REGIONAL DEVELOPMENT (OBJECTIVES 1 AND 2) - WORK PACKAGE 5B: ENVIRONMENT AND CLIMATE CHANGE ADE
Regional Case Study – South Finland – October 2009 Page 7
2. Regional policies and the role of the ERDF
2.1 Economic policies
For the 2000-2006 period, a strategy was clearly elaborated through a discussion between the seven regions. A consensus was reached on the strategy that consisted of promoting South Finland’s development into one functioning network of economic areas with a starting point at the strengths of the regions. The goal was to improve the position of South Finland in the international environment, especially in the Baltic Sea area, with a strengthening of international and competitive entrepreneurship and economic activity and the creation of an attractive living environment and a vigorous know-how centre and functioning connections. This strategy addressed the main challenges that were facing the different regions, linked to the reconversion of the economy, which was still in progress, after the collapse of the Soviet Union. The main weaknesses of the region were taken into account: unemployment, education, geographical position and high production costs. The ERDF regional Operational Programme has been completely integrated into this framework. The three priorities of the OP were elaborated as tools to reach the goals set by the strategy. The goal of priority 1 was to increase the attractiveness and competitiveness of enterprises. Focus was put on the increase and development of SME-activities and on the development of their operational environment as well as of new technologies and expertise of the personnel and entrepreneurs. Priority 2 aimed at lowering unemployment and reaching a positive migration balance as well as increasing the level of education and improving the operational prerequisites of education and research. Priority 3 consisted of the development of functioning communities and infrastructure, improvement of the environment, and development of tourism and culture.
2.2 Environmental policies
2.2.1 Main objectives pursued and contribution of the ERDF
Complying with EU Directives is not the main driver in environmental policies. However, the Water Services Act of 2001 follows the principles of the Water Framework Directive (WFD). WFD principles regarding coastal zones and river basin management are also used as reference for the protection of the Baltic Sea, its archipelago and connected catchment areas. According to this act, the municipalities are responsible for the general development of the water supply and sewerage and of the arrangements for the provision of water services.

EX POST EVALUATION OF COHESION POLICY PROGRAMMES 2000-2006 CO-FINANCED BY THE EUROPEAN FUND FOR REGIONAL DEVELOPMENT (OBJECTIVES 1 AND 2) - WORK PACKAGE 5B: ENVIRONMENT AND CLIMATE CHANGE ADE
Regional Case Study – South Finland – October 2009 Page 8
As regards the compliance to the Urban Wastewater Directive (for 2015), investments are being made for the removal of nitrogen, and the wastewater network of the Kymenlaakso has been totally rebuilt and centralised within this framework. Quantitative targets were not set in the water field. Wastewater connection and treatment was already at satisfactory levels by 2000 as the necessary investments had already been made. The objective was to solve very specific problems in isolated areas and for special actors such as resorts or farms, especially when there was an impact on a strategic area, such as catchment areas or lakes used as drinking water reservoirs. The investments consisted of connecting these places to the municipal system. These specific investments cannot be reflected in terms of connection rates. The exception was Kymenlaakso. Public and EU funds are only used for these specific cases. Other investments and maintenance costs are financed by end users. Besides water, environmental policies respond to national characteristics and do not follow EU Directives strictly. For example, treatment goes beyond EU Directives in terms of phosphorus removal. For other environmental sectors, EU Directives have played an important role, such as the habitats directive (for biodiversity) but have never been the sole driver as national interest is always at least as important and it is always a combination of the two that determines policy. No environmental quantitative objective has been set. The only target that was set was that 30% of the EU-funded projects had to have a positive environmental impact. On the other hand projects with negative environmental impact were not to be funded, in accordance with the national law. Regarding waste, the strategy was not to reduce generation per capita and as a consequence, these figures are not closely monitored. Waste policy was rather focused on promoting recycling, which increased during the period, though mainly thanks to the private sector, which has been proactive in developing recycling and separation by origin. The companies received support from public funds to develop recycling systems and expand their business internationally. In terms of renewable energy, which already accounts for a large share of total energy consumption, the situation improved over the 2000-06 period thanks to innovation and subsidies, according to the Finnish Environmental Institute. Subsidies are allocated by the State and focus on the forestry sector especially. The majority of the numerous environmental projects were limited in size and their impact on attractiveness remains local. In Kymenlaakso, the new water supply and wastewater network is a tool to attract companies, which will have a more efficient water supply and treatment. It has also attracted a company that produces biogas. The improvement of wastewater treatment in areas with polluted lakes increases the attractiveness of these lakes for environmental-related companies and habitations. On the other hand, Priority 1 projects significantly helped to develop the environmental business centre.

EX POST EVALUATION OF COHESION POLICY PROGRAMMES 2000-2006 CO-FINANCED BY THE EUROPEAN FUND FOR REGIONAL DEVELOPMENT (OBJECTIVES 1 AND 2) - WORK PACKAGE 5B: ENVIRONMENT AND CLIMATE CHANGE ADE
Regional Case Study – South Finland – October 2009 Page 9
2.2.2 Funding strategies
The ERDF has no particular strategic role as regards environmental policies. According to the Managing authorities, the choice of funding between national and EU funds was made on pragmatic criteria, depending on the needs of each project and the available budgets as well as the regulations and limitations of each source of financing. No specific environmental strategy was prepared for the regional OP. Environment was not an horizontal priority as such. Instead, the approach was to integrate environmental considerations into the overall programme as well as reserve substantial funding for environmental projects. The Finnish Environmental Institute feels that environmental considerations were taken reasonably well into account in the ERDF programs, even though a specific environmental strategy was lacking. The new programme (2007-2013) includes also an environmental strategy, in accordance with the requirements of the EU. Interreg funding (with Sweden, Russia and Estonia) was also used in water quality improvement and wastewater treatment projects as well as in waste management and projects aimed at increasing awareness on the state of the archipelago. This was implemented by the regional environment centre. There was no EIB loan for environmental projects in South Finland. The polluter-pays principle is strongly applied in South Finland. According to Finnish law, each company is responsible for the collection and the treatment of its waste and wastewater and must have cleaning systems. The same applies for households which cover the costs of the collection and treatment through user charges, including investment expenditures. Isolated habitations finance their own system or the connection to the municipal system in order to meet the permits. In water services, €250m is invested every year in Finland and state and EU financing amount only to €25m. 90% of the investments are thus supported by the users/polluters. The contribution of the State in total environmental investments (outside EU-supported projects) is very limited and only amounts to around €10m per annum and concerns projects for which the user-pays principle is difficult to apply, for example long transfer sewers. State and EU funds are also used in emergency situations, incentives for regional cooperation and for infrastructure in rural areas.
2.3 Actions taken
2.3.1 Environmental expenditures and main sources of funds
The total budget allocation of the OP was €180m, of which €44m (24%) was dedicated to the environment, according to Work Package 1. These €44m gather the allocations in environmental fields of intervention, which were, for this regional OP:

EX POST EVALUATION OF COHESION POLICY PROGRAMMES 2000-2006 CO-FINANCED BY THE EUROPEAN FUND FOR REGIONAL DEVELOPMENT (OBJECTIVES 1 AND 2) - WORK PACKAGE 5B: ENVIRONMENT AND CLIMATE CHANGE ADE
Regional Case Study – South Finland – October 2009 Page 10
environmental-friendly technologies, environmental infrastructure and urpgrading and rehabilitation of urban areas and of industrial and military sites. For priority 1, which concerned business competitiveness and attractiveness of the business environment, the companies financed 50% of the projects, the ERDF 25% and the State 25%. In the four visited regions, €4m was actually spent on these projects. The ERDF contribution accounts for only 4.1% of the ERDF financing for environmental projects within the framework of the regional OP. According to Work Package 1, €31m had been allocated for environmental projects within this priority for the whole of South Finland. Funding was thus abundant but demand from the companies was not sufficient to make use of all the funds. Within Priority 3, which aimed at the development of sub-regions, urban areas, and the attractiveness of the local communities, the majority of the funds were used for upgrading and rehabilitation of urban areas, industrial and military sites (FOI codes 351 and 352). These projects mainly consisted of cleaning areas, landscaping and landscape conservation, path building, lake and beach restoration, creation of green areas etc. However, there was no clear integration of these projects in a development strategy. €45m has been spent for these projects in the four regions, whereas €52.5m had been allocated for the whole of South Finland according to Work Package 1.
Table 3: Environmental expenditures related to ERDF-supported projects in the 4 visited regions of South Finland
Comment: In South Finland, there is no monitoring of the national, regional and local environmental investments and expenditures. These figures are unavailable. The only figures that could be computed were the environmental expenditures in the framework of the projects supported by the ERDF. These figures were gathered from the tables provided by the regional councils of the four regions that were visited. The three remaining regional councils have been contacted, without success. There was no monitoring of the
Fields of intervention (2000-2006;in € thousands, unless otherwise stated)
ERDF ERDF
in% ERDF € per capita
National counterpart
Muni-cipalities
Private Interreg TOTALTOTAL
in %
162: Environmentally friendly technologies, clean and economical energy technologies
790 4.1% 0.36 939 127 2,060 0 3,915 5.1%
34: Environmental infrastructure
Total 5,253 27.2% 2.42 4,188 13,571 4,177 425 27,615 36.1%
Solid waste 470 2.4% 0.22 149 198 1,483 0 2,299 3.0%
Water 4,468 23.2% 2.06 3,436 12,690 2,493 0 23,088 30.2%
351 & 352: Upgrading and Rehabilitation of urban areas and industrial and military sites
13,244 68.7% 6.11 10,369 16,487 3,677 1,119 44,897 58.7%
TOTAL 19,287 100% 8.89 15,496 30,186 9,914 1,544 76,427 100%

EX POST EVALUATION OF COHESION POLICY PROGRAMMES 2000-2006 CO-FINANCED BY THE EUROPEAN FUND FOR REGIONAL DEVELOPMENT (OBJECTIVES 1 AND 2) - WORK PACKAGE 5B: ENVIRONMENT AND CLIMATE CHANGE ADE
Regional Case Study – South Finland – October 2009 Page 11
expenditures at the South Finland level. The Regional councils have not used the “Fields of Intervention” classification and it was impossible to distinguish investments from current expenditures. As regards the projects related to environmental infrastructure supported under the same priority, ERDF has been mainly used to finance planning and feasibility studies as well as pilot projects but not the following steps. An exception was the Kymenlaakso region where the main environmental project concerned the centralisation of the water suply and wastewater networks. 27.6 €m have been spent in the four regions, compared to an allocation of 29.6 €m for the whole OP, according to the Work Package 1. Concerning the protection and renovation of lakes, the demand from associations was high but the regions lacked of resource and decided to use ERDF financing as seed money. This start-up capital attracted the private sector, which funded 8% of the costs of the ERDF-supported projects in 2000-06. The industry has become more and more interested in being involved in environmental funding and to sponsor such projects as it was very positive for their image.
2.3.2 ERDF contribution to environmental expenditures in the region
Table 4: Main output and result indicators
Indicator name
Baseline value (2000)
Target Achieved value
1 Number of projects on water supply n.a. n.a. 57
2 Number of projects on wastewater n.a. n.a. 51
3 Number of projects on municipal solid waste n.a. n.a. 5
4 Number of additional population served by water supply projects
n.a. n.a. 7,400
5 % increase of the additional population served by water supply projects (compared to the baseline value)
n.a. n.a. n.a.
6 Reduction of leakage from the water supply network n.a. n.a. n.a.
7 Increase in population served by wastewater projects n.a. n.a. 6,650
8 % increase in population served by wastewater projects (compared to the baseline value)
n.a. n.a. n.a.
9 New waste treatment capacity created n.a. n.a. n.a.
10 Number of unauthorised landfills closed or rehabilitated n.a. n.a. 0
11 % of unauthorised landfills in the total number of the landfills operated in 2000 (for EU10 Member States only)
n.a. n.a. 0
12 Population served by waste management projects n.a. n.a. 131,000
13 Number of planning projects/ water supply and sewerage n.a. n.a. 15Sources: WP2; annual reports and discussion with managing authorities
The role of the sources of financing had not been clearly identified and was specific to each region. In the Päijät-Häme region, the choice of funding between national and ERDF funds was purely pragmatic and depended only on the respective regulations and limitations but not on any specific strategies of the sources of financing. On the contrary, in Kymenlaakso, all projects related to energy were not financed by priority 1 of ERDF but by national funds for which energy was a strategic area, and therefore, financing was easier.

EX POST EVALUATION OF COHESION POLICY PROGRAMMES 2000-2006 CO-FINANCED BY THE EUROPEAN FUND FOR REGIONAL DEVELOPMENT (OBJECTIVES 1 AND 2) - WORK PACKAGE 5B: ENVIRONMENT AND CLIMATE CHANGE ADE
Regional Case Study – South Finland – October 2009 Page 12
As a result, 100% of the projects financed by national funds were environmentally friendly in this region whereas this figure is only 10% for ERDF-supported projects. Priority 1: Business competitiveness and attractiveness of the business environment This priority was under the responsibility of the Employment and Economic Development Centre (EEDC). ERDF funds were used both for company and project financing and for product and business development. The environment-related projects refer to projects aimed at developing the business of environmental companies and not to projects aimed at improving energy efficiency or environmental technologies in private companies. In some areas, the environmental projects were important under this priority, as many environmental companies are located there (recycling, biogas, waste management, wastewater systems etc). However, the goal was not to promote environmentally friendly technologies as such but to develop business, competitiveness and employment, through innovation and internationalisation, whether it was related to the environment or not. The main criterion used to select the projects was the fact that the projects could lead to international development, were innovative and could create employment. As many of the industries are environment-related, the share of environmental projects became high in some areas such as Lahti. Energy efficiency projects have been implemented as long as it was profitable for the company and its development. There was no incentive or subsidy for the promotion of environmentally friendly technologies or to increase energy efficiency. Priority 3: Development of sub-regions, urban areas, and attractiveness of the local communities Environmental projects under this priority concerned environmental infrastructure and rehabilitation of urban areas and the upgrading and rehabilitation of industrial sites. Regarding environmental infrastructure, the quality of the collections, connections and treatment were already satisfactory and the goal was to solve a number of specific problems for which the ERDF financed planning and pilot projects but not the building of the infrastructure itself. The impact in terms of figures was thus very limited: 7,400 and 6,650 additional people respectively served by water supply and wastewater projects, given that the total population of South Finland amounts to 2.6m. As regards rehabilitation projects, the activities were very varied, including tourism infrastructure development, restoration of lakes and parks, creation of areas to attract business etc. In the remaining of this section, it is described how the regional OP was implemented in each of the four visited regions. As South Finland is relatively heterogeneous, each region has its particulatities and was competent to define its strategy for the OP, within the framework of the global strategy for the whole of South Finland. As a consequence the ERDF actions have been different in each of the regions and the impacts have been mainly local. Uusimaa Region Environmental investment from the ERDF in the 2000-06 period only amounted to €1.2m, which is very limited compared to the total environmental budget of the region. Seventy environmental projects were implemented. This is explained by the fact that only

EX POST EVALUATION OF COHESION POLICY PROGRAMMES 2000-2006 CO-FINANCED BY THE EUROPEAN FUND FOR REGIONAL DEVELOPMENT (OBJECTIVES 1 AND 2) - WORK PACKAGE 5B: ENVIRONMENT AND CLIMATE CHANGE ADE
Regional Case Study – South Finland – October 2009 Page 13
two small areas belong to objective 2 and thus concerned by the OP: the Archipelago and the northern part of the region, where inhabitants are mainly working in agriculture or pendel to Helsinki. The archipelago is very specific as the permanent population is very limited (just 3000 inhabitants) but increases (in fact, doubles) significantly in summer. At the same time, the investments are more expensive as the soil is very rocky. There is no big industry in this area but the archipelago suffers from sea pollution caused by the industries of the city of Hanko, which is not concerned by the OP. As there is no industry in the two areas concerned by the OP, no funds were used under priority 1. The main contribution of the ERDF (under priority 3) was the financing of planning and pilot projects to connect isolated habitations (including summer houses) to the municipal water system and the support of tourism infrastructure development.
Wastewater and water supply project in Skaldo (Archipelago)
There is no wastewater treatment plant on the site. This project aimed at connecting the houses of Skaldo Island and its region to the water supply and wastewater treatment networks of the mainland. ERDF funds financed the planning of the project and its first phase (connection from the network to the sea, including connection to the houses in this area). EU support helped thus to start the project and it is likely that without this support, the project would have never been implemented. The second phase of the project (an underwater pipe between the mainland and Skaldo) has been financed by the state and the users. The third phase (connection of houses on the island) is being financed by the ERDF thanks to the extra time that Finland received to use funds from the 2000-06 period. By the end of the project (2014), 450 people will be served by the new connections. The ERDF financed €300,000 (including the third phase) out of a budget of €3m. Päjät-Häme In this region the ERDF intervened on two main fields: protection of lake Vesijärvi and promotion of "green" business. Lake Vesijärvi is very important as the city of Lahti is located in its shores and the lake affects the whole city. The lake Päijänne is even more important as it is the watersource for the entire Helsinki metropolitan area, serving thereby almost 25 % of the Finnish population. Water supply and wastewater treatment projects supported by the ERDF aimed at connecting isolated inhabitants and farms that had previously only had their own system to the municipal system. These specific cases had a significantly detrimental impact on the quality of the water in the lake and the goal was to solve these specific problems. For municipalities and industries, the connections were already satisfactory and complied with EU directives and as a result, the improvements cannot be observed through statistics.

EX POST EVALUATION OF COHESION POLICY PROGRAMMES 2000-2006 CO-FINANCED BY THE EUROPEAN FUND FOR REGIONAL DEVELOPMENT (OBJECTIVES 1 AND 2) - WORK PACKAGE 5B: ENVIRONMENT AND CLIMATE CHANGE ADE
Regional Case Study – South Finland – October 2009 Page 14
Project Aqua Vesijärvi
ERDF financing (€49,000) was used as seed money to start the project, which consisted of the creation of a foundation aimed at preventing the continuation of the worsening of the water quality. Before its foundation, €150,000 was spent annually by the city of Lahti for the protection of the lake. With the Project Aqua Vesijärvi, €1m is now spent annually, of which 70% is public and 30% private. This foundation was especially needed to make the link between private sources of financing and environmental management. The private implication pushes the municipalities to continue investing as it is very positive for their image. The goal was to involve the private industry of Lahti, while remaining independent and to create strong links with universities and local actors. The collaboration between public and private resources is both in terms of financial support and knowledge. The actions include research promotion, water restoration, awareness raising and improved management of the fishing and tourism activities. It has been a success and it is growing as the funding has tripled and continues to increase, thanks to a large amount of publicity in the press. The foundation allowed for the improvement of coordination and networking between the different actors (ministries, R&D, universities etc). This project, based on a bottom-up approach, aimed to have local impacts but also to comply with the Water Framework Directive. The other aspect of ERDF intervention concerned the development of environment-related business. Since the end of the 1990s, "green" business has developed strongly in Lahti, attracted by the research potential of Lake Vesijärvi. Now Lahti is among the key regions in environmental technology. It has become the second largest centre for cleantech companies and it has one of the most important cleantech-focused science park and infrastructure in Finland. The main areas of specialisation are recycling, material and energy efficiency and water purification.
Lahti Science and Business Park
The strategy of the Science and Business Park during the 2000-06 period was based on a pragmatic bottom-up model where the practical challenges and problems were used as triggers of innovation. Lahti became a place for dialogue between different areas of knowledge and expertise. This “intellectual cross-fertilisation” has stimulated innovation. This was combined with the arrival of regional units of four Finnish universities. These units were dedicated to technology and innovation and focused on the environment. The role of EU funding has been twofold. Firstly, several projects focused on the development of environmental technology, and innovation systems have been funded by the ERDF (under priority 1) in the 2005-08 period. The development of these projects contributed to the creation of a joint vision for developing environmental technology and innovation systems in Lahti Region, combining universities, companies, development organisations, funding organisations and municipalities, with good coherence between the different funding instruments. Some concrete successful showcases served as evidence that it was possible to become an international leader.

EX POST EVALUATION OF COHESION POLICY PROGRAMMES 2000-2006 CO-FINANCED BY THE EUROPEAN FUND FOR REGIONAL DEVELOPMENT (OBJECTIVES 1 AND 2) - WORK PACKAGE 5B: ENVIRONMENT AND CLIMATE CHANGE ADE
Regional Case Study – South Finland – October 2009 Page 15
Secondly, EU funds were used for the creation of a professorship of waste management in Helsinki University of Technology, located mainly in Lahti, in 2006-07. This professorship was a key element in creating the regional research base and in connecting it to the Helsinki Metropolitan Area. Recycling and waste management now account for more than 50% of cleantech business in the Lahti Region, where material efficiency has a growing importance and closed loops in traditional industries. The strategy is to develop a “recycling society” by closing material loops from production to consumption and back to production in a sustainable manner. Fifty percent of this professorship project has been funded by the ERDF under priority 1, whereas the other 50% was financed by companies and the city of Lahti. The target of the project was to strengthen expertise, research and business opportunities on environmental technology and to support the regional cleantech cluster with a strong university-industry link. The professor is Juha Kaila who is an internationally approved expert on waste management. The effects of this project are significant, thanks to a research agenda and a Master’s programme on environmental technology, with tight cooperation with local cleantech companies and a strengthening of national and international connections in environmental technology. This project was decisive in establishing Lahti as the Finnish cleantech cluster. The ERDF has allowed for the coordination of the innovation strategy and the transformation of Lahti into an environmental innovation leader and an attractive centre for innovative environment-related companies.
Varsinais-Suomi
In this region, the main focus of ERDF intervention has been the protection and restoration of the catchment area, which covers the entire territory of the region and which is threatened by the pollution of the Baltic Sea and its archipelago. The projects mainly aimed at creating organisations to improve collaboration between the stakeholders and to raise awareness. The protection of the archipelago is the key for most projects, either in archipelago itself, or in upstream regions.
Pro Saaristomeri Forum
The goal of this project, which was started with ERDF support, was the protection of the Baltic Sea and its archipelago, threatened by the nutrients from agriculture. The aim was to improve water quality by enhancing regional cooperation and the use of funding. All stakeholders participate in the forum: NGOs, research institutes etc. The forum is organised in working groups that discuss water-related issues and generate projects and initiatives: restoration of waters, decreasing environmental load etc. This forum clearly aims at complying with the WFD and the main achievements were the increased awareness and cooperation between stakeholders.
Kymenlaakso

EX POST EVALUATION OF COHESION POLICY PROGRAMMES 2000-2006 CO-FINANCED BY THE EUROPEAN FUND FOR REGIONAL DEVELOPMENT (OBJECTIVES 1 AND 2) - WORK PACKAGE 5B: ENVIRONMENT AND CLIMATE CHANGE ADE
Regional Case Study – South Finland – October 2009 Page 16
In this region the main ERDF intervention has been the centralisation of the wastewater network. Instead of having seven wastewater treatment plants in the region that dated back to the 1970s, it was decided to centralise the network with a unique modern plant in the city of Kotka. This project aimed at complying with the EU Directive in terms of nitrogen removal but was also cost-effective.
2.4 ERDF decision and planning process
The logic behind the creation of the South Finland programme area is that it was considered as a corridor to Russia, which was seen as the main opportunity for this region. However, there is neither the administration nor the competency at this programme level, as the power is in the hands of the seven regions covered by the whole programme area. Indeed, as it is described below, the strategy, the organisation, the project selection and the monitoring of the implementation are managed by the regions and not at South Finland level. Within South Finland, the funds of the OP have been divided between regions on the basis of their respective populations in Objective 2 areas. The preparation of the OP started in 1998-99 with several meetings in which all the regional bodies of South Finland took part: seven regional councils, four environment centres and four employment and economic development centres. Experts were also consulted, as well as the competent ministries. However, the role of the latter was purely advisory and it was up to the regional bodies to identify the main challenges for South Finland and determine the strategy of the OP. A consensus was reached on the three priorities that have characterised the OP. In the second step, each regional council elaborated its own strategy in the framework of the South Finland strategy and in consultation with the Environment centre and the Employment and Economic Development Centre.
In each region, a Regional Monitoring Committee (RMC) was created. The RMC was composed of representatives of the regional council, the municipalities, state authorities (the regional environment centre and the EEDC) and social partners (representatives of the labour market and business organisations). The RMC was responsible for preparing the regional cooperation document, which determined annually how the funds would be allocated between the three priorities. The RMC also prepared the process for the selection of the projects. The RMC is also responsible for reviewing the strategy for EU funding and large applications as well as other applications under request of the Secretary. It also ensures appropriate information and publicity on implementation. Following a bottom-up approach, applicants proposed projects to the Regional Council which evaluated them and asked possibly for changes before acceptation or rejection on the basis of the regional strategy. If the project was environmental (priority 3) or concerned a private company (priority 1), the decision was respectively delegated to the

EX POST EVALUATION OF COHESION POLICY PROGRAMMES 2000-2006 CO-FINANCED BY THE EUROPEAN FUND FOR REGIONAL DEVELOPMENT (OBJECTIVES 1 AND 2) - WORK PACKAGE 5B: ENVIRONMENT AND CLIMATE CHANGE ADE
Regional Case Study – South Finland – October 2009 Page 17
environment centre or the EEDC. The RMC decided which financing would be used: national funds or EU financing (with national counterpart). This decision was mainly pragmatic, depending on the available funds and the rules of each source of financing. There was thus a degree of fungibility between the EU and national funds. A person from the regional authorities (generally the regional council) was then named and made responsible for following the implementation of the project. This person participated in the steering group of the project, where all the stakeholders met. The Ministry of Interior supervised the coordination of the OP, which was the responsibility of the regions. There were also informal meetings between the regions to share experiences. The MoE, which has authority on environment centres also followed the implementation of the projects and informed the MAF on those projects concerning water resources. Each project application had to include an Environmental Impact Assessment (EIA), which was evaluated by the funding authority. There was no particular problem regarding the disbursement of funds, except for priory 1, where demand was not sufficient in comparison to available funds. In some cases, funds could not be used on time because the proposed projects were not sufficiently well designed.


EX POST EVALUATION OF COHESION POLICY PROGRAMMES 2000-2006 CO-FINANCED BY THE EUROPEAN FUND FOR REGIONAL DEVELOPMENT (OBJECTIVES 1 AND 2) - WORK PACKAGE 5B: ENVIRONMENT AND CLIMATE CHANGE ADE
Regional Case Study – South Finland – October 2009 Page 19
3. Analysis of the ERDF contribution
3.1 Relevance of the 2000-2006 ERDF strategy in the environmental sector for enhancing territorial development
There was no clear ERDF environmental strategy in South Finland, even though the regional Operational Programme has had environmental impacts. The strategy of the OP was very general and has not really been taken into account in the project selection. Indeed, within each priority, the regions were totally autonomous and determined their own strategies, even though they cooperated between each other. Regarding priority 1, environmental developments were entirely linked to the presence of environmental-related business and increasing awareness in the region. Indeed, the ERDF strategy was to support innovative business in their development, whether the business was environment-related or not, knowing that no project with negative environmental impact could be financed. The promotion of cleantech businesses in places such as Lahti has contributed to decreasing the dependency of South Finland on the Metropolitan area of Helsinki. Within priority 3, the projects related to upgrading and rehabilitation of urban areas were very varied and were not clearly integrated in a regional development strategy. Regarding environmental infrastructure, the strategy of the South Finland regions was more obvious: given the satisfactory level of the connections and treatment plants and the relatively limited available funds, it was decided to use the ERDF to solve some very specific problems related to isolated areas which had relatively significant impacts in terms of pollution. The main impact of environmental investments on territorial development was local: the connection of isolated areas to the municipal water network, namely in the archipelago, increases the attractiveness for tourism and summer houses. Another impact is linked to the protection and restoration of lakes which attracts new, highly qualified, inhabitants, often from Helsinki. As most major industrial areas (Helsinki metropolitan area, city of Turku region) were not included in the programme 2 area, several of the most important environmental issues (e.g. air pollution in the main cities) could not have been dealt with ERDF.
3.2 Quality of the planning and implementation process to meet regional challenges in the covered fields
Even though ministries and stakeholders were consulted, the regional bodies of South Finland were the only authorities involved in the preparation of the OP and this had the advantage of only taking into account the regional challenges to determine the allocation of the funds.

EX POST EVALUATION OF COHESION POLICY PROGRAMMES 2000-2006 CO-FINANCED BY THE EUROPEAN FUND FOR REGIONAL DEVELOPMENT (OBJECTIVES 1 AND 2) - WORK PACKAGE 5B: ENVIRONMENT AND CLIMATE CHANGE ADE
Regional Case Study – South Finland – October 2009 Page 20
However, an excessively general strategy and the lack of targets made it difficult to implement the strategy during the project selection process. Another problem was that the ERDF financing was allocated between the regions of South Finland only based on the population of their objective-2 areas, whereas some important problems concerned areas where the population is limited and scattered and the geography difficult, thus the funds were not sufficient to address the environmental challenges. The general coordination has been efficient and information abundant. The process made it easy to start projects and obtain financing. The funding authorities were very pragmatic, choosing between the different sources of financing on basis of the available funds and limitations. However, the supported projects were numerous and very limited in size. This has created difficulties to manage them and to assess the impacts, which were also limited.
3.3 Contribution of the ERDF to improving the environmental situation
3.3.1 Environmental situation: trends over the programming period
Environmental awareness increased significantly during the period, especially regarding the problem of small-size particles and the use of cars. The same applies for the loss of biodiversity and landscape even if the problem continued to grow due to development of monocultures. Urban issues and their impact on climate change worsened. The fact that the population is more and more scattered around Helsinki due to urban sprawl is problematic and this problem clearly accelerated during the 2000-06 period. During the period, wastewater cooperatives developed strongly. They allowed for the connection of isolated houses and villages to small water networks. This was done thanks to EU, government and municipal support. Improved waste management led to progress being made, especially in increasing levels of recycling. There has been an improvement in the use of renewable energy, thanks to state subsidies and innovation. In the 2000-06 period, the state of the Baltic Sea significantly worsened, even though municipal wastewater treatment has improved. This is mainly due to water pollution from Russia (City of St. Petersburg is the main single polluter of the Gulf of Finland) and nutrients from agriculture. A programme to address this challenge was adopted by the government in 2003 but it is only on a voluntary basis (with compensation and incentives to build protection for wetlands for example) and there was no significant progress in the 2000-06 period, also due to agricultural lobbies, according to the Finnish Environmental Istitute.

EX POST EVALUATION OF COHESION POLICY PROGRAMMES 2000-2006 CO-FINANCED BY THE EUROPEAN FUND FOR REGIONAL DEVELOPMENT (OBJECTIVES 1 AND 2) - WORK PACKAGE 5B: ENVIRONMENT AND CLIMATE CHANGE ADE
Regional Case Study – South Finland – October 2009 Page 21
3.3.2 Contributi on of the ERDF
The main challenging issues in South Finland were not in the scope of the regional OP. The state of the Baltic Sea is by far the most urgent environmental issue in South Finland but its pollution is mainly due to wastewater and farms in Russia and to agriculture nutrients, which are issues not covered by the OP. The same applies to urban problems where population density is high. These areas (Helsinki, Turku) were not covered by the ERDF as they are not objective 2. This explains why there has been no impact of the ERDF in terms of GHG emission reduction or air quality, as these issues are almost solely related to the Metropolitan area of Helsinki. These observations show the difficulty in dealing with pollution-related issues, using funds which are very geographically-targeted. The ERDF contributed to improvements in energy efficiency and renewable energy thanks to priority 1, even if it was not a strategic objective. This was especially the case in the area of Lahti, when cleantech SMEs are abundant and benefited from ERDF support in developing their business through internationalisation and innovation. However, in Kymenlaakso, these projects were to a large extent financed by the state as energy was one of its strategic priorities. The ERDF did not finance the construction of environmental infrastructure itself (with one exception, see below). One reason was the limited funds available. Moreover, the user/polluter-pays principle is strongly implemented in Finland and these projects are usually financed by local revenues. Instead, the ERDF was used as seed money and financed planning, feasibility studies and pilot projects. ERDF was implicated both in projects to build new environmental infrastructure (connection to isolated places) and in projects to upgrade existing infrastructure (Kymenlaakso and other projects to improve treatment for nitrogene removal). In terms of water supply and wastewater treatment, ERDF projects contributed to solving very specific problems in isolated areas, especially when the impact of the absence of connection to the municipal system was high in terms of pollution on strategic places such as catchment areas or drinking water reservoirs. The impact of these specific investments is localised and is so far difficult to assess and can certainly not be reflected in terms of connection rates. However, in Kymenlaakso, the ERDF was used to centralise the water network and this is the only example where the ERDF financed the construction of environmental infrastructure, beyond planning and pilot projects. As a result, the regional wastewater system now complies with the Urban Wastewater Directive. Many projects of rehabilitation are aimed at protecting and restoring areas linked to the Baltic Sea and the archipelago. However, no improvement in water quality was observed during the period but it is likely that the rate of worsening has been slowed. Regarding waste, the interventions of the ERDF were very limited and its contribution cannot be assessed.

EX POST EVALUATION OF COHESION POLICY PROGRAMMES 2000-2006 CO-FINANCED BY THE EUROPEAN FUND FOR REGIONAL DEVELOPMENT (OBJECTIVES 1 AND 2) - WORK PACKAGE 5B: ENVIRONMENT AND CLIMATE CHANGE ADE
Regional Case Study – South Finland – October 2009 Page 22
3.4 Contribution of the ERDF to regional economic development
3.4.1 Economic situation: trends over the programming period
There was no particular change during the 2000-2006 period regarding the economic situation of the region. Following strong growth at the end of the 1990s and early 2000s, the economy of the region, as is the case for the rest of Europe, was hit by the global slowdown. This is reflected by lower growth rates in 2002-03. However, this did not lead to an increase in unemployment, which remained stable at around 7%, and even slightly decreased during the remainder of the period. At local level, important changes appeared in the structure of the regional economy during the period. The most significant case concerns the area of Lahti, where, at the end of the 1990s, it was decided to develop polytechnics and the local units of the universities of Helsinki and Tampere. At the same time, research centres linked to these unversities were developed. They decided to focus on environmental business and research whereby Lahti is now the second most important centre for the environment in Finland, especially for environmental consultancy, recycling and research in renewable energy. Environmental business is now the main driver of the economy.
3.4.2 Contributi on of the ERDF
There has been a significant increase in environmental-related business activity in the region in the 2000-06 period, especially in clusters such as Lahti, but also in Kymenlaakso where eco-parks have attracted environmental SMEs. This was due to an increase in environmental awareness, environmental research, and increased cooperation between stakeholders. The ERDF contributed to all these developments, especially through priority 1, which aimed at supporting innovative business, including environment-related SMEs. As can be seen in table 6, the number of companies in the recycling and water sector increased during the 2002-2006 period. The increase in terms of people employed is less significant, especially in the water sector. This can be explained by the fact that priority 1 aimed at promoting innovation and new technologies but not employment. The most obvious impact is observed in Lahti which, with the support of the ERDF evolved from a low added value industrial town dependent on the Soviet Union to a high added value cleantech centre, based on close cooperation with universities and which attracts highly qualified workers from the Metropolitan area of Helsinki. The cleaning of Lake Vesijärvi, supported by the ERDF also played a part in attracting highly qualified workers and their families.

EX POST EVALUATION OF COHESION POLICY PROGRAMMES 2000-2006 CO-FINANCED BY THE EUROPEAN FUND FOR REGIONAL DEVELOPMENT (OBJECTIVES 1 AND 2) - WORK PACKAGE 5B: ENVIRONMENT AND CLIMATE CHANGE ADE
Regional Case Study – South Finland – October 2009 Page 23
Table 5: South Finland data – business statistics
Activities linked to the environment Sector 2002 2003 2004 2005 2006
Number of local units Recycling 42.0 41.0 50.0 49.0 59.0
Water (1) 88.0 98.0 106.0 112.0 136.0
Gross investment in tangible goods (in millions euros)
Recycling 10.5 5.5 3.5 5.3 10.6
Water (1) 66.2 88.7 75.5 51.3 113.6
Number of persons employed Recycling 231.0 307.0 354.0 394.0 513.0
Water (1) 1122.0 1221.0 1195.0 1003.0 1139.0
(1) Collection, purification and distribution of water Source: Eurostat
In Kymenlaakso, even though the centralisation of the water network did not aim at attracting companies, a biogas company has set up in Kotka with the aim of using the sludge from the central wastewater treatment plant. Google, which has recently decided to create a data centre in Kotka consider a reliable water supply system as a priority. Projects for rehabilitation of areas or environmental infrastructure in isolated areas had a local impact as they increased the attractiveness of the area for tourism and especially for summer houses. This is very important for the population in areas such as the archipelago in Uusimaa, as the main source of revenue is summer tourism. This also has an impact on real estate and construction, according to the beneficiaries and the managing authorities. However, it is still too early to assess the impact. Another important impact is the change of attitude among decision-makers. With ERDF funds, collaboration and a strategic approach between the different stakeholders (regional bodies, municipalities, private sectors, NGOs and inhabitants) has more importance, whereas with municipal funds, it is more of a case-by-case approach.
3.5 Contribution of the ERDF to improving the quality of life
The impact on the quality of life is not obvious as the main problems are located in the Metropolitan area of Helsinki or due to factors not covered by the ERDF (pollution from Russia and agricultural nutrients). The main changes in terms of quality of life concerned isolated habitations or summer houses which are now connected to the municipal system. Lake restoration and green area development have also improved the situation.


EX POST EVALUATION OF COHESION POLICY PROGRAMMES 2000-2006 CO-FINANCED BY THE EUROPEAN FUND FOR REGIONAL DEVELOPMENT (OBJECTIVES 1 AND 2) - WORK PACKAGE 5B: ENVIRONMENT AND CLIMATE CHANGE ADE
Regional Case Study – South Finland – October 2009 Page 25
Annex: Programme of the field study in South Finland (May 25th-29th 2009)
Monday 25.5. Tuesday 26.5. Wednesday 27.5. Thursday 28.5. Friday 29.5.
Morning Uusimaa Region Environment Centre and Regional Council of Uusimaa Hosts: Riitta Salasto and Ilkka Juva / Environment Centre of the Uusimaa Region, Eero Venäläinen / Regional Council of Uusimaa o Regional policies, strategies,
ERDF/environment in the region
o Project presentation: Underwater nature in Western Uusimaa Mikael Kilpi, Research Director, Novia / Åbo Akademi
Visit to the city of Lahti Host: Marja Koivula, Director of the Regional Council o Environmental issues
in programming o Project Aqua Vesijärvi
presentations by Mr. Heikki Hakala, Heikki Mäkinen and Pekka Koivisto
o ERDF-funding and sustainable environmental development
Visit to the city of Turku: o Meetings with
representatives of the Regional Council of Varsinais-Suomi, Environment Centre of Varsinais-Suomi and the Varsinais-Suomi Employment and Economic Development Centre
Visit to Region of Kymenlaakso o Regional Environment
Centre o Regional Employment and
Economic Development Centre
o Case projects
Afternoon Ministry of the Environment o Environmental
policies and strategies, role of EU and and EU funding, national coordination, etc. Pekka Jalkanen, Director
o Skåldö water supply project in the archipelago Kaj Malmberg, Chairman of the water association
o Byhamn – Development of the village harbour Niklas Wikström, Shopkeeper
Ministry of Agriculture and Forestry o Policies and strategies on
water resources management and water supply, role of ERDF funding, etc. Jaakko Sierla, Water Adviser
o Implementing and monitoring
o Project: Greenvironment, Timo Puukko, TE-keskus, Häme
o Project: Professor, Waste Management, Lahti Science and Business Park
o Experiences for the new programme period
Finnish Environment Institute o Environmental challenges in
Finland, R&D strategies and priorities Mikael Hilden, Director
o Regional Council of Kymenlaakso Juha Haapaniemi, Regional Development Director + various staff members and project managers


Ex post evaluation of cohesion policy programmes 2000-2006 co-financed by the European Fund for Regional Development (Objectives 1 and 2) – Work package 5b: Environment and Climate Change
RReeggiioonnaall ccaassee ssttuuddyy MMiiddii--PPyyrréénnééeess
October 2009
ADE s.a. Rue de Clairvaux, 40
B-1348 Louvain-la-Neuve Belgium
Tel.: +32 10 45 45 10 Fax: +32 10 45 40 99 E-mail: [email protected]
Web: www.ade.be


TThhiiss rreeppoorrtt hhaass bbeeeenn pprreeppaarreedd bbyy AADDEE aatt tthhee rreeqquueesstt ooff tthhee EEuurrooppeeaann CCoommmmiissssiioonn..
TThhee vviieewwss eexxpprreesssseedd aarree tthhoossee ooff tthhee CCoonnssuullttaanntt aanndd ddoo nnoott rreepprreesseenntt tthhee ooffffiicciiaall vviieewwss ooff tthhee EEuurrooppeeaann CCoommmmiissssiioonn..
RReepprroodduuccttiioonn oorr ttrraannssllaattiioonn iiss ppeerrmmiitttteedd,, pprroovviiddeedd tthhaatt tthhee ssoouurrccee iiss dduullyy aacckknnoowwlleeddggeedd aanndd nnoo mmooddiiffiiccaattiioonnss ttoo tthhee tteexxtt aarree mmaaddee..


EX POST EVALUATION OF COHESION POLICY PROGRAMMES 2000-2006 CO-FINANCED BY THE EUROPEAN FUND FOR REGIONAL DEVELOPMENT (OBJECTIVES 1 AND 2) - WORK PACKAGE 5B: ENVIRONMENT AND CLIMATE CHANGE ADE
Regional Case Study – Midi-Pyrénées – October 2009 Table of Contents
Table of Contents ACRONYMS
SUMMARY – KEY MESSAGES FROM THE MIDI-PYRÉNÉES CASE STUDY
1. STATUS AND FEATURES OF THE REGION .............................................................. 1
1.1 ECONOMIC SITUATION (IN 2000) .................................................................................... 1 1.2 ENVIRONMENTAL SITUATION (IN 2000) ........................................................................ 3 1.3 INSTITUTIONAL SET UP AND POLICY MAKING PROCESS ............................................... 4
1.3.1 Regional development .............................................................................................. 4 1.3.2 Environmental sector ............................................................................................... 4
2. REGIONAL POLICIES AND THE ROLE OF THE ERDF ........................................... 7
2.1 ECONOMIC POLICIES ......................................................................................................... 7 2.2 ENVIRONMENTAL POLICIES AND CONTRIBUTION OF THE ERDF ............................. 8 2.3 ACTIONS TAKEN ................................................................................................................ 9
3. ANALYSIS OF THE ERDF CONTRIBUTION .......................................................... 15
3.1 RELEVANCE OF THE 2000-2006 ERDF STRATEGY IN THE ENVIRONMENTAL SECTOR FOR ENHANCING TERRITORIAL DEVELOPMENT ........................................... 15 3.2 QUALITY OF THE PLANNING AND IMPLEMENTATION PROCESS IN MEETING REGIONAL CHALLENGES IN THE COVERED FIELDS .................................................... 15 3.3 ENVIRONMENTAL TRENDS AND CONTRIBUTION OF THE ERDF IN IMPROVING THE ENVIRONMENTAL SITUATION ................................................................................ 16 3.4 ECONOMIC TRENDS AND THE CONTRIBUTION OF THE ERDF TO REGIONAL ECONOMIC DEVELOPMENT ............................................................................................ 20
ANNEX - LIST OF INTERVIEWED PERSONS .................................................................. 23
LIST OF FIGURES
FIGURE 1 : MAP OF MIDI-PYRÉNÉES (FRANCE) ...................................................................... 1
LIST OF TABLES
TABLE 1: ENVIRONMENTAL MEASURES : APPROVED EXPENDITURES 2000-2008 (“PROGRAMMÉ”) ............................................................................................................. 10 TABLE 2: MAIN OUTPUT AND RESULT INDICATORS (*) .......................................................... 11 TABLE 3: EVOLUTION OF THE ENVIRONMENTAL SITUATION BETWEEN
2000 AND 2006 ............................................................................................................ 17 TABLE 4: SOCIO-ECONOMIC TRENDS ....................................................................................... 20 TABLE 5: TRENDS AT LOCAL LEVELS ........................................................................................ 21 TABLE 6: REGIONAL DATA – BUSINESS STATISTICS ................................................................ 22


EX POST EVALUATION OF COHESION POLICY PROGRAMMES 2000-2006 CO-FINANCED BY THE EUROPEAN FUND FOR REGIONAL DEVELOPMENT (OBJECTIVES 1 AND 2) - WORK PACKAGE 5B: ENVIRONMENT AND CLIMATE CHANGE ADE
Regional Case Study – Midi-Pyrénées – October 2009 Acronyms
Acronyms
SDAGE Schéma Directeur d’aménagement et de gestion des eaux
ERDF European Regional Development Fund
OP Operational Programme
EC European Commission
CPER Contrat Plan Etat-Region


EX POST EVALUATION OF COHESION POLICY PROGRAMMES 2000-2006 CO-FINANCED BY THE EUROPEAN FUND FOR REGIONAL DEVELOPMENT (OBJECTIVES 1 AND 2) - WORK PACKAGE 5B: ENVIRONMENT AND CLIMATE CHANGE ADE
Regional Case Study – Midi-Pyrénées – October 2009 Summary
Summary – Key messages from the Midi-Pyrénées case study The Midi-Pyrénées Region, located in south-west of France, is one of the largest Objective 2 regions of the country. The main regional issue was to ensure balanced development between all of the territories. There are indeed strong contrasts in the region, with on the one hand the attractive and dynamic agglomeration of Toulouse, and on the other hand, rural, semi-rural and mountainous areas which had encountered demographic problems with declining agriculture and traditional small industries. Midi-Pyrénées region was also lagging behind in implementation of water and waste directives.
The objective to support local development as a priority through the ERDF constitutes the key to understand the 2000-2006 programmes in Midi-Pyrénées and has driven the whole programming chain from strategy set-up to programme results. The strategy was thus deliberately open in order to give local bodies the necessary tools to lead their own territorial strategy.
The specific measure dedicated to environment represented 9% of ERDF contribution. Beyond that measure, programme intended to introduce the environment as a horizontal priority by introducing specific actions within other territorial and sector measures. But this possibility was not really seized by the actors.
The trends of the main regional socio-economic indicators during the period 2000-2006 were very positive, in higher proportion than national tendencies. But the most important changes were observed in rural territories targeted by Objective 2. Indeed, the decline tendencies observed before 2000 in these territories were reversed during the programming period. Even if the amounts remained limited (ERDF represented 0.01% of regional GDP), the ERDF took part in the general effort of investment in priority in these (semi-)rural territories in order to reinforce regional cohesion.
During the period 2000-2006, the Objective 2 programme mainly contributed to equip and consolidate rural territories, in particular in the fields of waste sorting and nature protection. The ERDF has also contributed to accelerating investments to reduce the delays occurring in the Midi-Pyrénées Region, in particular in the waste and water fields. In terms of waste, the ERDF effort focused to complete the local networks of waste sorting collection centres and has thus significantly contributed to reduce the gap compared to the national average. In the water field, intervention of the ERDF mainly focused on water treatment in small and average-sized towns. But, the role that the ERDF has played in water sector was limited since it represented less than 1% of the expenditure of the 3 main funders of the sector. This contribution was also limited in comparison to the demographic evolution during the period.
However, according stakeholders, there was no strong environmental awareness during this programming period, as illustrated notably by : (a) the decision to reduce the budget dedicated to the environmental measure at the time of mid-term review, (b) the weak mobilization of other actors on the opportunity to integrate projects with a strong environmental dimension under other measures of the OP and (c) no real use of the sustainable development analysis grid in project selection.. The implementation modes, the budget dispersion among a wide range of actions and the absence of a strong environmental vision did not allow the emergence of significant business activities or actions which could have a strong demonstrative effect. The private sector was indeed not really involved in the environmental part of the programme.


EX POST EVALUATION OF COHESION POLICY PROGRAMMES 2000-2006 CO-FINANCED BY THE EUROPEAN FUND FOR REGIONAL DEVELOPMENT (OBJECTIVES 1 AND 2) - WORK PACKAGE 5B: ENVIRONMENT AND CLIMATE CHANGE ADE
Regional Case Study – Midi-Pyrénées – October 2009 Page 1
1. Status and features of the region This case study report is based primarily on monitoring reports and raw monitoring data, stakeholders’ views and other elements collected during interviews with actors and the analysis of the evaluator. As the EC is fully in charge of ex-post evaluation according regulation for 2000-2006 period, the management authority recalls that it did not carry out any specific ex-post analysis or systematic validation of the monitoring data for supporting an evaluating judgement.
1.1 Economic situation (in 2000)
The Midi-Pyrénées Region, located in the South West of France, is one of the largest regions in France (45,348 km2, 8.3% of national territory). It is made up of 8 departments and has approximately 2.8 million inhabitants. The population density at this time was 55 inhabitants/km2, compared to a national average of 105 inhabitants per km2.
Figure 1 : Map of Midi-Pyrénées (France)

EX POST EVALUATION OF COHESION POLICY PROGRAMMES 2000-2006 CO-FINANCED BY THE EUROPEAN FUND FOR REGIONAL DEVELOPMENT (OBJECTIVES 1 AND 2) - WORK PACKAGE 5B: ENVIRONMENT AND CLIMATE CHANGE ADE
Regional Case Study – Midi-Pyrénées – October 2009 Page 2
The region is characterized by strongly contrasting territories. On one hand there is the attractive and dynamic agglomeration of Toulouse (and its basin of employment representing 50% of regional employment) which concentrates most of the advanced technology industries (in particular, aerospace centre with Airbus Industry) and employment opportunities. On the other hand, there are the remaining, mostly rural, areas including intermediate and small towns, vast agricultural areas (Agriculture occupies 54% of the regional territory), woods and enclosed mountain areas (the Pyrenees and south part of the Massif Central). Most of these rural areas had encountered demographic problems with declining agriculture and traditional small industries (i.e.: textile, coal, mechanical or wood industries). But, from the diversity of their landscapes, the climate and the quality of the environment, these rural and mountain areas kept an important attractiveness notably for tourism activities. The regional economy is characterised by : a weakness of its added value, in particular in the traditional sectors of industry (food,
wood, textile, mechanical sectors) which suffered from increasing international competition; companies of a size lower than the national average and few companies in the medium
size range; the absence of significant decision-making centres; an opening to international markets concentrated on few large and highly competitive
entities; a significant level of R&D expenditure (3.2%), but also concentrated mainly in a limited
number of sectors such as aerospace. Despite of difficult conditions (95% of agricultural surfaces classified in mountain or less favoured areas, structural hydrous deficit, soils with weak potential), agriculture remained a significant sector at the regional level (6.5% of regional employment), based on a traditional family model with small structures. The industrial sector accounted for only 20% of the regional added value and 22% of employment. In the tertiary sector (71% of regional employment), tourism presented a significant growth potential. In such a contrasting region from a physical point of view as well as from a socio-economic one, the main regional issue was thus to ensure a balanced development between all of the territories.
Maps of the main companies (number of employees)

EX POST EVALUATION OF COHESION POLICY PROGRAMMES 2000-2006 CO-FINANCED BY THE EUROPEAN FUND FOR REGIONAL DEVELOPMENT (OBJECTIVES 1 AND 2) - WORK PACKAGE 5B: ENVIRONMENT AND CLIMATE CHANGE ADE
Regional Case Study – Midi-Pyrénées – October 2009 Page 3
1.2 Environmental situation (in 2000)
The Midi-Pyrénées Region benefits overall from a high quality environment with vast, rich and diversified natural assets (in terms of species and natural surroundings). In order to preserve it, a significant part of the regional territory (12.7%) is classified as a protected zone (national or regional natural parks, reserves, etc.). The region does not encounter major problems in terms of industrial pollution. The vastness of the territory and the low density of population in some zones, in particular mountainous zones, makes the environmental infrastructures more complex and expensive. In 2000, the diagnosis also underlined a lack of thorough knowledge and monitoring tools of these regional natural assets.
Water supply and wastewater treatment
In 2000, almost all of the population had access to a water supply and sewerage system in the region. The main stakes lay in the quality of water as well as in the availability of the water resources at certain periods of the year. The drinking water supply was not an issue. With less than 48% of surface water satisfying at the good ecological state, the region was lagging behind in requirements for the European directive. The origins of pollution were mainly related to the significant agricultural activity (diffuse pollution due to breeding effluents, intensive practices and pesticides) and to the insufficient purification of municipalities. The region did not face significant problems of industrial pollution, except those related to old wool industries. The environmental effect of the additives necessary for creating artificial snow in ski resorts still remains ignored. The region also meets a total water deficit during the summer, in particular due to an unequal distribution of the water resources among the regional territory and the significant removal for irrigation (notably for corn). Without in being the cause, hydrous imbalances and the severe low water levels of some rivers worsen the consequences of diffuse pollution. The last stake relates to knowledge, in particular in terms of subsoil waters and ecological quality going beyond the physicochemical state.
Solid waste
At the beginning of programming period, the region showed a significant delay in terms of collective waste management from the point of view of households and companies. In 2000, the household waste generation rate was higher in Midi-Pyrénées (390kg/capita) compared to the national average (354 kg/capita). Waste sorting was insufficiently developed as only 20% of households practised it and 60% of household waste was landfilled (compared to 55% as a national average). The Midi-Pyrénées Region was still far from the rates of valorisation envisaged and lagged behind compared to its own “Schéma regional de collecte des déchets ménagers,” in particular on the network of waste sorting collection centres (68 of the 200 envisaged). In 1998 the region produced approximately 2 million tons of waste per year which was made up of the following: 46% domestic waste, 44% banal industrial waste (of which 43% of

EX POST EVALUATION OF COHESION POLICY PROGRAMMES 2000-2006 CO-FINANCED BY THE EUROPEAN FUND FOR REGIONAL DEVELOPMENT (OBJECTIVES 1 AND 2) - WORK PACKAGE 5B: ENVIRONMENT AND CLIMATE CHANGE ADE
Regional Case Study – Midi-Pyrénées – October 2009 Page 4
wood was revalorised), 10% special industrial waste and 0.8% collected green waste. The rate of equipping the region remained insufficient, with 41 waste sorting collection centres and 40% of the population covered. The recycling sector was weakly developed.
Air and renewable energy
The Midi-Pyrénées Region did not encounter a particular problem in terms of air pollution, except on three known industrial sites (1 paper mill and 2 sites of plastic reprocessing). It can nevertheless become more sensitive in the large agglomerations where pollution due to transport, domestic heating and industries is increasing. GHG emission was not a significant issue in 2000. Except in hydroelectric energy, renewable energies were not really developed although the region benefited from a huge potential in areas such as wood, solar, geothermic, wind or agro potentials. The share of renewable energy sources was not significant. Energy efficiency, particularly in social housing, remained problematic. The user and polluter-pays principles were both fully applied in the region.
1.3 Institutional set up and policy making process
1.3.1 Regional development
France has traditionally been a highly centralised country but is now progressively moving towards decentralisation. Economic development is an area where regions can play a significant role. Since 2004, regions have been given the possibility of establishing a Regional Economic Development Plan (Schéma Régional de Développement Economique). More generally, coherence between the national and the regional plans is ensured through a State/Region Planning Contract (Contrat de plan Etat/Region, or CPER) which was established 7 years ago. These CPERs form the bases that specify the projects to be conducted and define the funding share for the state and the region. In addition, the CPERs are established in line with the European Structural Funds, defined for each region via the Operational Programme (OP).
1.3.2 Environmental sector
The Ministry of Ecology, Energy, Sustainable Development and Territorial Planning (MEEDDAT) is represented at the regional level by the DREAL1, the Regional State Authority for the Environment, Territorial Planning and Housing. The DREAL, under the authority of the regional prefect, develops and implements in the region the State policy in the field of the environment and sustainable development. The role of local authorities is very important in two key environmental sectors, namely, waste and water management.
1 Direction Régionale de l'Environnement, de l'Aménagement et du Logement in French

EX POST EVALUATION OF COHESION POLICY PROGRAMMES 2000-2006 CO-FINANCED BY THE EUROPEAN FUND FOR REGIONAL DEVELOPMENT (OBJECTIVES 1 AND 2) - WORK PACKAGE 5B: ENVIRONMENT AND CLIMATE CHANGE ADE
Regional Case Study – Midi-Pyrénées – October 2009 Page 5
Waste management
Waste is managed by the municipalities. It includes waste collection, transportation, storage, sorting, and energy and material recovery. This management can be either transferred to a public office in which several municipalities are represented, or performed by a private company (through contracting) or through a private-public partnership. In the solid waste sector, private companies held 62% of the collection market and 90% of the household waste treatment market in 2005. To recover the costs of waste management, local bodies collect taxes from the various users (households, institutions, companies, etc.). Other financial instruments are also used to complement the tax revenues: Receipts from the sale of the sorted material and from energetic waste valorisation. Financial support from the green dot organisations or Producers’ Responsibility
Organisations (PRO)2 involved in the waste collection. Public subsidies from the State or other public institutions such as ADEME3, the
French Environment and Energy Management Agency.
Water management
In France, local bodies4 (municipalities or group of municipalities) are responsible for ensuring the drinking water supply and wastewater treatment. Local bodies can choose between 2 types of management for delivery of the water supply and wastewater treatment: direct management (internal) or contracting a private operator (this second option has been chosen by 55% of municipalities and three-quarters of the French population). Direct management is the predominant option only in settlements of less than 400 inhabitants. In any case, the water supply and treatment installations are owned by the local bodies. Local bodies can be financially supported by the local Water Agency (Agence de l’Eau)5. In Midi-Pyrénées, the Water Agency concerned is the Agence de l’Eau Adour-Garonne. The Water Agencies also set-up the global strategy for water policy in close dialogue with the all bodies related to water sitting at the Basin Committee6, a wide consultative body associated with the water agency. 2 These organisations, called Eco-organismes in French, take responsibility on behalf of their members (producers) for the
collection and recycling of waste. They are registered with public authorities and are non-profit organisations.
3 Agence de l'Environnement et de la Maîtrise de l'Energie in French
4 Collectivité locale in French
5 In France, there are six water agencies corresponding to the six major river basins. Water Agencies are public institutions supervised by MEEDDAT and the Ministry of Economy and Finance. In each region, the local Water Agency establishes taxes for water supply and treatment paid by the user for each m3 of water consumed by households, farmers (irrigation) or industries. Local water agencies are free to set up the taxes level as long as it remains under the maximum threshold set up by the National Water Law (Loi sur l’Eau). The Water Agencies collect the taxes and in return contributes to the funding of projects in the water sector.
6 Regional, departmental and local elected representatives, consumer organisation representatives, NGOs and State representatives are gathered within basin committees (Comités de bassin). Basin committees define the main axis of the global strategy for water policy at the basin scale. Basin committees also define the types of actions undertaken by the local Water Agency (Agence de l’Eau) and take part in decisions concerning the use of the Water Agency funds. At the national level, the National Water Committee (Comité National de l’Eau) gathers representatives of all types of stakeholders (consumer organisation representatives, elected representatives, presidents of basin committees, and the central government). This institution is involved in setting up the national strategy for water policy


EX POST EVALUATION OF COHESION POLICY PROGRAMMES 2000-2006 CO-FINANCED BY THE EUROPEAN FUND FOR REGIONAL DEVELOPMENT (OBJECTIVES 1 AND 2) - WORK PACKAGE 5B: ENVIRONMENT AND CLIMATE CHANGE ADE
Regional Case Study – Midi-Pyrénées – October 2009 Page 7
2. Regional policies and the role of the ERDF
2.1 Economic policies
The regional development strategies had the following general objectives:
Organizing and structuring of the territories: to support a better distribution of people and activities among territories based on regional buoyant and excellence sectors and the dynamics of Toulouse agglomeration, by supporting logics of development of the urban and rural territories and opening up isolated zones.
Reinforcement of cohesion: to accompany the economic changes in order to manage a sustainable transition between the traditional sectors in reconversion and those carrying new dynamics, in particular in the fields of the environment, tourism, new technologies and services in order to create jobs.
To meet these objectives, the decision was taken at the end of the 1990’s to promote local development by firstly supporting local territories. The aim was to contribute to the regrouping of municipalities and other territorial bodies around integrated local development projects. It has been decided in France that the ERDF would firstly contribute to supporting the projects emanating from local territorial bodies (Municipalities, Regional Natural Parks, “Pays”, Departments, etc.). This approach at local level was basically different of the current logic based on results and structuring projects. The strategy was thus deliberately open in order to cover a wide range of fields of competence and stakes associated with different levels of power, and more specifically to the local authorities. The objective was to give local bodies the necessary tools to lead their own territorial strategy. From this point of view, the OP strategy was based on a very wide consultation of all the local actors who could express their own needs and expectations. As result, the OP covered a wide range of actions, but also appeared to be a very dispersed and split up programme. Indeed, 23 measures, 75 sub-measures and 110 groups of actions for more than 12,000 operations/projects were programmed during the 2000-2006 period. The financial allowances between these measures did not clarify the hierarchy of regional priorities and stakes. The ERDF was above all viewed as an additional source of financing for supporting local projects implemented within the sectoral plans and into the general regional strategy, without enough clear specific priorities. Finally, it must also be mentioned that except for certain areas in difficulty, the agglomeration of Toulouse was not eligible for the Objective 2 programme.

EX POST EVALUATION OF COHESION POLICY PROGRAMMES 2000-2006 CO-FINANCED BY THE EUROPEAN FUND FOR REGIONAL DEVELOPMENT (OBJECTIVES 1 AND 2) - WORK PACKAGE 5B: ENVIRONMENT AND CLIMATE CHANGE ADE
Regional Case Study – Midi-Pyrénées – October 2009 Page 8
2.2 Environmental policies and contribution of the ERDF
The objectives of the environmental policy at the regional level remained rather general and open. This has been reflected in the OP which aimed to support different sectoral or local plans defined at the different levels of competencies. Almost all environmental fields were open to support within the framework of the sectoral action plan. In the field of solid waste, the OP fell under the regional and departmental plans of management of waste (sub-measure 13.3) which integrates the national and community orientations. The specific objective was to improve management of domestic waste at the source by increasing household awareness and supporting the development of sorting, recycling and revalorization. The policy of water is laid down through management and master development plans of water (SDAGE 7 ). This document, which integrates in particular the national and Community orientations and requirements, has legal status. Decisions of all actors related to water must be in accordance with this programme for water. The ERDF represents a very small share of public spending in water sector (less than 1%) The OP fell under this policy while concentrating on the SDAGE priority programmes and areas. The objective of OP (sub-measure 13.2) was to take part in the cleaning up of surface water and soils in territories where pollution had been identified and was to be solved in priority, in particular to support the economic development and touristic activities. In the economic and enterprises fields, the OP included two specific actions (Actions 13.7 a & b). The first aimed at promoting "sober and clean" processes of production as well as supporting experimentation and innovation for the creation of new activities and new products in the field of the environment. The second aimed at accompanying enterprises and local bodies to integrate environmental management or environmental certification (ISO 14000, EMAS) under the enterprise environmental plan (plan environnemental des entreprises –PEE). The OP also intended to promote the development of renewable energies (Action 13.7 c) in order to contribute to fight GHG emissions and to develop economic activities in the rural areas with the will to involve the private sector in this field. These actions also fit into the Regional Plan of improvement of the quality of the air (PRAQA). In the field of the environment, the OP also aimed: to develop and to improve the monitoring and the control of water and air (sub-measure 13.1) to protect inhabited places and areas of activity against major natural risks (sub-measure 13.4) to maintain and restore the quality of the natural and landscape assets (sub-measure 13.5)
7 SDAGE – « Schémas directeurs d’aménagement et de gestion des eaux ». Instituted in 1992, the SDAGE is an instrument of
planning. It fixes for each basin the main orientations of a balanced management of the water resource in the general interest and the respect of the principles, the environmental objectives and the cost recovery modalities according to the use of water. It also defines necessary developments to satisfy these objectives.

EX POST EVALUATION OF COHESION POLICY PROGRAMMES 2000-2006 CO-FINANCED BY THE EUROPEAN FUND FOR REGIONAL DEVELOPMENT (OBJECTIVES 1 AND 2) - WORK PACKAGE 5B: ENVIRONMENT AND CLIMATE CHANGE ADE
Regional Case Study – Midi-Pyrénées – October 2009 Page 9
to support thematic animations in order to facilitate the emergence of environmental protection projects. (sub-measure 13.6)
Beyond this specific measure dedicated to the environment (measure 13), the programme intended to introduce the environment as an horizontal priority by introducing specific actions with an environmental dimension into other sectoral measures (i.e. sub-measure 1.2 - landscape and environmental insertion into the transport measure 1) or territorial measures which aimed to support integrated local projects (Priority II, measure 6, 7 and 8). For instance, it was the case for the specific sub-measure for protection and improvement of the environment (sub-measure 6.3) in urban areas in difficulty and the agglomerations (i.e. with envisaged actions such as environmental management, urban building waste, opening spaces, urban pollution and health, innovation in energy saving and renewable energies, etc.). It should finally be underlined that the OP does not present any quantified objective related to the environment.
2.3 Actions taken
It should initially be underlined that almost all of the projects with environmental vocation were carried out under the only measure dedicated to the environment (measure 13). The possibility offered by the OP to integrate projects having a strong environmental dimension under territorial or sectoral measures was not really seized by the actors. For instance, the sub-measure dedicated to protecting and improving the environment in urban areas (sub-measure 6.3) only counts one project (over 172 projects for measure 6, representing less than 0.8% of programmed amounts for this measure) aimig to improve external spaces in two urban areas. The environmental and landscape insertion part of the measure related to transport (measure 1) includes only one operation of landscape valorisation. On the other hand, this transport measure supported several small cycle paths (23 equipments and 3 studies) under the action of diversification of the transport modes (sub-measure 1.3). The ERDF budget for the environmental measure (measure 13) was reduced by €5 million (13% of the initial budget), at the time of the mid-term review in profit of territorial measures (measures 6, 7 and 8) on which the local actors had been strongly mobilized. Finally, the ERDF contribution to environmental measures was €33 million, which represents 9% of programme’s total ERDF budget. The financing structure of the environmental measure illustrates perfectly the will to focus on local initiatives and the role local bodies had to play: the ERDF contributed 24% of the budget while 10% was brought forward through the State budget, 5% by the Regional budget, 8% by the private sector and finally 52% by local bodies or other public actors (Water agency, etc.). It was not possible to obtain reliable financial data to estimate the weight of the ERDF in the total budgets devoted to environmental infrastructures due to the number and the diversity of funders in this sector. However, firstly, the ERDF contribution to environmental measures represents around €2 per inhabitant per year. The average GDP in 2006 was around €26,200 per inhabitant in the Midi-Pyrénées Region. Secondly, in the field of water, as an illustration, the annual

EX POST EVALUATION OF COHESION POLICY PROGRAMMES 2000-2006 CO-FINANCED BY THE EUROPEAN FUND FOR REGIONAL DEVELOPMENT (OBJECTIVES 1 AND 2) - WORK PACKAGE 5B: ENVIRONMENT AND CLIMATE CHANGE ADE
Regional Case Study – Midi-Pyrénées – October 2009 Page 10
costs of the 3 main funders can be roughly estimated8 at around €100 million per year. The budget dedicated to water infrastructure in OP (sub- measure 13.2) represents €3.6 million per year, of which the ERDF amounts to €0.7 million per year. The ERDF contribution is therefore objectively very limited in the water sector in terms of financial volume (less than 1%). During interviews, two remarks were made to moderate this observation: First, in water sector for instance, main parts of the expenditures are fixed because
corresponding to necessary investments or recurrent expenditures of maintenances. The discretionary part of these expenditures being generally small, the ERDF can represent a more significant share of the flexible part of these budgets that can be used for developing new projects or initiatives.
European financing has contributed to the carrying out of interventions in sectors or for actors who did not have always sufficient financial capacities (declining industrial sectors in case of pollution, small local communities, etc) by reducing the percentage that these entities has to support. Table 1: Environmental measures : approved expenditures 2000-2008
(“Programmé”)
Sub-measure Field of intervention Total ERDF (EUR)
% of each sub-measure
Total sub-measure
(EUR)
% of ERDF
funding
13-1 Measures concerning follow-up and control 344 Drinking water (collection, storage,
treatment and distribution) 267 840 1% 844 508 32%
13-2 Depollution of urban wastewater and industrial sites
345 Sewerage and purification 4 146 010 13% 20 572 416 20%
351 Upgrading and rehabilitation of industrial sites
13-3 Development of waste sorting, treatment, recycling and valorisation
343 Urban and industrial waste 9 547 900 29% 59 458 258 16%
13-4 Prevention of major natural risks 34 Other environmental infrastructures
5 167 390 16% 17 957 539 29%
13-5 Preservation and valorisation of the natural environment
353 Protection, improvement and regeneration of the natural envir.
12 491 800 38% 30 306 780 41% 1312
Preservation of the environment in connection with land, forestry and landscape conservation
13-6 Thematic animations 353 Protection, improvement and regeneration of the natural environment
436 510 1% 600 081 73%
13-7 Supporting innovation in the field of environment and renewable energy
152 Environment-friendly technologies, clean and economical energy technologies
1 059 780 3% 5 518 540 19%
332 Renewable sources of energy (solar power, wind power, hydro-electricity, and biomass)
Total Environmental measure 33 117 230 100% 135 258 125 24% Sources: Managing authority based on Presage
8 These data present only a rough estimation of the current situation. It was not based on precise and checked data but
discussed during an interview. It is provided only as an illustration in order to give an idea of ERDF contribution. Estimation: Water agency € 200 million per year, including approximately a third for the Midi-Pyrenees Region (either € 66 million per year), Departement (“Conseils Généraux”) € 3 to 4 million per year * 8 departments (or approximately € 30 million per year), Region (Conseil regional) approximately € 3 million per year. Estimated total of € 100 million per year are currently invested in water.

EX POST EVALUATION OF COHESION POLICY PROGRAMMES 2000-2006 CO-FINANCED BY THE EUROPEAN FUND FOR REGIONAL DEVELOPMENT (OBJECTIVES 1 AND 2) - WORK PACKAGE 5B: ENVIRONMENT AND CLIMATE CHANGE ADE
Regional Case Study – Midi-Pyrénées – October 2009 Page 11
As can be seen in table 1, 38% of ERDF resources were used for preserving and valorising the natural environment. Around 55% was devoted to environmental infrastructures among which waste facilities have been the most important. It reflected the balance that authorities were looking for between hard and soft interventions: the objective was also to change behaviour by covering territories and not only to increase public facilities. In the field of solid waste, the sub-measure 13.3 aimed to support implementation of regional and departmental plans, in particular by promoting the development of sorting, treatment, recycling and valorisation of waste. One of the finalities was notably to develop units of valorisation ensuring jobs and economic development. During the 2000-2006 period, 112 projects were programmed, including 69 local waste sorting collection centres, 9 main waste centres, 18 units of valorisation of waste, 5 transfer installations, 4 centres of storage of ultimate waste, 10 studies and 9 operations of information and public awareness. The ERDF thus focused on the improvement of the management of waste to the source by supporting mainly the selective collection of waste, which infrastructure is a responsibility falling primarily on the municipalities. The upstream operations of increasing public and company awareness and the downstream operations of waste revalorization remained less significant in the Objective 2 programme.
Table 2: Main output and result indicators (*)
Sub-measure Created jobs (*)
Main-tained jobs (*)
Indicators Program-med (*)
Achieved value (*)
13-2
Depollution of urban wastewater and industrial sites
3 267
Number of projects regarding investments in urban wastewater infrastuctures 16 15
Additional population served by wastewater projects 30,510 33,510 Number of municipalities served by wastewater projects 20 20
13-3
Development of waste sorting, treatment, recycling and valorisation
(278) 135
Number of projects concerning waste management studies 16 14
Number of projects concerning investments in waste infrastructures
80 79
Number of sorting centres created 69 69 Number of municipalities served by solid waste projects
(3,574) (3,551)
Population affected by waste sorting (1,613,876) (1,595,291)
13-7
Supporting innovation in the field of the environment and renewable energy
1 8
Number of projects providing support in certification initiatives 13 14
Number of companies supported for their environmental management initiatives
87 106
Number of projects in wood energy 21 16 Tonnes of carbon dioxide avoided 2,162 1,885 Number of municipalities served by renewable energy projects 213 192
Number of companies supported in the field of renewable energy 77 23
Source : SGAR sur extraction de Présage. (*): Note: the data on realisation and results are raw data extracted from the monitoring data base (”Presage”) of the programmes as they were encoded by each service. These data are given only as an indication because since 2005, they have not been systematically checked and validated by the managing Authority of the programme. Double counts are possible (i.e. the number of municipalities served by solid waste projects is higher than the number of municipalities in the region)

EX POST EVALUATION OF COHESION POLICY PROGRAMMES 2000-2006 CO-FINANCED BY THE EUROPEAN FUND FOR REGIONAL DEVELOPMENT (OBJECTIVES 1 AND 2) - WORK PACKAGE 5B: ENVIRONMENT AND CLIMATE CHANGE ADE
Regional Case Study – Midi-Pyrénées – October 2009 Page 12
Since 2005, the initial budget of waste sub-measures has been used in full. Thus, during the last years of programming, it was decided that the remaining budget measure 13 would be firstly allocated to investments in the field of waste. This decision was notably justified by the delays in the implementation of waste plans and the risk that certain investments could not longer be financed after 2007. The success of the sub-measure is also explained by a clear community and national framework, closer delays in meeting requirements and the will to involve the departmental authorities, having coordination and supervision competences in the field of domestic waste, in the implementation of the programme and the project selection process. Finally, the projects carried out in touristic sites have benefited from a more particular attention. Indeed, even if it remained marginal, a higher priority was given and additional financial efforts were made in touristic sites to ensure a better integration in the landscape of projects. In the field of water, the improvement of the quality of water was one of the main priorities of the SDAGE. The objective of the OP in the field of water (sub-measure 13.2) was to take part in the cleaning-up of surface and ground water in the priority zones defined by the SDAGE. Actions were implemented at 2 levels:
Firstly, the OP supported studies and investments on the cleaning-up of urban waste water in agglomerations of 2,000 to 15,000 equivalent inhabitants (and of connected industries) targeted by the European directive. The action was geographically limited to the priority zones of the SDAGE and to the zones sensitive to eutrophication.
Secondly, the OP also supported diagnoses and the investments of the cleaning-up of the liquid dumping and polluted grounds of industrial origin. One of the main projects carried out was a historical inventory of the old industrial sites with regional incidence.
In 20 municipalities, a total of 24 equipment projects and 4 studies have benefited during the period of ERDF support for a total amount of €4.16 million (€20.5 Million total cost) allowing for the increase in the population served by wastewater projects by more than 30,000 equivalent inhabitants (which represents 1% of the regional population, but the population of the region has also increased by 9% during the period). This sub-measure also aimed to support research projects improving cleaning–up technologies, but no project was implemented within this framework. Action was also not envisaged within the framework of the ERDF on the significant stake of the water resource (quantity). In the economic and renewable energy fields, the initial diagnosis had shown that environmental and energetic performance was likely to become a major competitive asset for the regional SMEs. This not only from the point of view of the reduction of production costs but also of the development of new processes and products and of the development of renewable energy production. It was also true for local public bodies. In this field (sub-measure 13.7), the ERDF contributed to the implementation of 54 projects for an ERDF figure of €1 million, which represents only 3% of the budget for environmental measure 13. The financing demand within this sub-measure was higher than the restricted budget allocated at the time of mid-term review. The projects fall under 3 types of actions :

EX POST EVALUATION OF COHESION POLICY PROGRAMMES 2000-2006 CO-FINANCED BY THE EUROPEAN FUND FOR REGIONAL DEVELOPMENT (OBJECTIVES 1 AND 2) - WORK PACKAGE 5B: ENVIRONMENT AND CLIMATE CHANGE ADE
Regional Case Study – Midi-Pyrénées – October 2009 Page 13
The promotion of “sober and clean” processes of production and to support experimentation and innovation for the creation of new activities and new products in the field of the environment : This action has supported three studies on energy efficient processes and four projects for increasing company awareness (exhibition, animation, etc.), but no equipment investment. Within this action, three communes and six companies were supported.
The accompanying of enterprises and local bodies in integrating environmental management and/or environmental certification (ISO 14000, EMAS): four projects were supported to accompany 106 enterprises, of which 16 have obtained their environmental management certification. No public body have finally beneficiated of this action, even if they were also targeted.
The supporting of the renewable energy development (local wood energy, solar thermic, photovoltaic, wind, biofuel, biogas, geothermics, etc.) : This action has mainly supported the emergence of a wood energy sector (21 projects out of 43) which has been contributed during the period to avoid 2,162 tons of emission (CO2, NO2). The development and the structuring of this wood energy sector was a priority for the region, which has abundant wood resources and a potential of forest labour forces. This action has contributed to 19 collective heating networks.
In other environmental fields, the OP also aimed:
to develop and improve the monitoring and the control of water and air (sub-measure 13.1) : 10 projects – 1% of the environmental measure 13 – Mainly studies and equipment (104 installations) of measurements relating to the water quality.
to protect inhabited places and the activity areas against major natural risks (sub-measure 13.4) : 16% of the environmental measure 13 – Mainly studies and public work of flood and landslide prevention concerning more than 120,000 inhabitants.
to maintain and restore the quality of the natural and landscape assets (sub-measure 13.5) : 506 projects – 38% of the environmental measure 13 on five types of actions : 1) improvement of knowledge and the knowledge to create (76 projects), 2) information and public awareness (200 projects), 3) management of the milieu (131 projects), 4) the animation of the contracts of rivers (35 operations), 5) restoration of migrating fish (64 projects),
To support thematic animations in order to facilitate the emergence of environmental protection projects. (sub-measure 13.6) : 1% of the environmental measure 13 in order to support 2 animation associations.


EX POST EVALUATION OF COHESION POLICY PROGRAMMES 2000-2006 CO-FINANCED BY THE EUROPEAN FUND FOR REGIONAL DEVELOPMENT (OBJECTIVES 1 AND 2) - WORK PACKAGE 5B: ENVIRONMENT AND CLIMATE CHANGE ADE
Regional Case Study – Midi-Pyrénées – October 2009 Page 15
3. Analysis of the ERDF contribution
3.1 Relevance of the 2000-2006 ERDF strategy in the environmental sector for enhancing territorial development
The objective to support, as a priority, the local development through the ERDF constitutes the key to understanding the Midi-Pyrénées programme, and more generally the 2000-2006 programming period in France. It has indeed driven the whole programming chain, from the set-up of the strategy, passing through the selection and the monitoring of the projects up to the nature of observed effects. In the context of deeply the contrasting situations between Toulouse and the rest of regional territory, the territorial approach can be relevant in order to contribute to more balanced regional development. As the strategy aimed to financially support actions entering into integrated territorial and/or sectoral plans, the Objective 2 programme was thus ensured to be in line with environmental policies at EU/national and local levels. The set-up of the strategy was based on wide consultation with all the actors, which amounted to covering all their competences. Beyond a specific environmental measure, the environment also appeared as a horizontal priority. The OP did indeed have integrated actions with an environmental dimension under some other territorial or sectoral measures. The programme could thus appear relevant as it covered the main environmental stakes while being integrated in local and sectoral strategies. The main drawbacks of such an approach is that the limited amount of resources have been dispersed in many types of actions without clear priorities. It can prove relevant if ERDF resources are clearly integrated into sectoral/spatial plans and if it helps to fund directly or by levering additional resource projects that are a priority within these plans of actions. The difficulty of presenting a strategic and structured vision at regional level constitutes the limitation of the local approach.
3.2 Quality of the planning and implementation process in meeting regional challenges in the covered fields
The regional prefect9 was the authority responsible for the management of the ERDF programmes. He is helped in this task by the General Office for Regional Affairs (Secrétariat Général pour les Affaires Régionales, or SGAR). The regional prefect also coordinates a partnership between departmental prefectures, regional councils, relevant public institutions (ADEME, the Water Agency, etc.) and local bodies which are involved in the preparation of the operation plans.
9 Préfet de la région in French, who is the representative of the State in the region and supervises the decentralized
services of the State in the region.

EX POST EVALUATION OF COHESION POLICY PROGRAMMES 2000-2006 CO-FINANCED BY THE EUROPEAN FUND FOR REGIONAL DEVELOPMENT (OBJECTIVES 1 AND 2) - WORK PACKAGE 5B: ENVIRONMENT AND CLIMATE CHANGE ADE
Regional Case Study – Midi-Pyrénées – October 2009 Page 16
Although the regional prefect is the only official authority responsible for the management of ERDF programmes, in Midi-Pyrénées, departmental authorities were also involved in the projects pre-selection and follow up. This translates the will to employ the services which have the best knowledge, local realities and stakes. Indeed, some departmental committees10 were asked to examine the different projects and determine those which have priority to be funded by the ERDF. The region also appointed departments as a delegate for the follow up of local environmental projects. Operations led on a regional scale were followed by the SGAR. The financing demands were managed as continuous flows and were examined by the concerned services at the regional or departmental levels. The selection was mainly operated on the basis of 1) the eligibility of the project, 2) its capacity to mobilize the financial counterparts of the ERDF and finally 3) the availability of the remaining ERDF budget for the concerned measure. There is thus no tender at a fixed time, competition between projects or other specific instruments within the framework of the OP such as costs/benefits analysis, advice of expert committees, etc. The relevance and the quality of the projects were indirectly integrated in its capacity to gather the necessary additional financings of the ERDF counterpart by state or regional authorities. In the context of the mid term review and reduction of the budget allocated to environmental measures, it was agreed with the Commission to integrate a sustainable development analysis grid for new projects introduced within the programme. This grid increased stakeholder awareness with regards to sustainable development criteria and the quality of their projects. Nevertheless, this grid was not systematically applied and the results of the analysis were never a determining factor for the selection of the projects. The automatic decommitment rule (or n+2 rule) has increased the breaking-up effect of the programme in small operations easily carried out and justified, rather than focusing on more innovating projects or structuring investments.
3.3 Environmental trends and contribution of the ERDF in improving the environmental situation
Table 3 presents a number of indicators for understanding the evolution of the environmental situation between 2000 and 2006 in the region in key environmental fields.
Solid waste
In the year 2000, the household waste generation rate was higher in Midi-Pyrénées compared to the national average (390 kg/capita/year in Midi-Pyrénées; 354 kg/capita/year in France). Over the period, the regional household waste generation rate decreased to match the national average (about 350 kg/capita/year).
10 The departemental comitees were composed representatives of the State services, the General Council (Conseils Généraux
= departemental elected representatives), and the Regional Council (Conseil regional - regional elected representatives)

EX POST EVALUATION OF COHESION POLICY PROGRAMMES 2000-2006 CO-FINANCED BY THE EUROPEAN FUND FOR REGIONAL DEVELOPMENT (OBJECTIVES 1 AND 2) - WORK PACKAGE 5B: ENVIRONMENT AND CLIMATE CHANGE ADE
Regional Case Study – Midi-Pyrénées – October 2009 Page 17
In 2006, about 47% of the 1.86 million tons of municipal solid waste generated in the region were disposed of via landfills and about 22% were incinerated. This is significantly less compared with the initial situation in 1999 (where 63% of the municipal waste was landfilled) but is still above the national average (37% landfilled in 2006). This can be partly explained by the fact that Midi-Pyrénées is mainly a rural region. The main difficulties in this field are the vastness of the regional territory and the low density of the population. In 1999, the Midi-Pyrenées Region experienced significant delays in terms of waste sorting and valorisation (recycling and composting). Only 12% of household waste was in fact valorised (8% for recycling and 4% for composting) which was nearly 50% lower than the national average (23%). In 2006 the situation in the region improved significantly and became similar to the national average, i.e. 19% of waste was recycled and 12% of waste was composted in 2006.
Table 3: Evolution of the environmental situation between 2000 and 2006
Efforts were indeed made during the period in the area of sorting as confirmed by the number of local sorting centres, which increased from 96 to 206 units between 2000 and
Cat Indicator Coverage 2000 2001 2002 2003 2004 2005 2006
2006 - present
Wat
er
% of population connected to the public water supply system
France 99% 97% Midi-Pyrénées 97% 94%
% of population supplied with water not fulfilling quality criteria
France 9% 6% 5% 5% Midi-Pyrénées 15% 10% 11% 7%
% of population connected to the public sewerage system
France 99% 97% Midi-Pyrénées 97% 94%
% of the population supplied with water presenting unsatisfactory biological quality
Midi-Pyrénées 14% 10% 11% 9% 8% 6% 5%
% of measurement stations with a bad or very bad water quality regarding organic and oxidizable matters
France 18% 12% 16% 16% 12% 12% 15%
Midi-Pyrénées 20% 8% 14% 12% 7% 7% 15%
Was
te
generation of household waste (kg/hab) France 354 357 359 356 353 Midi-Pyrénées 390 378 348
% of collected household waste landfilled France 55% 52% 46% Midi-Pyrénées 60% 56% 50%
number of sorting centres Midi-Pyrénées 96 120 136 154 176 197 206 +115%
Household waste treatment (thousands of tons)
Landfilled 897 835 792 884 -1% Incinerated with energy saving
335 378 400 412 +23%
Waste sorting centres
116 150 239 350 +202%
Composting 65 102 168 217 +234%
GH
G &
Ene
rgy
Share of renewable energy in the energy production (tons/hab) Midi-Pyrénées
22.6 25.4 20.8 24.1 26.1 22.0 21.5 -5%
Energy consumption (toe/hab) Midi-Pyrénées 2.4 2.3 2.1 2.1 2.1 2.2 2.2 -8% CO2 emission (tons/hab) Midi-Pyrénées 5.2 5.0 4.6 4.6 4.5 4.8 - -8%
CO2 emissions per sector in Midi-Pyrénées (in thousands of tons)
Total 13228 12550 11684 12006 12416 13132 13376 +1.1% Residential 4303 3809 3566 3767 4112 4159 4416 +2.0% Industries 2230 2105 1462 1559 1537 1556 1644 -26% Transport 6012 5954 6011 6046 6148 6826 6734 +12% Agriculture 684 682 645 634 619 591 583 -14%
Sources : French Environment Institute (IFEN), French Environment and Energy Management Agency (ADEME), National institute for Statistics (INSEE)

EX POST EVALUATION OF COHESION POLICY PROGRAMMES 2000-2006 CO-FINANCED BY THE EUROPEAN FUND FOR REGIONAL DEVELOPMENT (OBJECTIVES 1 AND 2) - WORK PACKAGE 5B: ENVIRONMENT AND CLIMATE CHANGE ADE
Regional Case Study – Midi-Pyrénées – October 2009 Page 18
2006. Among these 110 new units, 69 were supported by the ERDF which provided a significant contribution towards the implementation of this policy. ut beyond waste sorting, upstream operations of increasing public and company awareness and the downstream operations to promote the re-using of waste remained less significant in the Objective 2 programme.
Drinking water and wastewater treatment
In 2000, almost the entire population had access to the public water supply and sewerage system in the region, a situation which has remained constant over the programming period. Water quality on the other hand, remains an issue in the region, but significant progress has been made. In 2000, about 14% of the population was supplied with water representing unsatisfactory biological quality while in 2006 only 6% of the population was facing this problem. In 1999, the region experienced a significant delay in water treatment with regard to the European directive requirements. For the Adour-Garonne basin, the evolution of the SDAGE aggregate indicator for water quality objective stagnated between 1996 and 2003, notably due to demographic growth. For surface water, the difficulty of controlling large-area pollutions originating from non-specific sources also contributed to the difficulty of improving the situation. The main issues of concern are organic matters and phosphorus (from domestic sources), metals (due to former metal industries) and nitrates (mainly from agriculture). The SDAGE Adour-Garonne 2010-2015 set an intermediate objective of 52% of the water masses reaching a good state by 2015 with a view to reach 100% by 2027. In terms of financial volume, intervention of the ERDF in the water sector remains limited since it represents less than 1% of the expenditure of the 3 main funders. Intervention of the ERDF mainly focused on water treatment in small and average-sized towns located in the priority zones of the SDAGE. This has allowed for an increase in the number of people connected to the sewerage system by more than 30,000, meaning an increase of 1%, but it should be noted that during the programming period, the population increased by 9.1%. This reflects the role that the ERDF has played in small segments of the sector. The question of over-investment was raised. The heavy solutions, induced by the directive, are not necessarily adapted for certain rural and mountainous areas, both in economic and in environmental points of view. Indeed, some natural solutions based on successive basins for instance, could constitute an alternative 5 or 10 times less expensive and prevent environmental damage related to improper piloting of wastewater plants (the region had experienced rejection of bacteria which was fatal for certain species such as crayfish due to improper piloting of small waste water plant). Even if not suitable, these heavy solutions are chosen due to the tendency of the sector to reproduce known techniques and availability of external sources of financing, such as ERDF. Nevertheless, it must be pointed out that the European water directive also had a positive impact on the sectoral policies, notably by changing the simple vision of the good physicochemical state of water to increase the good ecological state of the resource.

EX POST EVALUATION OF COHESION POLICY PROGRAMMES 2000-2006 CO-FINANCED BY THE EUROPEAN FUND FOR REGIONAL DEVELOPMENT (OBJECTIVES 1 AND 2) - WORK PACKAGE 5B: ENVIRONMENT AND CLIMATE CHANGE ADE
Regional Case Study – Midi-Pyrénées – October 2009 Page 19
Energy and GHG emissions
The allocated budget in this field remains minor (less than 2% of environmental measures). The programme has mainly focused on the one hand on actions of animation and on increase in company and representative awareness, and on the other hand on projects of investments in local collective heating installations in order to promote the development of the wood-energy sector. Actions in renewable energies have contributed to saving the equivalent of 2,182 tons of CO2 over the duration of the programme, i.e. less than 0.01% of regional emissions in annual base, which does not appear as really significant change. Energy consumption per inhabitant slightly decreased in the region and remained lower than the national average, around 2.2 toe (tonnes of oil equivalent) per person per year compared to the national energy consumption of 2.6 toe per person in 2006. However, in the transportation sector, energy consumption rose much faster in Midi-Pyrénées compared to the national trends (+2.4% per year in Midi-Pyrénées; +1.3% per year in France). A similar phenomenon was observed in the residential/service sector as energy consumption increased by 2% per year in the region compared to the national average of 1.1%. In contrast, energy consumption in the industrial sector has been decreasing by around 2.3% per year since 1990 (compared with a decrease of 0.2% per year at the national level). If the total CO2 emissions remained stable during the period, their decomposition by sector shows the efforts made in industry (-26%, but this is partly related to the closing of the AZF factory) and in agriculture (-14%). However, it did not compensate for the increase in the transport sector (+12%). The share of industry in CO2 emissions fell from 17% to 12%, whereas that transport sector rose from 45% to more than 50%. The emissions of CO2 per inhabitant remained stable, around 5 tons of CO2 per year. The national average was approximately 6 tons of CO2 per inhabitant in 2003. In 2006, the share of renewable energies in the energy production in Midi-Pyrénées was 21.5% (hydroelectric 12%, 8% wood, 1.6% wind, biofuel, waste), a slight decrease compared to 1999 (22.6%), mainly due to the fall of hydroelectric production which was not compensated by other renewable sources.
Conclusion from the environmental point of view
Historically, the ERDF has played a significant role in introducing environmental concerns in the regional or local policies which were required to integrate EU requirements. During the period 2000-2006, the Objective 2 programme mainly contributed to equip and consolidate rural territories, in particular in the fields of waste sorting and nature protection. The ERDF has also contributed to accelerating investments to reduce the delays occurring in the Midi-Pyrénées Region, in particular in the waste and water fields. It has also contributed to improving the knowledge of the territories and the particular local environmental stakes, which will allow for defining more relevant management and protection plans. However, according most of stakeholders met, there was no strong environmental awareness during this programming period, as illustrated by : (a) the decision to reduce the budget dedicated to the environmental measure at the time of mid-term review

EX POST EVALUATION OF COHESION POLICY PROGRAMMES 2000-2006 CO-FINANCED BY THE EUROPEAN FUND FOR REGIONAL DEVELOPMENT (OBJECTIVES 1 AND 2) - WORK PACKAGE 5B: ENVIRONMENT AND CLIMATE CHANGE ADE
Regional Case Study – Midi-Pyrénées – October 2009 Page 20
(b) the weak mobilization of actors on the opportunity to integrate projects with a strong environmental dimension under other measures of the OP.
(c) no real use of the sustainable development analysis grid of projects in project selection. The implementation modes, the budget dispersion among a wide range of actions and the absence of a strong environmental vision did not allow the emergence of significant business activities or actions which could have a strong demonstrative effect.
3.4 Economic trends and the contribution of the ERDF to regional economic development
At the beginning of the programming period, the Midi-Pyrénées Region faced a contrasting territory with on the one hand, the dynamism of agglomeration of Toulouse and on the other hand, rural territories with old traditional economic structures unsuited to the economic changes at the time. The regional strategy thus aimed to reinforce economic and social cohesion by accompanying the economic changes and by ensuring a more balanced distribution of the people and activities among the regional territory.
Table 4: Socio-economic trends
Socio-economic indicators
Région 2000 2001 2002 2003 2004 2005 2006 Incr. 2000-
present Population (in millions of inhabitants)
France 60.30 60.75 61.18 61.62 62.04 62.44 62.82 4.2% Midi-Pyrénées 2.59 2.62 2.66 2.69 2.72 2.75 2.79 7.7%
GDP/capita (at PPS; EU-25=100)
France 109.8 110.4 111.2 107.1 105.7 106.4 105.0 -4.4% Midi Pyrénées 96.0 99.1 99.8 96.6 94.3 96.5 96.3 +0.3%
GDP annual growth rate France 4.0 1.9 1.0 1.1 2.5 1.7 2.0 - Midi Pyrénées 3.0 4.6 1.3 2.2 2.1 2.5 3.1 -
Employment rate (of the group 15-64)
France 68.8 68.4 68.7 69.6 69.7 69.8 69.7 +1.3% Midi Pyrénées 69.6 69.7 70.2 72.6 71.6 72.0 73.0 +4.9%
R&D as % GDP France 2.2 2.2 2.2 2.2 2.2 2.1 2.1 -2.3% Midi Pyrénées 3.2 3.2 3.6 3.7 4.2
Unemployment rate France 10.2 9.1 9.2 8.9 9.3 9.3 9.3 -8.8% Midi Pyrénées 10.1 8.8 8.1 8.1 7.1 7.1 8.4 -16.8%
Nb of nights in collective tourist accommodations (in millions)
France 280.1 289.3 289.5 283.1 283.0 295.6 297.5 6.2%
Midi Pyrénées 14.4 13.7 13.7 13.7 13.6 13.8 13.9 -3.8%
Sources : Eurostat The trends of the main socio-economic indicators were very positive for the Midi-Pyrénées Region during the period 2000-2006, in higher proportions than the national tendencies. The ERDF represented approximately 0.01% of the regional GDP during the period of programming, of which only 9% was devoted to environmental projects. The contribution of environmental measures to macro-economic stability thus remains limited in volume. However, the ERDF was used during this programming period to support a strategy of development of the territories, mainly rural, in order to reinforce regional cohesion. During the 1990’s, these territories pursued a tendency to decline by widening the gap with the regional and national averages. As shown by detailed data at department level, these decline tendencies were reversed during 2000-2006, thus increasing cohesion within the region.

EX POST EVALUATION OF COHESION POLICY PROGRAMMES 2000-2006 CO-FINANCED BY THE EUROPEAN FUND FOR REGIONAL DEVELOPMENT (OBJECTIVES 1 AND 2) - WORK PACKAGE 5B: ENVIRONMENT AND CLIMATE CHANGE ADE
Regional Case Study – Midi-Pyrénées – October 2009 Page 21
The evolution of the main socio-economic indicators associated with these territories was positive and mainly higher than the national or regional tendencies. Even if the amounts remain limited, the ERDF took part in a general effort of investment in these territories which contributed to breaking with this logic of decline prevailing in the 1990’s.
Table 5: Trends at local levels
Demographic evolution (in thousands of inhabitants)
GDP per capita in PPS (EU 25 = 100) Unemployment rate
1999 2006 1990-1999
1999-2006 2000 2006 1996-
2000 2000-2006 2000 2007 2000-
2007 France 60296,7 63418,1 +3.6% +5.2% 109,8 105,0 0.0% -4.4% 10,2 8,3 -18.6% Midi-Pyrénées 2558,8 2791,4 +5.0% +9.1% 96,0 96,3 -1.1% +0.3% 10,1 8,1 -19.8%
Haute-Garonne (incl. Toulouse) 1051,7 1195,7 +12.8% +13.7% 118,1 116,5 +0.1% -1.4% 11,4 8,5 -25.4%
Ariège 137,3 146,9 +0.4% +7.0% 76,4 76,5 -4.6% +0.1% 10,7 9,3 -13.1% Aveyron 264 273,9 -2.1% +3.7% 83,9 85,5 -1.7% +1.9% 6 5 -16.7%
Gers 172,4 181,9 -1.4% +5.5% 79,7 75,5 -4.8% -5.4% 6,9 5,6 -18.8% Lot 160,6 170 +2.9% +5.9% 79,7 84,4 -1.4% +5.8% 8,7 7,2 -17.2%
Hautes-Pyrénées 222,6 228,1 -1.1% +2.5% 84,5 90,2 -2.5% +6.7% 10,8 8,6 -20.4% Tarn 343,8 366,7 +0.3% +6.7% 77,5 77,3 -3.0% -0.2% 10,5 9,4 -10.5%
Tarn-et-Garonne 206,4 228,2 +2.7% +10.6% 80,7 79,1 -4.2% -2.0% 10 9,5 -5.0% Sources : Eurostat During the programming period, the region shows a significant demographic progression (+9.1% compared to +5.2% for France as a whole). If the Toulouse Region confirms its strong attractiveness (+13.7%), the most striking fact is the inversion of the tendency in rural zones. Indeed, the majority of the rural areas show demographic trends comparable or higher than the national average whereas it stagnated or declined during the 1990’s. Regional GDP per capita has also progressed in a similar way as the European average (in purchasing power standard, from 96.0 to 96.3 in base EU-25=100) whereas the French average progress has been lower than the European average (from 110 to 105 in base EU-25=100). The performance of the Midi-Pyrénées mainly resulted from the rural areas which have higher growth rates than the Toulouse agglomeration (except for Gers and the Tarn-et-Garonne), reversing the tendencies observed during the 1990’s. Although the remainder is significant (116 for Toulouse compared to 75 to 90 for other departments), the difference between Toulouse and the other rural territories fell during the period. Consequently, the rate of employment has strongly increased (from 69.9% to 73% for the 15-64 age group) compared to the national average (from 68.8% to 69.7%), thus marking a retreat of the unemployment rate (from 10.2% to 8.4%), and this in all the areas of the Midi-Pyrénées Region. However, the particular contribution of environmental measures supported by the ERDF remains more difficult to assess. According to monitoring data, environmental measures have created 320 jobs during the period, of which 87% is in the waste sector, mainly in local units of local selective waste collection centres. Indeed, the number of local sorting centres went up from 96 to 206 units, of which 69 were supported by the ERDF. With the exception of this sector, the

EX POST EVALUATION OF COHESION POLICY PROGRAMMES 2000-2006 CO-FINANCED BY THE EUROPEAN FUND FOR REGIONAL DEVELOPMENT (OBJECTIVES 1 AND 2) - WORK PACKAGE 5B: ENVIRONMENT AND CLIMATE CHANGE ADE
Regional Case Study – Midi-Pyrénées – October 2009 Page 22
effect of environmental measures on employment remains limited to temporary employment related to the implementation of the actions, either in the building and equipment of sectors for investments, or in associations for information and animation actions (estimated for instance, for the biodiversity part to 300 annual full time equivalent).
Table 6: Regional data – business statistics Activities linked to the
environment Sector 2000 2001 2002 2003 2004 2005 2006 2000-06
Number of local units Recycling 248 243 241 251 249 250 254 +2.4% Water (1) 47 60 60 60 61 65 64 +36.2%
Gross investment in tangible goods (in millions of euros)
Recycling 11.2 13.6 11.8 10.3 14.4 15.2 22.7 +102.7% Water (1) 13.3 5.8 4.7 6.4 4.7 6.6 12.0 -9.8%
Number of people employed Recycling 975 977 1003 1054 1057 1056 1183 +21.3% Water (1) 1230 1281 981 1383 1352 818 1446 +17.6%
(1) Collection, purification and distribution of water Source : Eurostat
The private sector was not really involved in the environmental parts of the programme. The initial OP had included under sub-measure 13.7 actions to support experimentation and innovation for the creation of new activities and new products in the field of the environment and to promote environmental management and renewable energies. But the sub-measure accounted for only 3% of environmental measures, and has mainly supported actions to increase enterprise awareness of environmental management and some investments in renewable energies mainly in local public equipment (networks of heating). The programme missed the opportunity to create the conditions for the emergence of a green economy. During the 2000-2006 period, the ERDF was not used in the Midi-Pyrénées Region to support innovation in new products or processes or to develop new necessary competences to develop new economic branches in the field of preserving the environment. The ERDF contribution to support renewable energies was minor in the development of branches in this sector. This illustrates the limitations of the adopted approach which comes mainly in reaction to local initiatives, but has not pushed a strategic vision in a sector. Environmental measures must be seen as a way to maintain the basic attractiveness conditions of the territories. The environmental measure has also contributed to giving a positive image to the rural territories, which experienced significant inversion of the population trends during the programming period. The effect on the tourist sector remains very indirect. However, the touristic centres were regarded as a priority for waste and water, with close attention on landscape integration.

EX POST EVALUATION OF COHESION POLICY PROGRAMMES 2000-2006 CO-FINANCED BY THE EUROPEAN FUND FOR REGIONAL DEVELOPMENT (OBJECTIVES 1 AND 2) - WORK PACKAGE 5B: ENVIRONMENT AND CLIMATE CHANGE ADE
Regional Case Study – Midi-Pyrénées – October 2009 Page 23
Annex - List of interviewed persons
Date Nom Institution
02/06/2009 Emmanuel Jaeck, responsable de l’Unité d’Evaluation SGAR Midi-Pyrénées
03/06/2009 Frederic Fernandes
DREAL
03/06/2009 Christine Dutaut-Lafforgue, responsable administratif et juridique, contrôle de gestion
ADEME
04/06/2009 Christian Julia, Directeur de la Délégation Régionale de Toulouse
Agence de l’Eau Adour-Garonne
04/06/2009 Pascal Beer-Demander,Directeur adjoint Environnement et Développement Durable
Conseil Régional Midi-Pyrénées
05/06/2009 Jean-Paul Faivre, responsable de la Cellule Europe SGAR Midi-Pyrénées 05/06/2009 Monique Dejean-Servières Agence Régionale pour
l’Environnement 17/06/2009 Bernard Tissot, responsable projet SYDED Lot
Syndicat Départemental d’élimination des déchets ménagers


ADE s.a. Rue de Clairvaux, 40
B-1348 Louvain-la-Neuve Belgium
Tel.: +32 10 45 45 10 Fax: +32 10 45 40 99 E-mail: [email protected]
Web: www.ade.be
Ex post evaluation of cohesion policy programmes 2000-2006 co-financed by the European Fund for Regional Development (Objectives 1 and 2) – Work package 5b: Environment and Climate Change
RReeggiioonnaall ccaassee ssttuuddyy CCeennttrraall MMaacceeddoonniiaa
October 2009


TThhiiss rreeppoorrtt hhaass bbeeeenn pprreeppaarreedd bbyy AADDEE aatt tthhee rreeqquueesstt ooff tthhee EEuurrooppeeaann CCoommmmiissssiioonn..
TThhee vviieewwss eexxpprreesssseedd aarree tthhoossee ooff tthhee CCoonnssuullttaanntt aanndd ddoo nnoott rreepprreesseenntt tthhee ooffffiicciiaall vviieewwss ooff tthhee EEuurrooppeeaann CCoommmmiissssiioonn..
RReepprroodduuccttiioonn oorr ttrraannssllaattiioonn iiss ppeerrmmiitttteedd,, pprroovviiddeedd tthhaatt tthhee ssoouurrccee iiss dduullyy aacckknnoowwlleeddggeedd aanndd nnoo mmooddiiffiiccaattiioonnss ttoo tthhee tteexxtt aarree mmaaddee..


EX POST EVALUATION OF COHESION POLICY PROGRAMMES 2000-2006 CO-FINANCED BY THE EUROPEAN FUND FOR REGIONAL DEVELOPMENT (OBJECTIVES 1 AND 2) - WORK PACKAGE 5B: ENVIRONMENT AND CLIMATE CHANGE ADE
Regional Case study – Central Macedonia – October 2009 Table of Contents
Table of Contents ACRONYMS
SUMMARY
1. STATUS AND FEATURES OF THE REGION .............................................................. 1
1.1 ECONOMIC SITUATION (IN 2000) .................................................................................... 1 1.2 ENVIRONMENTAL SITUATION (IN 2000) ........................................................................ 2 1.3 INSTITUTIONAL SET UP AND POLICY MAKING PROCESS ............................................... 4
1.3.1 Regional development .............................................................................................. 4 1.3.2 Environmental sector ............................................................................................... 5
2. REGIONAL POLICIES AND THE ROLE OF THE ERDF ........................................... 7
2.1 ECONOMIC POLICIES ......................................................................................................... 7 2.2 ENVIRONMENTAL POLICIES ............................................................................................. 7 2.3 ACTIONS TAKEN ................................................................................................................ 8
2.3.1 Environmental expenditures and main sources of funds ................................... 8 2.3.2 ERDF contribution to environmental expenditures in the region .................... 9
2.4 PLANNING PROCESS AND COORDINATION BETWEEN ALL STAKEHOLDERS ........... 13
3. ANALYSIS OF THE ERDF CONTRIBUTION .......................................................... 15
3.1 RELEVANCE OF THE 2000-2006 ERDF STRATEGY IN THE ENVIRONMENTAL
SECTOR FOR ENHANCING TERRITORIAL DEVELOPMENT ........................................... 15 3.2 QUALITY OF THE PLANNING AND IMPLEMENTATION PROCESS TO MEET
REGIONAL CHALLENGES IN THE COVERED FIELDS .................................................... 15 3.3 CONTRIBUTION OF THE ERDF TO IMPROVING THE ENVIRONMENTAL
SITUATION ........................................................................................................................ 16 3.4 CONTRIBUTION OF THE ERDF TO REGIONAL ECONOMIC DEVELOPMENT ........... 17 3.5 CONTRIBUTION OF THE ERDF TO IMPROVING THE QUALITY OF LIFE .................. 19
LIST OF FIGURES
FIGURE 1: LOCATION OF CENTRAL MACEDONIA ...................................................................... 1 LIST OF TABLES
TABLE 1: ENVIRONMENTAL DATA .............................................................................................. 3 TABLE 2: ESTIMATE OF ENVIRONMENTAL EXPENDITURES DURING
THE 2000-2008 PERIOD (IN €M) .................................................................................. 9 TABLE 3: ENVIRONMENTAL MEASURES OF OP CENMAK–
APPROVED EXPENDITURES 2000-2008 (PUBLIC EXPENDITURE) ........................ 10 TABLE 4: MAIN OUTPUT AND RESULT INDICATORS – REGIONAL OPERATIONAL
PROGRAMME ............................................................................................................... 12 TABLE 5: MEASURES OF THE REGIONAL OP ........................................................................... 13 TABLE 6: GDP CENTAL MACEDONIA ..................................................................................... 17 TABLE 7: EMPLOYMENT IN CENTAL MACEDONIA ................................................................ 18


EX POST EVALUATION OF COHESION POLICY PROGRAMMES 2000-2006 CO-FINANCED BY THE EUROPEAN FUND FOR REGIONAL DEVELOPMENT (OBJECTIVES 1 AND 2) - WORK PACKAGE 5B: ENVIRONMENT AND CLIMATE CHANGE ADE
Regional Case study – Central Macedonia – October 2009 Acronyms
Acronyms
CSF Common Strategic Framework EIA Environmental Impact Assessment MoEnv Ministry of the Environment MW Megawatts NSRF National Strategic Reference Framework RES Renewable Energy Systems UWDS Uncontrolled Waste Disposal Sites UWWD Urban Waste Water Directive


EX POST EVALUATION OF COHESION POLICY PROGRAMMES 2000-2006 CO-FINANCED BY THE EUROPEAN FUND FOR REGIONAL DEVELOPMENT (OBJECTIVES 1 AND 2) - WORK PACKAGE 5B: ENVIRONMENT AND CLIMATE CHANGE ADE
Regional Case study – Central Macedonia – October 2009 Summary
Summary : Key messages from the case study in Central Macedonia Environmental policies in Central Macedonia are mainly oriented towards reaching EU directive requirements. A Top-Down approach is used for determining the regional strategy related to water, which mainly aims at increasing connexion rates. On the contrary a bottom-up approach characterises determination of the regional strategy for solid waste which consists of increasing recycling and closing uncontrolled waste disposal sites. The private sector is generally not involved in the management of the environmental infrastructures which are in the hands of public/municipal companies. However, some private involvement appeared during the covered period, namely in the management of the new landfills financed by the Cohesion Fund and in the recycling sector. New environmental infrastructure is continuously needed, especially for smaller agglomerations, while the need to upgrade existing infrastructure is not yet evident, as infrastructure is fairly new, except in cases where design errors and bad practices have occurred. Complementarity has been observed during the covered period for the financing and the implementation of environmental projects, both between regional and environmental Operational Programmes and between the ERDF and the Cohesion Fund. The regional needs in terms of solid waste treatment have been mainly financed by the Cohesion Fund. ERDF interventions in this area have been more modest and have acted as a complement. As regards water, the ERDF has confined its actions to new public infrastructures and has therefore not addressed the challenges of nitrates and industrial pollution of ground and superficial water and soil considered as a private sector problem. Strong regional planning was lacking concerning the implementation process of the OPs. Therefore the ERDF investments could not be inserted in a regional strategy. As a consequence, the capacity of the ERDF to meet challenges in the region relied completely on the selection of the interventions. ERDF regional and national environmental programmes had a significant impact on the improvement of the environmental situation of Central Macedonia. ERDF-financed projects contributed mainly to increasing the proportion of the population connected to improved water supplies and wastewater treatment plants and to closing uncontrolled waste disposal sites. These latter projects completed the building of new landfills financed by the Cohesion Fund. Environmental policies do not target directly the improvement of regional attractiveness but it is recognised that they do contribute to it. Conversely, efforts in urban area rehabilitation are devoted to increasing attractiveness. Beyond the increased attractiveness of some areas both in terms of economic activity and real estate, the impact of environmental projects on the regional economic development has remained limited and difficult to assess.


EX POST EVALUATION OF COHESION POLICY PROGRAMMES 2000-2006 CO-FINANCED BY THE EUROPEAN FUND FOR REGIONAL DEVELOPMENT (OBJECTIVES 1 AND 2) - WORK PACKAGE 5B: ENVIRONMENT AND CLIMATE CHANGE ADE
Regional Case study – Central Macedonia – October 2009 Page 1
1. Status and features of the region
1.1 Economic situation (in 2000)
Central Macedonia is the largest Greek region in size with 14.5% of the country surface area and the second one in total population 17.1%. It is the second most important region in terms of contributing to national GDP, but, its GDP per capita lies far behind the national rate (69% of EU average against 80.3% at national level) -. Indeed, Greek GDP per capita, is widely impacted by the Athens metropolis. The region contains an important urban centre: the city of Thessaloniki. It distorts significantly the statistics of the region. The prefecture of Thessaloniki produces 58% of the GDP of the region. The region comprises in total seven prefectures -Imathia, Thessaloniki, Kilkis, Pella, Pieria, Serres and Chalkidiki- each of which has specific characteristics. Thessaloniki is the second largest port in Greece after Piraeus in Athens and the natural sea exit to the Balkans Peninsula. Its industrial sector is characterised by textiles (facing competitiveness problems), clothing and shoes, food, beverages, furniture, tobacco and chemicals, in particular refineries. In the rapidly developing services sector, transport plays a key role, followed by health, education and productive services. Rapid urban population growth is an important challenge to be faced by the city. At regional level the urban population reached 77% in 2001 (while in 1991 it was only 57%) and was mainly concentrated in Thessaloniki.
Figure 1: Location of Central Macedonia
Each of the other six prefectures shows different characteristics. Agriculture and cattle are still the main activities of the region with 41% of the land being cultivable and 24% pastureland. These activities are particularly concentrated in Imathia, Pella, Pieria, Serres where a derived agro-food industry has also developed (juice and cannery production). But the profitability in the sector is slowly fading and is heavily affecting production, investment and employment. Kilkis prefecture has developed an industrial tissue, benefiting from its proximity to the border with the Former Yougoslave Republic of Macedonia (FYROM) and Bulgaria and to the port of Thessaloniki.

EX POST EVALUATION OF COHESION POLICY PROGRAMMES 2000-2006 CO-FINANCED BY THE EUROPEAN FUND FOR REGIONAL DEVELOPMENT (OBJECTIVES 1 AND 2) - WORK PACKAGE 5B: ENVIRONMENT AND CLIMATE CHANGE ADE
Regional Case study – Central Macedonia – October 2009 Page 2
The tourism sector has not managed to escape the mode of mass coastal tourism, with its subsequent disadvantages of seasonality and downgrading of coastal areas. The region has not developed any forms of alternative tourism, despite the ample resources it has to offer. Tourism areas are concentrated in Chalkidiki and the Pieria coast (Katerini), attracting clientele from national and eastern countries.
In 2000 the main competitiveness problems faced by the region were its remoteness, its inadequate road links and the need for restructuring of its primary and secondary economic sectors. However, the region did not suffer from a lack of assets. Its geopolitical position, the city of Thessaloniki, the size of the secondary sector, and its rich cultural heritage represented valuable opportunities.
1.2 Environmental situation (in 2000)
Water supply and wastewater treatment
Although the situation improved enormously during the period 1993-1999, there is still a need to complete environmental infrastructure in the areas of water supply, sewerage and wastewater treatment, especially in urban areas that see very rapid increases of new settlements, in the coastal recreation zone and in agglomerations that are in characterised sensitive areas:
There are no specific figures on potable water for the region, but the national figure of connectivity to improved water supplies for the whole country was 91% for urban areas and 73% for rural areas. This adapted to the Central Macedonia Region, with 77% urban population, means an overall connectivity of about 87%. There were nitrate and arsenic pollution cases reported is various rural and semi-urban agglomerations, as mentioned in the EC consultation letter 204635/18.10.2004.
For wastewater collection and treatment, the connected population to sewer networks in 1999 was, according to the MoEnv, 52% in Central Macedonia, of which 83% was treated, which means that 43.2% of the population had their sewage treated in the year 1999. Regarding the 91/271 Directive (Urban Waste Water Directive (UWWD), all the main cities above 15,000 inhabitants had partial collection and treatment of wastewater except Edessa, while some smaller agglomerations also had treatment facilities due to their touristic nature. The Ministry’s target for full treatment at the end of the programming period is nearly 75%.
Solid waste
Concerning solid waste, urban settlements and increased industrial activities augment the volume of domestic and industrial solid waste. Concentration and uncontrolled disposal caused acute problems in the region. In 2000, there were only 6 authorised landfills in operation in the region, serving 53% of the population. The Ministry target for the end of the programming period is 73%.

EX POST EVALUATION OF COHESION POLICY PROGRAMMES 2000-2006 CO-FINANCED BY THE EUROPEAN FUND FOR REGIONAL DEVELOPMENT (OBJECTIVES 1 AND 2) - WORK PACKAGE 5B: ENVIRONMENT AND CLIMATE CHANGE ADE
Regional Case study – Central Macedonia – October 2009 Page 3
There were also more than 500 Uncontrolled Waste Disposal Sites (UWDS) to be closed. These were the main sources of soil contamination together with some industrial residues which polluted industrial sites. Central Macedonia produces 12,6% of the country's 330,000 tons/year of hazardous waste. One of the 12 Greek recycling installations in 2001 was operating in Thessaloniki, aiming for a target of 22% recycling of packaging waste by the end of the programming period.
Table 1: Environmental data
Central Macedonia Region 2000 2001 2002 2003 2004 2005 2006
Forest (% of land) 42,3 n.a. n.a. n.a. n.a. n.a. n.a. Urbanized coastline (% of regional coastline) (a)
10 n.a. n.a. n.a. n.a. n.a. n.a.
% population collected to the public water supply system
86,6 n.a. n.a. n.a. n.a. n.a. 95 (b)
% population collected to the public sewerage system
52 n.a. n.a. n.a. n.a. n.a. 60 (b)
Collected solid waste/ capita n.a. 420 n.a. n.a. 430 n.a. n.a. Mortality rate for <65 from heart disease and respiratory illness in Thessaloniki city
n.a. 0,682 n.a. n.a. 0,659t n.a. n.a.
%Waste disposal in sanitary landfills
57 n.a. n.a. n.a. n.a. n.a. 72
(a) Urbanized coastline in 1990 was 5.9% in 1990. Source: Strategic Environmental Impact Assessment for the Region of Central Macedonia, 2006, preliminary study (b) End 2008
Other issues
In respect to other environmental indicators, it could be mentioned that measurements in air pollution of the Thessaloniki area show a continuous drop in all pollutants except particulates, which remain steady. Regarding renewable energy, the region had at the time an installed capacity in large scale hydroelectric power generation of 492 MW and a capacity of around 2 MW in power generation from biomass. The region has not been targeted for large scale RES exploitation, which has been planned for other areas of the country. At the time, little was envisaged regarding climate change and GHG reduction, except for the change of fuel to gas in some industrial areas and the closure of some large industries in the region. Data for the whole of the country show that GHG gas emissions will exceed by 10% the Kyoto protocol target of a 25% increase in 2012 compared to the base year of 1990.

EX POST EVALUATION OF COHESION POLICY PROGRAMMES 2000-2006 CO-FINANCED BY THE EUROPEAN FUND FOR REGIONAL DEVELOPMENT (OBJECTIVES 1 AND 2) - WORK PACKAGE 5B: ENVIRONMENT AND CLIMATE CHANGE ADE
Regional Case study – Central Macedonia – October 2009 Page 4
The natural environment of Central Macedonia is characterised by great variety and value, containing large rivers, lakes and wetlands, extensive mountainous areas and forests and a large coastline. The main problem for the region that endangers the environment and downgrades the quality of life is the uncontrolled development of activities, which:
reduces the ecosystem’s quality in lake, rivers and coastal areas. (lake Koronia,–Axios river delta and the coastal areas of Chalkidiki and Pieria)
generates large pollution of surface and underground water with local and imported pollution, from agricultural pesticides and nitrates, and urban and industrial effluents
results in large exploitation of the coastal touristic resources with continuously increasing building concentrations and illegal constructions downgrading natural resources. (Coast of Pirea and Chalkidiki).
The conflict of land uses is particularly intense given the inability of routine control of the activities and the insufficient control of environmental impacts. The lack of enforcement of the environmental and spatial laws, regulations and licenses, is worsening as the Prefectural authorities who were responsible until 1998 and are still partly responsible, have lost resources and competences, without a corresponding strengthening of the regional and central authorities.
1.3 Institutional set up and policy making process
1.3.1 Regional development
Greece is a higly centralised country and policies are developed on the basis of a central Governement programme. At regional level there is a three-tier administrative system. At the ‘third level’ are the 13 de-concentrated regions (Peripheria) governed by a Secretary General, appointed by the Government, and a Council. The regions were created in 1986 to implement European development policies in consultation with Prefectures (Nomos) and local governments. Since 1996 the Council has acted as a consultative body composed of the Prefects in the jurisdiction, the representatives of local authorities, the Secretary General of the region and representatives of various regional-level public interest groups. The regions are dependent on transfers from the central state and the European Union1. The second level, the Prefecture (Nomoi) has been decentralized since 1994. Nationwide there are 51 prefectures and the Central Macedonia Region consists of 7 prefectures. The Prefecture budget consists mainly of their share of centrally collected value-added taxes, tax on buildings, traffic duties, and car registration taxes, for which the central government determines base and rate. Finally, the “first level” is also decentralized and totals 1,033 municipalities and communes. The presidents of the first and second levels have been elected since 1998. 1 Rationalisation of regional and municipal levels is in discussion which will end with 3 regions: North, Central and
South.

EX POST EVALUATION OF COHESION POLICY PROGRAMMES 2000-2006 CO-FINANCED BY THE EUROPEAN FUND FOR REGIONAL DEVELOPMENT (OBJECTIVES 1 AND 2) - WORK PACKAGE 5B: ENVIRONMENT AND CLIMATE CHANGE ADE
Regional Case study – Central Macedonia – October 2009 Page 5
1.3.2 Environmental sector
The system of environmental management in 2000 was based on a multiple responsibility level, starting at the level of the entity providing the controlled activity, then up to the environmental services of the Prefectures, the department of the environment of the regions and finally the Ministry of the Environment at the top, with other Ministries and regional or prefectural services sharing responsibilities, as that of the Ministry of Health for the quality of drinking water and the Ministry of Development for industry. Environmental licensing is done in 3 levels on the basis of Environmental Impact Assessments. The central agency in the Ministry of the Environment considers class 1 EIAs, class 2 EIAs go to the regional services and class 4 EIAs go to the prefecture. Class 3 EIAs are screened by the regional services and are either handled there or are sent to the prefectural services. Regional and prefectural services had to ensure that the terms of the environmental licences were observed and also find serious polluters and bring them to justice. The penalties were administrative (fines) and legal. The system did not work well due to the inexperience of the controllers and the delays of courts. For this reason, the Environmental Inspectorate was created, with the support of OP Environment. At the moment there are 47 Inspectors based in Athens, Thessaloniki and Southern Greece. The departments of Thessaloniki and Southern Greece are undermanned and new personnel will be hired. The law for the water management system, which will enforce the WFD has been in existence since 2004. It works as a Secretariat of the Ministry of the Environment, headed by a political nomination with the intention of giving more weight and authority; nevertheless only one of its 3 sections is fully staffed, as it existed in the Ministry before the new law. The other 2 sections as well as the 13 regional offices operate with a skeleton staff, due to the long selection procedures imposed by the Public Service hiring system. The private sector is involved in providing consultancy and contracted services all along the line, from conducting EIAs, constructing environmental infrastructure and sometimes operating, always on a public contract. The collection of solid waste is exercised by municipalities, whereas disposal is conducted by local unions of municipalities. Recently, waste management companies have been formed at local level, fully owned by groups of municipalities, to operate similarly to water companies, regarding only the disposal, treatment and recycling of waste. Water and wastewater is the responsibility of municipalities, mainly through the formation and operation of water companies, fully owned by the municipality, which are obligatory for populations above 10,000. For the metropolitan areas of Athens and Thessaloniki, the water companies are State owned and have been partly privatised through the Stock Exchange, the State retaining the controlling interest.

EX POST EVALUATION OF COHESION POLICY PROGRAMMES 2000-2006 CO-FINANCED BY THE EUROPEAN FUND FOR REGIONAL DEVELOPMENT (OBJECTIVES 1 AND 2) - WORK PACKAGE 5B: ENVIRONMENT AND CLIMATE CHANGE ADE
Regional Case study – Central Macedonia – October 2009 Page 6
The private sector is generally not involved in the management of the environmental infrastructure which is in the hands of public/municipal companies. However, some private involvement appeared during the covered period, namely in the management of the new landfills financed by the Cohesion Fund and in the recycling sector. Climate change, biodiversity and nature protection are outside the competences of local government, which is however responsible for observing the town plans and urban rehabilitation. The polluter pays principle is applied through the water and wastewater charges and the solid waste collection and disposal charges, without however relating the charges to the actual damage done to the environment. In a similar way, fuel taxation is an indirect way of charging fuel users, whereas serious polluters pay only when caught, and that only after long court cases. Up to 2004 the fines were collected in a special fund within the Ministry of the Environment and were used for environmental interventions. Since 2004 however, the fines have gone to the Ministry of the Economy and injected into the general budget.

EX POST EVALUATION OF COHESION POLICY PROGRAMMES 2000-2006 CO-FINANCED BY THE EUROPEAN FUND FOR REGIONAL DEVELOPMENT (OBJECTIVES 1 AND 2) - WORK PACKAGE 5B: ENVIRONMENT AND CLIMATE CHANGE ADE
Regional Case study – Central Macedonia – October 2009 Page 7
2. Regional policies and the role of the ERDF
2.1 Economic policies
The Common Strategic Framework (CSF) is the main reference in terms of regional development planning and strategy. Subsequent Regional Operational Programmes stem from the CSF at regional level, taking into consideration the specificities of each region. The fact that European mandatory programming documents have become the main national reference is an unusual situation in comparison with other Member States that usually have their own national or regional strategies and, in parallel, develop the CSF to support them. Nonetheless, public action for regional development is also influenced by the Public Investment Programme and the Investment Incentives Legislation which offers significant cash grants, tax breaks and other subsidies to potential investors. The specific objective of the regional OP was enhancing the region’s competitive position while reducing the intraregional disparities in order to create the conditions that will ensure the region’s long term sustainable development and competitiveness. Within this framework, the regional OP aimed namely at supporting private investment and promoting Thessalonica’s role as a metropolitan centre. The priority was also to reduce intra-regional disparities and encourage innovation and entrepreneurial spirit as well as to reduce unemployment.
2.2 Environmental policies
Environmental policies are mainly oriented towards reaching EU directive requirements. They do not target directly the improvement of regional attractiveness but it is recognised that they do contribute to it. Conversely, efforts in urban area rehabilitation are devoted to increasing attractiveness. Regional policies have developed in a variety of ways. In the water and wastewater sector the policies were developed on a top down approach. First the central government created a plan to apply the 91/271 Directive and this plan was used by every region to develop the regional plans. The regional plans are also directed towards the implementation of the EU Directive. On the contrary, the regional solid waste management plan has developed bottom-up, based on an addition of the prefecture plans, first at regional level and finally at national level. Regarding solid waste, the intention was to reduce waste through recycling, however the recent economic crisis has caused a drop in the demand for recycled material and the

EX POST EVALUATION OF COHESION POLICY PROGRAMMES 2000-2006 CO-FINANCED BY THE EUROPEAN FUND FOR REGIONAL DEVELOPMENT (OBJECTIVES 1 AND 2) - WORK PACKAGE 5B: ENVIRONMENT AND CLIMATE CHANGE ADE
Regional Case study – Central Macedonia – October 2009 Page 8
recycling programmes are at the moment in a very difficult position. The UWDS question became an issue after the EU prosecuted Greece for non-compliance. The planning started centrally, where a UWDS census was initiated, standards for making closure designs and EIAs were set in place and then the implementation was allocated to the regions. New environmental infrastructure is continuously needed, especially for smaller agglomerations, while the need to upgrade existing infrastructure is not yet evident, as infrastructure is fairly new, except in cases where design errors and bad practices have occurred. Regarding renewable energies, apart from incentives to improve energy efficiency, no special incentives are foreseen for the region, other than the ones in force nationally, namely profitable sales prices of electricity produce to the Public Power Corporation, bearing in mind that the major RES projects are planned for other areas of the country such as the islands. The ERDF and the Cohesion Fund were almost the only sources of financing for environmental projects, as national available funds were very limited. The strategic role of the Cohesion Fund was to develop new landfills for solid waste and water supply system, whereas the ERDF was used to complete these actions and to develop wastewater collection and treatment infrastructure. A lot of work has been done in smaller communities through the programme Theseus, which is a nationally funded programme for the improvement of the infrastructures of local government.
2.3 Actions taken
2.3.1 Environmental expenditures and main sources of funds
The table below provides an estimation of environmental expenditures in Central Macedonia during the 2000-2008 period. Investments have been primarily concentrated in water supply and waste water management. In terms of sources, the contribution of European Funds through the ERDF and Cohesion Funds should be noted. The relatively modest contribution of OP Central Macedonia to waste management is largely compensated by the emphasis for this thematic in the Cohesion Fund programmes. An increased coordination between the two funds has been established within the 2000-2006 period: the CSF develops a common strategy for Environment for both funds and both funds are managed at regional level under the same Management Authority. Cases of complementary projects funded by different European programmes and funds are common. For instance, in Kilkis, the wastewater treatment plant and the control facilities of the water supply of Stavrochori were financed by the OP CENMAK and the city water supply system controls by OP Environment. The city centre sewers were financed by OP

EX POST EVALUATION OF COHESION POLICY PROGRAMMES 2000-2006 CO-FINANCED BY THE EUROPEAN FUND FOR REGIONAL DEVELOPMENT (OBJECTIVES 1 AND 2) - WORK PACKAGE 5B: ENVIRONMENT AND CLIMATE CHANGE ADE
Regional Case study – Central Macedonia – October 2009 Page 9
CENMAK, whereas the rest of the system to neighbouring localities by the Cohesion Fund. Regarding national expenditures, substantial resources are reserved for the co-financing of European programmes. In addition, Theseus programme resources devoted to upgrading environmental infrastructure in small localities represents also a valuable amount. According to the interviewees, public subsidies are sufficient for the regional absorption capacity and the use of loans is not common.
Table 2: Estimate of environmental expenditures during the 2000-2008 period (in €m)
Central Macedonia Region Environmental Expenditures
Of which investment
Waste management
Water supply-Waste water management
General Government n.a. n.a. n.a. 120.1
of which Theseus programme 36 36 1.4 26.6 of which National Counterpart to
OP CENMAK 16 16 1.7 10.6
of which Cohesion Fund National Counterpart 61.1 61.1 26.9 34.2
ERDF OP Central Macedonia 64.2(1) 64.2 7 42.6
Per capita (€) 34 34 4 22
% of GDP 0.26% 0.26% 0.03% 0.18%
ERDF OP Environment n.a. n.a. n.a. n.a.
Cohesion Fund 183.4 183.4 80.7 102.7
Per capita (€) 96 96 42 54
% of GDP 0.76% 0.76% 0.33% 0.42%
Private Sector n.a. n.a. n.a. n.a.
(1) Considers only expenditures in protection and improvement of natural environment, solid waste management, industrial sites and water supply and sanitation.
2.3.2 ERDF contribution to environmental expenditures in the region
Within the Central Macedonia Region, ERDF environmental expenditures have been carried out through two main programmes:
The regional operational programme (OP CENAMK)
The thematic operational programme “Environment”
2.3.2.1 The regional operational programme (OP CENMAK)
The OP CENMAK committed a total of €1,517,906.556 Of which 47% was provided by the ERDF, 18% by national public funds and 19% by the private sector2. End of 2008, public expenditure amounted to €1,297,080,169.
2 In addition the ESF and the FEOGA committed 6% and 10% respectively.

EX POST EVALUATION OF COHESION POLICY PROGRAMMES 2000-2006 CO-FINANCED BY THE EUROPEAN FUND FOR REGIONAL DEVELOPMENT (OBJECTIVES 1 AND 2) - WORK PACKAGE 5B: ENVIRONMENT AND CLIMATE CHANGE ADE
Regional Case study – Central Macedonia – October 2009 Page 10
Of this amount, 16.4% was dedicated to environmental expenditures. However, it should be distinguished that 7% concerned strictu sensu environmental interventions (mainly related to water) whereas the remaining 9.4% concerned interventions in the areas of urban rehabilitation and maintenance of cultural heritage in particular on Mount Athos. The programme was structured through the following priorities:
1. Support for private investment and to promote Thessalonica’s role as a metropolitan centre (€252m)
2. Protection and development of the environment (€136m)
3. Reduction of intra-regional disparities (€544m)
4. Encouragement of innovation and entrepreneurial spirit (€171m)
5. Alleviation of unemployment (€78m)
6. Development of the upland, the interior and the less-favoured areas (€61m)
The table below summarises the commitments and the expenditures in the environment by fields of interventions.
Table 3: Environmental measures of OP CENMAK– Approved expenditures 2000-2008 (Public expenditure)
FOI code
FOI Commitments Expenditures
Initial budget
Revision In % of budget
Planned Disbursed
343 Urban and industrial waste (including hospital and dangerous waste)
4,745,830 4,558,498 2.52% 9,372,021 8,837,825
344 Drinking water (collection, storage, treatment and distribution) 21,778,720 25,471,108 14.07% 23,093,041 21,973,032
345 Sewerage and purification 30,659,200 32,395,238 17.90% 33,826,790 31,323,016 351 Upgrading and rehabilitation of industrial
and military sites 24,900,000 11,666,602 6.45% 12,603,051 7,103,709
352 Rehabilitation of urban areas 39,014,600 37,541,346 20.74% 33,639,213 31,555,693 353 Protection, improvement and regeneration
of the natural environment 8,075,400 2,898,446 1.60% 12,069,575 11,118,438
354 Maintenance and restoration of the cultural heritage
72,772,000 66,438,061 36.71% 86,054,141 83,663,190
TOTAL 201,945,750 180,969,300 100% 210,657,833 195,574,903
Note: The data presented in the table do not reflect the budget reserved for purely environmental interventions in the OP as per page 19. The data presented correspond to the funds allocated by the FoI selected in the present study. Under these codes, other interventions such as rehabilitation of buildings as well as various projects on Mount Athos are considered.

EX POST EVALUATION OF COHESION POLICY PROGRAMMES 2000-2006 CO-FINANCED BY THE EUROPEAN FUND FOR REGIONAL DEVELOPMENT (OBJECTIVES 1 AND 2) - WORK PACKAGE 5B: ENVIRONMENT AND CLIMATE CHANGE ADE
Regional Case study – Central Macedonia – October 2009 Page 11
The OP devoted entirely its priority 2 (Protection and Enhancement of the environment in Central Macedonia) to environment. The basic aims of the axis are to:
Improve the situation regarding water supply and wastewater collection and treatment.
Produce sustainable solutions for the waste management and give emphasis to prevention and not remediation after the fact. Natura 2000 areas will be of special attention. The polluter pays principle will be applied more strictly.
Restore balance in the natural environment with emphasis in sensitive areas, forests, rivers and coastal areas.
Application of environmental - urban and spatial rules: Land uses and legislation on effluents to water courses. Location of sources of pollution. Penalties in cases of excess of pollution limits in line with the "Apply the Polluter-pays principle” in a more organised manner and sensitisation of the public.
The measures under this priority are: - 2.1 Finalising the infrastructure for the management of liquid and solid waste,
water supply and sewerage - 2.2 Management of the natural environment - 2.3 Protection and enhancement of Mount Athos
In solid waste management there are 13 groups of projects, all concerned with the closure of UWDS, ranging from €300,000 to above €3m. The largest projects are the Thessaloniki phase I and II (€1,586,000 and €3,159,000) and the Pella Group I and II (€1,580,000 and €2,873,000).
In water supply and treatment there are 22 projects adopted, the largest of which are:
Renovation of existing aqueduct for WS of Pieria agglomerations €5.77m Improvement of the Serres WS €2.66m WS of Pikrolimni municipality. Kilkis €2.60m Litochoro WS €1.76m Litochoro water treatment €1.70m
WS Stavrochori basin €1.68m
In sewerage and wastewater treatment there are 17 projects, the most important of which are:
Main Collectors and treatment plant of Edessa €7.62m Main Collectors and piping of Litochoro. Plaka etc €5.92m WS and sewerage of Kilkis €4.41m Wastewater treatment of Kilkis €3.12m Under measure 2.2 there are 3 actions in infrastructure and civil protection and 3 interventions related to wetland rehabilitation.

EX POST EVALUATION OF COHESION POLICY PROGRAMMES 2000-2006 CO-FINANCED BY THE EUROPEAN FUND FOR REGIONAL DEVELOPMENT (OBJECTIVES 1 AND 2) - WORK PACKAGE 5B: ENVIRONMENT AND CLIMATE CHANGE ADE
Regional Case study – Central Macedonia – October 2009 Page 12
However, allocations are also committed to the environmental field under other measures: - 1.1 Thessaloniki as a centre of productive services - 3.4 Providing infrastructure for the increase of competitiveness in business - 3.6 Upgrading infrastructure for the development of cultural facilities - 3.8 Integrated interventions of urban development in local small scale zones-
the ERDF - 6.9 Actions for the development of mountain areas with emphasis in the
establishment of mountain centres of development- the ERDF
In urban rehabilitation, there are 93 interventions implemented in the Region of Central Macedonia under measure 3.8, a total value of €49.4m.
The most important of these are:
Pedestrian ways of Edessa €2.2m Square of White Tower of Thesaloniki €2.1m Also under measure 3.8, there were 67 interventions concerning planning studies for a total value of €17.4 m. Under measure 6.9, 3 interventions relate to mountain paths, with a total worth of €3.5m. The outputs and results of environmental measures of the programme are summarised in table 4.
Table 4: Main output and result indicators – Regional Operational Programme
Indicator name
Baseline value (2000)
Target Achieved value
1 Number of projects on water supply n.a. 13 13
2
Number of projects on wastewater 21 (sewage networks)
10 sewage
+ 5 biotreatment
9
3 Number of projects on municipal solid waste n.a. n.a. n.a.
4 Number of additional inhabitants served by water supply projects
85,000 190,000 190,000
5 % increase of the additional population served by water supply projects (compared to the baseline value) n.a. 124% 124%
6 Reduction of leakages from the water supply network n.a. n.a. n.a. 7 Increase in population served by wastewater projects n.a. 64,000 64,000
8 % increase in population served by wastewater projects (compared to the baseline value) n.a. n.a. n.a.
9 New waste treatment capacity created n.a. n.a. n.a. 10 Number of unauthorised landfills closed or rehabilitated n.a. 258 206
11 % of unauthorised landfills in the total number of the landfills operated in 2000 (for EU10 Member States only) n.a. n.a. n.a.
12
Number of inhabitants benefiting from the closure or rehabilitation of unauthorised landfills
n.a. 156,000 106,000
13 Number of flood protection projects n.a. 6 4 14 Number of water supply/wastewater projects on Mount Athos n.a. 3 3 15 Jobs created during project implementation (eq. Man-years) n.a. 2,786 2,642
16 New jobs created as a result of project implementation (eq.
Man-years) n.a. 360 194

EX POST EVALUATION OF COHESION POLICY PROGRAMMES 2000-2006 CO-FINANCED BY THE EUROPEAN FUND FOR REGIONAL DEVELOPMENT (OBJECTIVES 1 AND 2) - WORK PACKAGE 5B: ENVIRONMENT AND CLIMATE CHANGE ADE
Regional Case study – Central Macedonia – October 2009 Page 13
2.3.2.2 The thematic operational programme « Environment »
The OP Environment was implemented nationally at national level and targeted planning actions related mainly to the newly formed services of Environmental Inspectors and Water Authorities. Besides national interventions there are also regional operations3.
There are 72 interventions under 10 measures of the OP that were implemented in the Region of Central Macedonia, with a total budget value of €80.3m.
Table 5: Measures of the regional OP Measure ERDF
commitments
Nb interventions
1.2 Interventions in the areas of wastewater management and economising of water resources
€4.70m 9
2.1 Management of non‐dangerous solid waste €1.52m 4
3.2 Restoration of landscape, 5 projects €3.65m 5
4.2 Reduction of noise, one intervention €0.90m 1
5.1 Institutions €0.11m 2
6.1 Protection of soil and water resources €5.27m 2 in flood protection
6.2 Infrastructure projects in water management €32.64m 27
7.1 Town and other planning actions €3.10m 5
7.2 Restoration of the urban environment €21.37m 11
8.1 Protection and management of natural areas €7.03m 5
TOTAL €80.30m 80
Source: OP Environment list of adopted projects 17/11/2008
The most important measure is ‘6.2 Infrastructure projects in water management’. Under this measure 22 projects were financed for the closure or the rehabilitation of small UDWS with the aim to protect underground wate. for a total amount of €7.33m, of which Kalochori UWDS was the largest (€4.52m). In addition, 5 wastewater collection projects for a total amount of €25.31m were implemented, of which the largest are Alexandria (€6.56m), East Olympus (€9.12m) and Paralia Katerinis (€5.54m) all utilising idle capacity of existing treatment plants.
2.4 Planning process and coordination between all stakeholders
In Greece, regional operational programmes are managed externally to the public administration. This management authority is in charge of planning and strategy, of project selection, implementation monitoring and financial control.
3 The OP Central Macedonia incorporates some planning actions but the main responsibility rests with the OP Environment.
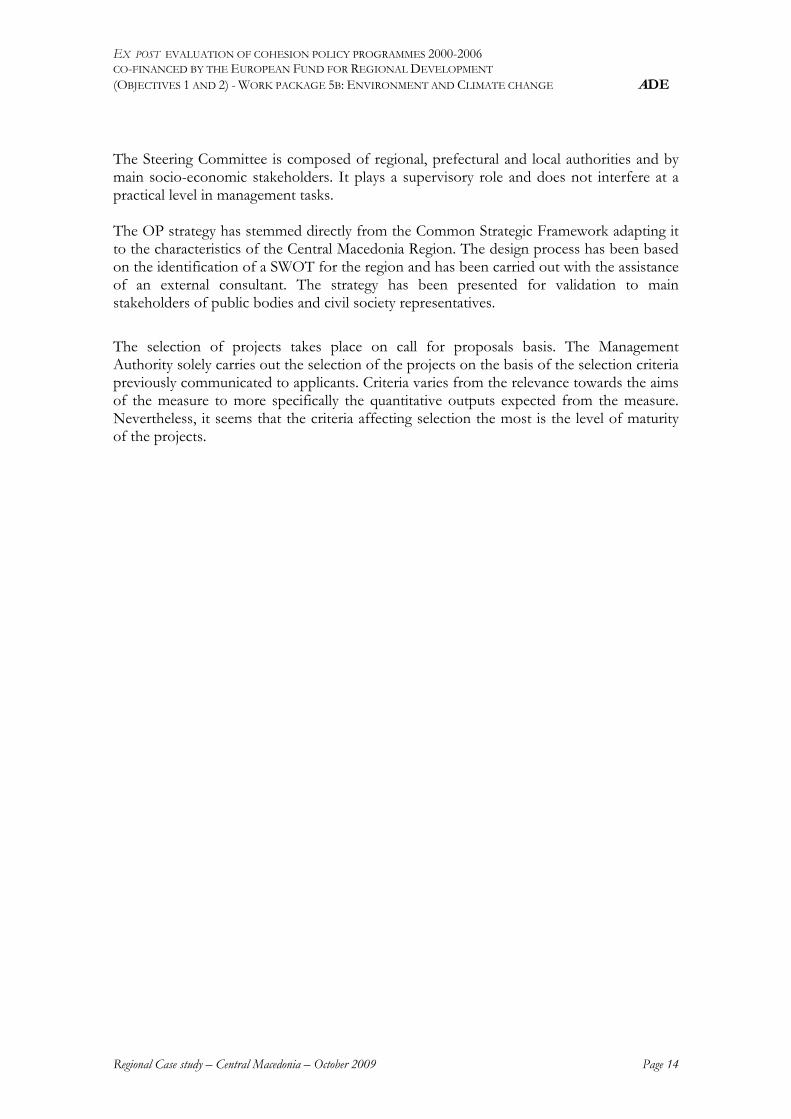
EX POST EVALUATION OF COHESION POLICY PROGRAMMES 2000-2006 CO-FINANCED BY THE EUROPEAN FUND FOR REGIONAL DEVELOPMENT (OBJECTIVES 1 AND 2) - WORK PACKAGE 5B: ENVIRONMENT AND CLIMATE CHANGE ADE
Regional Case study – Central Macedonia – October 2009 Page 14
The Steering Committee is composed of regional, prefectural and local authorities and by main socio-economic stakeholders. It plays a supervisory role and does not interfere at a practical level in management tasks. The OP strategy has stemmed directly from the Common Strategic Framework adapting it to the characteristics of the Central Macedonia Region. The design process has been based on the identification of a SWOT for the region and has been carried out with the assistance of an external consultant. The strategy has been presented for validation to main stakeholders of public bodies and civil society representatives.
The selection of projects takes place on call for proposals basis. The Management Authority solely carries out the selection of the projects on the basis of the selection criteria previously communicated to applicants. Criteria varies from the relevance towards the aims of the measure to more specifically the quantitative outputs expected from the measure. Nevertheless, it seems that the criteria affecting selection the most is the level of maturity of the projects.

EX POST EVALUATION OF COHESION POLICY PROGRAMMES 2000-2006 CO-FINANCED BY THE EUROPEAN FUND FOR REGIONAL DEVELOPMENT (OBJECTIVES 1 AND 2) - WORK PACKAGE 5B: ENVIRONMENT AND CLIMATE CHANGE ADE
Regional Case study – Central Macedonia – October 2009 Page 15
3. Analysis of the ERDF contribution
3.1 Relevance of the 2000-2006 ERDF strategy in the environmental sector for enhancing territorial development
The OP CENMAK has devoted 16.4% of the initial commitment to environmental expenditures. However, it should be distinguished that:
7% concerns strictu sensu environmental interventions. In these areas, the ERDF strategy has been mainly directed towards the completion of the water supply infrastructure and the achievement of communitarian directives of water treatment. This line of action has allowed an upgrade of basic environmental infrastructures in mid-sized agglomerations.
9.4% concerns interventions in the areas of urban rehabilitation and maintenance of cultural heritage in particular on Mount Athos.
The regional needs in terms of solid waste treatment have been mainly financed by the Cohesion Funds. ERDF interventions in this area have been more modest and have acted as a complement. An illustration of this logic is found in the OP Environment which supported the closure of small UWDS in consequence of the construction of proper landfills by Cohesion Funds. As regards water, the ERDF has confined its actions to public infrastructures and has therefore not addressed the challenges of nitrates and industrial pollution of ground and superficial water and soil considered to be a private sector problem. National strategy is based on the control of activities. It imposes a strong framework for the delivery of permits but the resources in terms of control of the effective activities in the field are weak. Biodiversity and ecosystem protection have been marginally addressed by the ERDF in this region, although there were major challenges in protecting the coastal zones against invasive construction and in the protection of lake and estuarine ecosystems.
3.2 Quality of the planning and Implementation process to meet regional challenges in the covered fields
Strong regional planning was lacking concerning the implementation process. Therefore the ERDF investments could be inserted into a regional strategy. As a consequence, the capacity of the ERDF to meet challenges in the region relied completely on the selection of the interventions. The execution delays have been moderated in the OP CENMAK. The delays encountered in the implementation of some individual projects are not linked to ERDF procedures. Work has stopped in some cases following complaints from the public, in particular for sensitive installations such as new landfills or water treatment plants. At operational level, only the reporting obligations seem overly bureaucratic to operators.

EX POST EVALUATION OF COHESION POLICY PROGRAMMES 2000-2006 CO-FINANCED BY THE EUROPEAN FUND FOR REGIONAL DEVELOPMENT (OBJECTIVES 1 AND 2) - WORK PACKAGE 5B: ENVIRONMENT AND CLIMATE CHANGE ADE
Regional Case study – Central Macedonia – October 2009 Page 16
3.3 Contribution of the ERDF to improving the environmental situation
The ERDF, through OP Central Macedonia and OP Environment had a positive contribution towards the improvement of the environmental situation in Central Macedonia. In the water supply subsector a substantial increase of people connected to an improved water supply was noted by the end of 2008. This could be estimated at approximately 220,000 additional people connected to improved water supplies since 20004 which raises connectivity to improved water supplies to around 95% compared to 87% at the beginning of the period. It can be calculated that the OP Central Macedonia contributed to around 52% of this increase (115,000 inhabitants 5 ). The OP environment has contributed to developing the control systems of the installations.
In the following programming period, a further improvement is expected in the water situation, concerning the water supply of rural settlements through mainly the Theseus programme, the savings in water resulting from better control systems and replacement of old piping in urban centres, and the large potable water collection, storage, treatment and distribution projects planned for the tourist areas of Chalkidiki.
In the wastewater collection and treatment subsector, it can be estimated that around 60% of the population is connected to a wastewater treatment plant. This represents an increase of 8% but this final figure falls short of the Ministry’s target for the end of the programming period of nearly 75%. The OP Central Macedonia has added 68,000 people and the OP Environment around 34,0006. The NSRF for 2007-2013 plans a large number of collection and treatment systems for agglomerations between 2,000 and 15,000 PE, mainly through the Cohesion Fund, which will add approximately 150,000 people to the collection and treatment systems. Highly polluted waterfronts have been freed from domestic sewage pollution.
In the solid waste sector, the ERDF has contributed to the closure of UWDS whereas the new landfills were built by the CF. The new CF landfills have increased the landfill served population by approximately 320,000, which means that the percentage of the population served by landfills is now 72%, close to the Ministry target. From the 542 UWDS in the CENMAK region to be closed in 2000, only 53 remain active today. Overall, 260 UWDS have been rehabilitated under the OP CENMAK of which 136 are in an advanced state of implementation and 51 under the OP Environment7. The closures of the 53 UWDS still 4 Based on authors' calculations on the basis of towns benefiting from new connections. 5 Theseus contributed to connecting 55,000 additional inhabitants. This calculation considers the increase of
population of about 40% of about 100,000 which went into already served urban centres. 6 In addition the Cohesion Fund has added 151,000 people and Theseus about 18,000. Add to that about 30% of the
population increase having settled in urban centres connected to a wastewater treatment plant. 7 In addition : 2 were funded by the Cohesion Fund, 123 by the Theseus programme and 23 are being restored by
municipalities. This makes a total of 459 with a budget of around €31m. At present, out of these, 323 have received certificates of closure.

EX POST EVALUATION OF COHESION POLICY PROGRAMMES 2000-2006 CO-FINANCED BY THE EUROPEAN FUND FOR REGIONAL DEVELOPMENT (OBJECTIVES 1 AND 2) - WORK PACKAGE 5B: ENVIRONMENT AND CLIMATE CHANGE ADE
Regional Case study – Central Macedonia – October 2009 Page 17
active are programmed upon the coming in service of the new landfills and are programmed through the OP Environment and Theseus. By the end of 2005, the installed capacity of renewable energies in Central Macedonia had increased by 43MW since 2000. The installed capacity in RES was of 535.55 MW of which 91.9% is large hydropower. The OP Macedonia-Thrace 2007-2013 set as a target for 2013 an increase in RES of 102 MW. In the GHG emissions sector, the only significant reductions were made through the closure of industrial units and the closure of UWDS, whereas no action was included towards combating air pollution, except indirectly, in the cases of the changeover to natural gas, brought to industrial areas by the OP. Also, air quality may have improved locally, in the case of the many urban rehabilitation interventions, especially where pedestrian ways were created.
3.4 Contribution of the ERDF to regional economic development
Economic evolution
Over the period, the GDP of Central Macedonia increased steadily impacting positively on the position of the region compared to the European average.
Table 6: GDP Cental Macedonia
Central Macedonia 2000 2001 2002 2003 2004 2005 2006
GDP/capita (in euros) 10,900 11,200 11,600 12,500 13,500 14,300 15,400
GDP/capita (at PPS; EU-25=100) (a) 69.0 70.1 71.6 71.2 73.6 74.9 n.a.
GDP annual growth rate n.a. 2.6 2.0 3.1 6.3 2.7 5.7
Sector contribution to GDP (%) (c):
In primary sector 7.9 7.7 7.6 6.9 6.3 5.9 n.a.
In secondary sector 26.8 27.1 26.3 26.4 26.5 25.3 n.a.
In tertiary sector 65.3 65.2 66.2 66.7 67.2 68.8 n.a.
Investment in % GDP (b) 30.7 38.6 40.1 36.3 29.3 n.a. n.a.
R&D in % GDP (b) n.a. n.a. n.a. 0.64 n.a. 0.58 n.a.
Primary sector GDP has been stable in absolute terms with, nevertheless, a slightly decreasing trend. The contribution of this sector to GDP has been reduced in relative terms due to the increase of secondary and particularly tertiary sectors. In the industrial sector, textiles have continued to decline given the international competition and the difference of productivity with neighbouring countries. Inversely, the production of building materials has recently expanded (a concentration of 100% of Greek production of elevators, aluminium frames, and metals). This increase was not based on specific comparative advantages but has however benefited from the booming construction sector in last 18 years.
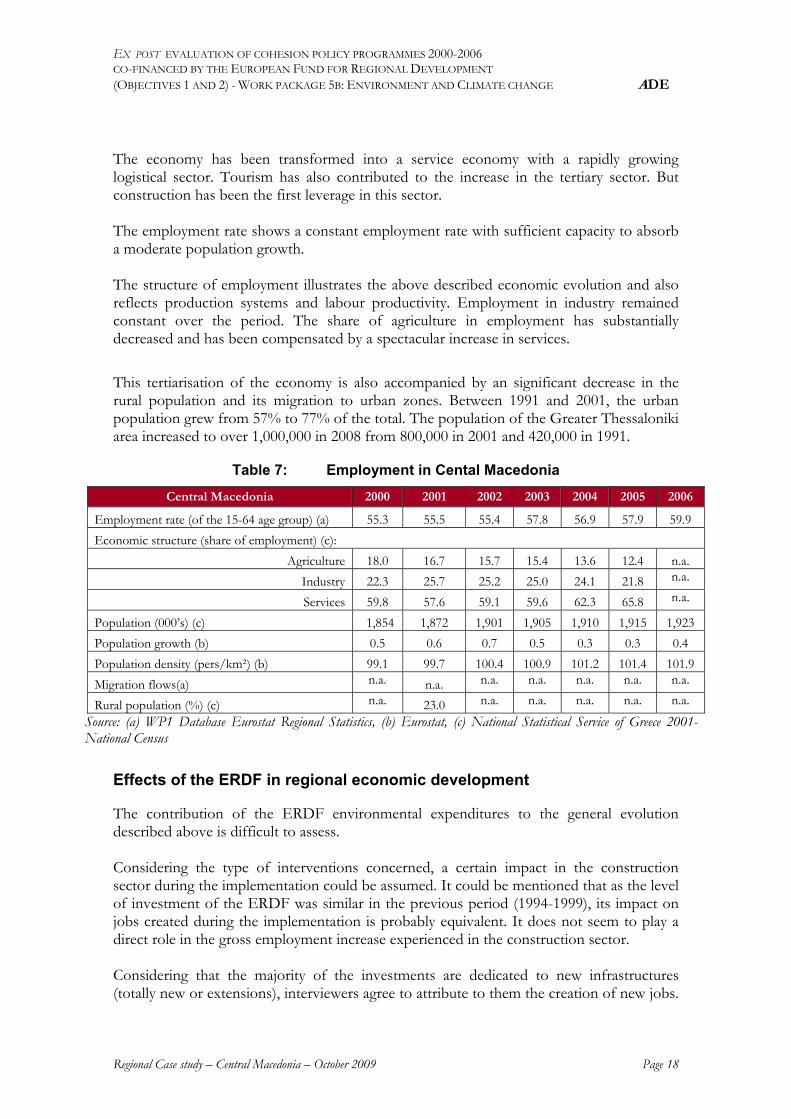
EX POST EVALUATION OF COHESION POLICY PROGRAMMES 2000-2006 CO-FINANCED BY THE EUROPEAN FUND FOR REGIONAL DEVELOPMENT (OBJECTIVES 1 AND 2) - WORK PACKAGE 5B: ENVIRONMENT AND CLIMATE CHANGE ADE
Regional Case study – Central Macedonia – October 2009 Page 18
The economy has been transformed into a service economy with a rapidly growing logistical sector. Tourism has also contributed to the increase in the tertiary sector. But construction has been the first leverage in this sector. The employment rate shows a constant employment rate with sufficient capacity to absorb a moderate population growth. The structure of employment illustrates the above described economic evolution and also reflects production systems and labour productivity. Employment in industry remained constant over the period. The share of agriculture in employment has substantially decreased and has been compensated by a spectacular increase in services.
This tertiarisation of the economy is also accompanied by an significant decrease in the rural population and its migration to urban zones. Between 1991 and 2001, the urban population grew from 57% to 77% of the total. The population of the Greater Thessaloniki area increased to over 1,000,000 in 2008 from 800,000 in 2001 and 420,000 in 1991.
Table 7: Employment in Cental Macedonia
Central Macedonia 2000 2001 2002 2003 2004 2005 2006
Employment rate (of the 15-64 age group) (a) 55.3 55.5 55.4 57.8 56.9 57.9 59.9
Economic structure (share of employment) (c):
Agriculture 18.0 16.7 15.7 15.4 13.6 12.4 n.a.
Industry 22.3 25.7 25.2 25.0 24.1 21.8 n.a.
Services 59.8 57.6 59.1 59.6 62.3 65.8 n.a.
Population (000’s) (c) 1,854 1,872 1,901 1,905 1,910 1,915 1,923
Population growth (b) 0.5 0.6 0.7 0.5 0.3 0.3 0.4
Population density (pers/km²) (b) 99.1 99.7 100.4 100.9 101.2 101.4 101.9
Migration flows(a) n.a. n.a. n.a. n.a. n.a. n.a. n.a.
Rural population (%) (c) n.a. 23.0 n.a. n.a. n.a. n.a. n.a.
Source: (a) WP1 Database Eurostat Regional Statistics, (b) Eurostat, (c) National Statistical Service of Greece 2001- National Census
Effects of the ERDF in regional economic development
The contribution of the ERDF environmental expenditures to the general evolution described above is difficult to assess. Considering the type of interventions concerned, a certain impact in the construction sector during the implementation could be assumed. It could be mentioned that as the level of investment of the ERDF was similar in the previous period (1994-1999), its impact on jobs created during the implementation is probably equivalent. It does not seem to play a direct role in the gross employment increase experienced in the construction sector. Considering that the majority of the investments are dedicated to new infrastructures (totally new or extensions), interviewers agree to attribute to them the creation of new jobs.

EX POST EVALUATION OF COHESION POLICY PROGRAMMES 2000-2006 CO-FINANCED BY THE EUROPEAN FUND FOR REGIONAL DEVELOPMENT (OBJECTIVES 1 AND 2) - WORK PACKAGE 5B: ENVIRONMENT AND CLIMATE CHANGE ADE
Regional Case study – Central Macedonia – October 2009 Page 19
Quantification is difficult to obtain8, nevertheless the projects visited show an average of 3 or 4 new jobs created directly. The impact in the creation of new activities for the private sector is limited. Private contractors are mostly and traditionally involved in construction. The management and the operation of these infrastructures, in particular water infrastructures, are handled by public/municipal enterprises in the majority of cases9. Environmental measures have contributed significantly towards the improvement of highly polluted waterfronts and rehabilitating cultural heritage. The impact of these interventions on tourism trends are not yet visible. There is evidence that rehabilitation of urban areas has increased attractiveness and has allowed for the maintenance of the existing activity (shops) and even the creation of new activities in these areas (especially cafés and restaurants). Although no formal study has been carried out on these, attractiveness is basically affecting proximity circles. Prices in the real estate market of these areas have substantially increased in these zones.
3.5 Contribution of the ERDF to improving the quality of life
The contribution of the ERDF to environmental improvements mentioned above had a crucial influence in key factors of quality of life more than in economic development, although there are no statistical measurements for an improvement of quality of life in the region. It seems that the first beneficiary of environmental investment was the population of the region. The most visible improvements are in water supply and in urban rehabilitation. In water supply, connectivity to an improved water supply has increased to European standard levels (95% against 87% at the beginning of the period). The OP Central Macedonia contributed to 52% of the increase. In urban rehabilitation, many projects were directed towards the restoration of prominent and frequently used places having a great impact on the daily life of inhabitants. This has been confirmed through interviews in the visited projects. Finally, other activities were less visible to the population such as wastewater collection and treatment –except for domestic sewage pollution at waterfronts-, the solid waste sector because they are downstream of their use. Advancements in these areas were prominent but, nevertheless, there is not yet a quantification of their positive impact on reduction of pollution and human health.
8 Indicators of the programme on this topic should be used with caution as the calculation method is not stablized.
9 Cases of private contractors operating in new sanitary landfills (Cohesion funds) are more and more common. Recycling is also an area where the private sector plays a role.


ADE s.a. Rue de Clairvaux, 40
B-1348 Louvain-la-Neuve Belgium
Tel.: +32 10 45 45 10 Fax: +32 10 45 40 99 E-mail: [email protected]
Web: www.ade.be
Ex post evaluation of cohesion policy programmes 2000-2006 co-financed by the European Fund for Regional Development (Objectives 1 and 2) – Work package 5b: Environment and Climate Change
RReeggiioonnaall ccaassee ssttuuddyy LLaazziioo
October 2009


TThhiiss rreeppoorrtt hhaass bbeeeenn pprreeppaarreedd bbyy AADDEE aatt tthhee rreeqquueesstt ooff tthhee EEuurrooppeeaann CCoommmmiissssiioonn..
TThhee vviieewwss eexxpprreesssseedd aarree tthhoossee ooff tthhee CCoonnssuullttaanntt aanndd ddoo nnoott rreepprreesseenntt tthhee ooffffiicciiaall vviieewwss ooff tthhee EEuurrooppeeaann CCoommmmiissssiioonn..
RReepprroodduuccttiioonn oorr ttrraannssllaattiioonn iiss ppeerrmmiitttteedd,, pprroovviiddeedd tthhaatt tthhee ssoouurrccee iiss dduullyy aacckknnoowwlleeddggeedd aanndd nnoo mmooddiiffiiccaattiioonnss ttoo tthhee tteexxtt aarree mmaaddee..


EX POST EVALUATION OF COHESION POLICY PROGRAMMES 2000-2006 CO-FINANCED BY THE EUROPEAN FUND FOR REGIONAL DEVELOPMENT (OBJECTIVES 1 AND 2) - WORK PACKAGE 5B: ENVIRONMENT AND CLIMATE CHANGE ADE
Regional Case study – Lazio – October 2009 Table of Contents
Table of Contents ACRONYMS
SUMMARY
1. STATUS AND FEATURES OF THE REGION ............................................................. 1
1.1 ECONOMIC SITUATION (IN 2000) .................................................................................... 1 1.2 ENVIRONMENTAL SITUATION (IN 2000) ........................................................................ 2 1.3 INSTITUTIONAL SET UP AND POLICY MAKING PROCESS ............................................ 4
1.3.1 Regional Development......................................................................................... 4 1.3.2 Environmental Sector .......................................................................................... 5
2. REGIONAL POLICIES AND THE ROLE OF THE ERDF .......................................... 7
2.1 ECONOMIC POLICIES ........................................................................................................ 7 2.2 ENVIRONMENTAL POLICIES ............................................................................................ 7
2.2.1 Main Objectives Pursued and Contribution of the Erdf ................................ 7 2.2.2 Funding strategies ................................................................................................. 8
2.3 ACTIONS TAKEN ................................................................................................................ 9 2.3.1 Environmental expenditures and main sources of funds ............................... 9 2.3.2 ERDF contribution to environmental expenditures in the region .............. 10
2.4 ERDF DECISION AND PLANNING PROCESS ................................................................. 13
3. ANALYSIS OF THE ERDF CONTRIBUTION ......................................................... 15
3.1 RELEVANCE OF THE 2000-2006 ERDF STRATEGY IN THE ENVIRONMENTAL
SECTOR FOR ENHANCING TERRITORIAL DEVELOPMENT ........................................ 15 3.2 QUALITY OF THE PLANNING AND IMPLEMENTATION PROCESS IN MEETING
REGIONAL CHALLENGES IN THE COVERED FIELDS .................................................. 15 3.3 CONTRIBUTION OF THE ERDF TO IMPROVING THE ENVIRONMENTAL
SITUATION ........................................................................................................................ 16 3.3.1 Environmental Situation : Trends over the Programming Period .............. 16 3.3.2 Contribution of the ERDF ................................................................................ 16
3.4 CONTRIBUTION OF THE ERDF TO REGIONAL ECONOMIC DEVELOPMENT ........... 17 3.4.1 Economic situation: trends over the programming period .......................... 17 3.4.2 Contribution of the ERDF ................................................................................ 17
3.5 CONTRIBUTION OF THE ERDF TO IMPROVING THE QUALITY OF LIFE ................... 18
ANNEX: PROGRAMME OF THE FIELD STUDY IN LAZIO (JULY 6TH-10TH 2009) ....... 19

EX POST EVALUATION OF COHESION POLICY PROGRAMMES 2000-2006 CO-FINANCED BY THE EUROPEAN FUND FOR REGIONAL DEVELOPMENT (OBJECTIVES 1 AND 2) - WORK PACKAGE 5B: ENVIRONMENT AND CLIMATE CHANGE ADE
Regional Case study – Lazio – October 2009 Table of Contents
LIST OF FIGURES
FIGURE 1: MAP OF THE LAZIO REGION .............................................................................. 1 LIST OF TABLES
TABLE 1: SOCIO-ECONOMIC DATA ............................................................................................. 2 TABLE 2: INDICATORS ON WATER .............................................................................................. 2 TABLE 3: INDICATORS ON WASTE ............................................................................................... 3 TABLE 4: INDICATORS ON RENEWABLE ENERGY ..................................................................... 4 TABLE 5: ENVIRONMENTAL EXPENDITURES IN ERDF-FINANCED PROJECTS
DURING THE 2000-2006 PERIOD (IN €M) ................................................................... 9 TABLE 6: ENVIRONMENTAL MEASURES – APPROVED EXPENDITURES 2000-2008 ............ 11 TABLE 7: MAIN OUTPUT AND RESULT INDICATORS RELATED
TO THE REGIONAL OP IN THE LAZIO REGION ..................................................... 12 TABLE 8: REGIONAL DATA – BUSINESS STATISTICS ................................................................ 18

EX POST EVALUATION OF COHESION POLICY PROGRAMMES 2000-2006 CO-FINANCED BY THE EUROPEAN FUND FOR REGIONAL DEVELOPMENT (OBJECTIVES 1 AND 2) - WORK PACKAGE 5B: ENVIRONMENT AND CLIMATE CHANGE ADE
Regional Case study – Lazio – October 2009 Acronyms
Acronyms
ARPA Agenzia Regionale Protezione Ambiente (Regional Environmental Protection Agency)
ATO Ambito Territoriale Ottimale (Optimal Territorial Authority) BA Basin Authority
ENEA Ente per le Nuove Tecnologie l'Energia e l'Ambiente (National Institute for New Technologies, Energy and the Environment)
FOI Field Of Intervention GHG Green House Gas OP Operational Programme WFD Water Framework Directive


EX POST EVALUATION OF COHESION POLICY PROGRAMMES 2000-2006 CO-FINANCED BY THE EUROPEAN FUND FOR REGIONAL DEVELOPMENT (OBJECTIVES 1 AND 2) - WORK PACKAGE 5B: ENVIRONMENT AND CLIMATE CHANGE ADE
Regional Case study – Lazio – October 2009 Summary
Summary: Key Messages From the Case Study in Lazio
A significant share of the regional OP has been devoted to environmental measures (52%). However, these measures were mainly used for supporting environmental policies and had no strategic role in terms of territorial economic development. Environmental measures were not integrated to other parts of the OP and the impact of the ERDF-financed environmental projects on the regional economy remained rather limited. On the other hand, the environmental part of the regional OP was totally integrated into the regional environmental strategy as one of the various available sources of funds. The choice of funding between national and EU financing was made based on pragmatic criteria. Investments are usually funded by public resources while operational costs are mainly covered by the application of the user and polluter pays principle. The decision process was a mix of a top down and bottom up approach and based on a strategy agreed between the regional authorities and the main stakeholders. The strategy reflected the specific challenges and characteristics of the region. The authorities chose to focus on a limited number of specific issues to achieve significant progress which could then be used as examples of success for further initiatives. Submitted projects were selected according to their coherence with the strategy and the final decision was made by the managing authorities leading to a set of measures and projects in line with regional priorities. One of the side effects of the ERDF has been its contribution to improving and organising the collaboration between stakeholders and to follow a strategic approach as regards environmental policy. 38% of the funds devoted to environmental measures were dedicated to infrastructures. The remaining and most significant part being allocated to projects in planning and rehabilitation, namely of urban areas. In the environmental sector as such, the ERDF has been used to address some specific sectoral issues in various sectors requiring new investments. The main driver for using the funds has been the need to comply with EU directives in both wastewater and waste sectors. Concerning water, all projects have been implemented with the objective of complying with the Urban Wastewater Directive and aimed to modernise the existing infrastructure. The main issue was the fact that constructed wetland technology was not considered as a treatment technology by the Italian legal framework at the beginning of the 2000-06 period and, as a consequence, could not be developed. An additional 273,000 citizens have been served by ERDF-financed wastewater projects. The OP was not concerned by the drinking water quality as the Lazio Region benefits from groundwater of particularly good quality.

EX POST EVALUATION OF COHESION POLICY PROGRAMMES 2000-2006 CO-FINANCED BY THE EUROPEAN FUND FOR REGIONAL DEVELOPMENT (OBJECTIVES 1 AND 2) - WORK PACKAGE 5B: ENVIRONMENT AND CLIMATE CHANGE ADE
Regional Case study – Lazio – October 2009 Summary
Municipal waste recolted per capita was higher in the Lazio Region than in the rest of the country and the landfills were almost at full capacity. The strategy of the region and of the OP as regards waste was to create alternatives to landfills by increasing recycling through ecoparks and by building thermo-valorisation plants. The contribution of the ERDF was significant for the first objective but the complexity of the sector has made the second objective impossible to reach. As regards renewable energy, the Lazio Region was lagging behind the European and Italian average, with a low share of renewable energy in total produced and consumed energy and a majority of the renewable energy coming from hydroelectric sources. The ERDF was used to begin the installation of photovoltaic panels. These pilot projects were completed by ERDF-financed awareness raising actions which had a significant impact on the promotion of renewable energy. Rehabilitation projects are mainly linked to tourism and sometimes complete other projects, namely related to soil protection against water erosion in touristic historical villages threatened by subsidence. ERDF-financed soil protection actions were carried out through pilot and experimental projects.

EX POST EVALUATION OF COHESION POLICY PROGRAMMES 2000-2006 CO-FINANCED BY THE EUROPEAN FUND FOR REGIONAL DEVELOPMENT (OBJECTIVES 1 AND 2) - WORK PACKAGE 5B: ENVIRONMENT AND CLIMATE CHANGE ADE
Regional Case study – Lazio – October 2009 Page 1
1. Status and Features of the Region
1.1 Economic Situation (in 2000)
The main characteristics of the economy of the Lazio Region at the beginning of the period were:
GDP per capita amounted to 129% of the average EU level whereas the national level
amounted to 112% of the EU average (see Table 1 on the next page). However, it has to be stressed that the region, which represents 10% of the Italian economy, is particularly heterogeneous, with both wealth and economic activity concentrated in the Province of Rome, whereas the rest of the region is significantly less prosperous.
The main challenge concerned the improvement of the transport and communication infrastructure, especially in more isolated areas.
The relocation of large companies away from the region was being observed and competitiveness problems resulted from high administrative costs as well as the small size of the majority of the enterprises. These factors made it difficult to invest in marketing or innovation and to obtain credit from banks. R&D expenditures were low (1.9% of GDP) and the synergies with research bodies and universities at an unsatisfactory level.
Private companies did not suffer from inadequate or expensive environmental infrastructure in 2000 as the main problems that the region was facing concerned the quality of the treatment of waste and wastewater. All firms were thus being served by sufficient waste and wastewater collection systems.
Figure 1: Map of the Lazio Region

EX POST EVALUATION OF COHESION POLICY PROGRAMMES 2000-2006 CO-FINANCED BY THE EUROPEAN FUND FOR REGIONAL DEVELOPMENT (OBJECTIVES 1 AND 2) - WORK PACKAGE 5B: ENVIRONMENT AND CLIMATE CHANGE ADE
Regional Case study – Lazio – October 2009 Page 2
Table 1: Socio-economic data
Socio-economic indicators 2000 2001 2002 2003 2004 2005 2006 GDP/capita (at PPS; EU-25=100) 129.3 131.2 127.2 125.3 124.4 122.9 n.a. Employment rate (of the 15-64 age group) 52.5 53.5 55.0 55.9 58.6 58.5 59.3 Unemployment rate (%) 11 10.2 8.6 8.7 7.9 7.7 7.5 GDP annual growth rate n.a. 2.0 2.7 -0.4 4.0 -0.1 1.4 Economic structure (share of employment): Agriculture 2.9 n.a. n.a. n.a. n.a. 1.9 n.a.
Industry 16.6 n.a. n.a. n.a. n.a. 15.7 n.a. Services 80.4 n.a. n.a. n.a. n.a. 82.4 n.a.
Investment in % GDP 18.4 17.5 17.9 18.4 16.5 n.a. n.a. R&D in % GDP 1.9 n.a. n.a. 1.9 1.8 1.8 n.a. Population growth -0.1 0.0 0.3 0.9 1.2 1.0 2.1 Population density (pers/km²) 303.5 303.4 303.7 306.3 310.0 312.9 319.5
Source: Eurostat, Work Package 1
1.2 Environmental Situation (in 2000)
Water Supply and Wastewater Treatment
In terms of drinking water, there was no specific problem and the region’s drinking water was totally safe. The Lazio Region benefits from groundwater of particularly good quality. Indeed, only 5% of the extracted water had to be purified, compared to more than 25% for the Italian average.
Table 2: Indicators on water
Indicator Geographical
zone 1999 2000 2001 2002 2003 2004 2005 2006 2007
% coasts with water of poor quality
Lazio 12.0 10.9 10.0 11.5 12.5 12.0 13.4 18.3 n.a.
Italy 5.6 5.5 5.4 5.8 5.5 5.9 5.7 6.4 n.a. % households reporting irregularities in water distribution
Lazio 11.1 10.9 13.5 9.3 16.2 n.a. 14.2 16.8 14.1
Italy 14.8 15.0 16.1 14.6 17.0 n.a. 13.8 14.0 13.2
Purified water in % of total extracted drinking water
Lazio 5.2 n.a. n.a. n.a. n.a. n.a. 5.3 n.a. n.a.
Italy 26.9 n.a. n.a. n.a. n.a. n.a. 31.1 n.a. n.a.
% population served by secondary and tertiary treatment
Lazio 21.6 n.a. n.a. n.a. n.a. n.a. 29.9 n.a. n.a.
Italy 47.3 n.a. n.a. n.a. n.a. n.a. 55.4 n.a. n.a.
Source: ISTAT

EX POST EVALUATION OF COHESION POLICY PROGRAMMES 2000-2006 CO-FINANCED BY THE EUROPEAN FUND FOR REGIONAL DEVELOPMENT (OBJECTIVES 1 AND 2) - WORK PACKAGE 5B: ENVIRONMENT AND CLIMATE CHANGE ADE
Regional Case study – Lazio – October 2009 Page 3
As regards wastewater treatment, the Lazio Region was not complying with the Urban Wastewater Treatment Directive. 21.6% of the population was connected to secondary and tertiary treatment, compared to a national average of 47.3%. Data on connection to total treatment, in accordance with the directive, are not available. The challenge was clearly to upgrade the treatment and not to build new networks as all the areas of the region were already connected to the system. The main issue was the fact that constructed wetland technology was not considered as a treatment technology by the Italian legal framework in 2000, and, as a consequence, could not be developed. Other challenges related to water were the defense of soil against water erosion, as well as the quality of water along the coasts, which lagged behind the national average (12% of coasts with water of poor quality, compared with 5.6% at national level).
Solid Waste
Municipal waste recolted per capita was increasing at a stable and limited rate in the late 1990s. At the beginning of the period, the amount of municipal waste recolted per capita was significantly higher in the Lazio Region than in the rest of the country. As can be seen in Table 3, the region is particularly dependent on its landfills for the treatment of solid waste. Indeed, in 2002, 93% of municipal waste was disposed of in landfills, compared with 63% at national level.
Table 3: Indicators on waste
Indicator Geographical
zone 1999 2000 2001 2002 2003 2004 2005 2006 2007
Municipal waste recolted per capita (kg)
Lazio 542.9 551.5 582.6 580.4 566.0 600.9 619.4 621.6 n.a.
Italy 498.3 508.6 516.2 522.5 521.4 535.4 540.3 551.8 n.a.
Municipal waste disposed in landfills per capita (kg)
Lazio n.a. n.a. n.a. 543.9 525.4 535.2 509.5 528.8 n.a.
Italy n.a. n.a. n.a. 338.3 327.1 320.3 310.3 313.3 n.a.
% of municipal waste disposed in landfills
Lazio n.a. n.a. n.a. 93.7 92.8 89.1 82.3 85.1 n.a.
Italy n.a. n.a. n.a. 64.8 62.7 59.8 57.4 56.8 n.a. Selectively collected waste in % of total waste
Lazio 3.4 4.6 4.2 5.5 8.1 8.6 10.4 11.1 n.a.
Italy 13.1 14.4 17.4 19.2 21.5 22.7 24.2 25.8 n.a.
Source: ISTAT
The main challenge was to develop alternatives to landfills, which were close to saturation at the beginning of the period. Thermo-valorisation and recycling were also priorities as the position of the region was behind the Italian average regarding these issues. Indeed, in 2000, only 4.6% of waste was selectively collected in the Lazio Region, compared with a national average of 14.4%.

EX POST EVALUATION OF COHESION POLICY PROGRAMMES 2000-2006 CO-FINANCED BY THE EUROPEAN FUND FOR REGIONAL DEVELOPMENT (OBJECTIVES 1 AND 2) - WORK PACKAGE 5B: ENVIRONMENT AND CLIMATE CHANGE ADE
Regional Case study – Lazio – October 2009 Page 4
Climate Change and Renewable Energies
As in the rest of the country, Green House Gas (GHG) emissions did not decrease during the 1990s. Rather, they continued increasing, though at relatively low levels. Energy efficiency of regional enterprises was relatively slow, namely due to the absence of promotion and awareness raising policies. The share of produced and consumed renewable energy was low in the Lazio Region. Moreover, more than 90% of consumed renewable energy came from hydroelectric sources. On the other hand, biomass and wind energy were very limited and photovoltaic energy non-existent. The challenge was to increase the share of renewable energy and to diversify its production and consumption in the region.
Table 4: Indicators on renewable energy
Indicator Geogra phical zone
1999 2000 2001 2002 2003 2004 2005 2006 2007
Renewable energy in % of total produced energy
Lazio n.a. 3.7 4.5 2.9 3.9 7.3 6.1 6.7 5.8
Italy n.a. 19.1 20.3 17.7 16.7 18.7 16.9 16.9 16.0
Consumed energy from renewable sources in % of total consumed energy
Lazio n.a. 5.2 5.4 3.8 4.9 6.7 6.1 5.9 3.8
Italy n.a. 16.0 16.8 14.6 13.9 15.8 14.1 14.6 13.7
Consumed energy from renewable sources (excluding hydroelectric sources) in % of total consumed energy
Lazio n.a. 0.3 0.4 0.7 1.4 1.6 1.5 1.5 1.4
Italy n.a. 2.2 2.5 2.8 3.3 3.7 3.9 4.2 4.6
Source: ISTAT
1.3 Institutional Set Up and Policy Making Process
1.3.1 Regional Development
The regional authority is the only responsible body as regards regional economic development, both for implementation and strategy. The central government is not involved in this process but can sometimes play an advisory role. Within the regional authority, the Economic Development Department is the competent body. It determines the strategy for regional development in collaboration with the social partners: business associations, trade unions, municipalities, provinces, universities and research insitutes. Thanks to this regional process, the strategy can be determined by taking the characteristics, challenges and opportunities of the region into account. The regional authority is also responsible for the management and the implementation of the national and EU-funded development programmes.

EX POST EVALUATION OF COHESION POLICY PROGRAMMES 2000-2006 CO-FINANCED BY THE EUROPEAN FUND FOR REGIONAL DEVELOPMENT (OBJECTIVES 1 AND 2) - WORK PACKAGE 5B: ENVIRONMENT AND CLIMATE CHANGE ADE
Regional Case study – Lazio – October 2009 Page 5
1.3.2 Environmental Sector
Within the regional authority, the Direction for the Environment is in charge of environmental issues, except for waste and water, which are the competency of the Territorial Department. These two departments are responsible for the determination of regional strategy and the supervision of implementation. The central government is thus not directly involved and its role is limited to advisory. As regards water, the implementation is divided in two sections. For water destined for agriculture (irrigation) and defence of soil against water erosion, the policy is implemented by the Basin Authorities (BA), which was created in 2003, in accordance with the Water Framework Directive (WFD). There are national BA (responsible for water reserves that are not entirely in one single region; there are four such national BA in the Lazio Region), regional BA (one per region; competent mainly for soil defence) and local BA. The local BA are managed by the Consortiums. A Consortium is a public body, under the authority of the region. It is responsible for irrigation and the water network for agriculture of the local area. It is financed by the farmers. Regarding drinking water and wastewater (not linked to agriculture), there are two regional strategies determined by the Territorial Department: one for the quality of water and the other for the water network. These strategies are implemented by the Optimal Territorial Authority (Ambito Territoriale Ottimale (ATO) in Italian). There are five ATOs (one for each of the five provinces) in the Lazio Region. The province and the municipalities are represented in the ATO. For each ATO, there is a Management company which is responsible for the management of the water supply and the collection and treatment of wastewater, even though the municipalities are responsible for the development and the design of the network. Up to 2008, the five provinces of the Lazio Region were responsible for the implementation of waste policies, in collaboration with municipalities and under the authority of the “Commissioner”, a person named responsible for waste by the Region. Until 2002, each province elaborated its own strategy for waste. As of 2002, the five provincial strategies were replaced by a single regional strategy (determined by the Territorial Department). In 2008, the role of the Commissioner was suppressed and ATOs were created for waste management and for water1. The private sector is involved in the environmental infrastructure. Waste and wastewater treatment plants are constructed by private companies, following a tender opened by the municipality and within the framework of the strategy set by the Territorial Department and implemented by the ATO. The plant is always owned by the municipality but is managed by the Management company (one per ATO), which is completely private, completely public or private-public.
1 There are five ATOs for the province of Rome (one for Rome and four for the rest of the province) and one ATO for each of the four other provinces. ATOs are directed by the provinces but they collaborate closely with the municipalities. As for water, for each ATO, there is a management company, responsible for the collection and treatment of waste.


EX POST EVALUATION OF COHESION POLICY PROGRAMMES 2000-2006 CO-FINANCED BY THE EUROPEAN FUND FOR REGIONAL DEVELOPMENT (OBJECTIVES 1 AND 2) - WORK PACKAGE 5B: ENVIRONMENT AND CLIMATE CHANGE ADE
Regional Case study – Lazio – October 2009 Page 7
2. Regional Policies and the Role of the ERDF
2.1 Economic Policies
The main challenge in terms of development of the economy was the improvement of the transport and communication infrastructure in order to address intra-regional disparities. In this framework, the regional strategy aimed at developing the network in isolated areas and at enhancing public transport services. The objective was also to decrease the use of cars and the transport of goods by road. In this regard, several ERDF-financed projects under priority 2 focused on developing ports, roads and multimodal transport. Another clear objective of the regional strategy was to develop “Areas of industrial development” with the aim of supporting private companies without direct public subsidies but rather with incentives and administrative simplification. These areas facilitate the creation of sectoral clusters through a better collaboration with universities and research bodies in order to increase innovation and new technologies. This strategy addresses the competitiveness problem resulting from the small sizes of companies. The ERDF has been used as an instrument to support this strategy. Priority 2 aimed at developing and strengthening SMEs, through improved business and financial services as well as support to productive investments. The focus of this priority was clearly put on innovation promotion. The ERDF was also used through priority 4, which aimed at enhancing human resources and namely at facilitating links between universities and the private sector. A last important objective has been the development of tourism and especially agri-tourism with a link to the development of quality and organic agriculture. The ERDF was involved through priority 3 which consisted of projects of rehabilitation and development of integrated tourism activities.
2.2 Environmental Policies
2.2.1 Main Objectives Pursued and Contribution of the Erdf
Complying with the EU directives in the field of water is definitely the main driver for the determination of the strategy and the implementation of the sectoral policy and the projects. The creation of the Basin Authorities for soil defence against water erosion and for water irrigation destined for agriculture was designed in order to comply with the Water Framework Directive. The policy and the projects in the field of wastewater treatment all aimed at complying with the Urban Wastewater Directive. Quantitative objectives were set, in coherence with the general strategy which focused on reaching EU standards.

EX POST EVALUATION OF COHESION POLICY PROGRAMMES 2000-2006 CO-FINANCED BY THE EUROPEAN FUND FOR REGIONAL DEVELOPMENT (OBJECTIVES 1 AND 2) - WORK PACKAGE 5B: ENVIRONMENT AND CLIMATE CHANGE ADE
Regional Case study – Lazio – October 2009 Page 8
National and ERDF funds were used as investment capital in the projects, which consisted mainly of upgrading the existing infrastructure. The operational costs are then totally supported by the users. Regarding waste, the strategy was not to decrease waste generation but rather to develop alternatives to landfills which were reaching full capacity. Moreover, the goal was also the closure of illegal dumps. The main objective, within this framework, has been to increase recycling in accordance with the EU directive, thanks to eco-parks. In a second step, the aim was also to develop thermo-valorisation. Concerning renewable energies, there was no incentive but only direct subsidies from the ERDF, allocated by the provinces to place photovoltaic panels on the roofs of schools. The strategy was also to improve communication to promote the use of renewable energies, namely with the publication on the internet of GHG emissions savings. Incentives are used to increase energy efficiency, through “eco labels” for enterprises (no involvement of the ERDF). The strategy also consisted of organising a coordinated management system to improve collaboration between stakeholders and think more in terms of strategy. The link between environmental measures and regional attractiveness is not obvious. Indeed, the challenge concerned the treatment of waste and wastewater but not the connections and collections. As a result, the impact in terms of attractiveness for the companies remains limited. As regards soil defence, water irrigation and rehabilitation of environmental and cultural areas, the main consequences are linked to improved quality of life, agriculture and tourism.
2.2.2 Funding strategies
The ERDF has no particular strategic role in the regional environmental policies. The regional OP has been used to partially fund the environmental strategy and, in this sense, was fully integrated. The choice of funding between national and EU funds is made on pragmatic criteria depending on the needs of each project and the available budgets. There was no EIB loan for environmental projects in the Lazio Region. The polluter-pays principle and the user-pays principle are strongly applied in Italy. All collection, treatment and maintenance costs are covered by the inhabitants and the private companies, both for waste and water. The funds are directly allocated to the companies that manage the collection and treatment system. On the contrary, investment costs are covered by public financing.

EX POST EVALUATION OF COHESION POLICY PROGRAMMES 2000-2006 CO-FINANCED BY THE EUROPEAN FUND FOR REGIONAL DEVELOPMENT (OBJECTIVES 1 AND 2) - WORK PACKAGE 5B: ENVIRONMENT AND CLIMATE CHANGE ADE
Regional Case study – Lazio – October 2009 Page 9
2.3 Actions taken
2.3.1 Environmental expenditures and main sources of funds
During the 2000-2006 period, €464m (52% of the total) was disbursed in environmental expenditures within the framework of ERDF-financed projects, accounting for slightly more than half of the total expenditures of the regional OP. Out of this amount, €178m (38%) was dedicated to environmental infrastructure.
Within the framework of the projects in which it participated, the ERDF financed 45% of the total, whereas the share of the state, region and municipalities amount to 38%, 12.5% and 4% respectively. The private sector was not involved at all in the ERDF-financed projects and it proved impossible to collect data on environmental private expenditures (outside the ERDF). However, it can be stated that the involvement of the private sector in environmental expenditures is twofold. Firstly, private companies are largely and increasingly involved in the management companies which deal with collection and treatment of waste and wastewater. Secondly, during the period, private companies made important investments in order to increase their energy efficiency. The “eco labels”, whose number significantly increased in the region during the period, have played their role by providing an incentive to invest in energy efficiency.
Table 5: Environmental expenditures in ERDF-financed projects during the 2000-2006 period (in €m)
Measure Name FOI* ERDF State Regio
n Local Private Total
1.1 Development of the regional environmental patrimony
34 34.9 24.5 10.4 0.0 0.0 69.9
1.2 Waste collection and treatment systems
343 7.7 5.4 1.0 1.3 0.0 15.4
1.3 Production of renewable energy
332 4.9 3.4 1.0 0.5 0.0 9.7
1.4 Awareness-raising and environmental information
34 4.0 2.8 1.2 0.0 0.0 8.0
2.2 Reorganization and adjustment of the water system
344/345 42.4 29.7 12.7 0.0 0.0 84.7
3.1 Infrastructure and land 35 67.4 72.7 19.8 10.2 0.0 170.2
3.2
Rehabilitation and valorisation of environmental and cultural areas
352 49.6 38.5 12.0 5.7 0.0 105.8
Total expenditures in evironmental infrastructure
89.1 62.3 25.4 1.3 0.0 178.1
Total environmental expenditures 210.9 177.0 58.2 17.7 0.0 463.8
per capita (in €) 40.5 34.0 11.2 3.4 0.0 89.0
Total expenditures in the OP 387.6 356.1 121.2 19.5 0.0 884.4
% of environmental expenditures 54.4 49.7 48.0 90.7 0.0 52.4 Source: OP annual report December 2008 * Field of intervention

EX POST EVALUATION OF COHESION POLICY PROGRAMMES 2000-2006 CO-FINANCED BY THE EUROPEAN FUND FOR REGIONAL DEVELOPMENT (OBJECTIVES 1 AND 2) - WORK PACKAGE 5B: ENVIRONMENT AND CLIMATE CHANGE ADE
Regional Case study – Lazio – October 2009 Page 10
2.3.2 ERDF contribution to environmental expenditures in the region The regional OP started in 2001 and was closed in June 2009. Objective 2 areas covered 45% of the Lazio Region and phasing-out areas accounted for 30.8%. Thus 75.8% of the region was concerned by the OP. However, in terms of the population, the objective 2 and phasing out areas represented only a population of 1.8 million, compared to a total population of 5.26 million for the whole region. This reflects the fact that the central Rome area was not covered by the OP. During this period, ERDF funds were used for a total amount of €211m, out of which €89m was dedicated to infrastructure. Measure 1.1 concerned soil defense, which was one of the main challenges of the region. This measure was a success. €70m (15% of environmental expenditures) was spent within the framework of this measure. It was namely used to conduct experimental projects and more funds were spent than planned, thanks to reallocation from Measure 1.2. Measure 2.2, Reorganisation and adjustment of the water system, gathers all the projects in water infrastructure. At the beginning, 30 projects had been planned, it was revised to 153 but by the end of the programme, 190 projects were involved. These projects concerned namely the upgrading of wastewater treatment and enabled significant progress to be made as regards the Urban Wastewater Treatment Directive. As can be seen in Table 7, targets regarding additional population served by water supply and wastewater treatment have both been exceeded. €85m was spent for this measure, which accounts for 18% of all environmental expenditures of the OP. This was more than planned, reflecting the reallocation of funds from Measure 1.2.

EX POST EVALUATION OF COHESION POLICY PROGRAMMES 2000-2006 CO-FINANCED BY THE EUROPEAN FUND FOR REGIONAL DEVELOPMENT (OBJECTIVES 1 AND 2) - WORK PACKAGE 5B: ENVIRONMENT AND CLIMATE CHANGE ADE
Regional Case study – Lazio – October 2009 Page 11
Table 6: Environmental measures – Approved expenditures 2000-2008
FOI code
Field of intervention
Total ERDF amount (EUR)
allocation
Total national
funds (EUR)
allocation
Total allocation
Planned expenditure at the end
of the programme
332
Renewable sources of energy (solar power, wind power, hydro-electricity, biomass)
5,145,750 5,145,750 10,291,500 9,716,074
34 Environmental infrastructure (including water)
33,375,716 33,375,714 66,751,430 77,938,193
343
Urban and industrial waste (including hospital and dangerous waste)
13,030,035 13,030,034 26,060,069 15,448,732
344
Drinking water (collection, storage, treatment and distribution)
11,341,674 11,341,673 22,683,34784,728,808
345 Sewerage and purification
26,463,905 26,463,904 52,927,809
35 Planning and rehabilitation 69,158,483 105,022,822 174,181,305 170,177,851
352 Rehabilitation of urban areas
17,571,161 20,032,431 37,603,592 105,782,367
Source: WP1; managing authorities, July 2009 The strategy of Measure 1.2, Collection systems and waste treatment, was twofold. On one hand, the goal was to develop ecoparks and on the other hand to build thermo-valorisation plants. The second objective proved excessively complicated due to the different levels of competent bodies involved (provinces were responsible for waste whereas regions were competent for energy). This measure consisted thus exclusively to develop eco-parks in order to create alternatives to landfills and increase recycling. €15.4m was spent on this measure; the surplus of unused funds was reallocated to projects in the fields of soil (Measure 1.1) and water (Measure 2.2). Measure 1.3, Production of renewable energy was difficult at the beginning, namely due to the fact that the concept of renewable energy was still largely unknown in Italy in 2000. At first the strategy was to involve the private sector but the tender proved unsuccessful. As a result, the regional authority decided to implement this measure through the provinces, which organised the placing of photovoltaic panels on the roofs of schools. This, together with linked communication and awareness raising actions, has been the sole type of project implemented under this measure. €9.7m has been allocated, which is much closer to the allocated amount. Measure 1.4, Actions of environmental sensibilisation and information, managed by ARPA, concerned environmental monitoring systems. Eight experimental monitoring systems

EX POST EVALUATION OF COHESION POLICY PROGRAMMES 2000-2006 CO-FINANCED BY THE EUROPEAN FUND FOR REGIONAL DEVELOPMENT (OBJECTIVES 1 AND 2) - WORK PACKAGE 5B: ENVIRONMENT AND CLIMATE CHANGE ADE
Regional Case study – Lazio – October 2009 Page 12
were developed under this measure. These experimental projects comply with the EU directive regarding the control of air quality and the communication of abnormal values. Priority 3 concerned projects in planning and rehabilitation, namely of urban areas. The actions aimed at enhancing the local infrastructure and valorising environmental and cultural heritage. The funds were used mainly for touristic purposes and the creation or renovation of green areas. These projects were in coherence with the strategic objective to develop tourism and agri-tourism and were often combined with other ERDF-funded projects, namely actions related to soil protection against water erosion, for example in the numerous historical villages situated at the tops of hills, threatened by subsidence.
Table 7: Main output and result indicators related to the regional OP in the Lazio Region
Indicator Unit Lazio
Target value
Achieved value
Number of projects in water supply number 35 31
Number of projects in wastewater number 118 151
Number of projects in municipal solid waste number n.a. 38
Number of additional inhabitants served by water supply projects
person 5,800 11,862
% increase of the additional inhabitants served by water supply projects (compared to the baseline value)
% n.a. n.a.
Reduction of leakage from the water supply network (% decrease compared to the baseline)
% n.a. n.a.
Number of additional inhabitants served by wastewater projects
person 100,000 273,393
% increase of additional inhabitants served by wastewater projects (compared to the baseline value)
% n.a. n.a.
New capacity of waste treatment created million
m³/ year 0.100 0.002
Number of unauthorised landfills closed/ rehabilitated number n.a. n.a.
% of unauthorised landfills in the total number of the landfills operated in 2000 (for EU-10 Member States only)
% n.a. n.a.
Number of additional inhabitants served by solid waste projects
number n.a. n.a.
Sources: Work Package 2; annual report of the regional OP (2006)

EX POST EVALUATION OF COHESION POLICY PROGRAMMES 2000-2006 CO-FINANCED BY THE EUROPEAN FUND FOR REGIONAL DEVELOPMENT (OBJECTIVES 1 AND 2) - WORK PACKAGE 5B: ENVIRONMENT AND CLIMATE CHANGE ADE
Regional Case study – Lazio – October 2009 Page 13
2.4 ERDF decision and planning process
Within the regional authority, the “management authority” is in charge of the management of the regional OP. For each measure, a person from the regional authority is named responsible and integrated into the management authority. The approach which characterises the management of the OP is a mix between top-down and bottom-up. In collaboration with the Direction for the environment and the Territorial Department, the management authority determines the strategy for each measure, based on the challenges and opportunities that characterise the region in this sector. In the first steps, the approach is thus purely top-down, even though, during the process of the determination of the strategy, the social partners are also consulted: business associations, research institutes (namely ENEA, the national institute for new technologies, energy and the environment), universities, trade unions, municipalities, provinces and the ARPA. The process is thus entirely regional and central government is not involved. The selection of the projects follows a bottom-up approach and is based on the project application submitted by the potential beneficiaries. The application is analysed by the person responsible for the measure, who takes the decision in collaboration with the Direction for the Environment and the Territorial Department. The selection process is only based on sectoral criteria as it is determined by the strategy that has been defined for the measure: the projects are selected on the basis of their coherence with the strategy, but without any link with the other parts of the OP or any specific instrument such as cost/benefit analysis. However, depending on the sector, there can be some specific approach. For example, for soil, the projects are selected according to the threat to the soil (on a scale from 1 to 4). The choice of financing between the EU and regional funds is then made by the person responsible of the measure, based only on the availability of funds. Those responsible for the measures within the regional authority also manage the implementation and monitoring of the OP.2 In general, the planning process has been efficient and has enabled the management of the OP to be coherent with the strategy. There was no particular problem regarding the disbursement of funds, except for Measure 1.2 on waste, for which it proved impossible to develop thermo-valorisation at this stage due to an excessively complicated situation as regards competencies (provinces were competent for waste and region for renewable energy). Another problem concerned Measure 1.3 on renewable energy, for which the call for tenders addressed to the private sector has been totally unsuccessful.
2 The responsible person within the regional authority for each measure had to use a centralised online programme,
called “Monitweb”. This programme was used to send financial data every three months on the progress of the projects. These figures were then collected of the Ministry of the Economy


EX POST EVALUATION OF COHESION POLICY PROGRAMMES 2000-2006 CO-FINANCED BY THE EUROPEAN FUND FOR REGIONAL DEVELOPMENT (OBJECTIVES 1 AND 2) - WORK PACKAGE 5B: ENVIRONMENT AND CLIMATE CHANGE ADE
Regional Case study – Lazio – October 2009 Page 15
3. Analysis of the ERDF Contribution
3.1 Relevance of the 2000-2006 ERDF Strategy in the Environmental Sector for Enhancing Territorial Development
The strategy of the OP for the environment in 2000-2006 was characterised by a clear willingness to focus on one precise issue within each environmental field: complying with the Urban Wastewater Treatment Directive, developing alternatives (ecoparks) to landfills, defence soil against water erosion, installing photovoltaic panels on the roofs of schools and developing touristic infrastructure are almost the only projects which were financed under this OP and were chosen according to the challenges and the specific situation of the Lazio Region. Given the delay of the region regarding the environment compared to the EU level and in the knowledge that environmental consciousness was still relatively lagging behind other regions, the regional authorities chose to focus on specific challenges and to try to achieve significant progress that could subsequently be used as an example of success for further initiatives. The main impact of environmental investment on territorial development has been local: Projects in soil defence against water erosion have been especially implemented in
isolated areas where the population has been decreasing because of relatively difficult living conditions. These projects are essential to prevent a worsening of the geological situation and a complete desertion of these small villages. Moreover, these projects often concern historical villages where tourism is important and these actions are often completed with ERDF-financed projects of rehabilitation which aim at enhancing the tourism infrastructure. This also contributes to decreasing the dependency of the regional tourist industry on Rome.
Projects linked to water irrigation in agricultural areas aim at solving problems caused by water shortages in summer. These actions significantly increase the attractiveness of these areas for agricultural professionals.
The creation of ecoparks in small cities aims to solve problems linked to landfills and illegal dumps and contribute to increasing the attractiveness of these places.
3.2 Quality of the Planning and Implementation Process in Meeting Regional Challenges in the Covered Fields
The process to determine the strategy was purely regional, as central government was not involved. Moreover, besides the regional authority, all the social partners have been involved in the process. This enabled the main challenges of the region to be taken into account, namely, organising the regional OP and addressing them effectively.

EX POST EVALUATION OF COHESION POLICY PROGRAMMES 2000-2006 CO-FINANCED BY THE EUROPEAN FUND FOR REGIONAL DEVELOPMENT (OBJECTIVES 1 AND 2) - WORK PACKAGE 5B: ENVIRONMENT AND CLIMATE CHANGE ADE
Regional Case study – Lazio – October 2009 Page 16
Within the regional authority, even though the Direction for the Environment and the Territorial Department were involved in the implementation of the OP, someone had been clearly named responsible for each measure, from the determination of the strategy to the selection process and the implementation and monitoring of the projects. This has proved to be successful management which enabled maintenance of the coherence of the measure and the effective adaptation of the implementation, according to the difficulties encountered during the period. The choice of the source of funding has been very efficient thanks to a very pragmatic process as the funding authorities chose between the different sources on the basis of the available funds and limitations.
3.3 Contribution of The ERDF to Improving the Environmental Situation
3.3.1 Environmental Situation : Trends over the Programming Period
Italy adopted the Urban Waste Water Treatment Directive in 1999, which facilitated the diffusion of constructed wetlands as a cost-effective means of secondary and tertiary wastewater treatment. This is reflected in the connection rate of the population to secondary and tertiary treatment, which increased from 21.6% in 1999 to 29.9% in 2005 in the Lazio Region. Similar to the rest of the country, municipal waste recolted per capita increased during the period. However, the proportion of waste disposed in landfills decreased from 94% in 2002 to 85% in 2005 for the Lazio Region. This trend is obviously connected to the increasing share of selectively collected waste, which increased from 3.4% in 1999 to 11% in 2006, even though this proportion still lags behind the national average. The popularity of renewable energy has significantly increased, as has their use, especially for biomass (currently 20% of renewable energy; from agriculture and waste), wind energy and photovoltaic energy (from 0% to 1.1% of renewable energy thanks to the ERDF in the 2000-08 period). As a result, hydroelectric energy only currently accounts for 60% of renewable energy, compared with 90% at the beginning of the period.
3.3.2 Contributi on of the ERDF
In the water sector, the ERDF was used with the clear aim of improving the compliance of the Lazio Region with the Urban Wastewater Treatment Directive. The projects were selected and implemented in coherence with this goal and the improvements were significant during the period. On the other hand, the ERDF also contributed to improving the irrigation system as well as to implementing experimental projects in soil defense against water erosion. The ERDF contributed to the decreasing share of municipal waste disposed of in landfills. Indeed, as regards waste, the strategy consisted of creating alternatives to landfills, which

EX POST EVALUATION OF COHESION POLICY PROGRAMMES 2000-2006 CO-FINANCED BY THE EUROPEAN FUND FOR REGIONAL DEVELOPMENT (OBJECTIVES 1 AND 2) - WORK PACKAGE 5B: ENVIRONMENT AND CLIMATE CHANGE ADE
Regional Case study – Lazio – October 2009 Page 17
were approaching total capacity. Within this framework, the ERDF financed the building of ecoparks, which is reflected by the increasing share of selectively collected waste. In terms of renewable energy, the ERDF was exclusively used to install photovoltaic panels on the roofs of schools. However, these projects were totally experimental in the Lazio Region and they were completed by important awareness raising actions in order to promote renewable energy among the regional population. The ERDF contributed to setting up a management system in the environmental sector, in order to facilitate collaboration between the different stakeholders and help them develop strategies.
3.4 Contribution of the ERDF to regional economic development
3.4.1 Economic situation: trends over the programming period
During the 2000-2006 period, the Lazio Region, as the rest of the country, suffered from slow growth, mainly due to the competitiveness problems that characterise Italy. However, it can be seen in Table 1 that the Lazio Region’s economy is more cyclical compared to the national economy, for which growth varied between 0.1 and 1.8% during the 2001-2005 period, whereas for the Lazio Region, the rate ranged between -0.4 and 4%. Regarding unemployment, the situation improved during the period, from 11% in 2000 to 7.5% in 2005. On the contrary, the situation did not improve concerning the investment rate and R&D expenses compared to GDP.
3.4.2 Contributi on of the ERDF
The impact of the ERDF environmental measures on regional economic development has remained rather limited. The measures of the OP related to the environment aimed at solving environmental problems characterising the Lazio Region but did not have obvious connections to the regional economic development strategy. Moreover, as the OP has just been closed, it is still too soon to assess precisely the economic impacts. Projects in water irrigation aimed at solving water shortages have contributed to increasing the attractiveness of some areas for agricultural professionals and should have a positive impact on their competitiveness in the future. Thanks to new systems, agricultural production will be less vulnerable to climatic conditions, which should improve income and employment stability for the sector in the future. Ecoparks have created jobs and are destined to be managed by private companies in the medium-term. As can be seen in the table below, the changes in terms of local units or employment were not significant in the sector of recycling during the 2000-2006 period.

EX POST EVALUATION OF COHESION POLICY PROGRAMMES 2000-2006 CO-FINANCED BY THE EUROPEAN FUND FOR REGIONAL DEVELOPMENT (OBJECTIVES 1 AND 2) - WORK PACKAGE 5B: ENVIRONMENT AND CLIMATE CHANGE ADE
Regional Case study – Lazio – October 2009 Page 18
Table 8: Regional data – business statistics
Activities linked to the environment
Sector 2000 2001 2002 2003 2004 2005 2006
Number of local units
Recycling 177 178 162 154 185 166 182
Water (1) 75 23 60 59 64 57 64 Gross investment in tangible goods (in millions of euros)
Recycling 7.0 8.0 13.3 6.9 20.8 10.0 8.4
Water (1) 39.6 13.2 12.8 29.1 21.7 29.5 53.1
Number of people employed
Recycling 633 634 728 674 760 810 830
Water (1) 2298 1397 1540 1718 1932 2086 2435 (1) Collection, purification and distribution of water
Source: Eurostat (ADE) –( Employment, Number of local units, Gross investment in tangible goods, Growth rate of employment, Investment per person employed)
Projects in soil defence against water erosion, (sometimes completed by rehabilitation projects) have contributed to the development of tourism in remote historical villages. The development of tourism and especially agri-tourism was a priority of the OP, and more particularly of the rehabilitation actions. The building or enhancing of touristic infrastructure aims at attracting more foreigners and local inhabitants to take short trips outside Rome, which should subsequently be reflected by increasing revenue and employment linked to tourism.
3.5 Contribution of the Erdf to Improving the Quality of Life
The effect in terms of quality of life was very specific to certain places and is very local. The first impact in terms of quality of life is related to soil defence with a local positive impact for the remote villages concerned, which had previously experienced dangerous subsidence. Another contribution is related to ecoparks that helped to diminish the amount of waste disposed of in illegal dumps. Finally, the projects in rehabilitation will also have some positive local impacts, thanks to the rehabilitation of urban areas and namely the creation of green areas.

EX POST EVALUATION OF COHESION POLICY PROGRAMMES 2000-2006 CO-FINANCED BY THE EUROPEAN FUND FOR REGIONAL DEVELOPMENT (OBJECTIVES 1 AND 2) - WORK PACKAGE 5B: ENVIRONMENT AND CLIMATE CHANGE ADE
Regional Case study – Lazio – October 2009 Page 19
Annex: Programme of the Field Study in Lazio (July 6th-10th 2009)
Monday 6.7. Tuesday 7.7. Wednesday 8.7. Thursday 9.7. Friday 10.7.
Morning o Project in water infrastructure (irrigation system for agriculture; measure 2.2) in Latina. Meeting with the water “consortium” of the Latina area Engineers Maurizio Iannella and Stefano Salbitani
o Meeting at Regione Lazio Rosanna Bellotti, Coordination manager Massimo Americola, responsible for the management of the OP Guido Magrini, Management authority Raniero De Filippis, Environmen, Direction for the Environment Giuseppa Bruschi, responsible of measure 1.3 Giuseppe Tanzi and Francesco Gubernale, responsible for measure 1.1 Giorgio Maggi, responsible for measure 2.2
o Meeting at ENEA (environmental research institute)
o Meeting at ARPA (Regional Environmental Protection Agency) + project of measure 1.4
Afternoon o Project in soil defence (measure 1.1) in Civita di Bagnoregio Engineer Alvaro Baffo Mayor Erino Pompei
o Project in waste infrastructure (ecopark; measure 1.2) in Aprilia Enrico Di Marco, responsible of the project
o Meeting at the Province of Rome + project of measure 1.3


ADE s.a. Rue de Clairvaux, 40
B-1348 Louvain-la-Neuve Belgium
Tel.: +32 10 45 45 10 Fax: +32 10 45 40 99 E-mail: [email protected]
Web: www.ade.be
Ex post evaluation of cohesion policy programmes 2000-2006 co-financed by the European Fund for Regional Development (Objectives 1 and 2) – Work package 5b: Environment and Climate Change
RReeggiioonnaall ccaassee ssttuuddyy LLaattvviiaa
October 2009


TThhiiss rreeppoorrtt hhaass bbeeeenn pprreeppaarreedd bbyy AADDEE aatt tthhee rreeqquueesstt ooff tthhee EEuurrooppeeaann CCoommmmiissssiioonn..
TThhee vviieewwss eexxpprreesssseedd aarree tthhoossee ooff tthhee CCoonnssuullttaanntt aanndd ddoo nnoott rreepprreesseenntt tthhee ooffffiicciiaall vviieewwss ooff tthhee EEuurrooppeeaann CCoommmmiissssiioonn..
RReepprroodduuccttiioonn oorr ttrraannssllaattiioonn iiss ppeerrmmiitttteedd,, pprroovviiddeedd tthhaatt tthhee ssoouurrccee iiss dduullyy aacckknnoowwlleeddggeedd aanndd nnoo mmooddiiffiiccaattiioonnss ttoo tthhee tteexxtt aarree mmaaddee..


EX POST EVALUATION OF COHESION POLICY PROGRAMMES 2000-2006 CO-FINANCED BY THE EUROPEAN FUND FOR REGIONAL DEVELOPMENT (OBJECTIVES 1 AND 2) - WORK PACKAGE 5B: ENVIRONMENT AND CLIMATE CHANGE ADE
Regional Case study – Latvia – October 2009 Table of Contents
Table of Contents ACRONYMS
SUMMARY – KEY MESSAGES OF THE CASE STUDY IN LATVIA
1. STATUS AND FEATURES OF THE REGION .............................................................. 1
1.1 ECONOMIC SITUATION ..................................................................................................... 1 1.2 ENVIRONMENTAL SITUATION ......................................................................................... 2 1.3 INSTITUTIONAL SET UP AND POLICY MAKING PROCESS ............................................... 5
1.3.1 Regional development .............................................................................................. 5 1.3.2 Environmental sector ............................................................................................... 6
2. REGIONAL POLICIES AND THE ROLE OF THE ERDF ........................................... 9
2.1 ECONOMIC POLICIES ......................................................................................................... 9 2.2 ENVIRONMENTAL POLICIES ........................................................................................... 10
2.2.1 Main objectives pursued ........................................................................................ 10 2.2.2 Interactions with EU policies ................................................................................ 12
2.3 ACTIONS TAKEN .............................................................................................................. 13 2.3.1 Environmental expenditures and main sources of funds ................................. 13 2.3.2 ERDF contribution to environmental expenditures in the region .................. 15
2.4 ERDF DECISION AND PLANNING PROCESS ................................................................. 17
3. ANALYSIS OF THE ERDF CONTRIBUTION .......................................................... 21
3.1 RELEVANCE OF THE 2004-2006 ERDF STRATEGY IN THE ENVIRONMENTAL SECTOR FOR ENHANCING TERRITORIAL DEVELOPMENT ........................................... 21 3.2 QUALITY OF THE PLANNING AND IMPLEMENTATION PROCESS IN MEETING REGIONAL CHALLENGES IN THE COVERED FIELDS .................................................... 22 3.3 CONTRIBUTION OF THE ERDF TO IMPROVING THE ENVIRONMENTAL
SITUATION ........................................................................................................................ 23 3.4 CONTRIBUTION OF THE ERDF TO REGIONAL ECONOMIC DEVELOPMENT ........... 27 3.5 CONTRIBUTION OF THE ERDF TO IMPROVING THE QUALITY OF LIFE .................. 28
ANNEX – LIST OF STAKEHOLDERS INTERVIEWED ...................................................... 29
LIST OF FIGURES
FIGURE 1 : TERRITORIES OF PLANNING REGIONS .................................................................. 5 FIGURE 2 : SET-UP FOR THE IMPLEMENTATION OF THE 2000-2006 SPD,
ESPECIALLY AS REGARDS ENVIRONMENTAL MEASURES ................................... 17

EX POST EVALUATION OF COHESION POLICY PROGRAMMES 2000-2006 CO-FINANCED BY THE EUROPEAN FUND FOR REGIONAL DEVELOPMENT (OBJECTIVES 1 AND 2) - WORK PACKAGE 5B: ENVIRONMENT AND CLIMATE CHANGE ADE
Regional Case study – Latvia – October 2009 Table of Contents
LIST OF TABLES
TABLE 1: ESTIMATES OF ENVIRONMENTAL EXPENDITURES (UNIT: LVL M) IN LATVIA FOR THE 2004-2008 PERIOD .............................................................. 14
TABLE 2: ERDF ENVIRONMENTAL EXPENDITURES OF THE 2004-2006 LATVIAN SPD (UNIT: LVL M) ................................................................................................ 15
TABLE 3: MAIN OUTPUT AND RESULT OF THE 2004-2006 LATVIAN SPD IN THE FIELD OF THE ENVIRONMENT ...................................................................... 16
TABLE 4: TRENDS IN THE ACCESS TO SAFE DRINKING WATER IN LATVIA (2000-2008) ............................................................................................................. 23
TABLE 5: TRENDS IN THE WASTEWATER SECTOR IN LATVIA (2000-2006) ..................... 24 TABLE 6: TRENDS IN THE SOLID WASTE SECTOR IN LATVIA (2000-2007) ...................... 24 TABLE 7: TRENDS IN ENERGY EFFICIENCY AND RENEWABLE ENERGY
SOURCES IN LATVIA (2000-2007) ......................................................................... 25 TABLE 8: ECONOMIC PERFORMANCE OF LATVIA (2003-2008) ......................................... 27 TABLE 9: ACTIVITIES LINKED TO THE ENVIRONMENT IN LATVIA (2003 TO 2006) ....... 28

EX POST EVALUATION OF COHESION POLICY PROGRAMMES 2000-2006 CO-FINANCED BY THE EUROPEAN FUND FOR REGIONAL DEVELOPMENT (OBJECTIVES 1 AND 2) - WORK PACKAGE 5B: ENVIRONMENT AND CLIMATE CHANGE ADE
Regional Case study – Latvia – October 2009 Acronyms
Acronyms
BCP Biodiversity Conservation Programme
ca circa
EBRD European Bank for Reconstruction and Development
EC European Commission
EEC European Economic Community
EIB European Investment Bank
EU European Union
IMF International Monetary Fund
ISPA Instrument for Structural Policies for Pre-Accession
GDP Gross Domestic Product
GHG Greenhouse Gas
k kilo
LEGMA Latvian Environment, Geology and Meteorology Agency
LPHA Latvian Public Health Agency
LVL Latvian lat (€ 1 = LVL 0.702804)
MoE Ministry of the Environment
MS Member State
n.a. Not available
n.c Not communicated
NEPP National Environmental Policy Plan
NWMP National Waste Management Plan
Ntot Total Nitrogen
p.e. Population equivalent
PPP Polluter- Pays Principle
PPS Purchasing Power Standards
Ptot Total Phosphorus
R&D Research and Development
RES Renewable energy sources
SCI Sites of Community Interest (Habitats Directive)
SPA Special Protected Area (Birds Directive)
SPD Single Programming Document
UWW Urban waste water


EX POST EVALUATION OF COHESION POLICY PROGRAMMES 2000-2006 CO-FINANCED BY THE EUROPEAN FUND FOR REGIONAL DEVELOPMENT (OBJECTIVES 1 AND 2) - WORK PACKAGE 5B: ENVIRONMENT AND CLIMATE CHANGE ADE
Regional Case study – Latvia – October 2009 Summary
Summary – Key messages of the case study in Latvia
In 2004, Latvia faced a significant level of structural unemployment, consisting of workers with a relatively high level of education, and a weak performance of its indigenous industry.
In terms of the environment, Latvia has received several derogations until 2015 or 2020 to the implementation of EU Directives due to their lack of environmental infrastructures in all the sectors.
The public sector directly invests in environmental infrastructures due to risks of state aid issues. Public environmental expenditures have been mainly covered by the Cohesion Fund and the national government during the 2004-2008 period. The ERDF mainly intervened in the water sector and the improvement of energy efficiency.
There was no specific ERDF strategy regarding environmental investments and support to Latvian SMEs. Large parts of ERDF support to the environment were brought to municipalities through national programmes designed at central administration or open calls specifically implemented in the framework of the SPD. Projects were co-funded only if they respected the priorities of the national programmes and environmental priorities defined by the government.
The implementation of co-funded projects posed particularly problem in the following cases: - the lack of technical and administrative capacities in many municipalities as well as the
administrative burden of the procedure itself caused delays in the selection procedure or the start of the projects;
- in the water sector: an uncertain national lending policy for municipalities to take loans for public infrastructures forced these municipalities to pre-finance their projects via another loan to the Latvian Environmental Fund. Technical issues have also been experienced due to wrong location on the water network from plans of the Soviet Union era;
- in the municipal waste sector, the ERDF strategy did not integrate each step of the waste management system. Due to the issue of selling sorted and collected waste, there was temporarily a break in the waste management system at the recycling level. As a result, sorted waste was taken to landfill.
Thanks to ERDF co-funded projects, improvements in environmental infrastructures have been made but they are still insufficient to comply with EU Directives. More people are now connected to safe drinking water and the share of untreated wastewater is decreasing. In the waste sector, more waste is sorted and collected. The closing and rehabilitation of dumpsites was a success. In the energy sector, the ERDF contributed significantly to increased energy savings in municipal heating systems even if land and property ownership issues were experienced.
In terms of (regional) economic development, ERDF support has contributed to increasing jobs in the water sector and in the waste sector (recycling/sorting). More generally, reducing energy losses in municipal heating systems, rehabilitation of dumpsites and development of ecotourism activities have contributed to increasing the attractiveness of some Latvian regions at local level (municipalities mainly).
ERDF support has contributed to increasing the quality of life of the population through more access to safe water supplies, rehabilitated dumpsites and ecotourism infrastructures.


EX POST EVALUATION OF COHESION POLICY PROGRAMMES 2000-2006 CO-FINANCED BY THE EUROPEAN FUND FOR REGIONAL DEVELOPMENT (OBJECTIVES 1 AND 2) - WORK PACKAGE 5B: ENVIRONMENT AND CLIMATE CHANGE ADE
Regional Case study – Latvia – October 2009 Page 1
1. Status and features of the region
1.1 Economic situation
After its independence in 1991, Latvia has prioritised the macroeconomic stability and a conservative public expenditure discipline. However, the Latvian economy remained subject to external shocks due to a persistent negative balance of payments1. Latvia entered in the EU in 2004.
As highlighted in the 2004-2006 Single Programming Document (SPD), challenges of the Latvian economy included: structural unemployment, especially a mismatch between labour supply and demand. In
2004, a large share of the unemployed had a relatively high level of education; widening regional (Nuts 3 level) disparities; weak performance of indigenous industry; the need to attract increased and new foreign direct investment flows.
In 2004, the Latvian Gross Domestic Product (GDP) per capita was equal to 9.9 k€/ capita while the annual GDP annual growth rate varied from 6.9% to 8.7% between 2000 and 2004 (Eurostat, 2009). In Purchasing Power Standards (PPS – EU-27=100), 2004 GDP per capita amounted to 45.7; far behind EU-15 Member States and the lowest ranked Member State amongst EU-10 Member States.
From 2000 to 2004, the Latvian employment rate among the economically active part of the population (the 15-64 age group) increased from 57.5% to 62.3% by 2004; while the unemployment rate amounted to 10.4% (Eurostat, 2009). In terms of economic structure, the majority of the active population (59.4%) worked in the service sector in 2004, while the employment rate in the agricultural sector stood at 27.3%, and the employment rate in the industrial sector amounted to 13.3%. Latvia has been progressively re-orientating its economy to the service sector since the end of the 1990’s while reducing the share of employment in the agricultural sector and stabilising the share of employment in the industrial sector (25-27%).
One striking fact is the decline in the population. The population density has diminished year by year.
According to an EBRD analysis2, labour costs in absolute levels remain low. Nonetheless, the decline in unemployment and the above-productivity wage increases in major industries have put overall pressure on competitiveness. There is however room for improvement in the business environment, notably by curbing, primarily, political corruption, reducing tax evasion and VAT fraud. 1 In 2004, exports of goods and services – mainly wood and articles of wood; transport vehicles, base metals and
articles, machinery, mechanical appliances and electrical equipment; textiles and textile articles, agricultural products and chemical products – constituted 43.9% of GDP, while imports of goods and services constituted 59.8% of GDP.
2 Strategy for Latvia, Document of the European Bank for reconstruction and development, 9 September 2008.

EX POST EVALUATION OF COHESION POLICY PROGRAMMES 2000-2006 CO-FINANCED BY THE EUROPEAN FUND FOR REGIONAL DEVELOPMENT (OBJECTIVES 1 AND 2) - WORK PACKAGE 5B: ENVIRONMENT AND CLIMATE CHANGE ADE
Regional Case study – Latvia – October 2009 Page 2
The private sector of the Latvian economy mainly consists of Small and Medium Enterprises (SMEs). While they provide a lot of employment and services – particularly in the poor areas of the country – SMEs have suffered from a lack of institutional capacities, including the environmental sector.
In terms of the environment, the private sector has invested in environmental infrastructures in order to reduce discharges into water bodies. In terms of air emission pollution control, some Latvian companies have invested in filters or other installations to reduce air polluters. Between 2001 and 2005, estimated total investments made by the Latvian industrial sector amounted to €43.8m, including €4.3m in urban and industrial waste and €6.4m for sewerage and purification.
However, the whole of the private sector has faced a clear lack of financial resources to multiply such investments required to protect and safeguard the environment. Moreover, packaging producers have been charged with setting up clean waste collection systems to ensure the achievement of recovery and recycling targets.
1.2 Environmental situation
Water supply and wastewater treatment
The groundwater volume is sufficient to be used as the main drinking water source in Latvia. However, access to drinking water of a safe quality complying with the relevant European Community standards was a problem identified as early as the end of 1990’s. The main challenges were related to the poor conditions of the water supply networks – huge losses and the deterioration of quality in the supply system. Additionally, natural elevated concentrations of iron, manganese and sometimes excessive natural sulphate concentrations require the setting up of water treatment facilities – for example, iron removal – before it can be distributed to consumers. According to the 2003 drinking water monitoring data, 59.3% of the analysed samples did not meet the physical chemical quality standards and 3.34% of the analysed samples did not meet the microbiological quality standards. According to the Latvian Public Health Agency (LPHA), the highest frequency of noncompliance with the standards has been monitored in the water supply systems with capacities below 100m3 a day.
One of the main environmental problems is eutrophication of the water bodies caused by anthropogenic nutrient input (phosphorus and nitrogen compounds). Discharges from municipal wastewater treatment facilities contributed half of the total volume of the wastewater discharged to water ecosystems. Referring to nutrients, the municipal wastewater treatment plants discharged about 74.2% of total nitrogen point-source pollution load and about 62% of total phosphorus point-source pollution load generated by Latvia in 2003. The following challenges have been identified with regard to the waste water treatment systems: the low connection rate to public sewage systems. Latvia has 88 agglomerations for
which the compliance with the Directive on Urban Waste Water Treatment 91/271/EEC has to be achieved. In 2003, just nine of them had a connection rate

EX POST EVALUATION OF COHESION POLICY PROGRAMMES 2000-2006 CO-FINANCED BY THE EUROPEAN FUND FOR REGIONAL DEVELOPMENT (OBJECTIVES 1 AND 2) - WORK PACKAGE 5B: ENVIRONMENT AND CLIMATE CHANGE ADE
Regional Case study – Latvia – October 2009 Page 3
above 90%. Full compliance with the requirements of the Directive on UWW Treatment was achieved only for 9% of inhabitants of Latvia in 2001.3
depending on the size of the agglomeration, different standards in treatment and discharges have to be met. As the whole country is designated as the sensitive area, the key criterion is that the surface water quality may not be worsened due to waste water discharges. About half of the wastewater treatment plants did not meet the established relevant environmental standards at beginning of the 2000’s4.
Solid waste
In the period 1995-2000/2003, the generated amount of waste was slowly increasing. However, it was about half of the volume generated in the EU on average – c.a. 300 kg/per capita. This can be explained by the fact that waste was only collected from 20% of rural areas and from 80% of the urban population in 20035.
The lack of environmentally safe waste disposal sites was a key problem of waste management in Latvia. In 1998, 558 waste dumpsites were identified. The majority of them were smaller than 1-2 hectares and received less than 1,000m3 of waste per year. According to the Latvian Environment, Geology and Meteorology Agency (LEGMA), 191 dumpsites were still operating in 2003. The development of regional waste management systems and the construction of new landfills were taking place parallel to the closure of dumpsites. The first new landfills in compliance with EC environmental standards were only set up in 2004. According to the EU regulation, all dumpsites shall be closed by 16 July 2009.
National and regional waste management policies in Latvia aim to increase the recovery and recycling of waste. Consequently, smaller amounts shall be deposited in the landfills. The data on deposited waste amounts into the landfills have been recorded for several years. They show a positive trend: from about 93% of waste brought to landfill in the middle of the 1990’s to c.a. 83% in 2003. This is due to the set up of separate waste collection systems all over the country.
Air
Concentrations of nitrogen dioxide (NO2) and particulate matter (PM10) in the air indicate the pressure of the transport sector on the environment, while concentrations of sulphur dioxide (SO2) show the impact of energy production. In Latvia, there were no exceeded limit values recorded for SO2 concentrations in 2003. However, the average annual hourly limit value of 100 μg/m3 NO2 – the lowest assessment level for human health protection – was exceeded in two monitoring stations in Riga as well as in Liepaja and Jelgava in 2003. In addition, the frequency of the excess was higher than allowed by national regulations. In terms of PM10, the limit values for the environment and human health protection were also exceeded in Riga, Liepaja, Rēzekne, and Ventspils in 20036. 3 Directive specific implementation and financing plan on the Directive on UWW, Ministry of Environment, Latvia,
2001) 4 National Programme on “Improvement of water services in the agglomerations with p.e. < 2000”, Ministry of the
Environment.
5 Waste Management in the Baltic States, 2004, Baltic Environmental Forum, Riga.
6 Air Quality Annual Assessment, 2003, Latvian Hydrometeorological Agency.

EX POST EVALUATION OF COHESION POLICY PROGRAMMES 2000-2006 CO-FINANCED BY THE EUROPEAN FUND FOR REGIONAL DEVELOPMENT (OBJECTIVES 1 AND 2) - WORK PACKAGE 5B: ENVIRONMENT AND CLIMATE CHANGE ADE
Regional Case study – Latvia – October 2009 Page 4
Soil
In Latvia, soil pollution is assessed in the context of contaminated sites. Where past or present land use activities are involved, or have been involved, the storage, handling or disposal of chemicals, there is an increased risk of contamination. Examples of potentially contaminating activities include service stations, landfills, former industrial facilities and military sites. Contamination is usually caused by spills or leaks, such as from fuel or chemical storage tanks, or poor management practices at industrial sites. The database of the Latvian Environment, Geology and Meteorology Agency (LEGMA) has registered 242 contaminated sites. However, it has been estimated that the number of potentially contaminated sites could be more than 2,600 in Latvia.
Climate change and renewable energy
Aggregated GHG emissions in Latvia – expressed in CO2 equivalent – have a declining trend of 60% compared to the 1990 level. The energy sector has been the main source of CO2 emissions during these years. In 2003, around 95% of all CO2 emissions were produced by fossil fuel combustion: 32.5% through energy production and transmission, 35% by transport, 13% by industrial processes and construction sectors, as well as around 15.5% by agriculture, forestry, fishery and other services7.
Three types of primary energy sources are dominant in Latvia with approximately equal shares: oil products, natural gas and wood. As many other EU Member states (MS), Latvia is dependent on the import of primary energy resources. However, this dependence was reduced by 17% between 1990 and 2003, mainly due to more extensive use of wood resources. Consequently, the renewable energy sector has contributed about one third to Latvian energy consumption. Electricity produced from hydro power represented 57% to 68% of the total Latvian electricity generation during the 2000-2004 period. In 2004, Latvia was the second EU-27 MS in terms of electricity generated from renewable sources (47.1% of the gross electricity consumption) – just behind Austria and before Sweden.
One of the key challenges for the energy sector is low energy efficiency. Although the situation has been improving, in 2003 Latvia consumed three to four times more energy to produce a unit of GDP compared to other EU Member States.
Biodiversity and Nature Conservation
To have efficient nature conservation at the EU level, the network of the natural areas called Natura 2000 has been established in Latvia. The process of the site selection for Natura 20008 in Latvia took place in 2003-2004 when Sites of Community Importance for habitats and species protection (SCI) and Special Protection Areas for Birds (SPAs) were selected. As a result, more rare species/habitats are present in the area and there are more restrictions on economic activity.
7 Report of the Republic of Latvia on Demonstrable Progress under the Kyoto Protocol to the United Nations
Framework Convention on Climate Change, Riga, 2006. 8 In Latvia, 331 sites of SCI were designated in Latvia covering 11% of the terrestrial territory8. The sites ensure that
more than 50 different habitat types (and more than 600 species) are protected in this part of Europe. With regard to SPAs, 97 sites have been designated in Latvia, covering 9.6% of the terrestrial territory of the country in 2004. Some of the SCI and SPA areas are overlapping as they are important for protection of birds and habitats and their species.

EX POST EVALUATION OF COHESION POLICY PROGRAMMES 2000-2006 CO-FINANCED BY THE EUROPEAN FUND FOR REGIONAL DEVELOPMENT (OBJECTIVES 1 AND 2) - WORK PACKAGE 5B: ENVIRONMENT AND CLIMATE CHANGE ADE
Regional Case study – Latvia – October 2009 Page 5
1.3 Institutional set up and policy making process
1.3.1 Regional development
In 2004, Latvia was divided in 33 regional level local governments, including 26 districts and 7 republic cities. There were 547 territorial local governments in the country.
As shown in the map hereafter, five planning regions (Kurzeme, Riga, Vidzeme, Zemgale, and Latgale) were established for the needs of ensuring the regional development planning and coordination. However, Latvia was still considered as a region (NUTS 2 level) to implement the 2004-2006 SPD on the whole territory.
Figure 1 : Territories of planning regions
Source: State Regional Agency, 2007.
During the 2004-2006 programming period, Latvia carried out an administrative territorial reform9 aiming on one hand to simplify the system and on the other hand, to reinforce the role of local governements in providing high quality services to residents. The reform has to be finalised before the elections in June 2009.
In Latvia, the Ministry of Regional Development and Local Government is the leading state administrative institution in the field of planning and coordination of state and regional development, local government development, spatial planning and state investment, as well as land policy. The Ministry of Regional Development and Local Government is assisted by the State Regional Development Agency. The aim of this Agency is to implement well-balanced state development support policies by providing
9 This reform aims to establish 118 administrative territories (109 amalgamated municipalities and 9 republic cities)
capable of economic development and governed by local governments. The distric municpalities have been reorganised as well – the duties are taken over by new local governments, thus there will be one fewer planning level.

EX POST EVALUATION OF COHESION POLICY PROGRAMMES 2000-2006 CO-FINANCED BY THE EUROPEAN FUND FOR REGIONAL DEVELOPMENT (OBJECTIVES 1 AND 2) - WORK PACKAGE 5B: ENVIRONMENT AND CLIMATE CHANGE ADE
Regional Case study – Latvia – October 2009 Page 6
implementation of national, EU and other financial instruments, required research work and high quality services.
The most important tasks of local governments (municipalities) are to provide residents with utility services, ensure improvement and sanitary hygiene of the administrative territory, as well as education for residents, to maintain culture and promote the preservation of traditional cultural values and development of people’s creative work. Local governments have been planning their development by elaborating strategic development programmes and spatial plans for 12 years. Since these plants are at the lowest planning hierarchy they have to be in line with other planning documents. The main challenge in development and spatial planning is different validity periods of the planning documents, thus it is rather difficult to have conformity.
In Latvia, the municipal sector remains highly fragmented and suffers from low administrative capacity. Municipalities still face difficulties in getting external financial resources in reasonable terms to address the challenges at their level – including in terms of environmental infrastructures and environment protection. According to the EBRD, there is an increasing scope for EU co-funded projects and for private involvement in increasing efficiency to deliver public services. Indeed, the private sector participates very little to environment-related activities – such as district heating, water and sewage – or to transport-related projects, such as urban transport. However, water services are still operated by publicly owned (commercialised) companies.
1.3.2 Environmental sector
Public bodies
National legislation has assigned many functions and tasks to local governments (municipalities) in the field of the environment. The main duties are prescribed in the Law on Local Governments: to organise the provision of utilities for residents (water supply and sewerage; supply of
heat; management of municipal waste; collection, conducting and purification of wastewater);
to look after the public services and facilities, and the sanitary cleanliness of their administrative territory (building, reconstruction and maintenance of streets, roads and public squares; lighting of streets, public squares and other areas designated for public use; development and maintenance of parks, public squares and green zones; control of collection and removal of waste; flood control measures; establishment and maintenance of cemeteries and places for burial of dead animals);
to determine procedures for the use of public-use forests and waters, if it is not specified otherwise by law.
The Law on Waste Management assigns specific responsibilities to local governments: organising the management of municipal waste, including municipally produced hazardous waste; taking decisions regarding the placement of new municipal waste recovery facilities and landfill sites within their administrative territories; issuing binding regulations, which

EX POST EVALUATION OF COHESION POLICY PROGRAMMES 2000-2006 CO-FINANCED BY THE EUROPEAN FUND FOR REGIONAL DEVELOPMENT (OBJECTIVES 1 AND 2) - WORK PACKAGE 5B: ENVIRONMENT AND CLIMATE CHANGE ADE
Regional Case study – Latvia – October 2009 Page 7
regulate the management of municipal waste within their administrative territories; taking decisions regarding the placement of new hazardous waste recovery facilities, incineration plants and landfill sites within their administrative territories; they may invest funding in the establishment and maintenance of waste management systems in conformity with waste management plans; and organising a segregated waste collection within their administrative territories.
The law on Pollution requires that municipalities take the necessary precautionary measures to prevent or – if it is impossible – reduce environmental pollution or the risk thereof, as well as the risk of accidents. The local municipalities are consulted when a new activity is proposed in their territory. The Environmental Protection Law sets the duties for local governments with regard to public participation, access to environmental information and control in the field of the environment.
The fulfilment of national policies and laws are overseen by a number of institutions which are supervised or subordinated by the Ministry the of Environment (MoE)10. The key institutions are as follows: the State Environmental Service 11 ; the Nature Protection Board12; the Environment State Bureau13; the Environment, Geology and Meteorology Agency14.
Private sector
Private sector is differently engaged in providing services for water, waste and heat supply sector.
Water service companies and the networks are mainly owned by local governments. Therefore, the development of central water supply and wastewater treatment systems is based on the initiatives and capacities of the local governments. The private sector is
10 The Ministry of the Environment (MoE) is a central executive institution in the area of the environment, which
includes protection of the environment and nature, maintenance and rational use of natural resources, as well as sub-sectors of hydrometeorology and use of subsoil. The MoE works out the national policy of environmental protection and holds and coordinates implementation of environmental policy. It develops projects of legislative acts and papers (conceptions, programs, plans), formulates opinions about projects prepared by other institutions, represents interests of Latvia in the international and foreign institutions, and also informs society about policies in the field and the work of the supervised institutions.
11 The State Environmental Service ensures the compliance of implementation of the legislation framework in the area of environmental protection and natural resources, mainly by performing controls on compliance with the relevant environmental legislation and issuing permits, technical requirements and other administrative acts concerning the use of natural resources and the performance of the polluting activities. The State Environmental Services have 8 Regional Environmental Boards.
12 The Nature Protection Board implements national policy in nature protection by ensuring management of specially protected nature areas, which do not have their own administration; organising elaboration and implementation of nature management plans and species protection plans as well as other activities prescribed by the laws and regulations.
13 The Environment State Bureau is in charge of supervising the environmental impact assessment procedures with regard to proposed activities and planning documents including large public investment projects or national policy planning documents.
14 The Latvian Environment, Geology and Meteorology Agency (LEGMA) is in charge of the collecting and processing of information about the environment and sustainable development, responsible for monitoring of the environment and information of society. LEGMA is also responsible for river basin management planning of four river basin management districts: Daugava, Lielupe, Gauja, and Venta (natural boundaries are used for planning).

EX POST EVALUATION OF COHESION POLICY PROGRAMMES 2000-2006 CO-FINANCED BY THE EUROPEAN FUND FOR REGIONAL DEVELOPMENT (OBJECTIVES 1 AND 2) - WORK PACKAGE 5B: ENVIRONMENT AND CLIMATE CHANGE ADE
Regional Case study – Latvia – October 2009 Page 8
mainly involved in promoting individual solutions of small capacities in rural areas (e.g. detached houses and villages consisting of a few houses).
Although local governments are responsible for waste services, the waste management company for collection, transport, re-loading and storage of municipal waste is selected according to the public procurement procedure. Thus, the municipal waste management sector acts on market based principles. With regard to final disposal, local governments shall determine the landfill sites where the municipal waste collected in the territory thereof shall be disposed of.
Heat supply companies also act according to the market-based principles as consumers may refuse to use heat supplied centrally and choose another heat supplier. However, in many municipalities the heat supply companies are closely linked to the local governments (80% of the utilities as they are shareholders) and the cost recovery principle is mainly ensured with regard to maintenance, however not with investments in infrastructure development. Thus, the current system limits the interest of private investors to take an active role in the heat supply market.
Polluter pays principle
The “Polluter Pays” Principle (PPP) is also endorsed by the Natural Resource Tax Law. It puts a tax on the discharges of the polluting substances into the environment (e.g. water, air, waste) and on the use of natural resources ( e.g. abstraction of water, mineral resources). The revenue generated from the use of natural resources and pollution is divided between the state (40%) and the local governments (60%). Tax payments for goods harmful to the environment15 are included in the State budget.
The revenues collected are entirely used for financing environmental measures: the local governments have to allow these revenues to environmental management in their areas. The State allocates money to the Latvian Environmental Protection Fund (LEPF) for the implementation of environmental protection measures and projects. Additionally, money is granted to the local governments to co-finance environmental projects.
The Producer Responsibility Principle based on the PPP has been introduced in the waste management sector, making producers of certain goods being physically or financially responsible for the entire lifecycle of that good and its packaging, even when they cease to be of use to the consumer. Producer responsibility has been established for the following products: packaging, vehicles, batteries, electric and electronic equipment. In Latvia, the legislation requires producers to establish relevant waste management systems to ensure that the targets set by the EC legislation16 are achieved in the given timescale. The Natural Resource Tax Law has established a tax in the form of fiscal incentives for companies to comply with the waste management targets. As a result, several producer responsibility organisations (e.g. Green Dot, Green Belt) are active in organising separate waste collections and treatment. 15 Packaging, coal, coke and lignite (brown coal), disposable tableware and accessories, vehicles, for the volume of
GHG emitted from installations, which is not included in the amount of transferred GHG emissions quota, for the unlawful extraction and the use of natural resources.
16 The EC legislation has set targets for recovery, recycling and re-use of these product related waste streams.

EX POST EVALUATION OF COHESION POLICY PROGRAMMES 2000-2006 CO-FINANCED BY THE EUROPEAN FUND FOR REGIONAL DEVELOPMENT (OBJECTIVES 1 AND 2) - WORK PACKAGE 5B: ENVIRONMENT AND CLIMATE CHANGE ADE
Regional Case study – Latvia – October 2009 Page 9
2. Regional policies and the role of the ERDF
2.1 Economic policies
Latvia did not have a global economic strategy when designing the 2004-2006 SPD, but instead, it had several sectoral strategies which were not really coordinated at a macroeconomic level. In terms of strategy, the priority was given to the definition of the Latvian 2004-2006 SDP instead of finalising the national development plan for Latvia.
The Ministry of Finance was the leading body in the preparation of the OP. It was in charge of defining the strategy and possible measures to be co-financed by the ERDF, taking into account the points of view of thematic Ministries, such as the Ministry of the Environment.
After the approval and the beginning of the implementation of the Latvian 2004-2006 OP, Ministries pursued their work with a view to finalising the national development plan for Latvia. After a long process and several attempts, this plan was finally approved in 2007.
During the 2004-2006 period, Latvia had no clear understanding of the definition of regional development. The 2004-2006 SPD was implemented taking into account a sectoral approach without specific criteria to identify socio-economic differences between the regions of the country. According to the Ministry of Regional Development, one of the main results of the 2004-2006 OP has been a comprehensive total shift to a regional and territorial approach, including a differentiation between Latvian regions.
As a result, territorial development indicators and analysis of methodology have now been released 17 while they were not available for the 2004-2006 programming period. In addition, administrative reform is expected to come into force in June 2009. However, this reform still requires political compromises in the field to be successful and to progressively provide more power to decentralised authorities. Today, most local governments are still neither organised, nor equipped, nor sufficiently trained to absorb funds, except perhaps the Riga region local governments which were the largest beneficiaries of the 2004-2006 Latvian OP.
17 State Regional Development Agency, Development of Regions in Latvia, 2007. These indicators are used to characterize each
region of the country through core themes (economic development, unemployment, population change, life expectancy, tax allowances, etc.).

EX POST EVALUATION OF COHESION POLICY PROGRAMMES 2000-2006 CO-FINANCED BY THE EUROPEAN FUND FOR REGIONAL DEVELOPMENT (OBJECTIVES 1 AND 2) - WORK PACKAGE 5B: ENVIRONMENT AND CLIMATE CHANGE ADE
Regional Case study – Latvia – October 2009 Page 10
2.2 Environmental policies
2.2.1 Main objectives pursued
During the 2000-2006 period, two policy documents were enforced: the National Environmental Policy Plan 1995-2003 and the National Environmental Policy Plan 2004-2008. Water quality, waste management, energy efficiency, climate change and maintenance of biodiversity were defined as priorities of both National Environmental Policy Plans.
Water Quality
There have been several national programmes and plans elaborated to improve water quality. The most relevant for the programming period are the Directive Specific Implementation and Financing Plans elaborated and approved during the accession process to EU.
Directive Specific Implementation and Financing Plan for the Council Directive 91/271/EEC Concerning Urban Waste Water Treatment and Directive Specific Implementation and Financing Plan for 98/83/EC Concerning the Quality of Water Intended for Human Consumption are two key strategic documents determining the way, how Latvia is planning to improve waste water treatment and drinking water supply in the country.
Waste Management
The development of the waste management system is planned comprehensively with the National Waste Management Plan (NWMP) (approved in 2003 and revised in 2006).
The NWMP sets the following goals: In economic growth circumstances to prevent waste generation and to ensure the
significant reduction of the generated waste amounts by the best available waste avoidance options, best available techniques for the resource use efficiency and promotion of sustainable consumption patterns;
To ensure that the generated waste are non-hazardous, or risk to environment and human health is minimised;
To ensure that the generated waste is returned in use, especially, by waste recycling or they are returned into environment in useful way (e.g. compost);
The waste disposal is reduced to minimum and waste is treated or deposited not leading to overall adverse environmental or human health impacts;
The generated waste as close as possible to the source of generation. The Plan defines recovery, recycling and use targets for the specific waste streams: packaging waste, end of life vehicles, electric and electronic equipment waste, biodegradable waste, wastes containing polychlorinated biphenyl. These targets are the same as the respective EC Directives.

EX POST EVALUATION OF COHESION POLICY PROGRAMMES 2000-2006 CO-FINANCED BY THE EUROPEAN FUND FOR REGIONAL DEVELOPMENT (OBJECTIVES 1 AND 2) - WORK PACKAGE 5B: ENVIRONMENT AND CLIMATE CHANGE ADE
Regional Case study – Latvia – October 2009 Page 11
The Plan also set the regional waste management system, needs for construction landfills, closing down dump-sites, etc.
Based on the NWMP, 10 regional Waste Management Plans have been elaborated and approved step by step in 2006-2008. The regional Waste Management Plans foresee establishing of new landfill per region, waste treatment centres, separate waste collection sites and yards. The investments allocated to this sector are targeted to achieve the objectives and tasks set by these documents.
Climate Change
The goals of this Climate Change Mitigation Programme, 2005-2010 is in line with NEPP 2004-2008, however additional ones have been defined, in particular to certain economic sectors: increase the share of renewable energy sources in the energy balance; increase efficient and rational use of energy resources; develop an environmentally friendly transport system; promote the implementation of the best available techniques, environmentally friendly
technologies and cleaner production; promote the implementation of environmentally sound agricultural methods that
reduce direct GHG emissions; increase CO2 removals in forestry; establish an up-to-date municipal waste management system, ensuring collection of
biogas in municipal waste landfills. The National Energy Efficiency Strategy adopted by the government 2001 and amended in 2004 sets the overall objective to reduce primary energy consumption per GDP unit by 25% till 2010.
Biodiversity
The goals of the Biodiversity Conservation Programme 2003 (BPC) have been integrated in NEPP 2004-2008. The BCP is setting specific objectives related to nature conservation, use of natural resources, in total 36. With regard to tourism sector and nature conservation, a lot of objectives have been defined. They are notably dealing with the development of tourism and recreation sites and their promotion.
The Investment Department of the MoE is in charge of the development and implementation of the investment strategies. It also prepares the plans and programmes related to the use of the ERDF in the field of the environment.

EX POST EVALUATION OF COHESION POLICY PROGRAMMES 2000-2006 CO-FINANCED BY THE EUROPEAN FUND FOR REGIONAL DEVELOPMENT (OBJECTIVES 1 AND 2) - WORK PACKAGE 5B: ENVIRONMENT AND CLIMATE CHANGE ADE
Regional Case study – Latvia – October 2009 Page 12
2.2.2 Interactions with EU policies
During accession to the EU, Latvia developed and approved special implementation plans for investment and infrastructure-related EU directives including drinking water, urban waste water, landfills, as well as packaging directives.
Both plans related to urban waste water treatment and to the quality of water intended for human consumption contain an exact list of the investment projects to be completed by 2015. These lists served as a basis for developing ERDF co-funded National Programmes.
The Landfill Directive 99/31/EC requires landfills to comply with the requirements of this Directive or they will be closed by 16 July 2009. Latvia has committed itself to organising the relevant activities by 2012. As a consequence, the former waste deposit sites are gradually being re-cultivated and the relevant groundwater monitoring organised. The commitments are included in the National Waste Management Plan and the relevant EC funding allocations.
In the 2002-2004 period, a number of public heating enterprises (c.a. 40 boiler houses) used fuel with a high sulphur content, while the usage of this type of fuel is not permitted in accordance with environmental protection requirements that are stated in Directive 1999/32/EC. Therefore, the investment projects were identified in 2003 by the Ministry of the Economy in cooperation of the Ministry of the Environment and the relevant local authorities. The National Programme to be co-funded by the ERDF was elaborated to support these activities.
As Latvia has important challenges to address with a view to meeting the requirements of EU directives in terms of the environment, derogations have been provided: Drinking water: a transitional measure until 31 December 2015 for bromates, total
trihalogenmethanes, iron, aluminium, manganese and oxidisability parameters have been granted on the basis of the following intermediate targets : - by 31 December 2008 for municipalities above 100,000 inhabitants; - by 31 December 2011 for municipalities with a population between 10,000 and
100,000 inhabitants, and ; - by 31 December 2015 for municipalities with a population between 1,000 and
10,000 inhabitants and smaller settlements. Urban wastewater: a transitional period has been granted :
- by 31 December 2008, compliance with the Directive shall be achieved in all 3 agglomerations of a population equivalent to more than 100,000 ;
- by 31 December 2011, compliance with the Directive shall be achieved in 20 agglomerations with a population equivalent to between 10,000 and 100,000.
- by 31 December 2015, compliance with the Directive shall be achieved in 65 agglomerations with a population equivalent to between 2,000 and 10,000.
Landfill of waste: Latvia has applied for the postponing of the targets with regard to reduction of biodegradable wastes going to landfills by four years, - by 16 July 2010 for the reduction of biodegradable municipal waste going to
landfills to 75 % of the total amount (by weight) of biodegradable municipal waste produced in 1995 or the last year before 1995 for which standardised Eurostat data is available;
- by 16 July 2013 for reduction of biodegradable municipal waste going to landfills to 50 %;
- by 16 July 2020 for reduction of biodegradable municipal waste going to landfills to 35 %.

EX POST EVALUATION OF COHESION POLICY PROGRAMMES 2000-2006 CO-FINANCED BY THE EUROPEAN FUND FOR REGIONAL DEVELOPMENT (OBJECTIVES 1 AND 2) - WORK PACKAGE 5B: ENVIRONMENT AND CLIMATE CHANGE ADE
Regional Case study – Latvia – October 2009 Page 13
2.3 Actions taken
2.3.1 Environmental expenditures and main sources of funds
During the 2004-2006 period, the largest part of public funding to finance environmental infrastructure projects came from external financing to Latvia. The most important source was the Cohesion Fund (CF). The ERDF played a lesser role in supporting the building of new environmental infrastructures than the CF. During the 2000-2004 period, ISPA funds also provided a large budget to carry out environmental projects, especially in the water sector18.
Environmental expenditures in Latvia remain quite difficult to estimate. Table 1 hereafter shows the estimated environmental expenditures by main available financial source and by main environmental theme19. These figures have to be treated carefully as there are several limitations to the information provided by Latvian stakeholders: as the Ministry of Finance did not communicate data in respect to the budget devoted
to the environment, figures are only those estimated by the Ministry of the Environment (cf. table 1);
no data are available for expenditures in relation to energy efficiency and renewable energy sources, except for the 2004-2006 ERDF contribution (cf. table 2);
no data have been communicated for the contribution of the private sector. Based on Eurostat data (Cofog data), total environmental investments made by the industry from 2001 to 2005 can, however, be estimated at €43.8m, including €4.3m in the solid waste sector and €6.4m in sewerage and purification.
no data are currently available for the support from the European Investment Bank (EIB). According to the Ministry of the Environment, the Latvian Treasury is preparing a report about the expenditures of EIB in Latvia. The final results of this work will be available later in 2009.
table 1 does not include other possible support (subsidies/loans) from other countries (such as Russia, Norway, etc.) or other private banks from the Baltic region.
The Ministry of the Environment has estimated that the total budget allocated to environmental purposes during the 2004-2008 period in Latvia is equal to LVL 215.14m20. More than half of the resources came from EU funds: ERDF support corresponds to around 17% of this total budget, which represents half of the support from the Cohesion Fund (CF) to the environment (35% of the total budget allocated to environmental purposes).
18 Latvia benefited from the ISPA fund equivalent to a total amount of LVL 69.3m to carry out projects in the field of
the environment for the 2000-2004 period.
19 Environmental themes for which data are available are: water supply, wastewater collection and treatment, flood risk management, biodiversity and nature protection, as well as rehabilitation of contaminated areas. Water supply and wastewater collection and treatment have been provided together due to the fact that financial information is not available separately for both fields of intervention.
20 Equivalent to €306.12m (if € 1 = LVL 0.702804).

EX POST EVALUATION OF COHESION POLICY PROGRAMMES 2000-2006 CO-FINANCED BY THE EUROPEAN FUND FOR REGIONAL DEVELOPMENT (OBJECTIVES 1 AND 2) - WORK PACKAGE 5B: ENVIRONMENT AND CLIMATE CHANGE ADE
Regional Case study – Latvia – October 2009 Page 14
The sector of water and wastewater is the first beneficiary of the public environmental expenditures (LVL 150m corresponding to 70% of the total budget for the 2004-2008 period) just before the solid waste sector (LVL 32m corresponding to 15% of the total budget for the 2004-2008 period) and the sector of biodiversity and nature protection corresponding to 9% of the total budget for the 2004-2008 period. Globally, the public budget devoted to flood risk management and the rehabilitation of contaminated areas was very low (< 1% of the total budget for the 2004-2008 period) taking into consideration all the environmental fields of intervention.
Table 1: Estimates of environmental expenditures (unit: LVL m) in Latvia for the 2004-2008 period
Financial source
Total environmental expenditures
Solid waste
Water supply/
Wastewater
Flood Risk Management
Energy efficiency/
RES
Biodiversity and nature protection
Rehabilitation of contaminated
areas
National contribution to the environment [(1) +(2)]
86.2 12.72 73.47 0.71 n.c. 16.3 0.3
Linked to ERDF (1) 13.88 1.91 10.59 0 n.c. 1.37 0
State budget co-financing ERDF projects
4.69 0.54 2.79 0 n.c. 1.35 0
Contribution of local authorities (municipalities) to ERDF projects
9.19 1.37 7.8 0 n.c. 0.02 0
Others (2) 89.6 10.81 62.88 0.71 n.c. 14.88 0.3 National contribution to CF projects
69.69 9.7 59.98 0 n.c. 0 0
State budget co-financing INTERREG projects
0.04 0 0 0 n.c. 0.04 0
Latvian Environmental Protection Fund
19.87 1.11 2.9 0.71 n.c. 14.84 0.3
Private sector n.c. n.c n.c n.c n.c. n.c n.c External contribution to environment
128.94 19.29 77.03 0 11.59 3.97 0
ERDF 36.56 4.31 16.83 0 11.59 3.83 0 CF 75.05 14.88 60.16 0 n.c. 0 0 EBRD 17.9 n.c. n.c. 0 n.c. 0 0 INTERREG 0.14 0 0 0 n.c. 0.14 0 Grand total 215.14 32.01 150.05 0.71 11.59 20.27 0.3
Source: ADE, 2009 based on information communicated by the Ministry of the Environment and EBRD.

EX POST EVALUATION OF COHESION POLICY PROGRAMMES 2000-2006 CO-FINANCED BY THE EUROPEAN FUND FOR REGIONAL DEVELOPMENT (OBJECTIVES 1 AND 2) - WORK PACKAGE 5B: ENVIRONMENT AND CLIMATE CHANGE ADE
Regional Case study – Latvia – October 2009 Page 15
2.3.2 ERDF contribution to environmental expenditures in the region Three main objectives were pursued through the 2004-2006 Latvian Single Programming Document (SPD): promoting competitiveness and employment; development of human resources; and development of transport and environmental infrastructures.
In the environmental sector, the ERDF mainly supported municipalities – including municipalities and parishes outside major urban areas – to address deficits in the environmental infrastructure (water, wastewater, and heating infrastructure).
Table 2 shows the breakdown of the ERDF contribution to Latvian environmental expenditures by field of intervention (FOI). Two main fields of intervention benefited from the ERDF: the sector of water and wastewater (LVL 16.83m) ; and energy efficiency, cogeneration, energy control (LVL 11.59m).
In addition, two last fields of intervention received a relatively low level of ERDF support: 1) the solid waste sector (LVL 4.31m) and the biodiversity and nature protection of the nature and biodiversity (LVL 3.83m).
Finally, 3 out of 168 projects devoted to business development in SMEs appear to be directly related to the environment; the first project in the municipal waste management and transportation services, the second in the water sector and the third in hydropower generation21. The ERDF contributions to these projects (total amount: 88,800 LVL) are not mentioned in Table 2 because these relatively small expenditures were classified under a FOI dealing with the development of SMEs and not the environment.
Table 2: ERDF environmental expenditures of the 2004-2006 Latvian SPD (unit: LVL m)
Priority Measure
Field of intervention (FOI)
Total (LVL m)
333
En
ergy
ef
fici
ency
, co
gen
erat
ion
, en
ergy
co
ntr
ol
343
Urb
an a
nd
in
du
stri
al w
aste
344
Dri
nki
ng
wat
er
(col
lect
ion
, sto
rage
, tr
eatm
ent
and
d
istr
ibu
tion
)
345
Sew
erag
e an
d
pu
rifi
cati
on
353
Pro
tect
ion
, im
pro
vem
ent
and
re
gen
erat
ion
of t
he
nat
ura
l en
viro
nmen
t
1. Promotion of Territorial Cohesion
1.1 Improvement of Environmental Infrastructure and Tourism
11.59 4.31 16.83 3.83 36.56
% of each FOI (%) 31.7% 11.8% 46% 10.5% Source: ADE, 2009 based on information communicated by the Ministry of the Environment.
21 Source: State of Regional Development Agency which managed the ERDF contribution to the Latvian SME sector.

EX POST EVALUATION OF COHESION POLICY PROGRAMMES 2000-2006 CO-FINANCED BY THE EUROPEAN FUND FOR REGIONAL DEVELOPMENT (OBJECTIVES 1 AND 2) - WORK PACKAGE 5B: ENVIRONMENT AND CLIMATE CHANGE ADE
Regional Case study – Latvia – October 2009 Page 16
Table 3 below shows targets and achieved values of indicators related to environmental expenditures made under the 2004-2006 Latvian SPD.
Table 3: Main output and result of the 2004-2006 Latvian SPD in the field of the environment
Name of the indicator Target value as determined in
2004
Achieved value (31/12/2008)
Number Percentage of target
(%) Number of improved water service systems
40 128 320
Increased share of population receiving good drinking water (%)
1 1.89 189
Number of projects in waste sorting n.a. 8 - Area (ha) of closed and re-cultivated dumpsites
75 79.2 106
Increase share of dumpsites area re-cultivated (%) 7 7.39 106
Number of potential NATURA 2000 territories with developed infrastructure
10 6 60
Number of projects to upgrade district heating systems
15 33 120
Number of new boiler houses n.a. 26 - Replaced heating networks (km) n.a. 50 - Increase in energy savings due to projects to upgrade district heating systems (%)
n.a. 8% -
Sources: WP2; annual reports and discussions with the Ministry of the Environment and the Ministry of the Economy. Most of the targets set at the beginning of the period were exceeded in 2008: the number of improved water systems (including water supply to the population,
reduction of water leakages and the wastewater collection and treatment) were higher than expected. According to the Ministry of the Environment, this reflects the strong needs of municipalities (especially in rural zones) in these basic infrastructures, which are lacking or in bad working conditions.
for projects in Natura 2000 sites, the target was not reached. This could be partially explained by the fact that this type of activity could also have been co-funded by other structural funds (e.g. Interreg).
the number of upgraded heating systems was higher than expected. These common heating systems, used in numerous municipalities in Latvia, often work in bad conditions (e.g. large consumption of fuel or natural gas to produce heating power, or a loss of heating power on the network). Municipalities needed to repair and upgrade the whole heating system to be more energy-efficient.

EX POST EVALUATION OF COHESION POLICY PROGRAMMES 2000-2006 CO-FINANCED BY THE EUROPEAN FUND FOR REGIONAL DEVELOPMENT (OBJECTIVES 1 AND 2) - WORK PACKAGE 5B: ENVIRONMENT AND CLIMATE CHANGE ADE
Regional Case study – Latvia – October 2009 Page 17
2.4 ERDF decision and planning process
As shown in Figure 2 below, the Managing Authority of EU funding in Latvia is the Ministry of Finance. Since 2004, the Central Finance and Contracting Agency (CFCA) – part of the Ministry of Finance – has aimed at ensuring safe, effective and transparent administration of the EU co-financed programmes, including the 2004-2006 SPD co-financed by the ERDF.
The first level intermediate bodies are the Sectoral Ministries. After supporting the Ministry of Finance in the design of the 2004-2006 SDP for Latvia, they were in charge of the management of the SPD activities according to their sector policies and priorities of the SPD. They have three core missions regarding the SPD: elaboration of sectoral interventions in case of national programme projects; selection of projects according to general quality and specific criteria; approval of aid schemes and national programmes.
Figure 2 : Set-up for the implementation of the 2000-2006 SPD, especially as regards environmental measures
Source: ADE, 2009 based on information from the Ministry of Regional Development.
Measures related to energy efficiency and control
These measures are managed by the Ministry of the Economy. In the case of the projects in energy efficiency and control, selection of the projects to be co-funded has been carried out in two different ways: direct support for the National Programme « Upgrading district heating systems by
reducing sulphur content in fuel » managed by the Ministry of the Economy; open call for projects to upgrade district heating networks. Administrative and
technical criteria (e.g. energy savings) for this type of support had to be completed.
Ministry of Finance
Ministry of the Economy
Ministry of the Environment
Ministry of Regional
Development
State Regional Development
Agency
Steering group committee Monitoring committee
Managing Authority
First level intermediate
bodies
Second level intermediate
bodies/ managers

EX POST EVALUATION OF COHESION POLICY PROGRAMMES 2000-2006 CO-FINANCED BY THE EUROPEAN FUND FOR REGIONAL DEVELOPMENT (OBJECTIVES 1 AND 2) - WORK PACKAGE 5B: ENVIRONMENT AND CLIMATE CHANGE ADE
Regional Case study – Latvia – October 2009 Page 18
Measures related to water supply/ wastewater, solid waste and eco-tourism
These measures are managed by the Ministry of the Environment.
In Latvia, the drinking water and sewerage pipeline have adjacent networks, therefore improvement in water services are planned in concerted action. In the case of the water sector, there was direct support from the ERDF to the National Programme “Development of water services in the agglomerations with population equivalent below 2000”. Although initial lists of potential beneficiaries were established in the national environmental public investment planning strategy, local authorities were asked to submit their applications. Administrative and qualitative criteria (compliance to the environmental priority, management capacity, budget and cost-effectiveness) and the programme specific criteria were used to select the projects of municipalities to be co-funded. In the case of the solid waste sector, selection of the projects to be co-funded has been carried out in different ways: direct support for the National Programme “Closure and re-cultivation of small and
medium scale non-compliant dumpsites” ; an open call for projects to establish separate waste collection points and treatment;
The solid waste National Programme was focused on municipalities of two waste management regions (Riga and the North Vidzeme) where activities have not been covered by other EC funding schemes. A total of 47 dumpsites covering around 80 ha were listed in the National Programme. A feasibility study was carried out for each dumpsite closure. This work was organised and funded by the Ministry of the Environment. The Local Authorities received a developed project and were only required to manage implementation.
The open call also focused on municipalities. The aim of the activity was to promote the achievement of the targets of the Packaging Directive 94/62/EC, the Landfill Directive 1999/31/EC, as well as the Waste Framework Directive 75/442. Administrative, qualitative and financial criteria as well as specific criteria related to waste management were used to select the projects of municipalities to be co-funded.
Eco-tourism and nature conservation was supported by the ERDF through the National Programme “Development of eco-tourism in potential Natura 2000 areas”. This programme aimed at promoting natural tourism activities including the development of eco-tourism facilities in the Natura 2000 sites for optimisation of the flow of tourists to potential Natura 2000 sites and consequently, at decreasing the negative impact on these areas, preserving the biotopes, animal and plant species.
Selection of the projects to be co-funded was based on the list of Natura 2000 areas listed in the programme. Projects have been implemented and monitored by different stakeholders: the Administration of the Nature Protected Area, the National Nature Conservation Boards, and local government (the city council).

EX POST EVALUATION OF COHESION POLICY PROGRAMMES 2000-2006 CO-FINANCED BY THE EUROPEAN FUND FOR REGIONAL DEVELOPMENT (OBJECTIVES 1 AND 2) - WORK PACKAGE 5B: ENVIRONMENT AND CLIMATE CHANGE ADE
Regional Case study – Latvia – October 2009 Page 19
Measures related to the development of the SME base
These measures are managed by the State Regional Development Agency, part of the Ministry of Regional Development. In the case of the development of the SME base, applicants had to mention if their project would have a neutral, negative or positive impact on the environment. When a negative impact was mentioned, the applicant had to carry out an environmental impact analysis for the project and to suggest correctional measures to compensate for the negative environmental impact. In other words, there was no clear strategy to support and select environmental projects in the SME base.


EX POST EVALUATION OF COHESION POLICY PROGRAMMES 2000-2006 CO-FINANCED BY THE EUROPEAN FUND FOR REGIONAL DEVELOPMENT (OBJECTIVES 1 AND 2) - WORK PACKAGE 5B: ENVIRONMENT AND CLIMATE CHANGE ADE
Regional Case study – Latvia – October 2009 Page 21
3. Analysis of the ERDF contribution
3.1 Relevance of the 2004-2006 ERDF strategy in the environmental sector for enhancing territorial development
According to the State Regional Development Agency, the environment was not a priority of the SPD during the 2004-2006 period for Latvia. ERDF support to the environment represented around 14% of the total ERDF support through the 2004-2006 SPD 22 . Priorities were rather economic development and employment.
The ERDF strategy suffered from several weaknesses which can be partly explained by the new approach required; a poor, even non-existent regional and territorial approach for fixing the priorities of
the ERDF a lack of integrated vision for supporting the transition process through external
financing a focus on sectoral interventions within long term plans established at different levels.
Only national sectoral strategies were implemented when Latvian stakeholders prepared the 2004-2006 Latvian SPD. One of the objectives of the SPD dealt with developing environmental infrastructures. In this matter, the guidelines of the SPD were clear for the water sector (water supply and wastewater), for the sector of solid waste, the heating sector and for the sector of ecotourism and nature conservation. Either the SPD had to directly support national programmes or the SPD had to provide a financial contribution through a call for tenders to support environmental infrastructures. Municipalities were the main beneficiaries of the ERDF support in these fields of intervention.
There was no strategy in terms of environmental investments and support for Latvian SMEs. The main objectives of the ERDF strategy for the SME base were to promote competitiveness and employment as well as to develop human resources. However, it appears that 3 small projects supported SMEs by accidental environmental investments23: one in the sector of municipal solid waste management and transportation services, one in the water sector and one in the sector of hydropower generation.
Latvia has just started to experience regional development thanks to the implementation of the 2004-2006 SPD. The operational programme was implemented at national level as no regional policy existed at the beginning of the 2004-2006 period. Consequently, this first experience launched a regional step-by-step process which, as mentioned before, is now much more advanced.
22 Total ERDF contribution to the 2004-2006 Latvian SPD is estimated at €369m (Source: DG Regional Policy website,
2009), including around €52m for environmental measures.
23 Under the aid scheme called “Support to productive investments in specially assisted areas”.

EX POST EVALUATION OF COHESION POLICY PROGRAMMES 2000-2006 CO-FINANCED BY THE EUROPEAN FUND FOR REGIONAL DEVELOPMENT (OBJECTIVES 1 AND 2) - WORK PACKAGE 5B: ENVIRONMENT AND CLIMATE CHANGE ADE
Regional Case study – Latvia – October 2009 Page 22
3.2 Quality of the planning and implementation process in meeting regional challenges in the covered fields
Due to state aid issues, only municipalities applied to receive ERDF support for activities linked to the environment. The selection procedure was organised in two ways: either the ERDF was devoted to directly supporting national programmes decided by the central government or municipalities could apply to a call for tenders based on administrative and technical criteria. In both cases, part of the technical criteria included environmental criteria. For example, the call for tender dealing with energy efficiency (support to heating systems) requested municipalities to mention in their applications the amount of saved energy, reduced impacts on the environment and increased use of renewable energies.
The selection procedure faced significant delays. In some particular cases the preparation and the approval of the project were really difficult. This was due to two main factors: the lack of technical and administrative capacities of some municipalities. A lot of
municipalities asked consultants to prepare the application as they had neither the capacity nor the administrative personnel to prepare it themselves. In some cases, consultants provided bad results. This led to a delay in the approval of the project.
the administrative burden of the selection procedure. It appeared in one case in the water sector (Litgane Parish) that the Ministry of the Environment requested the municipality to start the data feasibility of the project again while this analysis had been already done before the implementation of the 2004-2006 Latvian SPD. This was due to the fact that the administrative procedure applied to the ERDF support was different than the procedure implemented by the municipality to prepare the water project. While municipalities are not rich and often face difficulties in raising a public budget from their inhabitants (especially at the time of financial crisis) they had to find an additional budget to prepare the technical application once more, to be able to apply for ERDF support.
Due to the delay in approval, the implementation of co-funded projects often began with delays. In some projects, work was also delayed due to technical issues not foreseen in the planning process.
In the case of the water sector, an uncertain national lending policy for municipalities for public infrastructures caused constraints at the beginning of the projects. In the case of the Litgane Parish, the municipality had to contract a loan from the Latvian Environmental Fund and pre-finance all the project activities. Technical issues also appeared. No correct information about the location of water pipe systems was available24. Finally, the water network system was in such a bad condition that extra work was needed and required an extra budget not foreseen and made the work last longer than expected.
In the municipal solid waste sector, the ERDF strategy did not integrate each step of the recycling process. The focus of ERDF support was devoted to sorting activities, including increasing awareness of the population to sorting activities. However, huge problems occurred when it came to recycling itself. According to Riga City Council, containers
24 Information from previous plans elaborated during the Soviet Union era did not correspond to the real situation.

EX POST EVALUATION OF COHESION POLICY PROGRAMMES 2000-2006 CO-FINANCED BY THE EUROPEAN FUND FOR REGIONAL DEVELOPMENT (OBJECTIVES 1 AND 2) - WORK PACKAGE 5B: ENVIRONMENT AND CLIMATE CHANGE ADE
Regional Case study – Latvia – October 2009 Page 23
serving to sort municipal waste could not be collected by waste collecting companies. Indeed, they accumulated a lot of waste for recycling and faced difficulty in selling sorted waste to recycling companies after primary treatment. The exporting of sorted waste (mainly to Bielorussia and Russia) experienced difficulties due to low waste prices25. In addition, the high costs of transportation were not covered by the waste management fees. In the spring of 2009, there was a temporary break in the waste management system and sorted waste was taken for landfill.
3.3 Contribution of the ERDF to improving the environmental situation
Evolution of the environmental situation
Although the population is provided with the water supply, the drinking water quality often does not meet EC standards. In the 2004-2008 period, just 52% to 76% of consumers of public drinking water received water complying to EC standards. The key issue regarding the water quality is still the iron content; of all the cases where standards are not met, about 50% are caused by high iron content or suspended matters in the water supply. The problem is particulalry relevant in smaller water supply systems. However, due to specificities of the audit monitoring programme, public health data shows fluctuations, and not an improvement, in drinking water quality over the programming period.
Table 4: Trends in the access to safe drinking water in Latvia (2000-2008) Indicator 2000 2001 2002 2003 2004 2005 2006 2007 2008
Share of samples where chemical standards are not met (%)
58.2 49.5 56.3 59.3 77.0 72.6 75.5 67.1 60.7
Share of samples where microbiological standards are not met (%)
6.4 5.5 3.1 3.3 7.9 3.4 10.2 13.4 5.8
Share of the population receiving centralised drinking water complying to chemical standards (%)
n.a. n.a. n.a. n.a. 52 63 75 69 76
Share of the population receiving centralised safe drinking water complying to microbiological standards (%)
n.a. n.a. n.a. n.a. 96.3 98.7 98.8 93 98
Source: LPHA, 2009.
The trend shows a decrease by half in the wastewater discharges since the beginning of the 1990’s. In the 2000-2007 period, wastewater discharges decreased by almost 20%. Due to large investments in the water sector, the level of treatment also gradually increased. The key challenges are still to reduce discharges of untreated wastewater (from ca. 22% to 13 %) and to increase the share of wastewater undergoing advanced treatment levels (from 8% to 11%) over the period. However, since Latvia is designated as a sensitive area in terms of
25 Due to low demand for sorted waste because of the financial crisis.

EX POST EVALUATION OF COHESION POLICY PROGRAMMES 2000-2006 CO-FINANCED BY THE EUROPEAN FUND FOR REGIONAL DEVELOPMENT (OBJECTIVES 1 AND 2) - WORK PACKAGE 5B: ENVIRONMENT AND CLIMATE CHANGE ADE
Regional Case study – Latvia – October 2009 Page 24
eutrophication, adequate nutrient removal remains important in achieving surface water ecological quality objectives.
Table 5: Trends in the wastewater sector in Latvia (2000-2006) Indicator 2000 2001 2002 2003 2004 2005 2006 Total wastewater discharges(million m³) 180 180 172 149 150 142 152
Share of untreated wastewater (%) n.a 21.8 21.6 11.9 15.4 15.6 12.7
Share of secondary treated wastewater from total wastewater (%) n.a 60.3 59.3 70.1 66.9 66.4 66.2
Share of tertiary treated wastewater from total wastewater (%) n.a 7.8 10.6 9.6 9.8 9.9 11.2
Source: LEGMA, 2009.
The development of the regional waste management systems has provided access to the waste management services for many inhabitants. As a result, the generated waste volume also increased gradually: from 270 kg/capita in 2000 to 377 kg/capita in 2007. Two other reasons are the changing consumption patterns – increased use of disposable packaging, and increased imports of second-hand goods – as well as an increase in consumption itself. Usually this process is more visible in cities while impacting the total national waste quantities generated.
Table 6: Trends in the solid waste sector in Latvia (2000-2007) Indicator 2000 2001 2002 2003 2004 2005 2006 2007
Municipal waste generation (kg/capita) 270 302 338 298 311 310 411 377
Packaging waste generation (kg/capita) n.a. n.a. n.a. 69.4 89.9 92.6 109.2 125.1
Share of municipal waste deposited in landfills
93 94 83 83 83 78 71 85
Number of waste dumpsites 503 251 n.a. 191 148 109 99 84
Sources: Eurostat, 2008; LEGMA, 2008; MoE, 2008.
The share of collected waste (paper, glass, plastic) which can be recovered and recycled is increasing gradually; however, a large part is still deposited in landfills (ca. 80%). The closure of the dumpsites is an ongoing process and will be finalised by July 2009, when 10-12 landfill sites will have been constructed to cover all regions in Latvia.
Although energy efficiency improved progressively, overall primary energy consumption increased by almost 30% in the 2000-2007 period. This obviously reflects the trend of increasing GDP in Latvia for the same period. At the same time, the share of renewable energy in gross primary energy consumption was more or less stable while the share of renewable electricity in total electricity consumption fluctuated by about 10%.
As the renewable electricity generation is mainly based on hydropower, the capacities of these resources were used to the extent that no significant environmental damage should have appeared. In Latvia, the future trend is to explore wind energy further (particulary offshore) and the use of biogas.

EX POST EVALUATION OF COHESION POLICY PROGRAMMES 2000-2006 CO-FINANCED BY THE EUROPEAN FUND FOR REGIONAL DEVELOPMENT (OBJECTIVES 1 AND 2) - WORK PACKAGE 5B: ENVIRONMENT AND CLIMATE CHANGE ADE
Regional Case study – Latvia – October 2009 Page 25
Table 7: Trends in energy efficiency and renewable energy sources in Latvia (2000-2007)
Indicator 2000 2001 2002 2003 2004 2005 2006 2007
Share (%) of renewable energy in gross primary energy consumption (%)
31.8 31.7 31.3 30.9 33.1 33.0 31.0 30.0
Share (%) of renewable electricity in total electricity consumption
47.7 46.1 39.3 35.4 47.1 48.4 37.7 36.4
Energy intensity (kg of oil eq. per thousand €) 759 767 708 704 666 614 563 n.a.
Gross inland consumption of primary energy (1 000 toe) 3,746 4,092 4,021 4,289 4,406 4,492 4,625 4,764
Sources: Eurostat, 2008; Ministry of the Economy, 2008. When Latvia joined the EU, the potential designated sites to be protected were reviewed and evaluated by the nature conservation experts during biogeographical seminars. As a result, more areas were required to be proposed to ensure sufficient nature conservation. New areas were subsequently investigated and added to the Natura 2000 network. There are no indications regarding the evolution of the biodiversity26.
Effects of the SPD on the environment
ERDF support to the environment was significantly lower than other financial sources such as the Cohesion Fund or the total national contribution to environmental investments and expenditures in the country. However, the ERDF allowed municipalities to invest in environmental infrastructures with good results. In the SME base, the number of projects aiming at improving the environmental situation was insignificant (3 out of 168 dealt with the environment). In addition, these projects were really small (ERDF support was lower than LVL 40 k).
In the water sector, the ERDF contributed to supporting municipalities in investing in the water network (water supply as well as wastewater collection and treatment). As a result, more people are connected to safe drinking water and the share of untreated wastewater is decreasing. However, important challenges still have to be overcome in order to meet the targets of the urban wastewater directive across the country.
Even if most investments in sorting activities have been made thanks to the Cohesion Fund, the ERDF also supported these investments in the largest towns (Riga, Jelgava, etc.). As a result, the sorting system was improved, taking into account investments in waste collection points, construction works, the purchase of containers, and public awareness actions. However, large issues in the Latvian solid waste sector still remain.
26 The countries will report to the EC based on a six-year period on the conservation status of the protected habitats
and species with a view to monitoring the progression or regression in regard to the maintenance of biodiversity. The current reporting period is 2000-2006, for which the data will be compiled and reported to the EC in the middle of 2007. The report will serve as a baseline for assessment of the situation and to monitor the progress in the next reporting period until 2013.

EX POST EVALUATION OF COHESION POLICY PROGRAMMES 2000-2006 CO-FINANCED BY THE EUROPEAN FUND FOR REGIONAL DEVELOPMENT (OBJECTIVES 1 AND 2) - WORK PACKAGE 5B: ENVIRONMENT AND CLIMATE CHANGE ADE
Regional Case study – Latvia – October 2009 Page 26
The positive trend in sorting activities has hidden several other issues: the strategy to manage solid waste did not take into account the whole solid waste
chain from waste generation to recycled waste. Whilst sorting is improving, Latvia now faces an important issue to treat sorted waste inside the country or to export it; recycling infrastructures are insufficient in Latvia to process sorted waste. Presently prices on the solid waste market are too low to be attractive to the private sector inside and outside the country. As a result, a large part of the sorted waste is landfilled;
the sites are maintained by private waste management companies which are providing waste collection services (e.g. in Riga). Maintenance is not paid for by the waste management fee as the sale of collected waste should cover these costs. In addition, the legislation requires that the producer of packaging products must also cover the costs of recycling the packaging waste. However, these conditions are causing problems as the companies cannot currently make a profit in the recycling market;
despite some educational seminars for householders and housing unions being organised to increase the public awareness regarding the sorting, collection and treatment of municipal solid waste, attendees to such seminars were quite low. As a result, measures to improve the waste sorting system are being implemented quite slowly.
during the implementation of the 2004-2006 SPD, a lot of sites were identified to establish separate waste containers in large cities (at least in Riga). However, it turned out that waste containers failed to be set up in a large part of the identified sites as they had to be owned by municipalities or they were too close to houses or other important infrastructural networks. In addition, there was resistance from some housing unions as the waste containers also attract homeless people, which cause negative impacts for the neighbourhood surrounding the containers.
In addition, the ERDF contributed significantly to closing and rehabilitating dumpsites throughout the country. ERDF support was channelled through the national programme in this field but only focused on two waste management regions where EC funding was not available for these type of activities (Riga and North Vidzeme). As a result, pollution leakages (odours, groundwater and litter) in the area surrounding the dumpsite were stopped. This was also welcomed by Natura 2000 sites and houses close to dumpsites.
In the energy sector, the only, and small, project with a SME dealing with hydroelectricity generation did not contribute significantly to the share of electricity of the country produced from renewable energy sources. On the contrary, the ERDF contributed more to increasing energy savings in common heating systems at the level of municipalities. However, the main constraint for implementing this type of activity was related to ownership issues of land or property. The whole system – including the pipe network in the ground – had to be owned by local authorities, the government or under a long-term rental agreement.
Amongst other towns, Olaine benefited from this support to repair a part of its heating system. Due to the co-funded project, energy losses from the system in Olaine have been estimated at 920 MWh per year, which is equivalent to around 205t of CO2 per year. Even positive results have been obtained due to ERDF support in the field of energy efficiency. A lot of effort still needs to be made to reduce the energy intensity of the Latvian economy and improve the numerous common heating systems inherited from the Soviet Union era.

EX POST EVALUATION OF COHESION POLICY PROGRAMMES 2000-2006 CO-FINANCED BY THE EUROPEAN FUND FOR REGIONAL DEVELOPMENT (OBJECTIVES 1 AND 2) - WORK PACKAGE 5B: ENVIRONMENT AND CLIMATE CHANGE ADE
Regional Case study – Latvia – October 2009 Page 27
3.4 Contribution of the ERDF to regional economic development
Evolution of the economic situation
Table 8: Economic performance of Latvia (2003-2008) Socio-economic indicators 2003 2004 2005 2006 2007 2008 GDP/capita (at PPS; EU-27=100) 43.3 45.7 48.6 52.5 57.9 55.7
GDP annual growth rate 7.2 8.7 10.6 12.2 10.0 -4.6 Employment rate (of the 15-64 age group) 61.8 62.3 63.3 66.3 68.3 68.6
Investment as a % of GDP 24.4 27.5 30.6 n.a. n.a. n.a. R&D as a % of GDP 0.4 0.4 0.6 0.7 0.6 n.a.
Source: Eurostat and Latvian Central Statistical Bureau, 2009.
Between 2005 and 2007, rapid economic growth was observed in Latvia, with an average GDP annual growth equal to 10.9%. While domestic demand ensured economic growth and the contribution of net exports was negative, investments significantly increased during this period. However, since 2007, growth rates have started to decrease and became negative in the second quarter of 2008. The decrease of domestic demand at the beginning of 2008 started to affect the development of trade, construction and the real estate market to a considerable degree. In the second half of 2008, negative growth was observed in almost all basic economic sectors, excluding primary sectors and commercial services.
Employment was rapidly affected by the decrease in growth rates. Whereas employment of those aged 15 to 64 increased by 5% between 2005 and 2007, it only increased by 0.3% in 2008 compared to 2007.27 As a result, the unemployment rate considerably increased from 6% in 2007 to 7.5% in 2008. Today, the financial crisis is hitting the Latvian economy violently. While Latvian GDP decreased by 4.6% in 2008, Eurostat has foreseen a GDP decrease of 13.1% in 2009 and of around 3.2% in 2010. Due to this deep recession, fears of a devaluation of the lat (the Latvian currency; LVL) are growing and this threatens the whole financial stability of the Baltic region. Advised by bankers during the golden years (2005 to the beginning of 2007), many Latvian people contracted loans in euros to buy apartments and houses at growing prices. A devaluation of the domestic currency could lead to a worse situation for these Latvian households.
For the future, the main risk is related to instability of global financial markets, as well as the situation in Latvian export markets. A rapid and continual decrease in credit availability and the need for the government to reduce (drastically) its expenditures should reduce public investment, public services to the population, as well as private consumption. More specifically, this possible decrease in public investments could affect investment in environmental infrastructures and jeopardize the reaching of EU Directives for which Latvia has already received derogations.
27 Source: Eurostat, 2009.

EX POST EVALUATION OF COHESION POLICY PROGRAMMES 2000-2006 CO-FINANCED BY THE EUROPEAN FUND FOR REGIONAL DEVELOPMENT (OBJECTIVES 1 AND 2) - WORK PACKAGE 5B: ENVIRONMENT AND CLIMATE CHANGE ADE
Regional Case study – Latvia – October 2009 Page 28
Effects of the SPD on regional economic development
There was no strategy in Latvia integrating environmental issues into regional economic development. The lack of environmental infrastructures is not the only constraint to attracting investors in the country. The main constraints to economic development are still primarily political corruption, tax evasion and VAT fraud, as well as the low support programmes for SMEs.
Some impact of environmental measures can nevertheless be mentioned. Firstly in the environmental sector: ERDF support for environmental activities contributed to increasing the number of local units in the water sector and in the waste (recycling) sector between 2004 and 2006 (cf. table 8 hereafter). In both sectors the number of employees also increased due to the contribution of public funds, including the ERDF. In addition, ERDF supported sorting activities contributed to maintain or create a certain number of jobs in the private companies, which were in charge of the waste collection and sorting.
Table 9: Activities linked to the environment in Latvia (2003 to 2006) Activities linked to the
environment Sector 2003 2004 2005 2006
Number of local units Recycling 61 70 92 101 Water (1) 154 121 145 149
Gross investment in tangible goods (€ m)
Recycling 0.5 3.9 6.1 9.2 Water (1) n.a. 31.7 52.2 26.5
Number of persons employed Recycling 387 477 630 709 Water (1) 2,043 1,972 2,148 2,010
(1) Collection, purification and distribution of water Source: Eurostat, 2009.
Secondly, the improvement of environmental services contributed to slightly increasing the attractiveness of the zone for households as well as for companies. Projects aiming at reducing losses in common heating systems have positively impacted the household budget for heating houses and increased the attractiveness for people living in these municipalities. Moreover, closure and rehabilitation of dumpsites allowed, in certain regions and at local level, the development of new industrial parks and attracted new enterprises.
ERDF support to build infrastructures for ecotourism in Natura 2000 sites has also contributed to regional development. Sites which benefited from this support have attracted more people – especially people from Riga – for tourism activities. This has contributed to the development of hotel accommodation and restaurants around the sites.
3.5 Contribution of the ERDF to improving the quality of life
There is some evidence that supported environmental activities have led to a better quality of life for the Latvian population, mainly at a local level: in the water sector, more people have access to a water supply meeting the required
standards; in the waste sector, closed and rehabilitated dumpsites have reduced or eliminated bad
nuisances for people living in the surrounding areas; new or upgraded infrastructures in Natura 2000 sites have increased the opportunities
for people to enjoy leisure time in their country.

EX POST EVALUATION OF COHESION POLICY PROGRAMMES 2000-2006 CO-FINANCED BY THE EUROPEAN FUND FOR REGIONAL DEVELOPMENT (OBJECTIVES 1 AND 2) - WORK PACKAGE 5B: ENVIRONMENT AND CLIMATE CHANGE ADE
Regional Case study – Latvia – October 2009 Page 29
Annex: List of stakeholders interviewed
Name Position Institution
Iveta Umule Head of Unit Ministry of the Environment, Investment Department, Evaluation Unit
Ilze Donina, Head of Unit Ministry of the Environment, Waste Management Unit
Zane Galinska Head of Unit Ministry of the Economy, Unit of EU funded Public Infrastructure
Ilona Raugze Director Ministry of Regional Development and Local Government, Medium-Term Development Planning Department
Sandra Cakule Deputy Director State Regional Development Agency
Aivars Voldeks Head of Unit State Regional Development Agency, Unit of Implementation of Programmes
Ralfs Spade Head of Unit State Regional Development Agency, Coordination Unit of Assessments and Research
Sergejs Kirilovs Head of Unit Olaine City Council, Development Unit
Viesturs Liepa Director Olaine City Council, “Olaine water and heating systems”
Oksana Purina Specialist Olaine City Council, Public procurement Unit
Nata Vanaga Head of Unit Riga City Council, Waste Unit
Marite Ievina Head of Unit Jelgava City Council, Project management Unit
Aivar Jakobsons Project Manager Sigulda Amalgamated municipality Aija Zandere Chairperson Olaine Parish Council
Marija Grase Environmental expert
Olaine Parish Council
Silvija Zaharane Project manager Litgane Parish Council Andris Junkurs Project manager Nature Conservation Board Rolands Auzins Director Nature Conservation Board
Aigars Piksens Head of Unit Gauja National Park Administration, Project Management Unit
Kristine Melece Project manager Gauja National Park Administration, project Management Unit


ADE s.a. Rue de Clairvaux, 40
B-1348 Louvain-la-Neuve Belgium
Tel.: +32 10 45 45 10 Fax: +32 10 45 40 99 E-mail: [email protected]
Web: www.ade.be
Ex Post Evaluation of Cohesion Policy Programmes 2000-2006 Co-Financed by the European Fund for Regional Development (Objectives 1 And 2) – Work Package 5b: Environment and Climate Change
RReeggiioonnaall ccaassee ssttuuddyy PPooddkkaarrppaacckkiiee
October 2009


TThhiiss rreeppoorrtt hhaass bbeeeenn pprreeppaarreedd bbyy AADDEE aatt tthhee rreeqquueesstt ooff tthhee EEuurrooppeeaann CCoommmmiissssiioonn..
TThhee vviieewwss eexxpprreesssseedd aarree tthhoossee ooff tthhee CCoonnssuullttaanntt aanndd ddoo nnoott rreepprreesseenntt tthhee ooffffiicciiaall vviieewwss ooff tthhee EEuurrooppeeaann CCoommmmiissssiioonn..
RReepprroodduuccttiioonn oorr ttrraannssllaattiioonn iiss ppeerrmmiitttteedd,, pprroovviiddeedd tthhaatt tthhee ssoouurrccee iiss dduullyy aacckknnoowwlleeddggeedd aanndd nnoo mmooddiiffiiccaattiioonnss ttoo tthhee tteexxtt aarree mmaaddee..


EX POST EVALUATION OF COHESION POLICY PROGRAMMES 2000-2006 CO-FINANCED BY THE EUROPEAN FUND FOR REGIONAL DEVELOPMENT (OBJECTIVES 1 AND 2) - WORK PACKAGE 5B: ENVIRONMENT AND CLIMATE CHANGE ADE
Regional Case study – Podkarpackie – October 2009 Table of Contents
Table of Contents
ACRONYMS
SUMMARY
INTRODUCTION ............................................................................................................ 1
1. MAIN ISSUES FOR THE ERDF PROGRAMMES IN THE 2004-2006 PERIOD ............. 3
1.1 INSTITUTIONAL FRAMEWORK: DYNAMIC AND ON-GOING DECENTRALISATION
PROCESS .............................................................................................................................. 3 1.2 ECONOMIC CHALLENGES: FAST TRANSITION WITH INCREASING TERRITORIAL
DISPARITIES ........................................................................................................................ 4 1.3 MAIN ENVIRONMENTAL ISSUES: COMPLIANCE WITH EU LEGISLATION ................... 5
2. STRATEGIES AT NATIONAL AND REGIONAL LEVELS AND THE ROLE OF THE ERDF .......................................................................................................... 9
2.1 ENVIRONMENT AS A KEY PRIORITY OF THE NATIONAL DEVELOPMENT PLAN ...... 9 2.2 FUNDING STRATEGIES: THE IMPORTANT ROLE OF THE NATIONAL FUND FOR
ENVIRONMENTAL PROTECTION .................................................................................... 11 2.3 ERDF SUPPORT FOR THE ENVIRONMENT CHANNELLED THROUGH
THE REGIONS ................................................................................................................... 12 2.4 THE DECISION-SELECTION PROCESS ............................................................................ 13
3. ACTIONS TAKEN ................................................................................................. 17
4. ANALYSIS OF THE ERDF CONTRIBUTION ......................................................... 23
4.1 RELEVANCE OF THE 2004-2006 ERDF STRATEGY IN THE ENVIRONMENTAL
SECTOR FOR ENHANCING TERRITORIAL DEVELOPMENT ........................................... 23 4.2 QUALITY OF THE PLANNING AND IMPLEMENTATION PROCESS IN MEETING
REGIONAL CHALLENGES IN THE COVERED FIELDS .................................................... 24 4.3 CONTRIBUTION OF THE ERDF TO IMPROVING THE ENVIRONMENTAL
SITUATION ........................................................................................................................ 25 4.4 CONTRIBUTION OF THE ERDF TO REGIONAL ECONOMIC DEVELOPMENT ........... 28 4.5 CONTRIBUTION OF THE ERDF TO IMPROVING THE QUALITY OF LIFE .................. 30
ANNEX 1: LIST OF PEOPLE MET .............................................................................. 31
ANNEX 2: NATIONAL PROGRAMME FOR MUNICIPAL WASTE WATER TREATMENT ......................................................................................... 35
LIST OF FIGURES
FIGURE 1: MAP OF THE PODKARPACKIE REGION NATURAL RESERVES .................................. 7

EX POST EVALUATION OF COHESION POLICY PROGRAMMES 2000-2006 CO-FINANCED BY THE EUROPEAN FUND FOR REGIONAL DEVELOPMENT (OBJECTIVES 1 AND 2) - WORK PACKAGE 5B: ENVIRONMENT AND CLIMATE CHANGE ADE
Regional Case study – Podkarpackie – October 2009 Table of Contents
LIST OF CHART
CHART 1: NATIONAL DEVELOPMENT PLAN: OBJECTIVES IN THE ENVIRONMENTAL
FIELDS AND SOURCES OF FUNDING ......................................................................... 10 CHART 2: SOURCES OF FINANCING ENVIRONMENTAL PROTECTION AND WATER
MANAGEMENT 2004-2006 IN PODKARPACKIE REGION........................................ 12 CHART 3: IROP EXPENDITURES IN ENVIRONMENTAL INFRASTRUCTURES
BY MAIN FIELDS OF INTERVENTION – 2004-2008 - PLN ...................................... 19 CHART 4: AMOUNT SPENT UNDER SOP-ICE IN PODKARPACKIE 2004-2008 ..................... 22
LIST OF TABLES
TABLE 1: AMOUNTS ALLOCATED TO ENVIRONMENTAL MEASURES UNDER THE IROP
PROGRAMME IN PODKAPARCKIE REGION (MILLION PLN) ................................. 17 TABLE 2: OTHER ERDF INTERVENTIONS IN THE ENVIRONMENTAL FIELDS IROP
PODKARPACKIE .......................................................................................................... 20 TABLE 3: MAIN OUTPUT INDICATORS ...................................................................................... 21 TABLE 4: ENVIRONMENTAL INDICATORS FOR PODKARPACKIE REGION ........................... 25 TABLE 5: RESULTS AND IMPACT INDICATORS OF THE IROP REGIONAL PROGRAMME
(FOR PODKARPACKIE) ............................................................................................... 26 TABLE 6: SOCIO-ECONOMIC INDICATORS IN PODKARPACKIE REGION .............................. 28

EX POST EVALUATION OF COHESION POLICY PROGRAMMES 2000-2006 CO-FINANCED BY THE EUROPEAN FUND FOR REGIONAL DEVELOPMENT (OBJECTIVES 1 AND 2) - WORK PACKAGE 5B: ENVIRONMENT AND CLIMATE CHANGE ADE
Regional Case study – Podkarpackie – October 2009 Acronyms
Acronyms
CF Cohesion Fund EAGGF European Agriculture Guidance and Guarantee Funds
ERDF European Regional Development Fund
FDI Foreign Direct Investment
GDP Gross Domestic Product
IROP Integrated Regional Operational Programme
ISPA Instrument for Structural Policies for pre-accession MELSP Ministry of the Economy, Labour and Social Policy
OP(s) Operational Programme
PE Population Equivalent
PLN Polish currency - Zloty
PPP Polluter Pays Principle
SOP-ICE Sectoral Operational Programme – Improvement of the Competitiveness of Enterprises
WWD Waste Water Directive


EX POST EVALUATION OF COHESION POLICY PROGRAMMES 2000-2006 CO-FINANCED BY THE EUROPEAN FUND FOR REGIONAL DEVELOPMENT (OBJECTIVES 1 AND 2) - WORK PACKAGE 5B: ENVIRONMENT AND CLIMATE CHANGE ADE
Regional Case study – Podkarpackie – October 2009 Summary
Summary – Key messages from the Podkarpackie case study
The role given to regions was relatively new in 2004 and most of the ERDF interventions have been managed by the Central Government. This was not the case of environmental measures which were part of the Integrated Regional OP. 25% of the regional funds have been allocated in the environmental fields. The decision to give to regions the responsibility of implementing environmental measures was not obvious and was part of a policy debate on the search for an appropriate balance between support for leading areas and the development of regions lagging behind. The main objectives of the environmental measures were, on the one hand, to improve standards of living and investment opportunities in leading centres of growth and on the other hand, to support more remote rural areas as well as areas undergoing restructuring. The question of how to allocate the funds in the most effective manner was raised at national level (balance between territories) as well as at regional level (balance between rural/urban centres). The planning process was a mix of top down (the design of the IROP strategy and the decisions related to resource allocations between regions and priorities/measures were in the hands of the central authorities) and bottom up approaches (regions had some scope for flexibility to orientate funds towards their own specificities). In the environmental sectors, the sectoral plans were very detailed and well articulated and were generally followed. The selection process was strong and projects funded were those with the highest ranking according to the agreed criteria, one of them being to be in line with the plans. Authorities had a real concern in making efficient use of the budget. The main weakness of this process has been the inability to prioritize the projects according to a territorial development strategy. The need to comply with EU directives in the field of water and waste has been a clear incentive to allocate resources for modernising and extending the environmental infrastructures. It has also been one of the factors supporting the sectoral approach instead of a territorial strategy. EU funds have played an important role in the Podkarpackie region for developing environmental infrastructures. According to our own estimates, the CF and the ERDF have together contributed to nearly 50% of the investment expenditures. Even if national resources devoted to the environment, mainly through the National Fund for environmental protection and water management are substantial, the ERDF and the CF have accelerated the modernisation and extension of environmental services. The ERDF has mainly contributed to improve the environmental situation in the water and wastewater sectors:
- Nearly 75% of the ERDF funds devoted to environmental infrastructures have been used for extending sewerage networks and improving wastewater collection and treatment mainly in rural areas. As a consequence, the proportion of the population connected to the public sewerage system in rural areas has significantly increased. Nevertheless, the effectiveness and the efficiency of these measures have not been maximised: firstly, unexpected problems of final connection have reduced the utilisation rate and secondly, even if all investments were useful and addressed some needs, they were often overly ambitious. The main reasons for this were weak local planning capacities (one of the problems being forecasting the movement of the population in the future) as well as a misunderstanding of the requirements of the EU directive especially in small areas where

EX POST EVALUATION OF COHESION POLICY PROGRAMMES 2000-2006 CO-FINANCED BY THE EUROPEAN FUND FOR REGIONAL DEVELOPMENT (OBJECTIVES 1 AND 2) - WORK PACKAGE 5B: ENVIRONMENT AND CLIMATE CHANGE ADE
Regional Case study – Podkarpackie – October 2009 Summary
“adequate treatment“ is required. - The waste sector received little attention. One of the reasons is that the legal framework in
the sector was still unclear, especially regarding the role of the private sector. Furthermore, it was not considered to be a real issue at the beginning of the period but is now becoming one as adequate treatment is not ensured and changes in the way of living will increase the pressure on the waste system.
- Other identified priorities in the regional plan such as flood protection and land protection have not been tackled by the ERDF either because other resources have been made available (such as for flood protection) or because in a context of limited resources, the issue was cast aside.
The contribution of environmental measures to regional development is less visible and must be mainly analysed as part of a ”package” : the high GDP growth observed in the region during the 2004-2007 period has been partly explained by the level of all EU support allocated to the region which has created a “momentum” for increasing production capacities and sustaining growth factors. The main impact is visible in urban centres and more specifically around Rzeszow where FDI is increasing. Living conditions in rural areas have improved partly thanks to environmental measures but migration remains high as employment opportunities are still limited. The disparities within the region as well as within the country have continued to increase. The main problem regarding the contribution of the environment to territorial development is the lack of spatial planning capacities at local levels. This has lead to difficulties in making a proper assessment of the needs of infrastructures in the medium term, a dispersion of the available resources and a lack of coordination with other interventions such as those linked to rural development and support to enterprises and human capital development. Under the IROP, resources have also been allocated for maintenance of historical and cultural heritage with the aim to develop the tourism sector. This sector remains largely under-developed. A lot still has to be done to support facilities and services in the countryside. Finally, the SOP-ICE has provided financial incentives for companies to support the investments needed to comply with environmental protection standards. The measure was not really as successful at the country level as in Podkarpackie. No effect can be seen on the environmental sector or on the innovative capacities of companies. It can be expected that for the 25 benefiting companies, these investments have improved their competitiveness

EX POST EVALUATION OF COHESION POLICY PROGRAMMES 2000-2006 CO-FINANCED BY THE EUROPEAN FUND FOR REGIONAL DEVELOPMENT (OBJECTIVES 1 AND 2) - WORK PACKAGE 5B: ENVIRONMENT AND CLIMATE CHANGE ADE
Regional Case study – Podkarpackie – October 2009 Page 1
Introduction
The regional case study undertaken in Poland has targeted the Podkarpackie region. The main reasons for choosing this region were, on the one hand, the very low level of GDP per capita (one of the lowest in Poland) and the extremely large share of the agricultural sector in the economy (representing more than 30% of employment) and on the other hand, the importance of the ERDF, which is devoted to environmental fields and environmental infrastructures. As the Operational Programmes (OPs) were during this first period of the ERDF intervention designed and partly managed at central levels, the case study also aimed to analyse the interaction between central and regional levels. Interviews and meetings have been organised in both Warsaw and Podkarpackie. When required, the analysis turns on both Poland as a whole and the Podkarpackie region.


EX POST EVALUATION OF COHESION POLICY PROGRAMMES 2000-2006 CO-FINANCED BY THE EUROPEAN FUND FOR REGIONAL DEVELOPMENT (OBJECTIVES 1 AND 2) - WORK PACKAGE 5B: ENVIRONMENT AND CLIMATE CHANGE ADE
Regional Case study – Podkarpackie – October 2009 Page 3
1. Main issues for the ERDF programmes in the 2004-2006 period
The 2004-2006 OPs have been the first ERDF programmes following the accession of Poland to the EU in May 2004. In that context, three main issues had a major influence on the role and the implementation of the ERDF programmes : Firstly, the new institutional framework giving more autonomy to regions for driving
their own development ; Secondly, the on-going transition process from a state economy with a large rural
sector towards a private, more industrialised economy. Thirdly, the environmental challenges following the obligations to comply with EU
directives requirements in the field of air, waste and water.
1.1 Institutional framework: dynamic and on-going decentralisation process
The role given to regional policy is relatively new in Poland. The Polish regions (voivodships) were reorganised in 19991. The accession to the EU in 2004 provided the framework for enhancing the role of the regions that have been charged with implementing regional development strategies, partly using EU funds. Nevertheless, during the 2004-2006 programming period, the central government remained in charge of designing the development strategy and of programming the use of funds. The role of regions was rather limited and mainly concentrated on implementing some of the measures. The EU funded seven operational programmes for implementing the 2004-2006 National Development Plan/Community Support Framework. Two of them have addressed specifically environmental issues: the IROP (Integrated Regional Operational Programme). Within this program,
regions have received a financial envelope by measure and have been charged with its implementation. IROP was prepared by the Ministry of the Economy, Labour and Social Policy (MELSP) in close cooperation with regional self-government in all voivodships. Proposed goals, priorities and measures cover the whole of Poland. Targets, beneficiary categories and criteria were issued at national level. Decisions regarding allocation of funds for particular measures in voivodeships as well as indicators were made top down. Some slight differentiation was allowed between regions and locations in their implementation, depending on the socio-economic structure and situation in the voivodships and the development strategy being implemented.
1 The current administrative division of Poland was introduced pursuant to a series of acts passed by the Polish
Parliament in 1998, and came into effect on 1 January 1999. Previously (in the period from 1975 to 1998) there had been 49 smaller voivodships and no Powiats.

EX POST EVALUATION OF COHESION POLICY PROGRAMMES 2000-2006 CO-FINANCED BY THE EUROPEAN FUND FOR REGIONAL DEVELOPMENT (OBJECTIVES 1 AND 2) - WORK PACKAGE 5B: ENVIRONMENT AND CLIMATE CHANGE ADE
Regional Case study – Podkarpackie – October 2009 Page 4
At the implementation stage, IROP was managed nationally by the Ministry to ensure coordination and uniform application of agreed rules. Simultaneously, most tasks for implementation was vested with regional entities, i.e. regional self-government - Marshal Offices for project identification, and regional state administration - Voivodship Offices for audit, monitoring, payment verification and certification. The SOP-ICE (Sectoral Operational Programme – Improvement of the
Competitiveness of Enterprises). It covered priorities and measures in the area of entrepreneurship and innovation, with special emphasis on the small and medium-sized enterprises sector (SMEs). The environmental measures included in the second have been implemented at the central level by the National Fund for Environmental Protection and Water Management.
The decentralisation process is still on-going and the regional anchoring of the 2007-2013 operational programmes has been enhanced. The previous situation was an interim solution, upon sufficient experience and administrative efficiency being developed by all the entities in implementing measures co-financed by structural funds in Poland’s initial period of EU membership. From 2007 onwards, responsibility for preparing and implementing regional development programmes was delegated to the voivodship self-government level within a framework established by the Ministry of Regional Development. Some centralisation has, nevertheless, been maintained, especially in the field of infrastructure and the environment. The Infrastructure and Environment Programme is for instance designed and managed at the national level.
1.2 Economic challenges: fast transition with increasing territorial disparities
The Polish economy grew by an average annual rate of 4% from 1995 up to the accession into the EU in 2004. The growth rate accelerated in 2006 and 2007 and was one of the highest among European countries. A recent OECD study2 concluded that “Poland stands out as a relatively successful example of a transition from a partially state-directed economy to a primarily privately owned market economy”. However, the growth of GDP per capita is not distributed evenly throughout the country. Three main types of geographical disparities should be mentioned: the gap between Eastern and Western Poland; the gap between Warsaw and the rest of the country; and rising disparities between large urban areas and rural ones: GDP per capita has more
than doubled in urban areas.
2 OECD Territorial Reviews, Poland, 2008

EX POST EVALUATION OF COHESION POLICY PROGRAMMES 2000-2006 CO-FINANCED BY THE EUROPEAN FUND FOR REGIONAL DEVELOPMENT (OBJECTIVES 1 AND 2) - WORK PACKAGE 5B: ENVIRONMENT AND CLIMATE CHANGE ADE
Regional Case study – Podkarpackie – October 2009 Page 5
One of the main issues for policy makers is how to achieve an appropriate balance between support for centres of growth and the development of regions lagging behind (such as eastern regions which are among the poorest in the EU). The main strategic challenges are as follows: To strengthen agglomeration economies around “large urban centres” in order to
enhance productivity growth and the transfer of knowledge. For rural areas lagging behind, to enhance their links to urban areas and to diversify
their economies to non-agricultural activities. It requires a significant increase in productivity of the agricultural sector, especially in the eastern region where it is fragmented into small farms. Mobility out of the agricultural sector and migration from rural areas to urban centres, even to medium sized urban centres, is unavoidable and necessary to support the transition/growth process.
Infrastructure is considered to be one of the main drivers of growth but the decisions relating to what types and where to focus the investment was, and still is, one of the key issues for decision makers in Poland.
In that context, the Podkarpackie region, being one of the poorest regions in the Eastern part, is confronted with specific challenges of rural and remote zones that also influence the whole transition and development process in Poland:
In 2004, the agricultural sector represented 30% of total employment. Productivity in
the sector was very low (43.4% of the national level as estimated in 20003) due to highly fragmented agriculture (the average size of agricultural holdings is 3.5 hectares only 50% of Poland’s average).
It had one of the highest rates of long term unemployment while the phenomena of hidden unemployment is significant.
The regional economy suffered from a low competitiveness due to a relatively low share of highly processed products, low innovation levels and limited access to advanced technologies.
The case study has enabled better assessment of the situation of such zones and the policies that have been implemented to tackle their specificities.
1.3 Main environmental issues: compliance with EU legislation
The main issues in the environmental sector were at the time of accession linked to the application of the EU directives and the compliance with requirements in the field of water, waste and pollutant emissions. The amount of investment required in environmental infrastructures was considerable with an estimated €22 billion to €50 billion (1.2% – 2.7% of GDP)4 per year over 10 years. Air: the emission of air pollutants has been significantly reduced since the beginning of the nineties. The level of GHG emissions has decreased by more than 30% from 1998 to 2003. But there was in 2004 still room for further progress. Emission intensities of major air pollutants per unit of GDP are amongst the highest in the OECD due to the use of subsidised coal and a doubling of vehicular traffic over the past decade. 161 zones were identified as not meeting the EU standards on air quality. Only three sites exceeded the authorised level of pollution emission in the Podkarpackie region (Rzeszow, Przemysl, 3 Source : Operationnal Programme IROP 2004-2006 – annex 1. October 2007
4 Source : OECD Environmental Review of Poland, 2003

EX POST EVALUATION OF COHESION POLICY PROGRAMMES 2000-2006 CO-FINANCED BY THE EUROPEAN FUND FOR REGIONAL DEVELOPMENT (OBJECTIVES 1 AND 2) - WORK PACKAGE 5B: ENVIRONMENT AND CLIMATE CHANGE ADE
Regional Case study – Podkarpackie – October 2009 Page 6
Jaslo). Problems there are considered as local and mainly due to road traffic, some industries and heating systems. Provision of water supply: the situation was considered as satisfactory in 2003, the connection rate of the population to the public water supply being slightly above 85%. Changes in terms of provision of water supply occurred mainly in the 1990s thanks to massive investment efforts undertaken by municipal services. Nevertheless, some rural areas were still lacking adequate supply with a connection rate of just 70%. This was the case in the Podkarpackie region where the percentage of the population connected to the water supply system in rural areas reached 61.4% in 2003.
Waste water treatment: the connection rate to the sewerage system was still low in 2003 in Poland, with only 58% of the population receiving total wastewater treatment. Moreover, infrastructures were often not in compliance with EU requirements. In that field, the major issue was to provide adequate treatment facilities for agglomerations with a population equivalent5 of over 2000 as well as plants with enhanced treatment for agglomerations with a population equivalent of over 15000. In the Podkarpackie region, the situation showed a very low connection rate in rural areas (22.9%) while in urban areas (40% of the population) the percentage of population connected to the public sewerage system in 2003 reached 82.1%.
Water pollution: Poland still faced a problem of surface water quality mainly due to communal and industrial sewage, non-treated or insufficiently treated sewage and area run-offs in rural areas. Even if the quantity of communal and industrial sewage removed from surface waters had decreased in the past decade, the issue remained important as Poland has very poor natural water resources, both surface and underground. The Podkarpackie region is considered as being better off even if some progress had to be made in improving surface water quality.
Flood control is a top priority in the country as well as in Podkarpackie. The region has been hit by several significant floods in the last fifteen years (July 1997, April 1998, 2001, July 2008, June 2009).
Waste: The main issue is related to the management system of municipal waste as more than 95% of waste was still sent to landfill sites of which a majority did not meet technical standards. A number of illegal waste dump sites were in operation and the recovery rate was very low. In Podkarpackie, the volume of waste produced was small and significantly under the EU average, but 90% of collected waste was landfilled and the percentage of landfills fulfilling the regulations was low (according to some people met during the visits, the percentage could have been 5% to 10%). Only 4% was selected waste. The main problems were the costs of treatment that municipalities had to cover and the lack of infrastructures for segregated waste.
Nature and biodiversity: natural areas in Poland are among the most preserved in the EU. They require to be protected and safeguarded in a context of rapid economic growth. The Podkarpackie region is one of the wildest regions of Poland (see map below6). According to 2007 figures, build up area represent 4% of Podkaprackie region, 54% are rural areas and 37% are forests. About 45% is covered by various types of environmental protected areas.7 Land protection is thus a priority of the regional development plan.
5 As defined by the waste water directive
6 Map legends are to be translated as follows : pow / surface; drogi krajowe / national roads; drogi wojewódzkie / voivodeships roads; rzeki / rivers ; parki narodowe / national parks; parki krajobrazowe / landscape parks; obszary chronionego krajobrazu / areas of protected landscape; rezerwaty przyrody / narual reserves; otuliny / lagging's (of parks etc) zbiorniki wodne / water reservoir; zabudowa / buildings; lasy / forests; granice powiatow / poviats boundary
7 For the year 2008/2009 planned Network for Natura 2000 in podkarpackie consisted of:

EX POST EVALUATION OF COHESION POLICY PROGRAMMES 2000-2006 CO-FINANCED BY THE EUROPEAN FUND FOR REGIONAL DEVELOPMENT (OBJECTIVES 1 AND 2) - WORK PACKAGE 5B: ENVIRONMENT AND CLIMATE CHANGE ADE
Regional Case study – Podkarpackie – October 2009 Page 7
Figure 1: Map of the Podkarpackie region natural reserves
- 8 Special Protection Areas – SPA Natura 2000 (accepted by EC) with total area of 507 773 ha (28,5 % of podkarpackie area.). - 17 Special Areas of Conservation - SAC Natura 2000 (accepted by EC) with total area of 269 639, 30 ha na terenie województwa podkarpackiego (15,1 % of podkarpackie area). Moreover: - 28 potential Special Areas of Conservation Natura 2000 issued by NGO’s - Shadow List 2008) total area 136 635,5 ha in podkarpackie. - 26 Special Areas of Conservation Natura 2000 issued by Regional Special Panel przez (Wojewódzki Zespół Specjalistyczny) Total area of 30 000 ha in podkarpackie.


EX POST EVALUATION OF COHESION POLICY PROGRAMMES 2000-2006 CO-FINANCED BY THE EUROPEAN FUND FOR REGIONAL DEVELOPMENT (OBJECTIVES 1 AND 2) - WORK PACKAGE 5B: ENVIRONMENT AND CLIMATE CHANGE ADE
Regional Case study – Podkarpackie – October 2009 Page 9
2. Strategies at national and regional levels and the role of the ERDF
2.1 Environment as a key priority of the National Development Plan
The National Development Plan 2004-2006 provided a comprehensive view of how external funds had to be used together with national resources to accelerate the transition process in Poland. Environmental protection was one of the priorities as it is considered to be an important factor in the improvement of competitiveness of the Polish living space and investing capital. Moreover, the relatively low-transformed natural environment compared to other EU countries provided an opportunity to develop ecological agriculture and tourism. The need to reach the EU ecological standards was also an opportunity to modernise enterprises, implementing new technologies and improving the quality of products. These priorities have been translated into action plan as illustrated by the diagram on next page: Investments by the private sector for reaching the EU ecological standards have been
supported through axis 1 mainly by Poland's own resources and by the ERDF enterprise competitiveness programme SOP-ICE.
Structuring investments required in urban centres which have been identified as the main focus of interest for accelerating the growth process, are covered primarily by national resources and the Cohesion Fund (CF). Action plans were elaborated for the main fields of intervention and provided a detailed view of the investments that had to be carried out. This axis mainly concerned cities of more than 100,000 inhabitants and projects above €10 million as required by the CF regulation.
The modernisation or extension of infrastructures needed to comply with the EU directive requirements in the rest of the country was devoted to sub-institutional levels and was funded through the ERDF together with national resources. Funds have been allocated to each region through the IROP programme.
The demarcation line between the CF and the ERDF is the size of the projects and the amount of the investment. The CF funded projects above €10 million whilst the ERDF was dedicated to projects under this threshold.

EX POST EVALUATION OF COHESION POLICY PROGRAMMES 2000-2006 CO-FINANCED BY THE EUROPEAN FUND FOR REGIONAL DEVELOPMENT (OBJECTIVES 1 AND 2) - WORK PACKAGE 5B: ENVIRONMENT AND CLIMATE CHANGE ADE
Regional Case study – Podkarpackie – October 2009 Page 10
Chart 1: National Development Plan: Objectives in the environmental fields and sources of funding
Main objectives in the environmental fields
Achievement of EU standards regarding environmental protection
- Modernization and building of sewerage treatment plans/sewerage systems/water supply in towns >100,000 inh.- Building and extension of complex systems to supply water and treat drinking water- Modernisation and extension of anti-flood infrastructure- Solutions within the range of creation of integrated waste management system
- Infrastructure development and modernisation for strengthening of the regions competitiveness with particular consideration of metropolitan areas- Support to areas requiring activity stimulation and threatened with marginalisation
National Development Plan
Axis including environmental
issues
AXIS 1: Support for enterprises
competiveness
AXIS 3: Creation of conditions to
increase investment level, promotion of
balanced development and spatial cohesion
AXIS 5: Strenghtening of
development potential of the
regions and counteraction
against marginalisation of
some areas
National resources
Social and economic programme of the
Governement Enterpreneurship-Development-Work
- Programme for the ODRA river 2006-National waste management plan- Programme for agglomeration equipment with collective sewage systems and sewage treatment plans
National resources for implementation of voivodship contracts
Cohesion Fund
Projects >10 million o€1. Improvement of surface water, drinking water distribution, quality of water2. Rationalisation of waste management and protection of grounds surface water3. Improvement of air quality4. Improvement of flood security
ERDF
SOP-ICE Improvement of competiveness of the enterprises - Priority 1: Enhancement of a knowledge-based economy business environment- Priority 2: Direct support to enterprises – Measure 2.4 Support for investment adapting enterprises to environmental protection standards
IROP- Priority 1Upgrade and modernisation of infrastructure aiming at regions’ competiveness strenghtening – Measure 2: enviromental protection infrastrutcure- Priority 3 Local development – Measure 1: local infrastructure / measure 2: Revitalization of degraded areas
Others- Participation to RFP- Implementation of Phare pre-accession programmes
- Completion of ISPA pre-accession programme
Interreg

EX POST EVALUATION OF COHESION POLICY PROGRAMMES 2000-2006 CO-FINANCED BY THE EUROPEAN FUND FOR REGIONAL DEVELOPMENT (OBJECTIVES 1 AND 2) - WORK PACKAGE 5B: ENVIRONMENT AND CLIMATE CHANGE ADE
Regional Case study – Podkarpackie – October 2009 Page 11
2.2 Funding strategies: the important role of the national fund for environmental protection
In Poland, the funding of environmental protection and water management is based on a multi-level system. The main stakeholders involved are local authorities and to a certain extent regional authorities as the main bodies in charge of the management of water resources and waste policies. At the base of the system is the National Fund for the protection of the environment and water management. The resources of the Fund have been coming from the application of the ‘polluter pays principle’ (PPP) for 20 years now. All revenues from fines and fees paid by polluters8 are allocated to the Fund which provides subsidies and soft loans to municipalities for financing their environmental investments. The local authorities also receive loans from the banking system. They are considered as good clients and have easy access to such financing. Another level is their own resources, coming notably from charges paid by users. Central and provincial budgets complete the picture. In 2004, own resources represented 45.7% of all sources of financing of environmental protection and water management 9 while the contribution of the environmental funds amounted to 22%, that of bank credits to 7.6% and public budgets to 5.6%. In this framework, the share of foreign resources has been limited to 14.3%. Within the foreign resources, the Cohesion Fund was by far the main source of funds in the environmental sector at national level, four times more than the ERDF. The contribution of the ERDF towards environmental investments through the IROP programme can be estimated at just 5.4% of all resources provided by all public bodies for financing environmental investments. The role of the EIB has been quite limited. This can be explained by the strong involvement of the national banking sector. The private sector has also undertaken substantial environmental investments mainly for adapting their standards to environmental regulations. But the presence of the private sector in the environmental sector (water, waste water and waste) is still limited. There is no private company in the water sector. The situation in the waste sector is slightly different, with a more competitive market and several private companies providing services for collecting and treating waste. Compared to the national average, the contribution of foreign resources has been more important (26.5%) in Podkarpackie mainly due to a relatively lower contribution of the environmental funds (see graph below).
8 Environmental fund revenues come from fees for exploitation of the environment and penalties for exceeding
pollution limits. Fees and penalties are collected by provincial authorities and then distributed among the local funds. In 2005, the receipts amounted to €401.3 million for the whole country.
9 Expenditures include both current expenditures and investments related to protection of air, water and climate, waste management, water management and protection of land. According to our own estimates, investments represent around 50% of all expenditures.

EX POST EVALUATION OF COHESION POLICY PROGRAMMES 2000-2006 CO-FINANCED BY THE EUROPEAN FUND FOR REGIONAL DEVELOPMENT (OBJECTIVES 1 AND 2) - WORK PACKAGE 5B: ENVIRONMENT AND CLIMATE CHANGE ADE
Regional Case study – Podkarpackie – October 2009 Page 12
Chart 2: Sources of financing environmental protection and water management 2004-2006 in Podkarpackie region
Source: Regional Institute for Statistics
The whole budget for environmental protection and water management during the 2004-2006 period in Podkarpackie has been estimated at 1.1 billion PLN. Around 50% can be considered as operating costs and current expenditures. EU contribution has been quite substantial in the funding of new investments. 300 million PLN has been allocated through the CF 10 while the amount provided by the IROP programme has been close to 120 million PLN. Other EU funds have also been used to finance some environmental infrastructures: the Interreg programme (€6 million) and the SAPARD programme targeted at rural areas. According to our own estimates, the CF and the ERDF have thus contributed approximately 50% of all investments made in the region.
2.3 ERDF support for the environment channelled through the regions
In the years 2004-06, the main portion of Structural Funds as well as the entire Cohesion Fund were managed under sectoral programmes which cover the entire territory of Poland. On the contrary, the environmental measures were channelled through the regional programme IROP (except the specific measure aiming to provide incentives for private investment). Nevertheless, the design of the programmes remained in the hands of the central authorities. The strategy of the IROP focused to a large extent on the support for transport systems as well as on the support to enterprises and human capital development. Environmental protection has also been one of the pillars of the strategy: 25% of the funds have been allocated to environmental measures, with half being dedicated to environmental infrastructures. One of the characteristics of the IROP as a whole has been not to focus exclusively on infrastructure investments and to find an appropriate balance between infrastructures and intangible assets. 10 Four projects have been implemented under the CF and managed by the National Fund for environmental protection
and water management. It must also be mentioned that four other projects have been funded by the ISPA. Only one has been completed to date.

EX POST EVALUATION OF COHESION POLICY PROGRAMMES 2000-2006 CO-FINANCED BY THE EUROPEAN FUND FOR REGIONAL DEVELOPMENT (OBJECTIVES 1 AND 2) - WORK PACKAGE 5B: ENVIRONMENT AND CLIMATE CHANGE ADE
Regional Case study – Podkarpackie – October 2009 Page 13
In the environmental sector, as shown in chart 1 the strategy set in all regions comprised two main objectives: on the one hand, to improve the quality of the environment for improving standards of living and increasing the investment opportunities (measure 1.2) and on the other hand to support areas threatened with permanent peripheral status and marginalisation (priority 3- measure 3.1 (rural areas) and measure 3.2 (areas under restructuring11)). Actually, these two priorities dealt with the same problems but a different size of projects: projects under €1 million were funded through priority 3 while those between €1 million and €10 million were tied to priority 1. Investments in these fields were not connected to other infrastructures. The process of distribution of IROP funding by region was highly centralised. The distribution has been carried out firstly according to the population (80% of the funding), then 10% has been distributed to regions where the average GDP per capita was below 80% of the national average (Podkarpackie was one of the five benefiting regions) and the remaining 10% was addressed to the poorest Powiats (72 were identified). Criteria taking into account the specific environmental situation of each region were not utilised. Moreover, allocations of funds for each measure/priority were decided at national level. There has been no reallocation between measures within regional programmes. Regions were mainly in charge of implementing each measure within the envelope received.
2.4 The decision-selection process
The criteria for selecting projects were fixed at national level but the formal assessment was in the hand of the regions. The selection process was difficult but a series of weaknesses has been mentioned which didn’t permit the allocation of the funds in a way to maximise the effectiveness and efficiency of the programme. In Podkarpackie, several application rounds have been organised. Projects were mainly submitted by Powiat (association of municipalities) and Gminas (municipalities) which were the main final beneficiaries of the above mentioned measures. Projects were ranked by score according various criteria, the best projects receiving agreements. The ranking was not organised by sector but for all sectors even if the criteria were different from one sector to another. The specific criteria for environmental projects are described in the table below.
11 Areas were identified on the basis of the following criteria: a high level of unemployment, a high share of industrial
employment in total employment, a significant fall in industrial employment in recent years.

EX POST EVALUATION OF COHESION POLICY PROGRAMMES 2000-2006 CO-FINANCED BY THE EUROPEAN FUND FOR REGIONAL DEVELOPMENT (OBJECTIVES 1 AND 2) - WORK PACKAGE 5B: ENVIRONMENT AND CLIMATE CHANGE ADE
Regional Case study – Podkarpackie – October 2009 Page 14
N° Criteria Weight Maximum result
I Impact on realization of accession commitments in the area of environmental law (National Communal Waste Water Treatment Programme; National and Regional Waste Management Programme; Air Protection Programme; Flood Control programmes; Environmental Protection Management)
3 12
II Complementarity with other projects with preference given to projects complemented with other projects underway or planned to start within the lifetime of the OP, whether funded by the IROP, CF or funded by other sources
1 4
III Long term sustainability and institutional feasibility of the project
2 8
IV Demonstration of cost effectiveness of the project 4 16 V Correctness of indicators 1 4 VI Technical feasibility 1 4 VII Comprehensive projects including those implemented jointly
by more than one self-government unit 2 8
TOTAL 56 The most important criteria (IV) is the cost-effectiveness of the project. The project must be cost-effective but projects were not ranked according the level of cost-effectiveness. The second most important criteria (I) is the link with the concerned action plans and the level of priority. The project has to be in line with the development plans for the sector in the region. In the field of wastewater or waste, the points received were higher for projects covering a more significant number of PE (Population Equivalent). Priority was thus given to projects in more populated areas. Complementarity was one of the criteria, but had a very low influence on the selection because of its limited weight in the final score. The selection process has been reported by the final beneficiaries as being hard: strong competition between submitted projects, projects selected being those with the highest ranking. For projects applying under priority 1 (see table 1), the rate of success has been close to 30% while for priority 3, it has been around 25%. Nevertheless, some weaknesses have been highlighted that have made it difficult to reach a final set of projects that could have maximised the effectiveness and efficiency of the programme. The main problems raised were, on the one hand, the possibility to revise easily the plans to introduce some new projects and, on the other hand, the difficulty for upper levels of government to enforce the implementation of strategic decisions. The approach followed was a mix of bottom–up (selection of projects) and top-down decisions (funds allocated to each measure) which made it difficult to establish a list of priorities at regional level. There was no real multi-sector strategy tailored to various territorial needs. Insufficient spatial planning capacity at local levels was also mentioned as having an impact on the quality of the projects funded, one of the problems being forecasting the movement of the population in the near future which is one of the main factors for deciding what types of system must be implemented for waste management or for wastewater treatment.

EX POST EVALUATION OF COHESION POLICY PROGRAMMES 2000-2006 CO-FINANCED BY THE EUROPEAN FUND FOR REGIONAL DEVELOPMENT (OBJECTIVES 1 AND 2) - WORK PACKAGE 5B: ENVIRONMENT AND CLIMATE CHANGE ADE
Regional Case study – Podkarpackie – October 2009 Page 15
This planning and selection process had another effect at the country level: costs per capita among the projects funded showed a very wide range depending mainly on the types of zones (density of population, geographical situation, scattered population etc.), with the highest being in more remote and less populated places such as Podkarpackie. The efficiency of the programme has not been maximised in this regard.


EX POST EVALUATION OF COHESION POLICY PROGRAMMES 2000-2006 CO-FINANCED BY THE EUROPEAN FUND FOR REGIONAL DEVELOPMENT (OBJECTIVES 1 AND 2) - WORK PACKAGE 5B: ENVIRONMENT AND CLIMATE CHANGE ADE
Regional Case study – Podkarpackie – October 2009 Page 17
3. Actions taken
Table 1: Amounts allocated to environmental measures under the IROP programme in Podkaparckie region (Million PLN12)
million PLN
Amount of contracted projects
POLAND Podkarpackie
% Podk. Env. measures
Of which infrastructures
IROP Priority 1: Development and modernisation of the infrastructure to enhance the competitiveness of regions
Measure 1.2: Environmental protection Infrastructure
1138.8 81.7 7.2% 81.7 76.3
Measure 1.4: Development of tourism and culture
857.8 51.2 6.0% 48.5
Priority 3: Local development
Measure 3.1: Rural areas
1394.5 100.4 7.2% 40 33.4
Measure 3.2: Areas under restructuring
433.3 33.9 7.8% 20.8 12.5
Measure 3.3: Degraded urban, post industrial and post- military sites
420.9 31.5 7.5% 29.3
Total IROP 11724.4 775 6.6% 220.3 122.2
SOP-ICE
Priority 2: Direct support to enterprises
Measure 2.4 552 41.7 7.6% 41.7
Source: Ministry of Regional Development; Regional management authorities (Marshall Office)
12 The average exchange rate between the PLN and Euro in 2004-2008 was 3.9496 PLN to 1 Euro

EX POST EVALUATION OF COHESION POLICY PROGRAMMES 2000-2006 CO-FINANCED BY THE EUROPEAN FUND FOR REGIONAL DEVELOPMENT (OBJECTIVES 1 AND 2) - WORK PACKAGE 5B: ENVIRONMENT AND CLIMATE CHANGE ADE
Regional Case study – Podkarpackie – October 2009 Page 18
IROP
Nearly 30% of the IROP financial flows to Podkarpackie went towards the environment. This was in line with the importance given to the environment in the regional strategy. Two main objectives have been fixed in the regional development plan13 : the development of environmental infrastructures in rural areas (mainly water
treatment plants, sewage networks and water supply systems) should allow the elimination of the existing gaps and improve the standard of living in rural areas, avoid mass migration and together with improved transport, increase the region’s attractiveness to investors.
the environment must benefit from the agricultural sector and from the development of tourism which are both considered as strategic fields for the future of the province.
The regional plan has also included two other objectives as regards environmental infrastructures: the improvement of flood control protection through the construction and
modernisation of embankments in urban areas; the development of the post-mining areas of the Tarnobrzeg Sulphur Region along
with reclamation of polluted land. During the 2004-2006 period, EU funding was the main source of funds for environmental projects. Regional authorities consider that they had a pro-active policy going beyond EU directive requirements. The project portfolios funded by the ERDF in the region reflected some of the strategic orientations of the regional development plan but not all have been addressed: As shown by the following pie chart, more than half of the funds devoted to
environmental infrastructures (122 million PLN) were used to extend sewerage networks and improve wastewater collection and treatment. Furthermore, most of the projects classified as environmental infrastructures integrated a wastewater component. Efforts have been primarily concentrated on the development of the sewage system and to a lesser extent on modernising treatment plants. Among the 73 projects related to environmental infrastructures, 45 aimed at extending or modernising the sewerage network and wastewater treatment plants.
The drinking water supply was not as much of a concern as wastewater treatment but it was still part of the objectives of the regional development plan in order to increase the disposal surface water resources and water system training. 18 projects have been funded mainly in rural areas (see map below).
Only 1 project has been carried out for flood prevention: 5.52 km of embankments have been renovated along the Leg River. One of the reasons why the project was implemented there was that the river threatened an important factory site employing more than 1500 people and a huge flood caused significant damage in 2001. It is worth
13 The strategy of development of Podkarpackie Province for the years 2000-2006

EX POST EVALUATION OF COHESION POLICY PROGRAMMES 2000-2006 CO-FINANCED BY THE EUROPEAN FUND FOR REGIONAL DEVELOPMENT (OBJECTIVES 1 AND 2) - WORK PACKAGE 5B: ENVIRONMENT AND CLIMATE CHANGE ADE
Regional Case study – Podkarpackie – October 2009 Page 19
to mentionning that in Podkarpackie region, flood prevention infrastructure was co-financed within SOP Restructuring and Modernisation of the Food Sector and Rural Development funded by the EAGGF.
The waste sector received little attention. Only 5 projects were selected in that field. One of the reasons is that the legal framework in the sector was still unclear, especially regarding the role of the private sector. Price competition has been reported as high, municipalities are looking for the cheapest way to collect and treat produced waste. Another difficulty mentioned is that it often requires the cooperation of several Gminas to set up an efficient system14 and that cooperation is not easy to manage. It was not considered as a real issue at the beginning of the period but is becoming one now as adequate treatment is not ensured and some landfills still do not comply with legal conditions. Another reason which has been mentioned for not intervening in that sector is the complexity of state aid regulation which is applied for private stakeholders.
Chart 3: IROP expenditures in environmental infrastructures by main fields of intervention – 2004-2008 - PLN
Moreover 100 million PLN were used primarily for maintenance of historical and cultural heritage (63.7 million PLN). A small portion of the funds have been devoted to rehabilitation of military and industrial sites (Measure 3.3) which was not a big issue in the region as well as for rehabilitation of urban areas and for the protection, improvement and regeneration of the natural environment.
14 One of the main problems of running a waste plant efficiently is getting a sufficient volume of waste to treat. It raises
the issue of where to localise waste treatment plants and how to fund them. This is true for all sorts of infrastructures including incinerators that require a large amount of waste to be efficient.

EX POST EVALUATION OF COHESION POLICY PROGRAMMES 2000-2006 CO-FINANCED BY THE EUROPEAN FUND FOR REGIONAL DEVELOPMENT (OBJECTIVES 1 AND 2) - WORK PACKAGE 5B: ENVIRONMENT AND CLIMATE CHANGE ADE
Regional Case study – Podkarpackie – October 2009 Page 20
Table 2: Other ERDF interventions in the environmental fields IROP Podkarpackie
Field of Intervention FOI code Amount (PLN)
Upgrading and Rehabilitation of industrial and military sites 351 15,306,347.6
Rehabilitation of urban areas 352 14,072,935.3
Protection, improvement and regeneration of the natural environment 353 5,463,564.2
Maintenance and restoration of the cultural heritage 354 63,392,677.2
Source: Ministry of regional Development
Most of the projects funded are located in rural areas. The region is made up of 159 Gminas. Approximately 60 have benefited from EU funding in the environmental sector, most of them located in rural areas (covered by measures 3.1 and 3.2). Twenty of the 45 projects dealing with wastewater were carried out in rural areas through measure 3.1. This is in line with the regional development plan. The main outputs of the ERDF intervention in the environmental fields are recorded in the table below. Available indicators must be analysed carefully. Targets fixed at the beginning were a bit extravagant. Actually, it was difficult to anticipate the results of the selection process and to fix quantitative targets to be reached. For example, the building or modernisation of 67 power plants which use renewable resources was expected, but nothing has been done in that field. The expected number of financed projects of selective waste collection, waste deposition, recycling and of projects of urban waste was close to 100, but the real number was just five. What the indicators can tell us is, firstly, that for water and sewerage network, targets seem to have been achieved. Secondly, that there has been a real concern to limit the costs of the investments and to modernise existing plants wherever it was possible instead of building new facilities. This has been confirmed by beneficiaries in the fields: budget constraints were strict and projects had to suggest solutions which were not too expensive.

EX POST EVALUATION OF COHESION POLICY PROGRAMMES 2000-2006 CO-FINANCED BY THE EUROPEAN FUND FOR REGIONAL DEVELOPMENT (OBJECTIVES 1 AND 2) - WORK PACKAGE 5B: ENVIRONMENT AND CLIMATE CHANGE ADE
Regional Case study – Podkarpackie – October 2009 Page 21
Table 3: Main output indicators Achieved Target
Measure
1.2 Environmental infrastructure
3.1 Rural areas
3.2 Areas under
restructuring TOTAL 1.2 3.1 3.2 Number of projects with the contract signed 23 39 11 73
Value of the contracts (ERDF) (PLN) 82,190,296.7
32,151,886.1 12,077,654.8
126,419,837.5
Value of payments made from ERDF(PLN) 81,675,185.3
31,285,867.1 12,077,654.8
125,038,707.2
Average value (ERDF) by project (million PLN) 3.6 0.82 1.1 Length of water distribution network (km) 34,1
119,1 60,8
214,0 167 218 NA
Length of the sewerage network (km) 526.79
194.14 181,3
902.2 434 325
Number of sewage treatment plants built 4 2 2 8 24
50 Number of sewage treatment plants modernised 2 2 0 4
Number of water treatment plants built 0 0 1
62 Number of water treatment plants modernised 0 3 1 4
Source: Management authorities; Marshall office.
SOP-ICE:
The SOP-ICE program was managed by the National Fund for environmental protection and management of water. Projects funded were those ranked at the top of the list (with a minimum of 51 points). The projects were ranked according to their cost-effectiveness measured as the ratio between benefits (emissions saved) and the costs. This way of classifying projects has favoured those projects which are not too expensive and which yield high returns instead of big projects such as those of electric power plants. In Podkarpackie, 25 projects have been funded mainly to adapt installations for environmental protection requirements. The demand for supporting other types of investments in the environmental field were limited and the management team reported that it was not easy to spend the money. There have been some reallocations within the national OP from that measure towards the measure supporting innovation (measure 2.2.1).

EX POST EVALUATION OF COHESION POLICY PROGRAMMES 2000-2006 CO-FINANCED BY THE EUROPEAN FUND FOR REGIONAL DEVELOPMENT (OBJECTIVES 1 AND 2) - WORK PACKAGE 5B: ENVIRONMENT AND CLIMATE CHANGE ADE
Regional Case study – Podkarpackie – October 2009 Page 22
Chart 4: Amount spent under SOP-ICE in Podkarpackie 2004-2008
There were no ERDF funds made available specifically for supporting private investments in energy efficiency or in renewable energies.

EX POST EVALUATION OF COHESION POLICY PROGRAMMES 2000-2006 CO-FINANCED BY THE EUROPEAN FUND FOR REGIONAL DEVELOPMENT (OBJECTIVES 1 AND 2) - WORK PACKAGE 5B: ENVIRONMENT AND CLIMATE CHANGE ADE
Regional Case study – Podkarpackie – October 2009 Page 23
4. Analysis of the ERDF contribution
4.1 Relevance of the 2004-2006 ERDF strategy in the environmental sector for enhancing territorial development
Several issues can be raised regarding the relevance of the ERDF strategy in the environmental sector during the 204-2006 programming period: the approach chosen (regional versus national ; bottom-up versus top down) as well as the role played by the EU directives. The integration of environmental infrastructures in the regional programme has been questioned regarding the economic stakes at the country level. Some experts argue that a more centralised approach for developing infrastructures targeting the leading economic centres would have been more appropriate to support the transition period and accelerate the structural adjustment required. The issue of migration from rural areas with less growth potential is clearly at stake. In a very rural region such as Podkarpackie, policies will not easily favour urban centres to the prejudice of more rural areas where most of the population live. The regional strategy has instead favoured rural zones and the improvement of living conditions in such areas, so as to prevent massive migration. The obligation to comply with the EU directive requirements in the water sector has also been an incentive for such a strategy. Local authorities must reach the targets that have been fixed at European level and the gap is extremely important in more remote places. The directive may have played an ambiguous role by providing a framework for new investments in areas that are not considered to be a priority from an economic point of view. Moreover, during the 2004-2006 period, the water directive requirements seem to have not always been adequately understood, resulting in excessively high levels of infrastructure compared to what the local situation requires both now and in the future. As has already been mentioned, the high mobility of people from rural to urban and suburban zones and away from the region raises difficulties in planning the required investments correctly, especially in the zones targeted by the IROP. The bottom-up approach chosen in that field had some advantages, such as increasing the local appropriation and sustainability of the investments made. But it also has some drawbacks: more scattered investments, not integrated in an holistic view of regional development. The weak planning capacities at local level have also limited the relevance of the approach. The issue of prioritisation has received a new answer. For the current programming period, environmental investments have been re-centralised contrary to other fields that have been decentralised. The objective is to concentrate the funds on more strategic areas by applying the Waste Water Directive (WWD) in a tighter manner. The criteria for application are stricter and it makes it more difficult for a region such as Podkarpackie to meet the new conditions.

EX POST EVALUATION OF COHESION POLICY PROGRAMMES 2000-2006 CO-FINANCED BY THE EUROPEAN FUND FOR REGIONAL DEVELOPMENT (OBJECTIVES 1 AND 2) - WORK PACKAGE 5B: ENVIRONMENT AND CLIMATE CHANGE ADE
Regional Case study – Podkarpackie – October 2009 Page 24
4.2 Quality of the planning and Implementation process in meeting regional challenges in the covered fields
Planning is well developed in Poland but mainly oriented to sectoral planning. In the field of water, plans identifying the needed investments have been drawn up at different levels (national, regional and local) and are coherent between each other15. On a whole, it can be assessed that all investments funded by the ERDF in the environmental sector have been useful. According to an expert, having evaluated EU funds to the environment in that region, 16 all investments made were in line with national/regional/local strategies and addressed real needs. But many of them were overambitious. The complementarity between different sources of funds and more specifically between the CF and the ERDF has been satisfactory. Connections were well organised. Nevertheless, as mentioned above, there could have been more focus on some sensitive areas. Some deficiencies appeared when looking at spatial planning: as underlined by a recent OECD study, many local governments do not have proper spatial planning systems. Only 20% of the territory has spatial plans and these plans focus on municipalities’ administrative borders rather than on functional areas. As a result, planning does not play enough of a role in coordinating and giving spatial articulation to policies. In the environmental fields, the lack of spatial planning together with the selection process implemented has been translated into: Difficulties in properly assessing the needs of infrastructures in the medium term; A dispersion of the available resources; A lack of coordination with other interventions such as those linked to rural
development and support to enterprises and human capital development. Many administrative problems have been recorded: 97% of application forms had to be reviewed (mainly due to the assessment of eligible costs). Gminas have met difficulties for planning and managing the projects. The IROP procedures have changed several times and the regional authorities considered the process as being too centralised.
15 A map summarising the investment needs regarding wastewater treatment and collection can be found in annex 2. It
provides a complete picture of what must be done and what types of investments are required.
16 Elżbieta Kozłowska from Scott Wilson

EX POST EVALUATION OF COHESION POLICY PROGRAMMES 2000-2006 CO-FINANCED BY THE EUROPEAN FUND FOR REGIONAL DEVELOPMENT (OBJECTIVES 1 AND 2) - WORK PACKAGE 5B: ENVIRONMENT AND CLIMATE CHANGE ADE
Regional Case study – Podkarpackie – October 2009 Page 25
4.3 Contribution of the ERDF to improving the environmental situation
In recent years, the main field of improvement in the environmental sector has been the collection and treatment of wastewater. As can be seen in the table below, the percentage of the population connected to the public sewerage system has increased by 10% with a spectacular improvement in rural areas where the initial situation was a concern. In the waste sector, the main problems were related to waste treatment modalities. The percentage of selected waste has increased but remains low compared to other regions. Ten landfill sites have been closed , but not all remaining facilities comply with existing regulations.
Table 4: Environmental indicators for Podkarpackie region
Environmental situation 2002 2003 2004 2005 2006 2007
Protected environmental areas (%) 47.5 47.7 44.5 44.5
Forest (% of land) 36.5 36.6 36.8 36.9
% population connected to the water supply system
Urban 90.5 90.7 90.9 91.4 91.5 91.7
Rural 60 61.4 62 62.2 62.7 63
Total (average urban +rural) 72.4 73.2 73.7 74 74.4 74.6
% population connected to the public sewerage system
Urban 81.7 82.1 82.6 83.2 83.6 83.8
Rural 19.3 22.9 25.8 28.1 29.4 30.6
Total (average urban + rural) 44.5 46.9 48.8 50.4 51.3 52.2
Collected solid waste kg / capita 209 200 180.6 165 171.1 167.4
Municipal solid waste from households - kg per capita 129.0 120.1 125.5 119.0
Landfill sites 41 37 34 33 31
% of selected waste 2.7% 3.4% 4.7% 6.2%
Infrastructures
collective water supply systems, service lines to buildings in km 5,794.5 5,887.1 5,992.3 6,065.3 6,212.2
water-line system (km) 10,971.0 11,121.9 11,282.2 11,324.8 11,453.4
water purification plants 229 232 237 240 242
collective sewerage network (km) 5,379.0 6,308.9 6,938.3 7,464.3 7,905.6
collective wastewater treatment plants 198 201 208 211 216Source: regional institute of statistics

EX POST EVALUATION OF COHESION POLICY PROGRAMMES 2000-2006 CO-FINANCED BY THE EUROPEAN FUND FOR REGIONAL DEVELOPMENT (OBJECTIVES 1 AND 2) - WORK PACKAGE 5B: ENVIRONMENT AND CLIMATE CHANGE ADE
Regional Case study – Podkarpackie – October 2009 Page 26
Water supply and wastewater collection and treatment
The role of the ERDF in improving the infrastructures in the water sector has been important: according to regional figures, the extension of the network in water-line systems amounted to 480 km. The output recorded for ERDF projects is 214 km which represent nearly half of the efforts made in the zone (see table 3). The contribution to the extension of the collective sewerage network seems to be of the same proportion: around 1000 km have been built through ERDF projects while the whole network has been extended by 2500 km. According to output indicators collected for each of the measures, the number of people connected to the sewerage sector has increased by 48,230 while nearly 18,000 additional people are now connected to the distribution network of the waterworks.
Table 5: Results and impact indicators of the IROP regional programme (for Podkarpackie)
Unit Baseline Value Baseline Achieved
Measure 1.2 Infrastructure of environmental protection
Results Number of people connected to the sewage system person Na 22456
Measure 3,1 Rural areas
results
Number of people connected to the sewerage network person Na 15870Number of people connected to the distribution network of the waterworks person Na 13739
Investment areas available in consequence of implementation of the projects
Implicit baseline value ha Na 974.3
Measure 3.2 Areas under restructuring
Results
Number of people connected to the sewerage network % 9804
Investment areas available in consequence of implementation of the projects
Implicit baseline value ha Na 961.89
Number of people connected to the distribution network of the waterworks % Na 3942
Source: Management authorities; Marshall Office
Even if these indicators appear very positive, the effectiveness of ERDF projects on the sector has been hampered by some specific unexpected problems. Households were often reluctant to connect to the new infrastructures because of the costs of the connection and the very few legal or financial incentives to join the network. The cost of final connection is particularly high in small agglomerations with a scattered population. Infrastructures are thus far from being used to their full capacities. The overcapacity issue is also due to an incorrect expectation of the population to be covered and the adequate treatment to be applied. As a consequence, many of the new or

EX POST EVALUATION OF COHESION POLICY PROGRAMMES 2000-2006 CO-FINANCED BY THE EUROPEAN FUND FOR REGIONAL DEVELOPMENT (OBJECTIVES 1 AND 2) - WORK PACKAGE 5B: ENVIRONMENT AND CLIMATE CHANGE ADE
Regional Case study – Podkarpackie – October 2009 Page 27
modernised infrastructures seem too “advanced” for the local conditions. This raises the question of the financial viability of such equipment that has to be maintained by local authorities through their own budget. At the moment, the level of fees paid by households for collection and treatment do not cover the entire operating costs. For social reasons, municipalities must keep prices to a certain level. The impact of such investments on water pollution is not easy to assess. This type of pollution has been rather limited until now in the region. But as methods of consumption and standards of living are changing, it could increase in the future and the new infrastructures are thus preventing such evolution.
Other sectors
The impact of the ERDF environmental measures on other sectors has been quite limited even if some of them were considered as a main issue for environmental policy. The contribution of the ERDF to the waste sector has been very limited, the specific problems of the sector being on-going and awaiting more adequate answers from the Government. Flood protection was one of the objectives of the regional development plan. The only project funded through ERDF had a rather limited impact localised in the concerned area. The project was not part of a more integrated programme as it seems to be the case for the new programming period. Actually, this issue has been addressed by other sources of funds such as an important loan granted by the EIB at the end of the 1990’s. The region is conscious that the environment is one of their main assets for regional development (see the percentage of protected areas and the quality of nature). Until now, land protection has not been addressed by a specific policy due both to a lack of funds and to other priorities. According to a recent evaluation study,17 the environmental effect of projects implemented under the SOP-ICE was found to be negligible. These projects intending to adjust existing facilities to the best available technologies have mainly improved the competitiveness of these companies.
17 Evaluation study, "Impact of EU financial interventions in the area of water and wastewater management on the
environmental improvement and on the social and economic development," Agrotec, 2008

EX POST EVALUATION OF COHESION POLICY PROGRAMMES 2000-2006 CO-FINANCED BY THE EUROPEAN FUND FOR REGIONAL DEVELOPMENT (OBJECTIVES 1 AND 2) - WORK PACKAGE 5B: ENVIRONMENT AND CLIMATE CHANGE ADE
Regional Case study – Podkarpackie – October 2009 Page 28
4.4 Contribution of the ERDF to regional economic development
In recent years, GDP growth has been high in the region (more than 12% on a whole from 2001 to 2005), higher than the EU average which gives rise to a slight reduction in the significant gap in terms of GDP per capita between Podkarpackie and the EU 25. On the contrary, growth performances were smaller than for Poland as a whole and the disparities inside the country increased during that period.
Table 6: Socio-economic indicators in Podkarpackie region
2002 2003 2004 2005 2006 2007
GDP/capita (at PPS; EU-25=100) 33.8 34.6 35.3 35.4 35.8
Employment rate (for the age group 15-64) 53.2% 52.1% 51.3% 52.3% 53.7%
GDP annual growth rate 0.9% 4.6% 3.8% 2.8% Economic structure (share of employment): Agriculture 29.8% 29.8% 29.9% 29.6% Industry 26.7% 26.1% 26.2% 25.7% Services 43.5% 44.0% 43.9% 44.7%
Unemployment rate 18.2 17.7 16.6 16.7 13.7 9.6
Investment as a percentage of GDP 18.1% 19.3% 19.1%
R&D as a percentage of GDP 0.4 0.4 0.3 0.3
Population growth -1.15 0.04 -0.37 0.03 0.01 -0.03
Population density (pers/km²) 117.4 117.8 117.6 117.6 Source: Eurostat
The regional authorities explain part of the growth in the level of EU funding that have been channelled to the region during the 2000-2006 period (including the pre-accession funds). It has been one pillar of the regional strategy to apply as much as possible for EU funds. On a whole, the level of EU support reached €215 per capita during the period 2004-2006. 62% of the funds came from the Cohesion fund and the IROP programme. Podkarpackie has nevertheless received a lower amount of EU funding per capita than most of the other Polish regions. The main beneficiaries have been the North West region and the region of Warsaw (75% more than Podkarpackie)18. As indicated above, most of the funds were used to support tangible as well as intangible investments. Environmental measures are part of this wider effort to upgrade public infrastructures and create a “momentum” for increasing production capacities and sustaining growth factors.
18 According to an analysis made by the Podkarpackie regional authorities in 2008, the level of commited amount from
EU funds in Podkarpackie amounted to 928 PLN per capita, the second lowestlevel in Poland, while the region of Warsaw has been allowed 1653 PLN per capita and the North West region 1853 PLN per capita..

EX POST EVALUATION OF COHESION POLICY PROGRAMMES 2000-2006 CO-FINANCED BY THE EUROPEAN FUND FOR REGIONAL DEVELOPMENT (OBJECTIVES 1 AND 2) - WORK PACKAGE 5B: ENVIRONMENT AND CLIMATE CHANGE ADE
Regional Case study – Podkarpackie – October 2009 Page 29
The main impact was firstly a direct “demand” effect, subsequently followed by a supply-side effect mainly due to the fact that most of the work has been performed by local firms (at least in the environmental sectors). An increased structural impact can also be highlighted: in some leading economic centres such as Rzeszow, the attractiveness of the zone for foreign direct investment has improved due to these massive investments. The region has relied on business sectors that were already well developed, mainly the aeronautic sector and its suppliers such as the tyre industry. Companies such as Goodyear or Baumgardner have set up factories and further new FDI is expected. The region has also considered ICT19 and Eco-activities as the other two mainstreams for development. Up to now, the latest remain largely underdeveloped. The more specific effects of the investment made in the environmental sector are difficult to assess. There has been no specific development in the environmental sector. As everywhere, the recycling sector is growing in terms of the number of firms and employment. Nevertheless, it remains limited (just 326 people employed in 2006) and not related to ERDF interventions. There is no evidence of other activities growing in the sector. Measure 1.4 was specifically dedicated to the development of tourism and culture. Part of it was used to maintain and restore cultural heritage. Observed results in terms of tourism activities appear to be still limited: according to regional OPs indicators, the number of tourists seems to have increased by 18% but the new workplaces resulting of tourists projects (+32) as well as the new enterprises in this area (+4) remain very small. Even if the region has a great potential in that area, local policies must be reinforced for offering proper facilities and services especially in the protected areas as well as for promoting regional assets. One side effect that has been mentioned is the increase of inflationary pressure in the sectors directly involved in the building and maintenance of facilities: prices for building work and expertise have increased due to the higher demand from all external funding reflecting an excessively limited absorption capacity of the local economy. Another side effect is the increase in the level of public debt at local/regional levels. It is too early to conclude that the risk of financial problems will materialise and that this will lead to discontinuation of the project and loss of creditworthiness of local government units20. But the viability of the projects will have to be checked in the future.
19 Information and communication technology
20 Cfr Evaluation study by Agrotec mentioned above.

EX POST EVALUATION OF COHESION POLICY PROGRAMMES 2000-2006 CO-FINANCED BY THE EUROPEAN FUND FOR REGIONAL DEVELOPMENT (OBJECTIVES 1 AND 2) - WORK PACKAGE 5B: ENVIRONMENT AND CLIMATE CHANGE ADE
Regional Case study – Podkarpackie – October 2009 Page 30
4.5 Contribution of the ERDF to improving the quality of life
The most visible impact has been on the improvement of living standards and the quality of life. Tap water quality has improved while the increasing capacities for collection and treatment of wastewater contribute to better housing conditions. The price of housing has increased significantly in recent years which is explained by improved infrastructures and is considered as a positive evolution. Investments also directly affected housing development and in rural areas it may have prevented the outflow of young people and provided an incentive to settle down and invest. It is quite difficult to find evidence at this stage of such an evolution as the number of people leaving the region remains high (most of them going to the US or to other EU countries).

EX POST EVALUATION OF COHESION POLICY PROGRAMMES 2000-2006 CO-FINANCED BY THE EUROPEAN FUND FOR REGIONAL DEVELOPMENT (OBJECTIVES 1 AND 2) - WORK PACKAGE 5B: ENVIRONMENT AND CLIMATE CHANGE ADE
Regional Case study – Podkarpackie – October 2009 Page 31
Annex 1: List of people met
Day 1 – 25th May 2009 (Monday) Ministry of Regional Development; Coordination and Implementation of Regional Progammes Department Director Ewa Wnukowska Wspolna Str., Warsaw, tel. 022 536 74 30, 022 536 74 31, fax 022 536 74 91 As the Managing Authority the Department is also responsible for Integrated Regional Operational Programme 2004-2006 and manages its implementation and closure. The National Fund for Environmental Protection and Water Management Konstruktorska Str. 3a, Warsaw Telephones: (022) 459 00 00, 459 00 01 Fax: (022) 459 01 01 Day 2 – 26th May (Tuesday) Podkarpackie Marshall Office L.p. Imię i Nazwisko Funkcja
1. Ryszard Jur Department of implementation of infrastructural Project Director
2. Jacek Nowocień Department of implementation of infrastructural Project Vice director [email protected]
3. Magdalena Chłopek Regional Fund for Environmental Protection and Water Management of Podkarpackie

EX POST EVALUATION OF COHESION POLICY PROGRAMMES 2000-2006 CO-FINANCED BY THE EUROPEAN FUND FOR REGIONAL DEVELOPMENT (OBJECTIVES 1 AND 2) - WORK PACKAGE 5B: ENVIRONMENT AND CLIMATE CHANGE ADE
Regional Case study – Podkarpackie – October 2009 Page 32
VISITING PROJECT:
2.2 Modernisation of Solid Waste Management Institute – stage 1 Overall Project value 6 874 791,76 zł EU contribution: 3 880 250,72 zł Guide over Project held by: Grzegorz Pasternak – director for solid waste transfer
Day 3 – 27th May (Wednesday) 3.1 Podkarpackie Voivodship office in Rzeszow –8:00 a.m. Grunwaldzka 15 st. L.p. Imię i Nazwisko Funkcja
4. Jarosław Reczek Dyrektor Wydziału Zarządzania Funduszami Europejskimi Head of Unit of Managing of European Funds
5. Barbara Zubrzycka Kierownik Oddziału Wspierania Rozwoju Regionalnego i Współpracy Transgranicznej Head of Unit of Regional Development and Cross-border Cooperation
6. Janina Rząca Kierownik Oddziału Kontroli Trwałości ZPORR Head of Unit of Sustainability Control of IROP
7. Jan Staroń Kierownik Oddziału Zamknięcia Pomocy ZPORR Head of Unit of IROP Project Closures
8. Jadwiga Borek Pracownik Oddziału Wspierania Rozwoju Regionalnego i Współpracy Transgranicznej Unit of Regional Development and Cross-border Cooperation; specialist
9. Barbara Czekańska Pracownik Oddziału Kontroli Trwałości ZPORR Unit of Sustainability Control of IROP; specialist
10. Agnieszka Nowińska-Pyrkosz Pracownik Oddziału Zamknięcia Pomocy ZPORR Unit of IROP Project Closures; specialist

EX POST EVALUATION OF COHESION POLICY PROGRAMMES 2000-2006 CO-FINANCED BY THE EUROPEAN FUND FOR REGIONAL DEVELOPMENT (OBJECTIVES 1 AND 2) - WORK PACKAGE 5B: ENVIRONMENT AND CLIMATE CHANGE ADE
Regional Case study – Podkarpackie – October 2009 Page 33
3.2 Rzeszow City Hall – 10:00 a.m. Rynek 1 35-064 Rzeszów
L.p.
Imię i Nazwisko Funkcja
1. Stanisława Bęben Wydział Pozyskiwania Funduszy – director Departament for Fund Application
2. Jacek Jakubek Wydział Pozyskiwania Funduszy Departament for Fund Application
3. Stanisław Homa Wydziału Ochrony Środowiska i Rolnictwa Departament for Environmental Protection and Agricultural issues
3.3 Visiting Project 1:30 p.m. Title: Modernisation of Water Treatment Plant In Wola Mala over river Lancut Overall Project value: 3 634 564,53 zł EU contribution: 2 677 337,86 zł Guide over Project held by: Pacholicki Andrzej 4 Day 4 – 28th May (Thursday)
4.1 Visiting project: - 9 a.m. Project Title: Building of Wastewater Treatment plant In Hyzne, sewerage network In Brzezowska i Hyzne Overall Project value: 9 325 163,11zł EU contribution: 4 081 042,77 zł Guide over Project held by: Mayor of Hyzne Gmina - Bogusław Stanisław Kotarba Director of Wastewater Treatment Plant- Daniel Paściak 4.2 Visiting project 11 a.m. Project Title: Recultivation of solid waste landfill In Kolbuszowa Overall Project value: 2 101 193,52 zł EU contribution: 990 846,76 zł
Guide over Project held by:
Kazimierz Kret – head of departament – Environmental Protection and agricultural issues
Dyr. Andrzej Andryś – director of Municipal Services Industry

EX POST EVALUATION OF COHESION POLICY PROGRAMMES 2000-2006 CO-FINANCED BY THE EUROPEAN FUND FOR REGIONAL DEVELOPMENT (OBJECTIVES 1 AND 2) - WORK PACKAGE 5B: ENVIRONMENT AND CLIMATE CHANGE ADE
Regional Case study – Podkarpackie – October 2009 Page 34
4.3 Agency for Regional Development In Mielec 2 p.m.
- director Zdzisław Klonowski
- Grazyna Gajek – coordinator for numerous projects regarding ZPORR
4.4 Project title: Łeg I - modernisation – anti filtration protection Works on right embankment of river Leg at length of 5,52 km
Overall Project value: 7 777 868,26 zł EU contribution: 5 463 564,20 zł Guide over Project held by:
Bogdan Paśko 5 Day 5 – 29th May (Friday)
5.1 Tomasz Podgajniak – PROEKO CDM (external expert) Tamka Str., Warsaw PROEKO CDM is an independent consultancy company working in the field of environmental protection and the methodology used in the estimation of environmental and economic impact of the investment in infrastructure in the area of water and wastewater (environmental surveys, environmental impact assessment, feasibility studies). It also prepare investment and environmental protection procedures. 5.2 Ministry of Regional Development; Managing Department for Competitiveness and Innovation Programmes Director Agnieszka Jankowska Wspolna Str., Warsaw, tel. 022 501 53 07, 22 501 53 06, fax: 022 501 53 67 The Department is responsible for effective and efficient management, control and monitoring of the Sectoral Operational Programme Improvement of the Competitiveness of Enterprises for 2004-2006 and for preparing programming documents related to supporting enterprise development and supporting the use of EU structural funds under the National Cohesion Strategy. 5.3 Elżbieta Kozłowska (external expert) Dzika Str., Warsaw Independent consultant with experience in the process of preparing, organizing and supervising various projects on the environment protection. She was involved in a on-going evaluation of IROP environmental projects in Podkarpackie Voivodship in 2008 (analysis of the environmental needs of the Region's, analysis of the cohesion of environmental projects).

EX POST EVALUATION OF COHESION POLICY PROGRAMMES 2000-2006 CO-FINANCED BY THE EUROPEAN FUND FOR REGIONAL DEVELOPMENT (OBJECTIVES 1 AND 2) - WORK PACKAGE 5B: ENVIRONMENT AND CLIMATE CHANGE ADE
Regional Case study – Podkarpackie – October 2009 Page 35
Annex 2: National Programme for Municipal Waste Water Treatment
Map of Poland with projects of National Programme for Municipal Waste Water Treatment A - existing wastewater treatment plants (that are in comply with EU directives) (green circle) - with high level of nitrogen and phosphorus reduction (green triangle) - biological B - existing wastewater treatment plants (that need to be modernised/expanded/ or build - to be in comply with EU directives) (green circle) - with high level of nitrogen and phosphorus reduction (green triangle) - biological


ADE s.a. Rue de Clairvaux, 40
B-1348 Louvain-la-Neuve Belgium
Tel.: +32 10 45 45 10 Fax: +32 10 45 40 99 E-mail: [email protected]
Web: www.ade.be
Ex post evaluation of cohesion policy programmes 2000-2006 co-financed by the European Fund for Regional Development (Objectives 1 and 2) – Work package 5b: Environment and Climate Change
RReeggiioonnaall ccaassee ssttuuddyy NNoorrttee RReeggiioonn
October 2009


TThhiiss rreeppoorrtt hhaass bbeeeenn pprreeppaarreedd bbyy AADDEE aatt tthhee rreeqquueesstt ooff tthhee EEuurrooppeeaann CCoommmmiissssiioonn..
TThhee vviieewwss eexxpprreesssseedd aarree tthhoossee ooff tthhee CCoonnssuullttaanntt aanndd ddoo nnoott rreepprreesseenntt tthhee ooffffiicciiaall vviieewwss ooff tthhee EEuurrooppeeaann CCoommmmiissssiioonn..
RReepprroodduuccttiioonn oorr ttrraannssllaattiioonn iiss ppeerrmmiitttteedd,, pprroovviiddeedd tthhaatt tthhee ssoouurrccee iiss dduullyy aacckknnoowwlleeddggeedd aanndd nnoo mmooddiiffiiccaattiioonnss ttoo tthhee tteexxtt aarree mmaaddee..


EX POST EVALUATION OF COHESION POLICY PROGRAMMES 2000-2006 CO-FINANCED BY THE EUROPEAN FUND FOR REGIONAL DEVELOPMENT (OBJECTIVES 1 AND 2) - WORK PACKAGE 5B: ENVIRONMENT AND CLIMATE CHANGE ADE
Regional Case study – Norte Region – October 2009 Table of Contents
Table of Contents SUMMARY
1. STATUS AND FEATURES OF THE REGION ............................................................. 9
1.1 ECONOMIC AND ENVIRONMENTAL FEATURES AT THE BEGINNING OF THE PERIOD .................................................................................................................. 9
1.2 THE INSTITUTIONAL SET UP .......................................................................................... 11
2. REGIONAL POLICIES AND THE ROLE OF THE ERDF .......................................... 13
2.1 ENVIRONMENTAL PRIORITIES ....................................................................................... 13 2.2 NORTE REGIONAL DEVELOPMENT STRATEGY ............................................................ 14 2.3 ENVIRONMENT ACTIONS TAKEN .................................................................................. 16
3. ANALYSIS OF THE ERDF CONTRIBUTION .......................................................... 19
3.1 ERDF CONTRIBUTION TO ENVIRONMENTAL POLICIES ............................................ 19 3.2 MAIN RESULTS ACHIEVED IN TERMS OF THE ENVIRONMENTAL SITUATION .......... 22 3.3 CONTRIBUTION TO REGIONAL TERRITORIAL DEVELOPMENT .................................. 25
LIST OF FIGURES
FIGURE 1: NORTE PROGRAMME – PRIORITIES AND ENVIRONMENTAL MEASURES ............ 14 FIGURE 2: ENVIRONMENTAL IMPACT OF THE RENEWABLE ENERGY PROJECTS
BY REGION ................................................................................................................... 22 LIST OF TABLES
TABLE 1: ESTIMATES OF ENVIRONMENTAL EXPENDITURES IN NORTE REGION DURING THE 2000-2006 PERIOD .............................................................................. 16
TABLE 2: ENVIRONMENTAL MEASURES – APPROVED EXPENDITURES 2000-2008 ............ 20 TABLE 3: SYNTHESIS OF MAIN OUTPUT INDICATORS. ............................................................ 21 TABLE 4: ENVIRONMENTAL SITUATION OF THE NORTE REGION ...................................... 22 TABLE 5: ECONOMIC PERFORMANCES OF THE NORTE REGION ......................................... 25 TABLE 6: ACTIVITIES LINKED TO ENVIRONMENT .................................................................. 28 TABLE 7: TOURISM ACTIVITY IN THE NORTE REGION .......................................................... 30 LIST OF GRAPHS
GRAPH 1: ENVIRONMENTAL SITUATION AT NATIONAL/REGIONAL LEVEL (2005) ............ 24


EX POST EVALUATION OF COHESION POLICY PROGRAMMES 2000-2006 CO-FINANCED BY THE EUROPEAN FUND FOR REGIONAL DEVELOPMENT (OBJECTIVES 1 AND 2) - WORK PACKAGE 5B: ENVIRONMENT AND CLIMATE CHANGE ADE
Regional Case study – Norte Region – October 2009 Summary
Summary – Key messages of the regional case study in Norte Region Norte Region is an objective 1 region facing both a backwardness in terms of infrastructure, especially in waste water collection and treatment, and a deep economic crisis due to a rapid loss of competitiveness. The region has also suffered from a territorial cohesion problem, the population and economic activity being mainly concentrated in the urban coastal zone. The ERDF has provided nearly 20% of the financial resources for setting up waste water infrastructures, which was one of the main objectives of environmental/regional policies. On the whole, the contribution through the regional OP and various sectoral OPs (mainly the Environmental OP) has provided more than 20% of the environmental expenditure made during the 2000-2006 period in the Norte region. The ERDF contribution has ensured a high level of environmental investment despite the obligation imposed on the Portuguese Government to reduce macroeconomic imbalances and to limit its expenditure. Despite the huge improvement during the period, these investments were nevertheless insufficient to reach the objectives fixed by the EU Water Directive and to reduce significantly the regional asymmetries within the country. The ERDF OP was designed complementarily to the CF investment within a logic of integrated systems, with the CF financing upstream networks, while ERDF finances downstream components. No problem of coordination has been reported even if the management and organisation of the downstream part raises some concern. The regional ERDF OP has been considered as a main tool for supporting local authorities and providing them with the necessary resources for implementing their policies. A large part of those resources managed by municipalities or at a inter-municipal level were devoted to urban rehabilitation and territorial qualification. The effects of such projects are difficult to assess, and are mainly used for improving the quality of living conditions and the image of the zone. The contribution of ERDF funds to regional development appears to be limited and concentrated on some specific sectors. They didn’t permit, at least in the short term, the addressing of the main regional weaknesses hampering economic growth. The main reasons are:
- The institutional organisation of the State, highly centralised at the beginning of the period, that explains why sectoral approaches rather than regional integrated strategies have been applied to manage the allocation of ERDF funds.
- The lack of a coherent and comprehensive regional strategy into which the environmental infrastructures ERDF programme are integrated. The main difficulties have been, on one hand, to articulate the regional strategy with the program design and on the other hand, to coordinate different levels of decision making.
- A limited involvement of the private sector at all levels: within the environmental sector and in the other sectors that could have benefited from urban rehabilitation (at least to identify their expectations or needs).
The improvement of living conditions may have contributed to the good performance seen in the tourism sector since 2002.


EX POST EVALUATION OF COHESION POLICY PROGRAMMES 2000-2006 CO-FINANCED BY THE EUROPEAN FUND FOR REGIONAL DEVELOPMENT (OBJECTIVES 1 AND 2) - WORK PACKAGE 5B: ENVIRONMENT AND CLIMATE CHANGE ADE
Regional Case study – Norte Region – October 2009 Page 9
1. Status and features of the region
1.1 Economic and environmental features at the beginning of the period
The regional economy
The main characteristics of the Norte Region economy at the beginning of the period were: A relatively low GDP per capita compared to the EU average (60.6% in 2000) and to
the national level of 74.5% which could be partly explained by a significantly higher population density than in the rest of the country, with 170.6 inhabitants per km² (111 for Portugal as a whole).
A heavy weight of industries accounting for 44% of employment in 2000 among which the textile and footwear sectors were important. Norte industry was traditionally exporting a significant part of its production, representing about 40% of Portuguese exports. But this economic activity produced relatively low added value products with low productivity and employed a large number of low skilled workers.
A concentration of economic activity in the urban areas where two-thirds of the population live, and in coastal areas. In that context, urban issues became more and more important with particularly critical intra-migration trends from rural to urban areas and from inland to coastal regions. Territorial cohesion also suffered from the insufficient development of non-metropolitan urban systems and of their relationship with surrounding rural areas.
Growing competition with external markets had put industry in the Norte Region under high pressure. At the beginning of the 2000s, the region suffered from a loss of competitiveness. The first main challenge for the Norte economy was to restore industry competitiveness by enhancing innovation and worker qualifications. The second main challenge was to diversify and regenerate the rural economy.
The environmental situation
At the beginning of the 2000s, the Norte Region had the poorest environmental services in Portugal. The region remained far below the target levels set by the European Directive1 in terms both of collection and of treatment, in particular for urban waste water. Indeed in 2001 only 55% of the population of the region was served by public sewerage systems, compared with 71% at national level, and the proportion of the population served by wastewater treatment plants was only 42% (55% for Portugal). Collection and treatment of wastewater was particularly critical in Norte Region because of its heterogeneity: high density of population in urban and coastal areas on one hand, a rural territory composed of many protected areas (40% of the territory) on the other, and between them a mixed zone with scattered population. 1 Directive 91/271/EC

EX POST EVALUATION OF COHESION POLICY PROGRAMMES 2000-2006 CO-FINANCED BY THE EUROPEAN FUND FOR REGIONAL DEVELOPMENT (OBJECTIVES 1 AND 2) - WORK PACKAGE 5B: ENVIRONMENT AND CLIMATE CHANGE ADE
Regional Case study – Norte Region – October 2009 Page 10
Sensitive area
Less sensitive are
Source: National Water Institute INAG Moreover, given the industrial structure of the regional economy with a high number of textile factories which together produced a considerable amount of wastewater, the most critical environmental issue had always been the drainage and treatment of industrial wastewater in Norte Region. This problem had partially been solved by the late 1990s, in a large extent via ERDF co-financed projects that set up sewerage and treatment systems, particularly in rivers affected by textile factories, and by imposing municipal or inter-municipal regulations relative to industrial waste water discharge, which imply on-site treatment by the industry. Nevertheless, water quality and water resources management remain a problem. The quality of sea water was affected by the poor treatment of wastewater and was lower than the national average. As regards water supply, the situation of the region was more positive and closer to the national average and the targets set by European Directive2, with 79% of the population served. Prior to 2000 water was totally free in Norte Region. In terms of air quality and urban waste, the situation was less critical in Norte Region. Air quality improved in the 1990s and has been stable since the beginning of the 2000s.3 There are only a few localised problems, such as in Porto. The generation of urban waste in the region was lower than the national average: 381.8 kg/capita compared to 436 kg/capita. Moreover, massive investments had been made during the previous programme with the aim of closing the majority of dumps.
2 Directive 98/83/EC
3 Avaliação da qualidade do ar na Região Norte 2006, CCDRN and Universidade de Aveiro, August 2008

EX POST EVALUATION OF COHESION POLICY PROGRAMMES 2000-2006 CO-FINANCED BY THE EUROPEAN FUND FOR REGIONAL DEVELOPMENT (OBJECTIVES 1 AND 2) - WORK PACKAGE 5B: ENVIRONMENT AND CLIMATE CHANGE ADE
Regional Case study – Norte Region – October 2009 Page 11
1.2 The Institutional set up
Policy-making process
In 2000, Portugal was still a highly centralised country. In practice, Portugal remains the second most centralised country in the OECD area according to the share of total public revenue and expenditure generated at sub-national levels with a level close to 10%4. This indicator ranges between 20% and 50% for almost all other EU countries. Portugal’s traditionally centralised governance framework had a major influence on regional policies and their ability to take into account the specific assets of regions and to differentiate development strategies. Responsibilities for urban planning and the environment are shared between the central government and municipalities. But resources and competencies were at that time mostly vested at a central level. Local authorities are the more involved; despite of their high degree of autonomy and of their responsibilities (namely decentralized public services) they receive limited resources to implement their policies. The central government dominated the decision making process and applied an almost final product to the different territories. Moreover, the most important instruments for enhancing the regional industry competitiveness remained in the hands of the central level.
In the environmental sector
Water distribution, waste water sewerage and treatment, and solid waste are organised in two main systems: Downstream and Upstream. Water distribution: The upstream system covers the infrastructures needed for
catchments and “transportation” to main distribution centres. These are complex systems involving a large number of sub-catchment, treatment and water-supply-to-downstream systems. The downstream system relates to the municipal systems of water distribution.
Waste water: The downstream system relates to sewerage collection while the upstream systems involve collection from downstream systems, transport and treatment of urban wastewater, with strong geographical dispersion and diversity of size and technical complexity.
Solid waste: As regards solid waste, downstream relates to collection of solid waste while upstream is considered the waste separation centres and landfills receiving from more than one municipality.
4 Cfr OECD Territorial reviews – Portugal - 2008

EX POST EVALUATION OF COHESION POLICY PROGRAMMES 2000-2006 CO-FINANCED BY THE EUROPEAN FUND FOR REGIONAL DEVELOPMENT (OBJECTIVES 1 AND 2) - WORK PACKAGE 5B: ENVIRONMENT AND CLIMATE CHANGE ADE
Regional Case study – Norte Region – October 2009 Page 12
These upstream systems involve in general either a large city (more than 100,000 habitants) or a group of municipalities using a common infrastructure. There are two types of upstream systems, the inter-municipal system in which municipalities collaborate to manage the activity (directly with their own staff or by concession) and the multi-municipal system in which a group of municipalities establish an agreement with a company of Águas de Portugal group (a public corporation which deals in water, waste water and solid waste). Downstream services are ensured by municipalities which charge a fee to consumers. Municipalities can decide on the fee to charge, as long as they follow the rules set out by the National Institute of Regulation of Water and Waste (IRAR). The municipalities have their environmental departments or divisions of environment. There is not any obligation regarding the dimension and respective powers. Only some municipalities deal with green environment, all need to manage grey environment. Two bodies are now in charge of the environmental sector at regional level:
Regional Coordination and Development Commission “Comissões de Coordenação e
Desenvolvimento Regional” (CCDR) are the deconcentrated bodies of the Ministry of Environment, Territorial Planning and Regional Development. The CCDR are now administratively and financially independent, responsible for the execution of environmental policies, spatial planning, regional development and technical support to local governements. Another competence of the CCDR is management of the EDRF Regional programmes and in this sense they are also in charge of promoting coordination with other regional bodies.
River Basin District Authority “Administrações das Regiões Hidrográficas” – with activities starting in October 2008, these authorities are vested with the competence to elaborate and implement the river basin management plan and help in the elaboration of plans of dams, estuaries and coastal zones; emission of water use licences; and implementation of the economic and financial regime (cost-recovery, etc), surveillance, and implementation of policies of the national water authority. These competencies were previously (and during the 2000-2006) attributed to the CCDR.

EX POST EVALUATION OF COHESION POLICY PROGRAMMES 2000-2006 CO-FINANCED BY THE EUROPEAN FUND FOR REGIONAL DEVELOPMENT (OBJECTIVES 1 AND 2) - WORK PACKAGE 5B: ENVIRONMENT AND CLIMATE CHANGE ADE
Regional Case study – Norte Region – October 2009 Page 13
2. Regional policies and the role of the ERDF
2.1 Environmental priorities
Environmental priorities in Portugal were defined in the Regional Development Plan 2000-2006, in which the EC framework support to Portugal was based. According to the environmental strategy underlined in the document, the environmental priorities of the country are based on four aspects: integration of the environment into development policy and territorial sectoral policies; conservation and enhancement of natural heritage in a strategy of conservation of
nature and biodiversity; establishment of a strategic partnership with various stakeholders to achieve
environmental modernisation of economic activities and of organizations; development of environmental education and information. According to this strategic direction, environmental objectives were defined for key areas of the environment, including: water supply, wastewater treatment and solid waste: decreasing the asymmetries
between Regions which remain significant; water: improving water quality and water resources management (the river basin
authorities were enacted in 2008); preventing soil degradation and the risk of desertification, aggravated by weather events
(drought and heavy rain) and the extent of forest fires; improving the planning on the expansion of metropolitan areas and other urban areas; decreasing the dependence of road transportation and use of private cars and
developing other modes of transport, in particular rail; decreasing the high intensity of energy use and carbon emissions caused by economic
activities and patterns of mobility and consumption, leading to a close direct relationship between economic growth and the increase of energy consumption and emissions of Greenhouse Gases.
Sectoral plans have been established at national level for planning and managing waste and water systems: the Strategic Plan for Urban Solid Waste (PERSU I), approved in 1997 and reprinted in 1999, was the main reference tool at the beginning of the programme for planning and managing urban waste. This plan has, inter alia, quantified short, medium and long terms targets for reduction of production of solid waste, and of recycling, organic recovery and incineration with energy recovery as well as landfill. The 2000-2006 Strategic Plan for Water Supply and Wastewater Sanitation (PEAASAR) established the main strategic lines, assumptions, objectives and operational priorities for 2000-2006, to ensure the proper use of EU funds available in the 2000-2006 period, and in so doing it played a key role in the structuring of the entire sector of water supply and waste water treatment in Portugal5.
5 The PEEASAR I had four key objectives: (1) increasing the % of the population with access to water supply (to 95%)
and wastewater services (to 90%); (2) promoting water supply and wastewater services with quality and continuity; (3)promoting the implementation of integrated solutions (plurimunicipal) and entrusting the management of systems to companies; (4) obligation to establish adequate tariffs for using these public services.

EX POST EVALUATION OF COHESION POLICY PROGRAMMES 2000-2006 CO-FINANCED BY THE EUROPEAN FUND FOR REGIONAL DEVELOPMENT (OBJECTIVES 1 AND 2) - WORK PACKAGE 5B: ENVIRONMENT AND CLIMATE CHANGE ADE
Regional Case study – Norte Region – October 2009 Page 14
2.2 Norte regional development strategy
The Norte OP 2000-2006 was the main regional policy document. It has been designed to match the main objectives of the regional strategy with the institutional organisation of Portugal. The programme covered mainly the fields managed by local or regional authorities while the others, such as economy and research and innovation, were managed centrally. For the programming period 2000-2006, initial work started at the national level. A national paper came out of these discussions fixing the main priorities for actions at regional level and for the use of CSF. Three strategic priorities were defined: 1. improve the qualifications of the population, so as to increase their employment and
promote social cohesion;
2. promote regional competitiveness factors and valuate territorial productive systems;
3. promote the conditions for a sustainable and balanced territory.
Based on this, the design of the regional programmes was set up by central government and was identical for all regions. The first axis addressed primarily the actions of municipalities, axis 2 addresses inter-municipal and sub-regional aspects, and axis 3 corresponded to the implementation of national measures in the region. In this way the CCDR has established a strategy for the region, mainly in their areas of action that will be undertaken through axes 1 and 2. This strategy has been adjusted via negotiation with the central government on the framework of the regional programmes, and also with the municipalities on defining specific actions to implement; examples are the choice of areas for implementation of inter-municipal actions, or choice of cities in which to implement urban rehabilitation, or the pacts on specific issues for regional development. Each regional OP included a set of measures that are still under the central government responsibility. These measures implemented in the region were decided directly by the Central Government. Specific programs related to Central Government responsibilities such as Science and Innovation, Economy, Education or even part of the environmental sector also remain centralised, designed and managed by the Central Government. In the Norte Region, transversal objectives were clearly identified at the start but the structure of the OP has made it difficult to translate the strategy into a clear articulated regional programme.
Figure 1: Norte Programme – Priorities and environmental measures

EX POST EVALUATION OF COHESION POLICY PROGRAMMES 2000-2006 CO-FINANCED BY THE EUROPEAN FUND FOR REGIONAL DEVELOPMENT (OBJECTIVES 1 AND 2) - WORK PACKAGE 5B: ENVIRONMENT AND CLIMATE CHANGE ADE
Regional Case study – Norte Region – October 2009 Page 15
1. Infrastructural network for competitiveness in an openeconomy
2. Balance of the regional urban system: themetropolitan region and the rural areas in the interior
3. Qualification of the urban and natural environment
4. Importance of the policies towards specific groups(childhood, youth and old)
5. People qualifications and the employment growth
6. A qualified employment supply
7. Integrated policies against social exclusion, qualityimprovement and the equity of opportunities in theaccess to the main public services
8. Industrial policy toward the SME’s and the promotionof Region image of quality
9. Rural and agricultural development in the context ofEuropean and National policies
10. Modernization of the institutional framework to supportdevelopment
Water and sanitation infrastructure
Urban environment
10 key issues at stake 2 main objectives for environmental measures
Axis 1 Aid to municipal and intermunicipal investments
•Local environment systems (1.1)•Territorial qualification (1.3)•Specific actions of territorial improvement (1.6)•Basic sanitation – priority intervention areas (1.9)
Axis 2 Spatial Integrated actions •Douro (2.1)•Minho Lima (2.2)•Between Douro and Vouga (2.3)•Vale de Sousa (2.4)•Qualification of cities and metropolitan area(2.6)
Axis 3 Regional sectoral measures by central Government
•Health (3.8)•Environment (3.16)
Actually, the Norte OP had three sectoral components :
1. Transport covering the metro of Porto and the rehabilitation of roads in the metropolitan areas;
2. Environment aiming at reducing territorial imbalances and improving the quality of life as well as, in the medium term, attracting more qualified people;
3. The remaining part covering a large set of interventions notably in education, training, sport and culture.
Two critical environmental issues were placed at the forefront addressing some of the main challenges at regional level: water supply and sanitation and urban environment in a context of growing urban population. Environmental measures have been mainly driven by specific objectives linked to the water sector situation on the one hand, and on the other by a need to rehabilitate some urban and coastal zones.

EX POST EVALUATION OF COHESION POLICY PROGRAMMES 2000-2006 CO-FINANCED BY THE EUROPEAN FUND FOR REGIONAL DEVELOPMENT (OBJECTIVES 1 AND 2) - WORK PACKAGE 5B: ENVIRONMENT AND CLIMATE CHANGE ADE
Regional Case study – Norte Region – October 2009 Page 16
2.3 Environment actions taken
Table 1: Estimates of environmental expenditures in Norte Region during the 2000-2006 period
Norte Region
Total
environmental
expenditure
Out of which
environmental
investment
Waste
management
Water supply ‐
waste water
management
General Govt 1564.1 991.9 117.8 473.6
of which local authorities 1180.4 756.7 117.6 377.7
ERDF National Counterpart Fund 373.0 42.0
ERDF OP Norte 707.0 305.6 27.0 278.6
ERDF Ambiente 99.2 0.0
Cohesion Fund 826.4 826.4 146.2 680.3
Total grant 3569.7 2165.9 291.0 1432.5
Private sector 100.9 55.8 20.4
Total public + private 3569.7 2266.8 346.8 1452.9
EIB loans 358.1 358.1
Total 3927.7 2624.9 346.8 1452.9
Per capita (annual average) 1048.8 700.9
% Of GDP 1.4% 0.9% Source: INE, CCDR, Eurostat (COFOG data), own estimates,
The amount of environmental investments made in the Norte region during the period 2000-2006 is difficult to estimate precisely for two main reasons: regional data on national resources spent in the sector are not available for the whole period neither the amount invested by the private sector. An extrapolation has been made based on the national data by assuming that the level of national funds allocated to the Norte Region is correlated to the % of population living in that region. This is in line with available regional data for 2006 & 2007. Data on private investment are available at Nuts II level for 2005-2006-2007. The amount for the whole programming period has been estimated by using the proportion of expenditures done at national level in 2005/2006 compared to the whole period. Some interesting elements can be pointed out: At national level, capital expenditures accounted for nearly 50% of all expenditures in
the environmental sector. This must be similar in the Norte region. Investment per capita is high when compared to European countries (see task 2), but
similar to the national average. The Norte Region has thus not benefited of a higher level of investment as could have been expected regarding its position and the objective of reducing regional asymmetries.
These estimates confirmed by external experts shows that a large part (50% of public investments made) of environmental investments has been covered by European funds (besides the required counterpart, national investments often amplify the EU co-financed projects).
The CF has played a major role in environmental investment while according to our assumptions, the ERDF has contributed to nearly 20% mainly through the OP Norte but also through the Ambiente programme which accounted for nearly 2.5% of the environmental public expenditures made in the Norte Region.
The contribution of the private sector is relatively lower in the Norte region than in the rest of the country for all types of investments and especially for investment related to air protection (only 3% of investments made by the private sector in this field has been carried out in the Norte Region).

EX POST EVALUATION OF COHESION POLICY PROGRAMMES 2000-2006 CO-FINANCED BY THE EUROPEAN FUND FOR REGIONAL DEVELOPMENT (OBJECTIVES 1 AND 2) - WORK PACKAGE 5B: ENVIRONMENT AND CLIMATE CHANGE ADE
Regional Case study – Norte Region – October 2009 Page 17
During the 2000-2006 period, efforts have been concentrated on waste water collection and treatment infrastructures as expected. Around 75% of waste management expenditures are now current outlays, mainly for maintaining and operating the systems. Remaining investments have been funded by the CF and local authorities. Protection of biodiversity and landscape represented also a main area for public intervention and was taken in charge by Central government and local authorities; they mainly concern implementation of the coastal territorial planning, rehabilitation of dunes and coastal erosion, maintenance/rehabilitation of inland water bodies, management of protected areas. It has not been possible to analyse in details the set of operations made by the EIB. Loans from EIB are typically used for the water sector and the whole hydrologic cycle - from abstraction and distribution of potable water to the construction of waste water treatment plants. Co-funding schemes between the EIB and the ERDF/CF existed where the latter provided the necessary conditions to receive the EIB loan. This leverage effect was also observed for the financing of the metro in Porto and seems not to be so exceptional. The involvement of the private sector in environmental fields has grown during the 2000-2006 period. In 2004, private investments amounted to €13 mio and reached €21 mio in 2006 mainly due to higher investments related to waste water. Nevertheless the private sector seemed less active in the Norte Region compared to the country as whole: only 20% of the investments related to water and waste in Portugal have been undertaken in the region while for investment regarding air protection, the share of the region is less than 3%.


EX POST EVALUATION OF COHESION POLICY PROGRAMMES 2000-2006 CO-FINANCED BY THE EUROPEAN FUND FOR REGIONAL DEVELOPMENT (OBJECTIVES 1 AND 2) - WORK PACKAGE 5B: ENVIRONMENT AND CLIMATE CHANGE ADE
Regional Case study – Norte Region – October 2009 Page 19
3. Analysis of the ERDF contribution
3.1 ERDF contribution to environmental policies
Role of ERDF : National and regional OP
The ERDF contribution to the Norte environmental sector came from the regional OP as well as from the national thematic programs in particular the Ambiente program but also the Economy OP. Each program showed a strong focus: the regional OP has mainly supported waste water collection and treatment, as well as
the urban environment; the EOP has been used in priority for protection, improvement and regeneration of the
natural environment; the Economy OP has provided a significant amount of resources for renewable
energies and energy efficiency. The Regional OP According to the last figures available (situation at end-2007), €2,118m have been disbursed by ERDF for the Norte Region OP. Of this total, one-third (€703m) was dedicated to environmental projects, €771m (36,4%) was used for transport, a large proportion for the construction of the Metro do Porto, while the remaining 30% was directed to other measures, mainly in education, formations, sports and culture. Nearly 85% of environmental measures were allocated to the two main critical issues, leaving limited resources for other uses. Expenditures for environmental infrastructure (water supply, wastewater and solid waste) amounted to 42% of the environmental expenditures, a share equal to the proportion of ERDF funds dedicated to the rehabilitation of urban areas (€299m) In practice the ERDF investment on Regional OPs was designed complementarily to the Cohesion Funds investment in water supply, wastewater drainage and treatment and solid waste management within a logic of integrated systems, with Cohesion Funds financing upstream “high” regime while EDRF finances downstream “low” regime (final distribution to the client) in order to maximise the functionality of the systems. One of the reasons that explain this partition is the organisation of the water sector where municipalities are mainly in charge of the distribution while Águas de Portugal has the financial capacity to develop the complex upstream system throughout the country. During the 2000-2006 period, the ERDF regional OPs were considered as a main instrument to support local authorities investments. As Águas de Portugal is now entering more and more into the downstream part of the operations, the situation is evolving.

EX POST EVALUATION OF COHESION POLICY PROGRAMMES 2000-2006 CO-FINANCED BY THE EUROPEAN FUND FOR REGIONAL DEVELOPMENT (OBJECTIVES 1 AND 2) - WORK PACKAGE 5B: ENVIRONMENT AND CLIMATE CHANGE ADE
Regional Case study – Norte Region – October 2009 Page 20
Measures
1312 Preservation of the environment
152 & 162. Environment‐friendly
technologies, clean and economical energy
technologies
33 Energy infrastructures (production,
delivery)
34 Environmental infrastructure (including water)
343 Urban and industrial waste (including
hospital and dangerous waste)
344 Drinking water (collection, storage,
treatm
ent and distribution)
345 Sew
erage and purification
35 Planning and rehabilitation
351 Upgrading and Rehabilitation of
industrial and military sites
352 Rehabilitation of urban areas
353 Protection, improvement and
regeneration of the natural environment
354 Maintenance and restoration of the
cultural heritage
Total by
measure
% for each
measure
1.1. Local environmental systems 4,3 91,0 143,8 239,1 34,0%
1.3. Territorial qualification 9,4 124,8 0,2 134,5 19,1%
1.4. Regional and local valorization and promotion 0,2 0,2 0,0%
1.6. Specific actions of territorial improvements 2,2 34,4 36,6 5,2%
1.7. Bonus rates in credit lines of municipal investments 0,6 1,2 0,2 1,8 3,9 0,6%
1.9. Basic sanitation ‐ Priority intervention areas 8,7 7,5 21,8 38,0 5,4%
Total of Axis 1 0,0 0,0 13,0 0,0 99,2 166,8 11,8 0,0 161,2 0,2 0,0 452,3 64,3%
2.1. Douro 0,9 23,3 1,8 2,3 28,3 4,0%
2.2. Minho Lima 9,7 11,7 0,9 22,3 3,2%
2.3. Between Douro and Vouga 0,4 11,2 1,6 13,2 1,9%
2.4. Vale do Sousa 13,6 4,0 17,6 2,5%
2.6. Qualification of towns and metropolitan re‐
qualification (POLIS) 87,7 87,7 12,5%
Total of Axis 2 0,0 0,0 0,0 0,4 0,0 0,0 0,9 34,5 122,8 4,2 6,3 169,2 24,1%
3.8. Health 0,1 0,1 0,0%
3.11. Agriculture and regional development 1,7 1,7 0,2%
3.14. Economy 26,4 4,5 30,9 4,4%
3.16. Environment 19,5 14,7 14,7 48,9 7,0%
Total of Axis 3 1,7 26,4 0,0 19,5 0,0 0,1 4,5 0,0 14,7 14,7 0,0 81,6 11,6%
Total Regional OP by FOI 1,7 26,4 13,0 20,0 99,2 166,9 17,2 34,5 298,7 19,1 6,3 703,0
1.1 Preservation and valorisation of the natural patrimony 19,3 19,3
1.2 Support and protection of natural resources 23,9 23,9
1.3 Information, sensibilisation and environment
management 2,8 2,8
2.1Improvement of the urban environment
49,4 49,4
2.2 Support to environmental sustainability of economic
activities
3,9 3,9
Total ERDF by FOI 1,7 3,9 26,5 13,0 20,0 99,3 167,2 17,3 34,5 348,5 65,2 6,3 802,3
% for each FOI 0,2% 0,5% 3,3% 1,6% 2,5% 12,4% 20,8% 2,2% 4,3% 43,4% 8,1% 0,8%
Axis 1:
Aid to municipal
and
intermunicipal
investments
Axis 2:
Integrated
actions of the
territorial basis
Axis 3 Regional
sectoral
measures by
the central
government
Regional OP
Priority 1:
sustainable
management of
natural
resources
Priority 2:
Integrating the
environment in
economic and
social activities
OP Ambiente
Table 2: Environmental measures – Approved expenditures 2000-2008 Source: Annual reports, 2007 The majority of the targets have been reached or even exceeded, especially in wastewater treatment which was one of the priorities of the OP and for which funds were reallocated following the mid-term evaluation. Measure 1.9 (basic sanitation) was created following the mid-term evaluation in order to solve the remaining problems in basic sanitation. The priority intervention areas were the transition zones (between urban and rural areas) where the population is particularly scattered. 51% of the funds for this measure were used for wastewater treatment, 15% for water supply and 34% for mixed interventions. Moreover, a large part of the effort was dedicated to improving the quality of service for populations already connected, which is not reflected by the indicator of kilometers of pipes built. In urban rehabilitation, some targets had not been achieved at the time of reporting but it must be stressed that some of the achieved values were compiled before the end of the programme and that there had also been delays in approval of some projects.

EX POST EVALUATION OF COHESION POLICY PROGRAMMES 2000-2006 CO-FINANCED BY THE EUROPEAN FUND FOR REGIONAL DEVELOPMENT (OBJECTIVES 1 AND 2) - WORK PACKAGE 5B: ENVIRONMENT AND CLIMATE CHANGE ADE
Regional Case study – Norte Region – October 2009 Page 21
Table 3: Synthesis of main output indicators.
Target value
Achieved value
1 Number of projects in water supply number n.a. 3372 Number of projects in wastewater number n.a. 3523 Number of projects in municipal solid waste number n.a. 74 New capacity of waste treatment created million m³ n.a. 1405 Number of unauthorised landfills closed/ rehabilitated number n.a. 106 Water supply network (constructed, improved, or rehabilitated) km 4070 43477 Wastewater network (constructed, improved, or rehabilitated) km 2526 27188 Water treatment plants (constructed, improved, or rehabilitated) number n.a. 219 Daily capacity of water treatment plants constructed m³/day n.a. 605710 Wastewater plants (constructed, improved, or rehabilitated) number n.a. 50911 Daily capacity of wastewater treatment plants constructed m³/day n.a. 39690
12 Capacity of waste treatment on improved facilitiesmetric
tonne/dayn.a.
360
Nb. Indicator UnitOP Norte
Source: Annual Report 2007 The Environmental OP (EOP) 30% of the EOP has been allocated to the Norte Region, mainly for preserving natural resources and natural patrimony as well as for improving the urban environment (an additional contribution to the POLIS programme). The specific measure dedicated to support projects from private companies (measure 2.2) was less used in the Norte Region (only 14% of the funds were allocated to the Norte Region), which is in line with the limited investments made by companies in that field (see previous point). As mentioned in the analysis of the effectiveness of the EOP (section 3.2.5), there has been a close coordination with regional OPs, having as a central concern the avoidance of repetitions in the co-financing of projects. This is particularly true in the regionally focused interventions of the central government priority axis. Some criteria were defined à priori such as: EOP focused in Natural Parks while regional OPs focused on other Nature 2000 sites; the EOP funded rehabilitation of urban river bed stretches or construction of urban parks, while regional OPs funded other urban interventions and the EOP tends to fund larger investments. For measure 2.1 of the EOP, mainly urban intervention, the National POLIS Coordination Bureau6 supervised the proposals from all different funding sources within the scope of the POLIS programmes. The Economy OP It is worth noting that the Economy Operation Programme co-financed the installation of 586.5 MW, within 76 wind power plants and 11 mini-hydro power plants (with a cost of €624.5 million). In addition, the program has spent €121 million in energy efficiency, which also includes investments in solar power and biomass use. 6 The POLIS programme aim at qualification of towns and metropolitan re-qualification and improving quality of life in the cities.
Specifically on environment it focused on building side walks and bicycle lanes, building parks and green spaces, rehabilitating rivers and river margins, protecting dunes or preventing coastal erosion and solving environmental threats.

EX POST EVALUATION OF COHESION POLICY PROGRAMMES 2000-2006 CO-FINANCED BY THE EUROPEAN FUND FOR REGIONAL DEVELOPMENT (OBJECTIVES 1 AND 2) - WORK PACKAGE 5B: ENVIRONMENT AND CLIMATE CHANGE ADE
Regional Case study – Norte Region – October 2009 Page 22
The figure below, from the Economy OP 2007 report, shows the environmental impact of the renewable energy projects by region7 (on the left) with the largest impact being in the Norte region (63%, with an emission reduction of 1572 kton CO2/year), and the contribution of the energy source for the impact (on the right) in the entire country showing the large contribution of wind energy.
Figure 2: Environmental impact of the renewable energy projects by region
The Norte region absorbed about 22% of the funds for energy efficiency. The energy co-generation systems contributed to 86.5% of the investment in the entire country, and for the reduction of 662 771 tons of CO2/year. One third of this investment was directed to the use of natural gas in thermoelectric power plants. The remainder was invested in other types of energy producing systems. In this typology, it is worth mentioning the project of changing public illumination mercury bulbs to sodium bulbs reducing emissions in 48 813 tons of CO2/year. The Norte region absorbed 45% of this national €12 million project.
3.2 Main results achieved in terms of the environmental situation
Table 4: Environmental situation of the Norte Region
2001 2002 2003 2004 2005
Residue in surface water (kg per capita) n.a. 19 15 19 22Coast: % of beaches with water of poor quality n.a. n.a. n.a. n.a. 9,6Population served by public water supply systems (%) 79,0 81,0 83,0 83,0 84,0
Population served by public sewerage systems (%) 55,0 56,0 60,0 61,0 64,0Population served by wastewater treatment plants (%) 42,0 43,0 49,0 52,0 55,0Proportion of wastewater treated (%) 73,0 73,0 81,0 91,0 88,0
Urban solid waste (kg/hab) n.a. 381,8 388,5 389,5 388,8Urban waste selectively collected per inhabitant (kg/ hab) n.a. 12,1 15,1 19,1 22,0Proportion of urban waste selectively collected (%) n.a. n.a. n.a. n.a. 6
Sources: 2007 Operational report on OP Norte, INE, Anuario Estatistico Regional, Urban Audit
7 Azores and Madeira regions are not represented.

EX POST EVALUATION OF COHESION POLICY PROGRAMMES 2000-2006 CO-FINANCED BY THE EUROPEAN FUND FOR REGIONAL DEVELOPMENT (OBJECTIVES 1 AND 2) - WORK PACKAGE 5B: ENVIRONMENT AND CLIMATE CHANGE ADE
Regional Case study – Norte Region – October 2009 Page 23
In terms of waste collection and treatment
As regards solid waste, the situation remained stable: waste generation, still lower than the national average, did not increase significantly, helped by low economic growth. ERDF investment in waste collection and treatment, though limited, has been done complementarily to Cohesion fund. Concretely, the regional programme spent over 15 million on RESIDOURO a multi-municipal encompassing 10 municipalities. It has also spent 11 million euro for the environment requalification – roofing – of the waste separation unit of Vale do Ave encompassing six municipalities. It has also performed other smaller projects namely on information. Even if the aspect of waste generation and prevention has not been dealt by the Regional Programme, some significant improvements were observed during the period 2000-2007. Indeed, in 2000, only 3,4% of urban waste were collected selectively, compared to 8,4% in 2007. The amount of waste used to produce compost has also increased: from 42 thousand tons in 2000 to 151 thousand in 2007. Moreover, in 2000, 170 thousand tons of waste were still destined to garbage dumps. Finally, the target of 3,4 millions inhabitants served by waste treatment has been exceeded. Urban audit index for the amount of collected waste was 0.46 (scale 0-1) in Braga in 2004 and waste processed in landfill was 95% satisfactory, compared with UA cities. For Porto in 2004 the index for the amount of waste collected was satisfactory (0.7) but the degree of satisfaction with the waste processed in landfill was low.
In terms of water supply and waste water collection and treatment
Almost all the water treatment plants and wastewater treatment plants are new, whereas the extension of the water distribution and sewerage are new or rehabilitated, though this was not clearly assessed by the programme monitoring. In some cases the pipes had to be replaced. As regards the Water Framework Directive, it is to be stressed that RBD authorities started functioning in October 2008. No plans are defined yet. Regarding the WFD objectives, there is still a way to go in order to achieve them. In fact, in 2007 the proportion of population served by wastewater is 78%, while the treatment covers 71,5%. It is worth noting that nevertheless there has been an enormous effort in the period 2000-2006 with the population served by wastewater increasing from 58% and 43% respectively for sewerage and treatment. Regarding quality, as defined by the parameters set by National Water Institute, water in northern region varies from good to reasonable in the coastal areas, and is bad at the River Minho (border with Spain) in 75% of the stations. There are still some stations registering very bad water in the Vouga (a bit more than 30% of stations), Douro (less than 20%), and Ave/Leça (about 25%).

EX POST EVALUATION OF COHESION POLICY PROGRAMMES 2000-2006 CO-FINANCED BY THE EUROPEAN FUND FOR REGIONAL DEVELOPMENT (OBJECTIVES 1 AND 2) - WORK PACKAGE 5B: ENVIRONMENT AND CLIMATE CHANGE ADE
Regional Case study – Norte Region – October 2009 Page 24
In terms of new treatment technologies introduced, there has been 387 new wastewater treatment plants built until 31.12.2007 and most have bacteriological (secondary) treatment. As regards management, improvements were implemented. There are verticalised system – multimunicipal, the management held by municipality associations, either with own staff or with subcontractors. There is good articulation between upstream and downstream systems. Although water tariffs are in the process of being harmonized, there are large discrepancies between values, within the limits imposed by the regulatory authority.
Graph 1: Environmental situation at national/regional level (2005)
0.0 20.0 40.0 60.0 80.0 100.0
Population served by public water supply systems (%)
Population served by public sewerage systems (%)
Population served by wastewater treatment plants (%)
Proportion of wastewater treated (%)
Proportion of urban waste selectively collected (%)
Norte
Portugal
In terms of reducing GHG emission
Energy efficiency is a relatively new concept in Portugal. The national strategy has been published in 2008. In Portugal the energy consumption per capita is 1.7 tep (UE average 2.6 tep) and in 2006 there has been a decrease. Between 1984 and 2004 the electricity consumption for domestic use has increased at a rate of 5.6% per year. Portugal has the commitment of producing 45% of the electricity by renewable means (including dams) by 2010, and using 10% of bio-fuels. The Norte region produced in 2006, 15 840 MW/h of energy, 1 178 MW/h of which by wind, 8 518 MW/h dams, 6 142 MW/h thermal. In the new framework support 2007-2013 renewable energies and energy efficiency will be dealt at the regional OP. Promotion of the use of renewable energies and energy efficiency was not a part of OP Norte but mainly addressed through the Environmental OP and the Economy OP. However, the OP Norte has contributed in reducing GHG emissions, particularly through the major expenditure of the regional programme: the construction of the light railway of Porto (metro do Porto). This has contributed to diminish by 11 thousand the presence of vehicles per day in Oporto, and to the utilization by passengers of metro instead of bus. This would imply in 2005-2007 a decrease of tons of CO, ranging from 130 (if only the

EX POST EVALUATION OF COHESION POLICY PROGRAMMES 2000-2006 CO-FINANCED BY THE EUROPEAN FUND FOR REGIONAL DEVELOPMENT (OBJECTIVES 1 AND 2) - WORK PACKAGE 5B: ENVIRONMENT AND CLIMATE CHANGE ADE
Regional Case study – Norte Region – October 2009 Page 25
change of public transportation is taken into account) to 300 (including the diminution of cars). Even though the metro has emitted 178 t CO2 per year, the balance remains positive. The incentives provided by the Environmental OP for private investment in environmentally friendly technologies and energy efficiency do not seem to be particularly effective in the Norte Region. The use of this specific measure has been quite limited and available figures on private investment since 2004 in that field do not indicate any upward movement.
3.3 Contribution to regional territorial development
Table 5: Economic performances of the Norte Region Economic performance 2000 2001 2002 2003 2004 2005 2006
GDP/capita (PPS; EU25=100) 60,6 60,7 59,8 58,6 56,9 57,5 n.a.
Employement rate (of the group 15‐64) 68,0 69,1 68,4 67,0 66,3 65,9 66,3
GDP Annual growth rate n.a. 3,0 ‐1,4 ‐2,6 0,9 1,0 n.a.
Investment in % GDP 22,6 23,3 22,4 21,1 20,9 n.a. n.a.R&D in % GDP 0,2 0,2 0,4 0,6 0,7 0,7 n.a.Migration flows 0,56 0,64 0,66 0,60 0,48 0,35 0,23
Labour producitivity (GDP per employed in PPS) 20094 20268 20137 19822 20013 20318 n.a.Source: Eurostat
During the 2000-2006 period, the Norte Region’s economy suffered heavily from external shocks and a loss of competitiveness at the beginning of the 2000s. Real GDP experienced two consecutive years of recession in 2002-03 (-1.4% and -2.6%), while the EU25 economy was growing at an annual rate of 1.25%; the growth of Norte Region remained limited during the following years. The unemployment rate increased massively as a consequence of GDP reduction while labour productivity rose very slowly. In 2005, the unemployment rate was near 9%, the second highest level in Portugal well above the national average (7,5%). In 2001, it was still under 4%. The investment rate as a percentage of GDP has decreased raising concerns for the renewing and adjustment of regional productive capacities. At the end of the 2000-2006 period, the Norte region was not able to reverse significantly the declining trend of the economy and to put forward the necessary conditions for regaining its competitiveness. Contribution of ERDF environmental measures to the adjustment process
A first but significant effect of the EU funds has been to support macroeconomic adjustement of the country. Portugal has made major efforts to reduce its budget deficit since 2000 in order to achieve the European macroeconomic convergence criteria. European funds have thus permitted support for the poorer regions through massive transfers to finance infrastructure and basic public services with a view to reducing regional income disparities8 in a context of reduced macroeconomic imbalances.
8 For more, see the recent OECD territorial reviews of Portugal, ISBN 978-92-64-00895-3 - 2008

EX POST EVALUATION OF COHESION POLICY PROGRAMMES 2000-2006 CO-FINANCED BY THE EUROPEAN FUND FOR REGIONAL DEVELOPMENT (OBJECTIVES 1 AND 2) - WORK PACKAGE 5B: ENVIRONMENT AND CLIMATE CHANGE ADE
Regional Case study – Norte Region – October 2009 Page 26
The role played by the change in environmental infrastructures in the regional structural adjustment process appears to have been limited.
Basic infrastructures were not enough for addressing the big challenges the region had to face in terms of competitiveness. These investments were not integrated in a comprehensive regional strategy addressing the most important issues such as worker qualifications, innovation capacities, productivity increase and cost reduction as well as the integration of more remote areas.
One of the main difficulties for developing a more integrated approach at regional level has been the pre-eminent role taken by the national authorities, first by using national thematic programmes for dealing with the economy (and energy) and innovation, and second by maintaining a strong influence on the regional programme and the way funds are allocated (mainly through the axis 3). The management authorities of the regional OP were neither involved nor even informed of the funds allocated in the region through national thematic programmes. The centralised institutional set up also raised problems at the implementation stage partly due to the fact that the interaction between the regional representations of the different ministries was not very strong. The different sectoral programs have been implemented vertically without coordination at regional level. The CCDR-Norte didn’t even know what these programs such as Education, Health, Economy, Science and Innovation, Knowledge and culture have implemented in the region.
Limited impact in terms of competitiveness
This assessment is in line with the conclusions of a recent OECD study9 analysing Portuguese territorial policies and highlighting the following issues:
In a context of fiscal deficit reduction, regional policy stands out as a major tool for implementing the competitiveness agenda.
Past investments focusing on physical infrastructure and basic services – albeit credited with bringing about necessary improvements – were not enough to trigger an endogenous development dynamic based on competitive assets.
Improvements have been brought about by the focus of past regional policy on physical infrastructure (better accessibility in terms of public services) but the limits of such choices have been recognised (agglomeration effects have tended to reinforce the already developed urban poles on the coast).
There has been growing awareness that regions should not host accidental collision of sectoral policies that confuse economic agents via contradictory signals, but rather a carefully planned set of integrated and mutually reinforcing policies in accordance with a locality-based approach.
9 OECD territorial reviews, Portugal, 2008

EX POST EVALUATION OF COHESION POLICY PROGRAMMES 2000-2006 CO-FINANCED BY THE EUROPEAN FUND FOR REGIONAL DEVELOPMENT (OBJECTIVES 1 AND 2) - WORK PACKAGE 5B: ENVIRONMENT AND CLIMATE CHANGE ADE
Regional Case study – Norte Region – October 2009 Page 27
Moreover the intended contribution of environmental measure to regional development has been mainly oriented to improving the quality of the locality (including natural resources) and quality of life with a rather indirect contribution to economic development:
By improving the quality of life and the quality of the locality, the region expected to attract more qualified people and induce an upward trend in private investment;
A positive effect was also expected on tourism activities that depend partly on natural resources quality and cultural heritage.
Those measures aiming at rehabilitating urban areas, which represent an important part of the OP, had limited effects on the industrial sector. In some cases, projects were related to economic activity but the private sector has not been clearly involved and the effects are still to be seen (see box).
GAIA Polis
The POLIS programme has supported the rehabilitation of eight cities, GAIA being one of them. The public company set up at the beginning of the period to manage the programme and will be closed at the end of June 2009. The budget amounted to €32m of which €13.8m came from the ERDF OP Norte (mainly through measure 2.6). A total of 23 projects were undertaken in various fields: rehabilitation of the fishing port; building of new warehouses for the fishing industry; rehabilitation of roads and construction of new roads to facilitate mobility; construction of pedestrian and bicycle tracks; setting up of municipal natural reserves; protection of dunes; basic infrastructures to permit construction of a Marina by private investors; de-pollution; and others. The municipality now expects that the private sector will take its turn in carrying out commercial investments.
More often, projects have been undertaken for renovating urban spaces, green or not. The number of projects has been very high (around 200 under measure 1.3-territorial requalification of Norte OP) but usually of a limited amount (on average around €600 000 from the ERDF), scattered and isolated from other public investments.
The contribution to territorial development of environmental measures undertaken through axis 2 devoted to integrated actions on a territorial basis seems also to have been limited as again the most important share were used for rehabilitating urban environment. Four sub-regions were selected with the aim of enhancing territorial competitiveness. Three of the integrated action plans (Between Douro and Voga, Minho Lima, Vale do Sousa) aimed at reorganising the industrial tissue while the fourth (Douro) was dedicated to promoting tourism. Environmental measures could be undertaken if integrated into territorial planning. Only one sub-region used it for enhancing environmental infrastructures (a very limited project on solid waste). Meanwhile, two of the four sub-regions used between 25% and 40% of the fund for rehabilitating urban areas as well as industrial sites. ERDF has contributed to the POLIS programme dedicated to towns and metropolitan re-qualification. Eight cities selected by national authorities were addressed by this measure, which is being completed with the aid of national funds. Five of the eight cities were located along the coast and benefited of projects for protection of dunes, stabilisation of cliffs, improvement of beach zones and tracks for cycling.

EX POST EVALUATION OF COHESION POLICY PROGRAMMES 2000-2006 CO-FINANCED BY THE EUROPEAN FUND FOR REGIONAL DEVELOPMENT (OBJECTIVES 1 AND 2) - WORK PACKAGE 5B: ENVIRONMENT AND CLIMATE CHANGE ADE
Regional Case study – Norte Region – October 2009 Page 28
Attractiveness enhanced thanks to an improved quality of life
All these measures may have contributed to improving the environmental performance of the country, as emphasised by the mid-term evaluation of the environmental OP, especially by improving the urban environment and the coastline, which is justified by the high percentage of the population density on the coast. The attractiveness of the zone in terms of quality of life has been enhanced. Even if the need for such projects must not be underestimated, especially in dynamic urban regions that must attract highly qualified workers, the effects on the Norte Region competitiveness seem to be weak, at least in the short term.
Low spill-over effect of innovative technologies
Bringing technological innovation could also be another potential effect expected from public investments which may contribute to regional competitiveness. Innovation has been enhanced mainly through new equipments and technologies that have been integrated in the new/renovated infrastructures. The gains come mainly from embodied technologies. As seen in the field, the state of the art technologies have been used for waste water treatment and solid waste management (as for example in the GAIA water treatment system or the AMAVE solid waste project). Cooperation with universities has also been encouraged. But the effects remain limited. There have been some technical innovations such as electronic management of water leakages but the difficulty comes from the fact that innovation must be addressed by a national sectoral programme (Science and Technology). The innovations were localised and aimed at resolving specific issues.
Specific sectoral effects
Environmental measures have not contributed to lay down the necessary conditions for an economic recovery of the Norte region. Nevertheless some specific sectors have benefited directly or indirectly from the investments made, mainly the environmental sector, the building sector and the tourism activity.
Activities in the environmental sector
Table 6: Activities linked to environment
Source: Eurostat The investments in environmental infrastructures, mainly in the water sector, have reinforced the activity in the sector but the macroeconomic effects have been quite limited. The number of companies in the recycling and water sectors more than doubled during the period 2000-2006 (although not all are private companies) but employment in these sectors remained more stable. One of the reasons is that labour productivity increased due to
Activities linked to environment Sector 2000 2001 2002 2003 2004 2005 2006Recycling 44,0 47,0 67,0 77,0 103,0 107,0 120,0Water (1) 34,0 36,0 45,0 54,0 58,0 84,0 88,0Recycling 3,1 7,5 3,5 1,1 5,8 8,6 7,2Water (1) 203,4 171,9 194,9 200,2 180,2 374,3Recycling 512,0 527,0 439,0 595,0 635,0 602,0 766,0Water (1) 3278,0 3448,0 3149,0 3489,0 3483,0 3485,0Recycling 6,0 14,2 8,0 1,8 9,1 14,3 9,4Water (1) 62,1 49,9 61,9 57,4 51,7 107,4
(1) Collection, purification and distribution of water
Number of local units
Gross investment in tangible goods (in millions euro
Number of persons employed
Investment per person employed (in thousands euro

EX POST EVALUATION OF COHESION POLICY PROGRAMMES 2000-2006 CO-FINANCED BY THE EUROPEAN FUND FOR REGIONAL DEVELOPMENT (OBJECTIVES 1 AND 2) - WORK PACKAGE 5B: ENVIRONMENT AND CLIMATE CHANGE ADE
Regional Case study – Norte Region – October 2009 Page 29
technological innovation and better system organisation. This was the case for example in the Gaia treatment plant: 350 people are now employed compared to 300 in 1999 while the services have significantly increased. The effect of such funding on the financial health and the organisation of the water and sanitation sector would have been interesting to analyse. But it lies beyond the scope of this study. Nevertheless it is worth mentioning that municipal, inter-municipal companies, and the national holding (Águas de Portugal) responsible for environmental services can in some cases achieve good results: the Gaia municipal company has obtained a profit equivalent to more or less 10% of its turnover. This raises the question of tariffs (cf next section) and of the opportunity to extend the use of Public Private Partnership for funding such investments. Another related issue that was raised during the mission concerned the concessions given to private companies to run environmental services. In the Norte region, several municipalities have chosen to work under such arrangements. But it is becoming increasingly more convenient (partly due to funds distribution in the 2007-2013 programme) to extend the role of Aguas de Portugal to the downstream network. The effect could then be to reduce the role of the private sector in that field. Effects on the building sector The building sector has been one of the main beneficiaries of the investment made through the Norte OP. A project such as Metro do Porto employed many local workers during its construction and helped increase significantly the qualifications of local workers and companies, which are now using this experience on other projects abroad. It is quite difficult to identify the specific effects on the building industry of the investment made in environmental infrastructures. In any event the effects are mainly transitory except where the know-how gained could be used in other contexts and enhance the position of the companies on national and external markets. But no such effects were mentioned during the mission. Indirect effects on tourism activities It is difficult to pinpoint the specific impact of ERDF funds on the tourism sector in the Norte Region. Nevertheless, the improvement of the Porto airport (previous CF and ERDF funds on a previous programme), and an attractive clean and green environment and preserved cultural heritage are fundamental ingredients. The available figures related to tourism development shows a growing trend since 2000. The incomes earned have increased by around 30% while the number of nights in hotel/inhabitants has also significantly grown. Compared to the national average, this ratio is still low (375 for Portugal as a whole in 2007 compared to 113 in the Norte Region) but the rise has been higher (only 15% for Portugal as a whole between 2004 and 2007 compared to 26% in the Norte Region).

EX POST EVALUATION OF COHESION POLICY PROGRAMMES 2000-2006 CO-FINANCED BY THE EUROPEAN FUND FOR REGIONAL DEVELOPMENT (OBJECTIVES 1 AND 2) - WORK PACKAGE 5B: ENVIRONMENT AND CLIMATE CHANGE ADE
Regional Case study – Norte Region – October 2009 Page 30
Hotel establishments (No.) 436 435 435 450 452 461 5.7 %Total incomes (€) of hotel establishments 161,725 151,166 170,409 164,705 183,465 208,400 28.9%
Lodging incomes (€) of hotel establishments 104,621 98,557 115,003 107,873 121,558 137,200 31.1%Nights in hotel establishments by 100 inhabitants (No.) n.a n.a 89.4 92 102.7 112.9 26.3%
2006 20072002-07 Growth
rateTourism activity 2002 2003 2004 2005
Table 7: Tourism activity in the Norte Region
Source: National Institute for Statistics - Portugal These good performances may be partly due to the OP efforts to renovate urban environment and preserve natural resources. It may have improve the image of the Region and reinforce the attractiveness of the zone for tourists, and notably for local tourists.
ADE s.a. Rue de Clairvaux, 40
B-1348 Louvain-la-Neuve Belgium
Tel.: +32 10 45 45 10 Fax: +32 10 45 40 99 E-mail: [email protected]
Web: www.ade.be
Ex Post Evaluation of Cohesion Policy Programmes 2000-2006 Co-Financed by the European Fund for Regional Development (Objectives 1 And 2) – Work Package 5b: Environment and Climate Change
RReeggiioonnaall ccaassee ssttuuddyy EEaasstteerrnn SSlloovvaakkiiaa
October 2009


TThhiiss rreeppoorrtt hhaass bbeeeenn pprreeppaarreedd bbyy AADDEE aatt tthhee rreeqquueesstt ooff tthhee EEuurrooppeeaann CCoommmmiissssiioonn..
TThhee vviieewwss eexxpprreesssseedd aarree tthhoossee ooff tthhee CCoonnssuullttaanntt aanndd ddoo nnoott rreepprreesseenntt tthhee ooffffiicciiaall vviieewwss ooff tthhee EEuurrooppeeaann CCoommmmiissssiioonn..
RReepprroodduuccttiioonn oorr ttrraannssllaattiioonn iiss ppeerrmmiitttteedd,, pprroovviiddeedd tthhaatt tthhee ssoouurrccee iiss dduullyy aacckknnoowwlleeddggeedd aanndd nnoo mmooddiiffiiccaattiioonnss ttoo tthhee tteexxtt aarree mmaaddee..


EX POST EVALUATION OF COHESION POLICY PROGRAMMES 2000-2006 CO-FINANCED BY THE EUROPEAN FUND FOR REGIONAL DEVELOPMENT (OBJECTIVES 1 AND 2) - WORK PACKAGE 5B: ENVIRONMENT AND CLIMATE CHANGE ADE
Regional Case study – Eastern Slovakia – October 2009 Table of Contents
Table of Contents
ACRONYMS
SUMMARY
1. STATUS AND FEATURES OF THE REGION .............................................................. 1
1.1 THE REGION OF EASTERN SLOVAKIA ............................................................................ 1 1.2 ECONOMIC SITUATION (IN 2000-2004) .......................................................................... 1 1.3 ENVIRONMENTAL SITUATION (IN 2000) ........................................................................ 2 1.4 INSTITUTIONAL SET UP AND POLICY MAKING PROCESS ............................................... 5
1.4.1 Regional development .............................................................................................. 5 1.4.2 Environmental sector ............................................................................................... 5
2. REGIONAL POLICIES AND THE ROLE OF THE ERDF ........................................... 7
2.1 ECONOMIC POLICIES ......................................................................................................... 7 2.2 ENVIRONMENTAL POLICIES ............................................................................................. 8 2.3 ACTIONS TAKEN ................................................................................................................ 9
2.3.1 Environmental expenditures and the main sources of funds ............................. 9 2.3.2 ERDF contribution to environmental expenditures in the region .................. 10
3. ANALYSIS OF THE ERDF CONTRIBUTION .......................................................... 15
3.1 RELEVANCE OF THE 2000-2006 ERDF STRATEGY IN THE ENVIRONMENTAL
SECTOR FOR ENHANCING TERRITORIAL DEVELOPMENT ........................................... 15 3.2 QUALITY OF THE PLANNING AND IMPLEMENTATION PROCESS AT MEETING
REGIONAL CHALLENGES IN THE COVERED FIELDS .................................................... 15 3.3 CONTRIBUTION OF THE ERDF TO IMPROVING THE ENVIRONMENTAL
SITUATION (2000-2006 AND BEYOND) ......................................................................... 16 3.4 CONTRIBUTION OF THE ERDF TO IMPROVING THE QUALITY OF LIFE .................. 23 3.5 CONTRIBUTION OF THE ERDF TO REGIONAL ECONOMIC DEVELOPMENT ........... 24
ANNEX : INTERVIEWS ............................................................................................. 27

EX POST EVALUATION OF COHESION POLICY PROGRAMMES 2000-2006 CO-FINANCED BY THE EUROPEAN FUND FOR REGIONAL DEVELOPMENT (OBJECTIVES 1 AND 2) - WORK PACKAGE 5B: ENVIRONMENT AND CLIMATE CHANGE ADE
Regional Case study – Eastern Slovakia – October 2009 Table of Contents
LIST OF MAPS
MAP 1: EASTERN SLOVAKIA AND THE 8 SELF GOVERNED REGIONS ................................. 1 MAP 2: IMPROVEMENT OF THE SEWAGE NETWORK AND WWTPS IN AGGLOMERATIONS
BETWEEN 2002-2008 .................................................................................................. 19 MAP 3: IMPROVEMENT IN THE NUMBER OF INHABITANTS CONNECTED TO
THE PUBLIC SEWAGE NETWORK AND WWTP BY DISTRICTS BETWEEN 2002 –
2008 (IN %) .................................................................................................................. 20 MAP 4: DEVELOPMENT OF DRINKING WATER SUPPLY NETWORK IN
AGGLOMERATIONS BETWEEN 2002–2008 .............................................................. 20 MAP 5: IMPROVEMENT IN THE NUMBER OF INHABITANTS CONNECTED TO
THE PUBLIC DRINKING WATER NETWORK BY DISTRICTS BETWEEN 2002 – 2008 (IN %) ........................................................................................................................... 21
LIST OF TABLES
TABLE 1: ESTIMATE OF THE OVERALL INVESTMENTS IN ENVIRONMENTAL
INFRASTRUCTURES DURING THE 2000-2006 PERIOD IN SLOVAKIA ...................... 9 TABLE 2: ENVIRONMENTAL MEASURES – CONTRACTED ERDF AND SLOVAK FUNDS
2004-2008* .................................................................................................................. 10 TABLE 3: MAIN OUTPUT AND RESULT INDICATORS (RESULTS 31/12/2008) ...................... 11 TABLE 4: ENVIRONMENTAL DATA FOR SLOVAKIA ................................................................ 17 TABLE 5: SOCIO-ECONOMIC DATA ........................................................................................... 24

EX POST EVALUATION OF COHESION POLICY PROGRAMMES 2000-2006 CO-FINANCED BY THE EUROPEAN FUND FOR REGIONAL DEVELOPMENT (OBJECTIVES 1 AND 2) - WORK PACKAGE 5B: ENVIRONMENT AND CLIMATE CHANGE ADE
Regional Case study – Eastern Slovakia – October 2009 Acronyms
Acronyms
BIOP Basic Infrastructure Operational Programme
CF Cohesion fund
ERDF European Regional Development Funds
EU European Union
GDP Gross Domestic Product
ISPA Instrument for Structural Policies for Pre-Accession
MoE Ministry of the Environment
OP Operational Programme
PPS Purchasing Power Standard
WWTP Wastewater Treatment Plant


EX POST EVALUATION OF COHESION POLICY PROGRAMMES 2000-2006 CO-FINANCED BY THE EUROPEAN FUND FOR REGIONAL DEVELOPMENT (OBJECTIVES 1 AND 2) - WORK PACKAGE 5B: ENVIRONMENT AND CLIMATE CHANGE ADE
Regional Case study – Eastern Slovakia – October 2009 Summary
Summary – Key messages from the case study in eastern Slovakia
The ERDF operational programmes started in Slovakia with the adhesion in 2004. The Objective 1 area covers the entire national territory, except Bratislava. This regional case study focuses on the East Slovakia region, which is not a single comprehensive entity, but is composed of 2 self-governed regions. This region is lagging behind in economic terms and suffers from its relative isolation and lack of competitive infrastructures. The Slovak Republic is a highly centralised country. The economic and environmental policies are made by state authorities. Regional governments have no competencies in these fields. Complementary to the other European instruments (the CF and the ISPA), the ERDF OPs took part in the general process of structural adjustment by equipping the country with basic transport, environmental and local infrastructures and improving the living standards of the population. In the field of the environment, the strategy was national and mainly driven to comply with the related EU Directive requirements. Environmental measures account for 17% of ERDF OPs. The objectives were clear, mainly relevant and quantified with precise detailed local action plans identifying potential projects. However, it appears that the target values have not always been set in accordance with the available budget nor have they been articulated between results and output targets. Furthermore, provisions have not always been made to ensure the results and impacts of the investment once achieved. In the water field, priority was placed on sewerage and wastewater treatments (in agglomerations of over 2000 inhabitants) due to the existing difference between the population connected to water supply networks and the low rate of the population receiving wastewater treatment. Regarding solid waste, the OP focused on both the closure of uncontrolled landfills and the building of waste separation and recovery facilities. Waste management remains a problem in Slovakia since waste generation has significantly increased and the recycling rate remains stable at a very low level. Even if Slovakia does not face particular air quality problems, the authorities consider climate change as one of its main priorities. Evidence shows that the Slovak Republic, notably with ERDF support, has succeeded in increasing energy efficiency and has thus uncoupled its constant economic growth from its energy demands and emissions. Predominantly for social reasons, the maximum prices of environmental services are set by the authorities significantly lower than the true cost, in particular in the water sector. This raises the question of sustainability of investments since stakeholders do not (and will not) have capacities to invest. Regarding economic development, EU funds have supported the progressive structural adjustment of Slovakia which experienced, during the period a sustained economic growth, a level higher than the EU average. But, there is no strong direct link between environmental infrastructures supported and regional development. Except for the air measure under the Industry and service OP, the environmental measures were not designed in a perspective of regional economic development or supporting the private sector. The investment and the introduction of new technologies rather led to employment savings. The economic impacts of environmental investments are mainly indirect, in the building sector or in upstream or downstream activities. Even if the ERDF has contributed to improving the basic situation of the Roma Community, this marginalised community remains an important issue in Slovakia, in particular in the field of basic environmental infrastructure.


EX-POST EVALUATION OF COHESION POLICY PROGRAMMES 2000-2006 CO-FINANCED BY THE EUROPEAN FUND FOR REGIONAL DEVELOPMENT (OBJECTIVES 1 AND 2) - WORK PACKAGE 5B: ENVIRONMENT AND CLIMATE CHANGE ADE
Regional Case study – Eastern Slovakia – October 2009 Page 1
1. Status and features of the region
1.1 The region of Eastern Slovakia
The Slovak Republic is made up of 8 self-governing regions (Nuts 3) including 47 districts and 2929 municipalities1. The OP Basic Infrastructure is a single programme covering all Objective 1 regions, except the Bratislava region which is not eligible for Objective 1. The regional case study focuses on the East Slovakia Region (Nuts 2 - Východné Slovensko), which is not a single comprehensive administrative entity, but is composed of 2 self governing regions: Presov and Kosice.
Map 1: Eastern Slovakia and the 8 self governed regions
During the 2004-2006 programming period, the Basic Infrastructure OP represented a single programme with a single national strategy for all regions and was managed at national level. Thus, most of programming and statistical data are only available at programme or national level.
1.2 Economic situation (in 2000-2004)
Both industry (33% of employment) and agriculture (6% of employment) remained important branches of production in East Slovakia. The Presov and Kosice regions are average-industrialised areas with a considerably high-share of the processing industry (food and drink production, machine and electric machinery, mineral, metal, paper and wood production). Industrial companies concentrate their production capacities in urban areas (district capitals) whereas agriculture prevails in the countryside.
1 2029 municipalities : 416 (14%) with less than 2000 inhabitants and 2513 (86%) with less than 2000 inhabitants
East Slovakia

EX-POST EVALUATION OF COHESION POLICY PROGRAMMES 2000-2006 CO-FINANCED BY THE EUROPEAN FUND FOR REGIONAL DEVELOPMENT (OBJECTIVES 1 AND 2) - WORK PACKAGE 5B: ENVIRONMENT AND CLIMATE CHANGE ADE
Regional Case study – Eastern Slovakia – October 2009 Page 2
Nevertheless, the main characteristics of the economies of the Presov and Kosice regions at the beginning of period were to lag behind in terms of economic development with a very low GDP per capita compared to the EU average (36% in 2000) and also compared to the national level of 47.6% in 2000. Concerning the rest of Slovakia, the eastern regions benefited from the flow of foreign investments into the industry (Investment represents 26 to 30% of GDP between 2000 and 2006). The region had an abundant and skilled labour force, and relatively low costs to investments. Labour productivity (GDP per employed in PPS) in East Slovakia was about 87% of the national average. The ageing of the rural population and the very low level of employment in certain large communities in the eastern part of Slovakia, such as the Roma community, can explain the paradox of having a GDP per capita below the national average, while productivity (GDP/employed) is close to the national average. However, the weaker competitiveness of the Slovak economy is also related to the level of R&D expenditure which dropped in 2000 to 10% of the 1989 level. In East Slovakia, R&D spending represents only about 0.3% of GDP, which is half of the national average (0.6%) and far below the EU average (1.9%). In contrast to the western part of Slovakia, eastern regions suffered due to their relative isolation, being far away from the decision-making centres and a lack of a competitive transport infrastructure. The most forward-looking part of the Slovak service sector is tourism. The vast majority of foreign visitors (91%) came from former Eastern Block neighbouring countries. The rich and varied nature in East Slovakia is preserved in several national parks. Indeed, the region is a popular area for recreation and tourism, notably with the Tatras mountain chain (with the peak of Gerlach – 2665m) in the north of the Presov mountains and woods, lakes, caves and thermal springs in the Kosice region. Tourism turned out to be a new branch of business in 2002. Generally speaking, the private sector doesn’t suffer from a lack of, or inadequate, environmental infrastructures in eastern Slovakia,
1.3 Environmental situation (in 2000)
In terms of the environmental infrastructure and situation, East Slovakia encountered the same problems and challenges as the other parts of Slovak Republic, but in an acuter way because of the lower level of development and its geographical characteristics (isolation, broken relief in the north, the richness of its biodiversity the, poorest rural areas, the importance of the Roma community, etc.). Most environmental data are not available at regional level. In terms of environmental infrastructure, water supply and wastewater treatment certainly remained the most important challenge for the Slovak Republic in 2003. Even if significant investments had already been made in the 1990’s and the beginning of the 21st century, notably with ISPA funds support, in 2003 the Objective 1 area remained far below the target levels set by the European Directive for Water, in particular in East Slovakia which consists of many isolated villages and small cities.

EX-POST EVALUATION OF COHESION POLICY PROGRAMMES 2000-2006 CO-FINANCED BY THE EUROPEAN FUND FOR REGIONAL DEVELOPMENT (OBJECTIVES 1 AND 2) - WORK PACKAGE 5B: ENVIRONMENT AND CLIMATE CHANGE ADE
Regional Case study – Eastern Slovakia – October 2009 Page 3
In Slovakia, the share of the population connected to the public water supply was 83.9% in 2001, with a significant gap between urban and rural areas. An important aspect is the provision of drinking water to the population in areas where public waterworks are still absent and the population is supplied by individual water resources (wells). In most cases, the water from these resources does not meet the quality requirements stipulated by the Drinking Water Directive and it may be responsible for hygiene and health problems. The main challenges were: to increase the number of households connected to public water pipelines; to improve the technical conditions in the drinking water distribution network to avoid
high losses in the water supply. In 2001 there were 503 municipalities in the Slovak Republic (i.e. 17.4% of the total number of municipalities) with completed sewerage networks while only 389 municipalities (i.e. 13.5% of the total number of municipalities) had their wastewaters also fed to WWTPs. On the other hand, there is a difference between the population supply provision to the public water supply networks (83.4% of the total population in 2001) and the low rate of the population connected to the sewerage network system (55.2 % of the total population) and to the WWTP. Therefore the main challenges in this field in 2004-2006 concerned: improving the unsatisfactorily level of wastewater treatment and the low rate of
connection of the population to sewerage systems (especially in major agglomerations where some WWTPs were overloaded);
the expansion and intensification of WWTPs for agglomerations within the range from 2000 to 10,000 population equivalent (p.e.) and provide the technology for tertiary cleaning in urban wastewater agglomerations above 10,000 p.e.
Municipalities are fully responsible for water supply and wastewater treatment. Most of the municipalities settle agreements with water agencies. In Slovakia, and particularly in the Eastern region, flood prevention is also an important issue and is closely linked with water quality and water infrastructure in order to protect riverbanks and prevent illegal housing in the zones which are easily flooded. As regards solid waste, municipal waste generation (254 kg/capita in 2000) remained below that of most of European countries. The increase in waste generation by 0.5 million tons in 2001 compared to 1993, was caused by growth in gross domestic product and increased living standards, as well as a better quality of waste generation monitoring. During this time period, the great majority of municipal waste was disposed of through landfills. Indeed, about 93% of municipal waste was incinerated or landfilled in 2000.

EX-POST EVALUATION OF COHESION POLICY PROGRAMMES 2000-2006 CO-FINANCED BY THE EUROPEAN FUND FOR REGIONAL DEVELOPMENT (OBJECTIVES 1 AND 2) - WORK PACKAGE 5B: ENVIRONMENT AND CLIMATE CHANGE ADE
Regional Case study – Eastern Slovakia – October 2009 Page 4
There were two main challenges in the field of solid waste management, aiming to achieve compliance with European directives on waste and the landfills: Increasing the volume of separated and recycled waste materials and involving the
population in the system of separating urban waste collection; the safe closing of waste landfills upon expiry of their useful life and subsequent re-
cultivation of the landfill. Eastern Slovakia did not face a particular problem in the areas of soil quality or health. In terms of air/climate change and renewable energies, the key issues were to aim at improving air quality in urban and industrial areas, decreasing the energy demands of the Slovak economy and achieving changes in the fuel base aimed at more frequent use of environmentally favourable fuels and renewable energy sources. Indeed, energy efficiency was low due to outdated technologies and the share of renewable energy remained low (2.8% in primary energy consumption in 2000). GHG emissions were not an issue is 2000 since the Slovak Republic mainly uses gas, with the exception of the steel industry in Kosice. The polluter-payers principle is fully applied. Fines and penalties for polluters feed an environmental fund managed by the Ministry of the Environment at national level to support environmental projects. Finally, the Roma community is an important issue in East Slovakia, notably for environmental infrastructure.
The Roma community issue in Slovakia
An estimated 500,000 Roma (representing 10% of population) live in Slovakia, concentrated mainly in the east and south of the country. Most of them live in rudimentary settlements located on the border or outside towns and villages, with limited or no water or electricity supplies, sanitation systems, paved roads or other basic infrastructure. The Roma population suffer from high rates of poverty, unemployment, illiteracy and disease. Unemployment among the Roma is estimated at 80-90 %, and in settlements it can reach almost 100 per cent. The problem has been caused by the refusal of an important part of the Roma community to enter into the system (education, employment, legal procedures, territory planning, waste collection, etc.), despite the inclusion policies carried out over several years by the Slovak Authorities, with particular support from the Structural Funds (special actions and higher intervention rates). These communities, whose population could be higher than the population of the village, were generally insolvent and installed on illegal plots which were neither intended nor equipped for housing. This causes significant difficulties for the planning and the financing of the environmental infrastructures and services.

EX-POST EVALUATION OF COHESION POLICY PROGRAMMES 2000-2006 CO-FINANCED BY THE EUROPEAN FUND FOR REGIONAL DEVELOPMENT (OBJECTIVES 1 AND 2) - WORK PACKAGE 5B: ENVIRONMENT AND CLIMATE CHANGE ADE
Regional Case study – Eastern Slovakia – October 2009 Page 5
1.4 Institutional set up and policy making process
1.4.1 Regional development
In 2000, the Slovak Republic was a highly centralised country. The regional government had no clear competencies to lead their own economic development and environmental policies (Regional governments are mostly competent for matters such as social services, education, health or culture). The objectives of the Basic Infrastructure OP were derived from the objectives and priorities of National Development Plan. In 2002 – 2003, the preparation of this National Plan was undertaken following a bottom-up approach in which regional governments were involved in order to coordinate the identification of the needs at the territorial level. But the state authorities who include Ministries, their 8 regional and 46 district offices, remained competent for decisions on the main economic and environmental issues and strategies. The strategy was set up at national level and didn’t include regional specificities. Sectoral action plans are then derived from the national strategy on the level of the regional and district offices and municipalities. The local authorities were mainly in charge of implementation.
1.4.2 Environmental sector
The environmental policy is made by state authorities. Regional governments have no competencies on policy making in the field of the environment. Municipalities are fully responsible for urban development plans, including water and waste plans. In terms of water management, the State Water Authorities include the Ministry of the Environment (MoE), eight regional environmental offices, 46 district environmental offices, Slovak Environmental Inspection and municipalities. The regional and district offices depend directly on the national Ministry of the Environment. The work of the state administration bodies includes mainly decision-making, control and supervisory activity in line with legislation. The MoE is a central body of the state administration responsible for the environment and environmental protection, including water management, protection of water quality and quantity and its reasonable use, and flood protection. The Regional and District Environmental Offices issue all forms of permits relating to water management. Water companies manage water infrastructures on behalf of most municipalities, which own these infrastructures. The maximum price for water is fixed by the national government. Mainly for social reasons, this maximum price is fixed (around 1€/m3)2 far below the true price of water provision and treatment. None of the 17 main water agencies is profitable. Revenue does not even manage to cover a significant part of operational costs. Under these conditions, the private sector is almost excluded from water management in Slovakia.
2 In comparison to about 2.5 to €3.5 /m3 in Germany, Denmark or Belgium for instance.

EX-POST EVALUATION OF COHESION POLICY PROGRAMMES 2000-2006 CO-FINANCED BY THE EUROPEAN FUND FOR REGIONAL DEVELOPMENT (OBJECTIVES 1 AND 2) - WORK PACKAGE 5B: ENVIRONMENT AND CLIMATE CHANGE ADE
Regional Case study – Eastern Slovakia – October 2009 Page 6
In terms of waste management, the decision-making institutions are the Ministry of the Environment (MoE), the Department of Waste Management; eight regional environmental offices, 46 district environmental offices and municipalities. The District Environmental Office issues the majority of waste management permits, including permission for the operation of waste disposal and waste recovery facilities. The Regional Environmental Office, operating on NUTS 3 level,: i) is the primary appeal body; ii) issues permits for hazardous waste transportation exceeding district boundaries. The MoE issues permits for hazardous waste transportation exceeding Slovakian borders. Grants from the Recycling Fund and Environment Fund (both are controlled by the MoE) support technical infrastructure development of waste management in Slovakia. However, the Environment Fund only supports the solid municipal waste infrastructure in the field of waste management. As for water, municipalities are fully responsible for solid waste collection and treatment. Most of the municipalities make agreements with private companies for solid waste collect and treatment. The private sector tends to have its own landfills and will be responsible for properly closing their own landfills at their own cost. Municipalities are in charge of collecting revenue for waste management, which often needs to be completed by the municipal budget. Air and GHG emissions are a state responsibility under state budget.

EX-POST EVALUATION OF COHESION POLICY PROGRAMMES 2000-2006 CO-FINANCED BY THE EUROPEAN FUND FOR REGIONAL DEVELOPMENT (OBJECTIVES 1 AND 2) - WORK PACKAGE 5B: ENVIRONMENT AND CLIMATE CHANGE ADE
Regional Case study – Eastern Slovakia – October 2009 Page 7
2. Regional policies and the role of the ERDF
2.1 Economic policies
There is no clearly defined regional strategy. The National Development Plan (NDP), from which the EC framework (CSF) support was derived, determines the main orientations of development and priorities to be supported by Structural Funds in the 2004-2006 period. The NDP identifies the emergence of growth poles and the balancing of regional development as specific objectives in order to remove or reduce regional disparities. The strategy was translated into different Sectoral OPs (Basic Infrastructure, Industry and Services, Human Resources, Agriculture and Rural Development). These OPs are instruments for supporting the national strategy. In terms of economic policy, the sectors of industry, energy, tourism, and particular services were expected to become the leading fields of growth of Slovakia. The main objectives for those sectors were : supporting the development of industrial production, trade and services, including
related infrastructure (investment in production, extension and modernisation of existing industrial sectors);
providing a linkage between the R&D results, knowledge potential and needs of businesses;
improving the efficiency and effectiveness of the acquisition, conversion and use of energy sources and orientation towards energy savings, reducing energy costs and use of renewable energy sources;
utilising the natural, cultural and historical potential and tourism capacities for development of tourism and balneology. Including “green” tourism and related activities.
In addition, the global objective for Basic Infrastructure OP was to support balanced regional development by increasing the competitiveness of regions in three fields of intervention: Modernisation and development of transport infrastructure with a focus on
improvement of region accessibility; Improvement in the state of environmental infrastructure for ensuring the health of
inhabitants and preservation of the natural environment. Construction and development of local civil infrastructures (education, health, social services
and culture).

EX-POST EVALUATION OF COHESION POLICY PROGRAMMES 2000-2006 CO-FINANCED BY THE EUROPEAN FUND FOR REGIONAL DEVELOPMENT (OBJECTIVES 1 AND 2) - WORK PACKAGE 5B: ENVIRONMENT AND CLIMATE CHANGE ADE
Regional Case study – Eastern Slovakia – October 2009 Page 8
2.2 Environmental policies
Environmental policies in Slovakia were defined at national level in the National Development Plan. By definition, any priority, action or individual project must be in full compliance with European orientation and directives. The environmental strategy and priorities were mainly driven to achieve EU directive requirements. According to the strategy, the environmental priorities of the country were established mainly on 3 fields: An adequate supply of drinking water and reduction of water pollution to
acceptable levels thanks to the completion of technical infrastructure (the water/wastewater network and the sewage treatment plants) to ensure the protection of water from contamination. The main challenges are : - increasing the number of households connected to public water pipelines that meet the quality
requirements; - improving technical conditions in the drinking water distribution network to avoid losses in the
water supply; - improving the level of wastewater treatment and low rate of connection of the population to sewerage
systems. Proper disposal or utilisation of waste and minimising its production, through:
- development of waste collection systems and construction of equipment for processing different types of waste;
- closure of operating dumps with special conditions, reconstruction of old dumps, and construction of missing landfills for solid municipal waste.
Global environmental security and protection of the atmosphere against pollutants.
Support measures include: - air protection based on emission limits, the best available technologies, and charges for pollution; - harmonisation of requirements for refuse incineration with EU requirements; - completion of the air quality monitoring system of the Slovak Republic in light of EU
requirements; - introduction of emission quotas; - enforcing maximum utilisation of renewable energy sources in the regions.
From these national priorities, urban development and sectoral action plans were elaborated at regional, district and municipal levels by the Ministry of the Environment local offices and municipalities which were in charge of the implementation of the strategy. Environmental measures have been defined mainly for improving the health and quality of life for inhabitants as well as preserving the natural environment, rather than in an economic development perspective. The policy focused on both setting-up new infrastructures and upgrading/extending old infrastructures.

EX-POST EVALUATION OF COHESION POLICY PROGRAMMES 2000-2006 CO-FINANCED BY THE EUROPEAN FUND FOR REGIONAL DEVELOPMENT (OBJECTIVES 1 AND 2) - WORK PACKAGE 5B: ENVIRONMENT AND CLIMATE CHANGE ADE
Regional Case study – Eastern Slovakia – October 2009 Page 9
2.3 Actions taken
2.3.1 Environmental expenditures and the main sources of funds
Table 1: Estimate of the overall investments in environmental infrastructures during the 2000-2006 period in Slovakia
Comment: Total environnmental infrastructure includes air and noise infrastructure. Regional data are not available. Sources: IT Monitoring System (ITMS) of the Ministry of Construction and Regional Development of the SR, 30.11.2008, Eurostat, IDSPA reports, Ex post evaluation 2000-06: regional expenditure study, EBRD and EIB websites, www.phare.vlada.gov.sk, State on Environment Reports 2005, 2006.
During the 2000-2006 period, ISPA funds (2000-2003 – 4 projects - €53 million), the ERDF (88 projects for €82 million) and Cohesion funds (2004-2006 – 6 projects for €384 million) jointly covered almost the same fields of intervention to support environmental infrastructure in Slovakia (the quality and supply of drinking water, collection and treatment of water, collection and management of solid waste, reduction of pollution and energy efficiency). European support (the ISPA, the ERDF and Cohesion funds) has played a major role in environmental investment. Its contribution is estimated at 38% of total environmental infrastructure investments for the period 2000-2006 and 66% of public spending, while the ERDF contribution is estimated at only 5 % of total investments. The Cohesion Fund has played a major role in supporting large scale projects (> €10 million), whilst the ERDF was mainly used for smaller projects, including projects carried by local bodies (municipalities of more than 2000 inhabitants, water agencies, semi-private companies, …). The European Investment Bank (EIB) invested €42.4 million between 2000-2006 in 2 environmental infrastructures located in Objective 2 Bratislava region. Total investments in environmental infrastructure by the Slovakian public sector are estimated at €279 million for the period 2000-2006. These investments include the ERDF national counterpart (€28.2 million), subsidies from the Slovakian Environment Fund (€116.3 million), which is a state budgetary organisation under the MoE, supporting the following environmental activities: Protection and rational use of water; development of waste management; support for the solution to environmental problems, removal of environmental accidents or exceptional pollution/degradation of water; environmental education and promotion.
Sources of investments (in mio €; 2000-2006)
Total environmental investments by
the public sector
National counterpart to
ERDF environmental investments (2004-06)
ERDF environmental investments (2004-06)
ISPA investments in environmental
projects (2000-03)
Cohesion Fund total
commitments in environmental infrastructure
projects (2004-06)
EBRD investments in environmental infrastructure
Environmental projects
financed by EIB
Total environmental investments by
industry (2002-05)
Environmental infrastructure n.a. 0.0 0.0 0.0 n.a. 0.0 n.a. n.a.Urban and industrial waste n.a. 12.7 27.8 0.0 n.a. 0.0 n.a. 23.1Drinking water n.a. 5.1 17.8 41.4 n.a. 0.0 n.a. n.a.Sewerage and purification n.a. 10.3 35.4 111.4 n.a. 0.0 n.a. 91.5Total 250.8 28.2 81.0 152.8 384.4 0.0 42.4 664.2

EX-POST EVALUATION OF COHESION POLICY PROGRAMMES 2000-2006 CO-FINANCED BY THE EUROPEAN FUND FOR REGIONAL DEVELOPMENT (OBJECTIVES 1 AND 2) - WORK PACKAGE 5B: ENVIRONMENT AND CLIMATE CHANGE ADE
Regional Case study – Eastern Slovakia – October 2009 Page 10
The contribution of the private sector was considerable, while total environmental investments made by Slovak industries are estimated at €664.2 million for the period 2002-2005, including €23.1 million for urban and industrial waste and €91.5 million for sewerage and purification. The water supply sector, wastewater networks, including WWTP’s are publicly owned and only two of the Water Management Companies are in partnership with private stakeholders, because the sector is not profitable. The private sector is particularly present in the municipal waste management sector where private companies hold 46% of the household waste treatment and 60% of the waste collecting market. To give an idea, public support for environmental investments (including 30% national and 70% of European funds) represented, on average, during the period about 0.5% of GDP and 2.1% of Gross Fixed Capital Formation, which is significant. These figures can be doubled if private sector environmental investments are added.
2.3.2 ERDF contribution to environmental expenditures in the region
Table 2: Environmental measures – Contracted ERDF and Slovak funds 2004-2008*
Region Prešov Košice Eastern Slovakia Total Objectif 1 % East in Obj.1 Measure No. of
proj. Amount
(€m) No. of proj.
Amount (€m)
No. of proj.
Amount (€m)
% in env. priority
No. of proj.
Amount (€m)
% in env. priority
2.1. Water 16 14.0 12 11.9 28 25.9 53% 74 67.2 45% 39%
2.2. Air 9 10.5 3 5.8 12 16.3 34% 35 39.6 27% 41%
2.3. Waste 2 0.6 3 3.3 5 4.0 8% 63 33.9 23% 12%
2.4 Protection 8 1.9 4 0.5 12 2.4 5% 26 8.1 5% 30%
Total env. OP Basic infrastructure
35 27.0 22 21.6 57 48.6 100% 198 148.8 100% 33%
1.4 Energy OP Industry & services*
7 3.3 6 0.9 13 4.2 - 41 20.0 - 21%
(*) 2006 fort OP Industry & services. Sources : BIOP annual report 2008 and OP Industry & Services annual report 2006. Environmental measures accounted for approximately 17% of the total public expenditure carried out in the framework of the ERDF OP Basic infrastructures and OP Industry & Services in Eastern Slovakia. This has mainly supported hard investment expenditures (estimated to be at least 90% of expenditures), mainly in the fields of wastewater management and energy efficiency or renewable energies.

EX-POST EVALUATION OF COHESION POLICY PROGRAMMES 2000-2006 CO-FINANCED BY THE EUROPEAN FUND FOR REGIONAL DEVELOPMENT (OBJECTIVES 1 AND 2) - WORK PACKAGE 5B: ENVIRONMENT AND CLIMATE CHANGE ADE
Regional Case study – Eastern Slovakia – October 2009 Page 11
Table 3: Main output and result indicators (results 31/12/2008)
Fiel
ds
N° Indicator name Baseline
value (2003)
Target Achieved value Obj.1
Achieved
value Kosice
Achieved value Presov
Wat
er
1 Number of projects in water supply 14 74 12 16
2 Number of projects in wastewater 39
16 Length of new water networks (km) 24,168 +1,800 +154 26 25
13
Number of households connected to drinking water supply Newly connected to new network
1,738,000 1,765,000
1,749,924
22,999
1594
3743
5 % of the population served by water supply projects 84.0% n.a. 86.3% - -
15 Length of new sewerage networks (km) - 800 186 41 43
14 Number of population equivalents connected to new sewerage networks and WWTPs - 10,425 28,838 5,551 2,711
8 % of population receiving total wastewater treatment 56.5% n.a. 57.1% - -
20 Number of flood measures implemented 0 n.a 22 1 5
Was
te 3 Number of projects in municipal solid waste n.a. 63 3 2
10 Number of unauthorised landfills closed/ rehabilitated n.a. 31 0 2
12 Number of newly built or upgraded waste separation facilities and waste recovery facilities 55 116 2 33
18 Separated and recovered waste (1000 tons/year) 1,100 300 61 56
Air 17
Number of new facilities with installed with installed or upgraded technologies decreasing air pollution 8 237 6 21
19 Decreasing of pollutant and GHG emissions from year 2004 at the level of accepted projects -5% -29,6% -81.4% -19.6%
Prot
ectio
n
17 Number of newly built or reconstructed facilities for the nature and landscape purposes 27 53 4 30
19
% of protected areas with elaborated and/ or achieved management plans 29% 50%
Sources : Objective 1 annual report. Indeed, projects in water infrastructure accounted for 53% of the contracted environmental amounts of the Basic Infrastructure OP for the eastern region. The focus was mainly placed on the sewerage network and water treatment facilities which both represented more than 80% of the expenditures in the field of water, against 15% for drinking water network and less than 5% for the flood protection infrastructures. This aimed to contribute to filling the gap between connections to the water supply network and the sewerage network. The levels obtained in terms of the length of new pipes were somewhat lower than the initial objectives (9% reached in drinking water and 23% in the sewerage network). One of the main explanations is the undervaluation of building costs at the beginning and the severe increase in those during the programming period (an increase of raw material and labour costs). On the other hand, the target values in terms of connections were almost achieved in terms of drinking water, and largely exceeded in terms of sewerage. However, the target value for the number of population equivalents connected to the new sewerage networks and WWTPs (10,450 inhabitant equivalents) appears quite low considering both the amounts

EX-POST EVALUATION OF COHESION POLICY PROGRAMMES 2000-2006 CO-FINANCED BY THE EUROPEAN FUND FOR REGIONAL DEVELOPMENT (OBJECTIVES 1 AND 2) - WORK PACKAGE 5B: ENVIRONMENT AND CLIMATE CHANGE ADE
Regional Case study – Eastern Slovakia – October 2009 Page 12
dedicated to the water treatment facilities3 and the fact that the measure was only accessible to the 14% of municipalities of more than 2000 inhabitants. Among the 28 projects supported in the field of water in Eastern Slovakia, the following two cases illustrate the types of projects implemented. Case 1 : Development and improvement of the drinking and sewage water infrastructure in the TatraRegion The aim of the project was to construct new water sources and extend of existing ones and related facilities in order to fulfil the requirements of the Water Directive. The whole project consisted of two completely different water management facilities: finalising cluster water supply in 8 towns and the sewerage network and WWTP in 3 municipalities. The project was supported by the ERDF (75%), the state budget (20%) and the water agency (5%). A prior agreement had distributed the programme budget between the water agencies, which contributed to a more rational use of the budget. With the available budget being largely under the needs, the approach was pragmatic, focussing on the most urgent situation with criteria such as the critical black points of the network, a touristic village with rafting activities, improving the water supply to schools, new satellite residential areas etc. In order to face the problem of low connection rates, the water agency has itself financed the costs of connection between the houses to the pipe. This is not a usual practice, but it is the efficiency condition to ensure new revenues. It is usually financially more efficient to build new infrastructure than reconstruction. The main impact was the improvement of hygienic problems (the private wells became less sure when population and activity increase) and the standard of living (dishwashers and washing machines, etc.). Impacts on economic development are indirect: supporting of the building sector, allowing the extension of residential areas, consolidating touristic activities such as rafting. Case 2 : Wastewater Treatment Plant and sewage network infrastructure – 2nd phase The municipality of Krasnohorske Podhardies has 2500 inhabitants, of which the Roma community represents half of the population, living in a rudimentary illegal settlement on the edge of the municipality. The medieval castle in the village is a tourist attraction. The municipality manages its water equipment on its own and is not associated with a water agency. The first phase was financed in 1991 on its own (ISPA funds did not allow local entities such as a municipality to apply). This first phase included a WWTP for 1250 equivalent inhabitants, 30% of the network and a truck to collect wastewater. In the second phase, the ERDF allowed the duplication of the WWTP and the finishing of the last 70% of the water network. The contribution of the municipality was limited to 5% of the project, which accelerated the completion of water investment and allowed for the free provision of basic services to the Roma community without creating tension within the population. The cost for the final connection work was also financed by the municipalities to ensure a higher connection rate. This project has contributed to consolidating the touristic attractiveness of the municipality and the quality of life (avoiding smelt). The price of real estate increased more than in other areas for equipped plots (+40%). Projects related to air and energy accounted for 34% of the allocations of the environmental measure supported by Basic Infrastructure OP. The measure objective wasto reduce the emissions of air pollutants, including GHGs, by supporting the use of more environmentally favourable energy resources, the more intensive use of renewable energy and more efficient use of non-renewable energy resources.
3 This corresponds to more than €5.000 per newly connected equivalent inhabitant.

EX-POST EVALUATION OF COHESION POLICY PROGRAMMES 2000-2006 CO-FINANCED BY THE EUROPEAN FUND FOR REGIONAL DEVELOPMENT (OBJECTIVES 1 AND 2) - WORK PACKAGE 5B: ENVIRONMENT AND CLIMATE CHANGE ADE
Regional Case study – Eastern Slovakia – October 2009 Page 13
But ERDF intervention in this field was made through two measures: In the Basic Infrastructure OP, the measure accounted for 27% (€40 million) of the
environmental priority (34% for East Slovakia). The projects supported focused mainly on changing the coal or fuel base of energy sources, with the promotion of low-emissions and renewable resources. This relates in particular to the town collective heating and water heating infrastructures and the promotion of abundant wood resources.
In the industry & services OP, the measure (€20 million) was oriented towards the private sector. Projects aimed to achieve significant energy savings and increase the share of renewable energy sources in the private sector to tend towards the EU average in terms of energy consumption in the manufacturing process.
The indicator on the Number of installations with installed or modernised technologies that reduce air emissions was adopted because of its good measurability. When defining the indicator value, the indicative list of projects was taken as a basis, containing mainly large, capital-intensive projects with a regional impact on air quality. Therefore, the value of eight implemented facilities was defined. In reality, the interest to submit large investment projects was not as high as expected and as a result, several smaller and less expensive projects were approved. That is the reason why a higher number of projects were supported and why the indicator was several times exceeded. Case 3 : Improvement and development of the infrastructure for the protection of air. The aim of the project iwas the utilisation of renewable energy sources – wood chips - to produce heat and heated water for the city as well as for industrial purposes. The former local coal power station for electricity and collective heating was bought-out in 2005 by a private company. More than half of the 22,000 inhabitants are connected to this collective heating system. The improvement in energy effectiveness was a condition of continuing production and fulfilling the 2012 directive requirements. The objective was to reduce CO2 emissions by using abundant local wood resources rather than increasing dependency by importing coal. This has allowed for increasing energy effectiveness by 5% (from 80 to 85%). In terms of impact, modernisation has reduced employment in the power station. However, the use of wood chips has increased employment in the local wood sub-sector for preparation and transport of biomass. Moreover, it allows the valorisation of the residual parts of trees. Finally, GHG emission and solid small part spreading has significantly decreased, improving health conditions. Projects related to solid waste management accounted for only 8%4 of the total allocation of the OP in environmental infrastructure in Eastern Slovakia. The measure focused on both supporting investment for further development of waste separation or recovery facilities and the safe closure and remediation of landfills which did not fulfil current standards. In Eastern Slovakia, authorities focused mainly on the development of separation and recovery facilities (35 in the east on 116 new or upgraded facilities supported by Objective1) rather than landfill closure (2 in the east on 61 closures supported by Objective1). At the level of the Objective 1 Programme, the number of newly built or upgraded waste separation and recovery facilities supported (116) represents twice the forecasted value (55). Regarding the quantity of separated and recovered waste, the target value (1.1 million tons) was too optimistic and set without previous experience. Moreover, several projects have not yet been completed and a higher amount of separated and recovered waste is expected at the end of the implementation period.
4 This contrasts with the average of 23% for all Objective 1 areas. This was explained in particular by a lower number
of proper landfill closure projects in Eastern region.

EX-POST EVALUATION OF COHESION POLICY PROGRAMMES 2000-2006 CO-FINANCED BY THE EUROPEAN FUND FOR REGIONAL DEVELOPMENT (OBJECTIVES 1 AND 2) - WORK PACKAGE 5B: ENVIRONMENT AND CLIMATE CHANGE ADE
Regional Case study – Eastern Slovakia – October 2009 Page 14
Case 4 : Improvement of the waste management infrastructure - landfill closureThe aim of the project was land remediation following the closure of the old municipal landfill opened in 1992 and which operated under special approval of the Regional Environment Authority. The aim was to ensure a closure respecting all environmental requirements. This followed the opening in 2000 of a new district landfill fulfilling the necessary standards. This new infrastructure is owned and operated by a private company with licence for its use until 2026. At this time, the cost of closing this new landfill will be fully financed by this private company. Collecting fees represent two thirds of the cost of waste management. The last third is supported by the municipal budget. The sorting of waste started in 1992 with glass recycling. In this case of landfill closing, there is no economic or employment impact. The new discharge employs 25 workers (maintained employment). The only measure to decrease waste volume is the provision of sorting facilities for the population. Constraining measures (such as a tax per kilo, compulsory prepaid bags, etc.) would be counterproductive in a city with many apartment buildings. Case 5 : New plant for processing used tyres and rubber in Kechnec industrial park VODS, among others, was a unique company in the recovery of Slovakian used tyres and rubber products. The aim of the project was to build a new modern facility including the delivery of technology. The second stage consisted of building a new unit for rubber granulate revalorisation as a building material for sport surfaces and safe playgrounds. The project was 35% co-financed by the ERDF. The revenues came either from direct agreement with the producers or importers of tyres or via the recycling fund, notably supplied with the producers and importers who do not have such agreement. This new unit employs 45 people, in addition to the jobs created downstream in transport and logistics in the collection of tyres. However, the market of the revalorised products is starting to face a bottleneck due to, firstly, the economic crisis (less demand) and secondly, an increasing number of European competitors (higher supply for limited possibility of use).

EX-POST EVALUATION OF COHESION POLICY PROGRAMMES 2000-2006 CO-FINANCED BY THE EUROPEAN FUND FOR REGIONAL DEVELOPMENT (OBJECTIVES 1 AND 2) - WORK PACKAGE 5B: ENVIRONMENT AND CLIMATE CHANGE ADE
Regional Case study – Eastern Slovakia – October 2009 Page 15
3. Analysis of the ERDF contribution
3.1 Relevance of the 2000-2006 ERDF strategy in the environmental sector for enhancing territorial development
The Basic Infrastructure OP aimed to contribute to the process of structural adjustment of the Slovak Republic. Complementary to the other European instruments (CF, ISPA), it aimed at equipping the country with the basic transport, environmental and local infrastructures. The strategy was mainly driven to comply with the related EU Directive requirements and offer basic equipment to the population. Except for the energy measure of the Industry & Services OP, the strategy in the field of environmental infrastructure did not aim to support regional economic development. Environmental measures accounted for 17% of both Basic Infrastructure OP and Industry and services OP. The objectives were clear and quantified with precise detailed local action plans identifying each potential individual project. However, the target values were not always in coherence with the available budget (output indicator) and there was an articulation deficit between results and output targets. This is explained in particular by the preliminary lack of experience in determining quantified objectives by the authorities. In addition, the output target value terms were mainly based on the list of identified potential projects. The objectives and priorities were mainly relevant with regard to national stakes and coherent with national plans. Nevertheless, Slovakia considers climate change as one of its main environmental priorities along with water infrastructures. Nevertheless, Slovakia did not experience major problems in air quality or emissions. However, firstly, this approach offered a vision of a sum of small priority local projects, but not a sufficient strategic vision at the district, regional or basin levels. Secondly, the operational programme focused mainly on achieving hard infrastructures and equipment rather than soft actions or provisions to ensure results and impacts of these investments once achieved (i.e. : actions to ensure that all households beside new water pipes will be effectively connected after investment, growing awareness and demonstrative actions to reduce waste per capita, development of the downstream sector in recycling, incentives and demonstrations to use renewable energy, etc.).
3.2 Quality of the planning and Implementation process at meeting regional challenges in the covered fields
The Ministry of the Environment (MoE) was fully responsible for the implementation of measures under the environmental priority of the BIOP and coordinated all interventions, with the support of its regional and district offices. The environmental policy is made by state authorities at national level. Action plans which aimed to pre-identify local priority projects were established by regional and district offices of the MoE. Regional governments had no competencies on policy making in the field of the environment5. 5 Note that for the new 2007-2013 period, the regional governments are in charge of monitoring the OP.

EX-POST EVALUATION OF COHESION POLICY PROGRAMMES 2000-2006 CO-FINANCED BY THE EUROPEAN FUND FOR REGIONAL DEVELOPMENT (OBJECTIVES 1 AND 2) - WORK PACKAGE 5B: ENVIRONMENT AND CLIMATE CHANGE ADE
Regional Case study – Eastern Slovakia – October 2009 Page 16
Most of the obligations, competencies and responsibilities for urban development plan are on the local authorities, including waste, water and heating plans. In 2001-2002, the authorities organised special training for more than 400 civil servants on how to use ERDF funds. The bottom-up approach to elaborate on the action plan and this training has deeply contributed to the early starting and success of the programme. Project selection starts by call of proposal published by the MoE. In the application, the applicant must include evidence of district and regional office approval testifying that the project was fully in accordance with the local action plan before submitting it at national level. The proposal is checked by an employee of the MoE and evaluated by an independent expert. On the basis of the expert evaluation, the selection commission of the MoE decides to reject or accept the proposal. The accepted proposal is placed on a reserve (in the “pipeline”) and will be contracted when a budget is available. Projects above €10 million are priority financed by Cohesion Funds. This precise organisation resulted in a positive start of the programme which began in 2004 and ensured that the implementation corresponded exactly to what was expected. Nevertheless, certain stakeholders were critical, pointing to the long delays in the procedure and the lack of transparency in the communication in the accepted or rejected motivations. This is also explained by the last step of the procedure since an accepted project can remain in the “pipeline of accepted projects” over a certain time, or may never be financed even if originally accepted. The contract will mainly depend on the budget availability of the measure and the national counterpart, and not especially on its quality or on its entry date. The very low levels of physical attainment of certain measures such as in the field of water raises the question of efficiency. The selection procedure does not include real cost-benefit analysis or criteria.
3.3 Contribution of the ERDF to improving the environmental situation (2000-2006 and beyond)
The ERDF operational programmes started in Slovakia with the adhesion in 2004 and mostly focus on primarily projects of basic infrastructure. The environmental priority represented 25% of the Basic Infrastructure OP. However, the precise contribution of the ERDF remains difficult to apprehend. Firstly, the programme only began in 2004 and has mainly supported infrastructure projects which require delays to be fully implemented. Secondly, if European funds were one of the main supports for investments in the field of the environment, the contribution of the ERDF has remained limited compared to the major contributions of the Cohesion Funds or the ISPA. Indeed, during the 2000-2006 period, the ERDF has accounted for 11% of public expenditures (national +European) in environmental infrastructure and 20% of European support (ERDF, ISPA and Cohesion funds).
In terms of water supply and wastewater collection and treatment
During the period, water investment was the main field of intervention and mobilised about half of the budget dedicated to the OP environmental priority (45% at the programme level, 53% in Eastern Slovakia). The main Basic Infrastructure OP objectives in terms of water were to increase the population’s connection to sewerage networks and WWTPs, to

EX-POST EVALUATION OF COHESION POLICY PROGRAMMES 2000-2006 CO-FINANCED BY THE EUROPEAN FUND FOR REGIONAL DEVELOPMENT (OBJECTIVES 1 AND 2) - WORK PACKAGE 5B: ENVIRONMENT AND CLIMATE CHANGE ADE
Regional Case study – Eastern Slovakia – October 2009 Page 17
improve the quality of drinking water and to take measures to prevent or eliminate the negative impacts of flood. During this period, priority was placed on sewerage and wastewater treatment (in agglomerations over 2 000 inhabitants) due to the existing difference between the population supply provision to the public water supply networks (82.9% of total population in 2000) and the low rate of the population receiving wastewater treatment (50.5 % of total population in 2000). In this respect, progress was observed between 2000 and 2007, since the share of the population connected to the public sewerage system increased from 55% to 58% and the share receiving wastewater treatment increased from 50% to 57%. According to monitoring data, the population equivalent connected to new sewerage networks and WWP supported by the OP is 28,838 people equivalents, which represent 0.5% of the population.
Table 4: Environmental data for Slovakia
Fiel
d Indicator Entity 2000 2001 2002 2003 2004 2005 2006 2007 % incr 2000-2007
Wat
er
Share (%) of population connected to the public water supply
SK 82.9 83.4 83.9 84 84.7 85.4 86.3 86.6 +4.5%
Share (%) of population connected to the urban wastewater collecting system
SK 55 55 55 56 56 57 57 58
Share (%) of population receiving total wastewater treatment
SK 50.5 n.a. n.a. n.a. 56.5 n.a. 57.1 +13%
Was
te
Municipal waste generation (kg/capita)
SK 254 239 283 297 274 289 301 309 +9.2%* EU27 523 521 528 516 514 517 523 522 -1.1%*
Incinerated waste (kg/capita) SK 39 25 29 30 34 34 35 33 +14%* EU27 79 82 85 85 90 96 100 104 +22%*
Landfilled waste (kg/capita) SK 196 209 222 233 222 228 234 240 +8.1%* EU27 288 279 270 256 240 222 221 213 -21%*
Share of landfilled or incinerated waste (%)
SK 92.5% - 88.7% 88.6% 93.4% 90.7% 89.4% 88.3% -0.5%* EU27 70.2% 69.3% 67.2% 66.1% 64.2% 61.5% 61.4% 60.7% -9.7%*
Packaging waste generation (kg/capita)
SK n.a. n.a. n.a. 77 69 64 56 -
Ener
gy a
nd c
limat
e ch
ange
s
Share of renewable energy in primary energy consumption (%)
SK 2.8 3.9 3.7 3.3 3.9 4.3 4.6 5.5 +96% EU25 5.8 5.9 5.8 6 6.4 6.7 7.1 7.8 +34%
Share of renewable energy in electricity consumption (%)
SK 16.9 17.9 19.2 12.4 14.4 16.7 16.6 16.6 -1.8% EU25 13.7 14.2 12.7 12.7 13.7 13.6 14.3 15.5 13.1%
Energy intensity of the economy - Inland consumption of energy divided by GDP - kgoe (kilogram of oil equivalent) per 1000 euro
SK 796 845 810 769 728 680 620 539 -32.3%
EU25 182 183 180 182 180 177 171 165 -9.3%
Industry consumption of energy divided by GDP - kgoe (kilogram of oil equivalent) per 1000 euro
SK 442 411 347 348 315 287 266 222 -49.8%
EU25 116 114 110 109 106 103 97 93 -19.8%
Urban population exposure to air pollution by particulate matter
SK 28.5 26.7 28.6 31.4 33.1 33.2 28.3 -0.7% EU27 27.8 27.7 28.3 30.6 27.4 28.8 30.0 +7.9%
Total Greenhouse Gas Emissions (in CO2 equivalent) indexed on actual base year =100
SK 67.3 69.7 68.2 69.7 69.4 68.5 67.9 0.9%
EU25 93.3 94.2 93.4 95 95.2 94.7 94.3 1.1%
Source: Statistic Office of Slovakia 2008; Eurostat, 2008, OECD, 2008. (NMS = New-member states) (*) note : Evolution 2002-2007 for waste indicators. Indeed, since 2002, the assessment of waste generation has been carried out under new legislation, harmonised with legal regulation of the EU waste management policy, and because these data were not fully comparable with data from previous years.

EX-POST EVALUATION OF COHESION POLICY PROGRAMMES 2000-2006 CO-FINANCED BY THE EUROPEAN FUND FOR REGIONAL DEVELOPMENT (OBJECTIVES 1 AND 2) - WORK PACKAGE 5B: ENVIRONMENT AND CLIMATE CHANGE ADE
Regional Case study – Eastern Slovakia – October 2009 Page 18
Projects in the field of drinking water supply were oriented into the increase of the share of the population connected to a drinking supply network, which increased from 82.9% in 2000 to 86.6% in 2007. But on the other hand, water supply to households experienced a downward trend between 2000 and 2007 despite the fact that the number of supplied inhabitants was still increasing. The authorities feared that too high costs for drinking water could lead to the construction of private sources of drinking water (wells) with a quality far below hygienic standards.
As mentioned previously, the precise contribution of the ERDF remains difficult to apprehend. In addition, the level of physical achievements mainly fell below the expected objective (9% reached in drinking waters and 23% in the sewerage network), due notably to an undervaluation of the (increase in) building costs, in particular in mountainous areas due to a lower population density.
Connection of households to the new water facilities is the major condition for the effectiveness of the investments and remains an important issue. Indeed, the cost of connection work has usually been paid by the households. They hesitate to connect in order to avoid taxes. According to stakeholders, this was not sufficiently controlled and remains a problem, in particular in the field of sewers. Even if these practices were rather exceptional, some water stakeholders tried to find solutions, such as paying for the costs of connection work themselves, asking for a preliminary commitment from all households in a street before deciding whether or not to carry out the work, or imposing connection to the sewerage system on any request of connection to drinking water.
The second main issue is the artificially low maximum price (less €1/m3) fixed by the authorities, mainly for social reasons. But this price is largely lower than the true price of water and does not even cover the operational costs of maintenance. The water agencies and municipalities do not (and will not in the long term) have the means of achieving the necessary investment levels. Moreover, they cannot use depreciation for subsidised investments. This raises the important question of durability of the supported investments. Efficiency and the cost-benefit questions of the investments are thus increasingly present in debates regarding water, in particular the case of the rural zones6.
Despite massive support from the European Union in this field in the last years, the need to reach the requirements of the water related EU directive remains. A recent study shows that the expected national and European funds in this field as far as 2015 will represent only 40% of what is required to fulfil the minimum requirements of the EU directive. In addition, it is estimated that 50% of WWTPs are not in compliance with EU directive 91.
On the one hand, the following maps locate the investments carried out between 2002 and 2008 (map 2 for the improvement in the sewerage network and WWTPs and map 4 for the development of the drinking water supply network), by, in particular, distinguishing those supported by the European funds (the ERDF, ISPA, CF) and the state of equipment of the municipalities in
6 For instance, the article “Principle of Integrated Water Resources Management in municipalities and their river basins” of the
Association of town and villages (ZMOS)(http://www.waterparadigm.org/download/Principles_IWRM_Municipalitites_River_Basins.pdf), in particular point 6 p.13 Principle of sound wastewater treatment and economic analysis of the most cost effective system of drinking water supply and WWT and sewage system. This article proposes some advice and approaches in order to open the scenarios to support the most efficient solutions per one inhabitant equivalent : use the “open wastewater planning process” (means that the designer should prepare several alternatives considering health and environmental criteria with the participation of the population to select the most appropriate alternative) to examine different types of solutions, treat waste water as close as possible to the source of pollution, minimise dilution waste water by splitting waste water and rainwater and support nutrient recycling, chains of small lakes in small villages, etc.

EX-POST EVALUATION OF COHESION POLICY PROGRAMMES 2000-2006 CO-FINANCED BY THE EUROPEAN FUND FOR REGIONAL DEVELOPMENT (OBJECTIVES 1 AND 2) - WORK PACKAGE 5B: ENVIRONMENT AND CLIMATE CHANGE ADE
Regional Case study – Eastern Slovakia – October 2009 Page 19
2008. These maps also show the importance of the number of municipalities which were still without a public sewerage network or WWTP in 2008 (the grey area in map 2) or without a drinking water network (in yellow in map 4), in particular in Eastern Slovakia. Note that the programme focused only on municipalities of more than 2000 inhabitants, the 86% of municipalities with less than 2000 inhabitants (1.5million inhabitants) were not eligible for the ERDF.
Map 2: Improvement of the sewage network and WWTPs in agglomerations between 2002-2008
1. public sewage network and new or reconstructed WWTP achieved between 2002-2008 from CF and SF MoE SR 2. new or reconstructed WWTP (for existing sewage network) achieved between 2002-2008 from CF and SF MoE SR 3. public sewage network (connected to WWTP) achieved between 2002-2008 from CF and SF MoE SR 4. public sewage network, resp. WWTP achieved between 2002-2008 from other sources then CF and SF MoE SR 5. agglomerations with public sewage network and WWTP (situation 2002) 6. agglomerations with public sewage network without WWTP (situation in 2002) 7. agglomerations without public sewage network and WWTP (situation in 2008)
Sewage network and WWTPs in agglomerations
Source: Water Research Institute, Bratislava
Elaborated by: SEA CER Košice

EX-POST EVALUATION OF COHESION POLICY PROGRAMMES 2000-2006 CO-FINANCED BY THE EUROPEAN FUND FOR REGIONAL DEVELOPMENT (OBJECTIVES 1 AND 2) - WORK PACKAGE 5B: ENVIRONMENT AND CLIMATE CHANGE ADE
Regional Case study – Eastern Slovakia – October 2009 Page 20
Map 3: Improvement in the number of inhabitants connected to the public sewage network and WWTP by districts between 2002 – 2008 (in %)
Map 4: Development of drinking water supply network in agglomerations between 2002–2008
Improvement of the number of inhabitants connected to the public sewage network and WWTP by districts between 2002 – 2008 (in%)
(Without improvement)
Source: Water Research Institute, Bratislava Elaborated by: SEA CER Košice
Source: Water Research Institute, Bratislava Elaborated by: SEA CER Košice
Drinking water supply network in agglomerations 1. public drinking water supply network achieved between 2002-2008 from CF and SF MoE SR 2. public drinking water supply network achieved between 2002-2008 from other sources then CF and SF MoE SR 3. agglomerations with public drinking water supply network (situation in 2002) 4. agglomerations without public drinking water supply network (situation in 2008)

EX-POST EVALUATION OF COHESION POLICY PROGRAMMES 2000-2006 CO-FINANCED BY THE EUROPEAN FUND FOR REGIONAL DEVELOPMENT (OBJECTIVES 1 AND 2) - WORK PACKAGE 5B: ENVIRONMENT AND CLIMATE CHANGE ADE
Regional Case study – Eastern Slovakia – October 2009 Page 21
Map 5: Improvement in the number of inhabitants connected to the public drinking water network by districts between 2002 – 2008 (in %)
On the other hand, the two additional maps show the improvement during the period in the rates of connection to the public sewerage network (map 3) and the drinking water network (map 5). Sewerage and drinking water connection rates have evolved differently during the period. However, the OP was effective regarding the objective of increasing the population’s connection to the sewage network and WWTP, enhancing the quality of living standards for inhabitants and decreasing the regional disparities regarding water infrastructure. The OP was non-effective in decreasing the regional disparities between urban areas (a connection rate of 94.5% in 2004) and rural areas which still lag behind significantly.
Waste collection and treatment
Regarding solid waste, the OP objectives were the closing down of uncontrolled landfills, creating a network of landfills meeting regulatory conditions, contributing to waste prevention and minimisation, introducing separate waste collection systems and improving waste recovery. Municipal waste generation in Slovakia (309 kg/capita in 2007) remained below that of most other European countries. But, due notably to economic development and new lifestyles and consumption, Slovakia experienced a significant increase (+9.1% between 2002-2007), whereas the European average shows a slight reduction in the quantity of waste during this period (-1.1%). In 2007, both landfilled (77.7%) or incinerated (10.7%) waste still represented nearly 88% of municipal waste, whereas the European average fell to 60.7%. Slovakia has one of the

EX-POST EVALUATION OF COHESION POLICY PROGRAMMES 2000-2006 CO-FINANCED BY THE EUROPEAN FUND FOR REGIONAL DEVELOPMENT (OBJECTIVES 1 AND 2) - WORK PACKAGE 5B: ENVIRONMENT AND CLIMATE CHANGE ADE
Regional Case study – Eastern Slovakia – October 2009 Page 22
lowest rates of recycling in the EU with only 36.3% of packaging waste recycled in 2007, the same level as in 2003 (EU27 average = 56.5%). Waste management remains thus a problem in Slovakia. The field of solid waste management accounted for 23% of the environmental infrastructure supported by Basic Infrastructure OP (but only 8% in Eastern Slovakia). The OP has mainly contributed to building and modernising 116 waste separation and recovery facilities, in coherence with the objective of developing separate waste collection facilities and waste recovery systems. Moreover, 31 uncontrolled landfills were either closed or remediated, as these projects were most easily accessible among the mayors and that the date were the closure will be compulsory without any support approached. This effort made in hard investment during this programming period was mainly driven to comply with the waste related EU Directives. Provision of waste sorting facilities is a necessary condition, but not a sufficient condition to achieve significant results and to inflect the tendencies. The upstream conditions aiming at reducing the quantities of waste produced and downstream conditions aiming at the efficient sorting and recycling of waste was not sufficiently developed to ensure the full effectiveness of the supported investments. Some actors have observed increased difficulties in selling the waste sorted products to their usual customers and increased competition in the market between operators in recent months. The mayors fear not being able to achieve their recycling objectives. We did not have a clear answer to the following question: Is this problem temporary due to the current crisis or is it partly structural due to a supply surplus compared to the limited possibilities of revalorisation of some products such as raw materials?
Energy and reducing GHG emissions
As previously mentioned, Slovakia considers climate change as one of its environmental main priorities with water infrastructures. In the fields of energy and air, the objectives were further reduction of pollutant emissions, achieving better air quality in towns and industrial areas, reducing the energy demands of the economy, accomplishing changes in the fuel base with the aim of using more environmentally friendly fuels and renewable energy resources. Between 2000 and 2007, the share of renewable energies in primary energy consumption doubled (from 2.8% to 5.5%), thus approaching the European average (7.8%). The share of renewable energy in electricity consumption remained stable (about 16%), which is coherent with the main investments in heating and heat water systems. Exposure of the urban population to air pollution by particulate matter remained stable (-0.7%) while the European average experienced a slight increase. The Basic Infrastructure OP also aimed to decrease pollutant and GHG emissions by 5%, with 2004 as the year of reference. Between 2004 and 2007, GHG emissions fell by 6.1% (from 49.98 to 46.95 million tons of CO2) while CO2 emissions from the energy industry decreased by 20.3% (from 12.9 to 10.3 million tons of CO2) and emissions from the industrial sector remained relatively stable (+2%).

EX-POST EVALUATION OF COHESION POLICY PROGRAMMES 2000-2006 CO-FINANCED BY THE EUROPEAN FUND FOR REGIONAL DEVELOPMENT (OBJECTIVES 1 AND 2) - WORK PACKAGE 5B: ENVIRONMENT AND CLIMATE CHANGE ADE
Regional Case study – Eastern Slovakia – October 2009 Page 23
The energy intensity of the economy (inland energy consumption by unit of GDP) decreased by a third during the period, reducing the gap between Slovakia and the European average. In particular, the energy intensity of the industry sector was halved during the period. In 2007, the radiant intensity in industry in Slovakia was 2.3 times superior to the European average whereas this report/ratio was 3.8 in 2000. This indicates that the Slovak Republic, notably with ERDF support, has succeeded in increasing energy efficiency and has thus uncoupled its constant economic growth from its energy demands and emissions.
3.4 Contribution of the ERDF to improving the quality of life
Beyond satisfying the European requirements, the access of the population to basic environmental infrastructures and services represented one of major motivations of the programme. This occurs in the general process of adjustment by an improvement in the basic living standards of the population. The programme in particular contributed to the improvement of the living standards in the fields of wastewater treatment and drinking water, the collective heating and heat water systems, and waste management. As has been shown, the prices of environmental services were fixed below the true cost, mainly for social reasons, in particular in the water sector. In the long run, this raises the question of the sustainability of investments. Taking into account the current development of the country, prices should be raised in order to move closer to the true cost of services, even if special social prices could be set for only the most underprivileged households. During negotiation of the Community Support Framework, an agreement was reached to increase the intervention rate of the ERDF (80% instead of 75%) for selected activities with a direct impact on improving the social standing of the marginalised Roma groups and anti-flood activities. In the field of the environment, the concerned activities were only related to water investments. Since the intervention of the MoE usually amounts to 20%, this agreement means that the municipalities are exempted from supporting the cost of the project in this case. Of the 74 projects supported in the field of water, 9 projects directly (32 projects indirectly) supported the marginalised Roma community which represents 17% of ERDF support in the water infrastructures field (and 52% of ERDF support indirectly). This opportunity was also offered within the framework of measures related to the civil building up and developing of local infrastructures, but no project aiming directly to support the Roma community was supported. Thus, the ERDF contributed to taking into account and slightly improving the situation of the Roma Community. However, the marginalised Roma community remained an increasingly important issue in Slovakia, in particular in the field of basic environmental infrastructures.

EX-POST EVALUATION OF COHESION POLICY PROGRAMMES 2000-2006 CO-FINANCED BY THE EUROPEAN FUND FOR REGIONAL DEVELOPMENT (OBJECTIVES 1 AND 2) - WORK PACKAGE 5B: ENVIRONMENT AND CLIMATE CHANGE ADE
Regional Case study – Eastern Slovakia – October 2009 Page 24
3.5 Contribution of the ERDF to regional economic development
Table 5: Socio-economic data
Socio-economic indicators Level 2000 2001 2002 2003 2004 2005 2006 2007 Incr. 00-07
GDP/capita (at PPS; EU-25=100)
East 36.0 38.1 39.4 39.7 40.3 41.4 42.4 18% Nat. 47.5 50.2 52.0 53.1 55.0 57.7 61.1 29%
GDP annual growth rate East 1.1 6.1 3.7 2.9 3.8 3.5 - Nat. 1.4 3.4 4.8 4.8 5.2 6.6 -
Employment rate East 45.3 45.3 46.1 46.6 44.9 44.7 46.6 48.2 6.4% Nat. 48.8 48.8 48.8 49.7 49.2 49.8 51.2 52.3 7.2% EU25 : 45 51.4 51.6 51.5 52.1 53 53.5 -
Unemployment rate East 24.0 23.9 22.2 21.8 24.2 23.1 19.1 14.9 -38% Nat. 18.8 19.3 18.7 17.5 18.2 16.2 13.4 11.1 -41% EU25 9.2 8.6 8.9 9.1 9.2 9.0 8.2 7.2 -22%
Economic structure (share of employment): Agriculture.
East. 6.2 4.6 -26%
Industry East. 33.1 33.9 2% Services East. 60.7 61.5 1% Investment in % GDP East. 26.8 30.4 27.5 26.4 24.9 -7%
R&D in % GDP East. 0.33 0.36 0.31 0.28 0.28 0.28 -15% Nat. 0.65 0.64 0.57 0.57 0.51 -22%
Population growth East. 0.3 0.3 0.2 0.2 0.2 0.2 0.2 - Population density (pers/km²) East. 98.6 98.9 99.0 99.3 99.5 99.7 100.0 1% Nights spent by non-residents in hotels and similar est. (in thousand)
East 996,2 - 1156,2 981,2 969,1 1037,2 1076,3 1026,9 3%
Labour productivity (GDP per employed in PPS)
East 2224 2455 2655 2635 2822 3083 39% Nat. 2547 2736 2926 3003 3238 3502 37%
Sources : Eurostat.
During the 2000-2006 period, Slovakia experienced sustained economic growth, higher than the European average, allowing for a progressive structural adjustment. Despite a largely positive trend, this growth was however less significant in the eastern region, thus widening the gap between Eastern Slovakia and other parts of the country. Unemployment has decreased by almost 40% since 2000 in Slovakia. This is also true for Slovakia's eastern regions. This fall in the unemployment rate mainly occurred at the end of the period, a shift from 24.2% in 2004 to 14.9% in 2007 for East Slovakia. As a consequence, the employment rate rose from 44.0% to 48.2% in 2007. Labour productivity (GDP per employed person) also improved by almost 40% between 2000 and 2005. A first but significant effect of EU funds has been to support macroeconomic adjustment in Slovakia. This significant progress allowed Slovakia to be one of the first eastern new member states to enter the euro zone at the beginning of 2009. The adoption of the Euro currency has allowed the Slovak economy to improve its resistance to the current crisis to a greater extent than its neighbours. European funds have thus permitted support for the poorer regions through massive transfers to finance infrastructure and basic public services with a view to reducing regional income disparities among European countries. The role played by the change in environmental infrastructures in regional structural processes appears to have been limited. Environmental measures were mainly designed and

EX-POST EVALUATION OF COHESION POLICY PROGRAMMES 2000-2006 CO-FINANCED BY THE EUROPEAN FUND FOR REGIONAL DEVELOPMENT (OBJECTIVES 1 AND 2) - WORK PACKAGE 5B: ENVIRONMENT AND CLIMATE CHANGE ADE
Regional Case study – Eastern Slovakia – October 2009 Page 25
implemented as national sectoral activities going separately and without an integrated view between sectors nor an integrated regional approach. The case of energy/climate change measures is particularly illustrative. Fairly similar measures on energy were running separately, one by the Ministry of the Environment in the Basic Infrastructure OP, the other by the Ministry of the Economy in the Industry and services OP without clear coordination. Except for the air measure under the Industry and service OP, the environmental measures were not designed in a perspective of regional economic development or supporting the private sector. The economic effects of the environmental investments at sector level present a contrasting situation:
Employment in sector of collection, purification and distribution of water remains significant, but experienced a slight decrease between 2000 and 2006 (-11% at the national level). The investment and the introduction of new technologies led to savings in employment. But investments have also mainly benefited the building sector with a temporary effect on employment to complete public work. With the price of water being artificially low, the situation of some water organisations remains rather critical. European funding has been essential for the financial health of water organisations in allowing them to continue to invest.
The recycling sector has seen a significant increase in employment, in particular over the period 2004-2006 for which employment doubled. However, recycling remained underdeveloped in Slovakia, far below the potential of the sector. Thus employment in this sector still remains very limited (about 1500 people in 2006, which represents nearly 10 times less than employment in the sector of water). However, note that employment in the upstream activities such as sorting, transport, logistics or final products can be more significant.
In the energy and heating supply sector, employment also decreased (-17% at the national level), in particular because of the modernisation and the introduction of new, less labour intensive technologies. Nevertheless, two aspects must be underlined. On the one hand, without complete modernisation, many of the old collective coal heating systems would have been condemned in the next few years due to their emissions and low energy efficiencies. On the other hand, the investments in renewable energies were mainly oriented towards the use of wood, allowing a reinforcement of the local wood sector rather than importing coal. The valorisation of wood residues is also a labour intensive activity, in particular for low qualified people.
The energy measure of the Industry and services OP also allowed some other companies to increase their competitiveness through investments aiming at increasing their energy efficiency.


EX-POST EVALUATION OF COHESION POLICY PROGRAMMES 2000-2006 CO-FINANCED BY THE EUROPEAN FUND FOR REGIONAL DEVELOPMENT (OBJECTIVES 1 AND 2) - WORK PACKAGE 5B: ENVIRONMENT AND CLIMATE CHANGE ADE
Regional Case study – Eastern Slovakia – October 2009 Page 27
Annex : Interviews
Name Body Position
Veronika Čepková Ministry of Construction and Regional Development of the Slovak Republic
Director of Programme Management Department, Section of Regional Development Strategy
Pavol Minarových Ministry of Construction and Regional Development of the Slovak Republic
OPBI Manager
Jarmila Murčová Ministry of Construction and Regional Development of the Slovak Republic
OPBI Manager
Miroslava Hrušková Ministry of the Environment of the Slovak Republic
Evaluation Manager, Programme Department, Section of Environment Programmes and Projects
Mário Selecký Ministry of Environment of the Slovak Republic
Evaluation Manager, Programme Department, Section of Environment Programmes and Projects
Andrej Markovič Ministry of the Environment of the Slovak Republic
Head of the Water Management Projects Implementation Unit, Implementation Department
Jozef Škumát Ministry of the Environment of the Slovak Republic
Project Manager, Water Management Projects Implementation Unit, Implementation Department
Dagmar Petrovská Ministry of the Environment of the Slovak Republic
Head of the Air Protection and Waste Management Projects Implementation Unit, Implementation Department
Stanislav Ružička Ministry of the Environment of the Slovak Republic
Project Manager, Air Protection and Waste Management Projects Implementation Unit, Implementation Department
Monika Paulechová Ministry of the Environment of the Slovak Republic
Project Manager, Air Protection and Waste Management Projects Implementation Unit, Implementation Department
Peter Ďuroška, Dalibor Košár Podtatranska Water Management Company Project Manager István Szarka, Eva Szenderáková
Krásnohorské Podhradie Municipality Project Manager
Peter Švigár VODS Košice Director of tyres and rubber division
Danka Mojžišová The City of Velký Krtíš Project Manager Daniel Gemeran, Alexander Nagy
Association of Water Management Companies
General Director
Stanislav Doktor Association of Towns and Municipalities Section for Local Development Peter Kušnír Energy Snina Project Manager


ADE s.a. Rue de Clairvaux, 40
B-1348 Louvain-la-Neuve Belgium
Tel.: +32 10 45 45 10 Fax: +32 10 45 40 99 E-mail: [email protected]
Web: www.ade.be
Ex post evaluation of cohesion policy programmes 2000-2006 co-financed by the European Fund for Regional Development (Objectives 1 and 2) – Work package 5b: Environment and Climate Change
RReeggiioonnaall ccaassee ssttuuddyy VVaalleenncciiaa RReeggiioonn
Octobre 2009


TThhiiss rreeppoorrtt hhaass bbeeeenn pprreeppaarreedd bbyy AADDEE aatt tthhee rreeqquueesstt ooff tthhee EEuurrooppeeaann CCoommmmiissssiioonn..
TThhee vviieewwss eexxpprreesssseedd aarree tthhoossee ooff tthhee CCoonnssuullttaanntt aanndd ddoo nnoott rreepprreesseenntt tthhee ooffffiicciiaall vviieewwss ooff tthhee EEuurrooppeeaann CCoommmmiissssiioonn..
RReepprroodduuccttiioonn oorr ttrraannssllaattiioonn iiss ppeerrmmiitttteedd,, pprroovviiddeedd tthhaatt tthhee ssoouurrccee iiss dduullyy aacckknnoowwlleeddggeedd aanndd nnoo mmooddiiffiiccaattiioonnss ttoo tthhee tteexxtt aarree mmaaddee..


EX POST EVALUATION OF COHESION POLICY PROGRAMMES 2000-2006 CO-FINANCED BY THE EUROPEAN FUND FOR REGIONAL DEVELOPMENT (OBJECTIVES 1 AND 2) - WORK PACKAGE 5B: ENVIRONMENT AND CLIMATE CHANGE ADE
Regional Case study – Valencia Region – October 2009 Table of Contents
Table of Contents ACRONYMS
SUMMARY
1. STATUS AND FEATURES OF THE VALENCIA REGION ............................................. 1
1.1 ECONOMIC SITUATION (IN 2000) .................................................................................... 1 1.2 ENVIRONMENTAL SITUATION (IN 2000) ........................................................................ 3 1.3 INSTITUTIONAL SET UP AND POLICY MAKING PROCESS ............................................... 8
1.3.1 Regional development .............................................................................................. 8 1.3.2 Environmental sector ............................................................................................... 9
2. REGIONAL POLICIES AND THE ROLE OF THE ERDF .......................................... 11
2.1 ECONOMIC POLICIES ....................................................................................................... 11 2.2 ENVIRONMENTAL POLICIES ........................................................................................... 11
2.2.1 Description of the policies implemented ............................................................ 11 2.3 ACTIONS TAKEN .............................................................................................................. 13
2.3.1 Environmental expenditures and the main sources of funds ........................... 13 2.3.2 ERDF contribution to environmental expenditures in the region .................. 14
2.4 PLANNING PROCESS AND COORDINATION BETWEEN ALL STAKEHOLDERS ........... 21
3. ANALYSIS OF THE ERDF CONTRIBUTION ......................................................... 23
3.1 RELEVANCE OF THE 2000-2006 ERDF STRATEGY IN THE ENVIRONMENTAL
SECTOR FOR ENHANCING TERRITORIAL DEVELOPMENT ........................................... 23 3.2 QUALITY OF THE PLANNING AND IMPLEMENTATION PROCESS IN MEETING
REGIONAL CHALLENGES IN THE COVERED FIELDS .................................................... 23 3.3 CONTRIBUTION OF THE ERDF TO IMPROVING THE ENVIRONMENTAL SITUATION24 3.4 CONTRIBUTION OF THE ERDF TO REGIONAL ECONOMIC DEVELOPMENT ........... 25 3.5 CONTRIBUTION OF THE ERDF TO IMPROVING THE QUALITY OF LIFE .................. 26
ANNEX – MISSION AGENDA ........................................................................................ 27

EX POST EVALUATION OF COHESION POLICY PROGRAMMES 2000-2006 CO-FINANCED BY THE EUROPEAN FUND FOR REGIONAL DEVELOPMENT (OBJECTIVES 1 AND 2) - WORK PACKAGE 5B: ENVIRONMENT AND CLIMATE CHANGE ADE
Regional Case study – Valencia Region – October 2009 Table of Contents
LIST OF FIGURES
FIGURE 1: SOCIO-ECONOMIC DATA ............................................................................................. 3 FIGURE 2: AVAILABILITY OF WATER (L/INHAB/DAY) .............................................................. 4 FIGURE 3: WATER SUPPLY DISTRIBUTION IN THE VALENCIA REGION (2006) ...................... 4 FIGURE 4: REUSED WASTEWATER IN THE VALENCIA REGION ................................................ 5 FIGURE 5: NUMBER OF INSTALLATIONS OF WASTEWATER TREATMENT IN THE VALENCIA
REGION .......................................................................................................................... 6 FIGURE 6: TREATED URBAN WASTE IN THE VALENCIA REGION (2002-2008) ..................... 7 FIGURE 7: CO2 EMISSIONS DISTIBUTION IN THE VALENCIA REGION (2005) ...................... 8 FIGURE 8: ESTIMATE OF ENVIRONMENTAL EXPENDITURES DURING THE 2000-2008
PERIOD(€) .................................................................................................................... 14 FIGURE 9 : STRUCTURE OF THE VALENCIA REGION (INITIAL COMMITMENTS) .................... 15 FIGURE 10: ENVIRONMENTAL MEASURES – APPROVED EXPENDITURES 2000-2008 (€) ...... 16 FIGURE 11: MAIN OUTPUT, RESULT AND IMPACT INDICATORS ................................................ 20 FIGURE 12: REGIONAL DATA – BUSINESS STATISTICS ................................................................ 26
EX POST EVALUATION OF COHESION POLICY PROGRAMMES 2000-2006 CO-FINANCED BY THE EUROPEAN FUND FOR REGIONAL DEVELOPMENT (OBJECTIVES 1 AND 2) - WORK PACKAGE 5B: ENVIRONMENT AND CLIMATE CHANGE ADE
Regional Case study – Valencia Region – October 2009 Acronyms
Acronyms
INE Instituto Nacional de Estadística
GDP Gross Domestic Product
NSRF National Strategic Reference Framework
CP Complement of Programming
OP Operational Programme
ESF European Social Fund
EAGGF European Agricultural Guidance and Guaranties Fund
USW Urban Solid Waste
PAVACE Pacto Valenciano por el Crecimiento y el Empleo
ERDF European Regional Development Fund
FDI Foreign Direct Investment
WWTP Waste Water Treatment Plan


EX POST EVALUATION OF COHESION POLICY PROGRAMMES 2000-2006 CO-FINANCED BY THE EUROPEAN FUND FOR REGIONAL DEVELOPMENT (OBJECTIVES 1 AND 2) - WORK PACKAGE 5B: ENVIRONMENT AND CLIMATE CHANGE ADE
Regional Case study – Valencia Region – October 2009 Summary
Summary : Key messages from the case study in Valencia Region The region of Valencia has been submitted in the last ten years to great population and economic growth with strong consequences on the environmental situation of the region. In this context, public planning and investments have aimed to minimize the pressure on the environment while continuing to provide the basic resources and conditions for regional growth. Over the period, the emphasis has been put on water supply and in particular in increasing the volume of water and improving the distribution over the territory. Through these actions it was seeking to give an alternative to wells and release the pressure on inland aquifers that suffer from overexploitation and saline intrusion. The Operational Programme (OP) also followed this trend; it devoted 65% of its expenditures in environmental sectors to water supply. The selection of OP activities was mainly driven by a sectoral approach. This was done by intermediary bodies-sectoral ministries of the central administration and the regional authority, the Generalitat of Valencia- in agreement with their investment plans, the strategic lines of the OP and the eligibility rules of the ERDF. Activities financed by the ERDF were fully integrated in national and regional sectoral investment. However, the importance of sectoral planning and sectoral institutions disrupted a multi-sectoral strategic and monitoring vision of the programme. The private sector in environmental sectors plays a role in the provision of services and maintenance of public infrastructure and has played this role in the OP. In terms of the environmental impact of the OP, the activities to release the pressure on inland aquifers were substantial. They particularly targeted the increase in the volume of water available (desalinisation plants) and the improvement of water distribution over the territory (through water supply networks) to the population but also to economic activities. However, the benefits of these actions are still to be seen, as a substantial part of the infrastructures have not yet been finalised and/or have not yet begun operating. Furthermore, natural regeneration of aquifers requires a longer period. The actions in terms of modernisation of irrigated fields also had an impact in leakage reduction and irrigation efficiency. Agriculture is the first user of water resources in the region. Support for the reutilisation of treated wastewater was also supported, resulting in an increase in the water volume available. In certain cases, measures of hydrofertilisation were also supported and had a positive impact on nitrate pollution. In addition to the environmental benefits of these measures, there is also evidence that they contributed to reducing production costs and therefore improving the competitiveness of the sector. Interventions in the coastal region are directly linked with the tourism sector by improving the quality and the accessibility of the public to beaches. Although it is difficult to measure the effective impact on tourism, all interviewees agree on the drastic consequences a non-maintained beach could have on visitor and tourist frequentation. Finally, in terms of the quality of life of the population, interventions such as the improvement of river beds and channelling, the increase of water quality and quantity and the regeneration of urban areas were impacting the standard of living of a great part of the population.


EX POST EVALUATION OF COHESION POLICY PROGRAMMES 2000-2006 CO-FINANCED BY THE EUROPEAN FUND FOR REGIONAL DEVELOPMENT (OBJECTIVES 1 AND 2) - WORK PACKAGE 5B: ENVIRONMENT AND CLIMATE CHANGE ADE
Regional Case study – Valencia Region – October 2009 Page 1
1. Status and features of the Valencia region
1.1 Economic situation (in 2000) The Valencia Region covers 23,255 km2 which is the equivalent to 4.6% of the total surface area of the country. The region of Valencia is formed by three different provinces, Castellón, Valencia and Alicante. The city of Valencia is the third largest city in Spain in terms of population. In 2000, the Valencia Region represented approximately 10% of the population of Spain (4m inhabitants). The region was characterised during the decade 1990-2000 by strong economic growth. Population growth also rose significantly, around 4% in ten years compared to the Spanish average (3%). The attractiveness of Valencia in terms of population flows (national and foreigner) is based on its high potential for employment creation and the popularity of the region as a retirement location, mainly for citizens from other European countries. Population and economic activities are highly concentrated around the coastline. In 1996 the population density in coastline localities was 4.12 times higher than the density in the countryside. The population of the countryside is in constant decline and faces a significant ageing of the population. The majority of these zones are dedicated to mountainous agricultural production (wine, olives, livestock and wood). The economic situation of the region is one of a cyclical nature, with a higher increase in Gross Domestic Product (GDP) and employment than the national average during expansion periods and a stronger decrease during recession. The contribution of the Valencia Region to national GDP is of a range from 9% to 10%, positioning the region in 4th place behind Catalonia, Madrid and Andalusia, but given its impressive population growth, its GDP per capita has remained behind the national average of Spain. In terms of specialisation, over the 1980’s the region of Valencia moved from a traditionally agricultural-based society to one providing services and industrial activities. In 2000, the economic structure was skill based on traditional activities of low added value and labour intensive activities. This specialisation created few opportunities for young and highly qualified job seekers. The unemployment rate of active population of less than 25 years was 24.4% in 1999 compared to 11.2% for population with more than 25 years. The share of agriculture in regional production (around 3.3%) was slowing down as was its share of the active population and land use. But two thirds of agrarian production was directed to export and therefore still has economic relevance. Agrarian production is mainly citrus fruits, other fresh fruits and vegetables and is concentrated in the coastline. Land tenure structure is traditionally organised in smallholdings. Irrigation is a means to improving agrarian income and it is largely disseminated although compromised by the scarcity of water resources (with consequences such as drills salinization) and high water costs.

EX POST EVALUATION OF COHESION POLICY PROGRAMMES 2000-2006 CO-FINANCED BY THE EUROPEAN FUND FOR REGIONAL DEVELOPMENT (OBJECTIVES 1 AND 2) - WORK PACKAGE 5B: ENVIRONMENT AND CLIMATE CHANGE ADE
Regional Case study – Valencia Region – October 2009 Page 2
The industrial sector represented 28.1% of regional GDP (Spain 25.7%). It was based on traditional consumer goods: agro-industry, leather goods, ceramics, textiles, wood and toys etc. But industrial productivity per employee was, however, slightly lower than the national average and vulnerable to competition of newly industrialised countries. The business sector was based on micro and small sized enterprises and self-employment. The region consists of more than 30,000 enterprises of which 80.8% have fewer than 10 employees. Investment in research and innovation or in the improvement of processing or commercialisation is weak. In the 1990-2000 periods, exportation regressed. This could be partly explained by the weak FDI (Foreign Direct Investment). Industrial superficies and infrastructures are insufficient for the region. The shortage of adapted urban and environmental infrastructures limits the access to energy and waste treatment. This is explained by the high cost of land, given the agrarian production, and the higher costs to cover small industrial zones spread over the entire region.
Services were already in 2000 well developed especially the trade sector (14% of regional GDP) and also tourism which represented 10.8% of the regional GDP (the highest rate in a Spanish region). It was calculated that direct and indirect employment linked to tourism amounted to 10%. The weaknesses of the sector were and still are its exclusive offer based in coast zones and seasonality. The sector was developed in the 1970’s and suffers today from the concurrence of new destinations. The challenge is therefore to offer installations and services that improve the conditions for tourism. Tourism concentrates the majority of foreign private investment. Seasonal variations of population linked to tourism and seasonal activities also played an important role in the region in terms of planning, the use of infrastructures (water) and additional costs in the delivery of public services.
The active population is higher than in the rest of Spain with a significant incorporation of women into the labour market. Employment creation is high but the increase in the active population, due to migration flows, maintains high unemployment rates (16% in 1998). Creation of employment is mainly dependent on services (and suffers substantially from the seasonality of tourism with an oscillation of 10% yearly).

EX POST EVALUATION OF COHESION POLICY PROGRAMMES 2000-2006 CO-FINANCED BY THE EUROPEAN FUND FOR REGIONAL DEVELOPMENT (OBJECTIVES 1 AND 2) - WORK PACKAGE 5B: ENVIRONMENT AND CLIMATE CHANGE ADE
Regional Case study – Valencia Region – October 2009 Page 3
Figure 1: Socio-economic data
Valencia Region Socio‐economic indicators
2000 2001 2002 2003 2004 2005 2006
GDP (m Euros) 61,037.4 66,529.7 71,332.1 76,289.1 81,927.2 88,511.0 95,911.3
GDP/capita (in Euros) 15,100 16,200 16,900 17,600 18,400 19,300 20,400
GDP/capita (at PPS; EU‐25=100) 89.7 90.7 92.2 91.4 90.5 91.1
GDP annual growth rate (%) 5.6 4.6 2.8 2.8 3.1 3.4 3.9
Employment rate (for the 15‐64 age group) (%) 58.7 60.6 60.5 61.3 63.1 64.5 65.8
Economic structure (share of employment) (%)
Agriculture 4.6 3.5
Industry 35.4 34.7
Services 60.0 61.8
Sector contribution to GDP (%): 2007
In primary sector 3 2.3
In secondary sector 24 18.4
In tertiary sector – services 64 66.5
In tertiary sector ‐ construction 9 13
R&D in % GDP 0.7 0.7 0.8 0.8 0.9 1.0 0.7
Population growth 1.3 1.9 2.5 2.8 2.7 2.7 2.6
Population density (pers/km²) 181.6 186.7 191.7 196.9
Sources: Eurostat
1.2 Environmental situation (in 2000)
As previously mentioned, the Valencia Region was characterised by intense economic and population growth which led to a notable increase of urbanisation and infrastructures construction. The net increase of surfaces used for human activities developed during the period 1990-2000 was more than 50%, being the highest figure registered in Spain (39,948 ha). This increase has caused a diminution in agriculture and forest surfaces. The main part of this urbanisation process was located within the first 10km from the coastline, increasing the pressure on natural protected areas.
Water supply
Water management in the Valencia Region was and still is characterised by a high level of complexity due to the poor resources in comparison with the demand from human activities. The Valencia Region has a Mediterranean climate characterised by scarce precipitations and low natural flow regimes. However, the growing population density is posing a threat to water resources. More than 70% of the population lives in the coastal area where most of the aquifers present water salinisation as a consequence of groundwater overexploitation.

EX POST EVALUATION OF COHESION POLICY PROGRAMMES 2000-2006 CO-FINANCED BY THE EUROPEAN FUND FOR REGIONAL DEVELOPMENT (OBJECTIVES 1 AND 2) - WORK PACKAGE 5B: ENVIRONMENT AND CLIMATE CHANGE ADE
Regional Case study – Valencia Region – October 2009 Page 4
Figure 2: Availability of Water (l/inhab/day)
0
50
100
150
200
250
300
350
400
450
1996 1997 1998 1999 2000 2001 2002 2003
CV
Spain
Source: National Institute of Statistics. (Valencia Region)
Moreover, inland water resources present contamination with concentration of nitrate levels exceeding 50 ppm (due to the abusive use of fertilizers for agricultural purposes).
In this context, water management has principally focused on water availability. At the beginning of the period, the National Water Policy and hydrological planning foresaw a connection of the lower Ebro interbasin to the hydrological basins of Júcar and Segura (a total pipe length of 914 km). The transposition of the Water Framework Directive (WFD) to Spanish legislation in December 2003 led to abandon the connection and to redirect the National Water Policy and the hydrological planning. One of the most important projects affected by this change of philosophy in the regulation principles is the Vinalopó aquifer in the Valencia Region.
The evolution of the water supply shows an increase of 14% over the period. Water consumption, as can be observed in the following chart, registered over the past six years, shows a decrease in the weight of industrial and other economic activities in water consumption. On the contrary, the percentage of household consumption progressively increased due to the population growth and the urbanisation process registered in the region.
Figure 3: Water Supply distribution in the Valencia Region (2006)
0
50.000
100.000
150.000
200.000
250.000
300.000
350.000
400.000
450.000
1 2
Others
Municipality consumption
Households
Economic Sectors
20062000
Source: National Institute of Statistics.

EX POST EVALUATION OF COHESION POLICY PROGRAMMES 2000-2006 CO-FINANCED BY THE EUROPEAN FUND FOR REGIONAL DEVELOPMENT (OBJECTIVES 1 AND 2) - WORK PACKAGE 5B: ENVIRONMENT AND CLIMATE CHANGE ADE
Regional Case study – Valencia Region – October 2009 Page 5
Another characteristic of the water model of the Valencia Region is the increase of reused wastewater for agricultural purposes. In Valencia Region, the agriculture is an important economic sector with a high level of water consumption (1,829 Mio m³/year in 2005) and an important share of irrigated areas (41.7% of the agricultural superficies in 2005). The Valencia Region is one of the European leaders in reused water. The volume of reused wastewater per inhabitant in the Valencia Region is clearly superior to the Spanish average as can be seen in the figure below.
Figure 4: Reused wastewater in the Valencia Region
0
0,01
0,02
0,03
0,04
0,05
0,06
m3/inhab/day
1996 1997 1998 1999 2000 2001 2002 2003
ValenciaRegionSpain
Source: National Institute of Statistics.
Finally, one of the remaining challenges that the region must face is the efficiency in water distribution. The leakages were around 30% although the national average is 20%.
Wastewater treatment
In 1985, when the competence was transferred to the region the situation of wastewater in the Valencia Region was very poor, only 31% of the population was provided with wastewater treatment services. Directive 91/271/EEC was transposed to the Spanish regulation by the Royal Decree 11/1995, of 28 September, approving the rules for urban wastewater treatment. Subsequently and in response to the principles and objectives included in Directive 91/271/EEC, the Valencia Region approved its First Wastewater Treatment Plan in 1994.
With the final application of the First Wastewater Treatment Plan of the Valencia Region, a total of 323 wastewater installations were constructed or restored before year 2000. The total treatment capacity was 437 hm³/year affecting a population equivalent to 6.5 inhabitants. Only 0.5% of the population remained without wastewater treatment infrastructures, affecting towns with fewer than 500 inhabitants.

EX POST EVALUATION OF COHESION POLICY PROGRAMMES 2000-2006 CO-FINANCED BY THE EUROPEAN FUND FOR REGIONAL DEVELOPMENT (OBJECTIVES 1 AND 2) - WORK PACKAGE 5B: ENVIRONMENT AND CLIMATE CHANGE ADE
Regional Case study – Valencia Region – October 2009 Page 6
Figure 5 : Number of installations of wastewater treatment in the Valencia Region
225245 273
323 339 349376 386
400 409 415 424
0
50
100
150
200
250
300
350
400
450
1996
1997
1998
1999
2000
2001
2002
2003
2004
2005
2006
2007
The total investment dedicated to finance the First WWTP of the Valencia Region was approximately €811.8m. (Initially planned to be €646.1m). During the period 1994-2000, Community Funds played an important role in financing the infrastructures of the region. The most important contribution of Community Funds was allocated to the Autonomous Government of Valencia (€220.7m, 36% of total regional investment). 85% of the investment in the Valencia Region by the National Authorities was financed by the Cohesion Fund. In general terms, 44.8% of the First Wastewater Treatment Plan of the Valencia Region was financed by Community Funds such as the ERDF, Cohesion Fund, and ENVIREG. Another characteristic of the region of Valencia in the wastewater treatment field is the high level of valorisation of the sludge generated in urban wastewater treatment plants. Approximately 93% of this sludge is used for agricultural activities.
Solid waste
The urban solid waste per inhabitant amounted to 511kg/inhabitant/year in 1998 while the national average was 438 kg/year (compared to 540 kg/year for EU-15). Valencia is the second largest producing region of Spain, this difference in respect to the national average is mainly due to the presence of tourism. The urban waste generated in the Region of Valencia is characterised by the following configuration: 41.3 % Organic, 28.9% Packaging and 29.8% other types of waste. The solid waste generated in the Valencia Region has progressively increased over the last 10 years mainly due to the growth in population. The urban waste generated by the municipalities was always destined to valorisation installations in order to segregate organic waste from the rest. The Valencia Region did and still does not have any waste incineration plants. All the waste collected is transported to the existing composting plants. The compost generated is used by the agricultural sector of

EX POST EVALUATION OF COHESION POLICY PROGRAMMES 2000-2006 CO-FINANCED BY THE EUROPEAN FUND FOR REGIONAL DEVELOPMENT (OBJECTIVES 1 AND 2) - WORK PACKAGE 5B: ENVIRONMENT AND CLIMATE CHANGE ADE
Regional Case study – Valencia Region – October 2009 Page 7
the region. Infrastructure was nevertheless insufficient in 1999; only 25% of the waste was correctly treated. Urban solid waste treatment in the Valencia Region over the last 8 years is shown in the following table.
Figure 6: Treated Urban Waste in the Valencia Region (2002-2008)
Valencia Region
Selected Collection (Tonnes)
Compost Plant (Tonnes)
Landfill (Tonnes) Total Annual
Compost Plant (%) Landfill (%)
selected Collection
(%)
2000 65,550 1,337,122 300,877 1,703,549 4 78 18
2001 74,300 1,529,614 955,914 2,559,828 3 60 37
2002 85,884 1,602,963 965,157 2,654,004 3 60 36
2003 101,321 1,449,485 753,465 2,304,274 4 63 33
2004 111,476 1,774,854 1,160,144 3,046,479 4 58 38
2005 121,122 1,682,167 1,332,331 3,135,620 4 54 42
2006 134,195 1,754,654 1,414,842 3,303,691 4 53 43
2007 154,162 1,834,382 1,243,295 3,231,839 5 57 38
2008 175,278 1,621,641 1,546,770 3,343,689 5 48 46
Source: General Directorate of Climate Change (Generalitat de Valencia)
Nature and Biodiversity
The natural value and biodiversity of the region is very varied and diverse, including protected wetlands, marine natural parks and protected species. As previously mentioned, the coastline is subjected to intense human pressure. The 466km amounts to 14% of the territory and 53% of the inhabitants (650 inhabitants/km²). The population doubles in summer. This situation led to an uncontrolled use of the coast with consequences such as abusive urbanisation, a decline in swimming water quality, a loss of ecosystems and a regression of coastline and beaches. In 2000, more than 80% of these zones had no adapted structures and infrastructures that would contribute to its protection and restrain its use. The Valencia Region has substantially increased its list of Sites of Community Interest (SCIs) since 2000. In order to be in compliance with Directive 92/43/EEC, the Valencia Region Government initially approved a list of 39 SCIs in 1997. This list was reviewed by the autonomous and national governments and as a result of the revision process the list was increased to a total of 94 SCIs covering a total area of 685.862 hectares. This represents 26.1% of the Valencian territory and includes inland and marine habitats.
Climate change and renewable energies
The evolution of GHG emissions in the Valencia Region was constantly growing during the 1990-2005 period, reaching 86% above the baseline year established in 1990. In terms of the relative contribution of the Valencia Region, it represents 7% of the total amount of

EX POST EVALUATION OF COHESION POLICY PROGRAMMES 2000-2006 CO-FINANCED BY THE EUROPEAN FUND FOR REGIONAL DEVELOPMENT (OBJECTIVES 1 AND 2) - WORK PACKAGE 5B: ENVIRONMENT AND CLIMATE CHANGE ADE
Regional Case study – Valencia Region – October 2009 Page 8
Spanish GHG emissions. However, the equivalent CO2 emissions per capita in the Valencia Region remained below those registered at national level for the period 1990-2005. The predominant contribution to GHG emissions in the Valencia Region was registered in 2005 by the industrial sector, followed by road transport, the agriculture sector and the energy generation sector (See figure below).
Figure 7: CO2 Emissions Distibution in the Valencia Region (2005)
Road Transport;
30,3%
Energy; 10,3%
Agriculture and farming; 7,3%
Waste; 2,7%Other transport; 2,0%
Residential and services; 5,2%
Industry; 42,2%
The principal type of industry present in the Valencia Region responsible for GHG emissions is the ceramic and refinery sites mainly located in the province of Castellón. In terms of energy efficiency, the energy intensity indicator (primary energy/PIB) in 2007 was 18% inferior to the Spanish figure showing greater energy efficiency in comparison with the rest of the country; also in energy demand per capita the Valencia Region remains 15% below the Spanish level.
1.3 Institutional set up and policy making process
1.3.1 Regional development
The Valencia Region’s political power structure was basically defined by the 1982 Statute of Autonomy, replaced by a new text in April 2006. The “Generalitat Valenciana” is the name of the regional government and is divided into 12 departments “Consellerias” which execute the policies of their jurisdictions: education, healthcare, industry, public work, culture, agriculture, the environment, tourism, local administration and employment. However, some of these competences are exercised in coordination with the national government.

EX POST EVALUATION OF COHESION POLICY PROGRAMMES 2000-2006 CO-FINANCED BY THE EUROPEAN FUND FOR REGIONAL DEVELOPMENT (OBJECTIVES 1 AND 2) - WORK PACKAGE 5B: ENVIRONMENT AND CLIMATE CHANGE ADE
Regional Case study – Valencia Region – October 2009 Page 9
1.3.2 Environmental sector
Environmental management in the Valencia Region is shared between National, Regional and Local authorities. In water management the competence is shared as follows: The National competence is mainly exercised through the River Basins Authorities: the
river Júcar (80% of the Valencia Region territory), the river Segura (15%) and the river Ebro (5%),
The regional authorities are in charge of management, irrigation, distribution and potabilisation ,
Local authorities are in charge of urban water, waste collection and treatment The basic legislation is always approved by the Spanish Government and the region can develop the regional regulation according to the principles established in national laws or Royal Decrees.
The Valencia Region also contains a very emblematic and singular institution in connection with water administration. The Tribunal of the Water of Valencia is probably the oldest European institution of justice (earliest records from 960 a.d.). The Tribunal of Water of Valencia, which meets every Thursday, is composed of eight syndics (one for each of the main irrigation channel’s so-called “sèquies”) and their judgements are recognised by the ordinary courts of justice.
In wastewater, the Government of the Valencia Region assumed the competence in Wastewater Management in 1985. This Decree set the transference of competence in Wastewater technical management from the national government to the regional authorities.
Waste competences are shared between the region and the local authorities. Urban waste collection is one of the main fields of environmental intervention of local authorities. The private sector is involved in the exploitation and maintenance of water and waste public infrastructures. The property of environmental infrastructures (wastewater and potable treatment plants, composting plants etc.) remains public. In both the waste and the water sector, services are mainly delivered by the private sector by means of a concession of exploitation on a mid-term validity basis. The polluters-pays principle is applied to the region by means of several official programs and regulations. It is explicitly indicated in the Integral Waste Plan (IWP) and in the first and second Wastewater Treatment Plan of the Valencia Region.


EX POST EVALUATION OF COHESION POLICY PROGRAMMES 2000-2006 CO-FINANCED BY THE EUROPEAN FUND FOR REGIONAL DEVELOPMENT (OBJECTIVES 1 AND 2) - WORK PACKAGE 5B: ENVIRONMENT AND CLIMATE CHANGE ADE
Regional Case study – Valencia Region – October 2009 Page 11
2. Regional policies and the role of the ERDF
2.1 Economic policies Plannig in the region is of good quality, covering the main socio-economic challenges facing the region. Public policies applied in the region are nevertheless challenged by the division of competencies between the central, regional and local authorities. Policies and actions are atomised across them and there is a need for a more integrated vision. Planning is also mainly sector driven. At the Generalitat level, this sector approach is compensated by different coordination and dialogue foras such as the Consell1. Regarding the economic sector for the period, the main regional plan was the PAVACE I 2001-2006. The PAVACE (Pacto Valenciano para el Crecimiento y el Empleo) coordinated the action of the Generalitat with social stakeholders under two main strategic axes: Axis 1. Valorisation of productive factors; Axis 2. Support to productive sectors. The PAVACE is also committed to a social sustainble growth and therefore integrated social actions in education, health, social welfare and housing. The total budget committed for the period was €4.6 billion. Ther are further a number of other strategic plans which are sector specific such as: the Programa de Ordenación y Promoción del Turismo, the Plan Valenciano de Empleo Estable and the Plan Valenciano de Formación Profesional. A regional Development Plan was drafted, as in the other Spanish regions, as the starting point of the NRSF 2000-2006 and was the basis of the subsequent regional OPs. The Valencia OP and CP are clearly linked to the national and regional plans.
2.2 Environmental policies
2.2.1 Description of the policies implemented The Region of Valencia’s environmental policies, as is the case in the rest of the Autonomous Communities of Spain, are designed and coordinated by national and regional authorities.
1 It should be noted that the PAVACE II for the period 2009-2013 offers also multi-sector dialogue framework.
PAVACE I 2001-2006 was mostly oriented towards economic development.

EX POST EVALUATION OF COHESION POLICY PROGRAMMES 2000-2006 CO-FINANCED BY THE EUROPEAN FUND FOR REGIONAL DEVELOPMENT (OBJECTIVES 1 AND 2) - WORK PACKAGE 5B: ENVIRONMENT AND CLIMATE CHANGE ADE
Regional Case study – Valencia Region – October 2009 Page 12
The Valencia Region approved its Strategy for Sustainable Development in July 2002 which set the framework for the definition of environmental policies in the region. The key areas identified in the Strategy for Sustainable Development of the Valencia Region are the following:
Production, distribution and consumption in strategic sectors: energy, agriculture,
transport, industry, construction and tourism; Natural heritage management: resources, risks and environmental quality; Waste management: urban, industrial, agricultural and construction; Management of cultural and education resources: heritage, training and research; Cohesion and social inclusion: poverty, exclusion, employment and immigration; Prevision and social protection: aging, dependency, welfare and quality of life; Structure and territorial dynamics: mobility, soil usage, infrastructures and equipment; External affairs: trade, cooperation and sustainable development aids.
Water infrastructures were under the Consellería of Infrastructures and Transportation until 2007 and therefore they were not considered initially in the environmental strategy. In the water sector, the objective was to guarantee water resources in quantity and quality in order to maintain human activities (tourism, irrigation and domestic consumption).
Special interest was given to the compliance with the Council Directive 91/676/EEC of 12 December 1991 concerning the protection of water against pollution caused by nitrates from agricultural sources in the Region of Valencia. The abusive use of nitrates in fertiliser products has caused the contamination of most of the aquifers in the Valencia Region.
The National Hydrological Plan was reviewed in 2003 following a change of Government, and the transposition of the Water Framework Directive (WFD) abolished the Ebro transfer previously planned. The new regulation framework is based on integrated water management in line with demand and available resources cancelling the large water transfer projects and generating great discussions among the affected territories. The concept of ecological flow was introduced with the amendment of the National Hydrological Plan (Act 11/2005) and considered as the flow that permits attainment of a favourable ecological status in rivers.
The A.G.U.A. programme (Spanish acronym for Water Usage and Management Action) was launched in 2004. The main objective of this programme was the implementation of demand management measures and the efficient allocations of resources. The programme includes urgent measures for Mediterranean river basins where both water scarcity and quality were the most significant problems.
In addition, following the heavy drought which began in 2004 and affected the Júcar and the Segura river basins in Valencia, urgent action was undertaken in order to improve the efficiency of irrigation systems in the area.

EX POST EVALUATION OF COHESION POLICY PROGRAMMES 2000-2006 CO-FINANCED BY THE EUROPEAN FUND FOR REGIONAL DEVELOPMENT (OBJECTIVES 1 AND 2) - WORK PACKAGE 5B: ENVIRONMENT AND CLIMATE CHANGE ADE
Regional Case study – Valencia Region – October 2009 Page 13
The Valencia Government approved their Integral Waste Plan (IWP) by the Decree 317/1997. The IWP puts emphasis on treatment capacities. Its scope includes the waste generated from the following activities:
Domestic, commercial and services activities ; Industrial activities ; Sanitary and veterinary activities ; Agriculture and farming activities. The IWP of the Valencia Region is based on the principles of subsidiary, self-sufficiency, proximity, shared responsibility and the polluter pays principle. The plan intends to offer a coordinated framework of action to local and regional authorities. The IWP of the Valencia Region has been developed in 18 different Zone Plans covering the entire territory of the region. The programming of waste infrastructures in the Valencia Region takes into account not only the resident population but also the tourist impact. In 2001, the Valencia Region created the Agency of Valencia Energy (AVEN) by Law 8/2001, a public entity belonging to the Infrastructures and Transport Regional Department. Two different budget lines for grants have been established by the AVEN, one based on the promotion of renewable energies and the other based on the adoption of efficiency and energy saving measures in the domestic, private and public sectors. These two budget lines have been co financed by ERDF funds.
2.3 Actions taken
2.3.1 Environmental expenditures and the main sources of funds
In terms of public environmental expenditures, information is spread over all the public actors in charge of different sectors (national, regional and local) and is not centralised. The table below shows only an estimate of regional environmental expenditures using a proxy measured as the share of the national figure, based on the percentage of the population of the region. Concerning the ERDF, it should be noted that the figure does not reflect complete programme expenditures as the eligibility period is extended to 30 June 2009 and certification will last until December 2009. From the table it can be seen that the greatest effort has been made in the water sector, and especially in water supply.

EX POST EVALUATION OF COHESION POLICY PROGRAMMES 2000-2006 CO-FINANCED BY THE EUROPEAN FUND FOR REGIONAL DEVELOPMENT (OBJECTIVES 1 AND 2) - WORK PACKAGE 5B: ENVIRONMENT AND CLIMATE CHANGE ADE
Regional Case study – Valencia Region – October 2009 Page 14
Figure 8: Estimate of environmental expenditures during the 2000-2008 period(€)
Valencia Region Environmental Expenditures
Of which investment
Waste management
Water supply‐Waste water management
National – all levels (a) (statistical proxy) 29.511,464,232 830,119,520 264,124,346 565,995,174
of which ERDF OP Valencia National Counterpart (b) 327,577,429 327,577,429 2,263,988 316,175,285
of which ERDF OP local National Counterpart (b) 24,939,388 24,939,388 100,433 17,036,022
of which Cohesion Fund National Counterpart (b)
ERDF OP Valencia (b) 605,682,992 605,682,992 8,740,033 584001127
ERDF OP Local (b) 58,930,476 58,930,476 301,298 40,455,363
Cohesion Fund (c) 1,978,971,296 902,495,149
TOTAL 32,507,565,813 2,749,744,954 275,530,099 1,523,662,972
Capita (annual average) 7,361 623 62 345
% of GDP 4,3% 0,4% 0,0% 0,2%
Source: (a) Eurostat national environmental expenditures and authors calculations in % of regional population, (b) Ministry of the Economy-Fondo 2000 Certified expenditure 24 June 2009, (c) Ministry of the Economy, (d) Instituto Nacional de Estadística. Encuesta del gasto de las empresas en proteccion ambiental 2002-2006. Author’s calculations for other years.
2.3.2 ERDF contribution to environmental expenditures in the region
The Operational Programme for the Valencia Region 2000-2006 committed a total amount of €4,5m of which 48% was provided by the ERDF, 19% by the central administration and 17% by regional authorities2. In terms of expenditures, 98.8% was certified by end of June 2009. The structure of the programme is presented in the figure below. The programme was built along four priorities and 7 axes. The environmental measures were inscribed under the first priority – Improvement of the basic conditions to increase regional competitiveness – which also covers interventions in the fields of innovation, telecommunications, transport, energy and human capital. The environmental interventions were concentrated under Axis 3. This axis represents 24% of the OP in initial commitment terms. Three other environmental measures were integrated to axis 5 and 6.
2 A Further 5% is coming from the EAGGF and 11% from the ESF.

EX POST EVALUATION OF COHESION POLICY PROGRAMMES 2000-2006 CO-FINANCED BY THE EUROPEAN FUND FOR REGIONAL DEVELOPMENT (OBJECTIVES 1 AND 2) - WORK PACKAGE 5B: ENVIRONMENT AND CLIMATE CHANGE ADE
Regional Case study – Valencia Region – October 2009 Page 15
Figure 9 : Structure of the Valencia Region (initial commitments)
7 Axis
• First point Axis 1 – Competitiveness and productive tissue – €83m
• Axis 2 – Innovation, Research and development and Information society - €422m
• Axis 3 – Environment, nature and water resources - €1,176m
• Axis 4 – Education, employment and humanresources - €787m
• Axis 5 – Local and urban development -€263m
• Axis 6 – Transport and Energy - €1,316m
• Axis 7 – Agriculture and rural development -€128m
1st Sector of intervention WATER - €841m
• 3.1 Water supply to population and economic activities - €580m
• 3.2 Effectiveness improvement of infrastructures and use of water - €223m
• 3.3 Wastewater treatment - €38m
10 Measures related to environment
2nd Sector of intervention CONSERVATION OF NATURAL SPACES - €256m
• 3.5 Environmental actions in the coast - €51m
• 3.6 Protection and regeneration of natural spaces – €205m
Other sectors of intervention
• 5.1 Local and urban development - €61m
• 3.4 Integral Management of urban and industrial waste - €9m
• 3.8 Regeneration of sites – 5€m
• 5.3 Infrastructures andequipment in municipalities > 20,000 inhab - €4m
• 6.10 Improvement of energy efficiency in enterprises -
4 Priorities
• Improvement of basic conditions to increase the regional competitiveness• Improvement of the competitiveness and development of the productive tissue to ensure employment creation
• An strategy of employment and equal opportunities
• Promotion of the social and territorial cohesion
The strategy for the environment was very much concentrated on improving the public environmental infrastructures in particular in the water sector: Redistribution of resources, in particular for the conduction Turia-Sagunto and then
Jucar-Vinalopó. With the change of the National Hydrologic Plan this priority has changed to desalinisation plants;
Water saving in irrigation; Reuse of treated wastewater in irrigation, adapting the treatment plants as well as
building regulation and distribution infrastructure. Other actions were the conservation of natural spaces including coastal zones in the fight against erosion, desertification and threat to ecosystems. In the field of solid waste, the financial implication is relatively weak. The NSRF foresee that the action will be coordinated through Cohesion Funds. The table below presents the differences between the initial budget, the revision and the expenditures by Field of Interventions Drinking water is still the first sector of intervention, although it suffered reprogramming (see description by measure for more details). Another interesting insight is that given the expenditures certified as per June 2009, the proportion of the ERDF expenditures devoted to the environment was not high (13.4%) compared to an average level in Spain of 24.7%.

EX POST EVALUATION OF COHESION POLICY PROGRAMMES 2000-2006 CO-FINANCED BY THE EUROPEAN FUND FOR REGIONAL DEVELOPMENT (OBJECTIVES 1 AND 2) - WORK PACKAGE 5B: ENVIRONMENT AND CLIMATE CHANGE ADE
Regional Case study – Valencia Region – October 2009 Page 16
Figure 10: Environmental measures – Approved expenditures 2000-2008 (€)
FOI code
Field of Interventions ERDF commitments Expenditures
Initial budget Revision In % of budget
Disbursed
1312 Preservation of the environment in connection with land, forestry and landscaper conservation
6,149,865
152 Environment‐friendly technologies, clean and economical energy technologies for big enterprises
2,079,467 2,217,297 0.3%
162 Environment‐friendly technologies, clean and economical energy technologies for SMEs
2,079,467 2,217,297 0.3%
332 Renewable sources of energy (solar power, wind power, hydroelectricity, biomass)
5,409,109 5,409,109 0.7% 8,749,033
333 Energy efficiency, cogeneration, energy control 5,409,109 5,409,109 0.7%
343 Urban and industrial waste (including hospital and dangerous waste)
7,220,453 6,470,453 0.9% 6,791,966
34 and 344
Drinking water (collection, storage, treatment and distribution)
529,317,822 492,617,461 65.2% 495,161,079
345 Sewerage and purification 28,687,896 60,177,678 8% 88,840,046
352 Rehabilitation of urban areas 45,958,445 45,958,445 6.1% 38,403,575
353 Protection, improvement and regeneration of the natural environment
129,285,702 135,246,281 17.9% 109,530,889
TOTAL 755,447,470 755,723,130 100% 753,617,457
Source: Ministry of the Economy – DG European Funds The detailed interventions by the measures of axis 3 are described below: Measure 3.1 Water supplies to population and economic activities - €580m – this
measure only represents 12% of the OP and 49% of the axis. The measure is 40% co-financed by the central authorities and 3% by the regional authorities.
In terms of implementation, this measure has suffered severe delays over the period due to the changes that occurred in the National Hydrologic Plan. The initial budget was downscaled to €495m3. The new plan also conveys large investments for the region in particular in desalinisation plants but maturation of the projects (planning, localisation, permits) was at a very early stage and some of them will have to be financed by the next programme. Another consequence of this drastic change of strategy was that the downstream regional work also had to be adapted.
3 At the end of June 2009 the execution rate was 93%.

EX POST EVALUATION OF COHESION POLICY PROGRAMMES 2000-2006 CO-FINANCED BY THE EUROPEAN FUND FOR REGIONAL DEVELOPMENT (OBJECTIVES 1 AND 2) - WORK PACKAGE 5B: ENVIRONMENT AND CLIMATE CHANGE ADE
Regional Case study – Valencia Region – October 2009 Page 17
The most important projects financed under this measure were: the conduction between Júcar and Vinalopó (€195m). This project was totally modified
with a change in strategy, desalinisation plants: mainly two in Alicante (€80m), Torrevieja (€46m) but also the
initial work of three other (total amount €3.1m), in terms of purification and distribution, at the level of the competencies of regional
authorities, the projects have been distributed all over the territory. The most important ones are the Plana Baixa and the Camp Morvedre which was carried out in four phases but not all the parts are currently in service, Projects under this measure have targeted not only the supply of water to the population (240.68 km new/improved for supply to urban areas), but also to economic activities such as industrial zones and irrigated fields (164.39km new supply to economic activities).
Measure 3.2 Effectiveness improvement of infrastructures and use of water - €223m – 19% of the axis. The measure is approximately 27% co-financed by the central authorities and 9% by the regional authorities. This measure finances the modernisation of irrigation channels and infrastructures of reutilisation of treated wastewater. Through promoting the distribution of resources, the intervention in irrigation channels aims at preventing the over-exploitation of aquifers through individual wells with consequences for salinisation. The reutilisation of treated wastewater aims at minimising the increase of irrigation demand. The most important project financed under this measure was the modernisation of the Acequia Real del Júcar (€47m). The other projects were of a much smaller size.
Measure 3.3 Wastewater treatments - €38m – 3% of the axis – The measure is co-
financed for 25% by regional authorities. In this field great effort was committed to the previous OP 1994-1999. During the 2000-2006 programme the interventions aimed at the extension of nine treatment plants and the upgrading of three plants to tertiary treatment.
Measure 3.4 Integral Management of urban and industrial waste - €9m – 1% of
the axis – This measure is totally co-financed by the region at a level of 25%. Waste management is mainly financed by the cohesion fund. Under this measure the priority has been the construction of separated collection points.

EX POST EVALUATION OF COHESION POLICY PROGRAMMES 2000-2006 CO-FINANCED BY THE EUROPEAN FUND FOR REGIONAL DEVELOPMENT (OBJECTIVES 1 AND 2) - WORK PACKAGE 5B: ENVIRONMENT AND CLIMATE CHANGE ADE
Regional Case study – Valencia Region – October 2009 Page 18
Measure 3.5 Environmental actions at the coast - €51m – 4% of the axis co-financed by central and regional authorities at 17% and 13% respectively. Four types of interventions were supported under this measure: - Accessibility to public and other user services, - Environmental protection or recovery, - Recovery of the littoral: demolition of invasive buildings, - Restoration of beaches with the injection of sand. - There are numerous cases of projects that have integrated more than one type of
action such as the Playa del Puzol or the Playa l’Arbr del Gos, a remarkable compromise between environmental recovery and public accessibility.
3.6 Protection and regeneration of natural spaces – €205m - 18% of the axis – 27%
co-financed by the central authorities and 3% by the regional authorities. At the level of national administration, the majority of the support went to riverbed and riverbank rehabilitation aiming at improving of specific ecosystems and in certain cases flood protection. From the side of regional authorities, support went to natural parks and to “green ways”.
3.8 Regeneration of sites – €5m – 0.5% of the axis – 30% co-financing of the region.
This measure is mainly related with the closure of small UWDS. Finally, under this axis two other measures were financed by the EAGGF 3.9 Silviculture €51m and 3.10 Landscape conservation in the rural economy €10m. Outside axis 3 there were interventions related to urban rehabilitation:
- Measure 5.1 – Local and urban development - €61m – Around 20 urban centre rehabilitation projects and urban parks as well as subvention to 51 municipalities to improve the entrances of the villages.
- Measure 5.3 – Infrastructures and public equipment in municipalities of fewer than 20,000 inhabitants - €4m.
Finally, measure 6.10 concerned the improvement of energy efficiency in enterprises – This measure was managed by AVEN and was used to co-finance two different budget lines - one based on the promotion of renewable energies and the other based on the adoption of efficiency and energy saving measures. Both lines are open to individuals, public administrations, enterprises and industries. The table below shows the main indicators as available at the end of June 2009. The values are not definitive. The final expenditures are still to be carried out and this might change indicators achievements. In addition, already achieved values are still to be inputted into the database by some intermediary bodies.

EX POST EVALUATION OF COHESION POLICY PROGRAMMES 2000-2006 CO-FINANCED BY THE EUROPEAN FUND FOR REGIONAL DEVELOPMENT (OBJECTIVES 1 AND 2) - WORK PACKAGE 5B: ENVIRONMENT AND CLIMATE CHANGE ADE
Regional Case study – Valencia Region – October 2009 Page 19
The assessments that can be made currently are that: Some indicators show a particularly low level of achievement, although an important
level of expenditures has been carried out. This is the case for indicators 11 « Recovered aquifers (nb) », 12 « Irrigation area supplied by the improved network (ha) », 13 « Storage capacity regulation of reused water pools (m³) », 14 « Volume of reused water (hm³/year) ». This could be explained by the delays in the implementation and not by the effectiveness of the planning or the projects that are generally of good quality.
Some targets will not be achieved because the level of achievement of these types of interventions is insufficient. This is the case for example for result indicator nb 25 «Population benefited directly from urban rehabilitation projects » for which the level of achievement is only 17%. This can be explained because the level of achievement of related output indicators is only 24%.
In the majority of cases the level of achievement of indicators of results and impact are lower than for output indicators. This is visible in cases where the achievement is in line with the planning (outputs are in line with the target) as in indicator 23 “Inhabitants benefiting from improvement of channelling/river beds ». This indicator shows an achievement rate of 89% while the related output indicator shows an achievement level of 97%. There is a general trend which shows that the targets were set at optimistic levels.
The indicator system still shows some deficiencies at various levels:
- Utility; the managers of the programme use the output indicators as part of the expenditure verifications exercise; but generally no use is made of results or impact indicators in the strategic management and monitoring of the programme.
- Reliability; the data is collected on a pyramidal basis at the level of each project and then totalled to give a result at the level of the measure. This system presumes that each project manager has the same understanding of the meaning of the indicators. However, according to interviews with the intermediary bodies this is not always the case. Moreover there are still indicators for which calculation is still vague for example 16, 19 and 24 (Increase in treated wastewater (m³), Restored forest cover / needs (%), recovered land/polluted land (%)) in particular given they were percentages and there is confusion over the reference value.
- It is unfortunate that the measure that concentrates the majority of resources, 3.1, is the one that has the poorest indicator system. In particular, no result indicators are followed-up. The system was streamlined over the period to find a balance between the information it could bring and the workload it supposes, but a link between the financial weights would have been welcomed.

EX POST EVALUATION OF COHESION POLICY PROGRAMMES 2000-2006 CO-FINANCED BY THE EUROPEAN FUND FOR REGIONAL DEVELOPMENT (OBJECTIVES 1 AND 2) - WORK PACKAGE 5B: ENVIRONMENT AND CLIMATE CHANGE ADE
Regional Case study – Valencia Region – October 2009 Page 20
Figure 11: Main output, result and impact indicators
Indicator name Baseline
value (2000)Target Achieved value
1
Number of projects on water supply (New supply networks to economic activities (km) + New and/or improved supply networks to urban areas (km))
na 188,82 + 279,66
164,39 + 240,68
2 Number of projects on wastewater na 8 1
3 Number of projects on solid waste (treatment plant and closure of UWDS)
na 1 1
4 Number of additional citizens served by water supply projects na na Na
5 % increase of the additional population served by water supply projects (compared to the baseline value)
na na Na
6 Reduction of leakage from the water supply network na na Na
7 Increase in population served by wastewater projects (nb inhabitants) na 1,090,000 193,156
8 % increase in population served by wastewater projects (compared to the baseline value)
na na Na
9 New waste treatment capacity created (Tons of solid urban waste treated per year (tn/year))
na 31,100 31,100
10 Number of unauthorised landfills closed or rehabilitated na 1 1
11 Recovered aquifers (nb) na 6 1
12 Irrigation area supplied by the improved network (ha) na 170,179.08 113,555
13 Storage capacity regulation of reused water pools (m³) na 400,000 37,058
14 Volume of reused water (hm³/year) na 10 0.70
15 Waste-water subject to tertiary treatment (m³/year) na 130,000 60,000
16 Increase in treated wastewater (m³) na 90,000 43,100
17 Decrease in % of solid urban waste that can not be re-valued (%) na 10.20 10.15
18 Protected land / total land (%) na 22 16
19 Restored forest cover / needs (%) na 100 50
20 Increase/maintenance of endangered species (nb) na 288 25
21 Individuals benefiting from the awareness campaigns (nb)
na 841,907 748,792
22 Visitors of the facilities for environmental education na 239,141 70,452
23 Inhabitants benefiting from improvement of channelling/river beds” na 2,644,186 2,973,000
24 Recovered land/ polluted land (%) na 34 0.50
25 Citizens who benefited directly from urban rehabilitation projects na 1,685,121 293,629
26 Citizens who benefited directly from the equipment of municipalities of fewer than 200,000 inhabitants
na 340,000 146,467
27 Induced private investment (€) na 120m 91m
28 Renewable energy produced (Kwh) na 150,000,000 100,144,256
29 Energy consumption reduced (TEP) na 80,000 80,020
30 Jobs created at construction stage na 12,486 10,364
31 Jobs created at maintenance stage or new jobs (nb) na 204.85 95

EX POST EVALUATION OF COHESION POLICY PROGRAMMES 2000-2006 CO-FINANCED BY THE EUROPEAN FUND FOR REGIONAL DEVELOPMENT (OBJECTIVES 1 AND 2) - WORK PACKAGE 5B: ENVIRONMENT AND CLIMATE CHANGE ADE
Regional Case study – Valencia Region – October 2009 Page 21
2.4 Planning process and coordination between all stakeholders
The Management authority of the OP Valencia Region is, as for all the other Spanish OPs, the Ministry of the Economy. Given the importance of administrative decentralisation in Spain, the Generalitat of Valencia co-presides the Follow-up Committee. The management of the programme is spread over intermediary bodies. These are the sectoral ministries of the central administration and the Generalitat of Valencia. Following this, the Generalitat relies on its thematic services “Consellerias”. The intermediary bodies are autonomous in terms of the selection of interventions (although respecting the strategic lines of the OP), they are in charge of implementation (through their services or their associated bodies as are the Confederación del Júcar or Acuamed a public estate company) and have responsibilities in the first level of the certification of expenditures. The selection of interventions is totally driven by the national and regional investment plans. In this sense, the interventions are first planned at that level and the decision to be financed by the ERDF comes later on the basis of the eligibility of expenditures with reference to ERDF rules and the maturity of the projects. This allows the ERDF to be used for financing projects of good quality, cautiously planned and integrated to an overall programme. The coordination between authorities of different sectors or different levels for integrated projects is not organised at the level of the ERDF programme but at the level of the national/regional planning. The programme is understood as a support to public investment of regional and national administrations (Local authorities benefit of OP local and cohesion funds). However, there are also subventions to municipalities. Regarding the private sector, the programme supports public investment, aiming at improving the conditions of production and the competitiveness of the business sector. Private enterprises are mostly indirect beneficiaries’ of the programme. However, in certain cases they receive direct subventions (as is the case for the energy efficiency measure). In the particular case of the Valencia Region, the private sector has been associated with the programme through the forum PAVACE. At the level of administrative and financial management, the management of a project under ERDF rules brings challenges as these rules appear to be an extra layer to classical national procedures.


EX POST EVALUATION OF COHESION POLICY PROGRAMMES 2000-2006 CO-FINANCED BY THE EUROPEAN FUND FOR REGIONAL DEVELOPMENT (OBJECTIVES 1 AND 2) - WORK PACKAGE 5B: ENVIRONMENT AND CLIMATE CHANGE ADE
Regional Case study – Valencia Region – October 2009 Page 23
3. Analysis of the ERDF contribution
3.1 Relevance of the 2000-2006 ERDF strategy in the environmental sector for enhancing territorial development
The ERDF strategy in the environmental sector addresses the main obstacles encountered by the region in the way to sustainable economic growth. Furthermore, seeking an adaptation to region specificities the strategy includes measures that seem original in comparison with other European regions, i.e.: water availability, modernisation of irrigated fields and rehabilitation of coasts. The theme that seems to have been overlooked by the strategy is waste, despite the high levels of USW per capita and the link of this figure to tourism. This issue was nevertheless extensively addressed by the cohesion funds as foreseen in the NSRF. Furthermore, the competencies in waste management belong to local authorities whereas the ERDF OP Valencia was mainly devoted to regional and national public investments. Finally, the programme continuously monitors the relevance of the strategy with respect to the evolution of the socio-economic context of the region. The annual activity report provides the analysis and the insights in order to assess if there are changes that will justify a modification of the strategy. Over the period, the only substantial change that occurred was the change in the National Hydrologic Plan. The OP strategy was subsequently adapted, but the time needed for the planning and the launching of new activities has caused a delay and also a diminution of the financial weight of the measure.
3.2 Quality of the planning and Implementation process in meeting regional challenges in the covered fields
The selection of interventions is based on the activities foreseen in the national and the regional investment plans. The integration of each of the interventions financed in pre-existing national and regional investment plans is a guarantee to finance structuring projects integrated in the development of the region4. The planning is of good quality though sector based. The main approach used for selecting interventions was a sectoral planning system elaborated for each sector separately. Territorial coherence was ensured at upper level but action plans were not based on territorial unit. Furthermore, the important role played by the intermediary bodies, in the selection and implementation, has given to the programme a sectoral vision and has made difficult to develop a multisectoral strategic view in monitoring the programme at the level of Generalitat interventions.
4 There are few cases of non-structuring projects. For example, in emergency actions in coast rehabilitation when
beaches are filled with sand for a period of 10 years. These projects have been financed for a total of €3m ERDF. These projects are however extremely important for tourism activity in small localities.

EX POST EVALUATION OF COHESION POLICY PROGRAMMES 2000-2006 CO-FINANCED BY THE EUROPEAN FUND FOR REGIONAL DEVELOPMENT (OBJECTIVES 1 AND 2) - WORK PACKAGE 5B: ENVIRONMENT AND CLIMATE CHANGE ADE
Regional Case study – Valencia Region – October 2009 Page 24
3.3 Contribution of the ERDF to improving the environmental situation
The environmental context of the region did not change substantially over the period. The population growth and the concentration of the activities along the coast continue to constitute the two main factors of deterioration of the environment in the region. The two main environmental challenges the region faced in 2000 – namely overexploitation and nitrate pollution of inland aquifers - remain although significant effort was made under the ERDF, to address them. The OP Valencia has made significant effort regarding the over-exploitation of the inland aquifers through: An increase in the volume of available and the extension of water supply
infrastructures. These actions seek to improve the distribution of water resources (405 km network supply) over the region and force the abandonment of wells. However, not all the work supported is currently in use. For example, the supply networks of Camp Morvedre or some desalinisation plants.
Facilitating the reuse of treated water in order to provide agriculture with additional water resources (0.70 hm3/year).
Modernisation of irrigation channels, in order to reduce leakages and improve irrigation efficiency (133.555 ha).
The modernisation of irrigation means was in many cases also combined with measures of hydrofertilisation. This has had a direct impact on the abusive use of fertilisers and the pollution by nitrates of underground aquifers. The ERDF has contributed financially to 2% of the Irrigation Regional Plan while the FEOGA contribution is more significant.
In other areas, the contribution of the ERDF was not conclusive, either because the invested amounts were small (waste) or because their contribution to environmental protection was at best indirect (beach accessibility, green roads, rehabilitation of urban areas and small parks) Regarding GHG emissions, the contribution of ERDF funds in the reduction of GHG emissions has been focused on the fields of energy efficiency and renewable energy projects. The AVEN (Agency of Valencian Energy) has been financing the implementation of energy efficiency measures in industries, households and municipalities as well as the construction of renewable energy installations. In terms of environmental expenditures of enterprises, the improvement of GHG emissions is the first sub-sector of investment.

EX POST EVALUATION OF COHESION POLICY PROGRAMMES 2000-2006 CO-FINANCED BY THE EUROPEAN FUND FOR REGIONAL DEVELOPMENT (OBJECTIVES 1 AND 2) - WORK PACKAGE 5B: ENVIRONMENT AND CLIMATE CHANGE ADE
Regional Case study – Valencia Region – October 2009 Page 25
3.4 Contribution of the ERDF to regional economic development
Evolution of the economic context
The economy of the region maintained strong growth over the period as growth rates exceeded the national and the European average (see figure 1). Moreover, this trend had a positive impact on GDP per capita despite the intense population growth (EU 27 PPP: 86% in 2007). The region has left the Objective 1 group and integrated the Objective 2 regions due to its effective growth. There are only two other Spanish regions (Castilla León and Canarias) that have followed the same trend. The economy was boosted by low interest rates, immigration, employment creation and a strong internal demand for consumption and investment. This has stimulated in particular the building sector which shows the most dynamic trends in terms of its contribution to regional GDP and employment creation. The evolution from 2000 to 2007 of sector contribution to GDP shows that services are still first with 66.5% in 2007 (excluding construction), the secondary sector is second although its part decreased (from 24% to 18.46.4%). The dramatic decrease of primary sector should be noted: it represented 3% in 2000 and was in 2007 only 2.3%. Finally, the construction sector shows steady progression from 9% to 13%. However, since 2007 the economy has slowed down following the international and the Spanish economic situation. In addition to external causes, other internal causes could explain that the adjustment in the region is stronger than nationwide. Among the economic reasons are: the deceleration of the building sector (due to the difficulty to access to credit and price adjustments) as well as the reduction in exports and the weak competitiveness compareted to emerging countries with lower production costs. Growth and employment have also been severely affected. It has been difficult to absorb the active population which is still increasing. Unemployment has increased, especially in the building sector, discouraging consumption; other pillars of growth in the region.
Contribution of the ERDF
Two types of interventions are having the most direct effects on the economy of the region: Improvement of irrigation systems: irrigation in Valencia is a factor of differentiation
and key to improving profitability. The modernisation of irrigation systems reduces leakages, improves irrigation efficiency, and in many cases it is also accompanied by measures of hydro fertilisation and/or re-utilisation of treated water. All this has direct consequences on the reduction of production costs and the improvement of sector competitiveness.
Coastal rehabilitation: work in this area has improved the accessibility of the public to beaches and their quality. Although it is difficult to measure the effective impact on tourism, all interviewees agree on the drastic consequences a non-maintained beach could have on visitor and tourist frequentation.

EX POST EVALUATION OF COHESION POLICY PROGRAMMES 2000-2006 CO-FINANCED BY THE EUROPEAN FUND FOR REGIONAL DEVELOPMENT (OBJECTIVES 1 AND 2) - WORK PACKAGE 5B: ENVIRONMENT AND CLIMATE CHANGE ADE
Regional Case study – Valencia Region – October 2009 Page 26
In terms of activity in the environmental sector, the overall figure shows a steady increase in employment possibilities within the water sector and a significant increase in the recycling sector (although the contribution of the ERDF in this sector was modest). Concerning the environmental measures of the OP, the number of jobs created at the construction stage is estimated at around 10,364. The values are much more modest in terms of creation of jobs, amounting to just 95.
Figure 12: Regional data – business statistics
Activities linked to environment 2000 2001 2002 2003 2004 2005 2006
Recycling (Nb local units) 31 22 30 Collection, purification and distribution of water (Nb local units) 196 272 427 322 193 326 346
Number of persons employed - Recycling 280 268 1608
Number of people employed - Water 2522 2870 3303 2930 2797 3309 3944Source: Eurostat
3.5 Contribution of the ERDF to improving the quality of life
Concerning the quality of life, interventions such as the improvement of channelling and rehabilitation of urban areas seem key to reaching the population. According to the indicators of the programme, these interventions have benefited four million individuals. Also, improvements in terms of availability of water are an advance in terms of the quality of life. The water supplied per habitant (litre/per inhabitant/year) dramatically regressed until 2003 mostly due to population growth. But in 2007 the levels reached equalled the national average. In this matter, the contribution of the ERDF has been substantial (€495m). As numerous projects are still not finalised and not yet operating, the benefits of these investments will only become visible in the coming years.

EX POST EVALUATION OF COHESION POLICY PROGRAMMES 2000-2006 CO-FINANCED BY THE EUROPEAN FUND FOR REGIONAL DEVELOPMENT (OBJECTIVES 1 AND 2) - WORK PACKAGE 5B: ENVIRONMENT AND CLIMATE CHANGE ADE
Regional Case study – Valencia Region – October 2009 Page 27
Annex – Mission agenda
Monday 29th June to Friday 3rd July: Valencia
Institutional actors 1 Dirección General de Economía – Generalitat Valenciana
- Servicio de Política Regional y de la Competencia de la UE 2 Conselleria Medio Ambiente, Agua, Urbanismo y Vivienda– Generalitat Valenciana
- Area de Relaciones Institucionales - DG Agua (Measure 3.1, 3.2) – Planificación Hidraúlica - DG Calidad medioambiental – (Measure 3.4) - DG Territorio espacios naturales y paisaje (Measure 3.6 y 5.1)
3 Consellería de Infrastructuras y Transporte – Generalitat Valenciana - Servicio de análisis y evaluación de inversiones - DG Costas (Measure 3.5)
4 Oficiana técnica del parque de la Albufera 5 ACUAMED – (Measure 3.1, 3.2, 3.3) 6 Agencia Valenciana de la Energía – (AVEN – Measure 6.10)7 Confederación Hidrográfica del Júcar – (Measure 3.1, 3.2) 8 Demarcación Costas – Diputación de Valencia - (Measure 3.5)
Projects visited in the field 1 Modernización regadío Camp de Morvedre 2ª parte, Benifairó (Measure 3.2)
2 Abastecimiento Aguas Potables Camp de Morvedre (Measure 3.1)
3 Mejora paisajística Ayuntamiento de (Measure 5.1)
4 Playa Arbr el Gos (Measure 3.5)
5 Oficina técnica Parque Natural de Albufera - Recuperación Ullal de Senillera (3.5)
Wednesday 29 July 2009: Madrid
Institutional actors
1 Ministerio de Medio Ambiente y Medio Rural y Marino DG Aguas (Measure 3.1) Oficina Presupuestaria (Axis 3)
2 Ministerio de Economía y Hacienda DG Fondos Europeos (OP Valencia, OP local)


ADE s.a. Rue de Clairvaux, 40
B-1348 Louvain-la-Neuve Belgium
Tel.: +32 10 45 45 10 Fax: +32 10 45 40 99 E-mail: [email protected]
Web: www.ade.be
Ex post evaluation of cohesion policy programmes 2000-2006 co-financed by the European Fund for Regional Development (Objectives 1 and 2) – Work package 5b: Environment and Climate Change
RReeggiioonnaall ccaassee ssttuuddyy WWeesstt WWaalleess aanndd tthhee VVaalllleeyyss
October 2009


TThhiiss rreeppoorrtt hhaass bbeeeenn pprreeppaarreedd bbyy AADDEE aatt tthhee rreeqquueesstt ooff tthhee EEuurrooppeeaann CCoommmmiissssiioonn..
TThhee vviieewwss eexxpprreesssseedd aarree tthhoossee ooff tthhee CCoonnssuullttaanntt aanndd ddoo nnoott rreepprreesseenntt tthhee ooffffiicciiaall vviieewwss ooff tthhee EEuurrooppeeaann CCoommmmiissssiioonn..
RReepprroodduuccttiioonn oorr ttrraannssllaattiioonn iiss ppeerrmmiitttteedd,, pprroovviiddeedd tthhaatt tthhee ssoouurrccee iiss dduullyy aacckknnoowwlleeddggeedd aanndd nnoo mmooddiiffiiccaattiioonnss ttoo tthhee tteexxtt aarree mmaaddee..


EX-POST EVALUATION OF COHESION POLICY PROGRAMMES 2000-2006 CO-FINANCED BY THE EUROPEAN FUND FOR REGIONAL DEVELOPMENT (OBJECTIVES 1 AND 2) - WORK PACKAGE 5B: ENVIRONMENT AND CLIMATE CHANGE ADE
Regional Case study – West Wales and the Valleys – October 2009 Table of Contents
Table of Contents ACRONYMS
SUMMARY
1. STATUS AND FEATURES OF THE REGION .............................................................. 1
1.1 ECONOMIC SITUATION ..................................................................................................... 1 1.2 ENVIRONMENTAL SITUATION AT THE BEGINNING OF THE 2000-2006 PERIOD ...... 2 1.3 INSTITUTIONAL SET UP ..................................................................................................... 5
1.3.1 Regional development .............................................................................................. 5 1.3.2 Environmental sector ............................................................................................... 5
2. REGIONAL POLICIES AND THE ROLE OF ERDF .................................................. 7
2.1 ECONOMIC POLICIES ......................................................................................................... 7 2.2 ENVIRONMENTAL POLICIES ............................................................................................. 8
2.2.1 Description of the policies implemented .............................................................. 8 2.2.2 Interactions with EU policies .................................................................................. 9
2.3 ACTIONS TAKEN ................................................................................................................ 9 2.3.1 Environmental expenditures and main sources of funds ................................... 9 2.3.2 ERDF contribution to environmental expenditures in the region .................. 10
2.4 PLANNING PROCESS AND COORDINATION BETWEEN ALL STAKEHOLDERS ........... 13
3. ANALYSIS OF THE ERDF CONTRIBUTION .......................................................... 15
3.1 RELEVANCE OF THE 2000-2006 ERDF STRATEGY .................................................... 15 3.2 IMPLEMENTATION OF THE STRATEGY TO MEET REGIONAL CHALLENGES ............. 15 3.3 CONTRIBUTION OF ERDF TO IMPROVE THE ENVIRONMENTAL SITUATION ......... 17
3.3.1 Evolution of the environmental situation ........................................................... 17 3.3.2 Effects of the SPD on the environment ............................................................. 19
3.4 CONTRIBUTION OF ERDF TO REGIONAL ECONOMIC DEVELOPMENT ................... 21 3.5 CONTRIBUTION OF ERDF TO IMPROVE THE QUALITY OF LIFE ............................... 22
ANNEX : LIST OF STAKEHOLDERS INTERVIEWED .................................................... 25
LIST OF FIGURES
FIGURE 1: Eligible areas in region West Wales & The Valleys for Objective 1 between 2000 and 2006 ............................................................................................................... 1
LIST OF TABLES TABLE 1 : Estimates of environmental expenditures in Wales (Nuts 1) and in
West Wales and the Valleys (Nuts 2) during the 2000-2006 period (unit: £m) ..................................................................................................................... 10
TABLE 2 : Approved environmental expenditures 2000-2006 of the SDP in West Wales and the Valleys (unit: £m) ......................................................................................... 11
TABLE 3: Main outputs and results of the 2000-2006 SDP of West Wales and the Valleys in the field of environment ........................................................... 12
TABLE 4: Economic performances of the West Wales and the Valleys region .................. 21 TABLE 5: Activities linked to environment in the West Wales and the Valleys region ..... 22


EX-POST EVALUATION OF COHESION POLICY PROGRAMMES 2000-2006 CO-FINANCED BY THE EUROPEAN FUND FOR REGIONAL DEVELOPMENT (OBJECTIVES 1 AND 2) - WORK PACKAGE 5B: ENVIRONMENT AND CLIMATE CHANGE ADE
Regional Case study – West Wales and the Valleys – October 2009 Acronyms
Acronyms
AGSB Assembly Government Sponsored Body
AQMA Air Quality Management Area
CCW Countryside Council for Wales
CO2 Carbon Dioxide
DCWW Dŵr Cymru Welsh Water
EAW Environment Agency Wales
EIB European Investment Bank
ERDF European Regional Development Fund
EU European Union
FCW Forestry Commission Wales
FOI Field of Intervention
GDP Gross Domestic Product
GHG Greenhouse gas
GVA Gross Value Added
n.a. Not available
NUTS Nomenclature of Units for Territorial Statistics
PC Programme Complement
PMC Programme Monitoring Committee
PM10 Particle matter with a size range equal or inferior to 10 micrometer
PPS Purchasing Power Standard
R&D Research and Development
RES Renewable energy sources
SF Structural Funds
SF6 Sulphur Hexafluoride
SPD Single Programming Document
TAG Thematic Advisory Group
UK United Kingdom
UWWD Urban Waste Water Directive
WAG Welsh Assembly Government
WEFO Welsh European Funding Office


EX-POST EVALUATION OF COHESION POLICY PROGRAMMES 2000-2006 CO-FINANCED BY THE EUROPEAN FUND FOR REGIONAL DEVELOPMENT (OBJECTIVES 1 AND 2) - WORK PACKAGE 5B: ENVIRONMENT AND CLIMATE CHANGE ADE
Regional Case study – West Wales and the Valleys – October 2009 Summary
Summary – Key messages from the West Wales and the Valleys case study
The 2000-2006 Objective 1 West Wales and the Valleys SPD mainly focused on socio-economic issues rather than environmental issues; only 11% of the ERDF budget of the SPD was allocated to environment. In fact environment has been mainly treated as a horizontal priority (cross-cutting theme) even if some activities directly related to environment (vertical activities) were supported by ERDF. According to available financial data, the main financial sources devoted to environment in Wales (not available at NUTS 2 level) came from: Environment Agency Wales and EIB loans (only in the water sector). Even if no financial information is available, it should be noted that the private sector also played an important role in Wales, as in the wastewater sector.
In terms of the ERDF management, general lessons and specific lessons to the support to environment are the following: - In the selection procedure of the applications to be co-financed environment has been
mainly assessed as a horizontal priority based on one quite general criteria (demonstration of a positive environmental impact where possible or minimisation of any negative impacts). This selection strategy led to share the ERDF support to environment through different measures (“shopping list”) instead of strongly supporting a growth process including environmental activities.
- An independent evaluation1 pointed out needs for improvements, including: 1) delays due to a range of long processes, especially in the case of large scale capital projects; 2) clarification about state aid issues and lack of commercial viewpoint in the case of some capital environmental schemes where the private sector was involved (bureaucratic management); 3) a lack of sufficient dedicated support which could provide up front guidance and advice at the early stages of project development; 4) a lack of technical knowledge, notably within the project selection process.
As a result of relatively low ERDF expenditures in the environmental sector, the contribution of Objective 1 funds in the West Wales and the Valleys region related to the environment remains low compared to the environmental challenges. Regarding contaminated land and despoilment, direct effects of environmental activities supported by ERDF were however quite significant. Similarly, environment-friendly technologies in SMEs that were supported (e.g. through the ARENA network) had positive effects in terms of energy efficiency and reduction of pollution (in the waste sector mainly).
The Objective 1 contribution to regional development (employment, GVA, attractiveness) related to environmental activities remained low. However, the SPD allowed indirect support to enterprises (e.g. advice to reduce energy consumption, creation of basic infrastructure at industrial parks to attract new businesses, etc.) and increased to some extent the attractiveness of the region at local level mainly (e.g. Agri Park in Carmarthenshire attracting new enterprises).
Impact in terms of quality of life remains difficult to assess. There is however some evidence that supported measures of the SPD related to environment contributed positively to improving the quality of life at a local level (e.g. population living close to rehabilitated industrial website, more attractive regenerated urban centres, etc.).
1 Cross Cutting Themes Research Project (Objectives 1 & 3), Final report, July 2006.


EX-POST EVALUATION OF COHESION POLICY PROGRAMMES 2000-2006 CO-FINANCED BY THE EUROPEAN FUND FOR REGIONAL DEVELOPMENT (OBJECTIVES 1 AND 2) - WORK PACKAGE 5B: ENVIRONMENT AND CLIMATE CHANGE ADE
Regional Case study – West Wales and the Valleys – October 2009 page 1
1. Status and features of the region
1.1 Economic situation
West Wales and the Valleys (NUTS 2 level) are part of Wales (NUTS 1 level. This region had a relatively low Gross Domestic Product (GDP) per capita compared to the EU average, as with all the European Union (EU) areas benefiting from Objective 1 support. The GDP of the region in 2000 – expressed in Purchasing Power Standard (PPS) – was 73.6, compared with an average EU-25 value taken to equal 100. According to the analysis of the Welsh authorities, this low level is attributable to two main factors: 1) the high economic inactivity rate2 of the Welsh population; and 2) the lower value added per job of people at work, because of the adverse job and occupation mix.
Figure 1: Eligible areas in region West Wales & The Valleys for Objective 1 between 2000 and 2006
Source: DG Regional Policy website, 2009. Around one in four people of working age in Wales was economically inactive in 2000, especially women. The main cause of this inactivity amongst younger people was their participation in higher education. Amongst older people this economic inactivity is mainly explained by self-reported long-term illness (14% of the population of the West Wales and the Valleys region in 1998).
A major driving force of unemployment – especially amongst men – has been reduced demand for low-skill workers as a consequence of the protracted industrial decline. This problem has been more severe in Wales compared to other UK regions because the skill levels in Wales are lower than in the UK as a whole. In particular, the position in West Wales and the Valleys is worse than in the rest of Wales. Another factor is the limited tradition of entrepreneurship in the region (expect in the traditional farming sector).
2 The economic inactivity rate describes people of working age who are neither in work nor unemployed. In other words,
they are not working, not looking for work and/or not available for work.

EX-POST EVALUATION OF COHESION POLICY PROGRAMMES 2000-2006 CO-FINANCED BY THE EUROPEAN FUND FOR REGIONAL DEVELOPMENT (OBJECTIVES 1 AND 2) - WORK PACKAGE 5B: ENVIRONMENT AND CLIMATE CHANGE ADE
Regional Case study – West Wales and the Valleys – October 2009 page 2
In terms of the economic structure, the share of employment in industry in the West Wales and the Valleys region was 28.1%, with services representing 69.3% and with primary sector with 2.6%. The Welsh economy was mainly composed of small companies, i.e. with fewer than 50 employees. In terms of competitiveness and innovation, the 2000 Gross Value Added (GVA) of the West Wales and the Valleys region was £17,082 m3. This GVA is amongst the lowest of UK regions (NUTS 2 level). Indeed, the region has historically developed a pattern of specialisation in “lower order” activities with an under-representation of high value-added service industries and professional and managerial posts. This was reflected by low business expenditures in Research and Development (R&D) activities and relatively few patent applications compared to other UK regions.
As a consequence, economic challenges in the West Wales and the Valleys at the beginning of the programming period were: Achieving a high quality, job-creating, diversified, innovative and knowledge-driven
economy; Developing a skilled, enterprising and adaptable workforce; Achieving prosperity and a high quality of life for communities across urban and rural
areas.
1.2 Environmental situation at the beginning of the 2000-2006 period
A description of the key environmental characteristics of West Wales and the Valleys was set out in the ex ante evaluation of the Single Programming Document (SPD). The key characteristics identified were as follows: A rich environment at risk: West Wales and the Valleys has a very high quality
environment containing three National Parks: Snowdonia, Pembrokeshire Coast, and the Brecon Beacons. However, it also includes large areas of environmental despoilment due to past heavy industrial activity. The decline of agriculture has led to development of larger farms which threaten the distinctive nature of the Welsh countryside;
The environment is a key attribute of the region both for its own sake and as an economic asset in terms of tourism and inward investment;
The physical characteristics of the region are varied, but agriculture still remains the predominant land use activity with the countryside representing a vital resource, both in economic and social terms.
Generally the “polluter pays” principle is applied across UK sustainable development policy to ensure that social and environmental costs of development fall on those who impose them.
3 The link between GVA and GDP can be defined as: GVA (at current basic prices; available by industry only) plus
taxes on products (available at whole economy level only) less subsidies on products (available at whole economy level only) equal GDP (at current market prices; available at whole economy level only) – source: UK National Statistics, 2009)

EX-POST EVALUATION OF COHESION POLICY PROGRAMMES 2000-2006 CO-FINANCED BY THE EUROPEAN FUND FOR REGIONAL DEVELOPMENT (OBJECTIVES 1 AND 2) - WORK PACKAGE 5B: ENVIRONMENT AND CLIMATE CHANGE ADE
Regional Case study – West Wales and the Valleys – October 2009 page 3
Water supply and wastewater treatment
Wales is often considered to have abundant water resources, however the Environment Agency’s 2001 Water Resources Strategy4 identified some areas where improvements to the water environment were necessary. The availability of water resources within the region is dependent on the time of year, and the amount of rainfall. In summer, additional water for abstraction from watercourses is only available in a few parts of the region, whereas in winter water is generally available for abstraction across the catchment with a few exceptions. The Environment Agency Wales (EAW) (2001) identified a number of measures to ensure the sustainable use of water resources, including: Infrastructure improvements to move surplus water to areas of need; and Promotion of efficiency in domestic as well as commercial/industrial sectors.
In 2001-02, the average volume of water used per head per day was 148 litres for household use. Leakage over this period was 27.4% of the water supplied in Wales. In addition, sewerage infrastructure in parts of Wales was inadequate to support further development, especially along the north Wales coast and on Anglesey. Unless this issue was addressed, it was considered to limit the scope for growth.
Flood risk
Wales has a history of flood events. Transport infrastructure and development have historically been concentrated on the valley floors, lowland areas and on the coastal fringes owing to the topography of Wales, making them potentially vulnerable to flooding. The extent of flooding varied across Wales with the weather conditions, and the river systems. One significant cause of flooding was surcharging of drainage systems, which in some locations caused minor landslides and severed highways.
Solid waste
Municipal waste in Wales5 as a whole increased from 463 kilograms per person per annum in 1996-97 to 522 kilograms per person per annum in 1999-20006. In 2000, this amount of waste was slightly higher than the EU-27 average (equal to 517 kg per person per annum) and lower than the UK average (equal to 569 kg per annum).
In the beginning of the 2000-2006 programming period, about 5 million tonnes of controlled waste was disposed of in landfills in Wales each year. Of the non-controlled wastes, 4 million tonnes of agricultural waste, and 5.5 million tonnes of mine and quarry waste were produced in Wales each year.
4 Environment Agency Wales (2001). Water Resources for the Future: A Summary of the Strategy for Wales
5 No data is available for West Wales and the Valleys only.
6 State of the Environment, Welsh Assembly Government, 2008.

EX-POST EVALUATION OF COHESION POLICY PROGRAMMES 2000-2006 CO-FINANCED BY THE EUROPEAN FUND FOR REGIONAL DEVELOPMENT (OBJECTIVES 1 AND 2) - WORK PACKAGE 5B: ENVIRONMENT AND CLIMATE CHANGE ADE
Regional Case study – West Wales and the Valleys – October 2009 page 4
Air quality
Air quality in West Wales and the Valleys was generally relatively good, especially in the rural parts of the region. In urban areas however, levels of particulates (PM10) and Nitrogen Dioxide were occasionally high, which could be damaging to health.
Soil quality
Much of West Wales and the Valleys area remained rural and largely undeveloped. Farming practices (and therefore, soil quality) were of considerable local importance to the region. The agricultural land classification is used in Wales to determine suitability for agriculture; Grade 1 represents excellent soil and Grade 5, very poor soil. The West Wales and the Valleys area mainly comprised Grades 3 to 5.
Acidification associated with atmospheric pollution from anthropogenically derived sulphur and nitrogen was a problem for soils in Wales, as was soil erosion, especially in the upland areas.
Wales’ industrial past has left many soils with a wide variety of long lasting contamination from chemical pollution. Some of this contamination has been successfully addressed as part of large-scale land reclamation projects. Despite this, contamination does remain across Wales although detailed information about exactly what remains to be addressed requires detailed site investigation.
In some of the West Wales and the Valleys region which have suffered industrial spoilment, investments in environmental improvement remain necessary to promote investor confidence and release sufficient land for development.
Climate change
In 2000, the total estimated emissions in million tonnes of carbon dioxide (CO2) equivalent and sulphur hexafluoride (SF6) in Wales as a whole was 51.6 in 1995 and 56.3 in 20007. Key climate pressures identified on the eligible area included: the direct impacts on habitats and species, and the loss of some species, and sea level rise.
Landscape and biodiversity
The quality of habitats and species in Wales has been very high, as evident in the number of sites designated for their habitats and species of European importance, which affords the highest level of protection for those sites. However, some key pressure on habitats and wildlife in the eligible area comes from agricultural changes. This includes removal of traditional field boundaries, large-scale grassland improvement and ecological overgrazing by sheep; damages to bogs; over-grazing by domestic stock or wild deer, and infestation with dense rhododendron. Furthermore, coastal zones have been damaged and have remained under pressure due to development and recreational pressures, and in some cases (e.g. sand-dunes) due to a lack of grazing.
7 No data is available for West Wales and the Valleys only.

EX-POST EVALUATION OF COHESION POLICY PROGRAMMES 2000-2006 CO-FINANCED BY THE EUROPEAN FUND FOR REGIONAL DEVELOPMENT (OBJECTIVES 1 AND 2) - WORK PACKAGE 5B: ENVIRONMENT AND CLIMATE CHANGE ADE
Regional Case study – West Wales and the Valleys – October 2009 page 5
1.3 Institutional set up
1.3.1 Regional development
The National Assembly for Wales has competences over a large range of areas since 1999. This includes notably include economic development; education and training; environment and local governments. Unlike the Scottish Parliament, the National Assembly of Wales does not have full law-making powers. Primary legislation on Welsh affairs continues to be made in the UK Parliament. The UK Government however remains responsible for defence and national security, economic policy, employment legislation, foreign policy, home affairs, social security and broadcasting.
1.3.2 Environmental sector
Despite devolution, there is still a strong partnership between government in Westminster, the devolved administration, local government and the private sector. The National Assembly for Wales has a duty under section 121 of the Government of Wales Act 1998 to promote sustainable development in the exercise of its functions. Environmental protection and monitoring functions in Wales are partly delegated to the Environment Agency Wales, the Countryside Council for Wales, and local authorities. For woodlands responsibility lies with the Forestry Commission Wales.
Environment Agency Wales (EAW) is a Welsh Assembly Government Sponsored Body (AGSB), while also being part of the corporate Environment Agency for England and Wales. As an AGSB, Environment Agency Wales obtains much of its funding and direction from the Welsh Assembly Government (WAG), and reports back to them. The EAW works in partnership with the Welsh environmental sector and seeks to pursue, in partnership with others, innovative solutions that are specifically tailored to meet the needs of Wales.
EAW has wide responsibilities for managing the environment, including: acting as a champion for the environment; reducing pollution and enforcing pollution legislation; overseeing the management of waste, water resources and freshwater fisheries; reducing the harm caused by flooding; influencing others to achieve positive environmental outcomes by changing attitudes
and behaviour. The Countryside Council for Wales (CCW) is the Welsh Assembly Government’s statutory advisor on sustaining natural beauty, wildlife and the opportunity for outdoor enjoyment in Wales and its inshore waters. The Countryside Council for Wales champions the environment and landscapes of Wales and its coastal waters as sources of natural and cultural riches, as a foundation for economic and social activity, and as a place for leisure and learning opportunities.
Local authorities have statutory environmental responsibilities relating to local air pollution control, refuse collection and disposal, and monitoring drinking water quality. Together with the National Park Authorities, they also exercise the important statutory

EX-POST EVALUATION OF COHESION POLICY PROGRAMMES 2000-2006 CO-FINANCED BY THE EUROPEAN FUND FOR REGIONAL DEVELOPMENT (OBJECTIVES 1 AND 2) - WORK PACKAGE 5B: ENVIRONMENT AND CLIMATE CHANGE ADE
Regional Case study – West Wales and the Valleys – October 2009 page 6
planning function and have responsibilities for local traffic management. They are required to identify and remediate contaminated land, and have a key role in promoting local sustainable development initiatives. In addition, local authorities are encouraged to promote waste minimisation and recycling.
Forestry Commission Wales (FCW) acts as the Welsh Assembly Government’s Department of Forestry. FCW is responsible for managing the 38% of Welsh woodlands owned by the Assembly. FCW advises, on Welsh Assembly Government’s behalf, on the development of forestry policy and its implementation. They also encourage sustainable woodland management within the private sector and are responsible for administering grants and regulatory work, including licensing for felling and replanting. Dŵr Cymru Welsh Water is the sixth largest of the ten regulated water and sewerage companies in England and Wales. It is responsible for providing over three million people with drinking water and treating and disposing of wastewater across Wales and some adjoining parts of England. Ofwat, the Water Services Regulation Authority, is the economic regulator of the water and sewerage companies in England and Wales. Since 2001, Welsh Water has been owned by Glas Cymru, a “not-for-profit” company.
In addition, certain voluntary organisations undertake a variety of administrative roles in connection with the environment.
EX-POST EVALUATION OF COHESION POLICY PROGRAMMES 2000-2006 CO-FINANCED BY THE EUROPEAN FUND FOR REGIONAL DEVELOPMENT (OBJECTIVES 1 AND 2) - WORK PACKAGE 5B: ENVIRONMENT AND CLIMATE CHANGE ADE
Regional Case study – West Wales and the Valleys – October 2009 page 7
2. Regional policies and the role of ERDF
2.1 Economic policies
There were no specific sub regional approaches specific to West Wales and the Valleys for addressing economic or environmental challenges. The regional economic strategies to be applied to the sub-region are those established for the Wales region as a whole.
The Welsh Assembly Government (WAG), which was created at the beginning of the 2000-2006 programming period, published several regional economic strategies and plans during the programming period. A Winning Wales is the national economic development strategy set up by WAG in January 2002 and updated in November 2003. The vision of this strategy is to achieve a prosperous Welsh economy that is dynamic, inclusive and sustainable, based on successful, innovative businesses with highly skilled, well-motivated people. Demanding targets to be reached within 10 years were set in 2002: raising total employment by 135,000; improving enterprise and innovation; raising not just skill levels but Wales’ learning performance at every level; ensuring that Wales uses world-class electronic communications to their full potential.
At the top of these targets, four specific objectives were set out: development of a better coordinated and well-targeted business support network; dynamic development of the Welsh green economy, including sustainable agriculture
and energy production; smarter ways of connecting Wales to international business opportunities; support for the social business sector which can bring growth and opportunity to
disadvantaged communities.
Besides A Winning Wales, other sectoral plans and strategies have been designed such as Wales: A Vibrant Economy. In response to EC Competitiveness reports identifying that there was insufficient innovative activity and weak diffusions of information and communications technologies in Wales as in other EU regions, the WAG launched a new business support service and the Welsh innovation plan Wales for Innovation in 2003. The Wales Spatial Plan (2004) was established in order to provide a clear framework for the sustainable development in Wales. This included promotion of collaborative working and decision making at all the levels: regional authorities, local authorities and the business community.
The EU 2000-2006 Structural Fund programmes provided support to the implementation of the economic development strategy for Wales. In this context, the Objective 1 West Wales and the Valleys Single Programming Document (SPD) was devoted provide financial resources to support activities under the strategy A Winning Wales. The SPD was definitely business-oriented, aiming to develop the SME base in the region.

EX-POST EVALUATION OF COHESION POLICY PROGRAMMES 2000-2006 CO-FINANCED BY THE EUROPEAN FUND FOR REGIONAL DEVELOPMENT (OBJECTIVES 1 AND 2) - WORK PACKAGE 5B: ENVIRONMENT AND CLIMATE CHANGE ADE
Regional Case study – West Wales and the Valleys – October 2009 page 8
2.2 Environmental policies
2.2.1 Description of the policies implemented
In early 2000, the National Assembly for Wales (NAW) published a Strategic Plan for Wales (Better Wales, March 2000), which made sustainable development one of its three priority themes. Based on this, Better Wales identifies a number of targets for action by 2003. In the area of sustainable development, the targets included: improved awareness of environmental and sustainability issues; growth in environmentally-friendly economic activity; growth in sustainable farming; improved energy efficiency, use of clean energy, recycling, waste minimisation; improved public transport and cycle use; and growth in sustainable tourism.
In addition, Better Wales stipulated that account should be taken of the likely impact on the environment of new companies and projects co-financed by the Objective 1 programme. The Objective 1 programme is acknowledged in the Strategic Plan as being a major contributor to meeting the targets and actions of the Plan.
Environmental sustainability is identified as one of three cross-cutting themes of the SPD. Its rationale – namely to maintain and enhance the assets of the region – is derived from the State of the Environment Reports from the EAW and CCW/Forestry Commission Wales. These reports identified and examined the pressures on, and current state of, the environment in Wales and recommended a number of appropriate responses to address these.
The Welsh Assembly Government has sustainable development as a core principle within its founding statute. This duty, which was contained within the Government of Wales Act 1998 and which now falls under the Government of Wales Act 2006 (Section 79), requires Welsh Ministers to set out how they propose, in the exercise of their functions, to promote sustainable development. The first Sustainable Development Scheme Learning to Live Differently was published in 2000 and was followed by Starting to Live Differently in 2004. The Welsh Assembly Government also published The Sustainable Development Action Plan 2004-2007. Towards the end of the programme period, the Welsh Assembly Government published Environment Strategy for Wales and its accompanying Action Plan (2006).
It is also worth noting that the Assembly’s Action Plan of its Environment Strategy stipulates that the region will seek to ensure that European structural funds are used to deliver environmental outcomes that are compatible with the outcomes in the Environment Strategy.
Even if there were several projects specifically devoted to environment, this theme has been mainly treated as a cross-cutting theme in the SPD (“Environmental sustainability”). The SPD aimed at delivering eight general objective in terms of environmental sustainability8. However, there was no clear strategy for ERDF support to environment in
8 1) Save energy by development of a sustainable energy strategy; 2) Promote integrated transport; 3) promote efficient
use of natural resources; 4) Support sustainable land use; 5) Protect and enhance biodiversity; 6) Promote environmental education; 7) Develop monitoring programmes to establish links between community health and

EX-POST EVALUATION OF COHESION POLICY PROGRAMMES 2000-2006 CO-FINANCED BY THE EUROPEAN FUND FOR REGIONAL DEVELOPMENT (OBJECTIVES 1 AND 2) - WORK PACKAGE 5B: ENVIRONMENT AND CLIMATE CHANGE ADE
Regional Case study – West Wales and the Valleys – October 2009 page 9
the region specifying how to reach the objectives. ERDF was most often used as a shopping list allowing different types of activities linked to environment (e.g. rehabilitation of industrial sites). In other words, ERDF support to environment was not used to strongly support a growth process for the region, including environmental activities.
2.2.2 Interactions with EU policies
At 31 December 2000 the UK as a whole was 90% compliant with the requirement of the EU Directive to provide secondary treatment for discharges from agglomerations of more than 15,000 population equivalent. By the end of 2002 the UK was 98% compliant as a further 59 discharges will then receive secondary treatment.
Wales does not really meet problems with the Urban Waste Water Directive (UWWD) and sensitive areas. River quality between 1996 and 2000 remained high in Wales. Water companies achieved 99.94% compliance with drinking water standards in Wales in 2006. In Wales as a whole (although not all of these will be in the West Wales and the Valleys area), only a few sensitive areas have been designated under the UWWD (1 in 1994, 2 in 1998 and 2 in 2002) and nitrate (none).
In relation to waste management in Wales, the UK Government sets the framework for primary legislation and has the lead responsibility for policy areas not devolved to the Welsh Assembly Government (e.g. taxation). The National Waste Strategy for Wales 9 provides policies and guidance on planning for waste facilities. The Assembly has powers to introduce or amend secondary legislation relating to waste and litter to give direction to local authorities on their waste management and litter control functions. The Environment Agency Wales has statutory duties and powers to licence, permit, register and regulate waste management activities (including transportation) to ensure they do not cause pollution or harm to human health (with the exception of certain, usually small scale, facilities which are regulated by local authorities under the Pollution prevention and Control Regulations).
2.3 Actions taken
2.3.1 Environmental expenditures and main sources of funds
It is difficult to assess the total environmental expenditures in West Wales and the Valleys during the programming period. Except for Objective 1 funds, financial data are not available at the level of the region West Wales and the Valleys only. No data is available for the private sector and for local authorities. Indications on the environmental expenditures for the 2000-2006 programming period are nonetheless provided in the table below, based on evaluators’ estimations.
environmental quality; 8) Improve the quality of the environment to support sustainable development and protect vulnerable communities.
9 “Wise About Waste: the National Waste Strategy For Wales” (Welsh Assembly Government) June 2002 - this document replaced Waste Strategy 2000 (England and Wales) as the National Waste Strategy for Wales. It established a programme of change for ten years. Consultation is currently ongoing on “Waste Strategy 2009 – 2050: Towards Zero Waste”, a draft strategy which sets out how the Assembly Government proposes to build on “Wise about Waste – The National Waste Strategy for Wales”.

EX-POST EVALUATION OF COHESION POLICY PROGRAMMES 2000-2006 CO-FINANCED BY THE EUROPEAN FUND FOR REGIONAL DEVELOPMENT (OBJECTIVES 1 AND 2) - WORK PACKAGE 5B: ENVIRONMENT AND CLIMATE CHANGE ADE
Regional Case study – West Wales and the Valleys – October 2009 page 10
Wales received two loans from EIB during the programming period: 1) Environmental upgrading of wastewater treatment infrastructure in Wales (€52.8m on 12/08/2004); 2) Water supply and wastewater networks in Wales (€146.6m on 5/12/2005). Both focused on water supply and waste water treatment10.
Table 1 : Estimates of environmental expenditures in Wales (Nuts 1) and in West Wales and the Valleys (Nuts 2) during the 2000-2006 period (unit: £m)
Region
Environmental expenditures
Solid Waste
Water Quality
(including wastewater)
Water
Resources
Flood Risk
Management
Other fields11 Total
Investment only
Wales (Nuts 1 level) Environment Agency Wales
613.6 n.a. 72.0 95.4 137.8 249 59.4
EIB loans (for the whole of Wales) 132.412 - - 132.4 - - -
West Wales and the Valleys (Nuts 2 level) Welsh contribution to the 2000-2006 SPD WW&V
88.4 n.a n.a. n.a. - n.a. n.a.
ERDF contribution to the 2000-2006 SPD WW&V
88.4 n.a. 15.1 1.13 - 6.4 65.8
Source: ADE, 2009 based on information communicated by EAW, EIB and Welsh Management authorities.
Even though Table 1 above must be considered with caution due to the lack of data, two main findings can be drawn: compared to other sources of funding, the contribution of ERDF in West Wales and
the Valleys to support environmental expenditures appeared to be relatively low (less than 10% of total environmental expenditures);
the sector of wastewater has been largely supported by EIB loans while ERDF contributed to this sector to a very small extent.
2.3.2 ERDF contribution to environmental expenditures in the region
Financial contribution and main fields of intervention
In the 2000-2006 programming period, total Objective 1 funds to the West Wales and the Valleys region amounted to around £772.3m, including a total of £88.4m devoted to the environment. The share of ERDF expenditures of the SPD to the environment remains thus quite low: around 11% of the total ERDF contribution in the region for the 2000-2006 period.
10 Since 2006, Wales has benefited from other EIB loans, sometimes shared with other UK regions: 1) Environmental
upgrading of water supply and wastewater treatment infrastructure in Midlands (England) and central Wales (€220.6m on 15/06/2007; 2) Water supply and wastewater treatment schemes in Wales (€126.5m on 23/10/2008); 3) Upgrading of water and wastewater infrastructure in Midlands and Wales (€161.2m on 22/04/2009).
11 This item includes support to environment-friendly technologies to SMEs, rehabilitation of industrial/military sites, fisheries, navigation, recreation, and conservation).
12 Average currency exchange rate used (2004-2005): €1 = £ 0.664
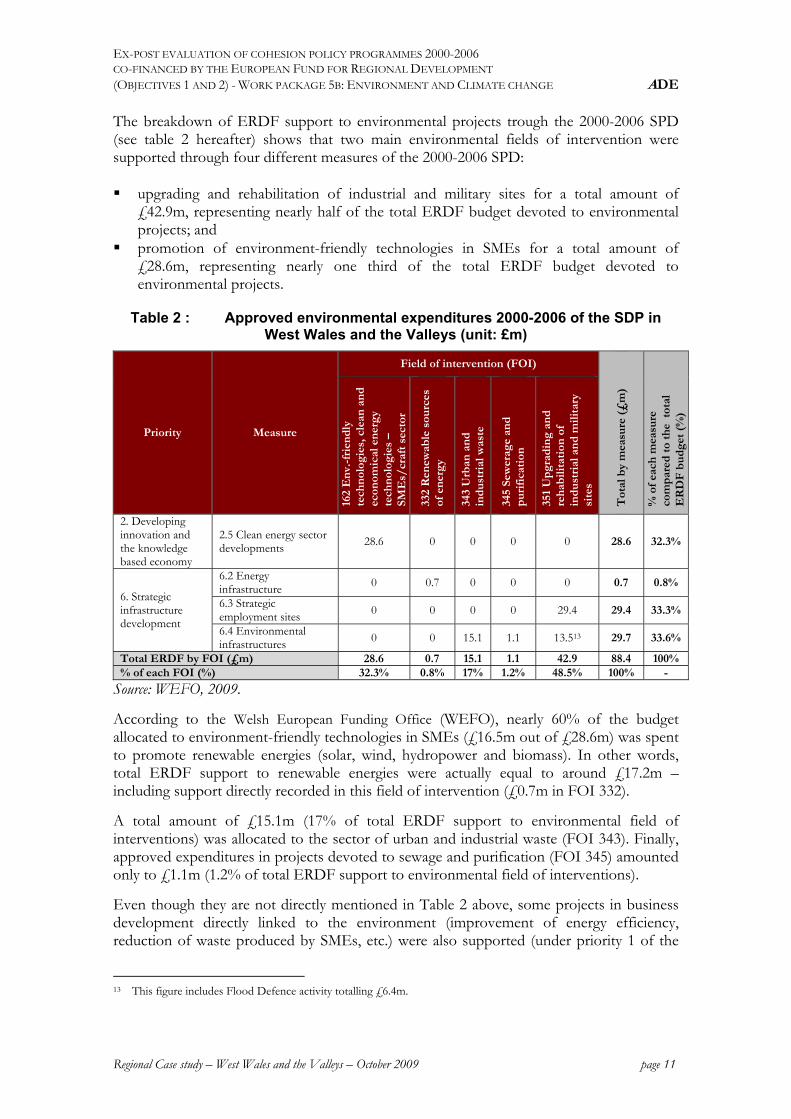
EX-POST EVALUATION OF COHESION POLICY PROGRAMMES 2000-2006 CO-FINANCED BY THE EUROPEAN FUND FOR REGIONAL DEVELOPMENT (OBJECTIVES 1 AND 2) - WORK PACKAGE 5B: ENVIRONMENT AND CLIMATE CHANGE ADE
Regional Case study – West Wales and the Valleys – October 2009 page 11
The breakdown of ERDF support to environmental projects trough the 2000-2006 SPD (see table 2 hereafter) shows that two main environmental fields of intervention were supported through four different measures of the 2000-2006 SPD: upgrading and rehabilitation of industrial and military sites for a total amount of
£42.9m, representing nearly half of the total ERDF budget devoted to environmental projects; and
promotion of environment-friendly technologies in SMEs for a total amount of £28.6m, representing nearly one third of the total ERDF budget devoted to environmental projects.
Table 2 : Approved environmental expenditures 2000-2006 of the SDP in West Wales and the Valleys (unit: £m)
Priority Measure
Field of intervention (FOI)
Tot
al b
y m
easu
re (
£m
)
% o
f ea
ch m
easu
re
com
par
ed t
o th
e t
otal
E
RD
F b
ud
get
(%)
162
En
v.-f
rien
dly
te
chn
olog
ies,
cle
an a
nd
ec
onom
ical
en
ergy
te
chn
olog
ies
– SM
Es/
craf
t se
ctor
332
Ren
ewab
le s
ourc
es
of e
ner
gy
343
Urb
an a
nd
in
du
stri
al w
aste
345
Sew
erag
e an
d
pu
rifi
cati
on
351
Up
grad
ing
and
re
hab
ilita
tion
of
ind
ust
rial
an
d m
ilita
ry
site
s
2. Developing innovation and the knowledge based economy
2.5 Clean energy sector developments
28.6 0 0 0 0 28.6 32.3%
6. Strategic infrastructure development
6.2 Energy infrastructure 0 0.7 0 0 0 0.7 0.8%
6.3 Strategic employment sites 0 0 0 0 29.4 29.4 33.3%
6.4 Environmental infrastructures 0 0 15.1 1.1 13.513 29.7 33.6%
Total ERDF by FOI (£m) 28.6 0.7 15.1 1.1 42.9 88.4 100% % of each FOI (%) 32.3% 0.8% 17% 1.2% 48.5% 100% -
Source: WEFO, 2009.
According to the Welsh European Funding Office (WEFO), nearly 60% of the budget allocated to environment-friendly technologies in SMEs (£16.5m out of £28.6m) was spent to promote renewable energies (solar, wind, hydropower and biomass). In other words, total ERDF support to renewable energies were actually equal to around £17.2m – including support directly recorded in this field of intervention (£0.7m in FOI 332).
A total amount of £15.1m (17% of total ERDF support to environmental field of interventions) was allocated to the sector of urban and industrial waste (FOI 343). Finally, approved expenditures in projects devoted to sewage and purification (FOI 345) amounted only to £1.1m (1.2% of total ERDF support to environmental field of interventions).
Even though they are not directly mentioned in Table 2 above, some projects in business development directly linked to the environment (improvement of energy efficiency, reduction of waste produced by SMEs, etc.) were also supported (under priority 1 of the
13 This figure includes Flood Defence activity totalling £6.4m.

EX-POST EVALUATION OF COHESION POLICY PROGRAMMES 2000-2006 CO-FINANCED BY THE EUROPEAN FUND FOR REGIONAL DEVELOPMENT (OBJECTIVES 1 AND 2) - WORK PACKAGE 5B: ENVIRONMENT AND CLIMATE CHANGE ADE
Regional Case study – West Wales and the Valleys – October 2009 page 12
SPD, which is called Expanding and Developing the SME Base). For example, the 2000-2006 SPD supported the ARENA network, an independent organisation providing practical support to business and other organisations primarily in Wales on environmental management and training related issues.
Main outputs and results
Table 3 below shows targets and achieved values of indicators related to environmental (part of) measures monitored by WEFO.
Table 3: Main outputs and results of the 2000-2006 SDP of West Wales and the Valleys in the field of environment
Output/ result indicator
Programme Complement (PC) target (2000-06)
Outputs and results at 31/10/2008 Forecast Actual
NumberPercentage
of PC Target
Number Percentage of
PC Target
SMEs adopting environmental management systems14 750 901 100+% 941 100+%
Companies provided with environmental technology transfer
300 564 100+% 522 100+%
No. of exemplar models developed for clean energy
6 33 100+% 95 100+%
No. of research initiatives supported 6 8 100+% 8 100+% Community environmental appraisals undertaken
200 265 100+% 289 100+%
No. of community environmental enhancement projects supported 500 808 100+% 874 100+%
No. of hectares of derelict/contaminated land improved 1,000 902 90% 940 94%
No. of hectares of contaminated land rehabilitated 80 69 86% 41 52%
No. of water efficiency schemes 8 1 13% 1 13% No. of major flood defence schemes 12 11 92% 10 83% No. of properties with reduced flood risk 1,900 3,468 100+% 2,971 100+%
NB: “100+%” means “over 100%”. Source: WEFO communication, April 2009.
According to information received from WEFO, the majority of targets related to environmental projects were exceeded or nearly reached. Some exceptions appear: the number of hectares of contaminated land rehabilitated (52% of the target was
reached) because of the “orphan sites” issue; the number of water efficiency schemes (13% of the target was reached) due to the
inability of the Structural funds to fund statuary duties. In addition, there were numerous state aid issues with funding private companies to undertake this work.
14 This indicator relates to the priority 1 of the SPD Expanding and Developing the SME Base for which ERDF allocations
were recorded under a non-environmental field of intervention according to the classification of 2000-2006 ERDF expenditures.

EX-POST EVALUATION OF COHESION POLICY PROGRAMMES 2000-2006 CO-FINANCED BY THE EUROPEAN FUND FOR REGIONAL DEVELOPMENT (OBJECTIVES 1 AND 2) - WORK PACKAGE 5B: ENVIRONMENT AND CLIMATE CHANGE ADE
Regional Case study – West Wales and the Valleys – October 2009 page 13
2.4 Planning process and coordination between all stakeholders
The Managing Authority for the Structural Fund programmes in Wales is the National Assembly for Wales. To facilitate the effective management of Structural Fund in Wales, the Welsh European Funding Office (WEFO) was established. WEFO is now a division of the Department for the Economy and Transport within the Welsh Assembly Government (WAG). WEFO is responsible for the design and management of the Objective 1 West Wales and the Valleys SPD.
The Programme Monitoring Committee (PMC) oversees the effectiveness and quality of the programme. It is chaired by an Assembly Member and consists of 18 members drawn equally from the public, private and the voluntary sector. It makes key decisions, approves significant documents and monitors overall progress of the programme.
One of the six priority considerations for the selection of projects is the demonstration of a positive environmental impact where possible or minimisation of any negative impacts. This criterion is the only one dealing with environment and remains quite general. No specific environmental criterion has been used to select the project.
The Environment Agency Wales (EAW) has had a key role in integrating the environment into the 2000-2006 SPD. It has had a permanent seat on the PMC for the Objective 1 programme during the whole period of 2000-2006. This enabled the EAW to give expertise to the PMC on environmental issues, and to help steer the programme.
Since 2002 EAW have seconded a specialist member of their staff into WEFO, to set up and build capacity in the Cross-cutting theme team, and to deliver Environment Sustainability across the whole programme. This has helped make the programme more sustainable, as any project in any priority had to include specific environmental outcomes. It has also helped with “greening” the Operational Programme itself, in terms of its environmental targets.
Local Strategic Partnerships cover each Local Authority area 15 . The Partnerships are responsible for developing local strategy in line with the overall programme strategy. They promote the programme locally and provide aftercare for projects that have been approved.
Six thematic Advisory Groups (TAGs) were set up in January 2004 for advising WEFO on strategic direction and most effective use of resources in the Objective 1 area that they cover, including one on environmental issues.
In terms of planning and implementation of the approved projects, the final evaluation of the 2000-2006 SPD devoted to cross-cutting themes 16 have underlined that (long) processes such as planning permission often lengthened the project development phase after approval. As a result, the start of the project implementation – especially regarding large scale capital projects – was most often delayed.
15 Local Strategic Partnerships existed in each of the 22 unitary authorities in Wales. For map of local authorities in
Wales see for example http://www.gwydir.demon.co.uk/uklocalgov/localgov.htm. Local Strategic Partnerships are currently in the process of being replaced by Local Service Boards.
16 Cross-cutting Themes Research Project (Objectives 1 and 3), Final report, July 2006.


EX-POST EVALUATION OF COHESION POLICY PROGRAMMES 2000-2006 CO-FINANCED BY THE EUROPEAN FUND FOR REGIONAL DEVELOPMENT (OBJECTIVES 1 AND 2) - WORK PACKAGE 5B: ENVIRONMENT AND CLIMATE CHANGE ADE
Regional Case study – West Wales and the Valleys – October 2009 page 15
3. Analysis of the ERDF contribution
3.1 Relevance of the 2000-2006 ERDF strategy As pointed out above, the Objective 1 West Wales and the Valleys SPD spent a relatively small share of its total budget on environmental expenditures (around 11% of the total 2000-2006 budget). The environment was partially treated “vertically” (sectoral approach) with a specific focus put on it as a theme with a number of individual environmental projects17. It was also considered as a “horizontal” priority or a cross-cutting theme.
It was then expected that the SPD could thus not contribute significantly to improvement in the field of environment in West Wales and the Valleys during the 2000-2006 period. Based on available figures (see Table 2 above18), it appears that the main environmental expenditures were made through national Welsh funds – managed by EAW – and EIB loans, in particular in the field of wastewater.
3.2 Implementation of the strategy to meet regional challenges
The 2006 independent evaluation assessed the integration and results for the environment amongst other cross-cutting themes (information and communications technology, and equal opportunities)19. It pointed out several barriers to effective implementation in the framework of the 2000-2006 Objectives 1 and 3 – including ERDF – in Wales. The main conclusions can be summarised as follows: Where the private sector was involved, state aid issues appeared in the cases of capital
environmental schemes. For example, supporting the water sector in Wales remained difficult because the UK wastewater sector is completely privatised, except Dŵr Cymru Welsh Water (DCWW) 20 . In addition, engaging the SPD with the private sector generally proved difficult due to a limited commercial viewpoint from management authorities ;
The overall system is felt to be overly bureaucratic and that this has led to some reluctance to impose more monitoring requirements in relation to the themes, including sustainable development ;
Whilst there were advisers and other support, there was still a lack of sufficient dedicated support which could provide up-front guidance and advice at the early stages of project development. A key element at the the level of the Managing Authorities is the lack of knowledge and experience of building the cross-cutting themes, including environment.
Many aspects of the cross-cutting themes – including sustainable development – involved specialised and detailed knowledge. In some cases, technical knowledge was lacking within the project selection process.
17 Clean energy projects, support for recreational opportunities and management of the natural environment, projects in
energy infrastructure and environmental infrastructures.
18 These figures have to be treated carefully due to lack of data, notably at the level of the private sector.
19 Cross Cutting Themes Research Project (Objectives 1 & 3), Final report, July 2006.
20 Dwr Cymru Welsh Water which is a single purpose company with no shareholders and which is run solely for the benefit of customers.

EX-POST EVALUATION OF COHESION POLICY PROGRAMMES 2000-2006 CO-FINANCED BY THE EUROPEAN FUND FOR REGIONAL DEVELOPMENT (OBJECTIVES 1 AND 2) - WORK PACKAGE 5B: ENVIRONMENT AND CLIMATE CHANGE ADE
Regional Case study – West Wales and the Valleys – October 2009 page 16
Box 1: Example of difficulties met by beneficiaries in the 2000-2006 programming period: the case of DCWW
Dŵr Cymru Welsh Water (DCWW) raised a number of issues regarding the Carmarthenshire Industrial Infrastructure, Capacity Expansion - Cross Hands project which was supported by ERDF: Time delay for grant approval - DCWW pointed out that it took 16 months to
get grant approval and that in this time companies had the possibility to have invested their money elsewhere.
Planning permission - this project could be undertaken without the need for planning permission as the works fell under ‘permitted development’ – Town & Country Planning Act (General Permitted Development) Order 1995 Schedule 2 Part 16 Development by or on behalf of Sewerage Undertakers. This allowed the project to be fast tracked and delivered within a short timescale. If this had not been the case, it may not have been possible to use the ERDF grant within the time limits required.
Source of funding - DCWW raised the question of who would have funded these works if an ERDF grant had not been approved, as it was not included in DCWW’s asset management plan.
Status of DCWW and its procurement procedures - DCWW raised the issue that there is a general lack of understanding of how the water industry is regulated and in particular the unique status of DCWW amongst privatised water companies in the UK as it is not-for-profit. In addition, there were questions raised during the Article 4 process regarding the fact that as DCWW does not have in-house engineering / construction capacity. DCWW out-sourced this work under the framework agreement it has with private engineering companies. DCWW used these companies to undertake the work, like any other capital works they undertake, rather than going out to tender for this specific project separately. They argued that the tendering process for the framework contract had followed all the relevant European procurement requirements.
DCWW’s financial records - DCWW uses a computerised SAP system which requires very few hard copies, therefore specifically for this project they had to establish a document cross referencing system.

EX-POST EVALUATION OF COHESION POLICY PROGRAMMES 2000-2006 CO-FINANCED BY THE EUROPEAN FUND FOR REGIONAL DEVELOPMENT (OBJECTIVES 1 AND 2) - WORK PACKAGE 5B: ENVIRONMENT AND CLIMATE CHANGE ADE
Regional Case study – West Wales and the Valleys – October 2009 page 17
3.3 Contribution of ERDF to improve the environmental situation
3.3.1 Evolution of the environmental situation
In Wales as a whole21, the quality of water supply has significantly increased since the beginning of the programming period. The tests failing the old quality standards decreased from 0.32% in 1996 to 0.23% in 2000 and 0.14% in 2003 and the tests failing the new quality standards decreased from 0.08% in 2004 to 0.04% in 200622.
By 2005, DCWW which provides wastewater services to an area slightly larger than the West Wales and the Valleys region, state that they will have spent over £1.5billion – 62% of the total investment programme for sewerage and wastewater treatment assets over Asset Management Plan 2, 1995-2000, and AMP3, 2000-2005. This will enhance wastewater assets to achieve compliance with EU Directives such as the Urban Waste Water Directive (UWWD), the Bathing Water Directive, River Quality objectives, Habitats Directive and the Shellfish Directive. 23
The percentage of river lengths in Wales (surveyed as part of the general quality assessment scheme by the Environment Agency) that are classified as being of either good or fair chemical and biological quality has consistently been higher than 98% since 1994. The percentage of river lengths in Wales of good or fair biological quality has consistently been 99 per cent or higher since 2002 (in 2000 it was 98.8%).
There are 81 EC identified bathing waters around the Welsh coastline, all of which fall in West Wales. The percentage of bathing waters which comply with the mandatory EC standards in Wales has remained above 90% since 1996, but has decreased from 0% in 2005 to 97.5% in 2007. The proportion of bathing waters which comply with the guideline EC standards in Wales increased from just over 40% in 1996 to over 90% in 2005, but then decreased to 86.3% in 2007. This situation was better than for the rest of the UK.
There are also 106 non-EC identified bathing waters in West Wales and in 2005, 95% of which met the minimum standards and 57% met the stricter guideline standards. 5% of these bathing waters failed to meet the minimum standards in 2005.
The total amount of municipal waste24 produced in Wales increased from 569 kg per person in 2000-2001 to 643kg per person in 2005-2006, but has since decreased to 604kg per person in 2007-2008. The percentage of municipal waste recycled or composted in Wales increased over this period, from 8.6% in 2000-01 to 25.5% in 2005-06 and 33.6% in 2007-200825.
21 It should be noted that where data is not available for 2000-2006 exactly, the nearest years have been used and whilst
data specifically relating to West Wales and the Valleys has been sought, if this is not available data for the whole of Wales has had to be used.
22 Statistics for Wales (2008) State of the Environment, 2008.
23 Dŵr Cymru Welsh Water (April 2005) Monitoring Plan 2005-2010.
24 Note: Municipal waste refers to household waste plus waste collected from non-household sources, and here excludes abandoned vehicles. Recycling/composting includes waste sent or collected for recycling/composting from household and non-household sources plus waste collected by private and voluntary organisations.
25 Statistics for Wales (2008) State of the Environment, 2008

EX-POST EVALUATION OF COHESION POLICY PROGRAMMES 2000-2006 CO-FINANCED BY THE EUROPEAN FUND FOR REGIONAL DEVELOPMENT (OBJECTIVES 1 AND 2) - WORK PACKAGE 5B: ENVIRONMENT AND CLIMATE CHANGE ADE
Regional Case study – West Wales and the Valleys – October 2009 page 18
The total estimated greenhouse gas (GHG) emissions in million tonnes of Carbon Dioxide (CO2) equivalent in Wales was 55.2 in 1990, 56.3 in 2000 and 51.1 in 2006. The overall effect has been an estimated decrease of 7.4 per cent in GHG emissions from Wales in 2006 compared to base year emissions.
Wales already has a number of renewable energy sources (RES) in place, the majority of which are situated in the West Wales and the Valleys region. Between 2003 and 2007 there was a 86% increase in generation from renewable energy sources in the UK as a whole, but the rate of growth was slower in Wales at 78%, from 768.9 kWh in 2003 to 1,369.5 kWh in 2007. The majority of the electricity was generated from wind and wave (864 kWh), followed with distance by hydro (283.7 kWh), landfill gas (192.6 kWh) and other biofuels (29.2 kWh). Wind and wave generation increased by 120.1% between 2003 and 2007, from 391.0 kWh to 864.0 kWh.26 Over 150,000 residential properties in Wales are at risk of flooding by rivers or the sea27. Following major flooding incidents in Wales in 1979, 1998 and 2000, flood defences have been improved and flood warning systems put in place throughout Wales. The Environment Agency Wales and Local Authorities are responsible for maintaining these defence systems. Currently, there are 123km of flood defences in the West Wales region (Environment Agency Wales GIS data, 2006).
EAW estimates that the current annual cost of flooding in Wales is around £70m, which would rise to £220m if there were no flood defences present. If current trends continue and an integrated flood management system is not introduced to reduce future costs of flooding, the annual cost of flooding is estimated to increase by between £121m and £1,235m by 2080 due to climate change.28
Soil acidification associated with atmospheric pollution is an important issue in Wales. It has been estimated that 34% of all soils in Wales are affected by acidic deposition. In terms of nature conservation, Wales is the worst affected region in the UK with more than 40% of the total area of Sites of Special Scientific Interest potentially damaged by freshwater acidification29. No up-to-date or trend data has been identified for acidification and soils in Wales.
Soil erosion is also an issue in the West Wales and the Valleys area, especially in the upland areas, where soils tend to be thin and therefore more prone to negative impacts (soil exposure, capping and increased overland flow) from overgrazing. No up-to-date or trend data has been identified for soil erosion in Wales. However, The Environmental Strategy for Wales (WAG, 2006) acknowledges the vulnerability of soils in Wales to acidification and erosion and their importance in terms of ecology and as a carbon sink and commits to manage Wales’ soils resource in the future.
26 Department for Business, Enterprise & Regulatory Reform (September 2008) Energy trends. A National Statistics
Publication
27 Welsh Assembly Government (2006) Environmental Strategy for Wales
28 West Wales and the Valleys ERDF Convergence Programme Strategic Environmental Assessment (SEA) Environmental Report. DTZ / Royal Haskoning on behalf of the Welsh European Funding Office (March 2007)
29 Stevens, P.A., Ormerod, S.J. and Reynolds, B., (1997). Final Report on the Acid Waters Survey for Wales. Institute of Terrestrial Ecology, Bangor, UK. As reported in the West Wales and the Valleys ERDF Convergence Programme SEA

EX-POST EVALUATION OF COHESION POLICY PROGRAMMES 2000-2006 CO-FINANCED BY THE EUROPEAN FUND FOR REGIONAL DEVELOPMENT (OBJECTIVES 1 AND 2) - WORK PACKAGE 5B: ENVIRONMENT AND CLIMATE CHANGE ADE
Regional Case study – West Wales and the Valleys – October 2009 page 19
3.3.2 Effects of the SPD on the environment
Projects co-funded by the 2000-2006 ERDF have had several different effects on the environment in West Wales and the Valleys taking into account their nature: increased use of environment-friendly technologies in SMEs, upgrading and rehabilitation of industrial sites, rehabilitation of urban areas, improved sewerage and purification and better flood risk prevention. These effects are detailed below. In terms of environment-friendly technologies in SMEs In the 2000-2006 period, ERDF supported several projects in green innovation in Welsh SMEs. Thanks to this support, it is estimated that 941 SMEs have adopted environmental management systems, 522 companies were provided with environmental technology transfer and 95 exemplar models for clean energy have been developed. One of the beneficiaries of the co-funded projects in this area was the ARENA network (total grant equivalent to £4.6m through three projects30). The aim of this network is to promote greater environmental awareness, the adoption of best practice and sustainable development whilst improving overall business performance and competitiveness. In undertaking their work, ARENA Network seeks to provide independent, professional and high-quality advice on a not-for-profit basis. As a result of effective environmental management, SMEs receive the Green Dragon Environment, which offers an environmental management system relevant to the specific needs of a company and rewards actions taken to achieve environmental improvements.
According to the ARENA network, it is estimated that the overall activities from the network – partially supported by ERDF during the 2000-2006 – allowed the following savings in Wales: Energy savings: £3 million per year; CO2 savings: 10,000 tonnes per year; Waste savings: £6.7 million per year; 75,000 tonnes of waste diverted from landfill; 260 companies making capital investments in environmental improvements.
In terms of upgrading and rehabilitation of industrial sites
The main part of the 2000-2006 ERDF co-funding in West Wales and the Valleys was devoted to environmental measures allocated to projects aiming at upgrading and rehabilitating industrial sites. These projects contributed to the improvement of 940 hectares of derelict/ contaminated land as well as the rehabilitation of 41 hectares of contaminated land. As a result, ERDF significantly contributed to rehabilitating the Welsh areas, often polluted and contaminated by heavy industries whose activities had stopped.
However, this support was also used as leverage for other private or public interventions. For example, small grant (£100,000) was used with other funds31 to prepare a vacant
30 They are: Environmental Innovation and Competitiveness, Green Dragon Environmental Grants, Green Dragon Environmental
Support for SMEs.
31 Match funding was provided by the Welsh Development Agency (WDA) and the City and County of Swansea.

EX-POST EVALUATION OF COHESION POLICY PROGRAMMES 2000-2006 CO-FINANCED BY THE EUROPEAN FUND FOR REGIONAL DEVELOPMENT (OBJECTIVES 1 AND 2) - WORK PACKAGE 5B: ENVIRONMENT AND CLIMATE CHANGE ADE
Regional Case study – West Wales and the Valleys – October 2009 page 20
industrial site (25 hectares) with a view to attracting industrial activities. The co-funded works concentrated on bringing the existing site roads, drainage and street lighting to adoptable standards, environmental enhancement of approaches to the site and structured landscaping within the site, surface water drainage issues; ensuring the availability of all necessary utilities. In addition to improving the attractiveness of the site to new enterprises, the surroundings have been improved and utilities have been designed to respect environmental requirements.
In terms of rehabilitation of urban areas
Co-funded projects supporting the regeneration of urban areas pursued both socio-economic (or an improvement of the quality of life) and environmental objectives. Impacts in terms of environment per se are less obvious, except in terms of landscape in the surroundings of the rehabilitated areas.
In terms of sewerage and purification
In the 2000-2006 little ERDF support was spent in West Wales and the Valleys in the wastewater sector (1.2% of the total ERDF budget devoted to environmental themes), even though wastewater was a challenge in the region. As a consequence of small ERDF allocations to the wastewater sector, few impacts were expected in this area. Only one water efficiency scheme was carried out. In addition, some other projects have been supported, such as the project Carmarthenshire Industrial Infrastructure, Capacity Expansion - Cross Hands implemented by DCWW.
The main reasons for the low level of supported activities in the wastewater sector have been detailed above (see Box 1: example of difficulties met by beneficiaries in the 2000-2006 programming period: the case of DCWW).
In terms of flood risk prevention
The largest public support to flood risk management was brought by EAW (£249m over the concerned period) under an umbrella of several projects. ERDF support contributed to this through the co-funding of 10 major flood defence schemes (total budget managed by EAW from ERDF support in flooding prevention schemes: £6.4m).
According to management authorities, this support reduced flood risk for 2,971 properties. Flood risk management achieved through ERDF support remain quite low compared to the global results of all the projects led by EAW, but they still remain significant taking into account the ERDF invested in this field. In fact, ERDF co-funding was used more as a additional financial contribution than a core source to tackle this important challenge in the region.

EX-POST EVALUATION OF COHESION POLICY PROGRAMMES 2000-2006 CO-FINANCED BY THE EUROPEAN FUND FOR REGIONAL DEVELOPMENT (OBJECTIVES 1 AND 2) - WORK PACKAGE 5B: ENVIRONMENT AND CLIMATE CHANGE ADE
Regional Case study – West Wales and the Valleys – October 2009 page 21
3.4 Contribution of ERDF to regional economic development
Evolution of the economic situation
Table 4: Economic performances of the West Wales and the Valleys region
Socio-economic indicators 2000 2001 2002 2003 2004 2005 2006
GDP/capita (at PPS; EU-27=100) n.a. n.a. 77.4 76.5 78.0 78.4 77.3
Employment rate (of the group 15-64) 63.5 63.1 63.6 65.7 66.1 66.4 66.4
GDP annual growth rate n.a. n.a. n.a. n.a. n.a. n.a. n.a.
Investment in % GDP 14.7 n.a. n.a. n.a. n.a. n.a. n.a.
Source: Eurostat, 2009
The GDP of the region in 2006 – expressed in Purchasing Power Standard (PPS) taking the average EU-27 value as 100 - was 77.3 compared to 77.4 in 2002. In other words, West Wales and the Valleys have not progressed in terms of GDP expressed in PPS and remains one of the poorest NUTS 2 regions of UK and the EU. However, the employment rate of the age group 15-64 increased during the programming period: from 63.5% in 2000 to 66.8% in 2007. This increase was greater amongst woman (+3.8%) than amongst man (+2.9%), although the employment rate remains lower amongst women (61.6%) than amongst men (72.3%).
During the 2000-2006 programming period, the employment in the industrial sector diminished in favour of the service sector. In 2005, the share of employment in the service sector was 74.4% compared to 23% in the industrial sector. The primary sector32 remained stable with a share of employment equivalent to 2.6%.
Effects of the SPD on the regional development
According to the final evaluation of the SPD on cross-cutting themes, co-funded projects directly devoted to environmental sectors were responsible for the creation of 26 jobs, notably in the clean energy sector or waste schemes. This remains quite marginal compared to the total number of jobs (cf. table 5 hereafter).
In addition to these direct jobs created, other projects supported through the SPD have also created new indirect jobs or contribute to maintaining some existing jobs, notably in the SME base. As an example, an evaluation of the Environmental Innovation and Competitiveness33 shows that the ARENA network – supported by ERDF through several projects and by other public financial sources – created 13 new jobs and protected 5,150 jobs in 2003 through the introduction of innovative environment-friendly techniques and technologies in SMEs.
32 Primary jobs involve getting raw materials from the natural environment e.g. mining, farming and fishing.
33 CRG Research Ltd (Oct 2003) Evaluation of Environmental Innovation and Competitiveness Project, Cardiff.

EX-POST EVALUATION OF COHESION POLICY PROGRAMMES 2000-2006 CO-FINANCED BY THE EUROPEAN FUND FOR REGIONAL DEVELOPMENT (OBJECTIVES 1 AND 2) - WORK PACKAGE 5B: ENVIRONMENT AND CLIMATE CHANGE ADE
Regional Case study – West Wales and the Valleys – October 2009 page 22
Table 5: Activities linked to environment in the West Wales and the Valleys region
Activities linked to environment
Sector 2000 2001 2002 2003 2004 2005 2006
Number of local units Recycling 52.0 n.a. 56.0 71.0 87.0 92.0 106.0 Water (1) n.a. n.a. 56.0 52.0 47.0 34.0 31.0
Gross investment in tangible goods (€ m)
Recycling 3.8 n.a. 3.0 4.6 6.5 8.9 10.8 Water (1) n.a. n.a. n.a. n.a. n.a. n.a. n.a.
Number of persons employed
Recycling 1178.0 n.a. 515.0 748.0 831.0 834.0 372.0
Water (1) 412.0 n.a. 678.0 649.0 n.a. n.a. n.a. Growth rate of employment
Recycling 207.6 n.a. -15.4 45.2 11.1 0.4 -55.4 Water (1) n.a. n.a. n.a. -4.3 n.a. n.a. n.a.
Investment per person employed ( € thousands)
Recycling n.a. n.a. 5.8 6.2 7.8 10.7 29.1 Water (1) n.a. n.a. n.a. n.a. n.a. n.a. n.a.
(1) Collection, purification and distribution of water Source: Eurostat, 2009.
No monitoring of the contribution of the 2000-2006 SPD through vertical environmental measures to the regional GVA was carried out. This contribution remains difficult to estimate due to the influence of several different internal and external factors. However, some visited projects have demonstrated that they have contributed – at least indirectly – to increasing the GVA in the region in the environment sector, although this remains quite low. For example, Dŵr Cymru Welsh Water was supported by ERDF to deliver an expansion to the existing sewage treatment works at Cross Hands Sewage Treatment Works (Carmarthenshire) in order to accommodate additional industrial and associated domestic effluent to develop a new industrial park in the area. The existing business park was to be redesignated and developed as an Agri-Food Park. As a result of the ERDF support, the Agri Food Park has been a success and is now partially occupied by new or existing companies while other companies are being approached to locate to the business park.
Another example is the ERDF support to the ARENA network. The supported network provides advice to SMEs in the field of energy efficiency by allowing them to reduce their running costs with regards to energy, as well as developing new activities in the environmental fields; both aspects contributing to increasing the GVA of these SMEs.
In addition, there are also evidences that rehabilitation of contaminated land and renovation of urban centres contribute to increase the attractiveness of the region at local level. However this contribution is quite difficult to assess (quantification).
3.5 Contribution of ERDF to improve the quality of life
Assessing the quality of life for beneficiaries and more widely for the surrounding population due to projects co-funded by ERDF is difficult. However, it can be assumed that co-funded projects have had a positive impact on the quality of life taking into account the improvement of the environment on a local scale (e.g. upgrading and rehabilitation of 25 hectares of vacant industrial at the Felinfach development site, rehabilitation of urban areas such as Merthyr Tydfil Town, etc.).
As example, the Merthyr Tydfil Town Centre Regeneration project aimed at improving those prominent and frequently used places within the town: high street public realm improvements, the creation of a “Cafe Quarter”; and improvements to the town centre

EX-POST EVALUATION OF COHESION POLICY PROGRAMMES 2000-2006 CO-FINANCED BY THE EUROPEAN FUND FOR REGIONAL DEVELOPMENT (OBJECTIVES 1 AND 2) - WORK PACKAGE 5B: ENVIRONMENT AND CLIMATE CHANGE ADE
Regional Case study – West Wales and the Valleys – October 2009 page 23
approaches to improve the identity of the town and improve pedestrian orientation). According to results of a shopper attitude survey34 conducted amongst 11 towns and 2 retail centres within Heads of the Valleys area (2008), Merthyr Tydfil Town Centre was the most popular town with over two fifths (42%) visiting its catchment area for non-food items. The Merthyr Tydfil on-street surveys concluded that the majority of respondents rated Merthyr Tydfil as either ‘very good’ or ‘good’ for: location/convenience (combined responses – 90.5%); and personal safety (combined responses – 88.5%). In addition, almost half of the respondents mentioned that the town does not need more improvements to encourage them to visit this area more often and improve their visiting experience.
34 This survey had however some limitations such as the fact that no survey was conducted prior to the implementation
of the project in order to compare obtained results.

EX-POST EVALUATION OF COHESION POLICY PROGRAMMES 2000-2006 CO-FINANCED BY THE EUROPEAN FUND FOR REGIONAL DEVELOPMENT (OBJECTIVES 1 AND 2) - WORK PACKAGE 5B: ENVIRONMENT AND CLIMATE CHANGE ADE
Regional Case study – West Wales and the Valleys – October 2009 page 24
Annex : List of stakeholders interviewed
Date Name Position Institution Monday 20/4/09 David Thomas Project officer; responsible for
environmental issues Welsh European Funding Office (WEFO)
Tuesday 21/04/09 Tracy Welland Appraisal officer and advisor in environment; responsible for support to SMEs and to infrastructure
Welsh European Funding Office (WEFO)
Tuesday 21/04/09 Rhian Prosser Project officer Merthyr Tydfil County Borough Council (CBC)
Tuesday 21/04/09 Ryan Bowen Project manager Welsh Water Wednesday 22/04/09 David Letellier Team leader for funds external research Environment Agency Wales Thursday 23/04/09 Alan Tillotson Chief Executive Arena Network Thursday 23/04/09 Neil Ranft Project officer City & County of Swansea

Chapter 2 : Waste prevention and management of
waste case study reports


ADE s.a. Rue de Clairvaux, 40
B-1348 Louvain-la-Neuve Belgium
Tel.: +32 10 45 45 10 Fax: +32 10 45 40 99 E-mail: [email protected]
Web: www.ade.be
Ex-Post Evaluation of Cohesion Policy Programmes 2000-2006 Co-Financed by the European Fund for Regional Development (Objectives 1 And 2) – Work Package 5: Environment and Climate Change
WWaassttee PPrreevveennttiioonn aanndd MMaannaaggeemmeenntt ooff wwaassttee CCaassee SSttuuddyy
BBrraannddeennbbuurrgg
October 2009


TThhiiss rreeppoorrtt hhaass bbeeeenn pprreeppaarreedd bbyy AADDEE aatt tthhee rreeqquueesstt ooff tthhee EEuurrooppeeaann CCoommmmiissssiioonn..
TThhee vviieewwss eexxpprreesssseedd aarree tthhoossee ooff tthhee CCoonnssuullttaanntt aanndd ddoo nnoott rreepprreesseenntt tthhee ooffffiicciiaall vviieewwss ooff tthhee EEuurrooppeeaann CCoommmmiissssiioonn..
RReepprroodduuccttiioonn oorr ttrraannssllaattiioonn iiss ppeerrmmiitttteedd,, pprroovviiddeedd tthhaatt tthhee ssoouurrccee iiss dduullyy aacckknnoowwlleeddggeedd aanndd nnoo mmooddiiffiiccaattiioonnss ttoo tthhee tteexxtt aarree mmaaddee..


EX-POST EVALUATION OF COHESION POLICY PROGRAMMES 2000-2006 CO-FINANCED BY THE EUROPEAN FUND FOR REGIONAL DEVELOPMENT (OBJECTIVES 1 AND 2) - WORK PACKAGE 5B: ENVIRONMENT AND CLIMATE CHANGE ADE
Waste Prevention and Management of waste Case Study - Brandenburg - October 2009 Table of Contents
Table of Contents
ACRONYMS
SUMMARY
1. GENERAL STRATEGIC CONTEXT ...................................................................... 1
1.1 SHORT INTRODUCTION TO THE SOCIO-ECONOMIC CONTEXT OF BRANDENBURG . 1 1.2 GDP GROWTH AND WASTE GENERATION IN BRANDENBURG ................................... 2 1.3 DIRECT ACTIVITIES LINKED TO SOLID WASTE .............................................................. 4
2. REGIONAL STRATEGY FOR SOLID WASTE MANAGEMENT AND GENERATION .. 7
2.1 WASTE MANAGEMENT STRATEGY ................................................................................... 7 2.2 INSTITUTIONAL ASPECTS OF WASTE MANAGEMENT IN THE BRANDENBURG
REGION ............................................................................................................................... 8
3. ERDF CONTRIBUTION ................................................................................. 11
3.1 ERDF PROGRAMME LINKAGES WITH THE REGIONAL STRATEGY ............................ 11 3.1.1 The waste measure .................................................................................................. 12
3.2 ERDF PROGRAMME ACHIEVEMENTS ACCORDING TO OFFICIAL INDICATORS ....... 16 3.3 ERDF PROGRAMME EFFECTIVENESS IN IMPROVING SOLID
WASTE MANAGEMENT ..................................................................................................... 16 3.4 ERDF PROGRAMME IMPACT ON THE QUALITY OF LIFE (AND SOCIO-ECONOMIC
CONTEXT) ......................................................................................................................... 17
4. CONCLUSIONS ............................................................................................... 19
ANNEX: LIST OF INTERVIEWS AND VISITS IN BRANDENBURG (GERMANY) ............. 21
LIST OF FIGURES
FIGURE 1: BRANDENBURG IN GERMANY ................................................................................. 2 FIGURE 2: REGIONS AND CITIES OF THE FEDERAL STATE OF BRANDENBURG
[ABFALLBILANZ BRANDENBURG 2007] ................................................................. 9

EX-POST EVALUATION OF COHESION POLICY PROGRAMMES 2000-2006 CO-FINANCED BY THE EUROPEAN FUND FOR REGIONAL DEVELOPMENT (OBJECTIVES 1 AND 2) - WORK PACKAGE 5B: ENVIRONMENT AND CLIMATE CHANGE ADE
Waste Prevention and Management of waste Case Study - Brandenburg - October 2009 Table of Contents
LIST OF TABLES
TABLE 1 : EVOLUTION OF GRAPH. 3GDP, MUNICIPAL WASTE PRODUCTION AND
POPULATION OVER THE 2000-2006 PERIOD IN BRANDENBURG ........................... 4 TABLE 2: EVOLUTION OF THE EMPLOYED POPULATION IN THE RECYCLING SECTOR IN
BRANDENBURG AND GERMANY ............................................................................... 5 TABLE 3: PRIORITY AREAS AND INITIAL FINANCIAL COMMITMENTS OF
THE OBJECTIVE 1 PROGRAMME IN BRANDENBURG (2000-2006) ....................... 11 TABLE 4: MEASURES OF AXIS 3 – ENVIRONMENTAL PROTECTION AND IMPROVEMENT
(UPDATED FIGURES) .................................................................................................. 12 TABLE 5 : COMPARISON OF THE ERDF FINANCIAL ALLOCATION TO WATER
AND WASTE ................................................................................................................. 12 TABLE 6: INVESTMENT IN WASTE MANAGEMENT AND RECYCLINGAND
COFOUNDING (€) ....................................................................................................... 13 TABLE 7: RECYCLING ACTIVITIES OF 20 SUPPORTED PROJECTS
UNDER MEASURE 3.1.1.2 ........................................................................................... 14 TABLE 8: RECYCLING ACTIVITIES OF 18 SUPPORTED PROJECTS WITH THE AIM OF
DEVELOPING NEW PRODUCTS ................................................................................. 15 TABLE 9: ACHIEVEMENTS OF MEASURE 3.1 WASTE PREVENTION, RECYCLING AND
DISPOSAL ACCORDING TO DATABASE INDICATORS .............................................. 16 LIST OF GRAPHS
GRAPH. 1: EVOLUTION OF GDP SINCE 1991 ......................................................................... 3 GRAPH. 2: GDP PER CAPITA (IN PPP) IN BRANDENBURG, GERMANY AND
EU 25 OVER THE PERIOD 2000-2006 .................................................................... 3

EX-POST EVALUATION OF COHESION POLICY PROGRAMMES 2000-2006 CO-FINANCED BY THE EUROPEAN FUND FOR REGIONAL DEVELOPMENT (OBJECTIVES 1 AND 2) - WORK PACKAGE 5B: ENVIRONMENT AND CLIMATE CHANGE ADE
Waste Prevention and Management of waste Case Study - Brandenburg - October 2009 Acronyms
Acronyms
DG Regio Directorate-General Regional Policy EAGGF European Agricultural Guarantee Fund ELV End-of-life vehicles ERDF European Fund for Regional Development ESF European Social Fund EU European Union GDP Gross Domestic Product GDR German Democratic Republic
ILB Investitionsbank des Landes Brandenburg (Brandenburg Investment Bank)
ISPA Instrument for Structural Policies for Pre-Accession MS Member State Mg Megagramme n.a. Not available
NACE Nomenclature générale des activités économiques dans les Communautés Européennes
OP Operational Programme PPP Purchasing Power Parity SBB Sonderabfallgesellschaft Berlin Brandenburg SME Small and Medium sized Enterprise t Ton TA Technical Assistance WEEE Waste electrical and electronic equipment


EX POST EVALUATION OF COHESION POLICY PROGRAMMES 2000-2006 CO-FINANCED BY THE EUROPEAN FUND FOR REGIONAL DEVELOPMENT (OBJECTIVES 1 AND 2) - WORK PACKAGE 5B: ENVIRONMENT AND CLIMATE CHANGE ADE
Waste Prevention and Management of waste Case Study - Brandenburg - October 2009 Summary
Summary - Key messages from the Brandenburg case study on waste prevention and management of waste
Brandenburg experienced significant economic growth during the 1990s after reunification. This growth slowed during the period 2000-2006. Over the same period, municipal waste production was reduced by 16% while GDP increased by 12% in current prices. Municipal waste production per capita was 406 kg in 2006, lower than the EU average of 580 kg/capita/year. The initial elements of decoupling waste production from GDP growth seem to be in place. Indeed, Brandenburg has a strong waste management strategy, coherent with German law and with the EU Landfill Directive. Waste related co-financing of projects from the ERDF has focused to a large extent on end-of-pipe activities. The ERDF contributed to securing and closing 60% of the remaining old landfills over the period. This is seen as sensible and the most effective approach for a region with a waste and historical situation such as Brandenburg. These interventions were coherent with the regional (and national) strategy. The main effects have been on the environment and quality of life, the latter namely through alleviating the financial burden of tax payers for the public damage that these landfills represent. The ERDF contribution to the recycling sector was guided by the principle of job creation and the development of new products. The overall growth rate of employment in the recycling sector amounted to 70% over the 2000-2006 period, largely over the German average. According to available statistics, almost all investments carried out in the recycling sector over the period have been supported by ERDF. Support focused as much as possible on new products and/or new technologies in the recycling sector.


EX POST EVALUATION OF COHESION POLICY PROGRAMMES 2000-2006 CO-FINANCED BY THE EUROPEAN FUND FOR REGIONAL DEVELOPMENT (OBJECTIVES 1 AND 2) - WORK PACKAGE 5B: ENVIRONMENT AND CLIMATE CHANGE ADE
Waste Prevention and Management of waste Case Study - Brandenburg - October 2009 Page 1
1. General strategic context
1.1 Short introduction to the socio-economic context of Brandenburg
Brandenburg is situated in the Eastern part of Germany, bordered by Poland in the East, by four other German Länder (Mecklenburg-Vorpommern, Sachsen, Sachsen-Anhalt and Niedersachsen) and surrounds Berlin. The territory of Brandenburg covers 29,473 km² and is one of the largest Länder of the country. The number of inhabitants in Brandenburg in 2006 was 2,553,628. This represents a reduction of 47,957 inhabitants compared to the year 2000. The average population density was 86.6 inhabitants/km² (2006). This is the lowest density of all German Länder. Population and growth differs significantly within the region. While Berlin’s surroundings offer good economic opportunities, rural areas further from Berlin face serious problems such as outward migration. The eastward enlargement of the EU has resulted in a much more central position for Brandenburg within the EU, especially with approaches to networking with the Polish economy. With an employment rate1 of 66% in 2006, Brandenburg records the same rate as in the EU 15 but a rate slightly lower than for Germany as a whole (67.5%) for the same year. A persistent lack of jobs and high unemployment, especially among women and among the youth, are major problems. The unemployment rate differs among the counties from 12% to 25%. Agriculture, industry and services employ respectively 3.7%, 22.5% and 73.8% of the population (2005). The share of employees in the industrial sector has decreased significantly since 2000 (from 27.1% in 2000 to 22.5% in 2005). The massive collapse of the construction industry over this period (2000-2006) helps explain the figures. Brandenburg’s economy has been subject to substantial structural changes. Old industries, such as lignite2 mining and lignite power plants played an important economic role in the GDR era. Brandenburg has experienced an important period of conversion of its old industries. Since the middle of the nineties, support for SMEs and their market adjustments have been key elements of cofounded policies.
1 The employment rate refers to the group of people between 15-64 years old.
2 Lignite, often referred to as brown coal, is a soft brown fuel between coal and peat.

EX POST EVALUATION OF COHESION POLICY PROGRAMMES 2000-2006 CO-FINANCED BY THE EUROPEAN FUND FOR REGIONAL DEVELOPMENT (OBJECTIVES 1 AND 2) - WORK PACKAGE 5B: ENVIRONMENT AND CLIMATE CHANGE ADE
Waste Prevention and Management of waste Case Study - Brandenburg - October 2009 Page 2
The main environmental problems of Brandenburg3 are extensive legacy land (former military, industrial and commercial land, lignite mining), low levels of sewage connection and high wastewater costs are significant environmental weaknesses. Remediation of old landfills was still a major issue at the beginning of the period (2000).
Figure 1: Brandenburg in Germany
1.2 GDP growth and waste generation in Brandenburg
The evolution of Brandenburg’s GDP since 1991 is shown hereafter in graph 1. In the early 1990s, Brandenburg had substantial double-digit growth rates (1991-95). Growth then slowed down, in particular in the years 1998, 2002-03 and 2005. Since 2007, the yearly growth rate has exceeded 3%.
3 Source: Gesamtbewertung des OP im Rahmen der Halbzeitbewertung des OP des Landes Brandenburg
2000-2006, Kienbaum i.A des Ministeriums der Finanzen des Landes Brandenburg, Berlin, Dezember 2006.

EX POST EVALUATION OF COHESION POLICY PROGRAMMES 2000-2006 CO-FINANCED BY THE EUROPEAN FUND FOR REGIONAL DEVELOPMENT (OBJECTIVES 1 AND 2) - WORK PACKAGE 5B: ENVIRONMENT AND CLIMATE CHANGE ADE
Waste Prevention and Management of waste Case Study - Brandenburg - October 2009 Page 3
Graph. 1: Evolution of GDP since 1991
15 000
20 000
25 000
30 000
35 000
40 000
45 000
50 000
55 000
60 000
1991
1992
1993
1994
1995
1996
1997
1998
1999
2000
2001
2002
2003
2004
2005
2006
2007
2008
Euro
Year
GDP per capita in current prices (euros)
6,5 %
Average growth rate for the period
Source: Bruttoinlandsprodukt, Bruttowertschöpfung in den Ländern und Ost-West-Großraumregionen Deutschlands 1991 bis 2008, Statistische Ämter der Länder, March 2009. Gross Domestic Product (GDP) amounted to 50.2 million euro in 2006 which represented 2% of Germany's GDP. With an annual average GDP growth of 1.8% for the period 2000-2006, Brandenburg experienced a growth slightly lower than the whole of Germany over the same period (1.95%). In 2006, GDP per inhabitant in the region was relatively low (17,800 euro) compared to the average for Germany (25,597 euro) and the EU 25 (23,318 euro). Graph 2 compares the GDP per capita between the EU 25, Germany and Brandenburg over the period 2000-2006.
Graph. 2: GDP per capita (in PPP) in Brandenburg, Germany and EU 25 over the period 2000-2006
10.000
12.000
14.000
16.000
18.000
20.000
22.000
24.000
26.000
28.000
2000 2001 2002 2003 2004 2005 2006
European Union (25 countries)
Germany
Brandenburg
Source: ADE based on Eurostat

EX POST EVALUATION OF COHESION POLICY PROGRAMMES 2000-2006 CO-FINANCED BY THE EUROPEAN FUND FOR REGIONAL DEVELOPMENT (OBJECTIVES 1 AND 2) - WORK PACKAGE 5B: ENVIRONMENT AND CLIMATE CHANGE ADE
Waste Prevention and Management of waste Case Study - Brandenburg - October 2009 Page 4
The figures in table 1 show that municipal waste generation decreased by 16% over the period 2000-2006 owing to the following factors: the significant decrease in waste generation per capita (- 14%) to a lesser extent, the population decrease (-2%). Indeed, waste generation per capita decreased each year from 475 kg per capita in 2000 to 406 kg per capita in 2006. Compared to Germany (601 kg per capita, one of the highest waste generations in the EU) this amount is low and it is also under the EU average of 580 kg/capita/year4. Overall, the indicator of waste (in tons) per unit of GDP (in million euro) decreased by 20%. A decoupling of GDP and waste growth seems to be in place.
Table 1 : Evolution of Graph. 3GDP, municipal waste production and population over the 2000-2006 period in Brandenburg
Items GDPMunicipal
waste
Municipal waste/unit of
GDP PopulationMunicipal
waste
Units/ Yearsin billion € constant million tons ton/million €
in million inhabitants
per capita year in kg
2000 44,984537 1,236 27 2,602 4752001 46,558996 1,185 25 2,596 4562002 46,791791 1,183 25 2,588 4572003 46,698207 1,088 23 2,579 4222004 46,558113 1,065 23 2,571 4142005 47,070252 1,057 22 2,564 4122006 47,493884 1,038 22 2,554 406 Growth rate 06/00 6% -16% -20% -2% -14% Source: Eurostat & Land Brandenburg, Daten und Informationen zur Abfallwirtschaft 2000-2007
1.3 Direct activities linked to solid waste Brandenburg has developed important activities dedicated to recovery of solid waste. There were 1,589 employees working in activities related to recycling in Brandenburg in 2006 (see table 2 hereafter). With a 70% growth rate of employment in the recycling sector for the period 2000-2006, Brandenburg experienced a significant expansion of this sector. This rate is far higher than that recorded in Germany (43% growth rate). Brandenburgs’ employees in the recycling sector represent 14% of German employees in the recycling sector which is much higher compared to employment in all sectors. Furthermore, compared to the growth rate of employment in the overall economy (3%), it appears that subsequent investments were carried out in the recycling sector in Germany and even more significantly, in Brandenburg.
4 Source : EU25 average of Municipal waste production from Eurostat (2004).

EX POST EVALUATION OF COHESION POLICY PROGRAMMES 2000-2006 CO-FINANCED BY THE EUROPEAN FUND FOR REGIONAL DEVELOPMENT (OBJECTIVES 1 AND 2) - WORK PACKAGE 5B: ENVIRONMENT AND CLIMATE CHANGE ADE
Waste Prevention and Management of waste Case Study - Brandenburg - October 2009 Page 5
Table 2: Evolution of the employed population in the recycling sector in Brandenburg and Germany
ItemsBrandenburg Germany Brandenburg Germany
Years/units2000 0,93 8,03 1131 36324
2001 n/a 8,92 1127 36528
2002 1,02 9,96 1115 36275
2003 1,15 9,84 1102 35927
2004 1,20 10,47 1093 35463
2005 1,53 11,01 1128 36654
2006 1,59 11,49 1169 37379
Growth rate 06/00 70% 43% 3% 3%
Employment in recycling sector Employment in all sectors
in thousands of people in thousands of people
Source: Eurostat (Regional data according to NUTS 3 DN37)
Some data are available about gross investment in tangible goods by the recycling industry over the 2000-2006 period (Eurostat regional data, NACE 3720) amounting to 107.5 million euro. The yearly amount varies around 10-20 million euro.


EX POST EVALUATION OF COHESION POLICY PROGRAMMES 2000-2006 CO-FINANCED BY THE EUROPEAN FUND FOR REGIONAL DEVELOPMENT (OBJECTIVES 1 AND 2) - WORK PACKAGE 5B: ENVIRONMENT AND CLIMATE CHANGE ADE
Waste Prevention and Management of waste Case Study - Brandenburg - October 2009 Page 7
2. Regional strategy for solid waste management and generation
2.1 Waste management strategy
The regional waste law5 in line with the federal waste law (“Kreislaufwirtschafts- und Abfallgesetz) and the European Waste Framework Directive6 stresses the prevention of waste as being a first priority followed by the recovery and, as a last option, the final disposal of waste. At federal level, the purpose is to avoid any landfills in the near future. Residual waste should be used as fuel for incineration (see especially mechanical biological treatment plants hereafter). This principle is also applied in Brandenburg. For the management of municipal solid waste, the first priority, after waste prevention is given to ensure the availability of environmentally sound treatment, recovery and processing of residual waste to fuel. Most landfills should be closed in the near future. Due to the low population density, incinerators do not represent an economically viable alternative. Brandenburg chose the option of mechanical biological treatment with subsequent incineration of the fraction with a high calorific value. This is seen as an important location factor for resident and potential new companies. The location of Brandenburg and its close relationship with Berlin leads to cooperation between both “Länder” in waste management (e.g. the utilisation of waste treatment capacities in Brandenburg by Berlin and vice versa). The contribution of waste management to a sustainable use of resources is addressed on different levels. Waste prevention is mainly allocated to innovative solutions of private companies and consumer behaviour. Waste recycling should be done by the involved parties (public and private) in such a way that material cycles are ensured. This addresses, inter alia, the prevention of all forms of factual final disposal under the cover of recycling. In the year 2000, Brandenburg's Ministry of the Environment stated, as a target of waste management in Brandenburg, the reduction of the amount of waste for final disposal by 35 % by the year 2005 (compared to 1996) and by up to 50 % by 2010 [Abfallwirtschaftsplan des Landes Brandenburg, Teilplan Siedlungsabfälle, Potsdam, 02.08.2000].
5 Brandenburgisches Abfallgesetz (BbgAbfG) vom 6. Juni 1997 (GVBl. I/97 Nr. 5 S. 40), last amended by Gesetz zur
Änderung des Brandenburgischen Abfallgesetzes and Gesetz über die Umweltverträglichkeitsprüfung vom 27. Mai 2009 (GVBl. I/2009, Nr. 8 S. 175).
6 At the beginning of the programming period 2000 to 2007 the relevant Directive was 75/442/EEG, the current version is 2008/98/EC.

EX POST EVALUATION OF COHESION POLICY PROGRAMMES 2000-2006 CO-FINANCED BY THE EUROPEAN FUND FOR REGIONAL DEVELOPMENT (OBJECTIVES 1 AND 2) - WORK PACKAGE 5B: ENVIRONMENT AND CLIMATE CHANGE ADE
Waste Prevention and Management of waste Case Study - Brandenburg - October 2009 Page 8
Regarding the treatment of municipal solid waste in sparsely populated areas, mechanical biological treatment with subsequent incineration of the fraction with a high calorific value and final disposal of the resulting bottom ashes is seen in the Brandenburg waste management plan of the year 2000 as the best option. It was expected that the amount of waste for disposal can be reduced by an additional 45 % (compared to untreated waste) through this type of treatment.
While landfill capacities were available, treatment capacities had to be developed. De-centralised waste management, where both feasible and sensible, is seen as best option to reduce transport efforts in sparsely populated areas. This approach of differentiated management of residual municipal solid waste will ensure that existing landfills are further used and waste fees can be used to securely close down landfills after they have been filled.
Old landfills that do not completely fulfil the requirements of the European Landfill Directive have been a major issue for waste management in Brandenburg. Overall, the number of landfills evolved from over 3,000 at the end of the GDR era,7 to 54 operating landfills in 2000, to just 5 in 2009. By 2005, 21 existing landfills classified as landfills for municipal solid waste had been closed down8. Nine existing landfills were intended to be closed down by July 16th 2009 and only 5 landfills will be used after July 2009.
Until 2006, four mechanical biological treatment plants have been put into operation, along with two mechanical biological stabilisation plants and 6 mechanical treatment plants. The fraction with high calorific value has been incinerated until 2006 in one dedicated waste incineration plant and two co-incineration plants. The low population density and the objective to increase efficiency of waste transport led to the implementation of 6 transfer stations for municipal solid waste.
The polluter pays principle is fully applied (see § 9 of the regional waste law BbgAbfG). Costs incurred for waste management by municipal or related public authorities have to be financed by charging fees to waste producers to cover these costs9.
2.2 Institutional aspects of waste management in the Brandenburg Region
The Ministry for Rural Development, the Environment and Consumer Protection (“Ministerium für Ländliche Entwicklung, Umwelt und Verbraucherschutz”) covers the political aspects of waste management in Brandenburg. The regional environmental agency (“Landesumweltamt”) performs and steers waste management activities in Brandenburg.
Management of mixed municipal solid waste from private households and from small companies is in the competence of the municipalities (“Landkreise und kreisfreie Städte”) and of the communities (“Gemeinden”). Most of the landfills are also owned by the municipalities.
Management of separately collected fractions from private households and small companies is in the competence of municipalities (biogenic waste, WEEE, paper and cardboard, and metals) and private companies. Packaging waste is in the competence of 7 private waste management systems.
7 Each township had its own landfill until 1989.
8 The overall number of closed landfills was 130 during the programming period.
9 Source : Abfallbilanz Brandenburg 2007, p.4

EX POST EVALUATION OF COHESION POLICY PROGRAMMES 2000-2006 CO-FINANCED BY THE EUROPEAN FUND FOR REGIONAL DEVELOPMENT (OBJECTIVES 1 AND 2) - WORK PACKAGE 5B: ENVIRONMENT AND CLIMATE CHANGE ADE
Waste Prevention and Management of waste Case Study - Brandenburg - October 2009 Page 9
Management of production specific waste and waste from enterprises and waste for recovery is in the competence of private waste management companies.
Management of hazardous waste is in the competence of the “Sonderabfallgesellschaft Berlin Brandenburg” (SBB). 25% is owned by the Federal State of Brandenburg, 25% by the Federal State of Berlin, 25% by the waste producing industry and the remaining 25% belongs to waste management companies.
The Federal State of Brandenburg consists of a number of regions and cities as shown in the figure XX hereafter.
Figure 2 : Regions and cities of the Federal State of Brandenburg [Abfallbilanz Brandenburg 2007]


EX POST EVALUATION OF COHESION POLICY PROGRAMMES 2000-2006 CO-FINANCED BY THE EUROPEAN FUND FOR REGIONAL DEVELOPMENT (OBJECTIVES 1 AND 2) - WORK PACKAGE 5B: ENVIRONMENT AND CLIMATE CHANGE ADE
Waste Prevention and Management of waste Case Study - Brandenburg - October 2009 Page 11
3. ERDF contribution
3.1 ERDF programme linkages with the regional strategy
Given the multifaceted problems in the state of Brandenburg, the design of the OP is a combination of a wide range of instruments from structural funds including ERDF, ESF and EAGGF funds. The total funding for the Brandenburg Region Objective 1 Programme (OP) for 2000-2006 amounted to 5.055 billion euro. It has developed its strategy along six axes (see table 3 below). ERDF funds (without TA) represent 2.893 billion or 57% of the total budget.
Table 3: Priority areas and initial financial commitments of the Objective 1 programme in Brandenburg (2000-2006)
Axis Fund Title of priority areaTotal cost
(in million €) %
1
Promoting the competitiveness ofeconomic activities, particularly ofSMEs 1067,5 21%
2 Infrastructural measures 1412,5 28%
3Environmental protection andimprovement 413,4 8%
Sub-total 2893,4 57%
4 ESFPromotion of the available labourforce and equal opportunities 1045,6 21%
5 EAGGF Promotion of rural development 1050,8 21%6 Technical assistance 65,2 1%
Total 5055,0 100%
ERDF
Source: Programming documents of Brandenburg OP
Axis 3 concerns “Environmental protection and improvement” with 413.4 million euros and represents 14% of ERDF funding (according to initial financial commitments). Axis 3 is subdivided into four measures (see table 4 hereafter). More than half of the total budget is used for the measure “Water supply/sewage”. 23% of the total budget is used for the measure “Waste prevention, recycling and disposal” for a total amount of 120.7 million euros.

EX POST EVALUATION OF COHESION POLICY PROGRAMMES 2000-2006 CO-FINANCED BY THE EUROPEAN FUND FOR REGIONAL DEVELOPMENT (OBJECTIVES 1 AND 2) - WORK PACKAGE 5B: ENVIRONMENT AND CLIMATE CHANGE ADE
Waste Prevention and Management of waste Case Study - Brandenburg - October 2009 Page 12
Table 4: Measures of axis 3 – Environmental protection and improvement (updated figures)
Measure code Title
Total cost (in million €) 31.03.2009 %
ERDF (million €) 31.03.2009 %
11 Water supply/sewage 291,8 57% 156,4 56%
21 Air pollution prevention/emission reduction 18,2 4% 10,6 4%31 Waste prevention, recycling and disposal 120,7 23% 53,5 19%
41 Brown field sites and conversion measures 84,8 16% 60,4 22%Total 515,5 100% 280,9 100%
Source: OP Brandenburg updated by Ministry of Economic Affairs, May 2009
The distribution of ERDF funds between the water and waste sectors (see table 5 below) clearly shows that less emphasis was put on waste management than on water supply/sewage.
Table 5 : Comparison of the ERDF financial allocation to water and waste
Areas
ERDF Brandenburg (in
€m)ERDF Brandenburg
(in %)
Water 156,4 56%
Waste 53,5 19%
Total Environment 280,9 100%
Source: OP Brandenburg updated by Ministry of Economic Affairs, May 2009 To summarise, according to updated figures, a total amount of 515.5 million euros was allocated to environmental protection and improvement, thus an increase of 25% compared to the initial budget of 413 million euros. ERDF co-funding amounts to 280.9 million euros.
3.1.1 The waste measure
ERDF interventions in “waste prevention, recycling and disposal” are twofold. They mainly support the public waste management of closure of old landfills but also intervene in supporting private companies operating in the recycling sector.

EX POST EVALUATION OF COHESION POLICY PROGRAMMES 2000-2006 CO-FINANCED BY THE EUROPEAN FUND FOR REGIONAL DEVELOPMENT (OBJECTIVES 1 AND 2) - WORK PACKAGE 5B: ENVIRONMENT AND CLIMATE CHANGE ADE
Waste Prevention and Management of waste Case Study - Brandenburg - October 2009 Page 13
Investments regarding public waste management refer to landfills only and are managed by the Ministry of Rural Development, Environment and Consumer Protection10. Investments in the recycling sector support private waste management companies11. The latter is under the supervision of the Ministry of Economic Affairs. Projects from private companies had to be strictly related to environmental investments or concern recycling, with the purpose of developing new products. All these projects were initially managed under measures of the environmental axis. Following the mid-term evaluation of the OP, some projects implemented by the private sector were transferred under the first axis promoting competitiveness “productive investments community task” (measure 1.1.1.1)). Final figures are presented in table 6 hereafter.
Table 6: Investment in waste management and recycling and cofounding (€)
Total investment
% of total inv. Eligible costs ERDF
% of ERDF ILB
Public waste management - Landfills 112.593.162 48% 108.269.187 47.045.083 82% 47.045.083Recycling sector 49.098.066 21% 45.933.468 5.961.778 10% 11.418.121Recycling /new products 72.881.213 31% 67.958.385 4.513.676 8% 8.914.642Total 234.572.441 100% 222.161.040 57.520.537 100% 67.377.847 Source: Ministry of Economic Affairs, May 2009 Taken together, all three areas represent an investment volume of 234.5 million euro of which 48% corresponds to waste management, namely rehabilitation of old landfills and 52% to recycling activities conducted by the private sector (21% managed under waste management and recycling and 31% under recycling support to enterprises). The ERDF contribution is mainly allocated to landfills (82%) and the remaining 18% to supporting recycling activities. Beneficiaries under environmental investments had to be SME’s and had to satisfy the criteria of the directive supporting this funding. Some beneficiaries were subsequently transferred to axis one either if they did not have the status of SME or if they did not satisfy the criteria of the directive.
3.1.1.1 Landfills
The main ERDF interventions in the waste sector concern support to the regional waste strategy through the closure of old landfills. The German federal waste law12 foresees an almost complete closure of landfills throughout the country, together with an important development of the recycling sector. For residual waste, incineration with energy recovery is foreseen (this is only profitable in large cities, see strategy). 10 Mesure 3.3 waste management, 3.3.1.1 Public waste management (Abfallwirtschaft)
11 Mesure 3.3 waste management, 3.3.1.2 Recycling (Kreislaufwirtschaft)
12 Gesetz zur Förderung der Kreislaufwirtschaft und Sicherung der umweltverträglichen Beseitigung von Abfällen (Kreislaufwirtschafts- und Abfallgesetz - KrW-/AbfG) BGBl. I S. 2705), BGBl. I S. 2705, last amendment by Art. 5 of the law dated 22.12.2008 published in BGBl. I S. 2986

EX POST EVALUATION OF COHESION POLICY PROGRAMMES 2000-2006 CO-FINANCED BY THE EUROPEAN FUND FOR REGIONAL DEVELOPMENT (OBJECTIVES 1 AND 2) - WORK PACKAGE 5B: ENVIRONMENT AND CLIMATE CHANGE ADE
Waste Prevention and Management of waste Case Study - Brandenburg - October 2009 Page 14
In parts of the region sparsely populated, the option of mechanical biological treatment was followed according to the waste management plan.
Overall, the number of landfills evolved from over 3,000 at the end of the GDR era,13 to 54 operational units in 2000 (without old landfills), to just 5 after July 2009. ERDF funding contributed to 35 projects, of which 32 secured and closed landfills. The total investment per landfill/project varied between 330,000 and 10,500,000 euro, with an average of 3.2 million euro.
The main investments concerned securing and recultivating landfills, degassing installations, establishing a sealing wall and cleaning waste.
The secured area corresponds to around 300 ha of land.
3.1.1.2 Recycling
The second aspect of interventions in the waste sector, coherent with the overall strategy of Brandenburg, is the support to private recycling companies operating in the waste sector. As already mentioned, it is financed under two different axis of the programme.
Under waste management and recycling, twenty applications have been supported14, leading to an overall investment volume of 49 million euro. The ERDF supported 12% of the total investment (or 13% of eligible costs). The main share was financed by private companies supporting 70% of the total investment.
Table 7: Recycling activities of 20 supported projects under measure 3.1.1.2
The amounts invested per company vary significantly, with a minimum of 108,000 euro and a maximum of 22 million. The average amount of investment is 2.4 million euro, with a median of 1.3 million.
Investments mainly concern the extension or rationalisation of establishments. Recycling activities cover, inter alia, scrap, waste material, tyres, wood, carpets etc.
13 Each township had its own landfill until 1989.
14 All projects belong to SME with the NACE code 03720.
InvestmentTotal
investmentEligible
costsof which
ERDFof which Federal
of which Region
of which Privat
million euro 49,1 45,9 5,9 2,7 2,7 34,5
% % 94% 12% 6% 6% 70% Source: Ministry of Economic Affairs, May 2009

EX POST EVALUATION OF COHESION POLICY PROGRAMMES 2000-2006 CO-FINANCED BY THE EUROPEAN FUND FOR REGIONAL DEVELOPMENT (OBJECTIVES 1 AND 2) - WORK PACKAGE 5B: ENVIRONMENT AND CLIMATE CHANGE ADE
Waste Prevention and Management of waste Case Study - Brandenburg - October 2009 Page 15
As already mentioned, several investments supported under measure 1.1.1.1 concerning support to SMEs are also related to the waste sector. These concern 18 projects. The total amount of investment is also widespread with a minimum of 100,000 euro and a maximum of 38 million euro. The average amount is 4 million, the median is 1 million. Various recycling activities are covered, namely: tyre recycling and recovery; ELV dismantling plants, various waste treatments, namely: - plastic packaging, synthetic materials, metal, cables, glass, industrial waste, waste for incineration; waste sorting and recycling; mechanical - biological systems; hazardous waste treatment; biogas plants. The main scopes of these investments are the following:
Reduction of waste volumes from the collection system; Reducing the amount of waste for disposal; Recycling of commodities; Reduction of the environmental impact from the disposal of waste; Use of the energy content of waste; Correct waste collection.
Table 8: Recycling activities of 18 supported projects with the aim of developing new products
ERDF Federal Region Private
million euro 72,88 67,96 4,51 2,20 2,20 59,04% % 94% 12% 6% 6% 70%
Source: Abfallwirtschaft (siehe Knut Sander für genaue Angaben)
of which Investment
Total investment
Eligible costs
From these latter 18 projects, 9 belong to the recycling sector (NACE DN37). The total investment of these 9 projects amounts to 67.5 million euro. Together with the 20 projects supported under the waste and recycling measure which amount to 49 million euro (see table 7), the overall investments of the recycling sector supported by ERDF funding amounts to 116.6 million euro over the 2000-2009 period. Considering the total investment by the sector over the 2000-2006 period (3 years difference) of 107.5 million euro (see section 1.3), most of the investments correspond to projects that have been supported by ERDF funds. Selection criteria for the projects were (1) to be active in the recycling sector, (2) to develop new products and/or new technologies with major horizontal criteria of (3) job creation. Enough funds were available to support almost all submitted projects. Business plans of submitted projects did not include risk analysis. It appeared however, from stakeholder interviews, that the market development of recycled components (becoming a form of commodity) are not always well known, nor price evolution (which depend heavily on regional or national grant) nor quantities (which are supposed to move downwards with the policies of reduction of waste).

EX POST EVALUATION OF COHESION POLICY PROGRAMMES 2000-2006 CO-FINANCED BY THE EUROPEAN FUND FOR REGIONAL DEVELOPMENT (OBJECTIVES 1 AND 2) - WORK PACKAGE 5B: ENVIRONMENT AND CLIMATE CHANGE ADE
Waste Prevention and Management of waste Case Study - Brandenburg - October 2009 Page 16
3.2 ERDF programme achievements according to official indicators
The achievements under this measure, according to official indicators mentioned in the database are summarised in the following table.
Table 9: Achievements of measure 3.1 Waste prevention, recycling and disposal according to database indicators
Indicator Type UnitTarget value
Achieved value 2006
Achieved value 2009
Rate of achievement
Upgrading and rehabilitation ofabandoned landfill sites Output Number 16 23 35 219%
Securing and recultivating ofabandoned landfill sites Result Hectare 150 158 298 199%
Temporary employment effects Result Number 700 916 n.a. 131%
Reduction of the amount of landfilledwaste ov er the 2000-2006 period Impact T Mg* 0 540000Source: programming documents of Brandenburg OP, updated project figures May 2009, Abfallbilanzen Land Brand*Waste generation is measured in tons of megagramm Mg The target values in terms of the number of existing landfills secured and have been largely exceeded. Accordingly, the area of secured and cultivated land remediate has been almost doubled compared to target values, achieving almost 300 ha (see table 9 above). The reduction of the amount of landfilled waste is estimated at around 540,000 t of Mg over the whole period (2000-2006)15. This evolution is not directly linked to activities financed by the OP but to the overall waste strategy of Brandenburg and application of the German waste law.
3.3 ERDF programme effectiveness in improving solid waste management
The ERDF effectively supported the major problem of closure of old landfills. Compared to other regions facing similar problems, East German Länder do not have access to ISPA or Cohesion funds which largely supported this type of investment in other EU10 regions. The OP also supported the recycling industry through private companies operating in the sector. A common objective linked to this support was the creation of jobs and the development of new products.
15 The initial indicator “yearly reduction of the amount of landfill waste” has been adapted and concerns the overall
reduction of waste landfilled over the 2000-2006 period according to data presented in the yearly reports of waste management (Daten und Informationen zur Abfallwirtschaft 2000, 2001, 2006.Ministerium für ländliche Entwicklung, Umwelt und Verbraucherschutz des Landes Brandenburg.)

EX POST EVALUATION OF COHESION POLICY PROGRAMMES 2000-2006 CO-FINANCED BY THE EUROPEAN FUND FOR REGIONAL DEVELOPMENT (OBJECTIVES 1 AND 2) - WORK PACKAGE 5B: ENVIRONMENT AND CLIMATE CHANGE ADE
Waste Prevention and Management of waste Case Study - Brandenburg - October 2009 Page 17
3.4 ERDF programme impact on the quality of life (and socio-economic context)
ERDF support for the remediation of old landfills significantly alleviated the financial burden of this task, remaining at the level of municipalities (öffentlich-rechtliche Entsorgungsträger). Municipalities would have transferred this cost to tax payers in the municipality. Consequently, the cost of waste management for private households has been reduced.
The positive environmental aspects of 300 ha of secured landfills on water (including elimination of leachate water), air, soil, biodiversity are of course of major importance, especially as some of the landfills are located in difficult areas from a hydrogeological point of view. Ground and surface waters are no longer contaminated. Landfill gases have been eliminated (or if possible with energy recovery)16. Air quality around landfills has improved. Through investment in SMEs (information is available for investments supported under measure 1.1.1.1 only) according to initial project indications, 147 jobs were created and around 259 jobs were secured. If one compares public funds used to support these investments it comes to a ratio of around 60,000 €/job created. Creation of jobs is however only a side-effect or horizontal objective of the whole OP. It appears that some companies have developed new technologies with regards to recycling activities, namely in the reuse of old tyres. Moreover, the mechanical biological treatment of waste is a very recent technology.
16 The methane production of the individual landfill varies in a very broad range depending on the age of
the landfill and the biogenic organic content of the waste. Thus, no assumptions can be made about the climate protection effect from the measures, which are really reliable.


EX POST EVALUATION OF COHESION POLICY PROGRAMMES 2000-2006 CO-FINANCED BY THE EUROPEAN FUND FOR REGIONAL DEVELOPMENT (OBJECTIVES 1 AND 2) - WORK PACKAGE 5B: ENVIRONMENT AND CLIMATE CHANGE ADE
Waste Prevention and Management of waste Case Study - Brandenburg - October 2009 Page 19
4. Conclusions
Major ERDF support (82% of funds) was allocated to remediation of old landfills while remaining funds (18%) supported private projects in the recycling sector. Waste related co-financing of projects from the ERDF has focused to a great extent on end-of-pipe activities. This is seen as the most sensible and most effective approach for a region with a waste and historical situation such as Brandenburg with old landfills. The region has not access to ISPA or Cohesion funds that did finance similar investments in other regions. The landfill situation, considered as end-of-pipe activities in the EU waste hierarchy, has significantly improved with support of ERDF-funded activities and major problems have been solved. The combination of projects on waste recovery and the creation/securing of jobs were seen as sensible in a situation where high priority has been given to the economic stabilisation of a region and creation of jobs. The recycling sector has known a significant development over the period in term of employment creation, which was one of the main selection criteria of support to those projects.


EX POST EVALUATION OF COHESION POLICY PROGRAMMES 2000-2006 CO-FINANCED BY THE EUROPEAN FUND FOR REGIONAL DEVELOPMENT (OBJECTIVES 1 AND 2) - WORK PACKAGE 5B: ENVIRONMENT AND CLIMATE CHANGE ADE
Waste Prevention and Management of waste Case Study - Brandenburg - October 2009 Page 21
Annex: List of interviews and visits in Brandenburg (Germany)
Date Hour Institution Main stakeholders Address Phone number 5 May 15h00 Ministry for Rural
Development, Environment and Consumer Protection Sachgebietsleiter Allgemeine Fragen der Abfallwirtschaft und öffentlich rechtliche Abfallentsorgung
MÜNDNER, Andreas Dr. STOCK, Ulrich
Albert-Einsteinstrasse, 42-46 14473 Potsdam
Tel: +49 331 866 73 06 [email protected]
6 May 8h00 Private company (Genan, knowlegde based recyling concepts)
BECK, Henning Oranienburg
10h30 Ministry of Economic Affairs, EU Structural funds
VIEHRIG, Vera KRÜGER, Ronald LIEKFELDT, Sven
Heinrich-Mann- Allee 14473 Potsdam
+ 49 331866 1713
14h00 Staatskanzlei HECHINGER, Rainer Heinrich- Mann- Allee 14473 Potsdam
+ 49 331866 1432
15H00 ILB Programmbetreuung / EU-Koordination, InvestitionsBank des Landes Brandenburg
MÜLLER, Christiane, Steinstraße 104 - 106 14480 Potsdam
+49 3 31 660 1667
7 May 10h00 DEPONIE, Landkreis Märkisch-Oberland, Rüdersdorf bei Berlin
Frau MANZKE (FRIESSE, Angela)
Bergstrasse 3 15344 Hennickendorf
+49 3 346 88 27 22 +49 3 346 88 27 26
14h00 Private company : Relux, Brennstoffproduktion
THIELE, Günther 14727 Premnitz


ADE s.a. Rue de Clairvaux, 40
B-1348 Louvain-la-Neuve Belgium
Tel.: +32 10 45 45 10 Fax: +32 10 45 40 99 E-mail: [email protected]
Web: www.ade.be
Ex-Post Evaluation of Cohesion Policy Programmes 2000-2006 Co-Financed by the European Fund for Regional Development (Objectives 1 And 2) – Work Package 5: Environment and Climate Change
WWaassttee PPrreevveennttiioonn aanndd MMaannaaggeemmeenntt ooff wwaassttee CCaassee SSttuuddyy
HHuunnggaarryy
October 2009


TThhiiss rreeppoorrtt hhaass bbeeeenn pprreeppaarreedd bbyy AADDEE aatt tthhee rreeqquueesstt ooff tthhee EEuurrooppeeaann CCoommmmiissssiioonn..
TThhee vviieewwss eexxpprreesssseedd aarree tthhoossee ooff tthhee CCoonnssuullttaanntt aanndd ddoo nnoott rreepprreesseenntt tthhee ooffffiicciiaall vviieewwss ooff tthhee EEuurrooppeeaann CCoommmmiissssiioonn..
RReepprroodduuccttiioonn oorr ttrraannssllaattiioonn iiss ppeerrmmiitttteedd,, pprroovviiddeedd tthhaatt tthhee ssoouurrccee iiss dduullyy aacckknnoowwlleeddggeedd aanndd nnoo mmooddiiffiiccaattiioonnss ttoo tthhee tteexxtt aarree mmaaddee..


EX-POST EVALUATION OF COHESION POLICY PROGRAMMES 2000-2006 CO-FINANCED BY THE EUROPEAN FUND FOR REGIONAL DEVELOPMENT (OBJECTIVES 1 AND 2) - WORK PACKAGE 5B: ENVIRONMENT AND CLIMATE CHANGE ADE
Waste Prevention and Management of waste Case Study - Hungary - October 2009 Table of Contents
Table of Contents ACRONYMS
SUMMARY
1. GENERAL STRATEGIC CONTEXT ........................................................................... 1
1.1 BRIEF INTRODUCTION TO THE SOCIO-ECONOMIC CONTEXT OF HUNGARY ............. 1 1.2 GDP GROWTH AND WASTE GENERATION IN HUNGARY ............................................... 2
1.2.1 GDP GROWTH ............................................................................................................. 2 1.2.2 TOTAL WASTE PRODUCTION .................................................................................... 2 1.2.3 MUNICIPAL WASTE PRODUCTION ............................................................................ 3
2. NATIONAL STRATEGY FOR SOLID WASTE MANAGEMENT AND GENERATION ....... 5
2.1 NATIONAL WASTE MANAGEMENT PLAN AND INSTITUTIONAL CONTEXT ................. 5 2.1.1 NATIONAL WASTE MANAGEMENT PLAN ................................................................ 5 2.1.2 INSTITUTIONAL CONTEXT ........................................................................................ 6
2.2 INDUSTRIAL WASTE ........................................................................................................... 6 2.3 MUNICIPAL WASTE ............................................................................................................. 7
2.3.1 MUNICIPAL SOLID WASTE ......................................................................................... 7 2.3.2 PACKAGING WASTE ................................................................................................. 10 2.3.3 HEALTHCARE WASTE ............................................................................................... 10 2.3.4 ANIMAL WASTE ........................................................................................................ 11 2.3.5 CONSTRUCTION AND DEMOLITION WASTE ......................................................... 12 2.3.6 MUNICIPAL FLUID WASTE ....................................................................................... 12
2.4 SPECIAL WASTE STREAMS ................................................................................................ 13 2.5 THE CASE OF THE CITY OF BUDAPEST ........................................................................... 13
3. ERDF CONTRIBUTION ........................................................................................ 15
3.1 INTRODUCTION ................................................................................................................ 15 3.2 ARTICULATION OF THE EIOP .......................................................................................... 15 3.3 ANIMAL WASTE ................................................................................................................. 17 3.4 CONSTRUCTION AND DEMOLITION WASTE AND HEALTHCARE WASTE ................... 18 3.5 ERDF PROGRAMME IMPACT ON THE QUALITY OF LIFE (AND
SOCIO-ECONOMIC CONTEXT) ........................................................................................ 20
LIST OF ANNEXES
ANNEX 1: ISPA PROJECTS ON MUNICIPAL SOLID WASTE MANAGEMENT 23
ANNEX 2: SPECIAL WASTE STREAMS 29
ANNEX 3: LIST OF PROJECTS ACCOMPLISHED IN THE EIOP’S MEASURE 1.2 33
ANNEX 4: LIST OF PROJECTS ACCOMPLISHED IN THE EIOP’S MEASURE 1.3 35
ANNEX 5: THE ANIMAL WASTE COLLECTION STATION IN EGER 37
ANNEX 6: DEMOLITION WASTE TREATMENT PLANT IN EGER 39

EX-POST EVALUATION OF COHESION POLICY PROGRAMMES 2000-2006 CO-FINANCED BY THE EUROPEAN FUND FOR REGIONAL DEVELOPMENT (OBJECTIVES 1 AND 2) - WORK PACKAGE 5B: ENVIRONMENT AND CLIMATE CHANGE ADE
Waste Prevention and Management of waste Case Study - Hungary - October 2009 Table of Contents
LIST OF FIGURES FIGURE 1: MAP OF HUNGARY ....................................................................................................... 1
LIST OF TABLES
TABLE 1: PERCENTAGE OF EMPLOYMENT BY SECTOR (AGRICULTURE, INDUSTRY AND
SERVICES) IN 2000 AND 2005 ...................................................................................... 1 TABLE 2: ANNUAL TOTAL WASTE PRODUCTION COMPARED TO GDP ................................. 3 TABLE 3: EVOLUTION OF GDP, MUNICIPAL WASTE PRODUCTION AND POPULATION
OVER THE 2000-2006 PERIOD IN HUNGARY ............................................................ 3 TABLE 4: EXPECTED GOALS IN WASTE GENERATION ACCORDING TO THE NATIONAL
WASTE MANAGEMENT PROGRAMME (MILLION TONS) .......................................... 5 TABLE 5: TOTAL WASTE MANAGEMENT (WITHOUT WASTE WATER SLUDGE) ...................... 6 TABLE 6: TREATMENT OF MUNICIPAL SOLID WASTE, THOUSAND TONS AND % ................. 9 TABLE 7: RECOVERY OF PACKAGING WASTE 2005 ................................................................ 10 TABLE 8: TREATMENT OF URBAN SOLID WASTE PRODUCED BY BUDAPEST
HOUSEHOLDS (2006) .................................................................................................. 13 TABLE 9: ENVIRONMENT BUDGET ALLOCATION OF THE EIOP, BY PRIORITY AND
MEASURE, AS WELL AS BY FIELD OF INTERVENTION ............................................. 16 TABLE 10: PROJECTS GRANTED IN ANIMAL WASTE MANAGEMENT ....................................... 18 TABLE 11: PROJECTS GRANTED IN HEALTHCARE AND CONSTRUCTION AND
DEMOLITION WASTE .................................................................................................. 19 TABLE 12: TREATMENT OF CONSTRUCTION AND DEMOLITION WASTE ............................... 20 TABLE 13: COLLECTION AND TREATMENT OF USED OIL [TONS] ........................................... 30

EX-POST EVALUATION OF COHESION POLICY PROGRAMMES 2000-2006 CO-FINANCED BY THE EUROPEAN FUND FOR REGIONAL DEVELOPMENT (OBJECTIVES 1 AND 2) - WORK PACKAGE 5B: ENVIRONMENT AND CLIMATE CHANGE ADE
Waste Prevention and Management of waste Case Study - Hungary - October 2009 Acronyms
Acronyms
BVM Budapest Chemical Works (Budapesti Vegyimuvek)
CF Cohesion Fund
CDW Construction and demolition waste
EC European Commission
EEOP Environment and Energy Operational Programme
EIOP The Environment Protection and Infrastructure Operational Programme
ERDF European Fund for Regional Development
EU European Union
GDP Gross Domestic Product
HUF Hungarian forint
ISPA Instrument for Structural Policies for Pre-Accession
kg Kilogram
MEW Ministry of the Environment and Water
NWMP National Waste Management Plan
OECD Organization for Economic Cooperation and Development
Phare Poland and Hungary Assistance for Economic Restructuring Programme
PPS Purchasing Power Standard
RWMP Regional Waste Management Plan
t Ton


EX-POST EVALUATION OF COHESION POLICY PROGRAMMES 2000-2006 CO-FINANCED BY THE EUROPEAN FUND FOR REGIONAL DEVELOPMENT (OBJECTIVES 1 AND 2) - WORK PACKAGE 5B: ENVIRONMENT AND CLIMATE CHANGE ADE
Waste Prevention and Management of waste Case Study - Hungary - October 2009 Summary
Summary - Key messages from the Hungary case study on waste prevention and management of waste
The volume of total waste generated in Hungary has decreased significantly since 2000 due to a crucial reduction in industrial waste. Furthermore, a significant decoupling of GDP and municipal waste was observed for the period 2000-2006: municipal waste increased by 3% while GDP increased by 28% in real terms. Even though the share of waste disposed of in landfills decreased in 2004-2006, the objective of the National Waste Management Plan that half of all waste had to be recovered or used for energy could not be achieved. This was mainly due to a lack of environmental consciousness of the population, as well as insufficient technologies and incentives. Municipal solid waste issues were covered by national funds and the Cohesion Fund. The main objective consisted of developing selective waste collection and treatment infrastructure. About €15.6m (12.45%) of the €125.3m financed by the ERDF during the 2004-2006 period was allocated to interventions concerning animal waste, construction and demolition waste and healthcare waste, considered in Hungary as “High-priority waste”. The main reason of this allocation was the urgent legal and sanitary needs correlated to their management that had to be satisfied. The ERDF strategy was to support the development of infrastructure dedicated to the processing and disposal of animal waste by the municipalities. The ERDF contributed to the creation of 15 new and renewed animal waste treatment units and to the recultivation of 85 dead animal pits. These interventions contributed to reducing hazardous components and health risks thanks to a separation of animal waste of high and low infection risk. Interest in this measure was low in 2004. The main reason for the difficult start was that the original objective of the measure was recultivation of dead animal pits, but this objective was not feasible due to ownership issues (most of the dead animal pits are privately owned facilities). However, the simplification of eligible activities by separation (20 May 2005), as well as the extension of the final scope of beneficiaries to business associations (20 May 2005), made it feasible to submit a greater number of tenders. As regards construction and demolition and healthcare waste, the main reason for intervention was related to the absence of inert waste landfill sites in the early 2000s. As a consequence, more than 80% of waste was disposed of in municipal waste landfill sites. Moreover, recycling could not be increased due to the absence of pre-treatment facilities.

EX-POST EVALUATION OF COHESION POLICY PROGRAMMES 2000-2006 CO-FINANCED BY THE EUROPEAN FUND FOR REGIONAL DEVELOPMENT (OBJECTIVES 1 AND 2) - WORK PACKAGE 5B: ENVIRONMENT AND CLIMATE CHANGE ADE
Waste Prevention and Management of waste Case Study - Hungary - October 2009 Summary
Regarding construction and demolition waste, the ERDF intervened through the development of selective collection and utilisation systems including treatment of the asbestos contained in waste. Concerning healthcare waste, the main planned activities within the EIOP were to invest in hospital (healthcare) waste incinerators to fulfil the technical requirements (emission and continuous measurement) and to develop and improve the healthcare waste collection and pre-treating systems. Only one project was implemented for healthcare waste (in contrast to a target of 14). The interest in healthcare waste treatment facilities was low, in spite of the fact that based on the National Waste Management Plan, more healthcare incinerators would be needed. As a consequence, €5.15m was reallocated at the end of 2006 to projects in flood prevention. The EIOP has contributed to supporting the creation of collection and waste utilisation systems and to reducing hazardous components as well as applying material specific treatment rules. This had an impact on the quality of life through the reduction of animal epidemic risks and the potential damage of asbestos. On the other hand, EIOP projects have solved only some local/regional problems as regards recycling. One reason is that the construction industry was not interested in recycling because of the low price of natural raw materials.

EX-POST EVALUATION OF COHESION POLICY PROGRAMMES 2000-2006 CO-FINANCED BY THE EUROPEAN FUND FOR REGIONAL DEVELOPMENT (OBJECTIVES 1 AND 2) - WORK PACKAGE 5B: ENVIRONMENT AND CLIMATE CHANGE ADE
Waste Prevention and Management of waste Case Study - Hungary - October 2009 Page 1
1. General strategic context
1.1 Brief introduction to the socio-economic context of Hungary
Hungary is characterised by a medium-sized open economy and has been part of the European Union since 2004.
Figure 1: Map of Hungary
With an employment rate1 of 57.3% in 2006, Hungary has a slightly lower rate than the EU 25 (64.7%). As shown in Table 1 hereafter, agriculture, industry and services employed in 2005 4.9%, 32.4% and 62.7% of the employed respectively. As in most EU countries, Hungary experienced a reduction of activities in the agriculture and industry sectors to the benefit of the services sector between 2000 and 2005.
Table 1: Percentage of employment by sector (agriculture, industry and services) in 2000 and 2005
1 The employment rate refers to the 15-64 age group.
Agricuture Industry Services
2000 6.4 33.9 59.82005 4.9 32.4 62.7
% total employedYear

EX-POST EVALUATION OF COHESION POLICY PROGRAMMES 2000-2006 CO-FINANCED BY THE EUROPEAN FUND FOR REGIONAL DEVELOPMENT (OBJECTIVES 1 AND 2) - WORK PACKAGE 5B: ENVIRONMENT AND CLIMATE CHANGE ADE
Waste Prevention and Management of waste Case Study - Hungary - October 2009 Page 2
1.2 GDP growth and waste generation in Hungary
1.2.1 GDP growth
The evolution of Hungary’s and EU 25’s GDP per capita (in PPS) for the period 2000-2006 is shown in Graph 1 below. With an annual average GDP per capita growth of 6.7% for the period 1999-2005, Hungary experienced a relatively high growth rate compared to the EU 25 (3.8%). However, GDP per capita in 2005 amounted to €14,393 per inhabitant which is almost two times lower than the GDP per capita in the EU 25 (€23,318).
Graph 1: GDP per capita (in PPS) and average growth rate in Hungary and the EU 25 over the period 1999-2005
5000
7000
9000
11000
13000
15000
17000
19000
21000
23000
25000
1999 2000 2001 2002 2003 2004 2005
Hungary
EU 25
3.8 %
HU ‐ Average growth rate for the period
EU 25 ‐ Average growth rate for the period
6.7 %
Source: ADE based on Eurostat
1.2.2 Total waste production
As shown in Table 2 below, the volume of total waste generated has decreased significantly since 2000. This is mainly due to a decrease in the number of economic activities producing waste, so called “production waste”. The decrease of production waste resulted from (1) the decline as of 2004 of the main waste generating sectors in the early 2000s (for example, mining and metallurgy), (2) the application of modern production methods and new technologies and (3) the development of industries with low material requirements and high skills (electronics and car manufacture). In certain cases, the use of hazardous materials (for example, toxic heavy metals) also fell. However, the application of non-waste (minimum waste) technologies and the recycling of production residues were not encouraged sufficiently, therefore, the results in this field were only modest.
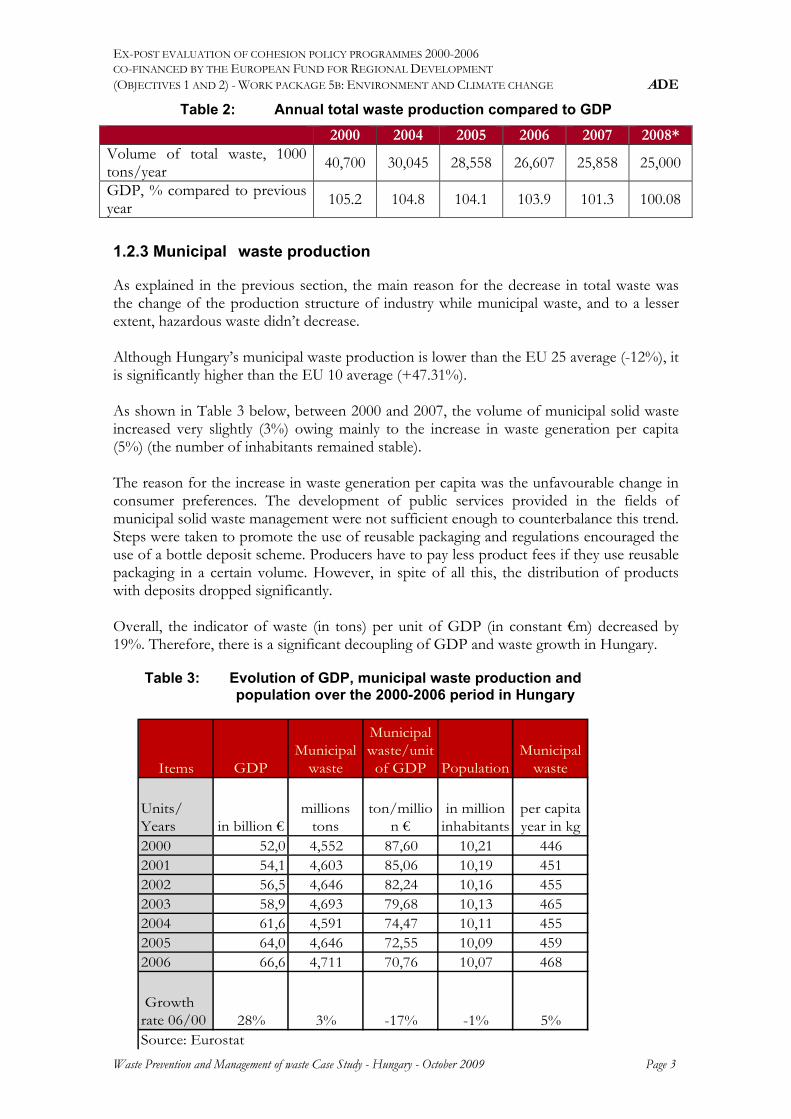
EX-POST EVALUATION OF COHESION POLICY PROGRAMMES 2000-2006 CO-FINANCED BY THE EUROPEAN FUND FOR REGIONAL DEVELOPMENT (OBJECTIVES 1 AND 2) - WORK PACKAGE 5B: ENVIRONMENT AND CLIMATE CHANGE ADE
Waste Prevention and Management of waste Case Study - Hungary - October 2009 Page 3
Table 2: Annual total waste production compared to GDP
2000 2004 2005 2006 2007 2008* Volume of total waste, 1000 tons/year
40,700 30,045 28,558 26,607 25,858 25,000
GDP, % compared to previous year
105.2 104.8 104.1 103.9 101.3 100.08
1.2.3 Municipal waste production
As explained in the previous section, the main reason for the decrease in total waste was the change of the production structure of industry while municipal waste, and to a lesser extent, hazardous waste didn’t decrease. Although Hungary’s municipal waste production is lower than the EU 25 average (-12%), it is significantly higher than the EU 10 average (+47.31%). As shown in Table 3 below, between 2000 and 2007, the volume of municipal solid waste increased very slightly (3%) owing mainly to the increase in waste generation per capita (5%) (the number of inhabitants remained stable). The reason for the increase in waste generation per capita was the unfavourable change in consumer preferences. The development of public services provided in the fields of municipal solid waste management were not sufficient enough to counterbalance this trend. Steps were taken to promote the use of reusable packaging and regulations encouraged the use of a bottle deposit scheme. Producers have to pay less product fees if they use reusable packaging in a certain volume. However, in spite of all this, the distribution of products with deposits dropped significantly. Overall, the indicator of waste (in tons) per unit of GDP (in constant €m) decreased by 19%. Therefore, there is a significant decoupling of GDP and waste growth in Hungary.
Table 3: Evolution of GDP, municipal waste production and population over the 2000-2006 period in Hungary
Items GDPMunicipal
waste
Municipal waste/unit of GDP Population
Municipal waste
Units/ Years in billion €
millions tons
ton/million €
in million inhabitants
per capita year in kg
2000 52,0 4,552 87,60 10,21 4462001 54,1 4,603 85,06 10,19 4512002 56,5 4,646 82,24 10,16 4552003 58,9 4,693 79,68 10,13 4652004 61,6 4,591 74,47 10,11 4552005 64,0 4,646 72,55 10,09 4592006 66,6 4,711 70,76 10,07 468
Growth rate 06/00 28% 3% -17% -1% 5%Source: Eurostat


EX-POST EVALUATION OF COHESION POLICY PROGRAMMES 2000-2006 CO-FINANCED BY THE EUROPEAN FUND FOR REGIONAL DEVELOPMENT (OBJECTIVES 1 AND 2) - WORK PACKAGE 5B: ENVIRONMENT AND CLIMATE CHANGE ADE
Waste Prevention and Management of waste Case Study - Hungary - October 2009 Page 5
2. National strategy for solid waste management and generation
2.1 National Waste Management Plan and institutional context
2.1.1 National Waste Management Plan
As can been seen in the table below, the NWMP expected a decrease in the generation of non-hazardous agricultural and industrial waste as well as municipal liquid waste (excluding sewage sludge) during the 2000-2008 period. In total, waste generation excluding biomass was expected to decrease by 10.6%, whereas, biomass included, total waste generation was expected to remain stable as a whole. Excluding municipal sewage sludge, hazardous waste was expected to experience the strongest increase (20.6%) during the 2000-2008 period, whereas biomass was expected to increase by 14.3%.
Table 4: Expected goals in waste generation according to the National Waste Management Programme (million tons)
Waste type 2000 2005 2008 %
increase 2000-08
Agricultural and food-industrial, non hazardous 5.0 5.0 3.0 -40.0 Industrial and other business, non hazardous 21.5 20.0 18.0 -16.3 Municipal solid 4.6 4.8 5.2 13.0 Municipal liquid (not including sewage sludge) 5.5 5.2 4.6 -16.4 Municipal sewage sludge 0.7 1.1 1.5 114.3 Hazardous 3.4 4.0 4.1 20.6 Total 40.7 40.1 36.4 -10.6 Biomass 28.0 30.0 32.0 14.3 Overall total 68.7 70.1 68.4 -0.4 The target set by the NWMP (for the period 2003 – 2008) was that half of the total waste (excluding biomass) produced had to be recovered or used for energy generation. Only the share of waste which could not be used in these ways should have been disposed of in landfills. However, this target was not reached, even though the share of waste landfilled decreased by 4.6% from 2004 to 2006 (see table below). The first reason which explains this failure is a lack of environmental consciousness to protect natural resources. Secondly, the technological capacities of material recovery are not available in Hungary. Finally, the intention to decrease the volume of waste disposed of in landfills is not sufficiently encouraged by economic regulation incentives.

EX-POST EVALUATION OF COHESION POLICY PROGRAMMES 2000-2006 CO-FINANCED BY THE EUROPEAN FUND FOR REGIONAL DEVELOPMENT (OBJECTIVES 1 AND 2) - WORK PACKAGE 5B: ENVIRONMENT AND CLIMATE CHANGE ADE
Waste Prevention and Management of waste Case Study - Hungary - October 2009 Page 6
Table 5: Total waste management (without waste water sludge)
2004 2005 2006 Tons % tons % tons % Recovered 8 892 837 29.8 7 630 197 26.9 6 697 451 25.2 Used for energy generation
911 322 3.1 1 271 472 4.5 1 627 237 6.1
Incinerator 169 852 0.6 52 756 0.2 101 434 0.4 Landfill 17 415 456 58.3 13 602 494 48.0 14 288 930 53.7 Other 2 461 033 8.2 5 799 114 20.4 3 892 287 14.6
Source: database of the Waste Information System (HIR) In addition, the prescriptions of the new Framework Directive had to be fulfilled: recycling at least 50% of paper, plastic, glass and metal waste from households and 70% of construction and demolition waste by 2020. As for animal waste, there is no quantitative goal as all waste has to be managed in line with EU regulations on animal by-products. Healthcare waste has also only qualitative goals on adequate treatment of all the generated quantity.
2.1.2 Institutional context
In the field of waste management, the Ministry of the Environment is responsible for: The determination of strategy and policies; The development of the legal, economic and technical framework.
However, all other ministries play a role in the regulation, planning and monitoring of waste management when it is linked to their competency. The twelve Regional Environmental Inspectorates, under the authority of the Ministry of the Environment have the responsibility for licensing, supervision and enforcement. The municipalities are responsible for building and site surveying. In their specific policies and development plans, the municipalities have to include the NWMP’s goals and put in place the necessary framework to reach them.
2.2 Industrial waste
Some interesting projects have been implemented, such as the use of slag ash scale in Tiszaújváros and foundry slag in Dunaújváros in the construction of both the M6 and M35 roads. The development of hazardous waste treatment was financed partly by private investments and partly by the aid of the Ministry of the Environment, which financed projects in the fields of localisation of environmental contamination, the development of hazardous waste collection and deposit, the closing of waste incinerators operating without

EX-POST EVALUATION OF COHESION POLICY PROGRAMMES 2000-2006 CO-FINANCED BY THE EUROPEAN FUND FOR REGIONAL DEVELOPMENT (OBJECTIVES 1 AND 2) - WORK PACKAGE 5B: ENVIRONMENT AND CLIMATE CHANGE ADE
Waste Prevention and Management of waste Case Study - Hungary - October 2009 Page 7
environmentally appropriate burning conditions and the upgrading of incinerators suitable for healthcare waste. In spite of the plan included in the NWMP to enlarge the capacities of landfills for hazardous waste, only one project has been implemented (in Szuhogy) within this framework, as further facilities were finally considered to be unnecessary. The total share of material and energy recovery of industrial waste reached 29% in 2006.
2.3 Municipal waste
2.3.1 Municipal Solid Waste
The 2nd National Environmental Programme and Regional Waste Management systems
In the 2nd National Environmental Programme (2003 – 2008) the target was to decrease the ratio of landfills which did not meet environmental requirements from 85% in 2003 to zero by the end of 2008. This target should have been reached by 15th July 2009. The continuous recultivation and monitoring of the closed landfills has to be carried out in order to minimise the risk originating from the earlier load to the environment. The recultivation measures of the Environment and Energy Operational Programme (EEOP) aimed to close professionally 651 landfills in the first two years (2007-2008) of the programme. During the period of the 2nd National Environmental Programme, the most important tasks were the preparation and implementation of the regional waste management systems. Each regional waste management system includes municipal waste systems, which deal with various fields, such as the creation and management of waste treatment plants, selective collection and treatment, treatment of biodegradable waste, disposal of waste in EU-conforming landfills and remediation of old landfills. The proportion of households served by the regular waste collection system was 85.1% in 2000. As a result of the distribution of the modern waste management systems and of the developments - supported by local and regional waste management plans - its share reached 92% in 2006. This share was the highest in the Central Hungary Region (95.9%) and only in the two regions of the Great Plain did it not reach 90% (the Northern Great Plain Region: 89.8%, and the Southern Great Plain Region: 84.9%).
Contribution of the Central government targeted on selective waste collection
Up to 2005, the main field of intervention for the financial assistance of the Hungarian government related to municipal waste treatment was the development of selective waste collection. Thanks to the help of governmental aid and later, the tendering system operated by the regional development councils, 1,632 waste collection islands, 12 waste collection yards and 17 composting plants were created.

EX-POST EVALUATION OF COHESION POLICY PROGRAMMES 2000-2006 CO-FINANCED BY THE EUROPEAN FUND FOR REGIONAL DEVELOPMENT (OBJECTIVES 1 AND 2) - WORK PACKAGE 5B: ENVIRONMENT AND CLIMATE CHANGE ADE
Waste Prevention and Management of waste Case Study - Hungary - October 2009 Page 8
To accomplish these interventions, a sum was dedicated from the central State budget to give an incentive to municipalities for the development of their public selective collection systems. A tender procedure was established to choose the best municipal proposals. The procedure was managed for three years by the Ministry of the Interior and later by the Regional Development Councils. Before 2001, there was no obliged responsibility for municipal waste treatment. Municipalities could decide if they organised a public service, and how. Thanks to this financing, the municipalities were able to purchase 111 waste collecting vehicles (including 31 special vehicles for collecting fluid waste) and 5,950 special instruments (composting frames) for home composting. In spite of the increasingly selective collection, the volume of organic and hazardous materials disposed of did not decrease.
ISPA/Cohesion Fund contribution focused on selective waste collection and recovery as well as on landfill development and recultivation
The 12 ISPA projects implemented provided services to 3.8 million inhabitants. These projects concerned selective waste collection and recovery as well as the development of regional landfills and recultivation of old landfills. By 2008, most of the investments were implemented or were close to completion. Some delays were observed due to difficulties in their preparation or in the selection of the location. The Cohesion Fund financed the implementation of different projects, including the implementation of the 1st phase and the preparation of the second phase of the regional waste management system of Szabolcs-Szatmár-Bereg county (providing services for 600,000 inhabitants). Other projects were supported by the CF in the framework of the New Hungary Development Plan (ÚMFT). After Hungary's accession to the EU, the old product charge system was changed into a fee based system operated by the coordinating organisations2, in which the operation of collection and recovery was no longer financed by the central government but by those who are obliged to do this. These organisations participated in the implementation of the municipal selective collecting systems of waste.
2 Government Decree No. 264/2004 (IX.23.) regulates the manufacturers’ obligations. The Obligor has, as a
manufacturer, namely, the manufacture’s collection, gathering, recovery and disposal obligations. The Obligor, as a manufacturer, may transfer these obligations to a recovery coordinating organization set up in accordance with the conditions set out in Section 11 of Act XLIII of 2000 on Waste Management and Section 7(1)’b’ of the Government Decree and with the conditions set out in Section 10(5) of the latter.
In the case of packaging and e-waste, it is reasonable for the manufacturer to join to a coordinating body:
it is cheaper than to pay the fees;
data have to be supplied only to the coordinating body;
the coordinating bodies help in the administration and data supply.

EX-POST EVALUATION OF COHESION POLICY PROGRAMMES 2000-2006 CO-FINANCED BY THE EUROPEAN FUND FOR REGIONAL DEVELOPMENT (OBJECTIVES 1 AND 2) - WORK PACKAGE 5B: ENVIRONMENT AND CLIMATE CHANGE ADE
Waste Prevention and Management of waste Case Study - Hungary - October 2009 Page 9
As regards selective waste collection and recovery, the impact of the projects can already be observed. Regarding the recovery of municipal solid waste, the ratio of material recovery and the ratio of waste used for energy generation increased, albeit slightly. In parallel, the ratio of waste landfilled decreased (see Table 7). In spite of these results, the numerical targets of waste recovery indicated in the National Waste Management Plan could not be reached. The ratio of municipal waste collection to the volume of total waste collected was only 10.4% instead of 35-40%; the ratio of the recovery of municipal waste to the total volume of waste collected was 18.7% in 2006 instead of the target of 50%.
Table 6: Treatment of municipal solid waste, thousand tons and %
2004 2005 2006 2007** Recovery 540 11,76% 444 9,56% 490 10,40% 554 12,06% Used for energy generation* 155 3,38% 303 6,52% 389 8,26% 383 8,34% Landfilled 3857 83,99% 3859 83,06% 3792 80,49% 3428 74,62% Other 40 0,87% 40 0,86% 40 0,85% 229 4,98% Total 4592 100% 4646 100% 4711 100% 4594 100% Source: Hungarian Central Statistical Office, Ministry of the Environment and Water *The fluctuation of the values of 'used for energy generation’ is caused by the stopping of the operation of the Waste Recovery Plant of Budapest and restarting it due to reconstruction. ** preliminary data
This lagging behind can be explained by economic factors: landfilling of waste is the cheapest method. One of the reasons is the lack of waste processing capacity (among others, also the lack of composting plants), the deficiencies of inspection (regularity, sanctions) and the low level of environmentally conscious behaviour. It must also be mentioned that the implementation of the complex regional waste management systems was delayed. The Phare survey carried out in Hungary in 2002 identified 2,667 sites and evaluated the environmental risks of those where the municipal solid waste was landfilled after 1950. Among these, approximately 1,000 were still in operation in 2003 but the number of operating landfills decreased drastically during the programming period. In 2008, only 141 landfills were in operation and of these, 73 were modern and 68 landfills are to be closed by July 2009. The closure and recultivation of the old landfills is an expensive and long term task for which the Ministry of the Environment and Water granted financial aid to 36 settlements (there was a so-called Environmental Fund managed by the Ministry in 1996 – 2004 and calls were issued to the municipalities for tendering the recultivation of closed landfills); in the framework of the ISPA projects, another 328 landfills were recultivated; but around 1,000 closed landfills are still being recultivated.3
3 The new source of this work is provided by the Environment and Energy Operational Programme (EEOP 2007 -
2013) in the frame of which financial assistance can be provided to the municipalities submitting tenders for financial aid to cover 100% of the recultivation costs.

EX-POST EVALUATION OF COHESION POLICY PROGRAMMES 2000-2006 CO-FINANCED BY THE EUROPEAN FUND FOR REGIONAL DEVELOPMENT (OBJECTIVES 1 AND 2) - WORK PACKAGE 5B: ENVIRONMENT AND CLIMATE CHANGE ADE
Waste Prevention and Management of waste Case Study - Hungary - October 2009 Page 10
2.3.2 Packaging waste
In the field of packaging, the public sector is involved in the selective collection system and the deposit fee system. The producers of packaging pay the municipalities (or the public service provider) for the collection and transport of packaging waste. Thus, this is a system based on the producers’ responsibility. In 2005, out of the 853,000 tons of produced packaging material, the coordinated bodies were responsible for 670,000 tons, of which 446,000 tons were recovered, which represented a ratio of 52%. In 2006, 885,000 tons were produced and 50% was considered to be recovered. The EU requirement for the recovery of 50% of packaging material was thus met by Hungary in 2005, as was the material recovery of waste (recycling) and the use of waste for energy generation.
Table 7: Recovery of packaging waste 2005
Material Packaging waste produced (tons)
Ratio of material recovery %
Ratio of recovery (together with
energy generation) %
Glass 126,271 20.5 20.5 Plastic 187,791 19.2 34.7 Paper and hard paper 296,017 85.8 93.0 Aluminium 6,211 54.1 54.1 Steel (iron) 56,927 69.4 69.4 Total metal 63,138 67.9 67.9 Wood 178,197 18.3 20.8 Other 1,630 0 0 Total 853,044 45.9 52.3 Source: Ministry of the Environment and Water The recovery rate for paper and cardboard is very high while the recovery rate of wooden and glass waste is relatively low. In order to meet the long term targets, both the processing capacities and the collecting networks have to be developed.
2.3.3 Healthcare waste
In most hospitals, waste is collected selectively and it is handed over to waste management organisations. The consulting rooms of private and family doctors are linked to one of the healthcare collecting organisations to ensure the selective collection of waste. In accordance with the EU requirements, waste incinerators operating without meeting the appropriate environmental requirements were closed by 2005; in some cases where it was necessary, the incinerators were developed in order to become suitable for also incinerating healthcare waste. From 2004, tenders could be submitted for this latter development in the framework of the Environmental and Infrastructure Operation Programme of the National Environmental Programme but in fact, a grant was only provided for one project since the

EX-POST EVALUATION OF COHESION POLICY PROGRAMMES 2000-2006 CO-FINANCED BY THE EUROPEAN FUND FOR REGIONAL DEVELOPMENT (OBJECTIVES 1 AND 2) - WORK PACKAGE 5B: ENVIRONMENT AND CLIMATE CHANGE ADE
Waste Prevention and Management of waste Case Study - Hungary - October 2009 Page 11
development and operation of small capacity incinerators was not profitable for the operators.
2.3.4 Animal waste
According to Hungarian legislation, the responsibility of municipalities related to the transport, processing and disposal of animal waste only exists if the owner of the animal waste is unknown. Otherwise, it is the owner of the animal who bears the responsibility of its treatment and who covers the costs. Therefore, municipalities do not hold any public responsibility in the disposal of animal waste. However, as a voluntarily accepted municipal task, they generally expand the public service of waste management to operate collection and treatment plants for animal waste in accordance with both EU and national standards. According to both EU Directives and national legislation, dead animals cannot be disposed of as waste by burial or put into dead animal pits. Under Hungarian legislation, carcasses and animal waste from slaughterhouses are classified as hazardous waste due to their infection potential, although their treatment has first of all to comply with veterinary sanitisation rules. The disposal of animal carcasses in animal waste dumps and dead animal pits had to be stopped. Hungary had to establish and develop regional animal waste treatment sites. These sites include: regional animal waste collection sites with the separation of animal waste of high and
low infection risk; composting plants; transfer stations; incinerators. The quantity of waste deposited at centralised depositories with adequate protection must be minimised through increased processing, composting and incineration. In order to prevent the spread of animal epidemics at the time of appearance of any contagious disease, incinerator equipment suitable for the disposal of carcasses and in compliance with environmental requirements should be installed. The majority of animal waste is taken and treated by ATEV Protein Processing Co. ATEV is a state owned company which deals with animal waste transportation, processing and disposal under the authority of the Ministry of Agriculture and Rural Development. ATEV provides services, among others to slaughterhouses, meat and poultry processing plants and to municipalities (for animals of unknown origin). In order to fulfil their legislative obligations, the municipalities have to establish their own regional and sub-regional collecting sites with the separation of animal waste of high and low infection risk. This collecting and buffer storage system must replace the carcass wells and animal pits. The deadline of 2005 for eliminating the carcass dumps and carcass wells could not be met due mainly to the lack of financial resources of the municipalities.

EX-POST EVALUATION OF COHESION POLICY PROGRAMMES 2000-2006 CO-FINANCED BY THE EUROPEAN FUND FOR REGIONAL DEVELOPMENT (OBJECTIVES 1 AND 2) - WORK PACKAGE 5B: ENVIRONMENT AND CLIMATE CHANGE ADE
Waste Prevention and Management of waste Case Study - Hungary - October 2009 Page 12
From 2004 onwards, tenders could be submitted in the framework of the Environmental and Infrastructure Operation Programme of the National Environmental Programme for developing animal waste treatment (see section 3.3). Grants were provided to 15 projects, of which 6 were completed, and by the end of 2008 the others were also completed. Unfortunately, during the 2007-2013 period, neither the Operational Programmes (due to maintenance and operation) (Development Directorate) of the New Hungary Development Plan (ÚMFT) nor the agricultural programmes (New Hungary Rural Development Plan) launched tenders for grants for such investments.
2.3.5 Construction and demolition waste
The NWMP set the treatment of some special waste streams (e.g. healthcare waste, construction and demolition waste, a part of them containing asbestos) among the tasks of municipalities which have to follow the objectives and the specialised action plans for the different treatment procedures of municipal solid waste (selective collection, recovery, disposal, pre-treatment activities, etc.) In 2004, a ministerial decree came into force concerning the treatment of construction/demolition waste, which introduced a special reporting system on the generation and treatment of these forms of waste. This system was incorporated into the building permission action and gave rules for collection, recycling and disposal. The determination of the volume of construction and demolition waste and its treatment has to be performed during the procedure of issuing the permit. It is forbidden to accumulate and to leave waste uncontrolled. This contributes to the elimination of illegal landfills. This decree applies only to non-hazardous, inert waste.
From 2004, in the framework of the Environmental and Infrastructure Operation Programme of the National Environmental Programme, tenders were launched for developing the treatment of construction and demolition waste (see section 3.4).
2.3.6 Municipal fluid waste
Municipal fluid waste refers to wastewater not collected by the sewage system but in individual basins, which are then transported by special vehicles to wastewater treatment plants. During the second part of the 2nd National Environmental Programme, the amounts to finance the development of sewage systems decreased slightly and no resources were provided for upgrading individual sewage treatment facilities. As a consequence, little progress was observed. The strategy of the government was to close the municipal fluid waste collecting facilities, which were not protected technically (earth bottom); these collecting facilities had to be terminated by the end of October 2007. This was not possible and the deadline was extended to 2015. The problem was that this issue generally concerned isolated habitations

EX-POST EVALUATION OF COHESION POLICY PROGRAMMES 2000-2006 CO-FINANCED BY THE EUROPEAN FUND FOR REGIONAL DEVELOPMENT (OBJECTIVES 1 AND 2) - WORK PACKAGE 5B: ENVIRONMENT AND CLIMATE CHANGE ADE
Waste Prevention and Management of waste Case Study - Hungary - October 2009 Page 13
located a long distance from wastewater treatment, which made connection difficult and very expensive for the inhabitants. In some regions there were no treatment capacities or no technology could be found which would be able to handle the fluid waste.
2.4 Special waste streams The requirements of the EU could be met and this can also be expected in the coming years. Special waste streams are namely: cells and batteries, packaging, tyres, destroyed vehicles and electrics and electronic equipment. However, fulfilling the requirements did not mean that the volume of waste could be decreased. Moreover, the application of packaging material recycling systems decreased significantly. From January 2003, the two systems, namely the old 'product charge-based solution’ and the new 'recovery fee’ system were operated parallel to each other. However, from 2005 the obligations of recovery cannot be changed to paying the product charge.
2.5 The case of the City of Budapest Budapest, the capital of Hungary, has a population of approximately 1,850,000 inhabitants. The waste management service is carried out by a public company, FKF Zrt., which is entirely owned by the municipality of Budapest. The most important tasks of this company include the collection, transport and disposal of municipal waste as well as cleaning public places. The company, together with associate contractors, as winners of the tender called by the Local Government of Budapest, has been charged with the treatment of communal solid waste. Up-to-date compacting vehicles are used to collect waste from approximately 800,000 Budapest households. The waste is thermally utilised or dumped into landfills. Household waste collection is organised as follows: door to door collection of unsorted waste which will be disposed of in the incinerator
or in landfills; 1,000 “islands”, that is to say, groups of road waste bins for the separate collection of
paper, plastics, glass and metal.
Both the incinerator and the landfills correspond to strict European environmental standards.
Table 8: Treatment of urban solid waste produced by Budapest households (2006)
Disposal/treatment Tons/year % Incinerator 420,000 51.53%
Landfill 355,000 43.56% Recycle 40,000 4.91% Total 815,000 100.00%
Source: based on interviews with the stakeholders

EX-POST EVALUATION OF COHESION POLICY PROGRAMMES 2000-2006 CO-FINANCED BY THE EUROPEAN FUND FOR REGIONAL DEVELOPMENT (OBJECTIVES 1 AND 2) - WORK PACKAGE 5B: ENVIRONMENT AND CLIMATE CHANGE ADE
Waste Prevention and Management of waste Case Study - Hungary - October 2009 Page 14
Non–household waste is managed according to free market regulations. Non-household waste is similar to household waste but the producer is not a household but a company. This waste is also collected by the same company (FKF ZRT.) but on the basis of contracts concluded on market terms. As a result of the modernisation of the Budapest Municipal Waste Incineration Works, implemented between 2003 and 2006, the emission of the plant meets the requirements of the EU and the capacity of the Works was increased to 420,000 tons per year.

EX-POST EVALUATION OF COHESION POLICY PROGRAMMES 2000-2006 CO-FINANCED BY THE EUROPEAN FUND FOR REGIONAL DEVELOPMENT (OBJECTIVES 1 AND 2) - WORK PACKAGE 5B: ENVIRONMENT AND CLIMATE CHANGE ADE
Waste Prevention and Management of waste Case Study - Hungary - October 2009 Page 15
3. ERDF contribution 3.1 Introduction The contribution of the ERDF through the EIOP was satisfactory in the sense that it helped Hungary to start and lead a process of improvement of its environmental conditions and to comply with several legislative laws in the field of the environment, and namely in waste management. About €15.6m out of the €125.3m financed by the ERDF during the 2004-2006 period was allocated to interventions concerning animal waste, construction and demolition waste and healthcare waste, considered in Hungary as “High-priority waste”. The decision to spend this share of 12.45% of ERDF funds on these specific waste streams was made on the basis of three elements: (i) the urgent legal and sanitary needs linked to their management had to be satisfied; (ii) successful interventions had been made in the field of Municipal Waste Management through 12 ISPA projects investing €212m from the Cohesion Fund; (iii) the total available amount from the ERDF in the 2004-2006 period did not allow other adequate interventions on Municipal Solid Waste management.
3.2 Articulation of the EIOP The EIOP in Hungary was composed of two priorities: Environmental protection and transport. Regarding the environment, the strategic objective was the “improvement of the environment by assisting the sustainable development through environment and nature protection developments”. The specific objectives of “Environmental protection” (priority 1) were the following:
improving access to environmental and water infrastructures; the protection of sub-surface water and drinking water bases; strengthening nature conservation; the development of energy management by increasing the efficient use of renewable
energy resources.
The programme was composed of seven environmental measures (see Table 9 below). Four of them were related to water, specific waste management, and (to a lesser extent) air and noise. Two were related to the protection of groundwater and various actions of nature conservation and flood management. Finally, one measure concerned the energy sector. Overall, environmental infrastructure represented just over 50% of EIOP investments. This mainly included the water sector with 36%, followed by waste management with 14%. Regarding “High priority waste”, the objectives were: (i) Establishing streams with material-specific treatment rules, in addition to the applicable general rules; (ii) Separating hazardous components from other waste and facilitating recovery and recycling. Another priority related to waste management was to improve landfills, which accounted for 83% of waste disposal. Among the 452 landfills which operated with permission in 2004, only 30% met the requirements of a modern landfill site. The estimated number of abandoned, closed down landfills or illegal waste dumps was over two thousand in Hungary. Energy recovery and selective waste collection also constituted priorities.

EX-POST EVALUATION OF COHESION POLICY PROGRAMMES 2000-2006 CO-FINANCED BY THE EUROPEAN FUND FOR REGIONAL DEVELOPMENT (OBJECTIVES 1 AND 2) - WORK PACKAGE 5B: ENVIRONMENT AND CLIMATE CHANGE ADE
Waste Prevention and Management of waste Case Study - Hungary - October 2009 Page 16
Table 9: Environment budget allocation of the EIOP, by priority and measure, as well as by field of intervention
Note: Cd=code Source: Financial information from the WP1 evaluation, 2008 Revised Second Intermediate Report – April 2009

EX-POST EVALUATION OF COHESION POLICY PROGRAMMES 2000-2006 CO-FINANCED BY THE EUROPEAN FUND FOR REGIONAL DEVELOPMENT (OBJECTIVES 1 AND 2) - WORK PACKAGE 5B: ENVIRONMENT AND CLIMATE CHANGE ADE
Waste Prevention and Management of waste Case Study - Hungary - October 2009 Page 17
The selection of the projects was based on: -their compliance with the objectives of the EIOP as well as their correlation with the
EU subsidy principles; The reasonability and feasibility of the projects (the methodology, sustainability, budget
and cost efficiency); Evaluation of the applying organisation (in terms of management, capacity, experience,
skills, evaluation of the partners and financial state of the applicant.
3.3 Animal waste
ERDF intervention
The specific objectives of the intervention were: (i) reducing the health risk originating from inadequate treatment of animal waste; (ii) reducing hazardous components; (iii) separating animal waste of high and low infection risk.
At least five factors influenced the demand for the intervention: the obligatory closing down of dead animal pits and sites: dead animal pits and sites did
not comply with the effective EU and national environmental and public health requirements so they had to be closed down by December 31st 2005;
the collapse of the traditional business model: the sustainability of the earlier system was ensured by the process and sale of animal waste as fodder;
the rising competition in the market of animal waste with the entry of Slovakian and Austrian service providers forcing ATEV to compete;
the treatment of illegal animal waste resulting from anonymity: while earlier animal waste could be disposed of into containers of the municipalities anonymously, the termination of these containers led to a decrease in the quantity of the otherwise illegally delivered or transported waste.
Even though the municipalities are in fact responsible for managing animal waste in coherence with EU and national legislation, they did not possess the necessary infrastructure to accomplish this task. EIOP measure 1.2 “Animal waste” was conceived to support the development of infrastructure dedicated to the processing and disposal of animal waste by the municipalities. In coherence with the typical properties of animal waste, the main activities covered by this measure were: (i) the enhancing of special animal waste collection and treatment systems/facilities; (ii) the liquidation of all operating and closed-down dead animal pits and animal waste
dumps.
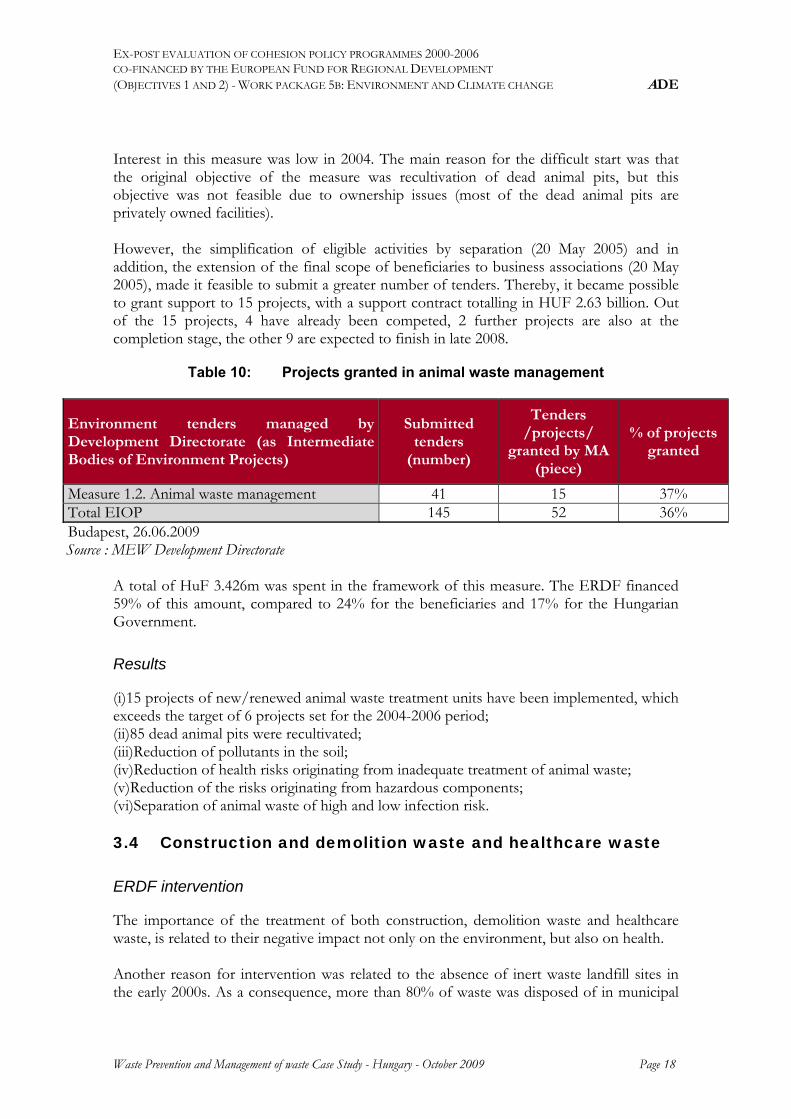
EX-POST EVALUATION OF COHESION POLICY PROGRAMMES 2000-2006 CO-FINANCED BY THE EUROPEAN FUND FOR REGIONAL DEVELOPMENT (OBJECTIVES 1 AND 2) - WORK PACKAGE 5B: ENVIRONMENT AND CLIMATE CHANGE ADE
Waste Prevention and Management of waste Case Study - Hungary - October 2009 Page 18
Interest in this measure was low in 2004. The main reason for the difficult start was that the original objective of the measure was recultivation of dead animal pits, but this objective was not feasible due to ownership issues (most of the dead animal pits are privately owned facilities). However, the simplification of eligible activities by separation (20 May 2005) and in addition, the extension of the final scope of beneficiaries to business associations (20 May 2005), made it feasible to submit a greater number of tenders. Thereby, it became possible to grant support to 15 projects, with a support contract totalling in HUF 2.63 billion. Out of the 15 projects, 4 have already been competed, 2 further projects are also at the completion stage, the other 9 are expected to finish in late 2008.
Table 10: Projects granted in animal waste management
Source : MEW Development Directorate A total of HuF 3.426m was spent in the framework of this measure. The ERDF financed 59% of this amount, compared to 24% for the beneficiaries and 17% for the Hungarian Government.
Results
(i)15 projects of new/renewed animal waste treatment units have been implemented, which exceeds the target of 6 projects set for the 2004-2006 period; (ii)85 dead animal pits were recultivated; (iii)Reduction of pollutants in the soil; (iv)Reduction of health risks originating from inadequate treatment of animal waste; (v)Reduction of the risks originating from hazardous components; (vi)Separation of animal waste of high and low infection risk.
3.4 Construction and demolition waste and healthcare waste
ERDF intervention
The importance of the treatment of both construction, demolition waste and healthcare waste, is related to their negative impact not only on the environment, but also on health. Another reason for intervention was related to the absence of inert waste landfill sites in the early 2000s. As a consequence, more than 80% of waste was disposed of in municipal
Environment tenders managed by Development Directorate (as Intermediate Bodies of Environment Projects)
Submitted tenders
(number)
Tenders /projects/
granted by MA (piece)
% of projects granted
Measure 1.2. Animal waste management 41 15 37% Total EIOP 145 52 36% Budapest, 26.06.2009
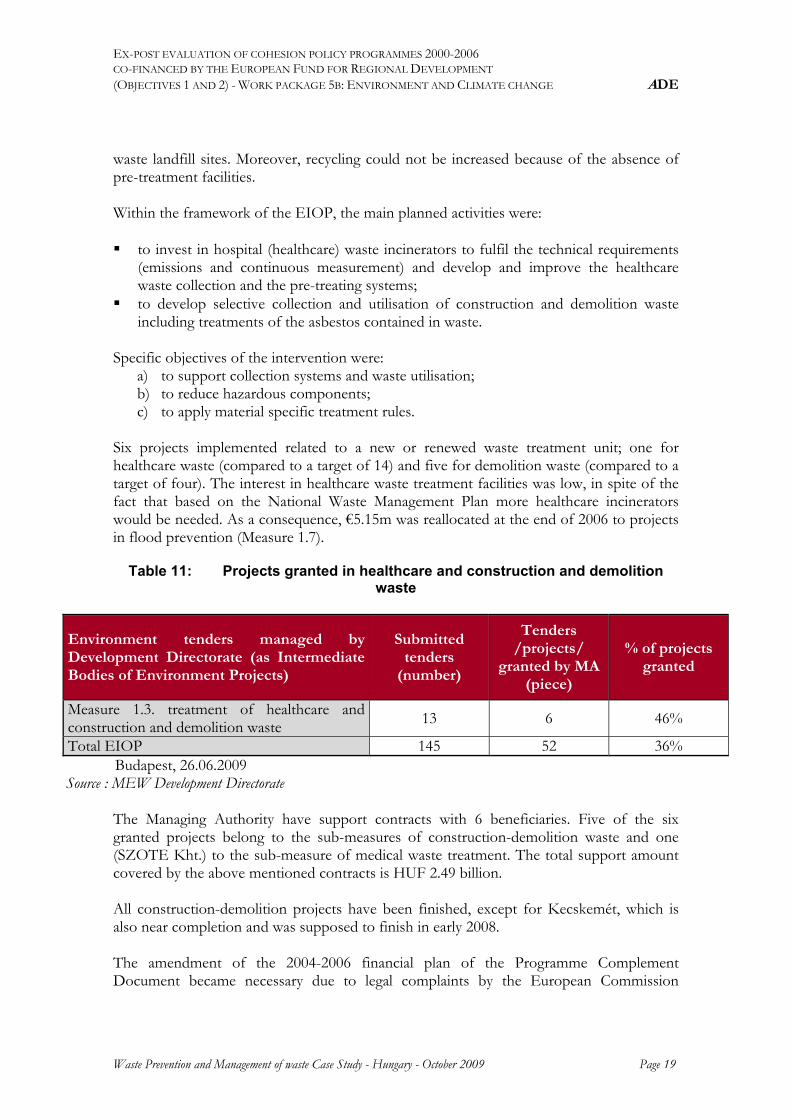
EX-POST EVALUATION OF COHESION POLICY PROGRAMMES 2000-2006 CO-FINANCED BY THE EUROPEAN FUND FOR REGIONAL DEVELOPMENT (OBJECTIVES 1 AND 2) - WORK PACKAGE 5B: ENVIRONMENT AND CLIMATE CHANGE ADE
Waste Prevention and Management of waste Case Study - Hungary - October 2009 Page 19
waste landfill sites. Moreover, recycling could not be increased because of the absence of pre-treatment facilities. Within the framework of the EIOP, the main planned activities were: to invest in hospital (healthcare) waste incinerators to fulfil the technical requirements
(emissions and continuous measurement) and develop and improve the healthcare waste collection and the pre-treating systems;
to develop selective collection and utilisation of construction and demolition waste including treatments of the asbestos contained in waste.
Specific objectives of the intervention were:
a) to support collection systems and waste utilisation; b) to reduce hazardous components; c) to apply material specific treatment rules.
Six projects implemented related to a new or renewed waste treatment unit; one for healthcare waste (compared to a target of 14) and five for demolition waste (compared to a target of four). The interest in healthcare waste treatment facilities was low, in spite of the fact that based on the National Waste Management Plan more healthcare incinerators would be needed. As a consequence, €5.15m was reallocated at the end of 2006 to projects in flood prevention (Measure 1.7).
Table 11: Projects granted in healthcare and construction and demolition waste
Source : MEW Development Directorate The Managing Authority have support contracts with 6 beneficiaries. Five of the six granted projects belong to the sub-measures of construction-demolition waste and one (SZOTE Kht.) to the sub-measure of medical waste treatment. The total support amount covered by the above mentioned contracts is HUF 2.49 billion. All construction-demolition projects have been finished, except for Kecskemét, which is also near completion and was supposed to finish in early 2008. The amendment of the 2004-2006 financial plan of the Programme Complement Document became necessary due to legal complaints by the European Commission
Environment tenders managed by Development Directorate (as Intermediate Bodies of Environment Projects)
Submitted tenders
(number)
Tenders /projects/
granted by MA (piece)
% of projects granted
Measure 1.3. treatment of healthcare and construction and demolition waste 13 6 46%
Total EIOP 145 52 36% Budapest, 26.06.2009

EX-POST EVALUATION OF COHESION POLICY PROGRAMMES 2000-2006 CO-FINANCED BY THE EUROPEAN FUND FOR REGIONAL DEVELOPMENT (OBJECTIVES 1 AND 2) - WORK PACKAGE 5B: ENVIRONMENT AND CLIMATE CHANGE ADE
Waste Prevention and Management of waste Case Study - Hungary - October 2009 Page 20
concerning the eligibility of the costs of elimination of asbestos; as a result, HUF 1.313 million was transferred from this measure to measure 1.5; Nature preservation and sustainable flood prevention (1st December 2006). Total investment was 2,505 million HuF, of which 75% was from the ERDF, 20% from the Hungarian Government and 5% from the Beneficiaries.
Results
The EIOP contributed to supporting the creation of collection and waste utilisation systems and to reducing hazardous components as well as applying material specific treatment rules. On the other hand, EIOP projects have solved only some local/regional problems as regards recycling. One reason is that the construction industry was not interested in recycling because of the low price of natural raw materials. The ratio of recovery remains low. The reason for this is that the treatment facilities are not located close to the materials which require treatment, while the fees to be paid at municipal waste landfills are low. However, as can be seen in the table below, the share of recovered material increased from 9% in 2004 to 26% in 2006, whereas the proportion of landfilled waste decreased from 91% to 74% over the same period.
Table 12: Treatment of construction and demolition waste
2004 2005 2006 Volume generated (t/year) 4,060,208 4,129,514 4,227,767 Treated within Hungary (t/év) 4,057,061 4,124,962 4,213,442 material recovery 9.05% 26.02% 25.92%
used for energy generation 0.01% 0.01% 0.06% incinerated 0.00% 0.00% 0.00%
landfilled 90.94% 73.97% 74.02% Source: database of the Waste Information System (HIR)
3.5 ERDF programme impact on the quality of life (and socio-economic context) The main effects of the ERDF measures on animal waste and demolition waste have been on the environment and on public health. Carcasses and animal waste are considered as hazardous waste (under Hungarian legislation) due to their infection potential. The creation of animal waste treatment units reduces the risk of spreading animal epidemics and infections. Construction and demolition waste can contain asbestos that threatens the environment and potentially damages health.

EX-POST EVALUATION OF COHESION POLICY PROGRAMMES 2000-2006 CO-FINANCED BY THE EUROPEAN FUND FOR REGIONAL DEVELOPMENT (OBJECTIVES 1 AND 2) - WORK PACKAGE 5B: ENVIRONMENT AND CLIMATE CHANGE ADE
Waste Prevention and Management of waste Case Study - Hungary - October 2009 Page 21
The case of Eger Eger is a city in northern Hungary where the ERDF intervened for:
- The construction of one animal waste collection station and for the purchase of lorries to collect and transport dead animals to the station.
- The construction of one demolition waste treatment plant with a capacity of 65,000-85,000t and for the purchase of lorries to collect construction and demolition waste and transport it. The waste is also treated for further utilisation.
The animal waste collection station, which is publicly owned, opened at the end of 2006. 15t of waste was collected in 2007, 157t in 2008 and 220t in the first semester of 2009. Animal waste is managed by the public sector and the costs are covered through the polluter pays principle. Two people are employed to manage the station, while around 30 people were employed for its construction. After closing down illegal animal waste wells and pits and the recultivation of polluted soils, the analyses made by accredited laboratories showed that the presence of pollutants in the soil (such as ammonium, nitrates, nitrites, potassium oxide, hydrochloric acid, sulphate, calcium oxide, iron, manganese, coliformi, enterococcus, escherichia coli and pseudomonas aeruginosa) decreased and obtained the limits permitted by law. The demolition waste treatment plant, which is publicly owned, opened in July 2006. 81,000t of demolition waste was collected in 2006, 53,000t in 2007 and 31,000t in 2008. The largest amount, registered in 2006, was due to the demolition of a large tobacco factory (which resulted in 35,000t of demolition waste). The reduction registered in the following years was also due the fact that the rate of growth of the construction sector decreased. Currently, around six people work there, in addition to some security guards. Around 50-60 people worked on the construction of the plant. Construction and demolition waste is managed by the public sector and the costs are covered through the polluter pays principle.


EX-POST EVALUATION OF COHESION POLICY PROGRAMMES 2000-2006 CO-FINANCED BY THE EUROPEAN FUND FOR REGIONAL DEVELOPMENT (OBJECTIVES 1 AND 2) - WORK PACKAGE 5B: ENVIRONMENT AND CLIMATE CHANGE ADE
Waste Prevention and Management of waste Case Study - Hungary - October 2009 Page 23
Annex 1: ISPA projects on Municipal Solid Waste Management
Hajdú-Bihar Waste management
Code of the project: 2000/HU/16/P/PE/002 Beneficiary: Debrecen municipality Total reimbursable budget: 4,7 Billion HUF Cohesion Fund contribution: 3,525 Billion HUF (75%) Hungarian State contribution: 0,705 Billion HUF (15%) Municipality contribution: 0,47 Billion HUF (10%) Expected date of completition: 30 Dec. 2006 Number of settlements involved : 73 Population involved: 620 000 Detailed information: http://www.e-misszio.hu/ispa/ Main elements of the project: Construction of 3 regional landfills (Debrecen, Hajdúböszörmény, Berettyóújfalu), Recultivation of 60 landfills Miskolc Waste management
Code of the project: 2000/HU/16/P/PE/004 Beneficiary: Miskolc city municipality Total reimbursable budget: 3,23 Billion HUF Cohesion Fund contribution: 2,261 Billion HUF (70%) Hungarian State contribution: 0,646 Billion HUF (20%) Municipality contribution: 0,323 Billion HUF (10%) Expected date of completition: 30 June 2006 Number of settlements involved : 37 Population involved: 263 000 Detailed information: http://www.miskolc.hu/oldal.php?menupont_id=304 Main elements of the project: construction of a regional landfill recultivation of 19 landfills

EX-POST EVALUATION OF COHESION POLICY PROGRAMMES 2000-2006 CO-FINANCED BY THE EUROPEAN FUND FOR REGIONAL DEVELOPMENT (OBJECTIVES 1 AND 2) - WORK PACKAGE 5B: ENVIRONMENT AND CLIMATE CHANGE ADE
Waste Prevention and Management of waste Case Study - Hungary - October 2009 Page 24
Szeged Waste management
Code of the project: 2000/HU/16/P/PE/005 Beneficiary: Szeged and 29 municipalities in its agglomeration Total reimbursable budget: 3,199 Billion HUF Cohesion Fund contribution: 2,079 Billion HUF (65%) Hungarian State contribution: 0,8 Billion HUF (25%) Municipality contribution: 0,32 Billion HUF (10%) Expected date of completition: 30 May 2007 Number of settlements involved : 30 Population involved: 258 677 Detailed information: http://www.szelektiv.szeged.hu/ Main elements of the project: development of a regional landfill construction of a composting plant construction of a biogas utilization plant recultivation of the landfills, which do not meet the requirements Tisza-tó Waste management
Code of the project: 2000/HU/16/P/PE/006 Beneficiary: Tisza-tavi Regionális Waste managementi Association Total reimbursable budget: 3,451 Billion HUF Cohesion Fund contribution: 2,071 Billion HUF (60%) Hungarian State contribution: 1,035 Billion HUF (30%) Municipality contribution: 0,345 Billion HUF (10%) Expected date of completition: 31 Dec. 2005. Number of settlements involved : 42 Population involved: 103 798 Detailed information: http://www.tiszatohulladek.hu/ Main elements of the project: Transfer station Regional landfill Recultivation of the lendfills, which do not meet the requirements

EX-POST EVALUATION OF COHESION POLICY PROGRAMMES 2000-2006 CO-FINANCED BY THE EUROPEAN FUND FOR REGIONAL DEVELOPMENT (OBJECTIVES 1 AND 2) - WORK PACKAGE 5B: ENVIRONMENT AND CLIMATE CHANGE ADE
Waste Prevention and Management of waste Case Study - Hungary - October 2009 Page 25
Szolnok Waste management
Code of the project: 2000/HU/16/P/PE/007 Beneficiary: municipality of Szolnok Total reimbursable budget: 3,631 Billion HUF Cohesion Fund contribution: 2,542 Billion HUF (70%) Hungarian State contribution: 0,726 Billion HUF (20%) Municipality contribution: 0,363 Billion HUF (10%) Expected date of completition: 2007. június 31. Number of settlements involved : 28 Population involved: 202 000 Detailed information: http://www.ispaszolnok.hu/ Main elements of the project: Waste management system in Kétpo with all the relevant additional facilities
(composting, sorting storage) Landfill (Kétpó) Biogas utilization Recultivation of 23 landfills Duna-Tisza Köze Waste management
Code of the project: 2001/HU/16/P/PE/008 Beneficiary: Municipality of Cegléd Total reimbursable budget: 5,992 Billion HUF Cohesion Fund contribution: 2,996 Billion HUF (50%) Hungarian State contribution: 2,397 Billion HUF (40%) Municipality contribution: 0,599 Billion HUF (10%) Expected date of completition: 31 Dec. 2007. Number of settlements involved: 96 Population involved: 354 000 Main elements of the project: two regional waste sorting facilities and pretretment centres (Cegléd, Kecskemét), landfill (Cegléd) waste transfer station (Nagykáta) composting plant (Nagykőrös), Recultivation of the lendfills, which do not meet the requirements

EX-POST EVALUATION OF COHESION POLICY PROGRAMMES 2000-2006 CO-FINANCED BY THE EUROPEAN FUND FOR REGIONAL DEVELOPMENT (OBJECTIVES 1 AND 2) - WORK PACKAGE 5B: ENVIRONMENT AND CLIMATE CHANGE ADE
Waste Prevention and Management of waste Case Study - Hungary - October 2009 Page 26
Sajó-Bódva valley Waste management
Code of the project: 2001/HU/16/P/PE/010 Beneficiary: Sajó-Bódva and Environment Waste managementi Municipality association Total reimbursable budget: 3,2 Billion HUF Cohesion Fund contribution: 1,6 Billion HUF (50%) Hungarian State contribution: 1,28 Billion HUF (40%) Municipality contribution: 0,32 Billion HUF (10%) Expected date of completition: 2007. december 31. Number of settlements involved : 103 Population involved: 230 000 Detailed information: http://www.sajobodva.hu/ Main elements of the project: waste yards transfer station (Ózd) construction of a regional landfill in Sajókaza construction of a bypass road in Szuhakálló recultivation of 5 landfills Homokhátság Waste management
Code of the project: 2002/HU/16/P/PE/015 Beneficiary: Csongrád önkormányzat Total reimbursable budget: 11,04 Billion HUF Cohesion Fund contribution: 8,283 Billion HUF (75%) Hungarian State contribution: 1,656 Billion HUF (15%) Municipality contribution: 1,104 Billion HUF (10%) Expected date of completition: 2006. december 31. Number of settlements involved : 82 Population involved: 345 000 Main elements of the project: establishment of waste organising and wast yards and waste collecting islnads wast transfer station (Kalocsa) construction of 3 up to date landfill recultivation of the landfills, which do not meet the requirements
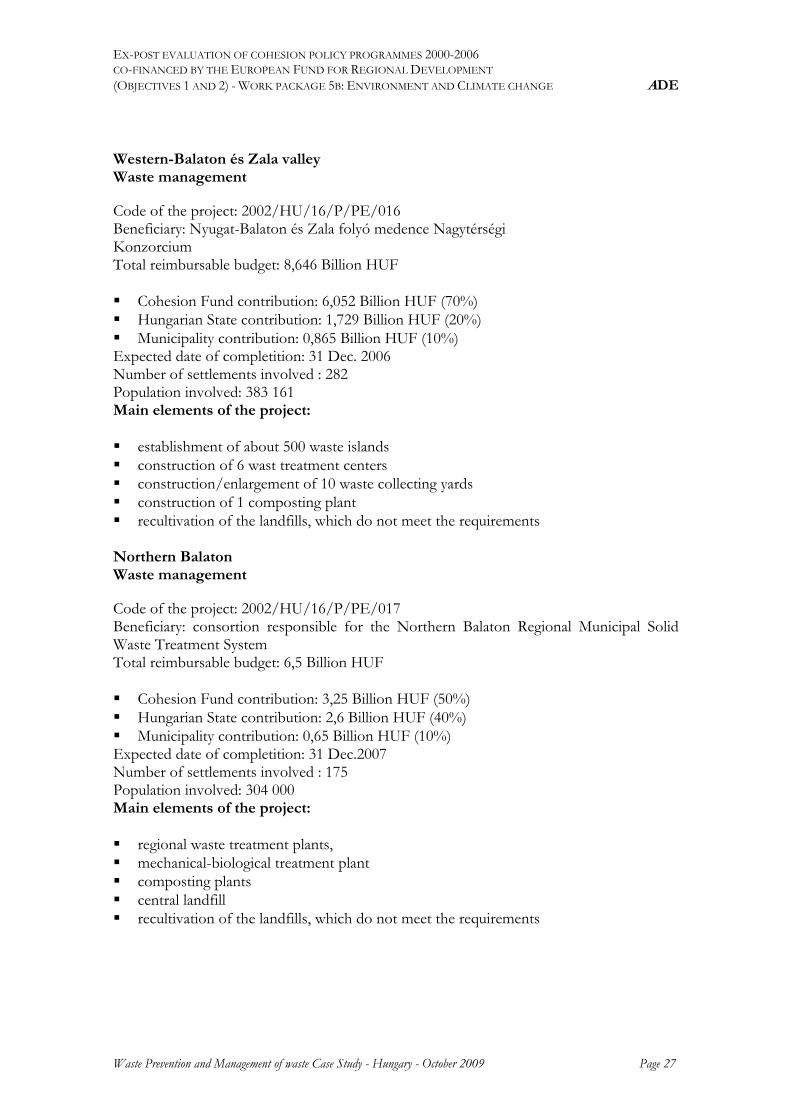
EX-POST EVALUATION OF COHESION POLICY PROGRAMMES 2000-2006 CO-FINANCED BY THE EUROPEAN FUND FOR REGIONAL DEVELOPMENT (OBJECTIVES 1 AND 2) - WORK PACKAGE 5B: ENVIRONMENT AND CLIMATE CHANGE ADE
Waste Prevention and Management of waste Case Study - Hungary - October 2009 Page 27
Western-Balaton és Zala valley Waste management
Code of the project: 2002/HU/16/P/PE/016 Beneficiary: Nyugat-Balaton és Zala folyó medence Nagytérségi Konzorcium Total reimbursable budget: 8,646 Billion HUF Cohesion Fund contribution: 6,052 Billion HUF (70%) Hungarian State contribution: 1,729 Billion HUF (20%) Municipality contribution: 0,865 Billion HUF (10%) Expected date of completition: 31 Dec. 2006 Number of settlements involved : 282 Population involved: 383 161 Main elements of the project: establishment of about 500 waste islands construction of 6 wast treatment centers construction/enlargement of 10 waste collecting yards construction of 1 composting plant recultivation of the landfills, which do not meet the requirements Northern Balaton Waste management
Code of the project: 2002/HU/16/P/PE/017 Beneficiary: consortion responsible for the Northern Balaton Regional Municipal Solid Waste Treatment System Total reimbursable budget: 6,5 Billion HUF Cohesion Fund contribution: 3,25 Billion HUF (50%) Hungarian State contribution: 2,6 Billion HUF (40%) Municipality contribution: 0,65 Billion HUF (10%) Expected date of completition: 31 Dec.2007 Number of settlements involved : 175 Population involved: 304 000 Main elements of the project: regional waste treatment plants, mechanical-biological treatment plant composting plants central landfill recultivation of the landfills, which do not meet the requirements

EX-POST EVALUATION OF COHESION POLICY PROGRAMMES 2000-2006 CO-FINANCED BY THE EUROPEAN FUND FOR REGIONAL DEVELOPMENT (OBJECTIVES 1 AND 2) - WORK PACKAGE 5B: ENVIRONMENT AND CLIMATE CHANGE ADE
Waste Prevention and Management of waste Case Study - Hungary - October 2009 Page 28
Southern Balaton and Sió valley Waste management
Code of the project: 2002/HU/16/P/PE/018 Beneficiary: Regional Municipal Solid Waste Treatment Consorion of southern Balaton and sio Valley Total reimbursable budget: 12,368 Billion HUF Cohesion Fund contribution: 8,039 Billion HUF (65%) Hungarian State contribution: 3,092 Billion HUF (25%) Municipality contribution: 1,237 Billion HUF (10%) Expected date of completition: 31 Dec. 2006 Number of settlements involved: 202 Population involved: 373 000 Main elements of the project: establishment of about 800 wast collecting islands 19 waste yards 9 composting plants 3 landfills recultivation of the landfills, which do not meet the requirements In process: Cohesion Fund projects after 2004
Szabolcs-Szatmár-Bereg - Waste management
2004/HU/16/C/PE/004
Beneficiary: Regional Waste Management Association of Szatmár (Mátészalka)
Total reimbursable budget 17,225 Billion HUF
Cohesion Fund contribution: 10,335 Billion HUF (60%)
Hungarian State contribution: 5,168 Billion HUF (30%)
Municipality: 1,722 Billion HUF (10%)
Expected end of the implementation:
-
Number of settlements covered:
237
Population covered: 592 299 inhabitants
Main elements of the project:
3 regional landfills, 8 waste transfer stations, 3 sorting facilities, construction of 15 composting plants, recultivation of 155 landfills, which do not meet the requirements.

EX-POST EVALUATION OF COHESION POLICY PROGRAMMES 2000-2006 CO-FINANCED BY THE EUROPEAN FUND FOR REGIONAL DEVELOPMENT (OBJECTIVES 1 AND 2) - WORK PACKAGE 5B: ENVIRONMENT AND CLIMATE CHANGE ADE
Waste Prevention and Management of waste Case Study - Hungary - October 2009 Page 29
Annex 2 : Special waste streams
Batteries and dry cells
Based on the data of 204-2008 19-21 thousand tons of plumbate batteries are traded annually and the same amount is collected and are handed over for reuse. In 2005, 167 tonnes, in 2006 246 tons, in 2007 261 tons of portable dry cells were collected (this is about 15 % of the total volume generated). It can be expected that Hungary will meet the requirement of recollection, that is, 18% by 2008. This was facilitated by the fact that the obliged manufacturers for fulfilling the requirement (collection/treatment) decided to use the coordinating organisational form. Alkaline batteries are generated in large volumes in Hungary and their dismantling is also performed in Hungary.
Tyres
From 1 July 2003 in accordance with the regulations of the EU it is forbidden to deposit used tyres in landfills. From 2006 the prohibition is extended also to the granulated form. The three Hungarian coordination organisations established coordinate the material recovery and the use of it as fuel by the cement works.
Wrecked vehicles
Since 2004 vehicles can only be withdrawn from circulation on the basis of a wrecking certificate. Based on the data available in Hungary on the period between 2005 and 2008 40-45000 cars are withdrawn ultimately from circulation. In 2006 the 80% recovery ratio could be reached but the reuse ratio reached was only 81.5% compared to the planned ratio of 85% (the only energy recovery ratio was lower).
Electric and electronic waste
The relevant EU Directive in addition to certain administrative measures (labelling the products, directions for use, manufacturer’ registration) sets also some goals for the collection and recovery. As for this latter in Hungary derogations are to be applied and so the requirements have to be met only by the end of 2008. By the end of 2008 about 1000 manufacturers were registered and 5 coordinating organisations were established. The target of collection to be reached is 4 kg/ capita annually by 2008 – based on the annual 3.5 kg/ capita of 2007 – this will probably be met. The various recovery and reuse targets set for the different products have already been met by Hungary in 2007.
Used oil
The volume of the collected and treated used oil is presented in the following table by years:

EX-POST EVALUATION OF COHESION POLICY PROGRAMMES 2000-2006 CO-FINANCED BY THE EUROPEAN FUND FOR REGIONAL DEVELOPMENT (OBJECTIVES 1 AND 2) - WORK PACKAGE 5B: ENVIRONMENT AND CLIMATE CHANGE ADE
Waste Prevention and Management of waste Case Study - Hungary - October 2009 Page 30
Table 13: Collection and treatment of used oil [tons]
2004 2005 2006 Total used oil 64 528 60 869 56 895 In which, reused in material 20 955 20 814 17 849
used energetically 3 534 937 1 324 burnt 2 071 1 117 1 088 biological and chemical treatment 43 053 37 945 30 476 other 56 6 158
Source: database of the Waste Information System (HIR) The volume of used oil regenerated decreased, but the volume of collection doubled. The system of reimbursing the product charge make the economic organisations interested in taking part in the collection of used oil.
Polychlorinated biphenyls and polychlorinated terphenyls
Equipments containing PCB can be operated up to June 30 2010, the equipments wrecked have to be cleaned and deposited until 31 Dec. 2010. In Hungary the use of equipments containing PCB was decreasing (in 2004 255 tons, in 2006-only 99.1 tons of fluids containing PCB were registered), and based the data by the deadline the use of this will be terminated. The dismantled equipment (for example, electrolytic condensers) can be deposited in Hungary in the 5 hazardous waste incinerators; the capacities of these are sufficient and the emissions of the incinerators do not exceed the limits. After cleaning the transformer houses from the PCB contamination are used in metallurgy. The treatment obligations will expectably be met by Hungary.
Plant protection chemicals and packaging
As a result of the coordinating organisations the collection from the user and depositing of the plant protection packaging waste both regarding the continuously produced and the stocks accumulated earlier are solved in Hungary (KGSZÁT). For collecting and depositing the plant protection chemicals accumulated earlier (KGSZÁT) the Ministry of Environment and Water supported two actions (by aids amounting to HUF 25 million and HUF 7 million) in 2006. As a result of the actions remediation 190 tons of plant protecting chemicals could be performed in 5 counties (in 2005 Bács-Kiskun and Pest county, in 2006 Zala, Somogy and Veszprém county). This amount was significantly more than the amount originally planned on the basis of the preliminary assessment. On the basis of the experience of the two successful actions it would be important to extend the collection and deposit to the other counties too and to clean the country from the residues of plant protecting chemicals, which are harmful to the health and to the environment. The resources were not available for continuing this work.

EX-POST EVALUATION OF COHESION POLICY PROGRAMMES 2000-2006 CO-FINANCED BY THE EUROPEAN FUND FOR REGIONAL DEVELOPMENT (OBJECTIVES 1 AND 2) - WORK PACKAGE 5B: ENVIRONMENT AND CLIMATE CHANGE ADE
Waste Prevention and Management of waste Case Study - Hungary - October 2009 Page 31
Biologically decomposing organic waste
In accordance with the regulation of the EU the volume of biologically decomposing part of municipal waste to be deposited has to be decreased by 2006 to the 75% of the volume generated in the base year of 1995, by 2009 to its 50% and by 2016 go its 35%. By meeting the requirement of the directive Hungary has already prescribed in 2004 the 25% decrease to the base year. By considering that landfill is still a dominating type of treatment of municipal waste management and the alternative methods require significant investments and the costs to be paid by the inhabitants would significantly increase the earlier requirement to reach 50% by 2007 by the amendment of 2007 of the Waste Management Plan – in accordance with the relevant deadline of the EU –was deadline was modified to 2009. In 1995 from the 4.5 million tons of total volume of municipal waste the part of biologically decomposing part accounted for 2.34 million tons; the share of easily recoverable paper waste accounted for 32.7% and 67.3% of it was other organic material. Hungary met the requirements of 2004 mainly by the high recovery ratio of paper. From the 2.46 million tons of organic material 706 thousand tons was treated by the bio waste treatment facilities in Hungary of 833 thousand tonnes total capacity of. . The goal defined by the strategy prepared in 2004 was to shift the waste treatment from landfilling. For achieving this goal the development of the biowaste treatment was planned to be implemented in several steps. Besides increasing the paper recollection and recovery ratio the selective collection of green waste was defined as the direction of development. The capacity of the 34 composting plants implemented by 2006 was about 250 thousand tonnes. Owing to the problems encountered in the composting plants (unused capacities, difficult sale of the compost, high maintenance costs) the necessity of distributing domestic, community composting got into the forefront) as well as the application of other alternative methods in the regional waste management systems planned. The Municipal Waste Incineration Works of Budapest was developed and enlarged in 2006, and its thermo capacity for biowaste originating from municipal waste was increased to 218 thousand tons. The recovery of paper waste, composting and the thermo capacities available meet only partly the time-proportional requirements; on the long term an increasing share of the waste deposited on landfills have to be processed by mechanic-biological pre-treatment (BMH) and it is necessary to study the opportunity of the separated treatment of municipal waste. Up to 2008 the first MBH facilities were implemented; questions of maintenance arose in connection with the operation of these and of the planned ones: the organic fraction separated by the treatment could be used only during a certain period of the recultivation of the landfill on the long term a solution has to be found for an alternative use of this material.

EX-POST EVALUATION OF COHESION POLICY PROGRAMMES 2000-2006 CO-FINANCED BY THE EUROPEAN FUND FOR REGIONAL DEVELOPMENT (OBJECTIVES 1 AND 2) - WORK PACKAGE 5B: ENVIRONMENT AND CLIMATE CHANGE ADE
Waste Prevention and Management of waste Case Study - Hungary - October 2009 Page 32
In accordance with the plans of the ministry the 80 thousand tons of domestic composting of 2004 was planned to be increased to 220 thousand tons by 2016. For reaching this aim efficient opinion formation and successful cooperation with the population are required. According to the plans of ISPA the biowaste treatment capacities of the regional waste management systems to be implemented from EU and national resources would have been increased from the annual capacity of 122 thousand tons of 2004 to 460 thousand tons by 2008 – but the elements of biowaste treatment were not implemented in time. Therefore, the development expected could only be partly implemented. The municipal waste management projects launched from 2007 and financed from the Cohesion Funds include in each case besides the treatment facilities also the implementation of the required biowaste treatment facilities.
Waste containing asbestos
The national survey of sprayed asbestos plastering in buildings has been carried out continuously since 1999. By the end 2007 the survey of dwelling houses was finished by the end of 2007 but the survey of industrial and other buildings is still in process. Tenders could be submitted between 2004-2006 in the frame of the Environmental and Infrastructure Operation Plan of the National Development Plan for grants provided for the safe removal and treatment of insulations containing asbestos. Numerous asbestos decontamination projects were implemented to which the municipalities obtained governmental financial assistance. In Győr 22 000 m2, in Budapest 11 000 m2 and in Tatabánya 5 000 m2 asbestos plastering was removed, which is in total more than 20% of the total asbestos insulation surveyed in buildings. In the New Hungary Regional Operative programme asbestos decontamination is not identified as an independent activity but as part of the rehabilitation developments.

EX-POST EVALUATION OF COHESION POLICY PROGRAMMES 2000-2006 CO-FINANCED BY THE EUROPEAN FUND FOR REGIONAL DEVELOPMENT (OBJECTIVES 1 AND 2) - WORK PACKAGE 5B: ENVIRONMENT AND CLIMATE CHANGE ADE
Waste Prevention and Management of waste Case Study - Hungary - October 2009 Page 33
Annex 3: List of projects accomplished in the EIOP’s measure 1.2
In 2005: 1 euro = about 250 HuF Total ERDF contribution: about 8.09 million euro


EX-POST EVALUATION OF COHESION POLICY PROGRAMMES 2000-2006 CO-FINANCED BY THE EUROPEAN FUND FOR REGIONAL DEVELOPMENT (OBJECTIVES 1 AND 2) - WORK PACKAGE 5B: ENVIRONMENT AND CLIMATE CHANGE ADE
Waste Prevention and Management of waste Case Study - Hungary - October 2009 Page 35
Annex 4: List of projects accomplished in the EIOP’s measure 1.3
In 2005: 1 € = about 250 HuF Total ERDF contribution: about 7.5 million euro


EX-POST EVALUATION OF COHESION POLICY PROGRAMMES 2000-2006 CO-FINANCED BY THE EUROPEAN FUND FOR REGIONAL DEVELOPMENT (OBJECTIVES 1 AND 2) - WORK PACKAGE 5B: ENVIRONMENT AND CLIMATE CHANGE ADE
Waste Prevention and Management of waste Case Study - Hungary - October 2009 Page 37
Annex 5: The animal waste collection station in Eger
Animal waste collection Tables indicating the kind of plant and the source of financing
Lorries used to collect and transport animal waste to Eger’s plant

EX-POST EVALUATION OF COHESION POLICY PROGRAMMES 2000-2006 CO-FINANCED BY THE EUROPEAN FUND FOR REGIONAL DEVELOPMENT (OBJECTIVES 1 AND 2) - WORK PACKAGE 5B: ENVIRONMENT AND CLIMATE CHANGE ADE
Waste Prevention and Management of waste Case Study - Hungary - October 2009 Page 38
Buildings where the animal waste is stocked

EX-POST EVALUATION OF COHESION POLICY PROGRAMMES 2000-2006 COFINANCED BY THE ERDF (OBJECTIVES 1 AND 2) WP 5: ENVIRONMENT AND CLIMATE CHANGE ADE
Waste Prevention and Management of waste Case Study - Hungary - October 2009 Page 39
Annex 6: Demolition waste treatment plant in Eger
Demolition and construction waste Table indicating the kind of plant and the source of financing
Equipment for the transport and the treatment of the construction and demolition waste


ADE s.a. Rue de Clairvaux, 40
B-1348 Louvain-la-Neuve Belgium
Tel.: +32 10 45 45 10 Fax: +32 10 45 40 99 E-mail: [email protected]
Web: www.ade.be
Ex-Post Evaluation of Cohesion Policy Programmes 2000-2006 Co-Financed by the European Fund for Regional Development (Objectives 1 And 2) – Work Package 5: Environment and Climate Change
WWaassttee PPrreevveennttiioonn aanndd MMaannaaggeemmeenntt ooff wwaassttee CCaassee SSttuuddyy
CCaattaalloonniiaa
October 2009


TThhiiss rreeppoorrtt hhaass bbeeeenn pprreeppaarreedd bbyy AADDEE aatt tthhee rreeqquueesstt ooff tthhee EEuurrooppeeaann CCoommmmiissssiioonn..
TThhee vviieewwss eexxpprreesssseedd aarree tthhoossee ooff tthhee CCoonnssuullttaanntt aanndd ddoo nnoott rreepprreesseenntt tthhee ooffffiicciiaall vviieewwss ooff tthhee EEuurrooppeeaann CCoommmmiissssiioonn..
RReepprroodduuccttiioonn oorr ttrraannssllaattiioonn iiss ppeerrmmiitttteedd,, pprroovviiddeedd tthhaatt tthhee ssoouurrccee iiss dduullyy aacckknnoowwlleeddggeedd aanndd nnoo mmooddiiffiiccaattiioonnss ttoo tthhee tteexxtt aarree mmaaddee..


EX-POST EVALUATION OF COHESION POLICY PROGRAMMES 2000-2006 CO-FINANCED BY THE EUROPEAN FUND FOR REGIONAL DEVELOPMENT (OBJECTIVES 1 AND 2) - WORK PACKAGE 5B: ENVIRONMENT AND CLIMATE CHANGE ADE
Waste Prevention and Management of waste Case Study - Catalonia - October 2009 Table of Contents
Table of Contents
SUMMARY
1. GENERAL STRATEGIC CONTEXT ................................................................... 1
1.1 GENERAL CONTEXT FOR CATALONIA ...................................................................... 1 1.2 GDP GROWTH AND WASTE GENERATION IN CATALONIA .................................... 3 1.3 INSTITUTIONAL CONTEXT REGARDING WASTE MANAGEMENT
IN CATALONIA .............................................................................................................. 4 1.4 MAIN ENVIRONMENTAL CONSTRAINTS IN CATALONIA AND
PUBLIC FINANCING ....................................................................................................... 5
2. REGIONAL STRATEGY FOR MUNICIPAL WASTE MANAGEMENT AND GENERATION ........................................................................................ 7
2.1 FINANCING OF THE CATALAN MUNICIPAL WASTE MANAGEMENT PLAN
(PROGREMIC) ........................................................................................................... 8 2.2 IMPLEMENTATION OF THE CATALAN MUNICIPAL WASTE MANAGEMENT PLAN
(PROGREMIC) ........................................................................................................... 9
3. CATALONIA OBJECTIVE 2 PROGRAMME (2000-2006) ................................... 13
3.1 THE OVERALL PROGRAMME IN CATALONIA .......................................................... 13 3.2 URBAN WASTE MANAGEMENT MEASURE ................................................................ 14
4. CONCLUSIONS ............................................................................................ 19
ANNEX 1: LIST OF PROJECTS FINANCED BY MEASURE 2.2 OF OBJECTIVE 2 PROGRAMME IN CATALONIA ................................................................... 21
ANNEX 2: LIST OF SITE VISITS DURING FIELD MISSION (FEBRUARY 2009) ............... 27
LIST OF GRAPHS
GRAPH 1: GDP /CAPITA (PPS PER INHABITANT IN % OF THE EU-27 AVERAGE) ............. 2 GRAPH 2: WASTE PER CAPITA DAY IN KG ................................................................................. 4 GRAPH 3: SEPARATED COLLECTION OF MUNICIPAL WASTES (%) IN CATALONIA
SINCE 1995 ................................................................................................................... 4 GRAPH 4: RELATION BETWEEN WASTE COLLECTION POINTS AND TOTAL WASTE
COLLECTED BETWEEN 1997 AND 2007 ................................................................. 11

EX-POST EVALUATION OF COHESION POLICY PROGRAMMES 2000-2006 CO-FINANCED BY THE EUROPEAN FUND FOR REGIONAL DEVELOPMENT (OBJECTIVES 1 AND 2) - WORK PACKAGE 5B: ENVIRONMENT AND CLIMATE CHANGE ADE
Waste Prevention and Management of waste Case Study - Catalonia - October 2009 Table of Contents
LIST OF TABLES
TABLE 1: EVOLUTION OF GDP, MUNICIPAL WASTE PRODUCTION AND POPULATION
OVER THE 2000-2006 PERIOD IN CATALONIA........................................................ 3 TABLE 2: REPARTITION OF ERDF INTERVENTIONS IN THE FIELD OF ENVIRONMENT
IN CATALONIA AND SPAIN ........................................................................................ 6 TABLE 3: MAIN INVESTMENTS OF PROGREMIC 2001-2006 PROGRAMME BY TYPE
OF ACTIVITY ................................................................................................................ 7 TABLE 4: WASTE PROJECTS FUNDED BY THE COHESION FUND IN CATALONIA
(2000-2006) ................................................................................................................. 8 TABLE 5: AXIS AND FINANCIAL COMMITMENTS OF OBJECTIVE 2 PROGRAMME IN
CATALONIA ............................................................................................................... 13 TABLE 6: MEASURES OF AXIS 2 CONCERNING THE ENVIRONMENT, NATURAL AND
HYDRAULIC RESOURCES (IN € AND % OF AXIS ENVIRONMENT) ........................ 14 TABLE 7: SPECIFIC ALLOCATION OF WASTE MANAGEMENT (MEASURE 2.2) IN DOCUP
OBJECTIVE 2 CATALONIA 2000-2006 (EUROS) ..................................................... 15 TABLE 8: JOINT FINANCED PROJECTS DOCUP 2000 – 2006 (AMOUNT IN THOUSANDS
OF EUROS) .................................................................................................................. 15 TABLE 9: ACHIEVEMENTS OF URBAN WASTE MANAGEMENT MEASURE (2.2) ................... 16 TABLE 10: CONTRIBUTION OF ERDF URBAN WASTE MANAGEMENT MEASURE (2.2) TO
INTERVENTIONS IN PROGREMIC ...................................................................... 17 TABLE 11: FUNDS DISTRIBUTION BY MEASURE (DOCUP MEASURE IN CATALONIA) ...... 21 TABLE 12: LIST OF PROJECTS AT LOCAL LEVEL (MEASURE 2.2 DOCUP
CATALONIA 2000-2006)........................................................................................... 22 TABLE 13: LIST OF PROJECTS AT REGIONAL LEVEL (MEASURE 2.2 DOCUP
CATALONIA 2000-2006)........................................................................................... 23

EX-POST EVALUATION OF COHESION POLICY PROGRAMMES 2000-2006 CO-FINANCED BY THE EUROPEAN FUND FOR REGIONAL DEVELOPMENT (OBJECTIVES 1 AND 2) - WORK PACKAGE 5B: ENVIRONMENT AND CLIMATE CHANGE ADE
Waste Prevention and Management of waste Case Study - Catalonia - October 2009 Summary
Summary – Key messages from the Catalonia case study on waste prevention and management of waste
Overall decoupling of GDP growth and waste growth seems to be in place since the end of the period (2000-2006) especially since 2005. The relative allocation of funds between the water sector and waste is in favor of the water sector for all EU funds combined (Cohesion fund and ERDF), and for all Spanish regions. The proportions are 80-90% for water and 10-20% for waste. The Regional Municipal Waste Plan is entirely coherent with the general EU framework for waste interventions based on the five-stage hierarchy. Financing of the Regional Municipal Waste Plan was mainly done through regional and national funds, with in addition 20% from the Cohesion Fund and 2% from the ERDF objective 2 programme (measure 2.2). ERDF interventions were coherent with the Regional Municipal Waste Plan. They promoted complementary tools to larger investments (especially from the Cohesion Fund). Although of small amounts and distributed over a very large number of small projects, they had an accelerating effect for investments at local level.


EX-POST EVALUATION OF COHESION POLICY PROGRAMMES 2000-2006 CO-FINANCED BY THE EUROPEAN FUND FOR REGIONAL DEVELOPMENT (OBJECTIVES 1 AND 2) - WORK PACKAGE 5B: ENVIRONMENT AND CLIMATE CHANGE ADE
Waste Prevention and Management of waste Case Study - Catalonia - October 2009 Page 1
1. General strategic context
1.1 General context for Catalonia
Catalonia covers a total area of 32,106.5 km2, and at the beginning of 2007 had a population of 7,168 million people. Only 6% of the total population lives in rural areas. The population is mainly concentrated on the coastal areas, particularly the metropolitan area of Barcelona.

EX-POST EVALUATION OF COHESION POLICY PROGRAMMES 2000-2006 CO-FINANCED BY THE EUROPEAN FUND FOR REGIONAL DEVELOPMENT (OBJECTIVES 1 AND 2) - WORK PACKAGE 5B: ENVIRONMENT AND CLIMATE CHANGE ADE
Waste Prevention and Management of waste Case Study - Catalonia - October 2009 Page 2
The economic development in Catalonia has shown sustained growth since the 1980s, parallel to the growth of the rest of Spain. The evolution of GDP per capita for the period 2000-2006 (see graph 4.2) shows that Catalonia is 10-15 points above the EU average and significantly above the Spanish average.
Graph 1: GDP /capita (PPS per inhabitant in % of the EU-27 average)
90
95
100
105
110
115
120
125
130
2000 2001 2002 2003 2004 2005 2006 2007
year
GDP per capita (PPC)
Catalonia
Spain
Euro zone
EU-27
Source: Catalan Statistics Institute
Regarding the employment rate, Catalonia has been characterised as a region that creates employment. According to the European regional statistics Catalonia’s employment rate increased from 61% (ages 15-64) in 1999 to 71% in 2007. It should be noted that Catalonia has known a significant population growth over the period 1998 to 2007 by 18% (from 6,09 to 7,168 million inhabitants).1
1 Source: © Institut d'Estadística de Catalunya

EX-POST EVALUATION OF COHESION POLICY PROGRAMMES 2000-2006 CO-FINANCED BY THE EUROPEAN FUND FOR REGIONAL DEVELOPMENT (OBJECTIVES 1 AND 2) - WORK PACKAGE 5B: ENVIRONMENT AND CLIMATE CHANGE ADE
Waste Prevention and Management of waste Case Study - Catalonia - October 2009 Page 3
1.2 GDP growth and waste generation in Catalonia
The evolution of Catalonia’s GDP, municipal waste generation and population over the 2000-2006 period is shown in table 4.9 below and discussed hereafter.
Table 1: Evolution of GDP, municipal waste production and population over the 2000-2006 period in Catalonia
Items GDPMunicipal
waste
Municipal waste/unit of GDP Population
Municipal Waste
Units / years
in billion € constant
millions tons
ton/million €
in million inhabitants
per capita year in kg
2000 126,281 3,418 27 6.21 5502001 131,3322 3,453 26 6.31 5482002 136,1915 3,722 27 6.44 5782003 139,4601 3,989 29 6.59 6052004 143,6439 4,131 29 6.73 6142005 148,2405 4,188 28 6.87 609
2006 153,2807 4,258 28 7.02 607
Growth rate 06/00 21% 25% 3% 13% 10% Source: ADE based on data from the Institut d'Estadística de Catalunya
Figures in table 4.9 show that Catalonia has experienced constant growth in GDP of 21% in constant prices (base 2000) over the period 2000-2006. Municipal waste generation has been increasing by 25% over the same period, owing to the following factors: the population growth registered in Catalonia (13% from 2000-2006)2; the increase in waste generation per capita although it seems the growing tendency
stops by the end of this period. Indeed, waste generation per capita increased especially from 2000-2004 from 550 to 614 kg/capita per year (or 1,51-1,68 kg/capita day). Waste generation then stabilized and even decreased from 2005 to 2006 to 607 kg/capita per year. Overall, the indicator of waste (in tons) per unit of GDP (in million €) only increased by 3% over the period, with decrease since 2005. A decoupling between GDP growth and waste production seems to be in place. 2 Population growth has even reached 18% over the 1998-2007 period.

EX-POST EVALUATION OF COHESION POLICY PROGRAMMES 2000-2006 CO-FINANCED BY THE EUROPEAN FUND FOR REGIONAL DEVELOPMENT (OBJECTIVES 1 AND 2) - WORK PACKAGE 5B: ENVIRONMENT AND CLIMATE CHANGE ADE
Waste Prevention and Management of waste Case Study - Catalonia - October 2009 Page 4
Graph 2: Waste per capita day in kg
1,40
1,45
1,50
1,55
1,60
1,65
1,70
2000 2001 2002 2003 2004 2005 2006
Waste per capita day in kg
Waste per capita day in kg
Source: ADE based on data from the Institut d'Estadística de Catalunya
Along with increased production of waste, recycling has grown, especially recycling of paper. Overall, the increase in the segregation of municipal waste rose from 2,3% in 1995 to 25,4 % in 2004 and 33,7 % in 2007, see graph 4.4.
Graph 3: Separated collection of municipal wastes (%) in Catalonia since 1995
Source: Catalan Statistics Institute.
1.3 Institutional context regarding waste management in Catalonia
The Autonomous region of Catalonia has been given the competences for the legislative development and execution as well as the establishment of additional protection regulations on waste. It falls to Catalonia to elaborate the Regional Plans on Waste as well as the granting of authorisations, monitoring, inspection and sanctioning of the activities that manage or generate wastes. The competence for waste management is shared between the Regional Government of Catalonia (Generalitat de Catalunya) and the local entities that make up the territorial organisation; thus Catalan law 6/1993 establishes the

EX-POST EVALUATION OF COHESION POLICY PROGRAMMES 2000-2006 CO-FINANCED BY THE EUROPEAN FUND FOR REGIONAL DEVELOPMENT (OBJECTIVES 1 AND 2) - WORK PACKAGE 5B: ENVIRONMENT AND CLIMATE CHANGE ADE
Waste Prevention and Management of waste Case Study - Catalonia - October 2009 Page 5
functions of both public institutions as well as the basic inter-administrative relations framework. The Catalan Waste Agency (Agència de Residus de Catalunya) is a public law entity subject to the Environmental Department (Government of Catalonia). The Agència de Residus de Catalunya is competent for waste generated in Catalonia and the waste managed in its territorial area, whether industrial, municipal, healthcare, or agricultural, with the exception of radioactive waste, waste from mining activities, waste from agricultural and stockbreeding operations that are not dangerous and used only within the framework of the agricultural operation, declassified explosives, and those managed as waste water and gas effluents. The municipal waste management model established in the Catalan Regional Plan on Waste for the period 2001-2006 called PROGREMIC3, favours the management of municipal waste generated in Catalonia by means of separate collected fractions, their recovery and as a last resort their final disposal. The local entities are those responsible for the development and application of this model to the characteristics of each municipality or municipal group. Civic amenity sites4 were created as one more tool for the management of municipal waste. Civic amenity sites are installations dedicated to reception and storage of selected urban wastes which are not home-collected and do not have special containers dedicated to their collection in the street. These specific collection points are very important in the development of the waste management model because they collect and recover other types of wastes (high-volume and special wastes) which could be a problem if managed like ordinary waste.
1.4 Main environmental constraints in Catalonia and public financing
Catalonia has a recurrent problem of water supply. In addition, waste water treatment is of crucial interest for environmental, economic and touristic reasons. Complying with the EU Water Directive is also of major importance. Water supply and its adequate treatment are immediately linked to the economic development of Catalonia.
In this context, although the increased waste generation also appears as an important constraint, a higher level of priority has been given to water related investments. Cohesion Fund and ERDF, which are two major funds in Spain for the environment, co-finance investments for water supply, waste water treatment and solid waste management. Both funds spend about 10-20% on solid waste management and 80-90% on the water sector. When elaborating Catalonias’ objective 2 programme (DOCUP), the main focus for “environment” (axis 2) was given to investments in the field of water (water sanitation and waste water treatment projects). This was a top priority for the Region of Catalonia. As a
3 PROGREMIC: Programa de Gestio de Residus Municipals de Catalunya
4 Civic Amenity Sites are sometimes called Waste collection points. Both terms are synonyms in this evaluation.

EX-POST EVALUATION OF COHESION POLICY PROGRAMMES 2000-2006 CO-FINANCED BY THE EUROPEAN FUND FOR REGIONAL DEVELOPMENT (OBJECTIVES 1 AND 2) - WORK PACKAGE 5B: ENVIRONMENT AND CLIMATE CHANGE ADE
Waste Prevention and Management of waste Case Study - Catalonia - October 2009 Page 6
general consideration, it has also to be noted that individual infrastructure projects in the field of water generally represent a higher investment than waste management projects. The important weight of water investments in total ERDF interventions in the field of environment is the result of this situation and also reflects the importance of complying with the EU Water Directive (see table 4.1 below). This observation is confirmed in most regions of Spain for ERDF funding of environmental infrastructure. According to the interviews held during the field mission in Catalonia, the respective weights of waste- and water-related projects was the result of discussions with the European Commission during the elaboration process of the DOCUP. It also reflected the types of request for funding originating from the municipalities in Catalonia. Cohesion funds also significantly co-finance environmental investments in Spain over the 2000-2006 period. The shares granted to water and waste are similar to the ERDF, ranging between 13-19% for solid waste with the remainder spent on water5.
Table 2: Repartition of ERDF interventions in the field of environment in Catalonia and Spain
Source: Direction General EC Funds (Fondos Communitarios), Spanish Ministry of Economy and Treasury (Ministerio de Economia y Hacienda)
5 Source : Annual reports from the Commission on the Cohesion Fund and their annexes (2003-2006).
ERDF Catalonia (in €m)
ERDF Catalonia
(in %)ERDF Spain
(in €m)
ERDF Spain (in
%)
Water 98.9 68.30% 282.7 70.30%
Waste 9.9 6.80% 49.3 12.20%
Total Environment 144.8 100% 402.1 100%

EX-POST EVALUATION OF COHESION POLICY PROGRAMMES 2000-2006 CO-FINANCED BY THE EUROPEAN FUND FOR REGIONAL DEVELOPMENT (OBJECTIVES 1 AND 2) - WORK PACKAGE 5B: ENVIRONMENT AND CLIMATE CHANGE ADE
Waste Prevention and Management of waste Case Study - Catalonia - October 2009 Page 7
2. Regional strategy for municipal waste management and generation
Waste planning and management in Catalonia was carried out according to the following programmes: PROGREMIC 2001-2006 Municipal Waste Management Programme. PROGRIC 2001-2006 Industrial Waste Management Programme. PROGROC 2001-2006 Construction Waste Management Programme. For the 2001-2006 period, the global estimation of the investment for the Catalan Municipal Waste Management Programme (PROGREMIC) amounted to approximately 481.85 millions of euros (see table 4.11 hereafter).
Table 3: Main investments of PROGREMIC 2001-2006 programme by type of activity
Main activity Total amount in million Euros
Waste prevention 30.05
Recovery of glass, paper, packaging and other fractions
Recovery of the organic fraction
Energy recovery
Recovery (total)
19.23
211.92
52.23
283.38
Landfilling of non recoverable waste 110.12
Dissemination and communication 36.06
Investigation and development (*) 22.24
TOTAL 481.85
Source: Progremic 2000-2006 (*) The I+D actions correspond to all action tiers in general

EX-POST EVALUATION OF COHESION POLICY PROGRAMMES 2000-2006 CO-FINANCED BY THE EUROPEAN FUND FOR REGIONAL DEVELOPMENT (OBJECTIVES 1 AND 2) - WORK PACKAGE 5B: ENVIRONMENT AND CLIMATE CHANGE ADE
Waste Prevention and Management of waste Case Study - Catalonia - October 2009 Page 8
2.1 Financing of the Catalan municipal waste management plan (PROGREMIC)
The financing of the actions planned in the Catalan municipal waste management plan (PROGREMIC) included various contributions, namely: the budgets of the Administration of the Generalitat and of the local entities, other public funds (state and European (Cohesion Fund and ERDF), the integrated management systems, promotion of taxation measures, participation of the private sector6. Main financing instruments of the Catalan Waste Agency for this programme were National and Regional funds.
The main EU funding line of investments in the field of environment in Catalonia proves to be the Cohesion Fund. The regional authorities chose to use the Cohesion fund for big investments, especially in the main cities, while the ERDF instrument was aimed at funding complementary investments. The Cohesion Fund funded approximately 20% of the total investment required by PROGREMIC (see table 4.12 below).
Table 4: Waste projects funded by the Cohesion Fund in Catalonia (2000-2006)
Source: Catalan Waste Agency
6 It mainly concerns Industrial Waste. CATOR, for instance is a factory where all the used oil is recycled, the vegetable
oil is recycled by private companies to manufacture biodiesel.
Project Approved fund in m €
Creation and improvement of the municipal wastetreatment infrastructure network in Catalonia 15.24
Adaptation of the municipal waste incinerationinstallations in Catalonia to Directive 2000/76/CE 9.6Municipal waste selection and bio treatment plant inSant Adrià de Besòs 36.1 Projects for the construction and preparation ofmunicipal waste management infrastructures inCatalonia 29.5
Municipal waste treatmentplants in the Urgell, PallarsJussà and Conca de Barberà regions 8TOTAL 98.44

EX-POST EVALUATION OF COHESION POLICY PROGRAMMES 2000-2006 CO-FINANCED BY THE EUROPEAN FUND FOR REGIONAL DEVELOPMENT (OBJECTIVES 1 AND 2) - WORK PACKAGE 5B: ENVIRONMENT AND CLIMATE CHANGE ADE
Waste Prevention and Management of waste Case Study - Catalonia - October 2009 Page 9
ERDF funding represented around 2% of the PROGREMIC programme, with 9.8 m euros7. The specific ERDF contribution will be discussed under section 4.4.6.
This general picture of ERDF interventions in the broader context of waste management investments in the Region show that they do not have a prominent role when compared to other sources of funding for waste management investments.
2.2 Implementation of the Catalan municipal waste management plan (PROGREMIC)
The regional strategy for the 2001-2006 period was organised around the following main areas: waste prevention, dissemination and information, recovery and landfilling of non recoverable waste. The PROGREMIC programme (Municipal Waste Management Programme) carried out a projection of waste generation that forecast a level of municipal waste generation (kg/capita/day) of 1.54 in 2006 (562 kg/capita year). This figure is being largely exceeded. 2004 registered waste generation per capita of 1.68 kg /capita/day (614kg/capita year) was recorded and 722,592 more tonnes were generated than the planned number. In addition, at the end of 2003 the level of waste recovery achieved was only 18%, well below the 36% target set for PROGREMIC. Like most countries and regions during the 90’s, Catalonia has experienced an important increase in waste production. As mentioned under § 4.3.2.2, the increased volume of waste especially over the 2000-2004 period appeared as major problem for the regional authorities. This increase was mainly due to the unexpected growth of population registered in Catalonia during the period 2001-2006, and also the unexpected increase of waste generation per capita (see table X : Evolution of GDP, municipal waste production and population over the 2000-2006 period in Catalonia) In 7 years and with a population increase of 13%, Catalonia has registered an increase of 39% in the generation of municipal waste and an increase of 21% of the daily generation of waste per capita. Actions taken to stop this pattern were established as a consequence of the mid-term evaluation (2003) of the Municipal Waste Management Program of Catalonia 2001-2006 (PROGREMIC). They were namely the following: Definition and approval of the 2005-2012 Territorial Sector Plan for Municipal Waste
Management Infrastructure; Establishment of waste disposal taxes (Act 2003 of 13 June on financing waste treatment
infrastructure); Approval of Grant Orders.
7 The total amount dedicated to waste management in the ERDF Objective 2 programme (measure 2.2)
funded by ERDF corresponds to 5,657,277 € directly managed by local authorities and 4,190,655 € managed by regional authorities. (Source: Departament d’Economia i Finances, Generalitat de Catalunya)

EX-POST EVALUATION OF COHESION POLICY PROGRAMMES 2000-2006 CO-FINANCED BY THE EUROPEAN FUND FOR REGIONAL DEVELOPMENT (OBJECTIVES 1 AND 2) - WORK PACKAGE 5B: ENVIRONMENT AND CLIMATE CHANGE ADE
Waste Prevention and Management of waste Case Study - Catalonia - October 2009 Page 10
As mentioned, the plan was revised in 2003, and in 2005 the Municipal Waste Management Action Plan 2005-2012 for Catalonia was approved. This current Action Plan is divided into two main parts: the revision of PROGREMIC and approval of PROGREMIC 2007-2012, and elaboration of the Municipal Waste Infrastructure Management Sector Plan which defines the needs to develop infrastructures for the period 2005-2012. This overall municipal waste management action plan for 2005-2012 from the department of Environment estimated an aggregate investment need of €1,789 million, €1,490 million of which dedicated to doubling the waste management installations in Catalonia (from 55 to 108). The main elements of the new Municipal Waste Management Action Plan 2005-2012 in Catalonia are: 1. Prevention measures and activities to encourage sustainable consumption. 2. Implementation of the selective collection of the organic waste fraction in all the
municipalities in Catalonia. 3. Increased efficiency of selective collection (including all types of fraction). 4. Treatment of non-segregated fraction for recovery of materials and biodegradability
reduction. 5. Distribution of the installations from the point of view of proximity and adequacy. 6. Collaboration, right to be informed, communication and awareness action campaigns. In terms of implementation, regarding civic amenity sites (i.e. waste collection points), Catalonia registered 228 operational waste collection points in 2004, eight under construction and 46 in process of approval (their distribution is directly related to population density). In addition, there were more than 31 operating mobile waste collection points and nine undergoing the approval process, which serviced 572 municipalities (out of more than 900 municipalities in Catalonia).

EX-POST EVALUATION OF COHESION POLICY PROGRAMMES 2000-2006 CO-FINANCED BY THE EUROPEAN FUND FOR REGIONAL DEVELOPMENT (OBJECTIVES 1 AND 2) - WORK PACKAGE 5B: ENVIRONMENT AND CLIMATE CHANGE ADE
Waste Prevention and Management of waste Case Study - Catalonia - October 2009 Page 11
Relació entre nombre de deixalleries i quantitats de residus totals recollits
243228 234219
199
173154
25 70
123
257
286.994
246.250221.029
183.810
149.576131.711110.030
40.06522.143
64.349
310.402
0
50
100
150
200
250
300
1995 1996 1997 1998 1999 2000 2001 2002 2003 2004 2005 2006 2007
deix
alle
ries
0
50.000
100.000
150.000
200.000
250.000
300.000
350.000
t
deixalleries residus
Programa de residus municipals 1995-2000
Programa de residus municipals 2001-2006
Catalonia registered 257 civic amenity sites (deixallerias) operating in 2007 compared to only 154 in 2000 (see graph 4.5 hereafter).
Graph 4: Relation between waste collection points and total waste collected between 1997 and 2007
Over the same 10 years-period, the main evolutions regarding infrastructures were: the end of the uncontrolled disposal of waste and closure of 206 dumping sites, the closure at the end of 2004 of three incineration plants (leaving only four remaining
incineration facilities active in Catalonia), the closure of 3 landfills (from 32 to 29), the development of composting plants (from 9 in 2000 to 20 units in 2006), the development of “ecoparques”8 (4 plants were created during the period).
8 The ECOPARK is a unit that allows energy and fertiliser to be gained from the municipal waste organic
fraction, which includes two lines of treatment: a) Treatment of the selective waste collection organic fraction, in order to evaluate the organic material to obtain quality compost and b) Treatment of the residual fraction.


EX-POST EVALUATION OF COHESION POLICY PROGRAMMES 2000-2006 CO-FINANCED BY THE EUROPEAN FUND FOR REGIONAL DEVELOPMENT (OBJECTIVES 1 AND 2) - WORK PACKAGE 5B: ENVIRONMENT AND CLIMATE CHANGE ADE
Waste Prevention and Management of waste Case Study - Catalonia - October 2009 Page 13
3. Catalonia Objective 2 programme (2000-2006)
3.1 The overall programme in Catalonia
Overall funding of the Catalonia Region Objective 2 programme amounted to €2832million. The management authority is the Ministry of Economy in coordination with the Generalitat de Catalunya, the regional administration. This programme put a main focus on innovation society and competitiveness with 56% of planned resources (see table 4.13).
Table 5: Axis and financial commitments of Objective 2 programme in Catalonia
Source: Programming documents of Catalonia OP
The second axis of the programme concerns environment, natural and hydraulic resources. It includes five measures, namely water, waste related investments. The environmental axis represents 10% of the total programme. Management of urban and industrial treated waste amounts to around 19m € and represents 7% of axis 2 (see table 4.14 below). The main measures are related to water supply (both to population and economic activities), to water sanitation and wastewater plants.
Axis Title million € %
1Improvement of competitiveness,employment and industrial network 730 26%
2Environment, natural and hydraulicresources 289 10%
3 Innovation society 839 30%
4 Communication and energy networks 456 16% 5 Local and urban development 498 18% 6 Technical assistance 18 1%
2830 100%TOTAL

EX-POST EVALUATION OF COHESION POLICY PROGRAMMES 2000-2006 CO-FINANCED BY THE EUROPEAN FUND FOR REGIONAL DEVELOPMENT (OBJECTIVES 1 AND 2) - WORK PACKAGE 5B: ENVIRONMENT AND CLIMATE CHANGE ADE
Waste Prevention and Management of waste Case Study - Catalonia - October 2009 Page 14
Table 6: Measures of axis 2 concerning the environment, natural and hydraulic resources (in € and % of axis environment)9
Source: Programming documents of Catalonia OP
3.2 Urban waste management measure
The urban waste management measure10, measure 2.2, has a double objective: environmental protection and development of economic activity related to recycling, waste management and waste valorisation. As shown in table 4.15 hereafter, it mainly focused on: construction of urban solid waste treatment plants: sorting centres, transfer stations,
civic amenity sites (waste collection points), composting plants; purchase of containers for selective waste collection and organic material; sealing of uncontrolled landfills. In addition, economic support for the preparation of environmental diagnoses and waste minimisation was financed under axis one, linked to the private sector. Overall, ERDF funds were managed by both local authorities and regional authorities as shown in the table hereafter.
9 Slight differences in total amounts for axis 2 come from rounding’s.
10 Urban waste management is the term used by the programme. It is synonym to municipal waste management.
Measure Title %
2.1 Water supply, water sanitation and wastewaterplants(WS to population and economic activities) 199 69%
2.2 Urban waste(Global managementof urban wasteandindustrial treated waste) 19 7%
2.3 Protection and regeneration of natural environment 40 14%
2.4 Monitoring, control and reduction of enviromentalpollution 6 2%
2.5 Studies, classification and recovery of industrialpolluted soil 23 8%
287 100%TOTAL
€m

EX-POST EVALUATION OF COHESION POLICY PROGRAMMES 2000-2006 CO-FINANCED BY THE EUROPEAN FUND FOR REGIONAL DEVELOPMENT (OBJECTIVES 1 AND 2) - WORK PACKAGE 5B: ENVIRONMENT AND CLIMATE CHANGE ADE
Waste Prevention and Management of waste Case Study - Catalonia - October 2009 Page 15
Table 7: Specific allocation of waste management (measure 2.2) in DOCUP Objective 2 Catalonia 2000-2006 (euros)
Source: Departament d’Economia i Finances, Generalitat de Catalunya
The local line was managed by the General Direction for Local Authorities of the Department of Government and Public Administration, i.e. the “Generalitat de Catalunya” which handled 40 projects. The amount of projects ranges from 40,000 - 800,000 €. A detailed list of the projects is presented in annex 1. The regional line was managed by the Regional Waste Agency (Agencia de Residus de Catalunya ARC), a public body subject to the Department of Environment of the Regional Government, which intervened in 3 projects registered in the DOCUP. These three projects are shown in table 4.16 below. In reality, these projects were feeding existing budget lines which funded more than 243 interventions as explained hereafter (see also detailed list is annex 1).
Table 8: Joint financed projects DOCUP 2000 – 2006 (amount in thousands of euros)
Source : DOCUP Catalonia 2000-2006
Measure Description
Approved eligible
expenditure
Committed at
31/12/2006
Urban solid waste treatment plants: tip points, transfer stations, transfer centres (code 137) 2,792.29 2,864.55Containers for selective waste collection andorganic material (code 138) 2,181.28 2,181.28Construction of controlled landfills and landfill sealing (code 139) 3,407.74 3,689.03
8,381.31 8,734.86
2.2 Comprehensivemanagement of urbanwaste and industrial waste
TOTAL
Waste management (measure 2.2)
Programmed ERDF co-financed
% s/total prog.
Directly Local Authorities Managed inCatalonia
11,314,554 5,657,277 0.67%
Directly Regional Authorities Managed(ARC)
8,381,311 4,190,655 0.50%
TOTAL 19,695,865 9,847,932
Amounts (in € )

EX-POST EVALUATION OF COHESION POLICY PROGRAMMES 2000-2006 CO-FINANCED BY THE EUROPEAN FUND FOR REGIONAL DEVELOPMENT (OBJECTIVES 1 AND 2) - WORK PACKAGE 5B: ENVIRONMENT AND CLIMATE CHANGE ADE
Waste Prevention and Management of waste Case Study - Catalonia - October 2009 Page 16
The philosophy behind the allocation of funds by the Region of Catalonia has rather been one of intervening in a large number of projects with relatively small amounts of funding. Amounts for individual intervention (among the 243) vary from less to 1,000 to some 300,000 €. The objective was to use ERDF funds as a complementary source of funding as a driver so as to favour the initiation and implementation of those projects. Even if the co-funding part was not dominant, by giving the necessary financial impulse, it facilitated the realisation of investments which otherwise would not have been made. This philosophy was used as a basis for the allocation of all ERDF funds in Catalonia during the period 2000-2006. As a consequence, the general profile of the interventions corresponds: for the “local” line, in investments of limited scale, generally improvements in existing
plants, extensions of capacity, productivity gains, complementary to other sources of funding such as the Cohesion Fund or regional or national funds.
for the “regional” line, in feeding the “funding lines” managed by the Catalan Waste Agency and created under regional law in the framework of the Regional Municipal Waste Management Plan (PROGEMIC 2001-2006, see above); these funding lines concerned the following investments (243 in total): - civic amenity centres (waste collection points) and transfer centres, - containers, - closure of unauthorised landfills.
The achievements linked to the above mentioned investments and expressed in the foreseen DG Regio indicators are expressed in number of projects, new capacity of waste treatment and closure or rehabilitation of unauthorized landfills. They are summarised in the following table 4.17.
Table 9: Achievements of urban waste management measure (2.2)
Indicator Unit Target value Achieved
value
Number of projects in municipal solid waste number 100 98
New capacity of waste treatment createdthousand
m³ 227.2 227.2
Number of unauthorised landfills closed/rehabilitated number 381 381 Source: Annual reports (2007) Docup Objective 2 Cataluna11
The foreseen output and result indicators have been almost completely achieved, especially regarding treatment capacity and landfills.
11 Estado de Ejecucion a 31/12/2006

EX-POST EVALUATION OF COHESION POLICY PROGRAMMES 2000-2006 CO-FINANCED BY THE EUROPEAN FUND FOR REGIONAL DEVELOPMENT (OBJECTIVES 1 AND 2) - WORK PACKAGE 5B: ENVIRONMENT AND CLIMATE CHANGE ADE
Waste Prevention and Management of waste Case Study - Catalonia - October 2009 Page 17
As already mentioned, ERDF funding especially contributed to installation of civic amenity sites, containers and closure of unauthorised landfills included in the Catalan Waste Management Plan (PROGERMIC). The respective ERDF contributions amount to 18% as regards landfills, 11% for civic amenity sites and 6% for containers (see table 4.18).
Table 10: Contribution of ERDF urban waste management measure (2.2) to interventions in PROGREMIC
InterventionTotal funding (in
million €)ERDF
contribution% ERDF in total
Waste collection points(civic amenity centers) 25,076 2,865 11%Containers 34,874 2,181 6%Closure of unauthorisedlandfills 20,316 3,689 18%
Source: Department of Economy and Finances, Catalan Government


EX-POST EVALUATION OF COHESION POLICY PROGRAMMES 2000-2006 CO-FINANCED BY THE EUROPEAN FUND FOR REGIONAL DEVELOPMENT (OBJECTIVES 1 AND 2) - WORK PACKAGE 5B: ENVIRONMENT AND CLIMATE CHANGE ADE
Waste Prevention and Management of waste Case Study - Catalonia - October 2009 Page 19
4. Conclusions
As stated clearly in the introduction of this report, ERDF interventions represent a very small part of total investment in the field of waste management in Catalonia (0,07 %). In consequence it proved impossible to assess its direct impact on the implementation of Catalan waste policy and on the results achieved during and after the programming period at environmental or socio-economic level. Progress made by Catalonia in its waste management policy as well as its constant efforts to comply with EU waste policy targets and Regulations have been developed under §4.3.3. The following conclusions can be drawn regarding ERDF interventions in the concerned field: their small weight compared to Cohesion Fund or regional/national funds which have
a determining role in efforts to comply with the EU Directives the complementarities of the tool promoting implementation of micro-investments like
sorting centers, composting plants, civic amenity sites, closing of dumping sites, etc. their coherence with the Catalan waste management plan geographical coverage impacting on a relatively high number of municipalities when analysing impact at local level, i.e. the level of a local public waste management
authority, ERDF interventions had an accelerating or facilitating effect which could have made all the difference in some cases (see description of local case studies visited during the evaluation), although overall they were not crucial as such
good articulation with the Cohesion Fund and the regional/national funds, the higher co-funding rate of the Cohesion Fund (80%) being an important factor when choosing the interventions
high level of execution (100 %) good internal follow-up at Catalan regional level.


EX-POST EVALUATION OF COHESION POLICY PROGRAMMES 2000-2006 CO-FINANCED BY THE EUROPEAN FUND FOR REGIONAL DEVELOPMENT (OBJECTIVES 1 AND 2) - WORK PACKAGE 5B: ENVIRONMENT AND CLIMATE CHANGE ADE
Waste Prevention and Management of waste Case Study - Catalonia - October 2009 Page 21
Measure Aut. Level Num. ProjectsProgrammed investment
Programmed Subsidy
% Programmed Subsidy by measure
2.1 Local 158 29.594.035 14.797.0182.1 Regional 133 170.343.252 85.171.626
Subtotal 291 199.937.287 99.968.643 69,67%2.2 Local 40 11.314.554 5.657.2772.2 Regional 3 8.381.311 4.190.655
Subtotal 43 19.695.865 9.847.932 6,86%2.4 Local 110 29.832.378 14.916.1892.4 Regional 44 8.308.403 4.154.201
Subtotal 154 38.140.781 19.070.390 13,29%2.5 Regional 9 5.832.640 2.916.320
Subtotal 9 5.832.640 2.916.320 2,03%2.6 Local 66 23.294.776 11.647.3882.6 Regional 1 90.152 45.076
Subtotal 67 23.384.928 11.692.464 8,15%TOTAL 564 286.991.501 143.495.750 100,00%
Annex 1 – List of projects financed by measure 2.2 of Objective 2 Programme in Catalonia
Table 11: Funds distribution by measure (DOCUP Measure in Catalonia)

EX-POST EVALUATION OF COHESION POLICY PROGRAMMES 2000-2006 CO-FINANCED BY THE EUROPEAN FUND FOR REGIONAL DEVELOPMENT (OBJECTIVES 1 AND 2) - WORK PACKAGE 5B: ENVIRONMENT AND CLIMATE CHANGE ADE
Waste Prevention and Management of waste Case Study - Catalonia - October 2009 Page 22
Nº ADMIN ACCIO PROJECTE NOM PROJECTE NOM_CURT_ORG EXECUTOR Initial date Project Final Project dateCertification Project Date
Co-Finance Tax
Programmed investment
Programmed Subsidy
1 AL 2.2 264 Construction of recycling installations in La Ferreria Aj. Montcada Reixac Aj. Montcada Reixac 01/01/2000 31/12/2003 30/06/2008 0,5 617.392,29 308.696,152 AL 2.2 442 Construction of the municipal waste collection point/installation. Type B and installations urb. Aj. Vila-seca Aj. Vila-seca 01/01/2000 31/12/2003 31/12/2007 0,5 180.303,63 90.151,823 AL 2.2 460 Improvement of the municipal waste management service CC Baix Camp CC Baix Camp 01/01/2000 31/12/2003 31/12/2007 0,5 240.404,84 120.202,424 AL 2.2 471 Regional waste collection point/installation, 2nd phase CC Conca de Barberà CC Conca de Barberà 01/01/2000 31/12/2003 31/12/2007 0,5 204.344,12 102.172,065 AL 2.2 489 Construction of regional waste collection point type A in the municipality of Falset CC Priorat CC Priorat 01/01/2000 31/12/2003 31/12/2007 0,5 48.080,97 24.040,496 AL 2.2 540 Conditioning of the USW (urban solid waste) landfill of Alt Urgell MM Urgellet MM Urgellet 01/01/2000 31/12/2003 31/12/2007 0,5 300.506,05 150.253,037 AL 2.2 704 USW surface containers and selective collection integration programme CC Alta Ribagorça CC Alta Ribagorça 01/01/2002 31/12/2005 31/12/2007 0,5 100.000,00 50.000,008 AL 2.2 705 Expansion of the regional waste collection point/installation in Santa Coloma de Queralt CC Conca de Barberà CC Conca de Barberà 01/01/2002 31/12/2005 31/12/2007 0,5 40.000,00 20.000,009 AL 2.2 706 Municipal waste management machinery and equipment CC Conca de Barberà CC Conca de Barberà 01/01/2002 31/12/2005 31/12/2007 0,5 260.000,00 130.000,00
10 AL 2.2 708 Improvement in the accesses to the environmental complex/installation CC Vallès Oriental Cons. Gest. Residus V Or 01/01/2002 31/12/2005 31/12/2007 0,5 200.000,00 100.000,0011 AL 2.2 709 Domestic waste collection project Manc. Ag.deSeg. Fon. Raj. Manc. Ag.deSeg. Fon. Raj 01/01/2002 31/12/2005 31/12/2007 0,5 120.000,00 60.000,0012 AL 2.2 1422 USW selective collection in Mont-roig Aj. Mont-roig Camp Aj. Mont-roig Camp 01/01/2004 31/12/2008 31/12/2007 0,5 186.000,00 93.000,0013 AL 2.2 1423 Regional USW mangement service CC Conca de Barberà CC Conca de Barberà 01/01/2004 31/12/2008 31/12/2007 0,5 148.000,00 74.000,0014 AL 2.2 1424 USW selective collection machinery CC Segarra CC Segarra 01/01/2004 31/12/2008 30/06/2008 0,5 186.000,00 93.000,0015 AL 2.2 1425 Construction of the EMED and the regional waste collection installation. CC La Selva CC La Selva 01/01/2004 31/12/2008 30/06/2008 0,5 760.000,00 380.000,0016 AL 2.2 1426 Adequacy of the USW transfer stations. CC Terra Alta CC Terra Alta 01/01/2004 31/12/2008 30/06/2008 0,5 112.000,00 56.000,0017 AL 2.2 1427 USW selective collection management space CC Terra Alta CC Terra Alta 01/01/2004 31/12/2008 30/06/2006 0,5 112.000,00 56.000,0018 AL 2.2 1428 RSU collection service truck CC Alt Camp CC Alt Camp 01/01/2004 31/12/2008 31/12/2007 0,5 138.000,00 69.000,0019 AL 2.2 1429 USW compacting plant/installation CC Alt Empordà CC Alt Empordà 01/01/2004 31/12/2008 31/12/2007 0,5 460.000,00 230.000,0020 AL 2.2 1430 Improvement in the USW organic fraction treatment CC Baix Camp CC Baix Camp 01/01/2004 31/12/2008 30/06/2008 0,5 460.000,00 230.000,0021 AL 2.2 1431 Environmental communication and education programme CC Montsià C per a GRM comarca Mon 01/01/2004 31/12/2008 31/12/2007 0,5 186.000,00 93.000,0022 AL 2.2 1432 Communication and awareness campaign on USW selective collection CC Tarragonès CC Tarragonès 01/01/2004 31/12/2008 30/06/2008 0,5 298.000,00 149.000,0023 AL 2.2 1433 Expansion of basin b in the regional landfill of Orís CC Osona C Gestió RSU Osona 01/01/2004 31/12/2008 30/06/2008 0,5 740.000,00 370.000,0024 AL 2.2 1434 Expansion of the leachate treatment plant of the Garraf landfill EMSHTR EMSHTR 01/01/2004 31/12/2008 30/06/2008 0,5 300.000,00 150.000,0025 AL 2.2 1668 Expansion of the composting plant Cons. Gest. Residus V Or Cons. Gest. Residus V Or 01/01/2004 31/12/2008 31/12/2007 0,5 760.000,00 380.000,0026 AL 2.2 1674 4th phase of the basin impermeabilization of Bufalvent landfill Cons. Bages gest. residus Cons. Bages gest. residus 01/01/2004 31/12/2008 31/12/2007 0,5 280.000,00 140.000,0027 AL 2.2 1675 Reinforcement of the access pavement into the Benavarre landfill MM Urgellet Aj. Montferrer Cast. 01/01/2004 31/12/2008 31/12/2007 0,5 186.000,00 93.000,0028 AL 2.2 1676 Purchase of a tractor Manc.Intm. l'Anoia Gest R Manc.Intm. l'Anoia Gest R 01/01/2004 31/12/2008 31/12/2007 0,5 60.000,00 30.000,0029 AL 2.2 1677 Remodelling of the USW segregation plant MM Penedès-Garraf MM Penedès-Garraf 01/01/2004 31/12/2008 31/12/2007 0,5 460.000,00 230.000,0030 AL 2.2 1785 Implementation of USW collection by means of underground containers Aj. Alcover Aj. Alcover 01/01/2006 31/12/2008 30/06/2008 0,5 194.000,00 97.000,0031 AL 2.2 1786 Improvements in the sewer network, phase 1 Aj. Polinyà Aj. Polinyà 01/01/2006 31/12/2008 31/12/2007 0,5 160.000,00 80.000,0032 AL 2.2 1787 Installation of a pneumatic waste collection system Aj. Reus Aj. Reus 01/01/2006 31/12/2008 30/06/2008 0,5 806.000,10 403.000,0533 AL 2.2 1789 Channelling of one section of Can Rossell stream Aj. Subirats ACA 01/01/2006 31/12/2008 30/06/2008 0,5 194.000,00 97.000,0034 AL 2.2 1790 Improvement in the waste collection and population awareness CC Urgell CC Urgell 01/01/2006 31/12/2008 30/06/2008 0,5 40.000,00 20.000,0035 AL 2.2 1791 Improvement of the basic services of the composting plant CC Baix Camp CC Baix Camp 01/01/2006 31/12/2008 30/06/2008 0,5 60.000,00 30.000,0036 AL 2.2 1792 Implementation of waste collection by means of underground containers CC Baix Ebre CC Baix Ebre 01/01/2006 31/12/2008 30/06/2008 0,5 400.000,00 200.000,0037 AL 2.2 1793 Implementation of underground containers for municipal waste collection. Civil work phase 1 B CC Montsià C per a GRM comarca Mon 01/01/2006 31/12/2008 0,5 360.000,00 180.000,0038 AL 2.2 1794 Waste collection by means of underground containers CC Pallars Sobirà CC Pallars Sobirà 01/01/2006 31/12/2008 31/12/2007 0,5 240.000,00 120.000,0039 AL 2.2 1795 Implementation of underground containers for organic waste collection and awareness campaign CC Tarragonès CC Tarragonès 01/01/2006 31/12/2008 0,5 240.000,00 120.000,0040 AL 2.2 1796 Remodelling and adequacy of "Can Giró" for USW MM Penedès-Garraf MM Penedès-Garraf 01/01/2006 31/12/2008 30/06/2008 0,5 477.522,10 238.761,05
TOTAL 40 11.314.554,10 5.657.277,05
Table 12: List of Projects at Local Level (Measure 2.2 DOCUP Catalonia 2000-2006)

EX-POST EVALUATION OF COHESION POLICY PROGRAMMES 2000-2006 CO-FINANCED BY THE EUROPEAN FUND FOR REGIONAL DEVELOPMENT (OBJECTIVES 1 AND 2) - WORK PACKAGE 5B: ENVIRONMENT AND CLIMATE CHANGE ADE
Waste Prevention and Management of waste Case Study - Catalonia - October 2009 Page 23
Table 13: List of Projects at Regional Level (Measure 2.2 DOCUP Catalonia 2000-2006)
Nº ADMIN ACCIO PROJECTE NOM PROJECTE NOM_CURT_ORG EXECUTOR Initial date Project Final Project dateCertification Project Date
Co-Finance Tax
Programmed investment
Programmed Subsidy
41 GC 2.2 137 Plants dedicated to the treatment of USW: waste collection points, transfer plants, etc. Dept. Medi Ambient i Hab. Ag Residus Cat 01/01/2000 31/12/2006 31/12/2006 0,5 2.792.293,31 1.396.146,6642 GC 2.2 138 Containers dedicated to the selective and organic waste collections. Dept. Medi Ambient i Hab. Ag Residus Cat 01/01/2000 31/12/2006 31/12/2006 0,5 2.181.279,22 1.090.639,6143 GC 2.2 139 Construction of controlled landfils and closure of landfills. Dept. Medi Ambient i Hab. Ag Residus Cat 01/01/2000 31/12/2005 31/12/2005 0,5 3.407.738,32 1.703.869,16
TOTAL 3 8.381.310,85 4.190.655,43

EX-POST EVALUATION OF COHESION POLICY PROGRAMMES 2000-2006 CO-FINANCED BY THE EUROPEAN FUND FOR REGIONAL DEVELOPMENT (OBJECTIVES 1 AND 2) WORK PACKAGE 5B: ENVIRONMENT AND CLIMATE CHANGE ADE
Waste Prevention and Management of waste Case Study - Catalonia - October 2009 Page 24
DOCUP de Catalunya 2000-2006. Objectiu 2.
Codi del projecte: 137Nom: Plantes de tractament de residus sòlids urbans: deixalleries, plantes de transferènciaMesura: 2.2Executor: Agència de Residus de Catalunya
BENEFICIARIS COMARCA JUSTIFICAT
AJ JONQUERA ALT EMPORDÀ 37.378AJ. AGRAMUNT URGELL 140.185AJ. AIGUAFREDA VALLÈS ORIENTAL 54.091AJ. ARGENTONA MARESME 3.059AJ. BLANES SELVA 131.223AJ. CADAQUÈS ALT EMPORDÀ 5.634AJ. CASTELLBELL I VILAR BAGES 23.706AJ. COLLBATÓ BAIX LLOBREGAT 886AJ. CUNIT BAIX CAMP 23.322AJ. GELIDA ALT PENEDÈS 26.849AJ. MANRESA BAGES 34.339AJ. MATARO MARESME 98.396AJ. PALS BAIX EMPORDÀ 123.097AJ. ROSES ALT EMPORDÀ 130.360AJ. RUBI VALLÈS OCCIDENTAL 13.213AJ. S.FRUITOS BAGES BAGES 9.974AJ. SABADELL VALLÈS OCCIDENTAL 218.857AJ. SALOU TARRGONÈS 123.097AJ. SANT HILARI SACALM SELVA 26.150AJ. TOSSA DE MAR SELVA 82.220AJUNTAMENT D'AVINYÓ Bages 59.875AJUNTAMENT DE LA TORRE DE CLARAMUNT Anoia 59.876AJUNTAMENT DE MANLLEU Osona 15.773AJUNTAMENT DE MARTORELL Baix Llobregat 4.808AJUNTAMENT DE MARTORELL Baix Llobregat 24.040AJUNTAMENT DE NAVÀS Bages 133.735AJUNTAMENT DE PALAMÓS Baix Empordà 13.535AJUNTAMENT DE ROSES Alt Empordà 18.849AJUNTAMENT DE VILASSAR DE MAR Maresme 145.443AJUNTAMENT DEL PERELLÓ Baix Ebre 57.817AJUNTAMENT D'ESPARREGUERA Baix Llobregat 1.221AJUNTAMENT D'ESPARREGUERA Baix Llobregat 18.900AJUNTAMENT D'OLESA DE MONTSERRAT Baix Llobregat 93.796AJUNTAMENT RUBÍ Vallès Occidental 16.200AJUNTAMENT RUBÍ Vallès Occidental 24.040C.C..CONCA DE BARBERÀ CONCA DE BARBERÀ 8.093C.C..CONCA DE BARBERÀ CONCA DE BARBERÀ 32.437C.C.GARROTXA GARROTXA 24.642C.C.GARROTXA GARROTXA 36.343C.C.PALLARS JUSSÀ PALLARS JUSSÀ 37.662C.C.PRIORAT PRIORAT 50.349C.C.VALLÈS ORIENTAL VALLÈS ORIENTAL 5.442C.C.VALLÈS ORIENTAL VALLÈS ORIENTAL 19.800CC, MARESME MARESME 31.454CONSELH GENERAU VAL D´ARAN VAL D´ARAN 129.720CONSELL COMARCAL DE LA CONCA DE BARBERÀ Conca de Barberà 40.394CONSELL COMARCAL DE LA NOGUERA Noguera 9.860CONSELL COMARCAL DEL BAIX EBRE Baix Ebre 24.667CONSELL COMARCAL DEL BERGUEDÀ Berguedà 24.040CONSELL COMARCAL DEL BERGUEDÀ Berguedà 28.331CONSELL COMARCAL DEL RIPOLLES Ripollès -33.800CONSELL COMARCAL DEL RIPOLLÈS Ripollès 24.040CONSELL COMARCAL DEL RIPOLLÈS Ripollès 33.800CONSORCI DEL MONTSIÀ Montsià 82.204CONSORCI PER A LA GESTIÓ DE RESIDUS DEL VALLÈS ORIENTAVallès Oriental 78.175CONSORCI PER A LA GESTIO DE RSM DEL MONTSIA Montsià 71.306MANC.PENED.GARRAF PENEDÈS-GARRAF 30.928MANC.PENED.GARRAF PENEDÈS-GARRAF 55.720MANCOMUNITAT INTERMUNICIPAL DEL PENEDÈS I GARRAF Alt Penedès 10.000MANCOMUNITAT INTERMUNICIPAL DEL PENEDÈS I GARRAF Alt Penedès 15.000
2.864.549
List of projects co-funded by ARC Funding lines under ERDF projects 137, 138 and 139

EX-POST EVALUATION OF COHESION POLICY PROGRAMMES 2000-2006 CO-FINANCED BY THE EUROPEAN FUND FOR REGIONAL DEVELOPMENT (OBJECTIVES 1 AND 2) WORK PACKAGE 5B: ENVIRONMENT AND CLIMATE CHANGE ADE
Waste Prevention and Management of waste Case Study - Catalonia - October 2009 Page 25
DOCUP de Catalunya 2000-2006. Objectiu 2.
Codi del projecte: 138Nom: Contenidors per a la recollida selectiva i de matèria orgànicaMesura: 2.2Executor: Agència de Residus de Catalunya
BENEFICIARIS COMARCA JUSTIFICAT
AJ. VILANANT ALT EMPORDÀ 43AJ. MASIES VOLTREGÀ OSONA 130AJ. ESCALA ALT EMPORDÀ 497CC RIPOLLÈS RIPOLLÈS 994ANOIA Santa Margarida de Montbui 1.015AJ. SANTA MARIA D'OLÓ BAGES 1.042CC BERGUEDÀ BERGUEDÀ 1.083AJ.VILADECAVALLS VALLÈS OCCIDENTAL 1.386SELVA Riudarenes 1.680AJ. TIANA MARESME 1.988BAIX CAMP Baix Camp 2.107AJ. STA. PERPETUA MOGODA VALLÈS OCCIDENTAL 2.165VALLÈS ORIENTAL Cardedeu 2.262CC BAIX CAMP BAIX CAMP 2.447ANOIA Igualada 2.662AJ. VALLS ALT CAMP 2.717RIPOLLÈS C.C.Ripollès 2.754SELVA Vilobí d'Onyar 2.957MARESME S. Andreu de Llavaneres 3.148CC CONCA DE BARBERÀ CONCA DE BARBERÀ 3.472CC GARRIGUES GARRIGUES 3.681MARESME Calella 3.745AJ. BLANES SELVA 4.029CONS. PRIORAT, TERRA ALTA, RIBERA EBRE PRIORAT, TERRA ALTA, RIBERA EBRE 4.496BAGES Navàs 4.542AJ. SETMENAT VALLÈS OCCIDENTAL 4.971CC BAIX EBRE BAIX EBRE 5.089AJ. TARRAGONA TARRAGONÈS 5.208AJ. ESCALA ALT EMPORDÀ 5.540AJ. MARTORELL BAIX LLOBREGAT 5.650MARESME Arenys de Munt 5.884CC TARRAGONÈS TARRAGONÈS 5.965AJ. CUNIT BAIX PENEDÈS 5.965SELVA Arbúcies 6.564AJ ST CUGAT DEL VALLÈS VALLÈS OCCIDENTAL 6.625CC PALLARS JUSSÀ PALLARS JUSSÀ 6.791MARESME Tordera 6.804CC RIPOLLÈS RIPOLLÈS 6.944MARESME Cabrils 7.004AJ. TARRAGONA TARRAGONÈS 7.136AJ. MARTORELL BAIX LLOBREGAT 8.150VALLÈS OCCIDENTAL Viladecavalls 8.799CC TARRAGONÈS 9.027SELVA Tossa de Mar 9.240TARRAGONÈS Salou 9.348TARRAGONÈS Vila-seca 9.373CC ANOIA ANOIA 9.689CC NOGUERA NOGUERA 10.263CC SOLSONÈS SOLSONÈS 10.416CC BAGES BAGES 10.977VALLES OCCIDENTAL Santa Perpètua Mogoda 11.165BAIX EBRE C.C Baix Ebre 11.310AJ. VILASECA TARRAGONÈS 11.457CC SOLSONÈS SOLSONÈS 11.805CC PLA DE L'ESTANY PLA DE L'ESTANY 11.999AJ. BLANES SELVA 12.265MARESME Premià de Dalt 12.462MARESME Argentona 13.535AJ. ROSES ALT EMPORDÀ 13.888CC GARRIGUES GARRIGUES 14.577GARROTXA Olot 14.790CC BAIX EMPORDÀ BAIX EMPORDÀ 15.142Ribera d'Ebre, Priorat, Ter Ribera d'Ebre, Priorat, Ter 16.091CC OSONA OSONA 16.241AJ. REUS BAIX CAMP 16.419CC BAIX EMPORDÀ BAIX EMPORDÀ 16.979CC PALLARS SOBIRÀ PALLARS SOBIRÀ 17.539CONS. PRIORAT, TERRA ALTA, RIBERA EBRE PRIORAT, TERRA ALTA, RIBERA EBRE 18.867CC GARROTXA GARROTXA 19.016AJ. REUS BAIX CAMP 21.576AJ. RUBÍ VALLÈS OCCIDENTAL 22.190CC SELVA SELVA 22.568MANC. ALT URGELL MERIDIONAL ALT URGELL 23.836MARESME Vilassar de Mar 25.182CC SELVA SELVA 25.703CC TARRAGONÈS TARRAGONÈS 29.158MONTSIÀ Consorci Montsià 33.366VALLÈS OCCIDENTAL Terrassa 33.785CC BAIX EBRE BAIX EBRE 33.957CC BAGES BAGES 34.723SEGARRA Consorci Segarra 35.029VALLES OCCIDENTAL Rubí 39.690AJ. CUNIT BAIX CAMP 39.916BAGES Manresa 40.800CC BAIX PENEDÈS BAIX PENEDÈS 41.316CC VALLÈS OCCIDENTAL VALLÈS OCCIDENTAL 42.246CC MONTSIÀ MONTSIÀ 42.786CC BAIX LLOBREGAT BAIX LLOBREGAT 43.399CONSORCI VALLÈS ORIENTAL 49.301PENEDÈS Mancomunitat Penedès/G 51.035BAIX CAMP Reus 53.400Vallès Oriental Vallès Oriental 53.491MANC. PENEDÈS-GARRAF MANC. PENEDÈS-GARRAF 57.825CONSORCI VALLÈS ORIENTAL VALLÈS ORIENTAL 86.236CC MARESME MARESME 107.984CONSORCI VALLÈS ORIENTAL VALLÈS ORIENTAL 110.949CC VALLÈS OCCIDENTAL VALLÈS OCCIDENTAL 157.755CC OSONA OSONA 302.068
2.181.279

EX-POST EVALUATION OF COHESION POLICY PROGRAMMES 2000-2006 CO-FINANCED BY THE EUROPEAN FUND FOR REGIONAL DEVELOPMENT (OBJECTIVES 1 AND 2) - WORK PACKAGE 5B: ENVIRONMENT AND CLIMATE CHANGE ADE
Waste Prevention and Management of waste Case Study - Catalonia - October 2009 Page 26
DOCUP de Catalunya 2000-2006. Objectiu 2.
Codi i nom del projecte: 139. Construcció de dipòsits controlats i segellat d'abocadorsMesura: 2.2
Executor: AGÈNCIA DE RESIDUS DE CATALUNYA
BENEFICIARIS COMARCA JUSTIFICAT
AJUNTAMENT DE SANT PERE SALLAVINERA Anoia 103AJUNTAMENT DE TORRELLES DE LLOBREGAT Baix Llobregat 114AJUNTAMENT DE CASTELLAR DEL VALLÈS Vallès Occidental 304AJUNTAMENT DE LLIÇÀ D'AMUNT Vallès Oriental 407AJUNTAMENT DE MONTOLIU DE SEGARRA Segarra 465AJUNTAMENT DE SANTA CRISTINA D'ARO Baix Empordà 466AJUNTAMENT DE MANLLEU Osona 861AJUNTAMENT MASQUEFA Anoia 1.039Ajuntament de Cadaqués Alt Empordà 1.202AJ. S. ESTEVE SESROVIRES BAIX LLOBREGAT 1.269AJ. CASTELLVI DE LA MARCA ALT PENEDÈS 1.556CC. ANOIA ANOIA 1.731AJ. CASTELLVI DE LA MARCA ALT PENEDÈS 1.990AJ. VILADECANS BAIX LLOBREGAT 2.046AJ. SANT JULIÀ DE CERDANYOLA BERGUEDÀ 2.628AJ. GUALBA VALLÈS ORIENTAL 2.900CONSELL COMARCAL DE LA NOGUERA Noguera 3.092AJUNTAMENT DE VANDELLÒS I L'HOSPITALET DE L'INFANT Baix Camp 3.204AJ. CASTELLAR DEL VALLÈS VALLÈS OCCIDENTAL 4.221AJ. ALFARA DE CARLES BAIX EBRE 4.917AJ. BEGUES BAIX LLOBREGAT 5.100AJ. ESPOLLA ALT EMPORDÀ 5.209AJ. VIELHA-MITJARAN VAL D'ARAN 5.242Ajuntament de Palamós Baix Empordà 5.463Ajuntament de Sant Pere de Ribes Garraf 5.682Ajuntament de Castellbell i el Vilar Bages 5.742AJ. LLÍVIA CERDANYA 6.139AJ. PREMIÀ DE DALT MARESME 6.328CC. ALTA RIBAGORÇA ALTA RIBAGORÇA 6.553AJ. VAJOL ALT EMPORDÀ 7.329C.C. Noguera (La Sentiu de Sió) Noguera 7.420MANC. INTERM. ALT URGELL MERIDIONAL ALT URGELL 7.427AJ. TREMP PALLARS JUSSÀ 7.741AJUNTAMENT DE SANT ESTEVE SESROVIRES 8.000C.C.Osona (Muntanyola) Osona 10.482AJ. ARMENTERA ALT EMPORDÀ 12.329AJ. ROSES ALT EMPORDÀ 14.004Ajuntament de Foradada Noguera 14.015AJ. CASTELLTERÇOL VALLÈS ORIENTAL 15.239AJ. LLIÇÀ D'AMUNT VALLÈS ORIENTAL 15.967AJ. RIUDOMS BAIX CAMP 16.187Aj. Cruïlles-Monells-St. Sadurní de l'Heura Baix Empordà 17.107AJ. S. ANDREU LLAVANERES MARESME 17.150CC. ALTA RIBAGORÇA ALTA RIBAGORÇA 17.475AJ. VALLROMANES VALLÈS ORIENTAL 19.959CC. PLA DE L'ESTANY PLA DE L'ESTANY 21.286Ajuntament de Sabadell (Talús Somosierra) Vallès Occidental 24.151AJ. TORÀ SEGARRA 24.484Ajuntament de les Borges Blanques Garrigues 24.732CONSELL COMARCAL DEL BAIX PENEDÈS 26.994AJ. VANDELLÒS I HOSPITALET BAIX CAMP 30.006AJ. PONTS LA NOGUERA 31.350AJ. LLÍVIA CERDANYA 32.965Ajuntament de Pla de Santa Maria Alt Camp 35.292Ajuntament de Sanaüja Segarra 40.193Ajuntament d'Albinyana Baix Penedès 41.225Ajuntament de Cornudella de Montsant Priorat 44.826CONSELL COMARCAL DE LA SELVA 46.414AJ. CERVIÀ DE LES GARRIGUES GARRIGUES 47.026AJ. BADIA DEL VALLÈS VALLÈS OCCIDENTAL 48.177AJ. TORROELLA DE MONTGRÍ BAIX EMPORDÀ 48.630AJUNTAMENT DE LA SELVA DEL CAMP 50.250Ajuntament de Masquefa (aboc.Can Parellada i aboc. del MaAnoia 50.503Ajuntament d'Avinyó Bages 51.226AJ. D´OLESA DE BONESVALLS ALT PENEDÈS 52.500AJUNTAMENT DE SANTA CRISTINA D'ARO 57.000AJ. S. PERE TORELLO OSONA 57.076Ajuntament de Vila-rodona Alt Camp 61.775Ajuntament de Calders Bages 63.737CC. OSONA OSONA 67.420Ajuntament de Calafell Baix Penedès 72.072C.C.TARRAGONÈS TARRAGONÈS 74.334CONSELH GENERAU D'ARAN ARAN 80.021AJ. VALLS ALT CAMP 86.122C.C. Alt Penedès (Sant Quintí de Mediona) Alt Penedès 89.190Ajuntament de Sabadell (Raval d'Amàlia) Vallès Occidental 91.154Consorci Ribera Ebre, Priorat i Terra Alta (Falset, Móra la Nova i Flix) 95.374C.C.SELVA SELVA 101.284CC. PALLARS SOBIRÀ PALLARS SOBIRÀ 106.814Ajuntament de Sabadell (Can Roqueta) Vallès Occidental 108.364AJ. CUNIT BAIX PENEDÈS 111.125AJ. ULLDECONA MONTSIÀ 113.948AJ. PORTBOU ALT EMPORDÀ 121.807C.C.PLA DE L´ESTANY PLA DE L´ESTANY 121.923AJ. BALAGUER NOGUERA 145.385AJ. VENDRELL BAIX PENEDÈS 173.373C.C.BERGUEDÀ BERGUEDÀ 263.086AJ. RUBÍ VALLÈS OCCIDENTAL 360.607
3.689.025

EX-POST EVALUATION OF COHESION POLICY PROGRAMMES 2000-2006 CO-FINANCED BY THE EUROPEAN FUND FOR REGIONAL DEVELOPMENT (OBJECTIVES 1 AND 2) - WORK PACKAGE 5B: ENVIRONMENT AND CLIMATE CHANGE ADE
Waste Prevention and Management of waste Case Study - Catalonia - October 2009 Page 27
Annex 2 – List of site visits during field mission (February 2009)
Site visit 1 : Mancomunitat Intermunicipal del Penedès Garraf General information The Mancomunitat Penedès Garraf is an association of municipalities for the realisation of services in common. Population: 230.000 hab. Production of municipal waste: 130.000 tons in 2008 Selective collection: 35.055 tons in 2008 In relation with waste management, the Mancomunitat provides the following services: municipal solid waste collection collection of bulky waste and WEEE transport of municipal waste to the treatment plants of the Mancomunitat maintenance, cleaning and disinfection of containers management of waste infrastructures : 12 civic amenity centres, 1 sorting plant, 1
composting plant waste prevention actions environmental education and awareness-raising campaigns ERDF intervention regarding waste management Project 1796 Object : Renovation and adaptation of Can Giro Mansion (Mancomunitat offices) in Vilanova Budget: 477.522,10 € ERDF : 238.761,05 € Period: 2006-2008 This project consisted of transforming an old juniper plant and owner mansion into offices for the Mancomunitat services for waste management. This project is not directly linked with waste management policies. Project 1677 Object : Remodelation of sorting centre for municipal solid waste Budget: 460.000 € ERDF : 230.000 € Period: 2004-2008 The intervention consisted in buying and installing a new machine in order to increase the productivity of the sorting plant (capacity : 4t/hour, funded by the Cohesion Fund). This

EX-POST EVALUATION OF COHESION POLICY PROGRAMMES 2000-2006 CO-FINANCED BY THE EUROPEAN FUND FOR REGIONAL DEVELOPMENT (OBJECTIVES 1 AND 2) - WORK PACKAGE 5B: ENVIRONMENT AND CLIMATE CHANGE ADE
Waste Prevention and Management of waste Case Study - Catalonia - October 2009 Page 28
machine prepares the sorting by opening the bags with drill. The rest of the sorting process is predominantly manual and aimed at sorting packaging waste. Evaluation of ERDF intervention by the beneficiaries The initial request for funding from the Mancomunitat was to automatize completely the plant in order to increase its performances. The investment was 2.000.000 € worth. The accepted amount for funding being 460.000 €, the Mancomunitat decided to concentrate the investment on this machine which enabled a direct increase of the sorting performances: the sorted quantities destined to recycling have doubled between 2005 and 2008. For the Mancomunitat, even if it was not the global investment they wanted to promote, it is considered as a first step in the process of automatization of the sorting plant. For this local public body for waste management, ERDF has been an important source of funds during the period. The main challenge for them is to get funding for their different projects with regards to their own strategy and planning for municipal waste collection and treatment. This occurs mainly with the Catalan Waste Agency as the main interlocutor and funder through subsidies. Concerning the administrative process linked with the ERDF interventions, the following comments were made during the visit: ERDF administrative processes require an elevated investment in time the authorities managing ERDF interventions or the direct beneficiaries hardly
understand the obligation of external controls and audits, they consider that, being public administrations having their own control procedures and legal obligations, they should be considered with more trust by the EC
the period of time for getting the funding is too long (2 years in this case)

EX-POST EVALUATION OF COHESION POLICY PROGRAMMES 2000-2006 CO-FINANCED BY THE EUROPEAN FUND FOR REGIONAL DEVELOPMENT (OBJECTIVES 1 AND 2) - WORK PACKAGE 5B: ENVIRONMENT AND CLIMATE CHANGE ADE
Waste Prevention and Management of waste Case Study - Catalonia - October 2009 Page 29
Site visit 2 : Consell Comarcal del Baix Camp General information The Consell Comarcal del Baix Camp is a supra-local authority (comarca) composed of 28 municipalities in the area of Reus. For waste Management, a specific organisation has been created by the Consell Comarcal, the “Consorcio de Gestión de residuos del Baix Camp” Population: hab. Production of municipal waste: 53.596 tons in 2008 Selective collection: 17.013 tons in 2008 In relation with waste management, the Consorcio provides the following services: construction and exploitation of municipal waste treatment installations development and support of the selective collection disposal authorizations and collection of waste taxes The Consorci manages (through a subsidiary structure named SECOMSA): 1 transfer centre 1 composting plant 1 civic amenity centre ERDF intervention regarding waste management Project 1430 Object : Improvement of the treatment of the organic fraction of municipal waste Budget: 460.000 € ERDF : 230.000 € Period: 2004-2005 The intervention consisted in optimising the pre-treatment lines of the composting plant by simplifying the process lines and by creating a double line for the refining step, one for the selectively collected organic waste and the other for food waste (professional origin) and sewage sludge. The total investment was finally 1.046.274,20 €, of which around 25 % (projects 1430 and 1791) were funded by ERDF. Project 460 Object : Improvement of municipal waste collection Budget: 240.404,84 € ERDF : 120.202,84 € Period: 2000-2001 This project helped buying new collection trucks for selective collection for a population of 60.000 inhabitants. The investment amounted 570.961 €, the rest was financed by the Infrastructures Fund.

EX-POST EVALUATION OF COHESION POLICY PROGRAMMES 2000-2006 CO-FINANCED BY THE EUROPEAN FUND FOR REGIONAL DEVELOPMENT (OBJECTIVES 1 AND 2) - WORK PACKAGE 5B: ENVIRONMENT AND CLIMATE CHANGE ADE
Waste Prevention and Management of waste Case Study - Catalonia - October 2009 Page 30
Project 1791 Object : Improvement of the composting plant Budget: 60.000 € ERDF : 30.000 € Period: 2006 Is directly linked with project 1430 and was aimed at funding a system for separating the water networks of the composting plant (rainwater and process water). Evaluation of ERDF intervention by the beneficiaries It is important to note that the ERDF interventions only represented 25 % of the total investment. The total investments have had an important impact on the waste management performances of the Comarca Baix Camp. The project 460 allowed to implement the selective collection at large scale: from 2004 to 2008 the collected quantities have increased from 7.874 t to 17.013 t, reaching now a 31,53 % of selective collection rate. The two other projects related to the composting plant allowed a capacity increase (from 30.000 to 37.000 tons/year) as well as an improvement in quality of the compost. For the Consorcio Baix Camp, ERDF has been an important source of funds during the period and it is remarkably integrated in a more global strategy for waste management. Comments regarding the administrative aspects of ERDF interventions Concerning the administrative process linked with the ERDF interventions, the following comments were made during the 2 visits: ERDF administrative processes require an elevated investment in time the authorities managing ERDF interventions or the direct beneficiaries hardly
understand the obligation of external controls and audits, they consider that, being public administrations having their own control procedures and legal obligations, they should be considered with more trust by the EC
the period of time for getting the funding is too long (2 years in this case)

Chapter 3 : Climate change case study reports


ADE s.a. Rue de Clairvaux, 40
B-1348 Louvain-la-Neuve Belgium
Tel.: +32 10 45 45 10 Fax: +32 10 45 40 99 E-mail: [email protected]
Web: www.ade.be
Ex post Evaluation of Cohesion Policy Programmes 2000-2006 Co-Financed by the European Fund for Regional Development (Objectives 1 and 2) – Work Package 5b: Environment and Climate Change CClliimmaattee CChhaannggee CCaassee SSttuuddyy CCzzeecchh RReeppuubblliicc
October 2009


TThhiiss rreeppoorrtt hhaass bbeeeenn pprreeppaarreedd bbyy AADDEE aatt tthhee rreeqquueesstt ooff tthhee EEuurrooppeeaann CCoommmmiissssiioonn..
TThhee vviieewwss eexxpprreesssseedd aarree tthhoossee ooff tthhee CCoonnssuullttaanntt aanndd ddoo nnoott rreepprreesseenntt tthhee ooffffiicciiaall vviieewwss ooff tthhee EEuurrooppeeaann CCoommmmiissssiioonn..
RReepprroodduuccttiioonn oorr ttrraannssllaattiioonn iiss ppeerrmmiitttteedd,, pprroovviiddeedd tthhaatt tthhee ssoouurrccee iiss dduullyy aacckknnoowwlleeddggeedd aanndd nnoo mmooddiiffiiccaattiioonnss ttoo tthhee tteexxtt aarree mmaaddee..


EX POST EVALUATION OF COHESION POLICY PROGRAMMES 2000-2006 CO-FINANCED BY THE EUROPEAN FUND FOR REGIONAL DEVELOPMENT (OBJECTIVES 1 AND 2) - WORK PACKAGE 5B: ENVIRONMENT AND CLIMATE CHANGE ADE
Climate Change Case Study –Czech Republic – October 2009 Table of Contents
Table of Contents
ACRONYMS
SUMMARY
1. STATUS AND FEATURES OF CLIMATE CHANGE ................................................... 1
1.1 PICTURE IN TERMS OF CLIMATE CHANGE ................................................................... 1 1.2 CHALLENGES IN TERMS OF CLIMATE CHANGE........................................................... 2 1.3 NATIONAL STRATEGY IN TERMS OF CLIMATE CHANGE ............................................ 2 1.4 INSTITUTIONAL FRAMEWORK FOR CLIMATE CHANGE ISSUES .................................. 3
2. LINK BETWEEN THE IEOP, CHALLENGES AND THE NATIONAL STRATEGY IN TERMS OF CLIMATE CHANGE ........................................................................ 5
3. ACHIEVEMENTS OF THE IEOP ......................................................................... 7
4. CONTRIBUTION OF THE IEOP TO REDUCING GHG EMISSIONS ....................... 9
4.1 EFFECTIVENESS OF THE ES AND RES PROJECTS SUPPORTED BY ERDF ............... 9 4.2 IMPACT OF ES AND RES PROJECTS SUPPORTED BY ERDF IN TERMS
OF GHG EMISSION REDUCTION ................................................................................ 10 4.3 EFFICIENCY OF ES AND RES PROJECTS SUPPORTED BY ERDF ............................ 11 4.4 PROFITABILITY OF ES AND RES PROJECTS SUPPORTED BY ERDF ...................... 12
5. CONTRIBUTION OF THE IEOP TO SOCIO-ECONOMIC DEVELOPMENT ........... 15
6. MANAGEMENT OF ES AND RES PROJECTS SUPPORTED BY ERDF .................. 17
7. METHOD TO ASSESS THE CONTRIBUTION OF ES AND RES PROJECT SUPPORTED BY ERDF TO REDUCING GHG EMISSIONS .................................. 19
8. EVOLUTION TO THE 2007-2013 PROGRAMMING PERIOD ................................. 21

EX POST EVALUATION OF COHESION POLICY PROGRAMMES 2000-2006 CO-FINANCED BY THE EUROPEAN FUND FOR REGIONAL DEVELOPMENT (OBJECTIVES 1 AND 2) - WORK PACKAGE 5B: ENVIRONMENT AND CLIMATE CHANGE ADE
Climate Change Case Study –Czech Republic – October 2009 Table of Contents
LIST OF TABLES
TABLE 1: GHG EMISSIONS IN THE CZECH REPUBLIC ............................................................. 1 TABLE 2: RENEWABLE ENERGY SOURCES AND ENERGY INTENSITY IN THE CZECH
REPUBLIC ....................................................................................................................... 1 TABLE 3: BUDGET ALLOCATION OF THE 2004-2006 IEOP DEVOTED TO CLIMATE
CHANGE ISSUES ............................................................................................................. 8 TABLE 4: NUMBER OF PROJECTS AND BUDGET FOR BOTH SUB-PROGRAMMES (ES AND
RES) OF THE 2004-2006 IEOP............................................................................................. 8
TABLE 5: TARGET AND ACHIEVED VALUES FOR PROJECTS IMPLEMENTED UNDER ES AND RES SUB-PROGRAMMES ...................................................................................... 9
TABLE 6: ASSESSED IMPACTS OF BOTH SUB-PROGRAMMES (ES AND RES) OF THE
2004-2006 EIOP IN TERMS OF CLIMATE CHANGE ............................................... 10 TABLE 7: ASSESSMENT OF THE EFFICIENCY OF BOTH ES AND RES SUB-PROGRAMMES .. 12 TABLE 8: INTERNAL RATE OF RETURN OF CZECH PROJECTS UNDER THE 2004-2006
IEOP ............................................................................................................................ 13 TABLE 9: GROSS NUMBER OF JOBS CREATED DUE TO PROJECTS CO-FINANCED UNDER
THE ES AND RES SUBPROGRAMMES ....................................................................... 15 TABLE 10: CO2 EQUIVALENT EMISSION FACTORS FOR POWER GENERATION IN
THE CZECH REPUBLIC .............................................................................................. 19 LIST OF FIGURES
FIGURE 1: THE INSTITUTIONAL FRAMEWORK FOR THE CLIMATE CHANGE POLICY IN THE
CZECH REPUBLIC ......................................................................................................... 4

EX POST EVALUATION OF COHESION POLICY PROGRAMMES 2000-2006 CO-FINANCED BY THE EUROPEAN FUND FOR REGIONAL DEVELOPMENT (OBJECTIVES 1 AND 2) - WORK PACKAGE 5B: ENVIRONMENT AND CLIMATE CHANGE ADE
Climate Change Case Study –Czech Republic – October 2009 Acronyms
Acronyms
CEA Czech Energy Agency
CENIA Czech Environmental Information Agency
CO2 Carbon dioxide
Coll. Collection of legal acts in the Czech Republic
CSF Community Support Framework
CZK Czech currency (Kc)
DG Regio Directorate-General Regional Policy
EEA European Environmental Agency
ES Energy saving
ETS Emission Trading Scheme
ERDF European Fund for Regional Development
EU European Union
Eq. Equivalent
GHG Greenhouse Gas
GJ Gigajoule
IEOP Industry and Enterprise Operational Programme
kgoe Kilogramme of oil equivalent
kWh Kilowatt hour
MJ Megajoule
MS Member State
Mt Megaton
MW Megawatt
MWh Megawatt hour
n.a. Not available
NAP National Allocation Plan
NDP National Development Plan
NEP National Environmental Programme
OP Operational Programme
OPBI Operational Programme Basic Infrastructure
PES Primary energy sources
ppm Parts per million
RES Renewable energy sources
SME Small and Medium Enterprise
t ton
UN FCCC United Nations Framework Convention on Climate Change
WP Work Package


EX POST EVALUATION OF COHESION POLICY PROGRAMMES 2000-2006 CO-FINANCED BY THE EUROPEAN FUND FOR REGIONAL DEVELOPMENT (OBJECTIVES 1 AND 2) - WORK PACKAGE 5B: ENVIRONMENT AND CLIMATE CHANGE ADE
Climate Change Case Study –Czech Republic – October 2009 Summary
Summary – Key messages of the case study in the Czech Republic
Status and features of climate change in the Czech Republic: - While the Czech Republic has no problem with the need to comply with the Kyoto
Protocol by 2012, its level of GHG emissions per capita was approximately 30% higher than the EU-27 average in 2005. The Czech economy consumes little energy from renewable sources (1.5% in 2000). In 2004, the Czech energy intensity was over four times higher than the EU-25 average energy intensity.
- In 2004, the Czech Government developed several programmes and instruments through different legislation and strategy papers, such as the 2004-2010 State Environmental Policy to combat climate change. Goals pursued by the Czech strategy in terms of climate change were to achieve a 6% share of renewable energy sources in total primary energy sources and at least an 8% share of renewable electricity in gross electricity consumption by 2010.
Intervention strategy for Structural Funds: - The ERDF supported two sub-programmes – energy savings and renewable energy
sources – for a total budget of €23.1m. These sub-programmes supported SMEs investing in a variety of activities leading to a reduction in energy consumption as well as in developing green capacity for heating and electricity production.
- The rationale for supporting SMEs was mainly based on the assumptions that green investment could be too costly for SMEs and that energy savings and development of renewable energy were typically not a priority for profit-oriented manufacturing companies.
- Most subsidies were given to innovative projects such as reconstruction of small hydropower plants, construction of photovoltaic power plants, windmill power plants, biogas stations, heat pumps, biomass power plants as well as power plants using landfill gases.
Contribution of the co-funded interventions: - Projects co-funded by the ERDF in the field of energy savings (ES) and renewable
energy sources (RES) resulted in the avoidance of around 183 kt of CO2 equivalent. This amount is equivalent to 0.13% of the total 2004 GHG emissions produced by the Czech Republic and it is thus not significant per se at macroeconomic level.
- In terms of socio-economic development, projects co-funded by the ERDF in energy savings and renewable energy sources allowed the creation of around 93 direct gross full-time jobs. In addition, the improvement in energy efficiency due to the co-funded projects allowed a reduction in energy costs for enterprises. Co-funded projects also contributed to generating increased demand for goods and services in the country.
Management of climate-friendly interventions: - The selection procedure included an independent ex ante energy audit to assess the
contribution of the project to be co-financed to reducing GHG emissions. The profitability of the projects to be co-funded is not used before selecting them. Information about the profitability including the public intervention is however

EX POST EVALUATION OF COHESION POLICY PROGRAMMES 2000-2006 CO-FINANCED BY THE EUROPEAN FUND FOR REGIONAL DEVELOPMENT (OBJECTIVES 1 AND 2) - WORK PACKAGE 5B: ENVIRONMENT AND CLIMATE CHANGE ADE
Climate Change Case Study –Czech Republic – October 2009 Summary
available. - The monitoring of ES and RES projects include financial and other administrative
information, but also the amount of energy savings generated or the renewable energy sources created or renewed as well as jobs created due to the project.
Method to assess GHG emission reduction: Based on information from the ex ante energy audit and the monitoring system, the Czech Energy Agency compared the assessed amount of GHG emissions avoided to a business-as-usual scenario. The Agency uses a coefficient defined by the Czech Regulation (1.17 t CO2 eq./MWh) to estimate the GHG emissions avoided (expressed in CO2 equivalent). This coefficient takes into account the share of each different source of energy in the Czech Republic.

EX POST EVALUATION OF COHESION POLICY PROGRAMMES 2000-2006 CO-FINANCED BY THE EUROPEAN FUND FOR REGIONAL DEVELOPMENT (OBJECTIVES 1 AND 2) - WORK PACKAGE 5B: ENVIRONMENT AND CLIMATE CHANGE ADE
Climate Change Case Study –Czech Republic – October 2009 Page 1
1. Status and features of climate change
1.1 Picture in terms of climate change As shown in table 1 below, the total annual amount of GHG emissions in the Czech Republic was stable from 1995 up to 2005. However the level increased by 8% between 2005 and 2007.
In 2005 the level of GHG emissions per capita was approximately 30% higher than the EU-27 average (13.66 t CO2 eq. / capita compared to 10.4 t CO2 eq. / capita). This level of GHG emissions per capita is among the highest in Europe (Report on the Environment of the Czech Republic 2007, CENIA and the Ministry of Environment, 2008). However, the average annual growth in GDP over the period 2000-2007 was 4.4% while the annual GHG emission growth over the same period was less than 1%.
Table 1: GHG emissions in the Czech Republic Item 1990 1995 2000 2001 2002 2003 2004 2005 2006 2007CO2 (Mt) 163.9 131.1 126.8 128.3 124.6 125.9 126.6 125.9 127.9 133.7GHG (Mt CO2 eq.)
190.3 145.4 139.6 141.4 137.3 139.7 140.6 139.3 144.8 150.0
GHG per capita (t CO2 eq./ capita)
n.a. n.a. 13.55 13.86 13.46 13.70 13.78 13.66 14.06 14.56
Trend (100 = 1990)
100 76.4 73.4 74.3 72.1 73.4 73.9 73.2 76.1 78.8
NB: data for 2007 are preliminary estimates Source: Czech Hydrometeorology Institute, 2008.
The Czech economy consumes little energy from renewable sources. As shown in Table 2 below, the share of renewable energy sources (RES) in the total national primary energy sources in 2000 was 1.5% but had increased to 4.3% by 2007. Coal represents a high share of total primary energy sources (PES): 49 % of total primary energy sources against 45 % in 2007.
The Czech Republic has no problem with the need to comply with the Kyoto Protocol by 2012. Czech GHG emissions in 1990 were 190.3 mt CO2 eq. whereas in 2007 the figure was 150 mt CO2 eq. Compared to 1990 GHG emissions had decreased by more than 20% by 2004 while the EU target is an 8% decrease in GHG emissions by 2012.
Table 2: Renewable energy sources and energy intensity in the Czech Republic
Item 2000 2001 2002 2003 2004 2005 2006 2007Share of renewable energy in primary energy consumption (%)
1.5 1.7 2.1 3.4 4.0 4.1 4.2 4.3
Share of renewable electricity in total electricity consumption (%)
2.7 3.6 4.0 4.6 4.0 4.5 4.9 4.7
Energy intensity (kgoe per 1000 €) 890.2 890.5 884.7 926.9 892.4 828.5 794.84 n.a.
Sources: European Environment Agency (EEA), Eurostat, Ministry of Industry and Trade, State of the Environment reports, Report on completion of indicative goal of energy production from RES (MoIT, ERU, 2006, 2007)

EX POST EVALUATION OF COHESION POLICY PROGRAMMES 2000-2006 CO-FINANCED BY THE EUROPEAN FUND FOR REGIONAL DEVELOPMENT (OBJECTIVES 1 AND 2) - WORK PACKAGE 5B: ENVIRONMENT AND CLIMATE CHANGE ADE
Climate Change Case Study –Czech Republic – October 2009 Page 2
Support to green electricity production was codified by the special Act No 180/2005 Coll. focusing on support for the use of RES. The State Environment Policy target is 6% of PES consumed through RES by 2010. However, the share of RES in gross domestic electricity consumption decreased from 4.9% in 2006 to 4.7% in 2007. In addition, a significant feature of the Czech economy is its high energy intensity. In 2004, the Czech energy intensity (equal to 892.4 kgoe per 1000 €) was over four times as high as the EU-25 average energy intensity (equal to 188.7 kgoe per 1000 €), while in 2007 this indicator was still more than three times the EU-25 average.
1.2 Challenges in terms of climate change The main environmental challenges in the Czech Republic during the programming period 2004-2006 are the following:
reduction of GHG emissions per capita ;
reduction of energy demand for production;
increase of the share of RES in energy consumption.
According to the 2004-2010 State Environmental Policy strategic document, by 2020 the Czech Republic should decrease its annual GHG emissions per inhabitant to the 2000 EU average level, i.e. 8.7 t CO2 eq./ capita. In 2004 the actual figure was 13.55 t CO2 eq. / capita.
In compliance with the EC Directive 2001/77/EC, the share of electricity generation from RES in the Czech Republic should increase to 8% by 2010. The actual figure at the beginning of the programming period (2004) was 4%.
1.3 National strategy in terms of climate change During the 2004-2006 programming period the Czech Republic acted as an integrated entity in terms of strategy and implementation of projects under the Objectives 1 and 2 programmes. In other words, the national policy, legislation and managing authorities are the same for all the Czech regions.
Environmental priorities for the Czech Republic up to 2010 were set by the 2004-2010 State Environmental Policy, the basic environmental policy document at national level1. The State Environmental Policy was approved by the Czech Government on 17 March 2004 (Resolution No 235/2004). One of its four priority areas is the Protection of the climate system of the Earth and prevention of long-range transport of air pollution.
In terms of climate change, there are two quantitative targets set in the State Environmental Policy of the Czech Republic:
Achieving a 6% share of RES in total PES by 2010 ;
Achieving at least a 8% share of renewable electricity in gross electricity consumption by 2010.
1 This document is now under revision.

EX POST EVALUATION OF COHESION POLICY PROGRAMMES 2000-2006 CO-FINANCED BY THE EUROPEAN FUND FOR REGIONAL DEVELOPMENT (OBJECTIVES 1 AND 2) - WORK PACKAGE 5B: ENVIRONMENT AND CLIMATE CHANGE ADE
Climate Change Case Study –Czech Republic – October 2009 Page 3
At policy level, the following national or regional strategies in the Czech Republic directly related to climate change are, or were, in place:
Strategy of the Czech Republic for the Protection of the Climate Change (1999) ;
National Programme to Abate the Climate Change Impacts in the Czech Republic (2004);
State Energy Policy, 2004 (under revision);
National Programme for the Support of Renewable Energy and Energy Savings (2002-2005, 2006-2009) supplemented by the State Programme for the Support of Renewable Energy and Energy Savings (updated each year annual).
All the above policies and programmes have included targets in the fields both of improved energy efficiency and of increased use of RES. They also have proposed a series of instruments to achieve these targets; mainly command-and-control and economic instruments. In the field of green electricity, examples of such instruments are: guaranteed prior access to grid; guaranteed revenue per unit of production for 15 years in the case of new installations ; choice between two supporting schemes (fixed feed-in tariff or premium green bonus), support to « in-house » consumed renewable electricity; guaranteed purchase price level for 15 years in the case of existing installations ; annual decrease in the purchase price (not higher than 5% in the case of new
installations).
1.4 Institutional framework for climate change issues
The institutional framework for climate change issues in the Czech Republic is set by relevant legislation. In accordance with the 1999 Strategy of the Czech Republic for the Protection against Climate Change, the main role in climate change issues is assigned to the Ministry of Environment. In addition, an important role is given to the Ministry of Industry and Trade, while minor roles are assigned to the Ministry of Transport and the Ministry of Agriculture.
Co-ordination of activities and measures implemented by particular ministries and other bodies is given by the 2004 National Programme to Abate the Climate Change Impacts in the Czech Republic. This programme was assessed in 2007 by the Ministry of Environment and lessons learnt from the assessment have been taken into account in the new set of programme activities and measures. According to the reviewed programme, the roles of the ministries are described in figure 1 hereafter.

EX POST EVALUATION OF COHESION POLICY PROGRAMMES 2000-2006 CO-FINANCED BY THE EUROPEAN FUND FOR REGIONAL DEVELOPMENT (OBJECTIVES 1 AND 2) - WORK PACKAGE 5B: ENVIRONMENT AND CLIMATE CHANGE ADE
Climate Change Case Study –Czech Republic – October 2009 Page 4
Figure 1: The institutional framework for the climate change policy in the Czech Republic
The Ministry of Environment
•Responsible for the implementation of the requirements of the UNFCCC and the Kyoto Protocol;
•Responsible for the implementation of EU ETS (CO2 emission trading scheme) in the Czech Republic; National Allocation Plans (NAP) for the distribution of emission allowances in cooperation with the Ministry of Industry and Trade;
•Responsible for the preparation of GHG emission inventories and projections, for the preparation of the National GHG Inventory Reports (NIRs) and the National Communications for the UN FCCC secretariat (in close cooperation with the Czech Hydro‐meteorological Institute);
•Responsible for the implementation of the 2004‐2006 Infrastructure Operational Programme co‐financed by ERDF (in close cooperation with the Ministry of Transport);
•Responsible for the implementation of the 2007‐2013 Environment Operational Programme co‐financed by ERDF, Including support to projects aiming at reducing GHG emissions (State Environmental Fund of the Czech Republic).
Climate change policy
The Ministry of Industry and Trade
•Responsible for the energy policy of the Czech Republic (including energy efficiency and development of renewable energy);
•Responsible for the implementation of the requirements in the field of renewable energy;
•Responsible for the implementation of the 2004‐2006 Industry and Enterprise Operational Programme co‐financed by ERDF;
•Responsible for the implementation of the 2007‐2013 Enterprise and Innovation OP co‐financed by ERDF; this programme facilitates support for projects in the field of energy efficiency and renewable energy (in close cooperation with Czech Invest and the Czech‐Moravian Guarantee and Development Bank).
The Ministry of Transport
•Responsible for the transport policy of the Czech Republic (including support to the “climate‐friendly”transport modes)
•Responsible for the implementation of the 2004‐2006 Infrastructure Operational Programme co‐financed by ERDF (in close cooperation with the Ministry of Environment);
•Responsible for the implementation of the 2007‐2013 Transport Operational Programme , which facilitates support for projects leading to the reduction of GHG emissions (in close cooperation with the State Transport Infrastructure Development Fund).
The Ministry of Agriculture
•Responsible for the agricultural policy of the Czech Republic (including support to the use of biomass for energy purposes)
•Responsible for the implementation of the 2007‐2013 Rural Development Plan (RDP), which enables to support projects focused on the use of biomass (in close cooperation with the State Agricultural Intervention Fund).

EX POST EVALUATION OF COHESION POLICY PROGRAMMES 2000-2006 CO-FINANCED BY THE EUROPEAN FUND FOR REGIONAL DEVELOPMENT (OBJECTIVES 1 AND 2) - WORK PACKAGE 5B: ENVIRONMENT AND CLIMATE CHANGE
Climate Change Case Study –Czech Republic – October 2009 Page 5
2. Link between the IEOP, challenges and the national strategy in terms of climate change
As detailed above, there have been three main challenges in terms of climate change in the Czech Republic: 1) reduction in specific GHG emissions; 2) reduction in energy demand for production, 3) increase in the share of RES in energy consumption. To address these challenges, the Czech government has developed several programmes and instruments through different legislation and strategy papers, such as State Environmental Policy.
Part of the 2004-2006 IEOP was designed to play a role in implementation of the national strategy to fight climate change and thereby be complementary to the national supporting programmes and instruments in this field. At the EU level, interventions are complementary to instruments such as the Emission Trading System (ETS) covering large business companies.
More specifically, co-funded interventions in the field of energy savings and renewable energy sources had to support SMEs investing in a variety of activities leading to reduction in energy consumption as well as in developing green capacity for heating and electricity production. Most subsidies were given to innovative projects such as reconstruction of small hydropower plants, construction of photovoltaic power plants, windmill power plants, biogas stations, heat pumps, biomass power plants as well as power plants using landfill gases. These co-funded interventions then contributed directly or indirectly to addressing the three main challenges faced by the Czech Republic in terms of climate change.


EX POST EVALUATION OF COHESION POLICY PROGRAMMES 2000-2006 CO-FINANCED BY THE EUROPEAN FUND FOR REGIONAL DEVELOPMENT (OBJECTIVES 1 AND 2) - WORK PACKAGE 5B: ENVIRONMENT AND CLIMATE CHANGE
Climate Change Case Study –Czech Republic – October 2009 Page 7
3. Achievements of the IEOP
The IEOP interventions were mainly concentrated on industrial research and development, technical infrastructures for enterprise, better credit disposability to SMEs, infrastructures for human resources development, business-related services development, energy savings in the industry sector and renewable sources of energy. The total budget of the 2004-2006 IEOP (all fields of interventions included) was equal to €347.8m, including an ERDF support equal to €260.9m2.
Under this programme, two sub-programmes were implemented to contribute to GHG emission reduction. These sub-programmes are:
the sub-programme Energy Savings (ES), under which the following activities were allowed: - reduction of energy intensity in the energy production, conversion and
distribution; - new technologies for energy source processes leading to higher energy yields; - new electricity and heat generation equipment; - reduction of energy losses; - use of thermal waste and secondary energy sources; - co-generation of heat and electricity; - introduction of energy saving production technologies; - more effective processes for distributing energy (production and logistics), as well
as improvement in the thermal properties of buildings used for production.
the sub-programme Renewable Energy Sources (RES), under which the following activities were allowed: - construction, renewal or reconstruction of equipment using RES; - introduction of low-energy-intensity production technologies and equipment
using RES; - co-generation of heat and electricity using RES.
According to EC Regulation 70/2001 the maximum subsidies by project would be 46% of the eligible costs. In addition, the minimum budget allocated to a project is CZK 0.5m (around €0.02m) and the maximum budget is CZK 30m (around €1.1m). Eligible costs were project investment costs under both sub-programmes from 1 July 2004 and with respect to the IEOP rules (75% paid by ERDF and 25% by national budget).
Due to absorption capacity issues during the implementation of the IEOP, the total budget was reduced from €34.8 m to €30.7m and reallocated between sub-programmes. Finally, ES and RES sub-programmes only accounted for 8.8% of the global budget of the IEOP. Budget changes and reallocation are given in Table 3 hereafter.
2 Communication of the Ministry of Industry and Trade (2009), based on information from the IEOP and the
Programme complement approved by DG Regional Policy.

EX POST EVALUATION OF COHESION POLICY PROGRAMMES 2000-2006 CO-FINANCED BY THE EUROPEAN FUND FOR REGIONAL DEVELOPMENT (OBJECTIVES 1 AND 2) - WORK PACKAGE 5B: ENVIRONMENT AND CLIMATE CHANGE
Climate Change Case Study –Czech Republic – October 2009 Page 8
Table 3: Budget allocation of the 2004-2006 IEOP devoted to climate change issues
Sub-programme Budget allocation in May 2004 Budget allocation in November 2008
ERDF (€m)
National funds (€m)
Total (€m)
ERDF (€m)
National funds (€m)
Total (€m)
Energy savings (ES)
13.0 4.3 17.4 3.2 1.1 4.2
Renewable energy sources (RES)
13.0 4.3 17.4 19.9 6.6 26.5
Total 26.1 8.7 34.8 23.1 7.7 30.7
Source: the Ministry of Industry and Trade (MIT), Structural Funds Section, January 2009
Subsidies were only given to SMEs which need to make considerable new investments. Co-financed interventions under the IEOP have partly covered these investments as the Czech SMEs do not have sufficient financial means and often have difficulty in obtaining access to credit loans for such investment processes.
Following a step-by-step selection procedure, 35 projects (out of 47 applications) have been approved in the energy savings (ES) sub-programme, to a total of CZK 113 m (€4.2m). In the sub-programme Renewable Energy Sources (RES), 63 projects (out of 153 applications) were approved during the same period, to a total of CZK 698 m (€26.5m). More detailed information on applications, grants and payments for both sub-programmes are given in Table 4 hereafter.
Table 4: Number of projects and budget for both sub-programmes (ES and RES) of the 2004-2006 IEOP
Source: the Ministry of Industry and Trade (MIT), Structural Funds Section, January 2009
Programme Allocation
Applications Granted projetcs Paid to beneficiairesNb. of
projects Amount (CZK m)
Nb. of projects
Amount (CZK m)
Nb. of projects
Amount (CZK m)
Energy savings 47 197.0 35 113.0 35 111.7
Renewable energysources 153 2,554.2 63 698.1 63 684.0

EX POST EVALUATION OF COHESION POLICY PROGRAMMES 2000-2006 CO-FINANCED BY THE EUROPEAN FUND FOR REGIONAL DEVELOPMENT (OBJECTIVES 1 AND 2) - WORK PACKAGE 5B: ENVIRONMENT AND CLIMATE CHANGE
Climate Change Case Study –Czech Republic – October 2009 Page 9
4. Contribution of the IEOP to reducing GHG emissions
While discussing the contribution of the IEOP to reducing GHG emissions, it should be kept in mind that the global objective of the IEOP was to support the competitiveness of Czech enterprises, especially SMEs. Consequently, only 8.8% of the total budget of the IEOP (i.e. € 30.7 m) was devoted to ES and RES sub-programmes. It should also be noted that the programming period in the Czech Republic was shorter than the standard 2000-2006 programming period.
4.1 Effectiveness of the ES and RES projects supported by ERDF
Table 5 hereafter shows both target and achieved values from indicators monitored during the 2004-2006 programming period. The values achieved cover all projects which produced results up to the end of 2008.
Table 5: Target and achieved values for projects implemented under ES and RES sub-programmes
Indicator UnitTarget value (2009-2012)
Achieved value (2009)
Fulfilment (%)
Sub-programme Energy savings (ES): 35 granted projectsHeating energy saved GJ 153,178 147,449 96%Electricity saved GJ 364,016 198,560 55%Heating energy generated (using RES) MWh 1,004 3,610 360%Electricity generated (using RES) MWh 526 400 76%Sub-programme Renewable energy sources (RES) : 63 granted projects Installed power (electricity) MW 38.12 37.41 98%Installed power (heating) MW 7.74 8.23 106%Electricity generated (using RES) MWh 118,781 69,162 58%Heating energy generated (using RES) GJ 146,887 102,031 69%
Source: the Ministry of Industry and Trade (MIT), Structural Funds Section, June 2009 While the budget of the sub-programme ES was reduced by 75%, the target for electricity saved using RES was largely exceeded at the end of 2008. However the targets for energy savings through supported heating projects (with or without RES) and for electricity generated using RES have not yet been achieved.
According to the indicators monitored under the RES sub-programme, the target value for supported installed heating capacity was exceeded while the capacity of supported installed electricity power generation almost reached the 2008 target value. The results obtained for the RES sub-programme in terms of installed capacity may be explained by the fact that 16 of the 63 projects supported focused on renewal of small hydro-power plants where installed capacity existed prior to the ERDF interventions. Another reason is that its initial

EX POST EVALUATION OF COHESION POLICY PROGRAMMES 2000-2006 CO-FINANCED BY THE EUROPEAN FUND FOR REGIONAL DEVELOPMENT (OBJECTIVES 1 AND 2) - WORK PACKAGE 5B: ENVIRONMENT AND CLIMATE CHANGE
Climate Change Case Study –Czech Republic – October 2009 Page 10
budget was boosted (+50%) during the programming period, reflecting the account taken of the higher demand for projects under the RES sub-programme vis-à-vis projects under the ES sub-programme.
In addition, it should be noted that the projects supported in energy savings as well as in installed capacity (electricity or heating) had still not yielded their full potential by the end of 2008. Therefore they have not yet contributed to GHG emission abatement to the extent expected by the ex ante energy audits.
Taking into account the above-mentioned conditions and the relatively low budget invested in energy savings and renewable energy sources through the IEOP, the results obtained from the interventions in the fields of ES and RES can be considered satisfactory. All co-funded projects which invested in green infrastructures were implemented before 31 August 2008 and have started to save energy or to produce green energy since becoming operational. In other words, still higher GHG emission reductions can be expected from 2009 onwards.
4.2 Impact of ES and RES projects supported by ERDF in terms of GHG emission reduction
Based on data provided by project energy audits the Czech Energy Agency estimated that the 98 projects supported by ERDF during the 2004-2006 period allowed avoiding a total amount of 182.6 kt CO2 eq. (cf. Table 6 below). This amount is equivalent to just 0.13% of the 2004 total of GHG emissions produced by the Czech Republic. In other words, the contribution of these projects to the reduction of GHG emissions at a macroeconomic level per se is not significant.
Table 6: Assessed impacts of both sub-programmes (ES and RES) of the 2004-2006 EIOP in terms of Climate Change
Sub-programme Estimated GHG emission avoided by year (kt CO2 eq.)
Energy savings (ES) 18.8Renewable energy sources (RES) 163.8Total 182.6
Source: Czech Energy Agency, 2006

EX POST EVALUATION OF COHESION POLICY PROGRAMMES 2000-2006 CO-FINANCED BY THE EUROPEAN FUND FOR REGIONAL DEVELOPMENT (OBJECTIVES 1 AND 2) - WORK PACKAGE 5B: ENVIRONMENT AND CLIMATE CHANGE
Climate Change Case Study –Czech Republic – October 2009 Page 11
4.3 Efficiency of ES and RES projects supported by ERDF
Benchmarks are needed to assess the efficiency of projects or policy aiming at reducing GHG emissions. These benchmarks can be identified through two main sources: the market price of the EU ETS market3 and the literature review.
The marginal abatement cost represents the cost of reducing one more ton of GHGs. It also represents the cost of buying one emission permit in the carbon market, if that ton was not reduced. A first benchmark is thus the market price in the EU ETS market. The EU allowance spot price is currently around 12 € (phase II of the EU ETS market: the 2008-2012 period) while the ongoing economic crisis (2008/2009) pushes this price down. Without the economic crisis this price should be about 25 €. Expected prices for phase III (post-Kyoto: after the 2008-2012 period) is about 30 €.
Some studies have tried to provide the fundamental carbon price, when EU ETS prices are subject to market volatility. The robustness of these studies is questionable4 and the range they provide is generally quite large: Elzen et al. (2007)5 give a marginal abatement cost associated to the EU reduction
objectives between 23 € and 93 € (2005)/t CO2 ; Kuik et al. (2009)6 assesses that the marginal abatement cost for a 500 ppm target in
2025 is between 37 € and 119 € (2005)/t CO2.
Assessing the efficiency of ES and RES sub-programmes with precision is not possible due to the lack of information about total costs (eligible and non eligible costs) of implemented projects. The assessment of the efficiency is then based on the total eligible costs of both ES and RES sub-programmes. Table 7 hereafter shows information used to assess the cost of reducing one ton of GHG and obtained results for both ES and RES sub-programmes.
3 The European Union Emission Trading System (EU ETS) is a major pillar of EU climate policy. The ETS currently
covers more than 10,000 installations in the energy and industrial sectors which are collectively responsible for close to half of the EU's emissions of CO2 and 40% of its total greenhouse gas emissions.
4 The macroeconomic valuations of marginal abatement costs of carbon strongly depend on (i) the methodology used, (ii) the underlying assumptions (on fuel prices, economic growth, time horizon, etc.), (iii) the emission reduction target (or concentration target). In particular, the stringer the reduction target, the higher the marginal abatement cost. Also, the longer the time horizon, the higher the abatement cost.
5 Elzen M.G.J., Lucas P.L., Gijsen A. (2007), « Exploring European Countries’ Emission Reduction Targets, Abatement Costs and Measures Needed Under the 2007 EU Reduction Objectives », Netherlands Environmental Assessment Agency (MNP).
6 Kuik O., Brander L., R.S.J. Tol (2009), « Marginal abatement costs of greenhouse gas emissions: A meta-analysis », Energy Policy 37(4).

EX POST EVALUATION OF COHESION POLICY PROGRAMMES 2000-2006 CO-FINANCED BY THE EUROPEAN FUND FOR REGIONAL DEVELOPMENT (OBJECTIVES 1 AND 2) - WORK PACKAGE 5B: ENVIRONMENT AND CLIMATE CHANGE
Climate Change Case Study –Czech Republic – October 2009 Page 12
Table 7: Assessment of the efficiency of both ES and RES sub-programmes
Item ES sub-programme
RES sub-programme
Estimated GHG avoided (kt CO2 eq.) 18.8 163.8
Average support share (%) of total eligible costs 34.5% 35.4%
Total financial support paid to beneficiaries (€ m) 4.2 26.5
Estimated total eligible costs (€ m) 12.2 74.9 Cost of reducing a ton of GHG with a time horizon of 15 years 43.3 30.5
Cost of reducing a ton of GHG with a time horizon of 10 years 64.9 45.7
Source: ADE 2009 based on information from Czech Energy Agency and Czech management authorities. For a time horizon equal to 15 years (from 2006 to 2020) or 10 years (from 2006 to 2015), the comparison between obtained results for ES and RES sub-programmes with above-mentioned benchmarks shows that costs of reducing one ton of GHG through ES and RES projects are comparable to the range of fundamental carbon prices provided in the literature review. However, all these costs of GHG abatement are higher than the spot price on the EU ETS market.
These observations suggest that the improvement of efficiency of such interventions remains a challenge. Consequently modalities of public support play an important role to improve this efficiency.
4.4 Profitability of ES and RES projects supported by ERDF
The profitability is the ability to generate net income. If a specific intervention generates a net income for an enterprise, this enterprise can decide to invest (part of) its capital to carry out this specific intervention. On the contrary, an unprofitable intervention will not attract an enterprise to invest. Public funds can then contribute to remove barriers to private investments, especially when the intervention generates a social benefit (for example, reducing GHG emissions).
The profitability of a project for an enterprise can be measured by the internal rate of return (IRR)7. In the particular case of RES, the IRR should be calculated for all types of RES (biomass, photovoltaic, wind, hydro-plant, biogas, landfill gas, etc.). This calculation should take into consideration all the characteristics and specificities of the location (country, region, climatic conditions, etc.) of the possible project – for example, the solar duration in the case of a solar energy project.
7 A project is a good investment proposition for an enterprise if its IRR is greater than the rate of return that could be
earned by alternate investments of equal risk (for example, investing in other projects or putting the money in a bank account). The IRR should then be compared to any alternate costs of capital including an appropriate risk premium. if the IRR is greater than the project's cost of capital, or hurdle rate, the project will add value for the company.

EX POST EVALUATION OF COHESION POLICY PROGRAMMES 2000-2006 CO-FINANCED BY THE EUROPEAN FUND FOR REGIONAL DEVELOPMENT (OBJECTIVES 1 AND 2) - WORK PACKAGE 5B: ENVIRONMENT AND CLIMATE CHANGE
Climate Change Case Study –Czech Republic – October 2009 Page 13
Table 8 hereafter shows the IRR of all types of RES projects supported by ERDF during the 2004-2006 period, as well as average IRR for both ES and RES sub-programmes. These parameters have been calculated by Czech Energy Agency taken into account the support provided by ERDF through the 2004-2006 IEOP. However, the IRR of each type of project without ERDF support and assumptions of the IRR calculation have not been communicated to the evaluator. This constitutes an important limit to the discussion of the profitability of ES and RES projects.
Table 8: Internal rate of return of Czech projects under the 2004-2006 IEOP
Type of ES/RES IRR (%) without ERDF support
IRR (%), with ERDF support
Small Hydro Plant (new) n.c. 6.8 Small Hydro Plant (renovated) n.c. 20.51 Wind n.c. 8.93 Biomass n.c. 21.42 Biogas n.c. 15.1 Landfill gas n.c. 12.06 Photovoltaic n.c. 2.48 Heat pump n.c. 2.55 ES sub-programme (35 projects) n.c. 9.89 RES sub-programme (63 projects) n.c. 12.24
NB: “n.c.” = not communicated by Czech authorities. Source: Czech Energy Agency, 2008.
The question of the most appropriate ERDF allocation to climate-friendly interventions in terms of profitability is quite complex. The profitability of ES and RES projects should be determined through the IRR calculated for each type of ES and RES without any external support. The rationale of the support ES and RES can vary depending on the level of this rate whatever the type of ES and RES: If the IRR without any external support is positive, the rationale of the ERDF
intervention is to provide incentives to enterprises to invest in climate-friendly technologies. In addition, ERDF intervention should consolidate the robustness of the private investment vis-à-vis the market volatility of GHG-intensive production patterns (e.g. fossil fuels). In the case of ERDF interventions while the IRR is positive, the risk is to provide support to enterprises which could invest in climate-friendly interventions without any external support. The higher the IRR the higher the risk of deadweight effect.
If the IRR without any external support is negative ERDF interventions will make private investments in climate-friendly technologies feasible.
Besides, it should be noted that profitability should be not the only criteria to decide ERDF support to ES or RES projects. Non-financial barriers such as the lack of information about climate-friendly technologies (potentials, costs, feasibility, etc.) at the level of the enterprise or the aversion of enterprises to invest in such measures whatever the reason, should not be neglected.
The nature of the public support, including ERDF interventions, to climate-friendly technologies could affect differently the regional or national production patterns of

EX POST EVALUATION OF COHESION POLICY PROGRAMMES 2000-2006 CO-FINANCED BY THE EUROPEAN FUND FOR REGIONAL DEVELOPMENT (OBJECTIVES 1 AND 2) - WORK PACKAGE 5B: ENVIRONMENT AND CLIMATE CHANGE
Climate Change Case Study –Czech Republic – October 2009 Page 14
climate-friendly energies. Supporting uniformly all the ES and RES projects whatever their IRR in the specific country or region could lead enterprises to invest only in the most profitable ES or RES. Bringing the IRR of all the ES and RES alternatives to a similar level should maintain a similar development of all these alternatives in a country or a region.
In the Czech Republic, the rationale to support SMEs to invest in ES and RES projects through the 2004-2006 IEOP was mainly based on the assumptions that green investment could be too costly for SMEs and that energy savings and development of renewable energy were typically not a priority for profit-oriented manufacturing companies. In addition, it was considered that there was a need for public intervention in the field of ES while the energy intensity of the Czech economy was four times higher than the EU average. In other words, the decision to support such interventions was to accelerate the reduction of energy intensity of the Czech economy.

EX POST EVALUATION OF COHESION POLICY PROGRAMMES 2000-2006 CO-FINANCED BY THE EUROPEAN FUND FOR REGIONAL DEVELOPMENT (OBJECTIVES 1 AND 2) - WORK PACKAGE 5B: ENVIRONMENT AND CLIMATE CHANGE
Climate Change Case Study –Czech Republic – October 2009 Page 15
5. Contribution of the IEOP to socio-economic development
An assessment of the IEOP contribution to socio-economic development is difficult as detailed information is not available. The only exception concerns impact on employment, which was clearly monitored during the 2004-2006 period. The indicator used was the gross number of new direct jobs created in the enterprises supported by each ES and RES sub-programme. Table 9 hereafter shows the results of each sub-programme in terms of direct jobs created.
No information is available on indirect job creation. However, it can be assumed that co-funded interventions in ES and RES projects have led to support for or creation of some indirect jobs, taking into account supply of materials (equipment, construction materials, etc.) and services for enterprises implementing the co-funded projects.
Table 9: Gross number of jobs created due to projects co-financed under the ES and RES subprogrammes
Sub-programme Nb. of direct gross jobs created (full-time equivalent; up to September 2008)
Energy savings (ES) 34Renewable energy sources (RES) 58.4Total 92.4
The gross number of direct jobs created by co-funded interventions under both sub-programmes has to be put into perspective. In fact improvement of energy efficiency in enterprises and in the energy production process can also reduce the number of direct and indirect jobs in enterprises. For example, one of the hydro-power plants supported by the IEOP employed three workers for maintenance and control of the plant. The plant invested in the renewal of two of the three turbines, thanks to the ERDF co-financing. As a result of this investment less maintenance and control are needed, and in consequence the number of workers has been reduced to two8.
In a business-as-usual scenario, an improvement in energy efficiency in the production process allows a reduction in energy costs and improves the economic and financial performance of the enterprises supported. In addition, co-funded projects generated increased demand for goods and services. This also contributed a degree of indirect support to socio-economic activities in the Czech Republic at national or regional level. For example, the two new turbines for the hydro-power plant were built in the Czech Republic.
8 Based on information from HYDROPOL Project and Management a.s (Ing. E. Mudroch)


EX POST EVALUATION OF COHESION POLICY PROGRAMMES 2000-2006 CO-FINANCED BY THE EUROPEAN FUND FOR REGIONAL DEVELOPMENT (OBJECTIVES 1 AND 2) - WORK PACKAGE 5B: ENVIRONMENT AND CLIMATE CHANGE
Climate Change Case Study –Czech Republic – October 2009 Page 17
6. Management of ES and RES projects supported by ERDF
The Department of Structural Funds from the Ministry of Industry and Trade has been responsible for the 2004-2006 co-funded IEOP coordination. The Czech Energy Agency (CEA)9 was responsible for the implementation of co-funded projects relating to energy savings and renewable energy up until the end of September 2007. Since 1 October 2007 Czech Invest has been the body responsible for administration of Structural Funds – supporting projects related to climate change – on behalf of the Ministry of Industry and Trade.
All criteria and procedures for the selection of projects under both sub-programmes (ES and RES) were defined according to both EU and national rules and published for all potential applicants. During the 2004-2006 programming period there were continual calls for projects in the fields of both ES and RES. The flow of calls was halted when funding applications for projects markedly exceeded the funds available. Both sub-programmes were announced on 1 April 2005, the deadline for application submissions being 30 September 2006.
During the 2004-2006 period, the selection procedure for ES and RES applications was multi-level. Each project proposal was assessed according to the following steps:
1) Evaluation of compliance and eligibility as carried out by Czech Invest
Application forms were submitted to the relevant regional office of Czech Invest, which checked the application for compliance, eligibility of the applicant and the project, eligibility of costs and the applicant’s economic evaluation (turnover, profitability, capacity to pay back loans, etc.). If the project fulfilled the basic requirements of the programme, it was then sent to the Czech Energy Agency for expert opinion. All information needed for evaluation of eligibility had to be transmitted by the applicant to the evaluation body.
One of the project admissibility conditions was a decrease in GHG emissions of at least 60t per year for projects under the RES sub-programme and 40t per year for projects under the ES sub-programme. This specific condition had to be assessed and confirmed by an independent ex ante energy audit. Another important condition was demonstration of satisfactory results from the economic evaluation (turnover, profitability, capacity to pay back loans, etc.).
9 The Czech Energy Agency (CEA) was closed down on 1 January 2008. Until 30 September 2007 CEA was the
subsidiary body of the Ministry of Industry and Trade. Its role was to support energy efficiency and introduction of renewable energy (both via direct financing and via consulting services – national network of consultants, certification of energy auditors, publications). Since 2008 the CEA duties have been carried out by several bodies, including Czech Invest.

EX POST EVALUATION OF COHESION POLICY PROGRAMMES 2000-2006 CO-FINANCED BY THE EUROPEAN FUND FOR REGIONAL DEVELOPMENT (OBJECTIVES 1 AND 2) - WORK PACKAGE 5B: ENVIRONMENT AND CLIMATE CHANGE
Climate Change Case Study –Czech Republic – October 2009 Page 18
2) Quality evaluation carried out by CEA
CEA evaluated the application using evaluation tables, which contained specific criteria for each application under both the ES and RES sub-programmes. It assessed each application and project on the basis of the following selection criteria:
regional development support ;
compliance with national programme on economic treatment of energy and use of renewable and secondary energy sources;
economic parameters of the project ;
environmental and energy benefits, one criterion addressing GHG emission levels;
qualification of the applicant.
When the evaluation by the CEA/Czech Invest was completed, the project was sent to the evaluation committee.
3) Evaluation carried out by the evaluation committee and project approval by Ministry of Industry and Trade (MIT)
Members of the evaluation committee were mainly representatives of the Ministry of Industry and Trade as well as representatives of professional and business associations and unions and of the Czech regions. Based on the results of the evaluation (steps 1 and 2 as described above), the evaluation committee discussed each application and recommended approval or otherwise. Recommendations from the evaluation committee are then sent to the Ministry of Industry and Trade for a final decision.
The subsidies proposed were calculated according to the methodology of energy project evaluation and were based on specific criteria which were applied to ES and RES projects according to the importance of their contributions to improved energy efficiency and energy production from renewable sources. The total amount of subsidy for a specific project depends on the scoring of the project after evaluation. Projects have to fit minimum requirements to be eligible for subsidies from the IEOP: the higher the score, the higher the subsidy.

EX POST EVALUATION OF COHESION POLICY PROGRAMMES 2000-2006 CO-FINANCED BY THE EUROPEAN FUND FOR REGIONAL DEVELOPMENT (OBJECTIVES 1 AND 2) - WORK PACKAGE 5B: ENVIRONMENT AND CLIMATE CHANGE
Climate Change Case Study –Czech Republic – October 2009 Page 19
7. Method to assess the contribution of ES and RES project supported by ERDF to reducing GHG emissions
With a view to assessing the contribution of ES and RES projects supported by ERDF to reducing GHG emissions, the Czech management authorities implement a bottom-up method consisting of two main steps: an independent ex ante energy audit and a monitoring of the ES or RES project after completion.
The independent ex ante energy audit is an obligatory step in the selection procedure. This audit determines the energy saved, the green capacity and the potential for production of green energy/ electricity of the project. Based on this information, the corresponding amount of GHG emissions avoided as a result of the project was also calculated by the audit. The Czech Energy Agency compared the assessed amount of GHG emissions avoided to a business-as-usual scenario.
The rules applied for this calculation are provided in the Notice of the Ministry of Industry and Trade No. 425/2004 Coll., amending Notice No. 213/2001 Coll. Under these rules the coefficient used to calculate the GHG emissions avoided (expressed in CO2 equivalent) through use of green energy (expressed in MWh) produced by each project is equal to 1.17 t CO2 eq./MWh. This coefficient takes into account the share of each different source of energy in the Czech Republic. Details about the general CO2 equivalent emission factors for power generation applied in the Czech Republic are given in Table 10 hereafter.
Table 10: CO2 equivalent emission factors for power generation in the Czech Republic
Type of energy source CO2 equivalent emission factor
(t CO2 eq./ MWh) Brown coal 0.36
Black coal 0.33
Heavy burning oil 0.27
Light burning oil 0.26
Natural gas 0.2
Biomass/ nuclear power 0
Source: Czech Energy Agency, 2009.
The monitoring of ES and RES projects is carried out using standard monitoring procedures. Project managers have to submit to Czech Invest a project progress report every six months and also when the project is fully completed (final report). In addition, beneficiaries have to submit an annual monitoring report during the three years after project completion and payment of subsidies.
Project progress and monitoring reports and the final report consist of detailed information in a concise standard report format. Apart from financial and other administrative

EX POST EVALUATION OF COHESION POLICY PROGRAMMES 2000-2006 CO-FINANCED BY THE EUROPEAN FUND FOR REGIONAL DEVELOPMENT (OBJECTIVES 1 AND 2) - WORK PACKAGE 5B: ENVIRONMENT AND CLIMATE CHANGE
Climate Change Case Study –Czech Republic – October 2009 Page 20
information, reports have to notify the amount of energy savings generated or the renewable energy sources created or renewed due to the project: for example, in the RES sub-programme, the capacity installed (MW) and the energy in MWh produced as a result of the project over a specific time period.
The main constraints of this method are the data collection from beneficiaries to management authorities, the control of the collected data and their treatment to translate them into GHG emissions avoided compared to a business-as-usual scenario. Nevertheless this bottom-up method remains reliable taken into account that it is based on independent ex ante energy audits whose results are confirmed by an obligatory monitoring three years after ERDF support to the projects.

EX POST EVALUATION OF COHESION POLICY PROGRAMMES 2000-2006 CO-FINANCED BY THE EUROPEAN FUND FOR REGIONAL DEVELOPMENT (OBJECTIVES 1 AND 2) - WORK PACKAGE 5B: ENVIRONMENT AND CLIMATE CHANGE
Climate Change Case Study –Czech Republic – October 2009 Page 21
8. Evolution to the 2007-2013 programming period
Reducing energy intensiveness demonstrates the success of structural changes and of the modernisation of the industry. For industrial sectors of the Czech economy, reducing the energy intensiveness – direct or indirect – represents a key factor on the way to increased enterprise competitiveness. Achieving energy savings is highly capital intensive and thus often inaccessible to small and medium-sized enterprises (high costs of the purchase and implementation of less energy consuming technologies). In this respect, the 2004-2006 IEOP devoted 8.8% to interventions in the field of energy savings and renewable energy only for SMEs.
However the absorption capacity of SMEs was not sufficient to benefit from all the support initially devoted to them during the 2004-2006 period. In addition the most important potential for energy savings still remains in Czech larger manufacturing companies rather than in SMEs. For this reason the 2007-2013 IEOP expanded ES and RES projects to a total amount of € 286 m – including €243 m from ERDF for both SMEs and large business companies. In other words, ERDF allocations ES and RES projects from 2004-2006 period to 2007-2013 period have been multiplied by 5 on a annual basis anticipating a higher absorption capacity.
The main objective of ES and RES projects under the 2003-2007 IEOP is similar than in the 2004-2006 period: reducing energy intensiveness of the Czech industry and of the processes related to the generation, transformation and the use of energy. Globally, the content of both ES and RES measures is also the same than in the 2004-2006 period.
In fact, support will mainly focus on building facilities for the generation and transmission of electric and thermal energy generated from RES and on the reconstruction of existing production facilities in order to use RES. Further support will be provided for modernisation of existing energy production facilities to increase their efficiency; for implementation and modernisation of systems for measurement and regulation of energy; for modernisation, reconstruction and reduction of loss in the transmission of electricity and heat and to the use of energy lost in industrial processes.
Finally, the 2007-2013 IEOP carries out a similar approach for selecting projects to be supported and for assessing GHG emissions avoided due to co-funded ES and RES projects.


ADE s.a. Rue de Clairvaux, 40
B-1348 Louvain-la-Neuve Belgium
Tel.: +32 10 45 45 10 Fax: +32 10 45 40 99 E-mail: [email protected]
Web: www.ade.be
Ex post Evaluation of Cohesion Policy Programmes 2000-2006 Co-Financed by the European Fund for Regional Development (Objectives 1 and 2) – Work Package 5b: Environment and Climate Change CClliimmaattee CChhaannggee CCaassee SSttuuddyy SSaacchhsseenn--AAnnhhaalltt
October 2009


TThhiiss rreeppoorrtt hhaass bbeeeenn pprreeppaarreedd bbyy AADDEE aatt tthhee rreeqquueesstt ooff tthhee EEuurrooppeeaann CCoommmmiissssiioonn..
TThhee vviieewwss eexxpprreesssseedd aarree tthhoossee ooff tthhee CCoonnssuullttaanntt aanndd ddoo nnoott rreepprreesseenntt tthhee ooffffiicciiaall vviieewwss ooff tthhee EEuurrooppeeaann CCoommmmiissssiioonn..
RReepprroodduuccttiioonn oorr ttrraannssllaattiioonn iiss ppeerrmmiitttteedd,, pprroovviiddeedd tthhaatt tthhee ssoouurrccee iiss dduullyy aacckknnoowwlleeddggeedd aanndd nnoo mmooddiiffiiccaattiioonnss ttoo tthhee tteexxtt aarree mmaaddee..


EX-POST EVALUATION OF COHESION POLICY PROGRAMMES 2000-2006 CO-FINANCED BY THE EUROPEAN FUND FOR REGIONAL DEVELOPMENT (OBJECTIVES 1 AND 2) - WORK PACKAGE 5B: ENVIRONMENT AND CLIMATE CHANGE ADE
Climate Change Case Study –Sachsen-Anhalt – October 2009 Table of Contents
Table of Contents
ACRONYMS
SUMMARY
1. STATUS AND FEATURES OF CLIMATE CHANGE IN SACHSEN-ANHALT ................... 1
1.1 THE PICTURE IN TERMS OF CLIMATE CHANGE .............................................................. 1 1.2 CHALLENGES IN TERMS OF CLIMATE CHANGE.............................................................. 3 1.3 STRATEGY IN TERMS OF CLIMATE CHANGE ................................................................... 4 1.4 INSTITUTIONAL FRAMEWORK FOR CLIMATE CHANGE ISSUES ..................................... 5
2. COHERENCE BETWEEN THE OP, CHALLENGES AND THE REGIONAL STRATEGY ................................................................................... 7
3. ACHIEVEMENTS OF THE CO-FUNDED 2000-2006 OP ........................................... 9
4. CONTRIBUTION OF THE OP TO REDUCING GHG EMISSIONS ............................ 11
5. CONTRIBUTION OF THE OP TO SOCIO-ECONOMIC DEVELOPMENT ................... 13
6. MANAGEMENT OF THE CO-FUNDED PROJECTS .................................................. 15
7. EVOLUTION TO THE 2007-2013 PROGRAMMING PERIOD .................................... 17
ANNEX – LIST OF STAKEHOLDERS INTERVIEWED ....................................................... 19
LIST OF TABLES
TABLE 1: GHG EMISSIONS, RENEWABLE ENERGY SOURCES AND ENERGY INTENSITY IN
GERMANY (FROM 2000 TO 2007) ................................................................................ 1 TABLE 2: GHG EMISSIONS, RENEWABLE ENERGY SOURCES AND ENERGY INTENSITY
IN SACHSEN-ANHALT (FROM 2000 TO 2007) ............................................................. 2 TABLE 3: UNEMPLOYMENT RATE, GDP AND GDP PER EMPLOYEE
IN SACHSEN-ANHALT (FROM 1995 TO 2006) ............................................................. 3 TABLE 4: APPROVED AND SPENT BUDGET DEVOTED TO ENVIRONMENT-FRIENDLY
TECHNOLOGIES, CLEAN AND ECONOMICAL-ENERGY TECHNOLOGIES ................ 9


EX-POST EVALUATION OF COHESION POLICY PROGRAMMES 2000-2006 CO-FINANCED BY THE EUROPEAN FUND FOR REGIONAL DEVELOPMENT (OBJECTIVES 1 AND 2) - WORK PACKAGE 5B: ENVIRONMENT AND CLIMATE CHANGE ADE
Climate Change Case Study –Sachsen-Anhalt – October 2009 Acronyms
Acronyms
bn Billion
CNC Computerised Numerical Control (tools with computerised numerical control)
CO2 Carbon dioxide
DG Regio Directorate-General Regional Policy
EEA European Environmental Agency
ES Energy saving
ETS Emission Trading Scheme
ERDF European Fund for Regional Development
EU European Union
Eq. Equivalent
GDR German Democratic Republic, Deutsche Demokratische Republik, DDR
GHG Greenhouse Gas
kgoe Kilogramme of oil equivalent
MS Member State
Mt Megaton
n.a. Not available
OP Operational Programme
RES Renewable energy sources
SME Small and Medium Enterprise
t Ton
UNFCCC United Nations Framework Convention on Climate Change


EX-POST EVALUATION OF COHESION POLICY PROGRAMMES 2000-2006 CO-FINANCED BY THE EUROPEAN FUND FOR REGIONAL DEVELOPMENT (OBJECTIVES 1 AND 2) - WORK PACKAGE 5B: ENVIRONMENT AND CLIMATE CHANGE ADE
Climate Change Case Study – Sachsen-Anhalt – October 2009 Summary
Summary – Key messages from the case study in Sachsen-Anhalt Status and features of climate change in the Region of Sachsen-Anhalt:
- In the Region of Sachsen-Anhalt GHG emissions significantly decreased during the 1990-2006 period due to the restructuring of the industrial sector; but increased by 7% during the 2000-2006 period while the national average decreased by 3%. The share of renewable electricity in total electricity consumption multiplied by 5 during the 2000-2006 period while the national average share doubled.
- No regional specific strategy to mitigate GHG emissions existed in 2000.
Intervention strategy for Structural Funds: - the ERDF budget related to the Operational Programme of the Region of Sachsen-
Anhalt should be interpreted with caution. Indeed the EC classification of expenditures by field of intervention – at least for supported climate-friendly interventions – was not available in the programming documents or monitoring reports.
- the 2000-2006 Operational Programme of the Region of Sachsen-Anhalt co-funded by the ERDF invested €61m in projects related to environment-friendly technologies, clean and economical energy technologies. These projects were not designed to reduce GHG emissions. The rationale of selecting these interventions was mainly business-oriented and designed to create employment.
Contribution of the co-funded interventions: - As no indicator related to GHG emission reduction was monitored during the 2000-
2006 programming period, it is not possible to assess the effectiveness, the impact or the efficiency of the co-funded measures relating to any GHG emission reduction as a result of the co-funded projects. However, it seems that several projects co-funded by the ERDF probably had climate protection effects as they supported investments in new machinery or production processes in enterprises, which consume less energy.
- In addition, it is not possible to assess the creation of jobs related to supported projects in the field of environment-friendly technologies, nor clean and economical energy technologies due to a lack of information from the monitoring system.
Management of climate-friendly interventions: - The selection of projects to be co-financed by the ERDF did not use specific criteria
related to climate change or energy efficiency. The profitability of the projects to be co-funded was not assessed before selecting the projects. The main criteria used dealt with the contribution of the projects to regional economic development, investments in enterprises and the creation of jobs.
- No indicator related to GHG emission was monitored and no GHG emission reduction due to the ERDF co-funded measures was assessed.
Method to assess GHG emission reduction: In the Region of Sachsen-Anhalt, there was no method of assessing the ERDF contribution to reducing GHG emissions during the 2000-2006 period.


EX-POST EVALUATION OF COHESION POLICY PROGRAMMES 2000-2006 CO-FINANCED BY THE EUROPEAN FUND FOR REGIONAL DEVELOPMENT (OBJECTIVES 1 AND 2) - WORK PACKAGE 5B: ENVIRONMENT AND CLIMATE CHANGE ADE
Climate Change Case Study – Sachsen-Anhalt – October 2009 Page 1
1. Status and features of climate change in Sachsen-Anhalt
1.1 The picture in terms of climate change
Situation in Germany
Germany is the largest emitter of greenhouse gases (GHGs) among the EU-27 Member states (MS); in 2007, its total GHG emissions were estimated at 956 Mt of CO2 equivalent (eq.). However, this amount was reduced by 52 Mt of CO2 eq. compared to the beginning of the 2000-2006 programming period (2000). This represents a reduction of 5.1% between 2000 and 2007.
Table 1: GHG emissions, renewable energy sources and energy intensity in Germany (from 2000 to 2007)
Item 2000 2001 2002 2003 2004 2005 2006 2007GHG (Mt CO2 eq.) 1,008 1,025 1,006 1,007 997 999 980 956GHG per capita (t CO2 eq./ capita)
10.7 10.9 10.7 10.9 10.9 10.6 10.7 n.a.
Trend in GHG emissions (100=1990)
82.7 84.1 82.5 83.6 83.4 81.5 81.5 81.5
Share of renewables in gross inland energy consumption (%)
2.8 3 3.4 3.9 4.5 5.1 6 8.3
Share of renewable electricity in total electricity consumption (%)
6.5 6.5 8.1 8.2 9.5 10.5 12.0 15.1
Energy intensity (kgoe per €1000) 160.1 163.7 160.3 161.9 161.0 158.3 154.8 n.a.
Source: Eurostat and European Environment Agency, 2009.
As shown in Table 1, the energy intensity of the German economy decreased during the 2000-2006 programming period; from 160.1 kgoe per €1,000 in 2000 to 154.8 kgoe per €1,000 in 2006. This low energy intensity allowed Germany to be a part of the group of countries within the European economic area1 with the lowest energy intensity.
Renewable energies have significantly increased their share in the energy consumption of the German economy. In fact, the share of renewables in gross inland energy consumption increased by 5.5 % between 2000 and 2007, while the share of renewable electricity in total electricity consumption increased by 8.6 %.
Germany is still the EU leader in wind utilisation, photovoltaic technologies, solar thermal installations and biofuel production. Actually, Germany has already exceeded its 2010 biofuel target of 5.75%; in 2006, it achieved 6.3%. In terms of wind power, its onshore wind capacity covers approximately 50% of the total installed capacity in the EU.
1 This group is composed of Austria, Denmark, Ireland, Germany, Norway and Switzerland. In this group, the lowest
energy intensity is ranked between 95.54 and 160.96 kgoe per €1,000 (Source: Eurostat, 2009).

EX-POST EVALUATION OF COHESION POLICY PROGRAMMES 2000-2006 CO-FINANCED BY THE EUROPEAN FUND FOR REGIONAL DEVELOPMENT (OBJECTIVES 1 AND 2) - WORK PACKAGE 5B: ENVIRONMENT AND CLIMATE CHANGE ADE
Climate Change Case Study – Sachsen-Anhalt – October 2009 Page 2
These results have been mainly achieved due to a stable and predictable policy framework favourable to the penetration and growth of renewable energy sources (RES). The market for RES has been supported by feed-in tariffs for electricity production from RES, market incentives for production of heat and cold from RES, as well as tax exemptions for biofuels.
Situation in the Sachsen-Anhalt Region
The situation in Sachsen-Anhalt during the programming period 2000 to 2006 can be better understood when the decade from 1990 to 2000 is taken into consideration.
During the 1990-2000 period, GHG emissions decreased by 44%. This was predominantly a consequence of the restructuring of the industry and the replacement of old power plant technology by a more efficient one. In the same period, GHG emissions per capita decreased by 43%. Between 1990 and 2000, the share of renewable energy in gross energy consumption was low (ranging between 0.1 and 1.1%).
Table 2: GHG emissions, renewable energy sources and energy intensity in Sachsen-Anhalt (from 2000 to 2007)
Item 1990 1995 2000 2001 2002 2003 2004 2005 2006GHG (Mt CO2 eq.) 52.9 28.1 29.4 30.1 31.0 31.9 30.9 31.5 31.6GHG per capita (t CO2 eq./ capita)
17.6 9.2 10.0 10.3 10.7 11.1 10.8 11.2 11.3
Trend in GHG emissions (100=1990)
100 52 57 59 61 63 61 64 64
Share of renewables in gross inland energy consumption (%)
0.1 0.1 1.1 1.5 2.2 n.a. 4.5 6.2 10.0
Share of renewable electricity in total electricity consumption (%)
n.a. n.a. 4.6 6.4 10.2 13.9 15.8 18.9 22.9
Energy intensity2 (1991=100) n.a. 46 43.8 44.7 44.9 46.0 43.9 45.2 43.8
Source: Länderarbeitskreis Energiebilanzen, 2009.
Contrary to the national situation, the GHG emission trend in the 2000-2006 programming period shows an increase of 7% in Sachsen-Anhalt while the national average shows a decrease of 3%. In that period in Sachsen-Ahnalt the industry was recovering and production was increasing.
While the share of renewable energies in total electricity consumption doubled in Germany as a whole between 2000 and 2006, this share multiplied by 5 in Sachsen-Anhalt. This high increase was partially the result of a low starting point (4.6% in 2000) compared to the German average (6.5% in 2000) and the increased use of biogenic waste 3 for energy production.
2 These values are expressed as primary energy consumption related to GDP. The values expressed in kilogram of oil
equivalent per €1000 are not available for the Sachsen-Anhalt Region.
3 The separated organic fraction of household waste; it consists of yard and food waste.
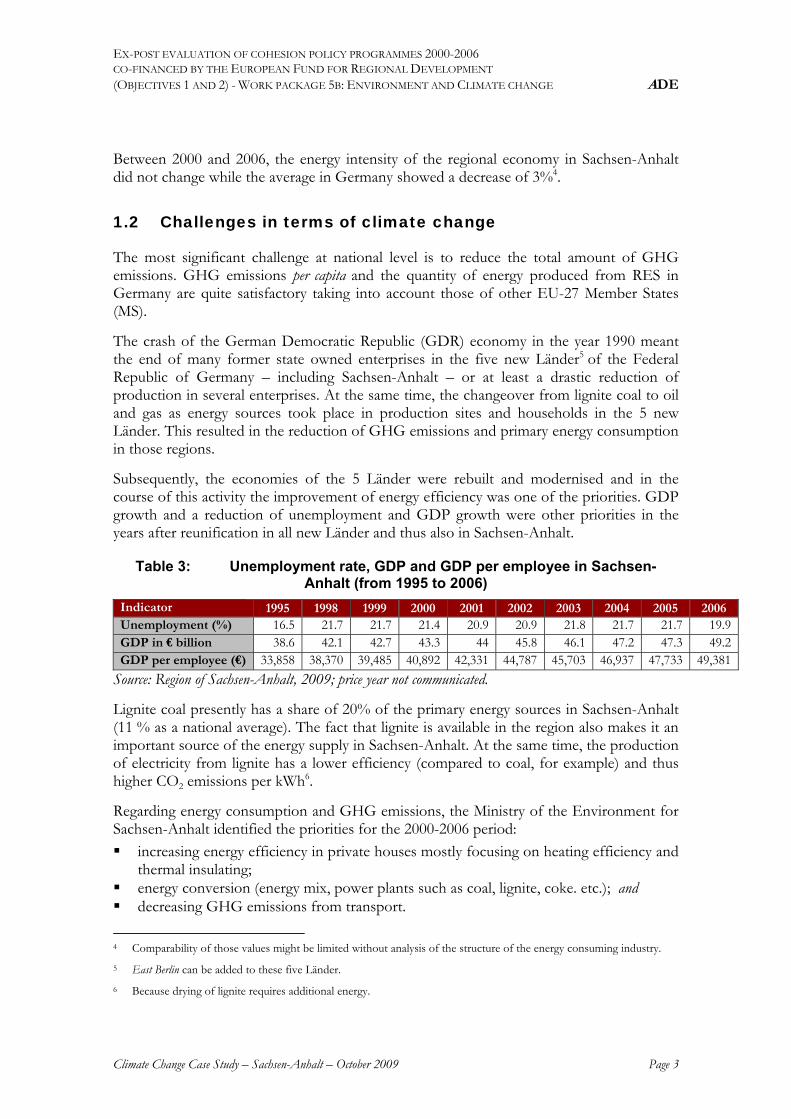
EX-POST EVALUATION OF COHESION POLICY PROGRAMMES 2000-2006 CO-FINANCED BY THE EUROPEAN FUND FOR REGIONAL DEVELOPMENT (OBJECTIVES 1 AND 2) - WORK PACKAGE 5B: ENVIRONMENT AND CLIMATE CHANGE ADE
Climate Change Case Study – Sachsen-Anhalt – October 2009 Page 3
Between 2000 and 2006, the energy intensity of the regional economy in Sachsen-Anhalt did not change while the average in Germany showed a decrease of 3%4.
1.2 Challenges in terms of climate change
The most significant challenge at national level is to reduce the total amount of GHG emissions. GHG emissions per capita and the quantity of energy produced from RES in Germany are quite satisfactory taking into account those of other EU-27 Member States (MS).
The crash of the German Democratic Republic (GDR) economy in the year 1990 meant the end of many former state owned enterprises in the five new Länder5 of the Federal Republic of Germany – including Sachsen-Anhalt – or at least a drastic reduction of production in several enterprises. At the same time, the changeover from lignite coal to oil and gas as energy sources took place in production sites and households in the 5 new Länder. This resulted in the reduction of GHG emissions and primary energy consumption in those regions.
Subsequently, the economies of the 5 Länder were rebuilt and modernised and in the course of this activity the improvement of energy efficiency was one of the priorities. GDP growth and a reduction of unemployment and GDP growth were other priorities in the years after reunification in all new Länder and thus also in Sachsen-Anhalt.
Table 3: Unemployment rate, GDP and GDP per employee in Sachsen-Anhalt (from 1995 to 2006)
Indicator 1995 1998 1999 2000 2001 2002 2003 2004 2005 2006 Unemployment (%) 16.5 21.7 21.7 21.4 20.9 20.9 21.8 21.7 21.7 19.9GDP in € billion 38.6 42.1 42.7 43.3 44 45.8 46.1 47.2 47.3 49.2GDP per employee (€) 33,858 38,370 39,485 40,892 42,331 44,787 45,703 46,937 47,733 49,381
Source: Region of Sachsen-Anhalt, 2009; price year not communicated.
Lignite coal presently has a share of 20% of the primary energy sources in Sachsen-Anhalt (11 % as a national average). The fact that lignite is available in the region also makes it an important source of the energy supply in Sachsen-Anhalt. At the same time, the production of electricity from lignite has a lower efficiency (compared to coal, for example) and thus higher CO2 emissions per kWh6.
Regarding energy consumption and GHG emissions, the Ministry of the Environment for Sachsen-Anhalt identified the priorities for the 2000-2006 period:
increasing energy efficiency in private houses mostly focusing on heating efficiency and thermal insulating;
energy conversion (energy mix, power plants such as coal, lignite, coke. etc.); and decreasing GHG emissions from transport.
4 Comparability of those values might be limited without analysis of the structure of the energy consuming industry.
5 East Berlin can be added to these five Länder.
6 Because drying of lignite requires additional energy.

EX-POST EVALUATION OF COHESION POLICY PROGRAMMES 2000-2006 CO-FINANCED BY THE EUROPEAN FUND FOR REGIONAL DEVELOPMENT (OBJECTIVES 1 AND 2) - WORK PACKAGE 5B: ENVIRONMENT AND CLIMATE CHANGE ADE
Climate Change Case Study – Sachsen-Anhalt – October 2009 Page 4
1.3 Strategy in terms of climate change
At national level
At national level, 7 Germany introduced two main schemes to promote electricity production from RES through the Renewable Energy Act in 2004:
Feed-in tariffs for onshore wind, offshore wind, photovoltaic, biomass, hydropower, landfill gas, sewage gas and geothermal power;
Large subsidised loans available through the Deutsche Ausgleichsbank Environment and Energy Efficiency Programme.
In addition, a Market Incentive Programme provided some subsidies for production of heat and cold from RES with excellent results in solar thermal and small-scale biomass heat generation. As a consequence, the 2007 budget was substantially increased (from €39m to €213m).
Finally, companies have been obliged since 1 January 2007 to market biofuels using a quota system: 4.4% for diesel and 1.2% for petrol. It is expected that these rates will increase annually. In addition, the second generation of biofuels, biogas and pure bio ethanol (E85) will be granted a decreasing tax incentive until 2015.
In the Region of Sachsen-Anhalt, enterprises and individuals benefit from the Renewable Energy Act by getting advantages from the fixed feed in tariffs and from receiving subsidised loans. However, the costs of cable installation (e.g. for de-central wind energy installations) must be borne by the Region of Sachsen-Anhalt.
At regional level
No regional specific strategy to mitigate GHG emissions existed when the Operational Programme was prepared and launched in 2000. Important elements of the climate protection strategy of Sachsen-Anhalt have been developed in the energy concept for Sachsen-Anhalt for the period from 2007 to 20208. It highlights the importance of climate protection activities in the context of the further development of the energy concept, including improvements of energy efficiency and the use of renewable energy sources (RES).
7 Source: DG Energy and Transport, Germany Renewable Energy Fact Sheet, 23 January 2008.
8 Das Energiekonzept der Landesregierung von Sachsen-Anhalt für den Zeitraum zwischen 2007 und 2020, Magdeburg, 2007.

EX-POST EVALUATION OF COHESION POLICY PROGRAMMES 2000-2006 CO-FINANCED BY THE EUROPEAN FUND FOR REGIONAL DEVELOPMENT (OBJECTIVES 1 AND 2) - WORK PACKAGE 5B: ENVIRONMENT AND CLIMATE CHANGE ADE
Climate Change Case Study – Sachsen-Anhalt – October 2009 Page 5
1.4 Institutional framework for climate change issues
No institutional framework dealing specifically with climate change issues existed during the 2000-2006 programming period. This institutional framework is under construction and should be adopted by the end of 2009. Within an overall concept of distributed responsibilities and a general context of sustainable development on economic, social and environmental levels, the Ministry of Agriculture and of the Environment have a major responsibility in view of climate protection and climate change. It has a (partly shared) responsibility for renewable energies including the use of biomass and waste management and for transport related activities. It is involved in the preparation of the National GHG Inventory Reports and the National Communications for the UNFCCC. Regarding the implementation of the 2000-2006 Operational Programme co-financed by the ERDF, it was responsible for projects with an environmental focus. The Ministry of the Economy is responsible for the energy policy of Sachsen-Anhalt, including energy efficiency and the development of renewable energy. It was responsible for the implementation of the 2000-2006 Operational Programme related to Joint Task activities co-financed by the ERDF. The Ministry of Regional Development and Transport is responsible for the transport policy in Sachsen-Anhalt, including public transport. This Ministry is also responsible for urban and regional planning and in that context also for climate protection related activities such as reduction of traffic by adapting regional planning and providing space for regenerative energy sources. It was responsible for the implementation of the 2000-2006 OP activities related to infrastructure measures.


EX-POST EVALUATION OF COHESION POLICY PROGRAMMES 2000-2006 CO-FINANCED BY THE EUROPEAN FUND FOR REGIONAL DEVELOPMENT (OBJECTIVES 1 AND 2) - WORK PACKAGE 5B: ENVIRONMENT AND CLIMATE CHANGE ADE
Climate Change Case Study – Sachsen-Anhalt – October 2009 Page 7
2. Coherence between the OP, challenges and the regional strategy
The major challenge in the period 2000-2006 was to deal with the consequences of reunification after 1989 and to stabilise regional economic development and to decouple this development as far as possible from the increase in GHG emissions.
At the moment of designing the Operational Programme no regional strategy to mitigate climate change existed. Climate protection was not a target in the 2000-2006 Operational Programme of Sachsen-Anhalt. This Operational Programme was mainly business-oriented and designed to create employment. However, environment-friendly technologies, clean and economical-energy technologies – i.e. climate-friendly technologies – were supported in the 2000-2006 Operational Programme of Sachsen-Anhalt.


EX-POST EVALUATION OF COHESION POLICY PROGRAMMES 2000-2006 CO-FINANCED BY THE EUROPEAN FUND FOR REGIONAL DEVELOPMENT (OBJECTIVES 1 AND 2) - WORK PACKAGE 5B: ENVIRONMENT AND CLIMATE CHANGE ADE
Climate Change Case Study – Sachsen-Anhalt – October 2009 Page 9
3. Achievements of the co-funded 2000-2006 OP
The Objective 1 Operational Programme (OP) of Sachsen-Anhalt supported investments in environmentally-friendly technologies, clean and economical energy technologies (corresponding to the FOI code 162 of the EC classification for expenditures under Structural Funds)9. These investments and expenditures were classified under priority 1 of the OP called Promotion of industry and competitiveness of SMEs. According to the information from the Ministry of Finance (communication during field interviews, the total budget spent on environment-friendly technologies, clean and economical energy technologies during the 2000-2006 period amounted to €61m (national and ERDF parts).
It is important to note that this figure should be interpreted with caution. Indeed the EC classification of expenditures by field of intervention – at least for supported climate-friendly interventions – was not available in the programming documents and monitoring reports, and – according to the Ministry of Finance – was not used appropriately by the desk officers at Ministry level (the Regional Investment Bank) during the 2000-2006 period (see further in this report under Management of the co-funded projects). In other words, it is possible that climate-friendly interventions supported by the 2000-2006 Operational Programme of Sachsen-Anhalt was not classified under relevant codes of fields of intervention related to climate change as defined in the framework of this ex post evaluation. Consequently they are not included in the above-mentioned budget.
Table 4: Approved and spent budget devoted to environment-friendly technologies, clean and economical-energy technologies
Measure under Priority 1 of the Operational Programme of Sachsen-Anhalt
Total budget spent (€m; 30 April 2009)
1.11.1 – JA Industry, productive investments 0
1.11.2 – JA Industry, R&D investments 5.4
1.11.3 – JA Industry, investments in SMEs 55.6
Total 61
Source: Ministry of Finance, Communication from field interviews, June 2009.
9 FOI codes taken into account for case studies related to climate change are the following: 152-Environment-friendly
technologies, clean and economical energy technologies in large business organisations; 162-Environment-friendly technologies, clean and economical energy technologies in SMEs and the craft sector; 332-Renewable energy sources of energy (solar power, wind power, hydro-electricity, biomass); 333- Energy efficiency, cogeneration, energy control;

EX-POST EVALUATION OF COHESION POLICY PROGRAMMES 2000-2006 CO-FINANCED BY THE EUROPEAN FUND FOR REGIONAL DEVELOPMENT (OBJECTIVES 1 AND 2) - WORK PACKAGE 5B: ENVIRONMENT AND CLIMATE CHANGE ADE
Climate Change Case Study – Sachsen-Anhalt – October 2009 Page 10
According to programming documents and the 2006 annual report, the 2000-2006 Operational Programme of Sachsen-Anhalt supported the following projects related to environment-friendly technologies, clean and economical energy technologies:
productive investments in the framework of the Joint Action Improvement of the regional industrial structure (GRW)10. These investments aimed at creating and securing permanent jobs in industries with predominantly supra-regional markets.
Support was given to investments which funded the building of new (and the extension of existing) production sites, changes in production processes and the relocation of production sites, basic rationalisation of production and the acquisition of enterprises which would otherwise be decommissioned. In addition, it was possible to obtain funding for production sites which had been destroyed by natural disasters and which had already been previously funded.
projects in the area of applied environmental research and the development of ecological products, production techniques and environmental technologies. These projects contributed to overcome the fundamental innovation weakness of the regional industry and to create conditions for a stand-alone, innovation-led growth.
projects strengthening existing R&D and innovation capacities, in particular in the field of environment and the environmental protection, as well as the creation of environment-friendly products and production techniques and of methods of ecological recovery.
According to information from the 2006 annual report, 10,932 projects have been implemented under priority Promotion of industry and competitiveness of SMEs. Due to a lack of information in the monitoring system, it is not possible to calculate the number of projects financed under the field of intervention environment-friendly technologies, clean and economical energy technologies.
It should be also underlined that some climate-friendly projects initially planned to be supported by the 2000-2006 Operational Programme of Sachsen-Anhalt were finally not implemented due to a lack of regional financial sources. According to the mid-term review of the use of EU Structural Funds related to the 2000-2006 Operational Programme of Sachsen-Anhalt (page 104), this was the case for example for the action Funding pilot and demonstration plants in the energy programme. In this specific case, a total budget of €6.96m (including €2.19m from the ERDF) was planned for the year 2003 and 2004 but the action has been cancelled because the Region of Sachsen-Anhalt was unable to finance its part of the total budget.
10 The GRW is the funding instrument of the Region of Sachsen-Anhalt for the business sector. The objective of the
funding programme is the granting of benefits to investment projects, which contribute to the creation or securing of permanent job positions.

EX-POST EVALUATION OF COHESION POLICY PROGRAMMES 2000-2006 CO-FINANCED BY THE EUROPEAN FUND FOR REGIONAL DEVELOPMENT (OBJECTIVES 1 AND 2) - WORK PACKAGE 5B: ENVIRONMENT AND CLIMATE CHANGE ADE
Climate Change Case Study – Sachsen-Anhalt – October 2009 Page 11
4. Contribution of the OP to reducing GHG emissions
No indicator related to GHG emission reduction was identified during the 2000-2006 programming period; neither at the level of the selection procedure nor at the level of the monitoring procedure. It is therefore not applicable or possible to assess the effectiveness, the impact and the efficiency of the co-funded measures relating to any GHG emission reduction due to the co-funded projects.
However it can be assumed that several projects co-funded by the ERDF probably had effects in terms of GHG emission reduction:
this is true for example for projects where the purchasing of electrical machines has been co-financed, such as machines for metal eroding11. The project was classified as “mainly environmentally oriented”. No explicit consideration of energy aspects has been documented.
another example is the co-funding of the purchase of a computerised machining tool CNC centre and other different metal processing machines12. In this case, an additional effect was the reduction of transport by reducing external steps in the work flow.
in a third example, the purchase of a machine for production of chocolate covered candy bars13 was co-financed. State of the art energy efficiency can be expected.
11 Responsible Ministry: Ministry of the Economy; permitting authority: Investment Bank: IB - LSA Unit: GA GA;
Measure 1.11.3 GA SME
12 Responsible Ministry: Ministry of the Economy; permitting authority: Investment Bank: IB - LSA Unit: GA GA; Measure 1.11.3 GA SME
13 Responsible Ministry: Ministry of the Economy; permitting authority: Investment Bank: IB - LSA Unit: GA GA; Measure 1.11.3 GA SME


EX-POST EVALUATION OF COHESION POLICY PROGRAMMES 2000-2006 CO-FINANCED BY THE EUROPEAN FUND FOR REGIONAL DEVELOPMENT (OBJECTIVES 1 AND 2) - WORK PACKAGE 5B: ENVIRONMENT AND CLIMATE CHANGE ADE
Climate Change Case Study – Sachsen-Anhalt – October 2009 Page 13
5. Contribution of the OP to socio-economic development
According to the Managing Authority, during the 2000-2007 period, the Sachsen-Anhalt Operational Programme resulted in: the creation of 23,751 jobs; the safeguarding of 64,703 jobs. Due to a lack of information in the monitoring system, it is however not possible to isolate created or safeguarded jobs related to supported projects in environment-friendly technologies or clean and economical energy technologies.


EX-POST EVALUATION OF COHESION POLICY PROGRAMMES 2000-2006 CO-FINANCED BY THE EUROPEAN FUND FOR REGIONAL DEVELOPMENT (OBJECTIVES 1 AND 2) - WORK PACKAGE 5B: ENVIRONMENT AND CLIMATE CHANGE ADE
Climate Change Case Study – Sachsen-Anhalt – October 2009 Page 15
6. Management of the co-funded projects
Overall organisation
The Ministry of Finance in Sachsen-Anhalt was the overall managing authority for the 2000-2006 period. The Managing Authority transferred responsibility for certain parts of the OP in view of concrete projects to (subordinated) ministries which were responsible departments for the individual projects: the Ministry of the Economy was responsible for projects related to the Joint Action
Industry, productive investments; the Joint Action Industry, R&D investments, as well as the Joint Action Industry, investments in SMEs (under priority 1 of the 2000-2006 the Operational Programme);
the Ministry of Agriculture and of the Environment were responsible for projects related to the water sector, air pollution prevention, waste management, remediation of landfills and industrial sites.
Processing of the applications was done by the regional public Investment Bank which is subordinated to the Ministry of Finance. A regional committee is supervising the implementation of the OP by the Managing Authority.
Selection procedure
Projects were selected according to the requirements and the criteria of the 2000-2006 Operational Programme. The main criteria used were support to the economic development of the region, investments in new and existing enterprises and creation of jobs. Climate protection and energy efficiency were not used as selection criteria.
Monitoring procedure related to GHG emissions
No indicator related to GHG emissions was monitored during the 2000-2006 programming period. In addition, there was no method to assess the GHG emission reduction due to the co-funded climate-friendly projects.
Lessons learnt in terms of EC expenditure classification and indicators
Indeed, the EC classification of expenditures by field of intervention – at least for supported climate-friendly interventions – was not available in the programming documents or monitoring reports.
During field interviews, the Managing Authority clearly stated that one of the lessons learnt from the 2000-2006 period was the need to improve: the use of the codes for the fields of intervention (FOI codes) to classify expenditures
under the ERDF when the application forms are processed; the monitoring through appropriate indicators
According to the Management authority, these issues have been solved for the 2007-2013 programming period by making the use of FOI codes and relevant indicators mandatory.


EX-POST EVALUATION OF COHESION POLICY PROGRAMMES 2000-2006 CO-FINANCED BY THE EUROPEAN FUND FOR REGIONAL DEVELOPMENT (OBJECTIVES 1 AND 2) - WORK PACKAGE 5B: ENVIRONMENT AND CLIMATE CHANGE ADE
Climate Change Case Study – Sachsen-Anhalt – October 2009 Page 17
7. Evolution to the 2007-2013 programming period
Climate protection is considered in the 2007-2013 Sachsen-Anhalt Operational Programme (OP) as a horizontal objective which will be considered in different areas of the OP. More specifically, climate change is the background to further development of a sustainable energy supply in the region. The major RES targeted by the 20007-2013 OP are biomass and geothermal energy. Environmentally sound transport (public transport and transport of goods) is stated as an area for reducing the impact on climate change and reducing energy consumption.
For renewable energy sources (RES) within the project field “research, development and innovation” a co-funding of €69.1 million (including national funds) is foreseen. The 2007-2013 OP states in this context that weaknesses regarding R&D activities can be observed in Sachsen-Anhalt. With this background investment, improvements for R&D activities in SMEs will be supported by funding. Additionally, the transfer of knowledge and technology from universities into enterprises will be supported. Further concentration and focusing of public research will be supported.
In the project field “environment, nature protection, prevention of risks, climate change and use of regenerative energy sources” co-funding of €38 million is foreseen. The 2007-2013 OP states an overall number of 250 projects in the area of “climate protection and regenerative energies”.


EX POST EVALUATION OF COHESION POLICY PROGRAMMES 2000-2006 CO-FINANCED BY THE EUROPEAN FUND FOR REGIONAL DEVELOPMENT (OBJECTIVES 1 AND 2) - WORK PACKAGE 5B: ENVIRONMENT AND CLIMATE CHANGE ADE
Climate Change Case Study –Sachsen-Anhalt – October 2009 Page 19
Annex – List of stakeholders interviewed
Date Name Position Institution
Tuesday 9 June 2009 Mr. Heller Head of Office Ministry of Finance, Management authority for Structural Funds in the Sachsen-Anhalt Region
Thursday 11 June 2009 Mr. Hillbrich Head of Department Ministry for Agriculture and the Environment of Sachsen-Anhalt
Thursday 11 June 2009 Ms. Stekly Policy Officer, EU-Department, Coordination
Ministry for Agriculture and the Environment of Sachsen-Anhalt
Thursday 11 June 2009 Mr..Herwarth Policy Officer Ministry for Agriculture and the Environment of Sachsen-Anhalt Thursday 11 June 2009 Ms. Dr. Schulz Policy Officer Ministry for Agriculture and the Environment of Sachsen-Anhalt Thursday 11 June 2009 Mr. Büchner Policy Officer Ministry for Agriculture and the Environment of Sachsen-Anhalt
Thursday 11 June 2009 Mr. Bauer Policy Officer, Waste Management Department
Ministry for Agriculture and the Environment of Sachsen-Anhalt
Thursday 11 June 2009 Mr. Schulz Policy Officer Ministry for Agriculture and the Environment of Sachsen-Anhalt Important notice to the reader
Despite many efforts to make an appointment, key stakeholders at the level of the Ministry of the Economy did not see themselves in a position to meet the consultants, arguing that they have nothing to share in the questionnaire related to the case study. However all the measures and projects to be considered for carrying out the case study in Sachsen-Anhalt (support to environment-friendly, clean and economical energy technologies) were selected and managed by the Ministry of the Economy during the 2000-2006 period. This constraint has strongly limited the collection and analysis of the information to answer questions of the Terms of Reference. The consultants have therefore mainly based their analysis on available documents (programming documents, Mid-Term review of the use of EU Structural Funds related to the 2000-2006 Operational Programme of Sachsen-Anhalt, 2006 annual report).


ADE s.a. Rue de Clairvaux, 40
B-1348 Louvain-la-Neuve Belgium
Tel.: +32 10 45 45 10 Fax: +32 10 45 40 99 E-mail: [email protected]
Web: www.ade.be
Ex post Evaluation of Cohesion Policy Programmes 2000-2006 Co-Financed by the European Fund for Regional Development (Objectives 1 and 2) – Work Package 5b: Environment and Climate Change CClliimmaattee CChhaannggee CCaassee SSttuuddyy TThhee AAuuttoonnoommoouuss RReeggiioonn ooff AAzzoorreess
October 2009


EX-POST EVALUATION OF COHESION POLICY PROGRAMMES 2000-2006 CO-FINANCED BY THE EUROPEAN FUND FOR REGIONAL DEVELOPMENT (OBJECTIVES 1 AND 2) - WORK PACKAGE 5B: ENVIRONMENT AND CLIMATE CHANGE ADE
Climate Change Case Study – The Autonomous Region of Azores – October 2009 Table of Contents
Table of Contents
ACRONYMS
SUMMARY
1. STATUS AND FEATURES OF CLIMATE CHANGE IN THE AUTONOMOUS REGION OF AZORES ............................................................................................. 1
1.1 THE PICTURE IN TERMS OF CLIMATE CHANGE .............................................................. 1 1.2 CHALLENGES IN TERMS OF CLIMATE CHANGE.............................................................. 3 1.3 REGIONAL STRATEGY IN TERMS OF CLIMATE CHANGE ............................................... 4 1.4 INSTITUTIONAL FRAMEWORK FOR CLIMATE CHANGE ISSUES ..................................... 6
2. COHERENCE BETWEEN THE OP, CHALLENGES AND THE REGIONAL STRATEGY ....................................................................................... 9
3. ACHIEVEMENTS OF THE CO-FUNDED 2000-2006 OP .......................................... 11
4. CONTRIBUTION OF PRODESA TO REDUCING GHG EMISSIONS ...................... 15
4.1 EFFECTIVENESS OF THE PROJECTS CO-FUNDED BY THE ERDF .............................. 15 4.2 IMPACT OF THE PROJECTS SUPPORTED BY THE ERDF .............................................. 15 4.3 EFFICIENCY OF THE PROJECTS SUPPORTED BY THE ERDF ....................................... 17 4.4 PROFITABILITY OF THE CO-FUNDED PROJECTS .......................................................... 18
5. CONTRIBUTION OF PRODESA TO SOCIO-ECONOMIC DEVELOPMENT ............ 19
6. MANAGEMENT OF THE CO-FUNDED PROJECTS ............................................... 20
7. EVOLUTION TO THE 2007-2013 PROGRAMMING PERIOD ................................... 21
ANNEX: LIST OF STAKEHOLDERS INTERVIEWED ................................................... 23

EX-POST EVALUATION OF COHESION POLICY PROGRAMMES 2000-2006 CO-FINANCED BY THE EUROPEAN FUND FOR REGIONAL DEVELOPMENT (OBJECTIVES 1 AND 2) - WORK PACKAGE 5B: ENVIRONMENT AND CLIMATE CHANGE ADE
Climate Change Case Study – The Autonomous Region of Azores – October 2009 Table of Contents
LIST OF TABLES
TABLE 1: MEASURED GHG EMISISONS (T CO2 EQ.) OF THE 3 LARGEST EMITTERS IN THE
AUTONOMOUS REGION OF AZORES (FROM 2005 TO 2007) ................................... 1 TABLE 2: RENEWABLE ENERGY SOURCES AND ENERGY INTENSITY IN THE AUTONOMOUS
REGION OF AZORES (FROM 2000 TO 2008) .............................................................................. 3
TABLE 3: PRODESA BUDGET DEVOTED TO RENEWABLE ENERGY SOURCES (RES) FOR THE PERIOD 2000-2008...................................................................................... 11
TABLE 4: PRODESA OUTPUT INDICATORS RELATED TO RENEWABLE ENERGY SOURCES (RES) ........................................................................................................... 12
TABLE 5: CO2 EMISSION FACTORS (G/ KWH) OF THE NINE AZORES ISLANDS .................. 16 TABLE 6: ASSESSED GHG EMISSIONS AVOIDED DUE TO PROJECTS IN RENEWABLE
ENERGY SOURCES IN THE AUTNOMOUS REGION OF AZORES............................. 17 TABLE 7: EXPECTED INVESTMENTS IN RENEWABLE ENERGY SOURCES THROUGH
THE COHESION FUND FOR THE 2007-2013 PERIOD ............................................. 21
LIST OF FIGURES
FIGURE 1: THE AUTONOMOUS REGION OF AZORES (2007) .................................................... 2 FIGURE 2: EVOLUTION OF THE ENERGY MIX OF THE AUTONOMOUS REGION OF AZORES
FROM 2000 TO 2008 AND EXPECTATIONS FOR 2013 FOR ELECTRICY
PRODUCTION ................................................................................................................. 3 FIGURE 3: ORGANISATION OF THE ELECTRICITY SUPPLY IN THE AUTONOMOUS
REGION OF AZORES (2009) ........................................................................................ 7 FIGURE 4: TIME SERIES (1999-2008) OF WIND POWER PRODUCTION ON THE AZORES
ISLANDS IN WHICH PRODESA FUNDED PROJECTS IN RENEWABLE ENERGY .................. 13
FIGURE 5: TIME SERIES (1999-2008) OF HYDRO POWER PRODUCTION ON THE AZORES
ISLANDS IN WHICH PRODESA FUNDED PROJECTS IN RENEWABLE ENERGY .................. 14

EX-POST EVALUATION OF COHESION POLICY PROGRAMMES 2000-2006 CO-FINANCED BY THE EUROPEAN FUND FOR REGIONAL DEVELOPMENT (OBJECTIVES 1 AND 2) - WORK PACKAGE 5B: ENVIRONMENT AND CLIMATE CHANGE ADE
Climate Change Case Study – The Autonomous Region of Azores – October 2009 Acronyms
Acronyms
ARENA Regional Agency for Energy and the Environment of the Azores
CF Cohesion Fund
CO2 Carbon dioxide
DG Regio Directorate-General Regional Policy
EC European Commission
EDA Electricidade dos Açores, S.A.
EDP EDP – Energias de Portugal, SA
EEA European Environmental Agency
EEG Empresa de Electricidade e Gaz, Lda
ETS Emission Trading Scheme – in Portuguese: Comércio Europeu de Licenças de Emissão (CELE)
ERDF European Fund for Regional Development
Eq. Equivalent
EU European Union
Eq. Equivalent
GEOTERCEIRA Sociedade Geoeletrica da Terceira, S.A.
GHG Greenhouse Gas
GVA Gross Value Added
kgoe Kilogramme of oil equivalent
kt Kiloton
MS Member State
Mt Megaton
n.a. Not available
PRAI Programme of Innovation Actions
PRODESA Programa Operacional para o Desenvolvimento Economico e Social dos Açores
RES Renewable energy sources
RGoA Government of the Autonomous Region of the Azores
SME Small and medium enterprise
SOGEO Sociedade Geotermica dos Açores, S.A.
SRAM Regional Secretariat of the Environment and Sea - in Portuguese: Secretaria Regional do Ambiente e do Mar
t Ton


EX-POST EVALUATION OF COHESION POLICY PROGRAMMES 2000-2006 CO-FINANCED BY THE EUROPEAN FUND FOR REGIONAL DEVELOPMENT (OBJECTIVES 1 AND 2) - WORK PACKAGE 5B: ENVIRONMENT AND CLIMATE CHANGE ADE
Climate Change Case Study – The Autonomous Region of Azores – October 2009 Summary
Summary – Key messages of the case study in the Autonomous Region of Azores
Status and features of climate change in the Autonomous Region of Azores: - Preliminary data shows that GHG emissions from economic sectors (such as agriculture;
households; terrestrial, air, and boat transport) increased by 59% between 1990 and 2004, which corresponds to 2% of Portuguese GHG emissions;
- The Autonomous Region of Azores is among the most efficient EU regions in terms of energy consumption. The share of renewables in gross inland energy consumption increased by 4.5% between 2000 and 2007, while the share of renewable electricity in total electricity consumption increased by 7.9%. The Azorean share of energy production through fossil fuels decreased by 6% during the 2000-2008 period, while geothermal energy and wind energy increased by 5% and 3% respectively;
- No regional strategy to combat climate change existed during the 2000-2006 programming period. This strategy is currently being elaborated.
Intervention strategy for Structural Funds: The 2000-2006 Operational Programme (PRODESA) co-funded by ERDF supported investments and research in the development of renewable energy sources for a total budget of €41.9m. As there is just one actor in the electricity sector in the Autonomous Region of Azores, stringent rules make the absorption of funds difficult and in some cases, projects were not allowed to be co-funded by the ERDF. Consequently, some of the targets of the PRODESA were not met (e.g. support to build new wind turbines) and ERDF support was reallocated to other co-funded projects.
Contribution of the co-funded interventions: - The PRODESA contributed to creating new geothermal energy production capacity (10
MW), to an increase in installed wind energy production capacity (+2.1 MW), to building wind farms (2.4 MW), to building and renovating mini-hydro power plants. It also contributed to supporting field feasibility studies in preparation for new investments in geothermal energy production capacity. However, it is not possible to assess the contribution of projects co-funded by the ERDF to reducing GHG emissions as it is not possible to isolate these projects from all the projects funded in the field of renewable energy sources.
- Due to a lack of information, it is not possible to assess the contribution of the co-funded interventions in terms of regional development.
Management of climate-friendly interventions: - The selection procedure did not include an assessment of the profitability of projects in
renewable energy sources (RES) to be co-financed by the ERDF. In addition, no information is available concerning the profitability of the different renewable energy sources in the Autonomous Region of Azores.
- During the implementation of the PRODESA, no indicator related to GHG emission was monitored and no GHG emission reduction specifically due to the ERDF co-funded measures was assessed. However, installed capacity (unit: MW) from renewable energy sources (geothermal, wind and hydro), as well as the monitoring of electricity production from renewable energy sources (unit: kWh or MWh) have been monitored for all the islands of the Autonomous Region of Azores.
Method to assess GHG emission reduction: CO2 emission factors (g/kWh) have been calculated taking into account the specific energy mix of each of the nine Azorean Islands. Based on these indicators it is possible to assess the GHG reduction of plants (hydro/geothermal energy) and wind turbines compared to a scenario with energy production from fossil fuels.


EX-POST EVALUATION OF COHESION POLICY PROGRAMMES 2000-2006 CO-FINANCED BY THE EUROPEAN FUND FOR REGIONAL DEVELOPMENT (OBJECTIVES 1 AND 2) - WORK PACKAGE 5B: ENVIRONMENT AND CLIMATE CHANGE ADE
Climate Change Case Study – The Autonomous Region of Azores – October 2009 Page 1
1. Status and features of climate change in the Autonomous Region of Azores
1.1 The picture in terms of climate change
Greenhouse gas emissions
Aggregated data concerning greenhouse gas (GHG) emissions in the Autonomous Region of Azores are not available. However, the Regional Direction for the Environment has monitored GHG emissions of the six largest emitting companies of the region through appropriate measurement stations in the framework of the European Trade Scheme (ETS). Four of the monitored installations are electricity producers, and the other two correspond to dairy product factories. Table 1 below provides GHG emissions for the group of power plants of the company Electicidade dos Açores (EDA), and of the two dairy factories. Total GHG emissions of these main Azorean industries vary from 400 kt CO2 equivalent (eq.) in 2006 to 367 kt CO2 eq. in 2007.
Table 1: Measured GHG emisisons (t CO2 eq.) of the 3 largest emitters in the Autonomous Region of Azores (from 2005 to 2007)
Operator Sector 2005 2006 2007
Electricidade dos Açores, S.A. Energy 376,951 384,943 340,911
Pronicol – Produtos Lácteos, S.A. Agro-food
11, 045 13,346 13,008
Fromageries Bel n.a. 1,591 12,698
Total 387,996 399,880 366,617
Source: Autonomous Region of Azores, Regional Secretary of the Environment and Sea, Regional Direction of Energy, 2009. GHG emissions from other sectors such as agriculture; households; terrestrial, air, and boat transport were not communicated by the Regional Direction of the Environment. However, preliminary data1 show an increase of 1,410 kt CO2 eq. in 1990 to 2,242 kt CO2 equivalent in 2004 (+59%), which corresponds to 2% of Portuguese GHG emissions2. According to the Regional Direction of Territorial Planning and Water Resources3, the figures reflect the evolution of regional GDP between 1990 and 2004, which grew by 72% – accompanied by the significant growth of the gross value added (GVA) of transportation and agriculture – and of the production of energy that grew 69%.
As the Autonomous Region of Azores is composed of 9 different islands (see the map hereafter), the transport sector, especially aviation (with over 12,000 flights per year
1 http://desertosedesertificacao.blogspot.com/2007/11/emisses-de-co2-nos-aores-em-2007.html 2 This is coincidental to the population ratio since about 2.2% of the country’s population live in the Azores. 3 http://desertosedesertificacao.blogspot.com/2007/11/emisses-de-co2-nos-aores-em-2007.html

EX-POST EVALUATION OF COHESION POLICY PROGRAMMES 2000-2006 CO-FINANCED BY THE EUROPEAN FUND FOR REGIONAL DEVELOPMENT (OBJECTIVES 1 AND 2) - WORK PACKAGE 5B: ENVIRONMENT AND CLIMATE CHANGE ADE
Climate Change Case Study – The Autonomous Region of Azores – October 2009 Page 2
between islands4) remains a large emitter of GHG emissions. In addition, the number of cattle in the Azores (among others, 240,000 cows5, approximately 1 cow per inhabitant) results in significant methane emissions, while the yearly production of over 500 million litres of milk6 is quite energy intensive.
Figure 1: The Autonomous Region of Azores (2007)
Source: Government of Azores, Regional Direction of Commerce, Industry and Energy, 2008.
Renewable energy sources and energy intensity
As shown in Table 2 hereafter, the energy intensity of the Azorean economy has decreased annually since 2004; from 135 kilograms of oil equivalent (kgoe) per €1,000 in 2004 to 128 kgoe per €1,000 in 2007. As a result, the Autonomous Region of Azores is among the most efficient EU regions in terms of energy consumption. In 2006, the energy intensity of the Autonomous Region of Azores was equivalent to around 60% of the average Portuguese energy intensity (= 225 kgoe per €1,000).
The share of renewables in gross inland energy consumption increased by 4.5% between 2000 and 2007, while the share of renewable electricity in total electricity consumption increased by 7.9%. In 2007, this last indicator was 12.4% higher than the EU-27 average but lower than the Portuguese average (= 30.1%). According to the Regional Direction of Energy, the large increase of the share of renewable electricity in total electricity consumption between 2006 and 2007 was due to the start up of production of the Pico Vermelho geothermal power plant, which was co-financed by the ERDF through the 2000-2006 Programa Operacional para o Desenvolvimento Economico e Social dos Açores (PRODESA).
4 Data from the National Institute of Statistics 5 Idem 6 Milk production in 2007 reached 506 million litres (data from the National Institute of Statistics).
Corvo
Faial
Graciosa
TerceiraSão Jorge
PicoSão Miguel
Santa Maria
Flores
610 Km
1115 Km
1400 Km
835 Km
CannaryIslands
Madeira Islands
Portugal Mainland
… to New York
3400 Km
Population: 241.000
Area: 2.322 km2
GDP: 1,7% of Portugal
GDP per capita: 70% average of Portugal

EX-POST EVALUATION OF COHESION POLICY PROGRAMMES 2000-2006 CO-FINANCED BY THE EUROPEAN FUND FOR REGIONAL DEVELOPMENT (OBJECTIVES 1 AND 2) - WORK PACKAGE 5B: ENVIRONMENT AND CLIMATE CHANGE ADE
Climate Change Case Study – The Autonomous Region of Azores – October 2009 Page 3
Table 2: Renewable energy sources and energy intensity in the Autonomous Region of Azores (from 2000 to 2008)
Item 2000 2001 2002 2003 2004 2005 2006 2007 2008Share of renewables in gross inland energy consumption (%)
7.5 9.6 8.4 8.1 7.6 6.8 7.4 12 n.a.
Share of renewable electricity in total electricity consumption (%)
19 25 21 20 18 16 17 28 27
Energy intensity (kgoe per €1000) 138 97 135 135 135 134 130 128 n.a.
Source: Autonomous Region of Azores, Regional Secretary of the Environment and Sea, Regional Direction of Energy, 2009. As shown in Figure 2 below, energy production in the Autonomous Region of Azores significantly increased between 2000 and 2008. However, the share of energy production through heavy and light fuel (diesel and gasoline) fell by 6% during this period. Geothermal energy and wind energy have increased by 5% and 3% respectively during the same period. Hydro energy decreased by 1%, but in terms of absolute production hydro energy rose by around 2.5 GWh.
Figure 2: Evolution of the energy mix of the Autonomous Region of Azores from 2000 to 2008 and expectations for 2013 for electricy production
Source: EDA, 2009.
1.2 Challenges in terms of climate change According to an integrated project assessing climate change impacts in Portugal (SIAM7), since the 1970s, the Autonomous Region of Azores has been registering an increase in the occurrence of tropical nights (minimum temperature above 20ºC) and an increase in summer days (maximum temperature above 25ºC). The foreseen changes in climate until 2100 are not as severe for the Autonomous Region of Azores as they are for Madeira or for mainland Portugal. Nevertheless, there is a tendency for an increase in temperature and a decrease in rain in the summer. For winter, the maintenance of precipitation is foreseen, but the tendency is for an increase in the intensity of storms and an increase in rain of up to 25% in some locations. In these circumstances, water resource preservation is a key issue. 7 www.siam.fc.ul.pt/siamII_pdf/Clima.pdf
Heavy fuel 70%
Light fuel 10%
Geothermal 15%
Hydro4% Wind 1%
2000
Total energy production: 520 GWhTotal production from RES: 101 GWhΣRES = 19%
Heavy fuel 66%
Light fuel8%
Geothermal20%
Hydro 3%
Wind3%
2008
Total energy production: 823 GWhTotal production from RES: 217 GWhΣRES = 27%

EX-POST EVALUATION OF COHESION POLICY PROGRAMMES 2000-2006 CO-FINANCED BY THE EUROPEAN FUND FOR REGIONAL DEVELOPMENT (OBJECTIVES 1 AND 2) - WORK PACKAGE 5B: ENVIRONMENT AND CLIMATE CHANGE ADE
Climate Change Case Study – The Autonomous Region of Azores – October 2009 Page 4
As stated above, the mitigation in the Autonomous Region of Azores is directly linked to the use of renewable energy sources. At the start of the 2000-2006 programming period, the challenge was different than the climate change mitigation: to supply the whole population of the Autonomous Region of Azores with good quality electricity. The archipelagic nature of the territory, with considerable distances and/or depths between the islands, requires the existence of nine different electricity production, transportation and distribution systems and confined grids. This is clearly seen in the fact that 50% of the disbursement in the measure of the 2000-2006 PRODESA dealing with energy concerned fossil fuel (oil) power plants. At the start of the 2000-2006 PRODESA the challenges related to renewable energy sources (RES) were: the status of the distribution grid led to losses and often stability problems occurred,
hence it was hard for the electrical networks to accommodate the variability associated with renewable energy, particularly wind but also hydro8;
the more stable geothermal energy requires a minimum of electricity consumption to be profitable, and only two islands (São Miguel and Terceira) have a significant level of consumption – besides, studies are required to locate the most appropriate sites ;
the difficulty in attracting entrepreneurs to invest in smaller islands and the need to subsidise the price of electricity in some islands ;
the need to reach the objective of increasing the penetration of RES, as expressed in priority 5 of the 2000-2006 PRODESA.
There has been a considerable evolution in terms of the use of renewable energy sources (RES) in the Autonomous Region of Azores. In the next few years, the Regional Authorities have foreseen9 a continuing increase in the share of electricity in the primary energy consumed in the Azores and the share of the RES in electricity production. Until 2012, it is expected that RES power installed in the Azores will come from10 45 MW geothermal energy (triple what existed in 2005), 15 MW wind energy (double the 2005 level) and 11 MW hydro (38% more than in 2005).
1.3 Regional strategy in terms of climate change
No regional strategy to combat climate change existed during the 2000-2006 programming period. This strategy is currently being elaborated by a multi-sectoral team involving the Secretariat of the Environment and Sea (and Directorates of the environment, energy, and water and territorial planning), and representatives of other secretariats.
Regarding adaptation to climate change, the protection of coastal areas – in particular in the supratidal11 talus-platforms locally called fajãs – and the preservation of water resources are 8 There are no large rivers in the Autonomous Region of Azores. Hence, with the exception of the island of Flores, the
hydro-power source is of torrential regime. 9 Draft of the Strategic Plan for Energy in the Azores (30-08-2008).
10 Communication of Dr Amaral, former Regional Director of Commerce, Industry and Energy.
11 “Supratidal” means pertaining to the shore area immediately marginal to and above the high-tide level.

EX-POST EVALUATION OF COHESION POLICY PROGRAMMES 2000-2006 CO-FINANCED BY THE EUROPEAN FUND FOR REGIONAL DEVELOPMENT (OBJECTIVES 1 AND 2) - WORK PACKAGE 5B: ENVIRONMENT AND CLIMATE CHANGE ADE
Climate Change Case Study – The Autonomous Region of Azores – October 2009 Page 5
fundamental. In this perspective, the River Basin District Management Plan of the Azores will be finalised in 201012, combining the tools of the water management plans of each of the islands to achieve regional coherence. Across the nine islands, the plan will define ways of improving the management of water, in particular focusing on the preservation of aquifers, the clear definition of recharging areas, biodiversity areas and agriculture and livestock areas, and on the increase of rain water storage. Large GHG emissions are derived from air transportation and the primary sector of the economy. Indeed, intensive air transportation is required due to the distances between the nine islands. Moreover, 86% the gross value added (GVA) of the primary sector comes from agriculture, especially cow meat production (19%) and cow milk production (54%), which produce significant amounts of methane. The Regional Authorities are aware of this issue and want to balance these specific regional GHG emissions by increasing the share of renewable energy sources in the gross inland energy consumption. In this perspective, the regional energy sector pursues three main objectives: increasing the penetration of electricity in the primary energy structure: raising the
electricity rate in energy consumption from the current 40% to 50% by 2018; this should be reached by replacing gas appliances with electric ones, promoting solar panels for heating, promoting the use of electric and hybrid vehicles, and establishing differentiated tariffs during certain hours to increase the price competitiveness of electricity relative to other energy sources;
increasing the penetration of renewable energy in the electricity sector from the current 28% to 75% by 2018; this should be reached by setting up an adequate business environment for investors in RES and allowing micro-generation from households and small and medium enterprises (SMEs), and through the use of incentives and tax schemes.
increasing the production of renewable energy in other sectors such as biomass, solid waste, animal waste, etc. ; so that RES production will increase from the current 12% of primary energy consumption to 40% by 2018.
This integrated way of managing energy – increasing the use of electricity in order to be able to integrate RES in smaller islands and create markets, decreasing the charge diagram13 to allow a larger proportion of RES, and implementing tax mechanisms to promote the use of renewable energies – will be one of the priorities of the regional climate change strategy.
12 http://www.diariodosacores.pt/index.php?option=com_content&view=article&id=1979:plano-de-gestao-de-
recursos-hidricos-pronto-em-2010&catid=44:ambiente
13 The difference in consumption between day and night time

EX-POST EVALUATION OF COHESION POLICY PROGRAMMES 2000-2006 CO-FINANCED BY THE EUROPEAN FUND FOR REGIONAL DEVELOPMENT (OBJECTIVES 1 AND 2) - WORK PACKAGE 5B: ENVIRONMENT AND CLIMATE CHANGE ADE
Climate Change Case Study – The Autonomous Region of Azores – October 2009 Page 6
1.4 Institutional framework for climate change issues
Regional Secretariat of the Environment and Sea
The 10th Regional Government of Azores, with the Regional Decree 25/2008 of 31st of December 2008, produced changes that highlighted the commitment to addressing climate change issues. In fact, the Regional Directorate of Energy was created under the Regional Secretariat of the Environment and Sea (SRAM). Until that date, the Regional Directorate of Commerce, Industry and Energy administered the energy sector. The Regional Secretariat of the Environment and Sea also includes the Regional Directorate of the Environment and the Regional Directorate of Water Resources and Territorial Planning. Besides, it includes the sub-secretariat of fisheries, as well as Environmental Inspection and Fisheries Inspection. The three regional directors of the SRAM are involved in the settlement of the regional strategy to address climate change. They also participated in the establishment of the Portuguese National Strategy. The group elaborating the Regional Strategy is also composed of representatives of other secretariats.
Azorean energy agencies
One company – EDA – has directly or through subsidies the monopoly of the electricity production, transport and distribution on the nine islands of the Autonomous Region of Azores. The company EDA (mother company) is 50.1% owned by the Government of the Autonomous Region of Azores, 39.7% owned by a private group of the region, 10% owned by EDP14 and 0.2% owned by small shareholders.
EDA owns 99% of the Empresa de Electricidade e Gaz (EEG), Lda that produces renewable energy from wind and micro-hydro power plants. EDA also owns 99.3% of Sociedade Geotérmica dos Açores, S. A. that produces geothermal energy in the Island of São Miguel and 50.04% of Sociedade Geoeléctrica da Terceira, S. A. – the remaining share belonging to EDP – that is prospecting geothermal energy on Terceira Island15.
EDA also owns detains 90% of the company Serviços de Engenharia, Gestão e Manutenção, Lda. – the remaining 10% belonging to EEG – which deals with technical services, maintenance, implementation of projects, as well as inspection and surveillance.
14 EDP is the main electricity production and distribution company in mainland Portugal 20% owned by the State and
5% by a public bank. Until the liberalization of the electricity market in the Iberian Peninsula in 2006, EDP had the monopoly in electricity distribution in mainland Portugal.
15 If success in prospection is achieved, the first plant is expected to start operating in 2011.

EX-POST EVALUATION OF COHESION POLICY PROGRAMMES 2000-2006 CO-FINANCED BY THE EUROPEAN FUND FOR REGIONAL DEVELOPMENT (OBJECTIVES 1 AND 2) - WORK PACKAGE 5B: ENVIRONMENT AND CLIMATE CHANGE ADE
Climate Change Case Study – The Autonomous Region of Azores – October 2009 Page 7
Figure 3: Organisation of the electricity supply in the Autonomous Region of Azores (2009)
Source: ADE based on information from EDA, 2009
EDAA public-private group:• with a monopolistic position in
the regionfor tranport and distribution (9 islands)
• Producer of thermal energy (fuel)
SOGEO EEGGEOTerceira
• Geothermal energy in the island of São Miguel
• Installed capacity: 23 MW (2008)
• Geothermal energy in the island of Terceira
• Prospection phase (2005-2009)
• Power plant expected in 2011
• Wind energy; installed capacity: 7 MW (2005)
• (Mini) hydro energy; installed capacity: 8.1 MW (2008)


EX-POST EVALUATION OF COHESION POLICY PROGRAMMES 2000-2006 CO-FINANCED BY THE EUROPEAN FUND FOR REGIONAL DEVELOPMENT (OBJECTIVES 1 AND 2) - WORK PACKAGE 5B: ENVIRONMENT AND CLIMATE CHANGE ADE
Climate Change Case Study – The Autonomous Region of Azores – October 2009 Page 9
2. Coherence between the OP, Challenges and the Regional Strategy
During the 2000-2006 period and among all the NUTS 2 regions of Portugal, only the Autonomous Region of Azores addressed directly the climate change issue through the ERDF support. At the beginning of the 2000-2006 period, ERDF supported the electricity production from fossil fuel as the main challenge was the wide supply of energy and the assurance of stability. However, the priority of the government shifted to the penetration of renewable energy sources in the 2003-2004 period. As a consequence, ERDF supported investments and research in the development of renewable energy sources. In addition, ERDF addressed adaptation to climate change through co-financed investments (€4m) in the correction of the torrential regime16 of some creeks as well as co-financed investments (€20m) in the protection and requalification of coastal areas.
Besides, the ERDF also co-financed the regional Programme of Innovation Actions (PRAI) which invested €2.44m (the ERDF provided €2m) in the field of renewable energy, including the feasibility of the use of hydrogen as a renewable energy source (RES). There has also been good articulation with other EC initiatives such as Interreg (Azores Islands – Madeira – Canary Islands). The EC initiative funds were used: to assess the potential of the different renewable energies in the archipelago ; to develop governance tools to overcome obstacles to the development of renewable
energy sources (RES) – development of common legal frameworks between the different autonomous regions, development of energy management tools including at the urban level, awareness raising and training;
to support research in technology and in energy saving and energy efficiency ; to support awareness campaigns – on energy efficiency and use of RES.
16 Permanently flowing mountain river fed by torrential streams, which has a torrential regime.


EX-POST EVALUATION OF COHESION POLICY PROGRAMMES 2000-2006 CO-FINANCED BY THE EUROPEAN FUND FOR REGIONAL DEVELOPMENT (OBJECTIVES 1 AND 2) - WORK PACKAGE 5B: ENVIRONMENT AND CLIMATE CHANGE ADE
Climate Change Case Study – The Autonomous Region of Azores – October 2009 Page 11
3. Achievements of the co-funded 2000-2006 OP
According to Regional Directorate of Planning and Structural Funds, the Objective 1 Programa Operacional para o Desenvolvimento Economico e Social dos Açores (PRODESA) for the programming period 2000-2006 implemented a specific measure in the energy field17, including renewable energy projects. Objectives of this measure were to: strengthen the capacity for producing electricity; increase the reliability and effectiveness of the transport and distribution of electrical
energy; improve levels of energy efficiency and cost effectiveness; increase the penetration of renewable and endogenous energy, especially from geothermal
energy; minimise environmental impacts of the implementation of electrical systems in order to
use clean and efficient electric energy.
These objectives were pursued through: the construction and the renovation of power plants (fossil fuels, geothermal wind or
hydro); the construction and the renovation of electricity transportation and distribution; the development of security and information/communication systems; the installation of pollution reduction equipment in fossil fuel power plants; studies and projects for improving energy efficiency and efficiency levels.
Table 3: PRODESA budget devoted to renewable energy sources (RES) for the period 2000-2008
Projects under Measure 5.3 of PRODESA dealing with RES
Execution body Approved budget (€ m) National
contribution ERDF
contribution Renovation and automatisation of the mini hydro power plant of Tuneis
EEG 1.30 1.30
Renovation of the mini hydro power plant of Além Fazenda
EDA 0.15 0.15
Wind energy development plan EDA 3.55 3.55
Deviation of the Ribeira do Meio creek and increase of the head of the Além Fazenda dam
EDA 0.30 0.30
Prospection studies for the geothermal power plant in the island of Terceira
GEOTerceira 4.28 4.28
Mini hydro power plant of Salto do Cabrito EEG 1.03 1.03
Construction of geothermal power plant of Pico Vermelho
SOGEO 10.25 10.25
Deviation of the Ribeira do Cascalho creek to reinforce the flow into the Além Fazenda dam
EEG 0.92 0.92
TOTAL - 20.97 20.97
Source: Management authority of PRODESA, 2009
17 Measure 5.3 of PRODESA.

EX-POST EVALUATION OF COHESION POLICY PROGRAMMES 2000-2006 CO-FINANCED BY THE EUROPEAN FUND FOR REGIONAL DEVELOPMENT (OBJECTIVES 1 AND 2) - WORK PACKAGE 5B: ENVIRONMENT AND CLIMATE CHANGE ADE
Climate Change Case Study – The Autonomous Region of Azores – October 2009 Page 12
The ERDF co-financed 50% of the total budget devoted to energy, which is equivalent to €79.1m. This specific measure corresponds to about 10% of the total budget of the PRODESA. 53% of the total budget devoted to energy supported investments or studies in renewable energy sources (RES), which corresponds to €41.9m (€20.97m from the ERDF and €20.97m from regional budget of the Azores Islands). Table 3 above shows the full list of the projects in the field of renewable energy.
Table 4 hereafter shows monitored indicators related to renewable energy projects supported by the ERDF during the 2000-2006 programming period.
Table 4: PRODESA output indicators related to renewable energy sources (RES)
Ouput indicator Programmed Approved PerformedNew/extended hydro-electric power stations
5 5 5
New geothermal projects 1 2 2
New/extended wind energy farms 8 5 5
Source: PRODESA, Implementation report, 2007 and Management authority of PRODESA.
Regarding geothermal energy, PRODESA allowed for the carrying out of two projects instead of one as planned. In addition to the construction of the Pico Vermelho18 power plant, €8m was invested in the prospection of geothermal wells on Terceira Island.
Five out of the eight new or extended wind energy farm projects targeted were carried out (62.5% of the target). In reality, the EEG built or expanded seven wind farms but not all of them were co-financed by the ERDF. This was explained by the difficulty of applying the ERDF funding procedures in the context of the archipelago.
Through PRODESA, the ERDF contributed to obtaining the following results: creation of a new production capacity of 10 MW (the Pico Vermelho power plant), which
corresponds to an increase of around 5% in the penetration rate of renewable energy in the Autonomous Region of the Azores;
an increase in the installed power (+ 900 kW) at the wind farm on Santa Maria Island; an increase in the installed power (+ 600 kW) at the wind farm on Graciosa Island; an increase in the installed power (+ 600 kW) at the wind farm on São Jorge Island; construction of the wind farm on Faial Island with an installed power of 1,800 kW; construction of the wind farm on Flores Island with an installed power of 600 kW.
The significant increase in 2002-2003 of wind farms resulted from projects co-financed by the ERDF. Before PRODESA there were around 1,030 kW of wind power installed on Santa Maria, São Jorge and Graciosa; some of them were already in bad condition.
Thanks to PRODESA, an extra 4,500 kW of wind power was installed. As a result of the new installed capacity due to the ERDF contribution, wind power production has significantly increased in five Islands: Santa Maria, Graciosa, São Jorge, Faial and Flores (cf. figure 3 hereafter).
18 The geothermic central of Pico Vermelho is situated on São Miguel Island.

EX-POST EVALUATION OF COHESION POLICY PROGRAMMES 2000-2006 CO-FINANCED BY THE EUROPEAN FUND FOR REGIONAL DEVELOPMENT (OBJECTIVES 1 AND 2) - WORK PACKAGE 5B: ENVIRONMENT AND CLIMATE CHANGE ADE
Climate Change Case Study – The Autonomous Region of Azores – October 2009 Page 13
Concerning hydro-electric energy, PRODESA supported three interventions in three different power plants: Além Fazenda on Flores Island, as well as Túneis and Salto do Cabrito on São Miguel Island. The Além Fazenda plant interventions included three different projects: deviation of creeks, improvement of the dam, and refurbishing of the power plant itself.
Figure 4: Time series (1999-2008) of wind power production on the Azores Islands in which PRODESA funded projects in renewable energy
Source: ADE based on information provided by EEG, 2009
The increase in the production of hydropower (cf. figure 4 hereafter) is less remarkable than for wind power partly due to the variable nature of the rain. However, there has been an increase relative to the historical average of hydro-electric power produced, due to plants being renovated or constructed with the ERDF support.
Santa Maria
Wind electricity productionMWh
Year
São Jorge
Graciosa
Faial
Flores
2,053
2,068
533 546
1,752 1,7171,958 2,045
1,496
1,7111,437
1,8161,827
2,837
3,251
2,6762,511
2,079
1,213
3,671
3,059
2,726
0
500
1,000
1,500
2,000
2,500
3,000
3,500
4,000
1999 2000 2001 2002 2003 2004 2005 2006 2007 2008
Wind electricity MWh MWh MWh MWh MWh MWh MWh MWh MWh MWh
1999 2000 2001 2002 2003 2004 2005 2006 2007 2008Santa Maria 421 256 70 583 2,209 2,284 2,439 2,419 2,053 2,068Graciosa 533 497 546 462 1,655 1,752 1,717 1,958 2,045 1,496São Jorge 1,711 1,437 1,816 1,827 2,837 3,251 2,748 2,676 2,511 2,079Faial 0 0 0 1,213 2,080 2,740 3,015 3,671 3,059 2,726Flores 0 0 0 273 1,473 1,769 1,672 1,816 1,773 2,040

EX-POST EVALUATION OF COHESION POLICY PROGRAMMES 2000-2006 CO-FINANCED BY THE EUROPEAN FUND FOR REGIONAL DEVELOPMENT (OBJECTIVES 1 AND 2) - WORK PACKAGE 5B: ENVIRONMENT AND CLIMATE CHANGE ADE
Climate Change Case Study – The Autonomous Region of Azores – October 2009 Page 14
Figure 5: Time series (1999-2008) of hydro power production on the Azores Islands in which PRODESA funded projects in renewable energy
Source: ADE based on information provided by EEG, 2009
Tuneis (Group II)
Hydroelectricity productionMWh
Year
Salto Cabrito
Alem Fazenda

EX-POST EVALUATION OF COHESION POLICY PROGRAMMES 2000-2006 CO-FINANCED BY THE EUROPEAN FUND FOR REGIONAL DEVELOPMENT (OBJECTIVES 1 AND 2) - WORK PACKAGE 5B: ENVIRONMENT AND CLIMATE CHANGE ADE
Climate Change Case Study – The Autonomous Region of Azores – October 2009 Page 15
4. Contribution of PRODESA to Reducing GHG Emissions
4.1 Effectiveness of the projects co-funded by the ERDF
As stated previously, only 10% of the PRODESA were allocated to energy projects. While designing the operational programme (1999), climate change was not at the top of the political agenda19. Consequently, at the outset of the implementation of the PRODESA, the investments in energy concerned the increase in electricity production using fossil fuel power plants and in the stability of the electricity provided. PRODESA really started to support the development of renewable energies (hydro, wind and geothermal energy) around the mid-term of the programming period (2003-2004).
As a result, no quantitative target in terms of GHG emissions (t CO2 equivalent) or in terms of green installed power (MW) was defined in the programming documents. It is thus not possible to assess the effectiveness of the programme in terms of renewable energies supported compared to expected targets.
4.2 Impact of the projects supported by the ERDF
Even if no target was defined at the beginning of the implementation of PRODESA, some data concerning green installed capacities (MW) and produced green electricity (MWh) have been communicated by the EDA group. However, it is not possible to attribute these achievements solely to ERDF support for two main reasons: companies of the EDA group also made additional investments in the supported
projects without the ERDF; other funds or programmes – Interreg or the MIT research strategy – have supported
the development of renewable energy in the Autonomous Region of Azores from the very outset or during the implementation of these projects (research projects, feasibility studies, etc.).
With some assumptions, it is nevertheless possible to assess the reduction of GHG emissions due to investments – all financial sources included when the ERDF can not be isolated – in renewable energies in the Autonomous Region of Azores during the 2000-2008 programming period.
19 Portugal approved the National Plan for Energy Efficiency in 2008.

EX-POST EVALUATION OF COHESION POLICY PROGRAMMES 2000-2006 CO-FINANCED BY THE EUROPEAN FUND FOR REGIONAL DEVELOPMENT (OBJECTIVES 1 AND 2) - WORK PACKAGE 5B: ENVIRONMENT AND CLIMATE CHANGE ADE
Climate Change Case Study – The Autonomous Region of Azores – October 2009 Page 16
To that purpose, it is assumed that each of the nine islands has its own CO2 emission factors (cf. Table 5 hereafter). In fact, the islands are nine different entities with nine different energy mixes. According to the EEG, the CO2 emission factors in the islands of São Miguel and Flores are lower than for other islands due to their higher penetration rate of renewable energies. Two types of coefficient factors can be considered: the CO2 emission factor (g/kWh) for the whole energy mix of each island. This
coefficient includes all energy sources of the island to produce electricity; i.e. fossil fuel and renewable energy sources (geothermal, wind, hydro);
the CO2 emission factor for fossil fuel power plants of each island: this coefficient only takes into consideration electricity produced from fossil fuels.
The difference between both coefficients shows the improvement in the energy efficiency to produce the same quantity of electricity from an energy mix including renewable energy sources.
Table 5: CO2 emission factors (g/ kWh) of the nine Azores Islands
Island
CO2 emission factor (g/ kWh) for the whole energy mix (including fossil fuel and
renewable energy sources) (1)
CO2 emission factor for fossil fuel power plants (g/ kWh) (2)
Difference between CO2 emission factors
[(2)- (1)] (g/ kWh)
Santa Maria 614.7 720.6 105.9
São Miguel 343.7 623.8 280.1
Terceira 589.8 658.2 68.4
Graciosa 607.6 685.5 77.9
São Jorge 623.3 704.3 81
Pico 577.5 684.0 106.5
Faial 644.8 698.7 53.9
Flores 382.8 799.0 416.2
Corvo 746.6 746.6 0
Source: EEG, 2009.
For illustration, Table 6 hereafter shows assessed GHG emissions avoided due to supported projects in renewable energy (geothermal electricity, hydroelectricity and wind electricity) for the year 2008.

EX-POST EVALUATION OF COHESION POLICY PROGRAMMES 2000-2006 CO-FINANCED BY THE EUROPEAN FUND FOR REGIONAL DEVELOPMENT (OBJECTIVES 1 AND 2) - WORK PACKAGE 5B: ENVIRONMENT AND CLIMATE CHANGE ADE
Climate Change Case Study – The Autonomous Region of Azores – October 2009 Page 17
Table 6: Assessed GHG emissions avoided due to projects in renewable energy sources in the Autnomous Region of Azores
Project Location
CO2 emission factor (g/ kWh) for the whole energy mix
(including fossil fuel and renewable energy sources)
Green electricity produced in 2008
(kWh)
GHG emission
avoided in 2008 (kt)
Geothermal electricity
Geothermal power plants (total) São Miguel 343.7 170,280,213 58.53
Hydro electricity
Hydropower plant in Túneis São Miguel 343.7 7,373,740 2.53
Hydropower plant in Salto do Cabrito São Miguel 343.7 2,894,380 0.99
Hydropower plant in Além Fazenda
Flores 382.8 3,731,920 1.43
Wind electricity
Wind turbines (total) Santa Maria 614.7 2,068,150 1.27
Wind turbines (total) Graciosa 607.6 1,496,370 0.91
Wind turbines (total) São Jorge 623.3 2,078,720 1.30
Wind turbines (total) Faial 644.8 2,726,070 1.76
Wind turbines (total) Flores 382.8 2,040,310 0.78
Source: ADE based on information communicated by EDA and EEG, 2009.
4.3 Efficiency of the projects supported by the ERDF
Benchmarks used by the evaluator to asses the efficiency of the co-funded projects under 2000-2006 ERDF programmes
EU ETS market :
The EU allowance spot price is currently (phase II of the EU ETS market: the 2008-2012 period) around €12 while the ongoing economic crisis (2008/2009) pushes this price down. Without the economic crisis this price should be around €25. The expected prices for phase III (post-Kyoto: after the 2008-2012 period) is around €30.
Literature review:
- Elzen et al. (2007)20 gives a marginal abatement cost associated with the EU reduction objectives between €23 and €93 (2005)/t CO2 ;
- Kuik et al. (2009)21 assesses that the marginal abatement cost for a 500 ppm target in 2025 is between €37 and €119 (2005)/t CO2.
20 Elzen M.G.J., Lucas P.L., Gijsen A. (2007), “Exploring European Countries’ Emission Reduction Targets, Abatement
Costs and Measures Needed Under the 2007 EU Reduction Objectives,” Netherlands Environmental Assessment Agency (MNP).
21 Kuik O., Brander L., R.S.J. Tol (2009), “Marginal abatement costs of greenhouse gas emissions: A meta-analysis,” Energy Policy 37(4).

EX-POST EVALUATION OF COHESION POLICY PROGRAMMES 2000-2006 CO-FINANCED BY THE EUROPEAN FUND FOR REGIONAL DEVELOPMENT (OBJECTIVES 1 AND 2) - WORK PACKAGE 5B: ENVIRONMENT AND CLIMATE CHANGE ADE
Climate Change Case Study – The Autonomous Region of Azores – October 2009 Page 18
As explained above, it is impossible to isolate projects that were only co-funded by the ERDF. Assessing the efficiency of these projects is thus not possible.
4.4 Profitability of the co-funded projects
The definition of the profitability used in the context of this evaluation :
“The profitability is the ability of an enterprise to generate net income on a consistent basis. If a specific intervention generates a net income for an enterprise, this enterprise can decide to invest (part of) its capital to carry out this specific intervention. On the contrary, an unprofitable intervention will not attract an enterprise to invest. Public funds can then contribute to remove barriers to private investments, especially when the intervention generates a social benefit (for example, reducing GHG emissions).
The profitability of a project for an enterprise can be measured by the internal rate of return22 (IRR) or the net payback time of this project. If the IRR is greater than the cost of capital of the project, the project will add value for the enterprise and then this enterprise should decide to invest. A negative or low IRR and a (very) long net payback time are barriers to private investments.”
The selection procedure did not include an assessment of the profitability of projects in renewable energy sources to be co-financed by the ERDF. In addition, no information is available about the profitability of the different renewable energy sources in the Autonomous Region of Azores. However it can be assumed that the selection of one or another renewable energy sources takes into account endemic characteristics of the region and not the only profitability. The Autonomous Region of Azores has natural craters of ancient and dormant volcanoes with geothermal activities. As a consequence the region exploits geothermal power to produce electricity, which is feasible at a fewer extent on the Portuguese mainland.
In the case of geothermal energy, feasibility studies are long (several years) and costly. Results of these studies determine if a geothermal plant to produce electricity is possible or not. If yes, huge investments are needed before producing the first Megawatt hour of electricity. On the contrary developing wind turbines is faster than developing geothermal energy. The internal rate of return of a project in geothermal energy and the internal rate of return of a project in wind energy are different. In other words their profitability is different and public funds have to be adjusted taking into account this difference.
22 A project is a good investment proposition for an enterprise if its IRR is greater than the rate of return that could be
earned by alternate investments of equal risk (for example, investing in other projects or putting the money into a bank account). The IRR should then be compared to any alternate costs of capital including an appropriate risk premium if the IRR is greater than the project's cost of capital, or hurdle rate, the project will add value for the company.

EX-POST EVALUATION OF COHESION POLICY PROGRAMMES 2000-2006 CO-FINANCED BY THE EUROPEAN FUND FOR REGIONAL DEVELOPMENT (OBJECTIVES 1 AND 2) - WORK PACKAGE 5B: ENVIRONMENT AND CLIMATE CHANGE ADE
Climate Change Case Study – The Autonomous Region of Azores – October 2009 Page 19
5. Contribution of PRODESA to Socio-Economic Development
An assessment of the PRODESA contribution to socio-economic development is difficult as detailed information is not available. In particular, no information is available on direct or indirect job creation related to PRODESA support to renewable energy. However it can be assumed that co-funded interventions in projects in renewable energy sources have contributed to some extent to the creation of temporary indirect jobs taking into account supply of materials (equipment, construction materials, etc.) and construction work.
On the other hand, the improvement in the energy production process reduced the number of direct jobs. For example, one of the hydro-power plants supported by PRODESA (Salto do Cabrito) employed three workers for maintenance and control of the plant. The plant was rebuilt and is currently operated remotely. Some of the workers have now been relocated to other plants and others have retired. The geothermal power plant, as well as the wind farms are also operated remotely and do not require resident staff.
Since the Government of the Autonomous Region of the Azores reduced the use of fossil fuels, which corresponds to one of the main expenses in the yearly budget, the savings were invested in other types of socio-economic projects. Similarly, since EDA reduced the losses in the energy grid there is increased potential for lower electricity tariffs.
In addition, there has been an increase of 60% in energy consumption and a growth of 72% in GDP between 1990 and 2004. Arguably, it can be stated that the investments on increasing production and on the improvement of the quality of electricity provided, had a significant impact on the overall regional economy.

EX-POST EVALUATION OF COHESION POLICY PROGRAMMES 2000-2006 CO-FINANCED BY THE EUROPEAN FUND FOR REGIONAL DEVELOPMENT (OBJECTIVES 1 AND 2) - WORK PACKAGE 5B: ENVIRONMENT AND CLIMATE CHANGE ADE
Climate Change Case Study – The Autonomous Region of Azores – October 2009 Page 20
6. Management of the Co-Funded Projects
In the late 1990s, PRODESA was designed in accordance with the strategy and action plan of the Government of the Autonomous Region of the Azores (RGoA). In the process of designing the programme, the RGoA discussed the priorities and measures to be proposed with the stakeholders involved in the energy sector.
Since there is only one player in the Azorean energy sector (EDA) and as this player is mainly owned by the RGoA, the measures were defined by direct negotiation. The priority needs of the region and imbalances between the nine islands, as well as the strategy and investment plan of EDA for the period were taken into consideration.
While climate change issues were not very high in the agenda at the time of the elaboration of the PRODESA, there was no selection process on the proposals submitted to the ERDF based on GHG emission reduction. Nevertheless, the Regional Direction of Planning and Structural Funds – which managed the 2000-2006 ERDF – ensured that the proposals comply with ERDF rules and guidelines and also ensured that the projects focused on the priorities of regional strategies.
As stated above, at the start of PRODESA, the main objective was to supply the population of the Azores with good quality (stability of the current) electricity. In 2003-2004, once that basic aspect had been greatly addressed, the main objective of the RGoA shifted towards increasing the penetration of renewable energy. This change of focus of the measure of the PRODESA dealing with energy was transmitted to EDA for modifying the types of projects to be selected and co-funded by the ERDF.
The monitoring of the PRODESA (supported by the ERDF) in terms of the energy sector was mainly done for financial information. With the exception of output indicators such as the number of projects financed by the programme (cf. Table 4), no other indicator related to the creation or the renovation of green installed capacity and electricity produced from renewable energy sources (RES) was monitored by the management authority of PRODESA. Consequently, no monitoring of GHG emission reduction due to the PRODESA was carried out. However, EDA has monitored electricity produced from RES for each installation in each island: wind turbines and hydropower plant by EEG, and geothermal power plants by SOGEO. Based on CO2 emission factors specific to each island (cf. section 4 Contribution of PRODESA to reducing GHG emissions), EDA was also able to assess the reduction of GHG emissions due to renewable energy projects. As there is only one actor in the electricity sector in the Autonomous Region of the Azores23, stringent rules makes the absorption of funds difficult. In some cases, EDA had to use direct adjudication and ended up supporting entire RES projects due to stringent rules to obtain ERDF support. Consequently, some of the targets of the PRODESA were not met and ERDF support was reallocated to other co-funded projects. This is specifically the case for wind farms: seven wind turbines were built in reality but only five of them were finally co-funded by the ERDF.
23 Interviewed stakeholders explained the monopoly position of EDA (and mainly owned by the Government) by the
fact that specificities of the Autonomous Region of Azores – nine different islands with no possible grid connections between them – do not attract private companies to invest in the energy sector in the region.

EX-POST EVALUATION OF COHESION POLICY PROGRAMMES 2000-2006 CO-FINANCED BY THE EUROPEAN FUND FOR REGIONAL DEVELOPMENT (OBJECTIVES 1 AND 2) - WORK PACKAGE 5B: ENVIRONMENT AND CLIMATE CHANGE ADE
Climate Change Case Study – The Autonomous Region of Azores – October 2009 Page 21
7. Evolution to the 2007-2013 Programming Period
In the 2007-2013 programming period, large investments in energy infrastructure have moved to the Cohesion Fund (cf. Table 6 hereafter). The 2007-2013 operational programme – PROCONVERGENCIA – finances PROENERGIA which is an incentives scheme for households and SMEs. The aim of PROENERGIA is to facilitate investments in the use of energy from renewable resources (hydro, wind, biomass, solar photovoltaic, and solar thermal for heating water), as well as to develop energy management systems in buildings to increase energy efficiency. Incentives mainly focus on auto-consumption but also allow for the micro-generation of electricity and its sale to the grid with a maximum of 20% of the energy produced.
The Cohesion Fund (CF) will co-finance investments in renewable energy sources through the Territorial Enhancement Programme. In this case, the managing authorities will monitor the reduction of GHG emissions resulting from co-funded projects aiming at moving from fossil fuel electricity production to renewable energy electricity.
Table 7: Expected investments in renewable energy sources through the Cohesion Fund for the 2007-2013 period
Foreseen Investments on RES in the Azores until 2013
Island Type of Production
Type of Investment
Power to be installed
[kW]
Yearly Average of
Energy [MWh]
Avoided Consumption of Fuel CO2 emission avoided [ton]
Santa Maria Wind Increase capacity
660 2,034 560,570 L
(diesel) 1,498
São Miguel Geothermal
Increase capacity
10,000 83,220 17,110,032 kg
(fuel) 52,932
Geothermal New Power
Plant (a) 8,000/ 12,000 66,576/ 99,864 13,688,025/ 20,532,038
kg (fuel)
42,345/ 63,518
Terceira Wind
New Power Plant
4,500 10,000 2,081,000 kg
(fuel) 6,438
Geothermal New Power
Plant 12,000 79,000 16,439,900
kg (fuel)
50,859
Graciosa Wind Increase capacity
660 2,633 698,535 L
(diesel) 1,867
São Jorge Wind
Increase capacity
990 4,051 1,084,048 L
(diesel) 2,897
Hydro New Power
Plant 980 3,066 820,462
L (diesel)
2,193
Pico Wind Increase capacity
660 3,095 670,377 kg
(fuel) 2,074
Faial Wind Increase capacity
990 2,946 641,639 kg
(fuel) 1,985
Flores Hydro
Increase capacity/
renovation 1,600 5,282 1,506,955
L (diesel)
4,028
Hydro New Power
Plant 1,040 5,035 1,436,486
L (diesel)
3,839
TOTAL 46,080 242,862 6,107,055
L (diesel)
157,642 45,680,948
kg (fuel)
Source: Assessor of the President of the RGoA for economical affairs and external cooperation (Former Regional Director of Commerce, Industry and Energy), 2009.


EX POST EVALUATION OF COHESION POLICY PROGRAMMES 2000-2006 CO-FINANCED BY THE EUROPEAN FUND FOR REGIONAL DEVELOPMENT (OBJECTIVES 1 AND 2) - WORK PACKAGE 5B: ENVIRONMENT AND CLIMATE CHANGE ADE
Regional Case study – The Autonomous Region of Azores – July 2009 Page 23
Annex: List of Stakeholders Interviewed
Date Name Position Institution
Wednesday 17 June 2009
José Luis Pimentel Amaral
Coordinator of the Economic affairs and of the External Cooperation; and President of ARENA
Autonomous Region of Azores, Regional Agency for Energy and the Environment (ARENA)
Doutor José Cabral Vieira
Regional Director Autonomous Region of Azores, Regional Secretary of the Environment and Sea, Regional Direction of Energy
Frederico Cardigos Regional Director Autonomous Region of Azores, Regional Secretary of the Environment and Sea, Regional Direction of the Environment
Thursday 18 June 2009
Carlos Alberto Bicudo da Ponte
Managing Director EDA Group
David Estrela Manager EDA Group, Empresa de Electrtricidada e Gaz, Lda
Friday 19 June 2009
Rui Amann Regional Director Autonomous Region of Azores, Vice-presidency of the Regional Government, Regional Direction of Planning and Structural Funds
Andreia Bretão Responsible for Monitoring and Evaluation Autonomous Region of Azores, Vice-presidency of the Regional Government, Regional Direction of Planning and Structural Funds


Annexes


EX-POST EVALUATION OF COHESION POLICY PROGRAMMES 2000-2006 CO-FINANCED BY THE EUROPEAN FUND FOR REGIONAL DEVELOPMENT (OBJECTIVES 1 AND 2) - WORK PACKAGE 5B: ENVIRONMENT AND CLIMATE CHANGE ADE
Final report – Volume 2 – October 2009 Annex 1 / Page 1
Annex 1: Methodology for the waste prevention and management of waste case studies
1. General strategic context
Justification: A brief description of the general strategic context of waste generation in the region since 1990, if available and (regional) economic growth will be provided. Indeed, a link between high GDP growth and growth in waste volume is often evident, as shown by recent studies. Connections between waste generation, economic growth and consumption will be examined.
Field Indicators Sources Regional economic performance
GDP/capita (2000-2006)Employment rate (2000-2006) + 1990-2000
Eurostat regional + WP1 data
Environmental investment by public sector/industry/private sector
Investments by sector in % of GDP at regional level (period 1990-2000)
Eurostat regional data (to be checked)
Environmental situation regarding solid waste
Trends in waste generation since 1990 by waste stream
Eurostat /national sources (to be checked) Interviews with regional authorities
Direct activities linked to solid waste
Turnover/ employment in activities linked to solid waste
Eurostat/ national sources
2. Context of waste management for each region
Justification: A brief description of the general situation in the selected region in the context of waste management will be provided, including coverage of general background information (territory, population, regional waste figures compared to national and EU figures), competences in waste management, specific waste legislation, and organisation of waste management (municipal and industrial), all taking account of the availability of data and of the targeted contact persons for the evaluation.
Field Indicators Sources
General regional data Territory (km²) ;Population (inhabitants) (rural/urban)
Eurostat regional data + WP1 data
Competent bodies for waste management
Entity/entities: area of responsibility (for each entity)
Interviews with regional authorities
Organisation of waste management (municipal and industrial)
Description by waste stream Interviews with regional authorities

EX-POST EVALUATION OF COHESION POLICY PROGRAMMES 2000-2006 CO-FINANCED BY THE EUROPEAN FUND FOR REGIONAL DEVELOPMENT (OBJECTIVES 1 AND 2) - WORK PACKAGE 5B: ENVIRONMENT AND CLIMATE CHANGE ADE
Final report – Volume 2 – October 2009 Annex 1 / Page 2
3. Description of regional strategy for solid waste
Justification: The regional strategy for waste management and waste generation developed by region in response to the specific context has to be described in order later to compare ERDF contribution to this strategy.
What was the regional trend in solid waste management in the fields addressed by ERDF interventions during the programming period? Short description of the regional strategy of waste management
Explicitly description of regional or even local policies for waste prevention
Sources: interviews with stakeholders among others Short description of the regional strategy of waste generation
Sources: interviews with stakeholders among others Prevention measures by waste stream Describe main prevention measures by waste stream
Source: Interviews with regional authorities and stakeholders Trends in waste generation by waste streamWaste production
Waste generation by waste type and stream (municipal, packaging, other) (kg/capita) 2000-2006
Eurostat regional data
Waste collection
Description of waste collection by type of waste including potential evolution over the period
Interviews with regional authorities
Waste treatment
Description of waste treatment infrastructures by type of infrastructure including: population covered, year of construction, types of waste treated, capacity, type of installation, type of technology, investment and operation costs
Interviews with regional authorities
Main projects carried out by other public funds (EIB, etc.)Waste projects and investments
Description of the projects and the way they have been supported
Interviews with regional authorities
Management of interventions Selection process for projects (criteria and decision
process); application of CBA to major projects Interviews with regional/national authorities
4. European trends in waste generation and management for each relevant
waste stream (2000 - 2006) - benchmark
Justification: European trends in waste generation and management will be provided as a benchmark to facilitate comparisons.
Field Indicators Sources
Waste production (which type of waste? Municipal solid waste- packaging waste, other?)
Waste generation by type of waste stream (municipal, packaging, other, in kg/capita) 2000-2006 for three European countries (best practice)
Eurostat national data
Waste collection (by type of waste)
Recycling rate by type of waste stream Eurostat national data (or other)
Waste treatment (by type of waste)
2000-2006 for three European countries (best practice)
Eurostat national data (or other)

EX-POST EVALUATION OF COHESION POLICY PROGRAMMES 2000-2006 CO-FINANCED BY THE EUROPEAN FUND FOR REGIONAL DEVELOPMENT (OBJECTIVES 1 AND 2) - WORK PACKAGE 5B: ENVIRONMENT AND CLIMATE CHANGE ADE
Final report – Volume 2 – October 2009 Annex 1 / Page 3
5. Programme achievements in the field of environment
Justification: In order to clearly identify the intervention of Regional Funds for each waste area, along with an account of the main improvements achieved through the use of these funds, basic programme achievements need to be described. For each measure, individual projects that were financed will have to be identified and briefly described. They will be recorded on an Excel spreadsheet or using Access. A standard format will be provided following the first pilot mission. Actual implementation of ERDF interventions in the field of solid waste (by waste stream) correspond to the initial objectives, budget and actions?
Indicators Main sources Budget allocations and revision for solid waste Financial data
To be completed with local authorities
Number of solid waste projects by waste stream (targets and achievements)
Database WP2; to be completed with local authorities
New waste treatment capacity created (targets and achievements)
Database WP2; to be completed with local authorities
Type of treatment (if incineration is involved, additional information will be gathered on the performance of the installations in terms of air and water treatment, air and water pollutant emissions, types of residue treatment, and types of energy recovery. If available, the performance of each installation will be compared with values provided by the Directive on waste incineration (2000/76/EC)).
Interviews with local authorities
Number of landfills closed (targets and achievements) Database WP2; to be completed with local authorities
Number of landfills rehabilitated (targets and achievements)
Database WP2; to be completed with local authorities
Regional landfill situation in the light of conformity with the landfill Directive - 99/31/EC.
Interviews with local authorities
Other (targets and achievements) Interviews with local authorities

EX-POST EVALUATION OF COHESION POLICY PROGRAMMES 2000-2006 CO-FINANCED BY THE EUROPEAN FUND FOR REGIONAL DEVELOPMENT (OBJECTIVES 1 AND 2) - WORK PACKAGE 5B: ENVIRONMENT AND CLIMATE CHANGE ADE
Final report – Volume 2 – October 2009 Annex 1 / Page 4
6. Effectiveness of environmental expenditures to improve the environmental situation
Justification: the questions and indicators listed under this theme of effectiveness aim to establish a linkage between ERDF interventions in the field of solid waste management, global trends in waste management, and the main objectives in the field of solid waste.
What link can be made between ERDF interventions in the field of solid waste management in the region and the global trend?
Compare ERDF interventions to the observed global trend, analyse and explain the link
Indicators Main sources Describe contribution of ERDF funds to trends in waste
generation and prevention measures for each relevant waste stream during the period 2000-2006 (use quantitative indicators from question ahead)
Regional documents, interviews with stakeholders
Describe contribution of ERDF funds to trends in recycling rates for each relevant waste stream during the period 2000-2006
Regional documents, interviews with stakeholders
Describe contribution of ERDF funds to landfill situations in the light of conformity with the landfill Directive 99/31/EC
Regional documents, interviews with stakeholders
Describe contribution of ERDF funds to air and water pollutant emissions in the light of conformity with the Directive on waste incineration 2000/76/EC
Regional documents, interviews with stakeholders
Contribution to attainment of the “acquis communautaire” in the field of waste (by relevant waste streams)
Evaluation reports. Interviews with administration
New treatment technologies introduced Evaluation reports. Interviews with project stakeholders
Improvement of management systems Evaluation reports. Interviews with project stakeholders
What is the opinion of the main stakeholders on the appropriateness and impact of ERDF interventions in waste management in the region?
Improvement of environmental services (solid waste) - general level of satisfaction of stakeholders regarding the
evolution of waste management (limited to specific ERDF interventions in solid waste), listing practical consequences
- quality of waste management services (frequency, accessibility, adaptation to the needs of users)
Stakeholders (level of satisfaction – identification of complaints from waste treatment, etc.)
Control of waste management activities (solid waste)- management of complaints - number of accidents - indirect pollution - GHG emissions - Control over exports - Respect for legal constraints - Statistical follow-up
Satisfaction of stakeholders (level of satisfaction through existing surveys) National/regional documents

EX-POST EVALUATION OF COHESION POLICY PROGRAMMES 2000-2006 CO-FINANCED BY THE EUROPEAN FUND FOR REGIONAL DEVELOPMENT (OBJECTIVES 1 AND 2) - WORK PACKAGE 5B: ENVIRONMENT AND CLIMATE CHANGE ADE
Final report – Volume 2 – October 2009 Annex 1 / Page 5
7. Effectiveness in improving quality-of-life
Justification: This part tries to identify the contribution of environmental investments in waste management and waste treatment to some specific elements of the quality of life.
Improved sanitation Air pollution
(e.g. reduction of air pollution from municipal waste incineration plants)
Interviews with stakeholders
Water quality (e.g. reduction in water pollutants from diminished unauthorised landfills)
Interviews with stakeholders
Soil quality (e.g. reduction in water pollutants from diminished unauthorised landfills)
Interviews with stakeholders
Quality of waste management services (efficiency, frequency, accessibility, adaptation to the needs of users)
Interviews with stakeholders


EX-POST EVALUATION OF COHESION POLICY PROGRAMMES 2000-2006 CO-FINANCED BY THE EUROPEAN FUND FOR REGIONAL DEVELOPMENT (OBJECTIVES 1 AND 2) - WORK PACKAGE 5B: ENVIRONMENT AND CLIMATE CHANGE ADE
Final report – Volume 2 – October 2009 Annex 2 / Page 1
Annex 2 – Evaluation grid for Climate change case studies
Background information about the selected MS/ Region
What were the environmental situation and the related strategy in respect of climate change in the selected Member State/ Region at the beginning of the programming period?
Justification et field of the question
Climate change was not explicitly addressed through programmes implemented during the 2000-2006 programming period. However, some specific interventions were carried out in the field of climate change, especially in the use of renewable energies and improvement in energy efficiency. As the starting point, a clear picture of the climate change situation in the MS/ Region1 is needed. In addition, it is important to know the features of the national/regional strategy for mitigation and adaptation activities for combating climate change.
Indicators Sources How to proceed?
MS/ regional position in terms of climate change
Indicators recorded under Task 2
Eurostat (GHG emission, energy intensity consumption, etc.) and statistics from the MS/ Region
Interviews with key stakeholders (notably at the Ministry of Environment)
Based on different sources of information, the evaluation team will describe the situation in terms of the strategy for combating climate change (if any), the state of energy efficiency and GHG emission production as well as the use of renewable energies in the selected MS and/ or in the selected Region. Relevant facts relating to climate change mitigation or adaptation will be highlighted. Existence of a
national/regional strategy in terms of climate change, main guidelines of this strategy, intervention logic
Strategy documents relating to combating climate change at national and/ or regional level
Interviews with key stakeholders (notably at the Ministry of Environment)
1 At MS level for the Czech Republic and at the regional level for Germany and Portugal.

EX-POST EVALUATION OF COHESION POLICY PROGRAMMES 2000-2006 CO-FINANCED BY THE EUROPEAN FUND FOR REGIONAL DEVELOPMENT (OBJECTIVES 1 AND 2) - WORK PACKAGE 5B: ENVIRONMENT AND CLIMATE CHANGE ADE
Final report – Volume 2 – October 2009 Annex 2 / Page 2
1. Programme achievements in the field of climate change
What are the achievements of the co-financed operational programmes in mitigation of and adaptation to climate change?
Justification and scope of question
Before analysing the contribution of climate change measures to the reduction of GHG emissions, and their economic profitability, it is necessary to have a comprehensive view of what has actually been done in this field and to what extent initial targets have been achieved. The case studies will also allow the characteristics of co-funded interventions to be identified more precisely.
Sub-question 1.1: What are the types of interventions implemented under the co-financed interventions in the field of climate change?
Indicators Sources How to proceed?
Types of interventions co-funded by ERDF and main features (information related, direct incentives, etc.)
Programming documents, evaluation reports and annual reports
Interviews with Managing Authorities
Based on different sources of information, the evaluation team will describe and classify the different types of co-funded intervention. For major and relevant projects, the profitability and the role of public funds will be discussed.
Sub-question 1.2: What are the actual achievements of the co-financed interventions in the field of climate change?
Indicators Sources How to proceed?
Budget allocations and revision
Indicators from WP2 database and WP2 final report
Programming documents, evaluation reports and annual reports
Interviews with Managing Authorities
The evaluation team will present the costs (budget allocations) and the achievements of co-funded interventions. Indicators provided by the WP2 database will be checked taking into account lessons learnt from the WP2 final report.
Number of projects (target and achieved values) related to climate change by type (renewable sources, improvement in energy efficiency)
Installed green capacity
Energy savings (notably in enterprises)
Other relevant indicators related to climate change

EX-POST EVALUATION OF COHESION POLICY PROGRAMMES 2000-2006 CO-FINANCED BY THE EUROPEAN FUND FOR REGIONAL DEVELOPMENT (OBJECTIVES 1 AND 2) - WORK PACKAGE 5B: ENVIRONMENT AND CLIMATE CHANGE ADE
Final report – Volume 2 – October 2009 Annex 2 / Page 3
2. The operational programme and the national/regional environmental strategy
How far did co-funded interventions respond to climate change issues and what was their role in the national/regional strategy in terms of climate change?
Justification and scope of question
The case studies will analyse how far the co-funded interventions in the field of climate change tackle challenges in this field in the MS/ Region, how programmes have integrated climate change issues into their strategy and how climate change measures have been linked to other (co)-financed measures in this field. The role and the profitability of ERDF interventions in climate change measures will be also assessed.
Sub-question 2.1: Did environmental measures tackle the main environmental challenges at national/regional levels?
Indicators Sources How to proceed?
Key environmental indicators at national/ regional levels (GHG emissions, green electricity, etc.) at the beginning of the programme
Indicators recorded under Task 2
Eurostat (GHG emission, etc.) and statistics from the MS/ Region
Interviews with key stakeholders (notably at the Ministry of Environment)
The evaluation team will highlight specific features in the MS/ Region taking into consideration the evolution of the key environmental indicators throughout the programming period.
Coherence between the main challenges in the MS/ region and interventions relating to climate change
Information under Task 2
Programming documents, evaluation reports and annual reports
Interviews with Managing Authorities
The evaluation team will assess the correspondence between the challenges at MS/regional level and the co-funded interventions in the field of climate change.

EX-POST EVALUATION OF COHESION POLICY PROGRAMMES 2000-2006 CO-FINANCED BY THE EUROPEAN FUND FOR REGIONAL DEVELOPMENT (OBJECTIVES 1 AND 2) - WORK PACKAGE 5B: ENVIRONMENT AND CLIMATE CHANGE ADE
Final report – Volume 2 – October 2009 Annex 2 / Page 4
Sub-question 2.2: Did ERDF environmental interventions respond to European/national/regional environmental priorities?
Indicators Sources How to proceed?
Integration of climate change measures implemented through OP with the EU/ national/ regional priorities in respect of climate change
Strategy to fight climate change at EU/ MS or regional level
Information from DG Environment/ EEA on guidelines for reducing climate change (e.g. European Climate Change Programme
Programming documents, evaluation reports and annual reports
Interviews with Managing Authorities
The evaluation team will verify whether the co-funded interventions address the issues at stake as defined in respect of climate change at EU/ MS and regional levels. In this regard it should be noted that climate change was not on the political agenda at the beginning of the programming period. However, some EU initiatives for combating climate change were launched in 1991. An assessment will then be made of whether the interventions designed at the beginning of the programming period were designed in parallel with these initiatives and how far they would have been complementary to and have interacted with them.
Interactions with other policy instruments linked to climate change
Sub-question 2.3: What are the role and the justification of ERDF co-financing in climate change interventions?
Indicators Sources How to proceed?
Involvement (strategy, financing, etc.) of the private sector in respect of climate change
Programming documents, evaluation reports and annual reports
Interviews with Managing Authorities
The evaluation team will identify the role of the private sector whenever ERDF has intervened to support measures to mitigate climate change or facilitate adaptation to it.
Role, justification and profitability of ERDF interventions in respect of climate change (typical need for additional public funds) compared to private sector interventions
Taking into account the role of the private sector in the field of climate change, the evaluation team will highlight the relevance of public funds in supporting interventions and identifying where public funds can efficiently provide incentives in support of private investments in the field of climate change.
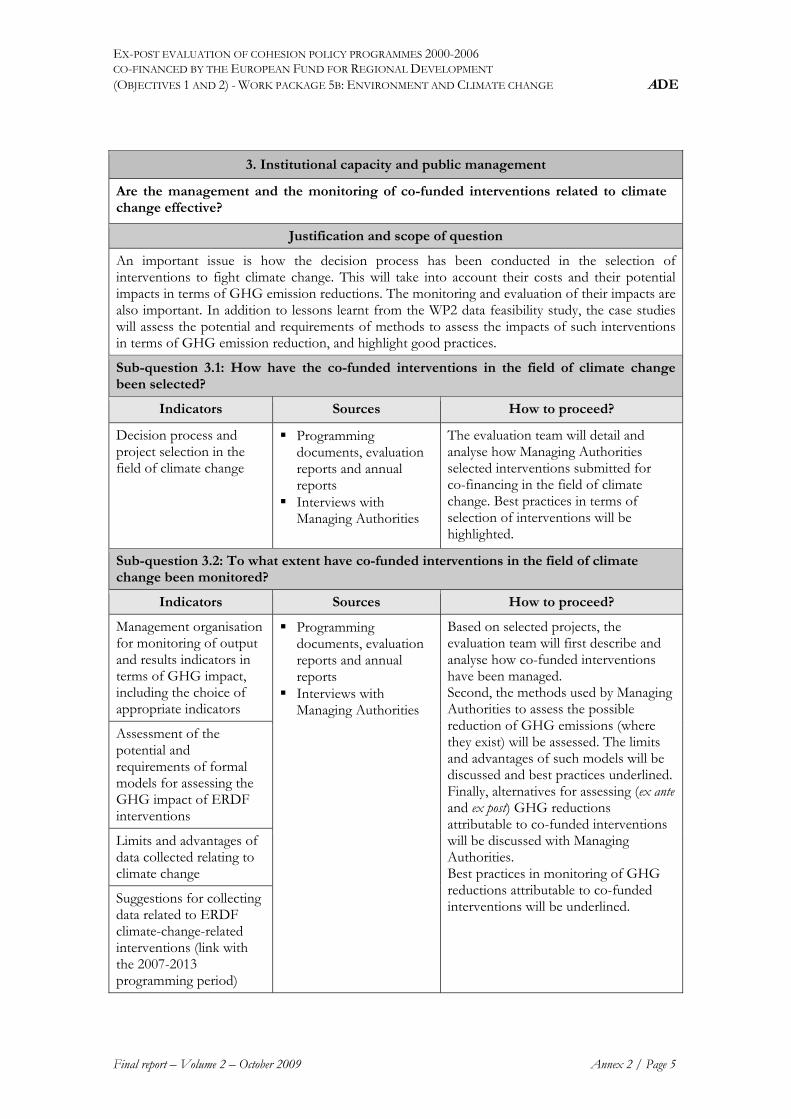
EX-POST EVALUATION OF COHESION POLICY PROGRAMMES 2000-2006 CO-FINANCED BY THE EUROPEAN FUND FOR REGIONAL DEVELOPMENT (OBJECTIVES 1 AND 2) - WORK PACKAGE 5B: ENVIRONMENT AND CLIMATE CHANGE ADE
Final report – Volume 2 – October 2009 Annex 2 / Page 5
3. Institutional capacity and public management
Are the management and the monitoring of co-funded interventions related to climate change effective?
Justification and scope of question
An important issue is how the decision process has been conducted in the selection of interventions to fight climate change. This will take into account their costs and their potential impacts in terms of GHG emission reductions. The monitoring and evaluation of their impacts are also important. In addition to lessons learnt from the WP2 data feasibility study, the case studies will assess the potential and requirements of methods to assess the impacts of such interventions in terms of GHG emission reduction, and highlight good practices.
Sub-question 3.1: How have the co-funded interventions in the field of climate change been selected?
Indicators Sources How to proceed?
Decision process and project selection in the field of climate change
Programming documents, evaluation reports and annual reports
Interviews with Managing Authorities
The evaluation team will detail and analyse how Managing Authorities selected interventions submitted for co-financing in the field of climate change. Best practices in terms of selection of interventions will be highlighted.
Sub-question 3.2: To what extent have co-funded interventions in the field of climate change been monitored?
Indicators Sources How to proceed?
Management organisation for monitoring of output and results indicators in terms of GHG impact, including the choice of appropriate indicators
Programming documents, evaluation reports and annual reports
Interviews with Managing Authorities
Based on selected projects, the evaluation team will first describe and analyse how co-funded interventions have been managed. Second, the methods used by Managing Authorities to assess the possible reduction of GHG emissions (where they exist) will be assessed. The limits and advantages of such models will be discussed and best practices underlined. Finally, alternatives for assessing (ex ante and ex post) GHG reductions attributable to co-funded interventions will be discussed with Managing Authorities. Best practices in monitoring of GHG reductions attributable to co-funded interventions will be underlined.
Assessment of the potential and requirements of formal models for assessing the GHG impact of ERDF interventions
Limits and advantages of data collected relating to climate change
Suggestions for collecting data related to ERDF climate-change-related interventions (link with the 2007-2013 programming period)

EX-POST EVALUATION OF COHESION POLICY PROGRAMMES 2000-2006 CO-FINANCED BY THE EUROPEAN FUND FOR REGIONAL DEVELOPMENT (OBJECTIVES 1 AND 2) - WORK PACKAGE 5B: ENVIRONMENT AND CLIMATE CHANGE ADE
Final report – Volume 2 – October 2009 Annex 2 / Page 6
4. Effectiveness of interventions in the field of climate change
What are the effects or impacts of co-funded interventions to mitigate climate change?
Justification and scope of question
The case studies will assess to what extent co-funded interventions increase the use of renewable energies and other measures with a view to improving energy efficiency, especially in enterprises. As far as possible, the impact in terms of GHG emission reduction will be estimated.
Sub-question 4.1: To what extent have co-funded interventions led to an increase of private investment in the field of energy efficiency and use of renewable energies?
Indicators Sources How to proceed?
Increase in private investments due to ERDF co-financing (leverage effects, reduced risk aversion for such interventions)
Programming documents, evaluation reports, annual reports
Interviews with Managing Authorities
The evaluation team will identify the effects/impacts of co-funded interventions on the private sector in terms of increased investments related to climate change.
Sub-question 4.2: To what extent have environmental expenditures contributed to reducing GHG emission?
Indicators Sources How to proceed?
Increase in and impact of the use of renewable energies
Results of interventions as mentioned under Evaluation Question 1 (programme achievements)
Evaluation reports and annual reports
Interviews with Managing Authorities
Interviews with beneficiaries (where possible)
The evaluation team will analyse as far as possible the effects/ impacts of co-funded interventions in terms of GHG reduction, improvements in efficiency and use of renewable energies. Best practices and results of such interventions in contributing to reduced GHG emissions will be underlined.
Improvement in energy efficiency
Trends in climate change indicators in the Region (renewable energy, energy savings, etc.)
National/ regional documents and statistics

EX-POST EVALUATION OF COHESION POLICY PROGRAMMES 2000-2006 CO-FINANCED BY THE EUROPEAN FUND FOR REGIONAL DEVELOPMENT (OBJECTIVES 1 AND 2) - WORK PACKAGE 5B: ENVIRONMENT AND CLIMATE CHANGE ADE
Final report – Volume 2 – October 2009 Annex 2 / Page 7
5. Contribution to regional development
To what extent have co-funded interventions in the field of climate change contributed to socio-economic regional 2 development?
Justification and field of question
The case studies will highlight the potential and limitations of climate-friendly interventions in contributing to regional development. As far as possible, effects in terms of employment, turnover and innovation will be assessed.
Sub-question 5.1: What are the socio-economic effects/impacts of the co-funded interventions in the field of climate change?
Indicators Sources How to proceed?
Employment/ turnover in environmental sectors
Evaluation reports and annual reports
Interviews with Managing Authorities
Interviews with beneficiaries (where possible)
The evaluation team will assess the contribution of co-funded interventions in terms of employment, turnover, and energy efficiency in enterprises. The potential and limitations of such interventions to this end will be highlighted through the case studies.
Impact of better energy efficiency on firms’ competitiveness
Sub-question 5.2: Have the co-funded interventions generated technological innovation in terms of climate change?
Indicators Sources How to proceed?
Introduction of new/improved technology, spill-overs
Evaluation reports and annual reports
Interviews with Managing Authorities
Interviews with beneficiaries (where possible)
The evaluation team will assess the contribution of co-funded interventions in terms of innovation. The potential and limitations of such interventions to this end will be highlighted through the case studies.
New process, new products/services developed
2 For the Czech Republic, the case study will analyse the contribution of co-funded interventions to national development.