Molecular Dynamics Docking Driven by NMR-Derived Restraints to Determine the Structure of the...
9
MAGNETIC RESONANCE IN CHEMISTRY, VOL. 34, S147-Sl55 (1996) Molecular Dynamics Docking Driven by NMR- Derived Restraints to Determine the Structure of the Calicheamicin yI1 Oligosaccharide Domain Complexed to Duplex DNA Jarrod A. Smith, Luigi Gomez-Paloma,? David A. Case and Walter J. Chazin* Department of Molecular Biology, The Scripps Research Institute, 10550 North Torrey Pines Road, La Jolla, California 92037, USA Calicheamicin yI1 is a natural product that has recently received much attention for its potent cytotoxic activity and its ability to bind and cleave duplex DNA in a sequence-specific manner. The solution structure of the calicheami- cin oligosaccharide domain has been determined in complex with the DNA duplex d(GCATCCTAGC) * d(GCTAGGATGC) containing the high-affinity binding site d(TCCT), using a restrained molecular dynamics-based conformational search. The input data consists of 229 DNA-DNA, 14 drug-drug and 17 drug-DNA NOE-derived distance constraints, 32 DNA hydrogen bond constraints and 91 DNA and eight drug torsion angle constraints for a total of 383 NMR-derived constraints. Novel strategies were utilized for generating DNA starting structures and for docking the ligand into the DNA minor groove to ensure the extensive sampling of conformational space consistent with the input data. The conformation of the complex is ypresented by an ensemble of 20 structures that have an average pairwise root mean square deviation of 0.94 A for the binding region. This ensemble was carefully selected as the minimum population of structures which represents all of the conformational space allowed by the experimental constraints. The ensemble was analyzed for interactions between the oligosaccharide and DNA that stabilize the structure of the complex and account for the binding specificity. KEY WORDS DNA recognition; NMR solution structure; DNA; ligand-DNA interactions INTRODUCTION Calicheamicin yl' (Fig. 1) is a member of the enediyne family of antitumor antibiotics that bind and cleave duplex DNA, eventually leading to cell death.'.' Once bound, calicheamicin can be activated upon bio- reduction of its trisulfide trigger. This gives rise, through a Bergmann cyclization, to an sp' carbon-centered 1,4- aryl diradical, which abstracts two hydrogen atoms, one from each strand of DNA, causing DNA double-strand cleavage. Recently, reports have demonstrated that the calicheamicin q derivative has shown the ability to initi- ate apopt~sis.~ Among enediynes, calicheamicin y: dis- * Author to whom correspondence should be addressed. On leave from the University of Naples, Italy. plays the greatest selectivity in binding duplex DNA, which we and others have attributed to favorable inter- actions of the complex carbohydrate with double helical DNA containing oligopyrimidine/oligopurine tracts, such as d(TCCT), d(TTTT) and d(CTCT).4*5 Compara- tive NMR studies between DNA complexes with intact calicheamicin and with its oligosaccharide domain have demonstrated the crucial role of the oligosaccharide in DNA recognition and In this paper, we present the three-dimensional solution structure of the oligosaccharide domain bound to the DNA duplex used for the previous qualitative comparative analysis. Structure determination of drug-DNA complexes by NMR spectroscopy poses some unique problems, including the intrinsic difficulties of properly character- izing three-dimensional structures of linear helical DNA molecules, generation of initial geometries of the drug and the DNA duplex, sampling of all conformation B Me OMe HO OMe OH ? HO M M o OM' OM' OH Figure 1. Structure of the calicheamicin y, ' oligosaccharide. CCC 0749-1 581/96/SI0147-09 @) 1996 by John Wiley 8L Sons, Ltd. Received 6 August 1.996 Accepted (revised) 4 September 1996
Transcript of Molecular Dynamics Docking Driven by NMR-Derived Restraints to Determine the Structure of the...

MAGNETIC RESONANCE IN CHEMISTRY, VOL. 34, S147-Sl55 (1996)
Molecular Dynamics Docking Driven by NMR- Derived Restraints to Determine the Structure of the Calicheamicin yI1 Oligosaccharide Domain Complexed to Duplex DNA
Jarrod A. Smith, Luigi Gomez-Paloma,? David A. Case and Walter J. Chazin* Department of Molecular Biology, The Scripps Research Institute, 10550 North Torrey Pines Road, La Jolla, California 92037, USA
Calicheamicin yI1 is a natural product that has recently received much attention for its potent cytotoxic activity and its ability to bind and cleave duplex DNA in a sequence-specific manner. The solution structure of the calicheami- cin oligosaccharide domain has been determined in complex with the DNA duplex d(GCATCCTAGC) * d(GCTAGGATGC) containing the high-affinity binding site d(TCCT), using a restrained molecular dynamics-based conformational search. The input data consists of 229 DNA-DNA, 14 drug-drug and 17 drug-DNA NOE-derived distance constraints, 32 DNA hydrogen bond constraints and 91 DNA and eight drug torsion angle constraints for a total of 383 NMR-derived constraints. Novel strategies were utilized for generating DNA starting structures and for docking the ligand into the DNA minor groove to ensure the extensive sampling of conformational space consistent with the input data. The conformation of the complex is ypresented by an ensemble of 20 structures that have an average pairwise root mean square deviation of 0.94 A for the binding region. This ensemble was carefully selected as the minimum population of structures which represents all of the conformational space allowed by the experimental constraints. The ensemble was analyzed for interactions between the oligosaccharide and DNA that stabilize the structure of the complex and account for the binding specificity.
KEY WORDS DNA recognition; NMR solution structure; DNA; ligand-DNA interactions
INTRODUCTION
Calicheamicin yl' (Fig. 1) is a member of the enediyne family of antitumor antibiotics that bind and cleave duplex DNA, eventually leading to cell death.'.' Once bound, calicheamicin can be activated upon bio- reduction of its trisulfide trigger. This gives rise, through a Bergmann cyclization, to an sp' carbon-centered 1,4- aryl diradical, which abstracts two hydrogen atoms, one from each strand of DNA, causing DNA double-strand cleavage. Recently, reports have demonstrated that the calicheamicin q derivative has shown the ability to initi- ate apopt~sis .~ Among enediynes, calicheamicin y: dis-
* Author to whom correspondence should be addressed. On leave from the University of Naples, Italy.
plays the greatest selectivity in binding duplex DNA, which we and others have attributed to favorable inter- actions of the complex carbohydrate with double helical DNA containing oligopyrimidine/oligopurine tracts, such as d(TCCT), d(TTTT) and d(CTCT).4*5 Compara- tive NMR studies between DNA complexes with intact calicheamicin and with its oligosaccharide domain have demonstrated the crucial role of the oligosaccharide in DNA recognition and In this paper, we present the three-dimensional solution structure of the oligosaccharide domain bound to the DNA duplex used for the previous qualitative comparative analysis.
Structure determination of drug-DNA complexes by NMR spectroscopy poses some unique problems, including the intrinsic difficulties of properly character- izing three-dimensional structures of linear helical DNA molecules, generation of initial geometries of the drug and the DNA duplex, sampling of all conformation
B Me
OMe HO
OMe OH ? HO M M o OM'
OM' OH Figure 1. Structure of the calicheamicin y, ' oligosaccharide.
CCC 0749-1 581/96/SI0147-09 @) 1996 by John Wiley 8L Sons, Ltd.
Received 6 August 1.996 Accepted (revised) 4 September 1996
S148 J. A. SMITH ET AL.
space consistent with the input data and docking the drug on to the duplex. The typical approach involves an initial step of manual docking with the aid of a molecu- lar modeling software package on a graphics work- station using a limited number of standard helical DNA and drug conformations. Clearly, this method is not completely objective. Here, we present a more objective docking procedure guided exclusively by experimental data and which incorporates the automated generation of a large number of widely varied DNA and drug start- ing conformations. One advantage of this procedure over the traditional approach of reusing the same two or three standard starting structures over and over is that it provides a much wider search of conformational space and a better statistical sample of final structures from which to choose a representative family.
The process by which a structural family is selected from this pool of acceptable models has not received much attention in the literature. The primary objective is to select a family that describes all possible conforma- tions that are consistent with the data. Clearly, there is some minimum number of models that must be included in order to represent properly the available conformational space, but in only a few cases has there been any effort made to define what this number Furthermore, in the case of oligonucleotide structures in particular, there has been a strong tendency to under- represent severely the number of conformations and, correspondingly, the full range of conformational space. On the other hand, it is also unnecessary and unwise to include too many structures, since it is uninformative and in some instances deceiving to view a figure of an overpopulated and therefore redundant family of NMR structures. An analysis of all candidate models in this context is an integral part of the process of solution structure determination, and a specific approach to select an appropriate representative family is described.
EXPERIMENTAL
NMR sample preparation and experiments
The preparation of the oligosaccharide-DNA complex has been reported.6 All NMR experiments were record- ed on a Bruker AMX-600 or AMX-500 spectrometer. A two-quantum spectrum" was acquired with a 30 ms excitation period, 64 scans per t, value and tl = 50 ms. A P COSY" spectrum was acquired with 64 scans per tl value and tl max = 80 ms. NOESY13 experiments were acquired at 283 K with tmix = 50 and 200 ms in D,O and tmix = 200 ms in 9: 1 H,0-D20; 32 or 64 FIDS were acquired for each t, value, with t , max = 50 ms. A short Hahn-echo period was incorporated at the end of the mixing period of the D,O spectrum to improve the quality of the ba~eline. '~. '~ For the HzO spectrum, the observation pulse was replaced by a jump and return composite sequence.16
Generation of DNA starting structures
Forty diverse DNA starting structures were generated with the NAB molecular manipulation language.' '*'
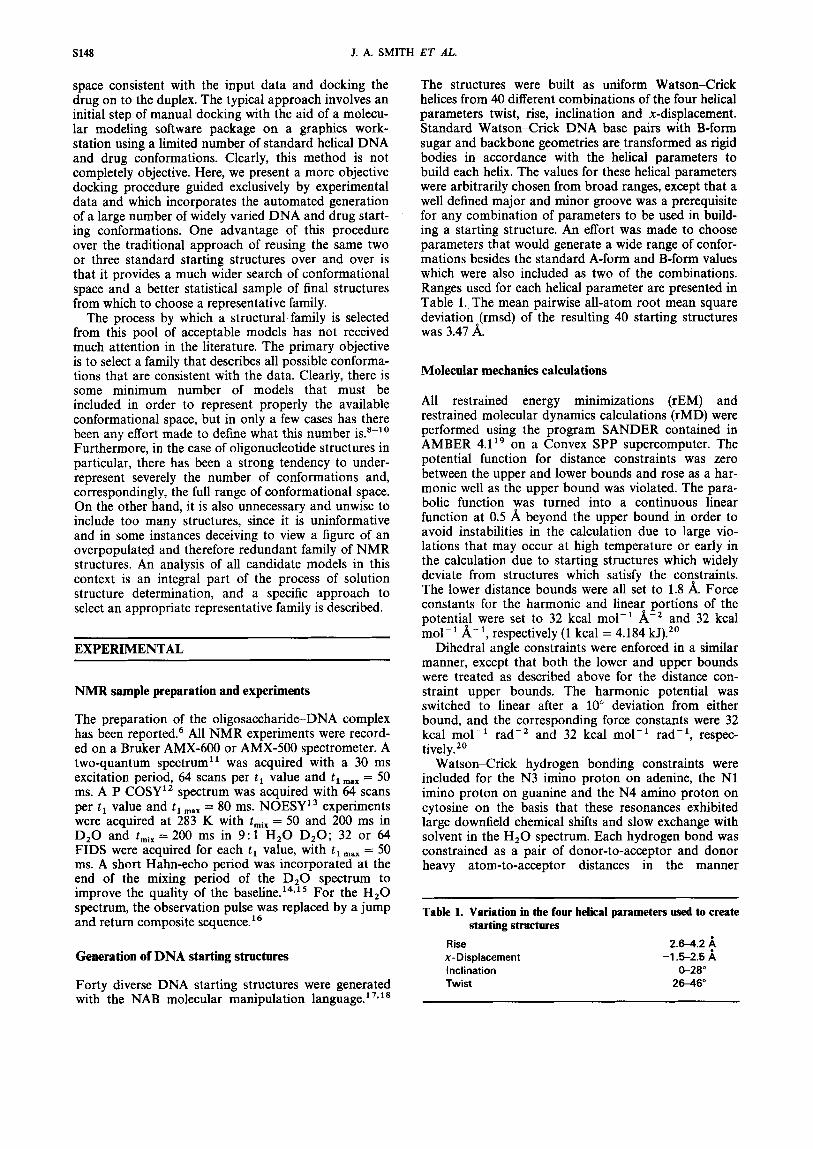
The structures were built as uniform Watson-Crick helices from 40 different combinations of the four helical parameters twist, rise, inclination and x-displacement. Standard Watson-Crick DNA base pairs with B-form sugar and backbone geometries are transformed as rigid bodies in accordance with the helical parameters to build each helix. The values for these helical parameters were arbitrarily chosen from broad ranges, except that a well defined major and minor groove was a prerequisite for any combination of parameters to be used in build- ing a starting structure. An effort was made to choose parameters that would generate a wide range of confor- mations besides the standard A-form and B-form values which were also included as two of the combinations. Ranges used for each helical parameter are presented in Table 1. The mean pairwise all-atom root mean square deviation (rmsd) of the resulting 40 starting structures was 3.47 A.
Molecular mechanics calculations
All restrained energy minimizations (rEM) and restrained molecular dynamics calculations (rMD) were performed using the program SANDER contained in AMBER 4.119 on a Convex SPP supercomputer. The potential function for distance constraints was zero between the upper and lower bounds and rose as a har- monic well as the upper bound was violated. The para- bolic function was turned into a continuous linear function at 0.5 A beyond the upper bound in order to avoid instabilities in the calculation due to large vio- lations that may occur at high temperature or early in the calculation due to starting structures which widely deviate from structures which satisfy the constraints. The lower distance bounds were all set to 1.8 A Force constants for the harmonic and linear portions of the potential were set to 32 kcal mol-' A-z and 32 kcal mol-' A-1, respectively (1 kcal = 4.184 kJ)."
Dihedral angle constraints were enforced in a similar manner, except that both the lower and upper bounds were treated as described above for the distance con- straint upper bounds. The harmonic potential was switched to linear after a lo" deviation from either bound, and the corresponding force constants were 32 kcal mol-' rad-' and 32 kcal mol-' rad-', respec- tively."
Watson-Crick hydrogen bonding constraints were included for the N3 imino proton on adenine, the N1 imino proton on guanine and the N4 amino proton on cytosine on the basis that these resonances exhibited large downfield chemical shifts and slow exchange with solvent in the H,O spectrum. Each hydrogen bond was constrained as a pair of donor-to-acceptor and donor heavy atom-to-acceptor distances in the manner
Table 1. Variation in the four helical parameters used to create starting structures
Rise 254.2 4 x - Displacement -1 5-25 A Inclination C28" Twist 2646"

STRUCTURE OF THE CALICHEAMICIN OLIGOSACCHARIDE IN COMPLEX WITH DNA S149
described above for standard NOE-based distance con- straints.
No explicit solvent molecules were included in these calculations, so a distance-dependent dielectric and reduced net charges on the phosphorus and phosphate oxygens were used to compensate for the absence of solvent.
Refinement of DNA atoms
The backbone and sugar atoms of the DNA starting structures were subjected to 1000 steps of steepest descent energy minimization to relieve any bad con- tacts that were present. Such contacts are inevitable because there are no adjustments made to backbone or sugar atom positions when the structures are built according to helical parameter specifications in NAB. The resulting minimized structures were used as starting points for 20 ps of rMD simulated annealing with the DNA-DNA NOE-derived distance restraints, DNA dihedral angle restraints and the H-bond restraints. The protocol consisted of heating from 0 to 700 K over 2 ps followed by 2 ps of high-temperature dynamics at 700 K and, finally, slow cooling from 700 to 0 K over the last 16 ps. The force constants for all the distance, dihe- dral and hydrogen bond constraints were linearly increased from 3.2 to 32 kcal between 0 and 3 ps, and remained at 32 kcal for the rest of the simulation. This resulted in 40 refined DNA structures whose average pairwise rmsd for all atoms was 2.20 k
Restrained MD docking
Several drug conformations were generated by taking snapshots of a free dynamics simulation of the calichea- micin oligosaccharide at 1000 K and then applying 50 steps of steepest descent rEM followed by 4950 steps of conjugate gradient rEM to each. NAB was used to place these drug structures into a coordinate frame such that the long axis of the drug defined the x-axis, the perpendicular y-direction was set across the aromatic ring and the cross product of these two vectors defined the z-axis. NAB was also used to place each of the 40 refined DNA structures into a coordinate frame such that the x-axis was defined as spanning across the minor groove in the binding region, the y-axis was defined as following the minor groove in the binding region and the z-axis as the cross product of these two vectors. Next, the drug conformations were randomly paired with the DNA structures and the coordinate frames were aligned to each other. The drug was then rotated about the x-axis by - 90" and translated in the z-direction by 15 8, This aligned the drug to the DNA in the direction of binding and placed it approximately 15 A away in an orientation that would allow the flat rings to slide into the minor groove.
An rMD docking protocol was then used to dock the drug into the minor groove of the DNA. All restraints that were used in the DNA refinement and also 17 sugar-DNA and 14 sugar-sugar restraints were imple- mented in the simulation of the complex. A total of eight dihedral angle constraints in the sugar rings were
also added to help, keep the A, B, D and E rings in the chair conformation, as was seen experimentally by intra-ring NOEs. Each of the starting structures for the complex was heated to 700 K over 3 ps and kept at that temperature for 3 ps. This was followed by slow cooling to 0 K over 14 ps. Force constants for all intramolecu- lar restraints were held fixed at 32 kcal for the entire simulation. The intermolecular distance restraints, however, were ramped linearly from 0 kcal at 0 ps to 32 kcal at 20 ps. This caused the drug molecule to be reeled into the minor groove by the intermolecular restraints, while the DNA was held near its initial pre- refined conformation by the intramolecular restraints. The force field allowed the DNA and the calicheamicin oligosaccharide molecules individually to search confor- mational space in the presence of the other during the entire docking process, thereby exploring the many pos- sible docking modes and intermolecular interactions around the binding site that was specified by the drug- DNA NMR constraints.
Final refinements of the complex
Each complex was subjected to two final rounds of rMD simulated annealing. All restraints were used. The complexes were annealed twice at 1000 K using a 20 ps protocol similar to that described in the DNA refine- ment. The complex was heated to 1000 K in 2 ps fol- lowed by 3 ps of dynamics at that temperature. This was followed by 15 ps of slow cooling to 0 K. All restraints were ramped from 3.2 to 32 kcal over the first 3 ps of the simulation and remained at 32 kcal for the remainder of the calculation. The second round was implemented twice with different random number seeds in order to generate more structures for statistical analysis.
RESULTS AND DISCUSSION
NMRderived distance and torsion constraints
Complete sequence-specific 'H NMR assignments for the oligosaccharide-DNA complex were reported in a previous paper.6 Using these assignments, 194 unam- biguous distance constraints could be directly identified in the NOESY spectra. These were sorted into strong, medium and weak categories based on the integrated intensity of the cross peak. After a first round of calcu- lations with these constraints, the structural models obtained were used to identify some of the ambiguous NOEs that were observed, and also as input reference structures for relaxation matrix analysis using the program MARDIGRAS 5.L2' The target distances output from MARDIGRAS were then used to calculate a new family of structures. Owing to the intrinsic limi- tations of the relaxation matrix approach and the ina- bility to account for any systematic error,22 the target values were adjusted by adding 10% of the distance in setting the upper bound of each constraint. We utilized

S150 J. A. SMITH ET AL.
292 distance constraints in the final round of calcu- lations, including 32 DNA hydrogen bonding con- straints (for 16 hydrogen bonds), 229 DNA-DNA, 14 intramolecular oligosaccharide and 17 intermolecular oligosaccharide-DNA contacts.
Dihedral angle constraints in the deoxyribose sugar rings were obtained from J1r-zr and J,.-z. coupling constants measured in the P COSY spectrum combined with estimates of the magnitude of J,.-,. made from the two-quantum spectrum. The coupling constant informa- tion was used to establish ranges of the pseudo-rotation angle from the J vs. pseudo-rotation curve,23 and these in turn were converted into specific constraints on the angles y o , vl , v z , v 3 and v 4 . The minimum range of these constraints was held to +15". The pseudo- rotation phase angles all fell within the range 90-190".
Dihedral angle constraints for the DNA backbone angles a, y, E and [ were established on the basis of char- acteristic NOES and the values for W,,. and XJH4,, similar to the strategy of Reid and c o - ~ o r k e r s . ~ ~ Con- straints on the backbone torsion angles y and E were obtained from measurements of the linewidth of H4' and H3' NOESY cross peaks, respectively. In particular, once a range for the deoxyribose ring pucker is known and provided that an upper bound for the width at half- height of 'H NMR signals is measurable, constraints on the y and E values can be derived from the sum of all scalar couplings to H 4 and to H3', re~pectively.~~ These were estimated from fully resolved cross peaks in w2 cross-sections from the NOESY spectra. Constraints on y and E were obtained for 14 residues out of 20, corre- sponding to 28 additional dihedral angle constraints. Typical values for y were in the range 20-100", while E angles were mostly between 240" and 300". Loose a and 5 restraints were obtained from examination of the H1' to H4'/HS/H5" region of the NOESY ~pectra. '~ These were found to lie in the region 240-360". In all, 171 dihedral angle constraints were assigned.
Structure calculations
The calculations were implemented as outlined in the Experimental section. A high rate of convergence was achieved with this protocol and input data set, as only six out of the 80 structures refined failed to converge to a low-energy oligosaccharide-DNA complex. Closer examination of these six structures from each stage of the calculation revealed that two structures from the same starting conformation did not dock properly. Two additional pairs of structures did not converge because they became energetically unstable during annealing in the first stage of the final refinement.
The resulting 74 structures had no violations greater than 0.47 and only 21 constraints in total were vio- lated by more than 0.20 k Upon visual inspection, it was clear that in all 74 structures the DNA was prop- erly stacked and base-paired and had well defined major and minor grooves. In all cases the oligosac- charide was snugly bound in the minor groove in the expected direction with all restrained rings in the same orientation. These 74 structures were sorted by restraint violation energy and analyzed for agreement with experimental constraints. A plot of the residual restraint
violation energy is shown in Fig. 2, and reveals progres- sive discontinuities. Structures 49-74 were excluded on the basis of violation energies which exceed the bulk of the population.
The remaining pool of 48 structures had converged from widely varied starting structures, with members originating from starting structures distant from those resembling the standard DNA conformations equally represented in the population.
Determining the number of structures in the family
The selection of a representative family of structures from the pool of those calculated is an important step in achieving a meaningful interpretation of the structural data provided by NMR. The primary objective is to present a conformational ensemble that accurately rep- resents the full extent of conformational space consis- tent with the experimental data, i.e. identify a set of structures generated by the refinement that covers the full range of conformations that were produced.
Of particular importance is the inclusion of a sufi- cient number of structures to represent the true confor- mational ~ariability.~ The rmsd is the typical quantity used to measure the precision of a structural ensemble. By limiting the number of structures included in the ensemble, misleading judgments might be made about the precision. We have developed a strategy that directly determines the number of structures required to fully represent the available conformational space by analyzing the behavior of the rmsd as the number of structures included in the rmsd calculation is increased.
The structures in the pool of 48 were placed in random order. The mean all-atom pairwise rmsd was computed for the first two structures in this ordering, then for the first three structures, etc., until the rmsds for all 47 subsets specified by this order had been calcu- lated. This computation was repeated 500 times, ran- domly permuting the order of the structures each time. This produced 500 rmsds for each family size of 2-48 structures. A plot of these data is presented in Fig. 3(a) where each data point is the rmsd for a family of x structures from one of the 500 permutations. The resulting variation in the rmsd is the key property used to determine the number of structures that is required to represent conformational space.
30
- m E 5
n "0 5 10 15 20 25 30 35 40 45 50 55 60 65 70 75
Structure Figure 2. Plot of the total violation energy (distance +dihedral angle violations) for each converged structure.

STRUCTURE OF THE CALICHEAMICIN OLIGOSACCHARIDE IN COMPLEX WITH DNA S151
It can be seen from Fig. 3(a) that if we had selected or computed only five structures to represent the family, the average pairwise rmsd could have been anywhere between 1.1 and 2.9 A Clearly, the average pairwise rmsd for a particular family of five structures would not be meaningful in this case. Of course, this variability in rmsd for a given number of structures is also a function of the precision in those structures. To illustrate this, a similar analysis was performed on the high-resolution structure of (+)-duocarmycin SA bound to the DNA sequence d(GACTAATTGAC).d(GTCAATTAGTC) that was recently obtained in this laboratory24 [Fig.
.c 1.5
0 5 10 15 20 25 30 35 40 0.0 " ' ~ " " ' ~ " ' ~ " " ' ~ " " ~ " " ~ " " ~ " " '
Number of Structures
C. 0.05
0.00
-020 1 i Figure 3. Selection of a representative family of structures. (A) Rmsd vs. the number of calicheamicin y , ' oligosaccharide complex structures. Each of the 23500 data points is derived from one of the 500 different orderings of the 48 final structures. (B) Analo- gous plot but for the 40 final structures of the (+)-DSA complex.24 (C) Change in standard deviation of rmsd in (A) upon increasing the number of structures from x - 1 tox.
3(b)]. While the precision of the (+)-DSA complex is much higher than that of the calicheamicin oligosac- charide domain structure, if the family were represented by an ensemble of only five structures, the rmsd could be anywhere between 0.6 and 1.1 b~, depending on which five of the conformational ensemble were initially selected. If by chance the structures chosen are the ones closest to one another, a small rmsd will result, and vice versa.
Since the families used to calculate the rmsds in Fig. 3 are chosen from the same pool, the more structures there are in the rmsd calculation, the fewer unique com- binations of structures exist. This accounts for the fact that the variability in the rmsd will always become smaller as the number of structures included in the cal- culation approaches the total number of structures in the pool. In the limit of the full conformational ensem- ble there is only a single combination of structures and all permutations of order will give the same rmsd value. Thus, when using this method, it is essential to have a significantly larger number of structures in the pool relative to the final number of structures required to represent the ensemble.
To establish what is the 'correct' number of structures to represent the ensemble, it is necessary to determine the limit where the change of variability in the rmsd reaches a lower threshold. At this limit, adding more structures does not further decrease the uncertainty in rmsd. Figure 3(c), which is derived from Fig. 3(a), shows the change in the standard deviation of rmsd (Abrmsd) on addition of a structure to the family. It is clear that at the outset, the magnitude of AbrmSd is shrinking rela- tively rapidly as structures are added to the family. This value decreases until, at approximately 20 structures, AbrmSd reaches -0.005, and remains at or around that number as more structures are added to the calculation. Thus, by this criterion, 20 structures are sufficient to represent the conformational space consistent with the experimental data.
Selection of the family
Once it was established that 20 members were sufficient to describe the structure, 20 individual members were chosen from the pool of 48. First, the structures were sorted on total restraint violation energy and the first 20 were inspected visually. Four of these 20 struc- tures had part of the D-ring of the drug facing directly out into solution and were clearly 'out of family.' Careful analysis of the restraint violations for these four structures indicated that they violated an inordinate number of the intermolecular restraints relative to the others, particularly in the region of the B-ring. Further- more, these structures had high molecular mechanics energies, more than one standard deviation greater than the mean of the pool of 48. A decision was then made to reject these four structures and to replace them with the four structures whose violation energies were next lowest. No further discrepancies were noted.
The final set of 20 structures were checked for any large single distance constraint violations and none greater than 0.10 A were found. Additional structural statistics for this family are presented in Table 2. Figure

S152 J. A. SMITH ET AL.
Table 2. Summary of the molecular energies, rmsds and residual violations of the family of 20 representative structures
Molecular mechanics energies (kcal) : Em.. , -825.0 f 4.0 E V l O l 1.0*0.2
Average pairwise rmsds (A) : DNA 0.95 Drug + DNA 1.38 Drug + DNA binding site 0.94
0.01 c d s 0 . 1 0 14.4 f 1.6 0.10 < d 0.0 0.0
o < e ~ 5 12.3 * 2.5 5 < 9 0.0 * 0.0
Distance violations (A) :
Dihedral angle violations (") :
4 shows a stereoview of the family superimposed on the DNA at the binding site (basepairs 3-7) and the oligo- saccharide minus the E-ring. The E-ring of the oligosac- charide is poorly defined in the structures because there were no NOES observed between it and the DNA, so it is excluded from the fit. The average pairwise rmsd for the region fitted is 0.94 8, Figure 5 depicts a single rep- resentative structure with a van der Waals surface around the oligosaccharide.
Structural features
Table 3 lists the mean and standard deviation of the DNA backbone torsion angles for the family on a per residue basis. Table 4 contains some of the helical parameters as measured by NEWHELIX.25 The DNA in the complex shows significant perturbations from either standard A or B forms, particularly in the binding site. The helical parameters propeller twist and helical
twist, and also the backbone dihedral angles a, /l and y, are found to be closer to that of A-DNA, whereas the parameters x-displacement, inclination and tilt, and also the 6 dihedral angle and sugar puckers (PPA 95-152"), are more similar to standard B-DNA. The minor roove width, as measured by P-P distances less 5.8 x 26 ranges from 5.2 to 8.5 8, The minor groove is close
to the B-DNA width of 5.7 8, (5.2-6.5 A) for most of the duplex except for the region of the E-ring (also where the aglycone would normally be in the intact drug) where the local backbone is expanded to 7.1-8.5 8,
Intermolecular interactions
Inspection of the structure of the complex has yielded a number of interactions which appear to be important in the binding of calicheamicin to d(GCATCCTAGC) * d(GCTAGGATGC) (Fig. 6). One such interaction is a hydrogen bond between the car- bony1 oxygen of the thioester linkage on the drug and the N2 amino group of G16 that is observed in five of the structures. This interaction has been observed in other structural studies of similar complexe~ ,~~ and although it is present in only 25% of our structures, we believe it to be important. It appears that in the struc- tures that do not adopt this hydrogen bond, the partial positively charged sulfur atom makes favorable electro- static contacts with the 04' and 0 3 ' of CYT 6, pulling it close to strand 1 of the duplex. This forces a conforma- tion of the thioester in which the carbonyl oxygen points out of the minor groove towards solution, thereby breaking the hydrogen bond. We believe that this apparently strong electrostatic interaction is an artifact of the rMD in uucuo and that in solution the conformation of this region of the drug will be more similar to the structures with the thioester carbonyl oxygen facing into the minor groove.
Figure 4. Stereoview of the family of 20 calicheamicin 7,' complex structures. The structures were superimposed on the atoms at the DNA binding site and the oligosaccharide minus the E-ring.

STRUCTURE OF THE CALICHEAMICIN OLIGOSACCHARIDE IN COMPLEX WITH DNA S153
Figure 5. Stereoview of a representative calicheamicin y, ' oligosaccharide complex structure. The DNA and oligosaccharide are labeled to identify the direction of binding. The oligosaccharide is shown with its all-atom van der Waals dot surface to indicate its snug fit in the minor groove.
Table 3. Average values of the sugar-phosphate backbone torsion angles of the calicheamicin oligo- saccharide domaiwDNA complex
Residue (") B ("1 A ("1 6 ("1 UI (") & (") 5 1")
1 - - 70+2 117*2 1 1 9 f 3 189*2 269f3 2 288f3 185*3 5 5 f 2 1 3 2 f 3 1 4 4 f 5 186f1 266 A2 3 284f2 176f1 55*1 114*4 120f4 187*2 267*3 4 287*2 1 7 i i 2 5a*1 98*4 100*5 184*3 272*2 5 293f3 168f2 60*3 103*7 102*10 181 f 4 273*2 6 296*4 168f3 61*2 116*9 122*13 1 8 5 f 2 268*3 7 289*2 168f2 64*3 114f7 119*8 189*3 273*2 8 285f5 169f1 58*3 112*2 118f2 183f1 263 f 3 9 290*2 170*2 62*1 131 *2 137*2 181 * I 251 f 2
10 292 f 1 1 8 5 f 2 5 7 f l 141 *I 152*3 - - 11 - - 70*2 113*2 115*2 193*3 276*3 12 285*4 1 7 9 f 3 56*2 128*3 137*3 183*2 263f3 13 288f2 1 7 3 f l 6 0 f l 112*3 1 1 8 f 3 185*1 270 *3 14 288*3 171 f l 59*2 104*2 109*1 184*2 269*2 15 293*2 170*2 61 *2 107*6 111 f 7 184*2 269*2 16 293*2 1 7 5 f 3 5 6 f 2 125*7 133f8 180*3 255*4 17 293*3 182*6 56*4 134*5 148f10 1 8 9 f 2 265*5
271 *1 18 283f5 1 6 5 f 3 61 *2 96 f 3 95 *4 182f1 19 291 *l 166*1 61 * I 133*2 1 4 0 f 3 181 f 0 250*1 20 292 f 1 1 8 6 f 2 57*1 141 *1 152 f 2 - -
Table 4. Average values of important base pair helical parameters in the calicheamicin oligosac- charide domai+DNA complex
Residue
1 2 3 4 5 6 7 8 9
10
x-Displacement (A) -1.7 f 0.4 -1.6 * 0.4 -1.9 f 0.5 -2.2 0.4 -1.9 f 0.5 -1.6 f 0.5 -1.7 * 0.5 -1.9 f 0.6 -2.3 f 0.6 -2.7 f 0.6
Inclination (")
6.7 * 4.3 7.3 f 3.2 7.2 f 2.6 9.1 322.2
11.2 *2.1 10.6 f 2.2 7.4 f 1.9 3.9 f 2.8 2.8 *4.3
-0.2 * 6.2
Propeller (")
-2.5 * 2.1 -8.0 f 3.3
-1 0.3 * 2.6 -8.1 *2.9 -8.2 4.2
-1 0.0 * 3.0 -1 3.0 1.6 -1 0.5 f 4.3 -8.6 f 2.9 -4.4 f 2.3
Twist (")
40.1 *l.O 32.9 * 1 .O 30.3 0.8 34.6 * 1.2 33.7 1.4 33.8 * 1.2 31.8 * 0.9 33.5 f 1.3 39.8 * 1.4
Rise (A) 2.4 0.2 3.0 * 0.2 3.2 f 0.1 3.2 f 0.1 3.1 fO.1 2.9 f 0.1 3.0 f 0.1 2.9 f 0.2 2.8 * 0.2 -
Till (")
1.5*0.6 -0.6 f 0.6 -0.6 f 0.6
0.7 f 0.8 0.3 * 0.7 1.3*0.8
-1 .o * 0.9 -1.1 *0.7 -1.6 * 0.6

S154 J. A. SMITH ET AL.
Figure 6. Stereoview of the oligosaccharide and the binding site. The oligosaccharide and DNA atoms involved in important interactions are labelled and highlighted with dot surfaces.
A second intermolecular hydrogen bond is observed between the hydroxyl proton at position 3 of the B-ring and N3 of A17 in 14 of 20 structures. Interestingly, in three of the six structures which do not satisfy the hydrogen bond, the hydroxyl proton is pointing parallel to or away from the helical axis, allowing the oxygen atom of the hydroxyl group to form a hydrogen bond with the N2 amino group of G16.
A third hydrogen bond is observed between the hydroxyl proton at position 2 of the D-ring and a back- bone oxygen atom of A17 in 14 of the 20 structures. This interaction is not dependent on the binding sequence and therefore is not expected to contribute to the sequence selectivity of calicheamicin, but it does appear to be an important interaction for overall stabil- ization of the complex.
Another non-specific interaction observed is a salt bridge between the positively charged N4E attached to the E-ring and the backbone. This appears in two general families: one to the C6 phosphate group and the other to the C5 phosphate group. It is interesting that even though there were no NOES observed between the E-ring of the oligosaccharide and the DNA, the ring preferred to interact with strand 1 in all cases, which is consistent with the structure when the aglycone is This suggests that the chemical structure of the oligosaccharide itself is finely tuned to position the aglycone into the minor groove without interference from the E-ring.
Finally, there is the interesting possibility for the iodine atom of the C-ring to act as a soft hydrogen bond acceptor to the G15 N2 amino group. In all struc- tures, the iodine atom is positioned deep in the minor groove, making van der Waals contact with the N2 amino group of G15. Such an interaction, as previously proposed by Schreiber and co-workers,28 would explain the differing binding energies of the derivatives contain- ing different halogen substituents on the C-r i~~g.~ '
the aryltetrasaccharide is a crucial element for binding." The conformational features of this linkage cause the two halves of the molecule to be oriented so that the overall shape of the oligosaccharide com- plements the curvature of the DNA minor groove. It is noteworthy that most minor groove binders can adopt this 'crescent' shape mainly because of the presence of peptidyl linkages (e.g. netropsin, distamycin and duocarmycin) that provide rigidity and the correct cur- vature in discrete linkages between ring elements. In comparison with these peptidyl linkages, the N-0 gly- cosidic linkage of calicheamicin should be viewed as an alternative structural element that provides a minor groove binding ligand with similar characteristics, despite its very different chemical nature.
The characteristic curvature provided by this linkage is quantitated by the torsion angles a, f l and y (hereafter referred to as 4,, 4s and 4y, respectively, to avoid con- fusion with the DNA backbone). Six low-energy confor- mations have been calculated for an analogous disaccharide containing this linkage in the absence of DNA.31 For four of the 20 solution structures, the 4a, 4s and # y angles were found to be approximately - 63", 150" and -SO", respectively, close to the calculated second-lowest energy conformation for this linkage. The 4,, ## and #, angles in the remaining 16 structures were approximately 170", 195" and 70", respectively. For these structures, the values of #, and 4p are close to those of two other low-energy conformations. However, the 4y angle is midway between the corresponding cal- culated values of 178" and -57", suggesting conforma- tional averaging in solution. It is clear from these results that in the complex, # p and possibly +y sample con- formations consistent with some of the calculated low- energy conformers for this linkage. This is significant because it suggests that the free oligosaccharide is already primed for binding in the DNA minor groove.
Role of the hydroxylamine glycosidic linkage
There is substantial evidence that the unusual hydroxyl- amine glycosidic linkage connecting rings A and B of
CONCLUSION
Overall, the structure of the oligosaccharide domain complex verifies the accuracy of the previous model of

STRUCTURE OF THE CALICHEAMICIN OLIGOSACCHARIDE IN COMPLEX WITH DNA S155
the intact calicheamicin molecule bound to this same DNA sequence,6 while providing more accurate and precise structural detail. This confirms the accuracy of
our previous hypothesis, that the DNA binding speci- ficity of calicheamicin yl’ is provided by the complex oligosaccharide domain.
REFERENCES
1. K. C. Nicolaou and W. M. Dai, Angew. Chem., Int. Ed. Engl. 30,1387 (1991).
2. K. C. Nicolaou, A. L. Smith and E. W. Yue, Proc. Narl. Acad. Sci. USA 90,5881 (1 993).
3. K. C. Nicolaou, T. Li, M. Nakada, C. W. Hummel, A. Hiatt and W. Wrasidlo, Angew. Chem., Int. Ed. Engl. 33,183 (1 994).
4. N. Zein, A. M. Sinha, W. J. McGabren and G. A. Ellestad, Science 240,f 1 98 (1 988).
5. S. Walker, R. Landovitz, W. D. Ding, G. A. Ellestad and D. Kahne, Proc. Natl. Acad. Sci. USA 89,4608 (1 992).
6. L. G. Paloma, J. A. Smith, W. J. Chazin and K. C. Nicolaou, J . Am. Chem. SOC. 116,3697 (1994).
7. N. Ikemoto, R. A. Kumar, T.-T. Ling, G. A. Ellestad, S. J. Dani- shefsky and D. J. Patel, Proc. Natl. Acad. Sci. USA 92, 10506 (1995).
8. H. Widmer, A. Widmer and W. Braun, J . Biomol. NMR 3, 307 (1993).
9. G. Wagner, S. G. Hyberts and T. F. Havel, Annu. Rev. Biophys. Biomol. Struct. 21,167 (1 992).
10. M. Akke, S. Forsen and W. J. Chazin, J . Mol. Biol. 252, 102
1 1 . L. Braunschweiler, G. Bodenhausen and R. R. Ernst, Mol.
12. D. Marion and A. Bax, J . Magn. Reson. 80,528 (1 988). 13. S. Macura and R. R. Ernst, Mol. Phys. 41,95 (1 980). 14. M. Rance and R. A. Byrd, J . Magn. Reson. 54,221 (1 983). 15. D. G. Davis, J . Magn. Reson. 81,603 (1 989). 16. P. Plateau and M. J. Gubron, J . Am. Chem. SOC. 104, 7310
(1982). 17. T. Macke, PhD Thesis, Scripps Research Institute, La Jolla,
CA (1 996).
(1 995).
Phys. 48, 535 (1 983).
18. D. A. Case, http://ww.scripps.edu/case. 19. D. A. Pearlman, D. A. Case, J. W. Caldwell, W. R. Ross, T. E.
Cheatham 111, S. DeBolt, D. Ferguson, G. Seibel and P. Kollman, Comp. Phys. Commun. 91,l (1 995).
20. J. Kordel, N. J. Skelton, M. Akke and W. J. Chazin, J. Mol. Biol. 231,711 (1 993).
21. 6. A. Borgias and T. L. James, J . Magn. Reson. 87, 475
22. H. Liu, H. P. Spielmann, N. 6. Ulyanov, D. E. Wemmer and T.
23. S.-G. Kim, L.-J. Lin and 6. R. Reid, Biochemistry 31, 3564
24. P. S. Eis, J. A. Smith, J. M. Rydzewski, D. A. Case, D. L.
25. R. E. Dickerson, NEWHELIX Release 1/20/93. Molecular
26. W. Saenger, Principles of Nucleic Acid Structure. Springer,
27. G. Bifulco, A. Galeone, L. G. Paloma, K. C. Nicolaou and W. J.
28. R. C. Hawley, L. Kiessling and S. L. Schreiber, Proc. Natl.
29. T. Li, 2. Zeng, V. A. Estevez, K. U. Baldenius, K. C. Nicolaou
30. K. C. Nicolaou, C. S. Tsai, T. Suzuki and G. F. Joyce, J . Am.
31. S. Walker, D. Gange, V. Gupta and D. Kahne, J . Am. Chem.
(1990).
L. James, J . Biomol. NMR 6,390 (1 995).
(1 992).
Boger and W. J. Chazin, submitted for publication.
Biology Institute, UCLA (1 993).
New York (1 984).
Chazin, J.Am. Chem.Soc., 118,8817 (1996).
Acad. Sci. USA 86, 1105 (1989).
and G. F. Joyce, J . Am. Chem. SOC. 116,3709 (1994).
Chem. SOC. 114,7555 (1992).
SOC. 116,3197 (1994).