The high degree of internal flexibility observed for an oligomannose oligosaccharide does not alter...
15
Eur. J. Biochem. 258, 3722386 (1998) FEBS 1998 The high degree of internal flexibility observed for an oligomannose oligosaccharide does not alter the overall topology of the molecule Robert J. WOODS 1 , Ahammadunny PATHIASERIL 1 , Mark R. WORMALD 2 , Christopher J. EDGE 2 and Raymond A. DWEK 2 1 Complex Carbohydrate Research Center, Department of Biochemistry, University of Georgia, Athens, Georgia, USA 2 Glycobiology Institute, Department of Biochemistry, University of Oxford, Oxford, UK (Received 26 May 1998) 2 EJB 98 0715/5 The conformational properties of oligosaccharides are important in determining their biological prop- erties, such as recognition by proteins. The structural and dynamic properties of many oligosaccharides are poorly understood both because of a lack of experimental data (usually obtained from solution NMR parameters) and because of gross approximations frequently invoked in theoretical models. To character- ise the oligomannose oligosaccharide Man 9 GlcNAc 2 we have acquired a more extensive NMR data set and performed the first unrestrained molecular dynamics (MD) simulation in water of this large oligosac- charide (employing the GLYCAM — 93 parameter set with the AMBER force field). Good agreement is seen between the computed dynamics data and the results of both an isolated spin pair (ISPA) analysis of short mixing time NOE data and NOE build-up curves for mixing times from 100 to 2000 ms. The number of experimental conformational constraints obtained in this study are in principle sufficient to fully define a rigid structure. The fact that this could not be done indicates a high degree of internal flexibility and/or the presence of multiple conformations about the glycosidic linkages. Independently, the same conclusions are reached from an analysis of the MD results. In addition, the theoretical results allow the overall topology of the molecule and its intra-molecular and solvent-mediated hydrogen bonding pattern to be defined. Extensive re-organisation of solvent and inter-residue hydrogen bonds is shown to be required for significant conformational changes to occur, resulting in relatively long life-times for distinct glycosidic linkage conformations, despite the high local flexibility of the glycosidic linkages. This factor is also seen in the overall topology of the molecule, where the considerable internal flexibility is not translated into gross changes in structure. The control exerted by the solvent over both the flexibility and overall topology of an oligosaccharide has important implications for recognition processes and for the conformational properties of glycans attached to glycoproteins. Keywords: AMBER; GLYCAM; molecular dynamics; simulations; NMR ; NOE; oligosaccharide. One of the major roles for oligosaccharides in biological sys- tems is to act as recognition markers for specific proteins. The strength of binding between a glycan and a protein will depend on a number of factors, including the flexibility and solvation of the glycan as well as its conformation. Experimental information on the conformational properties of oligosaccharides is usually obtained by solution 1 H-NMR spectroscopy using nuclear Over- hauser effects (NOEs). The use of NMR parameters to define oligosaccharide conformations has two major problems: NMR parameters only provide an average picture on a millisecond (ms) time scale, and the NMR parameters are frequently insuffi- cient to characterise uniquely the average conformation of the molecule [1, 2]. Unlike proteins, oligosaccharides offer only a Correspondence to R. J. Woods, Complex Carbohydrate Research Center, Department of Biochemistry, University of Georgia, Athens, Georgia 30602, USA Fax: 11 706 542 4412. E-mail : [email protected] URL: www.uga.edu/~biochem/ Abbreviations. AMBER, assisted model building and energy refine- ment ; gg, gauche-gauche ; GLYCAM, glycoproteins and carbohydrates with AMBER; gt, gauche-trans ; ISPA, isolated spin-pair approximation; GlcNAc, N-acetylglucosamine or N-acetylglucosaminyl; MBP, man- nose-binding protein; MD, molecular dynamics; MORASS, multispin Overhauser relaxation analysis and simulations; tg, trans-gauche. very limited number of NOEs for analysis, resulting in a confor- mationally under-determined system. The data obtained are usu- ally compatible with either several different rigid structures, or an ensemble of flexible structures, for each glycosidic linkage. Theoretical approaches, such as molecular dynamics (MD) simulation or Monte Carlo sampling, can provide, in principle, accurate structural and dynamic properties. Inaccuracies in mo- lecular force fields for carbohydrates [3], as well as a reluctance to treat water explicitly, have until recently [426] limited the application of MD methods to qualitative conformational searches [7] or to modelling employing experimentally deter- mined restraints [8]. Thus, the precise degree of flexibility, both for the individual glycosidic linkages and the whole molecule, remains uncertain. Oligomannose oligosaccharides derived from the parent structure Man 9 GlcNAc 2 shown in Fig. 1 are early intermediate structures during glycoprotein N-glycan processing. They are also found on an extensive range of mature glycoproteins and in some cases their presence has been implicated in the biological function. The activity of ribonuclease B is modulated by the size of the oligomannose oligosaccharide attached to the single N- glycosylation site [9] and the presence of oligomannose oligo- saccharides on the tailpiece of IgM has been implicated in cor- rect pentamer formation, antigen induced changes in quaternary structure and subsequent clearance [10]. In addition, glucosyl-
-
Upload
independent -
Category
Documents
-
view
0 -
download
0
Transcript of The high degree of internal flexibility observed for an oligomannose oligosaccharide does not alter...

Eur. J. Biochem.258, 3722386 (1998) FEBS1998
The high degree of internal flexibility observed for an oligomannoseoligosaccharide does not alter the overall topology of the molecule
Robert J. WOODS1, Ahammadunny PATHIASERIL1, Mark R. WORMALD2, Christopher J. EDGE2 and Raymond A. DWEK2
1 Complex Carbohydrate Research Center, Department of Biochemistry, University of Georgia, Athens, Georgia, USA2 Glycobiology Institute, Department of Biochemistry, University of Oxford, Oxford, UK
(Received 26 May1998) 2 EJB 98 0715/5
The conformational properties of oligosaccharides are important in determining their biological prop-erties, such as recognition by proteins. The structural and dynamic properties of many oligosaccharidesare poorly understood both because of a lack of experimental data (usually obtained from solution NMRparameters) and because of gross approximations frequently invoked in theoretical models. To character-ise the oligomannose oligosaccharide Man9GlcNAc2 we have acquired a more extensive NMR data setand performed the first unrestrained molecular dynamics (MD) simulation in water of this large oligosac-charide (employing the GLYCAM—93 parameter set with the AMBER force field). Good agreement isseen between the computed dynamics data and the results of both an isolated spin pair (ISPA) analysisof short mixing time NOE data and NOE build-up curves for mixing times from100 to 2000 ms. Thenumber of experimental conformational constraints obtained in this study are in principle sufficient tofully define a rigid structure. The fact that this could not be done indicates a high degree of internalflexibility and/or the presence of multiple conformations about the glycosidic linkages. Independently,the same conclusions are reached from an analysis of the MD results. In addition, the theoretical resultsallow the overall topology of the molecule and its intra-molecular and solvent-mediated hydrogen bondingpattern to be defined. Extensive re-organisation of solvent and inter-residue hydrogen bonds is shown tobe required for significant conformational changes to occur, resulting in relatively long life-times fordistinct glycosidic linkage conformations, despite the high local flexibility of the glycosidic linkages.This factor is also seen in the overall topology of the molecule, where the considerable internal flexibilityis not translated into gross changes in structure. The control exerted by the solvent over both the flexibilityand overall topology of an oligosaccharide has important implications for recognition processes and forthe conformational properties of glycans attached to glycoproteins.
Keywords:AMBER; GLYCAM; molecular dynamics; simulations; NMR; NOE; oligosaccharide.
One of the major roles for oligosaccharides in biological sys-tems is to act as recognition markers for specific proteins. Thestrength of binding between a glycan and a protein will dependon a number of factors, including the flexibility and solvation ofthe glycan as well as its conformation. Experimental informationon the conformational properties of oligosaccharides is usuallyobtained by solution1H-NMR spectroscopy using nuclear Over-hauser effects (NOEs). The use of NMR parameters to defineoligosaccharide conformations has two major problems: NMRparameters only provide an average picture on a millisecond(ms) time scale, and the NMR parameters are frequently insuffi-cient to characterise uniquely the average conformation of themolecule [1, 2]. Unlike proteins, oligosaccharides offer only a
Correspondence toR. J. Woods, Complex Carbohydrate ResearchCenter, Department of Biochemistry, University of Georgia, Athens,Georgia 30602, USA
Fax: 11 706 542 4412.E-mail : [email protected]: www.uga.edu/~biochem/Abbreviations.AMBER, assisted model building and energy refine-
ment ; gg, gauche-gauche; GLYCAM, glycoproteins and carbohydrateswith AMBER; gt, gauche-trans; ISPA, isolated spin-pair approximation;GlcNAc, N-acetylglucosamine orN-acetylglucosaminyl; MBP, man-nose-binding protein; MD, molecular dynamics; MORASS, multispinOverhauser relaxation analysis and simulations;tg, trans-gauche.
very limited number of NOEs for analysis, resulting in a confor-mationally under-determined system. The data obtained are usu-ally compatible with either several different rigid structures, oran ensemble of flexible structures, for each glycosidic linkage.
Theoretical approaches, such as molecular dynamics (MD)simulation or Monte Carlo sampling, can provide, in principle,accurate structural and dynamic properties. Inaccuracies in mo-lecular force fields for carbohydrates [3], as well as a reluctanceto treat water explicitly, have until recently [426] limited theapplication of MD methods to qualitative conformationalsearches [7] or to modelling employing experimentally deter-mined restraints [8]. Thus, the precise degree of flexibility, bothfor the individual glycosidic linkages and the whole molecule,remains uncertain.
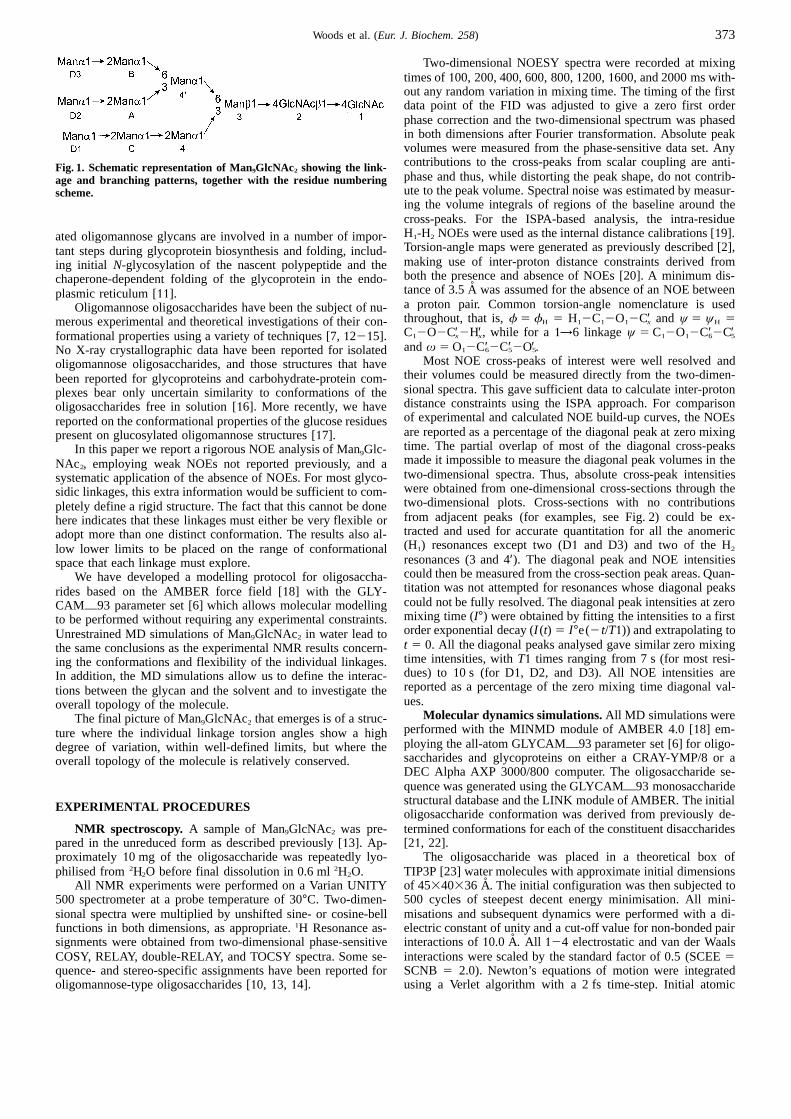
Oligomannose oligosaccharides derived from the parentstructure Man9GlcNAc2 shown in Fig.1 are early intermediatestructures during glycoproteinN-glycan processing. They arealso found on an extensive range of mature glycoproteins and insome cases their presence has been implicated in the biologicalfunction. The activity of ribonuclease B is modulated by the sizeof the oligomannose oligosaccharide attached to the singleN-glycosylation site [9] and the presence of oligomannose oligo-saccharides on the tailpiece of IgM has been implicated in cor-rect pentamer formation, antigen induced changes in quaternarystructure and subsequent clearance [10]. In addition, glucosyl-
373Woods et al. (Eur. J. Biochem. 258)
Fig. 1. Schematic representation of Man9GlcNAc2 showing the link-age and branching patterns, together with the residue numberingscheme.
ated oligomannose glycans are involved in a number of impor-tant steps during glycoprotein biosynthesis and folding, includ-ing initial N-glycosylation of the nascent polypeptide and thechaperone-dependent folding of the glycoprotein in the endo-plasmic reticulum [11].
Oligomannose oligosaccharides have been the subject of nu-merous experimental and theoretical investigations of their con-formational properties using a variety of techniques [7,12215].No X-ray crystallographic data have been reported for isolatedoligomannose oligosaccharides, and those structures that havebeen reported for glycoproteins and carbohydrate-protein com-plexes bear only uncertain similarity to conformations of theoligosaccharides free in solution [16]. More recently, we havereported on the conformational properties of the glucose residuespresent on glucosylated oligomannose structures [17].
In this paper we report a rigorous NOE analysis of Man9Glc-NAc2, employing weak NOEs not reported previously, and asystematic application of the absence of NOEs. For most glyco-sidic linkages, this extra information would be sufficient to com-pletely define a rigid structure. The fact that this cannot be donehere indicates that these linkages must either be very flexible oradopt more than one distinct conformation. The results also al-low lower limits to be placed on the range of conformationalspace that each linkage must explore.
We have developed a modelling protocol for oligosaccha-rides based on the AMBER force field [18] with the GLY-CAM—93 parameter set [6] which allows molecular modellingto be performed without requiring any experimental constraints.Unrestrained MD simulations of Man9GlcNAc2 in water lead tothe same conclusions as the experimental NMR results concern-ing the conformations and flexibility of the individual linkages.In addition, the MD simulations allow us to define the interac-tions between the glycan and the solvent and to investigate theoverall topology of the molecule.
The final picture of Man9GlcNAc2 that emerges is of a struc-ture where the individual linkage torsion angles show a highdegree of variation, within well-defined limits, but where theoverall topology of the molecule is relatively conserved.
EXPERIMENTAL PROCEDURES
NMR spectroscopy. A sample of Man9GlcNAc2 was pre-pared in the unreduced form as described previously [13]. Ap-proximately 10 mg of the oligosaccharide was repeatedly lyo-philised from2H2O before final dissolution in 0.6 ml2H2O.
All NMR experiments were performed on a Varian UNITY500 spectrometer at a probe temperature of 30°C. Two-dimen-sional spectra were multiplied by unshifted sine- or cosine-bellfunctions in both dimensions, as appropriate.1H Resonance as-signments were obtained from two-dimensional phase-sensitiveCOSY, RELAY, double-RELAY, and TOCSY spectra. Some se-quence- and stereo-specific assignments have been reported foroligomannose-type oligosaccharides [10, 13, 14].
Two-dimensional NOESY spectra were recorded at mixingtimes of100, 200, 400, 600, 800,1200,1600, and 2000 ms with-out any random variation in mixing time. The timing of the firstdata point of the FID was adjusted to give a zero first orderphase correction and the two-dimensional spectrum was phasedin both dimensions after Fourier transformation. Absolute peakvolumes were measured from the phase-sensitive data set. Anycontributions to the cross-peaks from scalar coupling are anti-phase and thus, while distorting the peak shape, do not contrib-ute to the peak volume. Spectral noise was estimated by measur-ing the volume integrals of regions of the baseline around thecross-peaks. For the ISPA-based analysis, the intra-residueH1-H2 NOEs were used as the internal distance calibrations [19].Torsion-angle maps were generated as previously described [2],making use of inter-proton distance constraints derived fromboth the presence and absence of NOEs [20]. A minimum dis-tance of 3.5 A˚ was assumed for the absence of an NOE betweena proton pair. Common torsion-angle nomenclature is usedthroughout, that is,f 5 fH 5 H12C12O12C′x and ψ 5 ψH 5C12O2C′x2H′x, while for a 1→6 linkageψ 5 C12O12C′62C′5andω 5 O12C′62C′52O′5.
Most NOE cross-peaks of interest were well resolved andtheir volumes could be measured directly from the two-dimen-sional spectra. This gave sufficient data to calculate inter-protondistance constraints using the ISPA approach. For comparisonof experimental and calculated NOE build-up curves, the NOEsare reported as a percentage of the diagonal peak at zero mixingtime. The partial overlap of most of the diagonal cross-peaksmade it impossible to measure the diagonal peak volumes in thetwo-dimensional spectra. Thus, absolute cross-peak intensitieswere obtained from one-dimensional cross-sections through thetwo-dimensional plots. Cross-sections with no contributionsfrom adjacent peaks (for examples, see Fig. 2) could be ex-tracted and used for accurate quantitation for all the anomeric(H1) resonances except two (D1 and D3) and two of the H2resonances (3 and 4′). The diagonal peak and NOE intensitiescould then be measured from the cross-section peak areas. Quan-titation was not attempted for resonances whose diagonal peakscould not be fully resolved. The diagonal peak intensities at zeromixing time (I°) were obtained by fitting the intensities to a firstorder exponential decay (I (t) 5 I°e(2 t/T1)) and extrapolating tot 5 0. All the diagonal peaks analysed gave similar zero mixingtime intensities, withT1 times ranging from 7 s (for most resi-dues) to10 s (for D1, D2, and D3). All NOE intensities arereported as a percentage of the zero mixing time diagonal val-ues.
Molecular dynamics simulations.All MD simulations wereperformed with the MINMD module of AMBER 4.0 [18] em-ploying the all-atom GLYCAM—93 parameter set [6] for oligo-saccharides and glycoproteins on either a CRAY-YMP/8 or aDEC Alpha AXP 3000/800 computer. The oligosaccharide se-quence was generated using the GLYCAM—93 monosaccharidestructural database and the LINK module of AMBER. The initialoligosaccharide conformation was derived from previously de-termined conformations for each of the constituent disaccharides[21, 22].
The oligosaccharide was placed in a theoretical box ofTIP3P [23] water molecules with approximate initial dimensionsof 45340336 A. The initial configuration was then subjected to500 cycles of steepest decent energy minimisation. All mini-misations and subsequent dynamics were performed with a di-electric constant of unity and a cut-off value for non-bonded pairinteractions of10.0 A. All 124 electrostatic and van der Waalsinteractions were scaled by the standard factor of 0.5 (SCEE5SCNB 5 2.0). Newton’s equations of motion were integratedusing a Verlet algorithm with a 2 fs time-step. Initial atomic

374 Woods et al. (Eur. J. Biochem. 258)
Table 1. Inter-residues NOEs observed for Man9GlcNAc2. A blank indicates an undetermined value.
Proton pair NOE intensity at mixing time of (ms)
F1 F2 100 200 400 600 800 1200 1600 2000
%
3H1 4H1 0.07 0.22 0.52 0.79 0.96 1.04 0.82 0.87
3H2 4H1 0.24 0.60 1.01 1.28 1.61 1.68 1.41 1.18
4H1 CH1 1.82 1.48 1.12 0.813H1 0.46 0.66 0.78 0.95 1.05 1.03 0.533H2 0.37 0.66 1.23 1.59 1.73 1.80 1.62 1.253H4 0.84 1.35 1.47 1.40 1.52 1.57 1.293H5 0.71 0.94 1.12 0.95 0.94 0.96
4′H1 3H6 0.82 1.53 2.36 3.16 3.19 3.21 2.61 2.053H6 2.11 3.35 4.51 4.86 5.07 4.24 3.64 2.393H5 0.21 0.54 0.98 1.10 1.50 1.12 1.09 0.78
4′H2 AH1 0.22 0.40 0.68 0.88 0.98 0.99 0.91 0.80AH5 1.72 2.22 2.71 2.58 2.55 2.23 1.64
AH1 D2H1 0.36 0.79 0.76 0.72 0.83 0.83 0.634′H2 0.30 0.55 1.01 1.15 1.15 1.25 1.28 0.924′H3 2.92 4.76 7.93 8.60 8.15 7.73 6.29 4.154′H4 0.66 1.07 1.29 1.21 1.18 1.00 0.93AH5/D2H5 1.65 2.48 2.45 2.33 1.93 1.80 1.42
BH1 D3H1 0.94 0.89 0.80 0.49BH2/4′H6 1.53 2.57 3.77 4.47 4.73 4.25 3.24 2.46D3H5 0.76 1.21 1.77 2.00 2.05 1.93 1.59 1.014′H6 1.90 2.84 3.81 4.34 4.28 3.40 2.43 1.99
CH1 4H1 1.70 1.51 1.41 0.88D1H1 0.26 0.49 0.65 0.71 0.78 0.75 0.56CH2/4H2 3.03 5.33 7.80 9.04 9.40 8.29 6.08 4.534H3 0.51 0.71 0.90 1.01 1.02 0.93D1H5 0.96 1.68 2.02 1.97 1.73 1.40 1.13
DH1/D3H1 CH1 0.30 0.38 0.50 0.54 0.69 0.56 0.47BH1 0.77 0.74 1.11 0.74 0.60CH2 1.02 1.84 2.66 3.40 3.98 4.06 3.17 2.89BH2 1.19 2.00 3.19 3.80 4.01 3.94 3.26 2.86CH3/BH3 0.26 0.41 0.57 0.61 1.03 0.83 0.90
D2H1 AH1 0.20 0.36 0.57 0.59 0.61 0.67 0.64 0.49AH2 1.36 2.36 4.08 4.52 4.44 4.40 4.37 3.66AH3 0.23 0.31 0.30 0.47 0.45 0.51
velocities were assigned from a Maxwellian distribution at 5 K.During the simulation a constant pressure of1 atm was main-tained with isotropic position scaling and a pressure relaxationtime of 0.2 ps21. A constant temperature of 300 K was main-tained through weak coupling to an external bath with a couplingconstant of 0.25 ps21. All bond lengths were constrained to theirequilibrium values through application of the SHAKE algorithm.The dynamics simulations were not in any way constrained toreproduce experimental observables, such as NOE intensities.
Theoretical NOE intensities were calculated with a modifiedversion of the multispin Overhauser relaxation analysis and sim-ulations (MORASS) program, version 2.1 [24]. This version ofMORASS accepts as input a single protein coordinate set in theBrookhaven Protein Databank (pdb) format and was altered tobe able to read an AMBER coordinate trajectory. The convertedversion of MORASS computes the elements of the relaxationmatrix for each coordinate set, exclusive of solvent, and calcu-lates an average relaxation matrix over the course of the trajec-tory. The NOE intensities are then derived from the average re-laxation matrix. Alternative approaches to treating internal mo-tions in the derivation of NOEs from MD trajectories, basedon computing an average conformation over the course of the
trajectory, have been successfully applied to oligosaccharides[25].
RESULTS AND DISCUSSION
We have carried out two independent conformational analy-ses of Man9GlcNAc2, using experimental NMR measurementsand theoretical unrestrained molecular dynamics calculations, inorder to evaluate accurately the information and limitations ofthese two techniques. The results of these two independentanalyses were then compared by using the molecular dynamicssimulations to back-calculate certain NMR parameters, such asNOE-build-up curves.
Conformational analysis by NMR spectroscopy (ISPA).Inthe absence of any prior conformational information, NMR-based distance constraints between pairs of protons are fre-quently employed to derive a preliminary conformational model.These constraints can be derived using the isolated spin-pair ap-proximation (ISPA) by comparing relative NOE intensities. Thisapproach assumes a simple r26 distance dependence of the NOE

375Woods et al. (Eur. J. Biochem. 258)
Table 2. Calculated inter-proton inter-residue distances in Man9Glc-NAc2. Distances derived from overlapping peaks are indicated by paren-theses. A prime indicates the proton belonging to the residue closer tothe reducing terminus.
Linkage Proton pair Distance Distance rangefor torsion-plots
A
(A1→2)C-4 H1/H′1 obscured
H1/H′2 (2.10) 2.022.4H1/H′3 3.23 3.0523.45H1/H′4 no NOE .3.5H5/H′1 (2.74) 2.623.0
D1-C H1/H′1 2.93 2.8023.15H1/H′2 2.17 2.0522.30H1/H′3 (3.35) 3.123.7H1/H′4 no NOE .3.5H5/H′1 (2.60) 2.422.9
D2-A H1/H′1 3.00 2.8523.20H1/H′2 2.19 2.0522.35H1/H′3 3.55 3.3523.80H1/H′4 no NOE .3.5H5/H′1 (2.50) 2.3522.65
D3-B H1/H′1 2.94 2.8023.15H1/H′2 2.13 2.0022.30H1/H′3 (3.35) 3.123.7H1/H′4 no NOE .3.5H5/H′1 (2.47) 2.322.7
(A1→3)
423 H1/H′1 3.30 3.1523.50H1/H′2 3.11 2.9523.30H1/H′3 shortH1/H′4 2.98 2.8523.20H1/H′5 no NOE .3.5H5/H′2 obscured
A-4′ H1/H′1 no NOE .3.5H1/H′2 2.99 2.8523.20H1/H′3 2.09 2.0022.25H1/H′4 2.90 2.7523.10H1/H′5 no NOE .3.5H5/H′2 2.69 2.5522.85
(A1→6)4′-3 H1/H′6 2.75 2.6022.90
H1/H′6 2.41 2.3022.55H1/H5 3.27 3.1023.50
B-4′ H1/H′6 (2.40) 2.222.7H1/H′6 2.14 2.0522.30H1/H′5 obscured
between a given pair of protons at short mixing times and ap-pears to be valid at mixing times less than150 ms, where theNOE build up curves are relatively linear. The ISPA approachrequires an internal calibration between a pair of protons ofknown separation, which for oligosaccharides is usually an intra-residue H1-H2 NOE [19]. Table1 lists all the quantifiable inter-residue NOEs for Man9GlcNAc2, Table 2 lists the ISPA-calcu-lated inter-proton distances.
The distance constraints derived from NOE data are averagevalues on a millisecond to second time scale. Thus, a distanceconstraint can be interpreted in terms of a structure only if it isassumed that there is a single, well-defined conformation for agiven linkage on this time-scale. Both positive (presence of an
Fig. 2. Selected NOE traces, parallel to F2, from the 800 ms mixingtime two-dimensional NOESY spectrum for Man9GlcNAc2. X 5HDO resonance position. (a) Trace through the D2H1 resonance, D2-AA-(1→2) linkage. (b) Trace through the AH1 resonance, A-4′ A-(1→3)linkage. (c) Trace through the 4′H1 resonance, 4′-3 A-(1→6) linkage.
NOE) and negative (absence of an NOE) distance constraintscan be used systematically to generate maps of glycosidic link-age torsion-angle space consistent with the NMR data [20]. Ifthis mapping does not define regions of conformational spaceconsistent with all the constraints, then the linkage cannot existin a single, well-defined conformation. However, the presence ofa region of conformational space consistent with all the distanceconstraints indicates only that this conformation would repro-duce the observed NMR parameters, not that it necessarily de-fines the actual structure in solution [1, 26]. Using the ISPAapproach, we derived a simplistic model that allowed us to selecta starting conformation for the MD simulations.
B-(1→2) linkages. In addition to each of the terminalA-(1→2)linkages, there is an internalA-(1→2) linkage (C-4) in Man9Glc-NAc2. For the C-4 linkage, NOEs were observed from CH1 to4H1, 4H2, and 4H3 and from 4H1 to CH5. It was not possible toaccurately measure either the CH1-4H2 NOE because of overlapwith the CH1-CH2 NOE, or the 4H1-CH5 NOE because of over-lap with, among others, the 4H1-3H3 NOE. Further, the overlapwith the CH1-CH2 NOE prevented it from being used directly asan internal calibration for the ISPA approximation. Conse-quently, the CH1-4H2 distance was derived from the AH1-AH2
NOE, with the assumption that the CH1-CH2 NOE is essentiallythe same as the AH1-AH2 NOE. The torsion-angle map thusgenerated is similar to that for the D2-A linkage (see below),with no single conformation satisfying all the NOE constraints.

376 Woods et al. (Eur. J. Biochem. 258)
Fig. 3. Selected glycosidic linkage contour plots showing the regionsof conformational space consistent with the NOE distance con-straints. The hatched areas indicate the regions of conformational spaceconsistent with each observed NOE (values for the ranges used are givenin Table 2). The non-shaded areas give the regions of conformationalspace that cannot be significantly populated, as indicated by the absenceof an NOE [20]. Solid grey shading at intersection areas indicates re-gions of conformational space consistent with all the distance con-straints. (a) D2-AA-(1→2) linkage._, H1-H1′ NOE;`, H1-H2′ NOE;c, H1-H3′ NOE; b, H5-H1′ NOE; h, H1-H4′ absent NOE. (b) A-4′A-(1→3) linkage._, H1-H2′ NOE;`, H1-H3′ NOE;c, H1-H4′ NOE;b, H5-H2′ NOE. (c) 4′-3 A-(1→6) linkage._ `, H1-H6′ NOEs.
In the 2D NOESY spectra, the diagonal cross-peak fromD2H1 overlapped with the diagonal peaks from the D1H1 andD3H1 resonances, however, a suitable trace through the contourplot was extracted to minimise this overlap. NOEs were ob-served from D2H1 to AH1, AH2, and AH3 (Fig. 2a) and fromAH1 to D2H5 (Fig. 2b). Each of these NOEs could be quantified,except the latter, which also overlapped with the NOE betweenAH1 and AH5. However, the contribution from the AH1 to AH5
NOE is probably very small, as other intra-residue H1 to H5
NOEs are typically very weak. The torsion-angle map (Fig. 3a)shows that no single conformation is consistent with all the dis-tance constraints calculated from the NOEs, but there is oneconformation (250°, 45°) that is consistent with all the NOEconstraints except the weakest one (D2H1-AH3). The NMR dataare consistent with a small variation inΦ (250°610°) but sug-gest a highly variableΨ angle (10°650°). The range ofΦ val-ues is consistent with the preferences attributed to the exo-anom-eric effect [27].
The D1H1 and D3H1 resonances have nearly identical chemi-cal shifts, and overlap could not be eliminated by choosing asuitable1D trace. NOEs were observed from D1H1 to CH1 andCH2, from D3H1 to BH1 and BH2, from BH1 to D3H5, and fromCH1 to D1H5. If both the D1H1-CH3 and D3H1-BH3 NOEs werepresent, they would be completely overlapping, as are the D1H1-D1H2 and D3H1-D3H2 NOEs. The sum of the D1H1-D1H2 andD3H1-D3H2 NOEs is approximately twice that of the D2H1-D2H2 NOE, and for calibration the observed intensity was di-vided equally between the two proton pairs. Both the BH1-D3H5
and CH1-D1H5 NOEs overlapped with other peaks to a smallextent. Given these assumptions, the linkage conformationanalysis was very similar to that for the D2-A linkage, with nosingle conformation consistent with all the NOE constraints.
B-(1→3) linkages. NOEs were observed for the 423 linkagefrom 4H1 to 3H1, 3H2, 3H3, and 3H4. Of these, the strongestNOE was the 4H1-3H3, but it could not be measured quantita-tively because of extreme overlap. At longer mixing times a4H123H5 spin-diffusion peak could be seen. No single confor-mation is consistent with the distances calculated from the threesmall, quantifiable NOEs. In the case of the A-4′ linkage, NOEswere observed from AH1 to 4′H2, 4′H3, and 4′H4 (Fig. 2b) andfrom 4′H2 to AH5, all of which could be quantified. The torsion-angle map (Fig. 3b) shows that no single conformation is consis-tent with all the distance constraints calculated from theseNOEs. There is one region at245°, 30° that satisfies the threestrongest NOE constraints, but all the constraints span a largeregion of conformational space (245°610°, 0°650°). Again,this range off-angle values satisfies the exo-anomeric effect.
B-(1→6) linkages. For the 4′-3 linkage, NOEs were observedfrom 4′H1 to 3H6, 3H′6, and 3H5 (Fig. 2c), all of which werequantified. Two possible linkage conformations are consistentwith the first two NOEs (Fig. 3c) atf 5 235°615°, ψ 5180°610° and 40°610°, 145°615°. Only the former is consis-tent with the knownf torsion-angle preferences. The strength ofthe 4′H123H5 NOE is consistent only with the most populatedconformations having anω angle of260° (gg). Previous mea-surements of3J5,6 coupling constants suggest that theω angle isa ratio of 80% of the260° conformer and 20% of the 60° (gt)[13]. In the case of the outerA-(1→6) linkage (B-4′), NOEs wereobserved from BH1 to 4′H6 and 4′H′6. Only one of these couldbe accurately quantified; the other overlapped with the BH1-BH2
NOE. The latter NOE was estimated by assuming that the BH1-BH2 NOE was the same as the AH1-AH2 NOE, and this valuewas subtracted from the measured intensity. Both NOEs aremore intense than the equivalent NOEs for the 4′-3 linkage. Themost likely explanation for this increased intensity is that theB-4′ linkage is more flexible than the 4′-3 linkage, allowing theBH1 proton to move closer to both 4′H6 protons. The BH1-4′H5
NOE, if present, would be obscured by the BH1-D3H5 NOE.However, previous measurements ofJ5,6 coupling constants sug-gest that theω torsion angle is also slightly more flexible thanfor the 4′-3 linkage [13].
β-(1→4) linkages.It was not possible to obtain NOE constraintsfor proton pairs involving these two residues due to the strongcoupling effects (as a result of small chemical shift dispersion)between the ring-protons of the GlcNAc residues.
Conformational analysis by molecular dynamics simulation.The values of the glycosidic angles for Man9GlcNAc2, plottedas a function of the MD simulation time, are presented in Fig. 4.By the end of the first 5 ps of the simulation, the temperatureof the system had reached approximately 300 K, however, the

377Woods et al. (Eur. J. Biochem. 258)
Fig. 4. Plots of torsion angle versus simulation time for the glycosidic linkages in Man9GlcNAc2. The data were obtained from1000 ps ofunrestrained MD simulations in water (see text for details). The definitions off, ψ, andω are given in the text. The graphs are presented in theorder given in Fig.1. All vertical axes range from2150° to 210°.
presence of large conformational transitions during the first1002200 ps suggests that conformational equilibration wouldnot be reached until a point long after that at which many sol-vated simulations are currently terminated.
B-(1→2) linkages.An examination of the MD trajectory for themannose residues that combine to form the outerA-(1→2) link-ages (D1-C, D2-A, D3-B ; Fig. 4) indicated that in each case theinitial conformation (f 5 260°, ψ 5 260°) underwent a spon-taneous transition to an alternative rotamer with a positiveψangle, analogous to that observed for the relevant mannose di-saccharide [21, 22].
In the initial conformation, the twoA-(1→2)-linked sugarrings adopted a relatively extended arrangement, whereas in thetransformed conformation the two rings were stacked together[21, 22]. In a recent MD simulation of Man9GlcNAc2 performedin vacuo, these A-(1→2) linkages preferred a conformationcloser to that of our initial state (f 5 260°, ψ 5 260°), al-though the values of theψ angle varied between approxi-mately 260° to 0° [7]. However, the stacked conformation isconsistent with chemical shift [28] and NOE NMR data [21, 22]and in gas-phase calculations has been predicted to be more sta-ble than the extended conformation by approximately 4 kJ/mol[29, 30]. In contrast, experimental optical rotation data for theA-(1→2)-linked mannose disaccharide are most consistent witha largely extended conformation. Based on gas-phase simula-tions, an intermediate conformation (247°, 220°), with exten-
sive flexibility in the ψ angle, is consistent with NOE data onthe disaccharide [31].
Both the D1-C and D3-B linkages adopted essentially indis-tinguishable stacked conformations characterised by values forf and ψ of (23969°, 56614°) and (24269°, 55614°), re-spectively. These values were calculated for the periods 22021000 ps (abbreviated [220,1000]) for D1-C and [100, 780] forD3-B, which are representative of the post-equilibration periodsduring which stacked conformations are present. It should benoted that the D3-B trajectory displayed a relatively short-livedtransition (less than10% of the total simulation time) to theextended form between [780, 860]. The D1-C trajectory alsoindicated that this conformation is present for a relatively briefperiod immediately following equilibration. Although the re-maining terminalA-(1→2) linkage, D2-A, also adopted a stackedconformation identical to that for D1-C and D3-B (namely,f 5 23969° andψ 5 52622°), it existed only over the period[640, 800]; the preponderant conformation for the D2-A linkagehad a somewhat smaller positiveψ-value, namely (24668°,22614°). In this previously unobserved conformation the tworings are no longer in close contact with one another. Eventhough the D1-C and D3-B linkages exhibited inter-residue hy-drogen bonds essentially identical to those reported for a relateddisaccharide (namely, between O6· · · O′6 and O6· · ·O′5 [21]), nei-ther of these interactions was present in the case of the D2-Alinkage. The 30° alteration of theψ angle introduced a largeseparation between the D2O6· · ·AO6 and D2O6· · ·AO5 groups
378 Woods et al. (Eur. J. Biochem. 258)
and enabled hydroxyl group D2O6 to interact with hydroxylgroup 4′O4. This interaction involves three residues and wouldbe impossible to observe in any of the earlier disaccharide MDsimulations.
In contrast to the properties of the outerA-(1→2) linkages,the C-4 linkage appeared to have no preference between stackedand extended conformations. Initially [100, 220], this linkageadopted a stacked conformation (24268°, 44610°) similar tothat observed (221°, 27°) in a complex between Man6GlcNAc2-Asn and a dimeric fragment of a mammalian mannose-bindingprotein (MBP) [32]. (In order to convert the values reported inthe MBP-oligosaccharide complex for thef andψ angles to ournomenclature, hydrogen atoms were added to the crystal struc-ture with the Insight II molecular modelling program [33]).However, after 220 ps the C-4 linkage reverted to an extendedconformation (245616°, 232610°) and remained in that con-formation for approximately 500 ps. The reversion of this link-age to the extended form appeared to occur in concert with thetransition in the outerA-(1→2) linkage (D1-C) from the ex-tended to the stacked conformation over the period [200, 240].At approximately 750 ps, the C-4 linkage again assumed astacked conformation (24168°, 52611°). Conformationalanalysis based on torsion angles alone is insufficient to describethe more sensitive structural features. This can be seen from thefact that the inter-residue hydrogen bonding in the two stackedconformations for the C-4 linkage was entirely different fromthat of the outerA-(1→2) linkages. During the first period ofstacking [100, 220], weak hydrogen bonds characteristic of ring-stacking were observed between CO6· · · 4O6 and CO6· · ·4O5.During the second period [780,1000] these hydrogen bondswere replaced by a new interaction between D1O6 ·· ·CO6 andD1O6·· ·CO5. The interaction between CO6 and DO6 eliminatedthe possibility of an interaction between CO6 and 4O6 and viceversa. It appears that the two consecutiveA-(1→2) linkages,D1-C and C-4, must select between similar, but mutually exclu-sive, inter-residue interactions. Interestingly, during the extendedconformation phase of the C-4 trajectory [280, 740] the outerD1-C linkage exhibited characteristic stacking interactions. Al-though it appeared that the transition in the D1-C linkage fromextended to stacked conformation correlated with the oppositetransition in the adjacent C-4 linkage, it is not clear that thesetwo motions are causally related. Moreover, the presence of in-ter-residue hydrogen bonds may not induce or even significantlystabilise the local conformation, but merely reflect the presenceof a conformation in which the interacting atoms are located ina fortuitous orientation. In MD simulations of the disaccharide,Man-A-(1→2)-Man-A-OMe, the elimination of the energetic con-tribution from the HO6· · ·O′6 and HO6· · ·O′5 hydrogen bonds didnot lead to a preference for the extended conformation (data notshown).
B-(1→3) linkages. The A-(1→3) linkage between 4 and 3 hadan average conformation (245613°, 212616°) similar to thatobserved in the X-ray crystal structure (257.6°, 219.4°) of thetrisaccharide Man-A-(1→3)-Man-β-(1→4)-GlcNAc [34], similarto that predicted from MD simulations of the same trisaccharide(258610°, 228626°) [35], as well as similar to that predictedfrom MD studies of the disaccharide, Man-A-(1→3)-Man(256611°, 232616°) [21]. Gas-phase calculations also pre-dict this to be a low-energy conformation, with relative energiesvarying from 0.2123.4 kJ/mol for conformations (244.7°,211.7°) [29] and (250°, 220°) [30], respectively. Our averageconformation for the 423 linkage also falls within the broadrange of conformations predicted for this linkage from gas-phaseMD simulations (230°625°, 15660°) [7].
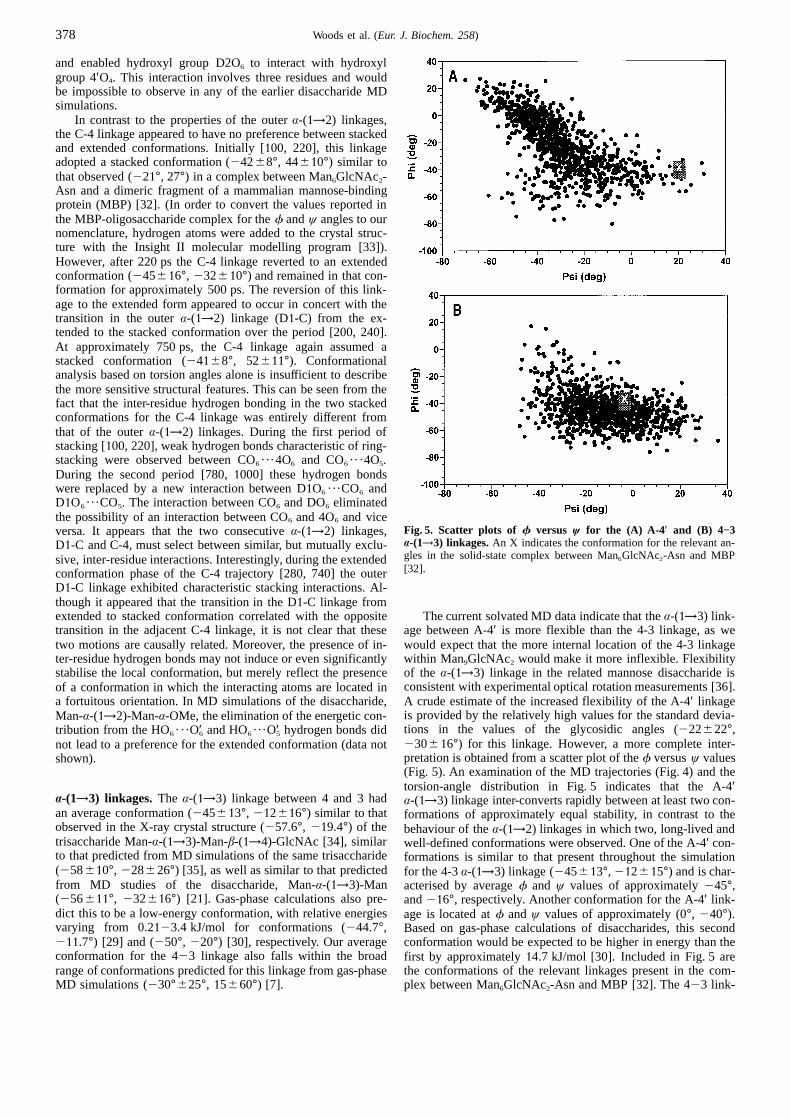
Fig. 5. Scatter plots of f versus ψ for the (A) A-4 ′ and (B) 4−3B-(1→3) linkages.An X indicates the conformation for the relevant an-gles in the solid-state complex between Man6GlcNAc2-Asn and MBP[32].
The current solvated MD data indicate that theA-(1→3) link-age between A-4′ is more flexible than the 4-3 linkage, as wewould expect that the more internal location of the 4-3 linkagewithin Man9GlcNAc2 would make it more inflexible. Flexibilityof the A-(1→3) linkage in the related mannose disaccharide isconsistent with experimental optical rotation measurements [36].A crude estimate of the increased flexibility of the A-4′ linkageis provided by the relatively high values for the standard devia-tions in the values of the glycosidic angles (222622°,230616°) for this linkage. However, a more complete inter-pretation is obtained from a scatter plot of thef versusψ values(Fig. 5). An examination of the MD trajectories (Fig. 4) and thetorsion-angle distribution in Fig. 5 indicates that the A-4′A-(1→3) linkage inter-converts rapidly between at least two con-formations of approximately equal stability, in contrast to thebehaviour of theA-(1→2) linkages in which two, long-lived andwell-defined conformations were observed. One of the A-4′ con-formations is similar to that present throughout the simulationfor the 4-3A-(1→3) linkage (245613°, 212615°) and is char-acterised by averagef and ψ values of approximately245°,and216°, respectively. Another conformation for the A-4′ link-age is located atf andψ values of approximately (0°, 240°).Based on gas-phase calculations of disaccharides, this secondconformation would be expected to be higher in energy than thefirst by approximately14.7 kJ/mol [30]. Included in Fig. 5 arethe conformations of the relevant linkages present in the com-plex between Man6GlcNAc2-Asn and MBP [32]. The 423 link-

379Woods et al. (Eur. J. Biochem. 258)
Fig. 6. (a) Intermittent hydrogen bond (– – –) between oxygen atomsD2O6 and 4′O4 and associated changes in the A-4′ f angle (––––).(b) Interatomic distance (– – –) between oxygen atoms CO6 and 3O4
and values of the 4−3 f angle (––––). (c) Interatomic separationbetween the D3O2 and CO6 oxygen atoms.
age conformation in the complex and that of the simulationshowed good agreement. In the complex the A-residue bound toMBP, which is the most likely reason for the somewhat alteredA-4′ linkage conformation in the complex relative to the MDdata.
The differences in the conformational properties of the twoA-(1→3) linkages correlate with differences in inter-residue hy-drogen bonding. In the case of the A-4′ linkage, a periodic inter-residue hydrogen bond was observed between oxygen atom O6
of residue D2 and O4 in residue 4′ (see Fig. 6a). The presenceof this hydrogen bond correlates with af value of approxi-mately 0° for the A-4′ linkage. For anA-linkage a value off < 260 is preferred by the exo-anomeric effect. Therefore, theD2O6· · ·4′O4 hydrogen bond is strong enough to significantlydistort the value of this angle. But for the 423 linkage no analo-gous hydrogen bond is present (CO6 · · ·3O4), and the value forthe f angle in the 423 linkage (245613°) is consistent withexpectations for anA-linkage (see Fig. 6b). It is noteworthy thatthe D2O6· · ·4′O4 inter-residue interaction spans the A-residue,and its influence on the properties of the A-4′ linkage is notdetectable on the basis of disaccharide simulations alone.
B-(1→6) linkages.The B-4′ linkage behaved in a manner analo-gous to that predicted for the corresponding mannose disaccha-ride, which is perhaps not surprising, given its relatively exposed
position in Man9GlcNAc2. Although thef angle in the B-4′ link-age maintained a steady value of256610° throughout the sim-ulation, the value of theψ angle (169628°) showed significantvariation. During the majority of the simulation [400,1000] theψ angle oscillated around a value of2176615°, and for thefirst 100 ps displayed a value of175611°. However, during theperiod [100, 400] theψ angle adopted values close to 90°. Val-ues for thef and ψ angles of approximately250° and 180°,respectively, are consistent with low-energy conformations pre-dicted from gas-phase calculations for the Man-A-(1→6)-Mandisaccharide [29, 30]; however, conformations in which theψangle is near 90° are higher in energy by 7.1 [29] to 10.5 kJ/mol[30].
The onset of the conformational change in theψ angle ap-pears to correlate with a rotation of theω angle from252.7610° (gg) to 50.6611° (gt). The gas-phase calculationson the related mannose disaccharide suggest that a value ofψ 590° is more stable in thegg rotamer than in thegt rotamer [29,30]. Thus, for the B-4′ linkage, the conformational change fromgg to gt induces a transient decrease in the value of theψ angle.Based on3JHH values of 2 Hz for each of the couplings betweenH5 and H6, and H′6, a preponderance of thegg rotamer has beenproposed for the B-4′ linkage [13, 37].
We conducted an analysis of the non-bonded interactions as-sociated with this linkage to determine the cause of the unex-pected transition fromgg to gt in the B-4′ ω angle. An examina-tion of the inter-oxygen distances between hydroxyl groups ofthe D3-arm and those within other residues of Man9GlcNAc2
revealed the presence of a transient hydrogen bond between hy-droxyl groups D3O2 · · ·CO6 (Fig. 6c), which existed over the pe-riod [200, 402]. The formation of this hydrogen bond was char-acterised by a rapid decrease in the D3O2 and CO6 separation,from <14 A to 3.1 A over the period [100, 200] and appearedto correlate with thegg to gt rotation in the B-4′ ω angle overthe same period. Once the rotational transition in theω anglehad occurred, the D3O2· · · CO6 hydrogen bond persisted forabout 200 ps before the inter-oxygen atomic separation gradu-ally returned to a value of<14 A. This behaviour suggested thatthe formation of the D3O2· · ·CO6 hydrogen bond induced therotational transition. Given the experimentally determined pref-erence for thegg rotamer, a significant rotational energy barriermust be present, consistent with the infrequent transitions com-puted for this angle. Once in thegt conformation, the time-scaleof the simulation is apparently insufficient to observe the rota-tion of this angle back to thegg conformation. Moreover, ifthis ω-angle transition requires the formation and subsequentbreaking of a hydrogen bond, rotation back to thegg conforma-tion will occur statistically even less frequently. If these transi-tions occur only rarely, the ns timescale of the simulation willnot be sufficient to determine their frequency. Transitions intoand out of thegg rotamer may occur without significantly alter-ing the average NMR parameters, provided the transitions areinfrequent on the ms time-scale.
In contrast, the 4′-3 linkage maintained a single, relativelyrigid conformation throughout the simulation, which could becharacterised byf, ψ, and ω values of257610°, 177610°,and 256610°, respectively. These values compare favourablywith the conformation of this linkage (251°, 177°, 266°) inthe complex between Man6GlcNAc2-Asn and MBP [32]. Thestandard deviations of the MD values are among the smallestfor any glycosidic torsion angle in Man9GlcNAc2, suggesting itis relatively rigid. Similar conclusions have been drawn fromNMR studies regarding the relative flexibilities of the 4′-3 andB-4′ linkages [13] and fromin vacuoMD simulations [7]. How-ever, the data from the simulations performedin vacuodid notreproduce the known gauche preferences of theA-(1→6) link-

380 Woods et al. (Eur. J. Biochem. 258)
Fig. 7. f, ψ Trajectories for GlcNAc linkages. (a) f, ψ Trajectory forthe Man-β-(1→4)-GlcNAc linkage indicating that the distance betweenthe 3O5 and 2O3 oxygen atoms correlates closely with theψ angle. (b)f, ψ Trajectory for the GlcNAc-β-(1→4)-GlcNAc linkage. Throughoutthe simulation the 2O5 and 2O3 oxygen atoms were within hydrogenbonding distance of one another, independent of the values of thef orψ angles.
ages and frequently indicated a strong preference for the uncom-mon tg (ω 5 180°) rotamer (ωH 5 60° in [7]). Considerableevidence exists that the preference for1→6 linkages to adoptthe gg or gt conformation arises from solvation [38] or crystal-
Fig. 8. Histogram of the f, ψ angles for the GlcNAc-β-(1→4)-GlcNAc linkage, derived by sorting the MD trajectory into 16 equal 15° binsin each dimension.
matrix effects [39]. It is not surprising, therefore, that MD simu-lations performed in the absence of explicit water moleculesfailed to correctly predict this general property.
The relatively long duration of the current simulation not-withstanding, it is possible that rotation of the 4′-3 ω angle is notobserved because of the short real-time scale of the simulation.Nevertheless, thisA-(1→6) linkage in Man9GlcNAc2 has beenshown experimentally to exist almost exclusively in thegg con-formation [13, 37]. The absence of inter-arm hydrogen bonds inmore highly trimmed oligomannose structures may explain whyboth gauche rotamers of the 4′-3 linkage are populated in thesmaller oligosaccharides.
β-(1→4) linkages.The MD-derived values of the glycosidic an-gles show considerable variability, but after the initial 300 ps ofthe simulation a reorientation of theψ angle occurs, which re-sults in a more stable trajectory and in averagef andψ anglesfor the period [300,1000] of 46613°, 210616°. Gas-phasemodelling studies of the Man-β-(1→4)-GlcNAc disaccharidehave identified a similar conformation (35240°, 10215°) as lowenergy, and it has been labelled B1 [30]. An examination of theMD trajectory for this linkage indicates that after<300 ps ahydrogen bond forms between the ring oxygen of residue 3 andthe hydroxyl group 2O3 (Fig. 7a).
Based on the data for the Man-β-(1→4)-GlcNAc (3-2) andGlcNAc-β-(1→4)-GlcNAc linkages (2-1) in Man9GlcNAc2
(Fig. 7b), it is apparent that the formation of an inter-residuehydrogen bond between the ring oxygen atom of the (n11)st
residue and O3 of the nth residue is incompatible with values fortheψ angle between these residues of greater than 0°. However,such a hydrogen bond may exist over a considerable range ofnegativeψ values, from 0° to 290°. Although values of theψangle greater than 0° were observed for the Man-β-(1→4)-GlcNAc linkage, repulsion between theN-acetyl group of thenon-reducing residue and H1 of the reducing residue appears toprohibit such a conformation in the GlcNAc-β-(1→4)-GlcNAclinkage.
The averagef andψ angles (36615°, 233623°) computedover the full trajectory for the 2-1 linkage in Man9GlcNAc2 aresimilar to those computed for the 3-2 linkage. These values aresimilar to a relatively low energy conformer, A2, (30°, 255°)predicted by gas-phase calculations to be<2.1 kJ/mol above theminimum energy conformation [30]. Moreover, the average MD

381Woods et al. (Eur. J. Biochem. 258)
Fig. 9. Selected glycosidic linkage contour plots showing the distribu-tion of f and ψ values obtained from the unrestrained MD simula-tion (points) and the NOE distance constraints.(See Fig. 3 captionfor details.) (a) D2-AA-(1→2) linkage. (b) A-4′ A-(1→3) linkage. (c)4′-3 A-(1→6) linkage.
values compare well with values of 30.2° and 244.8° deter-mined for an X-ray crystal structure of GlcNAc-β-(1→4)-GlcNAc-β-OH [40] and with MD values computed for a relatedtrisaccharide, Man-A-(1→3)-Man-β-(1→4)-GlcNAc (39613°,210611°) [35].
An X-ray crystal structure of GlcNAc-β-(1→4)-GlcNAc-A-OH gives rise tof andψ values of 36.3° and11.7°, respectively[41]. It is surprising that a change in the anomeric configurationat the reducing terminus should result in such significantchanges in the conformation of the glycosidic linkage. An ex-amination of the conformer distribution for the 221 linkage in-dicates that it is not simply a flexible linkage, as suggested bythe large standard deviation inψ, but is composed of two nearlyequal populations with approximate values of (45°, 215°) and(30°, 255°) (Fig. 8). The similarities of these values to thosereported for theA andβ anomers of GlcNAc-β-(1→4)-GlcNAc-OH is notable.
Comparison of experimental and theoretical results.In Fig. 9we superimposed the MD trajectories on the ISPA-derived dis-tance constraint plots for three selected linkages [4′-3 A-(1→6),A-4′ A-(1→3) and D2-AA-(1→2)]. The distribution of confor-mations obtained from the MD simulation reproduces qualita-tively very well the range of conformations derived from thedistance constraints.
Fig. 10. Theoretical NOE build-up curves derived from the MD sim-ulation from a full relaxation matrix calculation (––––) and the ex-perimental NOE intensities (including estimated error bars) for se-lected glycosidic linkages.A prime indicates the proton belonging tothe residue closest to the reducing terminus. (a) D2-AA-(1→2) linkage;s, D2H1 to AH1 ; h, D2H1 to AH2; n, D2H1 to AH3; e, AH1 to D2H5
1 AH5. (b) A-4′ A-(1→3) linkage;s, AH1 to 4′H2; h, AH1 to 4′H3; n,AH1 to 4′H4; e, 4′H2 to AH5. (c) 4′-3 A-(1→6) linkage;s, 4′H1 to 3H5;h andn, 4′H1 to 3H6.
To test the quantitative fit between the theoretical MD resultsand the experimental NMR parameters, the NOE build-upcurves for the inter-residue NOEs were calculated, using a fullrelaxation matrix. To make maximum use of the available exper-imental parameters, the NOE build-up curves were measuredwell into the spin-diffusion regime (mixing times much greaterthan 400 ms, selected data in Fig. 2) as well as in the initiallinear build-up region (as used in the ISPA approach). Calcula-tion of the build-up curves did not include water molecules inthe relaxation matrix, and a common correlation time of1 ns forall proton pairs led to good agreement between experimental andcomputed intensities.
The experimental NOE data and the calculated MD resultsfor the three selected linkages are shown in Fig.10. For theA-(1→3) (A-4′) and A-(1→6) (4′-3) linkages (Fig.10b and10c)agreement is excellent between the calculated and experimentaldata over the whole range of mixing times. For theA-(1→2)linkage (D2-A), the NOE from AH1 to D2H5 is reproduced well ;however, all the experimental NOEs originating from D2H1 areapproximately half the size of the calculated values (Fig.10a).
382 Woods et al. (Eur. J. Biochem. 258)
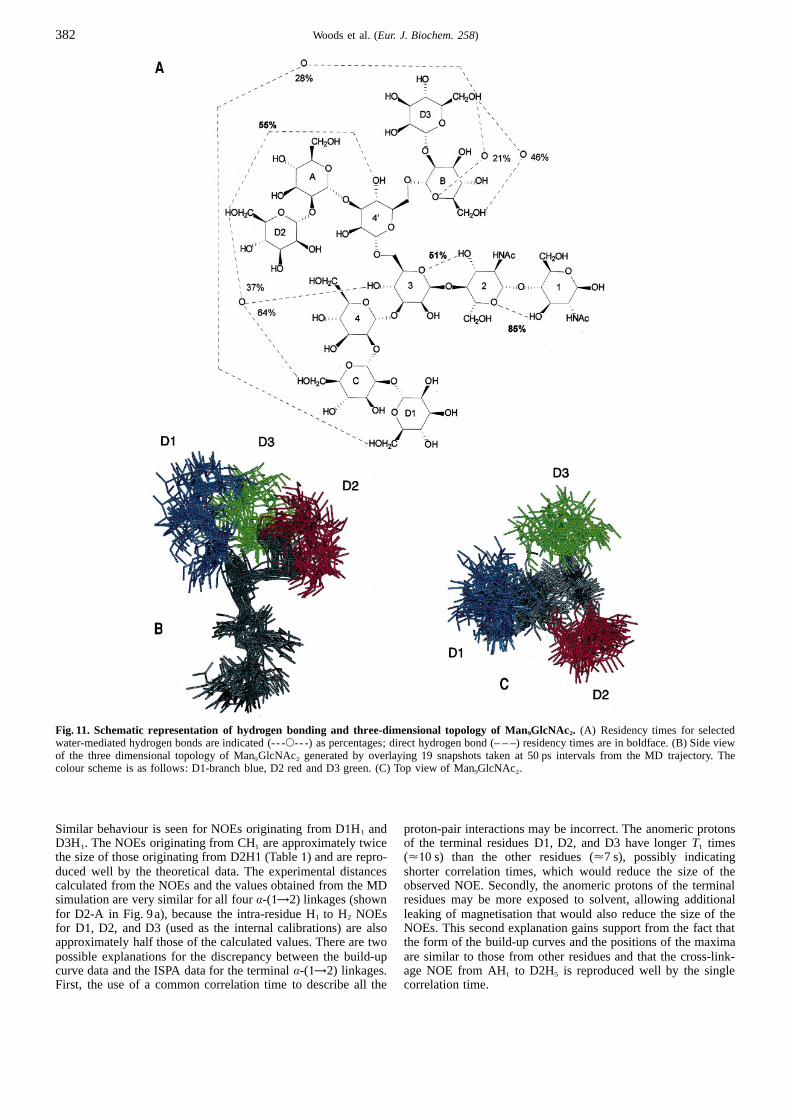
Fig. 11. Schematic representation of hydrogen bonding and three-dimensional topology of Man9GlcNAc2. (A) Residency times for selectedwater-mediated hydrogen bonds are indicated (-- -s-- -) as percentages; direct hydrogen bond (– – –) residency times are in boldface. (B) Side viewof the three dimensional topology of Man9GlcNAc2 generated by overlaying19 snapshots taken at 50 ps intervals from the MD trajectory. Thecolour scheme is as follows: D1-branch blue, D2 red and D3 green. (C) Top view of Man9GlcNAc2.
Similar behaviour is seen for NOEs originating from D1H1 andD3H1. The NOEs originating from CH1 are approximately twicethe size of those originating from D2H1 (Table1) and are repro-duced well by the theoretical data. The experimental distancescalculated from the NOEs and the values obtained from the MDsimulation are very similar for all fourA-(1→2) linkages (shownfor D2-A in Fig. 9a), because the intra-residue H1 to H2 NOEsfor D1, D2, and D3 (used as the internal calibrations) are alsoapproximately half those of the calculated values. There are twopossible explanations for the discrepancy between the build-upcurve data and the ISPA data for the terminalA-(1→2) linkages.First, the use of a common correlation time to describe all the
proton-pair interactions may be incorrect. The anomeric protonsof the terminal residues D1, D2, and D3 have longerT1 times(<10 s) than the other residues (<7 s), possibly indicatingshorter correlation times, which would reduce the size of theobserved NOE. Secondly, the anomeric protons of the terminalresidues may be more exposed to solvent, allowing additionalleaking of magnetisation that would also reduce the size of theNOEs. This second explanation gains support from the fact thatthe form of the build-up curves and the positions of the maximaare similar to those from other residues and that the cross-link-age NOE from AH1 to D2H5 is reproduced well by the singlecorrelation time.
383Woods et al. (Eur. J. Biochem. 258)
Solute-solvent interactions.The explicit treatment of solventmolecules in the MD simulation allowed us to determine theprevalence of solute-solvent hydrogen bonds. We computed theperiods during the simulation of Man9GlcNAc2 in which anyinter-oxygen distance is less than or equal to 3.0 A˚ (a relativelystringent definition of an inter hydroxyl hydrogen bond [21]).Fig. 11 summarises the most significant solute-solute and solute-solvent hydrogen bonds. Each of theA-(1→2) linkages displayeddirect and solvent-mediated hydrogen bonds characteristic ofthose linkages [21] ; the water-mediated hydrogen bonds for onlythe D3-B linkage are included in Fig.11. These interactions arequalitatively similar to those reported for the Man-A-(1→2)-Mandisaccharide [21]. The analysis also revealed the presence ofseveral strongly co-ordinated water molecules, mediating inter-arm hydrogen bonds. Earlier simulations of disaccharides indi-cated that the highest residency times (<50%) are those forwater molecules co-ordinated to vicinal hydroxyl groups. How-ever, in the case of Man9GlcNAc2, a residency time of<64%was observed for a water molecule co-ordinated to 3O4 and CO6.This position was involved in further interactions with D2O6 for<37% of the simulation. The highly co-ordinated network ofhydrogen bonds involving water molecules in this position is notsurprising, given the fact that this is a branch point in the mole-cule. Other inter-arm water-mediated hydrogen bonds were ob-served, including interactions between D3O6· · ·Ow·· ·D1O6. In-cluded in Fig.11 is an overlay of19 snapshots taken at 50 psintervals from the trajectory. The individual conformations werealigned by minimising the root-mean-squared deviation betweenall of the non-hydrogen atoms. This overlay clearly indicatesthe three dimensional relationship between the branches of theoligosaccharide, providing an explanation for the observed inter-arm hydrogen-bonding pattern. The overlay also illustrates theoverall topology of Man9GlcNAc2, which is relatively con-served, despite considerable fluctuations in most of the indivi-dual glycosidic linkages.
CONCLUSION
Previous conformational studies of Man9GlcNAc2 [19] usingNOEs and the ISPA approach have reported two NOEs for eachlinkage, with the exception of the ManA-(1→3) Man β linkage.These correspond, in almost all cases, to the strongest NOEsreported in Table 2. Torsion-angle plots generated using two dis-tance constraints for each linkage show either one or two regionsof conformational space consistent with all of the NOE data inevery case [2]. It is possible to construct a single structure forMan9GlcNAc2, which simultaneously satisfies all of these NOEconstraints for the whole molecule. However, there are too fewNOEs to conclude that the molecule necessarily adopts a rigidconformation.
The published inter-proton distances [19] are all within0.15 A of our calculated distances and fall within the distanceranges used to generate the torsion-angle plots (Table 2). How-ever, the inclusion of the extra distance constraints, based on theadditional weaker NOEs that we have observed, and the system-atic use of the absence of NOEs, changes dramatically the tor-sion-angle plots and their interpretation. These extra constraintswould now be sufficient to fully define a single conformationfor the molecule (four or more constraints to define two torsionangles for most linkages). The fact that such a conformationcannot be derived indicates that the molecule cannot be charac-terised by a single structure.
Only the A-(1→6) glycosidic linkages could adopt a singleconformation consistent with all the NMR distance constraints(for example, Fig. 3c). However, there are still only two distance
constraints (Table 2) for each of these linkages. Thus, it wouldbe premature to conclude that theA-(1→6) glycosidic linkagesdo in fact exist only in a single conformation. All the other link-ages (for example, Fig. 3a and b) must either show a high degreeof flexibility or adopt more than one conformation to satisfy thedistance constraints. In all cases, the experimental data can besatisfied by a range of glycosidic linkage conformations with asmall variation in thef angle (consistent with the exo-anomericeffect) but a much larger variation in theψ angle.
Unlike most experimental techniques, which provide a time-averaged result, MD simulations are well suited to investigatingthe individual conformations adopted by flexible molecules(Fig. 12). However, the validity of such theoretical methods canonly be assessed by comparison of the results of unbiased calcu-lations with independent experimental data. The increasednumber of experimental distance constraints reported here, to-gether with the NOE build-up curves measured long into thespin-diffusion regime, provide a more rigorous test of such MDsimulations than previously available. Using the GLYCAM—93parameter set and the AMBER force field, we obtained excellentagreement between the results of an unrestrained MD simulationof Man9GlcNAc2 in water and the experimental informationavailable from both NMR spectroscopy and X-ray crystallogra-phy. Given a good parameter set, an MD simulation performedwith the explicit inclusion of water must allow a long initialperiod for conformational equilibration (greater than 200 ps),and data must be averaged over a very long total simulation time(ideally much longer than even the1 ns reported here) to providea theoretical result that can reasonably be expected to reproducethe experimental data [42].
The issue of linkage flexibility is not entirely addressed byeither the MD simulations or the NMR data alone. Only theircombination allows an estimate of the extent to which a singleaverage structure (4′-3) or an ensemble of structures (A-4′) bestcharacterises a given linkage. The MD results clearly show thatin Man9GlcNAc2 the 4′-3 linkage (1→6) exhibits relatively lessmotion than do the other linkages. Thus, it could be said to berelatively rigid. The fact that the NMR data is also consistentwith a single rigid structure is supportive of this rather unex-pected result. However, on the time scale of the simulations itis not possible to conclude from the simulations alone that grossconformational interconversions might not occur.
The MD simulation of Man9GlcNAc2 indicates that in mostcases the glycosidic torsion angles oscillate around well-definedvalues for comparatively long periods of the total simulationtime. It is clear that during these time periods a single, well-characterised conformation is present. For such well-definedconformations the oscillations were typically on the order of610215°. However, even for these relatively stable glycosidiclinkages, significant periodic transitions may occur. In thesecases it is clear that the linkage does not exist as a normal distri-bution of conformations. Although these conformations areshort-lived compared to the time-scale for typical biological rec-ognition processes, they may contribute significant entropic in-fluences on carbohydrate-protein binding.
An extensive and relatively stable network of hydrogenbonds persists throughout the simulation of Man9GlcNAc2, in-volving both carbohydrate hydroxyl groups and water mole-cules. These interactions preferentially stabilise certain intra-and inter-arm conformations. In particular, the presence or ab-sence of water has a large effect on the predicted1→6 linkageω angles. A feature ofin vacuosimulations is the much largerfluctuations observed in many of the glycosidic angles [7]. Thus,the solvent-solute hydrogen bond network is flexible enough toaccommodate some torsional fluctuations in the glycosidic link-

384 Woods et al. (Eur. J. Biochem. 258)
Fig. 12. Snapshots taken at 100 ps intervals from the MD trajectory of Man9GlcNAc2. All structures were aligned by superimposing the non-hydrogen atoms of the GlcNAc-2 residue. For visual reference, GlcNAc-1 is labelled. All exo-cyclic groups and all hydrogen atoms have beenomitted for clarity. Carbon atoms are coloured green, oxygen red.
Table 3. Comparison of core conformations from selected glycoprotein X-ray crystal structures and that predicted from MD simulationsfor Man 9GlcNAc2.
Glycan Man-β-(1→4)-GlcNAc GlcNAc-β-(1→4)-GlcNAc
f angle ψ angle rmsa f angle ψ angle rms
deg A deg A
Average values for Man9GlcNAc2b 46613 210616 2 36615 233623 2
Man-β-(1→4)-GlcNAc-β-(1→4)-GlcNAc, [47] 42.9 237.8 0.31 46.7 10.2 0.57Man-β-(1→4)-GlcNAc-β-(1→4)-GlcNAc, [48] 37.2c 20.2 0.26 31.6 224.6 0.52
92.8d 27.2 0.55 45.8 26.0 0.24Man-β-(1→4)-GlcNAc-β-(1→4)-GlcNAc, [49] 221.5 237.6 0.74 45.0 3.0 0.48
a Root-mean-squared deviation between the X-ray crystallographic and theoretical structures, ring atoms, and glycosidic oxygen atoms only forthe specific linkage were included in the fit.
b Average values computed for the period [300,1000] ps.c Oligosaccharide chain beginning with GlcNAc residue 401 (numbering from [48]).d Oligosaccharide chain beginning with GlcNAc residue 411 (numbering from [48]).
ages but may play a role in maintaining an overall tertiary struc-ture by stabilising particular conformations (Fig.11).
A given oligosaccharide linkage cannot be considered in iso-lation but takes on conformational properties dependent on itsposition in the structure. Studies on smaller structures, such asdisaccharides, are of only limited use in the detailed analysis oflarge structures. For example, the two1→6 linkages (B-4′ and4′-3) show different degrees of flexibility. Correlated motionsbetween different linkages are also suggested, such as the con-certed conformational transitions of the D1-C and C-4 linkages.Furthermore, the terminal D2-A linkage exhibits a differentrange off andψ values from the D1-C or D3-B linkages, whichcan be attributed to inter-arm hydrogen bonding between resi-dues D2 and 4′. In this case, the resulting conformational differ-ences may be responsible for the different fates of these residues
observed during glycan processing; the D2-A linkage beingcleaved by anA-mannosidase in the endoplasmic reticulum andthe D1-C and D3-B linkages being cleaved byA-mannosidasesin the Golgi apparatus [43246].
The glycosidic angles forβ-(1→4) linkages in a selection ofreported glycoprotein X-ray crystal structures are given in Ta-ble 3. Although the values for theψ angles show considerablevariation, thef angles tend to be clustered around the expectedvalue. A root-mean-squared fitting between the ring atoms ofthe average MD conformation and each of these X-ray structuresled to small deviations, which were less than 0.5 A˚ on average.Thus, despite the variation in glycosidic angles, the overall con-formation of the oligosaccharide core is relatively conserved(Fig. 12) and appears to be not significantly altered upon proteinconjugation. This feature is achieved presumably through com-

385Woods et al. (Eur. J. Biochem. 258)
pensatory motions of the glycosidic linkages within the core.The observed conformational similarities between the free andprotein-conjugated oligosaccharide cores do not imply dynamicsimilarities. Because the free oligosaccharide core lacks the iner-tial resistance of the protein, the free core would be expected todisplay faster dynamic motions than the bound core.
It is interesting to speculate that the driving force for thesecompensatory motions in the core and the correlated motions inthe outer arms may be the conservation of the hydrogen bondnetwork between the carbohydrate residues and the solvent andor the maintenance of the solvent hydrogen bond network. Sim-ilar behaviour may occur for the other linkages, and this hasfundamental implications for the relationship between shape andmotion of carbohydrate molecules. The modulation of glycandynamics by the solvent also has implications for the entropychanges (and thus equilibrium constants) associated with glycanrecognition by proteins.
GLYCAM parameters for use with AMBER versions 4.0, 4.1 and5.0 are available upon request from R. Woods.
REFERENCES1. Cumming, D. A. & Carver, J. P. (1987) Virtual and solution confor-
mations of oligosaccharides,Biochemistry 26, 666426676.2. Wooten, E. W., Edge, C. J., Bazzo, R., Dwek, R. A. & Rademacher,
T. W. (1990) Uncertainties in structural determinations of oligo-saccharide conformation, using measurements of nuclear Over-hauser effects,Carbohydr. Res. 203, 13217.
3. Woods, R. J. (1997) Carbohydrate force fields, inEncyclopedia ofcomputational chemistry(Kollman, P. A., v. Schleyer, P. R., Al-linger, N. L. & Schaefer, H. F. III, eds), John Wiley and Sons,New York.
4. Naidoo, K. J., Denysyk, D. & Brady, J. W. (1997) Molecular dy-namics simulations of the N-linked oligosaccharide of the lectinfrom Erythrina corallodendron, Protein Eng. 10, 124921261.
5. Brisson, J.-R., Uhrı´nova, S., Woods, R. J., van der Zwan, M., Jarrell,H. C., Paoletti, L. C., Kasper, D. L. & Jennings, H. J. (1997)NMR and molecular dynamics studies of the conformational epi-tope of the type III group BStreptococcustype III capsular poly-saccharide,Biochemistry 36, 327823292.
6. Woods, R. J., Dwek, R. A., Edge, C. J. & Fraser-Reid, B. (1995)Molecular mechanical and molecular dynamical simulations ofglycoproteins and oligosaccharides.1. GLYCAM—93 parameterdevelopment,J. Phys. Chem. 99, 383223846.
7. Balaji, P. V., Qasba, P. K. & Rao, V. S. R. (1994) Molecular dy-namics simulations of high-mannose oligosaccharides,Glyco-biology 4, 4972515.
8. Rutherford, T. J. & Homans, S. W. (1994) Restrained vs free dy-namics simulations of oligosaccharides: application to solutiondynamics of biantennary and bisected N-linked glycans,Biochem-istry 33, 960629614.
9. Rudd, P. M., Woods, R. J., Wormald, M. R., Opdenakker, G., Down-ing, K. A., Campbell, I. D. & Dwek, R. A. (1994) The effects ofvariable glycosylation on the functional activities of ribonuclease,plasminogen and tissue plasminogen activator,Biochem. Biophys.Acta 1248, 1210.
10. Wormald, M. R., Wooten, W. E., Bazzo, R., Edge, C. J., Feinstein,A., Rademacher, T. W. & Dwek, R. A. (1991) The conformationaleffects ofN-glycosylation on the tailpiece from serum IgM,Eur.J. Biochem. 198, 1312139.
11. Ware, F. E., Vassilakos, A., Peterson, P. A., Jackson, M. R., Lehr-man, M. A. & Williams, D. B. (1995) The molecular chaperonecalnexin binds Glc1Man9GlcNAc2 oligosaccharide as an initialstep in recognizing unfolded glycoproteins,J. Biol. Chem. 270,469724704.
12. Imberty, A., Pe´rez, S., Hricovı´ni, M., Shah, R. N. & Carver, J. P.(1993) Flexibility in a tetrasaccharide fragment from the highmannose type ofN-linked oligosaccharides,Int. J. Biol. Macro-mol. 15, 17223.
13. Wooten, E. W., Bazzo, R., Edge, C. J., Zamze, S., Dwek, R. A. &Rademacher, T. W. (1990) Primary sequence dependence of con-formation in oligomannose oligosaccharides,Eur. Biophys. J. 18,1392148.
14. Homans, S. W., Pastore, A., Dwek, R. A. & Rademacher, T. W.(1987) Structure and dynamics in oligomannose-type oligosac-charides,Biochemistry 26, 664926655.
15. Homans, S. W., Dwek, R. A. & Rademacher, T. W. (1987) Solutionconformations ofN-linked oligosaccharides,Biochemistry 26,657126578.
16. Woods, R. J. (1995) Three-dimensional structures of oligosaccha-rides,Curr. Opin. Struct. Biol. 5, 5912598.
17. Petrescu, A. J., Butters, T. D., Reinkensmeier, G., Petrescu, S., Platt,F. M., Dwek, R. A. & Wormald, M. R. (1997) The solution NMRstructure of glucosylatedN-glycans involved in early stages ofglycoprotein biosynthesis and folding,EMBO J. 16, 430224310.
18. Pearlman, D. A., Case, D. A., Caldwell, J. C., Seibel, G. L., Singh,U. C., Weiner, P. & Kollman, P. A. (1991) AMBER 4.0, Universityof California, San Francisco.
19. Homans, S. W., Dwek, R. A. & Rademacher, T. W. (1987) Tertiarystructure inN-linked oligosaccharides,Biochemistry 26, 655326560.
20. Wormald, M. R. & Edge, C. J. (1993) The systematic use of negativenuclear Overhauser constraints in the determination of oligosac-charide conformations: application to sialyl-Lewis X,Carbohydr.Res. 246, 3372344.
21. Woods, R. J., Edge, C. J. & Dwek, R. A. (1994) The role of non-bonded interactions in determining the solution conformations ofoligosaccharides, InModelling the hydrogen bond(Smith, D., ed.)vol. 569, pp. 2522268, American Chemical Society, Washington,D.C.
22. Woods, R. J., Edge, C. J., Wormald, M. R. & Dwek, R. A. (1993)GLYCAM—93: A generalized parameter set for molecular dy-namics simulations of glycoproteins and oligosaccharides. Appli-cation to the structure and dynamics of a disaccharide related tooligomannose, inComplex carbohydrates in drug research,(Bock, K., Clausen, H., Krogsgaard-Larsen, P. & Kofod, H., eds)vol. 36, pp.15236, Munksgaard, Copenhagen, Denmark.
23. Jorgensen, W. L., Chandrasekhar, J., Madura, J. D., Impey, R. W. &Klein, M. L. (1983) Comparison of simple potential functions forsimulating liquid water,J. Phys. Chem. 79, 9262935.
24. Meadows, R. P., Post, C. B., Luxon, B. A. & Gorenstein, D. G.(1994)Multispin Overhauser relaxation analysis and simulations(MORASS), Purdue University, West Lafayette.
25. Lommerse, J. P. M., Kroon-Batenburg, L. M. J., Kroon, J., Kamer-ling, J. P. & Vliegenthart, J. F. G. (1995) Conformations and in-ternal mobility of a glycopeptide derived from bromelain usingmolecular dynamics simulations and NOESY analysis,J. Biomol.NMR 5, 79294.
26. Widmalm, G., Byrd, A. R. & Egan, W. (1992) A ConformationalStudy of A-L-Rhap-(122)-A-L-Rhap-(1-OMe) by NMR nuclearOverhauser effect spectroscopy (NOESY) and molecular dy-namics calculations,Carbohydr. Res. 229, 1952211.
27. Lemieux, R. U., Koto, S. & Voisin, D. (1979) The exo-anomericeffect, in Anomeric effect. Origin and consequences(Szarek, W.A. & Horton, D., eds) vol. 87, pp.17229, American ChemicalSociety, Washington, D.C.
28. Ogawa, T. & Sasajima, K. (1981) 1H- and13C-N.M.R.-spectral studyof synthetic methylD-manno-oligosaccharides,Carbohydr. Res.97, 2052227.
29. Dowd, M. K., French, A. D. & Reilly, P. J. (1995) Molecular me-chanics modeling ofA-(122)-, A-(123)-, and a-(126)-linkedmannosyl disaccharides with MM3(92),J. Carbohydr. Chem. 14,5892600.
30. Imberty, A., Gerber, S., Tran, V. & Pe´rez, S. (1990) Data Bank ofthree-dimensional structures of disaccharides, a tool to build 3-Dstructures of oligosaccharides,Glycoconjugate J. 7, 27254.
31. Peters, T. (1991) Synthesis and conformational analysis of methyl2-O-(A-D-mannopyranosyl)-A-D-mannopyranoside,Liebigs Ann.Chem., 1352141.
32. Weis, W. I., Drickamer, K. & Hendrickson, W. A. (1992) Structureof a C-type mannose-binding protein complexed with an oligosac-charide,Nature 360, 1272134.
386 Woods et al. (Eur. J. Biochem. 258)
33. Biosym/MSI (1995) Insight II. Biosym/MSI, San Diego.34. Warin, V., Baert, F., Fouret, R., Strecker, G., Spik, G., Fournet, B.
& Montreuil, J. (1979) The crystal and molecular structure ofO-A-D-mannopyranosyl-(123)-O-β-D-mannopyranosyl-(124)-2-acetamido-2-deoxy-A-D-glucopyranose,Carbohydr. Res. 76, 11222.
35. Homans, S. W. (1990) A molecular mechanical force field for theconformational analysis of oligosaccharides: comparison of theo-retical and crystal structures of ManA1-3Manβ1-4GlcNAc, Bio-chemistry 29, 911029118.
36. Stevens, E. S. (1994) The potential energy surface of methyl 3-O-(A-D-mannopyranosyl)-A-D-mannopyranoside in aqueous solu-tion: conclusions derived from optical rotation,Biopolymers 34,139521401.
37. Homans, S. W., Dwek, R. A., Boyd, J., Mahmoudian, M., Richards,W. G. & Rademacher, T. W. (1986) Conformational transitions inN-linked oligosaccharides,Biochemistry 25, 634226350.
38. Kroon-Batenburg, L. M. J. & Kroon, J. (1990) Solvent effect on theconformation of the hydroxymethyl group established by molecu-lar dynamics simulations of methyl-β-D-glucoside in water,Bio-polymers 29, 124321248.
39. Marchessault, R. H. & Perez, S. (1979) Conformations of thehydroxymethyl group in crystalline aldohexopyranoses,Biopoly-mers 18, 236922374.
40. Mo, F. (1979) On the conformational variability of theN-acetylglu-cosaminβ-(124) linked dimer. Crystal and molecular structureof β-N,N′-diacetylchitobiose trihydrate,Acta Chem. Scand. A33,2072218.
41. Mo, F. & Jensen, L. H. (1978) The crystal structure of a B-(124)linked disaccharide,A-N,N′-diacetylchitobiose monohydrate,ActaCrystallogr. B34, 156221569.
42. Woods, R. J. (1996) The application of molecular modeling tech-niques to the determination of oligosaccharide solution conforma-tions. InReviews in computational chemistry(Lipkowitz, K. B. &Boyd, D. B., eds) Chapter 3, VCH Publishers, Inc., New York.
43. Bischoff, J., Moremen, K. & Lodish, H. F. (1990) Isolation, charac-terization, and expression of cDNA encoding a rat liver endo-plasmic reticulumA-mannosidase,J. Biol. Chem. 265, 17110217117.
44. Trimble, R. B. & Atkinson, P. H. (1986) Structure of yeast externalinvertase Man8214GlcNAc processing intermediates by 5002MegaHertz1H NMR spectroscopy,J. Biol. Chem. 261, 981529824.
45. Bischoff, J. & Kornfeld, R. (1983) Evidence for anA-mannosidasein endoplasmic reticulum of rat liver,J. Biol. Chem. 258, 790727910.
46. Byrd, J. C., Tarentino, A. L., Maley, F., Atkinson, P. H. & Trimble,R. B. (1982) Glycoprotein synthesis in yeast,J. Biol. Chem. 257,14657214666.
47. Shaanan, B., Lis, H. & Sharon, N. (1991) Structure of a legumelectin with an orderedN-linked carbohydrate in complex withlactose,Science 254, 8622866.
48. Bode, W., Meyer, E. Jr & Powers, J. C. (1989) Human leukocyte andporcine pancreatic elastase : X-ray crystal structures, mechanism,substrate specificity, and mechanism-based inhibitors,Biochemis-try 28, 195121963.
49. Freymann, D., Down, J., Carrington, M., Roditi, I., Turner, M. &Wiley, D. (1990) 2.9 Aresolution structure of the N-terminal do-main of a variant surface glycoprotein fromTrypanosoma brucei,J. Mol. Biol. 216, 1412160.