Overall-Mouth Disinfection by Photodynamic Therapy Using ...
Upload
khangminh22Category
view
0download
0
Kochi Bengaluru Industrial Corridor –Draft Perspective Plan for overall KBIC region Draft Report

To Kerala State Industrial Development Corporation 2nd Floor, CHOICE Towers, Manorama Jn. Kochi – 682016
08 November 2019
Dear Sir,
Subject: Draft Report on Perspective Plan for overall KBIC region
This has reference to the Agreement between M/s PricewaterhouseCoopers Private Limited (PwC) and M/s L&T Infrastructure Engineering Ltd (L&T) and KSIDC dated March 05, 2018 for the engagement “Preparation of Perspective Plan and Concept Master Plan for IMC sites for Kochi Bengaluru Industrial Corridor Region”
We are pleased to submit to you the deliverable, “Draft Report on Perspective Plan for overall KBIC region & Concept Master Plan for Integrated Manufacturing Cluster (IMC)” as per the Terms of Reference (ToR) for the Engagement. Kindly contact us should you require any clarification or should your team have further suggestions.
Yours sincerely,
Manish Agarwal Partner, Leader - Infrastructure PricewaterhouseCoopers Pvt. Ltd 252, Veer Savarkar Marg, Shivaji Park, Dadar Mumbai 400028

Kochi Bengaluru Industrial Corridor –Draft Perspective Plan for overall KBIC region - Draft
Disclaimer
This Report has been prepared by PwC and L&T (“Consortium”) for Kerala State Industrial Development Corporation (KSIDC) for consultancy services namely “Preparation of Perspective Plan and Concept Master Plan for IMC sites for Kochi Bengaluru Industrial Corridor Region” (“the Project”) as outlined in the agreement dated March 05, 2018.
Any third party should obtain prior consent of the Consortium before copying or reproducing, in whole or in part, the contents of this report. The Consortium disclaims any responsibility for any loss or damage suffered by any third party by taking reliance of this report. Furthermore, the Consortium will not be bound to discuss, explain or reply to queries raised by any agency other than the intended recipients of this report.
The assessment and review are based on the facts and details provided to the Consortium during our
discussions specific to the Project and may not be similar across the organization / state. If any of these
facts or details provided to us are not complete or accurate, the conclusions drawn from subsequent
complete or accurate facts or details not available with us could cause us to change our opinion. The
conclusions drawn and recommendations made are based on the information available with the
Consortium at the time of writing this report. The Consortium does not make any representation or
warranty, express or implied, with respect to the information contained in this document. The information contained in this document is selective.

Kochi Bengaluru Industrial Corridor –Draft Perspective Plan for overall KBIC region - Draft
Table of Contents
1. Introduction ........................................................................................................... 1
1.1. Kochi Bengaluru Industrial Corridor (KBIC) – Background ........................................................... 1
1.2. Macroeconomic overview .................................................................................................................... 2
1.2.1. Kerala ........................................................................................................................................... 2
1.2.2. Tamil Nadu ................................................................................................................................. 3
1.3. Potential impact of the KBIC .............................................................................................................. 4
1.3.1. The proposed corridor will integrate several planned central and state projects there by
positively impacting the overall development of the region ............................................................ 5
1.3.2. KBIC will enable integration of value chains through cross border synergies .................... 5
1.3.3. Industries in the region will have improved access to alternate gateways ........................... 6
1.3.4. The priority manufacturing sectors in the corridor are expected to grow by over ~29,000
crore to ~50,000 crore over the next 30 years.................................................................................. 7
1.4. Study objectives and methodology ..................................................................................................... 9
1.4.1. Study objectives .......................................................................................................................... 9
1.4.2. Overview of our methodology ................................................................................................... 9
2. Corridor delineation and IMC identification .......................................................... 10
2.1. NH 544 forms the spine of the corridor, synergizing with other corridor development projects
in Southern India ...................................................................................................................................... 10
2.2. The corridor covers 9 districts in Kerala and 9 districts in Tamil Nadu .......................................11
2.3. 9 IMCs, 4 in Kerala and 5 in Tamil Nadu have been identified .................................................... 14
3. Industrial Development ........................................................................................ 20
3.1. Potential of the corridor ................................................................................................................... 20
3.2. Industrial development strategy for the Corridor ..........................................................................24
3.3. Identification and prioritization of industries in the Corridor...................................................... 25
3.4. Mapping industries to the IMCs.......................................................................................................33
3.5. Potential of services sector development in the Corridor .............................................................. 35
3.6. Industrial development strategy of Palakkad IMC........................................................................ 38
3.6.1. Unique Selling Proposition of Palakkad IMC....................................................................... 38
3.6.2. Focus sectors for Palakkad IMC .............................................................................................39
3.7. Industrial development strategy of Dharmapuri-Salem IMC .......................................................39
3.8. Stakeholder consultations ............................................................................................................... 40
3.9. Origin Destination Analysis .............................................................................................................. 41
3.10. Value chain assessment - Electronics Industry ............................................................................43
3.10.1. Rapidly growing market in India provides good opportunity for electronics
manufacturing in KBIC......................................................................................................................43
3.10.2. Electronics Industry in India ................................................................................................43
3.10.3. Electronics Industry value chain structure .........................................................................44
3.10.4. Key challenges in the electronics industry value chain in KBIC .......................................45

Kochi Bengaluru Industrial Corridor –Draft Perspective Plan for overall KBIC region - Draft
3.10.5. Growing industrial consumer base and large scale modernization in India’s defense
forces will drive the demand for electronics manufacturing in KBIC...........................................46
3.10.6. Origin-Destination analysis for Electronics sector in KBIC ..............................................46
3.10.7. Electronics industry in KBIC has good potential in components and strategic
equipment manufacturing................................................................................................................. 47
3.10.8. Industrial and Commercial Policy of Kerala 2015 needs to be implemented with focus
on synergistic sub sectors ..................................................................................................................49
4. Transport infrastructure assessment ..................................................................... 51
4.1. Port Infrastructure ............................................................................................................................. 52
4.1.1. Identified focus sectors in KBIC are highly dependent on the ports................................... 52
4.1.2. Ports play a very important role in the growth of manufacturing in any economy. They
provide the required gateway for the transfer of large volume of goods economically. They act
as an important part of both the forward and backward linkages of any company’s value chain
depending upon the nature of their business. Following figure will illustrate the role of the
ports in a value chain: ........................................................................................................................ 52
4.1.3. The corridor has 11 operational ports, with Cochin port being the busiest port handling
99% of the traffic in the region ......................................................................................................... 55
4.1.4. Majority of the traffic (~76%) at the Cochin Port is from Kerala which is the immediate
hinterland followed by nearby districts of Tamil Nadu (~18%) ....................................................58
4.1.5. In order to attract importers and exporters few soft and hard infrastructure changes are
required at the Cochin Port ...............................................................................................................59
4.1.6. These changes will help Cochin port to attract over INR 250 Bn worth of west moving
time sensitive cargo from the secondary hinterland of the port ...................................................63
4.1.7. Also, upcoming transhipment container terminal at Vizhinjam Port will integrate the
industries in the corridor and boost the overall logistics in the region in long term ..................66
4.2. Airports .............................................................................................................................................. 68
4.2.1. The Airport infrastructure in the KBIC region is well developed ...................................... 68
4.2.2. All the nodes in the KBIC corridor have an Airport in close proximity .............................69
4.2.3. Analysis of Airport Infrastructure in the KBIC corridor .....................................................69
4.2.4. Air Traffic Demand Forecast for KBIC Influence Region.................................................... 71
4.2.5. Infrastructure Analysis of CIAL as Anchor Airport.............................................................. 76
4.2.6. Proposed airport development works ................................................................................... 81
4.3. Road Infrastructure .......................................................................................................................... 83
4.3.1. Sector Overview....................................................................................................................... 83
4.3.2. Traffic Demand Forecast ...................................................................................................... 103
4.3.3. Demand/Supply Analysis .....................................................................................................108
4.3.4. Proposals for Road Development ........................................................................................ 112
4.3.5. Lane Requirement ................................................................................................................. 113
4.3.6. Road Infrastructure Development Proposals ..................................................................... 116
4.4. Railways Infrastructure....................................................................................................................117
4.4.1. Existing Rail Infrastructure in SR Division ..........................................................................117

Kochi Bengaluru Industrial Corridor –Draft Perspective Plan for overall KBIC region - Draft
4.4.2. Estimation of Traffic Growth Rates ..................................................................................... 129
4.4.3. Demand/Supply Assessment ............................................................................................... 131
4.4.4. Measures for improving Utilization..................................................................................... 134
4.4.5. Proposals for Rail Infrastructure Development in KBIC Region...................................... 135
4.5. Inland Waterways ............................................................................................................................140
4.5.1. Kerala has 5 and Tamil Nadu has 10 notified National Waterways, among them NW 3 in
the West Coast Canal is the only operational waterway in the region ........................................140
4.5.2. 205 km long National Waterway-3 consists of 3 canals and starts from Kottapuram and
ends at Kollam with 4 sea openings ............................................................................................... 141
4.5.3. However, various issues need to be resolved for full utilisation of inland waterway
potential of the state ........................................................................................................................ 143
4.6. Logistics Assessment ....................................................................................................................... 145
4.6.1. Transportation infrastructure, warehousing & cold storage services needs to be
improved in order to make KBIC competitive on logistics .......................................................... 145
4.6.2. Pricing, capacity expansion at over-utilized centres with operationalisation of MMLP
will help improve overall logistics in the corridor .........................................................................151
5. Energy infrastructure assessment.........................................................................153
5.1. Supply availability may not be a significant constraint in the near term to meet the demand in
the node.................................................................................................................................................... 154
5.1.1. Power generation capacity addition in the pipeline – 8% per annum average projected
capacity additions in the next 5 years ............................................................................................ 154
5.2. Continued need for improving grid stability so as to improve reliability of power in the node
................................................................................................................................................................... 155
5.2.1. Grid outage in the region of the node is higher than rest of the influence area............... 155
5.2.2. Reliability improvement in the Palakkad region of the Palakkad – Thrissur Node ....... 156
5.2.3. Reliability improvement in the Thrissur region of the Palakkad – Thrissur IMC ..........160
6. Urban infrastructure assessment......................................................................... 165
6.1. Major urban centers – Kerala ......................................................................................................... 165
6.1.1. Palakkad – Thrissur IMC....................................................................................................... 166
6.1.2. Kannur IMC ............................................................................................................................ 173
6.1.3. Other Urban Centres of Kerala ............................................................................................. 175
6.2. Major urban centers – Tamil Nadu ............................................................................................... 179
6.2.1. Coimbatore ............................................................................................................................. 179
6.2.2. Salem ...................................................................................................................................... 181
6.2.3. Hosur ...................................................................................................................................... 185
6.2.4. Erode.......................................................................................................................................188
6.3. Water Demand for KBIC districts .................................................................................................. 192
6.4. Wastewater Generation in KBIC districts ..................................................................................... 193
6.5. Solid Waste Generation in KBIC districts ..................................................................................... 196
7. Environmental assessment .................................................................................. 198
7.1. Climate............................................................................................................................................... 198

Kochi Bengaluru Industrial Corridor –Draft Perspective Plan for overall KBIC region - Draft
7.1.1. Kerala ....................................................................................................................................... 198
7.1.2. Tamil Nadu ............................................................................................................................. 198
7.2. Land Environment ........................................................................................................................... 198
7.2.1. Land Use-Land Cover ............................................................................................................ 198
7.2.2. Natural Resources.................................................................................................................. 199
7.2.3. Topography ........................................................................................................................... 202
7.2.4. Geology and Mineral Resources .......................................................................................... 202
7.2.5. Soil profile.............................................................................................................................. 203
7.3. Water Environment ........................................................................................................................ 205
7.3.1. Ground water ......................................................................................................................... 205
7.3.2. Surface Water ......................................................................................................................... 215
7.4. Ecology .............................................................................................................................................. 221
7.4.1. Flora and Fauna – Kerala ...................................................................................................... 221
7.4.2. Flora and Fauna – Tamil Nadu ............................................................................................ 221
7.5. Air Environment .............................................................................................................................. 221
7.5.1. Meteorology ............................................................................................................................ 221
7.5.2. Ambient Air Quality...............................................................................................................227
7.6. Noise Environment ......................................................................................................................... 230
7.7. Natural Disaster Prone Areas ........................................................................................................ 230
7.8. KBIC’s Environmental Sensitivity................................................................................................. 230
7.8.1. Protected Areas notified under the Wild Life (Protection) Act, 1972 in KBIC................ 230
7.8.2. Critically Polluted Areas as notified by the Central Pollution Control in KBIC ............. 232
7.8.3. Eco-Sensitive Areas as notified under the Environment (Protection) Act, 1986 ........... 233
7.8.4. Sites of Conservation Importance in KBIC influence Districts ........................................ 234
7.8.5. Inter-State boundaries ......................................................................................................... 239
7.8.6. Others .................................................................................................................................... 240
7.9. Environmental Setting of IMC Sites ............................................................................................. 243
7.9.1. Protected Areas ..................................................................................................................... 243
7.9.2. Proposed Eco-Sensitive Areas ..............................................................................................252
7.9.3. Palakkad District - Other Features ......................................................................................255
7.9.4. Aspects may be considered while locating IMCs in other KBIC Influenced Districts ... 263
7.9.5. Way Forward ......................................................................................................................... 263
8. Skill development ............................................................................................... 266
8.1. Skill infrastructure .......................................................................................................................... 266
8.1.1. Kerala...................................................................................................................................... 266
8.1.2. Tamil Nadu ............................................................................................................................ 270
8.2. Skill Gap Assessment ...................................................................................................................... 271
8.2.1. Kerala ...................................................................................................................................... 271
8.2.2. Tamil Nadu ............................................................................................................................272
8.3. Way Forward ....................................................................................................................................272
Appendix A. - Site Visit and Data Collection ............................................................. 273

Kochi Bengaluru Industrial Corridor –Draft Perspective Plan for overall KBIC region - Draft
Appendix B. - Approach to base map and node map preparation ............................... 280
Appendix C. - As-is scenario – Ports ........................................................................ 281
C.6. Ponnani Port ................................................................................................................................... 298
C.7. Beypore Port..................................................................................................................................... 301
C.8. Inland Waterways .......................................................................................................................... 302
C.9. Capacity of Ports ............................................................................................................................. 303
C.10. Proposal for development of ports.............................................................................................. 305
Appendix D. - Road inventory.................................................................................. 306
D.1. Road details – KBIC ....................................................................................................................... 306
Appendix E. - Environmental assessment ................................................................ 421
E.1. Surface water quality information ................................................................................................. 421
E.2. Work flow for the Forest Clearance .............................................................................................. 434
Appendix F. - Power infrastructure ......................................................................... 436
F.1. Details of works in the Palakkad Region ...................................................................................... 436
F.2. Details of works in the Thrissur Region ........................................................................................437

Kochi Bengaluru Industrial Corridor –Draft Perspective Plan for overall KBIC region - Draft
Table of Figures
Figure 1: GDSP Growth Rate of Kerala compared to other Southern States ...............................................2 Figure 2: Break-up of the Kerala GSVA including contribution of manufacturing sector..........................2 Figure 3: Comparison of GDP composition of select state.............................................................................3 Figure 4: Overview of corridor development plans in Southern India .........................................................4 Figure 5: Central and state development plan ................................................................................................ 5 Figure 6: Potential cargo movement through major gateways in KBIC .......................................................6 Figure 7: Estimated GVA growth (priority manufacturing sectors) in KBIC ............................................... 7 Figure 8: Estimated GVA growth (all manufacturing) in KBIC .................................................................... 7 Figure 9: Estimated employment generation (priority manufacturing sectors) in KBIC .......................... 8 Figure 10: The spine of the corridor integrating KBIC to other planned developments in Southern India .................................................................................................................................................................. 10 Figure 11: KBIC Base map ............................................................................................................................... 13 Figure 12 Framework for Identification and Prioritization of IMCs ........................................................... 14 Figure 13: Selected IMCs in KBIC .................................................................................................................. 15 Figure 14: Location of IMC Sites in Palakkad node ...................................................................................... 18 Figure 15: GVA/GSVA composition in FY17 (INR trillion) ......................................................................... 20 Figure 16: Contribution of Kerala and TN in manufacturing GVA ............................................................ 20 Figure 17: District-wise GSVA (FY 17) for Kerala and 5-year CAGR.......................................................... 20 Figure 18: District-wise GVA in Tamil Nadu, in FY13 ................................................................................. 20 Figure 19: Corridor district wise share in manufacturing of the state (in %)............................................. 21 Figure 20: Location of Existing Industrial Parks/Estates .......................................................................... 22 Figure 21: SEZ’s in KBIC influence region .................................................................................................... 23 Figure 22: Framework for development of industrial strategy .................................................................. 24 Figure 23: Kerala’s contribution to India’s GVA vs major industrial states...............................................25 Figure 24: District wise major industrial sectors ..........................................................................................25 Figure 25: Sector wise industrial output in Kerala ...................................................................................... 26 Figure 26: Comparison of state domestic product composition of select states....................................... 26 Figure 27: Framework for identification of priority sectors ....................................................................... 28 Figure 28: Prioritization of “what is” industries for the corridor ............................................................... 29 Figure 29: Factors of production for the priority industries ...................................................................... 33 Figure 30: GDP composition of the Corridor states .....................................................................................35 Figure 31: Employment in services ................................................................................................................35 Figure 32: State-wise software exports ......................................................................................................... 36 Figure 33: Performance wrt other major IT states ...................................................................................... 36 Figure 34: Manufacturing and Innovation in South Korea .........................................................................37 Figure 35 Product segments in the Electronics Industry in India ............................................................. 43 Figure 36 Share of Product Segments in Manufacturing in India ............................................................. 44 Figure 37 Electronics Industry Value chain ................................................................................................. 44 Figure 38: Case Study: IC Manufacturing cluster Taiwan .......................................................................... 48 Figure 39: Infrastructure Assets in KBIC ...................................................................................................... 51 Figure 40: Role of Ports in a Value Chain......................................................................................................52 Figure 41: Import and Export from the Cochin Port ....................................................................................52 Figure 42: Trade for the Cochin Port .............................................................................................................53 Figure 43: Ports in KBIC .................................................................................................................................55 Figure 44: Cargo Traffic at the Cochin Port .................................................................................................. 57 Figure 45: Container Traffic at the Cochin Port (‘ooo TEUs) ...................................................................... 57 Figure 46: Average Turn Round Time and Average Pre-Berthing Time at the Major Ports in India . 57 Figure 47: Hinterland of Kerala Ports ......................................................................................................... 58 Figure 48: State Wise Share of Cargo Handled at the Cochin Port............................................................ 59 Figure 57: Cargo Traffic at Mundra Port (in million tonnes) ..................................................................... 60 Figure 50: Difference between Loaded and Empty Container Handling Charges ................................. 61 Figure 51: Role of Port Agents ....................................................................................................................... 61 Figure 52: Share of Frozen and Fresh Food ................................................................................................. 62 Figure 53: Value of Export Cargo from Kerala Ports ................................................................................... 63 Figure 54: Cargo Movement from Kerala Ports ........................................................................................... 63 Figure 55: Centers of the Time Sensitive Cargo ........................................................................................... 64

Kochi Bengaluru Industrial Corridor –Draft Perspective Plan for overall KBIC region - Draft
Figure 56: Airport Infrastructure in KBIC.................................................................................................... 68 Figure 57: Corridor Airports proximity to nodes ......................................................................................... 69 Figure 58 Dwell time Comparison with Select Airports ............................................................................... 77 Figure 59 Cargo Tariff at Indian Airports ...................................................................................................... 77 Figure 60 Export Commodities at CIAL ........................................................................................................79 Figure 61 Case Study- Leipzig Halle Airport ................................................................................................ 80 Figure 62 KBIC road network ....................................................................................................................... 83 Figure 63 Section of NH 544 .......................................................................................................................... 86 Figure 64 Section of ECR near Thalachangadu ........................................................................................... 87 Figure 65 Lane Configuration Map of all road networks in KBIC region ...................................................97 Figure 66 Volume-Capacity roads for the core road network in KBIC region .......................................... 98 Figure 67: Seaport Airport Road augmentation in Cochin...................................................................... 116 Figure 68: Railway Network in KBIC Region ........................................................................................... 118 Figure 69: Capacity Utilization of Rail Network in current year in KBIC Region ................................... 125 Figure 70: Revenue Breakup of Different Zones of Indian Railways........................................................128 Figure 71: Contribution of Goods Earning in Total Earning......................................................................128 Figure 72: Rail vs road split of cargo (FY17)................................................................................................ 129 Figure 73: Railway Projects identified by KRDCL ..................................................................................... 137 Figure 74: National Waterways in Kerala and Tamil Nadu ....................................................................... 141 Figure 75: National Waterway 3 ................................................................................................................... 142 Figure 76: Composition of Cargo Moved on National Waterway 3 ....................................................... 143 Figure 77: Illustrative Working of an MMLP .............................................................................................. 152 Figure 78: Electricity Consumption in Million Units (MU), across districts ........................................... 153 Figure 79: Installed capacity of Kerala (MW) ............................................................................................. 154 Figure 80: Supply mix of Kerala (Million Units) ........................................................................................ 154 Figure 81: Demand supply balance .............................................................................................................. 155 Figure 82: BIS and BAU demand projections ............................................................................................. 155 Figure 83: Average duration of power cut (Hrs/month) ........................................................................... 156 Figure 84: Average number of power cut (Nos/month) ............................................................................ 156 Figure 85: Demand in MVA across categories ............................................................................................ 157 Figure 86: Demand in MVA across categories ............................................................................................ 158 Figure 87: Demand in MVA across categories ............................................................................................ 158 Figure 88: Demand in MVA across categories ............................................................................................ 161 Figure 89: Demand in MVA across categories ............................................................................................ 161 Figure 90: Urban Centres in KBIC Region .................................................................................................. 165 Figure 91: Major town population for Kerala .............................................................................................. 166 Figure 92: Major town population for Tamil Nadu .................................................................................... 166 Figure 93: Water Supply Scheme for Palakkad (KWA) ..............................................................................168 Figure 94: Water Supply Zones in Thrissur (ULB & KWA) ....................................................................... 170 Figure 95: Solid Waste Management in Palakkad ...................................................................................... 171 Figure 96: Solid Waste Management in Thrissur ....................................................................................... 172 Figure 97: Water Supply Scheme for Kannur (KWA)................................................................................. 174 Figure 98: Solid Waste Management in Kannur ........................................................................................ 174 Figure 99: Water treatment in Kochi ........................................................................................................... 176 Figure 100: Water treatment in Kozhikode ................................................................................................. 177 Figure 101: Sewerage treatment in Kochi .................................................................................................... 177 Figure 102: Solid waste treatment in Kochi ................................................................................................ 178 Figure 103: Solid waste treatment in Kozhikode ........................................................................................ 178 Figure 104: Water Supply in Coimbatore .................................................................................................... 179 Figure 102: STP in Coimbatore.................................................................................................................... 180 Figure 106: SWM in Coimbatore ................................................................................................................. 180 Figure 102: SWM Complex in Coimbatore .................................................................................................. 181 Figure 108: Water Supply system in Salem .................................................................................................182 Figure 109: Water Collection & Treatment in Salem..................................................................................182 Figure 110: Sewerage Treatment Plant in Salem ........................................................................................183 Figure 111: SWM in Salem .............................................................................................................................184 Figure 112: Solid Waste Management in Salem ..........................................................................................184 Figure 113: Water Supply system in Hosur ................................................................................................. 185 Figure 114: Water Distribution in Hosur ..................................................................................................... 185 Figure 115: SWM in Hosur ............................................................................................................................186 Figure 116: Waste Processing in Hosur........................................................................................................ 187

Kochi Bengaluru Industrial Corridor –Draft Perspective Plan for overall KBIC region - Draft
Figure 117: Water Supply in Erode .............................................................................................................. 188 Figure 118: Water Collection Erode............................................................................................................. 188 Figure 119: Water Treatment in Erode ........................................................................................................189 Figure 120: Sewerage Treatment Plant in Erode ....................................................................................... 190 Figure 121: SWM in Erode............................................................................................................................ 190 Figure 122: Solid Waste Processing in Erode .............................................................................................. 191 Figure 123: Urban water demand for KBIC Kerala districts ...................................................................... 192 Figure 124: Rural water demand for KBIC Kerala districts ....................................................................... 192 Figure 125: Urban water demand for KBIC Tamil Nadu districts............................................................. 192 Figure 126: Rural water demand for KBIC Tamil Nadu districts .............................................................. 193 Figure 127: Urban sewage generation for KBIC Kerala districts ............................................................... 194 Figure 128: Rural sewage generation for KBIC Kerala districts ................................................................ 194 Figure 129: Urban sewage generation for KBIC Tamil Nadu districts ..................................................... 194 Figure 130: Rural sewage generation for KBIC Tamil Nadu districts ....................................................... 195 Figure 131: Urban solid waste generation for KBIC Kerala districts ........................................................ 196 Figure 132: Rural solid waste generation for KBIC Kerala districts ......................................................... 196 Figure 133: Urban solid waste generation for KBIC Tamil Nadu districts ............................................... 196 Figure 134: Rural solid waste generation for KBIC Tamil Nadu districts ................................................ 197 Figure 135: Land Use Land Cover (LULC) map (1:250000 scale) for KBIC ............................................ 199 Figure 136: Fish landing centres in Kerala ................................................................................................. 200 Figure 137: Forest map for KBIC ................................................................................................................. 202 Figure 138: Soil map for KBIC ..................................................................................................................... 204 Figure 139: Ground water contamination in Tamil Nadu.......................................................................... 214 Figure 140: Nitrate contamination in Tamil Nadu ..................................................................................... 214 Figure 141: Faecal coliform contamination in Tamil Nadu........................................................................ 215 Figure 142: Rivers in KBIC ............................................................................................................................ 215 Figure 143: Protected areas in KBIC districts ............................................................................................ 232 Figure 144: Critically Polluted Areas (CPA) in KBIC districts .................................................................. 233 Figure 145: Eco-sensitive areas proposed in Kerala and Tamil Nadu ..................................................... 234 Figure 146: Periyar Tiger reserve ................................................................................................................ 235 Figure 147: Parambikulam Tiger reserve .................................................................................................... 235 Figure 148: Anamalai Tiger reserve ............................................................................................................ 236 Figure 149: Mudumalai Tiger reserve ......................................................................................................... 236 Figure 150: Vembanad Wetland Map ......................................................................................................... 238 Figure 151: KBIC Districts and Interstate Boundary ................................................................................. 239 Figure 152: ASI Monuments in KBIC ........................................................................................................... 241 Figure 153: Protected areas and IMC sites in Palakkad District .............................................................. 244 Figure 154: Protected areas and IMC Land Parcels in Thrissur District ................................................. 245 Figure 155: Protected areas and IMC Land Parcels in Kannur Node ...................................................... 246 Figure 156: Protected areas and IMC site in Dharmapuri District .......................................................... 247 Figure 157: Protected areas and Dynamatic IMC site in Coimbatore ...................................................... 249 Figure 158: Protected areas and TANCEM - 1 IMC site in Coimbatore ................................................... 250 Figure 159: Protected areas and TANCEM - 2 IMC site in Coimbatore .................................................. 250 Figure 160: Protected areas and Varapalayam site in Erode ................................................................. 251 Figure 161: Proposed Ecological Sensitive Area (ESA) in Palakkad District ........................................... 252 Figure 162: Proposed Ecological Sensitive Area (ESA) in Thrissur District ........................................... 253 Figure 163: Proposed Ecological Sensitive Area (ESA) in Kannur Node ................................................ 253 Figure 164: Proposed Ecological Sensitive Area (ESA) in Tamil Nadu ................................................. 254 Figure 165: LULC map for Puthussery land Parcel.................................................................................... 255 Figure 166: LULC map for Ozhalapathy land parcel ................................................................................. 255 Figure 167: LULC map for Kannambra land parcel ................................................................................... 256 Figure 168: Forest area in Palakkad ............................................................................................................ 256 Figure 169: Puthussery land parcel on SoI Toposheet ...............................................................................257 Figure 170: Ozhalapathy land parcel on SoI Toposheet .............................................................................257 Figure 171: Kannambra land parcel on SoI Toposheet .............................................................................. 258 Figure 172: Waterbodies in Puthussery site ............................................................................................... 259 Figure 173: Waterbodies in Ozhalapathy site ............................................................................................. 259 Figure 174: Waterbodies in Kannambra site .............................................................................................. 260 Figure 175: ASI monuments in Palakkad.................................................................................................... 260 Figure 176: Flood prone areas in Palakkad.................................................................................................. 261 Figure 177: Drought prone areas in Palakkad ............................................................................................. 261

Kochi Bengaluru Industrial Corridor –Draft Perspective Plan for overall KBIC region - Draft
Figure 178: Kerala – Vocational Training Annual Intake Capacity (per lakh population) .................... 267 Figure 179: Approach to base map and node map preparation ............................................................ 280 Figure 180 Location of Cochin Port ............................................................................................................ 282 Figure 181 Traffic handled at Cochin Port during 2015-16 and 2014-15 ................................................. 283 Figure 182 Location of Berths at Willingdon Island.................................................................................. 284 Figure 183 Google Earth imagery of ICTT Vallarpadam ........................................................................... 284 Figure 184 Google Earth Imagery of Kochi LNG Terminal ...................................................................... 285 Figure 185 Phase 1 Layout of Vizhinjam Port............................................................................................. 290 Figure 186 Phase 2 Layout of Vizhinjam Port ............................................................................................. 291 Figure 187 Master Plan Layout of Vizhinjam Port ...................................................................................... 291 Figure 188 Google earth image of VSIL on (July 2016) ............................................................................ 293 Figure 189 Google earth image showing reclaimation works at VSIL (February 2016) ........................ 293 Figure 190 Google Earth image of Thankassery Port ................................................................................ 296 Figure 191 Google earth Image of existing Port facilities at Thankassery port ....................................... 297 Figure 192 Phase 1 Layout of Ponnani port ................................................................................................ 299 Figure 193 Master plan of Ponnani port ..................................................................................................... 299 Figure 194 Google Earth image of Beypore Port ........................................................................................ 302 Figure 195 Inland waterways in Kerala....................................................................................................... 303 Figure 196 Cargo-wise available capacity at Cochin port .......................................................................... 304 Figure 197 Projected capacity of Ports ........................................................................................................ 305 Figure 198: Process for Forest Clearance (stage-1: Form A & B) ............................................................. 434 Figure 199: Process for Forest Clearance (stage-1: Form C) ..................................................................... 435

Kochi Bengaluru Industrial Corridor –Draft Perspective Plan for overall KBIC region - Draft
List of Tables
Table 1: Corridor delineation option summary ............................................................................................. 11 Table 2: Corridor delineation option summary ............................................................................................ 12 Table 3: IMCs identified in Kerala and Tamil Nadu ..................................................................................... 14 Table 4: Overall Ranking of IMCs .................................................................................................................. 17 Table 5: Palakkad – Thrissur IMC sites and connectivity............................................................................ 18 Table 6: Connectivity of IMC sites – Dharmapuri-Salem Node .................................................................. 19 Table 7: State-wise manufacturing sector schemes ...................................................................................... 21 Table 8: Potential sub-sectors for the corridor ............................................................................................ 29 Table 9 SWOT assessment of Palakkad IMC ............................................................................................... 38 Table 10: Key issues identified through stakeholder consultations ......................................................... 40 Table 11: Raw Material and Output of the Shortlisted Industries in KBIC ................................................ 41 Table 12: Import Export Destination of Shortlisted Industries................................................................... 41 Table 19: Major players in Electronics manufacturing in KBIC ................................................................ 46 Table 14: Origin Destination Matrix for KBIC Electronics Sector ............................................................ 46 Table 15: Products categories in the Components Manufacturing industry ..............................................47 Table 16: Export-Import Dependency of the Focus Sectors ........................................................................53 Table 17: Origin-Destination Mapping of the Focus Sectors ...................................................................... 54 Table 18: Cargo Handling at the Non Major Ports in Kerala .......................................................................55 Table 19: Detail of Berths and Occupancy Level at the Cochin Port .......................................................... 56 Table 20: Distance of Various Districts of Tamil Nadu from the Cochin Port .......................................... 58 Table 21: Time Sensitive Cargo from Secondary Hinterland of Kerala Ports ........................................... 64 Table 22: Cost-Time Analysis of West Moving Cargo from Western Tamil Nadu ................................... 65 Table 23: Cost-Time Analysis of West Moving Cargo from Southern Karnataka .................................... 65 Table 24: Project Overview of Vizhinjam Port ............................................................................................. 66 Table 25: Domestic Connectivity ................................................................................................................... 69 Table 26: Infrastructure at Corridor Airports .............................................................................................. 69 Table 27: Passenger Traffic Trends in Airports in KBIC Influence Region ................................................ 71 Table 28: Cargo Traffic Trends (in MT) in Airports in KBIC Influence Region ........................................72 Table 29: Elasticity Values used for forecasting Air Traffic .........................................................................73 Table 30: Finalized Growth Rates for Passenger Traffic..............................................................................74 Table 31: Finalized Growth Rates for Cargo Traffic......................................................................................74 Table 32: Forecast of Air Passenger (in Millions) for KBIC Region............................................................74 Table 33: Allocation of Air Traffic (International) to Existing Airports (Million Passengers per annum)............................................................................................................................................................................ 75 Table 34: Allocation of Air Traffic (Domestic) to Existing Airports (Million Passengers per annum) ... 75 Table 35: Forecast of International Air Cargo Traffic (in ‘000 MT per annum) for KBIC Airports ........ 75 Table 36: Forecast of Domestic Air Cargo Traffic (in ‘000 MT per annum) for KBIC Airports .............. 75 Table 43 Cargo Diversion to other Airports .................................................................................................. 77 Table 44 Origin and Destination of Cargo Diverted from the Corridor...................................................... 77 Table 45 Hub Connectivity from CIAL.......................................................................................................... 78 Table 40 Ongoing and proposed developments for KBIC airports ............................................................. 81 Table 41 Details of Road network in Kerala ................................................................................................ 84 Table 42 District-wise road information ..................................................................................................... 84 Table 43 Major Road Network in KBIC Region ........................................................................................... 85 Table 44 Capacity of Rural Roads ................................................................................................................. 87 Table 45 Capacity of Rural Expressways ...................................................................................................... 88 Table 46 Existing Road Network Characteristics for all the major roads in KBIC (2018) ...................... 89 Table 47 Existing Road Network Characteristics for the Core road networks in KBIC (2018) ............... 95 Table 48 Truck Trip Generation Rates from Industrial Nodes .................................................................. 99 Table 49 Proposed Land Demand for the KBIC region ............................................................................. 99 Table 50 Total Generated Traffic from KBIC Region (2018).................................................................... 100 Table 51 Committed Proposals .................................................................................................................... 100 Table 52 Time Series Data for Registered Motor Vehicles: Kerala .......................................................... 104 Table 53 Time Series Data for Registered Motor Vehicles: Tamil Nadu ................................................. 104 Table 54 Values of Elasticity values for the period 2001-2021 ..................................................................105 Table 55 Growth Rate based on Elasticity Method .................................................................................... 106

Kochi Bengaluru Industrial Corridor –Draft Perspective Plan for overall KBIC region - Draft
Table 56 Summary of Generated Traffic (in PCUs) from/to Industrial Nodes....................................... 106 Table 57 Summary of Generated Traffic (in PCUs) from Gateway Port .................................................. 106 Table 58 Existing Road Length Distribution by LOS in KBIC region ...................................................... 108 Table 59 Distribution of Various Road Sections by LOS........................................................................... 108 Table 60 Future Road Network Characteristics in KBIC Region ............................................................. 109 Table 61 Proposals for Spine Road Network ............................................................................................... 112 Table 62 Lane Requirement for KBIC Road Network ................................................................................ 113 Table 63 Distribution of Various Road Sections by LOS ........................................................................... 115 Table 64 Details of Rail Network in 6 Divisions of Southern Railways .................................................... 117 Table 65 Division-wise Existing Line Capacity Utilization in SR Network .............................................. 119 Table 66 Division-wise Existing Line Capacity Utilization in SWR Network .......................................... 123 Table 67 Capacity Utilization of KBIC Network .......................................................................................... 124 Table 68 Distribution by number of Running Lines of KBIC Network .................................................... 124 Table 69 Current Major Cargo Movement by Rail in KBIC Region .......................................................... 126 Table 70: Cost Comparison of Rail and Road in Kerala and Tamil Nadu ................................................ 129 Table 71 Estimation of Rail Traffic Growth Rate ........................................................................................130 Table 72 Summary of Generated Traffic (in rakes per day) due to Industrial Nodes .............................130 Table 73 Summary of Generated Traffic (in terms of rakes per day) from Gateway Ports ..................... 131 Table 74 Summary of Total Generated Traffic (in terms of rakes per day) .............................................. 131 Table 75 Distribution of Line Capacity Utilization in KBIC Region (in 2016-17) .................................... 131 Table 76 Distribution of Line Capacity Utilization in KBIC Region (Do Minimum Scenario)............... 132 Table 77 Distribution of Line Capacity Utilization in KBIC Region (Do Something Scenario) ............. 132 Table 78 Key technological differences between IR signaling systems & other major Railways ........... 133 Table 79 Capacity of Rail lines by Various Signaling Systems (Trains per day in both directions) ....... 134 Table 80 Sanctioned Rail Projects by Railways in KBIC Region............................................................... 135 Table 81 Description of Sanctioned Rail Projects - New Lines - as per Pink Book 2017-18 ................... 136 Table 82 Description of Sanctioned Rail Projects - Doubling - as per Pink Book 2017-18 .................... 136 Table 83 Summary of Proposals and Required year of Commissioning with Phasing and Cost ...........138 Table 84: Performance of Different Mode of Transportation .................................................................. 140 Table 85: Details of the Terminals at NW3 ................................................................................................. 142 Table 86 Accessibility of Industry clusters to nearest logistics infrastructure ........................................ 145 Table 87: Ranking based on LEADS report ................................................................................................. 146 Table 88: Areas of Improvement for KBIC Region..................................................................................... 146 Table 89 Utilization of Warehouses in KBIC............................................................................................... 147 Table 90 Warehousing Charges in KBIC States ..........................................................................................148 Table 91 Cold Storage Capacity in KBIC ......................................................................................................148 Table 92 Utilization of Cold storage in Kerala ............................................................................................148 Table 93 Current Cold Storage rates in KBIC states ...................................................................................148 Table 94 Utilization of ICDs in KBIC ........................................................................................................... 149 Table 95 Utilization of CFS in KBIC ............................................................................................................. 149 Table 96: CFS Charges in Kerala .................................................................................................................. 149 Table 97: Capacity enhancement required in KBIC.................................................................................... 151 Table 98: Sufficiency of transmission and distribution network – Palakkad region .............................. 158 Table 99: Total capex outlay in Palakkad region (Between FY 18 and FY 23) ........................................ 160 Table 100: Sufficiency of transmission and distribution network – Thrissur region ............................. 162 Table 101: Total capex outlay in Thrissur region (Between FY 18 and FY 23)......................................... 163 Table 102: Waste disposal systems in Thrissur........................................................................................... 172 Table 103: Projected water demand for KBIC districts (in MLD) ............................................................. 193 Table 104: Projected sewage generation for KBIC districts (in MLD) ...................................................... 195 Table 105: Projected solid waste generation for KBIC districts (in TPD) ................................................ 197 Table 106: Classification of Tamil Nadu Soils ............................................................................................ 204 Table 107: Ground water Quality for KBIC districts.................................................................................. 205 Table 108: Rivers in KBIC districts of Kerala .............................................................................................. 216 Table 109: Polluted river stretches in of Kerala ..........................................................................................218 Table 110: Rivers in KBIC districts of Tamil Nadu ..................................................................................... 219 Table 111: Polluted river stretches in Tamil Nadu ..................................................................................... 220 Table 112: Climatological Summary – Alappuzha Region (1971-2000) .................................................. 222 Table 113: Climatological Summary – Kannur Region (1978-2000) ....................................................... 222 Table 114: Climatological Summary – Kottayam Region (1973-2000) ................................................... 223 Table 115: Climatological Summary – Kozhikode Region (1971-2000) .................................................. 224 Table 116: Climatological Summary – Palakkad Region (1971-2000)..................................................... 224

Kochi Bengaluru Industrial Corridor –Draft Perspective Plan for overall KBIC region - Draft
Table 117: Climatological Summary – Coimbatore (Pilamedu) Region (1971-2000) ............................ 225 Table 118: Climatological Summary – Dharmapuri Region (1975-2000)............................................... 225 Table 119: Climatological Summary – Salem Region (1971-2000) .......................................................... 226 Table 120: Ambient air quality – Kerala KBIC districts ......................................................................... 227 Table 121: Ambient air quality – Tamil Nadu KBIC districts ................................................................. 228 Table 122: List of Protected areas in KBIC districts ................................................................................. 230 Table 123: Details of Critically Pollution Areas in KBIC ......................................................................... 233 Table 124: List of Landscape and Elephant Reserves in India with 2005 Census Population ........... 237 Table 125: Biosphere reserve in KBIC ......................................................................................................... 237 Table 126: List of ASI monuments in KBIC................................................................................................ 240 Table 127: Coastal districts in KBIC ............................................................................................................. 241 Table 128: List of Airports in KBIC districts .............................................................................................. 242 Table 129: Distance (Km) and Directions of Protected areas from Palakkad IMCs ............................... 243 Table 130: Distance (Km) and Directions of Protected areas from Thrissur IMC ................................. 244 Table 131: Distance (km) and Direction of protected areas from Kannur IMCs protected areas ......... 245 Table 132: Distance (km) and Direction of protected areas from Dharmapuri IMC site ...................... 247 Table 133: Distance (km) and Direction of protected areas from Tiruppur IMC site ............................ 248 Table 134: Distance (km) and Direction of protected areas from Coimbatore IMC sites ...................... 248 Table 135: Distance (km) and Direction of protected areas from Erode IMC site ................................. 250 Table 136: Summary – EIA notification and its application for IMC sites ............................................. 264 Table 137: Education Level in Kerala vis-à-vis India................................................................................. 266 Table 138: Number of Institutes and their sanctioned intakes ................................................................ 266 Table 139: Vocational Training in Kerala ................................................................................................... 267 Table 140: Higher Education in Kerala....................................................................................................... 268 Table 141: Details of engineering colleges in Kerala .................................................................................. 269 Table 142: Skill development infrastructure in Tamil Nadu .................................................................... 270 Table 143: Incremental Manpower Demand for Key Sectors across Kerala (‘00)................................... 271 Table 144: Estimated Incremental Skill Gap in Kerala from 2018 to 2022 (in lakh).............................. 271 Table 145: Sector wise skill gap in Tamil Nadu 2017-2021 (‘000) ........................................................... 272 Table 146: List of Places Visited .................................................................................................................. 273 Table 147: List of Offices Contacted ............................................................................................................ 274 Table 148: Port wise cargo handled 2013-2017...........................................................................................281 Table 149 Traffic handled at Cochin Port ................................................................................................... 282 Table 150 Berth details of Cochin Port ....................................................................................................... 283 Table 151 Equipment at Cochin Port ........................................................................................................... 285 Table 152 Storage facilities at Cochin Port ................................................................................................. 286 Table 153 Berth occupancy and Cargo handled by Cochin Port in 2015-16 ............................................ 287 Table 154 Port performance parameters for different cargoes at Cochin Port ....................................... 287 Table 155 Traffic forecast for Vizhinjam Port ............................................................................................ 288 Table 156 Traffic Forecast for Azhikal Port ................................................................................................ 294 Table 157 Storage area at Azhikkal Port...................................................................................................... 295 Table 158 Traffic forecast for Azhikkal Port ............................................................................................... 297 Table 159 Traffic forecast for Ponnani Port ................................................................................................ 300 Table 160 Navigational facilities in Ponnani Port...................................................................................... 300 Table 161 Berth details for Ponnani port .................................................................................................... 300 Table 162 Existing berth details and volume of cargo handled ................................................................ 304 Table 163 Projected capacity of ports ......................................................................................................... 304 Table 164 Cargo-wise future capacities of Ports ........................................................................................ 305 Table 165: Power infrastructure works in Palakkad region................................................................... 436 Table 166: Power infrastructure works in Thrissur region .................................................................... 437

Kochi Bengaluru Industrial Corridor –Draft Perspective Plan for overall KBIC region - Draft
1
1. Introduction
1.1. Kochi Bengaluru Industrial Corridor (KBIC) – Background
Economic corridor development (ECD) is an effective policy instrument integrating industry,
infrastructure, urban services, and trade under a business-friendly institutional and regulatory
framework. ECD is being pursued by India to increase the share of manufacturing output in the country’s
gross domestic product by linking the sector to global production networks to boost exports and create
jobs.
In the Kerala economy, the primary and secondary sectors have languished and the tertiary sector has
been leaping. The industrial corridor development approach with Integrated Manufacturing Clusters
(IMCs) will enable the state’s industrialization level to grow sustainably as envisaged in Kerala
Perspective Plan 2030. While improving performance of manufacturing sector has been the prime focus
of corridor development in India, the Kochi Bengaluru Industrial Corridor (KBIC) will also explore the
possibilities of improving the performance of services sector in the corridor region.
The objective of the corridor is aligned to the Kerala Perspective Plan 2030 of achieving higher manufacturing growth rates, generating employment and facilitating eco-friendly economic growth.
Based on the idea of sustainable industrialization, the
Kerala Perspective Plan 2030 aims to:▪ Achieve a CAGR of 7.5% in GSDP per capita for
the next 20 years.▪ Achieve manufacturing growth rates of 9%▪ Reduce unemployment rate to 2% by 2031
Vision
With the nominal presence of manufacturing sectors, Kerala, having a
huge base of skilled labour, can seize this opportunity to become aregional leader in high value manufacturing and services.
• Establishment of Industrial Clusters/ Integrated
Manufacturing Clusters (IMCs)• Create synergies with neighbouring states• Promote services to support manufacturing in the region• Enhance connectivity and improve logistic infrastructure to
support movement of goods in Southern India
• Improve urbanization in an integrated manner with industrialgrowth
Be
ne
fits
OutcomeIndustrial
Corridor

Kochi Bengaluru Industrial Corridor –Draft Perspective Plan for overall KBIC region - Draft
2
1.2. Macroeconomic overview
1.2.1. Kerala
GSDP of Kerala, driven by the tertiary sector, has been increasing at a faster pace, however it is still lower than competing states which are growing at double digit rate
In 2015-16, GSDP of Kerala at constant (2011-12) prices was INR 46,724,313 lakh registering a growth rate of 8.10% compared to 7.31% in 2014-15. However, compared to other southern states, the growth figures have been modest in the past few years. The figure below shows the trend in Kerala’s GSDP growth rate over the years in comparison to states like Tamil Nadu, Karnataka and Andhra Pradesh.
Figure 1: GDSP Growth Rate of Kerala compared to other Southern States
Source: State Economic Reviews, NITI Aayog
During 2015-16, the contribution from primary, secondary and tertiary sectors to the GSVA at constant (2011-12) prices was 11.58%, 26.17% and 62.24% respectively. A further break-up of the secondary sector shows the contribution of manufacturing to the GSVA has been steady around ~9.5%. It has been observing a growing trend in the contribution of tertiary sector to the GSVA and a falling trend in the contribution of primary sector. The figure below shows the break-up of the GSVA over the years for Kerala.
Figure 2: Break-up of the Kerala GSVA including contribution of manufacturing sector
Source: Kerala Economic Review 2016
With a lower GDP growth rate, Kerala’s per capita growth is almost double when compared to India average
13.84% 13.51%12.51%
10.99%
14.56%
18.24%
12.70%
11.42%
8.43%
12.85% 13.40%
15.85%
6.50%
3.89%
7.31%8.10%
2012-13 2013-14 2014-15 2015-16
Tamil Nadu Karnataka Andhra Pradesh Kerala
13.29% 12.70% 11.58%9.87% 9.50% 9.97%
16.46% 16.38% 16.20%
60.38% 61.43% 62.24%
2013-14 2014-15 2015-16
Primary Secondary (Manufacturing) Secondary (Others) Tertiary

Kochi Bengaluru Industrial Corridor –Draft Perspective Plan for overall KBIC region - Draft
3
The per capita GSDP at constant (2011-12) prices in 2015-16 was INR 119,763 recording a growth rate of 7.57% in 2015-16 compared to India’s per capita GDP of INR 77,803. Kerala’s average GDP growth between 2013 and 2016 was 6.5% against a country average of 7.2%. However, the per capita GDP growth has been 12%, almost double the country’s average during the same period.
Remittances play a major role in the states per capita GDP. Remittances from other countries, especially Gulf countries, contribute significantly to the state income. According to Kerala Migration Study conducted in 2014, roughly 2.4 million Keralites were working abroad. The inflow of NRI deposits increased to INR 135,609 Crores in 2016 from INR 109,603 crores in 2015 registering a 23.7% growth in deposits.
1.2.2. Tamil Nadu
Tamil Nadu, India’s fourth largest state, is home to the most factories in India, is the second largest contributor to the country’s GDP, and is the third largest contributor to its industrial output
Tamil Nadu’s GSDP grew at a compound annual growth rate (CAGR) of 6.3% between 2011–12 and 2015–16, reaching INR 94,867,385 in 2015–161.
Figure 3: Comparison of GDP composition of select state
Source: Niti Aayog
In terms of the ratio of manufacturing output to total GDP, Tamil Nadu comes third after Maharashtra and Gujarat. Similar to Gujarat, Tamil Nadu is characterized by strong fundamentals such as skilled manpower, a favorable investment climate, and sound infrastructure. The share of manufacturing to GSDP in Tamil Nadu declined from 22% to 20% between FY 2012 and FY 2016. The fall in the share of manufacturing in nominal terms was also seen across the major industrial states of Maharashtra, Gujarat and Karnataka.
1 Source: Indiastat
An
dh
ra P
rad
esh
Gu
jara
t
Ka
rna
tak
a
Mah
ara
shtr
a
Ta
mil
Na
du
Ker
ala
An
dh
ra P
rad
esh
Gu
jara
t
Ka
rna
tak
a
Mah
ara
shtr
a
Ta
mil
Na
du
Ker
ala
An
dh
ra P
rad
esh
Gu
jara
t
Ka
rna
tak
a
Mah
ara
shtr
a
Ta
mil
Na
du
Ker
ala
An
dh
ra P
rad
esh
Gu
jara
t
Ka
rna
tak
a
Mah
ara
shtr
a
Ta
mil
Na
du
Ker
ala
An
dh
ra P
rad
esh
Gu
jara
t
Ka
rna
tak
a
Mah
ara
shtr
a
Ta
mil
Na
du
Ker
ala
FY 12 FY 13 FY 14 FY 15 FY 16
GDP composition - select state comparisons
Manufacturing Other secondary Primary Tertiary

Kochi Bengaluru Industrial Corridor –Draft Perspective Plan for overall KBIC region - Draft
4
1.3. Potential impact of the KBIC
To promote manufacturing in India, the Government of India (GoI) announced the National Manufacturing Policy, 2011 with the objective of enhancing the share of manufacturing in gross domestic product (GDP) to 25% by 2025 from the current 17%. To achieve this, specific instruments have been conceptualized including the (i) simplification of business regulations; (ii) Make in India campaign; and (iii) clustering and aggregation of industrial areas through industrial and economic corridors, and National Investment and Manufacturing Zones (NIMZs). In 2017, the central government, in an attempt to promote private sector participation, enhance competition, increase efficiency, create a robust ecosystem for suppliers and put in place focused R&D for modernization, promulgated the Strategic Partnership Policy.
In the Southern region, corridor projects like Chennai Bangalore Industrial Corridor (CBIC) and Chennai Kanyakumari Industrial Corridor (CKIC) are in planning stages. Further, the central government has announced development of two defence corridors in the country, one of which is in the southern India. This defence corridor is proposed to be developed in Tamil Nadu with nodes around Chennai, Tiruchirappalli, Coimbatore, Salem and Krishnagiri.
Figure 4: Overview of corridor development plans in Southern India
KBIC will integrate Kerala and Western Tamil Nadu with the network of economic and industrial corridors of the country. The KBIC initiative will build upon the existing development plans in Southern India through:
• Integration with other planned developments in the region – KBIC will align with developments like CBIC, CKIC, defence corridor etc. with focus on increasing the share of manufacturing,
Kanyakumari
Bengaluru
Kochi
Salem
Chennai
Other Industrial/
Eco nomic corridors
Pro posed Tamil Nadu
Defence corridor
Ko chi - Bengaluru
Industrial Corridor
CoimbatoreT iruchirappalli
Krishnagiri
To Mumbai To Vizag
CKIC – Phase 1 nodes
CBIC Phase 1
CKIC – Phase 2 nodes

Kochi Bengaluru Industrial Corridor –Draft Perspective Plan for overall KBIC region - Draft
5
facilitating existing and upcoming manufacturing units through world class services industry, promoting balanced regional growth, and developing southern India.
• Enable integration of value chains through cross border synergies – KBIC will support cross border synergies through integration of value chains across manufacturing as well as services industries
• Provide alternate (cost/ time effective) gateways to existing and upcoming industries – With development of infrastructure as part of the corridor initiative, KBIC will also provide alternate gateways to industries in immediate and secondary hinterland and in turn improve overall competitiveness of the region
• Enable industrial development through increased investments and thus improve state output and generate employment opportunities
1.3.1. The proposed corridor will integrate several planned central and state projects there by positively impacting the overall development of the region
The corridor initiative will integrate multiple central and state government development plans in the region so as to enhance the viability and impact of each of them. For instance:
• New gateways like Kannur Airport and Vizhinjam Port will benefit from the generation of cargo in the hinterland and increased passenger movement due to growing manufacturing and services development
• The Mangalore to Bengaluru GAIL pipeline will benefit the utility intensive industries in the corridor region
• Multi Modal Logistics Park, Kochi will enjoy improved cargo potential which in turn will increase competitiveness of existing and new industries in the
region
• Trivandrum Kannur Semi - High Speed rail will improve connectivity along the 10 districts and reduce travel time thus promoting equitable regional disbursement of development initiatives planned as a part of the corridor
• Defence Corridor will facilitate creation of a value chain for sectors like electronics, rubber, technical textiles etc. through movement of raw materials and finished goods along the corridor. Services industries like R&D and IT/ ITeS will also enable the defence industries.
• Kochi Theni highway will provide seamless connectivity between Kochi port and Madurai Dindigul Virudhanagar Theni node of CKIC
1.3.2. KBIC will enable integration of value chains through cross border synergies
To cope with market demands and changes and maintain their competitive advantage, industries try to find new ways of working together with partners to provide customers with a range of services that knot together so seamlessly that they amount to more than the sum of their parts. The corridor will provide investment opportunities to integrate such value chains. For instance,
MMLP
Kochi
Vizhinjam
port
Kannur
Airport
Defence CorridorTrivandrum-
Kannur Semi - High Speed rail
GAIL pipeline
Theni
Kochi - Theni
highway
Figure 5: Central and state development plan
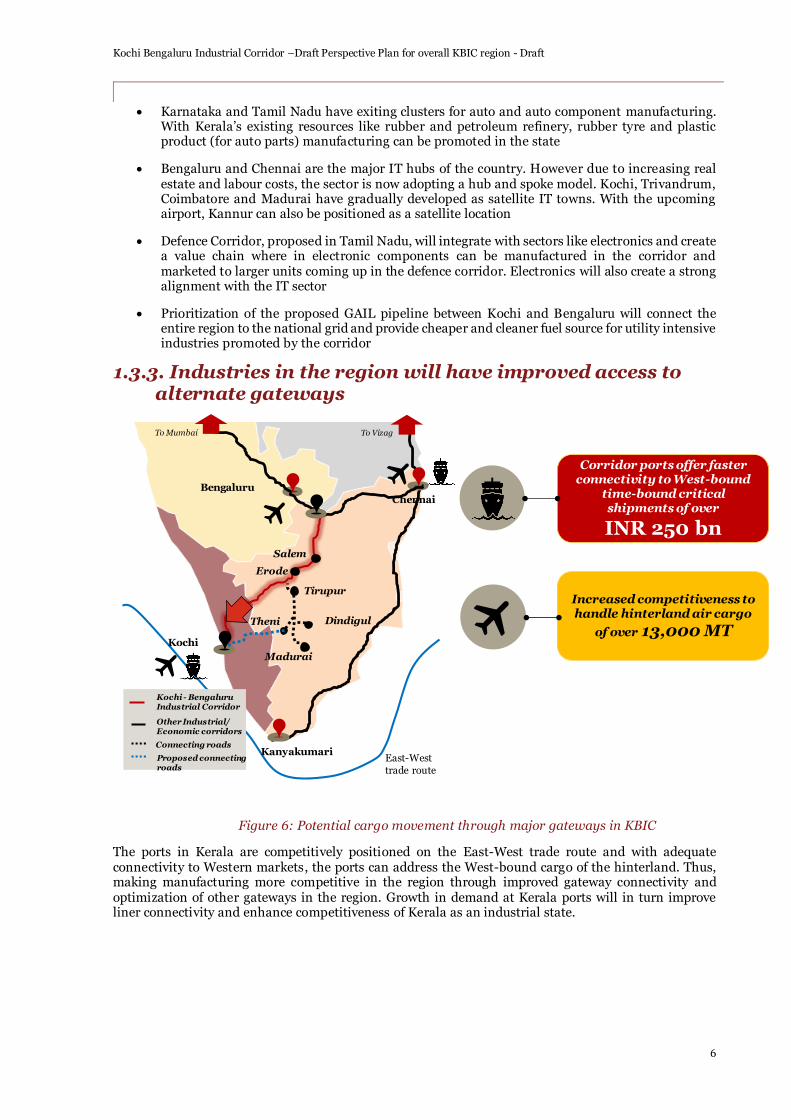
Kochi Bengaluru Industrial Corridor –Draft Perspective Plan for overall KBIC region - Draft
6
• Karnataka and Tamil Nadu have exiting clusters for auto and auto component manufacturing. With Kerala’s existing resources like rubber and petroleum refinery, rubber tyre and plastic product (for auto parts) manufacturing can be promoted in the state
• Bengaluru and Chennai are the major IT hubs of the country. However due to increasing real estate and labour costs, the sector is now adopting a hub and spoke model. Kochi, Trivandrum, Coimbatore and Madurai have gradually developed as satellite IT towns. With the upcoming airport, Kannur can also be positioned as a satellite location
• Defence Corridor, proposed in Tamil Nadu, will integrate with sectors like electronics and create a value chain where in electronic components can be manufactured in the corridor and marketed to larger units coming up in the defence corridor. Electronics will also create a strong alignment with the IT sector
• Prioritization of the proposed GAIL pipeline between Kochi and Bengaluru will connect the entire region to the national grid and provide cheaper and cleaner fuel source for utility intensive industries promoted by the corridor
1.3.3. Industries in the region will have improved access to alternate gateways
The ports in Kerala are competitively positioned on the East-West trade route and with adequate connectivity to Western markets, the ports can address the West-bound cargo of the hinterland. Thus, making manufacturing more competitive in the region through improved gateway connectivity and optimization of other gateways in the region. Growth in demand at Kerala ports will in turn improve liner connectivity and enhance competitiveness of Kerala as an industrial state.
Corridor ports offer faster connectivity to West-bound
time-bound critical shipments of over
INR 250 bn
Increased competitiveness to handle hinterland air cargo
of over 13,000 MT
Kanyakumari
Bengaluru
Kochi
Chennai
To Mumbai To Vizag
Tirupur
Salem
Madurai
Erode
Other Industrial/ Economic corridors
Kochi - Bengaluru Industrial Corridor
Connecting roads
DindigulTheni
Proposed connecting roads
East-West trade route
Figure 6: Potential cargo movement through major gateways in KBIC

Kochi Bengaluru Industrial Corridor –Draft Perspective Plan for overall KBIC region - Draft
7
1.3.4. The priority manufacturing sectors in the corridor are expected to grow by over ~29,000 crore to ~50,000 crore over the next 30 years
The priority sector manufacturing can grow up to 3 times over the next 20 years . Gross value addition of the potential manufacturing sectors in the corridor is estimated to increase from ~INR 24,000 crore to between ~INR 53,000 crore and ~INR 76,000 crore by 2040. Figure 22 presents estimated manufacturing GVA (priority sectors) under the BAU and the BIS. The GVA is estimated to grow at 6% - 9% in the first 10 years (2020-2030) and subsequently at 4% - 6% over the next 10 years (2030-2040).
Figure 7: Estimated GVA growth (priority manufacturing sectors) in KBIC
Figure 8: Estimated GVA growth (all manufacturing) in KBIC
5,315,871
2,409,267
7,617,235
-
1,000,000
2,000,000
3,000,000
4,000,000
5,000,000
6,000,000
7,000,000
8,000,000
20
20
20
21
20
22
20
23
20
24
20
25
20
26
20
27
20
28
20
29
20
30
20
31
20
32
20
33
20
34
20
35
20
36
20
37
20
38
20
39
20
40
Estimated GVA growth (priority manufacturing sectors) (in INR lakh)
BAU BIS
6,644,839
3,011,584
9,521,544
-
1,000,000
2,000,000
3,000,000
4,000,000
5,000,000
6,000,000
7,000,000
8,000,000
9,000,000
10,000,000
20
20
20
21
20
22
20
23
20
24
20
25
20
26
20
27
20
28
20
29
20
30
20
31
20
32
20
33
20
34
20
35
20
36
20
37
20
38
20
39
20
40
Estimated GVA growth (all manufacturing) (in INR lakh)
BAU BIS
1.4
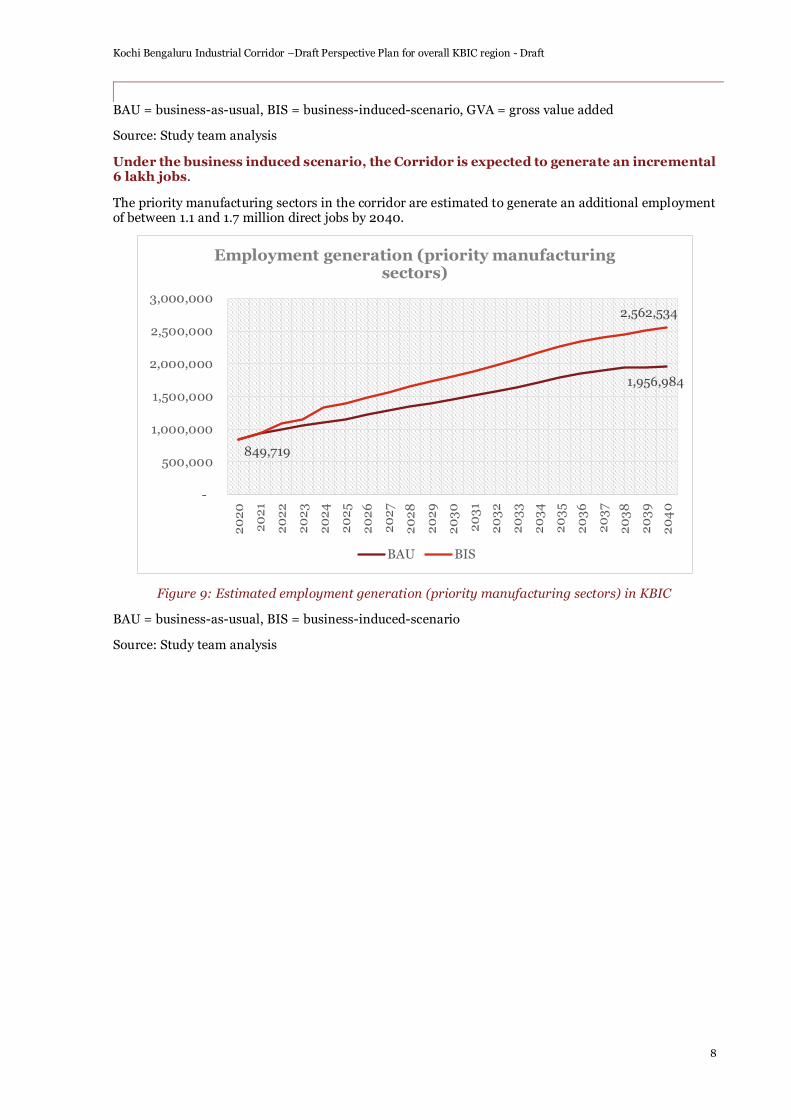
Kochi Bengaluru Industrial Corridor –Draft Perspective Plan for overall KBIC region - Draft
8
BAU = business-as-usual, BIS = business-induced-scenario, GVA = gross value added
Source: Study team analysis
Under the business induced scenario, the Corridor is expected to generate an incremental 6 lakh jobs.
The priority manufacturing sectors in the corridor are estimated to generate an additional employment of between 1.1 and 1.7 million direct jobs by 2040.
Figure 9: Estimated employment generation (priority manufacturing sectors) in KBIC
BAU = business-as-usual, BIS = business-induced-scenario
Source: Study team analysis
1,956,984
849,719
2,562,534
-
500,000
1,000,000
1,500,000
2,000,000
2,500,000
3,000,000
20
20
20
21
20
22
20
23
20
24
20
25
20
26
20
27
20
28
20
29
20
30
20
31
20
32
20
33
20
34
20
35
20
36
20
37
20
38
20
39
20
40
Employment generation (priority manufacturing sectors)
BAU BIS

Kochi Bengaluru Industrial Corridor –Draft Perspective Plan for overall KBIC region - Draft
9
1.4. Study objectives and methodology
1.4.1. Study objectives
The overall objective of this study is to craft a strategy for the industrial transformation of the corridor and its influence area. The analytical approach first identified the industries that will drive growth in KBIC and the IMCs in which these will be strategically located, taking into account land and factors of productions availability. Infrastructure plays the role of growth enabler. The urban–industry linkages and the focus on ports play a critical role in developing the infrastructure strategy and other industrialization enablers such as power and water supply. The scale of corridor development presents environmental challenges. Environmental assessment of the corridor region was conducted to ensure the development plan proposed is sustainable.
1.4.2. Overview of our methodology
This study involved several analytical approaches in examining key dimensions of the corridor development, including delineation of the spine and influence area; IMC selection; and industry, infrastructure, environmental analysis.
Corridor delineation and IMC identification
As a part of the corridor development, the spine of the corridor is initially identified. The spine is typically a robust road or rail network. For instance, in case of Vizag Chennai Industrial Corridor, the spine is NH 16; in case of Delhi Mumbai Industrial Corridor, the spine is railway connected via the Western Dedicated Freight Corridor. Also basis our experience in various corridor projects, it is preferable for the identified spine to be existing instead of planned so as to efficiently plan and execute the corridor development.
Subsequent to finalization of the spine, the corridor influence area is identified. The influence area is selected such that the impact of the corridor is maximized in terms of area and population coverage as well as investment and growth potential.
Subsequent to finalization of the corridor influence areas, localized areas (Integrated Manufacturing Clusters (IMCs)) for industrial development are identified. In the first step, identification of IMCs was done using certain inclusion and exclusion parameters. Subsequently the identified IMCs were prioritized by analyzing the size and proximity of land parcels within the IMC, access to gateways, industrial ecosystem of the region and the urban and social infrastructure.
Industry analysis
The industrial analysis consisted of an as-is assessment of industries across the corridor influence area, shortlisting of priority industries based on a “what is” and “what could be” analysis, and a review of manufacturing competitiveness using detailed value chain analysis and stakeholder consultations. In corroborating stakeholder findings, an as-is assessment and potential assessment of the industrial scenario, manufacturing and services, was undertaken for Palakkad. Based on secondary assessment, potential industries have been identified for Dharmapuri- Salem.
Infrastructure assessment
In the infrastructure analysis, the study assessed the current infrastructure supply, covering areas that include gateway infrastructure, transport infrastructure linked to industry (including logistics), power infrastructure, and infrastructure linked to urban development in the region. The study forecasted industry-linked development and its impact on urban growth, demand for transport infrastructure, and power infrastructure. Forecasting was done for a business-as-usual scenario (BAU), which builds on historical growth, and a business-induced scenario (BIS), which refers to accelerated growth with enablers in place.
Environmental assessment
A detailed as-is environmental assessment was carried out. We reviewed the environmental conditions of the corridor as well as the priority IMC in Kerala and Tamil Nadu. We have also discussed the clearances required for the selected IMC sites.

Kochi Bengaluru Industrial Corridor –Draft Perspective Plan for overall KBIC region - Draft
10
2. Corridor delineation and IMC identification
2.1. NH 544 forms the spine of the corridor, synergizing with other corridor development projects in Southern India
The corridor is envisaged to capitalize on the existing road network - the national and state highways running across the state of Kerala extending to Tamil Nadu.
With a total distance of 340 km between Kochi to Salem, of which 160 km runs within Kerala, NH 544 is the proposed spine of the corridor. The Palakkad-Kochi stretch of NH 544 is part of the NS-EW Corridor of the Indian highway system which is the largest ongoing highway project in India.
NH 544 provides connectivity to Cochin Port as well as Beypore Port in Kozhikode that connects to NH 544 via NH 966 at Palakkad. In addition, two of the three international airports in Kerala (Cochin and Kozhikode) are being linked with same highway network. Hence, NH 544 acts as an important link connecting the major ports, airports and hinterland, providing the crucial link for raw materials and finished goods movement across the state.
The Corridor further integrates the development plans in the Southern India making Kerala and western Tamil Nadu an integral part of the planned development.
Figure 10: The spine of the corridor integrating KBIC to other planned developments in Southern India
GAIL
Pi peline
Ma ngalore
Kochi
Ka nyakumari
Ba ngalore
BMEC
VCIC
CKIC
Karnataka
Andhra Pradesh
Tamil Nadu
Kerala
CBIC
Coimbatore
Sa lem
Hosur
Tiruchirappalli
Th iruvananthapuram (V izhinjam)
Kozh ikode
Pr oposed Ka nnur
V OC
In cluding Ch ennai, En n ore a n d Kattupalli
GA IL pipeline
NH 544
Other Corridors
TN Defence Corridor
Corridor airport
Corridor port
Other proximal a irport
Other proximal port
NH 544
Pr oposed ex pansion of CKIC to V izhinjam
N H 44
In dustrial clusters

Kochi Bengaluru Industrial Corridor –Draft Perspective Plan for overall KBIC region - Draft
11
2.2. The corridor covers 9 districts in Kerala and 9 districts in Tamil Nadu
Four options were analyzed for selecting the influence area of the corridor. The table below provides a quick summary of all the options discussed above.
Table 1: Corridor delineation option summary
Option 1 Option 2 Option 3 Option 4
Offset from Spine 50 km 75 km 100 km 100 km + key districts
Total Districts Covered
8 12 15 18
Kerala 1. Thrissur 2. Ernakulum 3. Palakkad
1. Thrissur 2. Ernakulum 3. Palakkad 4. Alappuzha 5. Kottayam 6. Malappuram
1. Thrissur 2. Ernakulum 3. Palakkad 4. Alappuzha 5. Kottayam 6. Malappuram 7. Idukki
1. Thrissur 2. Ernakulum 3. Palakkad 4. Alappuzha 5. Kottayam 6. Malappuram 7. Idukki 8. Kozhikode 9. Kannur
Tamil Nadu 1. Coimbatore 2. Erode 3. Namakkal 4. Salem 5. Tiruppur
1. Coimbatore 2. Erode 3. Namakkal 4. Salem 5. Tiruppur 6. Nilgiri
1. Coimbatore 2. Erode 3. Namakkal 4. Salem 5. Tiruppur 6. Nilgiri 7. Dharmapuri 8. Karur
1. Coimbatore 2. Erode 3. Namakkal 4. Salem 5. Tiruppur 6. Nilgiri 7. Dharmapuri 8. Karur 9. Krishnagiri
Total area in sq. km.
34,890 44,630 56,387 65,793
Kerala 10,572 17,747 22,103 26,380
Tamil Nadu 24,318 26,883 34,284 39,413
Total Population Coverage (in mn)
22.6 31.5 35.2 42.7
Kerala (in mn) 9.2 17.4 18.5 24.1
Tamil Nadu (in mn)
13.4 14.1 16.7 18.5
Contribution to GSVA
Kerala 30% 53% 57% 73%
Tamil Nadu 20% 20% 22% 29%
Source: census, 2011

Kochi Bengaluru Industrial Corridor –Draft Perspective Plan for overall KBIC region - Draft
12
Considering the coverage of area, population and contribution to GSVA, 100 kms + key districts from the central spine of the corridor i.e. NH544 is considered as the influence area.
The table below provides a quick summary of the selected option.
Table 2: Corridor delineation option summary
Option 4
Offset from Spine 100 km + key districts
Total Districts Covered 18
Kerala 1. Thrissur 2. Ernakulum 3. Palakkad 4. Alappuzha 5. Kottayam 6. Malappuram 7. Idukki 8. Kozhikode 9. Kannur
Tamil Nadu 1. Coimbatore 2. Erode 3. Namakkal 4. Salem 5. Tiruppur 6. Nilgiri 7. Dharmapuri 8. Karur 9. Krishnagiri
Total area in sq. km. 65,793
Kerala 26,380
Tamil Nadu 39,413
Total Population Coverage (in mn) 42.7
Kerala (in mn) 24.1
Tamil Nadu (in mn) 18.5
Contribution to GSVA
Kerala 73%
Tamil Nadu 29%
Aforementioned are a total of eighteen districts of Kerala and Tamil Nadu (nine in each state) forming part of the KBIC. A base map of the finalized delineation has been prepared. Survey of India topo sheets were used for preparation of the base map in a GIS environment. Project related data was collected from various agencies including Kerala State Industrial Infrastructure Corporation Ltd. (KSIDC), State Archaeological department, Central archaeological survey of India, Department of Town and Country Planning (DTCP), ULBs, Kerala State Development Planning Society, Commissioner and Director of Municipal Administration (CDMA), various official websites etc.
Source: census, 2011

Kochi Bengaluru Industrial Corridor –Draft Perspective Plan for overall KBIC region - Draft
13
Figure 11: KBIC Base map

Kochi Bengaluru Industrial Corridor –Draft Perspective Plan for overall KBIC region - Draft
14
2.3. 9 IMCs, 4 in Kerala and 5 in Tamil Nadu have been identified
A two-step approach has been adopted for identification and prioritization of Integrated Manufacturing Clusters (IMCs).
Identification
In the first step, identification of IMCs was done using certain inclusion and exclusion parameters. This approach enables a screening mechanism whereby we have analyzed the available land parcels based on the following inclusion parameters:
a. The land parcels come under the defined corridor influence region
b. The available land parcels are individually greater than 100 acres in size and;
c. The land parcels are either contiguous or within a distance of 100 kms.
In the exclusion criteria we have evaluated the land parcels that are not conducive to setting up the required infrastructure based on geographical or regulatory parameters and eliminated from consideration. The following criteria have been analyzed for excluding unusable land parcels:
a. Prohibited areas including Coastal regulatory zones, Forest areas, restricted and flood line areas, seismic zones etc.
b. Unusable land based on usage that include double irrigated lands, swamps, topographically unusable land etc.
c. The identified IMC sites include:
Table 3: IMCs identified in Kerala and Tamil Nadu
State Identified IMC sites
Kerala Palakkad
Kannur
Idukki
Criteria for inclusion of land parcels
+
• Land parcel is in corridor influence region (100kmfrom Spine on either side)
• Size of the land parcel is >100 acres• Contiguous land parcels or in proximity to each
other - <100 kms
Step 1: Identification of IMCs Step 2: Prioritization of IMCs
Exclusions from negative parameters
-
Prohibited areas - Coastal Regulatory Zone , Forest, Restricted and Flood line areas, Seismic zones IV & V, etc.
Based on land use - Double irrigated lands, swamps and marshy lands, other lands with unsuitable topography, etc.
• Extent of readily available land (including land proposed for acquisition)
• Distance between land parcels
Land parcels
• Proximity to port• Proximity to airport• Proximity to major roads
Transport infrastructure
• Growth in investments• GSVA per capita• Labour participation• Completed large investments
Industrial ecosystem
• Urbanization• Social infra like educational institutions,
medical institutions etc.• Proximity to large cities/ municipalities/
municipal corporations
Urban and social infrastructure
Figure 12 Framework for Identification and Prioritization of IMCs

Kochi Bengaluru Industrial Corridor –Draft Perspective Plan for overall KBIC region - Draft
15
Kozhikode
Tamil Nadu Dharmapuri – Salem
Coimbatore – Tiruppur
Erode
Karur
Krishnagiri
Source: KINFRA, KSIDC, SIPCOT
Among the identified IMCs, 4 IMCs are in Kerala and 5 IMCs are in Tamil Nadu. Basic assessment of
the IMCs in terms of connectivity, industrialization, and land availability is following:
1. Idukki: Idukki has 920 acres of available land in a single land parcel. In terms of connectivity, the IMC in Idukki has good access to Kochi Port as well as Airport both of which lie at a distance of 50-60 Km using NH 85. In terms of existing industrial infrastructure, Idukki doesn’t have any large scale industries. There are MSME clusters mainly comprising of readymade garments, textile, wood processing and rubber, plastic and petro based units. In terms of Industrial areas, there is a Mini Industrial Estate in Puliyamala.
2. Palakkad: The total land area available in Palakkad is 1,620 acres in 4 parcels with the largest land parcel 700 acres. The land parcels in Palakkad lie at a distance of 150-160 Km from the Kochi Port and 53 Km from the Coimbatore Airport. The land parcels are well connected to the gateways through the spine (NH 544). The main industrial areas in Palakkad are in NIDA Kanjikode, IDA Puthussery, DP Kappur, DP Shornur, DP Koppam and KINFRA Industrial and Textile Park.
3. Kozhikode: The total available land area is 322 acres in 2 parcels with the larger land parcel of 208 acres. The IMC lies at a distance of 180 km from the Kochi port connected through NH 66. The nearest airport is at Calicut, 25 Km from the land parcels. In terms of existing industrial infrastructure, Kozhikode has clusters comprising of wood processing, rubber, plastic and petro based units, food processing (marine). In terms of Industrial areas, there is an Industrial Estate, Govt of Kerala.
4. Kannur: The total available land area is 1,500 acres in 3 parcels with the largest measuring 500 acres. The land parcels lie 275 km from the Kochi port connected through NH 66. The nearest
KeralaTamil Nadu
Idukki
Total Land Area: 920 acres in 1 parcel
6
Palakkad-Thrissur
Total Land Area: 1,620 acres in 4 parcels; Largest parcel – 700 acres
7
Kozhikode
Total Land Area: 322 acres in 2 parcels; Largest parcel – 208 acres
8
Kannur
Total Land Area: 1,500 acres in 3 parcels; Largest parcel – 500 acres
9
Dharmapuri - Salem
Total Land Area: 2,663 acres in 8 parcels; Largest parcel – 860 acres
1
Coimbatore - Tiruppur
Total Land Area: 1,174 acres in 4 parcels; Largest parcel – 520 acres
2
Erode
Total Land Area: 472 acres in 2 parcels; Largest parcel – 272 acres
3
Karur
Total Land Area: 891 acres in 7 parcels; Largest parcel –177 acres
4
Krishnagiri
Total Land Area: 1,746 acres in 3 parcels; Largest parcel – 838 acres
5
Figure 13: Selected IMCs in KBIC

Kochi Bengaluru Industrial Corridor –Draft Perspective Plan for overall KBIC region - Draft
16
operational Airport is at Calicut, 115 km away, however the proposed airport at Kannur lies at a distance of 13 km from the land parcels. The main industrial areas in Kannur are in IDP Andor, Mini Industrial Estate, SIDCO, KINFRA small industries park, Tallecherry and a Major Industrial estate in Palayad.
5. Dharmapuri – Salem: The total available land area is 2,663 acre in 8 parcels with the largest parcel measuring 860 acres. The nearest port is Chennai and the nearest airport is at Salem.
6. Coimbatore – Tirrupur - The total available land area is 1,174 acre in 4 parcels with the largest parcel measuring 520 acres. The nearest port is Kochi and the nearest airport is at Coimbatore.
7. Karur: The total available land area is 891 acres in 7 parcels with the largest measuring 177 acres. The land parcels lie ~290 km from VOC port. The nearest operation airport is at Thiruchirapalli at ~82 km.
8. Erode: The total available land area is 472 acres in 2 parcels with the largest measuring 272 acres. The land parcels lie 267 km from the Kochi port connected through NH 544. The nearest operational Airport is at Coimbatore, 71 km away connected by NH 544. The main industrial areas in Erode are in Govt. Industrial Estate Erode and SIDCO Industrial Estate, Nanjai Uthukkuli.
9. Krishnagiri: The total available land area is 1,746 acres in 3 parcels with the largest measuring 838 acres. The land parcels lie 475 km from the Kochi port connected through NH 544. The nearest operational Airport is at Coimbatore, 278 km away connected by NH 544. The existing industrial areas in Krishnagiri are situated in Kadagathur, Krishnagiri SEZ, Uthankarai, Burgur, Poluppalli, Hosur – SIPCOT.
The nine selected IMCs in the corridor were assessed based on their distance from the environmentally sensitive areas in the corridor.
All the identified IMC Sites are sufficiently away from protected areas and none of them are reported CPAs. Action Plans have been proposed to lower CEPI index (Comprehensive Environment Pollution Index) with respect to Air, Water and Solid waste. There are two land parcels one at Mokeri in Kannur and one at Puthuserry in Palakkad which come under notified Ecologically Sensitive Areas in the region. Necessary clearances from MoEF & CC (Ministry of Environment, Forest and Climate Change) as applicable are required to be taken for the sites falling with in ESZ/ESAs. In addition, 2 land parcels in Palakkad share state boundary with Tamil Nadu because of which a clearance form MoEF & CC. is required. Also, none of the districts in KBIC fall under Seismic zone IV and V.
Hence, after analyzing the parameters in the Exclusion criteria, there is no significant impact on the selected IMCs.
Prioritization
In the second step, the IMCs identified under step 1 have been prioritized by analyzing the size and
proximity of land parcels within the IMC, access to gateways, industrial ecosystem of the region and the
urban and social infrastructure.
Four major parameters have been considered for excluding land parcels affecting environmentally sensitive areas:-
a. Protected Areas notified under the Wild Life (Protection) Act, 1972 (53 of 1972)
b. Critically Polluted areas as notified by the Central Pollution Control Board constituted under the Water (Prevention and Control of Pollution) Act, 1974 (6 of 1974)
c. Eco-sensitive areas as notified under sub-section (2) of section 3 of the Environment (Protection) Act, 1986
d. Presence of Seismic Zones IV and V
e. Land parcels sharing borders with other states
f. The summary of the ranking of the IMC nodes is as shown below. In the KBIC corridor, Palakkad has been identified as the priority IMC in Kerala and Dharmapuri – Salem has been identified as the priority IMC in Tamil Nadu.

Kochi Bengaluru Industrial Corridor –Draft Perspective Plan for overall KBIC region - Draft
17
Table 4: Overall Ranking of IMCs
IMC Nodes Overall Rank
Kerala
Palakkad 1
Kannur 2
Kozhikode 3
Idukki 4
Tamil Nadu
Dharmapuri - Salem 1
Coimbatore - Tirrupur 2
Erode 3
Karur 4
Krishnagiri 5
Note: IMCs in Kerala and Tamil Nadu have been ranked separately
Source: PwC Analysis
The prioritized IMCs have been studied in detail.
1. Palakkad – Palakkad has been identified as one of the priority IMCs in the corridor. It has 1,620 acres of land available for industrial development. Palakkad is one of the leading manufacturing districts in Kerala with approximately 8% contribution in overall manufacturing GSVA of the state. It has received maximum MSME investment except Ernakulum among the Kerala districts. In terms of connectivity, it is very well connected with the spine NH 544 which passes through the district and connects it with the gateways (Cochin Port, Cochin International Airport, and Coimbatore Airport) of the corridor. Also, Palakkad has the highest intake of engineering and medical students in Kerala. These factors make Palakkad one of the most attractive options for making it an integrated manufacturing cluster in the corridor.
Kochi Bengaluru Industrial Corridor –Draft Perspective Plan for overall KBIC region - Draft
18
Figure 14: Location of IMC Sites in Palakkad node
The following table shows the detail of these parcels with extent of area and the distance to gateways.
Table 5: Palakkad – Thrissur IMC sites and connectivity
S. No IMC sites –
Palakkad node
Distance from NH
544 (~km)
Nearest airport
(international)
Nearest Seaport
Nearest Railway Station
Nearest railway line
1 Puthussery
– 700 Ac. 0.6
Coimbatore - ~42 km
Kochi - ~110 km
Kanjikode - ~3 km
Adjacent
2 Ozhalapath
y -250 Ac. 7
Coimbatore – 39 km
Kochi – 115 km
Walayar - ~15 km
~8 km
3 Kannambra – 470 Ac.
Adjacent Coimbatore – 82 km
Kochi – 73 km
Lakkiti -~17km
~15 km
4 Desamanga
lam – 200 Ac.
25 Calicut –
50km Ponnani –
30 km Karakkad -
~2 km 2 km
2. Dharmapuri - Salem – Dharmapuri - Salem has been identified as the priority IMC in the Tamil Nadu. An area of ~2663.13 acres is identified in Dharmapuri - Salem node. Details of these IMC sites are given in the following table:
IMC sites – Dharmapuri – Salem node Area in acres Dharmapuri District 1,199.12

Kochi Bengaluru Industrial Corridor –Draft Perspective Plan for overall KBIC region - Draft
19
Salem Steel Plant - Salem District 1,464.01
Total 2,663.13
The land parcels in Dharmapuri and Salem are well connected by road, rail and air making the location strategically important for establishing the IMC. The connectivity details of land parcels in Dharmapuri and Salem node are given in the table below.
Table 6: Connectivity of IMC sites – Dharmapuri-Salem Node
IMC sites – Dharmapuri-Salem node
Nearest NH & SH
Nearest airport
Nearest Seaport
Nearest Railway Station
Dharmapuri–856.22 acres NH44, SH 60, SH60A, SH17,
NH844
Salem
~48km
Ponnani Port
~350km
Dharmapuri
Nallampalli – 342.90 acres NH44, SH 60, SH60A, SH17,
NH844
Salem
~37km
Ponnani Port
~356km
Dharmapuri
Salem West – 860 acres
NH44, NH544,
NH79, NH179A
Salem
~30km
~Ponnani Port
~304km
Salem, Magnesite
Omalur – 349.1 acres NH44,
NH544, NH544H
Salem
~8km
Ponnani Port
~305km
Omalur
Sankari – 244.53 acres NH544,
NH381A, SH79, SH86A
Salem
~45km
Ponnani Port
~267km
Salem, Erode
Edappady- NA NH544,
NH544H, NH381A
Salem
~43km
Ponnani Port
~282km
Salem, Erode
Mettur Dam
Yercaud- 10.38 acres
NH44, NH79, NH179A,
NH544 SH188
Salem
~30km
Ponnani Port
~320km
Salem, Magnesite

Kochi Bengaluru Industrial Corridor –Draft Perspective Plan for overall KBIC region - Draft
20
3. Industrial Development
3.1. Potential of the corridor
In FY17, the combined GSVA of the states of Tamil Nadu2 and Kerala3 constituted to 13% of the country’s total GVA.
As per last available data for KBIC districts (Kerala FY17 GSVA and TN FY13 GSVA4 inflation adjusted to 6% CAGR), the total GVA for the corridor is around INR 3,505 bn which is 3% of the country’s GVA.
The manufacturing sector contribution of the two states is around 12% of the total manufacturing GVA of the country, the contribution from Kerala being 2%. Tamil Nadu was the 3rd largest contributor to the country’s manufacturing GVA only after Maharashtra and Gujarat.
2 MoSPI 3 Government of Kerala, Department of Economics and Statistics 4 ASI
Figure 18: District-wise GVA in Tamil Nadu, in FY13
Figure 17: District-wise GSVA (FY 17) for Kerala and 5-year CAGR
91 3 55
0 1 3
112
20
32
60
GVA/GSVA PrimaryActivities
SecondaryActivities
TertiaryActivities
Tamil Nadu Kerala India
India
INR 20,199 bn
Tamil Nadu- 10%
Kerala-2%
Figure 15: GVA/GSVA composition in FY17 (INR trillion)
Source: MoSPI Source: MoSPI
Figure 16: Contribution of Kerala and TN in manufacturing GVA
63 62
24 26
90
5 3 17
104
-
20
40
60
80
100
120
Co
imb
ato
re
Ero
de
Na
ma
kk
al
Sal
em
Tir
up
pu
r
Nil
gir
i
Dh
arm
apu
ri
Kar
ur
Kri
shn
agi
ri
TN GSVA (at constant prices in Rs.bn)
6%5%
4%5%
2%
5%
3%
6%5%
0%1%2%3%4%5%6%7%
-
100
200
300
400
500
600
Th
riss
ur
Ern
aku
lam
Pal
ak
ka
d
Ala
pp
uzh
a
Ko
tta
yam
Ma
lap
pu
ram
Idu
kk
i
Ko
zhik
od
e
Kan
nu
r
Kerala GSVA (at constant prices in Rs.bn)CAGR

Kochi Bengaluru Industrial Corridor –Draft Perspective Plan for overall KBIC region - Draft
21
The corridor districts of Kerala, contribute to ~78% of the total manufacturing GSVA of the state and the TN districts contribute ~34% of the total manufacturing GSVA of TN.
Figure 19: Corridor district wise share in manufacturing of the state (in %)
# For Kerala, share of manufacturing GSVA for year 2015-16 * For TN, share of manufacturing GSVA for year 2012-13
Both the state governments have launched a number of policies to spur the manufacturing growth in the states.
Table 7: State-wise manufacturing sector schemes
Tamil Nadu5 Kerala6
Low Tension Power Tariff Subsidy Vendor development programme
Value Added Tax Subsidy Make-in Kerala
Generator Subsidy Awareness Programmes on Digital Payments
Back-ended Interest Subsidy (BEIS) Entrepreneur Development Programmes
Cluster Development Program National manufacturing competitiveness programme
Contribution of tertiary sector has been strong and growing in both the states
The tertiary sector contributes 64% in the Kerala KBIC economy. Trade, hotels and restaurants is one of the major services which contributes around 17% (same as Real estate) of the total GSVA of the KBIC districts in Kerala.
In Tamil Nadu, the tertiary sector contributes to 57% of the total GDP of the state which is much higher than the national average of 53%. While Chennai is the main hub for IT & ITeS industry, Coimbatore
5 Department of MSME, Tamil Nadu 6 MSME-Development Institute, Annual Report 2016-17
Kannur
Kozhikode
Malappuram
Thrissur
Ernakulum
Alappuzha
Kottayam
Krishnagiri
Dharmapuri
Salem
Namakkal
Karur
Erode
TiruppurIdukki
Nilgiris CoimbatorePalakkad
9%#
10%
6%
11%
14%
12%
6%
8%
2%
5%*
<1%
5%
1%
8%
2%
<1%
2%
7%
Share of manufacturing GSVA

Kochi Bengaluru Industrial Corridor –Draft Perspective Plan for overall KBIC region - Draft
22
has gradually been seeing growth in IT sector and is forming a spoke for the hubs at Chennai and Bengaluru.
Industrial infrastructure
In Kerala, Industrial infrastructure development is carried out by three agencies viz. District Industries Centre (DIC), Kerala State Industrial Development Corporation Ltd. (KSIDC) and Kerala Industrial Infrastructure Development Corporation (KINFRA).
The following figure shows the location of the existing industries of KSIDC, DIC and KINFRA in KBIC.
Figure 20: Location of Existing Industrial Parks/Estates
Under Government of Tamil Nadu, SPICOT is responsible for development of industrial complexes in the state. Of the 20 industrial complexes in Tamil Nadu, the following three are located in KBIC:
• Hosur, Krishnagiri - Allotable area of 1,676 acres; available area for allotment – 2 acres. The
major sectors operating in the complex include electrical, electronics, automobiles, pharma, and
floriculture industries
• Bargur, Krishnagiri – Allotable area of 606 acres; available area for allotment – 455 acres. The
major sectors operating in the complex include engineering, chemical, food processing, granite,
horticulture industries
• Perundurai, Erode - Allotable area of 1,859 acres; available area for allotment – 189 acres. The
major sectors operating in the complex include textile / hosiery processing units, dyeing units,
foundry, leather, engineering, chemical etc.
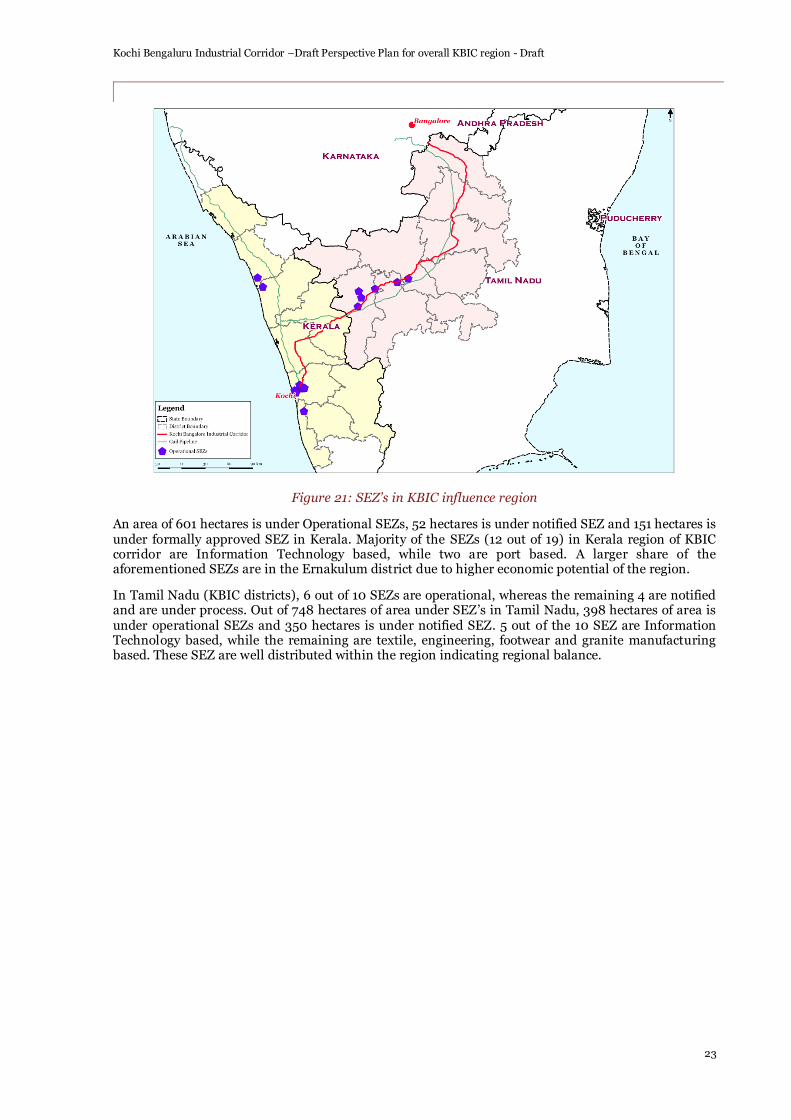
Kochi Bengaluru Industrial Corridor –Draft Perspective Plan for overall KBIC region - Draft
23
Figure 21: SEZ’s in KBIC influence region
An area of 601 hectares is under Operational SEZs, 52 hectares is under notified SEZ and 151 hectares is under formally approved SEZ in Kerala. Majority of the SEZs (12 out of 19) in Kerala region of KBIC corridor are Information Technology based, while two are port based. A larger share of the aforementioned SEZs are in the Ernakulum district due to higher economic potential of the region.
In Tamil Nadu (KBIC districts), 6 out of 10 SEZs are operational, whereas the remaining 4 are notified and are under process. Out of 748 hectares of area under SEZ’s in Tamil Nadu, 398 hectares of area is under operational SEZs and 350 hectares is under notified SEZ. 5 out of the 10 SEZ are Information Technology based, while the remaining are textile, engineering, footwear and granite manufacturing based. These SEZ are well distributed within the region indicating regional balance.
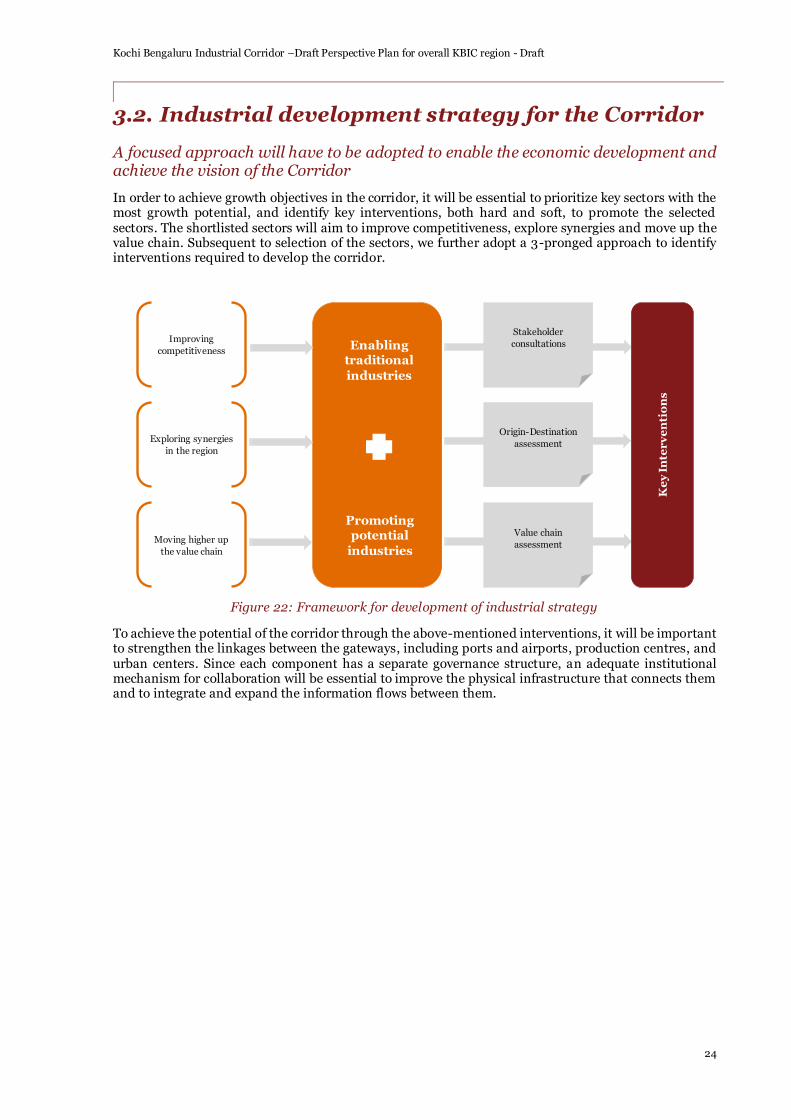
Kochi Bengaluru Industrial Corridor –Draft Perspective Plan for overall KBIC region - Draft
24
3.2. Industrial development strategy for the Corridor
A focused approach will have to be adopted to enable the economic development and achieve the vision of the Corridor
In order to achieve growth objectives in the corridor, it will be essential to prioritize key sectors with the most growth potential, and identify key interventions, both hard and soft, to promote the selected sectors. The shortlisted sectors will aim to improve competitiveness, explore synergies and move up the value chain. Subsequent to selection of the sectors, we further adopt a 3-pronged approach to identify interventions required to develop the corridor.
Figure 22: Framework for development of industrial strategy
To achieve the potential of the corridor through the above-mentioned interventions, it will be important to strengthen the linkages between the gateways, including ports and airports, production centres, and urban centers. Since each component has a separate governance structure, an adequate institutional mechanism for collaboration will be essential to improve the physical infrastructure that connects them and to integrate and expand the information flows between them.
Promoting potential
industries
Enabling traditional
industries
Improving
competitiveness
Exploring synergies
in the region
Moving higher up
the value chain
Stakeholder
consultations
Origin-Destination
assessment
Value chain
assessment
Ke
y I
nte
rv
en
tio
ns

Kochi Bengaluru Industrial Corridor –Draft Perspective Plan for overall KBIC region - Draft
25
3.3. Identification and prioritization of industries in the Corridor
Kerala has been a paradox of sorts with remarkable achievements in social and demographic sphere but slower growth in industrial development
Compared to the major industrial states in the county, Kerala contributes to ~1% of the country’s GVA.
Kerala has seen a structural transformation in its economy over the last 2 decades. From being a primarily agrarian economy with ~28%7 contribution to GSDP in 1990’s the state has evolved its secondary and tertiary sectors, as the primary sector share has fallen to ~12%.
Manufacturing in Kerala, although has grown over the decades, has not been able to match up to the Indian average and has been restricted to a few sectors
In 2015-16, secondary sectors contributed to 26.17%8 of the state’s GSVA at constant prices. Among its sub-sectors, construction was the highest contributor with about 15.03%9 followed by manufacturing and electricity, gas, water supply & other utility services. While, the secondary sector contribution is quite close to the country average of 28%10, at the national level the composition of such share is more skewed towards manufacturing followed by construction.
As per the Economic Review of Kerala, 2015-16, the manufacturing sector of Kerala grew by (at constant prices (2011-12)) 12.65%11 in 2015-16 as against 2.46%12 in 2014-15. The share of manufacturing sector in GSDP at constant in 2015-16 was 9.97%13.
7 Source: Structural transformation in Kerala’s economy: Is there any role of agriculture sector? 8 Source: Kerala Economic Review 2016 9 Source: Kerala Economic Review 2016 10 Source: Economic Survey of India 2016-17 11 Source: Kerala Economic Review 2016 12 Source: Kerala Economic Review 2016 13 Source: Kerala Economic Review 2016
Leather products
Textiles
Engineering
Agro based
Wood/wooden based furniture
Paper & Paper products
Mineral based
Metal based
Rubber, Plastic & petro based
Chemical/ Chemical based
Electrical machinery and transport equipment
Thrissur
Malappuram
Kozhikode
Palakkad
Idukki
Kottayam
Ernakulam
Alappuzha
Wayanad
Kasaragod
Kannur
Pathanamthitta
Thiruvananthapuram
Kollam
Figure 24: District wise major industrial sectors Source: DCMSME
Figure 23: Kerala’s contribution to India’s GVA vs major industrial states
Source: ASI
1%
21%
17%
9%6%
Kerala Maharashtra Gujarat Tamil Nadu Karnataka
C o n t r i b u t i o n T o C o u n t r y ' s G V A ( 2 0 1 4 - 1 5 )
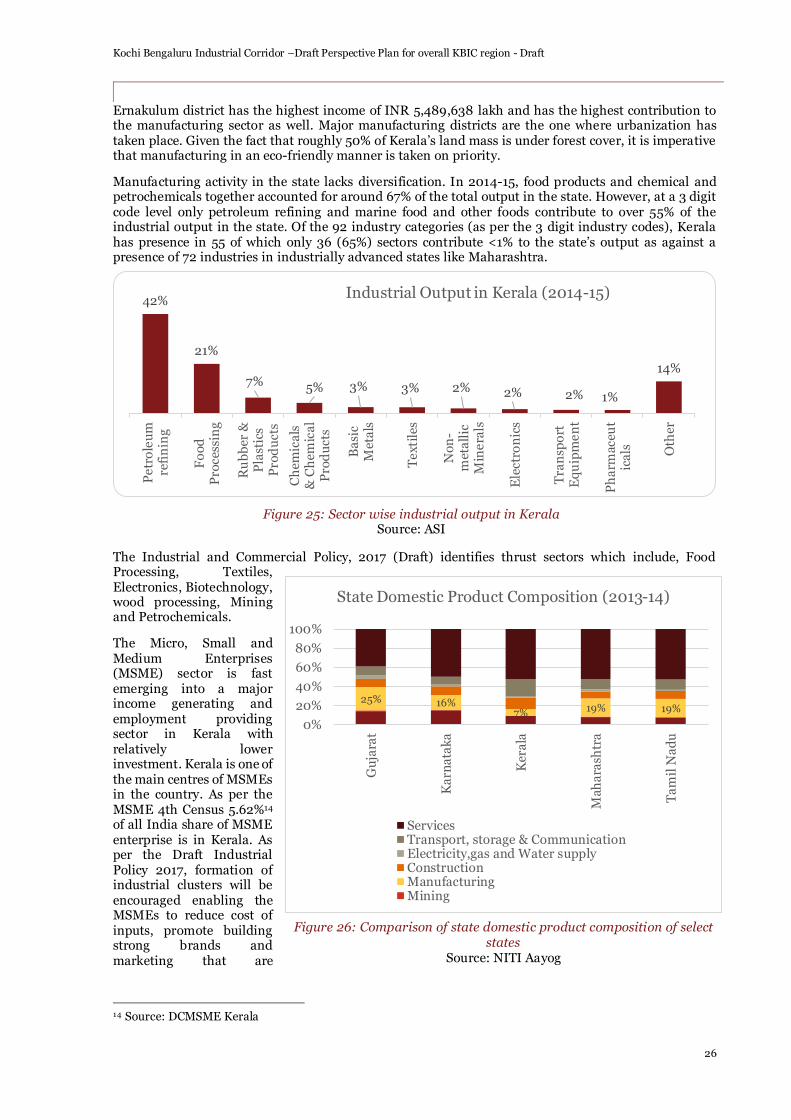
Kochi Bengaluru Industrial Corridor –Draft Perspective Plan for overall KBIC region - Draft
26
Ernakulum district has the highest income of INR 5,489,638 lakh and has the highest contribution to the manufacturing sector as well. Major manufacturing districts are the one where urbanization has taken place. Given the fact that roughly 50% of Kerala’s land mass is under forest cover, it is imperative that manufacturing in an eco-friendly manner is taken on priority.
Manufacturing activity in the state lacks diversification. In 2014-15, food products and chemical and petrochemicals together accounted for around 67% of the total output in the state. However, at a 3 digit code level only petroleum refining and marine food and other foods contribute to over 55% of the industrial output in the state. Of the 92 industry categories (as per the 3 digit industry codes), Kerala has presence in 55 of which only 36 (65%) sectors contribute <1% to the state’s output as against a presence of 72 industries in industrially advanced states like Maharashtra.
The Industrial and Commercial Policy, 2017 (Draft) identifies thrust sectors which include, Food Processing, Textiles, Electronics, Biotechnology, wood processing, Mining and Petrochemicals.
The Micro, Small and Medium Enterprises (MSME) sector is fast emerging into a major income generating and employment providing sector in Kerala with relatively lower investment. Kerala is one of the main centres of MSMEs in the country. As per the MSME 4th Census 5.62%14 of all India share of MSME enterprise is in Kerala. As per the Draft Industrial Policy 2017, formation of industrial clusters will be encouraged enabling the MSMEs to reduce cost of inputs, promote building strong brands and marketing that are
14 Source: DCMSME Kerala
Figure 25: Sector wise industrial output in Kerala Source: ASI
42%
21%
7% 5% 3% 3% 2% 2% 2% 1%
14%
Pe
tro
leu
mre
fin
ing
Fo
od
Pro
cess
ing
Ru
bb
er &
Pla
stic
sP
rod
uct
s
Ch
emic
als
& C
hem
ica
lP
rod
uct
s
Ba
sic
Met
als
Te
xtil
es
No
n-
met
all
icM
ine
rals
Ele
ctro
nic
s
Tra
nsp
ort
Eq
uip
me
nt
Ph
arm
aceu
tic
als O
ther
Industrial Output in Kerala (2014-15)
25% 16%7% 19% 19%
0%
20%
40%
60%
80%
100%
Gu
jara
t
Ka
rna
tak
a
Ker
ala
Mah
ara
shtr
a
Ta
mil
Na
du
State Domestic Product Composition (2013-14)
ServicesTransport, storage & CommunicationElectricity,gas and Water supplyConstructionManufacturingMining
Figure 26: Comparison of state domestic product composition of select states
Source: NITI Aayog

Kochi Bengaluru Industrial Corridor –Draft Perspective Plan for overall KBIC region - Draft
27
required to compete in the market.
Tamil Nadu has been the third largest contributor to India’s manufacturing output over the last decade
Tamil Nadu has consistently grown faster than India: its per capita GDP was 0.9 times that of India in 1980 and 1.4 times India’s in 2015. Like Gujarat, it has strong fundamentals such as skilled manpower, a favorable investment climate, and sound infrastructure.
The share of manufacturing in all-India GDP is around 14%. In Tamil Nadu, the contributions to GSDP of has slightly declined since 2005, with the GSDP share of manufacturing declining from around 20% in 2005 to around 19% in 2014. Manufacturing’s declining share of India’s nominal GDP between 2005 and 2015 confirms the classic Kuznets argument which states that as an economy develops its manufacturing share increases up to a critical value before declining as the services sector expands. However, in nominal terms, the share has come down from almost 20% to 15% in the same period. This implies that the state’s overall economic growth outpaced growth in manufacturing. In fact, the implicit GDP deflator grew at 6.6% per annum, whereas manufacturing prices grew at 4.4% per annum in the last decade. This compares with services, where prices grew by 8.2% per annum. As a result, services share of GSDP in nominal terms went up from 57% to 65%. The relative decline in manufacturing demand—including export demand for apparel, textiles, and leather products—can explain some of the decline in manufacturing’s share of GSDP. Similar declines have been seen in across all major industrial states (Maharashtra, Gujarat, and Karnataka), where manufacturing shares of GSDP fell 3–5 percentage points between 2005 and 2014.
The output share of registered manufacturing in Tamil Nadu in 2005 was around 60% of total manufacturing output, with the unorganized segment of manufacturing contributing around 40%. By 2015, the share of registered manufacturing had increased to around 71%, driven by output growth that more than doubled the pace of growth in unregistered manufacturing output.
Using a comprehensive approach, a combination of traditionally strong sectors and sectors with high potential have been selected as priority sectors
To identify priority sectors for manufacturing within the corridor, an assessment of the performance of industries in Kerala and Tamil Nadu was undertaken. The study team also reviewed the current and predicted performance of sectors at the national and global levels to identify trends that might impact the future. Subsequently the team conducted extensive stakeholder consultations, both private and public sector, to understand the potential and performance of the sectors.
Through this amalgamation of quantitative and qualitative approach, we identified sectors that are well established in the state and will continue to drive manufacturing sector growth in future (“what is”) and sectors which have strong potential for driving manufacturing growth in the corridor if adequately facilitated (“what could be”).
Sectors shortlisted for support within the corridor will have specific roles in the development of the manufacturing sector landscape of corridor and are expected to contribute to overall economic development.
The following figure summarizes our approach towards identifying priority sectors for the corridor.

Kochi Bengaluru Industrial Corridor –Draft Perspective Plan for overall KBIC region - Draft
28
To shortlist priority sectors, a total score across key performance indicators under each objective was used to identify the top sectors under each category. The sectors with highest total scores were discussed with the stakeholders to review their performance and feasibility.
During shortlisting of industries, we have limited our selection to minimally polluting industries to align the corridor development strategy with Kerala’s overall environmental sustainability plan.
Figure 27: Framework for identification of priority sectors
Shortlisting of Sectors – 2 Pronged Approach
Sectors where theCorridor can diversify
Traditionally strongsectors
High value addition
High growth - India
Complement existing
potential
Manufacturing output
Investment quantum
Employment potential
Govt. thrust sectors
1 4Traditionally strongMSME sectors
Export potential
2
Regional synergy
Investment quantum
Employment potential
3
Where we are Where we could be
Stakeholder consultations
Output & Export
competitiveness
Shortlist of sectors at 2-digit level
Government
departments
Private players
Industry
associations
Logistics players
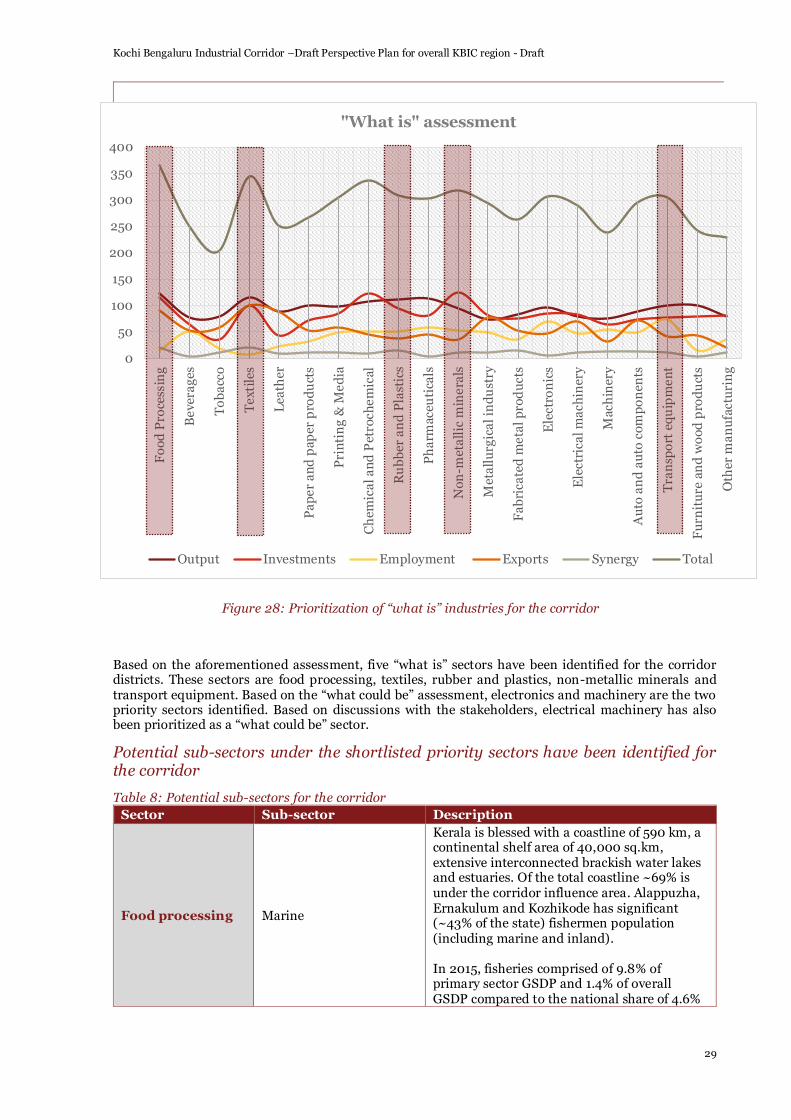
Kochi Bengaluru Industrial Corridor –Draft Perspective Plan for overall KBIC region - Draft
29
Based on the aforementioned assessment, five “what is” sectors have been identified for the corridor districts. These sectors are food processing, textiles, rubber and plastics, non-metallic minerals and transport equipment. Based on the “what could be” assessment, electronics and machinery are the two priority sectors identified. Based on discussions with the stakeholders, electrical machinery has also been prioritized as a “what could be” sector.
Potential sub-sectors under the shortlisted priority sectors have been identified for the corridor
Table 8: Potential sub-sectors for the corridor
Sector Sub-sector Description
Food processing Marine
Kerala is blessed with a coastline of 590 km, a continental shelf area of 40,000 sq.km, extensive interconnected brackish water lakes and estuaries. Of the total coastline ~69% is under the corridor influence area. Alappuzha, Ernakulum and Kozhikode has significant (~43% of the state) fishermen population (including marine and inland). In 2015, fisheries comprised of 9.8% of primary sector GSDP and 1.4% of overall GSDP compared to the national share of 4.6%
0
50
100
150
200
250
300
350
400F
oo
d P
roce
ssin
g
Be
vera
ges
To
ba
cco
Te
xtil
es
Lea
ther
Pa
pe
r a
nd
pap
er p
rod
uct
s
Pri
nti
ng
& M
ed
ia
Ch
emic
al
an
d P
etro
che
mic
al
Ru
bb
er a
nd
Pla
stic
s
Ph
arm
aceu
tica
ls
No
n-m
eta
llic
min
era
ls
Met
all
urg
ica
l in
du
stry
Fa
bri
cate
d m
eta
l p
rod
uct
s
Ele
ctro
nic
s
Ele
ctri
cal
ma
chin
ery
Mac
hin
ery
Au
to a
nd
au
to c
om
po
nen
ts
Tra
nsp
ort
eq
uip
me
nt
Fu
rnit
ure
an
d w
oo
d p
rod
uct
s
Oth
er m
an
ufa
ctu
rin
g
"What is" assessment
Output Investments Employment Exports Synergy Total
Figure 28: Prioritization of “what is” industries for the corridor

Kochi Bengaluru Industrial Corridor –Draft Perspective Plan for overall KBIC region - Draft
30
Sector Sub-sector Description
and 0.8% respectively15. Marine products also form a major export commodity from Kerala which accounts to 16% of India’s share by quantity and 15% by value16. Currently, the exports are dominated by frozen shrimps, cuttle fish and squid. Pre-processing and processing of marine products is a potential sector in the corridor
Grain mills
The districts of the corridor are endowed with major production centres including rice, maize etc. Palakkadan Matta rice, Kerala Red rice, or Red parboiled rice) is an indigenous variety of rice grown in Palakkad District of Kerala. It is different from brown rice. Palakkadan Matta rice has acquired the Geographical Indication (GI) tag, which brings uniqueness to the production of rice. Manufacturing of grain mill products including manufacturing of flour mixes, blended flour, dough for bread, cakes and biscuits, readymade mixed powders etc. can be promoted in the corridor.
Other food products
The food processing industry in India is one of the biggest in terms of production, growth, consumption and export, Both the corridor states have also identified this as a priority sector and are setting up mega food parks to promote the same. With abundance of raw materials, the corridor can focus on promoting processed food like bakery goods (bread, biscuits etc.), packaged food, prepared meals, products from sugarcane (abundantly available in corridor districts like Coimbatore, Dharmapuri, Erode etc.)
Textiles
Spinning and weaving Tamil Nadu consumes more than 37% of national cotton production and is a leader in exports of textile products17. The state is one of the largest exporters of textile products—exporting more than 21% of national cotton-based exports including yarn, fabric, and apparels—and is the largest consumer of cotton in the country. Tiruppur is the textiles hub of India with more than 5,000 garment manufacturing and job work units, and one of the most organized processing and finishing garment clusters in India. The textiles industry in Tiruppur contributes about 80% to India’s hosiery exports18.
Wearing apparel
15 Source: Kerala Marine Fisheries Statistics 2015 16 Source: Kerala Marine Fisheries Statistics 2015 17 Cotton Corporation of India. 2014-15 18 Annual Survey of Industries 2012

Kochi Bengaluru Industrial Corridor –Draft Perspective Plan for overall KBIC region - Draft
31
Sector Sub-sector Description
The major cluster of Tiruppur is facing severe land, water, and urban pollution issues, which are impacting the growth of the cluster. Several dyeing and knitting units are using conventional technologies, leading to significant water pollution in the area and excessive energy consumption. Stakeholder consultations revealed that for future industrialization, desalination projects will be required to meet the demand of this water-intensive sector.
Rubber and plastics
Rubber
Kerala and Tamil Nadu have been designated as the traditional rubber producing states by Rubber Board of India. Kerala produces ~70% of the country’s natural rubber. Geographically, the main rubber clusters Are concentrated in Kottayam, Ernakulum, Alappuzha, Thrissur, Palakkad, Malappuram and Kozhikode. India’s automobile industry contributes to nearly 22% of the country’s manufacturing GDP and has been steadily growing over the last years. In FY 17, the industry registered a growth of 5.1%19. Tamil Nadu is one of the largest hubs for OEMs in India housing major players like BMW, Force Motors, Hyundai, Ashok Leyland, Hindustan Motors, Renault, Nissan, Ford, and Mitsubishi in the 4-wheeler and multi-axel vehicle space; and firms like TVS and Royal Enfield in 2-wheeler space. The “Automotive Mission Plan 2016-2026” estimates the automotive industry to grow at 13% (base case) and 15% (optimistic case). The tyre industry is an integral part of the automotive industry and thus can be expected to grow at a commensurate rate. Tyre manufacturing has a high manufacturing value addition of 21.5% as against a median of 14% for the manufacturing industry20. In 2017-18, a little over 69% of the total rubber (natural and synthetic) consumption in India is consumed by the auto tyre manufacturers (a Y-o-Y growth of 7.5%)21. The Corridor with its natural resources and a well-developed market can promote tyre manufacturing in the region.
Plastics
Fundamentally, PVC is a synthetic resin made from the polymerization of vinyl chloride. It is the third largest plastic in production and consumption. PVC, combined with additives,
19 Source: Bloomberg 20 Source: Automotive Tyre Manufacturers ‘ Association (ATMA) 21 Source: Rubber Board
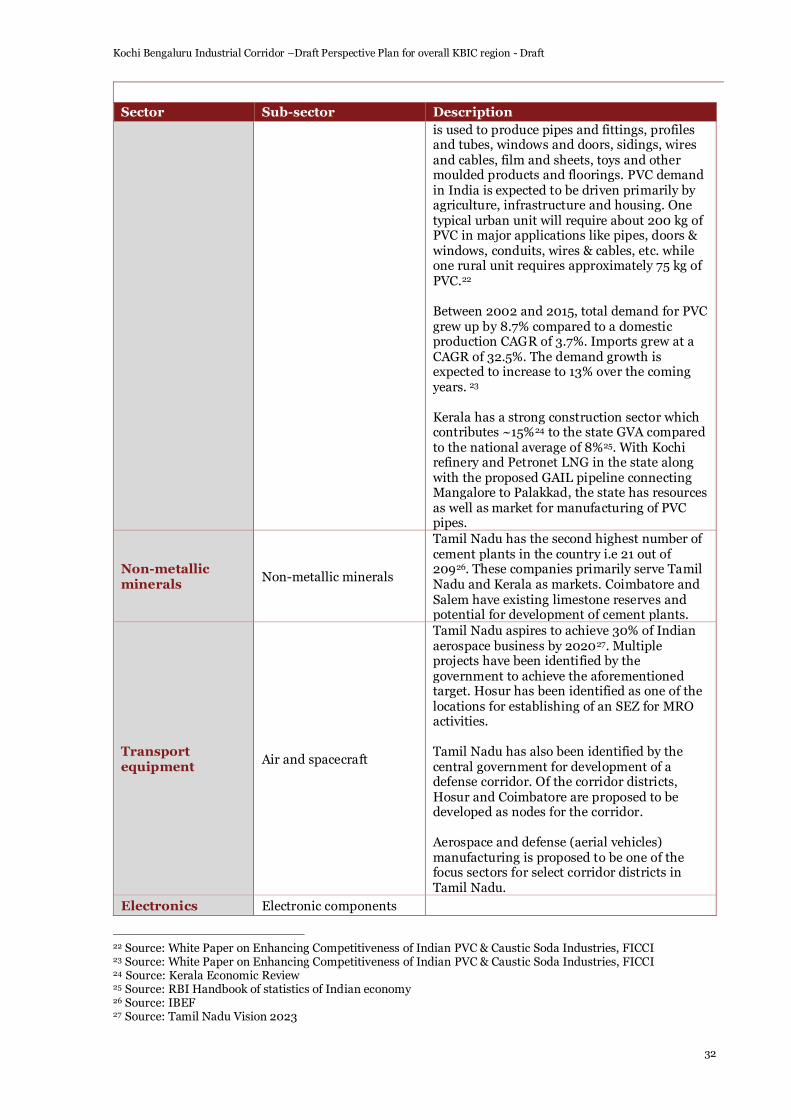
Kochi Bengaluru Industrial Corridor –Draft Perspective Plan for overall KBIC region - Draft
32
Sector Sub-sector Description
is used to produce pipes and fittings, profiles and tubes, windows and doors, sidings, wires and cables, film and sheets, toys and other moulded products and floorings. PVC demand in India is expected to be driven primarily by agriculture, infrastructure and housing. One typical urban unit will require about 200 kg of PVC in major applications like pipes, doors & windows, conduits, wires & cables, etc. while one rural unit requires approximately 75 kg of PVC.22 Between 2002 and 2015, total demand for PVC grew up by 8.7% compared to a domestic production CAGR of 3.7%. Imports grew at a CAGR of 32.5%. The demand growth is expected to increase to 13% over the coming years. 23 Kerala has a strong construction sector which contributes ~15%24 to the state GVA compared to the national average of 8%25. With Kochi refinery and Petronet LNG in the state along with the proposed GAIL pipeline connecting Mangalore to Palakkad, the state has resources as well as market for manufacturing of PVC pipes.
Non-metallic minerals
Non-metallic minerals
Tamil Nadu has the second highest number of cement plants in the country i.e 21 out of 20926. These companies primarily serve Tamil Nadu and Kerala as markets. Coimbatore and Salem have existing limestone reserves and potential for development of cement plants.
Transport equipment
Air and spacecraft
Tamil Nadu aspires to achieve 30% of Indian aerospace business by 202027. Multiple projects have been identified by the government to achieve the aforementioned target. Hosur has been identified as one of the locations for establishing of an SEZ for MRO activities. Tamil Nadu has also been identified by the central government for development of a defense corridor. Of the corridor districts, Hosur and Coimbatore are proposed to be developed as nodes for the corridor. Aerospace and defense (aerial vehicles) manufacturing is proposed to be one of the focus sectors for select corridor districts in Tamil Nadu.
Electronics Electronic components
22 Source: White Paper on Enhancing Competitiveness of Indian PVC & Caustic Soda Industries, FICCI 23 Source: White Paper on Enhancing Competitiveness of Indian PVC & Caustic Soda Industries, FICCI 24 Source: Kerala Economic Review 25 Source: RBI Handbook of statistics of Indian economy 26 Source: IBEF 27 Source: Tamil Nadu Vision 2023

Kochi Bengaluru Industrial Corridor –Draft Perspective Plan for overall KBIC region - Draft
33
Sector Sub-sector Description
Strategic electronics With the defense corridor proposed in Tamil Nadu, there is an expected growth in demand for precision engineering (including electronics, machinery and electrical machinery). The Defense Offset policy (implemented by the Defense Offset Facilitation Agency) mandates that any defense purchase valued over USD 600 Million must have a local component of 30%. This will drive opportunities for Indian players. Nanotechnology is gradually being adopted in medical electronics in India. Thus medical equipment manufacturing will also require advanced precision manufacturing over the upcoming years. Kerala with an abundance of skilled manpower and a growing destination for IT/ITeS can be expected to develop this sector.
Machinery General and special purpose machinery
Electrical machinery
Electric motors, generators, transformer
3.4. Mapping industries to the IMCs
The intersection of IMC characteristics and industries’ Factors of Production requirements establish the potential industries at proposed IMCs. Prioritization and mapping of industries for the IMCs is based on factors of production that drive value chains. This exercise has been carried out by mapping the profile of each IMC with six key factors of production across potential priority sub-sectors. The availability of factors of production is essential for industrial development at the district and IMC levels. The six key factors of production include land intensity, energy intensity, water intensity, raw material/ market proximity (domestic), gateway proximity (exports and imports) and urban proximity (labour/ market).
Land intensityEnergy
intensityWater intensity
Raw material/ Market
proximity (Domestic)
Gateway proximity (Exports & Imports)
Urban proximity (labour/ market)
Marine
Grain mills
Other foods
Spinning & weaving
Wearing apparel
Rubber
Plastics
Non-metallic minerals
(Cement)
Air and spacecraft
Electronic components
Strategic electronics
Machinery
Electric motors, generator,
transformer
Low Importance Moderate Importance Critical Importance
Figure 29: Factors of production for the priority industries

Kochi Bengaluru Industrial Corridor –Draft Perspective Plan for overall KBIC region - Draft
34
Mapping industry enablers across sectors and IMC will give a detailed perspective of the potential industries in the proposed priority nodes. We have mapped the priority sub-sectors to the priority nodes with respect to the eight industry enablers. High-tech and value-added sectors are concentrated largely in the priority IMC (Palakkad) given the existing industrial ecosystem, proximity to gateways (Kochi port, Kochi airport and Coimbatore airport) and urban centres (Coimbatore).

Kochi Bengaluru Industrial Corridor –Draft Perspective Plan for overall KBIC region - Draft
35
3.5. Potential of services sector development in the Corridor
Services sectors, in both Kerala and Tamil Nadu, has grown significantly over the years and constitute a large share of the GDP contribution and employment in the states
The tertiary sector contributes 64% in the Kerala KBIC economy, up from 57% in the last 5 years. Trade, hotels and restaurants is one of the major services which contributes around 17% (same as Real estate) of the total GSVA of the KBIC districts in Kerala.
In Tamil Nadu, the tertiary sector contributes to 57% of the total GDP of the state which is much higher than the national average of 53%. While Chennai is the main hub for IT & ITeS industry, Coimbatore has gradually been seeing growth in IT sector and is forming a spoke for the hubs at Chennai and Bengaluru.
Compared to the national average, employment in services sector (Code 6: Wholesale and retail trade; repair of motor vehicles and motorcycles; Transportation and storage; Accommodation and Food service activities; Information and communication, Code 7: Financial and insurance activities; Real estate activities ; Professional, scientific and technical Activities; Administrative and support service activities, Code 8: Public administration and defence; compulsory social security; Education; Human health and social work active; Arts, entertainment and recreation; Other service activities) has been significantly higher in Kerala and Tamil Nadu. Women employment in IT services in Kerala (2004) was ~40% compared to 24% in India.
With rising wages and education levels of its workforce, industries relying exclusively on cheap labour are
geadually shifting out of Kerala. When faced with similar challenges, economies like Singapore gradually shifted to services.
12%
24%64%
GDP composition - Kerala
12%
31%57%
GDP composition - Tamil Nadu Primary
Secondary
Tertiary
Figure 30: GDP composition of the Corridor states Source: State Economic Reviews/ Surveys
Figure 31: Employment in services Source: Employment survey
249
56
111
243
66
89
185
42
91
Code 6
Code 7
Code 8
Number of workers per 1000 (in services)
India Tamil Nadu Kerala

Kochi Bengaluru Industrial Corridor –Draft Perspective Plan for overall KBIC region - Draft
36
Information Technology: Over the years, the traditional industries in Kerala particularly coir, handloom, Khadi, bamboo-based, handicrafts, artisanal and cottage industries etc. have been plagued by the problems of high cost production, low quality, inappropriate technology and incapacity for professional marketing and export. Knowledge-based and skill-intensive economic activities can be developed in a more diffused pattern across Kerala.
While Kerala has turned into a favourable IT destination over the
years, it still has a nominal share in the overall software export of India. But if its CAGR of exports is compared with that of prominent IT exporting states, Kerala has a similar growth rate.
Kerala government has launched a number of initiatives to bolster the development of IT sector. Developing the IT/ ITeS sector would enable creating employment opportunities for literate workforce. Few of the initiatives by the Government to promote IT in the state include Kerala State Information Technology Mission (KSITM), IIITM- K, Technopark, Cyberpark, Infopark, KSITIL, ICFOSS, Kerala Start-up Mission.
With changing landscape of the industry, Tier II and Tier III cities have been gaining demand courtesy labour availability, affordable real estate (available built-up space), SEZ schemes etc. Chennai and Bengaluru are the two leading IT hubs in India. However they are reaching a saturation level. Thiruvananthapuram, Kochi and Kozhikode are currently the major IT hubs in Kerala. With airport connectivity (upcoming and existing) and urban proximity, Kannur and Coimbatore can be positioned as satellite locations for the major IT hubs of the Southern India. Cyberpark, Kannur is proposed by the government. for the overall development of IT industry in Malabar region. IT companies have also started setting up in Coimbatore as a satellite city.
Fast growing sectors like knowledge services, cloud-based services, infrastructure outsourcing, software testing etc. can be explored as a part of the corridor.
Research and development (R&D): A knowledge based economy strives to create, disseminate and diffuse information and knowledge. A critical element of the success of a knowledge economy is an effective innovation system of firms, research centres, universities, consultants and other organizations that can keep up with the knowledge revolution, tap into the growing stock of global knowledge and assimilate and adapt it to local needs.
Innovation and production are intertwined. R&D will play a critical role in fostering manufacturing in the corridor region as well as the country. For instance, South Korea’s per capita GDP grew by 20 times between 1963 and 2013. The nation achieved this growth in part by developing the manufacturing capabilities essential for high-tech industries. This shift to high tech industries was highly supported by R&D in the nation. In the 1960s and 1970s, South Korea began enhancing its domestic manufacturing capabilities through methods such as reverse engineering and foreign licensing. At the same time, the South Korean government and private sector invested in the capabilities needed to absorb the new technology.
0.45 0.41 0.64 0.68 0.63
9.3 10 11 12.3 13.4
23.128.2 28.7 29.5
32.2
2010-11 2011-12 2012-13 2013-14 2014-15
Software/ IT Exports from states in Billion USD
Kerala Tamil Nadu Karnataka
6.62%
7.58%
6.87%
Kerala Tamil Nadu Karnataka
5-year CAGR comparable with IT dominant states
Figure 32: State-wise software exports Source: State Economic Reviews/ Surveys
Figure 33: Performance wrt other major IT states
Source: State Economic Reviews/ Surveys

Kochi Bengaluru Industrial Corridor –Draft Perspective Plan for overall KBIC region - Draft
37
With high levels of literacy, significant talent pool in IT and engineering, airport connectivity, cost effectiveness, quality of life etc., the corridor can focus on establishing R&D centres to support the manufacturing base in the region. R&D units in sectors like precision engineering (electronics, electrical, machinery), biotechnology, agriculture (including coir and rubber) can come up in the corridor.
As a significant step towards developing Kerala as an R&D centre, Nissan motors will set up its first and only digital innovation hub at Thiruvananthapuram. I t will function as the nerve centre of the company’s research in electric and automated vehicles and host a team of engineers and scientists to design innovations in automated and electronic vehicles space. The research and development work will focus on Artificial Intelligence, cognitive analytics, machine learning and other digital technologies.
Logistics: Logistics plays an important role in the economy. It enables the effective forward and reverse flow of goods and services between origin and the recipient. Logistics has an impact on the shipment of goods and how quickly they can get to the consumer, thus adding a competitive edge to other businesses. With growth of manufacturing in the region, the demand for logistics services ranging from packaging to warehousing is expected to grow.
Other services: Fashion is one of the fastest growing and most dynamic industries in the world today. It is only one of the major contributors of India’s exports. Delhi, Mumbai, Tirupur, Bengaluru and Chennai are the five major garment production hubs, producing exclusively for the exports market. Fashion and textile designing services can potentially be promoted in the corridor region. However, skill development will be essential for these services.
India is the largest gems and jewelry market in the world. The jewelry industry is rapidly booming. With new styles in constant demand, jewelry design is becoming a challenging and lucrative profession. Districts in the corridor like Coimbatore specialized in casting jewelry, Thrissur specializes in lightweight gold and diamond cutting. To support these industry, jewelry designing services can be promoted in the corridor.
Figure 34: Manufacturing and Innovation in South Korea

Kochi Bengaluru Industrial Corridor –Draft Perspective Plan for overall KBIC region - Draft
38
3.6. Industrial development strategy of Palakkad IMC
Considering the growing national and global competitive environment, it is important to enhance key strength as the driver of the IMC development and realize a competitive IMC. Node vision is structured in line with areas to be strengthened for increasing competitiveness of the node for industry promotion.
As a first step, SWOT analysis on the IMC is conducted based on inputs on existing and potential infrastructure and industries at the IMC. For a second step, industries based on possible competitive edge for the node is identified.
3.6.1. Unique Selling Proposition of Palakkad IMC
The IMC’s Unique Selling Proposition is its proximity to the Coimbatore city, the existing industrial and commercial eco-system in the vicinity including new planned developments like mega foodpark etc., availability of skilled and technical manpower with institutes of the caliber of IIT.
The IMC is in proximity to large heavy equipment and defence manufacturer like BEML and within less than 40 kms of Coimbatore which is proposed to be developed as a nodes for the Tamil Nadu Defence Corridor. Palakkad- Thrissur has major potential to develop as the industrial hub for precision engineering sector companies. Availability of quality manpower also provides an advantage for development of a robust services ecosystem to support manufacturing growth in the region.
The following matrix summarizes current strategic positioning of the IMC with analysis of the strength, weakness, opportunity and threat. It is useful for evaluating development potential of the region which could provide direction to the future vision and strategy for the further development.
Table 9 SWOT assessment of Palakkad IMC
Advantages Challenges
Inte
rna
l
Strength:
⚫ Proximity to Coimbatore ⚫ Proximity to diverse industrial
clusters around the IMC ⚫ Stable energy supply availability ⚫ Availability of natural gas due to GAIL
pipeline ⚫ Existence of development plan of
defense industries in Palakkad – KINFRA Defence Park at Ottapalam
⚫ Existing residential and social facilities in the urban centre
Weakness:
⚫ High cost of land compared to neighboring industrial clusters in Tamil Nadu
⚫ Environmental sensitivity of IMC sites requiring certain environmental clearances
⚫ Limitation of surface and ground water resources
⚫ Necessity of logistics facilities to enable multi-modal transfer of industrial goods
Ex
tern
al
Opportunity:
⚫ Availability of technical work force from Palakkad
⚫ Growing interest of investors in sectors like defence due to initiatives of central government
⚫ Enhancing competitiveness of existing industries, especially through infrastructure development in exiting industrial areas
⚫ Improving logistics facilities around the node region to enable local domestic distribution networks
Threat:
⚫ Immediate competition from neighboring industrial areas like Coimbatore
⚫ Possibility of cost elevation for land acquisition due to dissemination of the KBIC Plan

Kochi Bengaluru Industrial Corridor –Draft Perspective Plan for overall KBIC region - Draft
39
3.6.2. Focus sectors for Palakkad IMC
The consultant has selected sectors in Palakkad IMC that are also the focus sectors for entire KBIC
region. The consultant also assumed that basis of industrial development will be formed by the sectors
traditionally present in Palakkad district for which the district offers certain factors of production and
which also form a part of KBIC region focus sectors. Of the “where to be” sectors identified for KBIC
region, some sectors will enjoy ease in creation of FoPs in the IMC due to its locational advantages. Based
on stakeholder interactions, the consultant has also taken into consideration availability / requirement
for factors of production pertaining to each of the KBIC focus sectors.
Apart from manufacturing, services industries to support manufacturing in the region are also proposed to be developed in the IMC
3.7. Industrial development strategy of Dharmapuri-Salem IMC
Salem’s industrial portfolio includes large textile, automotive, poultry and sago industries. Also, Salem manufactures traditional silver anklets in large quantities. Salem’s mineral wealth includes the largest magnesite deposits in India. Dharmapuri district has abundance of natural resources like mango, coconut oil, seeds, tamarind, pulse, tapioca cultivation and cacoon. The district had traditional industries like silk reeling, silk twisting, rice milling, manufacturing of readymade garments, power looms, sugarcane crushing and tamarind processing.
With the existing traditional industries, Dharmapuri district has the immense potential of development of clusters value addition like processed food manufacturing and readymade garment manufacturing. Salem has been identified as one of the potential districts for industrial development by both central and state governments. The central government has proposed to develop a defence corridor in Tamil Nadu, with Salem as one of the nodes. This development in Salem will create opportunities for the MSMEs to manufacture various components and machineries for defence sector. The state government has also proposed to develop an industrial corridor connecting Coimbatore-Karur-Namakkal-Salem along with Chennai-Kanyakumari and Chennai-Bengaluru corridor.
The consultant has selected sectors in Dharmapuri-Salem IMC that are also the focus sectors for entire KBIC region. The consultant also assumed that basis of industrial development will be formed by the sectors traditionally present in the IMC districts for which the districts offers certain factors of production and which also form a part of KBIC region focus sectors. Of the “where to be” sectors identified for KBIC region, some sectors will enjoy ease in creation of FoPs in the IMC due to its locational advantages.
IMC Sector Sub-sector
Dharmapuri- Salem Food processing Grain mill and starch products
Textiles Spinning and weaving
Wearing apparel
Grain mills Food products Rubber (Tyre) Plastics (PVC)Precision
engineering and electronics
Research & Development
Designing -Fashion, Gem
Logistics

Kochi Bengaluru Industrial Corridor –Draft Perspective Plan for overall KBIC region - Draft
40
Electronics (including precision engineering)
Electronic components
Strategic electronics
3.8. Stakeholder consultations
Stakeholder consultations were undertaken to identify key issues faced by the existing industries in the corridor and with focus on existing Palakkad ecosystem. The key issues identified are:
Table 10: Key issues identified through stakeholder consultations
• The land lease policy of KSIDC and KINFRA allows land lease for only 30 years as against 99 years in
other major manufacturing states
• The land prices inside industrial estates of KSIDC and KINFRA is very high compared to parcels in nearby areas (even though there is no transfer of ownership in case of the estates)
• In case of changes in shareholding structure, units inside the industrial park have to pay the differential in land cost which increases their business cost
• Skill development across sectors is required to improve the quality of skilled, semi-skilled and unskilled
labors
• The industries incur cost and time in training hired employees
• Labor union issues is one of the deterrents for industries in Kerala
• Wages of labor from Kerala is higher compared to those from other states . Due to the union issues and high wage structure, industries prefer migrant labor
Land
Labor
• Development of cargo handling facilities and warehouses at railway stations/junctions in proximity to
large industrial cluster
• Utilization of Kochi port land for development of SEZ and warehousing facilities can be explored
• Development of cold storage facilities at Kochi port area to ensure competitive prices and avoid monopoly of private players
• The cost of road transport in Kerala is very high due the taxation structure and high labor charges
• Bypassing of urban areas on the stretch between Kochi to Trivandrum (via road) is required to reduce costs
Logistics
• Internal roads inside the industrial clusters in Kerala need to be improved and regularly maintained
• Common treatment plant facilities and lab testing facilities should be established within the industrial parks
• Rainwater harvesting is currently been undertaken by industries in Palakkad and can be a solution to water issues in the area
• Common generators/ separate sub-stations for industrial usage (not supplying to domestic consumers)
can improve power quality
• Delays in disbursement of subsidies applied. Currently, multiple follow ups are required with the
departments
• The industries are unaware of the existing single window systems and prefer meeting individual departments to expedite clearances
• Single window systems in industrial parks can be one of the incentives for setting up shop inside industrial estates in Kerala
Industrial
infrastructure
Ease of doing
business

Kochi Bengaluru Industrial Corridor –Draft Perspective Plan for overall KBIC region - Draft
41
3.9. Origin Destination Analysis
Geographical location and demographics of Kerala has played a big role in establishing industrial profile of Kerala since ancient times. In medieval time, Kerala emerged as a global spice trade hub and attracted various traders from Europe. Gradually with strategic partnerships and availability of long coastline the state emerged as one of the leading states of India in food processing. Proximity with Persian Gulf Malacca shipping line also makes Kerala an exciting option for moving out west moving cargo from India. Upcoming defense corridor in Coimbatore and Salem will also act as an important agent for industrial development in the region.
Food processing, textiles, rubber and plastics, non-metallic minerals, and transport equipment are the traditional sectors which were shortlisted. While, electronics, machinery, and electrical machinery were identified as emerging sectors in the Kochi Bengaluru Industrial Corridor. Following table shows the main raw material and final output of the identified sectors in KBIC:
Table 11: Raw Material and Output of the Shortlisted Industries in KBIC
Sector Sub-sector Raw Material Final Output Food processing Marine Squid, Prawn, Fish Frozen Marine Food
Grain mills Wheat Wheat Flours, Dough for Bread
Other food products Raw Cashew nut, Spices
Cashew Kernels, Ready to Eat Food
Textiles Spinning and weaving Yarn, Fiber Fabric
Wearing apparel Fabric Apparels
Rubber and plastics Rubber Latex Tyres, Gloves Plastics Polypropylene Packaging Material,
Pipes
Non-metallic minerals Non-metallic minerals
Limestone, Coal, Sand, Glass
Cement, Asbestos sheet, Glass Sheets, Tiles
Transport equipment Air and spacecraft Spare Parts, Crane Accessories
Aerial Vehicles, Transport Equipment
Electronics Electronic components
Electronic components Optical discs, Diodes, Capacitors, PCBs (Printed Circuit Board)
Strategic electronics Components Strategic Equipment Machinery General and special
purpose machinery Machinery Parts Textile Machinery,
Machineries Electrical machinery Electric motors,
generators, transformer
Transformer Parts Pumps, Transformers, Generators
Source: PwC Analysis, Stakeholder Consultation
Cochin Port and Cochin International Airport are the two major gateways in the region. Majority of the trade in KBIC happens using the Cochin Port. Cochin International Airport is used for high value and time sensitive cargo such as wearing apparels, food products. United Aram Emirates, China, Europe, and Saudi Arabia are the major trading countries from Kerala. Following table contains detail of major import export destinations of shortlisted sectors:
Table 12: Import Export Destination of Shortlisted Industries
Sector Import Destination Export Destination Dependency
Food Processing South East Asia, China, Middle East
Europe, Bahrain, UAE, Thailand, USA
Export
Textiles Cameroon, USA, China, Malaysia
Spain, China, Italy, USA, Middle East
Export
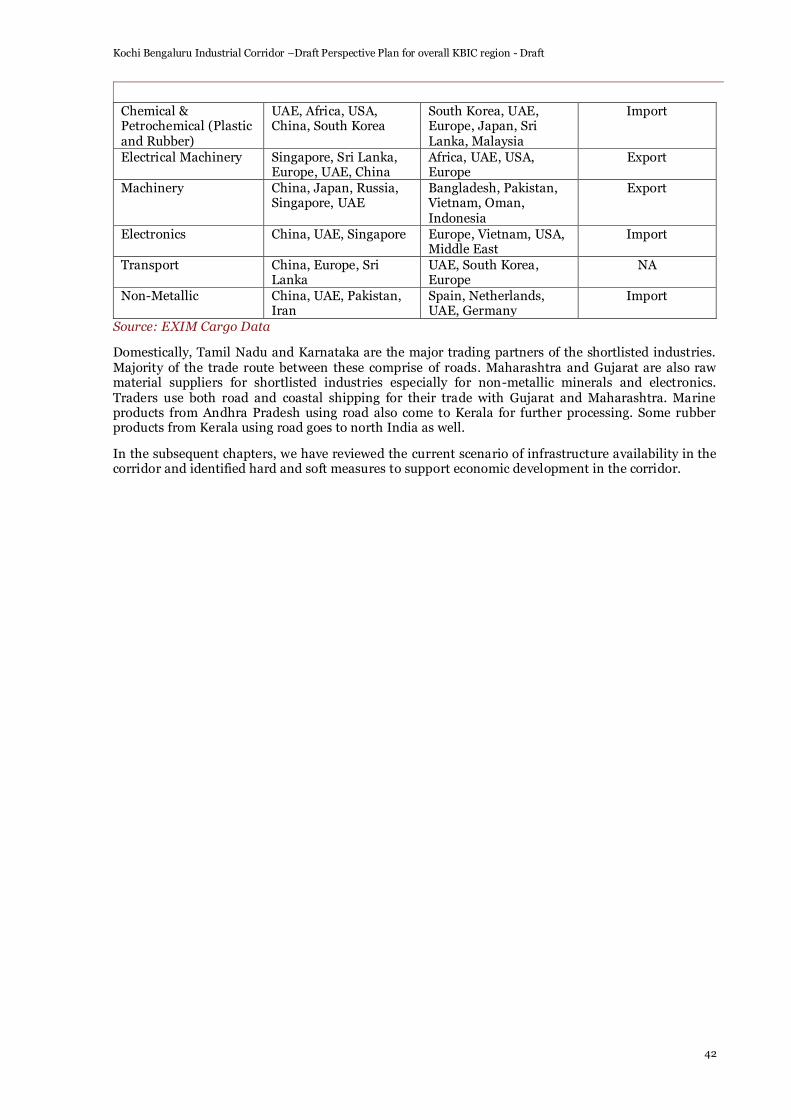
Kochi Bengaluru Industrial Corridor –Draft Perspective Plan for overall KBIC region - Draft
42
Chemical & Petrochemical (Plastic and Rubber)
UAE, Africa, USA, China, South Korea
South Korea, UAE, Europe, Japan, Sri Lanka, Malaysia
Import
Electrical Machinery Singapore, Sri Lanka, Europe, UAE, China
Africa, UAE, USA, Europe
Export
Machinery China, Japan, Russia, Singapore, UAE
Bangladesh, Pakistan, Vietnam, Oman, Indonesia
Export
Electronics China, UAE, Singapore Europe, Vietnam, USA, Middle East
Import
Transport China, Europe, Sri Lanka
UAE, South Korea, Europe
NA
Non-Metallic China, UAE, Pakistan, Iran
Spain, Netherlands, UAE, Germany
Import
Source: EXIM Cargo Data
Domestically, Tamil Nadu and Karnataka are the major trading partners of the shortlisted industries. Majority of the trade route between these comprise of roads. Maharashtra and Gujarat are also raw material suppliers for shortlisted industries especially for non-metallic minerals and electronics. Traders use both road and coastal shipping for their trade with Gujarat and Maharashtra. Marine products from Andhra Pradesh using road also come to Kerala for further processing. Some rubber products from Kerala using road goes to north India as well.
In the subsequent chapters, we have reviewed the current scenario of infrastructure availability in the corridor and identified hard and soft measures to support economic development in the corridor.
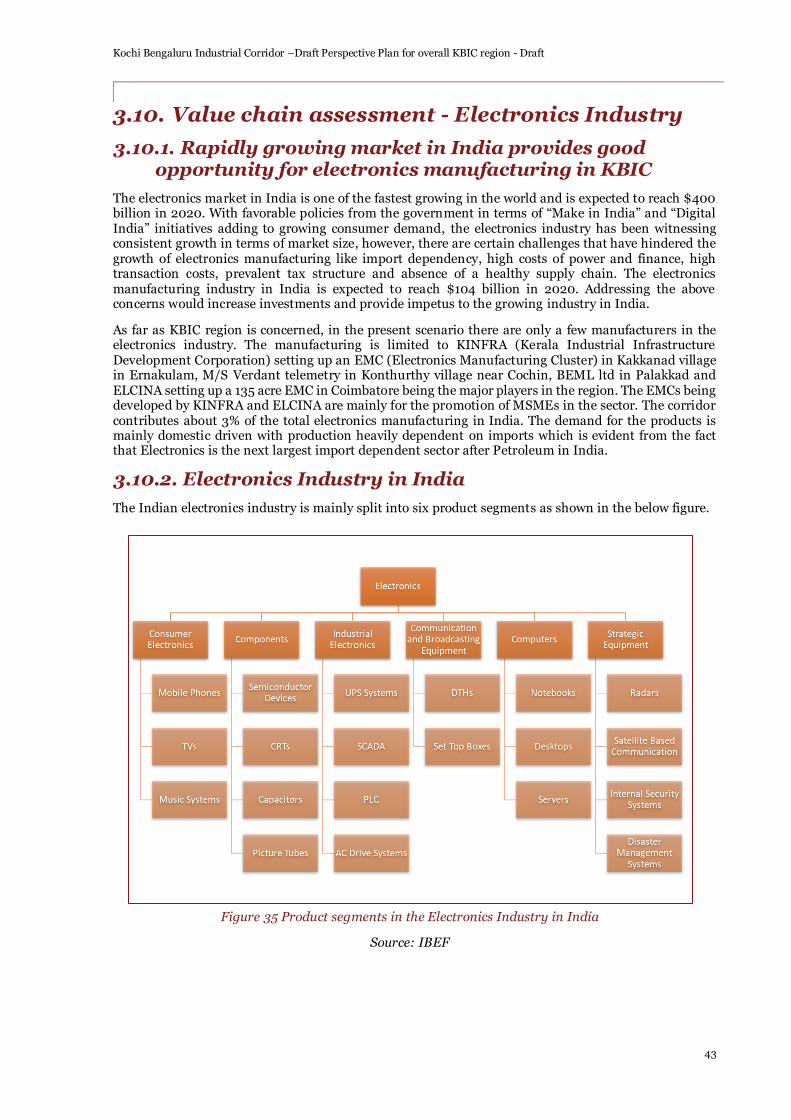
Kochi Bengaluru Industrial Corridor –Draft Perspective Plan for overall KBIC region - Draft
43
3.10. Value chain assessment - Electronics Industry
3.10.1. Rapidly growing market in India provides good opportunity for electronics manufacturing in KBIC
The electronics market in India is one of the fastest growing in the world and is expected to reach $400 billion in 2020. With favorable policies from the government in terms of “Make in India” and “Digital India” initiatives adding to growing consumer demand, the electronics industry has been witnessing consistent growth in terms of market size, however, there are certain challenges that have hindered the growth of electronics manufacturing like import dependency, high costs of power and finance, high transaction costs, prevalent tax structure and absence of a healthy supply chain. The electronics manufacturing industry in India is expected to reach $104 billion in 2020. Addressing the above concerns would increase investments and provide impetus to the growing industry in India.
As far as KBIC region is concerned, in the present scenario there are only a few manufacturers in the electronics industry. The manufacturing is limited to KINFRA (Kerala Industrial Infrastructure Development Corporation) setting up an EMC (Electronics Manufacturing Cluster) in Kakkanad village in Ernakulam, M/S Verdant telemetry in Konthurthy village near Cochin, BEML ltd in Palakkad and ELCINA setting up a 135 acre EMC in Coimbatore being the major players in the region. The EMCs being developed by KINFRA and ELCINA are mainly for the promotion of MSMEs in the sector. The corridor contributes about 3% of the total electronics manufacturing in India. The demand for the products is mainly domestic driven with production heavily dependent on imports which is evident from the fact that Electronics is the next largest import dependent sector after Petroleum in India.
3.10.2. Electronics Industry in India
The Indian electronics industry is mainly split into six product segments as shown in the below figure.
Figure 35 Product segments in the Electronics Industry in India
Source: IBEF

Kochi Bengaluru Industrial Corridor –Draft Perspective Plan for overall KBIC region - Draft
44
Consumer electronics has the largest share in production output among the segments followed by components manufacturing. The share of all product segments in terms of manufacturing is shown in the figure below.
Figure 36 Share of Product Segments in Manufacturing in India
Source: IBEF
3.10.3. Electronics Industry value chain structure
The following figure represents the value chain structure of the electronics industry.
Figure 37 Electronics Industry Value chain
Source: PwC Analysis
29.7%
21.1%20.9%
10.0%
9.9%8.3%
Consumer Electronics
Components
Industrial Electronics
Communication andBroadcasting Equipment
Computers
Strategic Equipment

Kochi Bengaluru Industrial Corridor –Draft Perspective Plan for overall KBIC region - Draft
45
The Indian market for electronic products is poised for significant growth in the next few years. The Indian electronics and hardware industry has grown at a CAGR of 16% during 2013-2018. Increasing demand of the electronics products market has started driving growth in the components industry as well. Local brands under the Make in India initiative and shifting of global OEMs from China to alternate locations such as India, due to mounting labor costs have continued to provide a strong platform for the Indian electronics industry to grow rapidly. This has presented the country with an opportunity to increase its manufacturing base by establishing backward linkages through the components industry. The next few years are crucial in this regard to drive investments in the industry backed by local demand. Currently value addition in electronic components is extremely limited as most of the raw materials are either imported or are purchased at a high cost. Increased dependence on imports from China will reduce value additions in India. The Indian electronics industry is currently limited to the manufacture of components mainly with extremely high import dependence to establish backward linkages. Presence of component assembly units have been increasing but there is no presence in the critical technologies thereby limiting innovation in the sector.
The increasing investments from OEMs in setting up units in India has been an encouraging trend in the industry coupled with increasing demand in the domestic market. In order to establish an efficient industry, the presence of backward and forward linkages in the domestic market plays a vital role. In terms of 3PL and 4PL players in the industry, India is well placed with the current infrastructure.
3.10.4. Key challenges in the electronics industry value chain in KBIC
The electronics industry in the KBIC region currently facing certain major challenges which is acting as an impediment to development of manufacturing infrastructure in the region.
1. Shortage of high-skilled labor: Limited number of quality institutions for skill development and preference of software and electronics engineers to work in the IT sector has led to shortage of high-skilled labor to operate high-end technology in the corridor.
2. Supply chain integration limited to downstream side of the value chain: The import dependence of the industry makes the supply chain relevance limited to raw material suppliers and component manufacturers. Lack of domestic sourcing limits the participation of original suppliers in the industry making it more dependent on traders who generally participate in value chain owing to their increased demand created by mainly MSMEs in the industry due to cost effectiveness. The import dependency of the sector is currently at ~60% which in a BAU scenario will increase to ~74% in 2020 as per the Ministry of Commerce and Industry.
3. Land availability: Constraints in land availability in the corridor has led to OEMs and major supplier investments moving to Maharashtra and Karnataka as these states have a much stronger consumer base.
4. Infrastructure constraints: Stakeholder consultations with electronic industries revealed following key issues:
• Shortage and low quality of power leading to production losses
• Road network with gateway connectivity to Cochin port are congested which restrict
seamless movement of cargo
5. Lack of R&D: Research and development in the electronics industry is mainly limited to larger
players. The electronics industry in the KBIC region is dominated by MSMEs whose businesses
are predominantly in the area of component assembly and hence not much focus is accorded to
research and development.

Kochi Bengaluru Industrial Corridor –Draft Perspective Plan for overall KBIC region - Draft
46
3.10.5. Growing industrial consumer base and large scale modernization in India’s defense forces will drive the demand for electronics manufacturing in KBIC
The electronics industry in the KBIC region is dominated by a few large government facilities and mostly MSMEs. The industry though at its nascent stage currently in Kerala, is growing at a rapid pace. In addition to meeting domestic demand, the exports from the region have been rising. Between 2011 and 2015, electronic hardware exports from Cochin Special Economic Zone have grown at a CAGR of 8.86% to reach US$ 76.8 million. As per Budget 2017-18, $240.89 million is allocated for mega projects in the state, which include Kochi Electronic Hardware Park. The electronic hub proposed at Kochi is an ambitious project of the Government of Kerala to promote electronic hardware manufacturing and assembling units and R&D centers, and support infrastructure for the same. The current key players in the region and their manufacturing details are listed in the table below. Apart from the above there are around 200 firms located in CHIL SEZ, Coimbatore specializing in component manufacturing, consumer electronics and strategic equipment manufacturing fields. The composition of these firms is mainly dominated by MSMEs and a few large manufacturing units. The opportunities for KBIC lie in the domestic as well as export markets. In the following sections we have discussed the opportunities in KBIC in the electronics industry value chain.
3.10.6. Origin-Destination analysis for Electronics sector in KBIC
The Origin-Destination matrix for electronics sector for KBIC provide an understanding that the sector is dependent more on the domestic market demand rather than exports. Also, the sector is highly import dependent in terms of backward as well as forward linkages; however there is potential for domestic manufacturing with significant input sources located in domestic market.
Table 14: Origin Destination Matrix for KBIC Electronics Sector
Domestic Origin (KBIC
as Destination)
Domestic Destination
(KBIC as Origin)
Domestic Transport
Mode
Import Origin (KBIC
as destination)
Export Destination
(KBIC as origin)
Overseas Transport
Mode
Tamil Nadu Tamil Nadu Road (Non-container)
China China Sea (container)
Maharashtra Karnataka Road (container)
S. Korea USA Sea/Air
• Keltron is a state-owned electronics enterprise, having 10 manufacturing centres in Kerala.The company’s products span categories including aerospace, surveillance systems, transportation systems, strategic electronics electronic components and TE units.
Keltron
• BEML is an Indian public sector undertaking having a unit at Palakkad. The units products include strategic electronics products for the defence sector.
BEML
• Traco Cable Company Limited manufactures high-quality cables and wires. TRACO currently meets the needs of public sector undertakings in India such as railways and the electricity boards of various states. The company is headquartered in Kochi and has factories in Ernakulam, Kannur and Thiruvalla.
Traco Cable Co. Ltd
• Verdant is a dedicated designer and manufacturer of antennas and radomes, specialising in airborne application. The company is headquartered in Kochi.
M/s Verdant Telemetry
Table 13: Major players in Electronics manufacturing in KBIC

Kochi Bengaluru Industrial Corridor –Draft Perspective Plan for overall KBIC region - Draft
47
Karnataka Andhra Pradesh Road (Non container)
Japan Germany Sea/Air
Source: PWC Analysis
3.10.7. Electronics industry in KBIC has good potential in components and strategic equipment manufacturing
Electronics is domestic market demand driven with substantial import dependency though the firms in the KBIC region contribute to exports as well. The electronics industry in KBIC has big opportunities in two areas (i) Component Manufacturing (ii) Strategic Equipment.
3.10.7.1. Opportunities in component manufacturing
The electronic components market can be broadly categorized as shown in the table below.
Table 15: Products categories in the Components Manufacturing industry
Product Category Product Type
Passive Components Capacitors, resistors, wound components and crystals
Active Components Diodes, transistors, ICs and LEDs
Electromechanical Components
PCBs, switches, relays, cables and connectors
Associated Components Optical discs, magnets, RF tuners, heat-sinks, magnetrons, magnetic tapes, etc.
Source: PWC Analysis
The Indian electronic components manufacturing industry had a market size of $ 7.5 billion in FY 2016-17 and is expected to reach $ 8.5 billion in FY 2017-18, growing at a rate of 15% year on year. The Indian market is dominated by electromechanical components which account for almost 30% of the demand followed by passive components. However, there has been significant growth in active and associated components as well in the past few years.
There is a huge demand supply gap in this sector in the Indian market. Currently in order to meet the growing demand in the industry, 95% of active components, 50% of passive components and 30% of electromechanical components are being imported. In total around 70% of electronics components is currently being imported in India with only 30% being produced indigenously. These imports currently come from China, Taiwan, South Korea and Japan. The imports are higher in case of specialized and precision components such as ICs, chip components, PCBs, LEDs, etc. The components being manufactured in India include cables, speakers, CRTs, etc. which are also being exported to other countries.
The demand for components is highest from the industrial electronics segment in India. This is followed by consumer electronics and the LED lighting industry. In addition, these is expected to be substantial demand from the growth of niche players in automotive and strategic electronics.
The current challenges in the industry are:-
• Inefficient supply chain for raw materials
• Non-availability of advanced manufacturing equipment
• Logistics inefficiencies and infrastructural bottlenecks
• Lack of access to new technology and capital equipment
• Lack of skilled labor

Kochi Bengaluru Industrial Corridor –Draft Perspective Plan for overall KBIC region - Draft
48
3.10.7.1.1. Way forward for development of Component manufacturing in KBIC
A cluster based approach is essential for setting up an ecosystem for manufacturing. Setting up of EMCs will help integrate the forward and backward linkages in the industry and address various inefficiencies in supply chain, raw material sourcing and human resources and lead to larger investments in technology and equipment in the medium term. This approach has been explored by various countries successfully among which Taiwan has been one of the most successful. Taiwan leads in electronic goods exports in the South-Asian and ASEAN region. The country has developed a strong ecosystem supporting electronics sector from R&D activities including product development up to exports across globe (including developed countries). Taiwan has successfully created an ecosystem to develop electronic clusters that leverage on a top-down approach, whereby an anchor OEM is facilitated who draws the downstream suppliers to create a network of firms. With the integrated approach of creating a sound environment, Taiwan leveraged upon its key strengths of low labor cost, educated work force and availability of capital to invest in sector specific infrastructure development. The following figure shows a case study of the cluster based approach implemented successfully in Taiwan.
Figure 38: Case Study: IC Manufacturing cluster Taiwan
Similar to the above, KBIC should encourage EMC clusters for component manufacturing in the region taking into account the following elements.
1. Anchor Manufacturers: The large manufacturing units in Kochi and Coimbatore can be utilized for development of synergies by creating backward linkages by setting up MSMEs in Palakkad.
2. Synergistic MSME units: Synergy is one of the most critical components for the success of an EMC. The units in the EMC should be able to address constraints in the region in terms of various factors such as supply chain, R&D, technology infusion, forward and backward integration etc.
3.10.7.2. Opportunities in strategic equipment manufacturing
Currently India is the seventh largest Aerospace and Defence (A&D) market globally. The defence budget of India is expected to increase in the coming years in order to address the needs of modernization of its A&D capital equipment base by addressing obsolescence as well as building additional capabilities through increasing investments. With regards to increasing investments the government has taken aggressive steps by doing away with the 51% cap for FDI in the sector. All of this has resulted in India becoming quite attractive as an A&D electronics market. India’s A&D is expected to consume electronics worth $70-72 billion in the next decade. Three key factors that that can be attributed to growth being (i) Modernization of weapon platforms (ii) Induction of state-of-art weapons by the three armed forces and (iii) Impact of indigenization and the Make in India initiative.
The upcoming Tamil Nadu defence corridor is being developed as a part of the Make in India initiative. The corridor lies in close proximity to the KBIC. This is a huge advantage for strategic equipment manufacturers in the region to act as suppliers to the bigger players in the defence corridor. There are certain inherent advantages for KBIC in the manufacturing of strategic equipment.

Kochi Bengaluru Industrial Corridor –Draft Perspective Plan for overall KBIC region - Draft
49
1. The presence of anchor manufacturers in Kerala viz. BEML in Palakkad, KELTRON in Kochi which have already established a presence in this product segment.
2. Presence of synergistic MSMEs in the region acting as component manufacturers for bigger players.
However, the following challenges need to be mitigated in order to develop EMCs in this product segment in the corridor:-
• Inadequate government funding for R&D projects.
• High import dependence in critical technologies.
• No vertical integration in product development leading to increase in assembly units.
3.10.7.2.1. Way forward for development of strategic equipment manufacturing in KBIC
In spite of the numerous opportunities, the Indian strategic equipment sector currently lags in manufacturing potential to meet the demand being generated. This is predominantly due to the absence of adequate R&D in the sector. The amendment of the defense procurement policy (DPP 2016) has provided a boost to the sector. The inclusion of Buy-IDDM (Indigenously designed, developed and manufactured) as a special category receiving highest priority in the procurement process is incentive enough for increased investments in the sector.
In the KBIC region, electronics manufacturing related to strategic equipment has been limited to large government organizations. The role of MSMEs and private players has been very limited in the past. In order to develop this product segment, operationalization of an EMC with focus on the defense sector creating synergies with the Tamil Nadu defense corridor is required. The following steps need to be taken towards achieving this objective:-
1. Anchor Manufacturer: The presence of BEML at Palakkad provides a good opportunity for an EMC to develop in the Palakkad - Thrissur IMC region establishing backward linkages.
2. Synergistic MSME driven growth: In order to complement the growth of MSMEs in the Coimbatore region in this product segment, it is important to take advantage of the increase in demand by establishing an EMC at Palakkad for MSMEs to develop synergies with anchor manufacturers in Palakkad (BEML), Coimbatore and Kochi.
3. Research and Development: The R&D budget in strategic equipment manufacturing needs to be given significance for the indigenous development of critical technologies.
3.10.8. Industrial and Commercial Policy of Kerala 2015 needs to be implemented with focus on synergistic sub sectors
The Industrial and Commercial policy of Kerala 2015 has enough elements that can benefit the ESDM sector. Whatever growth the state has seen till now has been on the basis of industrial policies introduced in 2001 and 2007. The latest policy has a part of it dedicated to the ESDM sector and intends to provide enough support to make this an integral part of the state’s economic growth.
The main highlights of this policy that set it apart from other state policies in India include:-
• Making Kerala a preferred destination for ESDM investments and enable it to become one of the leading contributors to the Indian electronics industry’s turnover by 2020.
• Thiruvananthapuram, Alapuzzha and Kannur districts have been identified for brownfield EMCs under the MSIPS.
• A 20% capital subsidy for new electronics manufacturing units established within the state.
• VAT deferment for ESDM companies with investments of ₹ 100 million for 5 years
• The state government to set up an electronics incubator in close proximity to EMCs. Post benchmarking of the state policies across India the following points emerged that need to be considered by the state government in the policy:-

Kochi Bengaluru Industrial Corridor –Draft Perspective Plan for overall KBIC region - Draft
50
1. Palakkad is a very important strategic location in KBIC for setting up both manufacturing as
well as R&D units and this area needs to be included as priority region for MSIPS investments. 2. Assurance of power supply is highly important for this sector, this should be one of the focus
areas for the state govt. The govt. should strive towards providing uninterrupted power for all ESDM units in the state.
3. There should be clear focus towards setting up clusters in the Strategic equipment and components manufacturing sub sectors. The units in these fields should be given additional encouragement.
4. R&D in electronics should be encouraged by providing assistance in terms of Patent filing costs, viability gap support for labs etc.
The state already has a small base in the ESDM sector which is one reason why the state can be counted on to make a strong impact in the sector. Besides, Kerala has the highest literacy rate in India and thus an abundance of skilled manpower ready to work in the industry. So the foundation is strong and we already know that Kerala is one of the leading IT/ITES destinations in India. In addition, the state policy is ready to provide enough support to the MSME sector, which can as a result attract more investors to start their electronics manufacturing units in the state. The focused approach can lead to growth in the industry in the medium to long term.

Kochi Bengaluru Industrial Corridor –Draft Perspective Plan for overall KBIC region - Draft
51
4. Transport infrastructure assessment
The origin–destination (O–D) analysis for the products of the target sectors indicate that the sectors are dependent on imports and exports.
Accordingly, transportation infrastructure in the corridor may be viewed from the perspective of what is extant and how does it help in the movement of goods. To address both areas, the chapter has been divided in 6 sections, i) Ports, ii) Airports, iii) Road, iv) Railway, v) Inland Waterways, and vi) Logistics assessment.
Figure 39: Infrastructure Assets in KBIC
In the section on the assessment of transportation infrastructure an as-is assessment has been undertaken for the transportation assets such as roads, railways, ports, inland waterways, and airports. The analysis comprises an assessment of coverage and extent, capacities, and utilization. Subsequently, an assessment was undertaken to study the goods flow in the corridor, with a view to understand the requirements it places on the transportation infrastructure. Following this, conclusions have been drawn on the specific infrastructure required to ensure an unimpeded flow of goods in the corridor. This analysis is substantially based on interactions with the various stakeholders such as private companies, industry associations, logistics players and port operators.

Kochi Bengaluru Industrial Corridor –Draft Perspective Plan for overall KBIC region - Draft
52
4.1. Port Infrastructure
Kerala ports are the closest among Indian ports from the Malacca-Persian Gulf trading route which is the main line for trade between Middle East and Far East and carries almost one third of the world shipping traffic. Owing to the location advantage, recent port development in the state has focused on container and transshipment cargo. In this section, role of ports in the development of focus sectors, existing status of the ports, opportunities, and possible interventions have been discussed.
4.1.1. Identified focus sectors in KBIC are highly dependent on the ports
4.1.2. Ports play a very important role in the growth of manufacturing in any economy. They provide the required gateway for the transfer of large volume of goods economically. They act as an important part of both the forward and backward linkages of any company’s value chain depending upon the nature of their business. Following figure will illustrate the role of the ports in a value chain:
Figure 40: Role of Ports in a Value Chain
Kerala is one of the coastal states of India and has a rich history of trading dating back to 15 th century. Currently, the state exports INR 28,946 crores of goods. Majority of the export cargo from the cargo uses the Cochin Port. Total import at the Cochin port in 2017 was 2,366 thousand tonnes while the exports was 1,315 thousand tonnes. Approximately 40% of the total imports at the port was chemical & petrochemical products, while 47% of the total export basket was constituted by food processing products. Textile is also a major export sector at the Cochin port, it constituted 25% of the total exports. Detailed import and exports from the Cochin port of the main sectors is shown below:
Figure 41: Import and Export from the Cochin Port
Source: PwC Analysis, EXIM Cargo Data: Cochin Port
Raw Material Exporter Ports Manufacturer Ports Market
957
0 15
292
9
700
368
21 4
222
3 8
616
11
98
26
327 4
Pet
roch
emic
als
(Ru
bb
er a
nd
Pla
stic
)
Ele
ctri
cal
Ma
chin
ery
Ele
ctro
nic
s
Fo
od
pro
cess
ing
Ma
chin
ery
Mis
cell
aneo
us
No
n-m
eta
llic
pro
du
cts
Tex
tile
s
Tra
nsp
ort
Import and Export from the Cochin Port in 2017 ('000 Tonnes)
Imports Exports

Kochi Bengaluru Industrial Corridor –Draft Perspective Plan for overall KBIC region - Draft
53
Majority of the trade from Cochin ports happens with Middle Eastern ports of Dubai and Dammam; European ports of Hamburg and St Petersburg; and Chinese ports of Shanghai, Tianjin, and Qingdao. Vietnamese port of Haiphong is also one of the major exports ports. Below pictures shows the trade from the Cochin port to the major ports:
Figure 42: Trade for the Cochin Port
Source: PwC Analysis, EXIM Cargo Data: Cochin Port
4.1.2.1. Origin and Destination of the Focus Sectors
Among the 8 shortlisted traditional sectors: 4 sectors are import dependent while 4 sectors are export dependent. Food processing rely on the plethora of raw material availability in Kerala and is heavily export dependent. The other export dependent sector is Textiles as major textile hubs of India in Tiruppur and nearby district are part of the corridor. On the other hand, electronics, transport, non-metallic, and chemical & petrochemical (rubber and plastic) are the import dependent sectors.
Table 16: Export-Import Dependency of the Focus Sectors
Sector
Import Export
Quantity (‘000
Tonnes) Prime Product Dependency
Quantity (‘000
Tonnes)
Prime Product
Dependency
Food Processing
292 Raw Cashew Nuts
616 Frozen Marine Foods
India
138.9 Mn Kgs
Jebel Ali
70.5 Mn Kgs
Qingdao
41.8 Mn Kgs
Shanghai
74.9 Mn Kgs
Tianjin
56.9 Mn Kgs
St Petersburg
121.9 Mn Kgs
32.7 Mn Kgs
Huangpu
30.5 Mn Kgs
Hamburg
Dammam
34.9 Mn Kgs
44.1 Mn Kgs
Haiphong
Export volume
Import volume
Trade route

Kochi Bengaluru Industrial Corridor –Draft Perspective Plan for overall KBIC region - Draft
54
Sector
Import Export
Quantity (‘000
Tonnes) Prime Product Dependency
Quantity (‘000
Tonnes)
Prime Product
Dependency
Textile 21 Raw Cotton
327 Coir Fiber
Chemical and Petrochemical (Plastic and Rubber)
957 Carbon Black Feed Stock
222 Rubber mats
Non-Metallic 368 Roof Tiles
26 Refractory Material
Electrical Machinery
0.2 Transformer parts 3 Pumps
Machinery 9 Machinery Parts 11 Textile machinery
Electronics 15 Household Goods
8 Invertor
Transport Equipment
4 Spare Parts 4 Spares
Source: PwC Analysis, EXIM Cargo Data: Cochin Port
Majority of the food processing products are exported to Europe, Bahrain, UAE, Thailand and the USA; while, imports related to the sector comes from South East Asia, China, and Middle East. Origin Destination of all the focus sectors are mentioned below.
Table 17: Origin-Destination Mapping of the Focus Sectors
Sector Import Destination Export Destination Dependency
Food Processing South East Asia, China, Middle East
Europe, Bahrain, UAE, Thailand, USA
Export
Textiles Cameroon, USA, China, Malaysia
Spain, China, Italy, USA, Middle East
Export
Chemical & Petrochemical (Plastic and Rubber)
UAE, Africa, USA, China, South Korea
South Korea, UAE, Europe, Japan, Sri Lanka, Malaysia
Import
Electrical Machinery Singapore, Sri Lanka, Europe, UAE, China
Africa, UAE, USA, Europe
Export
Machinery China, Japan, Russia, Singapore, UAE
Bangladesh, Pakistan, Vietnam, Oman, Indonesia
Export
Electronics China, UAE, Singapore Europe, Vietnam, USA, Middle East
Import
Transport China, Europe, Sri Lanka
UAE, South Korea, Europe
NA
Non-Metallic China, UAE, Pakistan, Iran
Spain, Netherlands, UAE, Germany
Import
Source: PwC Analysis, EXIM Cargo Data: Cochin Port

Kochi Bengaluru Industrial Corridor –Draft Perspective Plan for overall KBIC region - Draft
55
4.1.3. The corridor has 11 operational ports, with Cochin port being the busiest port handling 99% of the traffic in the region
KBIC has eleven operational ports including 1 major port in Cochin. All the ports are located in the state of Kerala. Out of the eleven ports, 3 are located in Kannur, 2 in Kozhikode, 1 in Malappuram, 1 each in Thrissur and Ernakulum, and 3 in Alappuzha. Apart from these 11 ports, the state has few more ports in the districts of Kasaragod, Kollam, and Thiruvananthapuram.
Figure 43: Ports in KBIC
4.1.3.1. Non-Major Ports in Kerala
The non-major ports in Kerala are mostly used for coastal shipping. Cement, metal, POL, and building products are the major coastal commodities at the non-major ports of Kerala. Among the non-major ports in Kerala, Kollam, Beypore, Azhikkal, and Vizhinjam (not in KBIC zone) handle majority of the cargo. Cargo volume at the non-major ports in Kerala has grown at the CAGR of 2% between FY2011 to FY2017, during FY2017 total cargo volume handled by the non-major Kerala ports was approximately 141,000 tonnes with Beypore port contributing to 91% of the total cargo. Coastal shipping is the major activity on the non-major cargos of the state with 93% of the total cargo at the ports was related to coastal shipping. Below figure will provide the detailed breakup of the cargo at the non-major ports in Kerala:
Table 18: Cargo Handling at the Non Major Ports in Kerala
Ports Coastal Shipping Foreign Going
Beypore 126,430 1,581
Vizhinjam 3,011 6,145 Azhikkal 311 2,638
Kollam 427 0 Source: Kerala Ports
4.1.3.2. Cochin Port
Cochin Port is the only major port in the state of Kerala. It comes in the south western coastal cluster of India. Other major ports in the cluster are New Mangalore Port and Mormugao Port. The port has one
Kodungallur Port
Cochin Port
Calicut Port
Thalasserry Port
Vizhinjam Port
Beypore Port
Alleppey Port
Kayamkulam Port
Manakkodam Port
Ponnani Port
Kannur Port
Azhikkal Port
Kochi Bengaluru Industrial Corridor –Draft Perspective Plan for overall KBIC region - Draft
56
container terminal (International Container Transhipment Terminal) managed by DP World. Cochin Port is a natural port and it has dry dock. It is located at 9⁰ 58’ N latitude and 76⁰ 14’ E longitude, the entrance channel with minimum width of 175 m and minimum depth of 15.95 m is 13 km from the harbour entrance. It has total of 19 berths including 12 berths for general cargo, 2 berths for container, 1 berth for fertilizers, 4 berths for POL. Below table contains detail of the berths at the Cochin Port.
Table 19: Detail of Berths and Occupancy Level at the Cochin Port
Sr No
Berth Name / Cargo Handled
Length (m) Designed Depth (m)
Occupancy 2016-17
Occupancy 2015-16
1 Q 1 – General Cargo 182 9.7 45 24 2 Q 2 – General Cargo 228 9.7 14 47
3 Q 3 – Passenger & General Cargo
9.7 4 26
4 Q 4 – Other Liquid 251 9.7 49 56
5 Q 5 – General Cargo 503 10.7 53 66 6 Q 6 – Passenger &
General Cargo 10.7 49 74
7 Q 7 – General Cargo 11.2 60 68 8 Q 8 – General Cargo 414 11.7 51 76
9 Q 9 – General Cargo 11.7 49 100
10 Q 10 – Fertilizer Raw Material
278 11.2 66 73
11 BTP – Multipurpose & Cruise
270 10.7 70 80
12 NCB – General Cargo & Passenger
209 9.7 49 25
13 COT – Crude / POL Products
430 13.2 51 47
14 NTB – POL Products 298 9.7 50 80
15 STB – POL Products 266 9.7 9 2
16 SCB – Liquid Cargo 192 9.7 2 8
17 SPM – Crude Oil NA 30 53 53 18 V 2 – Containers 600 15.95 67 66
19 V 3 – Containers 15.95 52 50
20 LNG – LNG 376.5 14.5 3 5 21 UTL – Passenger 300 6 100 100
Source: Indian Port Association
Cochin Port witnessed 13.16% YoY increase in its cargo traffic during FY2017. POL and container constitute 94% of the total traffic handled at the port. During FY2017, the port handled 25 Mn tonnes of cargo which includes 612,000 tonnes of transhipment cargo. Following is the breakup of the cargo at the Cochin Port:
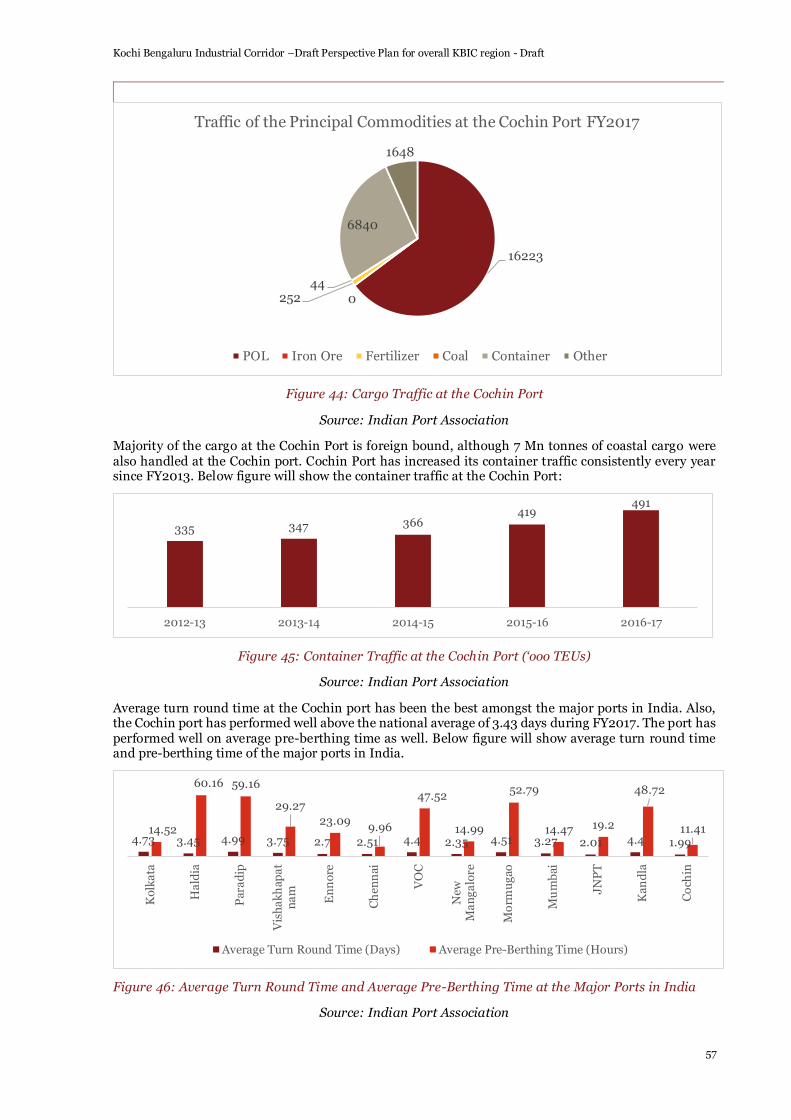
Kochi Bengaluru Industrial Corridor –Draft Perspective Plan for overall KBIC region - Draft
57
Figure 44: Cargo Traffic at the Cochin Port
Source: Indian Port Association
Majority of the cargo at the Cochin Port is foreign bound, although 7 Mn tonnes of coastal cargo were also handled at the Cochin port. Cochin Port has increased its container traffic consistently every year since FY2013. Below figure will show the container traffic at the Cochin Port:
Figure 45: Container Traffic at the Cochin Port (‘ooo TEUs)
Source: Indian Port Association
Average turn round time at the Cochin port has been the best amongst the major ports in India. Also, the Cochin port has performed well above the national average of 3.43 days during FY2017. The port has performed well on average pre-berthing time as well. Below figure will show average turn round time and pre-berthing time of the major ports in India.
Figure 46: Average Turn Round Time and Average Pre-Berthing Time at the Major Ports in India
Source: Indian Port Association
16223
025244
6840
1648
Traffic of the Principal Commodities at the Cochin Port FY2017
POL Iron Ore Fertilizer Coal Container Other
335 347 366419
491
2012-13 2013-14 2014-15 2015-16 2016-17
4.73 3.45 4.99 3.75 2.7 2.51 4.4 2.35 4.51 3.27 2.01 4.4 1.9914.52
60.16 59.16
29.27
23.099.96
47.52
14.99
52.79
14.47 19.2
48.72
11.41
Ko
lka
ta
Ha
ldia
Par
ad
ip
Vis
ha
kh
apa
tn
am
En
no
re
Ch
enn
ai
VO
C
New
Ma
ng
alo
re
Mo
rmu
gao
Mu
mb
ai
JN
PT
Kan
dla
Co
chin
Average Turn Round Time (Days) Average Pre-Berthing Time (Hours)
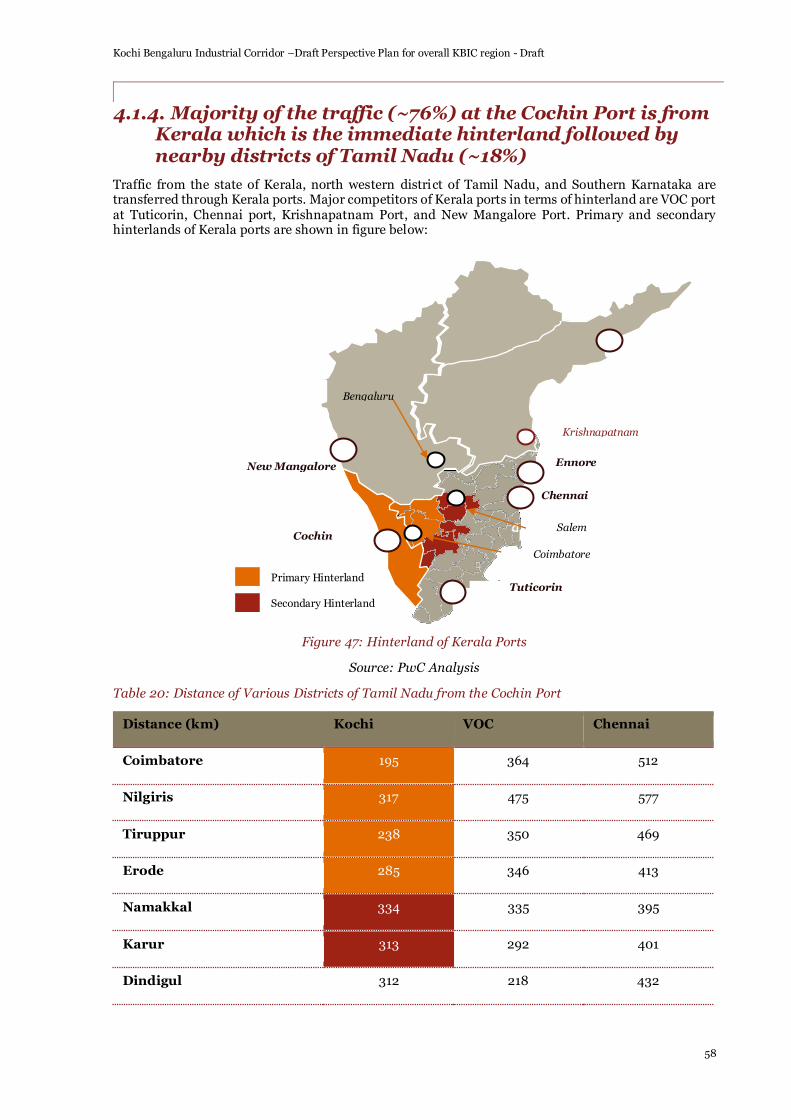
Kochi Bengaluru Industrial Corridor –Draft Perspective Plan for overall KBIC region - Draft
58
4.1.4. Majority of the traffic (~76%) at the Cochin Port is from Kerala which is the immediate hinterland followed by nearby districts of Tamil Nadu (~18%)
Traffic from the state of Kerala, north western district of Tamil Nadu, and Southern Karnataka are transferred through Kerala ports. Major competitors of Kerala ports in terms of hinterland are VOC port at Tuticorin, Chennai port, Krishnapatnam Port, and New Mangalore Port. Primary and secondary hinterlands of Kerala ports are shown in figure below:
Figure 47: Hinterland of Kerala Ports
Source: PwC Analysis
Table 20: Distance of Various Districts of Tamil Nadu from the Cochin Port
Distance (km) Kochi VOC Chennai
Coimbatore 195 364 512
Nilgiris 317 475 577
Tiruppur 238 350 469
Erode 285 346 413
Namakkal 334 335 395
Karur 313 292 401
Dindigul 312 218 432
New Mangalore
Cochin
Tuticorin
Ennore
Chennai
Krishnapatnam
Bengaluru
Salem
Coimbatore
Primary Hinterland
Secondary Hinterland

Kochi Bengaluru Industrial Corridor –Draft Perspective Plan for overall KBIC region - Draft
59
Distance (km) Kochi VOC Chennai
Salem 354 389 358
Dharmapuri 411 308 446
Krishnagiri 460 495 259
Theni 219 226 520
Source: PwC Analysis
As mentioned earlier, majority of the traffic at the Cochin Port is for Kerala followed by nearby districts of Tamil Nadu, and southern Karnataka. During 2017, 76% of the total cargo volume was from Kerala, while Tamil Nadu constituted 18% of the total cargo. However, Tamil Nadu had the share of 26% of the total exports from Kerala, whereas, Kerala share in import cargo was 90%. Below figure contains state-wise distribution of cargo handled at the Cochin port.
Figure 48: State Wise Share of Cargo Handled at the Cochin Port
Source: PwC Analysis
4.1.5. In order to attract importers and exporters few soft and hard infrastructure changes are required at the Cochin Port
Cochin Port was not able to attract the entirety of an approximate INR 650 Bn worth of west moving goods despite the cargo were originating from the hinterland of the ports. In order to improve the attractiveness of the Cochin Port among the traders few changes are required at the Cochin Port. Following are the changes which are required in order to make it attractive among the traders:
1. Increase number of shipping lines at the port
Shipping lines play a very important role in attracting traffic at the ports. Currently, Star Shipping comes to the Cochin Port. Cochin port is part of following shipping lines:
a. Xiamen - Xingang - Qingdao - Ningbo - Shanghai - Da Chan Bay - Port Klang - Cochin - Nhava Sheva - Mundra - Haifa - Ashdod - Alexandria - Mersin – Xiamen
b. Singapore - connecting mainliner at Port Kelang - Cochin - Nhava Sheva - Mundra - Suez - Haifa - Ashdod - Alexandria - Melsin - Suez Canal – Xiamen
Cochin Port needs to increase the shipping line calls in order to provide more options in terms of destination. Also, increased frequency of the lines will attract the traders as it will improve
76% 70%90%
18% 26%3%3% 3% 3%
3% 2% 5%
Total Cargo Export Cargo Import Cargo
Kerala Tamil Nadu Karnataka Other States

Kochi Bengaluru Industrial Corridor –Draft Perspective Plan for overall KBIC region - Draft
60
overall time taken for the export process. Currently, traders have to wait for 3-4 days if they miss the shipping line which lead to losses.
Following case study of Mundra Port will show the role of shipping lines in the success of the port:
2. Reduce vessel and container handling charges at the port
Cochin Port faces major competition from the Chennai and the VOC ports. Container and vessel handling charges at the Cochin port is very high as compared to the two ports which lead to more cost to the exporters. Currently, Cochin ports charges 2.6 times more vessel handling charges than the VOC port and as compare to the Cochin Port, vessel handling charges at the Cochin Port is 1.5 times more. Similarly, for container handling charges Cochin Port charges 2.1 times more than the VOC port and 1.8 times more than the Chennai Port.
Revision of charges will make the port more competitive in the region. Also, it will increase the traffic at the port. More traffic with less margin will help the port to achieve more overall profit. Cochin port can establish sand processing units and sell the sand in order to recover its dredging cost which help in reducing the handling charges.
3. Subsidize empty rake return movement from the port to ICDs
Cochin Port should reduce the charges on empty containers. Also, the port can subsidise return movement of the rakes to ICDs from the ports. Near Tuticorin and Chennai ports, the storage charges for empty containers are less compared to Cochin because of land lease issue. Also, there is an MOU between ICD WF (CONCOR) and Tuticorin, where Tuticorin pays empty rake charges and CONCOR carries empty containers from Tuticorin to ICD without any charges. Following figure will show the difference between loaded and empty container charges:
Mundra port has emerged as a major hub for handling containers in India. Last year only JNPT handled more containers than Mundra Port. Apart from the operational efficiency, strong operator, favorable hinterland; shipping lines have also played a very important role in the success of the port. All the leading shipping lines including Mediterranean Shipping Company (MSC), Maersk Line, CMA CGM operates from the port. MSC which started its operations in 2013 played a very big role in increasing the traffic at the port. Following figure will show cargo traffic at Mundra Port:
Figure 49: Cargo Traffic at Mundra Port (in million tonnes)
Source: Adani Ports & SEZ
64
82.1
101.1110.9 109 113.7
0
20
40
60
80
100
120
2011-12 2012-13 2013-14 2014-15 2015-16 2016-17
MSC Introduction

Kochi Bengaluru Industrial Corridor –Draft Perspective Plan for overall KBIC region - Draft
61
Figure 50: Difference between Loaded and Empty Container Handling Charges
Source: PwC Analysis
With increased difference between empty container handling and loaded container charges , Cochin port can be more competitive in the region. This will help the traders and liners to increase their volume from the port.
4. Open shipping line offices at the port
Currently, shipping line agents are operating at the Cochin port, none of the shipping lines have their offices at the port. In order to call one ship, the agents are required to put huge sums for booking the berth slots and other port charges. It is very difficult for the agents to maintain required working capital to call big ships regularly owing to the high charges associated with the ship. At the Cochin Port, approximately INR 550,000 for 8,000 GRT is required. For 40,000 GRT vessel the charges go more than INR 3 million.
Offices of shipping lines at the port will ensure better coordination and it will help in bringing large ships at the port as shipping lines can have better coordination with their offices and they have better working capital to ensure smooth operations at the port. Following figure describes role of port agents in overall operations:
Figure 51: Role of Port Agents
Source: PwC Analysis
29%
26%
16%
VOC Chennai Cochin
Difference Between Loaded and Empty Container Charges

Kochi Bengaluru Industrial Corridor –Draft Perspective Plan for overall KBIC region - Draft
62
5. Establish 24 x 7 customs office
The port has efficient inward and outward movement of the cargo. Slow movement at the port can be addressed by having 24x7 customs facility.
The port has efficient system for inward movement of cargo. It has 24 hours pilotage facility, and cargo operation. Also, it has system for Real-Time co-ordination of vessel movement through VTMS (Vessel Traffic Management and Information System). Adding to these, the port is moving towards zero pre berthing detention time.
Similarly, the port is well connected with other transport systems in order to facilitate smooth outward movement of the cargo. The port is connected with following National Highways:
a. NH 544 (340 km): Kochi to Salem
b. NH 66 (1622 km): Kanyakumari to Mumbai
c. NH 85 (413 km): Kochi to Tondi
d. NH 966 A and 966 B (15 km and 8 km): Connecting Cochin port to main junctions of other NHs
Ernakulum Junction is one of the major junctions of Southern Railways. It is located just 9 km away from the port. Apart from the Ernakulum Jn, the port has a dedicated railway station as well. The port is not only well connected to road and rail but also with inland waterways. 205 km long National Waterway 3 has a container terminal at Willington Island which enables movement of cargo using inland waterway.
Cochin Port has efficient inward cargo movement facility and is connected with infrastructure for ensuring smooth outward movement of the goods but movement of cargo at the Cochin Port is slow. Main reason behind this bottleneck is lack of 24 x 7 custom clearance facility. Officers at the Cochin Port are not available during weekends which lead to cargo getting stuck at the port for 2 days. Competing port in Tuticorin has 24 x 7 customs facility which has lead the shift of traffic from the Cochin Port to VOC Port.
6. Open cold storage facility at or near the port
Frozen and fresh food segment constitutes the biggest share of Cochin Port’s export basket. This segment contributes to 13% of overall exports from the Cochin Port in terms of quantity. Following figure shows the share of frozen and fresh food segment in exports of Cochin Port.
Figure 52: Share of Frozen and Fresh Food
Source: PwC Analysis
Cold storage units is very critical for movement of these cargo. There are multiple private sector cold storage facilities in Aroor area but exporters were expecting cold storage in the vicinity of the port. It will lead to less wastage and efficient movement of the segment.
13%

Kochi Bengaluru Industrial Corridor –Draft Perspective Plan for overall KBIC region - Draft
63
4.1.6. These changes will help Cochin port to attract over INR 250 Bn worth of west moving time sensitive cargo from the secondary hinterland of the port
Kerala ports enjoy geographical advantage over other southern ports for moving west moving cargo. Both Cochin and Vizhinjam ports are very close to Persian Gulf – Malacca Line. Last year, 69% of the total cargo at the Cochin Port was west bound. Total value of west moving cargo in FY2016 from Kerala ports was only INR 184 Bn. While, total value of west moving cargo from the secondary hinterland of Kerala ports was INR 841 Bn. Out of the INR 841 Bn worth of cargo approximately INR 289 Bn worth of west bound cargo was time sensitive. Key West bound time sensitive cargo from the region comprised of Pharmaceuticals product, food processing products, textile and leather, and floriculture products. Kerala ports could have attracted time sensitive cargo valued more than INR 250 Bn.
Figure 53: Value of Export Cargo from Kerala Ports
Source: PwC Analysis
Figure 54: Cargo Movement from Kerala Ports
Source: PwC Analysis
206 220 243 231
264
FY12 FY13 FY14 FY15 FY16
Value of Export Cargo from Kerala Ports (INR Bn)
69%
31%
Cargo Movement from Kerala Ports
West
East
Currently, we are using private cold storage in Aroor area which is 22 km away from the terminal. Cold storage facility in the vicinity of the port will be very helpful
for the exporters
- Sea Food Park India

Kochi Bengaluru Industrial Corridor –Draft Perspective Plan for overall KBIC region - Draft
64
Table 21: Time Sensitive Cargo from Secondary Hinterland of Kerala Ports
Time Sensitive Cargo Value of West Moving cargo from Secondary Hinterland of Kerala Ports in FY18 (INR Bn)
Textile and Leather 255.5
Food Processing 1.3
Floriculture 1.6
Pharmaceuticals 30.3
Source: Directorate General of Commercial Intelligence and Statistics
Figure 55: Centers of the Time Sensitive Cargo
Source: PwC Analysis
4.1.6.1. Shifting of west moving time sensitive cargo from western Tamil Nadu and southern Karnataka to Cochin Port will result in significant time saving
Time analysis for different routes which can be taken by the traders in the hinterland of Cochin Port suggested that the traders can save significant time if they shift to Cochin Port for the movement of their west moving cargos.
For the analysis, Jebel Ali port at Dubai was considered as the foreign port. Also, it was assumed that direct transfer from other ports to Jebel Ali will happen. If there is an option of transshipment from the Colombo Port, then Cochin Port will act as the feeder port. Following are the routes which were considered for the analysis.
Route A:
ICD Thudialur to Cochin Port to Jebel Ali Port
Pharmaceuticals
Floriculture Textile and Leather
Food Processing
Key Centres of the Time Sensitive Cargo
Krishnagiri, Nilgiris, Coimbatore, Namakkal, Trichy
Tiruppur, Bengaluru, Erode, Karur, Coimbatore
Trichy, Coimbatore, Erode, Salem, Krishnagiri
Hosur, Nilgiris, Coimbatore, Madurai, Trichy

Kochi Bengaluru Industrial Corridor –Draft Perspective Plan for overall KBIC region - Draft
65
Route B:
ICD Thudialur to Cochin Port to Colombo Port to Jebel Ali Port
Route C:
ICD Thudialur to VOC Port to Jebel Ali Port
Route D:
ICD Thudialur to Chennai Port to Jebel Ali Port
Following table contains the results of the time analysis of the west moving cargo from Western Tamil Nadu districts:
Table 22: Cost-Time Analysis of West Moving Cargo from Western Tamil Nadu
Items Route A Route B Route C Route D
Road Distance (km)
201 201 372 517
Sea Distance (km) 3,602 4,869 4,058 4,704
Road Time (hr) 5 5 7 9
Sea Time (hr) 194 264 218 254
Total Time (Days) 8.3 11.2 9.4 11
Source: PwC Analysis
Route E:
ICD Bengaluru to Cochin Port to Jebel Ali Port
Route F:
ICD Bengaluru to Cochin Port to Colombo Port to Jebel Ali Port
Route G:
ICD Bengaluru to VOC Port to Jebel Ali Port
Route H:
ICD Bengaluru to Chennai Port to Jebel Ali Port
Following table contains the results of the time analysis of the west moving cargo from Southern Karnataka districts:
Table 23: Cost-Time Analysis of West Moving Cargo from Southern Karnataka
Items Route E Route F Route G Route H
Road Distance (km)
550 550 583 347
Sea Distance (km) 3,602 4,869 4,058 4,704
Road Time (hr) 10 10 10 6

Kochi Bengaluru Industrial Corridor –Draft Perspective Plan for overall KBIC region - Draft
66
Items Route E Route F Route G Route H
Sea Time (hr) 194 264 218 254
Total Time (Days) 8.5 11.4 9.5 10.9
Source: PwC Analysis
Note: Transhipment time at Colombo Ports is assumed as 1 day
As we can see total time for Route A and Route E is 8.3 days and 8.5 days respectively which is significantly less than the total time for other routes. So, we can conclude that traders of time sensitive goods in the hinterland of Kerala ports can save significant time if they shift to Kerala Ports especially for their west moving cargo.
4.1.7. Also, upcoming transhipment container terminal at Vizhinjam Port will integrate the industries in the corridor and boost the overall logistics in the region in long term
Government of Kerala with Adani Ports and SEZ Ltd is developing a transshipment container terminal in Vizhinjam. The port is expected to be one of the major transshipment hubs in South Asia. The port has natural draft of 22 m and is located only 10 nautical miles away from the Persian Gulf – Malacca line. Also, it has minimum littoral drift and is centrally located on Indian Coastline. The Vizhinjam port projects is planned to be carried out in 3 phases. Phase 1 will be between FY2014 to FY2020 followed by Phase 2 between FY2021 to FY2030 and the last phase which is Phase 3 will be carried out between FY2031 to FY2044. Following table contains the detail about the project:
Table 24: Project Overview of Vizhinjam Port
Phase 1 Phase 2 Phase 3
Terminal Year Base Case Traffic
Gateway Container Traffic (Mn TEU) 0.1 0.4 0.8
Transshipment container Traffic (Mn TEU)
0.7 1.3 2.1
Bulk Traffic (Mn Tonnes) 0.6 1.3 2.6
Cruise vessels (no.) 30 60 120
Sub Total Excluding Cruise (Mn Tonnes)*
12.5 25.7 43.5
Port Configuration
Number of Container Berths 2 2 3
Number of General Cargo Berths 1 0 0
Number of Cruise Berth 1 0 1
Number of Liquid Berth 0 1 0
Sub Total 4 3 4
Estimated Investment (Mn USD)**
Infrastructure 110.3 46.2 178.8
Superstructure 14 9.6 52.7

Kochi Bengaluru Industrial Corridor –Draft Perspective Plan for overall KBIC region - Draft
67
Land Reclamation 43.1 30.3 98.7
Berths and Equipment 169.7 213.6 399.6
Sub Total 337.1 299.7 729.8
PV of Estimated Investment (@10%)**
337.1 153.8 144.4
Estimated Revenue in Base Case (Mn USD)**
188.3 965.6 3826.7
PV of Estimated Revenue (@10%)**
119 279.3 358
Note: * 1 Container = 14.5 tonne (Base Case)
** Provisional Estimate
Source: Drewry Research, IFC, L& T Ramboll Techno-commercial Feasibility Report

Kochi Bengaluru Industrial Corridor –Draft Perspective Plan for overall KBIC region - Draft
68
4.2. Airports
The Aviation industry plays a crucial role in the economic development of any region acting as an enabler for long-term economic growth. Major airports have evolved from being mere gateways that provide origin to destination connectivity to becoming drivers of socio economic growth for the region. Modern day airports rely on creation of an ecosystem of related businesses in their influence area which drives their growth and sustainability in the long run.
With increasing emphasis being placed on supply chain efficiency, it has been the norm to build manufacturing units and warehouses within close proximity of a gateway port. In the past as a gateway port opened, the economy of the region usually saw the emergence of related manufacturing and services and then expanded to include other industries. As air freight became more economical and flourished, airports increasingly became attractive venues for warehouses and manufacturers, and an industry began to build up around them. Memphis, is a prime example of an economy and city growing organically around an airport.
With the Indian Govt. emphasizing on the need for developing airport infrastructure in the country, the future of airports in India will depend upon the extent to which the economy around them flourishes and thereby enabling its organic growth.
A well-developed airport ecosystem has become necessary for any industrial corridor to sustain in the long run. The importance is not only limited to increase in supply chain efficiencies but also to crea te a mutually sustainable linkage with the industries in the influence region thereby acting as a growth driver for the region. This section will discuss the airport infrastructure in the corridor and the interventions which are required to improve overall efficiency in the corridor.
4.2.1. The Airport infrastructure in the KBIC region is well developed
There are three major airports in the KBIC corridor in Cochin, Coimbatore and Kozhikode and one in Kannur which is under construction and will be operational by 2019. In total the Airports in the corridor account for 5.1% of the total Passenger traffic and 3.1% of the total Cargo traffic in India.
All the operational Airports in the corridor are currently operating at lower than maximum capacity with majority of the passenger traffic handled at Cochin (65%) and also the majority of Cargo traffic handled at Cochin (72%).
In terms of passengers, the share of International traffic at Cochin (53%) and Kozhikode (84%) is very high, whereas Coimbatore (14%) mostly handles Domestic traffic. Similarly in Air Cargo throughput, the share of International traffic at Cochin (86%) and Kozhikode (95%) is very high, whereas Coimbatore (5%) mostly handles Domestic traffic.
For the development of the industrial corridor, the importance of air connectivity can’t be understated. In this regard, an anchor airport plays a significant role in providing the region rapid accessibility, thereby increasing market reach and making the region as a whole more competitive in terms of productivity, speed to market, costs and as a result pricing. In this regard we have analyzed the infrastructure of the corridor Airports in terms of accessibility, growth potential, efficiency etc.
In terms of domestic connectivity, the airports in the region are well connected to most major cities
Figure 56: Airport Infrastructure in KBIC
Source: PwC Analysis
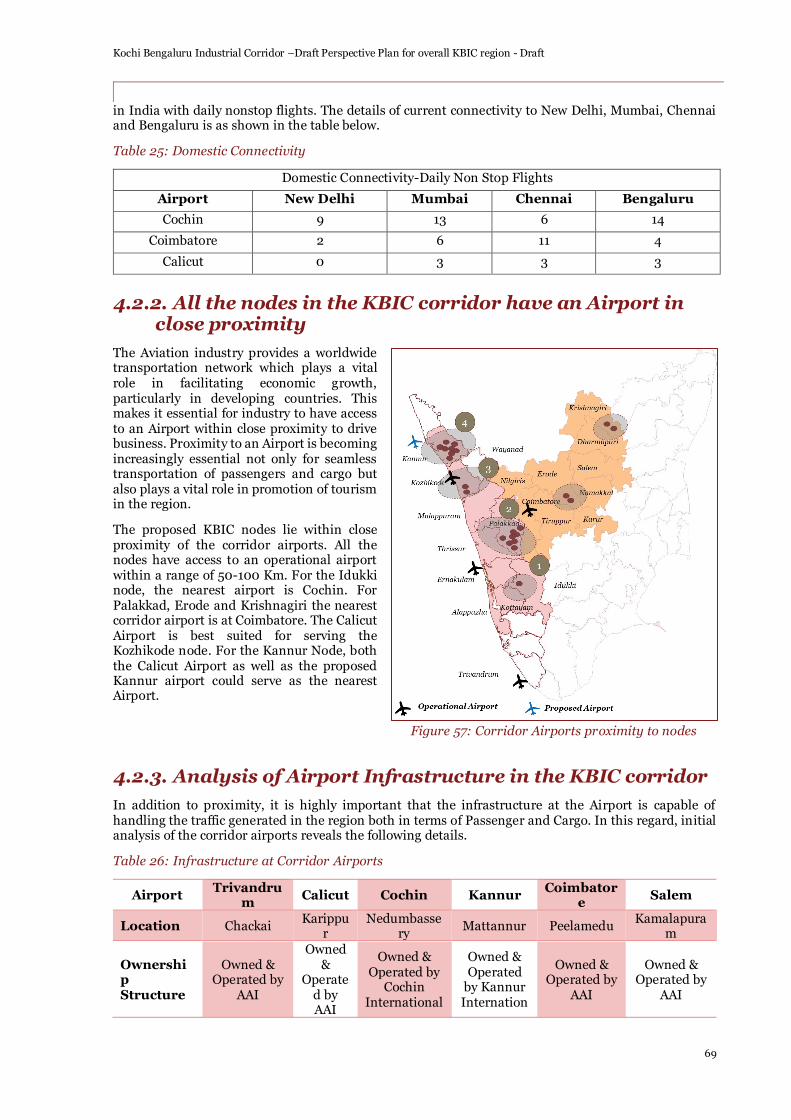
Kochi Bengaluru Industrial Corridor –Draft Perspective Plan for overall KBIC region - Draft
69
in India with daily nonstop flights. The details of current connectivity to New Delhi, Mumbai, Chennai and Bengaluru is as shown in the table below.
Table 25: Domestic Connectivity
Domestic Connectivity-Daily Non Stop Flights
Airport New Delhi Mumbai Chennai Bengaluru
Cochin 9 13 6 14
Coimbatore 2 6 11 4
Calicut 0 3 3 3
4.2.2. All the nodes in the KBIC corridor have an Airport in close proximity
The Aviation industry provides a worldwide transportation network which plays a vital role in facilitating economic growth, particularly in developing countries. This makes it essential for industry to have access to an Airport within close proximity to drive business. Proximity to an Airport is becoming increasingly essential not only for seamless transportation of passengers and cargo but also plays a vital role in promotion of tourism in the region.
The proposed KBIC nodes lie within close proximity of the corridor airports. All the nodes have access to an operational airport within a range of 50-100 Km. For the Idukki node, the nearest airport is Cochin. For Palakkad, Erode and Krishnagiri the nearest corridor airport is at Coimbatore. The Calicut Airport is best suited for serving the Kozhikode node. For the Kannur Node, both the Calicut Airport as well as the proposed Kannur airport could serve as the nearest Airport.
4.2.3. Analysis of Airport Infrastructure in the KBIC corridor
In addition to proximity, it is highly important that the infrastructure at the Airport is capable of handling the traffic generated in the region both in terms of Passenger and Cargo. In this regard, initial analysis of the corridor airports reveals the following details.
Table 26: Infrastructure at Corridor Airports
Airport Trivandru
m Calicut Cochin Kannur
Coimbatore
Salem
Location Chackai Karippu
r Nedumbasse
ry Mattannur Peelamedu
Kamalapuram
Ownership Structure
Owned & Operated by
AAI
Owned &
Operated by AAI
Owned & Operated by
Cochin International
Owned & Operated
by Kannur Internation
Owned & Operated by
AAI
Owned & Operated by
AAI
Figure 57: Corridor Airports proximity to nodes

Kochi Bengaluru Industrial Corridor –Draft Perspective Plan for overall KBIC region - Draft
70
Airport Trivandru
m Calicut Cochin Kannur
Coimbatore
Salem
Airport Limited
al Airport Limited
Operations
Dom & Int’l Dom &
Int’l Dom & Int’l Dom & Int’l Dom & Int’l Dom
Land Area 628.59 Acres
378.45 Acres
1254 Acres 1200 Acres 420.33 Acres
136.290 Acres
Terminal details
No of Terminals
2 2 2 1 1 1
Terminal Area (Square Meters)
32,200
(Int'l) 22,920 (Int'l)
1,0,000
(Int'l) Integrated
12619.92 (Integrated)
1000
13,500
(Dom) 12,000
(Dom) 10,000 (Dom)
(Dom)
Runway Details
Runway Dimensions
3373m × 45m
2850m × 45m
3400m × 45m
3400m × 45m
2990m × 45m
1829m × 45m
Runway Shoulders
10.5m 7.5m 15m - 7.5M 7.5M
Dimension of Runway Strip
3493m × 150m
2970m ×150m
3520m × 300m
- 3110m×
150m 1949m×
150m
1. The Airports at Coimbatore and Calicut have short Runway Lengths (<3000 m) incapable of
handling wide body Aircrafts, which is a major hindrance in attracting major airlines.
2. The passenger and cargo capacity at both Kozhikode and Coimbatore is low and still not fully
utilized.
3. Expansion of the Coimbatore and Kozhikode Airports would be highly capital intensive and offer
even more idle capacity.
4. Cochin Airport emerges as the biggest airport in the region offering capacity as well as connectivity
thereby being best suited as the Anchor Airport for the region.
Hence, in spite of proximity to other airports, the development of the nodes would depend highly on the Cochin Airport being a gateway Airport for the region. We expect that with increase in manufacturing in the KBIC corridor, the dependency on Cochin Airport would increase rather than any other airport in the region.

Kochi Bengaluru Industrial Corridor –Draft Perspective Plan for overall KBIC region - Draft
71
4.2.4. Air Traffic Demand Forecast for KBIC Influence Region
4.2.4.1. Past Traffic Trends
The past trends of passenger and cargo traffic in Airports in KBIC Influence region is presented in following tables.
Table 27: Passenger Traffic Trends in Airports in KBIC Influence Region
Year Trivandrum
Calicut Cochin Coimbatore Trivandrum
Calicut Cochin Coimbatore
Air Passenger Traffic - International
2009-10 1,695,912 1,657,929 2,226,860 94,546
2010-11 1,842,824 1,829,752 2,358,579 100,354 8.7% 10.4% 5.9% 6.1%
2011-12 1,835,952 1,982,955 2,586,658 102,274 -0.4% 8.4% 9.7% 1.9%
2012-13 1,850,469 1,962,316 2,919,707 112,397 0.8% -1.0% 12.9% 9.9%
2013-14 1,948,549 2,179,200 3,272,350 119,557 5.3% 11.1% 12.1% 6.4%
2014-15 2,093,025 2,286,829 3,751,225 123,250 7.4% 4.9% 14.6% 3.1%
2015-16 2,274,543 1,939,134 4,653,948 131,461 8.7% -15.2% 24.1% 6.7%
2016-17 2,309,742 2,211,108 5,000,524 140,195 1.5% 14.0% 7.4% 6.6%
2017-18 2,477,342 2,628,460
5,369,772 203,741 7.3% 18.9% 7.4% 45.3%
Average Growth Rate 4.9% 6.4% 11.8% 10.8%
Air Passenger Traffic – Domestic
2009-10 637,808 205,940 1,652,847 1,014,791
2010-11 684,061 230,227 1,982,157 1,143,469 7.3% 11.8% 19.9% 12.7%
2011-12 978,847 226,761 2,130,992 1,243,107 43.1% -1.5% 7.5% 8.7%
2012-13 988,614 311,387 1,961,066 1,185,407 1.0% 37.3% -8.0% -4.6%
2013-14 985,525 285,447 2,110,766 1,124,743 -0.3% -8.3% 7.6% -5.1%
2014-15 1,080,993 296,911 2,662,910 1,305,948 9.7% 4.0% 26.2% 16.1%
2015-16 1,196,245 366,413 3,095,953 1,560,092 10.7% 23.4% 16.3% 19.5%
2016-17 1,571,767 439,980 3,954,917 1,964,709 31.4% 20.1% 27.7% 25.9%
2017-18 1,916,127 510,972 4,803,067 2,200,194 21.9% 16.1% 21.4% 12.0%
Average Growth Rate 15.6% 12.9% 14.8% 10.6%
Air Passenger Traffic – Total
2009-10 2,333,720 1,863,869 3,879,707 1,109,337
2010-11 2,526,885 2,059,979 4,340,736 1,243,823 8.3% 10.5% 11.9% 12.1%
2011-12 2,814,799 2,209,716 4,717,650 1,345,381 11.4% 7.3% 8.7% 8.2%
2012-13 2,839,083 2,273,703 4,880,773 1,297,804 0.9% 2.9% 3.5% -3.5%
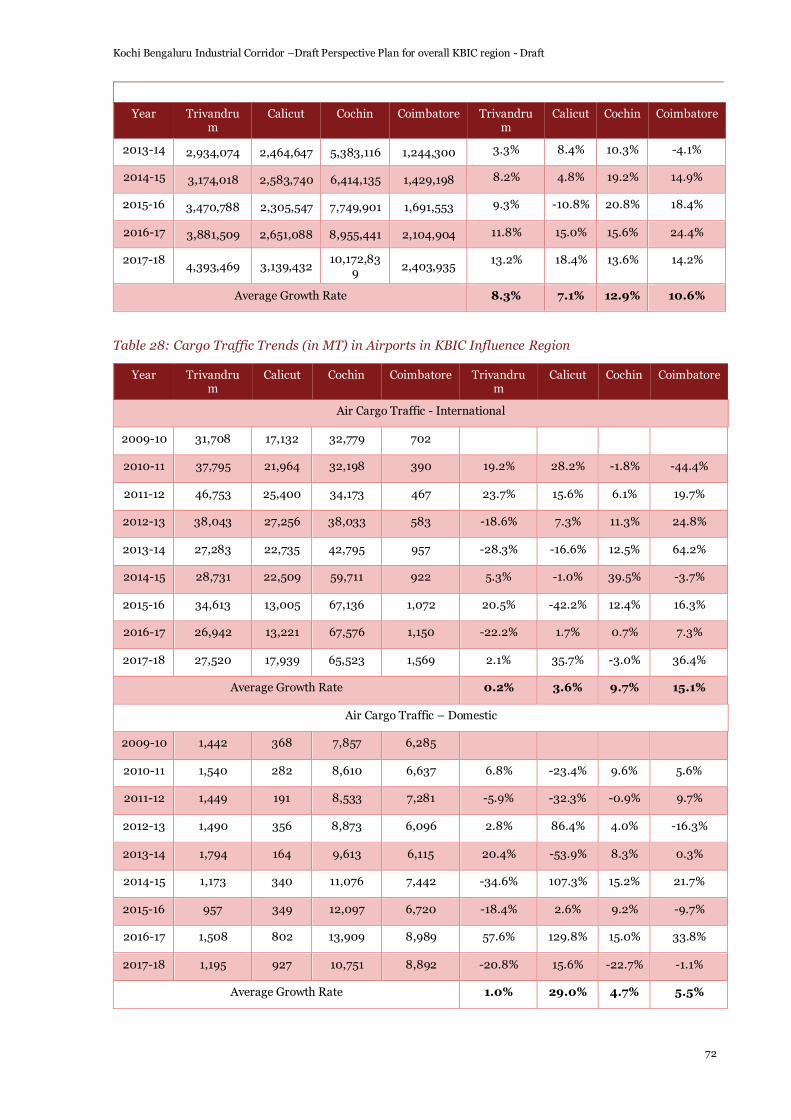
Kochi Bengaluru Industrial Corridor –Draft Perspective Plan for overall KBIC region - Draft
72
Year Trivandrum
Calicut Cochin Coimbatore Trivandrum
Calicut Cochin Coimbatore
2013-14 2,934,074 2,464,647 5,383,116 1,244,300 3.3% 8.4% 10.3% -4.1%
2014-15 3,174,018 2,583,740 6,414,135 1,429,198 8.2% 4.8% 19.2% 14.9%
2015-16 3,470,788 2,305,547 7,749,901 1,691,553 9.3% -10.8% 20.8% 18.4%
2016-17 3,881,509 2,651,088 8,955,441 2,104,904 11.8% 15.0% 15.6% 24.4%
2017-18 4,393,469 3,139,432
10,172,839
2,403,935 13.2% 18.4% 13.6% 14.2%
Average Growth Rate 8.3% 7.1% 12.9% 10.6%
Table 28: Cargo Traffic Trends (in MT) in Airports in KBIC Influence Region
Year Trivandrum
Calicut Cochin Coimbatore Trivandrum
Calicut Cochin Coimbatore
Air Cargo Traffic - International
2009-10 31,708 17,132 32,779 702
2010-11 37,795 21,964 32,198 390 19.2% 28.2% -1.8% -44.4%
2011-12 46,753 25,400 34,173 467 23.7% 15.6% 6.1% 19.7%
2012-13 38,043 27,256 38,033 583 -18.6% 7.3% 11.3% 24.8%
2013-14 27,283 22,735 42,795 957 -28.3% -16.6% 12.5% 64.2%
2014-15 28,731 22,509 59,711 922 5.3% -1.0% 39.5% -3.7%
2015-16 34,613 13,005 67,136 1,072 20.5% -42.2% 12.4% 16.3%
2016-17 26,942 13,221 67,576 1,150 -22.2% 1.7% 0.7% 7.3%
2017-18 27,520 17,939 65,523 1,569 2.1% 35.7% -3.0% 36.4%
Average Growth Rate 0.2% 3.6% 9.7% 15.1%
Air Cargo Traffic – Domestic
2009-10 1,442 368 7,857 6,285
2010-11 1,540 282 8,610 6,637 6.8% -23.4% 9.6% 5.6%
2011-12 1,449 191 8,533 7,281 -5.9% -32.3% -0.9% 9.7%
2012-13 1,490 356 8,873 6,096 2.8% 86.4% 4.0% -16.3%
2013-14 1,794 164 9,613 6,115 20.4% -53.9% 8.3% 0.3%
2014-15 1,173 340 11,076 7,442 -34.6% 107.3% 15.2% 21.7%
2015-16 957 349 12,097 6,720 -18.4% 2.6% 9.2% -9.7%
2016-17 1,508 802 13,909 8,989 57.6% 129.8% 15.0% 33.8%
2017-18 1,195 927 10,751 8,892 -20.8% 15.6% -22.7% -1.1%
Average Growth Rate 1.0% 29.0% 4.7% 5.5%

Kochi Bengaluru Industrial Corridor –Draft Perspective Plan for overall KBIC region - Draft
73
Year Trivandrum
Calicut Cochin Coimbatore Trivandrum
Calicut Cochin Coimbatore
Air Cargo Traffic – Total
2009-10 33,150 17,500 40,636 6,987
2010-11 39,335 22,246 40,808 7,027 18.7% 27.1% 0.4% 0.6%
2011-12 48,202 25,591 42,706 7,748 22.5% 15.0% 4.7% 10.3%
2012-13 39,533 27,612 46,906 6,679 -18.0% 7.9% 9.8% -13.8%
2013-14 29,077 22,899 52,408 7,072 -26.4% -17.1% 11.7% 5.9%
2014-15 29,904 22,849 70,787 8,364 2.8% -0.2% 35.1% 18.3%
2015-16 35,570 13,354 79,233 7,792 18.9% -41.6% 11.9% -6.8%
2016-17 28,450 14,023 81,485 10,139 -20.0% 5.0% 2.8% 30.1%
2017-18 28,715 18,866 76,274 10,461 0.9% 34.5% -6.4% 3.2%
Average Growth Rate -0.1% 3.8% 8.8% 6.0%
4.2.4.2. Forecast of Airport Traffic
Working Group on Civil Aviation Sector, National Transport Development Policy Committee (2012), considered GDP as explanatory variable to forecast the air passenger and freight traffic. Economic models have been developed by the committee to derive the elasticity of air passenger and freight traffic with respect to the GDP based on time series data from 1990-91 to 2010-11. While the domestic GDP is taken as the explanatory variable for forecasting domestic passenger traffic, World GDP is used for forecasting international air passenger traffic. To forecast domestic cargo and international cargo, domestic GDP and international GDP has been used as an explanatory variable. The derived elasticity values are presented as below.
Table 29: Elasticity Values used for forecasting Air Traffic
S. No. Component of Traffic Elasticity Explanatory Variable
1 Air Passenger traffic (domestic) 1.5 Domestic GDP
2 Air Passenger traffic (International) 3.1 World GDP
3 Air Cargo traffic (domestic) 1.37 Domestic GDP
4 Air Cargo traffic (International) 1.39 Domestic GDP
The above elasticity values have been used to forecast the air traffic for the influencing airports in KBIC region. For the purpose of forecasting air passenger and cargo traffic, GDP of the respective states as well as World GDP is used for forecasting the air traffic in the influencing airports of KBIC region. The growth rate of international GDP is assumed as 3.25% in the near term and 3% in the long term which are in line with IMF expected GDP growth rates. The finalized growth rates for passenger and cargo traffic in KBIC region is given in tables below. The traffic forecast for Salem airport has not been considered as the past trends are not available.
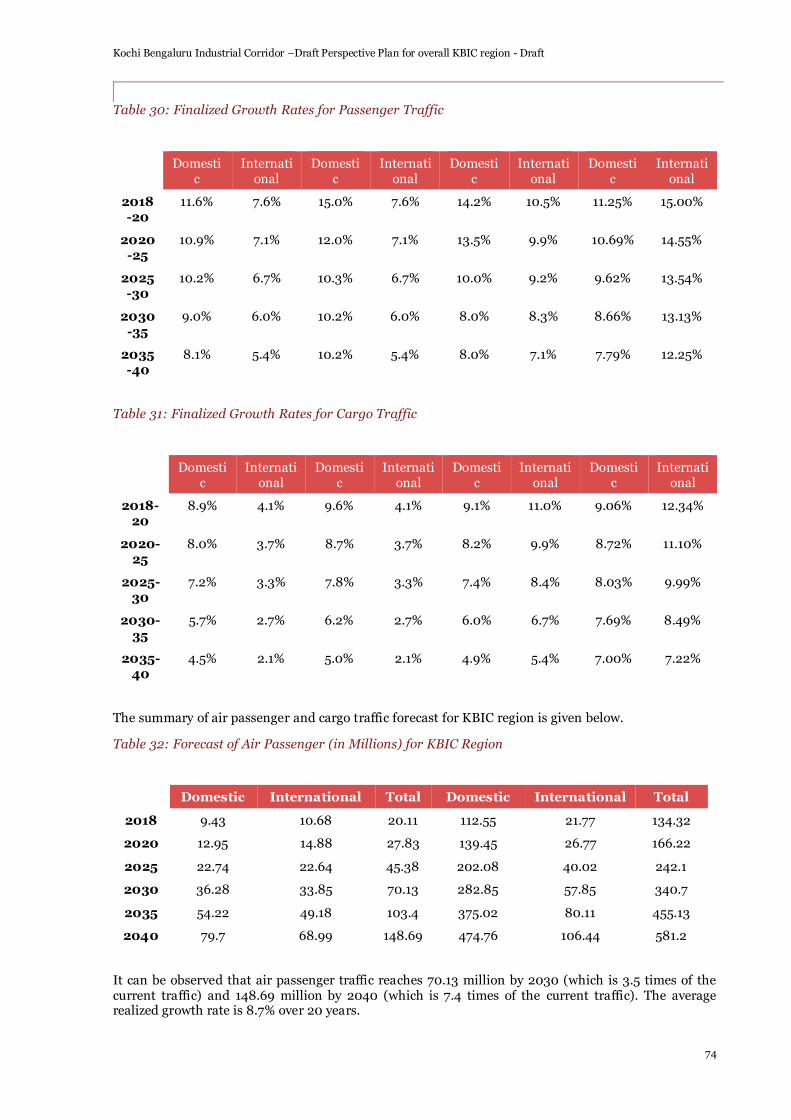
Kochi Bengaluru Industrial Corridor –Draft Perspective Plan for overall KBIC region - Draft
74
Table 30: Finalized Growth Rates for Passenger Traffic
Year Trivandrum Calicut Cochin Coimbatore
Domestic
International
Domestic
International
Domestic
International
Domestic
International
2018-20
11.6% 7.6% 15.0% 7.6% 14.2% 10.5% 11.25% 15.00%
2020-25
10.9% 7.1% 12.0% 7.1% 13.5% 9.9% 10.69% 14.55%
2025-30
10.2% 6.7% 10.3% 6.7% 10.0% 9.2% 9.62% 13.54%
2030-35
9.0% 6.0% 10.2% 6.0% 8.0% 8.3% 8.66% 13.13%
2035-40
8.1% 5.4% 10.2% 5.4% 8.0% 7.1% 7.79% 12.25%
Table 31: Finalized Growth Rates for Cargo Traffic
Year Trivandrum Calicut Cochin Coimbatore
Domestic
International
Domestic
International
Domestic
International
Domestic
International
2018-20
8.9% 4.1% 9.6% 4.1% 9.1% 11.0% 9.06% 12.34%
2020-25
8.0% 3.7% 8.7% 3.7% 8.2% 9.9% 8.72% 11.10%
2025-30
7.2% 3.3% 7.8% 3.3% 7.4% 8.4% 8.03% 9.99%
2030-35
5.7% 2.7% 6.2% 2.7% 6.0% 6.7% 7.69% 8.49%
2035-40
4.5% 2.1% 5.0% 2.1% 4.9% 5.4% 7.00% 7.22%
The summary of air passenger and cargo traffic forecast for KBIC region is given below.
Table 32: Forecast of Air Passenger (in Millions) for KBIC Region
Year Passengers (in millions) per annum Cargo (in ‘000 MT) per annum
Domestic International Total Domestic International Total
2018 9.43 10.68 20.11 112.55 21.77 134.32
2020 12.95 14.88 27.83 139.45 26.77 166.22
2025 22.74 22.64 45.38 202.08 40.02 242.1
2030 36.28 33.85 70.13 282.85 57.85 340.7
2035 54.22 49.18 103.4 375.02 80.11 455.13
2040 79.7 68.99 148.69 474.76 106.44 581.2
It can be observed that air passenger traffic reaches 70.13 million by 2030 (which is 3.5 times of the current traffic) and 148.69 million by 2040 (which is 7.4 times of the current traffic). The average realized growth rate is 8.7% over 20 years.

Kochi Bengaluru Industrial Corridor –Draft Perspective Plan for overall KBIC region - Draft
75
4.2.4.2.1. Allocation of forecasted air traffic to airports in KBIC Region
The allocation of air traffic forecast of various airports in KBIC influence area is made giving due weightage to the following parameters.
i) Current share of air traffic
ii) Population, population density, share of urban population, GDP, per capita income and future
potential developments like KBIC, Tourism etc.
Table 33: Allocation of Air Traffic (International) to Existing Airports (Million Passengers per annum)
Year Trivandrum Calicut Cochin Kannur Coimbatore
2018 2.48 2.63 5.37 - 0.20
2020 2.87 3.11 6.55 2.08 0.27
2025 4.04 4.65 10.49 2.93 0.53
2030 5.59 6.94 16.30 4.02 1.00
2035 7.47 10.18 24.28 5.39 1.86
2040 9.70 14.64 34.21 7.13 3.31
Table 34: Allocation of Air Traffic (Domestic) to Existing Airports (Million Passengers per annum)
Year Trivandrum Calicut Cochin Kannur Coimbatore
2018 1.92 0.51 4.80 - 2.20
2020 2.39 0.68 6.26 0.94 2.68
2025 4.00 1.19 11.82 1.28 4.45
2030 6.51 1.95 19.03 1.75 7.04
2035 10.03 3.17 27.96 2.39 10.67
2040 14.79 5.14 41.08 3.17 15.52
Forecast of domestic air cargo is made by multiplying the GDP of the states with the elasticity values derived by working group of Civil Aviation Sector. The forecast of air cargo (both domestic and international air cargo) is made and presented below.
Table 35: Forecast of International Air Cargo Traffic (in ‘000 MT per annum) for KBIC Airports
Year Trivandrum Calicut Cochin Kannur Coimbatore
2018 27.52 17.94 65.52 - 1.57
2020 29.82 19.44 80.69 7.52 1.98
2025 35.73 23.29 129.24 10.47 3.35
2030 42.06 27.42 193.39 14.58 5.40
2035 47.94 31.25 267.67 20.05 8.11
2040 53.25 34.71 347.74 27.56 11.50
Table 36: Forecast of Domestic Air Cargo Traffic (in ‘000 MT per annum) for KBIC Airports
Year Trivandrum Calicut Cochin Kannur Coimbatore
2018 1.20 0.93 10.75 - 8.89
2020 1.42 1.11 12.79 0.87 10.58

Kochi Bengaluru Industrial Corridor –Draft Perspective Plan for overall KBIC region - Draft
76
2025 2.09 1.69 18.96 1.22 16.06
2030 2.95 2.46 27.10 1.71 23.63
2035 3.90 3.33 36.29 2.36 34.23
2040 4.86 4.24 46.06 3.26 48.02
4.2.5. Infrastructure Analysis of CIAL as Anchor Airport
Cochin International Airport is owned and managed by Cochin International Airport Limited (CIAL) which has a unique ownership structure involving equity contributions from Government of Kerala, financial institutions, and more than 16,000 individual investors who are mostly nonresident Keralite (NRK). The airport is widely recognized as a low-cost functionally efficient airport in the country.
Passenger traffic at CIAL has grown from 0.2 million in FY 2000 to 10.2 million in FY 2018. In the past 5 years, traffic has grown at a CAGR of 16%. A significant part of air traffic is driven by strong state-domiciled Non-Resident Indian (NRI) community residing in the Middle East and attractiveness of the state as an international and domestic tourist destination. Also, CIAL is a low-cost functionally efficient no frills airport thereby justifying its sustainability as an anchor airport for the region. As far as passenger traffic is concerned, with a capacity of 21 million per annum CIAL doesn’t require any expansion in the short or medium term.
CIAL handles international and domestic cargo including perishables, valuables and general cargo. Air cargo traffic has increased from 5,951 Metric Tons (MT) in FY 2002 to 76,274 MT in FY 2018. In the past 5 years, cargo traffic at Cochin International Airport has grown at a CAGR of 12%. Out of the 76,274 MT of cargo handled in FY 2018, 65,523 MT was Export-Import cargo out of which exports have a 90% share. Cargo traffic is mainly dominated by exports to Middle East. In this regard, the cargo facilities have been assessed in details in the following sections.
4.2.5.1. Operating Performance of the Cargo terminal is in line with Indian Standards but still has room for improvement in comparison to global standards
Tariff at CIAL cargo terminal was analyzed in comparison with the tariff at other major Airports in India. At CIAL the tariff is lower as compared to other major Indian Airports in line with its strategy of operating as a low cost, no frills Airport. Also, the fact that the tariffs haven’t been increased since the terminal began operations makes the terminal more attractive for cargo inflow.
The Import and Export dwell times were analyzed in comparison to Indian as well as global standards. Dwell Time at Cochin Cargo Terminal is in line with other Airports in India, however, as per global Standards the Dwell time is generally in the range 4-8 Hrs. CIAL should strive to achieve those standards.
The following can be considered as areas of improvement.
• Implementation of Single Window Operations of Customs and other regulatory bodies.
• End to End E-Freight Implementation at the Airport.

Kochi Bengaluru Industrial Corridor –Draft Perspective Plan for overall KBIC region - Draft
77
4.2.5.2. Lack of Onward connectivity from CIAL is a major concern in sustaining Air Cargo Growth and aiding the Corridor as an Anchor Airport.
In order for an airport to sustain cargo growth and become an anchor for the region, onward connectivity through full freighter aircrafts is a necessity. CIAL is currently lacking in this area. As a result of CIAL lacking connectivity to most of the major air cargo hubs around the world, Cargo generated in the corridor is being diverted via Mumbai, Bengaluru and Chennai airports. The same can be observed from the table that almost 14,000 MT cargo is being diverted annually to other airports. This is a major cause of concern for CIAL. Lack of hub connectivity from Cochin Airport could prove a major hindrance for manufacturing in the region. Connectivity to major cargo hubs through dedicated freighters will enhance connectivity to ~120 countries and reduce dependency on bigger airports like Mumbai, Bengaluru and Chennai. Additional road transportation charges would increase logistics costs thereby impacting profitability. Cargo at CIAL has been growing at a CAGR of 12% over the past 5 Years (Higher than all Indian Airports ~7%). Hub connectivity would promote CIAL as a gateway airport and help arrest the leakage of cargo from the corridor thereby making the goods manufactured in the corridor competitive in the global market. The current freighters operational at CIAL include: Etihad Cargo, Qatar Airways Cargo and Saudia Cargo. Due to lack of hub connectivity through freighters, CIAL no longer remains the gateway port for cargo being exported to North America, EU, Latin American Countries, and South East Asia. The same can be inferred from the mapping of origin and destination of cargo diverted from the corridor in the adjacent table.
Origin and Destination of Cargo Diverted from the Corridor
Origin Destination
Tiruppur, Ernakulum,
Trivandrum, Thrissur, Coimbatore, Kozhikode,
Kannur, Erode
North America,
Africa,Australia,
South East Asia,LATAM
Figure 59 Cargo Tariff at Indian Airports Figure 58 Dwell time Comparison with Select Airports
Table 37 Cargo Diversion to other Airports
Table 38 Origin and Destination of Cargo Diverted from the Corridor

Kochi Bengaluru Industrial Corridor –Draft Perspective Plan for overall KBIC region - Draft
78
Hub connectivity from CIAL to major hubs around the world can be summarized in the following table:-
4.2.5.3. Arresting Leakages from the Corridor would increase Air Cargo tonnages by 30% and reduce logistics Costs for Exporters in the corridor
In order to establish CIAL as an anchor airport for the corridor and sustain the Air cargo growth, it is highly essential to arrest the leakage cargo produced in the region. This would not only increase the tonnages handled at CIAL by as high as 30% but also provide an efficient gateway to the manufacturers in the region by reducing their logistics expenses.
4.2.5.3.1. Setting up of AFS at key manufacturing regions
Air Freight Station (AFS) is an off-airport common user facility for handling and temporary storage of import and export cargo on behalf of an airport. Setting up of an AFS in key locations in the corridor would facilitate seamless movement of cargo manufactured in these regions to CIAL. This strategy would go a long way in establishing routes from the corridor to CIAL in the short to medium term and reduce dependency on Mumbai, Bengaluru and Chennai airports. The following locations have been identified for setting up AFS in the immediate term in terms of volume of cargo diverted from the corridor: Tiruppur, Thrissur, Kannur, and Trivandrum.
4.2.5.3.2. Increasing in Freighter Operations at CIAL
Freighter airlines play a vital role in providing onward connectivity and capacity from a gateway airport. They not only provide origin and destination connectivity but also increase the market potential of a gateway airport by providing hub connectivity which in turn opens up unserved locations. In view of the current commodities and destinations of air cargo in the corridor, the following have been identified as target airlines for CIAL.
1. In the immediate term, with Middle East, Europe being the prime market for the corridor
for marine products and perishables, Emirates Sky cargo should be pursued
2. In the short term, for serving perishables, textiles and other general cargo, South East Asia
and US, Singapore Airlines Cargo and Cathay Pacific Cargo freighters should be pursued
3. In the medium term, with electronics manufacturing expected to increase in the corridor,
Lufthansa and Turkish Cargo need to be targeted
Table 39 Hub Connectivity from CIAL

Kochi Bengaluru Industrial Corridor –Draft Perspective Plan for overall KBIC region - Draft
79
4.2.5.3.3. Proposal for Freighter Airlines for starting Operations at CIAL
In order to attract freighters to CIAL, the value propositions being offered need to be strongly highlighted in the proposals. The following strategies could be considered to enhance the value proposition for freighters to start operations at CIAL:-
1. CIAL growing at 12% CAGR over the past 5 years, current air cargo growth & potential from
the region adds immense value to the proposal
2. Incentivizing Freighter airlines by providing 100% landing and parking discounts
3. Offering prime slots for the airlines
4. Offering marketing & branding support in the corridor to the airline
4.2.5.4. CIAL offers sufficient cargo capacity for the medium term, however dedicated facilities for handling perishables and International Express is required in the Medium term.
With exports forming the majority of air cargo handled at CIAL, the following chart shows the major products being exported from CIAL.
Perishables, both agricultural as well as marine form the majority of cargo exported from CIAL. Textiles mainly from the Tiruppur/Coimbatore region holds good export potential.
CIAL has a well-developed state of Art Centre for perishable cargo with an area of 22,000 Sq. Ft. for export-import of perishable cargo with all modern facilities in line with international standards. However, the Current Centre for Perishable Cargo at CIAL is currently a common facility for all perishables. With increasing demand for export of marine, meat products etc., a separate center for handling frozen marine, meat Products needs to be developed.
The landside developments have major significance for movement of perishables for establishing an end to end cold chain for the handling of perishable products, in which the following can be considered: -
1. Bonded and Non Bonded Temperature Controlled Facilities (Cold Warehouses): Apart from the
facilities at the Cargo Terminal, for the development of the 50 acres earmarked for the
development of the Cargo Village, support infrastructure at the landside plays an important role
in establishing an end to end cold chain. With perishables comprising the majority of exports
from Cochin Airport, the demand for bonded and non-bonded warehouses at the landside is
expected to increase with the increase in cargo volumes.
2. An APEDA approved Pack house for Agricultural product exports into EU and USA: Apart from
marine products, fruits and vegetables comprise a major share of exports from CIAL. Currently,
these products are exported mainly to the Middle East and Europe. With regulations in EU and
USA demanding treatment of agri perishables, the role of pack houses becomes highly
significant in this regard. Establishing an APEDA approved pack house in the Cargo Village
would increase exports into highly lucrative markets in Europe and US.
Imports at CIAL have registered slow growth over the past few years at CIAL. Imports mainly comprise of unaccompanied baggage, personal effects & express cargo, valuable cargo. In order to establish itself as an Anchor Airport for the region, CIAL needs to develop a dedicated international express terminal. With increase in industrialization in the corridor, express cargo would have an important role not only in the development of the airport, but also contribute towards the development of the corridor. Examples of Leipzig Halle Airport, Germany and Jaipur Airport can be considered where International Express operations had a significant impact on the Cargo throughput at the Airport.
Figure 60 Export Commodities at CIAL

Kochi Bengaluru Industrial Corridor –Draft Perspective Plan for overall KBIC region - Draft
80
Jaipur Airport in Rajasthan showed similar results after starting of International Express operations:-
Case Study: Jaipur Airport International Express Operations
✓ Started International Express Operations in 2015. ✓ Air Cargo throughput Growth:-
✓ 2015-16: 188% ✓ 2016-17: 72%
Figure 61 Case Study- Leipzig Halle Airport

Kochi Bengaluru Industrial Corridor –Draft Perspective Plan for overall KBIC region - Draft
81
4.2.6. Proposed airport development works
The Airport Infrastructure proposals for KBIC region are identified based on the demand forecast. Most of the proposals suggested are either committed or planned by AAI, CIAL, GoK or GoTN in anticipation of future demand.
Table 40 Ongoing and proposed developments for KBIC airports
S.No Development works Cost Date of Commencement
Predicted Date of Completion
Trivandrum airport
Ongoing development works
1 Extension of airside arrival corridor with rotunda at NITB (C&E)
12.128 cr. 02.10.2015 01.08.2017
2
Extension of Parallel taxi track towards runway 32 beginning & runway 14 beginning including construction of isolation bay
69.07 cr. 17.07.2015 16.01.2017
3 Resurfacing and strengthening of runway and taxiways
55.67 cr. 20.11.2015 31.03.2017
Proposed development works
1 Construction of new ATC Complex/ Technical block at Chackai
30.00 cr. - -
2 Construction of B, C & D type quarters at AAI Colony
12.17 cr. - -
3 Construction of Domestic Terminal building at Chackai Side
300.00 cr. - -
4 Construction of line maintenance building
6.00 cr. - -
5 Construction of new fire station at Chackai
20.00 cr. - -
Calicut airport
Ongoing development works
1 Runway Strengthening and re-carpeting
50.93 Cr. 07.08.2015 15.01.2017
2 New International Arrival Building 85.18 Cr 16.12.2015 31.12.2017
Proposed development works
1 Extension of Runway ( Including RESA)
In Planning Stage
2 Provision of Cat I App lighting system
3
Dedicated water supply from cheekode project to Calicut Int. Airport and allied works.(Deposit work)
6.3 Cr. - -
Coimbatore airport

Kochi Bengaluru Industrial Corridor –Draft Perspective Plan for overall KBIC region - Draft
82
Ongoing development works
1 Provision of 2 nos. of Aerobridges 2.63 cr. 05.05.16 31.05.17
2 C/o two nos. Additional parking bays
5.19 cr. 12.09.16 Apr-17
Proposed development works
1 Covering of Nallah in the Operational area.
1.61 Cr. In Tender stage -
2 Construction of Staff Quarters
21.61 Cr. Under process for A/A & E/S
3 Facelift works of Terminal building at Coimbatore International Airport
- - -
4 i. Providing Tensile Fabric Canopy 5.45 cr. Work awarded
5 ii. Other balance facelift works 4.59 cr. In Tender stage -

Kochi Bengaluru Industrial Corridor –Draft Perspective Plan for overall KBIC region - Draft
83
4.3. Road Infrastructure
Road infrastructure is the backbone of any economy, it is an essential requirement for sustained growth and to ensure efficient movement of people and goods. The road framework in Kerala though well-developed faces the issue of unplanned constructions along the network which poses a challenge to capacity augmentation. The existing utilization is well beyond capacity and the traffic is currently increasing at the rate of 11% per annum. Due to limited right of way and land acquisition issues, expansion projects are currently delayed thereby adding to the already prevalent high utilization issue.
4.3.1. Sector Overview
The influence area of Kochi-Bengaluru Industrial Corridor (KBIC) covers about 18 districts in Kerala and Tamil Nadu (nine in each state).
Main spine of the corridor is NH-544 and NH-44. NH-544 starts at Kochi and ends at Salem and in continuation, NH-44 forms as part of the main spine i.e. from Salem to Krishnagiri District. It is considered that the KBIC corridor will impact 100km area on the either side of NH 544.
Figure 62 KBIC road network

Kochi Bengaluru Industrial Corridor –Draft Perspective Plan for overall KBIC region - Draft
84
Details of National Highways and District-wise road network information in Kerala are provided in the following tables. Table 41 Details of Road network in Kerala
Sl. No. NH No. From To Length of NH in Kerala (Km)
1 NH 66 Thalappadi Kaliyikkavila 669
2 NH 544 Walayar Edappally 168
3 NH 85 Bodimetu Kundanoor 168
4 NH 744 Kollam Kazhuthuruthy 81
5 NH 766 Kozhikode Muthanga(Kerala- Karnataka Border)
118
6 NH 966 Kozhikode Palakkad 125
7 NH 183 Kollam Theni (Tamil Nadu Border )
216
8 NH 966 B Wellington Island Kundanoor 6
9 NH 966 A Vallarpadam Kalamassery 17
10 NH 183 A Bharanikavu Pathanamthitta (via ) Vandiperiyar
117
11 NH 185 Adimaly Kumali (via ) Painavu 96
Total Length of National Highways in Kerala 1,782
Table 42 District-wise road information
Sl. No. District State Highways
Major District Roads
Total
1 Alappuzha 171 1,301 1,472
2 Kottayam 407 3,050 3,456
3 Idukki 998 1,869 2,867
4 Ernakulam 325 2,760 3,085
5 Thrissur 374 1,690 2,064
6 Palakkad 246 1,939 2,185
7 Malappuram 375 2,305 2,680
8 Kozhikode 377 2,077 2,455
9 Kannur 245 2,021 2,265
Total Length of road in KBIC region (Km) 3,518 19,013 22,530
Total Length of road in Kerala (Km) 4,342 27,470 31,812
Percentage of roads in KBIC region 81% 69% 71%
It can be observed that National highways in KBIC region constitute around 77% of the total NH road network in Kerala whereas R&B Roads (comprising of SH and MDR) constitutes 81% and 69% of the total road network in Kerala respectively.

Kochi Bengaluru Industrial Corridor –Draft Perspective Plan for overall KBIC region - Draft
85
4.3.1.1. Core Road Network
Major road network in the KBIC region is described in the following table.
Table 43 Major Road Network in KBIC Region
Road Name
Remarks
NH-544 This is the major spine road connecting Kochi with the various districts of Kerala and Tamil Nadu viz. Ernakulum, Thrissur, Palakkad, Coimbatore, Erode and Salem. The lane configuration of the road is predominantly four lane road. Six laning is under construction between Thrissur and Vadakancherry
NH-44
(Tamil Nadu)
This road is an extension of spine road network from Salem to Hosur connecting Dharmapuri and Krishnagiri. It is a four lane road from Salem to Krishnagiri and the final section between Krishnagiri and Hosur is a six lane road.
This network also passes through Namakkal and connects Karur which is located within the KBIC region in the south of spine network.
NH-66 National Highway 66 (Erstwhile NH-17 and a part of NH-47) is a busy National Highway that runs roughly north–south along the western coast of India, parallel to the Western Ghats. It connects Panvel (a city south of Mumbai) to Kanyakumari, passing through the states of Maharashtra, Goa, Karnataka, Kerala and Tamil Nadu. The NH66 touches the Arabian Sea at Maravanthe in Karnataka, Thalassery, Alappuzha and Kollam in Kerala.
Within KBIC region, NH-66 passes through following cities or towns: Taliparambu, Kannur, Thalassery, Vatakara, Payyoli, Koyilandi, Kozhikode, Feroke, Ramanattukara, Tirurangadi, Kottakkal, Valanchery, Ponnani, Chavakkad, Kodungallur, North Paravur, Kochi, Cherthala, Alappuzha, Ambalapuzha, Haripad, and Kayamkulam.
NH-966 National Highway 966 (NH 966) is a highway which connects Palakkad, Malappuram and Kozhikode district headquarters in Kerala. It was previously known as NH 213. It covers a distance of 125 km. It is one of the major National Highways which connect NH-544 and NH-66. At Ramanattukara, near Kozhikode, it joins NH 66 and at Palakkad it joins NH 544.
NH-966A
National Highway 966A (NH 966A) starts at Kalamassery (junction with NH 544) and ends at Vallarpadam International Container Transhipment Terminal in Kochi.
NH-966B
National Highway 966B (Old NH 47A) covers a distance of 5.920 km between Kundannoor and Willingdon Island in Kochi. It is the second-shortest national highway in India after NH 548 and NH 118.
NH-766 National Highway 766 (NH 766) (previously NH-212) connects Kozhikode in Kerala with Kollegal in Karnataka via Mysore. Of the total distance of 272 km, 117 km is in Kerala and 155 km is in Karnataka. The highway passes through dense forests of Western ghats of India.
The section of the road from Lakkidi in Wayanad to Adivaram (Thamarassery) called as Wayanad Churam with nine hairpin bends.
NH-183 National Highways 183 (previously known as NH 220) connects Kollam in Kerala with junction with NH-83 near Dindigul in Tamil Nadu. Starting from NH 66 in Kollam city, it runs northwards and turns east at Kottayam and runs along the northern border of Periyar Wildlife Sanctuary before crossing the border into Tamil Nadu and end near Dindigul, where it joins NH 83 (Coimbatore - Nagapattinam).
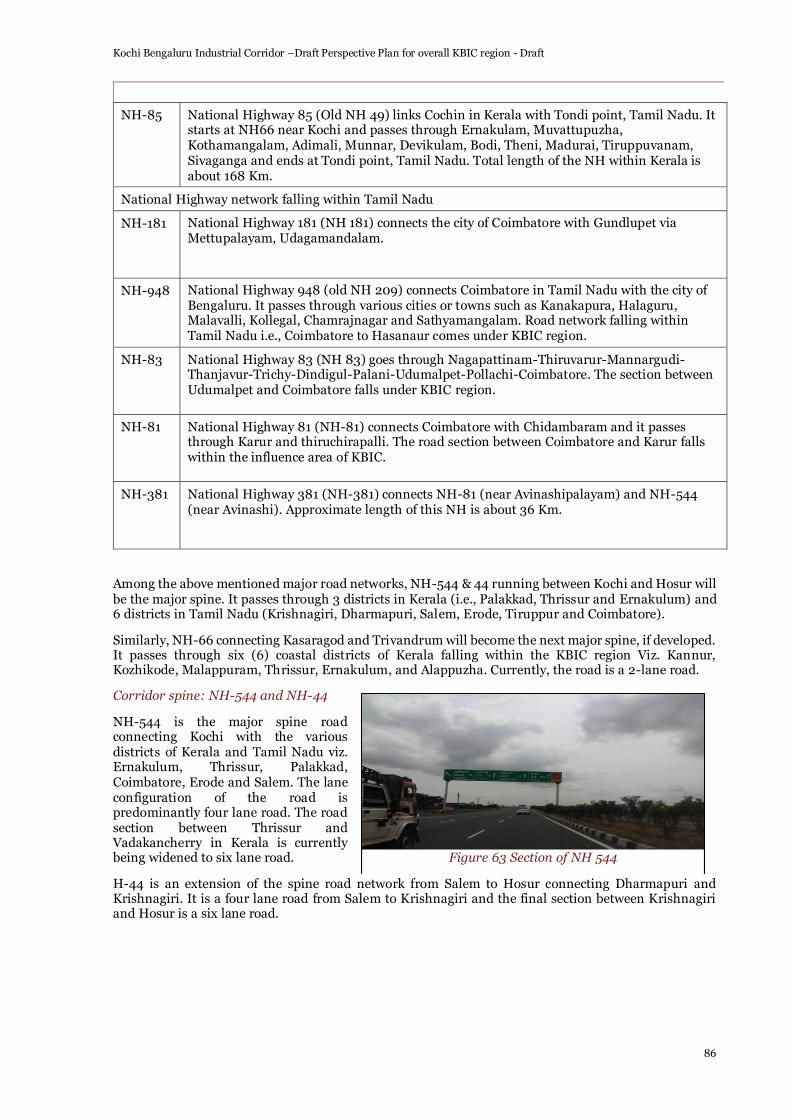
Kochi Bengaluru Industrial Corridor –Draft Perspective Plan for overall KBIC region - Draft
86
NH-85 National Highway 85 (Old NH 49) links Cochin in Kerala with Tondi point, Tamil Nadu. It starts at NH66 near Kochi and passes through Ernakulam, Muvattupuzha, Kothamangalam, Adimali, Munnar, Devikulam, Bodi, Theni, Madurai, Tiruppuvanam, Sivaganga and ends at Tondi point, Tamil Nadu. Total length of the NH within Kerala is about 168 Km.
National Highway network falling within Tamil Nadu
NH-181 National Highway 181 (NH 181) connects the city of Coimbatore with Gundlupet via Mettupalayam, Udagamandalam.
NH-948 National Highway 948 (old NH 209) connects Coimbatore in Tamil Nadu with the city of Bengaluru. It passes through various cities or towns such as Kanakapura, Halaguru, Malavalli, Kollegal, Chamrajnagar and Sathyamangalam. Road network falling within Tamil Nadu i.e., Coimbatore to Hasanaur comes under KBIC region.
NH-83 National Highway 83 (NH 83) goes through Nagapattinam-Thiruvarur-Mannargudi-Thanjavur-Trichy-Dindigul-Palani-Udumalpet-Pollachi-Coimbatore. The section between Udumalpet and Coimbatore falls under KBIC region.
NH-81 National Highway 81 (NH-81) connects Coimbatore with Chidambaram and it passes through Karur and thiruchirapalli. The road section between Coimbatore and Karur falls within the influence area of KBIC.
NH-381 National Highway 381 (NH-381) connects NH-81 (near Avinashipalayam) and NH-544 (near Avinashi). Approximate length of this NH is about 36 Km.
Among the above mentioned major road networks, NH-544 & 44 running between Kochi and Hosur will be the major spine. It passes through 3 districts in Kerala (i.e., Palakkad, Thrissur and Ernakulum) and 6 districts in Tamil Nadu (Krishnagiri, Dharmapuri, Salem, Erode, Tiruppur and Coimbatore).
Similarly, NH-66 connecting Kasaragod and Trivandrum will become the next major spine, if developed. It passes through six (6) coastal districts of Kerala falling within the KBIC region Viz. Kannur, Kozhikode, Malappuram, Thrissur, Ernakulum, and Alappuzha. Currently, the road is a 2-lane road.
Corridor spine: NH-544 and NH-44
NH-544 is the major spine road connecting Kochi with the various districts of Kerala and Tamil Nadu viz. Ernakulum, Thrissur, Palakkad, Coimbatore, Erode and Salem. The lane configuration of the road is predominantly four lane road. The road section between Thrissur and Vadakancherry in Kerala is currently being widened to six lane road.
H-44 is an extension of the spine road network from Salem to Hosur connecting Dharmapuri and Krishnagiri. It is a four lane road from Salem to Krishnagiri and the final section between Krishnagiri and Hosur is a six lane road.
Figure 63 Section of NH 544
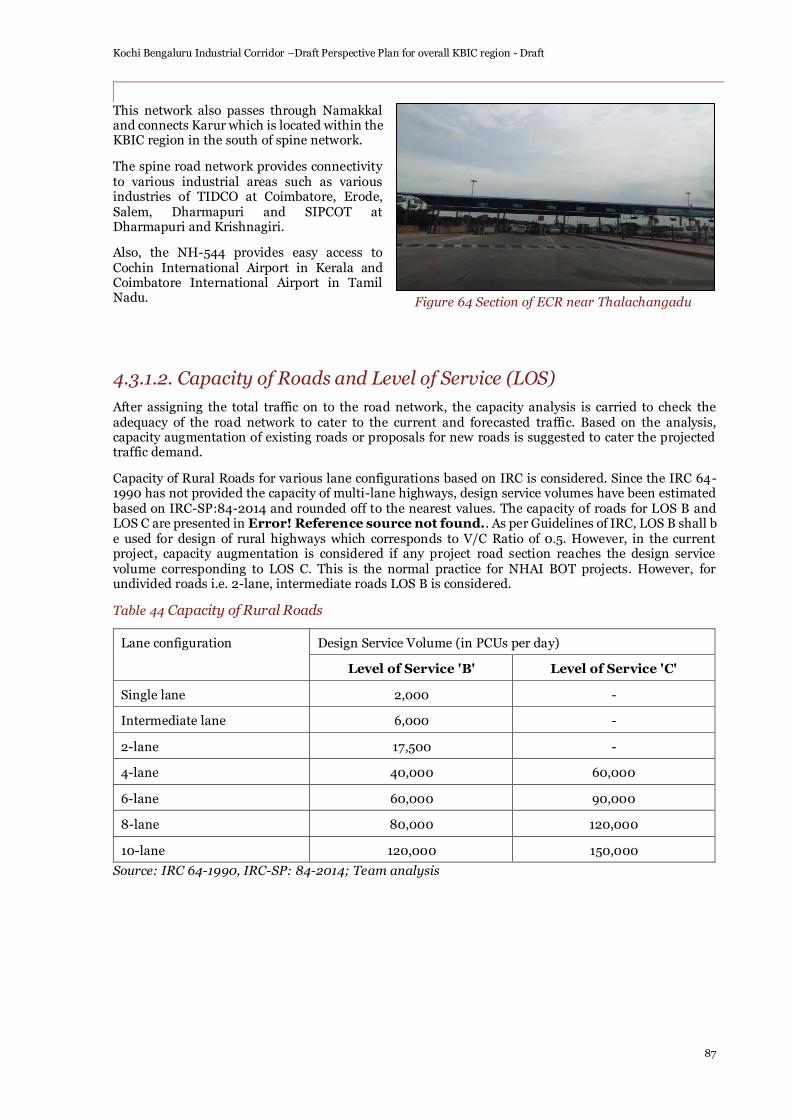
Kochi Bengaluru Industrial Corridor –Draft Perspective Plan for overall KBIC region - Draft
87
This network also passes through Namakkal and connects Karur which is located within the KBIC region in the south of spine network.
The spine road network provides connectivity to various industrial areas such as various industries of TIDCO at Coimbatore, Erode, Salem, Dharmapuri and SIPCOT at Dharmapuri and Krishnagiri.
Also, the NH-544 provides easy access to Cochin International Airport in Kerala and Coimbatore International Airport in Tamil Nadu.
4.3.1.2. Capacity of Roads and Level of Service (LOS)
After assigning the total traffic on to the road network, the capacity analysis is carried to check the adequacy of the road network to cater to the current and forecasted traffic. Based on the analysis, capacity augmentation of existing roads or proposals for new roads is suggested to cater the projected traffic demand.
Capacity of Rural Roads for various lane configurations based on IRC is considered. Since the IRC 64-1990 has not provided the capacity of multi-lane highways, design service volumes have been estimated based on IRC-SP:84-2014 and rounded off to the nearest values. The capacity of roads for LOS B and LOS C are presented in Error! Reference source not found.. As per Guidelines of IRC, LOS B shall be used for design of rural highways which corresponds to V/C Ratio of 0.5. However, in the current project, capacity augmentation is considered if any project road section reaches the design service volume corresponding to LOS C. This is the normal practice for NHAI BOT projects. However, for undivided roads i.e. 2-lane, intermediate roads LOS B is considered.
Table 44 Capacity of Rural Roads
Lane configuration Design Service Volume (in PCUs per day)
Level of Service 'B' Level of Service 'C'
Single lane 2,000 -
Intermediate lane 6,000 -
2-lane 17,500 -
4-lane 40,000 60,000
6-lane 60,000 90,000
8-lane 80,000 120,000
10-lane 120,000 150,000
Source: IRC 64-1990, IRC-SP: 84-2014; Team analysis
Figure 64 Section of ECR near Thalachangadu

Kochi Bengaluru Industrial Corridor –Draft Perspective Plan for overall KBIC region - Draft
88
The characteristics of traffic for various level of service (LOS) and the corresponding V/C ratios are presented below:
• LOS A: condition of free flow (V/C ratio up to 0.33)
• LOS B: reasonably free flow (V/C varies from 0.34 to 0.50)
• LOS C: represents stable range of flow but individual users will start getting affected with other vehicles in the traffic stream (V/C ratio varies from 0.51 to 0.70)
• LOS D: represent the limit of stable flow and with condition approaching close to unstable flow (V/C Ratio varies from 0.71 to 0.80)
• LOS E: represents operating conditions when traffic volumes are at or close to the capacity level (V/C ratio 0.81 to 1.00) which results in unstable flow
• LOS F: represents zone of forced or breakdown flow. This condition occurs when the amount of traffic approaching a point exceeds the amount which can pass it. Queues form behind such locations. Stop and Go situation will prevail (V/C ratio more than 1.00)
As per IRC: SP: 99-2013, rural expressways shall be designed for Level of Service B. For the purpose of design and future augmentation of the project expressway, the design service volume for level of service- B for plain/rolling terrain shall be 1300 PCU/hr/lane. The design service volume per day will depend on the peak hour flow. The adopted design service volume for rural expressways for the current project is presented in table below.
Table 45 Capacity of Rural Expressways
Lane configuration Design Service Volume (in PCUs per day) for LOS B
4-lane 86,000
6-lane 130,000
8-lane 173,000
Note: The capacity values are applicable for Plain and rolling Terrain and assuming peak hour traffic as 6%.
4.3.1.3. Road Network Characteristics in KBIC Influence Area
The characteristics of the existing road network is presented in terms of category, length (in km), current traffic (i.e.2018) in terms of PCUs, V/C Ratio and LOS. This data is compiled based on the database of consultants as well as data collected from government agencies and other sources.
Database available with the consultants is updated to the base year (2018) by using appropriate growth rates. Wherever data is not available, suitable assumptions are made based on site visits.

Kochi Bengaluru Industrial Corridor –Draft Perspective Plan for overall KBIC region - Draft
89
The road network characteristics in terms of category of road, length, existing lane configuration, traffic survey location, traffic intensity in PCUs, V/C ratio and LOS for various roads within the KBIC influencing districts of Kerala and the spine road network is presented below.
Table 46 Existing Road Network Characteristics for all the major roads in KBIC (2018)
Sl No. Name of the Road Length (km)
Category No. of Lanes
Total Traffic (PCUs)
V/C LOS
Spine Road Network
1 Edapally-Vytilla-Aroor
31.483 NH 544 Four Lane 65,434 1.09 F
2 Kundannur 10 NH 544 Four Lane 34,684 0.58 C
3 Thrissur-Angamaly-Edapally
64.94 NH 544 Four Lane 71,465 1.19 F
4 Thrissur-Vadakanchery
35 NH 545 Six Lane 71,465 0.79 D
5 Walayar-Vadakanchery
53.494 NH 544 Four Lane 27,168 0.45 B
6 Chengapalli-Coimbatore Bypass
39.45 NH 544 Four Lane 45,324 0.76 D
7 Kumarapalayam-Chengapalli
48.51 NH 544 Four Lane 53,198 0.89 E
8 Salem-Kumarapalayam
53.525 NH 544 Four Lane 38,681 0.64 C
9 Salem-Thumbipadi 25 NH 44 Four Lane 57,019 0.95 E
10 Krishnagiri-Thumbipadi
86 NH 44 Four Lane 58,512 0.98 E
11 Hosur-Krishnagiri 52 NH 44 Six Lane 61,900 0.69 C
Ernakulam District
1 Ernakulam-Pattimattom
23 SH 41 Two lane 8,222 0.47 B
2 Pattimattom-Muvattupuzha
16.5 Two lane 8,222 0.47 B
3 Ernakulam-Thekkady Road
12 Single/Intermediate
5,706 0.57 C
4 Aluva – Parur- Cherai – Beach Road
20.2 SH Two lane 11,710 0.67 C
5 Perumbavoor – Aluva Road
6.8 SH Two lane 14,827 0.85 E
6 Perumbavoor – Puthenkurissu Road
18 Two lane 10,250 0.59 C

Kochi Bengaluru Industrial Corridor –Draft Perspective Plan for overall KBIC region - Draft
90
Sl No. Name of the Road Length (km)
Category No. of Lanes
Total Traffic (PCUs)
V/C LOS
7 Vypin-Pallipuram Road
25.5 SH 63 Intermediate/Two
lane
17,338 1.16 F
8 UC College Thadikkakadavu Paravoor-Airport Road
5.4 MDR Single/Intermediate
3,534 0.35 B
9 Thathamangalam-Nattukal Road
14.2 SH 25 Intermediate/Two
lane
9,704 0.65 C
10 Muvattupuzha-Theni Road
15.2 SH 43 Single/Intermediate
2,427 0.24 A
11 Manakkakadavu – Pallikkara
3.9 SH 41 Two lane 9,362 0.53 C
12 Kizhakkambalam – Nellad
14.4 SH 41 Two lane 8,328 0.48 B
Kottayam District
13 Vaikom-Kaduthuruthi 16.5 SH 15 Two lane 16,396 0.94 E
14 Kaduthuruthi-Ettumanur Road
16.8 SH 15 Two lane 17,032 0.97 E
15 Kottayam – Kumarakom Road
14 SH 42 Two lane 12,329 0.70 D
16 Kumarakom – Cherthala Road
17.4 SH 40 Two lane 13,677 0.78 D
17 Kottayam – Ettumanoor Road
10.7 SH 1 Two lane 29,540 1.69 F
18 Kumarakam – Vaikom – Vechoor Road
20 SH Two lane 9,756 0.56 C
19 Changanassery-Alapuzha Road (Ramankary)
12 SH 11 Two lane 19,066 1.09 F
20 Kottayam-Kozhenchery Road
16.26 SH 9 Intermediate/Two
lane
7,014 0.47 B
21 Kanjirapally NH 183 Two lane 6,067 0.35 B
22 Vaikom - Vechoor Rd 9 MDR Two lane 13,249 0.76 D
Idukki District
23 Sabarimala-Neriyammangalam
152 SH 44 Intermediate/Two
lane
6,874 0.46 B

Kochi Bengaluru Industrial Corridor –Draft Perspective Plan for overall KBIC region - Draft
91
Sl No. Name of the Road Length (km)
Category No. of Lanes
Total Traffic (PCUs)
V/C LOS
24 Idukki – Neriyammangalam SH (19 to 49) Road
30 SH Two lane 3,308 0.19 A
25 Thodupuzha - Puliyanmala ( Paramada – Kattappana)
44 SH Two lane 3,692 0.21 A
26 Punalur-Thodupuzha 127 SH 8 Two lane 15,565 0.89 E
Alappuzha District
27 Chengannur-Muvattupuzha
90.2 SH 1 Two lane 22,965 1.31 F
28 Chengannur - Ettumanoor
46.5 NH 183 Two lane 27,387 1.56 F
29 Alappuzha-Cherthala Road
6.1 NH 66 Two lane 49,949 2.85 F
30 Alappuzha-Punnapra Road
6 NH 66 Two lane 52,143 2.98 F
31 Alappuzha-Pallathuruthy
3.8 SH 11 Two lane 25,191 1.44 F
32 Puliaynnoor-Mini Civil Station Road
3 SH 32 Two lane 5,507 0.31 A
33 Ambalappuzha-Tiruvalla Road
19.4 SH 12 Two lane 11,605 0.66 C
34 Cherthala – Thannermukkam Road
8 SH Two lane 4,966 0.28 A
35 Kayamkulam – Karthikappally Road
14 SH Two lane 3,816 0.22 A
36 Thumboli-Kanjiramchira
3 SH 66 Two lane 12,689 0.73 D
37 Kommady-Powerhouse
1.8 NH 66 Two lane 36,132 2.06 F
38 Thanneermukkam-Alappuzha (Near Roadmukku)
16.5 SH 40 Two lane 20,751 1.19 F
39 Alappuzha-Madurai Road
23 SH 40 Two lane 10,814 0.62 C
40 Manimala-Pathanamthitta
32.9 SH 8 Two lane 11,066 0.63 C
Thrissur District
41 Perumbilavu-Pattambi
18.5 SH 39 Two lane 15,676 0.90 E

Kochi Bengaluru Industrial Corridor –Draft Perspective Plan for overall KBIC region - Draft
92
Sl No. Name of the Road Length (km)
Category No. of Lanes
Total Traffic (PCUs)
V/C LOS
42 Kodungallur-Shornur Road
29.8 SH 22 Two lane 29,240 1.67 F
43 Perumbilavu-Perinthalmanna
43.5 SH 39 Two lane 15,515 0.89 E
44 Kodakara – Aloor Pariyapuram Road
20 SH Two lane 3,389 0.19 A
45 Kecheri – Akkikavu Road
9.8 SH Two lane 4,153 0.24 A
46 Thrissur-Mannuthy Road
5.2 MDR Two lane 12,557 0.72 D
47 Mudikkode - Karumatra
44.3 SH 22 Two lane 6,032 0.34 B
Kannur District
48 Muzhappilangad-Thalassery
8.4 NH 66 Two lane 29,744 1.70 F
49 Vadakara-Mahe 13 NH 66 Two lane 31,568 1.80 F
50 Thalassery-Valavupara
35.6 SH 30 Two lane 18,259 1.04 F
51 Puthiyangadi-Chovva Road
81.7 SH 38 Two lane 12,247 0.70 C
52 Chovva-Mattannur 22.8 MDR (New NH)
Two lane 20,881 1.19 F
53 Chovva-Chalode-Mattannur Road
23 SH Two lane 6,120 0.35 B
54 Alavil-Azhikode-Valiyaparamba-Azheekal Road
3 SH Two lane 3,597 0.21 A
55 Vellur- Aravanchal- Peringome- Padiyottuchal- Puligome Road
38 SH Two lane 4,823 0.28 A
56 Chirakkal – Kattampally – Mayyil- Kollalam Road
10 SH Two lane 3,521 0.20 A
57 Thalassery to Valavupara
35.6 SH 30 Two lane 15,703 0.90 E
58 Pilathara - Pappinissery
22.1 MDR Two lane 11,885 0.68 C

Kochi Bengaluru Industrial Corridor –Draft Perspective Plan for overall KBIC region - Draft
93
Sl No. Name of the Road Length (km)
Category No. of Lanes
Total Traffic (PCUs)
V/C LOS
59 Taliparambu - Iritty 44.8 SH 36 Two lane 8,660 0.49 B
60 Puthiyangadi-Chovva (Mamabaram Junction)
16.7 SH 38/MDR
17
Two lane 14,810 0.85 E
61 Mattannur-Iritty (Chavassery)
5.2 SH 30 Two lane 16,010 0.91 E
62 Iritty-Koottupuzha (Kunnoth)
14.2 SH 30 Two lane 10,106 0.58 C
Malappuram District
63 Angadipuram 65 NH 966 Two lane 26,457 1.51 F
64 Kondotty 60 NH 966 Two lane 30,744 1.76 F
65 Chattiparambu Jn SH Two lane 15634 0.89 E
66 Padaparamba Jn SH Two lane 15186 0.87 E
67 Thootha-Perinthalmanna (Near Olinkara)
6.4 SH 53 Two lane 12074 0.69 C
68 Feroke College – Vazhakkad – Areekode Road
3 SH Two lane 8787 0.50 C
69 Kondotty – Thirurangadi Road
12 SH Two lane 11941 0.68 C
70 Malappuram-Parappanangadi (Near Karathode)
32.5 SH Two lane 8732 0.50 B
71 Kulathur-Malappuram (Near Chattiparamba)
3.1 SH 71 Two lane 9031 0.52 C
72 Kooriyad Jn NH 66/SH 72
Two lane 33864 1.94 F
73 Kunnumpuram Jn SH Two lane 24039 1.37 F
74 Kottakkal Jn SH Two lane 20275 1.16 F
75 Vaniyambalam MDR Two lane 992 0.06 A
76 Vaniyamkulam-Valapuzha
14.3 MDR Two lane 1007 0.06 A
77 Pookottumpadam - Nilambur
9.4 SH 39 Two lane 6852 0.39 B
78 Manjeri - Olipuzha Road
9.7 Two lane 16776 0.96 E
79 Tirur - Kadalundi Road
MDR Two lane 18185 1.04 F

Kochi Bengaluru Industrial Corridor –Draft Perspective Plan for overall KBIC region - Draft
94
Sl No. Name of the Road Length (km)
Category No. of Lanes
Total Traffic (PCUs)
V/C LOS
80 Kottakkal - Kottapadi road
MDR Two lane 18289 1.05 F
Palakkad District
81 Ottappalam- Mannarcadu Road
31.34 SH Two lane 2233 0.13 A
82 Palakkad - Ponnai Road (Km 66.300 to km 76.500)
10.2 SH Two lane 13271 0.76 D
83 Ottappalam – Perinthalmanna Road
11 SH Two lane 5465 0.31 A
84 Kollengode - Puthunagaram Road
8.5 SH Two lane 5320 0.30 A
85 Pathiripala – Kongad Road
15 SH Two lane 5120 0.29 A
86 Nattukal – Velamthavalam Road
14 SH Two lane 5933 0.34 B
87 Chittor SH 27 Two lane 10622 0.61 C
88 Para-Pollachi Road 33 SH 52 Two lane 15927 0.91 E
89 Vadakkenchery - Pollachi
39 SH 58 Two lane 14488 0.83 E
90 Mannur - Chaliyam 3 MDR Two lane 3183 0.18 A
91 Ottapalam MDR Two lane 11257 0.64 C
92 MES college-Payyanadam Road
4 MDR Two lane 4652 0.27 A
93 Palakkad Pollachi 45.7 SH 52 Two lane 15927 0.91 E
Kozhikode District
94 Kunnamangalam – Agasthiyarmoozhi Road
13.5 SH Two lane 6515 0.37 B
95 Thamarassery – Edavanna Road
41.8 SH Two lane 8363 0.48 B
96 Kuttiyadi SH 54 Two lane 21942 1.25 F
97 Koduvally Town NH 766 Two lane 14921 0.85 E
98 Perambra SH 38 Two lane 2847 0.16 A
99 Karaparamba SH 54 Two lane 21531 1.23 F
Note- Data obtained from www.nhtis.org (National Highway Toll Information System)
Data obtained from govt. agencies
Data provided based on Consultants Database and Experience
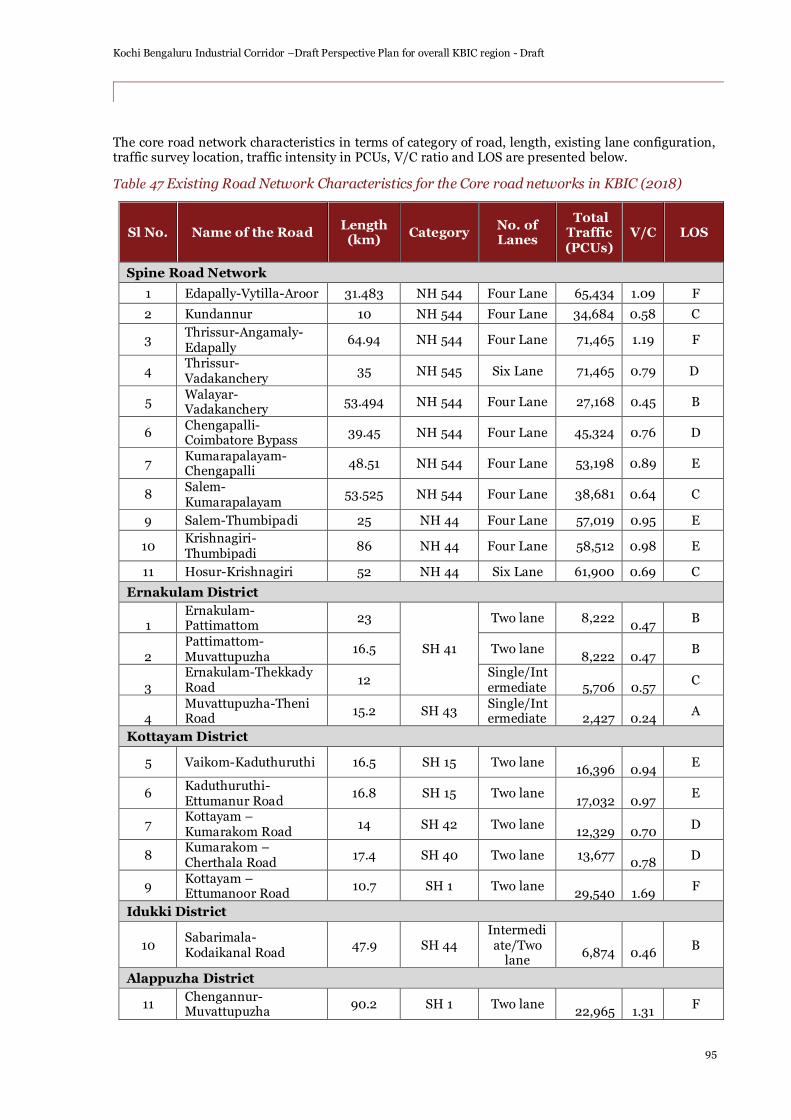
Kochi Bengaluru Industrial Corridor –Draft Perspective Plan for overall KBIC region - Draft
95
The core road network characteristics in terms of category of road, length, existing lane configuration, traffic survey location, traffic intensity in PCUs, V/C ratio and LOS are presented below.
Table 47 Existing Road Network Characteristics for the Core road networks in KBIC (2018)
Sl No. Name of the Road Length
(km) Category
No. of Lanes
Total Traffic (PCUs)
V/C LOS
Spine Road Network
1 Edapally-Vytilla-Aroor 31.483 NH 544 Four Lane 65,434 1.09 F
2 Kundannur 10 NH 544 Four Lane 34,684 0.58 C
3 Thrissur-Angamaly-Edapally
64.94 NH 544 Four Lane 71,465 1.19 F
4 Thrissur-Vadakanchery
35 NH 545 Six Lane 71,465 0.79 D
5 Walayar-Vadakanchery
53.494 NH 544 Four Lane 27,168 0.45 B
6 Chengapalli-Coimbatore Bypass
39.45 NH 544 Four Lane 45,324 0.76 D
7 Kumarapalayam-Chengapalli
48.51 NH 544 Four Lane 53,198 0.89 E
8 Salem-Kumarapalayam
53.525 NH 544 Four Lane 38,681 0.64 C
9 Salem-Thumbipadi 25 NH 44 Four Lane 57,019 0.95 E
10 Krishnagiri-Thumbipadi
86 NH 44 Four Lane 58,512 0.98 E
11 Hosur-Krishnagiri 52 NH 44 Six Lane 61,900 0.69 C
Ernakulam District
1 Ernakulam-Pattimattom
23
SH 41
Two lane 8,222
0.47 B
2 Pattimattom-Muvattupuzha
16.5 Two lane
8,222
0.47 B
3 Ernakulam-Thekkady Road
12 Single/Intermediate
5,706
0.57
C
4 Muvattupuzha-Theni Road
15.2 SH 43 Single/Intermediate
2,427
0.24
A
Kottayam District
5 Vaikom-Kaduthuruthi 16.5 SH 15 Two lane
16,396
0.94 E
6 Kaduthuruthi-Ettumanur Road
16.8 SH 15 Two lane
17,032
0.97 E
7 Kottayam – Kumarakom Road
14 SH 42 Two lane
12,329
0.70 D
8 Kumarakom – Cherthala Road
17.4 SH 40 Two lane 13,677
0.78 D
9 Kottayam – Ettumanoor Road
10.7 SH 1 Two lane
29,540
1.69 F
Idukki District
10 Sabarimala-Kodaikanal Road
47.9 SH 44 Intermediate/Two
lane
6,874
0.46
B
Alappuzha District
11 Chengannur-Muvattupuzha
90.2 SH 1 Two lane
22,965
1.31 F

Kochi Bengaluru Industrial Corridor –Draft Perspective Plan for overall KBIC region - Draft
96
Sl No. Name of the Road Length
(km) Category
No. of Lanes
Total Traffic (PCUs)
V/C LOS
12 Chengannur - Ettumanoor
46.5 NH 183 Two lane
27,387
1.56 F
13 Alappuzha-Cherthala Road
6.1 NH 66 Two lane
49,949
2.85 F
14 Alappuzha-Punnapra Road
6 NH 66 Two lane
52,143
2.98 F
15 Alappuzha-Pallathuruthy
3.8 SH 11 Two lane
25,191
1.44 F
Thrissur District
16 Perumbilavu-Pattambi 18.5 SH 39 Two lane
15,676
0.90 E
17 Kodungallur-Shornur Road
29.8 SH 22 Two lane
29,240
1.67 F
Kannur District
18 Muzhappilangad-Thalassery
8.4 NH 66 Two lane
29,744
1.70 F
19 Vadakara-Mahe 13 NH 66 Two lane
31,568
1.80 F
20 Thalassery-Valavupara 35.6 SH 30 Two lane
18,259
1.04 F
21 Puthiyangadi-Chovva Road
81.7 SH 38 Two lane
12,247
0.70 C
22 Chovva-Mattannur 22.8 MDR
(New NH) Two lane
20,881
1.19
F
Malappuram District
23 Angadipuram 65 NH 966 Two lane
26,457
1.51 F
24 Kondotty 60 NH 966 Two lane
30,744
1.76 F
Note- Data obtained from www.nhtis.org (National Highway Toll Information System) Data obtained from govt. agencies Data provided based on Consultants Database and Experience
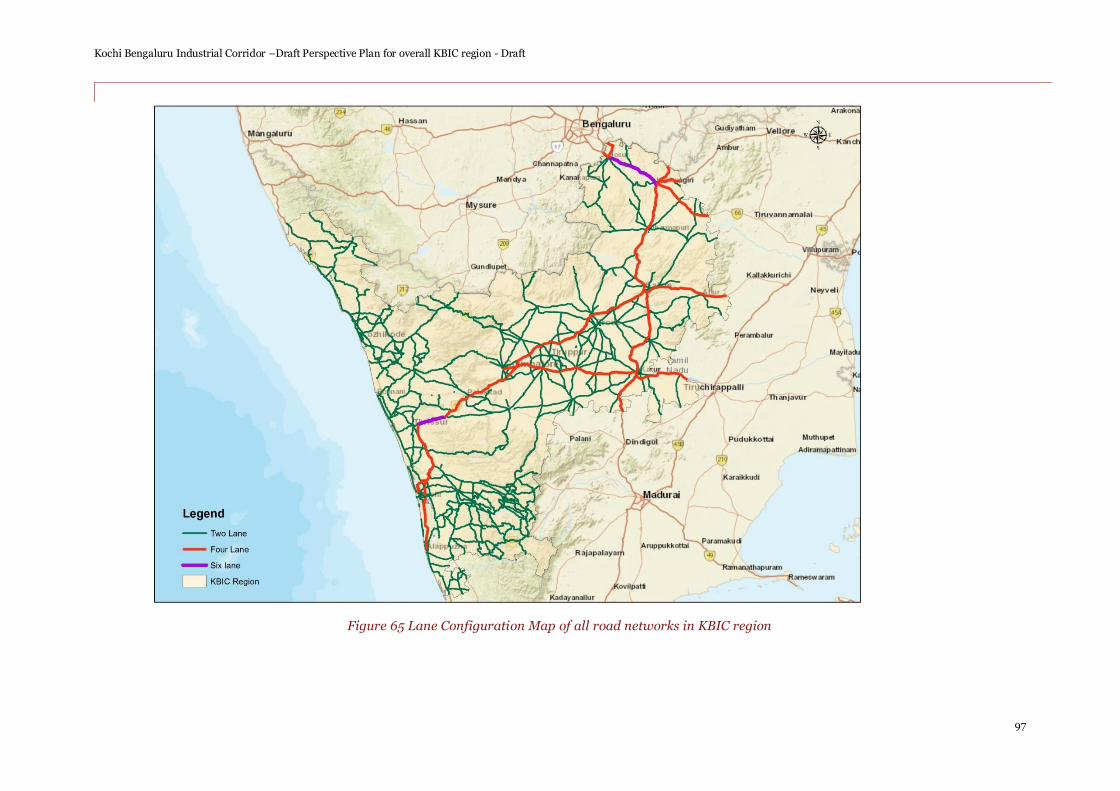
Kochi Bengaluru Industrial Corridor –Draft Perspective Plan for overall KBIC region - Draft
97
Figure 65 Lane Configuration Map of all road networks in KBIC region

Kochi Bengaluru Industrial Corridor –Draft Perspective Plan for overall KBIC region - Draft
98
Figure 66 Volume-Capacity roads for the core road network in KBIC region

Kochi Bengaluru Industrial Corridor –Draft Perspective Plan for overall KBIC region - Draft
99
4.3.1.4. Estimation of Generated Traffic
Estimation of Generated Traffic (Commercial): Generated traffic from industrial nodes is estimated from trip generation rates. No. of trucks generated from each industrial node is estimated based on area of development. The trip generation rates as listed below are used for the purpose.
Table 48 Truck Trip Generation Rates from Industrial Nodes
Land use Trip Generation Rates (Trucks per hectare)
Grain Mills 1.2
Rubber and Plastics 1.4
Chemicals and Petro Chemicals 1.4
Precision Engineering 1.2
Electronics 1.2
Food Processing 1.2
Machinery 1.5
Textiles 1.5
Other Manufacturing 1.2
Services 1.2
Note: Petrochemicals will be mostly transported via pipelines. Hence it is assumed that only 20% of the generated traffic will use road network. Chemicals will also be transported via pipelines. Hence it is assumed that only 40% of the generated traffic will use road network
Estimation of Generated Traffic (Passenger): Employees per hectare for each of the proposed node is used to calculate the total trips generated from the development. Further, a portion of trips are assigned to KBIC regional network based on likely attraction to various locations surrounding the development.
4.3.1.5. Traffic Assignment of Generated Traffic
The land demand details proposed for the KBIC region and the land proposed for the districts where land parcels is identified is presented below.
Table 49 Proposed Land Demand for the KBIC region
Details Area - BAU (Ha) Area - BIS (Ha)
Kerala 2,541 3,532
Tamil Nadu 14,502 17,402
Total 17,043 20,934
Area proposed in Palakkad, Kannur & Thrissur 1,305 1,836
% Share 8% 9%
Total land area proposed in KBIC region is about 17,000 Ha to 21,000 Ha out of which the share of the Land parcels identified in Palakkad (800 hectares), Kannur (286 hectares) and Thrissur ( 219 hectares) together accounts to only 8%.

Kochi Bengaluru Industrial Corridor –Draft Perspective Plan for overall KBIC region - Draft
100
Traffic is assigned on to the network based on possible O-D pattern and population and employment zones in the immediate influence area. The component of generated traffic likely to use rail is excluded before assignment on the available road network. The passenger vehicles are assumed to terminate nearest major towns located within 50 km. Phase-wise land demand by industry sector is considered for assessing the generated traffic.
Traffic demand forecast is carried out considering the KBIC node development and the traffic generated from each KBIC node is presented below.
Table 50 Total Generated Traffic from KBIC Region (2018)
KBIC Nodes Daily Traffic Generated (PCUs)
Commercial Traffic Passenger Traffic
Total Traffic Generated 2,017 6,774
4.3.1.6. Committed Road Proposals in KBIC Influence Area
The committed proposals in and around the project influence area by different agency and various stages of implementation are listed below.
Table 51 Committed Proposals
Project Recently Awarded
Sl. No NH No. Name of Project Length in Km. Proposed Configuration
1 66 Thalassery – Mahe Bypass (Km. 170.600 to Km. 188.000)
18.600 4-Lane
(Rigid Pavement)
Proposed for Award during 2017-18
Sl. No NH No. Name of Project Length in Km. Proposed Configuration
1 66 Kozhikode Bypass (Km 230.400 to 258.800)
28.400 6-Lane
(Flexible Pavement)
2 66 4/6 Laning Thalappady to Chengala (Km 17.200 to 57.200)
39.000 4/6-Lane
(Flexible Pavement
3 66 4/6 Laning Chengala to Kalikkadavu (Km 57.200 to 104.000)
47.800 4/6-Lane
(Flexible Pavement
4 66 Construction of Four-Lane of ROB near Neleshwaram
0.890 4-Lane
5 66 Kazhakoottam Flyover 2.720 4-lane
Projects for which DPR is under preparation
Sl. No Name of Project Length in Km Status
1 4 Laning Neleshwaram town to Thaliparamba (Kuttikole) Km 96+450 (Design Ch 94+248) to 137+900(Design Ch
41.450 Bidding Stage

Kochi Bengaluru Industrial Corridor –Draft Perspective Plan for overall KBIC region - Draft
101
Sl. No Name of Project Length in Km Status
134+650) of old NH17(New NH-66) under NHDP Phase III
2
4 Laning Thaliparamba (Kuttikole) to Muzhapilangad Km 137+900 (Design Ch 134+650) to 170+600(Design Ch 164+860) of old NH17 (New NH-66) under NHDP Phase III.
32.700 DPR in progress by M/s AECOM
3
4 laning of Azhiyur to Vengalam Km 188+000 (Design Ch 189+200) to 230+400(Design Ch 232+100) of old NH17(New NH-66)
42.400 Bidding Stage
4 Kozhikode Bypass (Vengalam to Ramanattukara) from Km. 230.400 to 258.800)
28.400 Bidding Stage
5 Ramanattukara to Kuttippuram from 258.800 to 318.000
59.200
DPR in progress
6
4 laning of Kuttippuram - Edappally – Thuravoor from Km 318.000 to Km 475.600 of NH-17 (New NH-66) under NHDP Phase III.
157.600
7 Thuravoor Km. 379.100 – Paravoor Km. 417.000
37.900
DPR in progress
8 Paravoor Km. 417.000– Kottankulangara Km. 454.500
37.500
9 Kottankulangara Km. 454.500 - Start of Kollam Bypass Km. 486.000
31.500
10 Kottankulangara Km. 486.000 - Start of Kollam Bypass Km. 517.800 31.800
11 Kadambattukonam Km. 517.800 – Kazhakoottam Jn Km. 547.320
29.520
12 Ernakulam Bypass - 4-laning starting at Angamaly junction through various PWD roads and Joining at Kundannoor Junction.
54 DPR in progress
Total length 584

Kochi Bengaluru Industrial Corridor –Draft Perspective Plan for overall KBIC region - Draft
102
Sl.No. NH No. Section NH Division Length (in km)
Remarks
1 NH85 (old NH49)
Km119/017 to Km 161/300 (BODIMETTU to MUNNAR)
Muvattupuzha 41.78 DPR finalized EPC Contract Awarded
2 NH85 (old NH49)
Thrippunithura to Munnar - from km 280/000 to 163/300
Muvattupuzha 116.7 DPR in progress
3 NH766 (old NH212)
Km 5/000 to 40/000 including bypasses at Koduvally and Thamarassery
Kozhikode 45 DPR in progress
4 NH766 (old NH212)
Km 40/000 to (Puthupady) to km 117/600 (Muthanga)
Kozhikode 77.6 DPR in progress
5 NH966 (old NH213)
Makkaraparambu bypass km 53/000 to 63/000
Malappuram 10 DPR in progress
6 NH966 (old NH213)
Providing paved shoulders Km 87/000 to 140/960
Malappuram 53.96 DPR in progress
7 NH183 (old NH220)
Widening to 2 lane with paved shoulder from Kottayam to (Ponkunnam) Mundakayam-km 106/70 to 137/00
Muvattupuzha 30.3 DPR in progress
8 NH183 (old NH220)
NH 183 (old 220) km 137/00 to Km 160/300 (Ponkunnam to Mundakkayam)
Muvattupuzha 23.3 Bid Stage
9 NH183 (old NH220)
Mundakkayan to Kumili - km 160/000 to 215/450
Muvattupuzha 55 DPR in progress
10 New NH
New NH from Alappuzha (NH47) Changanassery – Vazhoor – 14th Mile (NH220)
Alappuzha 50 DPR in progress
11 New NH
New NH from Kayamkulam (NH47) to Junction near Thiruvalla (NH183)
Alappuzha 23 Bid Stage
12 New NH
New NH from Junction of NH 183 near Vijayapuram to Junction of NH85
Muvattupuzha 45 DPR in progress

Kochi Bengaluru Industrial Corridor –Draft Perspective Plan for overall KBIC region - Draft
103
Among the above mentioned roads taken for upgradation, 4-laning of NH-66 will be a vital project as this road network connects the North – south part of Kerala and also will play significant role for the movement of traffic generated by KBIC project.
4.3.2. Traffic Demand Forecast
Normal and Generated traffic are the two major components of traffic on road network. Traffic currently plying on the road is known as normal traffic. This component of traffic is forecasted to future years based on the growth rates.
Traffic generated from identified land parcels as well the other industrial developments in KBIC Influence region is known as generated traffic. Assessment of generated traffic is made both from the industrial land parcels and gateway ports. Generated traffic from industrial land parcels is estimated based on area of development, phasing and type of industrial sector proposed. Generated traffic from gateway ports is based on cargo forecast at ports duly excluding the component of traffic considered between gateway and nodes. The component of traffic likely to use the road is estimated based on cargo type.
4.3.2.1. Estimation of Traffic Growth Rates
In general, the factors, which influence the growth of traffic, are listed below:
Economic
• Gross Domestic Product at the National level
• Net State Domestic Product at the State level
• Agricultural Output
• Industrial Output
• Per capita Income
Demographic
(old NH49) near Oonnukal
13 New NH
Stretch of new NH from junction of NH766 (old NH212) near Kalpetta connecting Mananthavadi
Kozhikode 50 DPR in progress
14 New NH
Road connecing Chovva - Mattannur-Koottupuzha - Valavupra - Makkottam -Virajpetta - Madikkeri - Mysore (stretch in Kerala)
Kannur 55 DPR in progress
15 New NH Road connecting Cherkala – Kalladka (stretch in Kerala)
Kannur 28 DPR in progress
16 New NH
Road connecting Vadakkenchery – Pollachi (stretch in Kerala)
Malappuram 40 DPR in progress

Kochi Bengaluru Industrial Corridor –Draft Perspective Plan for overall KBIC region - Draft
104
• Population
• Rural/Urban mix of population
• Income
• Others (e.g. tourism etc.,)
Traffic growth rate is generally established by giving due consideration to the above factors. Typically an estimate of the growth rate is obtained from the past trend and this is compared with the growth rate obtained from the econometric models. Most widely used methods for the macro level forecasts of the traffic include:
• Trend Analysis
• Elasticity Approach
Trend Analysis: Trend analysis involves deriving annual traffic growth rate of traffic based on past traffic data collected on the road stretches and extrapolating the trends for future years. However, trend analysis has shown wide variations as consistent data is not available at regular intervals and also growth rate is at certain locations are influenced by local factors therefore analysis could not indicate any trend. Therefore, this method has some limitation in the present context. However, it has given useful insights such replacement of LCVs and multi-axle vehicles over conventional 2-axle trucks over last 10 years due to economy of scale of multi-axle vehicles due to lower cost per tonne-km.
The vehicle registration trends in Kerala and Tamil Nadu is analyzed to assess the growth in registrations. The vehicle registration trend data is given in Table 50 and Table 51. Based on the analysis, for Kerala, the average growth in car is observed to be 12% whereas two wheelers registered a growth of 15%.The average growth in trucks is observed to be 6%. Similarly, for Tamil Nadu, the average growth in car is observed to be 18% whereas two wheelers registered a growth of 20% and the average growth in trucks is observed to be 10%. However, these growth rates cannot be adopted as it will not reflect the actual vehicles plying on the roads and its frequency. The data is cumulative and does not give the indication of old vehicles which are being scrapped every year.
Table 52 Time Series Data for Registered Motor Vehicles: Kerala
Year Two Wheelers Car LMV Bus Truck
2011-12 3,811,343 1,397,990 323,891 400,624 76,330
2012-13 4,464,849 1,590,625 364,323 407,983 78,796
2013-14 5,096,261 1,792,711 391,401 413,830 84,952
2014-15 5,722,224 1,978,598 409,745 418,620 89,571
2015-16 6,552,300 2,226,558 443,151 424,797 94,574
CAGR 15% 12% 8% 1% 6%
Table 53 Time Series Data for Registered Motor Vehicles: Tamil Nadu
Vehicle
Type
Cars/ Jeeps/
Taxis
Two Wheelers Auto/ 3
Wheelers
Bus Goods
Vehicles
2008-09 114,872 776,764 14,268 3,024 24,959
2009-10 249,679 1,709,579 38,482 6,717 59,298
2010-11 316,157 2,170,555 77,596 8,353 92,934
2011-12 370,958 2,690,330 64,243 9,096 133,940
2012-13 383,541 2,943,035 28,216 10,125 150,053
2013-14 366,302 2,855,210 37,010 10,080 101,151

Kochi Bengaluru Industrial Corridor –Draft Perspective Plan for overall KBIC region - Draft
105
2014-15 346,131 2,761,152 42,280 7,924 48,101
2015-16 358,625 2,805,495 43,082 7,231 47,469
CAGR 18% 20% 17% 13% 10%
The trend shows very high growth for passenger vehicles and commercial vehicles.
Elasticity Method: Elasticity is defined as rate of change of traffic with 1% change in economic variables such as NSDP, per capita income and population influencing the traffic.
Traffic growth is estimated based on the Elasticity method comprises of multiplying the growth rate of potential economic variables influencing the project road traffic with elasticity of traffic. The elasticity values of traffic with respect to GDP for the period 2001-2021 given presented in Journal of the Indian Roads Congress, is given in the table below. These values have been used with minor modifications as indicated in following sections.
Table 54 Values of Elasticity values for the period 2001-2021
S.No. Vehicle Type Elasticity Value
1 Car 1.200
2 Two-Wheeler 1.500
3 Bus 0.875
4 Goods Vehicles 1.10
5 Auto rickshaw 1.45
Source: Road Transport Demand for 2000 AD revisited and demand forecast for 2021, Journal of the Indian Roads Congress, Oct-Dec, 2009.
Growth Estimation for Commercial Vehicles:
In order to arrive at the growth rate of commercial vehicles, the influence of each zone in terms of commercial traffic has been considered. The relative impact of each sector was gauged by calculating the commodities being carried by goods vehicles. The commodity distribution is obtained based on past studies in KBIC influence area. The commodity distribution is used to determine the weightage for different sectors.
An elasticity value of 1.1 for commercial vehicles is adopted. The product of the weighted growth rate of economic indicators and elasticity value is the growth rate of the vehicle type on the project road.
In commercial vehicles, growth of 2-axle trucks has been negative and growth in 3-axle trucks is stagnant based on the past traffic trends all over India on National Highways. This is due to the increased preference for LCVs and Multi-axle vehicles which are economical to operate as compared to 2-axle trucks and multi-axle trucks. This axle conversion of commercial vehicles has been taken into account while estimation of traffic growth rates.
Growth Rate for Passenger Vehicles:
The growth in passenger traffic, especially cars, mainly depends on the growth in per capita income and the growth in population of the project influence area. The influence of each zone is multiplied by the combined growth in per capita income and population of that particular zone. Population is given a weightage of 70% and per capita income was given a weightage of 30% for two wheelers and cars, while for buses 60% of weightage is given for Population and 40% of weightage is given for per-capita income to obtain the weighted growth rate.
This weighted growth rate of socio-economic indicators is multiplied by the elasticity values to obtain the growth rate of passenger vehicles. The elasticity value of 1.6 for passenger vehicles is adopted.
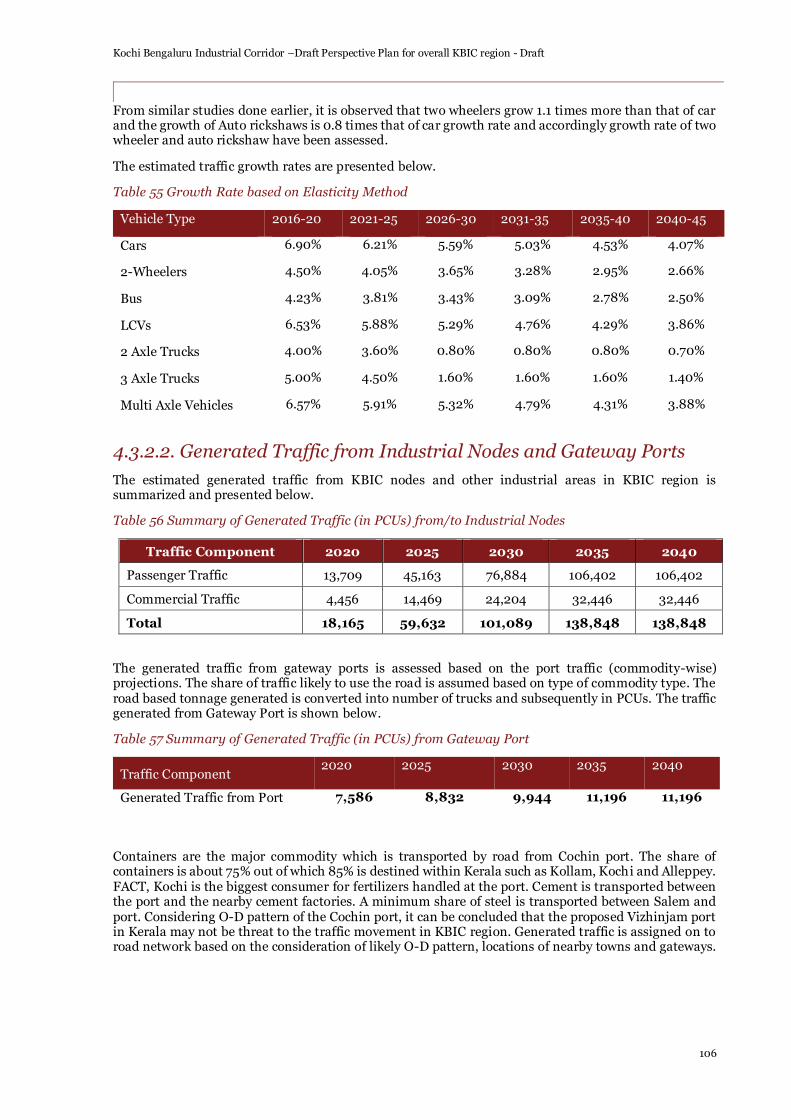
Kochi Bengaluru Industrial Corridor –Draft Perspective Plan for overall KBIC region - Draft
106
From similar studies done earlier, it is observed that two wheelers grow 1.1 times more than that of car and the growth of Auto rickshaws is 0.8 times that of car growth rate and accordingly growth rate of two wheeler and auto rickshaw have been assessed.
The estimated traffic growth rates are presented below.
Table 55 Growth Rate based on Elasticity Method
Vehicle Type 2016-20 2021-25 2026-30 2031-35 2035-40 2040-45
Cars 6.90% 6.21% 5.59% 5.03% 4.53% 4.07%
2-Wheelers 4.50% 4.05% 3.65% 3.28% 2.95% 2.66%
Bus 4.23% 3.81% 3.43% 3.09% 2.78% 2.50%
LCVs 6.53% 5.88% 5.29% 4.76% 4.29% 3.86%
2 Axle Trucks 4.00% 3.60% 0.80% 0.80% 0.80% 0.70%
3 Axle Trucks 5.00% 4.50% 1.60% 1.60% 1.60% 1.40%
Multi Axle Vehicles 6.57% 5.91% 5.32% 4.79% 4.31% 3.88%
4.3.2.2. Generated Traffic from Industrial Nodes and Gateway Ports
The estimated generated traffic from KBIC nodes and other industrial areas in KBIC region is summarized and presented below.
Table 56 Summary of Generated Traffic (in PCUs) from/to Industrial Nodes
Traffic Component 2020 2025 2030 2035 2040
Passenger Traffic 13,709 45,163 76,884 106,402 106,402
Commercial Traffic 4,456 14,469 24,204 32,446 32,446
Total 18,165 59,632 101,089 138,848 138,848
The generated traffic from gateway ports is assessed based on the port traffic (commodity-wise) projections. The share of traffic likely to use the road is assumed based on type of commodity type. The road based tonnage generated is converted into number of trucks and subsequently in PCUs. The traffic generated from Gateway Port is shown below.
Table 57 Summary of Generated Traffic (in PCUs) from Gateway Port
Traffic Component 2020 2025 2030 2035 2040
Generated Traffic from Port 7,586 8,832 9,944 11,196 11,196
Containers are the major commodity which is transported by road from Cochin port. The share of containers is about 75% out of which 85% is destined within Kerala such as Kollam, Kochi and Alleppey. FACT, Kochi is the biggest consumer for fertilizers handled at the port. Cement is transported between the port and the nearby cement factories. A minimum share of steel is transported between Salem and port. Considering O-D pattern of the Cochin port, it can be concluded that the proposed Vizhinjam port in Kerala may not be threat to the traffic movement in KBIC region. Generated traffic is assigned on to road network based on the consideration of likely O-D pattern, locations of nearby towns and gateways.

Kochi Bengaluru Industrial Corridor –Draft Perspective Plan for overall KBIC region - Draft
107
4.3.2.3. Traffic Forecast
Normal traffic is forecasted based on estimated growth rates and generated traffic is considered from 2020 onwards based on phase wise land demand as per the industrial sector. The area under industrial developments in various districts is assumed based on the yearly land demand forecast for industries. The normal traffic and generated traffic is summed up to obtain the total traffic.

Kochi Bengaluru Industrial Corridor –Draft Perspective Plan for overall KBIC region - Draft
108
4.3.3. Demand/Supply Analysis
Demand supply analysis and subsequent improvement proposals has been analyzed only for the road networks in Kerala and the same has been presented in the following sections.
4.3.3.1. Current Scenario
The distribution of existing lane-km in KBIC region by LOS is shown below. It can be observed that 67% of the lane-km have a LOS D or lower and needs immediate capacity augmentation. It is also noticed that congestion is higher near urban areas indicating the requirement of additional lanes to cater urban traffic as well as bypasses.
Table 58 Existing Road Length Distribution by LOS in KBIC region
LOS Length (km) % of Roads
A 15 1%
B 141 13%
C 209 19%
D 71 6%
E 186 17%
F 494 44%
Total 1,117 100%
4.3.3.2. Future Scenario
The V/C ratio for future scenario is assessed based on the present road configuration and the traffic volume (Normal + Generated Traffic) forecasted for the network. All the committed projects are considered for the forecasting. The distribution of KBIC Road sections in terms of by LOS is analyzed and presented below. The percentage of roads under LOS C and lower requires immediate capacity augmentation. It can be observed that around 84% of road sections need capacity augmentation by the year 2020.
Table 59 Distribution of Various Road Sections by LOS
V/C LOS 2020 2025 2030 2035 2040
0 - 0.33 A 1% 1% 1% 0% 0%
0.34 - 0.50 B 0% 0% 0% 1% 1%
0.51 - 0.70 C 14% 14% 12% 8% 8%
0.71 - 0.80 D 18% 0% 2% 7% 6%
0.80 - 1.00 E 11% 23% 19% 18% 19%
> 1.00 F 56% 62% 65% 67% 67%
Total 100% 100% 100% 100% 100%
% Roads Below LOS C 84% 84% 86% 91% 91%

Kochi Bengaluru Industrial Corridor –Draft Perspective Plan for overall KBIC region - Draft
109
Table 60 Future Road Network Characteristics in KBIC Region
Sl No. Name of the Road Length
(km) Categor
y
2018 2020 2025 2030 2035 2040
V/C LOS V/C LOS V/C LOS V/C LOS V/C LOS V/C LOS
NH Spine Road Traffic
1 Edapally-Vytilla-Aroor
31 NH 544 1.09 F 1.21 F 1.27 F 1.34 F 1.41 F 1.48 F
2 Kundannur 10 NH 544 0.58 C 0.65 C 0.68 C 0.72 D 0.75 D 0.79 D
3 Thrissur-Angamaly-Edapally
65 NH 544 1.19 F 1.33 F 1.40 F 1.48 F 1.56 F 1.63 F
4 Walayar-Vadakanchery
53 NH 544 0.45 B 0.52 C 0.58 C 0.65 C 0.71 D 0.74 D
5 Chengapalli-Coimbatore Bypass
39 NH 544 0.76 D 0.85 E 0.92 E 1.00 F 1.09 F 1.13 F
6 Kumarapalayam-Chengapalli
49 NH 544 0.89 E 1.00 E 1.08 F 1.17 F 1.26 F 1.32 F
7 Salem-Kumarapalayam
54 NH 544 0.64 C 0.73 D 0.80 E 0.88 E 0.95 E 0.99 E
8 Omalur Toll 25 NH 44 0.95 E 1.05 F 1.11 F 1.17 F 1.24 F 1.30 F
9 Krishnagiri-Thumbipadi
86 NH 44 0.98 E 1.08 F 1.13 F 1.19 F 1.24 F 1.31 F
10 Hosur-Krishnagiri 52 NH 44 0.69 C 0.76 D 0.81 E 0.86 E 0.91 E 0.95 E
Ernakulam
1 Ernakulam-Pattimattom 23
SH 41
0.47 B 0.52 C 0.55 C 0.57 C 0.61 C 0.64 C
2 Pattimattom-Muvattupuzha 17
0.47 B 0.52 C 0.55 C 0.57 C 0.61 C 0.64 C
3 Ernakulam-Thekkady Road
12 0.57 C 0.63 C 0.68 C 0.73 D 0.79 D 0.83 E
4 Muvattupuzha-Theni Road
15 SH 43 0.24 A 0.27 A 0.29 A 0.32 A 0.35 B 0.37 B
Kottayam
5 Vaikom-Kaduthuruthi
17 SH 15 0.94 E 1.03 F 1.09 F 1.14 F 1.21 F 1.27 F

Kochi Bengaluru Industrial Corridor –Draft Perspective Plan for overall KBIC region - Draft
110
Sl No. Name of the Road Length
(km) Categor
y
2018 2020 2025 2030 2035 2040
V/C LOS V/C LOS V/C LOS V/C LOS V/C LOS V/C LOS
6 Kaduthuruthi-Ettumanur Road
17 SH 15 0.97 E 1.07 F 1.13 F 1.19 F 1.25 F 1.31 F
7 Kottayam – Kumarakom Road
14 SH 42 0.70 D 0.78 D 0.82 E 0.86 E 0.91 E 0.95 E
8 Kumarakom – Cherthala Road
17 SH 40 0.78 D 0.86 E 0.91 E 0.96 E 1.01 F 1.06 F
9 Kottayam – Ettumanoor Road
11 SH 1 1.69 F 1.86 F 1.97 F 2.08 F 2.20 F 2.31 F
Idukki
10 Sabarimala-Kodaikanal Road
48 SH 44 0.46 B 0.51 C 0.55 C 0.59 C 0.63 C 0.66 C
Alappuzha
11 Chengannur-Muvattupuzha
90 SH 1 1.31 F 1.45 F 1.53 F 1.62 F 1.71 F 1.80 F
12 Chengannur - Ettumanoor
47 NH 183 1.56 F 1.73 F 1.82 F 1.91 F 2.01 F 2.11 F
13 Alappuzha-Cherthala Road
6 NH 66 2.85 F 3.39 F 3.58 F 3.78 F 4.00 F 4.18 F
14 Alappuzha-Punnapra Road
6 NH 66 2.98 F 3.52 F 3.73 F 3.94 F 4.16 F 4.35 F
15 Alappuzha-Pallathuruthy
4 SH 11 1.44 F 1.59 F 1.68 F 1.77 F 1.88 F 1.97 F
Thrissur
16 Perumbilavu-Pattambi
19 SH 39 0.90 E 0.99 E 1.05 F 1.11 F 1.17 F 1.23 F
17 Kodungallur-Shornur Road
30 SH 22 1.67 F 1.84 F 1.94 F 2.05 F 2.16 F 2.27 F
Kannur
18 Muzhappilangad-Thalassery
8 NH 66 1.70 F 1.98 F 2.11 F 2.25 F 2.39 F 2.50 F
19 Vadakara-Mahe 13 NH 66 1.80 F 2.10 F 2.23 F 2.38 F 2.52 F 2.63 F

Kochi Bengaluru Industrial Corridor –Draft Perspective Plan for overall KBIC region - Draft
111
Sl No. Name of the Road Length
(km) Categor
y
2018 2020 2025 2030 2035 2040
V/C LOS V/C LOS V/C LOS V/C LOS V/C LOS V/C LOS
20 Thalassery-Valavupara
36 SH 30 1.04 F 1.15 F 1.21 F 1.28 F 1.35 F 1.41 F
21 Puthiyangadi-Chovva Road (Near Mouveri)
82 SH 38 0.70 C 0.77 D 0.82 E 0.86 E 0.91 E 0.95 E
22 Chovva-Mattannur (Eachur)
23 MDR
(New NH) 1.19 F 1.32 F 1.41 F 1.50 F 1.60 F 1.68 F
Malappuram
23 Angadipuram 65 NH 966 1.51 F 1.68 F 1.78 F 1.90 F 2.02 F 2.11 F
24 Kondotty 60 NH 966 1.76 F 1.95 F 2.06 F 2.19 F 2.32 F 2.43 F

Kochi Bengaluru Industrial Corridor –Draft Perspective Plan for overall KBIC region - Draft
112
4.3.4. Proposals for Road Development
Road development proposals are formulated so that the road network does not reach LOS C or lower. The proposals are broadly classified as
• Spine Road Network
• Cross Connectivity Roads and other regional Roads
4.3.4.1. Spine Road Network
Existing spine road network needs up gradation to cater to the traffic generated from KBIC nodes, industrial areas and Gateway ports in the region. The proposals for major spinal road network are discussed below.
Table 61 Proposals for Spine Road Network
S. No. Name of the Major
Spine Current Scenario Proposals
1 NH 544 / NH 44
NH-544 is the major spine road connecting Kochi with the various districts of Kerala and Tamil Nadu viz. Ernakulum, Thrissur, Palakkad, Coimbatore, Erode and Salem. The lane configuration of the road is predominantly four lane road. 6-laning work is under construction for the road section between Thrissur and Vadakancherry
• Most of the sections of spine road network needs augmentation to 6-laning by 2020
NH-44 is an extension of spine road network from Salem to Hosur connecting Dharmapuri and Krishnagiri. It is a four lane road from Salem to Krishnagiri and the final section between Krishnagiri and Hosur is a six lane road. This network also passes through Namakkal and connects Karur which is located within the KBIC region in the south of spine network.
• The road section between Thrissur and Kochi needs to be widened to 8-lane by 2035

Kochi Bengaluru Industrial Corridor –Draft Perspective Plan for overall KBIC region - Draft
113
4.3.5. Lane Requirement
The lane requirement of various roads till 2040 is worked out and presented in the table below.
Table 62 Lane Requirement for KBIC Road Network
Road Name Length
(km) Category
Existing No. of Lanes
2020 2025 2030 2035 2040
Edapally-Vytilla-Aroor 31.5 NH 544 4 6 6 6 6 6
Kundannur 10.0 NH 544 4 4 4 4 4 4
Thrissur-Angamaly-Edapally 64.9 NH 544 4 6 6 6 8 8
Walayar-Vadakanchery 53.5 NH 544 4 4 4 4 4 4
Chengapalli-Coimbatore Bypass 39.5 NH 544 4 4 4 6 6 6
Kumarapalayam-Chengapalli 48.5 NH 544 4 4 6 6 6 6
Salem-Kumarapalayam 53.5 NH 544 4 4 4 4 6 6
Thumbipadi -Salem 25.0 NH 44 4 6 6 6 6 6
Krishnagiri-Thumbipadi 86.0 NH 44 4 6 6 6 6 6
Hosur-Krishnagiri 52.0 NH 44 6 6 6 6 6 6
Ernakulam-Pattimattom 23.0
SH 41
2 2 2 2 2 2
Pattimattom-Muvattupuzha 16.5 2 2 2 2 2 2
Ernakulam-Thekkady Road 12.0 2 2 2 2 2 2
Muvattupuzha-Theni Road 15.2 SH 43 2 2 2 2 2 2
Vaikom-Kaduthuruthi 16.5 SH 15 2 4 4 4 4 4
Kaduthuruthi-Ettumanur Road 16.8 SH 15 2 4 4 4 4 4

Kochi Bengaluru Industrial Corridor –Draft Perspective Plan for overall KBIC region - Draft
114
Road Name Length
(km) Category
Existing No. of Lanes
2020 2025 2030 2035 2040
Kottayam – Kumarakom Road 14.0 SH 42 2 2 2 2 2 2
Kumarakom – Cherthala Road 17.4 SH 40 2 2 2 4 4 4
Kottayam – Ettumanoor Road 10.7 SH 1 2 4 4 4 4 4
Sabarimala-Kodaikanal Road 47.9 SH 44 2 2 2 2 2 2
Chengannur-Muvattupuzha 90.2 SH 1 2 4 4 4 4 4
Chengannur - Ettumanoor 46.5 NH 183 2 4 4 4 4 4
Alappuzha-Cherthala Road 6.1 NH 66 2 4 4 4 4 4
Alappuzha-Punnapra Road 6.0 NH 66 2 4 4 4 4 4
Alappuzha-Pallathuruthy 3.8 SH 11 2 4 4 4 4 4
Perumbilavu-Pattambi 18.5 SH 39 2 2 4 4 4 4
Kodungallur-Shornur Road 29.8 SH 22 2 4 4 4 4 4
Muzhappilangad-Thalassery 8.4 NH 66 2 4 4 4 4 4
Vadakara-Mahe 13.0 NH 66 2 4 4 4 4 4
Thalassery-Valavupara 35.6 SH 30 2 4 4 4 4 4
Puthiyangadi-Chovva Road (Near Mouveri) 81.7 SH 38 2 2 2 2 2 2
Chovva-Mattannur (Eachur) 22.8 MDR
(New NH) 2 2 4 4 4 4
Angadipuram 65.0 NH 966 2 4 4 4 4 4
Kondotty 60.0 NH 966 2 4 4 4 4 4

Kochi Bengaluru Industrial Corridor –Draft Perspective Plan for overall KBIC region - Draft
115
4.3.5.1. Volume – Capacity ratio for Future Scenario
The V/C ratio for future scenario is assessed based on the forecasted traffic volume (Normal + Generated Traffic) and proposed improvement proposals for the network. The distribution of KBIC Road sections in terms of by LOS is analyzed and presented below. LOS on all the roads has improved considerably with the identified development proposals.
Table 63 Distribution of Various Road Sections by LOS
V/C LOS 2020 2025 2030 2035 2040
0 - 0.33 A 4% 6% 4% 3% 3%
0.34 - 0.50 B 22% 19% 17% 19% 11%
0.51 - 0.70 C 24% 29% 37% 32% 34%
0.71 - 0.80 D 27% 14% 15% 16% 16%
0.80 - 1.00 E 20% 31% 26% 30% 35%
> 1.00 F 3% 1% 1% 1% 1%
Total 100% 100% 100% 100% 100%
% Roads Below LOS C 73% 76% 79% 79% 86%

Kochi Bengaluru Industrial Corridor –Draft Perspective Plan for overall KBIC region - Draft
116
4.3.6. Road Infrastructure Development Proposals
• NH-544 / NH-44 are proposed as a major spine for the KBIC. In order to cater to traffic demand, it is also suggested to strengthen the NH-66 which connects Northern and Southern parts of Kerala. However, this corridor is already in DPR stage for 4-laning.
• There is a need to strengthen the cross-connectivity roads connecting the spine network
• Overall 2,200 of lane-km widening and 1,100 km of committed proposals are required to cater the demand till 2040. The overall approximate cost of road development proposal is around 6,050 crore for widening proposals.
• The Seaport-Airport Road (SPAP Road) is a four-lane, 30 km highway from Cochin seaport to the Cochin International Airport. This highway passes through the Cochin Special Economic Zone and connect such major industrial units as HMT, FACT, and Kochi Refineries as also the various oil terminals at Irumpanam and also boost the flow of cargo traffic both from the port and the airport. The IT Expressway to Infopark is starting from this road. This road plays an important role in Air-Sea and Sea-Air Transshipments. The road has not been completed with stretches from Kochi port to NH 85 and Cochin Airport to Angamaly yet to be constructed. The completion of construction of this proposed road should be taken up on immediate basis.
Figure 67: Seaport Airport Road augmentation in Cochin
A detailed inventory of roads is appended in Appendix D.

Kochi Bengaluru Industrial Corridor –Draft Perspective Plan for overall KBIC region - Draft
117
4.4. Railways Infrastructure
KBIC rail network falls almost within Kerala and Tamil Nadu under the jurisdiction of Southern Railway (SR), with a small proportion being controlled by the South Western Railway zone.
Southern Railway is one of the few zones in India whose earnings from freight are lower than those from passengers. During Financial Year 2017-18, SR earned Rs. 2,739 Cr from freight vis-à-vis Rs. 4,931 Cr from coaching (passengers). This is contrary to majority of IR zones where freight revenue is more than coaching earnings. Although SR is the 5th largest zone by route length (5,058 km), it ranks 14th out of 16 zones for freight carried (tonnes)/ route km, indicating that despite the presence of a large network, relatively low volumes of freight is handled by SR.
Southern Railway’s originating freight is primarily from Ports or from Port based industries (Fertilizer plants, refiners and others).
Southern Railway is divided into following 6 Divisions:
• Chennai Division
• Salem Division
• Palakkad Division
• Thiruvananthapuram Division
• Tiruchirappalli Division
• Madurai Division
KBIC influence area falls under 3 divisions of Southern Railways i.e., Salem, Palakkad and Thiruvananthapuram divisions.
Also, two sections of South Western Railway (SWR) falls under KBIC region.
4.4.1. Existing Rail Infrastructure in SR Division
The rail line from Kochi to Bengaluru forms major spine of KBIC and falls under in Southern Railway. The various sections of Kochi to Bengaluru rail line and corresponding jurisdiction of railway zones are presented below.
The details of Rail network in 6 divisions of Southern Railways is presented in the table below. SR is served by around 4,600 km of BG railway line and running track-km of 6,500 km.
Table 64 Details of Rail Network in 6 Divisions of Southern Railways
Railway Zone Division Route-Km
(BG) Running Track-Km (BG)
Southern Railway
Chennai* 702 1,506
Salem 782 1,067
Palakkad 540 940
Thiruvananthapuram 618 832
Tiruchchirappalli 829 983
Madurai 1153 1,218
Total 4,636 6,559
Note: * Chennai division has significant Suburban Rail network
Broad Gauge lines on Indian Railways are classified into various categories A, B, C and D, on the basis of future maximum permissible speed.
(1) Group `A'-For a sanctioned speed of 160 km per hour
(2) Category `B'-For a sanctioned speed of 130 km per hour
(3) Category `C'-Suburban Sections

Kochi Bengaluru Industrial Corridor –Draft Perspective Plan for overall KBIC region - Draft
118
(4) Category `D'-Where the maximum sanctioned speed is 100 km/hour, as at present
(5) Category `E'-Other sections of branch lines with present sanctioned speed
It is to be noted that none of the KBIC rail network comes under the Category – A.
The existing rail network in KBIC influence area is shown in figure below.
Figure 68: Railway Network in KBIC Region

Kochi Bengaluru Industrial Corridor –Draft Perspective Plan for overall KBIC region - Draft
119
The details of division-wise rail network under KBIC region such as section name, length, traction type, no. of lines, charted capacity 28, average no. of trains operating and utilized capacity is presented below.
Table 65 Division-wise Existing Line Capacity Utilization in SR Network
Sl. No.
SECTION Length (Kms)
SL/TSL /DL/TL/Q
L/QSL Year
Charted Line
Capacity each way
Average No. of trains each way
%age of utilization of Charted
Capacity
With MTCE
Pass Goods Other
s Total With MTCE
Salem Division
1 Jolarpettai Jn. - Magnesite Jn. 116.7 D/L 2016-17 52 35.0 12.8 4.0 51.8 100%
2 Magnesite Jn. - Salem Jn. 3.34 D/L 2016-17 57 47.0 9.0 4.0 60.0 104%
3 Salem Jn. - Erode Jn. 59.25 D/L 2016-17 55 40.0 6.6 4.0 50.6 92%
4 Erode Jn. - Irugur Jn. 82.84 D/L 2016-17 52 41.0 5.7 4.0 50.7 98%
5 Irugur Jn. - Podanur Jn. 10.77 S/L 2016-17 23 5.0 3.8 2.0 10.8 46%
6 Irugur Jn. - Coimbatore North Jn. 15.02 D/L 2016-17 52 37.0 1.0 3.0 41.0 79%
7 Coimbatore North Jn.-Coimbatore Jn.
2.68 D/L 2016-17 57 42.0 0.1 3.0 45.1 80%
8 Coimbatore Jn.- Podanur Jn. 6.00 D/L 2016-17 52 31.0 0.1 3.0 34.1 66%
9 Vriddhachalam Jn- Salem Jn. 138.9 S/L 2016-17 10 6.0 0.6 1.5 8.1 81%
10 Erode Jn. - Karur Jn. 65.38 S/L 2016-17 23 18.0 1.7 1.5 21.2 91%
28 Each line has a certain charted capacity to carry a certain number of trains each way during a period of 24 hours. This capacity depends on the speeds of the different trains operating on the section, the gradients, the standard of signalling and interlocking, the distance between crossing stations and the daily maintenance blocks. When the numbers of trains operating on the sections reach this charted capacity, the line becomes saturated unless additional capacity is created by doubling or multiple lines, automatic block signalling, splitting the block sections and other line capacity works. As per the Railway Board, a double line section is deemed to be saturated at 90% util ization of chartered capacity after accounting for a mandatory Maintenance Block of 4 hours. Likewise a single line section is considered saturated when capacity utilization exceeds 80%.
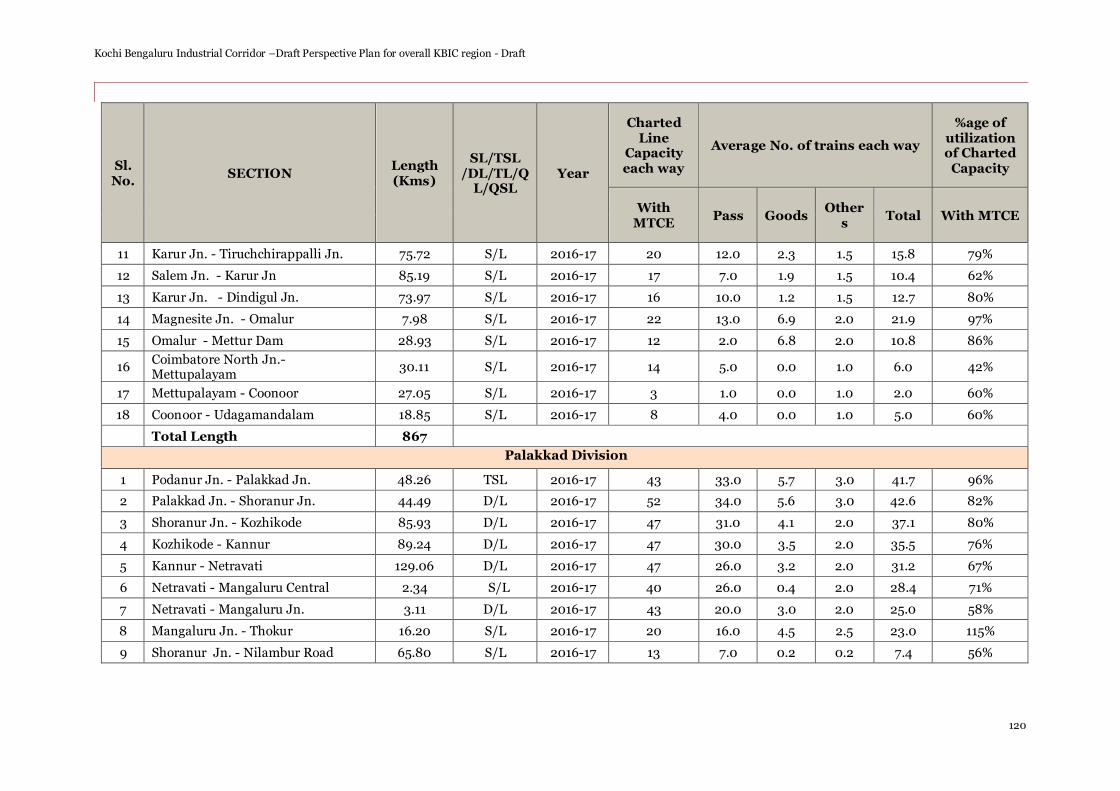
Kochi Bengaluru Industrial Corridor –Draft Perspective Plan for overall KBIC region - Draft
120
Sl. No.
SECTION Length (Kms)
SL/TSL /DL/TL/Q
L/QSL Year
Charted Line
Capacity each way
Average No. of trains each way
%age of utilization of Charted
Capacity
With MTCE
Pass Goods Other
s Total With MTCE
11 Karur Jn. - Tiruchchirappalli Jn. 75.72 S/L 2016-17 20 12.0 2.3 1.5 15.8 79%
12 Salem Jn. - Karur Jn 85.19 S/L 2016-17 17 7.0 1.9 1.5 10.4 62%
13 Karur Jn. - Dindigul Jn. 73.97 S/L 2016-17 16 10.0 1.2 1.5 12.7 80%
14 Magnesite Jn. - Omalur 7.98 S/L 2016-17 22 13.0 6.9 2.0 21.9 97%
15 Omalur - Mettur Dam 28.93 S/L 2016-17 12 2.0 6.8 2.0 10.8 86%
16 Coimbatore North Jn.-Mettupalayam
30.11 S/L 2016-17 14 5.0 0.0 1.0 6.0 42%
17 Mettupalayam - Coonoor 27.05 S/L 2016-17 3 1.0 0.0 1.0 2.0 60%
18 Coonoor - Udagamandalam 18.85 S/L 2016-17 8 4.0 0.0 1.0 5.0 60%
Total Length 867
Palakkad Division
1 Podanur Jn. - Palakkad Jn. 48.26 TSL 2016-17 43 33.0 5.7 3.0 41.7 96%
2 Palakkad Jn. - Shoranur Jn. 44.49 D/L 2016-17 52 34.0 5.6 3.0 42.6 82%
3 Shoranur Jn. - Kozhikode 85.93 D/L 2016-17 47 31.0 4.1 2.0 37.1 80%
4 Kozhikode - Kannur 89.24 D/L 2016-17 47 30.0 3.5 2.0 35.5 76%
5 Kannur - Netravati 129.06 D/L 2016-17 47 26.0 3.2 2.0 31.2 67%
6 Netravati - Mangaluru Central 2.34 S/L 2016-17 40 26.0 0.4 2.0 28.4 71%
7 Netravati - Mangaluru Jn. 3.11 D/L 2016-17 43 20.0 3.0 2.0 25.0 58%
8 Mangaluru Jn. - Thokur 16.20 S/L 2016-17 20 16.0 4.5 2.5 23.0 115%
9 Shoranur Jn. - Nilambur Road 65.80 S/L 2016-17 13 7.0 0.2 0.2 7.4 56%

Kochi Bengaluru Industrial Corridor –Draft Perspective Plan for overall KBIC region - Draft
121
Sl. No.
SECTION Length (Kms)
SL/TSL /DL/TL/Q
L/QSL Year
Charted Line
Capacity each way
Average No. of trains each way
%age of utilization of Charted
Capacity
With MTCE
Pass Goods Other
s Total With MTCE
10 Kinattukkadavu -Pollachi Jn. 21.14 S/L 2016-17
11 Pollachi Jn. - Palakkad Town. 53.80 S/L 2016-17 20 4.0 0.0 0.5 4.5 23%
12 Palakkad Town - Palakkad Jn. 4.09 S/L 2016-17 28 4.0 0.0 1.5 5.5 19%
Total Length 563
Thiruvananthapuram Division
1 Shoranur Jn. - Punkunnam 30.80 D/L 2016-17 50 41.0 5.0 2.5 48.5 97%
2 Punkunnam - Thrisur 2.01 D/L 2016-17 60 48.0 5.0 2.5 55.5 93%
3 Thrisur - Ernakulam Town 71.54 D/L 2016-17 54 44.0 5.4 5.5 54.9 101%
4 Ernakulam Town - Ernakulam Jn. 2.50 D/L 2016-17 45 31.0 0.3 5.0 36.3 81%
5 Ernakulam Town - Ernakulam 'C' Cabin
1.98 D/L 2016-17 35 18.0 3.5 3.5 25.0 71%
6 Ernakulam Jn.- Ernakulam 'C' Cabin 1.60 S/L 2016-17 22 9.0 0.3 4.0 13.3 61%
7 Ernakulam Jn.- Kochi Harbour Terminus
7.75 S/L 2016-17 17 0.0 0.0 1.0 1.0 6%
8 Ernakulam 'C' Cabin. - Kayankulam Jn. (Via Kottayam)
114.66 S/L 2016-17 30 29.0 1.4 3.5 33.9 113%
9 Kayankulam Jn. - Kollam Jn. 40.84 D/L 2016-17 53 38.0 1.1 3.0 42.1 79%
10 Kollam Jn. - Thiruvananthapuram Central
64.48 D/L 2016-17 50 34.0 0.9 4.0 38.9 78%
11 Thiruvananthapuram Central-NagercoilJn.
71.05 S/L 2016-17 17 15.0 0.9 1.0 16.9 101%
12 Nagercoil Jn. - Kanniyakumari 15.51 S/L 2016-17 20 11.0 0.0 3.5 14.5 73%

Kochi Bengaluru Industrial Corridor –Draft Perspective Plan for overall KBIC region - Draft
122
Sl. No.
SECTION Length (Kms)
SL/TSL /DL/TL/Q
L/QSL Year
Charted Line
Capacity each way
Average No. of trains each way
%age of utilization of Charted
Capacity
With MTCE
Pass Goods Other
s Total With MTCE
13 Nagercoil Jn. - Tirunelveli Jn. 73.29 S/L 2016-17 17 13.0 0.9 1.5 15.4 92%
14 Ernakulam Jn. - Alappuzha 57.00 S/L 2016-17 22 22.0 0.5 2.0 24.5 109%
15 Alappuzha - Kayankulam Jn. 43.34 S/L 2016-17 22 19.0 0.5 2.0 21.5 96%
16 Punkunnam - Guruvayur 19.98 S/L 2016-17 13 7.0 0.0 1.5 8.5 64%
Total Length 618
Madurai Division
1 Tiruchchirappalli Jn. -Dindigul Jn. 92.61 S/L 2016-17 27 18.0 0.8 1.5 20.3 76%
2 Tenkasi Jn. - Sengottai Jn. 7.83 S/L 2016-17 23 9.0 0.0 1.0 10.0 43%
3 Sengottai - Punalur 49.38 S/L 2016-17
4 Punalur - Kollam Jn. 44.10 S/L 2016-17 20 7.0 0.0 0.5 7.5 38%
5 Dindigul Jn. - Palani 58.30 S/L 2016-17 14 3.0 0.1 0.5 3.6 25%
6 Palani - Pollachi Jn. 62.90 S/L 2016-17 17 3.0 0.1 0.5 3.6 22%
Total Length 315
Tiruchchirappalli Division
1 Villupuram Jn. - Vriddhachalam Jn. 54.56 D/L 2016-17 47 19.0 2.3 2.0 23.3 50%
2 Vriddhachalam Jn. -Ariyalur 53.22 D/L 2016-17 47 19.0 2.4 2.0 23.4 50%
3 Ariyalur - Lalgudi 42.93 D/L 2016-17 48 19.0 2.5 2.0 23.5 49%
4 Lalgudi - Ponmalai Jn. 23.98 S/L 2016-17 25 21.0 2.0 1.5 24.5 98%
5 Ponmalai Jn. - Tiruchchirappalli Jn. 2.84 D/L 2016-17 50 43.0 2.1 3.0 48.1 96%
6 Villupuram - Katpadi Jn. 160.13 S/L 2016-17 15 8.0 0.7 0.5 9.2 61%

Kochi Bengaluru Industrial Corridor –Draft Perspective Plan for overall KBIC region - Draft
123
Sl. No.
SECTION Length (Kms)
SL/TSL /DL/TL/Q
L/QSL Year
Charted Line
Capacity each way
Average No. of trains each way
%age of utilization of Charted
Capacity
With MTCE
Pass Goods Other
s Total With MTCE
Total Length 338
Table 66 Division-wise Existing Line Capacity Utilization in SWR Network
Sl. No.
SECTION Length (Kms)
SL/TSL /DL/TL/Q
L/QSL Year
Charted Line
Capacity each way
Average No. of trains each way
%age of utilization of Charted
Capacity
With MTCE
Pass Goods Other
s Total With MTCE
Bengaluru Division
1 Baiyyappanahalli-Bengaluru 10.75 D/L 2016-17 61 44 2 5 61 100%
2 Baiyyappanahalli-Omalur 207.00 S/L 2016-17 17 12 1 3 16 94%

Kochi Bengaluru Industrial Corridor –Draft Perspective Plan for overall KBIC region - Draft
124
The capacity utilization in the KBIC network is given below. It can be observed that around 34% of the network is saturated. The map showing the capacity utilization of various sections in KBIC Network for the year 2016-17 is shown below
Table 67 Capacity Utilization of KBIC Network
Capacity Utilization Length (km) Percentage Share
0% - 50% 427 16%
51% - 80% 1,056 40%
81% - 90% 289 11%
91% - 100% 440 17%
More than 100% 450 17%
Total 2,662 100%
The capacity utilization of rail network in KBIC is better appreciated by taking into account of the fact that around 61% of the network is single line, 37% of the network is double line, and 2% of the network is twin single line as shown below.
Table 68 Distribution by number of Running Lines of KBIC Network
Number of Running Lines Track Length (km) Percentage Share
Single Line 1,648 61%
Double Line 1,005 37%
Twin Single Line 48 2%
Total 2,702 100%

Kochi Bengaluru Industrial Corridor –Draft Perspective Plan for overall KBIC region - Draft
125
Figure 69: Capacity Utilization of Rail Network in current year in KBIC Region

Kochi Bengaluru Industrial Corridor –Draft Perspective Plan for overall KBIC region - Draft
126
4.4.1.1. Current Major Movements by Rail in KBIC region
The summary of major cargo movements through ports and other major traffic generators through rail in KBIC region is summarized below.
Table 69 Current Major Cargo Movement by Rail in KBIC Region
Major Commodity OD Movement – Palakkad Division
Commodity Origin Destination
Cement Malabar Cements, Walayar Private siding
Badagara, Angamaly, Aluva, Edakkad, Kallayi, Nileshwar, Tirunnavaya, West Hill
Associated Cements Corp. Madukkarai
Edakkad, Kallayi, Palakkad Junction, Mangalore Central, Tirunnavaya, West Hill
Fertilizers Panamburu Amaravathi Colony, Bellary Junction, Belgaum, Coimbatore North Jn, Hassan Junction, Katpadi Junction, Kottayam, Shimoga Town, West Hill
Fertilizers-MCF, Panamburu Adoni, Anantapur, Bellary Junction, Belgaum, Coimbatore North Junction, Hassan Junction, Kottayam, Mandya, Ongole, Raichur, Salem Market, White Field Satellite Goods Terminal, Shimoga Town, Thrissur City, Tiruchirappalli Goods, West Hill, Warangal Junction
Coal New Manglore Port Siding, Panamburu
M/S JSW STEEL Ltd. Siding, Tornagallu, M/s BMM ISPAT Ltd. Private siding served by Vyasanakere, Associated Cements Corp. Madukkarai, Malabar Cements, Walayar, Associate Cement Co. Ltd. Siding
Panamburu Kariganuru, Associated Cements Corp. Madukkarai E-oil Panamburu Amausi, Sonik Gypsum New Mangalore Port Siding,
Panamburu Associated Cements Corp. Madukkarai
Major Commodity OD Movement – Salem Division
Commodity Origin Destination Cement India Cements Sdg,
Sankaridurg Edakkad, Kalamassery, Kottayam, Kallayi Kozhikode South, Thrissur Ollur, Palakkad Junction, Tiruvalla,, Valapattanam
Chettinad Cement Corporation siding, Palaiyam
Angamaly, Aluva, Kallayi Kozhikode South, Nileshwar, Kollam Junction, Tirunnavaya, Valapattanam
Chettinad Cements Sdg.,Virarakkiyam
Angamaly, Aluva, Kyatsandra Goods, Kallayi Kozhikode South, Navalur, Valapattanam
Container Irugur Concor Siding, Irugur
International Container Transshipment Siding, Valarpadam
Steel Mecheri Road Chennai Harbour (Jawahar Docks), Nagothane, White Field Satellite Goods Terminal
Ready Mix Concrete (RMC)
Bommidi Danishpet, Morappur, Salem Junction, Tiruppattur Erode Junction Perambur, Perambur Works Minnampalli Attur, Ettapur Road, Salem Town Podanur Junction Tiruppattur, Tiruppur, Igatpuri Salem Junction Namakkal Tiruppur Uthukuzhi Perundurai, Sankaridurg, Tiruppur
Major Commodity OD Movement – Trivandrum Division
Commodity Origin Destination Coal BPCLKR Siding,
Irumpanam Yard The Ramco Cements Ltd siding, Ariyalur & Ichchangadu, Dalmia Cements, Kalakudi Pazhanganatham, Chettinad Cements Corporation siding, Palaiyam, Virarakkiyam & Sillakudi, Madras Cements,
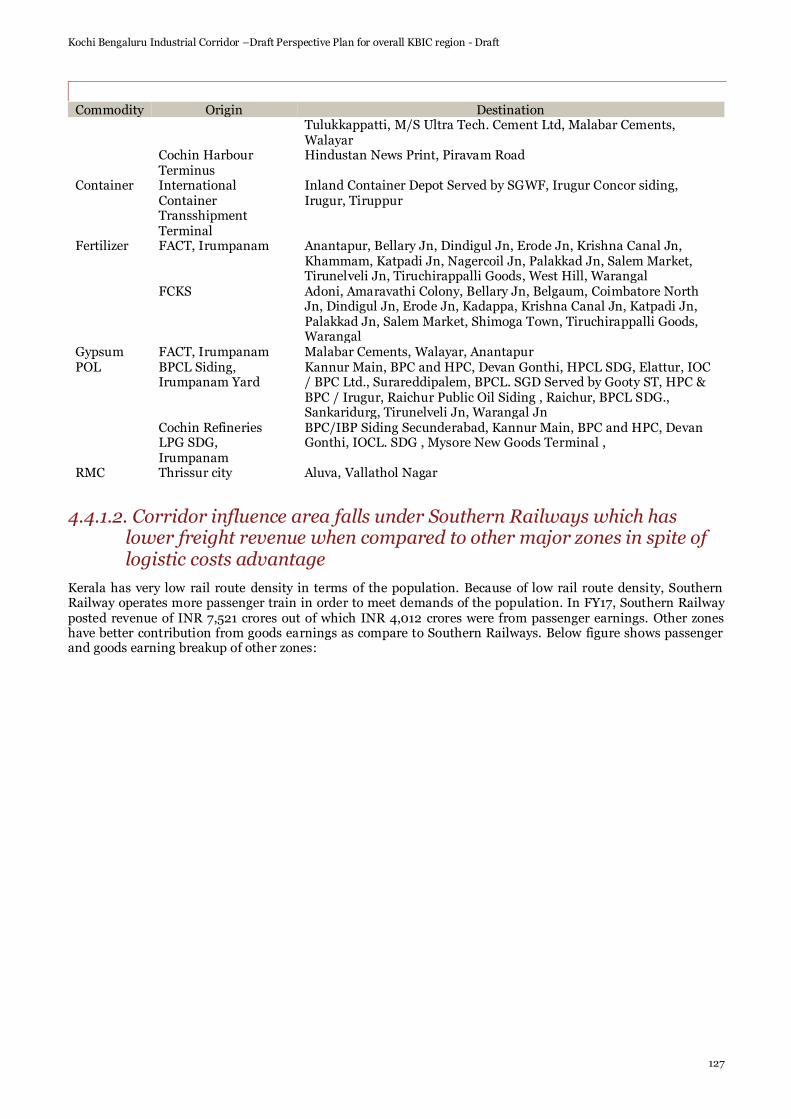
Kochi Bengaluru Industrial Corridor –Draft Perspective Plan for overall KBIC region - Draft
127
Commodity Origin Destination Tulukkappatti, M/S Ultra Tech. Cement Ltd, Malabar Cements, Walayar
Cochin Harbour Terminus
Hindustan News Print, Piravam Road
Container International Container Transshipment Terminal
Inland Container Depot Served by SGWF, Irugur Concor siding, Irugur, Tiruppur
Fertilizer FACT, Irumpanam Anantapur, Bellary Jn, Dindigul Jn, Erode Jn, Krishna Canal Jn, Khammam, Katpadi Jn, Nagercoil Jn, Palakkad Jn, Salem Market, Tirunelveli Jn, Tiruchirappalli Goods, West Hill, Warangal
FCKS Adoni, Amaravathi Colony, Bellary Jn, Belgaum, Coimbatore North Jn, Dindigul Jn, Erode Jn, Kadappa, Krishna Canal Jn, Katpadi Jn, Palakkad Jn, Salem Market, Shimoga Town, Tiruchirappalli Goods, Warangal
Gypsum FACT, Irumpanam Malabar Cements, Walayar, Anantapur POL BPCL Siding,
Irumpanam Yard Kannur Main, BPC and HPC, Devan Gonthi, HPCL SDG, Elattur, IOC / BPC Ltd., Surareddipalem, BPCL. SGD Served by Gooty ST, HPC & BPC / Irugur, Raichur Public Oil Siding , Raichur, BPCL SDG., Sankaridurg, Tirunelveli Jn, Warangal Jn
Cochin Refineries LPG SDG, Irumpanam
BPC/IBP Siding Secunderabad, Kannur Main, BPC and HPC, Devan Gonthi, IOCL. SDG , Mysore New Goods Terminal ,
RMC Thrissur city Aluva, Vallathol Nagar
4.4.1.2. Corridor influence area falls under Southern Railways which has lower freight revenue when compared to other major zones in spite of logistic costs advantage
Kerala has very low rail route density in terms of the population. Because of low rail route density, Southern Railway operates more passenger train in order to meet demands of the population. In FY17, Southern Railway posted revenue of INR 7,521 crores out of which INR 4,012 crores were from passenger earnings. Other zones have better contribution from goods earnings as compare to Southern Railways. Below figure shows passenger and goods earning breakup of other zones:

Kochi Bengaluru Industrial Corridor –Draft Perspective Plan for overall KBIC region - Draft
128
Figure 70: Revenue Breakup of Different Zones of Indian Railways
Source: Indian Railway
As we can see in the figure below Figure 71all the zones of Indian Railways except North Eastern and Southern Railway have more contribution from goods earning. In East Coast, South East Central, and South Eastern Railway goods earning contributes more than 85% of the total earning.
Figure 71: Contribution of Goods Earning in Total Earning
Source: Indian Railway
Additionally, operating ratio of Southern Railway is very high as compared to that of Indian Railways. Operating ratio of Indian Railways is 96% whereas, operating ratio of Southern Railway is 147.8% which is higher than
6,698
13,264
9,367 6,695
8,490 10,900 10,672
6,101 8,302
6,598 4,465 4,050
1,919 2,792 1,409
2,615
6,321
1,306
4,531
5,045
4,428 1,502 1,071
4,328 2,334
3,004
1,929 2,232
1,156 1,392
1,501
4,012
No
rth
ern
Eas
t C
oa
st
So
uth
Cen
tral
Ce
ntr
al
No
rth
Cen
tra
l
So
uth
Ea
ster
n
So
uth
Ea
st C
entr
al
We
ster
n
Eas
t C
entr
al
We
st C
entr
al
No
rth
Wes
tern
Eas
tern
No
rth
eas
t F
ron
tier
So
uth
Wes
tern
No
rth
Ea
ster
n
So
uth
ern
Zone wise Revenue Breakup (INR Crores)
Goods Earning Passenger Earning Others
41%
89%
64%
53%
64%
85%89%
52%
76%
67%
59% 56%
32%
61%
45%
35%
No
rth
ern
Eas
t C
oa
st
So
uth
Cen
tral
Ce
ntr
al
No
rth
Cen
tra
l
So
uth
Ea
ster
n
So
uth
Ea
st C
entr
al
We
ster
n
Eas
t C
entr
al
We
st C
entr
al
No
rth
Wes
tern
Eas
tern
No
rth
eas
t F
ron
tier
So
uth
Wes
tern
No
rth
Ea
ster
n
So
uth
ern
Goods Earning Passenger Earning
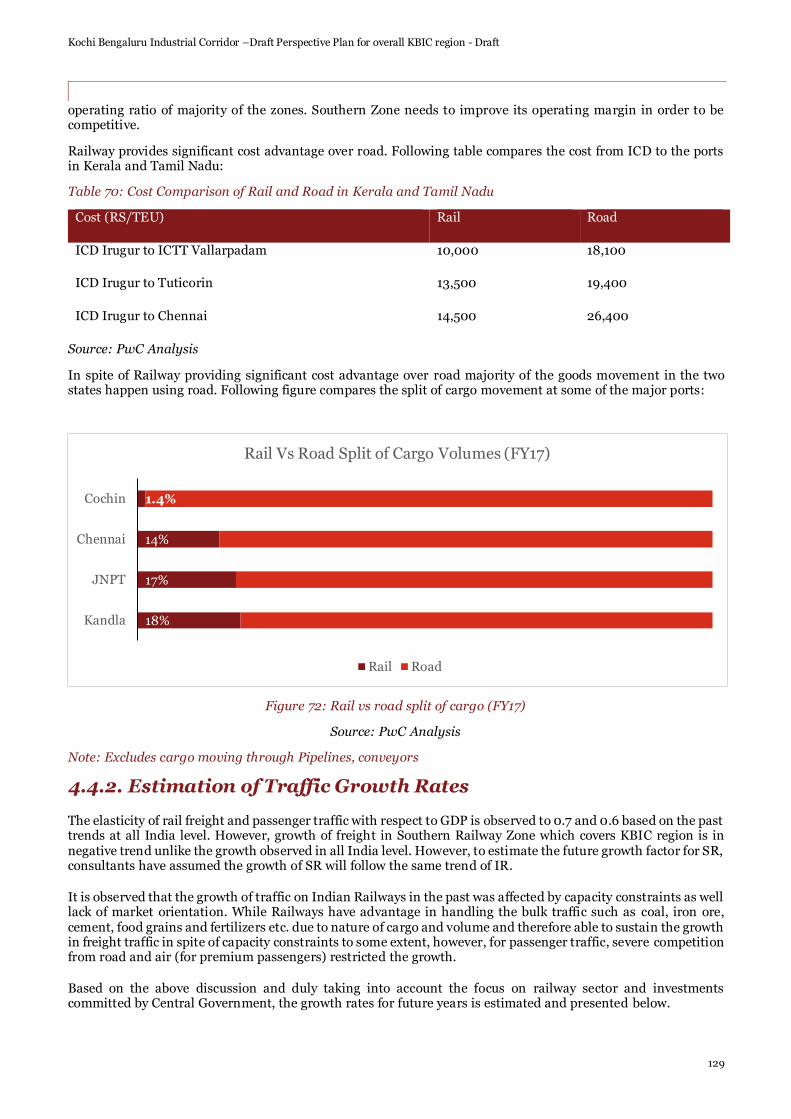
Kochi Bengaluru Industrial Corridor –Draft Perspective Plan for overall KBIC region - Draft
129
operating ratio of majority of the zones. Southern Zone needs to improve its operating margin in order to be competitive.
Railway provides significant cost advantage over road. Following table compares the cost from ICD to the ports in Kerala and Tamil Nadu:
Table 70: Cost Comparison of Rail and Road in Kerala and Tamil Nadu
Cost (RS/TEU) Rail Road
ICD Irugur to ICTT Vallarpadam 10,000 18,100
ICD Irugur to Tuticorin 13,500 19,400
ICD Irugur to Chennai 14,500 26,400
Source: PwC Analysis
In spite of Railway providing significant cost advantage over road majority of the goods movement in the two states happen using road. Following figure compares the split of cargo movement at some of the major ports:
Figure 72: Rail vs road split of cargo (FY17)
Source: PwC Analysis
Note: Excludes cargo moving through Pipelines, conveyors
4.4.2. Estimation of Traffic Growth Rates
The elasticity of rail freight and passenger traffic with respect to GDP is observed to 0.7 and 0.6 based on the past trends at all India level. However, growth of freight in Southern Railway Zone which covers KBIC region is in negative trend unlike the growth observed in all India level. However, to estimate the future growth factor for SR, consultants have assumed the growth of SR will follow the same trend of IR.
It is observed that the growth of traffic on Indian Railways in the past was affected by capacity constraints as well lack of market orientation. While Railways have advantage in handling the bulk traffic such as coal, iron ore, cement, food grains and fertilizers etc. due to nature of cargo and volume and therefore able to sustain the growth in freight traffic in spite of capacity constraints to some extent, however, for passenger traffic, severe competition from road and air (for premium passengers) restricted the growth.
Based on the above discussion and duly taking into account the focus on railway sector and investments committed by Central Government, the growth rates for future years is estimated and presented below.
18%
17%
14%
1.4%
Kandla
JNPT
Chennai
Cochin
Rail Vs Road Split of Cargo Volumes (FY17)
Rail Road

Kochi Bengaluru Industrial Corridor –Draft Perspective Plan for overall KBIC region - Draft
130
Table 71 Estimation of Rail Traffic Growth Rate
Period GDP
of India
Elasticity w.r.t GDP Growth Rate ( All India) Facto
r **
Growth Rate (KBIC Region)
Freight Passenge
r Freight
Passenger
Freight
Passenger
2015-2020 6.6% 0.70 0.60 4.6% 4.0% 0.900 4.2% 4.0%
2021-2025 5.0% 0.90 0.80 4.5% 4.0% 0.800 3.6% 4.0%
2026-2030 5.0% 0.90 0.80 4.5% 4.0% 0.700 3.2% 4.0%
2031-2035 4.8% 1.00 0.90 4.8% 4.3% 0.700 3.4% 4.3%
2036-2040 4.8% 1.00 0.90 4.8% 4.3% 0.650 3.1% 4.3%
2041-2045 4.2% 1.00 0.90 4.2% 3.8% 0.650 2.7% 3.8%
Note: ** Factor is used to convert the growth rate obtained at national level to KBIC region
4.4.2.1. Generated Traffic from Industrial Nodes and Gateway Ports
Generated traffic from sea ports and industrial nodes is estimated as follows.
• Generated traffic from sea ports in terms of tonnage is estimated based on the forecast of cargo at sea ports. The tonnage likely to use the rail is estimated based on the analysis of each port, cargo composition and its hinterland. Thus, the estimated tonnage by rail by commodity-wise (coal, iron ore, containers etc.) is converted into number of rakes (trains) and is assigned to the existing and proposed KBIC rail network. The empty rakes likely to use the rail network are also considered.
• The O-D pattern of generated traffic assumed for each port and industrial node is assumed based on following criteria.
o Current major movements
o Hinterland of the port
o Locations of mines (coal, iron ore, lime stone etc.), location of major manufacturing clusters and metropolitan cities
The extent of land proposed at each site for KBIC project is relatively less and the sectors proposed also doesn’t holds good option for railways as railways are interested in bulk cargo and considering the past trends in railways, the transport of generated traffic for the KBIC project by rail will be very minimal which is in the range of 5 to 10%.
The estimated generated traffic from KBIC nodes and other industrial areas in KBIC region is summarized and presented below.
Table 72 Summary of Generated Traffic (in rakes per day) due to Industrial Nodes
Traffic Component 2020 2025 2030 2035 2040 2045
Freight Traffic 1 2 4 6 7 8
Note: The estimated rakes includes the empty rakes
The generated traffic from gateway ports is assessed based on the port traffic (commodity-wise) projections. The share of traffic likely to use the rail is assumed based on type of commodity. The rail based tonnage generated is converted into number of rakes. The traffic generated from gateway Ports is shown below.

Kochi Bengaluru Industrial Corridor –Draft Perspective Plan for overall KBIC region - Draft
131
Table 73 Summary of Generated Traffic (in terms of rakes per day) from Gateway Ports
Traffic Component 2020 2025 2030 2035 2040 2045
Freight Traffic 1 1 2 3 5 9
Note: The estimated rakes includes the empty rakes
The total generated traffic both from Gateway ports and industrial nodes is summed up and presented below.
Table 74 Summary of Total Generated Traffic (in terms of rakes per day)
Traffic Component 2020 2025 2030 2035 2040 2045
Freight Traffic 2 3 6 8 12 17
It can be observed that generated traffic will contribute 2 rakes in 2020 and will increase to 17 rakes by 2045. Generated component of passenger traffic is not considered separately and considered as a part of growth rates itself. Generated traffic is assigned on to the rail network based on the consideration of likely O-D pattern, locations of nearby towns on to the gateways. The current movement of rakes, mining areas, ports are the major origin-destinations for the rail traffic as well major cities.
4.4.3. Demand/Supply Assessment
Demand/Supply scenario analysis is carried out for KBIC Rail network with respect to line capacity utilization levels.
4.4.3.1. Current Scenario
Line capacity utilization levels for the KBIC network is presented below.
Table 75 Distribution of Line Capacity Utilization in KBIC Region (in 2016-17)
Capacity Utilization Length (km) Percentage Share
0% - 50% 427 16%
51% - 80% 1,056 40%
81% - 90% 289 11%
91% - 100% 440 17%
More than 100% 450 17%
Total 2,662 100%
4.4.3.2. Future Scenario
4.4.3.2.1. Do Minimum Scenario
In this scenario, all that proposals sanctioned by Railway Board (as indicated in Pink Book 2017-18 for SR) are assumed to be implemented within 5 to 10 years i.e. by 2025.

Kochi Bengaluru Industrial Corridor –Draft Perspective Plan for overall KBIC region - Draft
132
The distribution of line capacity utilization in KBIC region is analyzed for Do Minimum Scenario and presented below. The rail sections having utilization levels more than 100% considered for capacity augmentation measures. The percentage of rail sections that require augmentation will reach 89% by 2045.
Table 76 Distribution of Line Capacity Utilization in KBIC Region (Do Minimum Scenario)
Capacity Utilisation 2016 2020 2025 2030 2035 2040 2045
0% to 50% 17% 13% 13% 11% 10% 4% 4%
51% to 80% 39% 25% 21% 11% 5% 7% 7%
81% to 90% 11% 26% 10% 5% 3% 3% 0%
91% to 100% 16% 3% 5% 7% 6% 2% 0%
101% to 150% 17% 33% 50% 45% 26% 23% 16%
151% to 200% 0% 0% 1% 20% 39% 33% 18%
More than 200% 0% 0% 0% 0% 12% 29% 55%
Total 100% 100% 100% 100% 100% 100% 100%
% of Rail Sections more than 100% congestion levels
17% 33% 50% 65% 76% 85% 89%
4.4.3.2.2. Do Something Scenario
Do something scenario comprises of projects as part of Do Minimum scenario, projects for which Railways has sanctioned surveys and new projects identified by the study team.
The most cost effective way of increasing the capacity is by adopting modern signalling system. Before considering the new lines, Automatic Block Signaling System is first adopted and once the lines are saturated with Automatic Block Signaling System, new lines are considered.
New projects have been identified based on the line capacity utilization levels. Iterative procedure is followed to identify the new projects. The list of additional proposals is presented in next section.
The distribution of line capacity utilization in KBIC region is analyzed for Do Something Scenario and presented below. Due to new projects proposed by the study team including improved signaling system, saturated lines have been brought down.
Table 77 Distribution of Line Capacity Utilization in KBIC Region (Do Something Scenario)
Capacity Utilisation 2016 2020 2025 2030 2035 2040 2045
0% to 50% 17% 31% 49% 36% 29% 9% 14%
51% to 80% 39% 33% 32% 40% 60% 56% 53%
81% to 90% 11% 18% 10% 2% 4% 26% 16%
91% to 100% 16% 2% 8% 14% 4% 4% 6%
101% to 150% 17% 16% 0% 8% 3% 5% 10%
151% to 200% 0% 0% 0% 0% 0% 0% 1%
More than 200% 0% 0% 0% 0% 0% 0% 0%
Total 100% 100% 100% 100% 100% 100% 100%

Kochi Bengaluru Industrial Corridor –Draft Perspective Plan for overall KBIC region - Draft
133
Capacity Utilisation 2016 2020 2025 2030 2035 2040 2045
% of Rail Sections more than 100% congestion levels
17% 16% 0% 8% 3% 5% 11%
4.4.3.3. Modern Signaling System
Currently, Indian Railways is predominantly using Absolute Block Signaling. The system is old and offers less capacity. Automatic Block Signaling (ABS), if adopted, substantially increases the capacity at about one tenth of cost of laying new line. At present ABS is being used in about 10% of rail network (predominately in suburban rail network of Mumbai and Chennai). ABS offers highest capacity if the speed differential of various trains (passenger and freight is least) but even in mixed traffic conditions which is typical of Indian Railways, it offer far higher capacity then laying a new line.
There is an urgent need to provide Automatic Block Signaling on all the double line sections and on the single line sections which will allow postponement of investments on additional tracks. Automatic Block Signaling, if accompanied by Centralized Traffic Control (CTC), will reduce the operational time of signaling systems at stations by using computers and eliminating manual operation, reducing running time of trains. CTC can operate 20-25 stations or more so as to optimize track use. In this system, the signaling systems of all stations are controlled from a remote control office through computers. In India, this system is present only in Delhi Metro, which is running metro operations with high throughput and safely. The running time will also be minimized. Systems such as Auxiliary Warning System (AWS), which warns the driver if he exceeds the speed limit, can further increase throughput.
Following are the key technological differences between IR signaling systems & other major Railways of the world:
Table 78 Key technological differences between IR signaling systems & other major Railways
Type of System Indian Railways Railways in developed
Countries
Command & Control systems Old distributed control Centralized integrated systems for efficiency
Interlocking systems Relay based system Electronic interlocking with object controllers
Block Working Manual block Double line sections converted to automatic block signaling
Train Protection System Auxiliary Warning System (AWS) has been in use in Mumbai Suburban Railway System only.
Automatic Train Protection (ATP) system like ERTMS, ATACS, ITCS, PTC etc.
Though Automatic Signaling System offers very high capacity (almost 3 to 4 minutes a train in dedicated suburban lines), the actual line capacity on regional lines depends upon many factors such as speed differential of trains, protection system provided. However, based on theoretical capacity as well as field data on Indian Railways29 following capacity have been adopted in the current project for Absolute Block Signaling and Automatic Block Signaling and the same is presented below.
29 Presentation to Sr DOM’s at IRITM,30th June,2011 The realized double line peak capacity /day on UMB-SIR section(53km) is about 140 trains, VR-DRD section (64 km) is 225 trains & on BRC –GER section (79 km) has been observed as 95 to 103 trains.
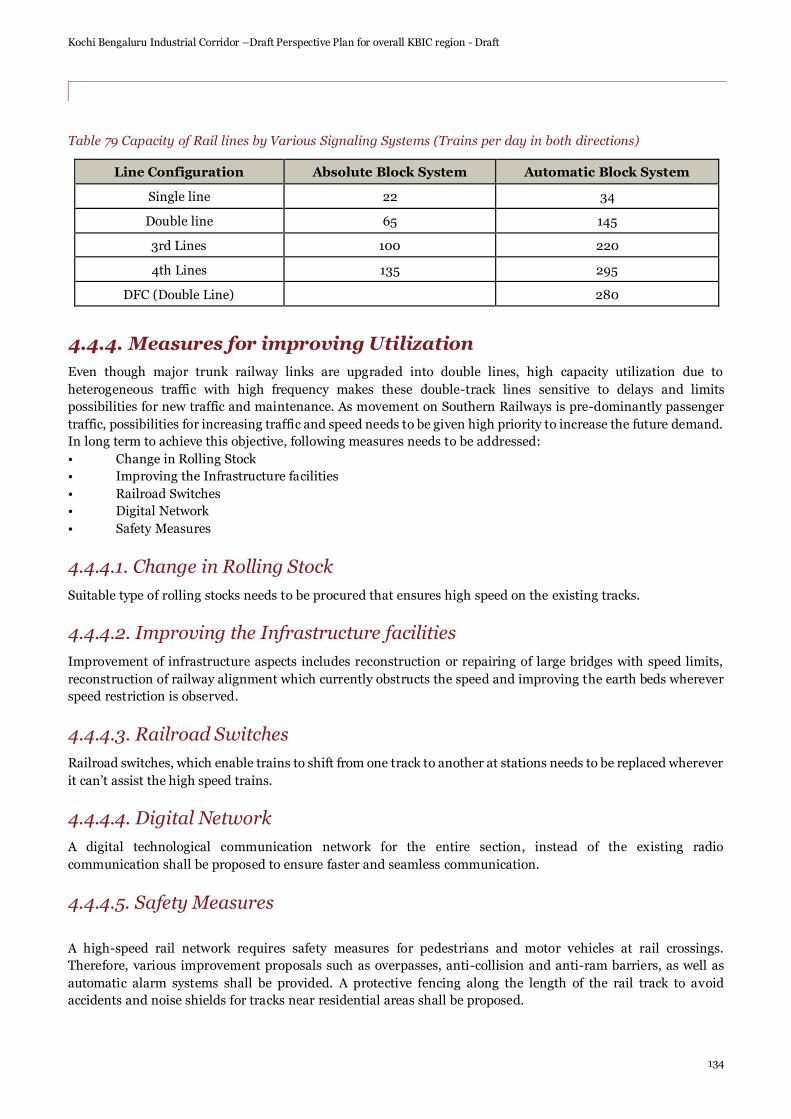
Kochi Bengaluru Industrial Corridor –Draft Perspective Plan for overall KBIC region - Draft
134
Table 79 Capacity of Rail lines by Various Signaling Systems (Trains per day in both directions)
Line Configuration Absolute Block System Automatic Block System
Single line 22 34
Double line 65 145
3rd Lines 100 220
4th Lines 135 295
DFC (Double Line) 280
4.4.4. Measures for improving Utilization
Even though major trunk railway links are upgraded into double lines, high capacity utilization due to
heterogeneous traffic with high frequency makes these double-track lines sensitive to delays and limits
possibilities for new traffic and maintenance. As movement on Southern Railways is pre-dominantly passenger
traffic, possibilities for increasing traffic and speed needs to be given high priority to increase the future demand.
In long term to achieve this objective, following measures needs to be addressed:
• Change in Rolling Stock
• Improving the Infrastructure facilities
• Railroad Switches
• Digital Network
• Safety Measures
4.4.4.1. Change in Rolling Stock
Suitable type of rolling stocks needs to be procured that ensures high speed on the existing tracks.
4.4.4.2. Improving the Infrastructure facilities
Improvement of infrastructure aspects includes reconstruction or repairing of large bridges with speed limits,
reconstruction of railway alignment which currently obstructs the speed and improving the earth beds wherever
speed restriction is observed.
4.4.4.3. Railroad Switches
Railroad switches, which enable trains to shift from one track to another at stations needs to be replaced wherever
it can’t assist the high speed trains.
4.4.4.4. Digital Network
A digital technological communication network for the entire section, instead of the existing radio
communication shall be proposed to ensure faster and seamless communication.
4.4.4.5. Safety Measures
A high-speed rail network requires safety measures for pedestrians and motor vehicles at rail crossings.
Therefore, various improvement proposals such as overpasses, anti-collision and anti-ram barriers, as well as
automatic alarm systems shall be provided. A protective fencing along the length of the rail track to avoid
accidents and noise shields for tracks near residential areas shall be proposed.

Kochi Bengaluru Industrial Corridor –Draft Perspective Plan for overall KBIC region - Draft
135
All above improvement measures will ensure high speed of trains and also improves the utilization level of the
railway networks.
4.4.5. Proposals for Rail Infrastructure Development in KBIC Region
4.4.5.1. Sanctioned Projects by Indian Railways
The various sanctioned projects of Indian Railways for the KBIC Rail Network as listed out in Pink Book for 2017-18 for SR are listed below. The various proposals put forward by Railways can be classified into the following categories:
1. Doubling
2. Gauge Conversion
3. 3rd Line and 4th Line
4. New line
5. Feasibility Study
Table 80 Sanctioned Rail Projects by Railways in KBIC Region
S.No.
Section Name Length (Km)
Proposal
Southern Railway
1 Tirunnavaya - Guruvayur 35 New line
2 Karur-Salem 85 New line
3 Angamali-Sabarimala 116 New line
4 Erode-Palani 91.05 New line
5 Kurruppanthara-Chingavanam 26.54 Doubling
6 Ambalapuzha-Haripad 18.13 Doubling
7 Ernakulam-Kumbalam - Patch doubling 7.71 Doubling
8 Omalur-Mettur Dam - Doubling with electrification 29.03 Doubling
9 Kumbalam-Thuravur - Patch doubling 15.59 Doubling
10 Trivandrum - Kanyakumari 85 Doubling
11 Turavur - Ambalapuzha 50 Doubling
12 Netravati - Mangalore Central 1.5 Doubling
Completed Projects
13 Calicut-Mangalore 221 Doubling
14 Irugur-Coimbatore 17.70 Doubling
15 Cheppad-Kayanakulam 7.76 Doubling
16 Mavelikara-Chengannur - Patch doubling 12.30 Doubling
17 Cheppad-Haripad - Patch doubling 5.28 Doubling
18 Mulanturutti-Kurruppantara 24 Doubling
19 Chinganur-Chingavanam 26.5 Doubling

Kochi Bengaluru Industrial Corridor –Draft Perspective Plan for overall KBIC region - Draft
136
S.No.
Section Name Length (Km)
Proposal
20 Kankanadi-Panambur - Patch doubling 19 Doubling
Table 81 Description of Sanctioned Rail Projects - New Lines - as per Pink Book 2017-18
Name of the work Length (km) Cost in Crore
Benefits of the project
Tirunnavaya (Kuttipuram) – Guruvayur
35.00 142.71
Extension of Trichur - Guruvayur branch line and is a shorter route from South Kerala to West coast and KRCL. No significant traffic is expected.
Angamali – Azhutha 116.00 1,605.99 To serve the pilgrim town of Sabarimala. No significant traffic is expected.
Erode - Palani 91.05 603.23 An alternate route from Erode to Dindigul and south Tamil Nadu.
Table 82 Description of Sanctioned Rail Projects - Doubling - as per Pink Book 2017-18
Name of the work Length (km) Cost in Crore Benefits of the project
Chengannur – Chingavanam 26.50 191.721 The section is utilised to 118%. This is a saturated section (118%) of the North - South Trunk route of Southern Railway between Chennai Central - Thiruvananthapuram. Doubling of this section will improve the mobility of freight train operations on Southern Railway.
Kurupantara – Chingavanam 26.54 270.140
Ambalapuzha – Haripad 18.13 105.916 LC utilisation of the section 112%. This is an alternative to the trunk route from Ernakulam to Thiruvananthapuram via Alleppey. Completion of doubling of this route will improve the mobility of freight train operations and also facilitate seamless movement of POL traffic from Irumpanam to Tirunelveli.
Ernakulam South – Kumbalam 7.71 189.000
Kumbalam - Turavur 15.59 250.000
Turavur - Ambalapuzha 50.00 1010.000 This section is utilised to 112%.All other sections have already been sanctioned for doubling. This will increase the LC.
Netravati - Mangalore Central 1.50 18.930 Doubling of this stretch will eliminate frequent detention to coaching trains.
Salem-Magnesite Junction - Omalur
11.00 76.430 Missing link
4.4.5.2. Development Projects identified by KRDCL
Kerala Rail Development Corporation Limited (KRDCL), a joint venture company between Ministry of Railways
and Government of Kerala formed in January 2017. KRDCL is studying various railway devel opment projects and
the same have been presented below.

Kochi Bengaluru Industrial Corridor –Draft Perspective Plan for overall KBIC region - Draft
137
Figure 73: Railway Projects identified by KRDCL
Consultants had discussion with the officials of KRDCL to understand the above projects and its current status.
Out of seven projects mentioned above, two projects i.e., Rapid Rail Transit System (RRTS) and Broad Gauge line
to Vizhinjam Sea port has been withdrawn by KRDCL. However, a new rail line between Nilambur – Nanjangud
is being studied which is in pre-feasibility stage. It is understood that all the above projects are in initial stage and
currently, finalisation of General Consultant (GC) for carrying out the Detailed Project Report (DPR) for the above
projects is in progress. Based on the findings of DPR study, these projects will be taken forward with Railway
Board for approval. Since the railway projects of KRDCL are in very initial stage, Consultants have not considered
these projects under the committed projects.

Kochi Bengaluru Industrial Corridor –Draft Perspective Plan for overall KBIC region - Draft
138
4.4.5.3. Proposed proposals and phasing
The summary of all the proposals, phasing and Cost Estimates are is presented below. It is to be noted here that all the projects sanctioned by Railways (which is in various stages of implementation) are excluded from the following list. The cost estimates does not include the land acquisition cost.
Table 83 Summary of Proposals and Required year of Commissioning with Phasing and Cost
S.No. Section Length No. of Lines Track-Km Type of Proposal Cost (Rs. Cr)
2020
1 Podanur Jn. - Palakkad Jn. 48.26 1 48.26 ABS on Single line 33
2 Palakkad Jn. - Shoranur Jn. 44.49 2 88.98 ABS on double line 62
3 Mangaluru Jn. - Thokur 16.20 1 16.2 ABS on Single line 11
4 Shoranur Jn. - Punkunnam 30.80 2 61.6 ABS on double line 43
5 Punkunnam - Thrissur 2.01 2 4.02 ABS on double line 3
6 Thrisur - Ernakulam Town 71.54 2 143.08 ABS on double line 99
7 Ernakulam Town - Ernakulam Jn. 2.50 2 5 ABS on double line 3
8 Ernakulam Town - Ernakulam 'C' Cabin 1.98 2 3.96 ABS on double line 3
Total 257
2025
1 Shoranur Jn. - Kozhikode 85.93 2 171.86 ABS on double line 119
2 Kozhikode - Kannur 89.24 2 178.48 ABS on double line 124
3 Kayankulam Jn. - Kollam Jn. 40.84 2 81.68 ABS on double line 57
4 Kollam Jn. - Thiruvananthapuram Central 64.48 2 128.96 ABS on double line 89
Total 389

Kochi Bengaluru Industrial Corridor –Draft Perspective Plan for overall KBIC region - Draft
139
S.No. Section Length No. of Lines Track-Km Type of Proposal Cost (Rs. Cr)
2030
1 Kannur - Netravati 129.06 2 258.12 ABS on double line 179
2 Netravati - Mangaluru Jn. 3.11 2 6.22 ABS on double line 4
3 Mangaluru Jn. - Thokur 16.20 2 32.4 Doubling 225
4 Punkunnam - Guruvayur 19.98 1 19.98 ABS on Single line 14
Total 422
2035
1 Podanur Jn. - Palakkad Jn. 48.26 2 96.52 ABS on double line 67
2 Shoranur Jn. - Nilambur Road 65.80 2 131.6 ABS on Single line 91
3 Ernakulum ‘C’ Cabin. - Kayankulam Jn. (Via Kottayam)
114.66 2 229.32 ABS on double line 159
4 Ernakulam Jn. - Alappuzha 57.00 2 114 ABS on double line 79
Total 396
2040
1 Netravati - Mangaluru Central 2.34 2 4.68 ABS on double line 3
2 Alappuzha - Kayankulam Jn. 43.34 2 86.68 ABS on double line 60
Total 63
2045
1 Irugur Jn. - Podanur Jn. 10.77 2 21.54 Doubling 149
2 Mangaluru Jn. - Thokur 16.20 2 32.4 ABS on double line 22
3 Shoranur Jn. - Punkunnam 30.80 3 92.4 Third Line with ABS 704
4 Punkunnam - Thrissur 2.01 3 6.03 Third Line with ABS 46
5 Thrissur - Ernakulam Town 71.54 3 214.62 Third Line with ABS 1635
6 Thiruvananthapuram Central - Nagercoil Jn. 71.05 2 142.1 ABS on double line 98
Total 2,656
Grand Total 4,182

Kochi Bengaluru Industrial Corridor –Draft Perspective Plan for overall KBIC region - Draft
140
4.5. Inland Waterways
With rising population and deteriorating environment conditions development of road and rail infrastructure is becoming difficult every day. Average acquisition of land for highway development in India has rose from INR 9 Mn per hectare in FY 2014 to INR 20.5 Mn a hectare in FY 2016. Both for roadways and railways development a lot of land is required and high acquisition cost of land make the projects very costly which impacts feasibility of the project. Inland Waterways development require very less land, majority of the required land is used for development of the terminals. Similarly, Inland Waterways have less impact on environment which makes it very exciting choice for transportation option. Also, Inland Waterways have more load carrying capacity than other mode of transportation. Following table contains the detail various performance indicators of different mode of transportation on environment:
Table 84: Performance of Different Mode of Transportation
Mode of Transportation
Land Acquisition Cost
Load Carrying Capacity
Fuel Efficiency CO2 Emission Cost to Transport
Inland Waterways Low 1 Horse Power
4000 kg
1 Litre
105 tonne-km
32-36 gm CO2 per Km
INR 1.19 for 1 tonne over
1 km Railways High 1 Horse Power
500 kg
1 Litre
85 tonne-km
NA INR 1.41 for 1 tonne over
1 km
Roadways High 1 Horse Power
150 kg
1 Litre
24 tonne-km
51-91 gm CO2 per Km
INR 2.28 for 1 tonne over 1 km
Source: PwC Analysis, World Bank
India is 7th largest country of the world in terms of area and 20 states of the country are landlocked which lead to very high movement of freight in the country itself. Currently, 65% of the intra country movement of freight happens using roadways followed by 27% by rail. Only 0.5% of the fright movement happens using waterways. If we compare the share of waterways in overall freight movement in other economies then it is very less in India. In the United States, 8.3% of fright movement happens using waterways, it becomes 8.7% in China, and 7% in Europe. Heavy use of road as a main mode for transportation leads to huge logistics cost, logistics costs in India are estimated to account for as much as 18 percent of the country’s GDP which is very high as compare to other economies. Development of inland waterways in India will help the country to reduce logistics cost, and will help in controlling pollution.
This section will discuss the current state of Inland Waterways in the corridor, challenges being faced in regards to Inland Waterways development, and possible interventions.
4.5.1. Kerala has 5 and Tamil Nadu has 10 notified National Waterways, among them NW 3 in the West Coast Canal is the only operational waterway in the region
Earlier, India had 5 national waterways (NW 1, 2, 3, 4, and 5). 106 new National Waterways were identified in National Waterways Act, 2016. NW 1 is a 1,620 km long waterway on the Ganges which connects Haldia and Allahabad; NW 2 is a 891 km long waterways on Brahamputra river between Bangladesh Border and Sadiya; NW 3 has a total length of 205 km, it contains 168 km of West Coast Canal, 23 km of Udyogmandal Canal, and 14 km of Champakara Canal and connects various districts of Kerala; NW 4 is 1,078 km with Kakinada-Puducherry stretch of Canals integrated with Bhadrachalam - Rajahmundry stretch of River Godavari and Wazira Vijayawada stretch of River Krishna; and NW 5 is a 623 km long waterway with Talcher- Dhamra stretch of river Brahmani, Geonkhali- Charbatia stretch of East Coast Canal, Charbatia- Dhamra stretch of Matai river and Mangalgadi-Paradip stretch of Mahanadi delta rivers.
After the 2016 Act, there are 5 National Waterways in the state of Kerala and 10 in the state of Tamil Nadu. Apart from NW 3, 4 new waterways were identified in Kerala. While, in Tamil Nadu, apart from NW 4, 9 new waterways were identified. 11 km long NW 13 in AVM canal is the waterway which comes under both the states. Among the Kerala waterways, NW 8 is a 28 long waterway in Alappuzha Changanassery Canal; NW 9 is 38 km long waterway connecting Alappuha, Kottayam, and Athirampuzha; and NW 59 is a 28 km long waterway connecting Kottayam and Vaikom. Among the Tamil Nadu waterways, NW 4 is a 2890 km long waterway passing through Andrha Pradesh, Maharashtra, Telangana, and Tamil Nadu; NW 20 is a 94 km long waterway in Bhavani River; NW 55
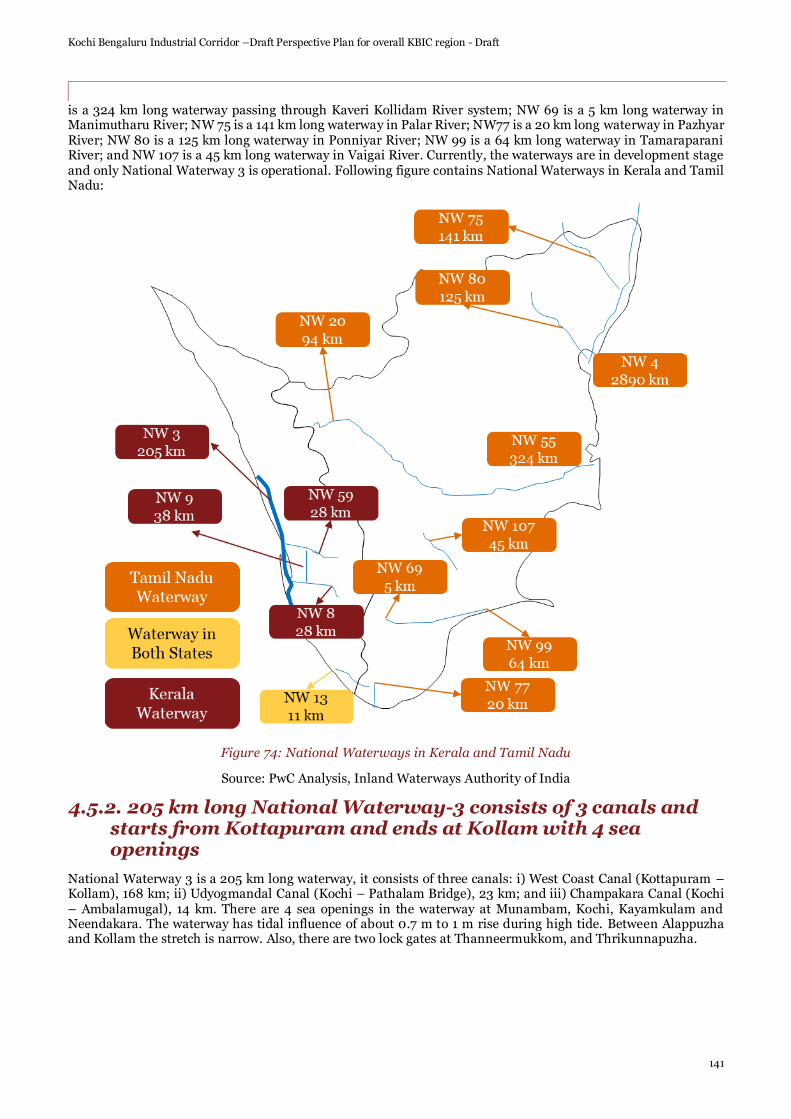
Kochi Bengaluru Industrial Corridor –Draft Perspective Plan for overall KBIC region - Draft
141
is a 324 km long waterway passing through Kaveri Kollidam River system; NW 69 is a 5 km long waterway in Manimutharu River; NW 75 is a 141 km long waterway in Palar River; NW77 is a 20 km long waterway in Pazhyar River; NW 80 is a 125 km long waterway in Ponniyar River; NW 99 is a 64 km long waterway in Tamaraparani River; and NW 107 is a 45 km long waterway in Vaigai River. Currently, the waterways are in development stage and only National Waterway 3 is operational. Following figure contains National Waterways in Kerala and Tamil Nadu:
Figure 74: National Waterways in Kerala and Tamil Nadu
Source: PwC Analysis, Inland Waterways Authority of India
4.5.2. 205 km long National Waterway-3 consists of 3 canals and starts from Kottapuram and ends at Kollam with 4 sea openings
National Waterway 3 is a 205 km long waterway, it consists of three canals: i) West Coast Canal (Kottapuram – Kollam), 168 km; ii) Udyogmandal Canal (Kochi – Pathalam Bridge), 23 km; and iii) Champakara Canal (Kochi – Ambalamugal), 14 km. There are 4 sea openings in the waterway at Munambam, Kochi, Kayamkulam and Neendakara. The waterway has tidal influence of about 0.7 m to 1 m rise during high tide. Between Alappuzha and Kollam the stretch is narrow. Also, there are two lock gates at Thanneermukkom, and Thrikunnapuzha.

Kochi Bengaluru Industrial Corridor –Draft Perspective Plan for overall KBIC region - Draft
142
Figure 75: National Waterway 3
Source: PwC Analysis, Inland Waterways Authority of India
There are 13 planned terminals in NW3 including 2 container terminals at Bolagatty and Willington Island. There are 8 terminals are operational. Also, there are. 2 terminals at CEPZ and Chavara will be considered after the utilization of the terminals already constructed. The terminals are mechanized with developed approach road connecting them with the main lines. Following table contains detail of the terminals of NW3.
Table 85: Details of the Terminals at NW3
Location Area (Hectare)
Jetty Type Storage Equipment Approach Road
Kottapuram 0.5823 30 m (RCC Jetty)
200 sq m covered 400 sq
m open
One 18 t Mobile hydraulic crane & one 3t capacity fork lift
Available
Aluva 1.331 30 m (RCC Jetty)
200 sq m covered 400 sq
m open
One 18 t Mobile hydraulic crane & one 3t capacity fork lift
Available
Maradu 2.0268 30 m (RCC Jetty)
200 sq m covered 400 sq
m open
One 18 t Mobile hydraulic crane & one 3t capacity fork lift
Available
Vaikkom 0.5184 30 m (RCC Jetty)
200 sq m covered 400 sq
m open
One 18 t Mobile hydraulic crane & one 3t capacity fork lift
Available
Thannermukkom 0.917 30 m (RCC Jetty)
200 sq m covered 400 sq
m open
One 18 t Mobile hydraulic crane & one 3t capacity fork lift
Available
Thrikunnappuzha 0.5057 30 m (RCC Jetty)
200 sq m covered 400 sq
m open
One 18 t Mobile hydraulic crane & one 3t capacity fork lift
Available
Kayamkulam 1.6304 30 m (RCC Jetty)
200 sq m covered 400 sq
m open
One 18 t Mobile hydraulic crane & one 3t capacity fork lift
Available
Kollam 0.6208 30 m (RCC Jetty)
200 sq m covered 400 sq
m open
One 18 t Mobile hydraulic crane & one 3t capacity fork lift
Available
Thrissur
Kollam
Kottayam
Alappuzha
Ernakulam
Kottapuram
NW 3

Kochi Bengaluru Industrial Corridor –Draft Perspective Plan for overall KBIC region - Draft
143
Alappuzha 2.2277 Under construction through CPWD on deposit work basis
CEPZ 1.2234 It is proposed to be considered after the utilization of the terminals already constructed
Chavra 0.8061 It is proposed to be considered after the utilization of the terminals already constructed
Bolgatty 0.8 Ro-Ro / Lo-Lo Service*
Container Terminal
Constructed for Ro-Ro/Lo-Lo barge service and in operation
Willington Island 0.5 Ro-Ro / Lo-Lo Service*
Container Terminal
Constructed for Ro-Ro/Lo-Lo barge service and in operation
Note: *Currently Ro-Ro service is suspended since June 2017 due to contractual dispute between the operator and Cochin Port Trust
Source: PwC Analysis, Inland Waterways Authority of India
In 2016-17, a total of 1.03 MMT Cargo was moved through NW-3. Ro-Ro services are available on NW-3 (since 2011) between Bolgatty and Willington Islands transporting Container Cargo in collaboration with Cochin Port Trust, thus, reducing congestion in Kochi city.
During 2016-17, a total of 12,805 Twenty Feet Equivalent Units (TEUs) & 16,558 Forty feet Equivalent Units (FEUs) were transported. Since its operationalization in 2011, a total of 106,224 Twenty Feet Containers and 78,026 Forty Feet Containers have been transported between Bolgatty and Willington Islands.
The Ro-Ro services are temporarily suspended since June 2017 due to contractual dispute between the operator and Cochin Port Trust. IWAI is taking steps to appoint a new operator through open competitive bidding. Following figure represents composition of cargo moved on NW 3:
Figure 76: Composition of Cargo Moved on National Waterway 3
Source: PwC Analysis, Ministry of Shipping Transport Research Wing, Govt. of India. (ON1363) & Past Issues
4.5.3. However, various issues need to be resolved for full utilisation of inland waterway potential of the state
Following are the issues in the state of Kerala which are needed to be resolved in order to utilize the inland waterway potential of the state:
64.7%
20.4%
14.7%
0.2%
Composition of Cargo Moved on National Waterway-III in India (2015-16)
Container Fertilisers Chemicals POL/POL Products

Kochi Bengaluru Industrial Corridor –Draft Perspective Plan for overall KBIC region - Draft
144
1. Depth of the canal is not uniform and less than the required depth
2. Some of the bridges are very low which limits the height of the container
3. Various stretches of the canal are very narrow and big ships can’t navigate
4. Last mile connectivity of the storage facilities across the canal needs improvement
5. Fishing nets in the canal restricts the movement of the ships
6. 2 gates in the canal have manual operations which lead to congestion
7. Ro-Ro facility at the container terminals is suspended due to contract dispute

Kochi Bengaluru Industrial Corridor –Draft Perspective Plan for overall KBIC region - Draft
145
4.6. Logistics Assessment
The logistics and infrastructure sector in India has been witnessing positive changes in the past few years. Initiatives to attract investments in this sector have been increasing rapidly. With Infrastructure status given to the logistics industry, there have been clear indications on the part of the govt. to rapidly modernize the sector in a bid to improve the LPI (Logistics Performance Index) score. There have been numerous strategic interventions on the part of MOFPI to improve the cold chain infrastructure in the country. While this is important for the warehousing sector, supporting infrastructure has to improve as well.
As far as the KBIC region is concerned, most of the logistics infrastructure is concentrated around few important locations like Cochin and Coimbatore where utilization is high. However, the rest of the location have minimal utilization of existing infrastructure. A very important parameter for the improvement of logistics and warehousing infrastructure is connectivity. In the KBIC region, most of the logistics infrastructure goes unutilized due to lack of transportation coverage in the region. The transportation of cargo mainly relies on the road network which is highly congested and the rail network doesn’t fare any better in the region as explained in the previous chapters. The following table shows the accessibility of Industry clusters to nearest logistics infrastructure in KBIC.
Table 86 Accessibility of Industry clusters to nearest logistics infrastructure
Distance of identified industry cluster to nearest logistics infrastructure
Sector Warehouse Spine Road (NH 544)
ICD/CFS Seaport Gateway Airport
(Cochin)
Textile 50-70 20-50 50-70 230-250 230-250
Food Processing 50-70 170-190 220-250 230-250 230-250
Wood Processing 50-70 70-100 50-70 70-90 70-90
PVC and Rubber 50-70 20-50 50-70 50-70 50-70
Non Metallic Minerals
20-50 20-50 100-120 150-170 170-190
Source: PWC Analysis
As seen in the table above, most of the industry clusters have good accessibility to the nearest logistics infrastructure in the region. However, there is a mismatch in the accessibility and utilization of infrastructure in the KBIC region. This issue is mainly prevalent in warehousing, cold storage, ICDs and CFSs in the region where in spite of better accessibility, they are not the most preferred. In the subsequent sections we have analyzed the logistics infrastructure in the KBIC region, identified prevalent issues and given suggestions on imp rovement.
4.6.1. Transportation infrastructure, warehousing & cold storage services needs to be improved in order to make KBIC competitive on logistics
According to the report titled “Logistics Ease across Different States”, Ministry of Commerce and Industry, Government of India, Kerala lacks on most of the parameters compared to other industrialized states. The data reveals that there is a major scope for improvement under each of the parameters given in the table below:

Kochi Bengaluru Industrial Corridor –Draft Perspective Plan for overall KBIC region - Draft
146
Table 87: Ranking based on LEADS report
Note: Ranking is out of 22 states, Tripura, Mizoram, Meghalaya, Nagaland, Manipur, and UTs were ranked separately; Andaman & Nicobar, Lakshadweep, Sikkim, and Arunachal Pradesh were not ranked
Source: Report title “Logistics Ease across Different States” January 2018, Ministry of Commerce & Industry, Govt. of India.
The study which was conducted based on both primary and secondary data looks at multitude of factors, following which a weighted average score was given for the same. From the table above, it can be seen that Kerala is well behind other industrialized states including the neighboring states of Tamil Nadu and Karnataka. Of these, it is clear the state requires major improvements in terms of capacity building, operating conditions and most importantly on competitiveness of pricing. Following table shows key indicators where Kerala needs to improve:
Table 88: Areas of Improvement for KBIC Region
Indicator Definition Key Area
Kerala Score and
Rank
Tamil Nadu
Score and Rank
Best State on the
Indicator
Competitive Pricing
Shipment prices to/from chosen state compared to price expectations, assessment of costs, prices elsewhere
• Transportation
• Handling
• Storage
2.48
(21)
2.59
(15)
Jharkhand
(2.98)
Parameter (Ranking out of 22 states)
Kerala Tamil Nadu
Gujarat Andhra Pradesh
Karnataka Maharash
tra
LEADS Index 12 8 1 3 4 4
Infrastructure
9 7 1 4 5 2
Services 8 5 1 7 4 2
Timelines 6 9 1 2 3 3
Track & Trace
17 13 2 3 10 6
Competitiveness of Pricing
21 15 4 5 5 12
Safety of Cargo
6 10 2 7 5 11
Operating Environment
16 9 1 5 6 11
Regulatory Process
12 12 2 3 6 7
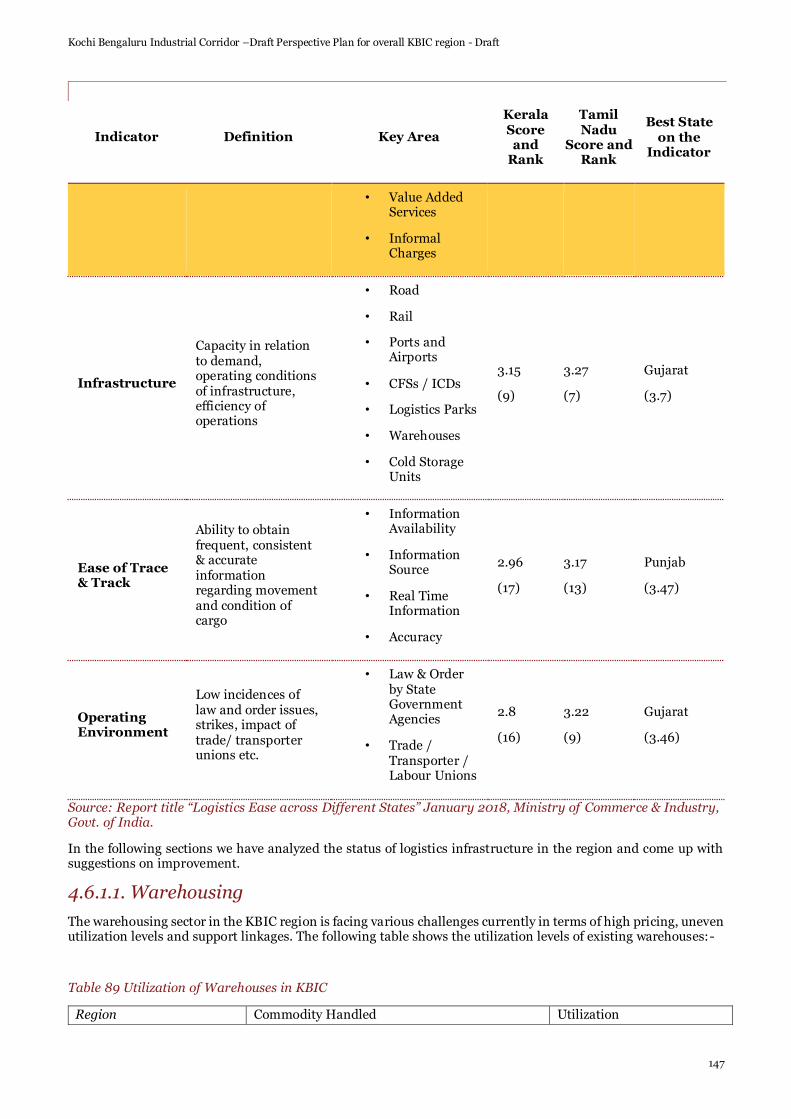
Kochi Bengaluru Industrial Corridor –Draft Perspective Plan for overall KBIC region - Draft
147
Indicator Definition Key Area
Kerala Score and
Rank
Tamil Nadu
Score and Rank
Best State on the
Indicator
• Value Added Services
• Informal Charges
Infrastructure
Capacity in relation to demand, operating conditions of infrastructure, efficiency of operations
• Road
• Rail
• Ports and Airports
• CFSs / ICDs
• Logistics Parks
• Warehouses
• Cold Storage Units
3.15
(9)
3.27
(7)
Gujarat
(3.7)
Ease of Trace & Track
Ability to obtain frequent, consistent & accurate information regarding movement and condition of cargo
• Information Availability
• Information Source
• Real Time Information
• Accuracy
2.96
(17)
3.17
(13)
Punjab
(3.47)
Operating Environment
Low incidences of law and order issues, strikes, impact of trade/ transporter unions etc.
• Law & Order by State Government Agencies
• Trade / Transporter / Labour Unions
2.8
(16)
3.22
(9)
Gujarat
(3.46)
Source: Report title “Logistics Ease across Different States” January 2018, Ministry of Commerce & Industry, Govt. of India.
In the following sections we have analyzed the status of logistics infrastructure in the region and come up with suggestions on improvement.
4.6.1.1. Warehousing
The warehousing sector in the KBIC region is facing various challenges currently in terms of high pricing, uneven utilization levels and support linkages. The following table shows the utilization levels of existing warehouses:-
Table 89 Utilization of Warehouses in KBIC
Region Commodity Handled Utilization

Kochi Bengaluru Industrial Corridor –Draft Perspective Plan for overall KBIC region - Draft
148
Ernakulam Food Grains, Appliances >60%
Coimbatore Agro products, Cotton >80%
Kannur Food grain, Wood ~10%
Pallakkad Sugar, Rubber, Agro > 85%
Source: PwC Analysis
Clearly indicated in the above table is the uneven utilization rates of warehouses in KBIC. Regions such as Cochin, Coimbatore and Palakkad show higher utilization whereas the rest of the region reports utilization of warehouses as low as 10%. The below table indicates prevalent rates the Kerala and Tamil Nadu.
Table 90 Warehousing Charges in KBIC States
State Storage charge
Kerala ~18 to 22 Rs/Sqft Tamil Nadu ~12 to 17 Rs/Sq ft
Source: PWC Analysis
Warehousing charges in Kerala are higher than Tamil Nadu, with the most prevalent reason being higher labour charges in Kerala. Also, due to lack of good road and railway connectivity to the rest of the regions, most of the utilization of warehouses are concentrated around Cochin, Coimbatore and Palakkad.
4.6.1.2. Cold Storage Infrastructure
The cold storage capacity in Kerala and Tamil Nadu show a marked difference in terms of utilization. The following table indicates the state wise utilization of Cold storage infrastructure.
Table 91 Cold Storage Capacity in KBIC
State Installed Cold Chain
Capacity (MT) Required Capacity (MT) Installed Capacity as % of
Required Capacity
Kerala 78,355 45,874 171%
Tamil Nadu 295,671 471,769 63%
Source: MOSPI Report on “Performance Assessment of the Storage and Warehousing Industry in India” 2017
As evident from the above table, there is excess capacity of cold storage in Kerala whereas in Tamil Nadu the available capacity is lower than demand. Similar to warehousing demand, cold storage demand is concentrated around few locations in Kerala whereas most of the capacity goes unutilised. The following table shows the utilization of Cold Storages in Kerala region wise and the difference in rates across Kerala and Tamil Nadu.
Table 92 Utilization of Cold storage in Kerala
Table 93 Current Cold Storage rates in KBIC states
Source: PwC Analysis
Region Commodity Handled Utilization
Ernakulum Marine >70%
Alleppey Marine >70%
Palakkad Agro products ~40%
State Storage charge
Kerala ~36 to 45 Rs/Sq Ft
Tamil Nadu ~20 to 30 Rs/Sq Ft

Kochi Bengaluru Industrial Corridor –Draft Perspective Plan for overall KBIC region - Draft
149
Various reasons can be attributed to the reason behind high prices of cold storages in Kerala. The average sizes of the cold warehouses being smaller, high labour rates and transportation issues being the major reasons due to which Kerala cold storages are being priced higher even though the utilization of the infrastructure is uneven across the state.
4.6.1.3. ICD Infrastructure
There are three major ICDs in the KBIC region. The details regarding the commodities handled and their utilization is shown in the following table.
Table 94 Utilization of ICDs in KBIC
ICD Commodity Handled Utilization
Coimbatore (Irugur) Container (Textiles, Coir, rubber etc) <30%
Kannur Containers (Wood products) <5%
Tirupur Containers (Mixed) <10%
Source: PwC Analysis
As evident from the table, the utilization of the ICDs in the region is minimal. The main challenges being faced by the ICDs in the region are Railway movement, first and last mile connectivity through roads and labour issues in the region. Railway connectivity plays a very important role in the functioning of an ICD. With most of the railway networks in the region congested, cargo traffic is highly affected. The same can be said about the road infrastructure in the region, with congestion the first and last mile connectivity from the ICDs needs huge improvement.
4.6.1.4. CFS and Port Infrastructure
CFSs in the KBIC region are mostly concentrated around Cochin. Most of the major commodities currently produced in the region are handled in these CFSs. The following table shows the utilization of CFS infrastructure in KBIC.
Table 95 Utilization of CFS in KBIC
Key Area Commodities Utilization
Cochin/ Ernakulam
Textiles, Cashew, Electronics, wood products, rubber, marine food products
50% to 70%
Source: PwC Analysis
CFS in the region are expected to be affected due to changes in policy (DPD, AEO programs). The current policy is looking at reducing dwell time of cargo at the CFSs by providing direct port delivery to consignees. This is mainly aimed at reducing time consumed due to customs examination and thereby improving efficiencies in supply chain. However, this policy once implemented to its full potential will have an adverse effect on the CFS businesses in the region.
4.6.1.4.1. High handling charges at the port & CFSs in Kerala make the state less competitive on pricing
Labor charges in Kerala is almost double than Tamil Nadu. As mentioned in port section, Cochin Port handling charges is very high than VOC Port and Chennai Port. Vessel handling charges at the Cochin Port is 2.6 times more than VOC Port and 1.5 times more than the Chennai Port. Similarly, container handling charges at the Cochin Port is 2.1 times more than the VOC Port and 1.8 times more than the Chennai Port. Also, CFS charges in Kerala is approximately 1.7 times more than the charges in the state of Tamil Nadu. The Cochin port, in order to become the preferred gateway for the KBIC region needs to improve in terms of associated infrastructure such as CFS and ICD services by establishing price competitiveness. The following table shows the CFS charges in one of the CFSs in Kerala:
Table 96: CFS Charges in Kerala
No Particulars 20’ (INR) 40” (INR) Stuffing / De-stuffing Containers
a. Stuffing / De-stuffing Containers 4000 5500
b. Stuffing / De-stuffing hazardous / fish meal / machinery / OH / OS / Coir Yarn / Plywood / Coir pith (in loose) / Chili Powder / Coir Fibre
6000 8000
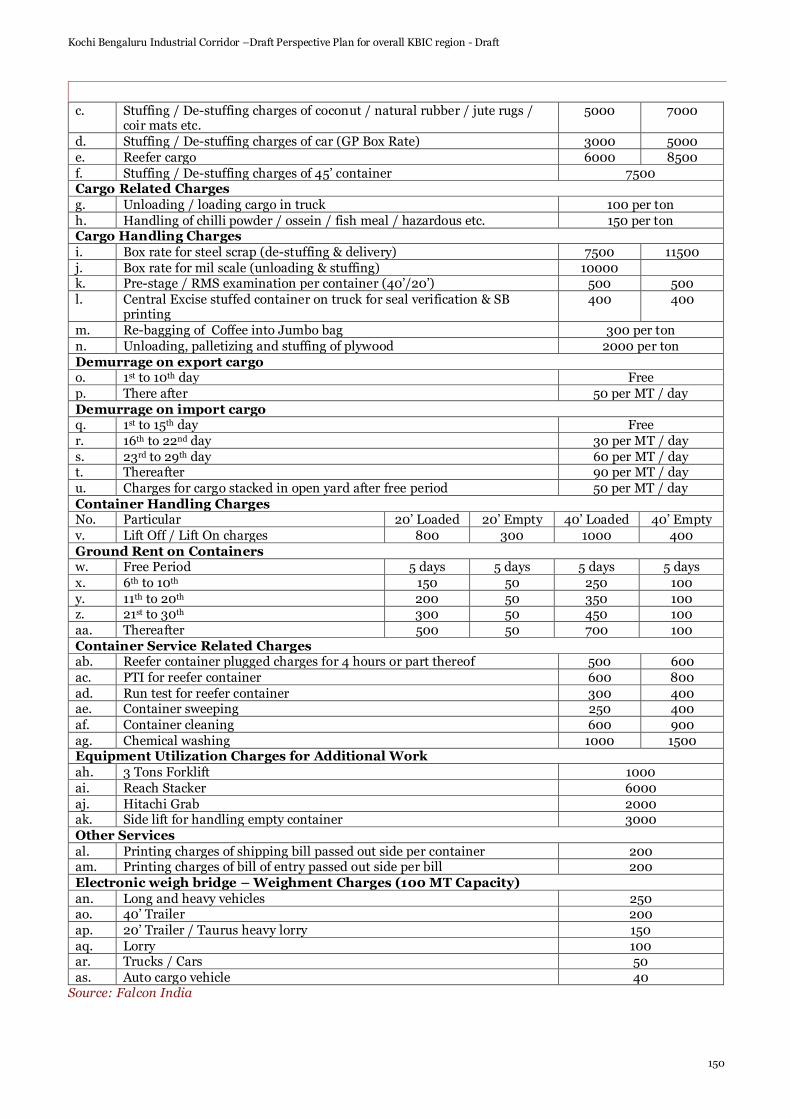
Kochi Bengaluru Industrial Corridor –Draft Perspective Plan for overall KBIC region - Draft
150
c. Stuffing / De-stuffing charges of coconut / natural rubber / jute rugs / coir mats etc.
5000 7000
d. Stuffing / De-stuffing charges of car (GP Box Rate) 3000 5000
e. Reefer cargo 6000 8500
f. Stuffing / De-stuffing charges of 45’ container 7500 Cargo Related Charges
g. Unloading / loading cargo in truck 100 per ton
h. Handling of chilli powder / ossein / fish meal / hazardous etc. 150 per ton Cargo Handling Charges
i. Box rate for steel scrap (de-stuffing & delivery) 7500 11500
j. Box rate for mil scale (unloading & stuffing) 10000 k. Pre-stage / RMS examination per container (40’/20’) 500 500
l. Central Excise stuffed container on truck for seal verification & SB printing
400 400
m. Re-bagging of Coffee into Jumbo bag 300 per ton
n. Unloading, palletizing and stuffing of plywood 2000 per ton
Demurrage on export cargo o. 1st to 10th day Free
p. There after 50 per MT / day
Demurrage on import cargo q. 1st to 15th day Free
r. 16th to 22nd day 30 per MT / day
s. 23rd to 29th day 60 per MT / day t. Thereafter 90 per MT / day
u. Charges for cargo stacked in open yard after free period 50 per MT / day
Container Handling Charges No. Particular 20’ Loaded 20’ Empty 40’ Loaded 40’ Empty
v. Lift Off / Lift On charges 800 300 1000 400
Ground Rent on Containers w. Free Period 5 days 5 days 5 days 5 days
x. 6th to 10th 150 50 250 100
y. 11th to 20th 200 50 350 100 z. 21st to 30th 300 50 450 100
aa. Thereafter 500 50 700 100
Container Service Related Charges ab. Reefer container plugged charges for 4 hours or part thereof 500 600
ac. PTI for reefer container 600 800
ad. Run test for reefer container 300 400 ae. Container sweeping 250 400
af. Container cleaning 600 900
ag. Chemical washing 1000 1500 Equipment Utilization Charges for Additional Work
ah. 3 Tons Forklift 1000
ai. Reach Stacker 6000
aj. Hitachi Grab 2000 ak. Side lift for handling empty container 3000
Other Services
al. Printing charges of shipping bill passed out side per container 200 am. Printing charges of bill of entry passed out side per bill 200
Electronic weigh bridge – Weighment Charges (100 MT Capacity)
an. Long and heavy vehicles 250 ao. 40’ Trailer 200
ap. 20’ Trailer / Taurus heavy lorry 150
aq. Lorry 100 ar. Trucks / Cars 50
as. Auto cargo vehicle 40 Source: Falcon India

Kochi Bengaluru Industrial Corridor –Draft Perspective Plan for overall KBIC region - Draft
151
4.6.2. Pricing, capacity expansion at over-utilized centres with operationalisation of MMLP will help improve overall logistics in the corridor
Owing to high logistics costs and uneven utilization of available infrastructure, in price competitiveness, Kerala currently ranks 21st out of 22 states in India as per LEADS index (Logistics Ease across Different States). The following interventions are necessary to make the logistics sector in KBIC more efficient and competitive.
4.6.2.1. Pricing
Pricing of infrastructure is highly important especially in the context of Kerala in the KBIC. The existing infrastructure is highly priced across the state which has resulted in uneven utilisation. The following strategies can be implemented for addressing this issue.
1. Labour cost plays a vital role in pricing. In Kerala, due to high labour costs, the infrastructure is being overpriced. Hence, manual handling costs in Kerala needs to be rationalised.
2. The cold storage infrastructure across Kerala is fragmented with the average size per warehouse smaller leading to uneven utilization and higher pricing. An average cold warehouse in Kerala is sized 2588 Sq. M in comparison to 4567 Sq. M being the all India average. Consolidation of cold storage units across the state needs to be taken up in key locations in order to make the infrastructure more cost efficient.
3. Transportation infrastructure (Roads and Railway) needs to be improved to provide better accessibility to the infrastructure in the region especially ICDs and CFSs.
4.6.2.2. Capacity expansion at Key locations
In the KBIC especially in Kerala, the capacity constraints in warehousing, cold storages etc. are arising due to difference in demand at different locations. Capacity consolidation at these key locations will lead to better utilisation of the infrastructure thereby improving overall efficiency. To illustrate this issue the following example can be taken where dry ginger in Palakkad is currently being stored at twice the price of competing facilities in other states owing to limited storage capacity hence optimally priced cold storage facilities are required in the region. Storage facilities in Kannur are ample and no major expansion is required for this node. The following table shows the locations identified for capacity enhancement across KBIC.
Table 97: Capacity enhancement required in KBIC
District Capacity expansion
Palakkad Required
Coimbatore Required
Cochin Required
Kannur Not Required
4.6.2.3. Operationalisation of an MMLP (Multi Modal Logistics Park) in KBIC
Kerala figures among 11 states in India where an MMLP is being developed under the Logistics Efficiency Enhancement Programme of the Ministry of Road Transport and Highway. Operationalisation of the MMLP will go a long way in addressing the logistics issues in the region. The proposed park will act as a hub aggregating cargo from the identified IMCs in KBIC and will enable distribution of the same using various modes. In Kochi, 264 acres of land is required for setting up the park of which 110 acres meant for storage, 88 acres for allied infrastructure and 66 acres for future expansion and landscaping.

Kochi Bengaluru Industrial Corridor –Draft Perspective Plan for overall KBIC region - Draft
152
The working of an MMLP is illustrated in the following figure.
Figure 77: Illustrative Working of an MMLP
Source: PWC Analysis
There are numerous advantages to be gained from the operationalisation of the MMLP. The most important and immediate advantages are listed below:-
1. Improve logistics efficiency and reduce logistic costs, pollution from automobiles and congestion in key cities.
2. Address the issues of unfavorable modal mix, inefficient fleet mix and under-developed material handing infrastructure.
3. Act as hubs for freight movement enabling aggregation and distribution. 4. Reduction in transport costs by 10 per cent, 12 per cent reduction in Co2 emissions, 20 per cent reduction
in freight vehicles

Kochi Bengaluru Industrial Corridor –Draft Perspective Plan for overall KBIC region - Draft
153
5. Energy infrastructure assessment
Power is a critical infrastructure element required for the smooth functioning of the economy. An efficient, resilient and financially healthy power sector is essential for growth and poverty reduction. The availability of reliable, quality and affordable power will help in the rapid industrial, urban and overall economic development of the corridor and the IMC proposed inside the corridor.
The Integrated Manufacturing Centre (IMC) in the Palakkad – Thrissur node is encapsulated inside ~3500 Sq km in which the two adjoining districts are spread. The two distracts consume ~7 % of the electricity used in the corridor region (Kerala only). The below graphic shows the historical consumption over the years which shows an average increase in consumption of ~6 %. Industrial consumption in Palakkad district account for ~38%30 and 18%31 in Thrissur.
Figure 78: Electricity Consumption in Million Units (MU), across districts
Source: Study Team Analysis
The below section presents our analysis of the IMC in the Palakkad – Thrissur node to assess and show the
feasibility of the node to enable competitiveness of industry.
This chapter
1. Identifies of power supply sources for the node, available opportunities, and fuel source including ensuring availability of adequate power supply;
2. Evolves suitable measures for ensuring reliable and uninterrupted power supply in the identified regions with in the node;
30 For year 2017 31 For year 2017
0
5000
10000
15000
20000
25000
FY 14 FY 15 FY 16 FY 17 FY 18
Palakkad Thrissur Rest of Corridor Non Corridor

Kochi Bengaluru Industrial Corridor –Draft Perspective Plan for overall KBIC region - Draft
154
5.1. Supply availability may not be a significant constraint in the near term to meet the demand in the node
5.1.1. Power generation capacity addition in the pipeline – 8% per annum average projected capacity additions in the next 5 years
Kerala State Electricity Board Ltd. as the principal power distribution licenses in the state under the Electricity Act 2003 will largely meet supply of power to the Integrated Manufacturing Cluster (IMC) in the Palakkad – Thrissur node. The installed capacity of KSEBL has been growing at an average 6% in the last five years. 37% of installed capacity comes from hydro plants followed by coal power plants at 34%32.
Figure 79: Installed capacity of Kerala (MW)
Source: Central Electricity Authority, Government of India
However, in the supply mix, ~58% of the energy comes from coal based plants on long term PPA’s, followed by hydro which contributes ~24% and short term purchase through traders ~18%.
Figure 80: Supply mix of Kerala (Million Units)
Source: Kerala Electricity regulatory commission tariff order
While energy availability has been growing at an average 4% per annum in the last few years, it has failed to meet the demand in the state from across categories. During the period FY13 to FY18 the gap between actual consumption and unrestricted demand increased to 4% which then gradually reduced to 0.1%.
32 For FY 18
3856 3891 4106 4172
4998 50745428
59346541
70477571
0
1000
2000
3000
4000
5000
6000
7000
8000
FY 13 FY 14 FY 15 FY 16 FY 17 FY 18 FY 19 FY 20 FY 21 FY 22 FY 23
0%
20%
40%
60%
80%
100%
FY 13 FY 14 FY 15 FY 17
Coal Hydro Short term RE
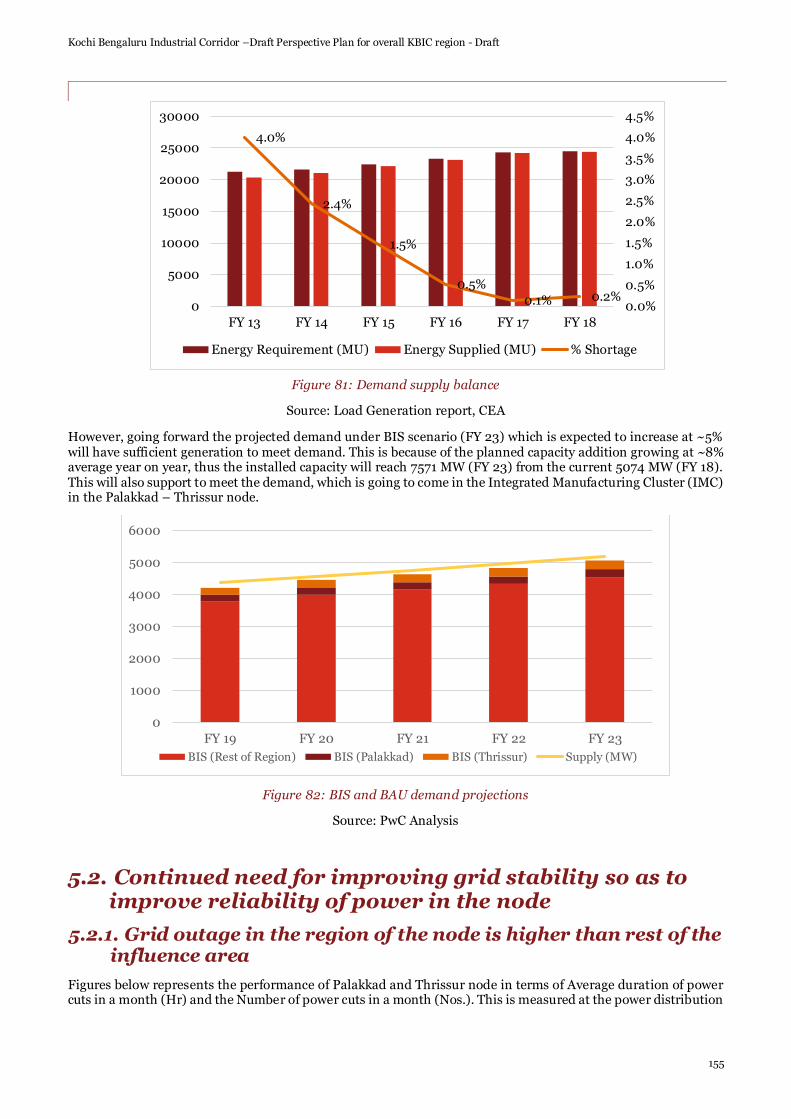
Kochi Bengaluru Industrial Corridor –Draft Perspective Plan for overall KBIC region - Draft
155
Figure 81: Demand supply balance
Source: Load Generation report, CEA
However, going forward the projected demand under BIS scenario (FY 23) which is expected to increase at ~5% will have sufficient generation to meet demand. This is because of the planned capacity addition growing at ~8% average year on year, thus the installed capacity will reach 7571 MW (FY 23) from the current 5074 MW (FY 18). This will also support to meet the demand, which is going to come in the Integrated Manufacturing Cluster (IMC) in the Palakkad – Thrissur node.
Figure 82: BIS and BAU demand projections
Source: PwC Analysis
5.2. Continued need for improving grid stability so as to improve reliability of power in the node
5.2.1. Grid outage in the region of the node is higher than rest of the influence area
Figures below represents the performance of Palakkad and Thrissur node in terms of Average duration of power cuts in a month (Hr) and the Number of power cuts in a month (Nos.). This is measured at the power distribution
4.0%
2.4%
1.5%
0.5%
0.1% 0.2%0.0%
0.5%
1.0%
1.5%
2.0%
2.5%
3.0%
3.5%
4.0%
4.5%
0
5000
10000
15000
20000
25000
30000
FY 13 FY 14 FY 15 FY 16 FY 17 FY 18
Energy Requirement (MU) Energy Supplied (MU) % Shortage
0
1000
2000
3000
4000
5000
6000
FY 19 FY 20 FY 21 FY 22 FY 23
BIS (Rest of Region) BIS (Palakkad) BIS (Thrissur) Supply (MW)

Kochi Bengaluru Industrial Corridor –Draft Perspective Plan for overall KBIC region - Draft
156
voltage level of 11kV. Reliability of supply in the Palakkad region is better when compared to rest of the state. Thrissur is lagging behind in meeting the overall supply reliability parameter.
Figure 83: Average duration of power cut (Hrs/month)
Source: Urja Portal
Figure 84: Average number of power cut (Nos/month)
Source: Urja Portal
5.2.2. Reliability improvement in the Palakkad region of the Palakkad – Thrissur Node
The Integrated Manufacturing Cluster (IMC) is planned across four towns of which the following fall under the Palakkad region. These include the following –
• Puthussery Panchayat, Palakkad Circle
• Ozhalapathy Panchayat, Palakkad Circle
0
2
4
6
8
10
12
14
16
18
Kerala Discom Palakkad Thrissur
0
0.5
1
1.5
2
2.5
3
3.5
4
Kerala Discom Palakkad Thrissur
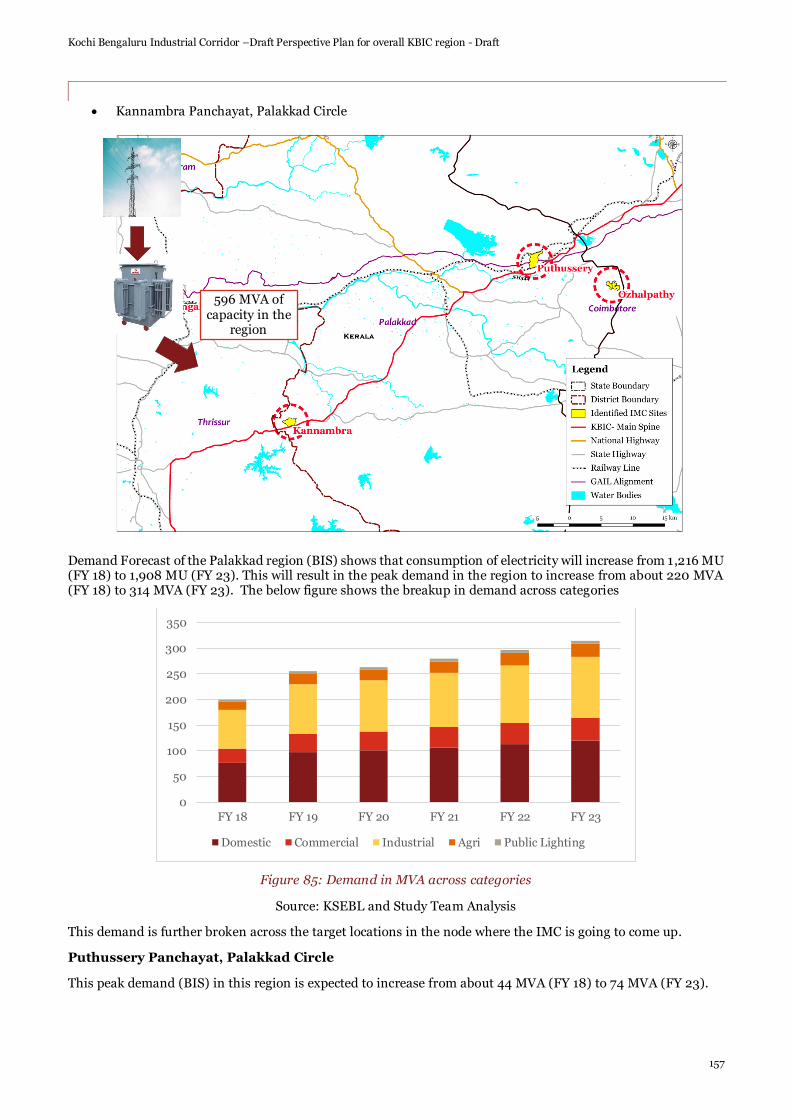
Kochi Bengaluru Industrial Corridor –Draft Perspective Plan for overall KBIC region - Draft
157
• Kannambra Panchayat, Palakkad Circle
Demand Forecast of the Palakkad region (BIS) shows that consumption of electricity will increase from 1,216 MU (FY 18) to 1,908 MU (FY 23). This will result in the peak demand in the region to increase from about 220 MVA (FY 18) to 314 MVA (FY 23). The below figure shows the breakup in demand across categories
Figure 85: Demand in MVA across categories
Source: KSEBL and Study Team Analysis
This demand is further broken across the target locations in the node where the IMC is going to come up.
Puthussery Panchayat, Palakkad Circle
This peak demand (BIS) in this region is expected to increase from about 44 MVA (FY 18) to 74 MVA (FY 23).
0
50
100
150
200
250
300
350
FY 18 FY 19 FY 20 FY 21 FY 22 FY 23
Domestic Commercial Industrial Agri Public Lighting
596 MVA of capacity in the
region

Kochi Bengaluru Industrial Corridor –Draft Perspective Plan for overall KBIC region - Draft
158
Figure 86: Demand in MVA across categories
Source: KSEBL and Study Team Analysis
Kannambra Panchayat, Palakkad Circle
This peak demand (BIS) in this region is expected to increase from about 3 MVA (FY 18) to 5 MVA (FY 23).
Figure 87: Demand in MVA across categories
Source: KSEBL and Study Team Analysis
Table 98: Sufficiency of transmission and distribution network – Palakkad region
FY 19
Demand FY 23
Demand Current Transformation
Capacity (FY 19)
Sufficiency of Transmission
and Distribution
Network
MVA MVA MVA
Puthussery Panchayat 61 74 220 Yes
Kannambra Panchayat 23 28 23 Yes
0
10
20
30
40
50
60
70
80
FY 18 FY 19 FY 20 FY 21 FY 22 FY 23
Domestic Commercial Industrial Agri Public Lighting
0.00
0.50
1.00
1.50
2.00
2.50
3.00
3.50
4.00
4.50
5.00
FY 18 FY 19 FY 20 FY 21 FY 22 FY 23
Domestic Commercial Industrial Agri Public Lighting

Kochi Bengaluru Industrial Corridor –Draft Perspective Plan for overall KBIC region - Draft
159
Rest of Palakkad Circle 171 212 354 Yes
Total 255 314 596
As can be seen, the current Transformation capacity 596 MVA at the transmission level is sufficient to meet the current and future load growth in the Palakkad region and the IMC planned in the region.
Measure to improve reliability of supply in the Palakkad region
• Enhancing reliability and quality of the power supplied – On studying and analyzing the key
issues faced in the network the following two measures would help in meeting the stated objective –
o Improving HT Feeder Availability - There are 150 HT feeders emanating from 29 substations in
the Palakkad region. At present 90% of the main lines have back feeding facility. From the
network map, it’s inferred that this can be further improved by the measures of interlinking
feeders, ring formations and drawing a few kilometers of new HT feeders. However, some of the
transformers shall continue to remain without alternate feeding arrangements due to the nature
of locality.
o Improving Transformer and LT feeder Availability - Analysis of data indicates that there are
4048 distribution transformers under Palakkad region with a total transformation capacity of
488 MVA. Considering load factor, the peak demand in LT side will be around 135MVA only.
Attempts should be made to relocate the transformers to load centers and to replace
higher/lower rated capacity transformers with optimal capacity wherever possible. However, in
many cases the load factor is much below the average. Recorded maximum demand and
minimum demand vary drastically from season to season; diurnal and nocturnal variation also
is significant in many cases. It is also required to install new transformers where ever required.
Based on the discussion, it was found that identification of faults in the feeder is consuming lion's
portion of the down time of feeders when compared to the actual time taken for subsequent
rectification. Installing modern devices to alert the field officers (preferably on their smart
phone) in the event of any fault occurring in the zone of operation of the device should be done.
Lack of isolation devices at proper location (along the feeder or at the transformer point) also is
increases down time. In the absence of isolation device at transformer point, a number of
transformers are sometimes required to be switched off to attend maintenance activities of a
single transformer. Hence, availability of healthy AB switches at all transformer locations is
required. Similarly, installation of isolation devices along the line will increase the flexibility and
improve the supply availability considerably.
Out of the total 3061 km HT line, 3048 km is drawn using bare OH line. In many areas, these
lines are drawn as multi circuit along the same poles. If maintenance activities are to be carried
in one of these circuits, the other circuit also need to be switched off on safety considerations,
affecting thousands of consumers. Bare OH feeders through thick vegetation pose a threat to
reliability. Insulated conductors like UG cable or ABC is an option in these situations. Partially
insulated (covered) conductors can also be used in vegetated area.
• Improving System Efficiency And Reducing Losses - Low T&D losses is a true indicator of a
healthy electrical distribution system. Hence, it is imperative that the region should invariably include
measures to reduce system losses, thereby improving energy efficiency. Main Reasons for technical
Losses are found to be the following: (1) lengthy distribution lines as some of the distribution
transformers are located away from load centers (2) uneven current in phases due to load unbalancing

Kochi Bengaluru Industrial Corridor –Draft Perspective Plan for overall KBIC region - Draft
160
under many transformers (3) increased contact resistances in the network due to bad workmanship (4)
improper sizing and selection of transformers (5) improper sizing and selection of conductors
The following measure can be taken to meet the stated objective –
o Re-conductoring undersized and worn out conductors
o Conversion of LT 1-Phase lines to 3-Phase
o Repositioning of transformers
o Re-conductoring with ABC/ UG cables or Covered Conductors
o Constructing new LT lines for load sharing
o Introducing High Voltage Distribution System
• Ensuring Safe Installations – Some of the below measures can be taken to ensure safe installations
which will also add to the improved performance of the network
o Standardization of transformer installations, including suitable switching, mechanisms,
fencing and yard metaling;
o Dismantling of unused and unnecessary lines for ensuring safety, without compromising
desired redundancy;
o Converting lines in areas of thick vegetation to insulated systems (ABC/Covered conductors);
o Providing fail safe tripping mechanisms, in unsafe areas;
o Upgrading installations to ensure compliance to relevant rules, regulations and standards,
after evolving location specific designs;
o Providing adequate number of Line ABs or other switching devices;
o Re-conductoring the AAC and Copper Conductors with ACSR and AB Cables.
Between FY 18 and FY 23, the below table summarizes the total capex outlay in the Palakkad region to improve
the overall reliability of supply. Total spend of Rs 195 Cr. in 5 years.
The details of the Task in provided in Appendix F.
Table 99: Total capex outlay in Palakkad region (Between FY 18 and FY 23)
Sr. Objective Capex Spend (Rs Lakhs)
1 Reliability of supply 2504.95
2 Reduction in Distribution loss to aid reliability improvement 859.17
3 Safe Installations 2141.47
4 Connecting RE sources 8.42
5 Electrification 56.13
6 Miscellaneous to improve reliability, loss reduction etc. 14004.15
7 Total 19574.29
5.2.3. Reliability improvement in the Thrissur region of the Palakkad – Thrissur IMC
The Integrated Manufacturing Cluster (IMC) is planned across four towns of which the following fall under the Thrissur region which is adjoin to the Palakkad - Thrissur IMC. This include the following –
• Dessamangalam Section, Thrissur Circle
Demand Forecast of the Thrissur region (BIS) shows that consumption of electricity will increase from 1175 MU (FY 18) to 1572 MU (FY 23). This will result in the peak demand in the region to increase from about 194 MVA (FY 18) to 259 MVA (FY 23). The below figure shows the breakup in demand across categories.

Kochi Bengaluru Industrial Corridor –Draft Perspective Plan for overall KBIC region - Draft
161
Figure 88: Demand in MVA across categories
Source: KSEBL and Study Team Analysis
This demand is further broken across the target locations in the node where the IMC is going to come up.
• Desamangalam Section, Thrissur Circle
This peak demand (BIS) in this region is expected to increase from about 0.5 MVA (FY 18) to 1.15 MVA (FY 23).
Figure 89: Demand in MVA across categories
Source: KSEBL and Study Team Analysis
0
50
100
150
200
250
300
FY 18 FY 19 FY 20 FY 21 FY 22 FY 23
Domestic Commercial Industrial Agri Public Lighting
0.00
0.20
0.40
0.60
0.80
1.00
1.20
1.40
FY 18 FY 19 FY 20 FY 21 FY 22 FY 23
Domestic Commercial Industrial Agri Public Lighting

Kochi Bengaluru Industrial Corridor –Draft Perspective Plan for overall KBIC region - Draft
162
Table 100: Sufficiency of transmission and distribution network – Thrissur region
FY 19
Demand FY 23
Demand Current Transformation
Capacity (FY 19)
Sufficiency of Network at
Transmission and Distribution
MVA MVA MVA
Desamangalam 1 1.5 25 Yes
Rest of Thrissur Circle 204 257.5 580 Yes
Total 205 259 605
As can be seen, the current Transformation capacity 605 MVA at the transmission level is sufficient to meet the current and future load growth in the Palakkad region and the IMC planned in the region.
Measure to improve reliability of supply in the Thrissur region
• Enhancing reliability and quality of the power supplied – On studying and analyzing the key
issues faced in the network the following two measures would help in meeting the stated objective –
o Improving HT Feeder Availability - There are 130 HT feeders emanating from 28 substations in
the Thrissur region. At present 30% of the main lines have back feeding facility. From the
network map, it’s inferred that this can be further improved to 80% by the measures of
interlinking feeders, ring formations and drawing a few kilometers of new HT feeders. However,
some of the transformers shall continue to remain without alternate feeding arrangements due
to the nature of locality.
o Improving Transformer and LT feeder Availability - Analysis of data indicates that there are
5082 distribution transformers under Thrissur region with a total transformation capacity of 605
MVA. Considering load factor, the peak demand in LT side will be around 172 MVA only.
Attempts should be made to relocate the transformers to load centers and to replace
higher/lower rated capacity transformers with optimal capacity wherever possible. However, in
many cases the load factor is much below the average. Recorded maximum demand and
minimum demand vary drastically from season to season; diurnal and nocturnal variation also
is significant in many cases. It is also required to install new transformers where ever required.
Based on the discussion, it was found that identification of faults in the feeder is consuming lion's
portion of the down time of feeders when compared to the actual time taken for subsequent
rectification. Installing modern devices to alert the field officers (preferably on their smart
phone) in the event of any fault occurring in the zone of operation of the device should be done.
Lack of isolation devices at proper location (along the feeder or at the transformer point) also is
increases down time. In the absence of isolation device at transformer point, a number of
transformers are sometimes required to be switched off to attend maintenance activities of a
single transformer. Hence, availability of healthy AB switches at all transformer locations is
required. Similarly, installation of isolation devices along the line will increase the flexibility and
improve the supply availability considerably.
Out of the total 3184 km HT line, 3121 km is drawn using bare OH line. In many areas, these lines
are drawn as multi circuit along the same poles. If maintenance activities are to be carried in one
of these circuits, the other circuit also need to be switched off on safety considerations, affecting
thousands of consumers. Bare OH feeders through thick vegetation pose a threat to reliability.

Kochi Bengaluru Industrial Corridor –Draft Perspective Plan for overall KBIC region - Draft
163
Insulated conductors like UG cable or ABC is an option in these situations. Partially insulated
(covered) conductors can also be used in vegetated area.
• Improving System Efficiency And Reducing Losses - Low T&D losses is a true indicator of a
healthy electrical distribution system. Hence, it is imperative that the region should invariably include
measures to reduce system losses, thereby improving energy efficiency. Main Reasons for technical
Losses are found to be the following: (1) lengthy distribution lines as some of the distribution
transformers are located away from load centers (2) uneven current in phases due to load unbalancing
under many transformers (3) increased contact resistances in the network due to bad workmanship (4)
improper sizing and selection of transformers (5) improper sizing and selection of conductors
The following measure can be taken to meet the stated objective –
o Re-conductoring undersized and worn out conductors -Substantial length of the LT conductors
in the Thrissur PMU area s till contain undersized & worn out Copper/ AAC / A AAC. This is
causing considerable loss in the distribution system.
o Conversion of LT 1-Phase lines to 3-Phase - Conversion of single phase lines to three phase lines
shall bring good savings in I2R losses due to reduction in load current and also by balancing
of load current.
o Repositioning of transformers
o Re-conductoring with ABC/ UG cables or Covered Conductors
o Constructing new LT lines for load sharing - Construction of few meters of LT lines, in many
cases, can bring about remarkable improvements in sharing of loads between transformers
and ensuring optimum loading
o Introducing High Voltage Distribution System
• Ensuring Safe Installations – Some of the below measures can be taken to ensure safe installations
which will also add to the improved performance of the network
o Standardization of transformer installations, including suitable switching, mechanisms,
fencing and yard metaling;
o Dismantling of unused and unnecessary lines for ensuring safety, without compromising
desired redundancy;
o Converting lines in areas of thick vegetation to insulated systems (ABC/Covered conductors);
o Providing fail safe tripping mechanisms, in unsafe areas;
o Upgrading installations to ensure compliance to relevant rules, regulations and standards,
after evolving location specific designs;
o Providing adequate number of Line ABs or other switching devices;
o Re-conductoring the AAC and Copper Conductors with ACSR and AB Cables.
Between FY 18 and FY 23, the below table summarizes the total capex outlay in the Palakkad region to improve
the overall reliability of supply. Total spend of Rs 225 Cr. in 5 years.
The details of the Task in provided in Appendix F.
Table 101: Total capex outlay in Thrissur region (Between FY 18 and FY 23)
Sr. Objective Capex Spend (Rs Lakhs)
1 Reliability of supply 5094.84
2 Reduction in Distribution loss to aid reliability improvement 1930.6
3 Safe Installations 1330.71
4 Connecting RE sources 3.57

Kochi Bengaluru Industrial Corridor –Draft Perspective Plan for overall KBIC region - Draft
164
5 Electrification
6 Miscellaneous to improve reliability, loss reduction etc. 14127.32
7 Total 22487.04

Kochi Bengaluru Industrial Corridor –Draft Perspective Plan for overall KBIC region - Draft
165
6. Urban infrastructure assessment
6.1. Major urban centers – Kerala
This section details urban profiles of major influence cities of the proposed corridor. Followed by as-is assessment of existing urban infrastructure and service delivery benchmarking to gauge readiness and responsiveness to service delivery standards (defined by MoUD) in these urban centres.
With above background, this report aims to deliver the following objectives:
• Urban infrastructure requirements for 2035 based on the population projection for the districts falling in the
corridor and major urban centres.
• Assessment of infrastructure – services level delivery and issues on the supply side.
• Proposed strategic initiatives to ensure infrastructure readiness over the forecast period.
• Projects already proposed under AMRUT
The following section provides an overview of the existing infrastructure across the four urban sectors viz. water supply, sewerage, solid waste management and storm water drainage. Further, it discusses the existing demand for infrastructure as well as future anticipated demand in the Business-as-Usual (BAU) and Business-Induced-Scenario (BIS). It also discusses the existing capacity augmentation plans that are either under implementation or under planning stage. It also discusses the existing capacity augmentation plans that are either under implementation or under planning stage. Taking these the infrastructure gap assessment is arrived for future demand.
Out of all the urban centres falling within the proposed corridor districts, nine (9) urban centres have been shortlisted, which are Kochi, Palakkad, Thrissur, Kannur and Kozhikode in Kerala and Coimbatore, Salem, Erode and Hosur in Tamil Nadu.
Figure 90: Urban Centres in KBIC Region

Kochi Bengaluru Industrial Corridor –Draft Perspective Plan for overall KBIC region - Draft
166
Urban infrastructure demand is crucially linked to growth in the population of the nodes. The charts below gives an overview of node-level effect of incremental projected population increase in population along with census population for 2001* and 2011*.
Figure 91: Major town population for Kerala
It is observed that the population projections for most of the urban centres of Kerala considered under KBIC are having negligible growth. Except Thrissur which is expecting highest growth rate amongst the urban centres. It is also observed that there are no million plus urban centres in the study area.
Figure 92: Major town population for Tamil Nadu
Amongst the six urban centres which are part of the KBIC region only Erode is expected to have negligible growth projection whereas the remaining urban centres are expected to have steady growth over the period. Presently only Coimbatore is the million plus urban centre amongst the Tamil Nadu urban centres in KBIC, but Salem is expected to be a million plus urban centre by 2025.
Based on the projected population demand supply gap has been identified for the major urban centres with the nodes in the corridor. This section also reviews the proposed/ planned infrastructure supply across each infrastructure components and readiness of these nodes to address the existing infrastructure gap and future demand till 2035.
6.1.1. Palakkad – Thrissur IMC
6.1.1.1. Water Supply
Palakkad
Overview of the water supply scenario in Palakkad urban centre are summarized here

Kochi Bengaluru Industrial Corridor –Draft Perspective Plan for overall KBIC region - Draft
167
Water Supply & Source: Presently, water supply to the Palakkad city is around 28 MLD which includes losses & NRW. About 86% of this is being supplied to domestic connections i.e., 25 MLD, with balance distributed to commercial, industrial and other users. Water is sourced from Malampuzha dam (on Bharathapuzha River) located at a distance of 12 km north of city. Water from the source reaches to multiple filter plants established over a period from 1959. The some sections of raw water mains are under rehabilitation under AMRUT. As per the projected population of Palakkad, sufficient water quantity is available to meet the demand of approximately 19 MLD. Present rate of supply of water is 150 lpcd.
Treatment Facility: the current installed capacity of filter plants in Palakkad city is 34 MLD, which is sufficient to meet the current and future demand till 2035. Currently three filter plants of 9 MLD (1959), 12.5 MLD (1989) and 12.5 MLD (2009) are operational. There is proposal of reconstructing the Malampuzha 12.5 MLD filter plant to 45 MLD capacity under AMRUT.
Distribution and Coverage: Water supply in Palakkad is divided into three zones viz., Mattumantha zone, Moothanthara zone and Fort-Kalmandapam zone. Water is distributed in each zone through separate OHSR and GLSR. As per the information, supply duration varies from 8 to 12 hours. Few parts of the city also gets 24 hours of supply. Out of the total 207 km of road length in Palakkad, 81% network coverage is present.
Others: Basis of billing for water supply charges is based on metering. Extent of metering is more than 95%. Water tariff for residential connections is charged at the rate of Rs. 4/KL with fixed charge of Rs. 20 for consumption upto 15 KL. Incremental charges for usage beyond 15 KL with charges varying from Rs. 6/KL to Rs. 14/KL. For non-domestic usages separate charges are in place. Palakkad is able to achieve 100% O&M cost recovery indicating positive sign. Charges for public stand post are paid by Municipality.
Water Availibility
•Main surface sources of water is Malampuzha dam
•Adequate availibility of water to meet present demand
Treatment facility
•Current installed capacity is 34 MLD
•Sufficient to meet demand till 2035
Storage
•Water is distributed through ground and elevated reservoirs
•Storage sufficient to meet the demand
Coverage
•Service area is divided into three zones
•Network coverage is 81%•80% of the households have access to piped water supply
Per capita supply
•Average volume of water produced is 28 MLD
•Avg 150 lpcd
Others
•Extent of Metering is 95%
•Water audit to address NRW is required

Kochi Bengaluru Industrial Corridor –Draft Perspective Plan for overall KBIC region - Draft
168
Figure 93: Water Supply Scheme for Palakkad (KWA)
Thrissur
Overview of the water supply scenario in Thrissur urban centre are summarized here

Kochi Bengaluru Industrial Corridor –Draft Perspective Plan for overall KBIC region - Draft
169
Water Supply & Source: Presently, water is supplied from Peechi Dam and from Karuvannur River to Thrissur city which is around 34 MLD. There is adequacy of water at source but with the installed capacity presently only 34 MLD is being supplied. In order to meet the present and future (2035) demand there is deficit of around 11.2 MLD and 17.9 MLD respectively. Augmentation of facility is already being proposed under AMRUT by 20 MLD which will be able to meet the demand of 2035. Present rate of supply of water is 93 lpcd against the MoUD benchmark of 135 lpcd.
Treatment Facility: the current there are multiple water treatment plants (WTPs) treating water for Thrissur. Two WTP located at Peechi Dam with total installed capacity of 50 MLD provides around 31 MLD of treated water to Thrissur city. Whereas 1.5 MLD is supplied from Mulayam WTP located near Manali River and 1.2 MLD from Karuvannur river. Thus total installed capacity is 33.7 MLD. New 20 MLD treatment plant is proposed under AMRUT at Peechi Dam.
Distribution and Coverage: Water supply in Palakkad is divided into six zones viz., Thekkainkadu zone (Old Municipal zone of 12.6 sqkm), Kokkalai zone, Vilvattam zone, Pallikulam zone, Kizhakkum Pattukara zone and Aranattukara zone. Only Thekkainkadu zone is maintained by ULB while rest of the zone are managed by Kerala Water Authority. Hence, making the management of water supply system in Thrissur city under control of ULB and KWA. Water is distributed in each zone through separate OHSR and GLSR. As per the information, supply duration varies around 10 hours. Few parts of the city also get 24 hours of supply. Out of the total 1,795 km of road length in Thrissur, 93% network coverage is present with network length of 1,678 km.
Others: Basis of billing for water supply charges is based on metering. Extent of metering is more than 90%. Thrissur is able to recover about 60% of cost through service charges with efficiency in collection of water supply charges of around 55%. Water tariff for residential connections is charged at the rate of Rs. 4/KL with fixed charge of Rs. 20 for consumption upto 15 KL. Incremental charges for usage beyond 15 KL with charges varying from Rs. 6/KL to Rs. 14/KL. For non-domestic usages separate charges are in place.
Water Availibility
•Main surface sources of water is Peechi dam and Karuvannur River
•Adequate availibility of water to meet present demand
Treatment facility
•Current installed capacity is 33.7 MLD
•Current capacity needs augmentation to meet future demand
Storage
•Water is distributed through ground and elevated reservoirs
•Storage sufficient to meet the demand
Coverage
•Service area is divided into six zones
•Network coverage is 93%•61% of the households have access to piped water supply
Per capita supply
•Average volume of water produced is 34 MLD
•Avg 93 lpcd
Others
•Extent of Metering is 90%
•About 30% of NRW is reported
•Cost recovery is 60%

Kochi Bengaluru Industrial Corridor –Draft Perspective Plan for overall KBIC region - Draft
170
Figure 94: Water Supply Zones in Thrissur (ULB & KWA)
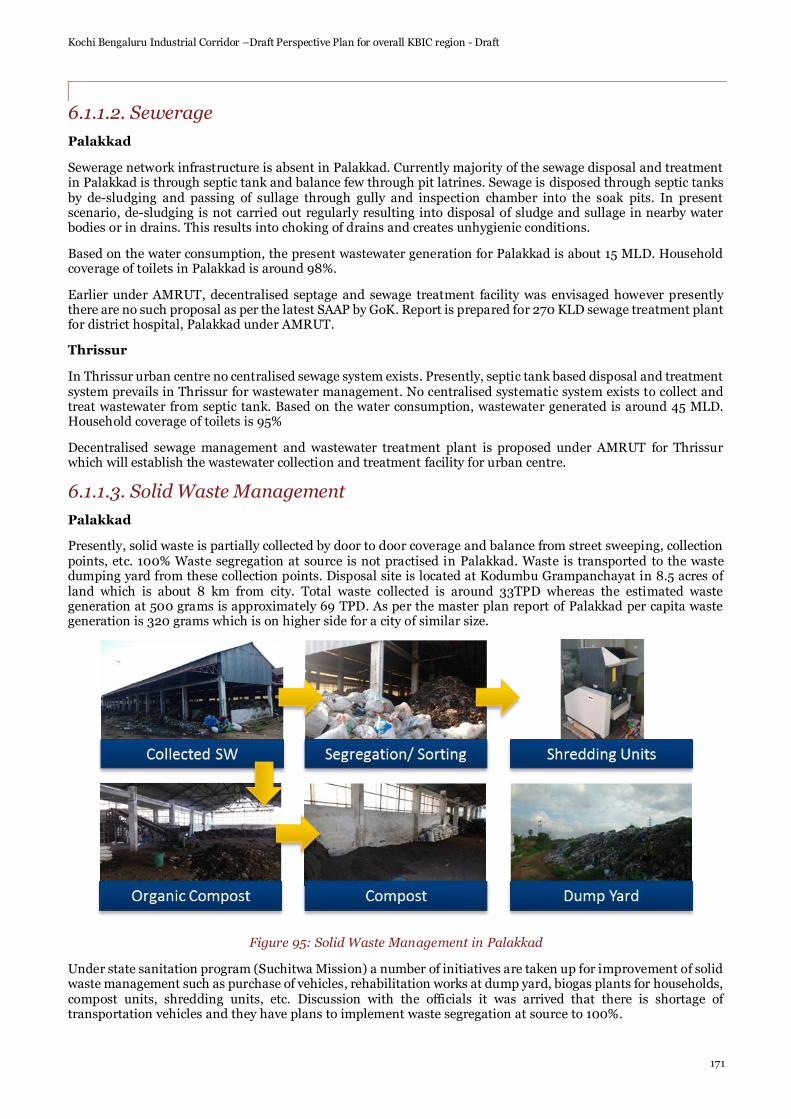
Kochi Bengaluru Industrial Corridor –Draft Perspective Plan for overall KBIC region - Draft
171
6.1.1.2. Sewerage
Palakkad
Sewerage network infrastructure is absent in Palakkad. Currently majority of the sewage disposal and treatment in Palakkad is through septic tank and balance few through pit latrines. Sewage is disposed through septic tanks by de-sludging and passing of sullage through gully and inspection chamber into the soak pits. In present scenario, de-sludging is not carried out regularly resulting into disposal of sludge and sullage in nearby water bodies or in drains. This results into choking of drains and creates unhygienic conditions.
Based on the water consumption, the present wastewater generation for Palakkad is about 15 MLD. Household coverage of toilets in Palakkad is around 98%.
Earlier under AMRUT, decentralised septage and sewage treatment facility was envisaged however presently there are no such proposal as per the latest SAAP by GoK. Report is prepared for 270 KLD sewage treatment plant for district hospital, Palakkad under AMRUT.
Thrissur
In Thrissur urban centre no centralised sewage system exists. Presently, septic tank based disposal and treatment system prevails in Thrissur for wastewater management. No centralised systematic system exists to collect and treat wastewater from septic tank. Based on the water consumption, wastewater generated is around 45 MLD. Household coverage of toilets is 95%
Decentralised sewage management and wastewater treatment plant is proposed under AMRUT for Thrissur which will establish the wastewater collection and treatment facility for urban centre.
6.1.1.3. Solid Waste Management
Palakkad
Presently, solid waste is partially collected by door to door coverage and balance from street sweeping, collection points, etc. 100% Waste segregation at source is not practised in Palakkad. Waste is transported to the waste dumping yard from these collection points. Disposal site is located at Kodumbu Grampanchayat in 8.5 acres of land which is about 8 km from city. Total waste collected is around 33TPD whereas the estimated waste generation at 500 grams is approximately 69 TPD. As per the master plan report of Palakkad per capita waste generation is 320 grams which is on higher side for a city of similar size.
Figure 95: Solid Waste Management in Palakkad
Under state sanitation program (Suchitwa Mission) a number of initiatives are taken up for improvement of solid waste management such as purchase of vehicles, rehabilitation works at dump yard, biogas plants for households, compost units, shredding units, etc. Discussion with the officials it was arrived that there is shortage of transportation vehicles and they have plans to implement waste segregation at source to 100%.
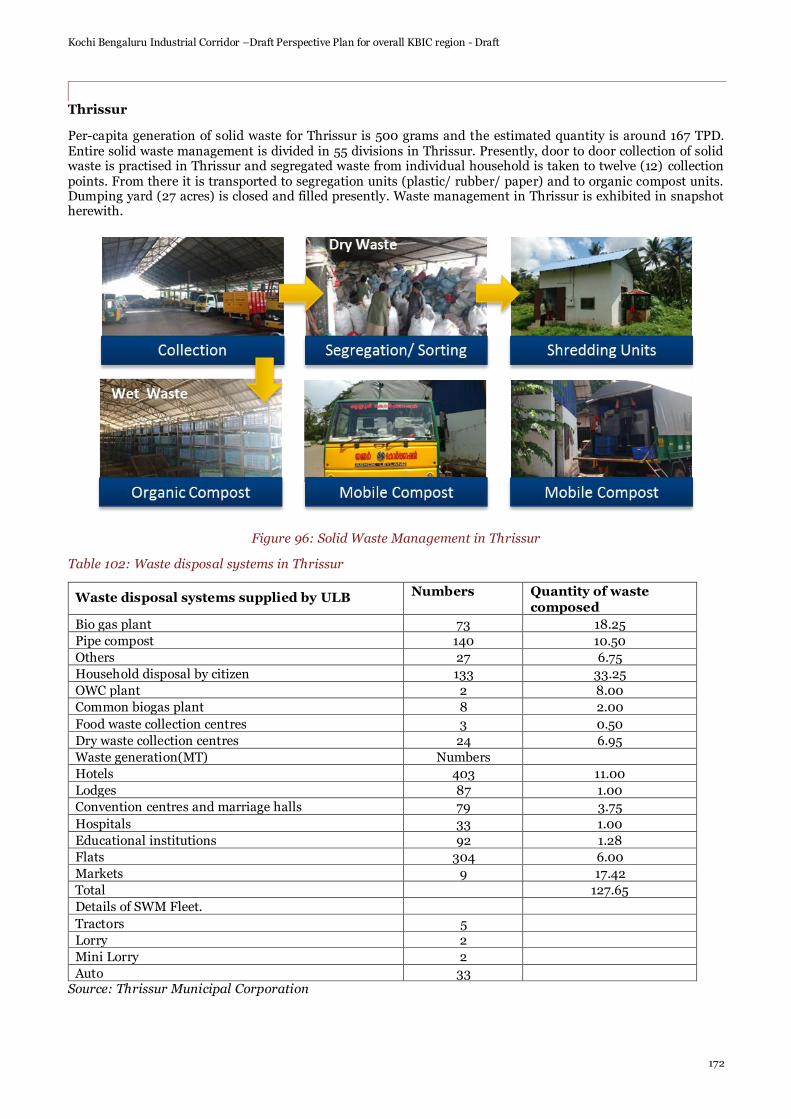
Kochi Bengaluru Industrial Corridor –Draft Perspective Plan for overall KBIC region - Draft
172
Thrissur
Per-capita generation of solid waste for Thrissur is 500 grams and the estimated quantity is around 167 TPD. Entire solid waste management is divided in 55 divisions in Thrissur. Presently, door to door collection of solid waste is practised in Thrissur and segregated waste from individual household is taken to twelve (12) collection points. From there it is transported to segregation units (plastic/ rubber/ paper) and to organic compost units. Dumping yard (27 acres) is closed and filled presently. Waste management in Thrissur is exhibited in snapshot herewith.
Figure 96: Solid Waste Management in Thrissur
Table 102: Waste disposal systems in Thrissur
Waste disposal systems supplied by ULB Numbers Quantity of waste
composed
Bio gas plant 73 18.25
Pipe compost 140 10.50
Others 27 6.75
Household disposal by citizen 133 33.25
OWC plant 2 8.00
Common biogas plant 8 2.00
Food waste collection centres 3 0.50
Dry waste collection centres 24 6.95
Waste generation(MT) Numbers
Hotels 403 11.00
Lodges 87 1.00
Convention centres and marriage halls 79 3.75
Hospitals 33 1.00
Educational institutions 92 1.28
Flats 304 6.00
Markets 9 17.42
Total 127.65
Details of SWM Fleet.
Tractors 5
Lorry 2
Mini Lorry 2
Auto 33 Source: Thrissur Municipal Corporation

Kochi Bengaluru Industrial Corridor –Draft Perspective Plan for overall KBIC region - Draft
173
6.1.1.4. Storm Water Drainage
Palakkad
Existing drainage pattern in Palakkad is composite of natural and man-mande drains, draining the storm water into Kalpathy and Kannadi rivers. Terrain in Palakkad is undulating creating low lying and flood prone pockets. There are a series of primary and secondary drains leading to two rivers, whereas tertiary drains (along the road) are linked to secondary drain network. These drains are mostly uncovered and approximately 122 km in length. In addition to the storm water, these drains are also caring the illegal sullage discharged into them resulting into unhygienic condition. As most of the drains are uncovered and open they are common dumping place for litter and garbage resulting in choking and reduced carrying capacity.
Currently coverage of storm water drainage network is 61% with instances of water logging being reported in city. Construction and maintenance of SWD is joint responsibility of ULB and KWA. Rejuvenation of drains and covering of minor drains are proposed under AMRUT.
Thrissur
The terrain of Thrissur is such that it is naturally draining storm water out of the city. There are about 60km of natural drains and around 335km of storm water drains. Coverage of storm water drainage network is 6% only which comprises of covered and uncovered drains. There are instances of water logging reported in the urban centre. Thrissur needs new drains to be constructed and rehabilitation of the existing ones (widening, de-silting, etc.). It is also observed that the utility networks are either passing through or cross the storm water drains at few places imposing serious concerns and choking or drains.
It is proposed to cover the minor drains and construction of new drains under AMRUT for Thrissur to improve the storm water drainage.
6.1.2. Kannur IMC
6.1.2.1. Water Supply
Kannur
Overview of the water supply scenario in Palakkad urban centre are summarized here
Water Supply & Source: Presently, water supply to the Kannur city is around 30 MLD which includes losses & NRW. Water is sourced from Pazhassi reservoir located at a distance of 40 km from city through intake well at Veliyambra. Water is pumped to 30 MLD WTP at Chavasseryparamba through booster station (2 nos 500 HP VT Pumpsets with 100% standby). After treatment water is distributed through gravity to different parts of the city from 12.5LL Clear water sump. In order to increase the capacity of system raw water pumps are proposed under AMRUT along with rehabilitation of old network segments. As per the projected population of Kannur, sufficient water quantity is available to meet the demand. Present rate of supply of water is 90 lpcd.
Treatment Facility: The current installed capacity of treatment plants in Kannur city is 30 MLD, which is sufficient to meet the current demand.
Water Availibility
•Main surface sources of water is Pazhassi resevior
•Adequate availibility of water to meet present demand
Treatment facility
•Current installed capacity is 36 MLD
•Sufficient to meet demand
Storage
•Water is distributed through ground and elevated reservoirs
•Storage sufficient to meet the demand
Coverage
•Service area is divided into five zones
•Network coverage is xx%•43% of the households have access to piped water supply
Per capita supply
•Average volume of water produced is 30 MLD
•Avg 90 lpcd
Others
•Extent of Metering is xx%

Kochi Bengaluru Industrial Corridor –Draft Perspective Plan for overall KBIC region - Draft
174
Distribution and Coverage: Water supply in Kannur is divided into five zones viz., Edakkad, Elayavoor, Puzhati, Pallikunnu and Kannur corporation zone. Water is distributed in each zone through separate OHSR and GLSR. Details of storage reservoirs are Melechova (28 LL), Elayavoor (8LL), SN College (0.25LL), Chala (4LL), Thana (40LL), Sangeetha junction (16LL), Kasanakkotta (2.25 LL), Vattakulam (8.5LL), Kacheripara (13LL), Kakkad (2.5LL), Payangodan para (1.5LL), Pallikkunnu (4.5LL) and Panankavu (5 LL). As per the information, 80% network coverage is present in Kannur with total length of network as 398 km. Schematic water supply scheme for Kannur is shown in figure below
Figure 97: Water Supply Scheme for Kannur (KWA)
6.1.2.2. Sewerage
Kannur
Centralised sewerage collection and treatment facility if not present in Kannur. Coverage of toilets in Kannur is 98%. Households are dependent on septic tanks. Detail project report for decentralised sewerage and septage management is under process under AMRUT.
6.1.2.3. Solid waste management
Kannur
Per capita waste generation is estimated as 30TPD for Kannur where present solid waste collected is 35.5 TPD. Household waste collection is practised and transported to the collection points at Thekki bazaar, stadium, plaza junction, onden road, Town centre, Thana, Thayyil. Dumping ground is available at Chelore in 2 acres of land.
Figure 98: Solid Waste Management in Kannur

Kochi Bengaluru Industrial Corridor –Draft Perspective Plan for overall KBIC region - Draft
175
6.1.3. Other Urban Centres of Kerala
6.1.3.1. Water Supply
Kochi
Overview of the water supply scenario in Kochi urban centre are summarized here
Water Supply & Source: Water is sourced from Periyar and Muvattupuzha River for Kochi which are located approximately 20km and 26km respectively. Head works are located at Aluva on Periyar River and at Pazhoor on Muvattupuzha River. Presently, 270 MLD of water is supplied to urban centre which includes losses & NRW. As per the projected population of Kochi, sufficient water quantity is available to meet the demand of approximately 86 MLD. Present rate of supply of water is 145 lpcd.
Treatment Facility: The current cumulative installed capacity of treatment plants in Kochi city is 325 MLD, which is sufficient to meet the current and future demand till 2035. Currently four treatment plants of 225 MLD (48 MLD in 1965, 72 MLD in 1972, 70 in 1990 and 35 MLD in 2002) at Aluva and one treatment plant of 100 MLD at Maradu are operational.
Distribution and Coverage: The city is divided into 19 zones for water supply. Presently the transmission and distribution lines are interlinked in city creating unequitable distribution of water. High NRW is being reported due to interlinking of lines, faulty meters, leaking distribution line, etc. Water is distributed in each zone through eight (8) ELSRs with capacity of 12.8 ML and six (6) GLSRs with 4 ML capacity with a combined total capacity of 16.8ML Storage facility is not sufficient and there are proposal for development of OHSRs with interlinking to pumping main and distribution network at Edakochi zone, Karuvelipaddy zone and Kaloor zone. As per the information, water is supplied for about 24 hours in most of the corporation area. Network coverage is present on all most all the roads.
Others: Basis of billing for water supply charges is based on metering. Extent of metering is more than 96%, however city is reporting presence of faulty meters. Under AMRUT replacement of these faulty meters is taken up along with installation of bulk meters at various locations in distribution network. Water tariff for residential connections is charged at the rate of Rs. 4/KL with fixed charge of Rs. 20 for consumption upto 15 KL. Incremental charges for usage beyond 15 KL with charges varying from Rs. 6/KL to Rs. 14/KL. For non-domestic usages separate charges are in place. Cost recovery in Kochi is 44% with efficiency of collection of service charges at 80%.
Water Availibility
•Main surface sources of water is Periyar & Muvattupuzha river
•Adequate availibility of water
Treatment facility
•Current installed capacity is 325 MLD
•Sufficiency in capacity to meet demand
Storage
•Water is distributed through ground and elevated reservoirs
•Storage is in-sufficient to meet the demand
Coverage
•Service area is divided into three zones
•Network coverage is 100%•89% of the households have access to piped water supply
Per capita supply
•Average volume of water produced is 270 MLD
•Avg 145 lpcd
Others
•Extent of Metering is 96%
•Water audit to address NRW is required
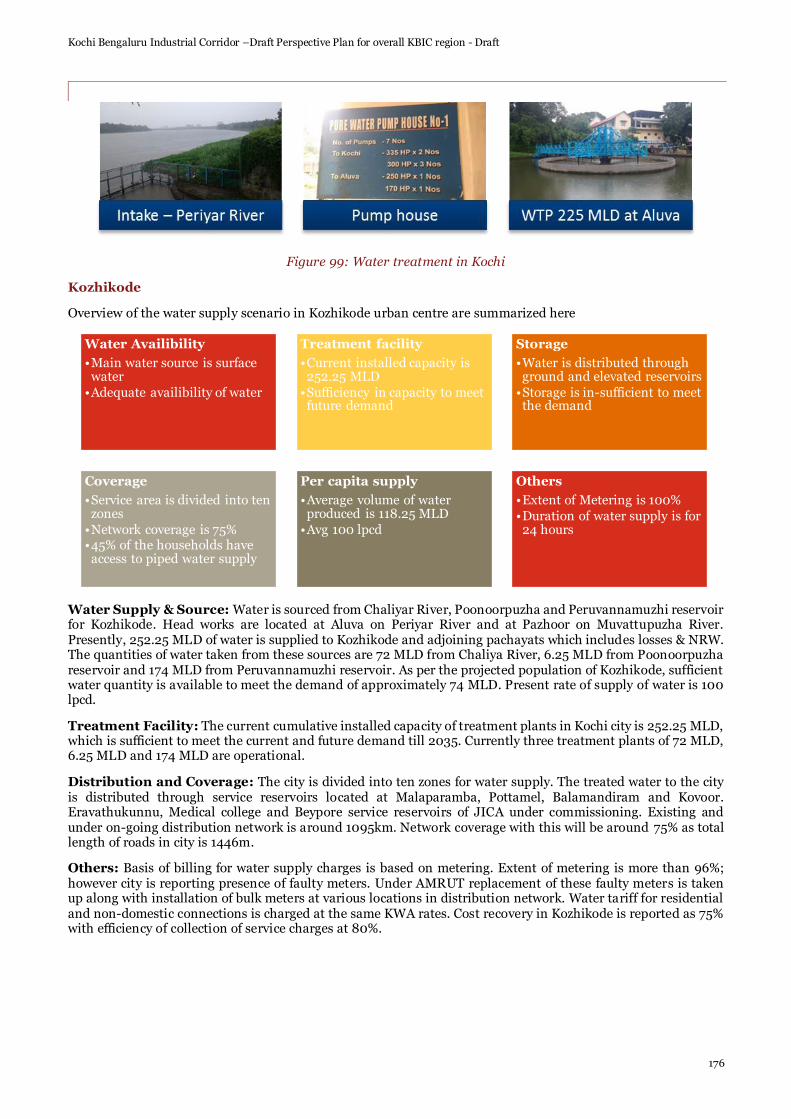
Kochi Bengaluru Industrial Corridor –Draft Perspective Plan for overall KBIC region - Draft
176
Figure 99: Water treatment in Kochi
Kozhikode
Overview of the water supply scenario in Kozhikode urban centre are summarized here
Water Supply & Source: Water is sourced from Chaliyar River, Poonoorpuzha and Peruvannamuzhi reservoir for Kozhikode. Head works are located at Aluva on Periyar River and at Pazhoor on Muvattupuzha River. Presently, 252.25 MLD of water is supplied to Kozhikode and adjoining pachayats which includes losses & NRW. The quantities of water taken from these sources are 72 MLD from Chaliya River, 6.25 MLD from Poonoorpuzha reservoir and 174 MLD from Peruvannamuzhi reservoir. As per the projected population of Kozhikode, sufficient water quantity is available to meet the demand of approximately 74 MLD. Present rate of supply of water is 100 lpcd.
Treatment Facility: The current cumulative installed capacity of treatment plants in Kochi city is 252.25 MLD, which is sufficient to meet the current and future demand till 2035. Currently three treatment plants of 72 MLD, 6.25 MLD and 174 MLD are operational.
Distribution and Coverage: The city is divided into ten zones for water supply. The treated water to the city is distributed through service reservoirs located at Malaparamba, Pottamel, Balamandiram and Kovoor. Eravathukunnu, Medical college and Beypore service reservoirs of JICA under commissioning. Existing and under on-going distribution network is around 1095km. Network coverage with this will be around 75% as total length of roads in city is 1446m.
Others: Basis of billing for water supply charges is based on metering. Extent of metering is more than 96%; however city is reporting presence of faulty meters. Under AMRUT replacement of these faulty meters is taken up along with installation of bulk meters at various locations in distribution network. Water tariff for residential and non-domestic connections is charged at the same KWA rates. Cost recovery in Kozhikode is reported as 75% with efficiency of collection of service charges at 80%.
Water Availibility
•Main water source is surface water
•Adequate availibility of water
Treatment facility
•Current installed capacity is 252.25 MLD
•Sufficiency in capacity to meet future demand
Storage
•Water is distributed through ground and elevated reservoirs
•Storage is in-sufficient to meet the demand
Coverage
•Service area is divided into ten zones
•Network coverage is 75%•45% of the households have access to piped water supply
Per capita supply
•Average volume of water produced is 118.25 MLD
•Avg 100 lpcd
Others
•Extent of Metering is 100%
•Duration of water supply is for 24 hours

Kochi Bengaluru Industrial Corridor –Draft Perspective Plan for overall KBIC region - Draft
177
Figure 100: Water treatment in Kozhikode
6.1.3.2. Sewerage
Kochi
Underground sewerage network covers 3% of the corporation area covering an area of 2.5 sqkm in the central general hospital area and 1.5 sqkm of Gandhi nagar area. Although the later is having sewerage network, very few household have connected to the network and are have on-site sanitation disposal. Total length of the network is 28.4km. Detailed studies have been conducted to cover the entire city with network by KWA and Corporation.
There is an existing 4.5 MLD sewage treatment plant located at Ellumkulam following activated treatment process of sewage treatment. The treated effluent is discharged into Elankulam Thodu. There is another STP of 900KLD maintained by GCDA at marine drive discharging the treated effluent into the sea. Treatment efficiency report under service level benchmark is 4.5%. Coverage of toilets is 95% in Kochi. This indicates majority of the households are having on-site sanitation through septic tanks. Septage management is taken up by private operators for cleaning and maintenance on chargeable basis.
Proposal to implement comprehensive decentralised sewage system for five divisions of Kochi is proposed under AMRUT.
Figure 101: Sewerage treatment in Kochi
Kozhikode
Sewerage collection and treatment system is under implementation in city. Presently the network does not exists for collection of sewage. Detailed report is already prepared for the entire city for comprehensive sewerage facility. Coverage of toilets in city is 97% and disposal is on-site with soak pits and septic tanks. Filled up tanks are either pumped or cleaned by municipality or by private agencies. No sewerage treatment plant exists.
Sewerage collection and treatment plants are proposed under AMRUT for the entire city (city is divided into 5 zones as per the detailed study and projects are proposed). Presently projects are under development for city central area only which will be servicing limited number of households.
6.1.3.3. Solid waste management
Kochi
Solid waste primary collection in Kochi is carried out by different groups and transferred to secondary collection points. Waste is being collected in segregated manner in bins at household level. Secondary collection and transportation of solid waste is done by ULB. Waste is transported to waste treatment plant located at

Kochi Bengaluru Industrial Corridor –Draft Perspective Plan for overall KBIC region - Draft
178
Brahmapuram site (37.3 acres) at a distance of 20km from city centre. The installed capacity of the waste treatment plant is 200 TPD for mechanical composting and 50 TPD of organic waste by vermi composting. There is also RDF plant within the facility. Total waste collected in Kochi is around 230 TPD (translating to 350-400 grams per capita generation).
Figure 102: Solid waste treatment in Kochi
Kozhikode
Organised solid waste management is operational in the city mostly at the core city area and densely populated areas by Kudumbasaree members with auto rickshaws (32 numbers). Treatment and disposal is presently done at Njeliyanparamba in a 100 TPD composting facility. Waste is processed into manure and non-biodegradable wastes are land filled. Plastic wastes are recycled at recycling unit at West Hill. Present waste collection is around 300 TPD. Present collection and treatment system needs to be expanded to the surrounding areas.
Figure 103: Solid waste treatment in Kozhikode
6.1.3.4. Storm Water Drainage
Kochi
There are eighteen major canals traversing the city area as arterial drains discharging into the back waters. Arterial canals are receiving the storm water and sullage from secondary drains which in turn receives from tertiary drain network. The total length of secondary drains is approximately 250km and total length of drains is 1400kms. Coverage of drains is reported as 68%. The city is mostly plain with average altitude of 7.5 m above MSL on eastern side while it is 1m on western side. Carrying capacity of the drains is less as it is reducing due to several factors such as discharge of sullage and grey water due to absence of sewerage network, high water table, tidal effect, malfunctioning of septic tanks, clogging due to solid waste, silt deposition, etc.
There are instances of water logging and are addressed on case to case basis by the ULB. As per the earlier reports there are around 20 locations in the ULB which are prone to choking of drains due to high silt deposition and clogging due to solid waste especially plastic.
Rehabilitation and Renovation of the drains and canals is taken up under AMRUT which includes silt removal, fencing, construction of cover and side walls.
Kozhikode
There exist many natural drains and two manmade canals in the city. They are major drains which collect from smaller road side drains to primary drains or directly to sea. Out of the total road length of 973km in Kozhikode

Kochi Bengaluru Industrial Corridor –Draft Perspective Plan for overall KBIC region - Draft
179
city length of drains is 284km. EK canal, BK canal and Nallai pond-Kallai river canal are the primary drains existing in the city. Out of all the drains approximately 30% of the drains are covered drains.
City faces water logging during the monsoons due to its geography, presence of backwaters and river deltas, reduced carrying capacity of canals and drains due to solid waste, siltation, etc. As part of the overall city development, Kozhikode has identified stretches of the roads where construction of drains is warranted. This will also mitigate the incidence of water logging in these areas.
6.2. Major urban centers – Tamil Nadu
6.2.1. Coimbatore33
6.2.1.1. Water Supply
Figure 104: Water Supply in Coimbatore
Water Sources: Coimbatore is receiving 215 MLD of water from different sources. Siruvani, Pillur dams on Bhavani River which is a tributary river of Cauvery are two (2) major sources. From the Pillur dam, there are two (2) schemes; they are Pillur-I and Pillur-II. Apart from this Aliyar and Bhavani are other sources of water. Siruvani scheme is commissioned in the year 1993 with capacity of 101.4 MLD and Pillur-I in the year 1998 with capacity of 125 MLD.
Water Treatment: Water is treated at source itself using traditional treatment mechanisms. Plant capacities are Siruvani-101.40 MLD, Pillur-I- 125 MLD, Pillur-II- 125.00, Bhavani- 22.00, and Aliyar-17.60. Siruvani water treatment plant is located at Velliyankundu and consists of pre-sedimentation tank, aerator, Clariflocculator, Filter house, Clear water reservoir and Sump-cum-pump house etc.
Water Distribution: Water is transported directly to master service reservoirs which are supposed to cater two functions. First is to distribute the water to other service reservoir and the second is to distribute the water in their allocated service area. Likewise there are master reservoirs and 133 service reservoirs. There are totally 2,86,449 domestic, 10,087 industrial, 597 commercial and 12 institutional connections in Coimbatore as on July, 2019. For catering these, 2,200 kms lengthy network system is also placed considering all the schemes. It is covering around 94% of the city’s area.
Others: In Coimbatore, water supply duration is 12 hours in certain areas and it is varying in city considering wards receiving water only for 1-2 hours a day. Frequency is also varying in the city. On-going water supply projects are Kavundampalayam Vadavalli and Veerakeralam Water supply Improvement scheme, Thudiyalur, Chinnavedampatti, Vellakinaru, Saravanampatti, Kalapatti, Vilankurichi, Krichi and Kuniyamuthur water supply improvement scheme, 24 x 7 water supply improvement scheme, and Pillur- III scheme. These are aimed to improve the service quality in the city.
6.2.1.2. Sewerage
As per Census 2011, 87.80 % of households in Coimbatore had access to individual household latrines (IIHLs) and 9.7 percent were using public toilets. Approximately 2.5 % of the households were defecating in the open.
Collection: Only 37% of households which is 23.10sq.km of city’s area with IHHLs were connected to the piped sewer network. Majority of the households with IHHLs were based on on-site collection systems including septic tanks (57%) and pit latrines13 (5%). The remaining parts of the erstwhile CCMC and recently incorporated areas
33 Source: City Development Plan, City Sanitation Plan and Official Websites
Sources
• Two (2) Major Source-Siruvani and Pillur-I
• Other Sources: Aliyar, Bhavani and Pillur-II
• Total Supply- 215 MLD
Treatment
• Treament at Source• Siruvani-101.4 MLD• Pillur-I & II - 125 MLD• Bhavani- 22 MLD• Aliyar-17.6 MLD
Distribution
• 133 service reservoirs• 2,200 Kms length of
network • 94% of Coverage• Duration -12 Hours• 2,86,449 domestic, 10,087
industrial, 597 commercial & 12 institutional connections

Kochi Bengaluru Industrial Corridor –Draft Perspective Plan for overall KBIC region - Draft
180
are not covered by underground sewerage system. But the works are going on in the erstwhile Coimbatore area which is covering 105.06 sq.km. The present service area is divided into 3 zones.
Treatment: There are three treatment plants located in the city out of which only one is operational. STPs are located at Ukkadam with 70MLD capacity, Ondipudur with 60 MLD capacity and Nanjundapura with 40 MLD capacity. All of them are designed with Sequential Batch Reactor technology. But currently only STP located at Ukkadam is operational and treating 24-30 MLD water. The other two STPs are non-functional because one is under construction and the other is closed because of some legal issue. The sewage from Zone-I is collected by 5 main sewers, which run across Valankulam tank, and is discharged at the treatment plant at Ukkadam. The area that is required for treating the incoming sewage of 16 MLD is 178 acres (at a rate of 25,000 gallons per acre per day). Since the present area of the treatment plant is only 114 acres, the balance sewage is pumped to the sewage farm at Vellalore for treatment. The sewage from zone -II is collected and pre-treated at the treatment plant at Ukkadam from where it is pumped to Vellalore for final treatment and disposal. The sewerage system for zone-III has been completed having 16,791 house service connections. The sewage from this is collected at the pumping station at Nanjundapuram from where it is discharged to the sewage farm at Vellalore. The farm at Vellalore covers an area of 655 acres. Treated water is disposed at Ukkadam and Vellalore sites.
Others: There are projects going on to improve the situation in Municipal Corporation. Coimbatore Underground Sewerage System (UGSS) is going to improve the network and the connections in the city. It is designed to cover an area of 105 km2 (corresponding to the area of erstwhile Coimbatore Municipal Corporation) with laying of sewer lines along 582.88 km19 and 103,506 household connections. In addition, a Detailed Project Report (DPR) has been prepared for covering the recently added areas (152 sq km) with UGSS.
6.2.1.3. Solid waste Management
Figure 106: SWM in Coimbatore
Primary Collection: Solid Waste Management in Coimbatore City is a function of the Health Department of Coimbatore Municipal Corporation. The waste generated per day within the city is 1,050 metric tonnes per day
Primary Collection
•Door to door collection
•Total Waste Generation- 1050 MT
Transportation
•Decentralise Sysytem
•4 transfer stations at Peelaimedu, Ondipudur, Sathy Road, Ukkadam
•Private participation in transportation
Waste Processing
•Windrow composting - 685 MT
•Vermi Composting -100 MT
•Bio- gas plant- 10 MT
Disposal
•100% safe disposal of waste
•24 ac site at Bellalur
Figure 105: STP in Coimbatore
STP Model
Sewerage Treatment Plant

Kochi Bengaluru Industrial Corridor –Draft Perspective Plan for overall KBIC region - Draft
181
at the rate of 450gm per capita per day out of whuich 976 MT is collected with 93% of collection efficiency. Total waste is Collected in 1800 Pushcarts and 4500 community bins. Coverage of the service is 90%.
Secondary Collection/ Transportation: After collecting the waste, it is shifted to transfer stations located at four (4) sites namely, Peelaimedu, Ondipudur, Sathy Road, Ukkadam. From these points they are shifted to various waste processing units.
Waste processing: There are three major practices. They are Windrow composting, Vermi composting and Bio gas plant. 685 metric tonnes of waste is used for windrow composting, 100 metric tonnes of waste is used for vermi composting, 10 metric tonnes is used in bio gas plant and remaining is inert materials.
Disposal: One of the landfill sites is at Bellalur in 24 acres and currently is used for waste dumping. Tariff charges for solid waste management are varying in between Rs.10 to 100.
6.2.2. Salem34
Salem is one of the major urban agglomerations in the state of Tamil Nadu. The town was constituted as a
municipality in 1867, and was upgraded to a special-grade municipality in 1979 and to a municipal corporation
in 1994. It is sprawled in the area of 91.34 sq.km and divided into 60 wards. Salem has a population of 9,13,188
as per census 2011. City is known for its established textile industry and also for the steel plant. National highways
passing through the city are NH-44, NH-544 and also NH-79. NH-544 and NH-79 are originating from the city.
Salem junction railway station is located in Suramangalam which is located 5 kms west of the city.
34 Source: City Sanitation Plan and Official Websites
Waste Processing Unit Vermi Composting
Bio Composting Disposal Site
Figure 107: SWM Complex in Coimbatore

Kochi Bengaluru Industrial Corridor –Draft Perspective Plan for overall KBIC region - Draft
182
6.2.2.1. Water Supply
Figure 108: Water Supply system in Salem
Water Sources: Salem is mainly depending on the river Cauvery on the downstream of Mettur dam. 124 MLD water is extracted from the source for meeting present day demand of Salem.
Water Treatment: Collected water is treated at Thottil Patty treatment plant which is next to pump house. Water is treated using aerator tanks and other conventional methods by stabilizing water in sumps. Then water is shifted to distribution system in which chlorination is practiced before distribution. Within the treatment plant, there is a pump house having four (4) pumps of 675 kW -2247 m3/Hr capacities to pump the clear water into the
Sources
• Major Source- Mettur Dam on Cauvery River
•124 MLD of extraction to meet present day demand of 135 LPCD
Treatment
•Thottil Patty treatment plant
•Conventional treatment - Aeration tanks
•Clear water pump house at Thottil Patty -4 Pumps of capacity of 2247 m3/Hr
•A booster station at Konmburankadu 110 kW - 4 pumps of 2247 m3/Hr
Distribution
•56 OHT+ 11 GSLR
•821.7 Kms length of network
•98% of Coverage
•Duration -1.5 Hours
•108168 domestic and 1301 commercial and 9 industrial connections
•Billing- Fixed Tarriff System
Water Collection-Intake Points
Water Treatment
Figure 109: Water Collection & Treatment in Salem

Kochi Bengaluru Industrial Corridor –Draft Perspective Plan for overall KBIC region - Draft
183
distribution network. There is a booster station at Konmburankadu which has four 110 kW - 2247 m3/Hr pumps in the distribution network.
Water Distribution: City is divided into 56 zones and 60 wards. There are 56 over head tanks and 11 ground level service reservoirs of capacities varying from 2 lakh to 15 lakh litres. 98% of the network is working on gravity flow and about 2% is depending on the direct pumping flow. There are 1,08,168 domestic, 9 industrial and 1,301 commercial connections. Length of water distribution network is 821.7 kms. Coverage of the service is 98%. Duration of supply is one and half hours per day throughout the city. But the frequency of supply is varying in the city. 50 wards are having supply for once in 3 days where 10 wards are having supply for once in 2 days.
Others: Fixed tariff system is followed in Salem. Domestic connections are paying Rs.150/- per day. SCADA metering project is under process which enables the authority to charge based on usage. Dedicated water supply scheme to Salem Corporation is proposed in the year 2010 under which 119.55 kms of network is proposed for replacement and 16.35 km new network will be added.
6.2.2.2. Sewerage
Underground sewerage system is present in the 31 wards, 18 wards are partially covered whereas 11 wards are uncovered. Underground sewerage network on-going scheme is proposed to cover 46% of city area. Total proposed Length of Sewer Main is 421.64 km and for House Service Connections 505.33 Km is proposed. There are 4 sewerage treatment plants in Salem having total capacity of 98 MLD. Based on the water consumption, the present wastewater generation for Salem is about 89.5 MLD.
6.2.2.3. Solid Waste Management
Sewerage Treatment Plant
Figure 110: Sewerage Treatment Plant in Salem

Kochi Bengaluru Industrial Corridor –Draft Perspective Plan for overall KBIC region - Draft
184
Figure 111: SWM in Salem
Primary Collection: Door to door collection is practiced in the city covering all the 60 wards. Total 350 metric tonnes of waste is generated every day out of which 58% is bio degradable and 42% is non-bio degradable wastes. Per capita generation of waste is 383 grams. There are 1075 permanent sanitary workers and 1000 self-help group workers available for collection. Waste is collected in the segregated manner as bio-degradable and non-bio degradable. There are 493 push carts covering 1,23,250 households 225 battery operated vehicles covering 90,000 households and 18 mini autos covering 21,600 households.
Secondary Collection & Transportation: Decentralised system is followed in the city which is resulting in transport cost for solid waste management. For this purpose 12 compactors, 5 dumper placers, 8 mini tippers and 38 tractors are available. Collected waste is shifted to different processing units based on waste characteristics and unit capacities.
Waste processing: Collected waste is processed in different forms. 170 bulk waste generators comprising 24 Apartments, 68 Kalyana Mandapams, 72 Hotels and 6 Educational institutions are accounting for 10 metric tonnes. There are 2 bio-methanantion plants with 8 metric tonnes capacity, there are 20 on site composting centres accounting 17 metric tonnes, 15 micro compost centres accounting for 38 metric tonnes. These all are handling the bio-degradable waste. Non Bio Degradable dry waste is recycled through Kuppaikaran NGO which has got 30 units accounting for 17 metric tonnes per day.
Disposal: Waste is disposed at Erumapalayam in 19.33 acres land. With a recent initiative of bio capping of old waste, now around 13 acres of land is only available for disposing of waste.
Primary Collcetion
•Door to door collection
•Total Waste-350 MT, 383gms Percapita per day
•Bio-degradable-58%
•Non-biodegradable-42%
Transportation
•Decentralised system
•Segragation at source
•Vehicular Transport
Waste Processing
•2 Bio-methanantion Plant- 8 MT
•170 Bulk waste generators- 10 MT
•15 Micro Composting Centres- 38MT
•20 On-Site Composting - 17 MT
•30 Non-Bio degaradble waste recycling- 17MT
Disposal
•100% safe disposal of waste
•Site at Erumapalayam
•19.33 Acres of site
•Bio- Capping is in practise
BOV- Collection Micro Compost Centre Disposal Site
Figure 112: Solid Waste Management in Salem

Kochi Bengaluru Industrial Corridor –Draft Perspective Plan for overall KBIC region - Draft
185
6.2.3. Hosur35
Hosur was upgared to special grade municipality in the year 2012. It has a population of 280,881 (As per Census 2011) spreading over 72.41 sq.kms of area distributed into 45 wards. Proximity to Bangalore is an advantage for its industrial growth. And major national highways NH44, NH 648 and NH 844 are passing through the city connecting major cities such as Bangalore, Chennai and Northern parts of India. And the municipality is also having a railway station which is well connected to major cities of the country.
6.2.3.1. Water Supply
Figure 113: Water Supply system in Hosur
Water Sources: Hosur is majorly depending upon the ‘Hoganekkal water supply Project’ which was executed & maintained by Tamil Nadu Water Supply and Drainage (TWAD) Board. This project is designed to meet the demand of 14.64 MLD supply for the city. Under the project of combined water supply scheme (CWSS), ‘Kelavarapalli Dam’ is supplying 4MLD at present and the other source is ‘Perandapalli project’ on Pennar River. There are two (2) booster stations installed in the years 1980 and 1999 for drawing water from 7 bore wells located on the sides of South Pennar River at Kumudapalli and being supplied to 10LL OHT at Kamaraj Nagar. The pump sets of 20 HP to 60 HP are installed in these booster stations. The quantity water supplied by this source is about 2 MLD. And from local bore wells 5.6 MLD water supplied to the city. Supplied water is being treated (Only chlorination) at source and no further treatment is carried out.
Distribution System: The city is divided into 101 zones for supplying of water and there are 101 over head tanks along with 20 ground level service reservoir. Out of these 101 tanks 14 in core and 9 in other parts of city
35 Source: City Sanitation Plan and Official Websites
Sources
•Hoganekkal- CWSS-14.64 MLD
•Kelavarapalli- CWSS- 4 MLD
•Perandapalli project-2MLD
•Local Bore Wells- 5.6 MLD
Treatment
• Treament at souce it self
•Chlorination before distributing
Distribution
•101 OHT+ 20 GSLR
•240 Kms length of network
•80% of Coverage
•Duration -2 Hours
•31812 domestic and 122 commercial
•Billing- Fixed Tarriff System
Chlorination Plant OHT- Distribution Tank
Tanker- Distribution
Figure 114: Water Distribution in Hosur

Kochi Bengaluru Industrial Corridor –Draft Perspective Plan for overall KBIC region - Draft
186
are considered as major OHTs because of their higher capacities. The capacities of OHT are varying in between 0.1 LL to 29 LL. Length of pumping main is 8.40 Km and the total length of network is 240 kilometres which is covering almost 80% of the households in city. Water is supplied daily for 2 hours. As of March, 2019 there are 31,812 domestic and 122 commercial connections. Present water supply rate is 73 LPCD.
Others: The fixed tariff system is followed here collecting Rs.40/- per month from domestic connections and Rs.150/- per month from commercial connections. TWAD has proposed a new distribution system for the city which is designed in 2 phases. The new distribution network is reclassified into 39 water distribution Zones based on the contour of the town, out of which 14 zones have been taken up for execution under phase I. The proposed distribution zones will have 574.15 Km length of water supply distribution network which is inclusive of 97.70 Km of existing network and 137.38 km of replacement network and 339 Km of new proposed network. A total of 145.702 Km of network has been proposed in Phase I and the remaining shall be proposed subsequently in Phase II.
6.2.3.2. Sewerage
There is no sewerage system in the Hosur City. Total length of the open drains present in the city is 103.61 km. DPR for the sewerage system of the Hosur city is under preparation.
6.2.3.3. Solid Waste Management
Figure 115: SWM in Hosur
Primary Collection: Door to door collection is being carried out in all 45 wards for residential houses which accounts for 65.5% and commercial establishments accounting 34.5%. Total waste collected is 74 MT which is coming down as 250gms per capita collection per day. Waste is segregated at source itself in the forms of bio degradable which is 36% and non-bio-degradable waste which is 64%. Door to door collection is practised in the city using different types of vehicles. There are 117 push carts, 125 battery autos, 25 tipper autos for waste collection.
Secondary Collection & Transportation: For this purpose one (1) tractor, nine (9) tipper Lorries, one (1) compactor and one (1) JCB are available. Collected waste is shifted into 11 micro compost centres where compost is generated.
Primary Collcetion
•Door to door collection
•Total Waste-74 MT, 250gms Percapita per day
•Bio-degradable-36%
•Non-biodegradable-64%
Transportation
• Decentralised system
•Segragation at source
Waste Processing
•Bio-methanantion Plant- 8 MT
•11 Micro Composting Centres- 34 MT
•On-Site Composting - 2 MT
Disposal
•100% safe disposal of waste
•Dasepalli Village-20kms away from city
•7.69 Acres of site

Kochi Bengaluru Industrial Corridor –Draft Perspective Plan for overall KBIC region - Draft
187
Waste processing: For waste processing, micro composting, bio-methanation and on-site composting are being practiced. About 34 metric tonnes of waste is micro composted in 11 micro compost centres across the city. 8 metric tonnes of waste is processed in bio-methanation plant and 2 metric tonnes is processed with on-site composting.
Disposal: Waste is disposed in a site available in Dasepalli village which is 20 kms away from the city in 7.9 acres.
Bio-Mining Bio- Methanantion Plant
Vehicular Disposal Disposal Site
Figure 116: Waste Processing in Hosur

Kochi Bengaluru Industrial Corridor –Draft Perspective Plan for overall KBIC region - Draft
188
6.2.4. Erode36
6.2.4.1. Water Supply
Figure 117: Water Supply in Erode
Water Sources: Erode is solely depending on river Cauvery for municipal water supply. Intake structures with treatment facilities on River Cauvery are located at Vairapalayam village. Water drawn is pumped to the treatment plant located nearby. Under the second scheme a separate collection cum suction well has been constructed at a few hundred meters upstream of the old suction well. Water is drawn from the river through a leading open channel, which is connected to the new collection-cum-suction well. The raw water at the present drawl points are polluted due to discharge from the industries especially the tanneries, dyeing and bleaching industries. To avoid drawl of raw water with high pollution concentration, water is drawn from locations far away from the right bank. For this purpose, a new pipeline is laid with a length of 110 meters where it is extracting water from the centre of river and polluted water can be diverted from the sides in a different course with construction of temporary structures.
Water Treatment: Present supply of the water to the city is 54.09 MLD against the demand of 86.1 MLD. There are nine (9) water treatment plants commissioned from the year 1919 to 2008. These plants designed capacity all together is 69.28 MLD but there are not being utilized at their best. Treatment is carried out in various stages in different tanks. Process consists of stages such as aeration, clarification and filtration.
36 Source: City Sanitation Plan and Official Websites
Sources
• Major Source- Cauvery River
•2 Extraction points•River pollution is an issue - Industrial waste in river
Treatment
•9 treatment plants
•Total design capacity-69.28 MLD
•Current supply is 54.09 MLD
•Conventional treatment - Aeration tanks, clarification and filtration
Distribution
•76 OHT+ 25 GSLR
•672.08 Kms length of network
•57.55% of Coverage
•Duration -3 Hours
•Frequency- Varing in the city (Daily, Alternative Days, Every 3rd day.
•Billing- Fixed Tarriff System
Figure 118: Water Collection Erode
River Cauvery Intake Point-I Intake Point-II

Kochi Bengaluru Industrial Corridor –Draft Perspective Plan for overall KBIC region - Draft
189
Water Distribution: City is divided into 60 wards and further into 148 distribution zones. There are 759 water pumps and 923 bore wells/hand pumps in the city accounting for 5.8 MLD. For water distribution purpose, there are 76 over head tanks and 25 ground level service reservoirs with an overall capacity of 236.15 lakhs litres. The distribution network is having a length of 672.08 kilometres which is covering 57.55% of households in the city area. Water is not being distributed equally in the city. Certain zones are having a supply on daily basis where as other zones are being supplied on every alternative day or every third day with a duration of 3 hours. There are 65,530 service connections out of which 62,778 are domestic.
Others: Flat tariff structure is in practise in which fixed charges are collected from the consumers. And a detailed water supply scheme is prepared for the municipal corporation which has a project cost of Rs.484.45 crores. Under the project it is expected to improve the service facilities in the city by enhancing the capacities of treatment and network. 68 new zones are identified for supply of water.
6.2.4.2. Sewerage
Collection: Generally it is measured as 80% of supplied water to the water supply distribution system which gives the figure as 43.27 MLD. But the collection in the city is 4.80 MLD which is showing the lack of collection facilities in the city. As the city is not having the underground sewerage system, open drains are only used for sewer collection. Length of the conveyance network is 474.04 kms.
Treatment: Collected sewerage is treated at treatment plant located at Vendipalayam which has a capacity of 50.55 MLD. Treated water is currently used for irrigation purpose which is sent through the pipelines.
Figure 119: Water Treatment in Erode
Treatment Plant- 20 MLD
Treatment Plant- 115 MLD

Kochi Bengaluru Industrial Corridor –Draft Perspective Plan for overall KBIC region - Draft
190
Others: Current project is going on under the AMRUT project in which network is improved along with the improvement in collection efficiency of the system. Project cost is 209.22 crores.
6.2.4.3. Solid Waste Management
Figure 121: SWM in Erode
Primary Collection: City is having a good solid waste management system. Door to door collection is in practice. Per capita waste generation in the city is 352 grams and total waste collected in the city is 250 metric tonnes. Waste is segregate at the source itself as bio degradable and non-bio degradable. It is collected by municipal workers using 360 push carts, 106 tricycles and 90 battery operated vehicles.
Secondary Collection & Transportation: As the decentralised management system is in practise, transportation is not an issue here at Erode. There are 4 compactors, 20dumper placers, 4 JCBs, 6 tipper Lorries and 15 tractors are available.
Waste Processing: for the purpose of safe disposal there are multiple processing practices can be observed in the city. The waste processing practices are Windrow composting accounting for 120 metric tonnes, bio-methanation accounting for 12.5 metric tonnes, onsite composting accounting for 47.5 metric tonnes, micro composting accounting for 48 metric tonnes and also recycling accounting for 22 metric tonnes.
Primary Collcetion
•Door to door collection
•Total Waste-250 MT, 352 gms Percapita per day
•Bio-degradable-51.2%
•Non-biodegradable-48.8%
Transportation
•Decentralised system
•Segragation at source
•Vehicular Transport
Waste Processing
•Windrow Composting- 120 MT
•Bio-methanantion Plant- 12.5 MT
•Micro Composting Centres- 48MT
•On-Site Composting -47.5MT
•Recycling- 22 MT
Disposal
•100% safe disposal of waste
•Vendipalayam compost yard-19.46 Acres
•Vairapalayam-7.91 Acres
Sewerage Treatment Plant
Figure 120: Sewerage Treatment Plant in Erode

Kochi Bengaluru Industrial Corridor –Draft Perspective Plan for overall KBIC region - Draft
191
Disposal: There are 2 compost yards in the city namely Vendipalayam compost yard and Vairapalayam. These compost yards are 5km from the ULB. Both are having area of 19.46 and 7.91 acres respectively. Corporation proposes to procure 50 acre land to develop treatment plant and landfill site.
Figure 122: Solid Waste Processing in Erode
Micro Compost Centre-I Micro Compost Centre- II Disposal Site

Kochi Bengaluru Industrial Corridor –Draft Perspective Plan for overall KBIC region - Draft
192
6.3. Water Demand for KBIC districts
Water demand projections are linked with the population projections for KBIC districts (within both the states). Water demand is projected for the KBIC districts considering the 135 lpcd as per the CPHEEO guidelines. Water demands are projected for Urban and Rural population of the KBIC districts of Kerala and Tamil Nadu and are shown in Figures below.
Figure 123: Urban water demand for KBIC Kerala districts
Figure 124: Rural water demand for KBIC Kerala districts
It is noted that rural water demand is decreasing across the districts as rural population is decreasing in the districts. However, overall there is an increase in the water demand.
Figure 125: Urban water demand for KBIC Tamil Nadu districts

Kochi Bengaluru Industrial Corridor –Draft Perspective Plan for overall KBIC region - Draft
193
Figure 126: Rural water demand for KBIC Tamil Nadu districts
It is observed that the rural water demand for Erode, Tiruppur & Coimbatore is decreasing whereas for all other districts both urban and rural water demand is increasing steadily. Total water demand for KBIC district in 2035 will be 6617 MLD out of which 91% (6066 MLD) will be for urban areas where the balance 9% (551 MLD) will be for rural areas. Water demand (Urban & Rural) for KBIC districts are shown in table below
Table 103: Projected water demand for KBIC districts (in MLD)
2018 2020 2025 2030 2035
Districts
To
tal
De
ma
nd
Ur
ba
n
Ru
ra
l
To
tal
De
ma
nd
Ur
ba
n
Ru
ra
l
To
tal
De
ma
nd
Ur
ba
n
Ru
ra
l
To
tal
De
ma
nd
Ur
ba
n
Ru
ra
l
To
tal
De
ma
nd
Ur
ba
n
Ru
ra
l
KBIC Region 6,094
4,061
2,033
6,175
4,293
1,883
6,356
4,932
1,424
6,505
5,575
930 6,617
6,066
551
KBIC -Kerala 3,346
2,582
764 3,363
2,723
640 3,392
2,901
491 3,403
3,012
391 3,394
3,098
296
Kannur 346 273 73 347 278 69 347 293 54 346 303 43 342 301 41
Kozhikode 431 425 6 434 434 0 440 440 0 443 443 0 444 444 0
Mallapuram 597 545 52 608 606 2 634 634 0 657 657 0 676 676 0 Thrissur 429 429 0 430 430 0 431 431 0 430 430 0 426 426 0
Ernakulam 455 403 52 457 421 36 460 460 0 461 461 0 459 459 0
Alappuzha 285 239 46 284 260 23 279 279 0 273 273 0 266 266 0 Palakkad 393 143 250 396 157 239 401 196 205 405 242 163 406 287 119
Iddukki 146 7 139 144 6 138 140 5 135 135 5 130 129 4 126
Kottayam 265 119 146 263 130 133 259 162 97 254 199 54 247 236 11
KBIC – TN 2,754
1,519
1,235
2,821
1,559
1,262
2,985
1,716
1,269
3,141
1,865
1,276
3,282
1,958
1,324
Nilgiris 95 57 38 94 54 40 94 48 46 96 42 54 98 35 63 Krishnagiri, Dharmapuri
507 124 383 520 130 391 554 145 409 585 159 426 613 167 446
Salem 511 284 227 522 286 236 548 293 255 571 295 277 591 285 306 Namakkal 254 111 142 259 112 147 272 115 157 284 116 168 294 112 182
Karur 155 74 81 158 76 82 164 81 83 170 86 84 174 87 88
Erode, Tirupur & Coimbatore
1,232
868 364 1,267
900 367 1,353
1,034
319 1,435
1,169
266 1,511 1,272
239
Source: Consultants assessment
6.4. Wastewater Generation in KBIC districts
Based on the water demand projections, wastewater generation is projected for KBIC districts (within both the states). Wastewater generation is estimated for the KBIC districts as 80% of the water demand as per the

Kochi Bengaluru Industrial Corridor –Draft Perspective Plan for overall KBIC region - Draft
194
CPHEEO guidelines. Wastewater generation are projected for Urban and Rural population of the KBIC districts of Kerala and Tamil Nadu and are shown in Figures below.
Figure 127: Urban sewage generation for KBIC Kerala districts
Figure 128: Rural sewage generation for KBIC Kerala districts
It is noted that rural sewage generation is decreasing across the districts as rural population is showing a decreasing trend in the districts. However, overall there is an increase in the sewage generation.
Figure 129: Urban sewage generation for KBIC Tamil Nadu districts

Kochi Bengaluru Industrial Corridor –Draft Perspective Plan for overall KBIC region - Draft
195
Figure 130: Rural sewage generation for KBIC Tamil Nadu districts
It is observed that the rural sewage generation for Erode, Tirupur & Coimbatore is decreasing whereas for all other districts both urban and rural generation is increasing steadily. Total sewage generated for KBIC district in 2035 will be 5293 MLD out of which 91% (4853 MLD) will be for urban areas where the balance 9% (441 MLD) will be for rural areas. Water demand (Urban & Rural) for KBIC districts are shown in table below
Table 104: Projected sewage generation for KBIC districts (in MLD)
2018 2020 2025 2030 2035
Districts
To
tal
Se
wa
ge
Ur
ba
n S
ew
ag
e
Ru
ra
l S
ew
ag
e
To
tal
Se
wa
ge
Ur
ba
n S
ew
ag
e
Ru
ra
l S
ew
ag
e
To
tal
Se
wa
ge
Ur
ba
n S
ew
ag
e
Ru
ra
l S
ew
ag
e
To
tal
Se
wa
ge
Ur
ba
n S
ew
ag
e
Ru
ra
l S
ew
ag
e
To
tal
Se
wa
ge
Ur
ba
n S
ew
ag
e
Ru
ra
l S
ew
ag
e
KBIC Region 4,875
3,249
1,626
4,940
3,434
1,506
5,085
3,946
1,139
5,204
4,460
744 5,293
4,853
441
KBIC – Kerala
2,677
2,066
611 2,690
2,178
512 2,714
2,321
393 2,722
2,410
312 2,716
2,479
237
Kannur 277 218 59 278 223 55 278 234 44 277 242 34 274 241 32 Kozhikode 345 340 5 347 347 0 352 352 0 355 355 0 355 355 0
Mallapuram 478 436 42 486 485 1 507 507 0 525 525 0 541 541 0
Thrissur 343 343 0 344 344 0 345 345 0 344 344 0 341 341 0 Ernakulam 364 322 41 365 337 29 368 368 0 369 369 0 367 367 0
Alappuzha 228 191 37 227 208 19 223 223 0 218 218 0 212 212 0
Palakkad 314 114 200 317 125 191 321 157 164 324 193 130 325 229 95 Iddukki 117 5 111 115 5 110 112 4 108 108 4 104 103 3 101
Kottayam 212 95 117 211 104 107 207 130 78 203 159 43 197 189 9
KBIC – TN 2,203
1,215
988 2,257
1,247
1,010
2,388
1,373
1,015
2,513
1,492
1,021
2,626
1,566
1,059
Nilgiris 76 46 31 75 43 32 75 38 37 77 33 43 78 28 51
Krishnagiri, Dharmapuri
405 99 306 416 104 313 443 116 327 468 127 341 491 134 357
Salem 409 227 182 418 229 189 439 234 204 457 236 221 473 228 245
Namakkal 203 89 114 207 90 118 218 92 126 227 93 135 235 90 146 Karur 124 59 65 126 61 65 131 65 66 136 69 67 140 70 70
Erode, Tirupur & Coimbatore
986 694 291 1,014
720 294 1,083
827 255 1,148
935 213 1,209
1,017
191
Source: Consultants assessment

Kochi Bengaluru Industrial Corridor –Draft Perspective Plan for overall KBIC region - Draft
196
6.5. Solid Waste Generation in KBIC districts
Solid waste generation is estimated for KBIC district 500 grams per capita generation rate. Higher generation rate is considered due to the fact that most of the district caters to tourist population. Sold waste management in Kerala is good when compared with other states especially for biodegradable and plastic wastes. Many of the urban centres are spearheading the good practices in these aspects when compared across other urban centres in India. Solid waste generation for KBIC districts are projected for Urban and Rural population and are shown in Figures below.
Figure 131: Urban solid waste generation for KBIC Kerala districts
Figure 132: Rural solid waste generation for KBIC Kerala districts
It is noted that rural sewage generation is decreasing across the districts as rural population is showing a decreasing trend in the districts. However, overall there is an increase in the sewage generation.
Figure 133: Urban solid waste generation for KBIC Tamil Nadu districts

Kochi Bengaluru Industrial Corridor –Draft Perspective Plan for overall KBIC region - Draft
197
Figure 134: Rural solid waste generation for KBIC Tamil Nadu districts
It is observed that the rural solid waste generation for Erode, Tirupur & Coimbatore is decreasing whereas for all other districts both urban and rural generation is increasing steadily. Total solid waste generated for KBIC district in 2035 will be 24,506 TPD out of which 91% (22,466 MLD) will be for urban areas where the balance 9% (2,039 MLD) will be for rural areas. Water demand (Urban & Rural) for KBIC districts are shown in table below
Table 105: Projected solid waste generation for KBIC districts (in TPD)
2018 2020 2025 2030 2035
To
tal
SW
Ur
ba
n S
W
Ru
ra
l S
W
To
tal
SW
Ur
ba
n S
W
Ru
ra
l S
W
To
tal
SW
Ur
ba
n S
W
Ru
ra
l S
W
To
tal
SW
Ur
ba
n S
W
Ru
ra
l S
W
To
tal
SW
Ur
ba
n S
W
Ru
ra
l S
W
KBIC Region 22,570
15,042
7,528 22,872
15,899
6,973 23,542
18,268
5,273 24,093
20,650
3,444 24,506
22,466
2,039
KBIC – Kerala
12,393
9,565 2,828 12,456
10,085
2,370 12,563
10,743
1,819 12,603
11,157
1,447 12,572
11,476
1,096
Kannur 1,282 1,011 272 1,285 1,031 254 1,286 1,085 202 1,280 1,122 158 1,266 1,116 150 Kozhikode 1,596 1,574 22 1,608 1,608 0 1,629 1,629 0 1,642 1,642 0 1,645 1,645 0
Mallapuram 2,211 2,018 193 2,252 2,246 6 2,347 2,347 0 2,432 2,432 0 2,505 2,505 0
Thrissur 1,590 1,590 0 1,594 1,594 0 1,598 1,598 0 1,593 1,593 0 1,578 1,578 0 Ernakulam 1,683 1,492 191 1,691 1,559 133 1,704 1,704 0 1,707 1,707 0 1,699 1,699 0
Alappuzha 1,056 885 171 1,051 964 87 1,034 1,034 0 1,011 1,011 0 983 983 0
Palakkad 1,455 530 925 1,466 580 886 1,486 726 760 1,499 895 604 1,503 1,062 440 Iddukki 540 24 515 534 23 511 518 20 498 500 17 483 479 14 465
Kottayam 980 441 540 975 481 494 960 601 359 939 738 201 914 873 40
KBIC – TN 10,199
5,625 4,574 10,448
5,773 4,674 11,056
6,356 4,700 11,634
6,909
4,725 12,156
7,251 4,905
Nilgiris 353 211 141 348 201 146 347 178 169 355 154 200 363 129 234
Krishnagiri, Dharmapuri
1,877 460 1,417 1,928 480 1,447 2,050
536 1,515 2,166 588 1,578 2,272 620 1,651
Salem 1,894 1,052 842 1,935 1,061 874 2,030
1,085 945 2,116 1,092 1,025 2,190 1,056 1,134
Namakkal 940 413 527 961 416 544 1,009 426 583 1,052 429 624 1,090 415 675
Karur 573 274 299 584 282 302 608 302 306 629 318 311 646 322 324 Erode, Tirupur & Coimbatore
4,563 3,215 1,348 4,694 3,333 1,361 5,012 3,830
1,182 5,315 4,329 986 5,596 4,710 886
Source: Consultants assessment

Kochi Bengaluru Industrial Corridor –Draft Perspective Plan for overall KBIC region - Draft
198
7. Environmental assessment
7.1. Climate
7.1.1. Kerala
With around 120–140 rainy days per year, Kerala has a wet and maritime tropical climate influenced by the seasonal heavy rains of the southwest monsoon and northeast monsoon. Around 65% of the rainfall occurs from June to August corresponding to the Southwest monsoon, and the rest from September to December corresponding to Northeast monsoon. In Kerala, the influence of the Northeast monsoon is seen in southern districts only. Kerala's rainfall averages 2,923 mm (115 in) annually. Some of Kerala's drier lowland regions average only 1,250 mm (49 in); the mountains of the eastern Idukki district receive more than 5,000 mm (197 in) of orographic precipitation: the highest in the state. In eastern Kerala, a drier tropical wet and dry climate prevails. During the summer, the state is prone to gale-force winds, storm surges, cyclone-related torrential downpours, occasional droughts, and rises in sea level. The mean daily temperature ranges from 19.8°C to 36.7°C. Mean annual temperatures range from 25 to 27.5°C in the coastal lowlands to 20 to 22.5°C in eastern highlands.
7.1.2. Tamil Nadu
Tamil Nadu is heavily dependent on monsoon rains, and thereby is prone to droughts when monsoons fail. Climate of the state ranges from dry sub-humid to semi-arid. The state has distinct periods of rainfall, which are the advancing monsoon period, South-west monsoon (from June to September) with strong southwest winds, North-east monsoon (from October to December), with dominant northeast winds, and the Dry season (from January to May). The normal annual rainfall of the state is about 945 mm (37.2 in), of which 48% is through the North East monsoon, and 32% through the South West monsoon. Since the state is entirely dependent on rains for recharging its water resources, monsoon failures lead to acute water scarcity and severe drought.
7.2. Land Environment
7.2.1. Land Use-Land Cover
The land use/land cover (LULC) of the KBIC was prepared using NRSC-Bhuvan imagery. The land use/land cover map and Land use classification for the KBIC is shown below.

Kochi Bengaluru Industrial Corridor –Draft Perspective Plan for overall KBIC region - Draft
199
Figure 135: Land Use Land Cover (LULC) map (1:250000 scale) for KBIC
Source: NRSC-Bhuvan
7.2.2. Natural Resources
7.2.2.1. Kerala
Agriculture: Agricultural crops in the state are broadly classified as food crops and non-food crops. Food crops are cereals & millets, sugar crops, spices & condiments, fresh fruits, vegetables, etc. The major non-food crops are rubber, betel leaves, lemon grass, etc.
Another classification of crops is seasonal crops, annual crops and perennial crops which are based on their life time. Paddy, pulses and grains include the category of Food grains.
Fisheries Resources: In Kerala, fishing Industry occupies an important position in its economy. Kerala’s share in the national marine fish production is about 20-25%. There are 6 Marine fishing harbours, 14 fish landing centres and 222 fishing villages in the state. About 0.54% of the total population of the state is fishermen. The potential fishing zones for kerala given by INCOIS is shown below

Kochi Bengaluru Industrial Corridor –Draft Perspective Plan for overall KBIC region - Draft
200
Figure 136: Fish landing centres in Kerala
Source: INCOIS- ESSO - Indian National Centre for Ocean Information Services
Forests: The forest area includes 11,309.4 sq.km which is 29.10 % of the total geographical area of Kerala state, of which Tropical wet Evergreen and Semi Evergreen forest type constitute 34.28% followed by Tropical Moist Deciduous with 31.97 %, Tropical Dry Deciduous with 3.46% , Montane Sub- tropical Temperate sholas with 3.42%, Plantations with 3.70%, Grass Lands with 4.43% and Others (8.37). The total plantation area under the department activities is about 13.7 % of the total forest area.
District wise forest area include Thiruvananthapuram 463.8 sq.km, Kollam 840.5 sq.km, Pathanamthitta 1,533.7 sq.km, Kottayam 100.8 sq.km, Ernakulam 823.8 sq.km, Idukki 2713.7 sq.km, Thrissur 1,022.7 sq.km, Palakkad 1,527.3 sq.km, Malappuram 723.9 sq.km, Kozhikode 290.4 sq.km, Wayanad 907.0 sq.km, Kannur 241.5 sq.km, Kasaragode 119.7 sq.km.
Kerala has 3,213.2 sq.km of forests under protected areas which includes 5 National Parks, 17 Wildlife Sanctuaries (includes 2 Tiger Reserves, 2 Bird Sanctuaries, 1 Peafowl Sanctuary) and one Community Reserve which forms 28% of the total forest area.

Kochi Bengaluru Industrial Corridor –Draft Perspective Plan for overall KBIC region - Draft
201
7.2.2.2. Tamil Nadu
Agriculture: Tamil Nadu has historically been an agricultural state and is a leading producer of agricultural products in India. Cauvery delta region is known as Rice Bowl of Tamil Nadu. In terms of production, Tamil Nadu accounts for 10% in fruits and 6% in vegetables, in India.
The state is the largest producer of bananas, turmeric, flowers, tapioca, the second largest producer of mango, natural rubber, coconut, groundnut and the third largest producer of coffee, sapota, tea and sugarcane. Tamil Nadu's sugarcane yield per hectare is highest in India. State has 17,000 hectares of land under oil palm cultivation, second highest in India.
Fisheries Resources: Tamil Nadu is one of the leading States in India in Fisheries Development. The different types of aquatic resources in Tamil Nadu like marine, freshwater, brackish water, riverine stretches, cold water streams in upland area are bestowed with rich biodiversity of aquatic fauna and flora. There are ~2,500 species of fishes found in different aquatic environment. The fisheries in the state are one of the vital sources for food security. However, no Coastal districts of Tamil Nadu are part of KBIC.
Forests: Tamil Nadu has a wide range of biomes extending East from the South Western Ghats montane rain forests in the Western Ghats through the South Deccan Plateau dry deciduous forests and Deccan thorn scrub forests to tropical dry broadleaf forests. The state has a range of flora and fauna with many species and habitats.
Tamil Nadu is the only state in India which has both the Western Ghats and the Eastern Ghats mountain ranges which both meet at the Nilgiri hills. The Western Ghats dominate the entire western border with Kerala. The Nilgiri Biosphere Reserve located in the Western Ghats and Nilgiri Hills comprises part of adjoining states of Kerala and Karnataka. The Agasthyamala Biosphere Reserve is in the south west of the state bordering Kerala in the Western Ghats. Tamil Nadu is home to five declared National parks located in Anamalai, Mudumalai, Mukurithi, Gulf of Mannar, Guindy located in the centre of Chennai city and Vandalur located in South Chennai. Sathyamangalam Tiger Reserve, Mukurthi National Park and Kalakkad Mundanthurai Tiger Reserve are the tiger reserves in the state.
Tamil Nadu Forests details at a glance:
• Forest Cover of the State is ~26,345 sq.km (2015 assessment) which is 20.26% of the Geographical Area (GA)
of the State.
• Area under forest cover within recorded forest area is 17, 365 sq.km; forest cover outside recorded forest area
is 8,980 sq.km.
• Area under Very Dense Forest (VDF), Moderately Dense Forest (MDF) and Open Forest (OF) is 2,993 sq.km
(28.23%of GA), 10,469 sq.km (8.04% of GA) and 12,883 sq.km (9.90% of GA) respectively.
• Recorded Forest Area of the State as per 2015 assessment is 22,877 sq.km which is 17.59 percent of the GA
of the State.
• Tree cover of the State is 4,505 sq.km.
• District-wise forest cover shows districts like Dharmapuri (3,280 sq.km), Coimbatore (2,627 sq.km), Erode
(2,421 sq.km), Vellore (1,857 sq.km), The Nilgiris (1,853 sq.km) and Dindigul (1,662 sq.km) covers higher
forest cover. Forest map of KBIC is shown below.

Kochi Bengaluru Industrial Corridor –Draft Perspective Plan for overall KBIC region - Draft
202
Figure 137: Forest map for KBIC
Source: Bhuvan-NRSC
7.2.3. Topography
7.2.3.1. Kerala
The topography of Kerala is divisible into three geographical regions – Highlands, Midlands and Lowlands. The highlands slope down westward from the Western Ghats with numerous valleys and gorges clothed with dense evergreen forest tracts. The midlands, lying between the mountains and lowlands, are made up of undulating hills and valleys. The lowlands or the coastal belt is composed of the river deltas, backwaters and the shore of the Arabian Sea.
7.2.3.2. Tamil Nadu
The Western, Southern and the North-Western parts of the state are hilly and rich in vegetation. The Eastern parts are fertile coastal plains. The Northern parts are a mix of hills and plains. The Central and the South-Central regions are arid plains.
7.2.4. Geology and Mineral Resources
7.2.4.1. Kerala
Geology:
The geology of Kerala is a part of the South Indian Precambrian terrain, which is composed of granulites, gneisses, granites and greenstones. The granulites and associated gneisses belong to the Precambrian in Kerala state. The younger Meso-Cenozoic dykes and pegmatites are found to intrude late Precambrian rocks. The tertiary sedimentary formations of the land belong to Neogene period only (Soman, 2002).
The Charnockites and charnockitic gneisses are the oldest rock complex units of Kerala state. Charnockitic gneisses, gneisses and the pyroxene-bearing granulites occupy the major parts of the Western Ghats and the midland regions located within Kerala state. The granulitic gneisses are very well spatially connected with lineaments and faults in Kerala state (Soman, 2002). Khondalites are yet another major rock formation of south Kerala and are associated with garnet-biotite gneiss and garnetiferous quartzofeldspathic gneiss.
Kochi Bengaluru Industrial Corridor –Draft Perspective Plan for overall KBIC region - Draft
203
The presence of intrusives especially, the dykes, have hydrogeological role to find good zones of water bearing fractures. Intrusive formation dykes of Lower-Middle Proterozoic age, pegmatites of Middle Proterozoic age, host of younger granites (Late Precambrian-early Palaeozoic age) and later dolerite dykes, contemporaneous with Cretaceous-Paleocene Deccan Basalt magmatism, are the common elements seen in granulitic terrain of this state.
The Western parts of the State consists of sedimentary formations of Neogene period and quaternary period having four distinct beds viz. Alleppey, Vaikom, Quilon and Warkali. In midland regions, the Tertiary and crystalline formations are found as lateritized units which act as good aquifer. Along the coastal regions, alluvial deposits of recent origin are found.
Minerals: Major minerals in the State are beach sands comprising Illuminate, Monazite, Zircon, China clay, Tile clay, Lime shell, Lime stone, Bauxite, Silica sand, Graphite, Silica sand, Quartz etc.
7.2.4.2. Tamil Nadu
Geology
Tamil Nadu represents an important high grade metamorphic terrain of global importance. Geologically it is divided into three zones viz. the Northern region and southern region divided by a central region.
Central Region
• The central region is marked by two prominent tectonic zones viz., East-West trending Moyar-Bhavani-Attur
(MBA) on the North and Palghat-Noyyil-Cauvery (PNC) in the South.
• Largely made up of reworked gneisses carrying enclaves of older schists, amphibolites, fuchsite quartzite,
Banded magnetite quartzite, calc-granulites with limestone, and layered anorthosite complex (Bhavani
layered complex and Sittampundi complex).
• Dolerites are comparatively less in this zone and are exposed with many younger granites of Proterozoic age.
Northern Region
• Northern region is occupied by the amphibolite facies terrain, which is the Southern extension of Dharwar
craton.
• The major metabasic occurrence in the North zone is the amphibolite in Vepanapalli-Maharajagadai area,
which is the southern extension of the Kolar (Gold-bearing) schist belt, forms the Kolar group of rocks.
• There are many Banded Magnetite Quartzites (BMQ) which run to few hundred metres in length noticed
throughout the Northern Tamil Nadu of which the major ones are the Kavuthimalai, Vediyappanmalai,
Kanjamalai and Thirthamalai.
• The intrusions of swarms of dolerite dykes are concentrated in Sholingar – Gudiyattam – Krishnagiri belt.
Southern Region
• Occurs to the south of the Palghat-Cauvery tectonic zone.
• On the west of this zone charnokites form the massifs of the Western Ghats and the Eastern part is
predominantly of gneisses.
• This zone is totally devoid of dolerite dykes and banded magnetite quartzites.
• Extensive limestone deposits are found from Palayam to Kiranur, Rajapalayam-Alangulam belt east of
Varshanad hills and Talaiyuthu near Tirunelveli.
• At the southern extremity of peninsular India and to south of the Achankoil shear zone consist of garnet-
biotite-graphite gneisses and garnetiferous charnockite and khondalites (garnet-sillimanite-biotite-
graphite), cordierite gneiss.
Minerals: Tamil Nadu is leading holder of country's resources of vermiculite, magnetite, dunite, rutile, garnet, molybdenum and ilmenite. The State accounts for country's 81% lignite, 75% vermiculite, 69% dunite, 59% garnet, 52% molybdenum and 30% titanium minerals resources.
7.2.5. Soil profile
Soil map for KBIC is shown below.

Kochi Bengaluru Industrial Corridor –Draft Perspective Plan for overall KBIC region - Draft
204
Figure 138: Soil map for KBIC
Source: Bhuvan-NRSC
7.2.5.1. Kerala
In general, the soils of Kerala are acidic, kaolintic and gravelly with low CEC (Cation Exchange Capacity), low water holding capacity and high phosphate fixing capacity. Climate topography, vegetation and hydrological conditions are the dominant factors of soil formation. On the basis of the morphological features and physico-chemical properties, the soils of the State have been classified into red loam, laterite coastal alluvium, riverine alluvium, Onattukara alluvium, brown hydromorphic, saline hydromorphic, Kuttanad alluvium, black soil and forest loam.
7.2.5.2. Tamil Nadu
Soils are classified in to six orders, 12 sub-orders, 20 great groups, 44 sub-groups and 94 soil families in the hierarchy. The six orders are Entisols, Inceptisols, Alfisols, Mollisols, Ultisols, Vertisols. Inceptisols cover about 50% of the State’s total geographical area followed by Alfisols (30%), Vertisols (7%), Entisols (6%), Ultisols (1%) and negligible area by Mollisols. About 5% of the areas are miscellaneous land types, which include rocklands, marshes, urban areas and water bodies. Classification of Tamil Nadu soils are shown below.
Table 106: Classification of Tamil Nadu Soils
S. No. Type of Soil Place of Occurrence
1 Red loam Parts of Kancheepuram, Cuddalore, Salem, Dharmapuri, Coimbatore, Tiruchirappalli, Thanjavur, Ramanathapuram, Madurai, Tirunelveli, Sivagangai, Thoothukudi, Virudhunagar, Dindigul and Nilgiris districts
2 Laterite soil Parts of Nilgiris district
3 Black soil Parts of Kancheepuram, Cuddalore, Vellore, Tiruvannamalai, Salem, Dharmapuri, Madurai, Ramanathapuram, Tirunelveli, Sivagangai, Thoothukudi, Virudhunagar, Dindigul and Nilgiris districts

Kochi Bengaluru Industrial Corridor –Draft Perspective Plan for overall KBIC region - Draft
205
S. No. Type of Soil Place of Occurrence
4 Sandy coastal alluvial soils
Along the coasts in Ramanathapuram, Thanjavur, Nagapattinam, Cuddalore, Tiruvarur, Kancheepuram and Kanniyakumari districts
5 Red sandy soils Small patches in Coimbatore and Nilgiris districts
6 Riverine alluvial soils
Parts of Kancheepuram, Tiruvallur, Villupuram, Cuddalore, Thanjavur, Nagapattinam, Tiruvarur, Ramanathapuram and Thoothukudi district
Source: Directorate of Agriculture and Department of Economics and Statistics, Chennai
7.3. Water Environment
7.3.1. Ground water
Ground water levels, development status and their quality for KBIC districts are collected from respective district’s groundwater brochure by Central Ground Water board (CGWB) and the summary of the same is given below.
Table 107: Ground water Quality for KBIC districts
S. No District Name
GW Status
Water levels
Water Quality Category GW Related Issues
I Kerala State
1. Alappuzha
• Pre Monsoon GW Level in m (April 2011)-0.72 to 12.49 bgl
• Post Monsoon GW Level in m (November 2011)-0.08 to 6.30 bgl
Dug wells in most of the area show electrical conductivity (EC) in the range of 200 to 800 μs/cm at 25ºC indicating freshwater suitable for all purposes. High EC values are noted in dug wells located adjacent to tidal inlets and brackish water bodies.
As per the assessment of dynamic ground water resources of the district as in March 2009, all the blocks in the district have been categorized as ‘Safe’.
Due to the poor sanitary conditions and the shallow ground water levels, ground water in a major part of the district suffers from bacteriological contamination, making it unsuitable for drinking.
2. Ernakulam
• Pre Monsoon Avg. GW Level in m (2002-2011)-0.75 to 12.05 bgl
• Post Monsoon Avg. GW Level in m (2002-2011)-0.54 to 10.42 bgl
• The ground water quality of the shallow aquifers of the district is generally very good. The average Electrical Conductance is ranging from 150 to 250 μs/cm.
• presence of inland salinity in some areas namely Deshom and Sree Moolanagaram where the EC is found to be very high of the order of more than 17,000 micro siemens/cm at 25°C.
• In the coastal sedimentary
Based on stage of development and long term water level trend for the 15 blocks (old) of Ernakulam district as on march 2009, 12 blocks are categorised as safe and 3 as semi critical. There are no over-exploited blocks in the district.
• Saline water ingress is observed in the shallow alluvial aquifer in the western part of the district which is in hydraulic connection with the back water.
• Water logging along the western border of the district bordering the back water lagoons during the rainy season.
• Brackish quality of groundwater

Kochi Bengaluru Industrial Corridor –Draft Perspective Plan for overall KBIC region - Draft
206
S. No District Name
GW Status
Water levels
Water Quality Category GW Related Issues
aquifers, the quality of the water of Vaikom aquifers is saline in most part of the district except for small pockets like Narakal and Kumbalangi where it is fresh. The EC is found to range between 4000 micro siemens/cm to 17,300 micro siemens/cm at 25°C.
• The Warkalai aquifer is completely saline in the district.
along tidal inlets
• Anthropogenic pollution.
3. Idukki
• Depth to water level (Avg: 2002-11)- 0.5 to 8.41 m bgl
• Pre Monsoon GW Level in m (April 2011)- 1.20 to 9.08 bgl
• Post Monsoon GW Level in m (November 2011)-0.59 to 7.48 bgl
• Majority of dug wells have EC less than 400μs/cm at 25°C.
• Fluoride concentration is within the permissible limit, the highest value being 0.65 ppm.
• Nitrate is within permissible limits except in Kattappana (> 100 ppm).
• Bore wells are potable in general. EC less than 750μs/cm at 25°C. Fluoride is also within the permissible limit, in the range of 0.1 to 0.98 ppm.
As per the Dynamic Ground Water Resources of Idukki District, Kerala (As in March 2009), Nedumkandam and Kattapana blocks have been categorized as ‘Semi Critical’ and the remaining six blocks as ‘Safe’.
• N03 more than 100 ppm at Kattappana
• The north-eastern part of the district is a rain shadow area, where water scarcity conditions occur frequently
• There is a long-term decline in water level in the eastern part of the district especially in the blocks of Kattappana and Nedumkandam
4. Kannur
• Pre Monsoon GW Level in m (April 2011)- 1.75 to 20.48 bgl
• Post Monsoon GW Level in m (November 2011)-0.37 to 19.26 bgl
• The EC of water from shallow aquifer ranges from 29 to 553 μs/cm at 25°C. About 86% of shallow aquifer samples show EC less than 250 μs/cm at 25°C. Deeper aquifer samples are characterized by high EC values ranging from 204 -802 μs/cm.
• The hardness of shallow aquifer varies from 6 to
As per the Dynamic Ground Water Resources of Idukki District, Kerala (As in March 2009), Thalasserry and Kuthuparamba blocks became ‘Semi Critical’ and the remaining six blocks under ‘Safe’ category.
• Decline in water level, water scarcity and pollution due to saline water intrusion are some of the major problems noticed in the district.
• In coastal areas of the district like Azhikode, Azhikkal, Edakkad, Dharmadam, Muzhapilanga, Kamapuram,

Kochi Bengaluru Industrial Corridor –Draft Perspective Plan for overall KBIC region - Draft
207
S. No District Name
GW Status
Water levels
Water Quality Category GW Related Issues
120 ppm showing the soft nature of water.
• Fluoride is within the permissible limit. The maximum value recorded was 0.44 ppm.
Mahe and Cherukunnu, brackish to saline water has been identified in aquifers due to intrusion of saline water from nearby backwater shallow channels.
5. Kottayam
• Pre Monsoon GW Level in m (2002-2011)- 1.22 to 13.57 bgl
• Post Monsoon GW Level in m (2002- 2011)-0.91 to 11.22 bgl
• In general EC ranges from 29 to 608 μs/cm at 25°C except in Vaikom which has EC less than the 500 μs/cm at 25°C.
• Total hardness ranges from 8 to 182 mgl /litre.
• Chloride ranges from 4.30 to 102 mgl/litre.
• Fluoride concentration is within the permissible limit.
All the blocks fall under Safe category
The water scarcity being faced in the hilly areas in summer period is due to drying up of dug wells.
6. Kozhikode
• Pre Monsoon GW Level in m (April 2011)- 0.73 to 16.11 bgl
• Post Monsoon GW Level in m (November 2011)-0.26 to 10.62 bgl
• The EC of water from shallow aquifer ranges between 50 (Punnasserri) and 661 (Kozhikode) μS/cm at 25ºC.
• The pH value of water ranges from 6.29 to 8.29 indicating neutral to alkaline and occasionally acidic nature.
• Total hardness of water samples ranges between 12 and 155 mg/l as CaCO3 shows soft nature of the water.
As per the Dynamic Ground Water Resources of Idukki District, Kerala (As in March 2009), Balusseri and Kunnamangalam are categorized as semi critical and the rest of the blocks as safe.
• The major problems noticed in the district are water scarcity, decline in water level
• Localized pollution is reported from many areas in the district, especially from effluent and sewage discharges from factories and hotels.
7. Malappuram
• Pre Monsoon GW Level in m (April 2011)- 1.57 to 13.68 bgl
• Post Monsoon GW Level in m (November 2011)-0.26 to 12.85 bgl
• The shallow groundwater from the alluvial formation has higher total dissolved solids and major ion constituents than that of other formations. This is due to the proximity of the pond water
As per the Dynamic Ground Water Resources of Idukki District, Kerala (As in March 2009), 3 blocks namely Kondotty, Tirurangadi and Vengara have been categorized as ‘Semi-Critical’ and the remaining
Dug wells in the lateritic aquifer go dry immediately after the monsoon season causing drinking water shortage to rural population.

Kochi Bengaluru Industrial Corridor –Draft Perspective Plan for overall KBIC region - Draft
208
S. No District Name
GW Status
Water levels
Water Quality Category GW Related Issues
channels and tidal influence in the area occupied by coastal alluvium.
• In the coastal alluvium the electrical conductivity ranges from 1360 – 2130 μS/cm at 25° C.
blocks are categorized as Safe
8. Palakkad
• Pre Monsoon GW Level in m (April 2011)- 1.55 to 11.23 bgl
• Post Monsoon GW Level in m (November 2011)-0.73 to 8.67 bgl
• Fluorides in the dug wells are in the range of 1 - 5.75 ppm. The higher values recorded from Kopanur (5 .75 ppm). The bore wells are showing high concentration of fluoride, ranges from 0.3 to 3.12 ppm. The highest concentration is reported from Chinnamoolathara (EW of CGWB).
• The water supply bore well of Eruthanpathy is also showing 1.76 ppm of fluoride.
• Inland salinity is noticed from Kadumthuruthi (Yakkara) and Koduvayoor area.
• The dug wells in the Kadumthuruthi colony area showing high EC values in the range of 2000 - 6700 microseimens/cm at 25°C. In the Kuduvayoor area EC values are high and in the range of 756 - 7200 micro seimens/cm at 25°C.
Out of 13 blocks in the district, the status of GW as of March 2009 is as follows:
Over Exploited-01
Critical-1
Semi Critical-2
Safe-9
The fluoride content was observed to be beyond the permissible limit of 1 mg/l deep wells in Chittur taluk and Knajikod areas of Palakkad district are found to contain fluoride concentration greater than 1mg/l.
9. Thrissur
• Pre Monsoon GW Level in m (April 2011)- 1.57 to 14.42 bgl
• Post Monsoon GW Level in m (November 2011)-0.53 to 11.73 bgl
• In the deeper sedimentary area the formation water is slightly brackish.
• The EC ranges from 37 to 635 μs/cm at 25°C
• Total hardness ranges from 6 to 240 mg /litre.
Most of the blocks are falling under safe category, however the Kodungallur block falls under critical category and Ollukkara under semi-critical category.
• Acute water scarcity being faced in the hilly areas in summer period due to drying up of dug wells and hand pumps.
• In Kole land and adjoining areas are water logged about six

Kochi Bengaluru Industrial Corridor –Draft Perspective Plan for overall KBIC region - Draft
209
S. No District Name
GW Status
Water levels
Water Quality Category GW Related Issues
• Chloride ranges from 4.30 to 121 mg/litre
months in year in those areas the conjunctive use of both ground and surface water to be adopted for irrigation and industrial uses. In Kole land the salinity has been observed more during high tides and less during low tides and increasing from February to May.
II Tamil Nadu State
10. Coimbatore
• Post Monsoon GW Level in m (January 2016)-13.8
• Pre Monsoon GW Level in m (May 2016)-16.7
• The specific electrical conductance of ground water in phreatic zone (μS at 25°C) during May 2006 was in the range of 597 to 4810 in the district. It is between 750 and 2250 μS/cm at 25°C in the major part of the district. Conductance below 750 μS/cm has been observed in Kaltanpet whereas conductance exceeding 2250 μS/cm has been observed in parts of Avinashi, P.N.Palayam, Tiruppur, Nachipalayam, Vadavalli, Singanallur, Slur, Podanur and Chinnaripalayam
• Total Hardness as CaCO3 is observed to be in excess of permissible limits in about 39%, whereas Nitrate is found in excess of 45 mg/l in about 80%
Out of 44 Firkas in the district, the status of GW as of March 2013 is as follows:
Over Exploited-22
Critical-2
Semi Critical-18
Safe-2
• Incidence of high TDS, Fluoride, Chloride and Nitrate has been reported from localised areas. Ground water in small packets of the district is likely to cause high to very high salinity hazard when used for irrigation.
• An area of about 202.68 Sq. Km covering Tiruppur and its environ is affected by industrial pollution. There are about 669 dyeing and bleaching industries under operation as per the available statistical data. The liquid and solid waste discharged into the nearby land and watercourses have contaminated the ground water.

Kochi Bengaluru Industrial Corridor –Draft Perspective Plan for overall KBIC region - Draft
210
S. No District Name
GW Status
Water levels
Water Quality Category GW Related Issues
• Excessive use of fertilizers and pesticides in agriculture has also reportedly resulted in localized enrichment of nitrate in the top unconfined aquifer.
11. Dharmapuri
• Post Monsoon GW Level in m (January 2016)-5.0
• Pre Monsoon GW Level in m (May 2016)-9.5
• Dharmapuri has conductance below 750 μS/cm whereas in parts of Papireddipatti, Pennagaram and Morappur blocks, conductance exceeds 2250μS/cm.
• Total Hardness as CaCO3 is excess of permissible limits in about 40% areas whereas Nitrate is found in excess of 45 mg/l in about 32% of the areas.
• The incidence of high total hardness is attributed to the composition of lithounits constituting the aquifers in the district, whereas the Nitrate pollution is most likely due to the use of pesticides and fertilizers for agriculture.
Out of 22 Firkas in the district, the status of GW as of March 2013 is as follows:
Over Exploited-14
Critical-3
Semi Critical-5
• TH as CaCO3 and Nitrate concentrations are more than permissible limit
• Limited Groundwater potential and excess fluoride are the main issues in the district
12. Erode
• Post Monsoon GW Level in m (January 2016)-6.8
• Pre Monsoon GW Level in m (May 2016)-11.2
• Conductance below 750 μS/cm has been observed in ground water in only Vellakottai whereas conductance exceeding 2250 μS/cm has been observed at Pudupalayam, Bhavani and Vijayamangalam.
• Total Hardness as CaCO3 is observed to be in excess of permissible limits in about 32% areas, whereas Nitrate is
Out of 34 Firkas in the district, the status of GW as of March 2013 is as follows:
Over Exploited-12
Critical-5
Semi Critical-11
Safe-6
• The ground water polluted in this district due to the indiscriminate discharge of untreated effluents from the textiles dyeing, bleaching processing and tanneries units, which are concentrated at Erode, Bhavani, Chennimalai and Vellakoil

Kochi Bengaluru Industrial Corridor –Draft Perspective Plan for overall KBIC region - Draft
211
S. No District Name
GW Status
Water levels
Water Quality Category GW Related Issues
found in excess of 45 mg/l in about 66% areas.
• The incidence of high total hardness is attributed to the composition of lithounits constituting the aquifers in the district, whereas the nitrate pollution is most likely due to the use of fertilizers for agriculture and other improper waste disposal.
towns and their environs.
• Excessive use of fertilisers and pesticides in the areas has resulted in localised enrichment of nitrate and other harmful chemicals in the ground water, especially in the phreatic zone.
• Incidence of fluoride in ground water in excess of permissible limits for drinking has been reported from parts of the district, especially from the fracture zone.
• The source of fluoride in ground water is the fluoride-bearing minerals present in the granitic gneisses and granites, which underlie in the area.
13. Karur
• Post Monsoon GW Level in m (January 2016)-10.1
• Pre Monsoon GW Level in m (May 2016)-18.5
• The total Hardness as CaCO3 as well as nitrate is observed to be in excess of permissible limits in about 44 and 78% of areas.
• Fluoride in excess of the drinking water limit of 1.5 mg/l is observed in 44% areas.
• Excess of fluoride is observed in places such as Noyil, Chinna Dharapuram, Paramathi and Aravakirichi.
Out of 18 Firkas in the district, the status of GW as of March 2013 is as follows:
Over Exploited-9
Critical-3
Semi Critical-1
Safe-5
• Incidence of high TDS, Chloride and Nitrate has been reported from localised areas.
• Ground water in small packets of the district is likely to cause high to very high salinity hazard when used for irrigation.
• Higher concentration Chloride and Nitrate has been observed mainly from phreatic aquifer.

Kochi Bengaluru Industrial Corridor –Draft Perspective Plan for overall KBIC region - Draft
212
S. No District Name
GW Status
Water levels
Water Quality Category GW Related Issues
14. Krishnagiri
• Post Monsoon GW Level in m (January 2016)-9.1
• Pre Monsoon GW Level in m (May 2016)-12.9
• Total hardness as CaCO3 is observed to be in excess of permissible limits in 33% of areas, whereas nitrate is found in excess of 45 mg/l in about 50% of areas.
• Excess fluoride more than the permissible limit of 1.5 mg/l is observed at K.Vetrapatti and Karukanchavadi areas.
Out of 29 Firkas in the district, the status of GW as of March 2013 is as follows:
Over Exploited-12
Critical-1
Semi Critical-8
Safe-8
• It is inferred that a major part of the district could be considered vulnerable to water level depletion.
• Incidence of fluoride in ground water in excess is reported in Thally and Hosur blocks.
15. Namakkal
• Post Monsoon GW Level in m (January 2016)-5.9
• Pre Monsoon GW Level in m (May 2016)-8.4
• The total Hardness as CaCO3 as well as nitrate is observed to be in excess of permissible limits in about 66 and 86% of areas.
• Fluoride in excess of the drinking water limit of 1.5 mg/l is observed in 30% of the areas.
• In about 14%of the areas sulphates was in excess of the drinking water limit of 400 mg/l.
• Excess of fluoride is observed in places such as Venandur, Udaiyarpalayam, Talamabadi, V.G.Patti and Mohanur.
Out of 30 Firkas in the district, the status of GW as of March 2013 is as follows:
Over Exploited-20
Critical-2
Semi Critical-5
Safe-3
• It is inferred that a major part of the district could be considered vulnerable to various environmental impacts of water level depletion such as declining ground water levels, drying up of shallow wells and decrease in yield of bore wells.
• Pollution of ground water due to Sago industry is also one of the issues in the district. The effluents from which have caused local pollution of surface and ground water resources.
16. Nilgiri
Depth of Water level in Unconfined to semi confined aquifers is 5-10 m
• All the constituents are within the permissible limit of drinking water limits except nitrate exceeding the limit in 15% of the areas
Out of 15 Firkas in the district, the status of GW as of March 2011 is safe for all.
• Declining ground water levels of shallow wells also noticed in few locations.
• There is no ground water Pollution due to industrial effluents in Nilgiri district. Slight industrial pollution of

Kochi Bengaluru Industrial Corridor –Draft Perspective Plan for overall KBIC region - Draft
213
S. No District Name
GW Status
Water levels
Water Quality Category GW Related Issues
surface and ground water has been noticed at one or two places in the district.
17. Salem
• Post Monsoon GW Level in m (January 2016)-7.4
• Pre Monsoon GW Level in m (May 2016)-11.4
• In major part of the district the electrical conductivity is above1000 μS/cm, except in Yercaud, P.Goundanpalayam & Salem.
• Total Hardness is observed in 60% of the areas exceeds more than permissible limit.
• About 80% of the areas are having high concentration of Nitrate, which may be due to anthropogenic activities. 22% of the areas are having higher concentration of
• Fluoride (>1.5 mg/L), in parts of Edapadi, Attayampatti & Jalakandapuram.
• It is observed that the majority of the areas are characterized by higher concentration of NO3, SO4 and F than the BIS permissible limit.
• In general, groundwater can be categorized as High Salinity on the basis of SAR
Out of 42 Firkas in the district, the status of GW as of March 2011 is as follows:
Over Exploited-27
Critical-2
Semi Critical-7
Safe-6
• Water level depletion such as declining ground water levels, drying up of shallow wells, decrease in yield of bore wells and increased expenditure and power consumption for drawing water from progressively greater depths.
• A number of industrial units including textile units, sugar mills and sago factories exist in the district, the effluents from which have caused local pollution of surface and ground water resources.
• Excessive use of fertilisers and pesticides in agriculture has also reportedly resulted in localised enrichment of nitrate in the phreatic zone.
18. Tiruppur
• Post Monsoon GW Level in m (January 2016)-7.9
• Pre Monsoon GW Level in m (May 2016)-12.2
• Salinity level: 58 % good, 33% moderate and 9% poor
• Residual Sodium Carbonate: 53% good, 46% moderate and 1% poor
• Sodium Adsorption Ratio:100 % good
Out of 31 Firkas in the district, the status of GW as of March 2011 is as follows:
Over Exploited-21
Critical-4
Semi Critical-5
Safe-1
-

Kochi Bengaluru Industrial Corridor –Draft Perspective Plan for overall KBIC region - Draft
214
Figure 139: Ground water contamination in Tamil Nadu
From the above figure, it is observed that Dhramapuri District is the highest in terms of contamination levels with 88.13% of the samples being contaminated.
Figure 140: Nitrate contamination in Tamil Nadu
From the above figure, it is observed that the districts of Tiruppur and Erode have high levels of nitrate contamination, this is due to the agricultural run-off and due to the presence of many Red Category Industries.

Kochi Bengaluru Industrial Corridor –Draft Perspective Plan for overall KBIC region - Draft
215
Figure 141: Faecal coliform contamination in Tamil Nadu
From the above figure, it is observed that the districts of Theni, Madhurai, Dharmapuri, Krishnagiri, Thiruvannamalai, and Vellore have high levels of faecal Coliform contamination, this is due to untreated industrial wastewater and municipal sewage.
7.3.2. Surface Water
The major rivers in KBIC are shown in following figure.
Figure 142: Rivers in KBIC
Source: Bhuvan-NRSC

Kochi Bengaluru Industrial Corridor –Draft Perspective Plan for overall KBIC region - Draft
216
7.3.2.1. Kerala
There are 44 rivers, most of them having their source in the Western Ghats and draining into the Arabian Sea. The important rivers from north to south are: Valapattanam river, Chaliar, Kadalundipuzha, Bharathapuzha, Chalakudy river, Periyar, Pamba, Achancoil and Kalladayar. Other than these, there are 35 more small rivers and rivulets flowing down from the Ghats. One of the striking features of the state is the continuous chain of lagoons or backwaters existing along the coastal region. The lagoons or backwaters are connected to the sea through small opening called Azhis or Pozhis according as the opening is permanent or temporary. The important backwaters in Kerala of the state are Kumbala, Kalnad, Bekal, Chittari, Valapattanam, Korapuzha, Kavvayi, Veliyangod, Crangnonore, Perur, Vembanad, Kayalakulam, Ashtamudy, Anjengo, Katinamkulam and Veli. Fresh water lake system is also a unique and vulnerable ecosystem in the state. Large inland freshwater bodies are common in the central and southern parts of Kerala; the important ones among these are the Kolelands of Trichur district, the Punchas/ Chals of Alleppey district, the Sasthakota Kayal of Quilon and Vellayani Kayal of Trivandrum.
Rivers flowing in KBIC districts of Kerala are given in below.
Table 108: Rivers in KBIC districts of Kerala
S. No. Name of the River Description
1. Achenkovil River
The Achenkovil River is formed by the confluence of Kallar and several small streams originating from the Western Ghats. It is flowing through Kollam, Pathanamthitta and Alappuzha districts. The river travels a distance of nearly 128 km and finally joins the Pamba river at Veeyupuram village near Mavelikkara (Alappuzha District).
2. Pamba River
The Pamba River originates from the Pulachi Malai Hills of the Peerumedu Plateau in the Western Ghats. It flows through Ranni, Pathanamthitta, Thiruvalla, Chenganoor, Kuttanadu, Ambalappuzha and finally reaches Vembanadu lake.
3. Meenachil River The Meenachil River originates from the Western Ghats and flows through Erattupettah, Palai, Kidangoor, Ettumanoor and Kottayam, where it divides into its tributaries before emptying into the Vembanadu Lake.
4. Manimala River
The Manimala River originates from the Muthavara Hills near Peerumedu in Idukki district and has a length of about 92 km. It flows through Kottayam and Pathanamthitta districts and finally joins Pamba River at Muttar in Alappuzha.
5. Periyar River
The Periyar River is the longest river in Kerala. It originates from the Sivagiri hills of the Western Ghats. It has a length of 244 km. Major hydroelectric projects of Kerala which are Pallivasal, Chengulam, Idukki, Panniyar, Neriyamangalam, Edamalayar, Lower Periyar etc. are located in this river. The river bifurcates at Alwaye as Mangalapuzha branch and Marthandavarma branch. Several major, minor and small scale industries are located on the banks of these two branches. Periyar River is the main drinking water source of Cochin Corporation, Aluva and Paravur towns and a lot of Panchayaths like Kadamakudy, Puthencruz etc.
6. Moovattupuzha River
The Moovattupuzha River is formed by the union of three rivers viz., Thodupuzha, Kaliyar and Kothamangalam at Moovattupuzha. Malankara dam is constructed across Thodupuzha River for irrigation purpose. This river finally joins the Vaikom lake and drains into the Lakshadweep Sea.
7. Chalakkudy River
Chalakudypuzha, the fifth longest river in Kerala has a total stretch of about 145 km. It originates from the Anamali and Nelliampathy ranges of the Western Ghats and flows westwards through the districts of Palakkad, Thrissur and Ernakulam. The major portion of this river flows through Thrissur district and finally joins the Periyar River near Paravur and drains into the Lakshadweep Sea.

Kochi Bengaluru Industrial Corridor –Draft Perspective Plan for overall KBIC region - Draft
217
S. No. Name of the River Description
8. Karuvannoor River
The Karuvanoor River originates from the Manali Aar from the Vaniampara Hills. The Kurumali and Manali Aar join together and flow as Karuvanoor River through 29 Grama Panchayats in Thrissur District and 2 in Palakkad District within the entire stretch of 48 km. Peechi and Cheemeni irrigation projects are situated in this river.
9. Keecheri River The Keecheri River originates from the western cliffs of the Western Ghats in Thalapathi Taluk.
10. Bharathapuzha River
The Bharathapuzha River ‘otherwise called Nila River’ is the second longest river in Kerala. It stretches a length of about 209 km and has its presence in three districts namely Palakkad, Malappuram and Thrissur. This river originates from the Anamalai Hills and empties into the Lakshadweep Sea at Ponnani.
11. Kadalundi River
The Kadalundi River is formed by the union of tributaries Olipuzha and Veliyar which originate from Cherakombanmala and Erattukombanmala of the Silent Valley. It has a length of nearly 120 km and finally debouches into the Lakshadweep Sea. A famous bird sanctuary is located on the banks of Kadalundi River near Beypore port.
12. Tirur River The Tirur River originates from the Athavanad village and has a length of 48 km, joins Bharathapuzha at Ponnani and finally reaches the Lakshadweep Sea.
13. Chaliyar River
The Chaliyar River is the fourth longest river in Kerala. It has a length of about 169 km and flows through Malappuram and Kozhikode districts and finally joins the Lakshadweep Sea at Kozhikkode. It originates from the Western Ghats at Elambalan Hills located near Cherambadi Town in Nilgiri district of Tamilnadu. This river is a significant transportation route for raw materials of the wood industries located at Nilambur and Kallai areas.
14. Bhavani River
The Bhavani River has a length of the about 217 km. This river originates from the Nilgiri Hills of the Western Ghats at Mukkli in Kerala. It flows through Attappadi plateau for nearly 25 km stretch and through Coimbatore and Erode in Tamilnadu and merges with Cauvery River. It flows through three States- Kerala, Tamilnadu and Karnataka. The major portion of this river flows through Tamilnadu.
15. Kallaipuzha River Kallai River originates from the Cherukulathur village in Kozhikode and joins at Arabian Sea after flowing through Kovoor,Olavanna and kallai.
16. Korappuzha River This 40 km long river is formed by the confluence of Alakapuzha and Punnoorpuzha. It originates from the mountains of Wayanad district. It empties into the Lakshadweep Sea at Elattur.
17. Kuppam River This river originates from the Padinalkad Ghats reserve forest in the Coorg district of Karnataka. It has a length of about 83 km. It joins the River before emptying into the Lakshadweep Sea.
18. Valapattanam River
Valapattanam River originates from Brahmagiri forests of Kodagu district in Karnataka State and joins Kuppam River and empties into the Arabian Sea. It has a length of 110 Km. The irrigation project, Pazhassi Dam is in Valapattanam river. Major tributaries are Srikandapuram, Bharapuzha Valiyapuzha, Venipuzha and Aralampuzha.
19. Kadambrayar The Kadambrayar is the drains from the Irrigation canals of Bhoothathankettu which are well connected with the adjoining paddy fields.The Kadambrayar joins Chithrapuzha near Brahmapuram.

Kochi Bengaluru Industrial Corridor –Draft Perspective Plan for overall KBIC region - Draft
218
S. No. Name of the River Description
20. Chitrapuzha The upstream portion of Chithrapuzha River has a link with the Kadambrayar.
The rivers of Kerala have been increasingly polluted from the industrial and domestic waste and from the pesticides and fertilizer in agriculture. Industries discharge hazardous pollutants like phosphates, sulphides, ammonia, fluorides, heavy metals and insecticides into the downstream reaches of the river. The river Periyar and Chaliyar are very good examples for the pollution due to industrial effluents. It is estimated that nearly 260 million litres of trade effluents reach the Periyar estuary daily from the Kochi industrial belt.
The major water quality problem associated with rivers of Kerala is bacteriological pollution. The assessment of river such as Chalakudy, Periyar, Muvattupuzha, Meenachil, Pamba and Achenkovil indicates that the major quality problem is due to bacteriological pollution and falls under B or C category of CPCB classification. There are local level quality problems faced by all rivers especially due to dumping of solid waste, bathing and discharge of effluents.
As per the “River Stretches For Restoration of Water Quality” published by Central Pollution Control Board, MoEF&CC-February 2015, the list of polluted river stretches in Kerala are given below.
Table 109: Polluted river stretches in of Kerala
S. No
River Name Stretch Identified Towns identified Approx. length of the stretch (in Km
Remarks
1. Chitrapuzha Irumpanam to Karingachira
Chittethukara 15 Falling in KBIC Districts
2. Kadambayar Manckakadavu to brahmapuram
Kakkattikara,Thengumthuruthu
8 Falling in KBIC Districts
3. Kallai Thekepuram to Arakkinar
Kozhikode, Mananchir 5 Falling in KBIC Districts
4. Karamana Malekkdu to Thiruvallam
Trikkannapuram 4 -
5. Keecheri Puliyannor to Kechery
Thrissur 6 Falling in KBIC Districts
6. Kuppam Thaliparamba to Velichangool
Marathakkad, Kuttiyeri 12 Falling in KBIC Districts
7. Manimala Kalloopara to Thondra
Mallappally, Vaipur 10 -
8. Neeleswaram
Nambiarkal dam To Hosdurg
Puthukai 8 -
9. Periyar Alwaye-Eloor to Kalamassery
Muttinakam, Edampaadam 5 Falling in KBIC Districts
10. Pullur Ramnagar to Kannoth
Kottapara 2 -
11. Puzhackal Olarikkara to Puzhackal
Puthurkara, Chettupuzha 3 Falling in KBIC Districts

Kochi Bengaluru Industrial Corridor –Draft Perspective Plan for overall KBIC region - Draft
219
S. No
River Name Stretch Identified Towns identified Approx. length of the stretch (in Km
Remarks
12. Thirur Naduvilangadi to Thalakkadathur
Chembra, thazhepalam,
Mangalam Thiruthummal 8
Falling in KBIC Districts
13. Uppala Poyya to Mulinja Manjeshwar, Hosabettu 3 -
7.3.2.2. Tamil Nadu
Rivers flowing in KBIC districts of Tamil Nadu are given below.
Table 110: Rivers in KBIC districts of Tamil Nadu
S. No District Name
Major Water Bodies Name/Type
1. Coimbatore
• The most part of the district forms parts of Cauvery river basin whereas the South western part of the district comes under Ponnani River basin.
• The major river courses which come under Cauvery basin are Bhavani, Noyyal and Amaravathi.
• The South western part of the district is drained by tributaries of Ponnani, namely Palar, Aliyar and Uppar originating from Anamalai hills.
2. Dharmapuri
• Major rivers of the district are the Cauvery River and Ponnaiyar. R. Cauvery originating from Karnataka State enters the district at Hogenekkal, and drains into the Mettur Dam in Salem district.
• Ponnaiyar is the other major river draining the district and is ephemeral in nature. It originates from Nandhi hills in Karnataka, enters Tamil Nadu west of Bagalur and flows almost in a south easterly direction tll it reaches Doddampatti from where it takes an easterly course.
• Pambar, Vaniyar and Kallar are the important tributaries of Ponnaiyar draining the eastern part of the district whereas the Chinnar and Markandeya Nadhi drain the northern part of the district.
3. Erode This district forms part of the Cauvery basin and contributes several tributaries viz Bhavani and Noyyal, that all drains into the river Cauvery.
4. Karrur
• The entire area of this district is drained by the river Cauvery, which flows on the northern boundary of the district.
• The tributary rivers namely Amaravathi, Kodaganar and Noyyal drain the western part of the district.
5. Krishnagiri
• Krishnagiri district forms parts of Cauvery and Pennaiyar Rivers basins. Cauvery River forms the southwestern boundary of the district.
• Dodda Halla is the most important tributary of Cauvery draining the rugged terrain in the north-western part of the district.
• Ponnaiyar river is another major river draining the district. It originates from Nandhi hills in Karnataka, and enters Tamil Nadu and flows almost in a south-easterly direction.
• Pambar and Burgur Ar, are the important tributaries of Ponnaiyar draining in the district.
6. Namakkal Most of the southern part of the district is drained by Cauvery and its tributary Thirumanimuttar.
7. Nilgiri
• The Nilgiris district, an entire hilly terrain district forms part of River Cauvery basin.
• Many streams originate from hill slopes and have formed several rivers in the deep valley portions.
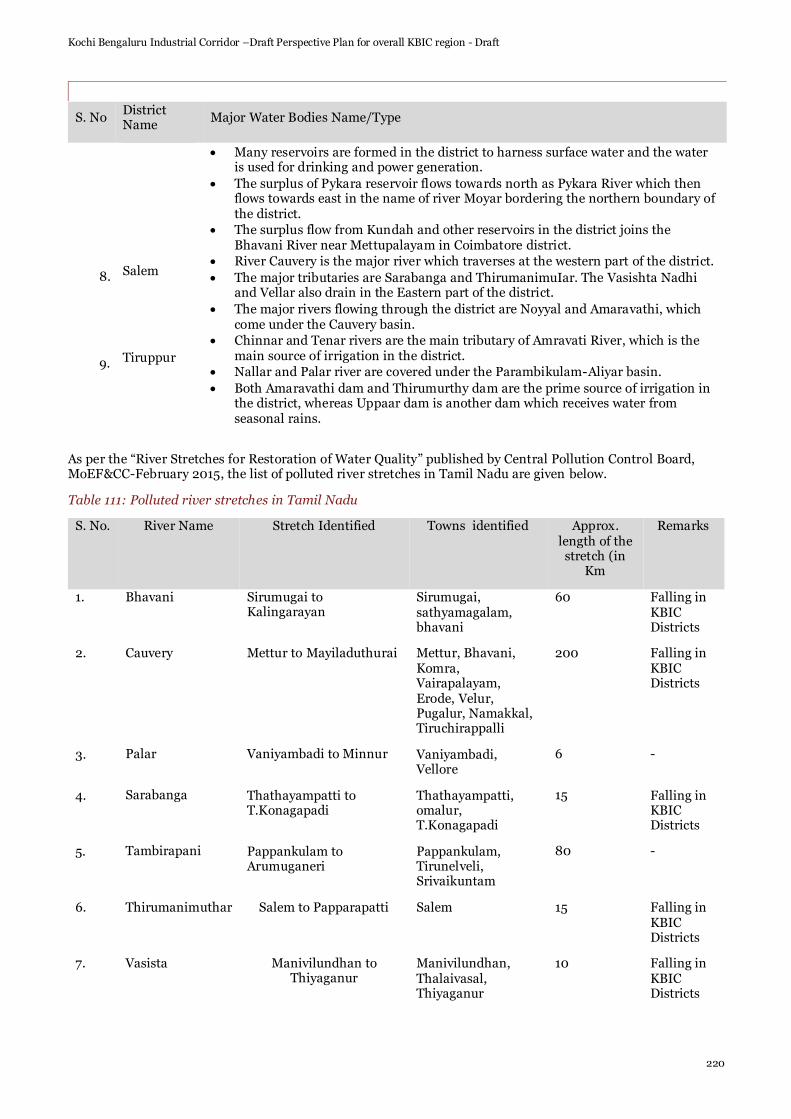
Kochi Bengaluru Industrial Corridor –Draft Perspective Plan for overall KBIC region - Draft
220
S. No District Name
Major Water Bodies Name/Type
• Many reservoirs are formed in the district to harness surface water and the water is used for drinking and power generation.
• The surplus of Pykara reservoir flows towards north as Pykara River which then flows towards east in the name of river Moyar bordering the northern boundary of the district.
• The surplus flow from Kundah and other reservoirs in the district joins the Bhavani River near Mettupalayam in Coimbatore district.
8. Salem • River Cauvery is the major river which traverses at the western part of the district.
• The major tributaries are Sarabanga and ThirumanimuIar. The Vasishta Nadhi and Vellar also drain in the Eastern part of the district.
9. Tiruppur
• The major rivers flowing through the district are Noyyal and Amaravathi, which come under the Cauvery basin.
• Chinnar and Tenar rivers are the main tributary of Amravati River, which is the main source of irrigation in the district.
• Nallar and Palar river are covered under the Parambikulam-Aliyar basin.
• Both Amaravathi dam and Thirumurthy dam are the prime source of irrigation in the district, whereas Uppaar dam is another dam which receives water from seasonal rains.
As per the “River Stretches for Restoration of Water Quality” published by Central Pollution Control Board, MoEF&CC-February 2015, the list of polluted river stretches in Tamil Nadu are given below.
Table 111: Polluted river stretches in Tamil Nadu
S. No. River Name Stretch Identified Towns identified Approx. length of the stretch (in
Km
Remarks
1. Bhavani Sirumugai to Kalingarayan
Sirumugai, sathyamagalam, bhavani
60 Falling in KBIC Districts
2. Cauvery Mettur to Mayiladuthurai Mettur, Bhavani, Komra, Vairapalayam, Erode, Velur, Pugalur, Namakkal, Tiruchirappalli
200 Falling in KBIC Districts
3. Palar Vaniyambadi to Minnur Vaniyambadi, Vellore
6 -
4. Sarabanga Thathayampatti to T.Konagapadi
Thathayampatti, omalur, T.Konagapadi
15 Falling in KBIC Districts
5. Tambirapani Pappankulam to Arumuganeri
Pappankulam, Tirunelveli, Srivaikuntam
80 -
6. Thirumanimuthar Salem to Papparapatti Salem 15 Falling in KBIC Districts
7. Vasista Manivilundhan to Thiyaganur
Manivilundhan, Thalaivasal, Thiyaganur
10 Falling in KBIC Districts

Kochi Bengaluru Industrial Corridor –Draft Perspective Plan for overall KBIC region - Draft
221
7.4. Ecology
7.4.1. Flora and Fauna – Kerala
Kerala State, which encompasses the windward side of the Southern Western Ghats, represents a bio-geographically important zone. The State represents 95% of the flowering plants and 90% of the vertebrate fauna of the Western Ghats, with high rate of endemism. The varied topographical features, high rainfall and geologic conditions have favoured the formation of different ecosystems from shola forests on the mountain valleys to the mangrove forests along sea coasts and estuaries. The most outstanding feature of the State is the formation of tropical rainforests along the windward side of the Southern Western Ghats, which is lying parallel to the west coast.
The upper stratum trees in the forest includes Antiaris toxicaria, Artocarpus heterophyllus, Canarium strictum, Chrysophyllum roxburghii, Diospyros buxifolia, Dipterocarpus indicus, Hopea parviflora, Mangifera indica, Persea macrantha, Syzygium chavaran, Terminalia travancorensis and Vateria indica, etc. The middle stratum trees in the forest include Aglaia lawii, Alseodaphne parvifolia, Cinnamomum malabatrum, Elaeocarpus glandulosus, Hydnocarpus alpina, Lepisanthes tetraphylla, Madhuca neriifolia, Strombosia ceylanica, Syzygium laetum and Vepris bilocularis. Among the trees, Bombax insigne, Hymenodictyon obovatum and Lagerstroemia microcarpa have a leafless period up to five months. Terminalia paniculata and Dalbergia sissoides have a leafless period of less than 2 weeks. Trees like Coconut, Jack Fruit and mango are found almost in all the regions of the state. According to forest department estimate, fauna like Elephant, Gaur,Tiger,Panther,Sambar, barking deer, Wild boar, Sloth bear, Nilgiri langur, Liontailed macaque, Otter, Malabar giant squirrel, Wild dog etc are the major mammals from the state. The major reptile seen here are King Cobra, Cobra, Viper, Krait, Rat Snake, Tree frog, Bronze frog, Rufescent Burrowing Frog, Indian Chameleon, etc. Common birds include Eastern Grey Heron, Openbill Stork, Blacke Lackwinged Kite, Pheasant-Tailed Jacana, Malabar Grey Hornbill, Malabar Pied Hornbill and Blackbacked woodpecker are notable birds from the state.
7.4.2. Flora and Fauna – Tamil Nadu
In Tamil Nadu, Forest vegetation is divided into 3 major groups according to temperature zones namely Tropical Forests, Montane Subtropical Forests and Montane Temperate Forests, which are sub divided into nine type groups based on moisture and physiognomic variation.
Angiosperm diversity includes 5640 species accounting for 1/3rd of the total flora of India. Forest Tree species present in this state are Hopeaparvi flora, Artocarpus hirsuta, Syzygium cumini, Cinnamomum zeylanicum. Artocarpus hirsuta, Hopea parviflora, Lagerstroemia lanceolata, Terminalia paniculata, Bombax ceiba, Dillenia pentagyna, Mitragyna parviflora, Albizzia amara, Anogeissus latifolia, Butea monosperma and Terminalia spp., etc.
Common Trees species include in the state are Palmyra palm, Banyan Tree, Peepal tree, Arjuna tree, Sal Tree, Gulmohar tree, Indian Mahogany, eucalyptus, rubber, cinchona, clumping bamboos and common teak.
The faunal diversity of Tamil Nadu includes 165 identified freshwater fishes, 76 amphibians, 127 reptiles, 545 birds and 187 mammals. Mammals include including elephants, tigers, leopards, lion tailed macaque, wild dogs, sloth bears, gaurs, nilgiri langurs, nilgiri tahrs, grizzled giant squirrels and sambar deer. Resident and migratory birds such as cormorants, darters, herons, egrets, open-billed storks, spoonbills and white ibises, little grebes, Indian moorhen, black-winged stilts and grey pelicans.
7.5. Air Environment
7.5.1. Meteorology
The Climatological data for some regions in KBIC, published by the IMD, based on daily observations at 08:30 and 17:30 hour IST for a 30 year period, is given in the following sections on the meteorological conditions of the region. The monthly variations of the relevant meteorological parameters are detailed below.

Kochi Bengaluru Industrial Corridor –Draft Perspective Plan for overall KBIC region - Draft
222
7.5.1.1. Kerala
Table 112: Climatological Summary – Alappuzha Region (1971-2000)
Month
Temp (oC) Rainfall
(mm)
Relative Humidity
(%)
Station Level
Pressure hPa
Mean
Wind
Speed
(km/h)
Predominant Wind Directions
(From)*
Daily
Max.
Daily
Min.
Total
No. of
days
08:30
17:30
08:30
17:30
08:30 17:30
Jan 32.4 22.5 16.3 1.1 24.9 27.5 1012.
7 1008.
8 8.8 E,SE,NE
NW,W,SW,N
Feb 32.6 23.7 48.7 1.9 27.8 29.4 1012.
1 1008.
1 10.3 E,NE,SE NW,W,SW
Mar 33.3 25.2 48.0 2.7 31.0 32.4 1011.
4 1007.
5 11.1 NE,E,SE W,NW,SW
Apr 33.6 25.9 145.9 7.4 32.8 33.7 1009.
9 1006.
5 11.8 NE,E,SE NW,W,SW
May 32.6 25.7 267.5 11.9 33.0 33.6 1008.
8 1006.
1 12.1 NE,E,NW NW,W,SW
Jun 30.3 24.2 605.1 22.7 31.8 32.3 1008.
9 1006.
9 11.1 NE,NW,W NW,W,N
Jul 29.1 23.5 514.6 22.1 30.6 31.2 1009.
4 1007.
4 9.6
NE,NW,N,W
NW,W,N
Aug 29.0 23.6 380.7 18.7 30.8 31.2 1010.
0 1007.
7 9.6 NW,NE,N NW,W,N
Sep 30.0 24.0 297.9 13.9 31.0 31.3 1010.
5 1007.
6 9.7 NE,NW,N NW,W,N
Oct 30.9 24.1 343.0 14.4 31.2 31.5 1010.
9 1007.
9 8.8 E,NE,SE NW,W,SW
Nov 31.5 24 204 9 30.1 30.2 1011.
2 1008.
2 8.1 E,SE,NE W,NW,SW
Dec 32.3 23.1 56.3 2.7 26.8 28.1 1012.
2 1008.
9 7.9 E,SE,NE NW,W,SW
*Predominant wind in decreasing order (Source: IMD Climatological Data for Alappuzha Region)
Table 113: Climatological Summary – Kannur Region (1978-2000)
Month
Temp (oC) Rainfall
(mm)
Relative Humidity
(%)
Station Level
Pressure hPa
Mean Wind Speed (km/
h)
Predominant Wind Directions
(From)*
Daily
Max.
Daily
Min.
Total No. of
days
08:30
17:30
08:30
17:30
08:30 17:30
Jan 32.7 21.5 3.9 0.2 69
63 1011.0
1007.3 5.2
E,NE W,NW,SW
Feb 33.1 22.3 0.2 0.0 74
64 1010.5
1006.8 5.5
E,NE,N W,NW,SW
Mar 33.6 24.1 13.1 0.5 75
66 1009.6
1005.8 5.8
E,NE,N W,NW,SW
Apr 34.1 25.6 37.4 2.5 74
66 1008.2
1004.6 6.3
NE,E,N,NW
W,NW,SW
May 33.3 25.3 199.8 7.9 78
71 1006.9
1003.9 5.8
NE,E,N,NW
NW,W,SW
Jun 29.6 23.6
1035.5 24.2 90
84 1006.4
1004.4 4.5
E,SE,NE,W
W,NW,SW

Kochi Bengaluru Industrial Corridor –Draft Perspective Plan for overall KBIC region - Draft
223
Month
Temp (oC) Rainfall
(mm)
Relative Humidity
(%)
Station Level
Pressure hPa
Mean Wind Speed (km/
h)
Predominant Wind Directions
(From)*
Daily
Max.
Daily
Min.
Total No. of
days
08:30
17:30
08:30
17:30
08:30 17:30
Jul 28.9 23.1 879.1 25.0 92
86 1007.0
1005.0 4.0
E,W,NE W,NW,SW
Aug 29.0 23.1 553.7 21.6 91
85 1007.8
1005.5 3.9
E,NW,W NW,W,SW
Sep 30.1 23.4 225.1 11.2 87
80 1008.3
1005.5 4.4
E,NE,SE NW,W,SW
Oct 31.0 23.5 213.1 10.5 84
78 1008.8
1005.8 4.1
E,NE,SE W,NW,SW
Nov 32.0 23.0 113.2 5.2 75
72 1009.6
1006.3 4.6
E,NE,N W,NW,SW
Dec 32.5 22.0 32.2 1.3 68
65 1010.8
1007.4 5.2
E,NE,SE W,NW,SW
*Predominant wind in decreasing order (Source: IMD Climatological Data for Kannur Region)
Table 114: Climatological Summary – Kottayam Region (1973-2000)
Month
Temp (oC) Rainfall
(mm)
Relative Humidity
(%)
Station Level
Pressure hPa
Mean Wind Speed (km/
h)
Predominant Wind Directions
(From)*
Daily
Max.
Daily
Min.
Total No. of
days
08:30
17:30
08:30
17:30
08:30 17:30
Jan 32.6 22.3 9.7 0.8 78
68 1008.4
1005.1 3.5
NE,SE,SW
SW,NW,W
Feb 33.3 22.9 29.1 1.4 78
66 1007.9
1004.7 3.5
NE,SE SW,NW,W
Mar 34.1 23.9 45.1 2.5 74
65 1007.4
1003.8 4.1
NE,SE SW,NW,W
Apr 34.2 24.1 132.7 7.6 74
67 1006.0
1002.9 3.3
NE,SE SW,NW,W
May 33.3 23.8 231.8 10.0 79
70 1004.9
1002.6 4.3
NE,SE SW,NW,W
Jun 30.4 22.9 653.3 22.4 88
81 1004.7
1002.8 3.9
NE,SE,NW
SW,NW,W
Jul 29.8 22.7 539.9 21.8 90
82 1005.1
1003.5 3.9
NE,SE,NW
SW,NW,W
Aug 30.0 22.8 414.8 18.1 89
81 1005.7
1003.7 3.5
NE,SW,NW
SW,NW,W
Sep 30.8 23.2 275.1 12.6 85
77 1006.2
1003.7 3.6
NE,SE,NW
SW,NW,W
Oct 31.1 23.2 319.7 14.0 84
77 1006.6
1003.9 3.5
NE,SE SW,NW,W
Nov 31.4 23.2 181.9 9.2 83
75 1006.8
1004 3.2
NE,SE SW,NW,W
Dec 32.2 22.9 44.0 2.8 79
70 1007.7
1004.7 3.2
NE,SE SW,NW,W
*Predominant wind in decreasing order (Source: IMD Climatological Data for Kottayam Region)

Kochi Bengaluru Industrial Corridor –Draft Perspective Plan for overall KBIC region - Draft
224
Table 115: Climatological Summary – Kozhikode Region (1971-2000)
Month
Temp (oC) Rainfall
(mm)
Relative Humidity
(%)
Station Level
Pressure hPa
Mean Wind Speed (km/
h)
Predominant Wind Directions
(From)*
Daily
Max.
Daily
Min.
Total No. of
days
08:30
17:30
08:30
17:30
08:30 17:30
Jan 31.8 22.2 1.6 0.1 76
64 1012.9
1009.1 9.3
E,SE NW,W,N
Feb 32.2 23.5 1.7 0.2 77
67 1012.3
1008.5 10.7
E,SE NW,W,N
Mar 32.9 25.1 14.2 0.7 76
70 1011.5
1007.6 11.5
E,NE NW,W,N
Apr 33.2 26.2 76.6 3.6 75
71 1009.9
1006.4 12.1
E,N,NE NW,W,N
May 32.6 25.9 217.8 8.3 78
75 1008.8
1005.9 11.8
N,NW,NE NW,W,N
Jun 29.6 24.1 837.6 23.1 89
85 1008.5
1006.5 9.6
E,NW,NE NW,W,SW
Jul 28.5 23.5 816.5 24.5 92
87 1009.0
1007.1 8.3
E,NW,NE NW,W,N
Aug 28.5 23.6 454.8 20.5 92
87 1009.7
1007.5 7.9
NW,N,E NW,W,N
Sep 29.8 24.1 222.4 10.6 88
82 1010.2
1007.3 8.6
NW,E,N NW,W,SW
Oct 30.7 24.0 262.8 10.7 86
78 1010.8
1007.8 8.3
E,SE,NE NW,W,SW
Nov 31.4 23.7 149.4 6.2 82
72 1011.4
1008.2 8.0
E,SE,NE NW,W,SW
Dec 31.8 22.7 28.4 1.6 76
65 1012.6
1009.1 8.2
E,SE NW,W,SW
*Predominant wind in decreasing order (Source: IMD Climatological Data for Kozhikode Region)
Table 116: Climatological Summary – Palakkad Region (1971-2000)
Month
Temp (oC) Rainfall
(mm)
Relative Humidity
(%)
Station Level
Pressure hPa
Mean Wind Speed (km/
h)
Predominant Wind Directions
(From)*
Daily
Max.
Daily
Min.
Total
No. of
days
08:30
17:30
08:30
17:30
08:30 17:30
Jan 33.0 21.7 2.8 0.2 73 46 1002.
6 998.0 9.0
E,W,SE E,W,SE
Feb 35.3 22.4 5.2 0.4 72 39 1001.
9 996.9 8.2
E,W,SE E,W,SE
Mar 37.5 23.9 19.3 0.9 74 37 1000.
9 995.6 7.4
E,W,SE W,E,SE
Apr 36.8 24.9 73.3 3.6 78 53 999.2 994.7 7.8 W,E,SW W,E,SE
May 34.4 24.7 121.9 5.3 80 61 997.9 994.4 10.4 W,E,SW W,E,NE Jun 29.9 23.1 427.3 18.9 89 79 997.7 995.3 11.0 W,SW,E W,E,NE
Jul 28.6 22.5 491.5 20.6 91 82 998.0 995.6 11.2 W,SW,NE W,SW,E
Aug 28.8 22.7 322.2 16.9 91 81 998.6 995.9 10.9 W,SW,NE W,SW,NE
Sep 30.7 23.0 150.5 9.0 88 74 999.2 995.8 9.8 W,SW,NE W,SW,NE
Oct 31.5 23.1 203.4 10.6 86 73 1000.
0 996.4 6.5
W,E,SW W,E,SW

Kochi Bengaluru Industrial Corridor –Draft Perspective Plan for overall KBIC region - Draft
225
Month
Temp (oC) Rainfall
(mm)
Relative Humidity
(%)
Station Level
Pressure hPa
Mean Wind Speed (km/
h)
Predominant Wind Directions
(From)*
Daily
Max.
Daily
Min.
Total
No. of
days
08:30
17:30
08:30
17:30
08:30 17:30
Nov 31.9 22.9 123.4 5.2 81 65 1000.
7 997.0 6.6
E,W,SE E,W,SE
Dec 31.9 22.2 22.3 1.1 74 56 1002.
1 998.2 8.7
E,W,SE E,W,NW
*Predominant wind in decreasing order (Source: IMD Climatological Data for Palakkad Region)
7.5.1.2. Tamil Nadu
Table 117: Climatological Summary – Coimbatore (Pilamedu) Region (1971-2000)
Month
Temp (oC) Rainfall
(mm)
Relative Humidity
(%)
Station Level
Pressure hPa
Mean Wind Speed (km/
h)
Predominant Wind Directions
(From)*
Daily
Max.
Daily
Min.
Total No. of
days
08:30
17:30
08:30
17:30
08:30 17:30
Jan 30.5 18.2 5.4 0.3 81 41 970.0 965.7 6.9 NE,E,N E,NE,SE
Feb 33.3 19.5 13.0 1.0 76 34 969.0 964.4 7.7 NE,E,N E,NE,SW
Mar 35.9 21.3 15.1 1.0 73 29 967.9 963.0 8.1 NE,E,SW E,NE,SW Apr 36.7 23.4 48.0 3.0 75 42 966.0 961.4 9.0 SW,NE,S SW,E,S
May 35.2 23.5 71.2 4.2 78 56 964.1 960.4 11.8 SW,S,NE SW,S,W
Jun 32.2 22.4 27.4 2.7 80 66 963.2 960.7 16.3 SW,S,W SW,W,S
Jul 31.3 21.8 24.7 2.9 83 69 963.5 960.9 16.5 SW,S,W SW,S,W
Aug 31.6 21.8 35.5 2.6 83 68 964.2 961.3 16.5 SW,S,W SW,S,W
Sep 32.5 22.0 74.3 4.6 83 67 965.3 961.6 13.1 SW,S,W SW,S,W
Oct 31.6 21.8 123.1 7.4 83 67 966.6 963.0 8.6 SW,NE,S SW,E,NE Nov 30.1 20.7 122.2 5.8 83 63 968.0 964.4 5.8 NE,N,E E,NE,SW
Dec 29.3 19.0 46.0 2.8 82 55 969.8 966.0 6.2 NE,E,N E,NE,SE
*Predominant wind in decreasing order (Source: IMD Climatological Data for Coimbatore Region )
Table 118: Climatological Summary – Dharmapuri Region (1975-2000)
Month
Temp (oC) Rainfall
(mm)
Relative Humidity
(%)
Station Level
Pressure hPa
Mean Wind Speed (km/
h)
Predominant Wind Directions
(From)*
Daily
Max.
Daily
Min.
Total No. of
days
08:30
17:30
08:30
17:30
08:30 17:30
Jan 29.2 17.3 5.7 0.6 76 48 962.3 958.1 6.0 NE,E,SW NE,E,SE Feb 32.4 18.5 12.4 0.7 71 39 961.2 956.6 5.4 NE,SW,E NE,E,SE
Mar 35.4 20.4 19.5 1.2 65 31 960.0 955.2 5.1 SW,NE,W NE,E,SE
Apr 37.1 23.5 36.6 2.2 64 37 958.0 953.1 5.2
SW,NE,S NE,SE,SW
May 36.7 24.0 86.8 6.2 63 44 956.0 951.9 6.2
SW,W,NE SW,NE,SE
Jun 34.1 23.5 70.2 4.0 65 51 954.9 951.6 9.0
SW,W SW,W,NW

Kochi Bengaluru Industrial Corridor –Draft Perspective Plan for overall KBIC region - Draft
226
Month
Temp (oC) Rainfall
(mm)
Relative Humidity
(%)
Station Level
Pressure hPa
Mean Wind Speed (km/
h)
Predominant Wind Directions
(From)*
Daily
Max.
Daily
Min.
Total No. of
days
08:30
17:30
08:30
17:30
08:30 17:30
Jul 33.2 23.1 66.9 4.5 66 53 955.2 951.9 8.8
SW,W SW,W,NW
Aug 32.6 22.8 95.2 6.1 68 55 956.0 952.4 8.3
SW,W SW,W,NW
Sep 32.4 22.3 177.7 8.5 72 59 957.3 953.1 5.8 SW,W,NE SW,W,NE Oct 30.9 21.5 160.4 8.6 77 67 958.8 955.1 4.3 NE,SW,W NE,SW,E
Nov 28.9 20.0 107.8 6.5 79 67 960.2 956.6 5.0 NE,SW,E NE,E,SE
Dec 27.9 18.4 36.9 2.8 79 60 962.1 958.4 5.6 NE,E NE,E,SE
*Predominant wind in decreasing order (Source: IMD Climatological Data for Dharmapuri Region)
Table 119: Climatological Summary – Salem Region (1971-2000)
Month
Temp (oC) Rainfall
(mm)
Relative Humidity
(%)
Station Level
Pressure hPa
Mean Wind Speed (km/
h)
Predominant Wind Directions
(From)*
Daily
Max.
Daily
Min.
Total No. of
days
08:30
17:30
08:30
17:30
08:30 17:30
Jan 32.0 18.8 2.8 0.2 71 42 983.4 978.9 7.1 NE,E E,NE,SE Feb 34.4 20.2 5.0 0.4 69 34 982.3 977.5 7.3 NE,E,SE E,NE,SE
Mar 37.0 22.2 13.7 0.9 65 29 981.1 975.9 7.0 NE,E,SW E,NE,SE
Apr 38.0 24.9 43.4 3.1 65 37 979.0 973.6 6.1 NE,E,SW E,NE,SW May 37.4 24.9 99.9 6.6 68 46 976.8 972.3 5.0 SW,W,NE SW,NE,W
Jun 35.1 23.9 89.0 5.6 73 52 975.9 972.2 5.7 SW,W,S SW,W,S
Jul 34.0 23.2 115.8 7.4 77 56 976.3 972.6 5.2 SW,W,S SW,W,S
Aug 33.4 22.9 131.1 8.2 78 57 977.0 973.1 4.7 SW,W,S SW,W,S Sep 33.2 22.7 217.7 10.3 78 60 978.2 973.7 3.7 SW,W,S SW,W,NE
Oct 32.2 22.3 165.8 9.2 79 66 979.7 975.8 3.3 SW,NE NE,E,SE
Nov 31.1 21.0 99.1 5.5 77 63 981.0 977.5 4.6 NE,E NE,E,SE Dec 30.7 19.5 40.5 2.7 74 55 983.0 979.2 6.1 NE,E NE,E,SE
*Predominant wind in decreasing order (Source: IMD Climatological Data for Salem Region)

Kochi Bengaluru Industrial Corridor –Draft Perspective Plan for overall KBIC region - Draft
227
7.5.2. Ambient Air Quality
7.5.2.1. Kerala
Vehicles and industries are mainly responsible for the deterioration of air quality in the state. Vehicular emissions and noise from the vehicles are severe in the three major cities of Kerala namely, Thiruvananthapuram, Kochi and Kozhikode.
As per the Water & Air Quality Directory 2017 published by Kerala State Pollution Control Board, The Ambient Air Quality data of districts in KBIC is given below.
Table 120: Ambient air quality – Kerala KBIC districts
S. No. Sampling location Category
Parameters (in Annual Average)
Sulphur Dioxide μg/m³
(Limit: 50 μg/m³)
Nitrogen Dioxide μg/m³
(Limit: 40 μg/m³)
RSPM μg/m³
(Limit: 60 μg/m³)
Max Min Max Min Max Min
District: Alappuzha
1. DC Mills, Pathirapally Industrial 2.00 2.00 4.50 4.50 84.00 31.00
2. Thondamkulangara Industrial 2.00 2.00 4.50 4.50 69.00 27.00
District: Kottayam
3. Nagampadom Residential & Others
5.45 3.68 16.73 12.00 122.00 19.00
4. Vadavathur Industrial 11.73 4.36 38.30 13.50 133.00 23.00
District: Idukki
5. Thodupuzha (SAMP) Residential Rural & Others
22.00 2.00 4.50 4.50 69.00 9.00
District: Ernakulam
6. Methanam (Eloor I) Residential 2.00 2.00 59.87 15.05 110.00 17.00
7. TCC (Eloor II) Industrial 2.00 2.00 59.00 19.75 122.00 14.00
8. Near South Over bridge Residential & Others
6.30 2.00 33.60 4.50 159.00 17.00
9. Vyttila Residential Rural & Others
11.30 2.00 47.70 4.50 138.00 17.00
10. Irumpanam Industrial 9.90 2.00 33.90 4.50 92.00 28.00
11. Kalamassery Industrial 6.60 2.00 33.60 4.50 135.00 10.00
12. M.G. Road Residential & Others
9.10 2.00 26.70 4.50 155.00 14.00
13. Perumbavoor-Kuttippadam
Residential & Others
4.50 2.00 29.50 4.50 108.00 16.00
District: Thrissur

Kochi Bengaluru Industrial Corridor –Draft Perspective Plan for overall KBIC region - Draft
228
S. No. Sampling location Category
Parameters (in Annual Average)
Sulphur Dioxide μg/m³
(Limit: 50 μg/m³)
Nitrogen Dioxide μg/m³
(Limit: 40 μg/m³)
RSPM μg/m³
(Limit: 60 μg/m³)
Max Min Max Min Max Min
14. Poomkunnam Residential & Others
2.90 2.00 9.00 4.50 179.00 42.00
District: Palakkad
15.
Carborandum Universal/SEPR Refractories, Kanjikode
Industrial 2.00 2.00
9.93 6.75 68.00 24.00
District: Malappuram
16. Kakkanchery, near KINFRA
Industrial 2.00 2.00 50.14 9.12 87.00 5.00
District: Kozhikode
17. KSRTC Bus Stand-Kozhikode City
Residential Rural & Others
2.00 2.00 33.50 11.25 90.00 15.00
18. Nallalam, Kozhikode Industrial 2.00 2.00 29.67 11.17 94.00 18.00
District: Kannur
19. Kannur (SAMP) Residential Rural & Others
2.00 2.00 4.50 4.50 94.00 20.00
20. Mangattuparambu (SAMP)
Residential Rural & Others
2.00 2.00 8.30 4.50 97.00 27.00
7.5.2.2. Tamil Nadu
Air pollution in Tamil Nadu is widespread in urban areas where vehicles are the major contributors and in a few other areas with a high concentration of industries and thermal power plants. The main driving forces of air pollution in the state are mainly rampant increase in vehicular population, industrialization and also indiscriminate burning of garbage and refuse. Vehicular emissions are of particular concern since these are ground level sources and thus have the maximum impact on the general population.
Tamil Nadu Pollution Control Board (TNPCB) is carrying out ambient air quality monitoring under National Air Quality Monitoring Programme (NAMP) funded by Central Pollution Control Board. This monitoring is being carried out in Chennai and seven (07) other districts of Tamil Nadu, namely: 1) Thoothukudi, 2) Coimbatore, 3) Salem, 4) Madurai, 5) Trichy, 6) Cuddalore and 7) Mettur.
As per the Annual Report & Annual Accounts 2015 – 2016, published by TNPCB, the Ambient Air Quality data for some of the districts in KBIC is given below.
Table 121: Ambient air quality – Tamil Nadu KBIC districts
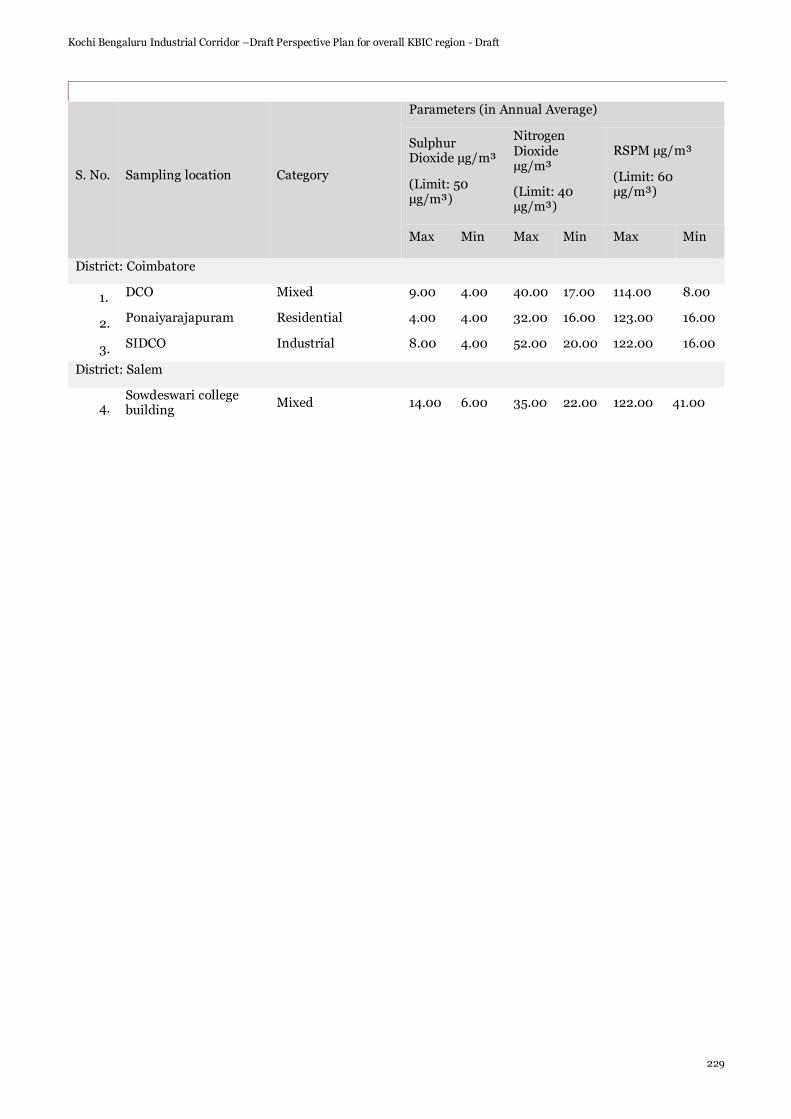
Kochi Bengaluru Industrial Corridor –Draft Perspective Plan for overall KBIC region - Draft
229
S. No. Sampling location Category
Parameters (in Annual Average)
Sulphur Dioxide μg/m³
(Limit: 50 μg/m³)
Nitrogen Dioxide μg/m³
(Limit: 40 μg/m³)
RSPM μg/m³
(Limit: 60 μg/m³)
Max Min Max Min Max Min
District: Coimbatore
1. DCO Mixed 9.00 4.00 40.00 17.00 114.00 8.00
2. Ponaiyarajapuram Residential 4.00 4.00 32.00 16.00 123.00 16.00
3. SIDCO Industrial 8.00 4.00 52.00 20.00 122.00 16.00
District: Salem
4. Sowdeswari college building
Mixed 14.00 6.00 35.00 22.00 122.00 41.00

Kochi Bengaluru Industrial Corridor –Draft Perspective Plan for overall KBIC region - Draft
230
7.6. Noise Environment
7.6.1.1. Kerala
Vehicular emissions and noise from the vehicles are severe in the three major cities of Kerala namely, Thiruvananthapuram, Kochi and Kozhikode.
7.6.1.2. Tamil Nadu
Noise from vehicular movements is a major contributor to the noise pollution in the state. Industrial ization, commercial activities and other sources such as loud speakers, fire crackers, etc. also contribute to the noise pollution.
7.7. Natural Disaster Prone Areas
Seismic zoning map for KBIC districts was give as Error! Reference source not found.. From the figure, it is observed that, all the 9 districts in KBIC in Kerala are falling under Seismic zone-III (Moderate Risk Zone-Intensity-VII), whereas in Tamil Nadu, Coimbatore, Tiruppur, Nilgiris, Namakkal, Salem, Dharmapuri, and Krishnagiri are partly falling under Seismic Zone-III (Moderate Risk Zone-Intensity-VII) and remaining districts in KBIC Tamil Nadu part are falling under Seismic Zone-II (Low Risk Zone-Intensity VI and lower).
7.8. KBIC’s Environmental Sensitivity
The following major Environmental Sensitivity aspects are studied with respect to KBIC.
• Protected Areas notified under the Wild Life (Protection) Act, 1972 (53 of 1972) such as Wild Life
Sanctuaries, National Park, etc.,
• Critically Polluted Areas as notified by the Central Pollution Control Board
• Eco Sensitive Areas as notified under sub-section (2) of section 3 of the Environment (Protection) Act,
1986,
• Inter-State boundaries
• Others
✓ Archaeological Monuments
✓ Reserve Forest Areas
✓ Urban Areas
✓ CRZ Areas
✓ Airports, Defence Installations, etc.
7.8.1. Protected Areas notified under the Wild Life (Protection) Act, 1972 in KBIC
The notified protected areas (National Parks, Wild Life Sanctuaries, and Marine/Community Reserves etc.) in KBIC districts of Kerala and Tamil Nadu are given below.
Table 122: List of Protected areas in KBIC districts
Name of the Protected Area Year of
Establishment Area (km2) District
Kerala
National Parks Anamudi Shola NP 2003 7.50 Idukki
Eravikulam NP 1978 97.00 Idukki
Mathikettan Shola NP 2003 12.82 Idukki

Kochi Bengaluru Industrial Corridor –Draft Perspective Plan for overall KBIC region - Draft
231
Name of the Protected Area Year of
Establishment Area (km2) District
Pambadum Shola NP 2003 1.318 Idukki
Periyar NP 1982 350.00 Idukki & Quilon
Silent Valley NP 1984 89.52 Palakkad Wild Life Sanctuaries
Aralam WLS 1984 55.00 Kannur
Chimmony WLS 1984 85.00 Thrissur Chinnar WLS 1984 90.44 Idukki
Chulannur Peafowl WLS 2007 3.42 Palakkad
Idukki WLS 1976 70.00 Idukki Kottiyoor WLS 2011 30.38 Kannur
Kurinjimala WLS 2006 32.00 Idukki
Malabar WLS 2010 74.22 Kozhikode Mangalavanam Bird WLS 2004 0.0274 Ernakulam
Parambikulam WLS 1973 285.00 Palakkad
Peechi-Vazhani WLS 1958 125.00 Thrissur Periyar WLS 1950 427.00 Idukki
Thattekadu WLS 1983 25.16 Ernakulam
Community Reserves Kadalundi Vallikkunnu Com R 2007 1.50 Malappuram
Tamil Nadu
National Parks Indira Gandhi (Annamalai) NP 1989 117.10 Coimbatore
Mudumalai NP 1990 103.23 Nilgiris
Mukurthi NP 1990 78.46 Nilgiris Wild Life Sanctuaries
Cauvery North WLS 2014 504.33 Krishnagiri & Dharmapuri
Indira Gandhi (Annamalai) WLS 1976 841.49 Coimbatore
Mudumalai WLS 1942 217.76 Nilgiris
Sathyamangalam WLS 2008, 2011 1411.61 Erode Vellode Birds WLS 1997 0.77 Erode
Source: The notified protected areas by MoEF&CC as on 5th July 2017 from ENVIS Centre on Wildlife & Protected Areas website

Kochi Bengaluru Industrial Corridor –Draft Perspective Plan for overall KBIC region - Draft
232
Figure 143: Protected areas in KBIC districts
General Environmental Guidelines for Industries suggests that Industries shall be located at least 25.0 km away from ecologically and/or otherwise sensitive areas. If the Proposed IMC area is falling within 10.0 km of NPs/WLS, then National Board of Wild Life (NBWL) clearances shall be applicable. However, delineation/ approval of Ecologically Sensitive Zone (ESZ) around the NPs/WLS are almost completed for all the NPs/WLS and Gazetted. The requirements of the same shall be followed as appropriate.
7.8.2. Critically Polluted Areas as notified by the Central Pollution Control in KBIC
The Central Pollution Control Board (CPCB) has developed a Comprehensive Environmental Pollution Index (CEPI). CPCB has done a nation-wide environmental assessment of Industrial Clusters based on CEPI and 43 such industrial clusters having CEPI greater than 70, on a scale of 0 to 100, has been identified as critically polluted.
The data refers to the Comprehensive Environmental Pollution Index (CEPI) scores of the critically polluted industrial clusters/areas. The index captures the various dimensions of environment including air, water and land.
The overall CEPI is given in the alpha-numeric form stating the score along with the status of Air, Water and Land environment in terms of subscript as critical / severe/ normal. A sub-index score of more than 60 shows a critical level of pollution in the respective environmental component, whereas a score between 50 and 60 shows a severe level of pollution with reference to the respective environmental component.
It is observed that the critically Polluted areas such as Greater Cochin Industrial Cluster in Kerala and Coimbatore Industrial Cluster, tirppur, Erode and Mettur in Tamil Nadu are falling in KBIC districts. MoEF&CC has imposed the moratorium on New Industrial development in these industrial clusters in order to avoid the additional pollutions. updated CEPI scores for all 100 PIAs have been submitted by CPCB to MoEF&CC on 10.04.2019 submitted in the application No:1038/2018 to NGT.

Kochi Bengaluru Industrial Corridor –Draft Perspective Plan for overall KBIC region - Draft
233
Table 123: Details of Critically Pollution Areas in KBIC
State No. of Clusters in KBIC districts
Industrial Clusters/ Areas
Air water Land CEPI Status
Kerala 1 Cochin, Greater
47.38 35.88 29.50 52.94 An-Wn-Ln
Tamil Nadu
4 Coimbatore 47.25 53.75 45.25 63.64 An-Wn-Ln
Tiruppur 33.00 65.00 64.00 72.39 An-Wn-Lc
mettur 41.25 19.38 69.38 71.82 An-Wn-Lc Erode 34.13 47.00 52.75 60.33 An-Wn-Ls
Figure 144: Critically Polluted Areas (CPA) in KBIC districts
Though the moratorium has been lifted for both the sites, while identifying the land parcels for IMCs in this district shall consider the same.
7.8.3. Eco-Sensitive Areas as notified under the Environment (Protection) Act, 1986
There are Eight ESAs in the country notified under sub-section (2) of section 3 of the EPA, 1986 and No notified ESAs is observed KBIC. However, there is a proposed Western Ghats Eco-sensitive Area (Draft Notification dated February 28, 2017) which is falling in KBIC influenced districts. As per the draft notification, ESA covers Gujarat, Maharashtra, Goa, Karnataka, Kerala and Tamil Nadu States.
A High Level Working Group (HLWG) submitted a report dated 15th April 2013, identified and proposed ESA, which is approximately thirty-seven percent of the Western Ghats covering an area of 59,940sq.km. Ecological Sensitive area proposed in Kerala and Tamil Nadu in Draft notification is shown below.
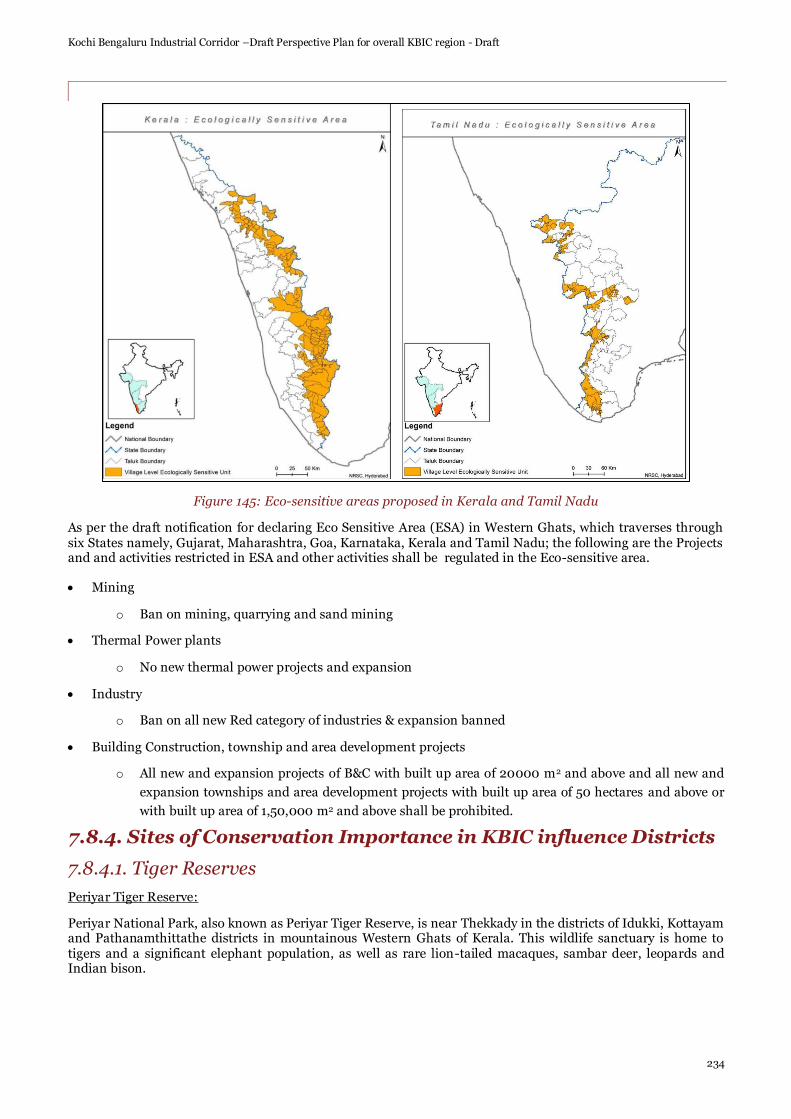
Kochi Bengaluru Industrial Corridor –Draft Perspective Plan for overall KBIC region - Draft
234
Figure 145: Eco-sensitive areas proposed in Kerala and Tamil Nadu
As per the draft notification for declaring Eco Sensitive Area (ESA) in Western Ghats, which traverses through six States namely, Gujarat, Maharashtra, Goa, Karnataka, Kerala and Tamil Nadu; the following are the Projects and and activities restricted in ESA and other activities shall be regulated in the Eco-sensitive area.
• Mining
o Ban on mining, quarrying and sand mining
• Thermal Power plants
o No new thermal power projects and expansion
• Industry
o Ban on all new Red category of industries & expansion banned
• Building Construction, township and area development projects
o All new and expansion projects of B&C with built up area of 20000 m2 and above and all new and
expansion townships and area development projects with built up area of 50 hectares and above or
with built up area of 1,50,000 m2 and above shall be prohibited.
7.8.4. Sites of Conservation Importance in KBIC influence Districts
7.8.4.1. Tiger Reserves
Periyar Tiger Reserve:
Periyar National Park, also known as Periyar Tiger Reserve, is near Thekkady in the districts of Idukki, Kottayam and Pathanamthittathe districts in mountainous Western Ghats of Kerala. This wildlife sanctuary is home to tigers and a significant elephant population, as well as rare lion-tailed macaques, sambar deer, leopards and Indian bison.

Kochi Bengaluru Industrial Corridor –Draft Perspective Plan for overall KBIC region - Draft
235
Figure 146: Periyar Tiger reserve
Parambikulam Tiger Reserve:
Parambikulam Tiger Reserve is a well-protected ecological portion in the Nelliampathy - Anamalai landscape of the Southern Western Ghats in India. It is located in the Palakkad District of Kerala.
Figure 147: Parambikulam Tiger reserve

Kochi Bengaluru Industrial Corridor –Draft Perspective Plan for overall KBIC region - Draft
236
Anamalai Tiger Reserve:
Anamalai Tiger Reserve, earlier known as Indira Gandhi Wildlife Sanctuary and National Park (IGWLS&NP) and previously as Anamalai Wildlife Sanctuary, is a protected area located in the Anaimalai Hills of Pollachi, Valparai and Udumalpet taluks of Coimbatore District and Tiruppur District, Tamil Nadu state, South India.
Figure 148: Anamalai Tiger reserve
Mudumalai Tiger Reserve:
The Mudumalai National Park and Wildlife Sanctuary also a declared tiger reserve, lies on the north-western side of the Nilgiri Hills (Blue Mountains), in Nilgiri District, about 150 kilometres (93 mi) north-west of Coimbatore city in Tamil Nadu. It shares its boundaries with the states of Karnataka and Kerala.
Figure 149: Mudumalai Tiger reserve

Kochi Bengaluru Industrial Corridor –Draft Perspective Plan for overall KBIC region - Draft
237
Sathyamangalam Tiger Reserve:
Sathyamangalam Tiger Reserve is located along the Western Ghats in the Erode District in Tamil Nadu.
7.8.4.2. Elephant Reserves
Table 124: List of Landscape and Elephant Reserves in India with 2005 Census Population
S. No.
Elephant Range Elephant Reserve
Date of Notification
State Total Area
(Sq.Km)
P.A. in ER
(Sq.Km)
Population
1 Brahmagiri-Nilgiri-Eastern Ghats Landscape (Karnataka-Kerala- Tamilnadu- Andhra)
Nilgiri ER 19.9.03 Tamil Nadu
4663 716 2862
Nilambur ER
2.4.02 Kerala 1419 90 281
Coimbatore ER
19.9.03 Tamil Nadu
566 482 329
2 Anamalai-Nelliampathy- High Range Landscape (Tamil Nadu-Kerala)
Anamalai ER 19.9.03 Tamil Nadu
1457 300 179
Anamudi ER 2.4.02 Kerala 3728 780 1726
3 Periyar-Agasthyamalai Landscape (Kerala-Tamilnadu)
Periyar ER 2.402 Kerala 3742 1058 1100
Source: ENVIS Centre on Wildlife & Protected Areas-Elephant Task Force Report of MoEF, August 2010
7.8.4.3. Biosphere Reserves in KBIC
Biosphere reserves are sites established by countries and recognized under UNESCO's Man and the Biosphere (MAB) Programme to promote sustainable development based on local community efforts and sound science. The programme of Biosphere Reserve was initiated by UNESCO in 1971. The purpose of the formation of the biosphere reserve is to conserve in-situ all forms of life, along with its support system, in its totality, so that it could serve as a referral system for monitoring and evaluating changes in natural ecosystems.
Presently, there are 18 notified biosphere reserves in India as on Dec, 2014 (Source: ENVIS Centre on Wildlife & Protected Areas). Out of which, one (01) biosphere reserve is falling under KBIC. The details of the biosphere reserve are given below.
Table 125: Biosphere reserve in KBIC
Name Date of Notification
Area (in km2) Location (State)
Nilgiri Biosphere reserve
01.09.1986 5520 (Core 1240 & Buffer 4280)
Part of Wayanad, Nagarhole, Bandipur and Mudumalai, Nilambur, Silent Valley and Siruvani hills (Tamil Nadu, Kerala and Karnataka)
7.8.4.4. RAMSAR Wetland Sites in KBIC
The RAMSAR Convention is an international treaty for the conservation and sustainable utilization of wetlands, recognizing the fundamental ecological functions of wetlands and their economic, cultural, scientific, and recreational value.

Kochi Bengaluru Industrial Corridor –Draft Perspective Plan for overall KBIC region - Draft
238
Presently, there are 26 notified RAMSAR wetlands in India (Source: ENVIS Centre on Wildlife & Protected Areas- Ministry of Environment & Forests, Government of India). Out of which, Vembanad Wetland is listed wetland under the RAMSAR Convention of Wetlands is falling in KBIC.
The geographical coordinates of the Vembanad wetland as per the RAMSAR list is 09000’ – 10040’ N Latitude and 76000’ – 77030’ E Longitude covering an area of approximately 151,250 ha (~373,587 acres). The general location of the wetland falls within the districts of Alappuzha, Kottayam, Ernakulam and Thrissur.
Vembanad Wetland, declared as Ramsar site on 19/08/02. The largest brackish, humid tropical wetland ecosystem on the south west coast of India, fed by 10 rivers and typical of large estuarine systems on the western coast, renowned for its clams and supporting the third largest waterfowl population in India during the winter months. Over 90 species of resident birds and 50 species of migratory birds are found in the Kol area. Flood protection for thickly populated coastal areas of three districts of Kerala is considered a major benefit. Kumarakam Bird Sanctuary is located around Vembanad Lake. Thaneermukkom salt barrier divides the lake in to two parts one with brackish water perennially and other with fresh water from rivers draining in to the lake. The wetland support diverse fauna, including a large variety of fish, prawns and clams, reptiles and birds and provides a habitat for both an adromous and catadromous fish species
Figure 150: Vembanad Wetland Map

Kochi Bengaluru Industrial Corridor –Draft Perspective Plan for overall KBIC region - Draft
239
7.8.5. Inter-State boundaries
KBIC involves two states covering 18 districts and the Land parcels identified for IMC site in Palakkad (Ozhalapathy and Pudussery land parcels) will close to Tamil Nadu state boundary, which can be seen below. The proposed IMC sites in the Kerala districts within 5.0/10.0 km to the state boundary if any shall be appraised for Environmental Clearance at MoEF&CC Level though it attracts Category B of EIA Notification 2006 which can be apprised at State level. However, requirement regarding distance of 5 km or 10 km, as the case may be, of the inter-State boundaries can be reduced or completely done away with by an agreement between the respective States sharing the common boundary in case the activity does not fall within 5 km or 10 km, as the case may be of the areas such as NPs/WLS, ESAs and CPAs.
Figure 151: KBIC Districts and Interstate Boundary

Kochi Bengaluru Industrial Corridor –Draft Perspective Plan for overall KBIC region - Draft
240
7.8.6. Others
7.8.6.1. Archaeological Monuments
Table 126: List of ASI monuments in KBIC
S. No. ASI Monuments in KBIC 1. Adiyamankottai Chennaraya Perumal Temple
2. Ariyannur Umbrellas
3. Attur Fort-1 4. Avittahur Sive Temple
5. Chemmanthitta Sive Temple
6. Chinnakavandanur Fort & Temples 7. Chowannur Burial Cave
8. Eyyal Burial Cave
9. Fort St.Angelo
10. Kadavallur Vishnu Temple 11. Kakkad Burial Caves
12. Kandanasserry Burial Cave
13. Kanyampundi Pandava Graves 14. Kattakkambal Burial Cave
15. Krishnagiri Hill Fort
16. Kudakkalparambu 17. Mandapakkadu
18. Mattancherry Palace
19. Mettupudur Jain Temple 20. Namakkal Hill
21. Namakkal Temples of Sri Narasimhaswami & Ranganathanswami
22. Netrimangalan Siva Temple 23. Palakkad Fort
24. Peruvanam Sive Temple
25. Rayakottai Hill Fort 26. Srikar Peria Palayam-Sugriverswara Temple & Tank
27. St.Francis Church
28. Tellicherry Fort 29. Thirprayar Sri Rama Temple
30. Tirumuruganpundi Muruganatha Temple
31. Tiruvanchikulam Siva Temple 32. Vadakkancherry Sive Temple, Pallimanah
33. Vadakkumnatha Temple
34. Vaigainallur Rock

Kochi Bengaluru Industrial Corridor –Draft Perspective Plan for overall KBIC region - Draft
241
Figure 152: ASI Monuments in KBIC
Source: NRSC-Bhuvan
As per the Ancient Monuments and Archaeological Sites and Remains (Amendment & Validation) Act, 2010, and Rules framed thereunder, persons having buildings or houses in the prohibited area (100 metres from protected monuments) of any Centrally -protected monument may undertake repairs and renovation after obtaining permission from the Competent Authority on the recommendation of the National Monuments Authority. Further, in case of regulated area (200 metres further beyond prohibited area) the persons may undertake construction, reconstruction, repairs and renovation only after obtaining permission from the competent authority on the recommendation of National Monuments Authority.
7.8.6.2. CRZ Areas
The coastal districts falling in the KBIC are given in the table below.
Table 127: Coastal districts in KBIC
S.No. Coastal districts in KBIC
1. Thrissur
2. Ernakulam 3. Malappuram
4. Alappuzha
5. Kozhikode 6. Kannur
From the above table, it is clear that none of the districts in Tamil Nadu falling under KBIC have coastline. Locating IMCs near Coastal areas, at least 1/2 km from High Tide Line and 100 m from tidal influenced water bodies as mentioned in Coastal Zone Management Plan (CZMP) shall be left. Only Permissible activities as per CRZ Notification 2011 shall be planned in the CRZ Area.

Kochi Bengaluru Industrial Corridor –Draft Perspective Plan for overall KBIC region - Draft
242
7.8.6.3. Airports
Kerala state has 3 operational International airports. The state will get another international airport in the year 2018 to become the only Indian state having 4 international airports along with Tamil Nadu. The IMCs which are to be planned in these areas or closer to the airports, the “Flying Funnel Restrictions” Shall be checked and accordingly the building heights shall be planned. Also the stacks/ Chimneys of the individual industries at IMCs proposed near Airports shall take necessary “No Objection Certificate (NoC) or clearances from Airports Authority of India (AAI).
Table 128: List of Airports in KBIC districts
S. No. Name of the Airport District Ownership Status
International
1. Cochin International Airport Kochi, Ernakulam, Kerala PPP Operational 2. Calicut International Airport Kozhikode, Kerala AAI Operational
3. Kannur International Airport Kannur, Kerala PPP Upcoming
4. Coimbatore International Airport Coimbatore, Tamil Nadu AAI Operational Domestic
5. Salem Airport Salem, Tamil Nadu AAI Operational
Military Airbases 6. INS Garuda Kochi, Ernakulam, Kerala Indian Navy Operational
7. Sulur Air Force Station Coimbatore, Tamil Nadu Indian Air Force Operational

Kochi Bengaluru Industrial Corridor –Draft Perspective Plan for overall KBIC region - Draft
243
7.9. Environmental Setting of IMC Sites
The Preliminary Environmental Assessment (PEA) is aimed to
• Assess the prevailing environmental/Social conditions
• Compilation of available/observed baseline environmental and social data to provide general
environmental/social setting of the project location
• Identify prevailing environmental/social issues, if any
• Suggest the extent of environmental study and clearances required
The EA will help towards the overall decision making processes for project planning in such a way so as to have minimal conflict with the environment. Basic idea is to minimize adverse environmental and social impacts with best possible engineering solutions at optimal cost to make development environmentally sound and sustainable.
7.9.1. Protected Areas
7.9.1.1. Palakkad – Thrissur Node
7.9.1.1.1. Palakkad District
The following three protected areas as notified under the Wild Life (Protection) Act, 1972 (53 of 1972) are falling in Palakkad district:
1. Silent Valley National Park (NP)
2. Choolannur Pea Fowl Wild Life Sanctuary (WLS)
3. Parambikulam Wild Life Sanctuary
The distances of these protected areas from the three (3) identified land parcels for IMCs in Palakkad District under KBIC are given in the table below.
Table 129: Distance (Km) and Directions of Protected areas from Palakkad IMCs
Name of the IMC Land Parcel - Palakkad
Silent Valley NP in Palakkad
Choolannur Pea Fowl WLS in Palakkad
Parambikulam WLS in Palakkad
Peechi- Vazhani WLS in Thrissur
Chimmony WLS in Thrissur
Puthussery 48 km, NW 32 km, WSW 30 km, S 46 km, SW 46 km, SW
Ozhalapathy 59 km, NW 44 km, W 27 km, SSW 55 km, SW 52 km, SW
Kannambra 53 km, N 13 km, N 22 km, SE 1 km, W 12 km, S

Kochi Bengaluru Industrial Corridor –Draft Perspective Plan for overall KBIC region - Draft
244
Figure 153: Protected areas and IMC sites in Palakkad District
From the table above, it is clearly shown that all the protected areas in Palakkad district are away from the identified land parcels except IMC site at Kannambra which is close to Peechi-Vazhani WLS (within 10.0 km) and falling outside ESZ which needs to obtain NBWL Clearance.
7.9.1.1.2. Thrissur District
The following two protected areas as notified under the Wild Life (Protection) Act, 1972 (53 of 1972) are falling in Thrissur District:
1. Chimmony Wild Life Sanctuary
2. Peechi-Vazhani Wild Life Sanctuary
Also there is a Choolannur Pea Fowl WLS (Palakkad) close to the proposed IMC site.
The distances of these protected areas from the one (1) identified land parcel for IMCs in Thrissur District under KBIC are given below. It is observed that, the identified land parcel in Thrissur district is not falling in10 km radius of any protected area.
Table 130: Distance (Km) and Directions of Protected areas from Thrissur IMC
Name of the IMC Land Parcel -
Thrissur
Choolannur Pea Fowl WLS
Peechi-Vazhani WLS Chimmony WLS
Desamangalam 25 km, ESE 14 km, SE 37 km, SE

Kochi Bengaluru Industrial Corridor –Draft Perspective Plan for overall KBIC region - Draft
245
Figure 154: Protected areas and IMC Land Parcels in Thrissur District
7.9.1.2. Kannur Node
The following two protected areas as notified under the Wild Life (Protection) Act, 1972 (53 of 1972) ae falling in Kannur Node:
1. Aralam Wild Life Sanctuary
2. Kottiyoor Wild Life Sanctuary
The distances of protected areas from the three (03) identified IMC land parcels in Kannur node under KBIC are presented below. It is observed that, none of the identified land parcels in Kannur node are falling under 10 km radius of notified protected areas.
Table 131: Distance (km) and Direction of protected areas from Kannur IMCs protected areas
Name of the IMC Land Parcel
Aralam WLS Kottiyoor WLS Malabar WLS (in Kozhikode district)
Pattannur 24km, E 38km, ESE 47 km, SE
Panayathamparambu 26km, E 38km, E 44km, SE
Mokeri 20km, NE 29 km, ENE 29km, SE

Kochi Bengaluru Industrial Corridor –Draft Perspective Plan for overall KBIC region - Draft
246
Figure 155: Protected areas and IMC Land Parcels in Kannur Node

Kochi Bengaluru Industrial Corridor –Draft Perspective Plan for overall KBIC region - Draft
247
7.9.1.3. Dharmapuri – Salem Node
The following protected areas as notified under the Wild Life (Protection) Act, 1972 (53 of 1972) are falling near Dharmapuri IMC Site.
1. Cauvery North Wild Life Sanctuary
2. Cauvery Wild Life Sanctuary
The distances of these protected areas from the identified land parcel for IMCs in Dharmapuri District under KBIC are given in table below. The protected areas along with IMC land parcels in Dharmapuri-Salem node are shown in figure below. It is observed that, the identified land parcel in Dharmapuri–Salem node is not falling in 10 km radius of any protected area.
Salem IMC site boundary is not yet finalised. The information regarding the protected areas will be explained in details after finalisation of boundary.
Figure 156: Protected areas and IMC site in Dharmapuri District
Table 132: Distance (km) and Direction of protected areas from Dharmapuri IMC site
Name of the IMC Land Parcel
Cauvery North WLS in Dharmapuri
Cauvery WLS in Karnataka
Dharmapuri 28.5 km, WNW 32.4 km, W

Kochi Bengaluru Industrial Corridor –Draft Perspective Plan for overall KBIC region - Draft
248
7.9.1.4. Coimbatore – Tiruppur Node
The following protected areas as notified under the Wild Life (Protection) Act, 1972 (53 of 1972) are falling near Tirupppur-Thathanur IMC Sites.
1. Biligiri Rangaswamy Temple Sanctuary
2. Mudumalai National Park
3. Bandipur National Park
4. Mukurthi National Park
5. Silent Valley National Park
The following protected areas as notified under the Wild Life (Protection) Act, 1972 (53 of 1972) are falling near Coimbatore IMC Sites.
6. Indira Gandhi (Annamalai) National Park
7. Parambikulam Wild Life Sanctuary
8. Chulannur Peafowl Wild Life Sanctuary
The distances of protected areas from the two (02) identified IMC land parcels in Coimbatore – Tiruppur node under KBIC are presented in Error! Reference source not found.. The protected areas along with IMC land parcels in Coimbatore – Tiruppur node are shown in figures below, and . It is observed that, none of the identified land parcels in Coimbatore – Tiruppur node are falling under 10 km radius of notified protected areas.
Table 133: Distance (km) and Direction of protected areas from Tiruppur IMC site
Name of the IMC Land
Parcel - Tiruppur
Silent Valley NP in
Palakkad
Mukurthi NP in Karnataka
Mudumalai WLS in
Karnataka
BRT WLS in Karnatka
Bandipur National Park in
Karnataka
Thathanur 87 km, WSW 77 km, WSW 64 km, NW 48.7km,NNW 55 km, NW Table 134: Distance (km) and Direction of protected areas from Coimbatore IMC sites
Name of the IMC Land Parcel –
Coimbatore- Salem Node
Indira Gandhi (Annamalai) NP in
Coimbatore
Parambikulam WLS in Palakkad
Choolannur Pea Fowl WLS in
Palakkad
Dynamatics 45 km, SSW 55 km,SW 78 km, WSW
Tancem-1 21 km, SSW 38 km, SW -
Tancem-2 13.2 km, SSW 35 km, WSW -

Kochi Bengaluru Industrial Corridor –Draft Perspective Plan for overall KBIC region - Draft
249
Figure 157: Protected areas and Dynamatic IMC site in Coimbatore

Kochi Bengaluru Industrial Corridor –Draft Perspective Plan for overall KBIC region - Draft
250
Figure 158: Protected areas and TANCEM - 1 IMC site in Coimbatore
Figure 159: Protected areas and TANCEM - 2 IMC site in Coimbatore
7.9.1.5. Erode Node
The following protected areas as notified under the Wild Life (Protection) Act, 1972 (53 of 1972) are falling near Varapalayam IMC Sites.
1. Mudumalai National Park
2. Bandipur National Park
3. Mukurthi National Park
4. Silent Valley National Park
5. Indira Gandhi (Annamalai) National Park
6. Vellode Bird Sanctuary
The distances of protected areas from the identified IMC land parcel in Erode node under KBIC are presented in table below. The protected areas along with IMC land parcels in Erode node are shown in figure below. It is observed that, none of the identified land parcels in Erode node are falling under 10 km radius of notified protected areas.
Table 135: Distance (km) and Direction of protected areas from Erode IMC site
Name of the IMC
Land Parcel - Erode
Vellode Bird
Sanctuary in Erode
Silent Valley NP
in Palakkad
Mukurthi NP in
Karnataka
Mudumalai WLS in
Karnataka
Indira Gandhi
(Annamalai) National
Park
Bandipur National Park in
Karnataka
Varapalayam 12.7 km, NE 114 km, WSW
105 km, WNW 95 km, NW 89km,SSW 85 km, NW

Kochi Bengaluru Industrial Corridor –Draft Perspective Plan for overall KBIC region - Draft
251
Figure 160: Protected areas and Varapalayam site in Erode

Kochi Bengaluru Industrial Corridor –Draft Perspective Plan for overall KBIC region - Draft
252
7.9.2. Proposed Eco-Sensitive Areas
No notified ESAs are falling within KBIC influenced districts.
7.9.2.1. Palakkad District
In Palakkad district, 14 villages are falling under proposed ESA. Those villages are Kizhakkencheri-I, Muthalamada-I, Muthalamada-II, Nelliyampathy, Pudur, padavayal, Agali, Kottathara, Kallimala, sholayur, Palakkayam, Puthuppariyaram-I, Malampuzha-I, Puthussery East.
The proposed ESA villages in Palakkad district are shown below. It is observed that none of the identified land parcels in Palakkad are falling in proposed ESA. But the land parcel at Puthussery is just abutting th e proposed ESA, as the notification is in draft stage, the boundaries of ESA may change and the boundary of Puthussery land parcel may fall in ESA. In that case, this parcel may need to get necessary approval from competent authority after finalisation of draft notification and IMC site boundaries.
Figure 161: Proposed Ecological Sensitive Area (ESA) in Palakkad District
7.9.2.2. Thrissur district
In Thrissur district, only Pariyaram village is falling under proposed ESA villages. The proposed ESA village in Thrissur district is shown below. From this, it is observed that the identified land parcel near Desamangalam is not falling in proposed ESA.

Kochi Bengaluru Industrial Corridor –Draft Perspective Plan for overall KBIC region - Draft
253
Figure 162: Proposed Ecological Sensitive Area (ESA) in Thrissur District
7.9.2.3. Kannur Node
In Kannur node, 3 villages are falling under proposed ESA villages. Those villages are Aralam, Kottiyoor and Cheruvanchery.
The proposed ESA villages in Kannur are shown below. From this, it is observed that one identified land parcel near Mokeri is falling in proposed ESA village. So this parcel may need to get necessary approval from competent authority after finalisation of draft notification and IMC land parcel extent.
Figure 163: Proposed Ecological Sensitive Area (ESA) in Kannur Node

Kochi Bengaluru Industrial Corridor –Draft Perspective Plan for overall KBIC region - Draft
254
7.9.2.4. Dharmapuri-Salem Node
In Dharmapuri and Salem districts, no villages are falling under proposed ESA.
7.9.2.5. Coimbatore-Tiruppur Node
In Coimbatore district, 6 villages are falling under proposed ESA. Those villages are Anaikatti (North), Anaikatti (South), Veerapandi, Boluvampatti (Block I), Boluvampatti (Block II), Valparai (TP).
7.9.2.6. Erode Node
Varapalayam site in Erode district is not falling under proposed ESA.
Following map shows the IMC sites on proposed Ecological Sensitive Area in Tamilnadu.
Figure 164: Proposed Ecological Sensitive Area (ESA) in Tamil Nadu

Kochi Bengaluru Industrial Corridor –Draft Perspective Plan for overall KBIC region - Draft
255
7.9.3. Palakkad District - Other Features
7.9.3.1. Land use Land cover
The Land Use Land Cover (LULC) maps for the Puthussery, Ozhalapathy and Kannambra land parcels in Palakkad were prepared using NRSC-Bhuvan imagery for 1:50000 scale and are shown in figures below.
From the LULC maps provided, it is clear that land parcels are mostly classified as Agricultural crop/ Agricultural plantation land and Barren/uncultivable/wastelands, scrub land. As per the LULC map, forest land is partly falling inside and abutting the boundary in north for Puthussery land parcel.
Figure 165: LULC map for Puthussery land Parcel
Figure 166: LULC map for Ozhalapathy land parcel

Kochi Bengaluru Industrial Corridor –Draft Perspective Plan for overall KBIC region - Draft
256
Figure 167: LULC map for Kannambra land parcel
Source: NRSC-Bhuvan
7.9.3.2. Forest Areas
The forest area map for Palakkad district is shown below, which includes protected areas as well as reserved forests. From the figure, it is clear that none of the identified land parcels are falling under forest area.
Also the land parcels are superimposed on SoI toposheets for examining whether any reserve forests and settlements are falling within the identified land parcels.
Figure 168: Forest area in Palakkad
Source: NRSC-Bhuvan

Kochi Bengaluru Industrial Corridor –Draft Perspective Plan for overall KBIC region - Draft
257
Figure 169: Puthussery land parcel on SoI Toposheet
Source: Survey of India
Figure 170: Ozhalapathy land parcel on SoI Toposheet
Source: Survey of India
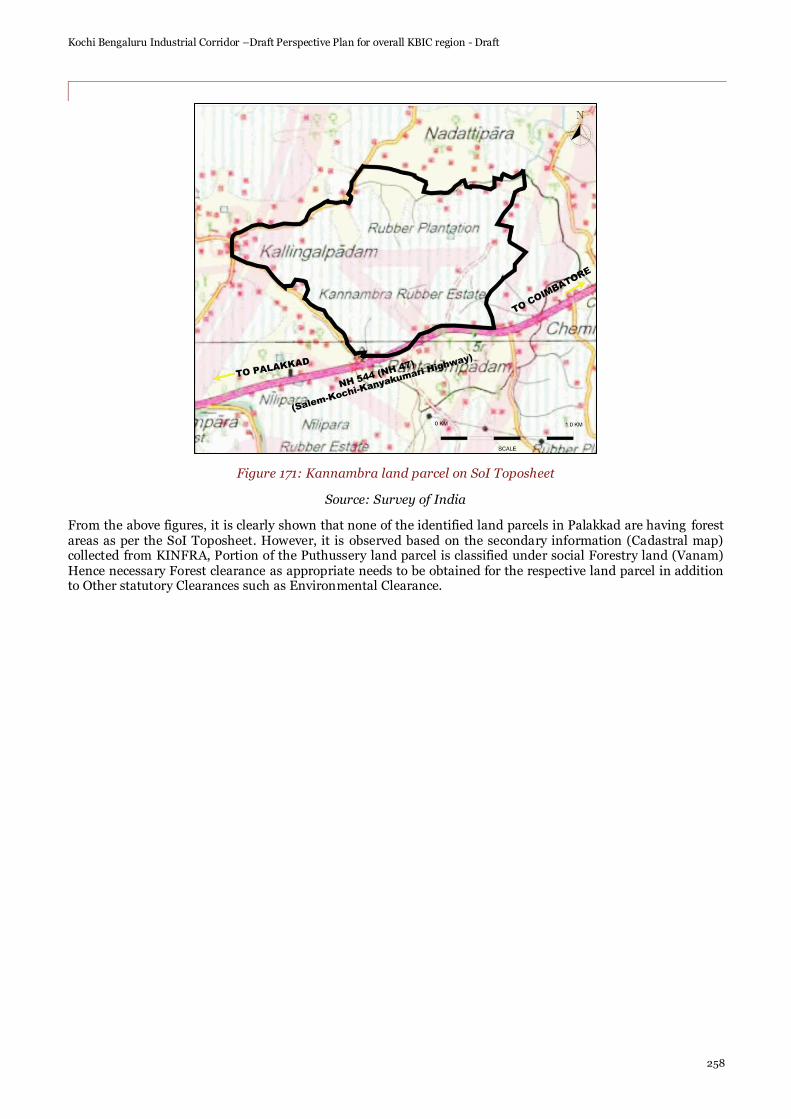
Kochi Bengaluru Industrial Corridor –Draft Perspective Plan for overall KBIC region - Draft
258
Figure 171: Kannambra land parcel on SoI Toposheet
Source: Survey of India
From the above figures, it is clearly shown that none of the identified land parcels in Palakkad are having forest areas as per the SoI Toposheet. However, it is observed based on the secondary information (Cadastral map) collected from KINFRA, Portion of the Puthussery land parcel is classified under social Forestry land (Vanam) Hence necessary Forest clearance as appropriate needs to be obtained for the respective land parcel in addition to Other statutory Clearances such as Environmental Clearance.

Kochi Bengaluru Industrial Corridor –Draft Perspective Plan for overall KBIC region - Draft
259
7.9.3.3. Water bodies
Drainage/Water bodies map for the Palakkad - Thrissur IMC land parcels are shown in figures below.
Form the figures, it can be observed that Puthussery, Ozhalapathy and Kannambra land parcels have some water bodies and drains within the site. So the development shall be carried out in such a way to ensure that existing drainage pattern of the region is not affected by providing surface drainage systems including storm water network, etc.
Figure 172: Waterbodies in Puthussery site
Source: NRSC-Bhuvan
Figure 173: Waterbodies in Ozhalapathy site
Source: NRSC-Bhuvan

Kochi Bengaluru Industrial Corridor –Draft Perspective Plan for overall KBIC region - Draft
260
Figure 174: Waterbodies in Kannambra site
Source: NRSC-Bhuvan
7.9.3.4. ASI Monuments
ASI Monuments in Palakkad are shown below.
Figure 175: ASI monuments in Palakkad
Source: NRSC-Bhuvan

Kochi Bengaluru Industrial Corridor –Draft Perspective Plan for overall KBIC region - Draft
261
7.9.3.5. Flood and Drought Prone Areas
The maps showing the flood prone areas, drought prone areas in Palakkad are shown below.
Figure 176: Flood prone areas in Palakkad
Source: NRSC-Bhuvan
It is observed that, Puthussery land parcel in falling in Flood prone area whereas Ozhalapathy and Kannambra parcels are partly falling/just abutting the flood prone areas.
Figure 177: Drought prone areas in Palakkad
Source: NRSC-Bhuvan
1
2
3
123

Kochi Bengaluru Industrial Corridor –Draft Perspective Plan for overall KBIC region - Draft
262
It is observed that all the identified land parcels in Palakkad are falling in Moderate drought area.
Similar exercise and analysis for sites in Thrissur land parcel and Kannur node will be carried out once the site boundaries are finalized.

Kochi Bengaluru Industrial Corridor –Draft Perspective Plan for overall KBIC region - Draft
263
7.9.4. Aspects may be considered while locating IMCs in other KBIC Influenced Districts
Based on General Environmental Siting Guidelines, following points shall be checked while locating IMC sites in other KBIC influenced districts than discussed in Palakkad/Thrissur and Kannur Districts.
• Ecologically and/or otherwise sensitive areas are at least 25 km away from the IMC sites. If IMC site falling
within 10.0 km from the protected areas, necessary NBWL clearance shall be taken. Also it shall be ensured
that IMCs are not falling in the declared/proposed ESZs of protected areas. Only permitted activities are to
be planned if it is falling within ESZ as per the prevailing guidelines
• IMCs not to be located in the declared Critically Polluted Areas as notified by the Central Pollution Control.
• IMCs not to be located Eco Sensitive Areas as notified under sub-section (2) of section 3 of the Environment
(Protection) Act, 1986. Only permitted activities are to be planned if it is falling within ESA as per the
prevailing guidelines
• IMCs planned near the inter-state boundaries shall obtain necessary clearances from relevant authority.
• Others
o Archaeological Monuments – Sufficient buffer shall be provided
o Reserve Forest Areas - Shall be avoided to the extent Possible. Necessary Forest Clearances shall be taken
if the forest land is involved.
o Coastal areas: at least 1/2 km from High Tide Line and 100 m from tidal influenced water bodies as
mentioned in Coastal Zone Management Plan (CZMP). Only Permissible activities as per CRZ
Notification 2011 shall be planned in the CRZ Area.
o Flood prone and drought prone areas- Flood Plain of the Riverine Systems: at least 1/2 km from flood
plain or this distance can be revisited based on the region and based on the scientific studies.
o Major settlements (300,000 population): at least 25 km from the project boundary of the settlement. Or
IMC can be located within 25.0 km radius based on the Impact Assessment Studies.
o Water sourcing from Scarce GW resources shall be avoided.
7.9.5. Way Forward
The environmental sensitivity of the KBIC and its influenced districts as well as proposed IMC sites at Palakkad, Thrissur and Kannur is studied and the summary of the same is provided below.
• Selection of New IMC site shall be reviewed based on siting guidelines and for nearness to all Protected area,
ESAs, CPAs, Forest area, Interstate boundaries etc., Appropriate Statutory clearances such as NBWL, Forest,
Environmental and CRZ, ESA and Wetland if required shall be taken.
• Based on the Preliminary Environmental Assessment, for the proposed IMCs (Puthussery, Ozhalapathy and
Kannambra) at Palakkad, it is observed that Kannambra attracts NBWL Clearance and Puthussery attracts
Forest clearance in addition to Environmental Clearances.
• IMCs proposed at Thrissur and Kannur node shall obtain Environmental Clearances.
• IMC proposed at Mokeri in Kannur is falling in the proposed ESA (Western Ghats) and hence necessary
clearances shall be obtained and in that area only permitted activities shall be planned.
• Environmental Impact Assessment Studies shall be initiated for the proposed IMCs and the above
observations shall be verified based on the finalised land extent and necessary clearances as appropriate shall
be obtained.

Kochi Bengaluru Industrial Corridor –Draft Perspective Plan for overall KBIC region - Draft
264
Table 136: Summary – EIA notification and its application for IMC sites
S. No
Name of the IMC Site
Area (Acres/Ha)
Sectors Proposed
Category as per EIA Notification 2006 (as
amended)
Applicability General
Conditions as per EIA
Notification 2006
I Palakkad District
1.
Puthussery 600/242.81
Manufacturing - • Grain mills;
Processed food manufacturing
• Rubber and plastics; Precision engineering (electronics, electrical and machinery)
Services - • R&D -
Electronics, Auto, Agriculture; Jewellery designing; Fashion designing; Logistics
Category B (EC from SEIAA, KL) Industrial Estate of area below 500 ha. and not housing any industry of category A or B does not require clearance. However, If the area is less than 500 ha. But contains building and construction projects > 20000 sq. mtr. and or development area more than 50 ha it will be treated as activity listed at serial no. 8(a) or 8(b) in the Schedule, as the case may be. In this case of Puthusserry IMC site, proposed Sectors are not attracting any Category A or B of EIA Notification and hence, this shall be considered under 8(b) as it may covering an area of 50 Ha and or built up area > 1,50,000 SQM.
For 8(a) and 8(b) General Conditions are not applicable (i.e., project falling within 10.0 km of protected areas (WLS/NPS etc.,), ESAs, State Boundary and CPAs shall be treated as Cat. A projects)
2.
Ozhalapathy 250/101.17
Category B (EC from SEIAA, KL) Industrial Estate of area below 500 ha. and not housing any industry of category A or B does not require clearance. However, If the area is less than 500 ha. But contains building and construction projects > 20000 sq. mtr. and or development area than 50 ha it will be treated as activity listed at serial no. 8(a) or 8(b) in the Schedule, as the case may be. In this case of Ozhalapathy IMC site, proposed Sectors are not attracting any Category A or B of EIA Notification and hence, this shall be considered under 8(b) as it may covering an area of 50 Ha and or built up area > 1,50,000 SQM.
For 8(a) and 8(b) General Conditions are not applicable (i.e., project falling within 10.0 km of protected areas (WLS/NPS etc.,), ESAs, State Boundary and CPAs shall be treated as Cat. A projects)

Kochi Bengaluru Industrial Corridor –Draft Perspective Plan for overall KBIC region - Draft
265
S. No
Name of the IMC Site
Area (Acres/Ha)
Sectors Proposed
Category as per EIA Notification 2006 (as
amended)
Applicability General
Conditions as per EIA
Notification 2006
3.
Kannambra 470/190.20
Category B (EC from SEIAA, KL) Industrial Estate of area below 500 ha. and not housing any industry of category A or B does not require clearance. However, If the area is less than 500 ha. But contains building and construction projects > 20000 sq. mtr. and or development area than 50 ha it will be treated as activity listed at serial no. 8(a) or 8(b) in the Schedule, as the case may be. In this case of Kannambra IMC site, proposed Sectors are not attracting any Category A or B of EIA Notification and hence, this shall be considered under 8(b) as it may covering an area of 50 Ha and or built up area > 1,50,000 SQM.
For 8(a) and 8(b) General Conditions are not applicable (i.e., project falling within 10.0 km of protected areas (WLS/NPS etc.,), ESAs, State Boundary and CPAs shall be treated as Cat. A projects)
II Thrissur District
1. Desamangalam 200/80.93 ha
Category B (EC from SEIAA, KL) Industrial Estate of area below 500 ha. and not housing any industry of category A or B does not require clearance. However, If the area is less than 500 ha. But contains building and construction projects > 20000 sq. mtr. and or development area than 50 ha it will be treated as activity listed at serial no. 8(a) or 8(b) in the Schedule, as the case may be. In this case of Desamangalam IMC site, proposed Sectors are not attracting any Category A or B of EIA Notification and hence, this shall be considered under 8(b) as it may covering an area of 50 Ha and or built up area > 1,50,000 SQM.
For 8(a) and 8(b) General Conditions are not applicable (i.e., project falling within 10.0 km of protected areas (WLS/NPS etc.,), ESAs, State Boundary and CPAs shall be treated as Cat. A projects)

Kochi Bengaluru Industrial Corridor –Draft Perspective Plan for overall KBIC region - Draft
266
8. Skill development
Developing a pool of skilled workers that can be retained at priority IMCs would support the growth of identified value-added and high-tech industries and services. Strategically leveraging the state-funded and centrally-funded schemes and programs will be crucial in building the skills level of potential workers in the corridor. It will be important to develop a program which supports the skill needs of KBIC from the perspectives of infrastructure development, the policy framework, as well as administration and governance.
Kerala is the most literate state in India with overall literacy of around 94%. Kottayam is the most literate districts in Kerala with 97.2% literacy while, Wayanad is the least literate district of the state with literacy of 89% which is more than Indian average literacy rate of around 74%. Kerala has performed very well on education levels as well especially on education level of women. Only in number of male graduates, Kerala is only slightly higher than the national average. However, female graduates in Kerala is 70% more than the national average. Following table shows comparison of education level in Kerala and India:
Table 137: Education Level in Kerala vis-à-vis India
Education Level (per 1000, 15 years and above) Kerala India
Male Female Total Male Female Total
Illiterate 33 86 61 214 423 317
Literate up to Middle School 545 509 526 422 346 385
Secondary and Higher Secondary School 277 271 274 259 169 215
Diploma / Certificate 53 36 44 15 6 11
Graduate and above 92 97 95 90 56 73
Source: NSS Report 551 – Status of Educational and Vocational Training in India
In Kerala, Industrial Training Department is responsible for providing vocational and apprenticeship training in the State. In order to achieve the objectives related to vocational and apprenticeship training, the department runs various long and short term training programs in Industrial Training Institutes (ITIs) / Centers in the State. There other agencies as well in the State which are responsible for skill development in Kerala. This chapter will discuss skill development framework in the state of Kerala.
8.1. Skill infrastructure
8.1.1. Kerala
8.1.1.1. Vocational Training Infrastructure in Kerala
Industrial Training Institutes (ITIs), Industrial Training Centers (ITCs), and Polytechnic colleges are primary institutions responsible for skill development in the State. As per NSIDC Skill Gap Report, Kerala has 612 ITI/ ITCs with the government ITIs comprising 12.41% of the total. Thiruvananthapuram (73) has the maximum number of ITI/ITCs while Wayanad (7) has the lowest number of ITI/ITCs in the state. Except the districts of Kasaragod (12), Idukki (12) and Wayanad (7), all the districts have more than 35 ITIs. Also, there are 250 registered Vocational Training Providers (VTPs) in the state, 70 VTPs estimated to be functional. S B Global is the first private training institution based in Kerala to be approved by NSDC as a Skill Development Partner, with centers at Kochi, Kottayam, Thrissur and Kannur. Other NSDC partners with operations in Kerala include Future Sharp, IIJT and Talent Sprint. Following table shows number of training institutes and their sanctioned intakes in Kerala:
Table 138: Number of Institutes and their sanctioned intakes
Program Number of Institutes Sanctioned Intake
ITI/ITCs 612 ~67,000

Kochi Bengaluru Industrial Corridor –Draft Perspective Plan for overall KBIC region - Draft
267
Polytechnic 59 ~10,500
Source: NSDC - Skill Gap Report 2012
Alappuzha is the only district in the state which has intake capacity of more than 300 per lakh people for vocational training. While, districts including Wayanad, Idukki, and Kasargod have intake capacity of less than 100 per lakh people for vocational training. Southern districts of Thiruvananthapuram, Kollam, Pathanamthitta, Kottayam, and Ernakulum have intake capacity between 200 and 300 per lakh people. Other central and norther districts of Thrissur, Palakkad, Malappuram, Kozhikode, and Kannur have intake capacity between 100 and 200 per lakh people. Following figure shows district wise vocational training intake capacity in Kerala:
Figure 178: Kerala – Vocational Training Annual Intake Capacity (per lakh population)
Source: NSDC - Skill Gap Report 2012
There are various private providers in Kerala who provide vocational training in the State. Following table shows private players providing vocational training in the state:
Table 139: Vocational Training in Kerala
District Major Private Providers
Thiruvananthapuram Bishop Peter Pereira Memorial ITC, N I Institute of Engineering, M P Industrial Training Centre, Bishop Vincent Dercele Memorial ITC

Kochi Bengaluru Industrial Corridor –Draft Perspective Plan for overall KBIC region - Draft
268
District Major Private Providers
Kollam Malik Dhinar ITC, Sivarajapillai Memorial ITC, Marthoma ITC, Mata Amritandamayi Mission Trust
Pathanamthitta Michael Mar Dionysious Memorial ITC, Mezhuveli Pan ITC, Mar Phelizenos ITC, Mannam Centenary Memorial ITC
Alappuzha Pius X, Bharat Institute, Hindustan Inst.of Computer Tech., Sobha ITC
Kottayam Madonna Institute of Electronics Engg. & ITC, Mary Matha ITC, Mathews Mar Ivanios ITC, Leejoy ITC
Idukki CSI ITC, Guru ITC, Mar Gragorious Memorial ITC, KSDS ITC
Ernakulum Social Welfare Technical, Little Flower Engineering, Kuriakose Chavara Memorial ITC, Balanagar Technical Institute, Skiltek
Thrissur Thozhil Abhasana Peedam ITC, Good Sheperds ITC, College of Technology ITC, Victory ITC
Palakkad Parakkotti Krishnam Memorial ITC, St. Mary ITC, Mount Seena ITC
Malappuram Valvannur Bafukhy Yetheem Khana ITC, M D P Sangham ITC, Hamad ITC, Madin ITC, Ideal ITC
Kozhikode J D T Islam ITC, Markaz ITC, Indus Data System ITC, MHES ITC, Salafi College of Engineering ITC
Wayanad Eldorado ITC, Athanasian Institute, Mar Athanosios ITC
Kannur Sree Narayana, Nirmala, Universal ITC, BhagavadPada ITC
Kasaragod SA-Adiya ITC, Aliya ITC
Source: DGET Website
8.1.1.2. Higher Education Infrastructure in Kerala
As per the All India Survey of Higher Education 2017-18, Kerala has a Gross Enrolment Ratio (GER) of 36.2. The GER for females (40.4) is significantly higher than GER for males (32). Kerala has a total of 14 universities, of which 5 universities offer courses in various fields while APJ Abdul Kalam Technological University, Sree Sankaracharya University of Sanskrit, Cochin University of Science and Technology, Kerala University of Fisheries and Ocean Studies, Kerala Veterinary and Animal Sciences University, Kerala University of Health Sciences, National University of Advanced Legal Studies (NUALS), Thunchath Ezhuthachan Malayalam University and Kerala Agricultural University offer specialized courses. Kerala also has leading institutions including IIM Kozhikode, NIT Kozhikode, and IIT Palakkad for management and technical studies. Out of the 14 universities, 13 universities are state universities and one university is a central university.
There are several centre of excellence in the state as well including, Technopark, VikramSarabhai Space Centre, Rajiv Gandhi Centre for Biotechnology, IISER, Cyberpark, IIM Kozhikode, NIT Kozhikode, Cochin University of Science and Technology (CUSAT).
As per AICTE, Kerala has 254 AICTE approved Engineering colleges, 84 AICTE approved colleges, and 51 AICTE approved MCA colleges. Also, Kerala houses 80 colleges for medicine and related studies. Following table contains details of higher education in Kerala.
Table 140: Higher Education in Kerala
Educational Infrastructure Number of Institutes
Engineering / Technology 254
Agriculture 5
Medicine (Including Ayurveda, Homeopathy) 80

Kochi Bengaluru Industrial Corridor –Draft Perspective Plan for overall KBIC region - Draft
269
B. Pharma 44
Law 24
Management 84
MCA 51
Source: AICTE for Engineering / Technology, Management, and MCA; CEE Website for Medicine, B. Pharma, Law, Agriculture
Following table summarizes the district wise details of engineering colleges in Kerala
Table 141: Details of engineering colleges in Kerala
District Total number of colleges Sanctioned Intake
Thiruvananthapuram 28 8,883
Kollam 19 5,560
Pathanamthitta 8 2,520
Alappuzha 12 3,930
Kottayam 11 4,385
Idukki 2 1,660
Ernakulum 32 12,515
Thrissur 21 7,410
Palakkad 11 3,740
Malappuram 11 2,949
Kozhikode 10 2,500
Wayanad 2 340
Kannur 7 2,334
Kasaragod 5 1,650
Total 183 60,376
Source: Kerala Economic Review 2016

Kochi Bengaluru Industrial Corridor –Draft Perspective Plan for overall KBIC region - Draft
270
8.1.2. Tamil Nadu
A snapshot of existing physical infrastructure for skill development in the state is presented below. Along with government-operated infrastructure, there are multiple vocational and skill training institutes operated in the state by non-profit organizations and the private sector.
Table 142: Skill development infrastructure in Tamil Nadu
Department Skill infrastructure Enrollment capacity
Department of Employment and Training
719 ITIs (including 658 private ITIs)
91,600
Directorate of Technical Education
464 polytechnics 72,000
Department of Collegiate Education
1,464 (government aided and self-funded colleges) (343 colleges assessed and accredited by NAAC)
>200,00
SDCs–Tamil Nadu Skill Development Corporation
50 skill development centers ~18,000
NSDC-operated training centers and NSDC partner operated training centers
137 (including 109 fixed centers) 308 (including 237 fixed centers)
56,000
Total ~420,000
ITI = Industrial Training Institutes, NAAC = National Assessment and Accreditation Council, NSDC = National Skill Development Corporation.
Source: Directorate General of Training, Ministry of Skill Development and Entrepreneurship, Government of India; TNSDC; Directorate of Technical Education, GoTN; National Skill Development Corporation; Department of Employment and Training, GoTN; Department of Collegiate Education, GoTN.

Kochi Bengaluru Industrial Corridor –Draft Perspective Plan for overall KBIC region - Draft
271
8.2. Skill Gap Assessment
8.2.1. Kerala
As per Skill Gap Assessment for the State of Kerala conducted by the NSDC in 2012, more than one million (total of 1,908,000) manpower is required across various sectors between 2017 and 2022. There is a requirement of 663,000 skilled, 725,000 semi-skilled, and 520,000 minimally skilled manpower between 2017 and 2022. Majority of the demand is expected to come from BFSI, Building and Construction, and communication. In terms of skilled labors, BFSI and Education / skill development have maximum requirement. Whereas, building and construction will have maximum demand for minimally skilled labors. Approximately, 282,000 workforce is expected to exit agriculture and allied activities between 2017 and 2022. This workforce will also act as major supply of talent in other sectors. Largest demand of man power in the 5 years will come for semi-skilled segment.
The incremental manpower demand in priority manufacturing sectors across Kerala are presented in following table:
Table 143: Incremental Manpower Demand for Key Sectors across Kerala (‘00)
Key Sector 2017 – 2022
Skilled Semi-Skilled Minimally Skilled
Food processing/ Cold Chain/ Refrigeration
25 75 150
Engineering Units 34 103 34
Manufacture of Rubber and Plastics 19 44 63
Other Manufacturing (Ayurveda, Other Electrical Machinery and Transport, glass and ceramics etc.)
8 17 17
Incremental Demand in overall Manufacturing
204 543 396
Source: NSDC - Skill Gap Report 2012
Following table shows estimated incremental skill gap in Kerala from 2018 to 2022:
Table 144: Estimated Incremental Skill Gap in Kerala from 2018 to 2022 (in lakh)
Skill Segment Incremental Human Resource Requirement
Incremental Human Resource Available
Demand Supply Gap of Human Resource
Skilled 6.63 4.48 2.15
Semi-skilled 7.25 5.64 1.61
Minimally skilled 5.19 4.74 0.45
Source: NSDC - Skill Gap Report 2012
Between 2018 and 2022, there is a gap of 4.21 lakh manpower amongst skilled, semi-skilled, and minimally skilled labors in Kerala. Total incremental demand in the state between the stated periods is 19.07 lakh resources while only 14.86 human resource will be available which will lead to demand supply gap of 4.21 lakh human resources in the State.

Kochi Bengaluru Industrial Corridor –Draft Perspective Plan for overall KBIC region - Draft
272
8.2.2. Tamil Nadu
Sector wise skill gap in Tamil Nadu is summarized below
Table 145: Sector wise skill gap in Tamil Nadu 2017-2021 (‘000)
Sectors Skill gap
Food Processing 108
Textiles /Apparel 386
Electronics & Hardware 14
Overall manufacturing 949
Source: NSDA – Skill Development Ecosystem, Tamil Nadu
8.3. Way Forward
The existing skill development infrastructure caters to various sectors and trades and thus may experience a capacity shortage in providing a skilled workforce for manufacturing and services in the corridor. It will be important to align this infrastructure with the NSQF and the priority sectors of the corridor. In order to bridge the capacity shortfall of skilling infrastructure in terms of physical infrastructure and workforce quality, the following strategies may be adopted:
• developing incubation centers within the key industrial estates of KBIC and leverage partnerships with existing tenants;
• inviting industries beyond PPP models to operate courses and provide trainings to ITIs and invest and leverage the ITI infrastructure for training the existing staff;
• upgrading select government ITIs in key districts that can emerge as nodes for “Training of Trainers” across the state integrated with centers excellence;
• implementing a modern Labor Market Information System that provides a real-time view of demand-and-supply indicators such as job opportunities, skilled candidates, trainers, and training centers under the NSQF model;
• adding centers of excellence in various industrial training institutes (ITIs) in accordance with the NSQF, with a focus on KBIC sectors;
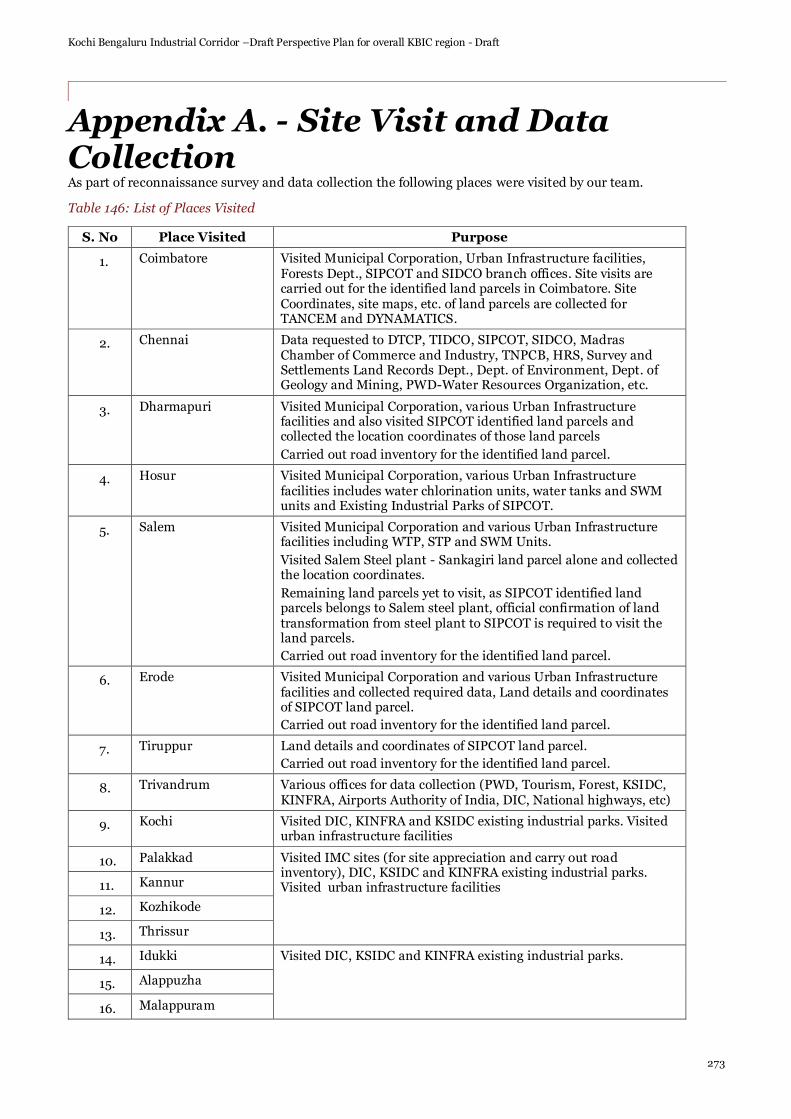
Kochi Bengaluru Industrial Corridor –Draft Perspective Plan for overall KBIC region - Draft
273
Appendix A. - Site Visit and Data Collection As part of reconnaissance survey and data collection the following places were visited by our team.
Table 146: List of Places Visited
S. No Place Visited Purpose
1. Coimbatore Visited Municipal Corporation, Urban Infrastructure facilities, Forests Dept., SIPCOT and SIDCO branch offices. Site visits are carried out for the identified land parcels in Coimbatore. Site Coordinates, site maps, etc. of land parcels are collected for TANCEM and DYNAMATICS.
2. Chennai Data requested to DTCP, TIDCO, SIPCOT, SIDCO, Madras Chamber of Commerce and Industry, TNPCB, HRS, Survey and Settlements Land Records Dept., Dept. of Environment, Dept. of Geology and Mining, PWD-Water Resources Organization, etc.
3. Dharmapuri Visited Municipal Corporation, various Urban Infrastructure facilities and also visited SIPCOT identified land parcels and collected the location coordinates of those land parcels
Carried out road inventory for the identified land parcel.
4. Hosur Visited Municipal Corporation, various Urban Infrastructure facilities includes water chlorination units, water tanks and SWM units and Existing Industrial Parks of SIPCOT.
5. Salem Visited Municipal Corporation and various Urban Infrastructure facilities including WTP, STP and SWM Units.
Visited Salem Steel plant - Sankagiri land parcel alone and collected the location coordinates.
Remaining land parcels yet to visit, as SIPCOT identified land parcels belongs to Salem steel plant, official confirmation of land transformation from steel plant to SIPCOT is required to visit the land parcels.
Carried out road inventory for the identified land parcel.
6. Erode Visited Municipal Corporation and various Urban Infrastructure facilities and collected required data, Land details and coordinates of SIPCOT land parcel.
Carried out road inventory for the identified land parcel.
7. Tiruppur Land details and coordinates of SIPCOT land parcel.
Carried out road inventory for the identified land parcel.
8. Trivandrum Various offices for data collection (PWD, Tourism, Forest, KSIDC, KINFRA, Airports Authority of India, DIC, National highways, etc)
9. Kochi Visited DIC, KINFRA and KSIDC existing industrial parks. Visited urban infrastructure facilities
10. Palakkad Visited IMC sites (for site appreciation and carry out road inventory), DIC, KSIDC and KINFRA existing industrial parks. Visited urban infrastructure facilities
11. Kannur
12. Kozhikode
13. Thrissur
14. Idukki Visited DIC, KSIDC and KINFRA existing industrial parks.
15. Alappuzha
16. Malappuram

Kochi Bengaluru Industrial Corridor –Draft Perspective Plan for overall KBIC region - Draft
274
S. No Place Visited Purpose
17. Ernakulum
18. Kottayam
The following offices were contacted for data related to KBIC districts.
Table 147: List of Offices Contacted
S.
No.
Office Contacted Designation Type of Data Requested
Tamil Nadu
1 Tamil Nadu Industrial Development Corporation
(TIDCO)
Director (Projects)
Details of existing Industrial Estates
• Site boundaries map (AUTO CADD or GIS platform)
• Layout plan/master plan if available (AUTO CADD or GIS platform)
• Location with geo co-ordinates
• Extent of area
• Nature of production
• Information about the utilities (water, wastewater management, solid waste management details).
2 SIDCO The Managing Director
3 SIPCOT The Managing Director
Details of existing Industrial estates along with details of identified land parcels under SIPCOT
3 Directorate of Town and Country Planning
Existing/ Proposed Master plan for the cities/towns (in AUTO CADD or GIS platform).
5 Highway Research Station, Chennai
The Director • Status of various on-going road development projects in the study area
• Improvement proposals for various road networks in the study area
• District wise details of road networks a) Category - National Highway/ State
Highway/MDR/ODR b) Ownership details
(NHAI/PWD/Panchayat, etc.) c) Length d) Lane configuration e) Past Traffic (in PCUs)
4 Tamil Nadu Road Sector Project II (TNRSP),
Division Offices – Salem, Tiruppur.
The Project Director, TNRSP
The Division Engineer
• Status of various on-going road development projects in the study area
• Improvement proposals for various road networks in the study area
• District wise details of road networks a) Category - National Highway/ State
Highway/MDR/ODR b) Ownership details
(NHAI/PWD/Panchayat, etc.) c) Length d) Lane configuration e) Past Traffic (in PCUs)

Kochi Bengaluru Industrial Corridor –Draft Perspective Plan for overall KBIC region - Draft
275
S.
No.
Office Contacted Designation Type of Data Requested
5 National Highway Authority of India- Chennai, Karur, Krishnagiri, Coimbatore,Salem
The Chief General Manager, NHAI, Project Director
• List of National Highways (NH) in each district along with the following details:
a) Length b) Lane configuration c) Past Traffic (in PCUs)
• Status of various on-going road development projects
• Improvement proposals for various road networks
6 Coimbatore Municipal Corporation
Mayor Existing data
• Water Supply
• Sewerage
• Solid Waste Management
Salem Municipal Corporation
Erode Municipal Corporation
Hosur Municipal Corporation
7 Madras Chamber of Commerce and Industry
President EXIM & ICD Data
8 Coimbatore and Salem Airport
The Airport Director
• Future proposals
• Expansion plans
• Additional terminals/ terminal expansion plan
9 Department of Tourism The Director District wise Tourism statistics (for past 5 years)
10 Department of Archaeology
The Commissioner
• Archaeological Monuments/Sites of state and national importance.
• Protected Monuments/Areas of state and national importance
11 Department of Forests-Coimbatore, Nilgris, Erode, Namakkal, Karur, Salem, Dharmapuri
The District Forest Officer
• Areas used by protected, important or sensitive species of flora or fauna for breeding, nesting, foraging, resting, over wintering and migration.
• Boundaries of Reserved Forests, Protected Forests, Wild Life Sanctuaries, National Parks (in AUTO CADD or GIS platform).
12 Regional Meteorological Centre, Chennai
The Deputy Director General
• Rainfall
• Temperature
• Humidity
• Wind Direction
• Wind Velocities
• Station Pressure, etc.
(for the latest 30 years)

Kochi Bengaluru Industrial Corridor –Draft Perspective Plan for overall KBIC region - Draft
276
S.
No.
Office Contacted Designation Type of Data Requested
13 Department of Environment
The Director • Areas protected under international conventions, national or local legislation for their ecological, landscape, cultural or other related value.
• Areas which are important or sensitive for ecological reasons - Wetlands, watercourses or other water bodies, coastal zone, biospheres, mountains, forests
14 Water Resources Organisation, PWD
The Engineer in Chief
• Rivers and its flow details (Flow rate, High Flood Level, Low Flood Level)
• Reservoirs, Dams and water storage details
• Ground water levels and quality
• Surface Water Quality
15 State Ground and Surface Water Resources Data Centre
The Chief Engineer
16 Tamil Nadu Pollution Control Board
The Chairman
• Air, Water (Surface & ground)Quality status Directory for recent years
• Monitoring Locations and frequency of sampling
• Noise levels
• Soil quality
17 Department of Geology & Mining (HO and District offices)
The Director
• Mines and minerals availability
• List of Quarries
18 DIC District Offices- Coimbatore, Dharmapuri, Erode, Karur, Krishnagiri, Namakkal, Salem, Tiruppur, Nilgris,
The General Manager
Details of existing Industrial Estates
• Site boundaries map (AUTO CADD or GIS platform)
• Layout plan/master plan if available (AUTO CADD or GIS platform)
• Location with geo co-ordinates
• Extent of area
• Nature of production
• Information about the utilities (water, wastewater management, solid waste management details).
19 Survey and Settlement Department, Survey House.
Assistant Director (Drawing)
Cadastral maps of the villages.
20 Integrated Chief Engineers Office of Highways Department, Construction & Maintenance Department,
Division Offices – Salem, Dharmapuri, Erode, Tiruppur.
Sub-Division Offices – Dharmapuri.
The Chief Engineer
Division Engineer,
Sub-Division Engineer
• Status of various on-going road development projects in the study area
• Improvement proposals for various road networks in the study area
• District wise details of road networks f) Category - National Highway/ State
Highway/MDR/ODR g) Ownership details
(NHAI/PWD/Panchayat, etc.) h) Length i) Lane configuration
Past Traffic (in PCUs)

Kochi Bengaluru Industrial Corridor –Draft Perspective Plan for overall KBIC region - Draft
277
S.
No.
Office Contacted Designation Type of Data Requested
Kerala
1 Forests and Wildlife Department, Kerala
Additional Chief Secretary
Forest boundaries of 9 districts of KBIC
2 Kerala State Industrial Development
Corporation (KSIDC)
Managing Director
Details of Industrial Parks / Estates / Industrial estates / SEZs located within the corridor
3 Kerala Small Industries Development
Corporation Ltd. (SIDCO)
Managing Director
Layouts and location of the MSMEs in the KBIC region.
4 Kerala Industrial Infrastructure Development Corporation (KINFRA)
Managing Director
Existing and Proposed Industrial Parks / Industrial Estates within the corridor
5 Department of Town and Country
Planning (DTCP)
Chief Town Planner
• Development Plans of all the urban areas and settlements
• Policies and Initiatives of the Government of Kerala
• State Urban Information System
• Schemes and proposals of the 9 districts
6 Calicut International Airport
Kochi International Airport
Trivandrum International Airport
The Airport Director
• Future proposals
• Expansion plans
• Additional terminals/ terminal expansion plan
7 Kerala Road Fund Board Chief Executive Officer
• Status of various on-going road improvement projects
• Improvement Proposals for various road networks 8 Kerala State Transport
Project (KSTP) The Project Director
9 Transport Commissionerate
• Vehicle registration data for the past 5 years for each district in Kerala
10 PWD R&B and Administration
The Chief Engineer
• Strategic Options Study (SOS) report for National / State Highways in Kerala
• District wise details of road networks 1) Category - National Highway/ State
Highway/MDR/ODR 2) Ownership details
(NHAI/PWD/Panchayat, etc.) 3) Length 4) Lane configuration 5) Past Traffic (in PCUs)
• Improvement Proposals for Roads – Current Status & Implementing agency

Kochi Bengaluru Industrial Corridor –Draft Perspective Plan for overall KBIC region - Draft
278
S.
No.
Office Contacted Designation Type of Data Requested
11 Department of Tourism The Director • District wise Tourism statistics (for past 5 years)
12 Directorate of Archaeology
Principal Secretary
• Archaeological Monuments/Sites of state and national importance
• Protected Monuments/Areas of state and national importance
13 Kochi Municipal Corporation
Mayor Existing data
• Water Supply
• Sewerage
• Solid Waste Management
14 Palakkad Municipality
15 Kannur Municipal Corporation
16 Kozhikode Municipal Corporation
17 Thrissur City Municipal Corporation
18 National Highway Authority of India
General Manager • List of National Highways (NH) in each district along with
a. Length b. Lane configuration c. Past Traffic (in PCUs)
• Status of various on-going road development projects
• Improvement proposals for various road networks
19 Directorate of Ports Director of Ports • List of Major and minor ports in Kerala
• Location of All the ports
• Layout of the ports
• Existing facilities a) Marine Facilities
i. Berths and their Details ii. Breakwater details (if any) [Length,
orientation etc.] iii. Approach Channel iv. Turning Circle
b) Port Facilities i. Storage Area
ii. Equipment and machinery iii. Cargo handled iv. Land area and usage v. Road rail connectivity
vi. Buildings and Other Infrastructure c) Traffic Details
i. Vessel sizes served ii. Parcel size handled
iii. Cargo Traffic (2016-17, 2017-18)
• Port performance parameters
• Planned Development of existing ports
• Planned details of proposed greenfield ports (if any)
Kochi Bengaluru Industrial Corridor –Draft Perspective Plan for overall KBIC region - Draft
279
S.
No.
Office Contacted Designation Type of Data Requested
• Details of Inland waterway NW-3 and its extension
20 Highways Research Station (HRS),
The Director, HRS
• Status of various on-going road development projects in the study area
• Improvement proposals for various road networks in the study area
• District wise details of road networks a) Category - National Highway/ State
Highway/MDR/ODR b) Ownership details
(NHAI/PWD/Panchayat, etc.) c) Length d) Lane configuration e) Past Traffic (in PCUs)

Kochi Bengaluru Industrial Corridor –Draft Perspective Plan for overall KBIC region - Draft
280
Appendix B. - Approach to base map and node map preparation
The overall approach followed for base map and node maps preparation in the following figure.
Data Collection
Base Map
• KSIDC
• DIC
• DTCP (Kerala and Tamil Nadu)
• KINFRA
• SIPCOT
• SIDCO
• TIDCO
• SOI
• Statistical Handbooks
• Kerala and Tamil Nadu State Roads Department
• Official websites
• Roads • Rail • Seaports • Airports • Administrative
boundaries • Land use • Ecological sites • Archaeological sites • Master Plans of cities • Industrial
Parks/estates/SEZs
Node maps
Thematic Maps of KBIC in GIS
• Covers 100 km on either side of NH 544 (18 Districts)
• Transport
• Industrial areas
• Ecological area
• Archeological sites
• New projects identified
Figure 179: Approach to base map and node map preparation

Kochi Bengaluru Industrial Corridor –Draft Perspective Plan for overall KBIC region - Draft
281
Appendix C. - As-is scenario – Ports
C.1. Ports in KBIC corridor
Gateway through waterway like seaports plays a crucial role in most of the industrial corridors. Being most cost and energy efficient mode of transport it enhances the connectivity of Hinterland multifold times. The proximity of the clusters to the ports will greatly influence the evacuation of both raw-material as well as the finished products from the industrial area. Cochin port is the only operational major port in KBIC corridor and handles 99.5% of overall cargo for state of Kerala. As of March 2017, the quantum of cargo handled at minor and intermediary ports for FY2016-17 is 141,000 Tonnes only compared to 25 MT in Cochin Port during the same year. Cargo handled in all the ports of Kerala between 2013 and 2017 is as follows:
Table 148: Port wise cargo handled 2013-2017
Year Cochin
Port Azhikkal
Port Kozhikode/B
eypore Kollam
Kovalam/Vizhingam
TOTAL Kerala
2013-14 20.887 0.001 0.092 0.005 0.009 20.994
2014-15 21.595 0.005 0.127 0.016 0.007 21.75
2015-16 22.098 0.001 0.126 0.009 0.008 22.242
2016-17 25.007 0.003 0.128 0.001 0.009 25.148
In addition to the above ports in Kerala, Vizhinjam Port and Ponnani Port are already under construction. Further a deepwater port at Azhikkal is also under consideration and is presently at planning stage.
C.2. Technical assessment of ports in KBIC corridor
A technical assessment of operational and conceptualized ports along KBIC corridor is presented in this section.
C.2.1. Cochin Port
Cochin Port is one of the 12 major ports of India operated by Cochin Port Trust. The port has 91 years of active service since establishment in the year of 1926. Cochin Port is the natural ports located at latitude 9˚58’N and longitude 76˚14’E on the west coast of India.
Cochin Port tops the list of the ports in Kerala as the one that handles. The port has handled 25 MTPA of cargo during the year 2016-17.

Kochi Bengaluru Industrial Corridor –Draft Perspective Plan for overall KBIC region - Draft
282
Figure 180 Location of Cochin Port
C.2.1.1. Traffic handled
The diverse commodities of cargo are handled at Cochin Port. Major commodities handled are POL products, edible oil, other liquids, fertilizers, raw materials for fertilizers, wheat, coal, iron, salt, cement and containers.
The total volume of cargo handled at Cochin port for the year 2016-17 is 25 MT. The quantum of cargo transshipped during this period is 612,000 Tonnes. It is to be observed that most of the cargo i.e. 19.94 MT is imported at Cochin port whereas the volume of exports stands at 4.4 MT only.
POL products constitute 74% of all the cargo handled at Cochin port. Port has handled 491,000 TEU of containers in last fiscal year aggregating 6.2 MT (24.8 % of overall cargo volume). From the above statistics it is abundantly clear that POL products and containers form the major cargo commodity at Cochin Port. In broad sense, Liquid Bulk cargo dominates at Cochin port followed by Containers. The commodity wise traffic handled at the Cochin port is given below.
Table 149 Traffic handled at Cochin Port
Cargo handled in Million tonnes/TEUs
Commodity 2016-17 2015-16
Liquid bulk 16.66 14.70
Break bulk 0.03 0.06
Dry Bulk 1.46 1.54
Containers 6.84 5.78
In TEUs 0.50 0.42
Total 25.00 22.10

Kochi Bengaluru Industrial Corridor –Draft Perspective Plan for overall KBIC region - Draft
283
Figure 181 Traffic handled at Cochin Port during 2015-16 and 2014-15
C.2.1.2. Navigational Facilities
The port is an all-weather natural harbour with approach channel depth of 15.95 m and 670 m diameter turning circle. The work is under progress to deepen the approach channel to 18 m. The entrance channel then divides into two branches on either side of Willingdon Island namely Ernakulum channel and Mattancherry channel. The 4.9 KM long Ernakulum channel has width varying from 250m to 500m with draft of 12.5m reducing to 9.4m at the end. Ernakulum channel also houses a 500m diameter turning circle with draft of 11.9m. On the other hand, Mattancherry channel is shorter, narrower and shallower with length 4.08km, width varying from 180m to 250m and draft of 9.14m.
C.2.1.3. Berth Details
Cochin port operates 19 berths and one Single Buoy Mooring (SBM). The port boasts of 4527.5m of quay length with draughts varying from 9.7 m to 15.95 m. The table below enlists the different berths of Cochin port.
Table 150 Berth details of Cochin Port
S. No. Name of Berth Length (m)
Draft (m) Max Size of Ship (DWT)
Commodities Handled
1 Single Point Mooring
22.5 3,00,000 Crude
2 COT 250 12.5 1,15,000 Crude / POL
3 NTB 213 9.1 30000 POL
4 STB 170 9.1 20000 POL
5 Ernakulam Wharf (Q5-Q6) 250 10 20000 Dry Cargo / CBFS
6 Ernakulam Wharf (Q7) 250 10.5 60000 Dry Cargo
7 Ernakulam Wharf (Q8-Q9) 250 11 60000 Dry Cargo
8 Fertilizer Berth ( Q10) 207 10.7 60000 Fertilizers/Phos./Acid
9 SCB 170 9.1 15000 Liquid Bulk
10 NCB 410 9.1 35000 Dry /Liquid Bulk
11 BTP
10 35000 Dry /Liquid Bulk
12 Mattancherry Wharf (Q1-Q3) 180 9.1 16000 Dry Bulk
13 Mattancherry Wharf (Q4) 180 9.1 65000 Dry /Liquid Bulk
14 ICTT Vallarpadam (V2-V3) 335 14.5 1,10,000 Containers
15 LNG Puthuvypeen 320 12.5 1,20,000 LNG

Kochi Bengaluru Industrial Corridor –Draft Perspective Plan for overall KBIC region - Draft
284
Figure 182 Location of Berths at Willingdon Island
C.2.1.3.1. Mattancherry Channel
Mattancherry wharf lies on the western side of Willingdon Island on Mattancherry channel. Mattacherry wharf houses four quays (Q1-Q4). Other berths on Mattancherry channel BTP NCB and SCB.
C.2.1.3.2. Ernakulam Channel
Ernakulum channel is bigger than Mattancherry channel and lies on the eastern side of Willingdon Island. Ernakulum channel has three oil berths namely COT, NTB and STB. The Ernakulum wharf has 6 alongside quays (Q5-Q10) handling dry bulk cargo and fertilizers. Along with all these berths, there is a RO-RO berth too.
C.2.1.3.3. ICTT Vallarpadam
International Container Transshipment Terminal is located at Vallarpadam Island and is developed to tap international container transshipment business. The project has been developed on BOT basis in association with M/s India gateway terminal Private limited. ICTT phase1 was commissioned in February 2011. Terminal can handle two 8000+ TEU ships simultaneously on its 600m long quay. Terminal is envisages to handle 3 Million TEU with total quay length of 1800m.
Figure 183 Google Earth imagery of ICTT Vallarpadam
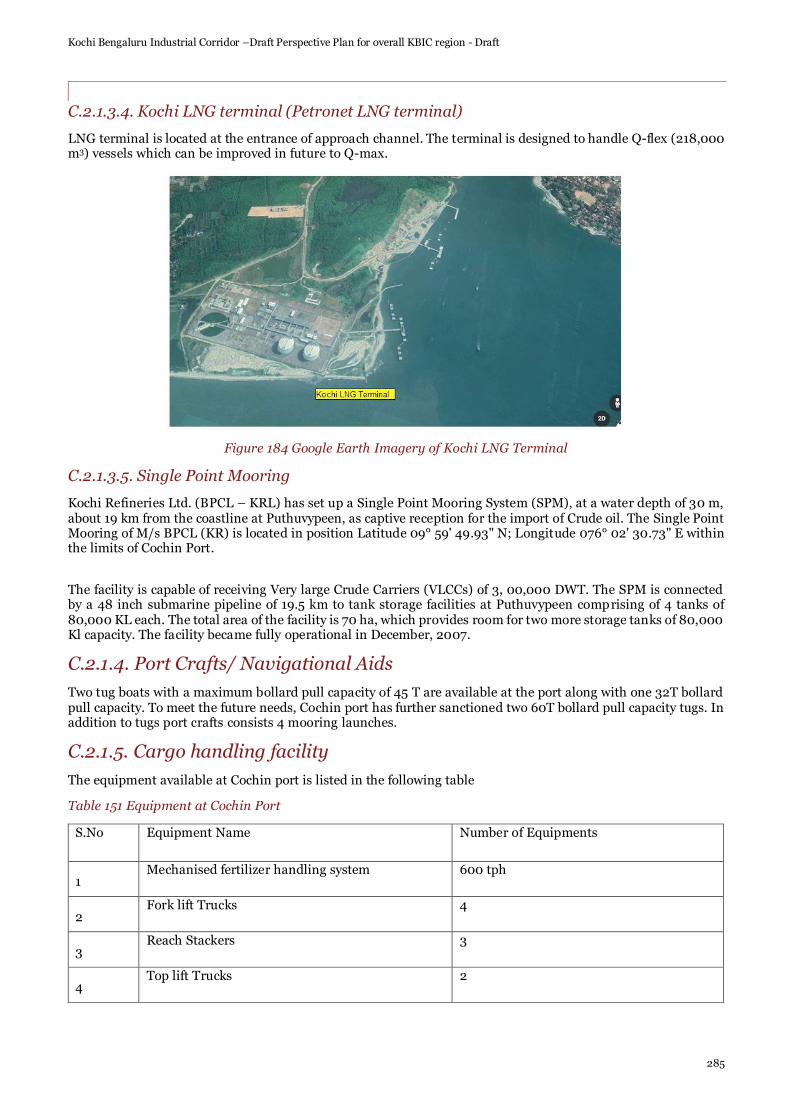
Kochi Bengaluru Industrial Corridor –Draft Perspective Plan for overall KBIC region - Draft
285
C.2.1.3.4. Kochi LNG terminal (Petronet LNG terminal)
LNG terminal is located at the entrance of approach channel. The terminal is designed to handle Q-flex (218,000 m3) vessels which can be improved in future to Q-max.
Figure 184 Google Earth Imagery of Kochi LNG Terminal
C.2.1.3.5. Single Point Mooring
Kochi Refineries Ltd. (BPCL – KRL) has set up a Single Point Mooring System (SPM), at a water depth of 30 m, about 19 km from the coastline at Puthuvypeen, as captive reception for the import of Crude oil. The Single Point Mooring of M/s BPCL (KR) is located in position Latitude 09° 59' 49.93" N; Longitude 076° 02' 30.73" E within the limits of Cochin Port.
The facility is capable of receiving Very large Crude Carriers (VLCCs) of 3, 00,000 DWT. The SPM is connected by a 48 inch submarine pipeline of 19.5 km to tank storage facilities at Puthuvypeen comprising of 4 tanks of 80,000 KL each. The total area of the facility is 70 ha, which provides room for two more storage tanks of 80,000 Kl capacity. The facility became fully operational in December, 2007.
C.2.1.4. Port Crafts/ Navigational Aids
Two tug boats with a maximum bollard pull capacity of 45 T are available at the port along with one 32T bollard pull capacity. To meet the future needs, Cochin port has further sanctioned two 60T bollard pull capacity tugs. In addition to tugs port crafts consists 4 mooring launches.
C.2.1.5. Cargo handling facility
The equipment available at Cochin port is listed in the following table
Table 151 Equipment at Cochin Port
S.No Equipment Name Number of Equipments
1 Mechanised fertilizer handling system 600 tph
2 Fork lift Trucks 4
3 Reach Stackers 3
4 Top lift Trucks 2

Kochi Bengaluru Industrial Corridor –Draft Perspective Plan for overall KBIC region - Draft
286
5 Marine loading arms for handling liquid cargo 4*300mm
6 Quay cranes at container terminals 4
7 RTGs at container yard 15
C.2.1.6. Storage Facilities
It is important for any port to have sufficient storage area to protect the cargo during storage and transit. Cochin port has 11 sheds and 7 warehouses covering 65,000 sq.m of area. most of these storage areas are present at Willingdon island and Vallarpadam island.
Table 152 Storage facilities at Cochin Port
Covered Area (Transit Sheds and Overflow sheds)
Location Total Sheds Area (Sqm)
Mattancherry Wharf 6 19,160
Ernakulum Wharf 4 13,200
Container Freight Station 1 10,000
Grand Total 11 42,360
Covered Area (Warehouses)
Location Total Sheds Area (Sqm)
Mattancherry Wharf 4 11,800
Ernakulum Wharf 1 2,980
Cement Godown 1 1,000
BTP 1 6,000
Grand Total 7 21,780
C.2.1.7. Road and Rail Connectivity
Cochin port is well connected with hinterland due to four national highways spreading out in all the directions.
• NH 17 – Cochin to Panvel takes off from Edapally at Cochin.
• NH-47 – Salem to Kanyakumari Passes through Cochin.
• NH 49 – Cochin to Madurai/ Dhanushkodi, takes off from NH 47 from Kudanoor at Cochin.
• NH 47 A – National highway link connecting Willingdon Island and NH 47 at Kudanoor.
The port is well connected via rails to its hinterland. The facilitate the cargo flow from Cochin port, two railway routes are being utilised presently. Since the Cochin port is scattered across different islands, each line serves to different facilities. An 8 km long broad gauge section caters to the needs of Wellingdon Island. It branches off at Ernakulum from main Shornur-Trivandrum line. The ICTT facility at Vallarpadam is served by another 8.86 km which is connected to Edapally.
C.2.1.8. Inland Waterways
National waterway 3, a 205 km inland waterway connects major industrial areas of Kerala with Cochin port. The water way stretches from Kozhikode in north to Kollam in south. The west coast canal, Udyogmadal canal and Champakkara canal provides main links between NW-3 and Cochin Port.
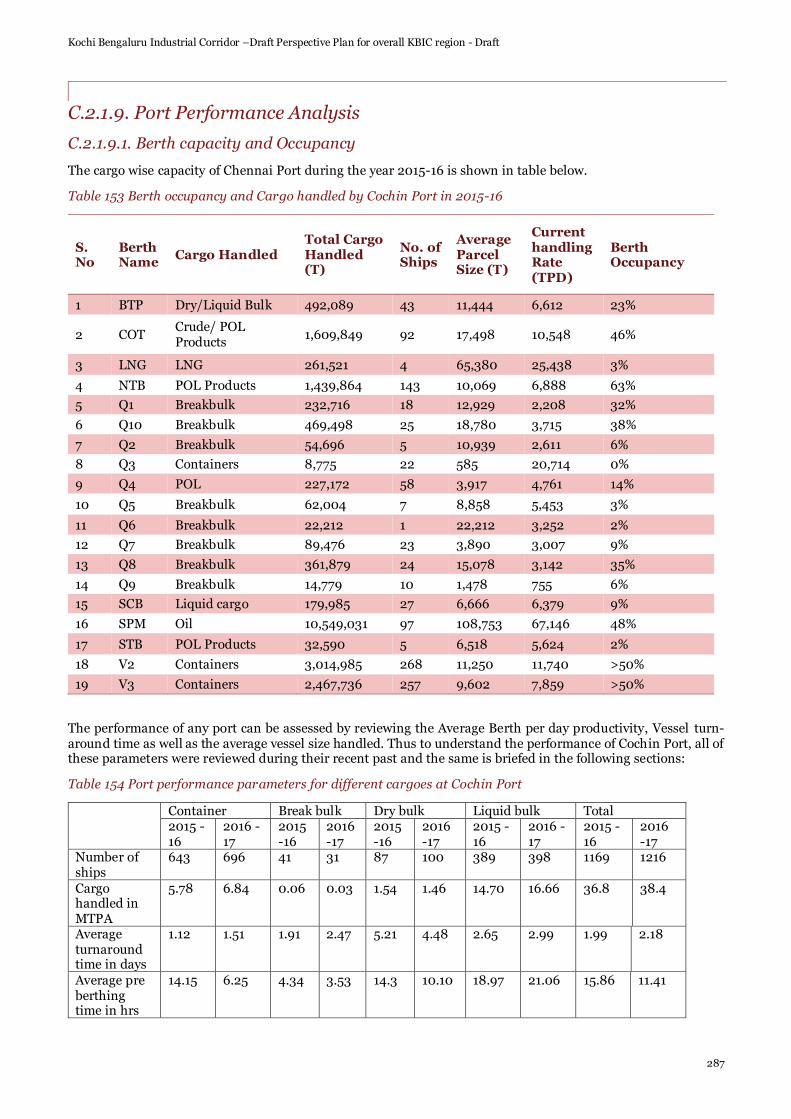
Kochi Bengaluru Industrial Corridor –Draft Perspective Plan for overall KBIC region - Draft
287
C.2.1.9. Port Performance Analysis
C.2.1.9.1. Berth capacity and Occupancy
The cargo wise capacity of Chennai Port during the year 2015-16 is shown in table below.
Table 153 Berth occupancy and Cargo handled by Cochin Port in 2015-16
S. No
Berth Name
Cargo Handled Total Cargo Handled (T)
No. of Ships
Average Parcel Size (T)
Current handling Rate (TPD)
Berth Occupancy
1 BTP Dry/Liquid Bulk 492,089 43 11,444 6,612 23%
2 COT Crude/ POL Products
1,609,849 92 17,498 10,548 46%
3 LNG LNG 261,521 4 65,380 25,438 3%
4 NTB POL Products 1,439,864 143 10,069 6,888 63%
5 Q1 Breakbulk 232,716 18 12,929 2,208 32%
6 Q10 Breakbulk 469,498 25 18,780 3,715 38%
7 Q2 Breakbulk 54,696 5 10,939 2,611 6%
8 Q3 Containers 8,775 22 585 20,714 0%
9 Q4 POL 227,172 58 3,917 4,761 14%
10 Q5 Breakbulk 62,004 7 8,858 5,453 3%
11 Q6 Breakbulk 22,212 1 22,212 3,252 2%
12 Q7 Breakbulk 89,476 23 3,890 3,007 9%
13 Q8 Breakbulk 361,879 24 15,078 3,142 35%
14 Q9 Breakbulk 14,779 10 1,478 755 6%
15 SCB Liquid cargo 179,985 27 6,666 6,379 9%
16 SPM Oil 10,549,031 97 108,753 67,146 48%
17 STB POL Products 32,590 5 6,518 5,624 2%
18 V2 Containers 3,014,985 268 11,250 11,740 >50%
19 V3 Containers 2,467,736 257 9,602 7,859 >50%
The performance of any port can be assessed by reviewing the Average Berth per day productivity, Vessel turn-around time as well as the average vessel size handled. Thus to understand the performance of Cochin Port, all of these parameters were reviewed during their recent past and the same is briefed in the following sections:
Table 154 Port performance parameters for different cargoes at Cochin Port
Container Break bulk Dry bulk Liquid bulk Total 2015 -16
2016 -17
2015 -16
2016 -17
2015 -16
2016 -17
2015 -16
2016 -17
2015 -16
2016 -17
Number of ships
643 696 41 31 87 100 389 398 1169 1216
Cargo handled in MTPA
5.78 6.84 0.06 0.03 1.54 1.46 14.70 16.66 36.8 38.4
Average turnaround time in days
1.12 1.51 1.91 2.47 5.21 4.48 2.65 2.99 1.99 2.18
Average pre berthing time in hrs
14.15 6.25 4.34 3.53 14.3 10.10 18.97 21.06 15.86 11.41

Kochi Bengaluru Industrial Corridor –Draft Perspective Plan for overall KBIC region - Draft
288
Average output per ship per day
15381 18606 667 703 4740 4395 23702 25098 15661 17450
C.2.1.10. On-going/Proposed Port Expansion Activities
• Development of International ship repairing facility
• Multi User Liquid Terminal (4.52 MTPA oil cum LPG jetty)
• Development of Cruise terminal
• Refurbishment and capacity enhancement of COT, NTB and STB
• Bitumen complex
• Cement hub
• Grain Terminal
• Sand Mining Project
• Cryogenic warehousing
• Tea Park
• RO-RO facility
C.3. Vizhinjam Port
A deep water multi-purpose greenfield port is developed by Government of Kerala (GoK) via special purpose vehicle Vizhinjam International Seaports Limited (VISL) through PPP mode on Build Operate Transfer (BOT) basis. The initial studies by Drewry`s International shipping, UK and Detailed Project Report AECOM suggests that due to smaller primary hinterland, Vizhinjam port will have to focus on container tans-shipment business as major service. The port is proposed to operate on Landlord based model.
Vizhinjam port is envisaged to be a deep draft all weather multipurpose port located at latitude 8˚22’N and longitude 76˚57’E on the west coast of India. The close proximity to international shipping routes and naturally available deep draft are the biggest advantages for Vizhinjam port to attract largest container vessels. The intense competition from Colombo port and ICTT Vallarpadam, Cochin proves to be the only drawback.
Development of port is carried out with a Public private partnership component of Design build finance operate and Transfer (DBFOT) basis. The concessionaire for this project is M/s Adani Vizhinjam Port Private Limited and construction of port is scheduled to be completed on 4th December 2019.
C.3.1. Traffic Forecast
DREWRY Shipping Consultants Ltd. in year 2010 carried out traffic survey for Vizhinjam port for 30 years starting from year 2014. The study enlists the projections for three phases.
• Phase I – Year 2014 to 2020
• Phase II – Year 2021 to 2030
• Phase III – Year 2031 to 2044
The outcome of the study is shown below.
Table 155 Traffic forecast for Vizhinjam Port
Unit Phase 1 Phase 2 Phase 3
FY14-20 FY21-30 FY31-44
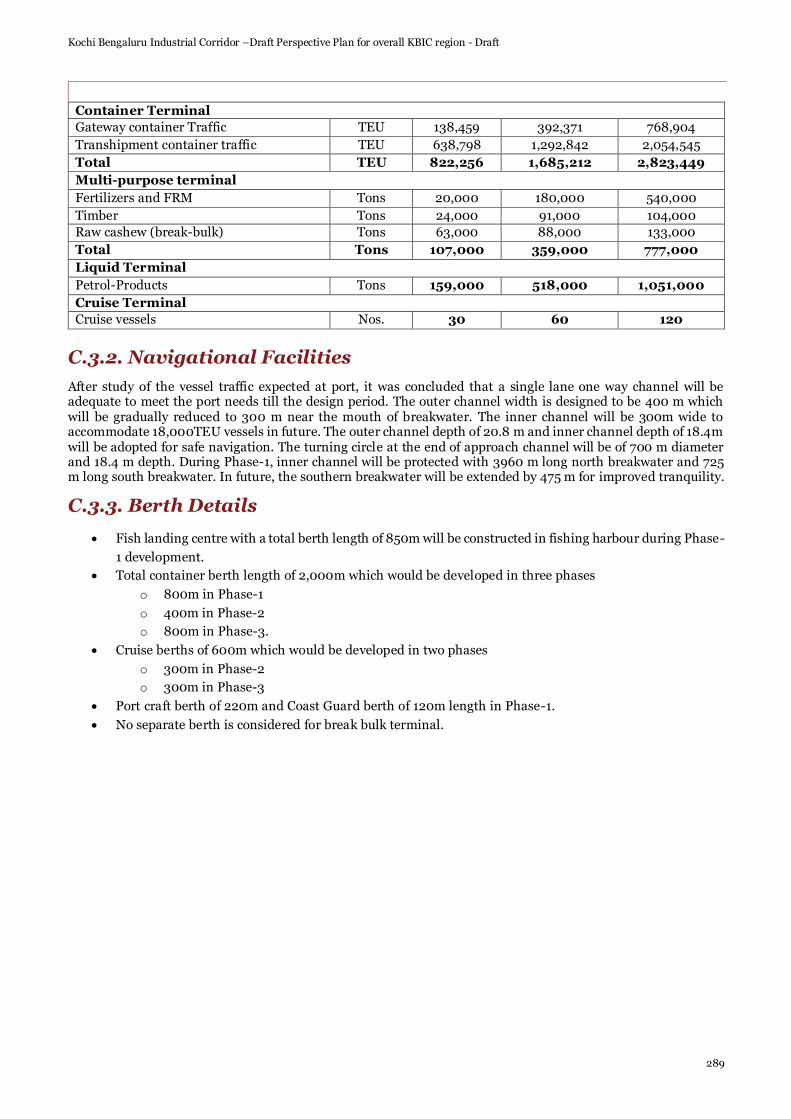
Kochi Bengaluru Industrial Corridor –Draft Perspective Plan for overall KBIC region - Draft
289
Container Terminal
Gateway container Traffic TEU 138,459 392,371 768,904
Transhipment container traffic TEU 638,798 1,292,842 2,054,545
Total TEU 822,256 1,685,212 2,823,449
Multi-purpose terminal
Fertilizers and FRM Tons 20,000 180,000 540,000
Timber Tons 24,000 91,000 104,000
Raw cashew (break-bulk) Tons 63,000 88,000 133,000
Total Tons 107,000 359,000 777,000
Liquid Terminal
Petrol-Products Tons 159,000 518,000 1,051,000
Cruise Terminal
Cruise vessels Nos. 30 60 120
C.3.2. Navigational Facilities
After study of the vessel traffic expected at port, it was concluded that a single lane one way channel will be adequate to meet the port needs till the design period. The outer channel width is designed to be 400 m which will be gradually reduced to 300 m near the mouth of breakwater. The inner channel will be 300m wide to accommodate 18,000TEU vessels in future. The outer channel depth of 20.8 m and inner channel depth of 18.4m will be adopted for safe navigation. The turning circle at the end of approach channel will be of 700 m diameter and 18.4 m depth. During Phase-1, inner channel will be protected with 3960 m long north breakwater and 725 m long south breakwater. In future, the southern breakwater will be extended by 475 m for improved tranquility.
C.3.3. Berth Details
• Fish landing centre with a total berth length of 850m will be constructed in fishing harbour during Phase-
1 development.
• Total container berth length of 2,000m which would be developed in three phases
o 800m in Phase-1
o 400m in Phase-2
o 800m in Phase-3.
• Cruise berths of 600m which would be developed in two phases
o 300m in Phase-2
o 300m in Phase-3
• Port craft berth of 220m and Coast Guard berth of 120m length in Phase-1.
• No separate berth is considered for break bulk terminal.

Kochi Bengaluru Industrial Corridor –Draft Perspective Plan for overall KBIC region - Draft
290
Figure 185 Phase 1 Layout of Vizhinjam Port

Kochi Bengaluru Industrial Corridor –Draft Perspective Plan for overall KBIC region - Draft
291
Figure 186 Phase 2 Layout of Vizhinjam Port
Figure 187 Master Plan Layout of Vizhinjam Port

Kochi Bengaluru Industrial Corridor –Draft Perspective Plan for overall KBIC region - Draft
292
C.3.4. Port Crafts/ Navigational Aids
Vizhinjam port envisages having 5 Tugs, 3 Mooring Launch and one pilot launch during phase 1 of development. Later this fleet of port crafts will be expanded to 8 Tugs, 4 mooring Launch and 2 Pilot launches for final phase of Master Plan.
C.3.5. Container storage yard
The RTG storage area will be seven wide and five containers high. The container yard is provided for approximately following number of twenty-foot-ground slots after discounting the TGS provided for empty containers:
• Phase-1: 4,400 TGS
• Phase-2: 7,500 TGS
• Master Plan: 17,000 TGS
The empty container storage area has been planned along the rear of the container yard for around 1,200 TGS.
C.3.6. Road and Rail Connectivity
NH 47 connects the entire district of Thiruvananthapuram. Vizhinjam port is only 10km away from NH 47. NH 47-A connects NH 47 with Cochin aids to connect the northern subcontinent till Mumbai via NH 17. At salem, NH 47 meets with NH 4 and NH 7 connecting it to Chennai and other parts of southern India.
The southern railway main line is 8km away from Vizhinjam port borders.
C.3.7. Observations
• The Vizhinjam Port enjoys the natural deep draft of (-) 20m CD and can call largest container ships.
The proximity of International trading route is an added advantage.
• It has tremendous potential to be a transhipment hub and can give a tough competition to port of
Colombo.
• Since the port is in nascent stages, there is great flexibility available for planning capacity addition
for the future needs.
C.3.8. On-going/Proposed Port Expansion Activities
The development work of Vizhinjam port has been awarded to Adani Ports and SEZ on 10 th June 2015 and the construction work has commenced.
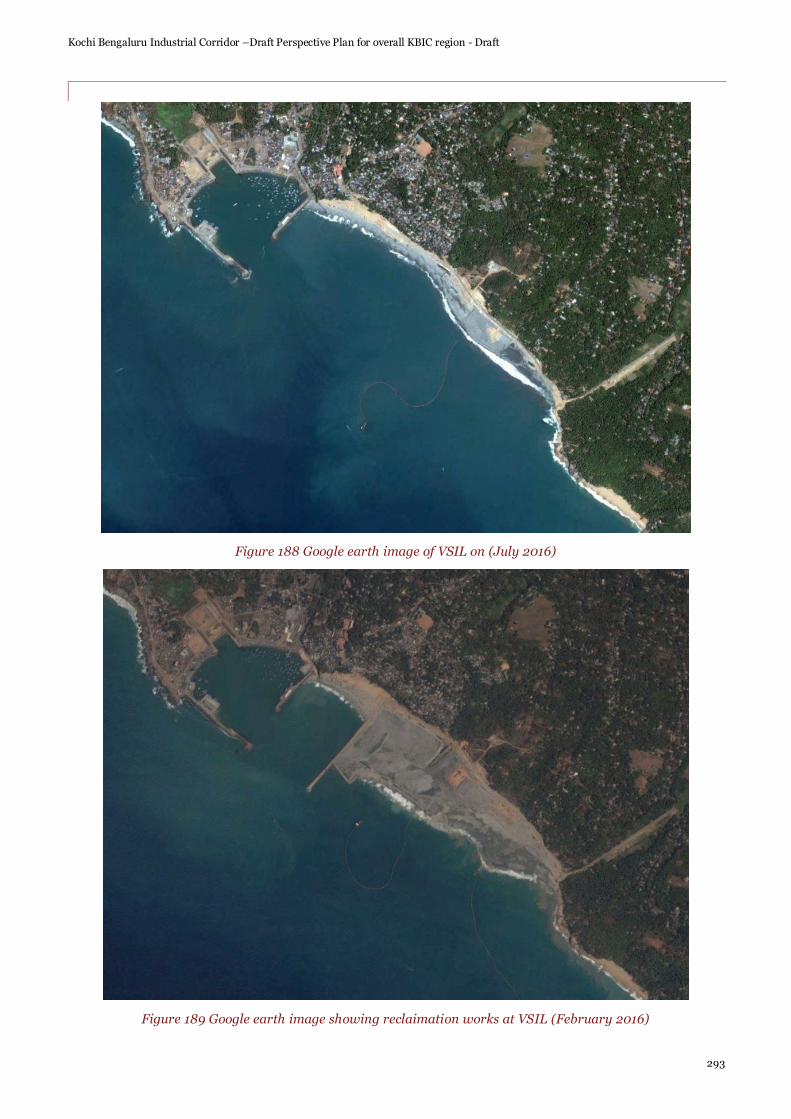
Kochi Bengaluru Industrial Corridor –Draft Perspective Plan for overall KBIC region - Draft
293
Figure 188 Google earth image of VSIL on (July 2016)
Figure 189 Google earth image showing reclaimation works at VSIL (February 2016)

Kochi Bengaluru Industrial Corridor –Draft Perspective Plan for overall KBIC region - Draft
294
C.4. Azhikkal Port
Azhikkal port is located in district of Kannur, Northern Kerala. Azhikkal port is only 100km south of New Mangalore port on west coast of India. Port is being developed in the estuarine region of Vallarpatam River where the river meets the Arabian sea. Both the banks of the river are going to be utilised for the development of port. Being located between New Mangalore port and Cochin port, Azhikkal port will face stiff competition in garnering traffic. Hence, it was decided to develop Azhikkal port as lightrage port with focus on coastal shipping for initial phase of development. A modular type development approach has been considered wherein the specific terminals will be developed on need basis.
C.4.1. Traffic Forecast
Traffic forecast was carried out for three alternative scenarios:
1. Cement, General cargo and Containers from Primary hinterland were considered
2. In addition to Alternative 1, coal required for upcoming Cheemeni thermal power plant was taken into
account.
3. Alternative 3 was optimistic scenario wherein additional containerized cargo traffic from secondary
hinterland of Bengaluru and Mysore was considered along with Alternative 2 cargo.
All the alternatives were evaluated for high growth, medium growth and low growth scenarios. Medium growth condition of Alternative 3 was adopted for planning of the port. The cargo projection for selected alternative is presented in table below:
Table 156 Traffic Forecast for Azhikal Port
Cargo Type Units 2015-16 2025-26 2040-41
Bulk Tons 910,000 1,640,000 2,730,000
Containers TEU 29,000 54,000 136,000
Containers from Bengaluru and Mysore District
TEU 25,500 41,500 86,000
Cement Tons 1,160,000 1,890,000 3,920,000
Captive Coal Tons 1,200,000 3,600,000 3,600,000
Total Tons 3,940,000 6,880,000 12,540,000
C.4.2. Navigational Facilities
For lightrage operations, 4,000 to 6,000 DWT barges have been considered. The draft required for navigation of these vessels is 3.2m only. The available draft at the entrance of breakwaters is (-) 6 m CD with minimum draft available in harbour basin area is (-) 4 m CD. The width between two breakwaters at the entrance of port is 370m and is sufficiently wide for barge navigation. The turning circle of 200m is proposed for the barges, however a 300m turning circle is available for depth of (-) 4 m CD.
C.4.3. Berth Details
As the port is proposed to be developed in modular fashion, a Multi-purpose berth and a cement terminal will be developed in initial phase with additional terminals will be developed as the demand increases. In final development (2035-36), the overall terminals will be as follows:
1. Multi-purpose terminal : 2 nos of 1.8 MTPA capacity each
2. Cement terminal : 2 nos of 2.25 MTPA capacity each
3. Container cum general cargo berth : 2 nos of 2.25 MTPA capacity each
4. Coal terminal : 3 nos of 2.4 MTPA capacity each

Kochi Bengaluru Industrial Corridor –Draft Perspective Plan for overall KBIC region - Draft
295
C.4.4. Port Crafts/ Navigational Aids
Since port is destined to be a lightrage port in initial stages, the port plans to have a survey launch, one tug and a speed boat to meet the minimum ISPS requirements.
C.4.5. Cargo handling facility
Mobile cranes with grab buckets of capacity 10-15 tons at 15m radius are proposed for multipurpose terminal. At cement terminal, cement will handled through pipelines using pumps and compressed. For containers, Grab cranes and reach stackers will be deployed.
C.4.6. Storage Facilities
Port authority has 61.6 Hectares of land its control on either river bank for port activities.
Table 157 Storage area at Azhikkal Port
Terminal Area (hectares)
1. Multi- Purpose Terminal 8
2. Cement Terminal 6
3. Coal Terminal 30
4. Shipyard 6
Total 50
C.4.7. Road and Rail Connectivity
Azhikkal port location is only 2km away from NH-17 which connects Mumbai in north to Kanyakumari in south. This road also connects Azhikkal port with New Mangalore Port and Cochin Port.
Broad gauge rail line can be utilised for cargo movement. This rail line connects Mumbai to Trivandrum via Konkan region.
C.4.8. On-going/Proposed Port Expansion Activities
A study initiated for Detailed Project Report for Development of Azhikkal port in 2017 to update the older report and to consider the feasibility of port as a direct berthing port.
C.5. Thankassery Port
Thankassery port is located in the Kollam district of Kerala. It is one of the oldest operating ports in India with historical records dating back to 9th century AD. Thankassery port is owned by Government of Kerala and is operated by The Directorate of Ports, Government of Kerala. The existing wharf was constructed by Government of Kerala in 2006. The seaward breakwater measures 2100m in length whereas the leeward breakwater is 500m long.

Kochi Bengaluru Industrial Corridor –Draft Perspective Plan for overall KBIC region - Draft
296
Figure 190 Google Earth image of Thankassery Port

Kochi Bengaluru Industrial Corridor –Draft Perspective Plan for overall KBIC region - Draft
297
Figure 191 Google earth Image of existing Port facilities at Thankassery port
C.5.1. Traffic Forecast
Traffic was forecasted by conducting commodity wise surveys in primary and secondary hinterland and forecasting the growth after studying the historical trends. Three scenarios of Low, Medium and High growth were considered for traffic projections and Medium scenario was adopted for planning of Thankassery Port. The results of survey are tabled below.
Table 158 Traffic forecast for Azhikkal Port
Cargo Type Units 2015 2020 2025 2030 2035 2040
Bulk and Container M. Tons 2.2 2.7 3.4 4.2 5.3 6.8
Containers TEU 43,560 51,860 62,900 77,170 95,360 118,300
C.5.2. Navigational Facilities
There are two breakwater, 2100m long seaward breakwater and 500 m long leeward breakwater to provide tranquil conditions for operation of port. Port has basin of 1250m long and 800m width providing sufficient space for turning operations of vessels. A 350m wide and 6.5 m deep approach channel facilitates the entry of vessels in to the basin.
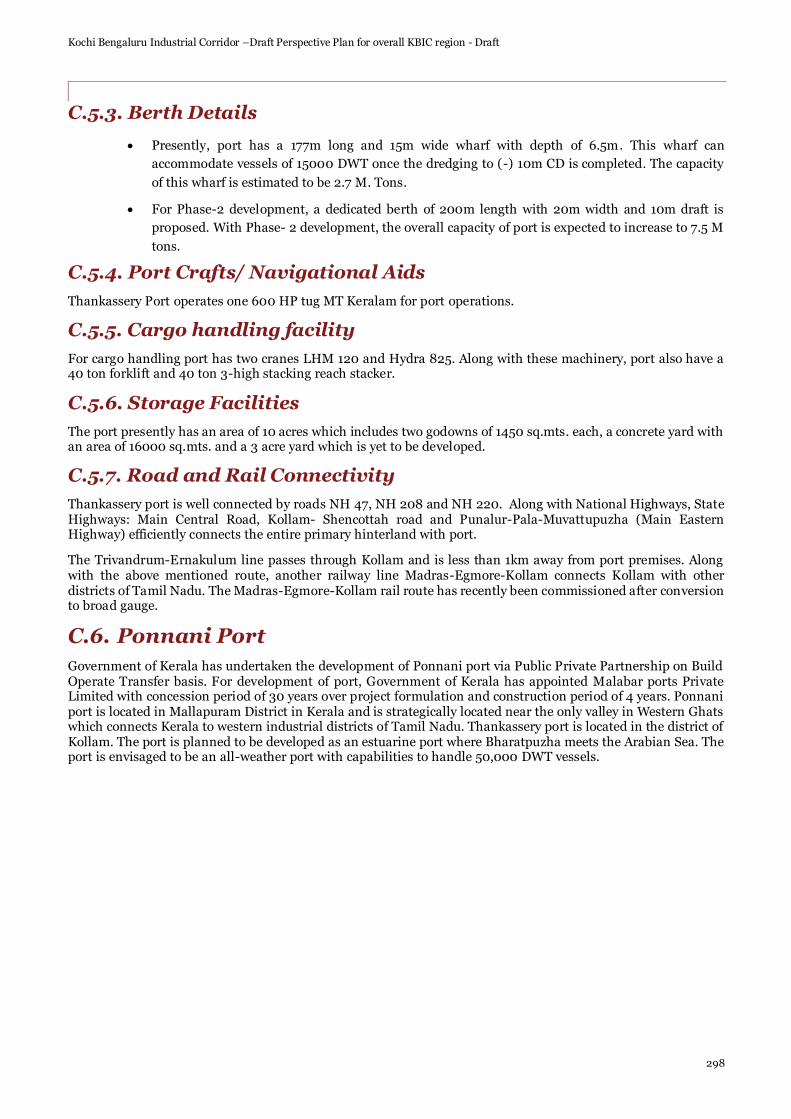
Kochi Bengaluru Industrial Corridor –Draft Perspective Plan for overall KBIC region - Draft
298
C.5.3. Berth Details
• Presently, port has a 177m long and 15m wide wharf with depth of 6.5m. This wharf can
accommodate vessels of 15000 DWT once the dredging to (-) 10m CD is completed. The capacity
of this wharf is estimated to be 2.7 M. Tons.
• For Phase-2 development, a dedicated berth of 200m length with 20m width and 10m draft is
proposed. With Phase- 2 development, the overall capacity of port is expected to increase to 7.5 M
tons.
C.5.4. Port Crafts/ Navigational Aids
Thankassery Port operates one 600 HP tug MT Keralam for port operations.
C.5.5. Cargo handling facility
For cargo handling port has two cranes LHM 120 and Hydra 825. Along with these machinery, port also have a 40 ton forklift and 40 ton 3-high stacking reach stacker.
C.5.6. Storage Facilities
The port presently has an area of 10 acres which includes two godowns of 1450 sq.mts. each, a concrete yard with an area of 16000 sq.mts. and a 3 acre yard which is yet to be developed.
C.5.7. Road and Rail Connectivity
Thankassery port is well connected by roads NH 47, NH 208 and NH 220. Along with National Highways, State Highways: Main Central Road, Kollam- Shencottah road and Punalur-Pala-Muvattupuzha (Main Eastern Highway) efficiently connects the entire primary hinterland with port.
The Trivandrum-Ernakulum line passes through Kollam and is less than 1km away from port premises. Along with the above mentioned route, another railway line Madras-Egmore-Kollam connects Kollam with other districts of Tamil Nadu. The Madras-Egmore-Kollam rail route has recently been commissioned after conversion to broad gauge.
C.6. Ponnani Port
Government of Kerala has undertaken the development of Ponnani port via Public Private Partnership on Build Operate Transfer basis. For development of port, Government of Kerala has appointed Malabar ports Private Limited with concession period of 30 years over project formulation and construction period of 4 years. Ponnani port is located in Mallapuram District in Kerala and is strategically located near the only valley in Western Ghats which connects Kerala to western industrial districts of Tamil Nadu. Thankassery port is located in the district of Kollam. The port is planned to be developed as an estuarine port where Bharatpuzha meets the Arabian Sea. The port is envisaged to be an all-weather port with capabilities to handle 50,000 DWT vessels.

Kochi Bengaluru Industrial Corridor –Draft Perspective Plan for overall KBIC region - Draft
299
Figure 192 Phase 1 Layout of Ponnani port
Figure 193 Master plan of Ponnani port

Kochi Bengaluru Industrial Corridor –Draft Perspective Plan for overall KBIC region - Draft
300
C.6.1. Traffic Forecast
The major traffic expected at Ponnani port will consist of General cargo, Container cargo and Thermal coal. The general cargo will consist of Fertilizers, Cement, Granite, Building Material, Timber, Tea and other miscellaneous cargo. The forecasted traffic of Ponnani port for realistic scenarios is presented in
Table 159 Traffic forecast for Ponnani Port
Cargo Type Units 2020 2025 2030 2035 2040 2045
Container MTPA 7.3 10.3 13.4 17.1 21.8 27.8
General Cargo MTPA 5.1 6.8 8.7 10.8 13.3 16.3
Thermal Coal MTPA 0.4 0.5 0.7 0.9 1.2 1.5
Total MTPA 12.8 17.6 22.8 28.8 36.3 45.6
C.6.2. Navigational Facilities
The outer channel and inner channel provides access to the tranquil harbour basin area. The dimensions of approach channel and turning circle for manoeuvring are given below. The tranquillity of harbour will be maintained with help of two breakwaters namely North-western breakwater (1815 m) and south western breakwater (950 m).
Table 160 Navigational facilities in Ponnani Port
Channel Units Phase 1 Master Plan
Outer Channel Width m 160.0 220.0
Depth 13.8 17.8
Inner Channel Width m 160.0 220.0
Depth 13.2 17.0
Turning Circle Diameter m 420.0 640.0
Depth 13.2 17.0
C.6.3. Berth Details
Planned berth details are as per the table below.
Table 161 Berth details for Ponnani port
Phase Type Design Vessel Size No. of berths* Phase wise No. of berths and length*
Phase I Multipurpose berth 40000 DWT 1 2 (490 m) Container 2500 TEU 1
Phase IA Multipurpose berth 100000 DWT 1 6 (1510 m) Container 3000 TEU 2
General Cargo 30000 DWT 3
Phase II Multipurpose berth 120000 DWT 1 8 (2220 m) Container 5000 TEU 3
General Cargo 40000DWT 4
Phase III Multipurpose berth 120000 DWT 1 11 (3110 m) Container 8000 TEU 4
General Cargo 40000 DWT 6 *(All values are cumulative)

Kochi Bengaluru Industrial Corridor –Draft Perspective Plan for overall KBIC region - Draft
301
C.6.4. Port Crafts/ Navigational Aids
Ponnani port plans to have two barges of 40T bollard pull with fire fighting facilities. Port will also have a Pilot launch, one survey Launch and one bilge barge. Survey launch and bilge barge are proposed to be outsourced.
C.6.5. Cargo handling facility
For cargo handling port has two cranes LHM 120 and Hydra 825. Along with these machinery, port also have a 40 ton forklift and 40 ton 3-high stacking reach stacker.
C.6.6. Storage Facilities
• During first phase, an area of 4 Ha. will be earmarked for coal which will be increased to 8 Ha. In
future.
• Similarly for general cargo 5 Ha. is reserved increasing to 27 Ha. the area is inclusive of Open and
closed storage areas.
• For containers, 1100 ground slots have been planned for first phase which will be gradually
increased to 5900. Along with container yard, container Freight station is also considered in 2 Ha.
land parcel for first phase.
C.6.7. Road and Rail Connectivity
The proposed site has a good rail and rail connectivity. The location is served with National Highway 17 (renumbered NH 66) passing close by. Even in terms of rail accessibility, the station of Kuttipuram is close to the site, with the major junctions of Thrissur, Palakkad and Calicut in close proximity.
C.6.8. On-going/Proposed Port Expansion Activities
Even though port concession agreement has been signed for Ponnani port, no construction has been started yet.
C.7. Beypore Port
Beypore port is the oldest functioning port in Kozhikode district of Kerala. It is an important port as it ships almost half of the cargo demand of Union Territory of Lakshadweep Islands. It also services passenger ships from Kavaratti Island. Proximity of Beypore port to Cochin, one of the biggest cities in Kerala makes it important port for coastal and EXIM cargo trade. The port is located in the estuarine region of Chaliyar River.
C.7.1. Traffic
Beypore handled .128 MT in FY2016-17. Out of the total cargo handled, 0.128 MT was cargo for Union Territory of Lakshadweep.
C.7.2. Navigational Facilities
Since port is located in estuarine region, the mouth of river is stabilised with two groins on either banks of river. The average draft available is around 3m. The approach channel is duly highlighted with channel marker buoys.
C.7.3. Berth Details
The existing wharf is 314m long and has strength of 3.5 T/sqm. An additional berth of 200m is proposed to be constructed exclusively for Lakshadweep Islands.
C.7.4. Port Crafts/ Navigational Aids
Beypore port has no port crafts of its own.
C.7.5. Cargo handling facility
Beypore operates four stationary electric cranes, a Hydra 825 and LHM 180 for cargo handling purposes.

Kochi Bengaluru Industrial Corridor –Draft Perspective Plan for overall KBIC region - Draft
302
C.7.6. Storage Facilities
The cargo arriving at port is stored in 1400 sqm warehouses (1x 800 sqm and 2x 300 sqm).
C.7.7. Road and Rail Connectivity
Beypore port is just 10km away from Kochi and thus has good road and rail connectivity.
Figure 194 Google Earth image of Beypore Port
C.8. Inland Waterways
National Water 3 (NW3) is one of the major inland waterways in India. The west flowing rivers and backwaters with interlinking canals form a vast network of navigable waterway in Kerala. The NW 3 water way consists of West Coast Canal, Udyogmandal Canal and Champakara canal. The West Coast canal connects K0ttapuram in north and Kollam in south. The 183 Km long canal has 13 Terminal to facilitate cargo as well as passenger transport. The important terminals on West Coast Canal are Kottapuram, Aluva, Maradu, Vaikkom, Thannermukkom, Thrikkunnapuzha, Kayamkulam, Kollam, Allapuzha, CPEZ, Charva, Bolgatty and Willingdon Island. Most of the terminals have 30m long RCC jetty. Each terminal has 200 m2 covered storage godown and 400m2 open area for storage. Terminals also have a crane and forklift for cargo handling purpose. The Udyogmandal channel is 24.9 km (Cochin Port to Pathalam Bridge) long whereas the Champakara channel is 23.9 km long (Cochin Port to Amabalamugal FACT). The least available draft on NW-3 varies from 1m to 2.2m. It is the first waterway in India with 24hrs navigation facilities.

Kochi Bengaluru Industrial Corridor –Draft Perspective Plan for overall KBIC region - Draft
303
Figure 195 Inland waterways in Kerala
C.9. Capacity of Ports
Overall cargo handled at major ports in FY16-17 stands at 648.3 MT whereas minor ports handled 466 MT in same year. Over the years there has been as visible pattern wherein the share of cargo handled by minor ports has been increasing steadily. In Kerala, Cochin port is the only major port and handled 25 MT in FY16-17 which is 99% of cargo handled by state of Kerala.
C.9.1. Existing capacity
It is evident that the most of the cargo is handled by Cochin port. The existing capacity to handle cargo at Cochin port is 56.57MTPA. The installed capacity of other minor ports together is 0.14 MTPA.
Hence from the overall capacity sums up to be 56.71 MTPA out of which 25.14 MTPA was utilised FY 2016-17. The percentage utilisation of cargo handling capacity is about 44% and the summary of cargo handled is given in table below.

Kochi Bengaluru Industrial Corridor –Draft Perspective Plan for overall KBIC region - Draft
304
Table 162 Existing berth details and volume of cargo handled
Port Status Cargo Handled
No. of Berths
Total berth length (m)
Berth Occupancy (%)
Cargo Handled FY 16-17 (MTPA)
Draft at Berths (m)
Cochin Operational POL, Containers, Liquid and Dry Break Bulk
19 + 1 SBM
4800 25.6 25 9 to 14.5 (22.5 @ SPM)
Azhikkal Existing POL, General Cargo
1 37 NA 0.14 2
Thankassery Existing 1 117 6.5
Beypore Existing 1 314 3.5
Cochin port has surplus capacity of 31.6MTPA and the cargo-wise available capacity available is shown in figure below.
Figure 196 Cargo-wise available capacity at Cochin port
C.9.2. Projected capacity
In order to improve trade and industries in Kerala, the Government of Kerala has decided to develop the minor ports in State and make it a major contributor to EXIM trade in India. With the above stated objective in mind, Kerala ports will be adding almost 109 MTPA over the next few decades. The Table 3-2 below showcases the growth in capacities of ports under consideration.
Table 163 Projected capacity of ports
Port Year
2020 2025 2030 2035 2040 2045
Cochin 56.57 56.57 56.57 56.57 56.57 56.57
Vizhinjam 13.5 13.5 27 27 50.25 50.25
Ponnani 6.4 14.95 26 26 40.5 40.5
Azhikkal 2.7 5.5 7.1 11.7 13.2 13.2
Thankassery 2.7 2.7 2.7 5.7 5.7 5.7
Total 81.87 93.22 119.37 126.97 166.22 166.22
8
2
5.5
12
4
POL Products
Liquid Bulk
LNG
Containers
Break Bulk
Values are in MTPA
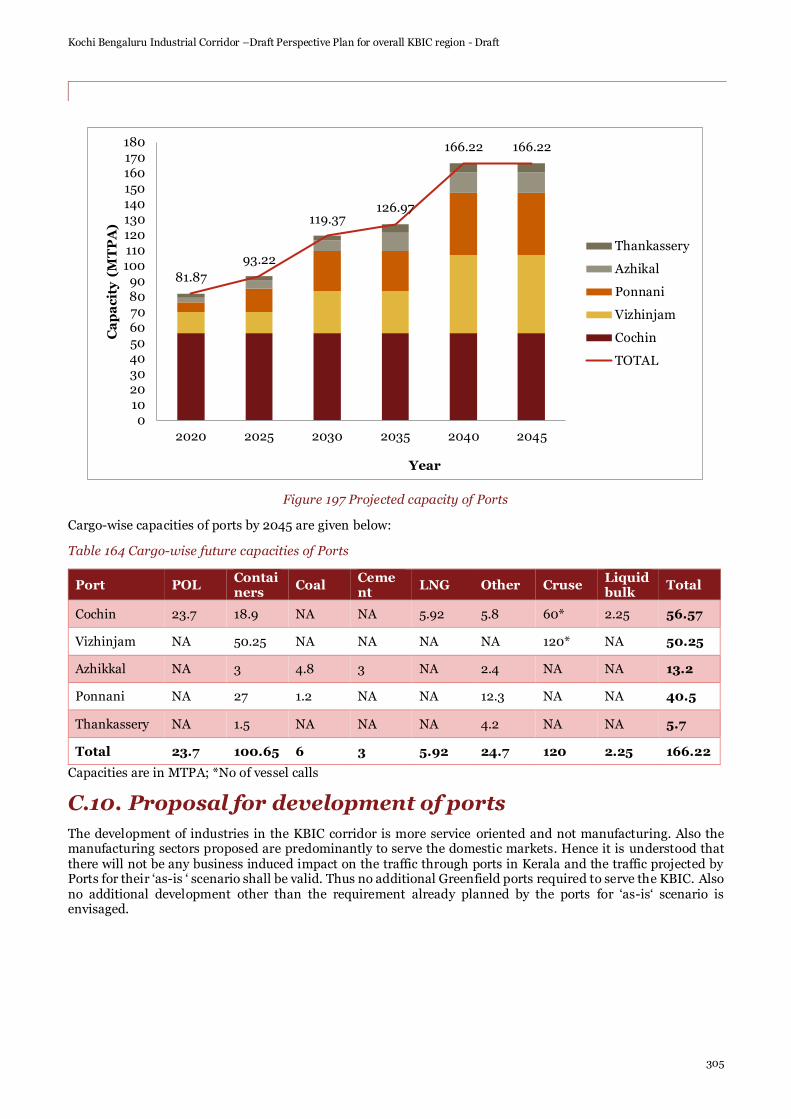
Kochi Bengaluru Industrial Corridor –Draft Perspective Plan for overall KBIC region - Draft
305
Figure 197 Projected capacity of Ports
Cargo-wise capacities of ports by 2045 are given below:
Table 164 Cargo-wise future capacities of Ports
Port POL Containers
Coal Cement
LNG Other Cruse Liquid bulk
Total
Cochin 23.7 18.9 NA NA 5.92 5.8 60* 2.25 56.57
Vizhinjam NA 50.25 NA NA NA NA 120* NA 50.25
Azhikkal NA 3 4.8 3 NA 2.4 NA NA 13.2
Ponnani NA 27 1.2 NA NA 12.3 NA NA 40.5
Thankassery NA 1.5 NA NA NA 4.2 NA NA 5.7
Total 23.7 100.65 6 3 5.92 24.7 120 2.25 166.22
Capacities are in MTPA; *No of vessel calls
C.10. Proposal for development of ports
The development of industries in the KBIC corridor is more service oriented and not manufacturing. Also the manufacturing sectors proposed are predominantly to serve the domestic markets. Hence it is understood that there will not be any business induced impact on the traffic through ports in Kerala and the traffic projected by Ports for their ‘as-is ‘ scenario shall be valid. Thus no additional Greenfield ports required to serve the KBIC. Also no additional development other than the requirement already planned by the ports for ‘as-is‘ scenario is envisaged.
81.87
93.22
119.37126.97
166.22 166.22
0102030405060708090
100110120130140150160170180
2020 2025 2030 2035 2040 2045
Ca
pa
cit
y (
MT
PA
)
Year
Thankassery
Azhikal
Ponnani
Vizhinjam
Cochin
TOTAL

Kochi Bengaluru Industrial Corridor –Draft Perspective Plan for overall KBIC region - Draft
306
Appendix D. - Road inventory D.1. Road details – KBIC
Stretch number 1
NH /SH number SH 66
Connecting Places Alappuzha to Thoppumpady
Approximate Stretch Length 52km
District Alappuzha/ Ernakulam
Lane Configuration 2 Lane undivided
ROW (m) 8 – 15
Land Use Residential
Major Settlements Alappuzha , Mararikulam ,Arthunkal , Ottamassery ,Pallithodu , Kannamaly ,Thoppumpadi.
Traffic Level Medium
Pavement Condition Good
Remarks • Bus Route from Alappuzha to Cherthala
• At grade level crossings are present
• Cochin Fisheries Harbour located at Thoppumpady.
• Educational Institutions are present
• Connectivity to Tourist spots Willingdon Island,Mattanchery,Fort Kochi etc
• Road width and ROW inside the towns are less.

Kochi Bengaluru Industrial Corridor –Draft Perspective Plan for overall KBIC region - Draft
307
Stretch number 2
NH /SH number NH 66
Connecting Places Trivandrum – Kasargode (Panvel to Kanyakumari)
Approximate Stretch Length 670 km in Kerala (1622 km)
States Kerala
Lane Configuration 4 Lane Divided road
2 Lane undivided road
ROW (m) 20 - 30
Land Use Open Land/Agricultural
Major Settlements
Kannur, Thalassery, Kozhikode, Feroke, Ramanattukara, Tirurangadi, Kottakkal, Valanchery, Ponnani, Kochi, Alappuzha, Kollam, Thiruvananthapuram
Traffic Level High
Pavement Condition Pavement condition is good
Remarks • 4 lane Construction from Kazhakootam to Eanchakal and Karamana to Kaliyikkavila in Trivandrum city is progressing
• Construction works are ongoing in the Kerala stretch
• NH 66 connects the major sea ports International Container Transshipment Terminal, Kochi, Trivandrum Vizhinjam Port and other important ports like Beypore Port, Kozhikode and Kollam Port.
• NH 66 allows for the movement of goods by trucks (lorries) from the rural areas to the major sea ports of India
• Many industries have been set up along NH 66
• High Vehicle density at Junctions

Kochi Bengaluru Industrial Corridor –Draft Perspective Plan for overall KBIC region - Draft
308
• Educational Institutions and Hospital are present
• Road meet major junctions at NH 766 in Kozhikode,NH 966 in Ramanattukara,NH 966A in Cheranelloor in Kochi,NH 544 Edapally in Kochi,NH 966B in Kundannoor Kochi,NH 183A Titanium Jn in Kollam,NH 183 High School Jn in Kollam,NH 744 Chinnakada in Kollam.
• Some portions of roads are damaged
• Agricultural lands are present
• Bridge Construction work at Ramanattukara & Thondayadu
• Vacant lands are present along the stretch.
• Road width and ROW inside the towns are less.

Kochi Bengaluru Industrial Corridor –Draft Perspective Plan for overall KBIC region - Draft
309
Stretch number 3
NH /SH number SH 11
Connecting Places Alappuzha - Changanassery
Approximate Stretch Length 25 km
District Alappuzha - Kottayam
Lane Configuration 2 lane undivided
ROW (m) 10-20
Major Land Use Residential/Agricultural Land
Major Settlements Alappuzha (starts at NH 66)Kalarcode - Pazhaveedu - Pallathuruthy - Nedumudy - Mancombu - Ramankari - Kidangara - Changanassery
Traffic Level Medium
Pavement Condition Good
Remarks • Agricultural lands are present on both sides
• Busroutes from Alappuzha to Changanassery
• Road passes through low lying areas of Kuttanad
• Road is prone to flooding during monsoon seasons

Kochi Bengaluru Industrial Corridor –Draft Perspective Plan for overall KBIC region - Draft
310
Stretch number 4
NH /SH number SH 12
Connecting Places Ambalapuzha - Thiruvalla
Approximate Stretch Length 27.5 km
District Alappuzha - Pathanamthitta
Lane Configuration 2 lane undivided
ROW (m) 10-20
Major Land Use Residential/Agricultural Land
Major Settlements Ambalapuzha (NH 66) - Thakazhy - Thalavady - Podiyadi junction,Thiruvalla (MC Road)
Traffic Level Medium
Pavement Condition Good
Remarks • Agricultural lands are present on both sides
• High Vehicle density at Junctions
• Busroutes from Alappuzha to Thiruvalla
• At grade rail road crossing at Sankaramanagalam
• State ware house at Thakazhy
• Railway Station at Ambalapuzha
• Road width and ROW inside the towns are less.

Kochi Bengaluru Industrial Corridor –Draft Perspective Plan for overall KBIC region - Draft
311
Stretch number 5
NH /SH number SH 6
Connecting Places Kayamkulam - Thiruvalla
Approximate Stretch Length 31 km
District Alappuzha - Pathanamthitta
Lane Configuration 2 lane undivided
ROW (m) 10-20
Major Land Use Residential/Commercial
Major Settlements Kayamkulam , Chettikulangara ,Mavelikkara , Chennithala , Mannar ,Parumala , Pulikeezhu , Kavumbhagom , Thiruvalla.
Traffic Level Medium
Pavement Condition Good
Remarks • Educational Institutions are present
• High Vehicle density at Junction.
• Travancore Sugars & Chemicals Ltd factory in Thiruvalla
• Bus route from Kayamkulam to Thiruvalla
• Road width and ROW inside the towns are less.

Kochi Bengaluru Industrial Corridor –Draft Perspective Plan for overall KBIC region - Draft
312
Stretch number 6
NH /SH number SH 42
Connecting Places Kumarakom – Cumbammettu – Cumbam
Approximate Stretch Length 183km
District Kottayam - Ernakulam - Idukki
Lane Configuration 2 lane undivided
ROW (m) 10-20
Major Land Use Residential/Commercial
Major Settlements Kumarakom– Kaduthuruthy Piravam–Thodupuzha - Velliyamattom – Kulamavu – Cheruthoni –Cumbammettu – Cumbam
Traffic Level Medium
Pavement Condition Good
Remarks • Educational Institutions are present
• Road towards tourist Spot Kumarakom
• Road passes through low lying areas
• Road is prone to flooding during monsoon seasons

Kochi Bengaluru Industrial Corridor –Draft Perspective Plan for overall KBIC region - Draft
313
Stretch number 7
NH /SH number SH 1
Connecting Places Kesavadasapuram -Angamaly,
Approximate Stretch Length 245 Km
District Thiruvanathapuram , Kollam,Ernakulam
Lane Configuration 2 lane undivided
ROW (m) 10-20
Major Land Use Residential/Commercial
Major Settlements Kesavadasapuram, Kilimanoor, Nilamel, Chadayamangalam, Ayoor, Kottarakkara, Adoor, Pandalam, Chengannur, Tiruvalla, Changanassery, Kottayam, Ettumanoor, Kuravilangad, Koothattukulam, Muvattupuzha, Perumbavoor,Angamaly
Traffic Level Medium
Pavement Condition Good
Remarks • Educational Institutions are present along the stretch
• High Vehicle density at Junctions
• Road also Known as MC Road
• Popular route to access the Pilgrim centre Sabarimala
• Industries like Transformers And Electricals Kerala Ltd.(TELK in Angamaly, Tolins Tyres Pvt. Ltd . Tread Rubber Industry,Kerala State Bamboo Corporation are present along the stretch
• Rubber plantations and Agricultural lands are present
• Road width and ROW inside the towns are less.
• Few section of this road is upgraded to NH 183
• Popular route to access the Sabarimala

Kochi Bengaluru Industrial Corridor –Draft Perspective Plan for overall KBIC region - Draft
314

Kochi Bengaluru Industrial Corridor –Draft Perspective Plan for overall KBIC region - Draft
315
Stretch number 8
NH /SH number SH 15
Connecting Places Ettumanoor -Pulikal
Approximate Stretch Length 58 Km
District Kottayam- Ernakulam
Lane Configuration 2 lane undivided
ROW (m) 10-20
Major Land Use Residential
Major Settlements Ettumanoor - Kuruppumthara - Thalayolaparambu- Vaikom- - Thripunithura - Vyttila - Pulikkal junction
Traffic Level Medium
Pavement Condition Good
Remarks • At Pulikkal junction it joins with NH66
• Educational Institutions are present
• Government Ayurveda College Hospital at Trippunithura
• Agricultural lands are present
• Bus routes from Kottayam to Ernakulam
• Road width and ROW inside the towns are less.

Kochi Bengaluru Industrial Corridor –Draft Perspective Plan for overall KBIC region - Draft
316
Stretch number 9
NH /SH number SH 40
Connecting Places Alappuzha -Cumbummettu
Approximate Stretch Length 183 Km
District Alappuzha- Ernakulam-Idukki
Lane Configuration 2 lane undivided
ROW (m) 10-25
Major Land Use Residential/Agricultural Land
Major Settlements Alappuzha , Muhamma ,Thanneermukkam ,Thalayolaparambu , Peruva ,Mutholapuram ,Koothattukulam , ,Thodupuzha ,Kodikulam, Kanjikkuzhy,Nedumkandam , Thookkupalam ,Cumbummettu.
Traffic Level Medium
Pavement Condition Good
Remarks • Educational Institutions like M.E.S College ,M.G University College of Teacher Education ,Govt. Polytechnic College are present
• Thaneermukkam bund is present along the stretch at Kuttanadu to prevent tidal action and intrusion of salt water into the Kuttanad low-lands
• Bus routes from Alappuzha,Ernakulam and idukki
• Road width and ROW inside the towns are less.
• Agricultural lands are present

Kochi Bengaluru Industrial Corridor –Draft Perspective Plan for overall KBIC region - Draft
317

Kochi Bengaluru Industrial Corridor –Draft Perspective Plan for overall KBIC region - Draft
318
Stretch number 10
NH /SH number SH 32
Connecting Places Athirampuzha - Poonjar.
Approximate Stretch Length
38 Km
District Kottayam
Lane Configuration 2 lane undivided
ROW (m) 10-25
Major Land Use Residential/Agricultural Land
Major Settlements Athirampuzha - Ettumanoor - Kidangoor - Cherpunkal - Mutholy - Pala Market - Bharananganam town - Erattupetta town - Poonjar
Traffic Level Medium
Pavement Condition Good
Remarks • Tourist spots like Poonjar Palace, Vagamon etc
• Educational Institutions like College of Engineering, Poonjar,Govt Polytechnic are present
• Railway station is Present at Ettumanoor
• Rubber Estates are present at Erattupetta
• Industrial Estate is located at Athirampuzha
Stretch number 11
NH /SH number SH 9
Connecting Places Kanjikuzhi - Kozhencherry.
Approximate Stretch Length
District Kottayam & Pathanamthitta
Lane Configuration 2 lane undivided
ROW (m) 10-25
Major Land Use Residential/Agricultural Land
Major Settlements Athirampuzha - Ettumanoor - Kidangoor - Cherpunkal - Mutholy - Pala Market - Bharananganam town - Erattupetta town - Poonjar
Traffic Level Medium
Pavement Condition Good
Remarks • Tourist spots like Poonjar Palace, Vagamon etc
• Educational Institutions like College of Engineering, Poonjar,Govt Polytechnic are present
• Railway station is Present at Ettumanoor
• Rubber Estates are present at Erattupetta
• Industrial Estate is located at Athirampuzha

Kochi Bengaluru Industrial Corridor –Draft Perspective Plan for overall KBIC region - Draft
319
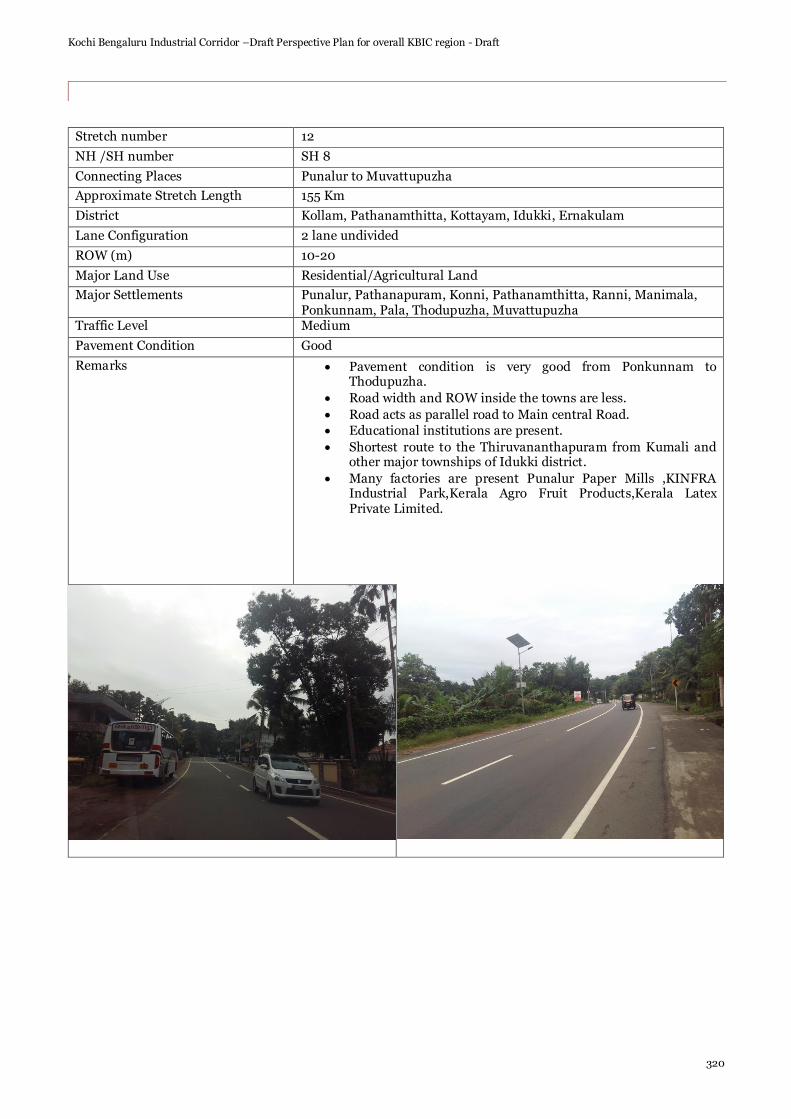
Kochi Bengaluru Industrial Corridor –Draft Perspective Plan for overall KBIC region - Draft
320
Stretch number 12
NH /SH number SH 8
Connecting Places Punalur to Muvattupuzha
Approximate Stretch Length 155 Km
District Kollam, Pathanamthitta, Kottayam, Idukki, Ernakulam
Lane Configuration 2 lane undivided
ROW (m) 10-20
Major Land Use Residential/Agricultural Land
Major Settlements Punalur, Pathanapuram, Konni, Pathanamthitta, Ranni, Manimala, Ponkunnam, Pala, Thodupuzha, Muvattupuzha
Traffic Level Medium
Pavement Condition Good
Remarks • Pavement condition is very good from Ponkunnam to Thodupuzha.
• Road width and ROW inside the towns are less.
• Road acts as parallel road to Main central Road.
• Educational institutions are present.
• Shortest route to the Thiruvananthapuram from Kumali and other major townships of Idukki district.
• Many factories are present Punalur Paper Mills ,KINFRA Industrial Park,Kerala Agro Fruit Products,Kerala Latex Private Limited.

Kochi Bengaluru Industrial Corridor –Draft Perspective Plan for overall KBIC region - Draft
321
Stretch number 13
NH /SH number NH 183
Connecting Places Kollam - Dindigul
Approximate Stretch Length 216.30 in Kerala (342 km )
District Kollam, Kottayam, Idukki
Lane Configuration 2 lane undivided
ROW (m) 10-30
Major Land Use Residential/Agricultural Land
Major Settlements Kollam , Thevally , Anchalumoodu , Kadavoor , Kundara ,Bharanikkavu ,Chakkuvally, Kollakadavu , Chengannur , Thiruvalla ,Changanassery , Kottayam ,Pampady , Kanjirapalli , Kumily , Theni.
Traffic Level Medium
Pavement Condition Good
Remarks • Educational institutions are present.
• Tecnopark at Kundara
• Industries like Kerala Electricals Limited, Aluminium Industry Limited are present along the stretch
• Divided roads at junctions
• Road width and ROW inside the towns are less.
• At Junctions traffic is high
• Agricultural lands are present
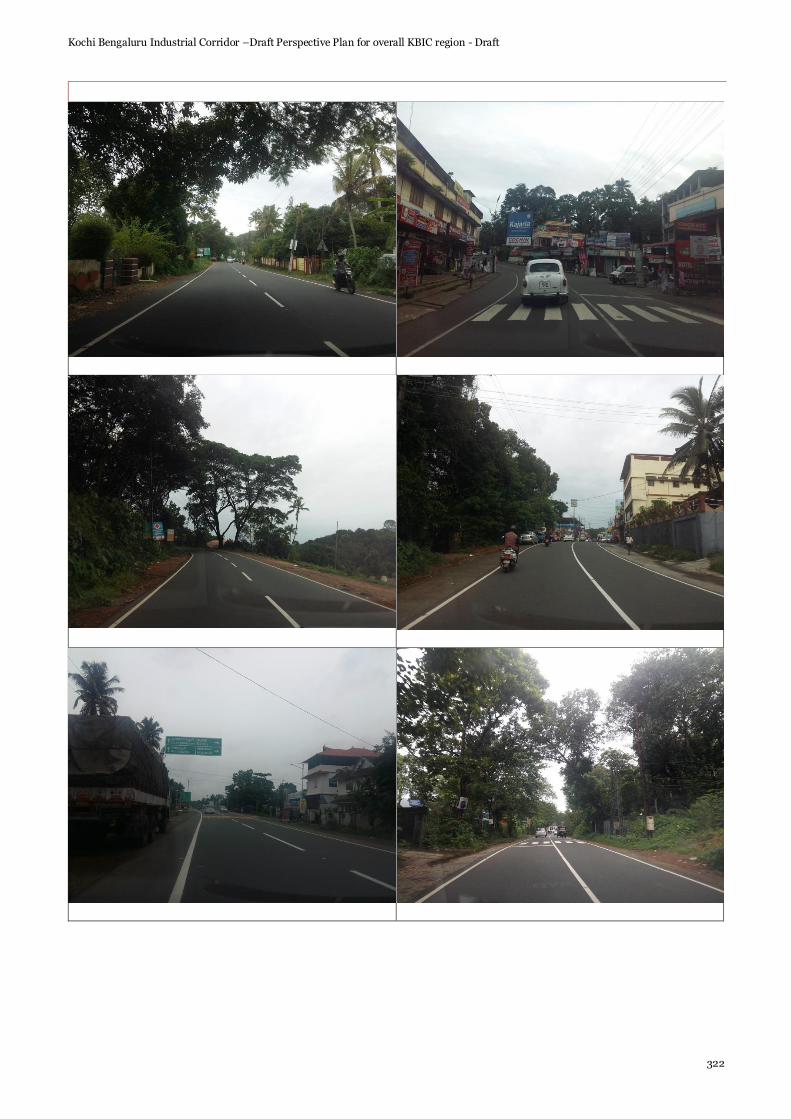
Kochi Bengaluru Industrial Corridor –Draft Perspective Plan for overall KBIC region - Draft
322

Kochi Bengaluru Industrial Corridor –Draft Perspective Plan for overall KBIC region - Draft
323
Stretch number 14
NH /SH number NH 183 A
Connecting Places Kollam - Vandiperiyar
Approximate Stretch Length
116.80Km
District Kollam, Pathanamthitta.Idukki
Lane Configuration 2 lane undivided
ROW (m) 10-25
Major Land Use Residential/Agricultural Land
Major Settlements Sasthamkotta , Adoor , Anandapally , Thatta , Kaipattoor , Omalloor , Pathanamthitta , Mylapra , Mannarakulanji , Kumplampoika ,Vadasserikkara , Perunad , Lahai , Plappally , Gavi , Vandiperiyar
Traffic Level Medium
Pavement Condition Good
Remarks • Educational institutions are present.
• Bus Routes are present
• Road width and ROW inside the towns are less.
• Road passes through Periyar National Park
• Tea, coffee and pepper plantations are present along the stretch at Vandiperiyar
• Kakki reservoir is present along road side

Kochi Bengaluru Industrial Corridor –Draft Perspective Plan for overall KBIC region - Draft
324
Stretch number 15
NH /SH number SH 41
Connecting Places Palarivattom - Thekkady
Approximate Stretch Length 155 Km
District Ernakulam - Idukky
Lane Configuration 2 lane undivided
ROW (m) 10-15
Major Land Use Residential/Agricultural Land
Major Settlements Palarivattom , Kakkanad , Pallikkara , Kizhakkambalam , Pattimattom , Valamboor , Muvattupuzha , Pandappilly,Manakkad , Thodupuzha , Moolamattom , Vagamon ,Chottupara ,Upputhara , Kumily ,Thekkadi
Traffic Level Medium
Pavement Condition Good
Remarks • Vaccant lands are present.
• Road width and ROW inside the towns are less.
• Educational institutions are present.
• Some portions of roads are damaged.
• Bus routes are available.
• Tourist places like Thekkadi and Vagamon.
• Along road side spices and coffee plantations are present.
• Commercial area at junctions.
• Agricultural lands are present.

Kochi Bengaluru Industrial Corridor –Draft Perspective Plan for overall KBIC region - Draft
325
Stretch number 16
NH /SH number NH 85
Connecting Places Kundanoor – Thondi Point
Approximate Stretch Length
168 Km in Kerala (Kundanoor – Bodimetu) (413 Km)
District Ernakulam - Idukky
Lane Configuration 2 lane undivided
ROW (m) 10-20
Major Land Use Residential/Agricultural Land
Major Settlements Kundanoor, Ernakulam, Muvattupuzha, Kothamangalam, Adimali, Munnar, Devikulam
Traffic Level Medium
Pavement Condition Good
Remarks • Road meets major junctions at Theni with NH 183,Kundanoor with NH 66,Adimaly with NH 185
• One way system is adopted inside Muvattupuzha Town
• Educational institutions are present.
• Some portions of roads are damaged.
• Bus routes from Eranakulam to Munnar
• At Munnar tea estates and coffee plantations are present.
• Agricultural lands are present.
• Road width and ROW inside the towns are less.

Kochi Bengaluru Industrial Corridor –Draft Perspective Plan for overall KBIC region - Draft
326
Stretch number 17
NH /SH number SH 43
Connecting Places Muvattupuzha - Theni
Approximate Stretch Length 105 Km
District Ernakulam - Idukky
Lane Configuration 2 lane undivided
ROW (m) 10-20
Major Land Use Residential/Agricultural Land
Major Settlements Muvattupuzha ,Kalloorkad , Kodikulam , Idukki , Mariyapuram , Erattayar ,Kattappana , Puliyanmala , Chettukuzhi, Cumbammettu
Traffic Level Medium
Pavement Condition Good
Remarks • Road meets at Theni with NH 183
• One way system is adopted inside Muvattupuzha Town
• Educational institutions are present.
• Some portions of roads are damaged.
• Bus routes are present
• Cardamom plantations are present
• Road width and ROW inside the towns are less.
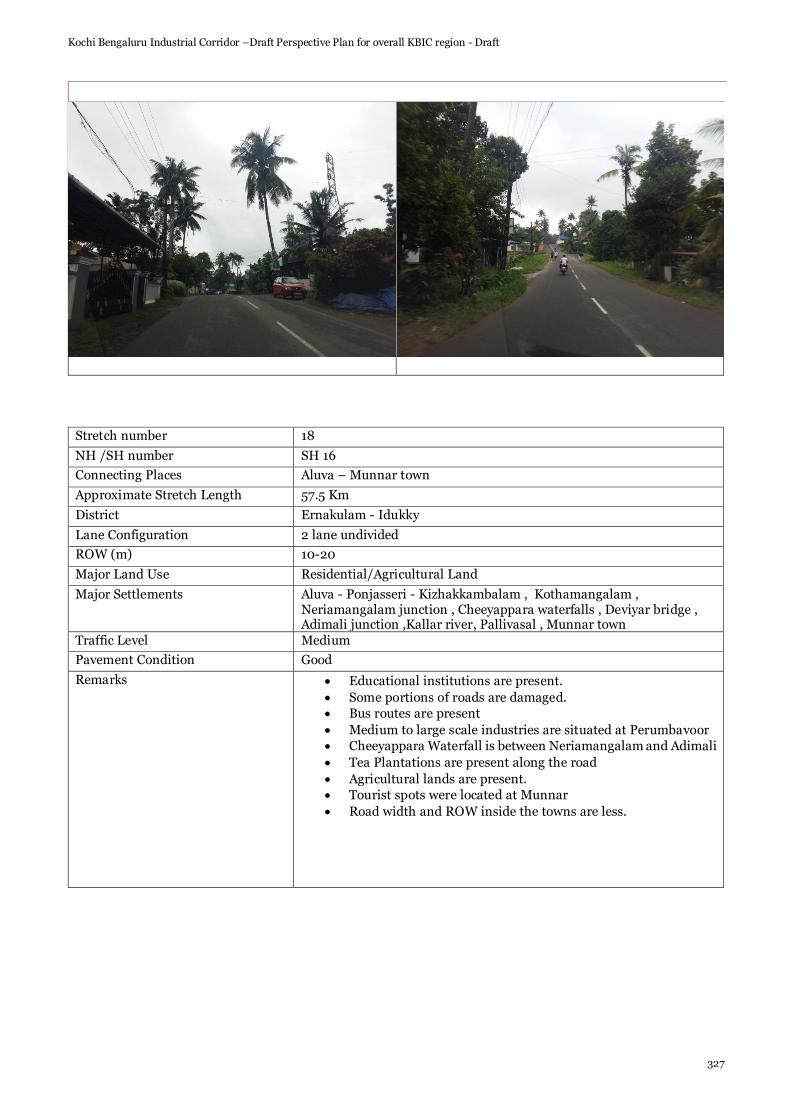
Kochi Bengaluru Industrial Corridor –Draft Perspective Plan for overall KBIC region - Draft
327
Stretch number 18
NH /SH number SH 16
Connecting Places Aluva – Munnar town
Approximate Stretch Length 57.5 Km
District Ernakulam - Idukky
Lane Configuration 2 lane undivided
ROW (m) 10-20
Major Land Use Residential/Agricultural Land
Major Settlements Aluva - Ponjasseri - Kizhakkambalam , Kothamangalam , Neriamangalam junction , Cheeyappara waterfalls , Deviyar bridge , Adimali junction ,Kallar river, Pallivasal , Munnar town
Traffic Level Medium
Pavement Condition Good
Remarks • Educational institutions are present.
• Some portions of roads are damaged.
• Bus routes are present
• Medium to large scale industries are situated at Perumbavoor
• Cheeyappara Waterfall is between Neriamangalam and Adimali
• Tea Plantations are present along the road
• Agricultural lands are present.
• Tourist spots were located at Munnar
• Road width and ROW inside the towns are less.

Kochi Bengaluru Industrial Corridor –Draft Perspective Plan for overall KBIC region - Draft
328

Kochi Bengaluru Industrial Corridor –Draft Perspective Plan for overall KBIC region - Draft
329
Stretch number 19
NH /SH number NH 544
Connecting Places Ernakulam - Salem
Approximate Stretch Length
169 Km in Kerala (340 Km)
District Ernakulam – Thrissur-Palakkad-Coimbatore-Salem
Lane Configuration 6 lane divided
• Vadakkencherry to Mannuthy
• After Coimbatore bypass toll -Chengapalli 4 lane divided
• Kochi to Madukarai
• Neelambur to Salem 2 lane divided with paved shoulder
• Madukarai to Neelambur
ROW (m) 20-50
Major Land Use Vaccant land /Residential area
Major Settlements Ernakulam,Aluva,Angamaly,Thrissur,Palakkad,Walayar,Karumathampatty, Avinashi,Perundurai,Erode
Traffic Level High
Pavement Condition Good
Remarks • Educational Institutions, Hospitals are present in this stretch.
• Bus routes are present.
• Construction of tunnel going on at Kuthiran in Thrissur.
• The pavement condition is poor in the stretches where construction of tunnel and bridge work and road work progressing areas
• Toll Plazas are present at Paliyekkara, Pampampallam, Coimbatore Bypass Tolls, Kaniyur, Vijayamangalam and Vaikundam.
• Construction works are going on at Chalakudy and Vadakkencherry to Mannuthy stretch
• Many small and large scale industries are located along the stretch.
• Apollo Tyre Factory at Perambra.
• Malabar cement factory at Walayar, ACC cement factory at Madhukarai is located along the road side.
• The road handles very high truck traffic, especially trucks carrying cement from the nearby cement factories
• Six lane road from Pudukkad till Paliyekkara toll plaza.
• Tourist buses from Kochi use this road to reach Coimbatore,Salem,Chennai.
• Road meets major junctions at NH 44 in Salem, NH 381A in Sankagiri,NH 544H in Erode, NH 381 in Avinashi,NH 81, NH 181 in Coimbatore,NH 83, NH 948 in Coimbatore ,NH 966 in Palakkad, NH 66 in Kochi, Kerala.

Kochi Bengaluru Industrial Corridor –Draft Perspective Plan for overall KBIC region - Draft
330

Kochi Bengaluru Industrial Corridor –Draft Perspective Plan for overall KBIC region - Draft
331
Stretch number 20
NH /SH number SH 22
Connecting Places Kodungallur- Shornur
Approximate Stretch Length
71 Km
District Thrissur - Palakkad
Lane Configuration 2 lane undivided with paved shoulder
ROW (m) 10-20
Major Land Use Residential/Agricultural Land
Major Settlements Kodungallur, Vellangallur, Irinjalakuda, Mapranam, Karuvannur, Urakam, Perumbillissery, Chevoor,Palakkal,Koorkanchery,Kokkalai,Kuruppam Road,Thrissurround,Viyyoor,Mulangunnathuthukavu,Wadakkanchery,Vazhacode Junction,Cheruthuruthy,Shornur
Traffic Level Medium
Pavement Condition Good
Remarks • Presence of educational institutions and hospitals along the stretch
• Major portions of roads are damaged.
• Bus route from Thrissur to Shornur
• Central Prison at Viyyoor
• Wadakkanchery ,Vallamkulam and Shornur railway stations are present along the stretch
• Agricultural lands are present.
• At Junctions divided roads are present
• Road width and ROW inside the towns are less.
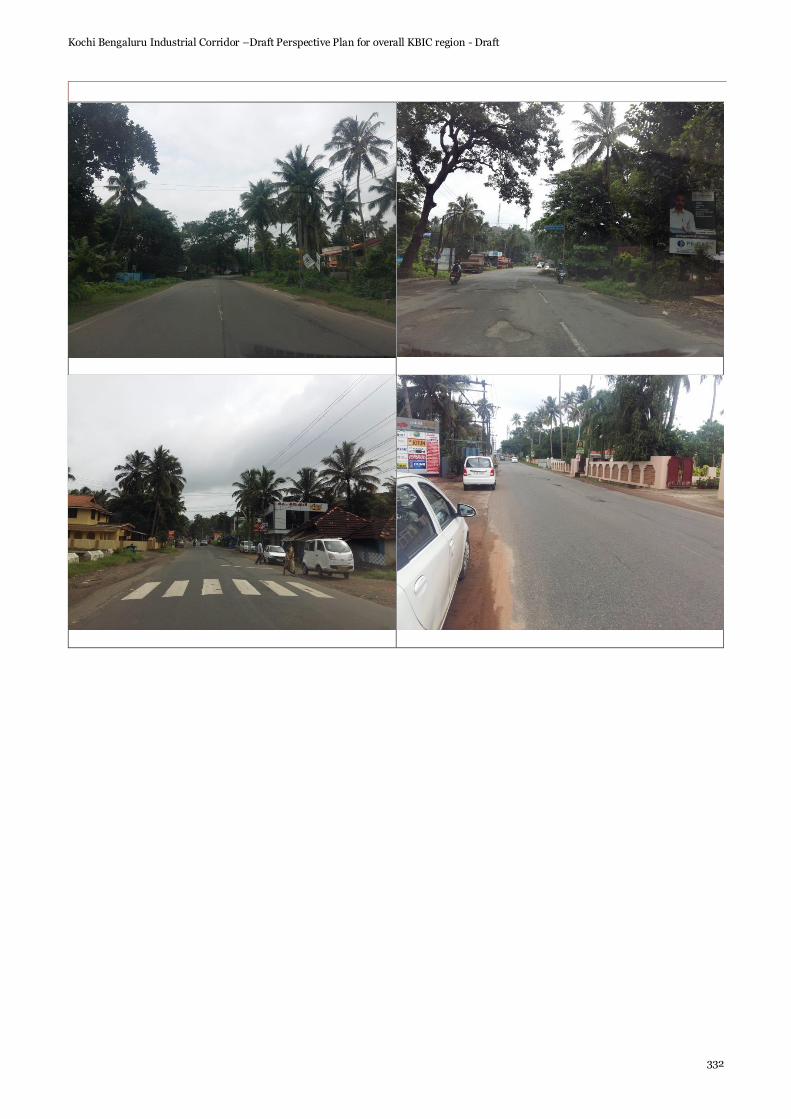
Kochi Bengaluru Industrial Corridor –Draft Perspective Plan for overall KBIC region - Draft
332

Kochi Bengaluru Industrial Corridor –Draft Perspective Plan for overall KBIC region - Draft
333
Stretch number 21
NH /SH number SH 61
Connecting Places Potta - Moonupedika
Approximate Stretch Length 44.5 Km
District Thrissur
Lane Configuration 2 lane undivided
ROW (m) 10-20
Major Land Use Residential/Agricultural Land
Major Settlements Potta , Irinjalakuda , Padiyur , Moonupeedika
Traffic Level Medium
Pavement Condition Good
Remarks • The road stretch starts from NH 544 at Potta and meets NH 66 at Moonupeedika
• Busroutes from Potta to Irinjalukuda
• Cashew factory at Allur
• Agricultural lands are present.
• Road width and ROW inside the towns are less.
• Hospitals are present between Potta and Irinjalakuda road
• Main road to Irinjalakuda Railway Station

Kochi Bengaluru Industrial Corridor –Draft Perspective Plan for overall KBIC region - Draft
334

Kochi Bengaluru Industrial Corridor –Draft Perspective Plan for overall KBIC region - Draft
335
Stretch number 22
NH /SH number SH 51
Connecting Places Kodakara - Kodungallur
Approximate Stretch Length 27 Km
District Thrissur
Lane Configuration 2 lane undivided
ROW (m) 10-20
Major Land Use Residential
Major Settlements Kodakara,Aloor,Mala,Kodungallur
Traffic Level Medium
Pavement Condition Good
Remarks • The road stretch starts from NH 544 at Kodakara
• Road width and ROW inside the towns are less.
• Agricultural lands are present
• Educational Institutions, hospitals are present between Kodakara and Kodungallur Road
• Bus routes from Thrissur to Kodungallur
• Road width and ROW inside the towns are less.

Kochi Bengaluru Industrial Corridor –Draft Perspective Plan for overall KBIC region - Draft
336

Kochi Bengaluru Industrial Corridor –Draft Perspective Plan for overall KBIC region - Draft
337
Stretch number 23
NH /SH number SH 21
Connecting Places Chalakudy – State Boundary
Approximate Stretch Length 80 Km
District Thrissur
Lane Configuration 2 lane undivided
ROW (m) 8-20
Major Land Use Residential/Vaccant Land
Major Settlements Chalakudy
Traffic Level Medium
Pavement Condition Good
Remarks • The road stretch starts from NH 544 at Chalakudy and ends in state boundary
• Road towards tourist spots like Athirappilly Waterfalls,Vazhachal falls etc
• Bus routes are present
• Road width and ROW inside the towns are less.

Kochi Bengaluru Industrial Corridor –Draft Perspective Plan for overall KBIC region - Draft
338

Kochi Bengaluru Industrial Corridor –Draft Perspective Plan for overall KBIC region - Draft
339
Stretch number 24
NH /SH number SH 75
Connecting Places Thrissur - Vadanappally
Approximate Stretch Length 16.5 Km
District Thrissur
Lane Configuration 2 lane undivided
ROW (m) 8-20
Major Land Use Residential/Agricultural Land
Major Settlements Thrissur , Olarikkara , Elthuruth , Manakody , Kunnathangadi , Arimpoor , Kanjany ,kandassankadavu, Vadanappally
Traffic Level Medium
Pavement Condition Poor
Remarks • Bus Routes from Thrissur to Chettuva
• Road Construction works are going on in some places
• Road condition in the above section is observed to be poor
• Agricultural lands are present on both sides
• The road stretch ends in NH 66 at Vadanappally
• Major portions of roads are damaged
• Road width and ROW inside the towns are less.

Kochi Bengaluru Industrial Corridor –Draft Perspective Plan for overall KBIC region - Draft
340

Kochi Bengaluru Industrial Corridor –Draft Perspective Plan for overall KBIC region - Draft
341
Stretch number 25
NH /SH number SH 69
Connecting Places Thrissur - Thrikkanapuram
Approximate Stretch Length 53 Km
District Thrissur,Malappuram
Lane Configuration 2 lane undivided
ROW (m) 8-20
Major Land Use Residential/Agricultural Land
Major Settlements Thrissur ,Poonkunnam , Mundur,Kunnamkulam ,Perumpilavu ,Naduvattom ,Edappal ,Thavanoor , Thrikkanapuram
Traffic Level Medium
Pavement Condition Good
Remarks • Bus routes from Thrissur to Malappuram
• Agricultural lands are present on road sides
• Some portions of roads are damaged
• Four lane divided road from Puzhakkal to Mundur
• Educational Institutions, Hospitals are present between Thrissur –Thrikkanapuram
• Road width and ROW inside the towns are less.

Kochi Bengaluru Industrial Corridor –Draft Perspective Plan for overall KBIC region - Draft
342
Stretch number 26
NH /SH number SH 76
Connecting Places Kuranchery - Kechery
Approximate Stretch Length 12.9 Km
District Thrissur
Lane Configuration 2 lane undivided
ROW (m) 8-15
Major Land Use Residential
Major Settlements Kuranchery ,Mundathikode , Velur , Kechery
Traffic Level Low
Pavement Condition Good
Remarks • Bus routes from Thrissur to Kechery • Agricultural lands are present on road sides • Road width and ROW inside the towns are less.
• Educational Institutions, Hospitals are present along the stretch
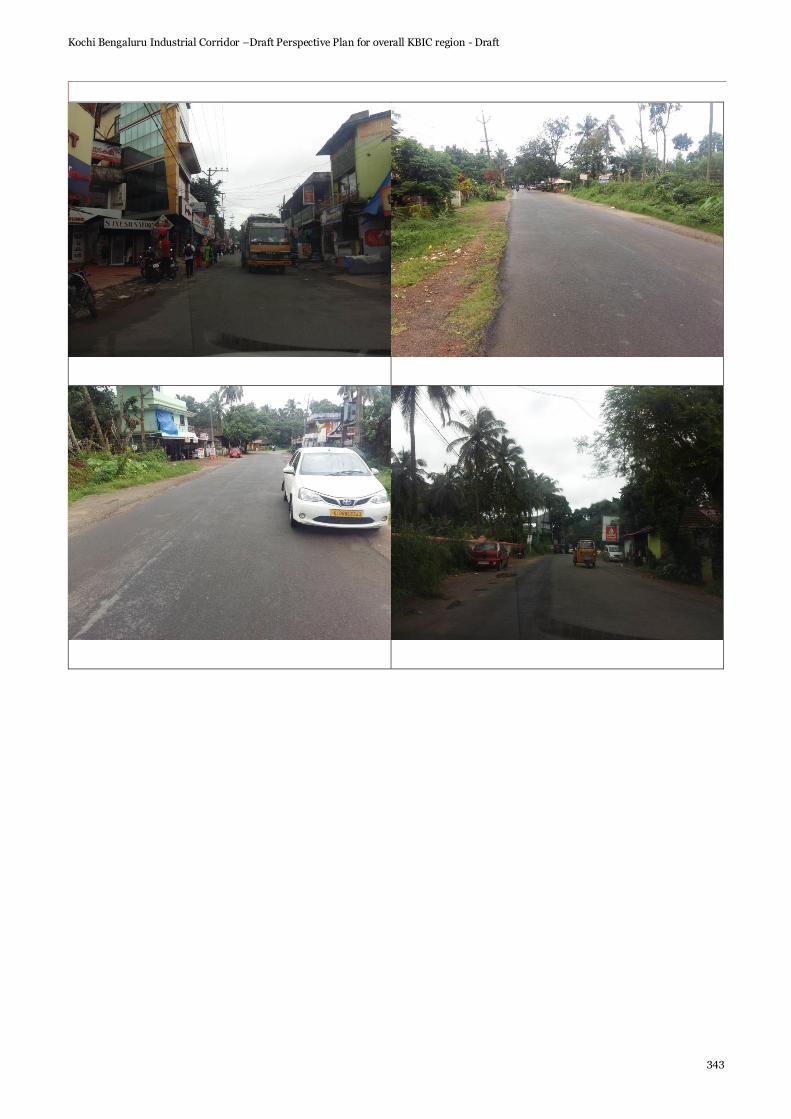
Kochi Bengaluru Industrial Corridor –Draft Perspective Plan for overall KBIC region - Draft
343

Kochi Bengaluru Industrial Corridor –Draft Perspective Plan for overall KBIC region - Draft
344
Stretch number 27
NH /SH number SH 49
Connecting Places Guruvayoor - Choondal
Approximate Stretch Length 7.4 Km
District Thrissur
Lane Configuration 2 lane undivided
ROW (m) 8-15
Major Land Use Residential
Major Settlements Guruvayoor, Chowallurpady , Choondal
Traffic Level Medium
Pavement Condition Good
Remarks • Bus routes from Thrissur to Guruvayoor
• Road connects Thrissur to Guruvayoor
• Paddy Fields are present.
• Road width and ROW inside the towns are less.

Kochi Bengaluru Industrial Corridor –Draft Perspective Plan for overall KBIC region - Draft
345
Stretch number 28
NH /SH number SH 50
Connecting Places Chavakkad – Wadakkancherry
Approximate Stretch Length 32 Km
District Thrissur
Lane Configuration 2 lane undivided with Paved shoulder
ROW (m) 8-15
Major Land Use Residential/Commercial
Major Settlements Chavakkad,Mammiyoor,Kottapadi,Kunnamkulam,Marathamcode, Pannithadam,Vellarakad,Erumapetty,Wadakkancherry
Traffic Level Medium
Pavement Condition Good
Remarks • Bus routes from Chavakkad to Guruvayoor
• From Kottapadi carriage way reduces to 5.5m
• Agricultural lands are present on both sides of road.
• Educational Institutions, hospitals are present in this stretch
• Some portions of roads are damaged

Kochi Bengaluru Industrial Corridor –Draft Perspective Plan for overall KBIC region - Draft
346
Stretch number 29
NH /SH number SH 28
Connecting Places Kozhikode – Gudallur Highway
Approximate Stretch Length 104 Km
District Kozhikode,Malappuram
Lane Configuration 2 lane undivided
ROW (m) 8-20
Major Land Use Residential/Commercial
Major Settlements Cheruvannur-Feroke-Petta-Ramanattukara-Velluvambram - Manjeri junction - Nilambur - Chungathara - Edakkara - Vazhikadavu
Traffic Level Medium
Pavement Condition Good
Remarks • Heavy Traffic is found at Junctions
• Subjail Junction To Eranjipalam 4 lane divided road
• Some portions of roads are damaged
• At Ramanattukara Junction road meets at NH 66
• Agricultural lands are present
• Educational Institutions, hospitals are present in this stretch
• Bus route from Kozhikode to Malappuram
• Some Indudtrial Establishments are found.
• Road width and ROW inside the towns are less.

Kochi Bengaluru Industrial Corridor –Draft Perspective Plan for overall KBIC region - Draft
347
Stretch number 30

Kochi Bengaluru Industrial Corridor –Draft Perspective Plan for overall KBIC region - Draft
348
NH /SH number NH 766
Connecting Places Kozhikode – Kollegal(Karnataka)
Approximate Stretch Length
272 Km (117.60 in Kerala )
States Kerala,Karnataka
Lane Configuration 2 lane undivided with paved shoulder
ROW (m) 15-35
Major Land Use Residential/Vaccant Land
Major Settlements Malaparambu,Kunnamangalam,Koduvally,Thamarassery,Vythiri,Kalpetta Meenangadi,Sultan Bathery,Muthanga
Traffic Level High
Pavement Condition Good
Remarks • Bus Routes from Kozhikode to Bangalore,Coimbatore.
• Agricultural lands are present • Educational Institutions, hospitals are present in this stretch.
• From Vellumadikunnu a bypass road to Kozhikode Medical College • From Lakkidi to Adivaram a Hill highway with nine hairpin bends
along the stretch
• Very high truck traffic on the road • Road width and ROW inside the towns are less.
• Some portions of roads are damaged • Many tourist attractions are located on the stretch, like
Thamarassey Churam, Wayanad Wildlife Sanctuary etc

Kochi Bengaluru Industrial Corridor –Draft Perspective Plan for overall KBIC region - Draft
349

Kochi Bengaluru Industrial Corridor –Draft Perspective Plan for overall KBIC region - Draft
350
Stretch number 31
NH /SH number SH 68
Connecting Places Kappad - Adivaram
Approximate Stretch Length 68 Km
District Kozhikode
Lane Configuration 2 lane undivided
ROW (m) 8-20
Major Land Use Residential/ Vacant Land
Major Settlements Kappad ,Thiruvangoor,Atholi,Nanminda, Narikkuni , Mookilangadi , Puthur , Koduvally,Omassery ,Kodencheri, Adivaram.
Traffic Level Medium
Pavement Condition Good
Remarks • Bus routes are Kozhikode to Adivaram
• Agricultural lands are present.
• Educational Institutions, hospitals are present in this stretch.
• Road meets with NH 766 at Padanilam
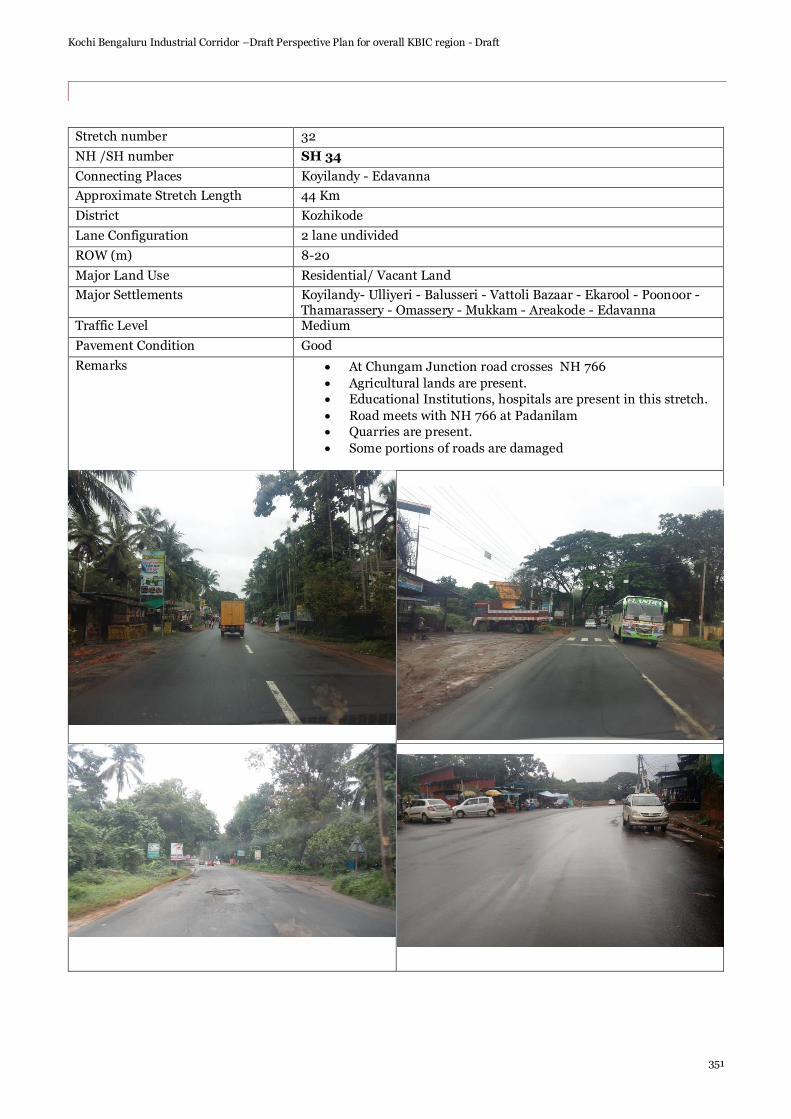
Kochi Bengaluru Industrial Corridor –Draft Perspective Plan for overall KBIC region - Draft
351
Stretch number 32
NH /SH number SH 34
Connecting Places Koyilandy - Edavanna
Approximate Stretch Length 44 Km
District Kozhikode
Lane Configuration 2 lane undivided
ROW (m) 8-20
Major Land Use Residential/ Vacant Land
Major Settlements Koyilandy- Ulliyeri - Balusseri - Vattoli Bazaar - Ekarool - Poonoor - Thamarassery - Omassery - Mukkam - Areakode - Edavanna
Traffic Level Medium
Pavement Condition Good
Remarks • At Chungam Junction road crosses NH 766
• Agricultural lands are present.
• Educational Institutions, hospitals are present in this stretch.
• Road meets with NH 766 at Padanilam
• Quarries are present.
• Some portions of roads are damaged

Kochi Bengaluru Industrial Corridor –Draft Perspective Plan for overall KBIC region - Draft
352
Stretch number 33
NH /SH number SH 65
Connecting Places Kolappuram - Puthalam
Approximate Stretch Length 29 Km
District Malappuram
Lane Configuration 2 lane undivided
ROW (m) 10-20
Major Land Use Residential/ Vacant Land
Major Settlements Kolappuram , Kunnumpuram ,Kondotty , Kizhisseri, Puthalam
Traffic Level Medium
Pavement Condition Good
Remarks • The road meets NH 966 at Kondotty
• Agricultural lands are present
• Some portions of roads are damaged
• Educational Institutions, hospitals are present in this stretch.
• Road towards Calicut International Airport.
• Road width and ROW inside the towns are less.

Kochi Bengaluru Industrial Corridor –Draft Perspective Plan for overall KBIC region - Draft
353
Stretch number 34
NH /SH number NH 966
Connecting Places Kozhikode - Palakkad
Approximate Stretch Length
125.3 Km
District Kozhikode,Malappuram,Palakkad
Lane Configuration 2 lane undivided
ROW (m) 10-25
Major Land Use Residential/ Vacant Land
Major Settlements Ramanattukara ,Pulikkal,KondottyNediyiruppu,ValluvambramJunction, Pookkottur,Malappuram,Koottilangadi,Angadipuram,Perinthalmanna, Karinkallathani,Nattukal,Vattambalam,Mannarkkad,Karimba,Mundoor, Olavakkode, Palakkad.
Traffic Level Medium
Pavement Condition Good
Remarks • Previously road is named as NH 213 • Bus Routes from Kozhikode to Palakkad • Main road to Calicut International Airport
• Agricultural lands are present • Some portions of roads are damaged
• At Palakkad it joins with NH 544, which connects Coimbatore and Cochin through Palakkad
• Palakkad Railway station is at Olavakkode
• Educational Institutions, hospitals are present in this stretch. • Road width and ROW inside the towns are less.
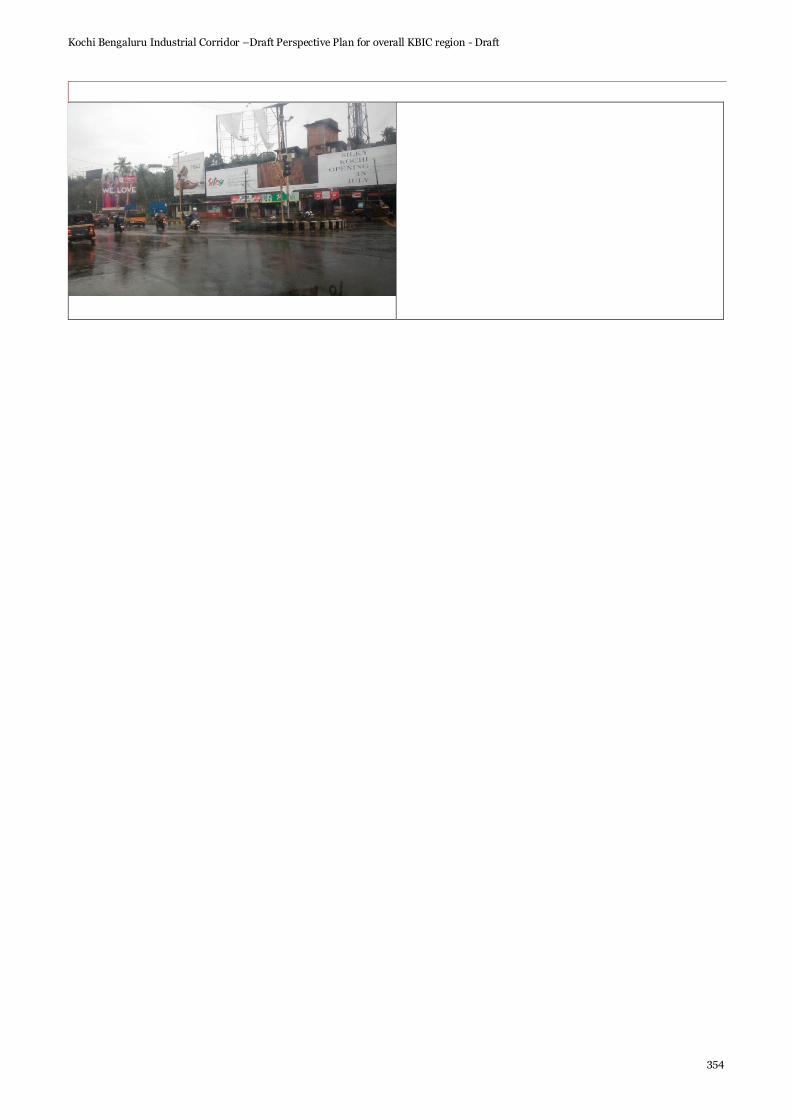
Kochi Bengaluru Industrial Corridor –Draft Perspective Plan for overall KBIC region - Draft
354

Kochi Bengaluru Industrial Corridor –Draft Perspective Plan for overall KBIC region - Draft
355
Stretch number 35
NH /SH number SH 54
Connecting Places Kozhikode - Kalpetta
Approximate Stretch Length 100 Km
District Kozhikode,Wayanad
Lane Configuration 2 lane undivided
ROW (m) 8-20
Major Land Use Residential/ Vacant Land
Major Settlements Eranhippalam, Pavangad , Ulliyeri ,Perambra , Kadiyagad , Peruvannamuzhi , Chempanoda , Poozhithode , Kariganny,Padinjarethara , Kalpetta
Traffic Level Medium
Pavement Condition Good
Remarks • Bus Routes from Kozhikode to Kalpetta
• The road meets NH 66 at Eranhikkal
• Agricultural lands are present
• Educational Institutions, Hospitals are present in this stretch.
• At junctions divided roads are present
• Road width and ROW inside the towns are less.
• Some portions of roads are damaged.

Kochi Bengaluru Industrial Corridor –Draft Perspective Plan for overall KBIC region - Draft
356

Kochi Bengaluru Industrial Corridor –Draft Perspective Plan for overall KBIC region - Draft
357
Stretch number 36
NH /SH number SH 38
Connecting Places Puthiyangadi - Chovva
Approximate Stretch Length 43 Km
District Kozhikode,Kannur
Lane Configuration 2 lane undivided
ROW (m) 8-20
Major Land Use Residential/ Commercial
Major Settlements Puthiyangadi ,Ulleri ,Perambra , Kuttiyadi , Nadapuram ,Mekkunnu , Panoor , Koothuparamba ,Chovva.
Traffic Level Medium
Pavement Condition Good
Remarks • Bus Routes from Kozhikode to Kannur
• Educational Institutions, Hospitals are present in this stretch.
• Road width and ROW inside the towns are less.
• Bridge construction at Thazhechovva,
• Some portions of roads are damaged.
• Agricultural lands are present,
• Vaccant lands are present.
• Construction works are ongoing at Pattiam.
• Some portion roads are damaged.

Kochi Bengaluru Industrial Corridor –Draft Perspective Plan for overall KBIC region - Draft
358

Kochi Bengaluru Industrial Corridor –Draft Perspective Plan for overall KBIC region - Draft
359
Stretch number 37
NH /SH number SH 30
Connecting Places Thalassery - State boundary
Approximate Stretch Length 55 Km
District Kannur
Lane Configuration 2 lane undivided
ROW (m) 8-20
Major Land Use Residential/ Vaccant Land
Major Settlements Thalassery,Kuthupatramba, Mattannur , Iritty , Koottupuzha , State Boundary
Traffic Level Medium
Pavement Condition Good
Remarks • Bus Routes from Kannur to Iritty
• Road also known as Thalassery Coorg Road
• Educational Institutions, Hospitals are present in this stretch.
• Road width and ROW inside the towns are less.
• Some portions roads are damaged
• 4 Lane divided construction works ongoing.
• New Bridge construction works are ongoing at Nerveli,Karetta and Ulliyil.
• Vacant lands are present.
• Agricultural lands are present
• At Iritty Junction 2 lane divided roads are present

Kochi Bengaluru Industrial Corridor –Draft Perspective Plan for overall KBIC region - Draft
360

Kochi Bengaluru Industrial Corridor –Draft Perspective Plan for overall KBIC region - Draft
361
Stretch number 38
NH /SH number SH 36
Connecting Places Thaliparamba - Iritty
Approximate Stretch Length 46 Km
District Kannur
Lane Configuration 2 lane undivided
ROW (m) 8-20
Major Land Use Residential/ Vaccant Land
Major Settlements Thaliparamba - Sreekantapuram - Kalithodu - Iritty
Traffic Level Medium
Pavement Condition Good
Remarks • At Thaliparamba road meets at NH 66
• Valapattanam River flows parallel to SH36
• Bus routes from Thaliparamba to Iritty
• Agricultural lands are present
• Educational Institutions, Hospitals are present in this stretch.
• Some portions roads are damaged.
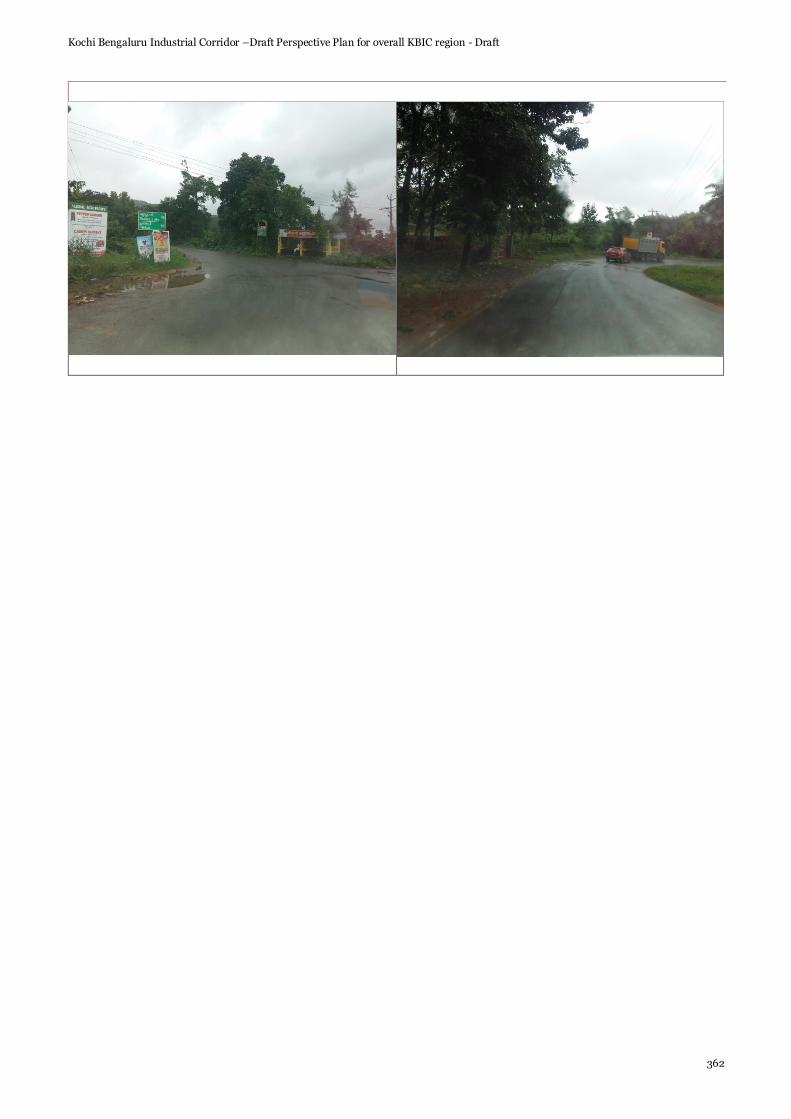
Kochi Bengaluru Industrial Corridor –Draft Perspective Plan for overall KBIC region - Draft
362

Kochi Bengaluru Industrial Corridor –Draft Perspective Plan for overall KBIC region - Draft
363
Stretch number 39
NH /SH number NH 44 (AH 43)
Connecting Places Hosur- Salem ( Srinagar – Kanyakumari )
Approximate Stretch Length
165 Km (Total Length 3745Km )
States Jammu & Kashmir, Punjab, Haryana, Delhi, Uttar Pradesh, Madhya Pradesh, Maharashtra, Telangana, Andhra Pradesh, Karnataka, Tamil Nadu.
Lane Configuration 6 lane divided
• Hosur- Krishnagiri 4 lane divided
• Krishnagiri -Namakkal
ROW (m)
Major Land Use
Major Settlements
Traffic Level Medium
Pavement Condition Good
Remarks • 6 lane divided roads with Service Lane till Perandapalli forest area.
• In night traffic is high
• Weekends traffic towards Bangalore is high
• Many industrial and IT parks are present along the stretch.
• IT industrial park Electronics City is also located alongside Hosur Road.
• Toll Plaza at starts at Attibelle( Km 87/100 ends at Km 94/000), Thoppur and Omalur
• Elephant Crossings are observed at Perandapalli forest area
• Educational Institutions, Hospitals are present in this stretch.

Kochi Bengaluru Industrial Corridor –Draft Perspective Plan for overall KBIC region - Draft
364
Stretch number 40
NH /SH number SH 60
Connecting Places Hogenakkal - Tirupattur
Approximate Stretch Length
109 Km
Districts Dharmapuri, Krishnagiri, Vellore
Lane Configuration 2 Lane
ROW (m)
Major Land Use
Major Settlements Dharmapuri, Krishnagiri, Vellore
Traffic Level Medium
Pavement Condition Good
Remarks • Educational Institutions, Hospitals are present in this stretch.
• Agriculture land on both sides.
• Construction of ROB is almost completed
Stretch number 41
NH /SH number SH 60 A
Connecting Places Dharmapuri - Harur
Approximate Stretch Length
39 Km
Districts Dharmapuri
Lane Configuration 2 Lane
ROW (m)
Major Land Use
Major Settlements
Traffic Level Medium
Pavement Condition Fair till Settikarai
Remarks

Kochi Bengaluru Industrial Corridor –Draft Perspective Plan for overall KBIC region - Draft
365
Stretch number 42
NH /SH number SH 17
Connecting Places Malur - Hosur
Approximate Stretch Length
39 Km
Districts Dharmapuri
Lane Configuration 2 Lane
ROW (m)
Major Land Use
Major Settlements
Traffic Level Medium
Pavement Condition Good
Remarks

Kochi Bengaluru Industrial Corridor –Draft Perspective Plan for overall KBIC region - Draft
366
Stretch number 43
NH /SH number SH 188
Connecting Places Salem Junction - Yercaud
Approximate Stretch Length
31Km
Districts Salem
Lane Configuration 2 Lane
ROW (m)
Major Land Use
Major Settlements
Traffic Level Medium
Pavement Condition Good
Remarks • Flyover construction is going on
• At Hasthampatty junction 4 lane divided road
• Road towards Yercaud tourist place

Kochi Bengaluru Industrial Corridor –Draft Perspective Plan for overall KBIC region - Draft
367
Stretch number 44
NH /SH number SH 18
Connecting Places Salem - Vaniyambadi
Approximate Stretch Length
125 Km
Districts Salem, Dharmapuri, Krishnagiri, Vellore
Lane Configuration 2 Lane
ROW (m)
Major Land Use
Major Settlements Ayothiyapattinam
Traffic Level Medium
Pavement Condition Good
Remarks

Kochi Bengaluru Industrial Corridor –Draft Perspective Plan for overall KBIC region - Draft
368
Stretch number 45
NH /SH number NH 79
Connecting Places Salem- Ulundurpettai
Approximate Stretch Length
135 Km
Districts Salem, Viluppuram
Lane Configuration 2 Lane
ROW (m)
Major Land Use
Major Settlements Salem
Traffic Level Medium
Pavement Condition Good
Remarks • Road connects with NH 44 and NH 544 at Salem,NH 68 and SH 69 at Ulundurpettai

Kochi Bengaluru Industrial Corridor –Draft Perspective Plan for overall KBIC region - Draft
369
Stretch number 46
NH /SH number SH 86A
Connecting Places Salem - Thiruchengode
Approximate Stretch Length
33 Km
Districts Salem, Namakkal
Lane Configuration 2 Lane
ROW (m)
Major Land Use
Major Settlements Salem, Ariyanoor, Mallasamudram, Thiruchengode
Traffic Level Medium
Pavement Condition Good
Remarks

Kochi Bengaluru Industrial Corridor –Draft Perspective Plan for overall KBIC region - Draft
370
Stretch number 47
NH /SH number SH 221
Connecting Places Magudanchavadi - Komarapalayam
Approximate Stretch Length
44 Km
Districts Salem
Lane Configuration 2 Lane
ROW (m)
Major Land Use
Major Settlements
Traffic Level Medium
Pavement Condition Good
Remarks
Kochi Bengaluru Industrial Corridor –Draft Perspective Plan for overall KBIC region - Draft
371
Stretch number 48
NH /SH number SH 86
Connecting Places Omalur - Paramathi Velur
Approximate Stretch Length
44 Km
Districts Salem,Namakkal
Lane Configuration 2 Lane
ROW (m)
Major Land Use
Major Settlements Omalur ,Paramathi Velur
Traffic Level Medium
Pavement Condition Good
Remarks • From Sankari MDR 767 connecting NH 544 and SH 86

Kochi Bengaluru Industrial Corridor –Draft Perspective Plan for overall KBIC region - Draft
372
Stretch number 49
NH /SH number SH 79A
Connecting Places Sankari - Pallipalayam
Approximate Stretch Length
16 Km
Districts Salem,Namakkal,Erode
Lane Configuration 2 Lane
ROW (m)
Major Land Use
Major Settlements
Traffic Level Medium
Pavement Condition Good
Remarks

Kochi Bengaluru Industrial Corridor –Draft Perspective Plan for overall KBIC region - Draft
373
Stretch number 50
NH /SH number SH 117
Connecting Places Madurantakam - Vennangupet
Approximate Stretch Length
16 Km
Districts Kancheepuram
Lane Configuration 2 Lane
ROW (m)
Major Land Use
Major Settlements
Traffic Level Medium
Pavement Condition Good
Remarks
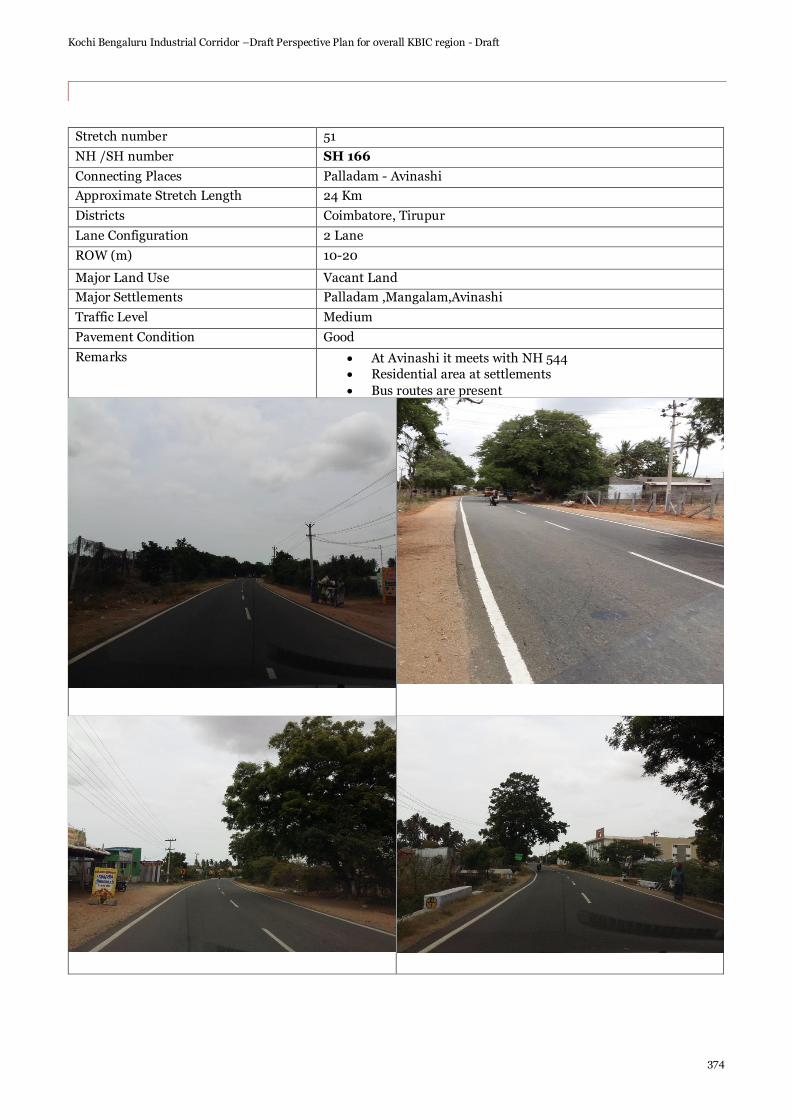
Kochi Bengaluru Industrial Corridor –Draft Perspective Plan for overall KBIC region - Draft
374
Stretch number 51
NH /SH number SH 166
Connecting Places Palladam - Avinashi
Approximate Stretch Length 24 Km
Districts Coimbatore, Tirupur
Lane Configuration 2 Lane
ROW (m) 10-20
Major Land Use Vacant Land
Major Settlements Palladam ,Mangalam,Avinashi
Traffic Level Medium
Pavement Condition Good
Remarks • At Avinashi it meets with NH 544
• Residential area at settlements
• Bus routes are present

Kochi Bengaluru Industrial Corridor –Draft Perspective Plan for overall KBIC region - Draft
375
Stretch number 52
NH /SH number NH 381
Connecting Places Avinashi -Avinashipalayam
Approximate Stretch Length 32 Km
Districts Tirupur
Lane Configuration 4 lane divided
• Avinashi to Thirumurugan Poondi 2 lane undivided
• Thirumurugan Poondi to Avinashipalayam ROW (m) 10-30
Major Land Use Vacant Land / Residential
Major Settlements Palladam ,Mangalam,Avinashi
Traffic Level Medium
Pavement Condition Good
Remarks • At Avinashi it meets with NH 544, Avinashipalayam meeta with NH 81
• Road passes through the city of Tirupur.
• Education Institutions like AVP Trust School is present.
• Road Construction going on.
• Textile factories are present along the stretch.
• Residential area at settlements.
• Bus routes are present.
• Road width and ROW inside the towns are less

Kochi Bengaluru Industrial Corridor –Draft Perspective Plan for overall KBIC region - Draft
376

Kochi Bengaluru Industrial Corridor –Draft Perspective Plan for overall KBIC region - Draft
377
Stretch number 53
NH /SH number SH 196
Connecting Places Tirupur - Perundurai
Approximate Stretch Length 42 Km
Districts Tirupur,Erode
Lane Configuration 2 lane
ROW (m) 10-30
Major Land Use Vacant Land
Major Settlements Tirupur , Perumanallur , Kunnathur , Perundurai.
Traffic Level Medium
Pavement Condition Good
Remarks • Periyasamy Hydraulic Equipment is present on the stretch near Kunnathur
• Textile factories are present at Tiruppur
• Residential area at settlements.
• Bus routes are present.

Kochi Bengaluru Industrial Corridor –Draft Perspective Plan for overall KBIC region - Draft
378
Stretch number 54
NH /SH number SH 81
Connecting Places Dharapuram -Gobichettipalayam
Approximate Stretch Length 47 Km
Districts Tirupur,Erode
Lane Configuration 2 lane
ROW (m) 10-20
Major Land Use Vacant Land
Major Settlements Gobichettipalayam - Uthukuli - Dharapuram
Traffic Level Medium
Pavement Condition Good
Remarks • Educational institutions are present along the stretch
• Residential area at settlements.
• Bus routes are present.
• Textile factories are present

Kochi Bengaluru Industrial Corridor –Draft Perspective Plan for overall KBIC region - Draft
379
Stretch number 55
NH /SH number SH 15
Connecting Places Erode - Udagamandalam
Approximate Stretch Length 162 Km
Districts Erode,Coimbatore,Nilgiris
Lane Configuration 2 lane
ROW (m) 10-20
Major Land Use Vacant Land
Major Settlements Erode,Gobichettipalayam ,Sathyamangalam , Mettupalayam ,Kotagiri , Udagamandalam
Traffic Level Medium
Pavement Condition Good
Remarks • Educational institutions are present along the stretch
• Residential area at settlements.
• Bus routes are present.
• Road meets the following roads along the way: SH 20 at Erode, NH 544 at Chittode,SH 81 at Gobichettipalayam,SH 15A at Gobichettipalayam,NH 948 at Sathyamangalam,NH 181 at Mettupalayam.

Kochi Bengaluru Industrial Corridor –Draft Perspective Plan for overall KBIC region - Draft
380
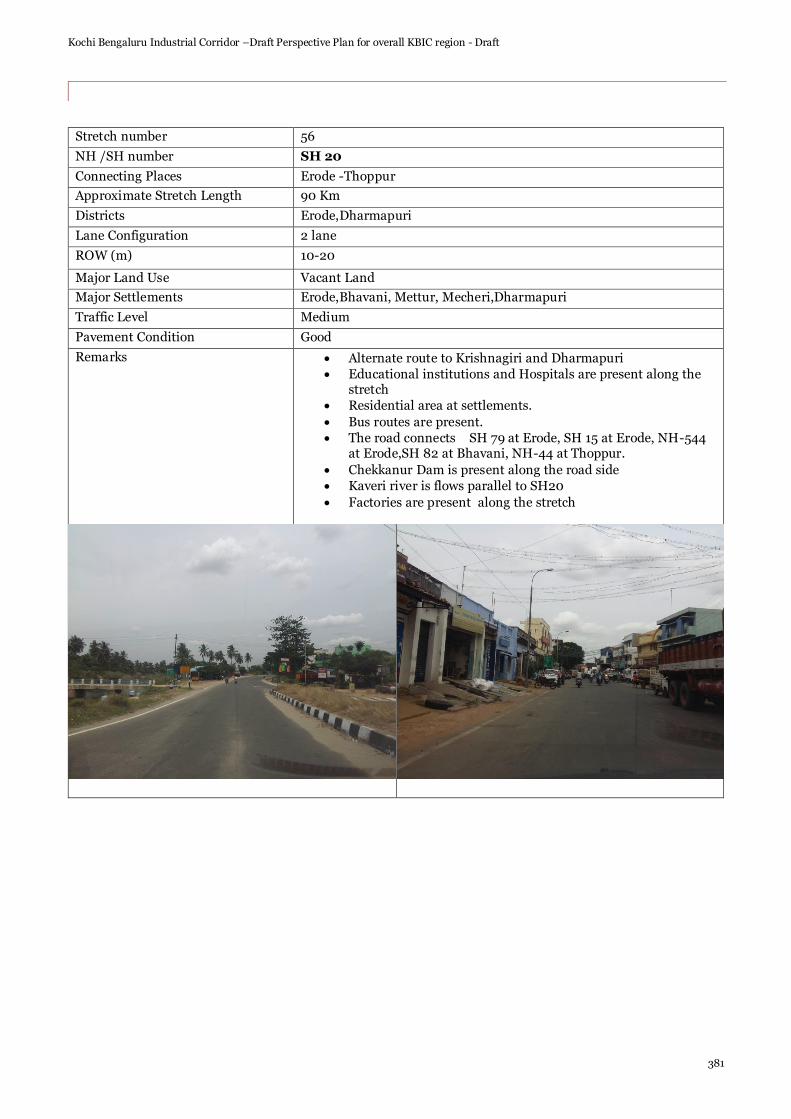
Kochi Bengaluru Industrial Corridor –Draft Perspective Plan for overall KBIC region - Draft
381
Stretch number 56
NH /SH number SH 20
Connecting Places Erode -Thoppur
Approximate Stretch Length 90 Km
Districts Erode,Dharmapuri
Lane Configuration 2 lane
ROW (m) 10-20
Major Land Use Vacant Land
Major Settlements Erode,Bhavani, Mettur, Mecheri,Dharmapuri
Traffic Level Medium
Pavement Condition Good
Remarks • Alternate route to Krishnagiri and Dharmapuri
• Educational institutions and Hospitals are present along the stretch
• Residential area at settlements.
• Bus routes are present.
• The road connects SH 79 at Erode, SH 15 at Erode, NH-544 at Erode,SH 82 at Bhavani, NH-44 at Thoppur.
• Chekkanur Dam is present along the road side
• Kaveri river is flows parallel to SH20
• Factories are present along the stretch

Kochi Bengaluru Industrial Corridor –Draft Perspective Plan for overall KBIC region - Draft
382

Kochi Bengaluru Industrial Corridor –Draft Perspective Plan for overall KBIC region - Draft
383
Stretch number 57
NH /SH number SH 84
Connecting Places Erode -Karur
Approximate Stretch Length 62 Km
Districts Erode,Karur
Lane Configuration 2 lane
ROW (m) 10-20
Major Land Use Vacant Land
Major Settlements Erode , Unjalur , Kodumudi , Karur
Traffic Level Medium
Pavement Condition Good
Remarks • 4 lane divided road upto Solar
• Educational institutions and Hospitals are present along the stretch
• Residential area at settlements.
• Bus routes are present.
• Factories are present in the road stretch
• Agricultural land is present.
• Kaveri river is flows parallel to the SH 84
• Large number of ricemills in and around Kodumudi
• TNPL paper mills is near Kodumudi

Kochi Bengaluru Industrial Corridor –Draft Perspective Plan for overall KBIC region - Draft
384

Kochi Bengaluru Industrial Corridor –Draft Perspective Plan for overall KBIC region - Draft
385
Stretch number 58
NH /SH number SH 84 A
Connecting Places Solar - Mulanur
Approximate Stretch Length 62 Km
Districts Erode,Tirupur
Lane Configuration 2 lane
ROW (m) 10-20
Major Land Use Vacant Land
Major Settlements Solar , Modakurichi , Muthur , Vellakoil , Mulanur
Traffic Level Medium
Pavement Condition Good
Remarks • Educational institutions and Hospitals are present along the stretch
• Residential area at settlements.
• Bus routes are present.
• Factories are present in the road stretch
• Agricultural land is present.
• Road construction works are ongoing
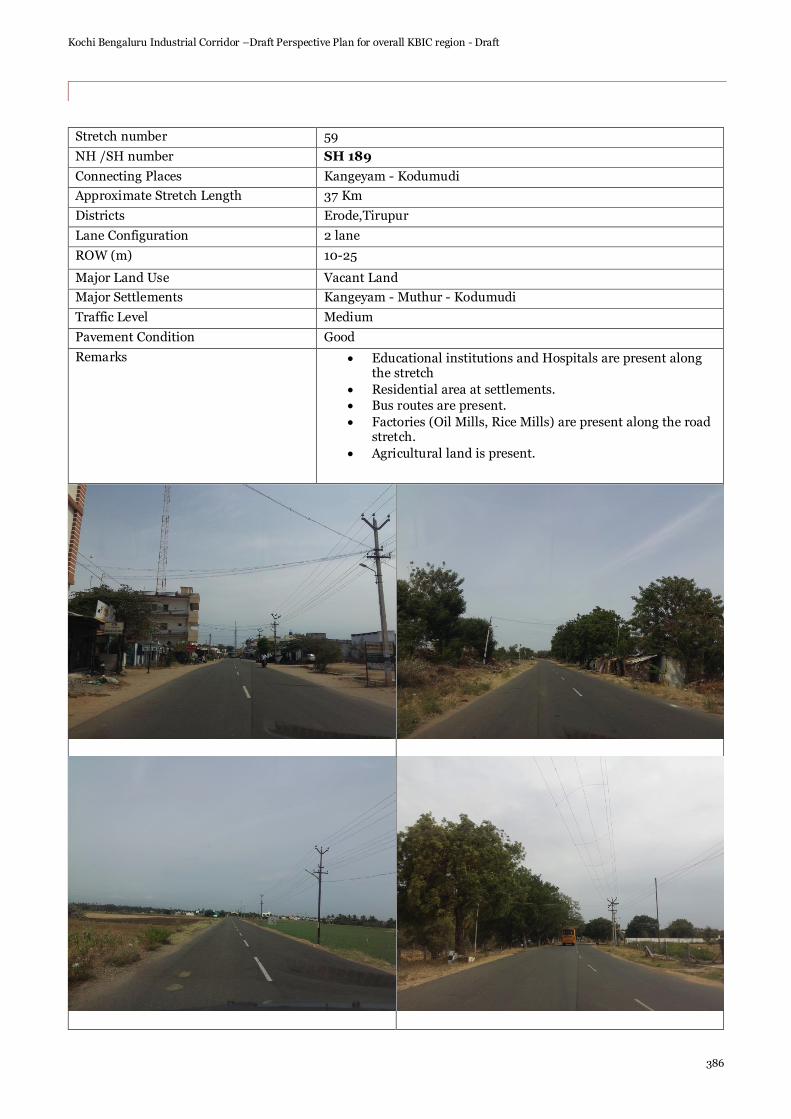
Kochi Bengaluru Industrial Corridor –Draft Perspective Plan for overall KBIC region - Draft
386
Stretch number 59
NH /SH number SH 189
Connecting Places Kangeyam - Kodumudi
Approximate Stretch Length 37 Km
Districts Erode,Tirupur
Lane Configuration 2 lane
ROW (m) 10-25
Major Land Use Vacant Land
Major Settlements Kangeyam - Muthur - Kodumudi
Traffic Level Medium
Pavement Condition Good
Remarks • Educational institutions and Hospitals are present along the stretch
• Residential area at settlements.
• Bus routes are present.
• Factories (Oil Mills, Rice Mills) are present along the road stretch.
• Agricultural land is present.

Kochi Bengaluru Industrial Corridor –Draft Perspective Plan for overall KBIC region - Draft
387
Stretch number 60
NH /SH number SH 172
Connecting Places Tirupur - Kangeyam Approximate Stretch Length 27 Km
Districts Tirupur
Lane Configuration 2 lane
ROW (m) 10-25
Major Land Use Vacant Land
Major Settlements Tirupur ,Kangeyam
Traffic Level Medium
Pavement Condition Good
Remarks • 4 lane divided road from Tiruppur to Nallur
• Road meets with NH 381 at Nallur
• Educational institutions and Hospitals are present along the stretch
• Residential area at settlements.
• Bus routes are present.
• Factories (Oil Mills, Textile Mills) are present along the road stretch.
• Agricultural land is present.

Kochi Bengaluru Industrial Corridor –Draft Perspective Plan for overall KBIC region - Draft
388

Kochi Bengaluru Industrial Corridor –Draft Perspective Plan for overall KBIC region - Draft
389
Stretch number 61
NH /SH number SH 190
Connecting Places Karumandampalayam - Salaipudur Approximate Stretch Length 18 Km
Districts Erode
Lane Configuration 2 lane
ROW (m) 10-25
Major Land Use Vacant Land
Major Settlements Karumandampalayam, Malayampalayam , Thamaraipalayam ,Salaipudur
Traffic Level Medium
Pavement Condition Good
Remarks • Residential area at settlements.
• Bus routes are present.
• Factories (Coir Mills) are present along the road stretch.
• Agricultural land is present.

Kochi Bengaluru Industrial Corridor –Draft Perspective Plan for overall KBIC region - Draft
390
Stretch number 62
NH /SH number SH 197
Connecting Places Vellakovil - Mulanur Approximate Stretch Length 25 Km
Districts Tiruppur
Lane Configuration 2 lane
ROW (m) 10-20
Major Land Use Vacant Land
Major Settlements Vellakovil ,Akkaraipalayam, Mulanur
Traffic Level Medium
Pavement Condition Good
Remarks • At Mulanur it meet swith NH 81
• Residential area at settlements.
• Bus routes are present.
• Spinning Mills are present along the road stretch.
• Agricultural land is present.

Kochi Bengaluru Industrial Corridor –Draft Perspective Plan for overall KBIC region - Draft
391
Stretch number 63
NH /SH number NH 81
Connecting Places Coimbatore to Karur (Coimbatore to Chidambaram ) Approximate Stretch Length 132Km (381 Km )
Districts Coimbatore, Karur, Tiruchirappalli, Cuddalore
Lane Configuration 2 lane
ROW (m) 15-45
Major Land Use Residential area / Vaccant land
Major Settlements Coimbatore, Sulur,Kangayam ,,Vellakoil,Karur
Traffic Level Medium
Pavement Condition Good
Remarks • 4 Lane divided road from Sulur to Karanampettai,
• The road is four lane divided inside the towns
• Road width and ROW inside the towns are less.
• Road meets with NH 544 at Coimbatore
• Factories (Sugar factories,Textile Mills) are present along the road stretch.
• Educational institutions,Hospitals are present along the road stretch
• Bus routes are present
• Brick klins are located along the road
• Agricultural land is present.
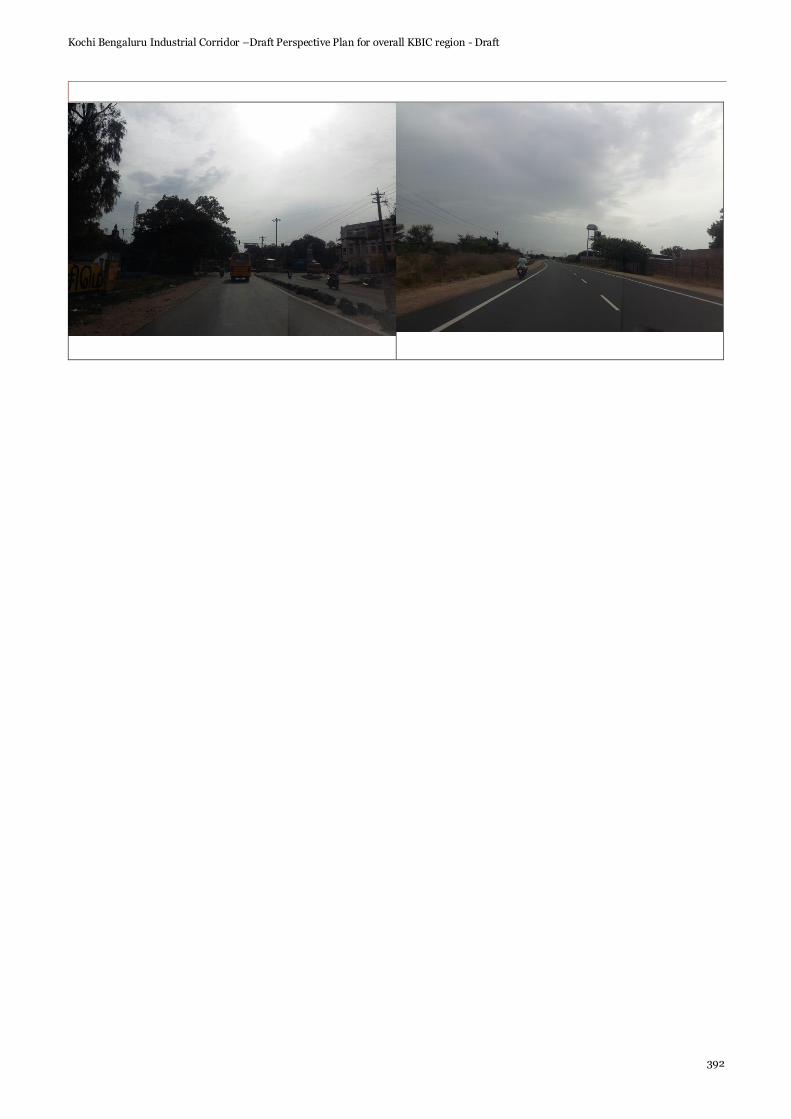
Kochi Bengaluru Industrial Corridor –Draft Perspective Plan for overall KBIC region - Draft
392

Kochi Bengaluru Industrial Corridor –Draft Perspective Plan for overall KBIC region - Draft
393
Stretch number 64
NH /SH number SH 83 A
Connecting Places Erode - Dharapuram Approximate Stretch Length 78 Km
Districts Erode,Tirupur
Lane Configuration 2 lane
ROW (m) 10-20
Major Land Use Vacant Land
Major Settlements Kangayam,Arachalur,Avalpoondurai,Dharapuram
Traffic Level Medium
Pavement Condition Good
Remarks • Residential area at settlements.
• Bus routes are present.
• Many Factories are present on the road stretch.
• Agricultural land is present.
• Windmills are present along the road stretch
• Educational Institutions, hospitals are present between the stretch
• Sugar factories is present at Vadapalani

Kochi Bengaluru Industrial Corridor –Draft Perspective Plan for overall KBIC region - Draft
394

Kochi Bengaluru Industrial Corridor –Draft Perspective Plan for overall KBIC region - Draft
395
Stretch number 65
NH /SH number SH 21
Connecting Places Pollachi - Karur Approximate Stretch Length 120 Km
Districts Coimbatore, Tirupur, Karur
Lane Configuration 2 lane
ROW (m) 10-20
Major Land Use Vacant Land
Major Settlements Pollachi, Dharapuram ,Mulanur , Karur
Traffic Level Medium
Pavement Condition Good
Remarks • Residential area at settlements.
• Windmills are present along the road stretch
• Bus routes are present.
• Many Factories are present on the road stretch.
• Agricultural land is present.
• Educational Institutions, hospitals are present between the stretch

Kochi Bengaluru Industrial Corridor –Draft Perspective Plan for overall KBIC region - Draft
396
Stretch number 66
NH /SH number SH 37
Connecting Places Mettur - Tirupur Approximate Stretch Length 121 Km
Districts Dindigul, Tirupur
Lane Configuration 2 lane
ROW (m) 10-20
Major Land Use Vacant Land
Major Settlements Mettur - Palakkanuthu - Oddanchatram - Dharapuram - Tirupur
Traffic Level Medium
Pavement Condition Good
Remarks • At junctions divided roads are found
• At Dindigul it meets with NH 83
• Residential area at settlements.
• Windmills are present along the road stretch
• Bus routes are present.
• Vinayagar Spinning Mills at Dharapuram
• Agricultural land is present.
• Educational Institutions, hospitals are present between the stretch

Kochi Bengaluru Industrial Corridor –Draft Perspective Plan for overall KBIC region - Draft
397

Kochi Bengaluru Industrial Corridor –Draft Perspective Plan for overall KBIC region - Draft
398
Stretch number 67
NH /SH number SH 83
Connecting Places Palani - Dharapuram Approximate Stretch Length 31 Km
Districts Dindigul,Tirupur
Lane Configuration 2 lane
ROW (m) 10-20
Major Land Use Vacant Land
Major Settlements Palani ,Thoppampatti,Dharapuram
Traffic Level Medium
Pavement Condition Good
Remarks • Residential area at settlements.
• Bus routes are present.
• Factories are present on the road stretch
• Agricultural land is present.
• Educational Institutions are present between the stretch

Kochi Bengaluru Industrial Corridor –Draft Perspective Plan for overall KBIC region - Draft
399
Stretch number 68
NH /SH number SH 97
Connecting Places Udumalpet - Dharapuram Approximate Stretch Length 37 Km
Districts Tirupur
Lane Configuration 2 lane
ROW (m) 10-20
Major Land Use Vacant Land
Major Settlements Udumalpet ,Thoppampatti, Dharapuram
Traffic Level Medium
Pavement Condition Good
Remarks • Residential area at settlements.
• Bus routes from Dharapuram to Udumalpet.
• Factories are present on the road stretch
• Windmills are present along the road stretch
• Agricultural land is present.
• Educational Institutions are present between the stretch
• At junctions divided roads.
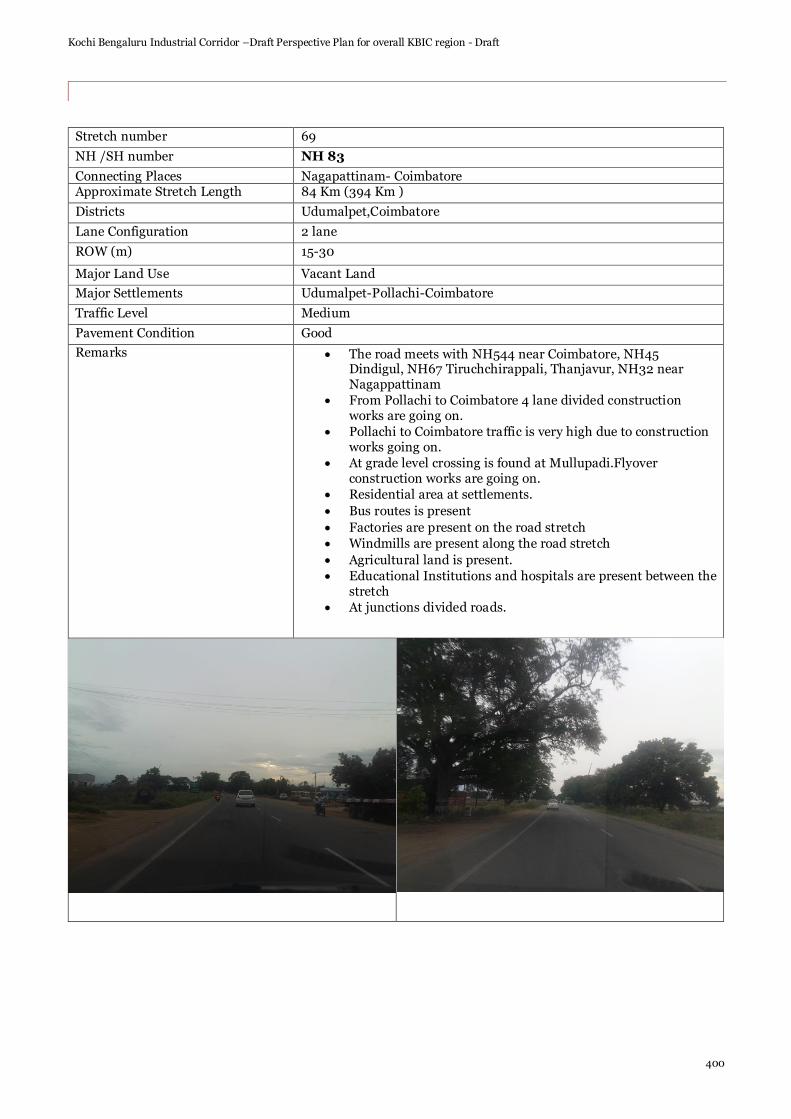
Kochi Bengaluru Industrial Corridor –Draft Perspective Plan for overall KBIC region - Draft
400
Stretch number 69
NH /SH number NH 83
Connecting Places Nagapattinam- Coimbatore Approximate Stretch Length 84 Km (394 Km )
Districts Udumalpet,Coimbatore
Lane Configuration 2 lane
ROW (m) 15-30
Major Land Use Vacant Land
Major Settlements Udumalpet-Pollachi-Coimbatore
Traffic Level Medium
Pavement Condition Good
Remarks • The road meets with NH544 near Coimbatore, NH45 Dindigul, NH67 Tiruchchirappali, Thanjavur, NH32 near Nagappattinam
• From Pollachi to Coimbatore 4 lane divided construction works are going on.
• Pollachi to Coimbatore traffic is very high due to construction works going on.
• At grade level crossing is found at Mullupadi.Flyover construction works are going on.
• Residential area at settlements.
• Bus routes is present
• Factories are present on the road stretch
• Windmills are present along the road stretch
• Agricultural land is present.
• Educational Institutions and hospitals are present between the stretch
• At junctions divided roads.

Kochi Bengaluru Industrial Corridor –Draft Perspective Plan for overall KBIC region - Draft
401

Kochi Bengaluru Industrial Corridor –Draft Perspective Plan for overall KBIC region - Draft
402
Stretch number 70
NH /SH number SH 87
Connecting Places Udumalpet - Palladam Approximate Stretch Length 46 Km
Districts Tirupur
Lane Configuration 2 lane
ROW (m) 10-20
Major Land Use Vacant Land
Major Settlements Udumalpet , Gudimangalam, Palladam
Traffic Level Medium
Pavement Condition Good
Remarks • Residential area at settlements.
• Bus routes are present.
• Factories are present on the road stretch
• Agricultural land is present.
• Educational Institutions are present between the stretch

Kochi Bengaluru Industrial Corridor –Draft Perspective Plan for overall KBIC region - Draft
403
Stretch number 71
NH /SH number SH 78
Connecting Places Pollachi - Valparai Approximate Stretch Length 65 Km
Districts Coimbatore
Lane Configuration 2 lane
ROW (m) 10-20
Major Land Use Residential area / Vacant Land
Major Settlements Pollachi ,Samathur,Valparai
Traffic Level Medium
Pavement Condition Good
Remarks • Road Passes through Aalliyar reserve forest area.
• Aaliyar dam is present along the road side.
• Hair pin bend roads are presents
• Residential area at settlements.
• Bus routes are present.
• Factories (Textile industries,Coir industries ) are present along the road stretch
• Agricultural land is present.
• Educational Institutions are present between the stretch

Kochi Bengaluru Industrial Corridor –Draft Perspective Plan for overall KBIC region - Draft
404
Stretch number 72
NH /SH number NH 948
Connecting Places Coimbatore - Bengaluru Approximate Stretch Length 69 Km (468 Km)
Districts Coimbatore,Erode,
Lane Configuration 4 lane divided road
• Polalchi Main road to Saravanampatty 2 lane undivided
• Saravanampatty to Sathyamangalam ROW (m) 15-40
Major Land Use Commercial/Residential
Major Settlements Ukkadam,Kovilpalayam,Annur,Puliampatty,Sathyamanagalam
Traffic Level Medium
Pavement Condition Good
Remarks • Traffic is heavy in city regions.
• One way system is adopted inside towns.
• Road width and ROW inside the towns are less.
• Bus routes are present.
• SIDCO private industrial estate is found at Pollachi main road
• Many Factories are present along the road stretch
• Agricultural land is present.
• At Eachanari roads meets with NH 544.
• Educational Institutions and Hospitals are present between the stretch

Kochi Bengaluru Industrial Corridor –Draft Perspective Plan for overall KBIC region - Draft
405
Stretch number 73
NH /SH number NH 181
Connecting Places Coimbatore - Gundlupet Approximate Stretch Length 40Km (211 Km)
States TamilNadu,Karnataka

Kochi Bengaluru Industrial Corridor –Draft Perspective Plan for overall KBIC region - Draft
406
Lane Configuration 2 lane
ROW (m) 10-30
Major Land Use Vaccant Land
Major Settlements Coimbatore,Kavudampalayam,Karamadai,Mettupalayam.
Traffic Level Medium
Pavement Condition Good
Remarks • 4 lane divided road from Coimbatore to Therkkuppalayam
• Residential area at settlements.
• Commercial area at settlements.
• Road width and ROW inside the towns are less.
• Construction works are going on Mettupalayam
• Flyover Construction is going on at Karamadai.
• Bus routes are present.
• Factories (Rice mills, Textile Industries ) are present along the road stretch
• Coimbatore North railway station is present in this stretch
• Agricultural land is present.
• Major road towards tourist place Ooty
• Educational Institutions, Hospitals are present between the stretch

Kochi Bengaluru Industrial Corridor –Draft Perspective Plan for overall KBIC region - Draft
407

Kochi Bengaluru Industrial Corridor –Draft Perspective Plan for overall KBIC region - Draft
408
Stretch number 74
NH /SH number SH 164
Connecting Places Kavundampalayam -Anaikatti Approximate Stretch Length 30 Km
Districts Coimbatore
Lane Configuration 2 lane
ROW (m) 10-20
Major Land Use Residential area/ Vacant land
Major Settlements Kavundampalam, Kanuvai, Thadagam, Anaikatti
Traffic Level Medium
Pavement Condition Good
Remarks • Road towards Nilgri Hills
• Road width and ROW inside the towns are less.
• Some portions of roads are damaged
• Bus routes are present.
• Agricultural land is present.
• Brick factory is present along the stretch
• Educational Institutions and Hospitals are present between the stretch

Kochi Bengaluru Industrial Corridor –Draft Perspective Plan for overall KBIC region - Draft
409
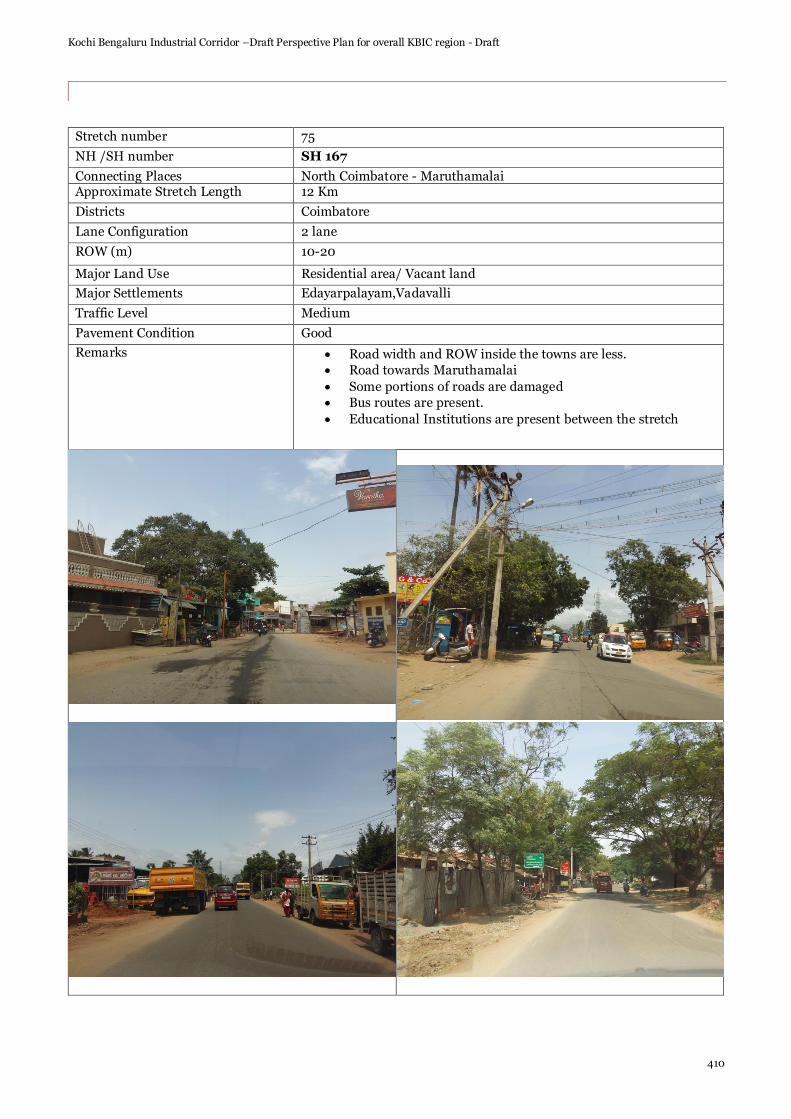
Kochi Bengaluru Industrial Corridor –Draft Perspective Plan for overall KBIC region - Draft
410
Stretch number 75
NH /SH number SH 167
Connecting Places North Coimbatore - Maruthamalai Approximate Stretch Length 12 Km
Districts Coimbatore
Lane Configuration 2 lane
ROW (m) 10-20
Major Land Use Residential area/ Vacant land
Major Settlements Edayarpalayam,Vadavalli
Traffic Level Medium
Pavement Condition Good
Remarks • Road width and ROW inside the towns are less.
• Road towards Maruthamalai
• Some portions of roads are damaged
• Bus routes are present.
• Educational Institutions are present between the stretch

Kochi Bengaluru Industrial Corridor –Draft Perspective Plan for overall KBIC region - Draft
411
Stretch number 76
NH /SH number SH 168
Connecting Places Karamadai - Kariyampalayam
Approximate Stretch Length 15 Km
Districts Coimbatore
Lane Configuration 2 lane
ROW (m) 10-20
Major Land Use Residential area/ Vacant land
Major Settlements Karamadai
Traffic Level Low
Pavement Condition Good
Remarks • Bus routes are present.
• Educational Institutions are present between the stretch
• Agricultural land is present.
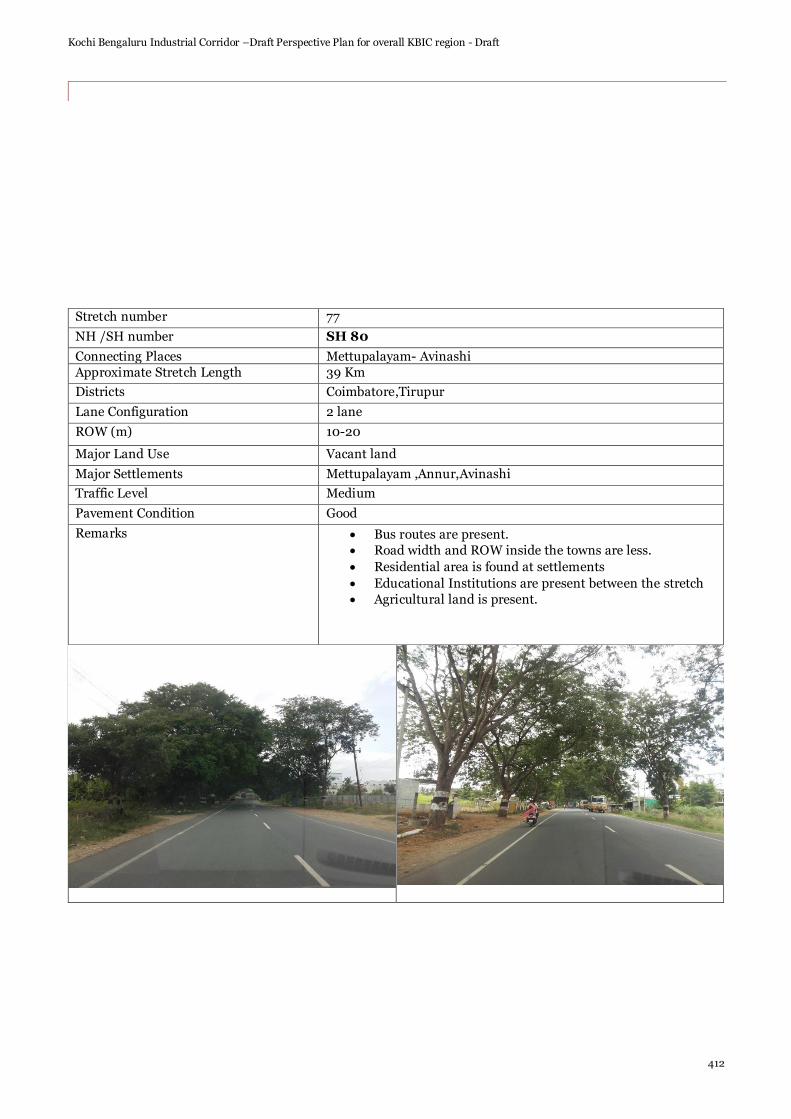
Kochi Bengaluru Industrial Corridor –Draft Perspective Plan for overall KBIC region - Draft
412
Stretch number 77
NH /SH number SH 80
Connecting Places Mettupalayam- Avinashi
Approximate Stretch Length 39 Km
Districts Coimbatore,Tirupur
Lane Configuration 2 lane
ROW (m) 10-20
Major Land Use Vacant land
Major Settlements Mettupalayam ,Annur,Avinashi
Traffic Level Medium
Pavement Condition Good
Remarks • Bus routes are present.
• Road width and ROW inside the towns are less.
• Residential area is found at settlements
• Educational Institutions are present between the stretch
• Agricultural land is present.
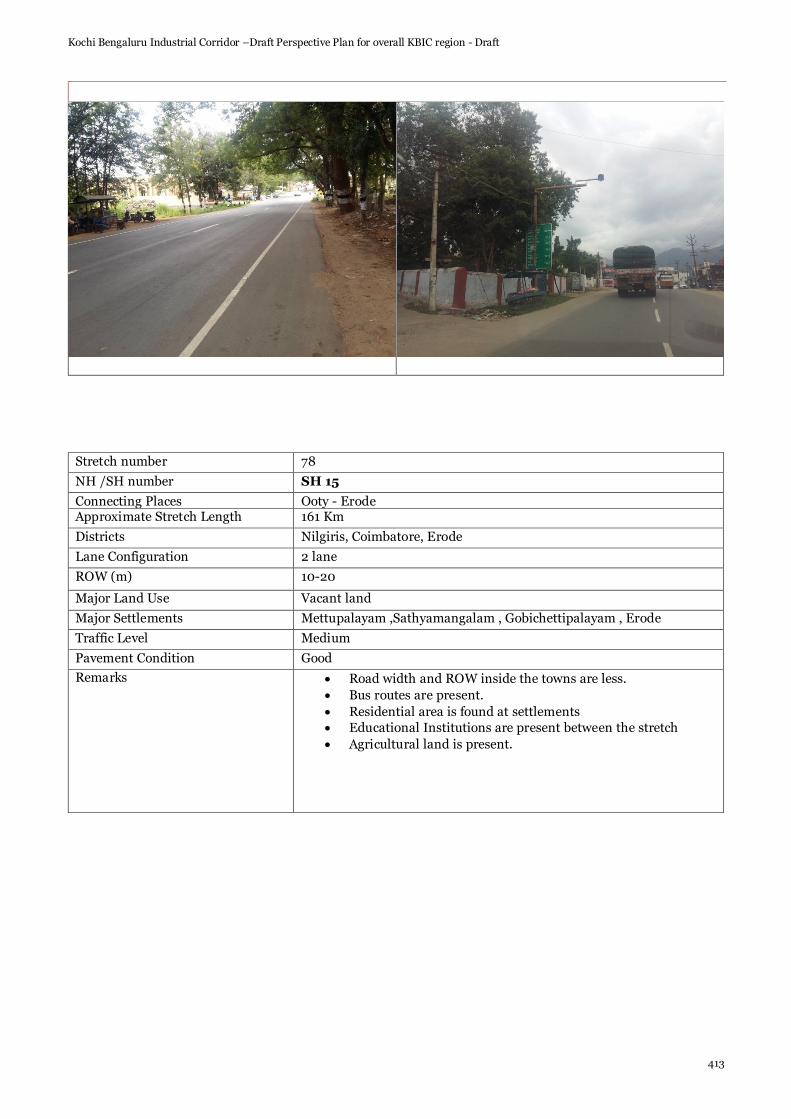
Kochi Bengaluru Industrial Corridor –Draft Perspective Plan for overall KBIC region - Draft
413
Stretch number 78
NH /SH number SH 15
Connecting Places Ooty - Erode Approximate Stretch Length 161 Km
Districts Nilgiris, Coimbatore, Erode
Lane Configuration 2 lane
ROW (m) 10-20
Major Land Use Vacant land
Major Settlements Mettupalayam ,Sathyamangalam , Gobichettipalayam , Erode
Traffic Level Medium
Pavement Condition Good
Remarks • Road width and ROW inside the towns are less.
• Bus routes are present.
• Residential area is found at settlements
• Educational Institutions are present between the stretch
• Agricultural land is present.

Kochi Bengaluru Industrial Corridor –Draft Perspective Plan for overall KBIC region - Draft
414

Kochi Bengaluru Industrial Corridor –Draft Perspective Plan for overall KBIC region - Draft
415
Stretch number 79
NH /SH number SH 170
Connecting Places Puliampatti - Sirumugai Approximate Stretch Length 18 Km
Districts Coimbatore
Lane Configuration 2 lane
ROW (m) 10-20
Major Land Use Vacant land / Agricultural land
Major Settlements Ganeshapuram,Irumbarai,Puliampatti
Traffic Level Medium
Pavement Condition Good
Remarks • Bridge construction works are ongoing
• Residential area is found at settlements
• Educational Institutions are present between the stretch
• Agricultural land is present.

Kochi Bengaluru Industrial Corridor –Draft Perspective Plan for overall KBIC region - Draft
416
Stretch number 80
NH /SH number SH 165
Connecting Places Kamanaikenpalayam - Annur Approximate Stretch Length 39 Km
Districts Coimbatore
Lane Configuration 2 lane
ROW (m) 10-20
Major Land Use Vacant land
Major Settlements Kamanaikenpalayam , Somanur,Karumathampatti , Annur
Traffic Level Low
Pavement Condition Good
Remarks • Factories are present on the road stretch
• Bus routes are present.
• Residential area is found at settlements
• Educational Institutions are present between the stretch
• Agricultural land is present.
• At junctions divided roads.
• Road meets with NH 544 at Karumathampatti.

Kochi Bengaluru Industrial Corridor –Draft Perspective Plan for overall KBIC region - Draft
417
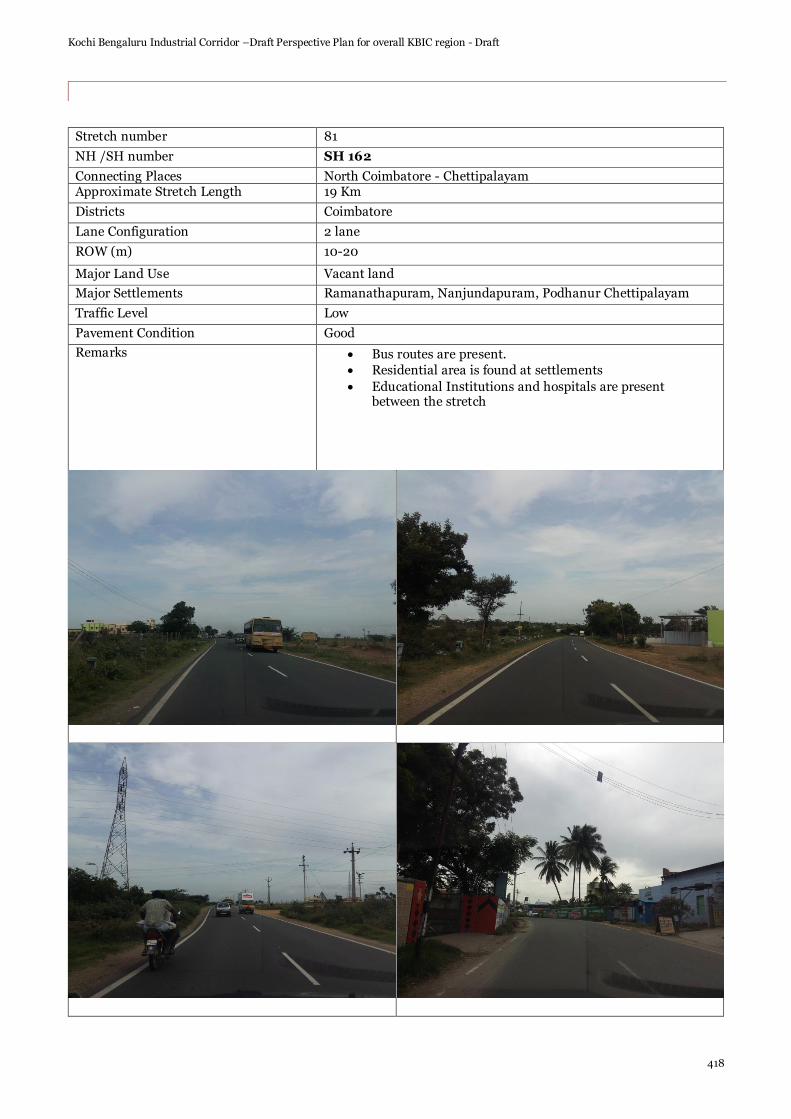
Kochi Bengaluru Industrial Corridor –Draft Perspective Plan for overall KBIC region - Draft
418
Stretch number 81
NH /SH number SH 162
Connecting Places North Coimbatore - Chettipalayam Approximate Stretch Length 19 Km
Districts Coimbatore
Lane Configuration 2 lane
ROW (m) 10-20
Major Land Use Vacant land
Major Settlements Ramanathapuram, Nanjundapuram, Podhanur Chettipalayam
Traffic Level Low
Pavement Condition Good
Remarks • Bus routes are present.
• Residential area is found at settlements
• Educational Institutions and hospitals are present between the stretch

Kochi Bengaluru Industrial Corridor –Draft Perspective Plan for overall KBIC region - Draft
419
Stretch number 82
NH /SH number SH 163
Connecting Places Palladam -Othakalmandapam Approximate Stretch Length Km
Districts Coimbatore
Lane Configuration 2 lane
ROW (m) 10-20
Major Land Use Vacant land
Major Settlements Palladam, Karadivavi, Chettipalayam
Traffic Level Low
Pavement Condition Good
Remarks • Bus routes are present.
• Residential area is found at settlements
• Educational Institutions and hospitals are present between the stretch
• Factories are present on the road stretch
• Agricultural land is present

Kochi Bengaluru Industrial Corridor –Draft Perspective Plan for overall KBIC region - Draft
420

Kochi Bengaluru Industrial Corridor –Draft Perspective Plan for overall KBIC region - Draft
421
Appendix E. - Environmental assessment
E.1. Surface water quality information
E.1.1. Kerala
As per the Water & Air Quality Directory 2017 published by Kerala State Pollution Control Board (KSPCB), Water Quality data of Rivers in KBIC districts is given below:
Achenkovil River:
KSPCB conducted monthly monitoring as part of State Water Quality Monitoring Programme (SWMP) for Achenkovil river in Pallipad in Alappuzha. The results are given below.
At Pallipad Monthly Monitoring
2017 pH Conductivity DO BOD TC FC
Unit µmhos/cm mg/l mg/l no/100 ml no/100 ml
Max 8.1 150.5 6.7 2.4 440 220
Min 7.2 67 4.1 0.8 260 100
CPCB conducted monitoring as part of NWMP 2017 for Achenkovil river in Chennithala village in Alappuzha. The results are given below.
At Chennithala
Monthly Monitoring
2017 pH Conductivity DO BOD Nitrate N
TC FC
Unit µmhos/cm mg/l mg/l mg/l no/100 ml no/100 ml
Max 7.5 144 7.3 1.4 0.56 460 180
Min 6.6 110 5.5 1 0.12 140 100
Pamba River:
KSPCB conducted monthly monitoring as part of SWMP for Pamba River in 2 stations in Alappuzha district. The results are given below.
At Edathua (Alappuzha)
Monthly Monitoring
2017 pH Conductivity DO BOD TC FC
Unit µmhos/cm mg/l mg/l no/100 ml no/100 ml
Max 6.9 73 6.6 1.90 1970 1810
Min 6.1 46 3.2 0.2 520 380
At Chenganoor
Max 7.2 66 7.1 1.00 2100 1970
Min 6 39 4.3 0.1 360 250
CPCB conducted monitoring as part of NWMP 2017 for Pamba river in Chengannoor and Thakazhi villages. The results are given below.
At Chenganoor
Monthly Monitoring

Kochi Bengaluru Industrial Corridor –Draft Perspective Plan for overall KBIC region - Draft
422
2017 pH Conductivity DO BOD Nitrate N
TC FC
Unit µmhos/cm mg/l mg/l mg/l no/100 ml no/100 ml
Max 6.6 63 6.3 1.3 2.14 460 310
Min 5.6 42 2.9 0.2 0 240 90 At Thakazhi
Max 7.2 83 6.1 3.3 0.5 840 580
Min 5.3 45 1 0.1 0 260 110
Meenachil River:
KSPCB conducted monthly monitoring as part of SWMP for Meenachil River in 5 stations in Alappuzha and Kottayam districts. The results are given below.
At Punnathara (Ayarkunnam-
Alappuzha)
Monthly Monitoring
2017 pH Conductivity DO BOD Nitrate N
TC FC
Unit µmhos/cm mg/l mg/l mg/l no/100 ml no/100 ml
Max 7.2 166.00 7.6 0.50 0.47 6400 3200
Min 6.3 37.05 6 0.24 0.25 1800 800
At Thazhathangady (Kottayam) Max 7.2 7423.00 6.5 1.10 0.65 3800 2600
Min 6.4 49.8 4.9 0.3 0.218 1000 500
At Kadappattoor (Mutholi-Kottayam) Max 7 207.00 7.6 1.40 0.44 3600 2000
Min 6.3 35 6.1 0.2 0.25 1000 600
At Bharananganam (Kottayam) Max 7 124.00 7.90 0.50 1 5600 1700
Min 6.2 29.41 6.9 0.2 0.12 1200 400
At Theekoy (Thalanadu-Kottayam)
Max 7.03 122.00 7.80 0.40 1 2800 1800 Min 6.41 23.23 6.6 0.2 0.21 1000 400
CPCB conducted monitoring as part of NWMP 2017 for Meenachil river in Kidangoor village. The results are given below
At Kidangoor Monthly Monitoring
2017 pH Conductivity DO BOD Nitrate N TC FC
Unit µmhos/cm mg/l mg/l mg/l no/100 ml no/100 ml
Max 7.7 92 7.3 2.4 0.53 3800 2000
Min 6.4 40 6.1 0.2 0.03 1800 800
Manimala River:
KSPCB conducted monthly monitoring as part of SWMP for Manimala River in 4 stations in Kottayam district. The results are given below.
At Kootickal (Mundakayam)
Monthly Monitoring
2017 pH Conductivity DO BOD TC FC
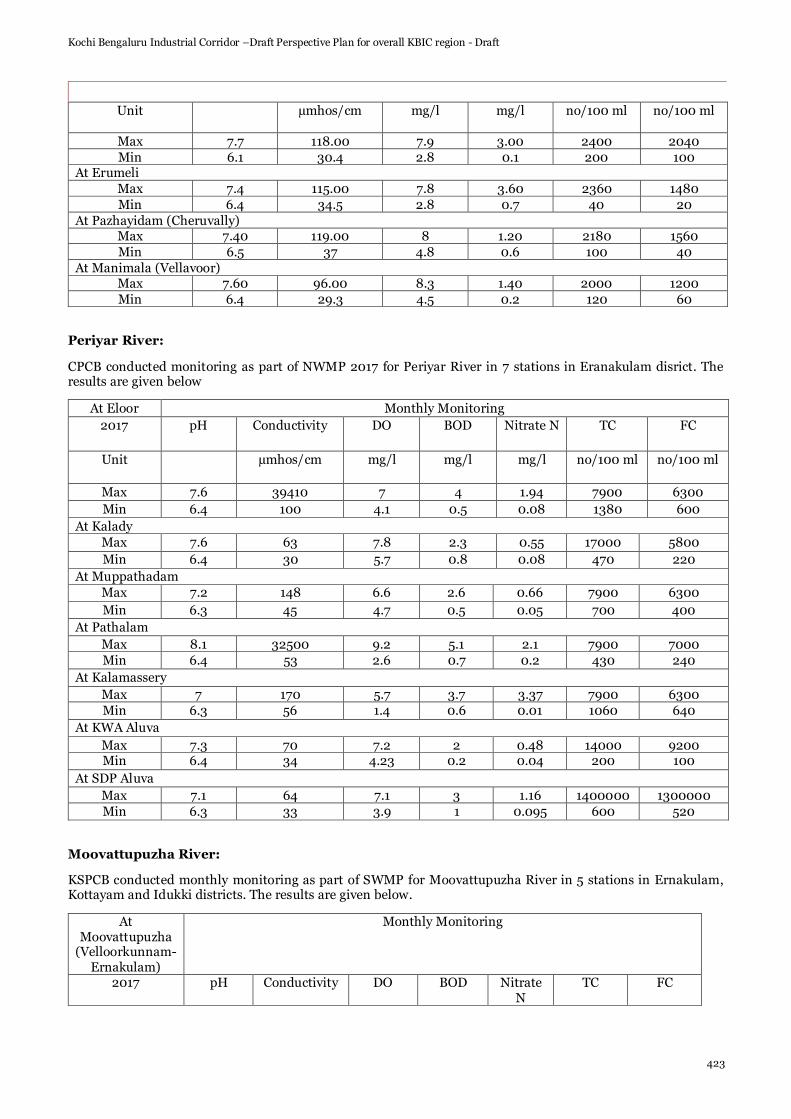
Kochi Bengaluru Industrial Corridor –Draft Perspective Plan for overall KBIC region - Draft
423
Unit µmhos/cm mg/l mg/l no/100 ml no/100 ml
Max 7.7 118.00 7.9 3.00 2400 2040
Min 6.1 30.4 2.8 0.1 200 100 At Erumeli
Max 7.4 115.00 7.8 3.60 2360 1480
Min 6.4 34.5 2.8 0.7 40 20
At Pazhayidam (Cheruvally) Max 7.40 119.00 8 1.20 2180 1560
Min 6.5 37 4.8 0.6 100 40
At Manimala (Vellavoor) Max 7.60 96.00 8.3 1.40 2000 1200
Min 6.4 29.3 4.5 0.2 120 60
Periyar River:
CPCB conducted monitoring as part of NWMP 2017 for Periyar River in 7 stations in Eranakulam disrict. The results are given below
At Eloor Monthly Monitoring
2017 pH Conductivity DO BOD Nitrate N TC FC
Unit µmhos/cm mg/l mg/l mg/l no/100 ml no/100 ml
Max 7.6 39410 7 4 1.94 7900 6300
Min 6.4 100 4.1 0.5 0.08 1380 600
At Kalady
Max 7.6 63 7.8 2.3 0.55 17000 5800
Min 6.4 30 5.7 0.8 0.08 470 220
At Muppathadam
Max 7.2 148 6.6 2.6 0.66 7900 6300
Min 6.3 45 4.7 0.5 0.05 700 400
At Pathalam
Max 8.1 32500 9.2 5.1 2.1 7900 7000
Min 6.4 53 2.6 0.7 0.2 430 240
At Kalamassery
Max 7 170 5.7 3.7 3.37 7900 6300
Min 6.3 56 1.4 0.6 0.01 1060 640
At KWA Aluva
Max 7.3 70 7.2 2 0.48 14000 9200 Min 6.4 34 4.23 0.2 0.04 200 100
At SDP Aluva
Max 7.1 64 7.1 3 1.16 1400000 1300000
Min 6.3 33 3.9 1 0.095 600 520
Moovattupuzha River:
KSPCB conducted monthly monitoring as part of SWMP for Moovattupuzha River in 5 stations in Ernakulam, Kottayam and Idukki districts. The results are given below.
At Moovattupuzha
(Velloorkunnam-Ernakulam)
Monthly Monitoring
2017 pH Conductivity DO BOD Nitrate N
TC FC

Kochi Bengaluru Industrial Corridor –Draft Perspective Plan for overall KBIC region - Draft
424
Unit µmhos/cm mg/l mg/l mg/l no/100 ml
no/100 ml
Max 7.1 99 7.4 1.40 0.7 4600 2800
Min 6.3 41 6.5 0.2 0.3 1200 800
At Ramamangalam (Ernakulam) Max 7.0 110.00 7.5 0.80 0.8 2800 1800
Min 6.4 36 6.3 0.2 0.21 1000 600
At Murinjapuzha (Chempu-Kottayam) Max 7.3 7802.00 6.8 1.10 0.64 3600 2400
Min 6.5 53 5.3 0.2 0.07 2000 1000
At Piravom (Vellore-Kottayam) Max 7.1 202.00 7.3 0.80 0.75 3500 2000
Min 6.47 42 6 0.2 0.18 1400 900
At Malamkara Dam (Muttam-Idukki) Max 7.1 106 7.8 0.60 0.76 2400 1200
Min 6.32 32 7 0.2 0.147 800 400
CPCB conducted monitoring as part of NWMP 2017 for Moovattupuzha river in Vettikkattumukku village. The results are given below.
At Vettikkattumukku
Monthly Monitoring
2017 pH Conductivity DO BOD Nitrate N
TC FC
Unit µmhos/cm mg/l mg/l mg/l no/100 ml
no/100 ml
Max 7.9 700 6.9 1.6 0.57 4000 1800
Min 6.5 54 5.5 0.3 0.07 1200 500
Chalakkudy River:
KSPCB conducted monthly monitoring as part of SWMP for Chalakkudy river in 6 stations in Thrissur district. The results are given below
At Muringoor
Monthly Monitoring
2017 pH Conductivity DO BOD TC FC
Unit µmhos/cm mg/l mg/l no/100 ml no/100 ml
Max 8.5 99 7.9 3 670 320
Min 6.5 38 5.7 0.4 150 40
At Pariyaram (Kanjirappilly)
Max 7.9 612.0 8.7 3.5 800 400
Min 6.8 29.65 3.7 0.8 170 50
At Pariyaram (Vettilappara)
Max 8.5 101.2 8.3 2.7 600 400
Min 7 30.2 7.1 0.4 180 50
At Pariyaram (Peringal)
Max 8.5 55.8 8.6 2.5 750 400
Min 6.9 29.5 5.4 0.3 120 50
At Kalloor (Palpuzhakadavu)
Max 8.2 199 8.7 3.0 700 330
Min 6.5 45 5.28 0.2 190 70
At Kalloor (Pulikkakadavu)
Max 7.7 176 8.6 3.0 700 330
Min 6.4 29 4.9 0.6 220 70

Kochi Bengaluru Industrial Corridor –Draft Perspective Plan for overall KBIC region - Draft
425
Karuvannoor River:
KSPCB conducted monthly monitoring as part of SWMP for Karuvannoor River in 5 stations in Thrissur district. The results are given below.
At Kainoor (Puthoor)
Monthly Monitoring
2017 pH Conductivity DO BOD TC FC
Unit µmhos/cm mg/l mg/l no/100 ml no/100 ml Max 7.5 210.1 8.8 3.9 1000 800
Min 6.8 40.3 4 0.5 100 80
At Kottenkode (Karalam)
Max 7.7 122.1 8.9 3 530 210
Min 6.7 33 3 0.2 90 10
At Karanchira (Karalam)
Max 7.9 172.1 8.6 3 600 360
Min 6.8 74.77 4 0.46 100 20
At Karuvannur (Porathissery)
Max 7.7 100.3 8.8 3.3 400 280
Min 6.8 36.81 5 0.5 100 60
At Mupliyam (Nandipulam)
Max 8.5 87.9 8.8 3.7 700 280 Min 6.4 38.54 5.2 0.4 200 110
CPCB conducted monitoring as part of NWMP 2017 for Karuvannoor River in Karuvannoor village. The results are given below.
At Karuvanoor Monthly Monitoring
2017 pH Conductivity DO BOD Nitrate N
TC FC
Unit µmhos/cm mg/l mg/l mg/l no/100 ml no/100 ml
Max 7.6 146 8 5.6 0.3 700 290
Min 6.9 35 5.1 0.3 0 100 31
Keecheri River:
KSPCB conducted monthly monitoring as part of SWMP for Keecheri River in Vadakkancherry village in Thrissur district. The results are given below
At Vadakkancherry Monthly Monitoring
2017 pH Conductivity DO BOD Nitrate N
TC FC
Unit µmhos/cm mg/l mg/l mg/l no/100 ml
no/100 ml
Max 7.8 240 8.5 6.4 0.54 750 260
Min 7 91 4.9 1.1 0.02 190 60
Bharathapuzha River:
KSPCB conducted monthly monitoring as part of SWMP for Bharathapuzha River in 9 villages in Malappuram, Palakkad and Thrissur districts. The results are given below.

Kochi Bengaluru Industrial Corridor –Draft Perspective Plan for overall KBIC region - Draft
426
At Thootha (Cherupulassery)-Malappuram
Monthly Monitoring (2017)
pH DO BOD TC Unit mg/l mg/l no/100 ml
Max 8.1 9 3 920
Min 7.1 7.2 0.3 20 At Kuttipuram-Malappuram
Max 8 8.7 2.7 320
Min 6.2 6.6 0.5 40 At Lakkidi-Palakkad
Max 8.5 7.1 3 840
Min 6.2 3.6 0.2 60 At Parali-Palakkad
Max 8.3 8.2 3 880
Min 7.2 3.6 0.9 40
At Naragampilly (Pudussery)-Palakkad Max 8.4 8.3 3.4 580
Min 7.4 2.9 1.1 20
At Tripallur (Erimayur)-Palakkad Max 8.2 8.3 3.2 840
Min 7.2 5.9 1.1 40
At Mangalam (Vadakkancherry)-Palakkad Max 7.9 8.8 3.8 840
Min 7 4.5 0.6 20
At Shornur-Thrissur
Max 8.5 8.8 3 740 Min 6.2 4 0.4 20
At Pattambi-Thrissur
Max 8.5 8.8 3 980
Min 6.2 6.8 0.3 60
CPCB conducted monitoring as part of NWMP 2017 for Bharathapuzha River in 2 stations. The results are given below.
At Kuttipuram-Malappuram
Monthly Monitoring
2017 pH Conductivity DO BOD Nitrate N
TC FC
Unit µmhos/cm mg/l mg/l mg/l no/100 ml no/100 ml
Max 8 848 9.4 3 0.73 320 286
Min 6.6 67 6.6 1.1 0.1 0 0
At Pattambi-Palakkad
Max 8.3 318 8.8 3.4 0.99 980 580 Min 6.2 175 6.8 0.3 0.21 0 0
Kadalundi River:
KSPCB conducted monthly monitoring as part of SWMP for Kadalundi River in 5 stations in Malappuram district. The results are given below.
At Kooriyad (Vengara) Monthly Monitoring (2017)
pH DO BOD TC Unit mg/l mg/l no/100 ml
Max 7.3 7.10 3 560

Kochi Bengaluru Industrial Corridor –Draft Perspective Plan for overall KBIC region - Draft
427
Min 6.3 5.3 0.4 48
At Manikkuth (Oorakam) Max 7.2 6.90 3 800
Min 6.5 4.1 0.6 32
At Hajiyarpalli (Panakad) Max 7.5 8.00 3 2400
Min 6.5 5.1 0.3 24
At Anakkayam Max 7.3 7.20 2.4 480
Min 6 4.2 0.6 16
At Oravampuram (Nenmeni) Max 7.5 7.00 3 160
Min 6.3 4.5 0.3 20
CPCB conducted monitoring as part of NWMP 2017 for Kadalundi River in 2 stations. The results are given below
At Thiroorangadi-Malappuram
Monthly Monitoring
2017 pH Conductivity DO BOD Nitrate N
TC FC
Unit µmhos/cm mg/l mg/l mg/l no/100 ml
no/100 ml
Max 7 280 7 3 2 480 255
Min 6.5 62 5.8 0.3 0 32 20
At Hajiyarapally-Malappuram
Max 7.5 143 8 3.6 1.4 2400 1100
Min 6.5 58 5.1 0.3 0 24 12
Tirur River:
KSPCB conducted monthly monitoring as part of SWMP for Tirur River in 3 stations in Malappuram districts. The results are given below.
At Thalakadathur (Cheriyamundam-Malappuram)
Monthly Monitoring (2017)
pH DO BOD TC
Unit mg/l mg/l no/100 ml Max 7.4 6.40 3.6 240.00
Min 4.7 3.1 0.6 12
At Mangatteri (Thalakad ) Max 7.70 7.30 3.30 496.00
Min 6 3.7 0.6 8
At Kooloopalam (Thalakad) Max 7.10 6.70 4.30 124.00
Min 6.3 3.6 0.6 40
CPCB conducted monitoring as part of NWMP 2017 for Tirur River in Thalakadathur stations. The results are given below.
At Thalakadathur Monthly Monitoring
2017 pH Conductivity DO BOD Nitrate N
TC FC
Unit µmhos/cm mg/l mg/l mg/l no/100 ml
no/100 ml
Max 7.4 30750 6.4 3.6 2 240 120
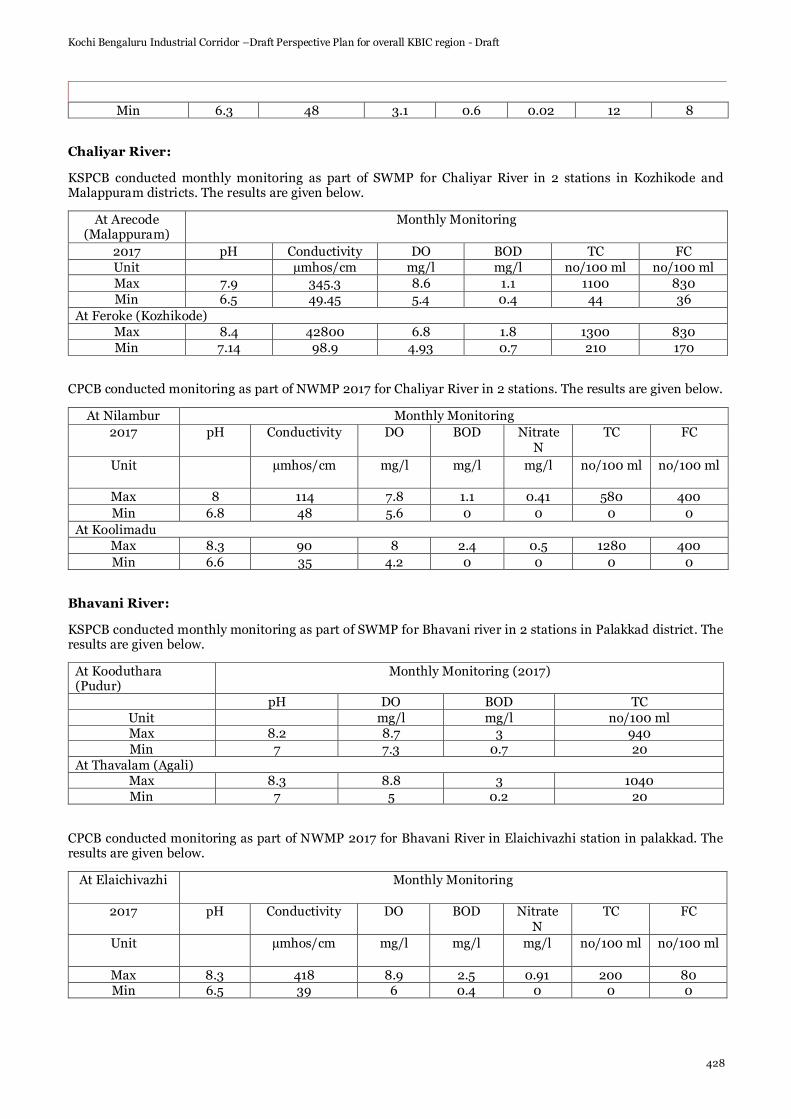
Kochi Bengaluru Industrial Corridor –Draft Perspective Plan for overall KBIC region - Draft
428
Min 6.3 48 3.1 0.6 0.02 12 8
Chaliyar River:
KSPCB conducted monthly monitoring as part of SWMP for Chaliyar River in 2 stations in Kozhikode and Malappuram districts. The results are given below.
At Arecode (Malappuram)
Monthly Monitoring
2017 pH Conductivity DO BOD TC FC
Unit µmhos/cm mg/l mg/l no/100 ml no/100 ml
Max 7.9 345.3 8.6 1.1 1100 830
Min 6.5 49.45 5.4 0.4 44 36
At Feroke (Kozhikode)
Max 8.4 42800 6.8 1.8 1300 830
Min 7.14 98.9 4.93 0.7 210 170
CPCB conducted monitoring as part of NWMP 2017 for Chaliyar River in 2 stations. The results are given below.
At Nilambur Monthly Monitoring
2017 pH Conductivity DO BOD Nitrate N
TC FC
Unit µmhos/cm mg/l mg/l mg/l no/100 ml no/100 ml
Max 8 114 7.8 1.1 0.41 580 400
Min 6.8 48 5.6 0 0 0 0
At Koolimadu
Max 8.3 90 8 2.4 0.5 1280 400
Min 6.6 35 4.2 0 0 0 0
Bhavani River:
KSPCB conducted monthly monitoring as part of SWMP for Bhavani river in 2 stations in Palakkad district. The results are given below.
At Kooduthara (Pudur)
Monthly Monitoring (2017)
pH DO BOD TC
Unit mg/l mg/l no/100 ml Max 8.2 8.7 3 940
Min 7 7.3 0.7 20
At Thavalam (Agali) Max 8.3 8.8 3 1040
Min 7 5 0.2 20
CPCB conducted monitoring as part of NWMP 2017 for Bhavani River in Elaichivazhi station in palakkad. The results are given below.
At Elaichivazhi Monthly Monitoring
2017 pH Conductivity DO BOD Nitrate N
TC FC
Unit µmhos/cm mg/l mg/l mg/l no/100 ml no/100 ml
Max 8.3 418 8.9 2.5 0.91 200 80 Min 6.5 39 6 0.4 0 0 0

Kochi Bengaluru Industrial Corridor –Draft Perspective Plan for overall KBIC region - Draft
429
Kallaipuzha River:
KSPCB conducted monthly monitoring as part of NWMP for Kallaipuzha River at Kallai Bridge in Kozhikode district. The results are given below.
At Kallai Bridge Monthly Monitoring
2017 pH Conductivity DO BOD Nitrate N
TC FC
Unit µmhos/cm mg/l mg/l mg/l no/100 ml no/100 ml
Max 8 50980 4.3 4.5 1.3 14000 6000
Min 6.8 767 1.1 0.7 0 70 40
Korappuzha River:
KSPCB conducted monthly monitoring as part of SWMP for Korappuzha River in 2 stations in Kozhikode district. The results are given below.
At Anapparakadavu Monthly Monitoring
2017 pH Conductivity DO BOD TC FC
Unit µmhos/cm mg/l mg/l no/100 ml no/100 ml
Max 8.15 57590 6.3 3.2 2040 1760
Min 7.3 937 1.2 0.6 150 70
At Purakatteri (Elathur)
Max 7.95 46200 5.4 5.1 1480 500
Min 6.4 258.5 0 0.6 80 40
CPCB conducted monitoring as part of NWMP 2017 for Korappuzha River in Kanayankode station in Kozhikode. The results are given below
At Kanayankode Monthly Monitoring
2017 pH Conductivity DO BOD Nitrate N
TC FC
Unit µmhos/cm mg/l mg/l mg/l no/100 ml no/100 ml
Max 7.8 40360 7.8 1.4 0.58 4800 4200
Min 6.8 329 2.4 0 0 100 90
Kuppam River:
CPCB conducted monitoring as part of NWMP 2017 for Kuppam River in 2 stations in Kannur district. The results are given below.
At Thaliparambu Monthly Monitoring
2017 pH Conductivity DO BOD Nitrate N
TC FC
Unit µmhos/cm mg/l mg/l mg/l no/100 ml no/100 ml
Max 7.3 47000 8.1 3 1.1 3000 940
Min 5.7 94 4.6 0.4 0.06 49 24
At Rayoram
Max 7.5 99 8.6 2 0.8 1020 820

Kochi Bengaluru Industrial Corridor –Draft Perspective Plan for overall KBIC region - Draft
430
Min 6.3 36 6.5 0.1 0.05 330 48
Valapattanam River:
KSPCB conducted monthly monitoring as part of SWMP for Valapattanam River in 4 stations in Kannur districts. The results are given below.
At Chengalayi (Kannur)
Monthly Monitoring
2017 pH Conductivity DO BOD TC FC
Unit µmhos/cm mg/l mg/l no/100 ml no/100 ml
Max 7.8 31640 8.4 1.5 950 870.00 Min 6.9 54.4 6.3 0.1 160 28
At Irikkur
Max 7.80 148 8.00 2.30 2000.00 800.00
Min 6.2 47 7.40 0.1 300.00 52.00
At Valapattanam
Max 8 52040 7.8 2.9 2900 1170
Min 6.6 522 2.4 0.3 200 28
At Pazhassi Reservoir (Padiyoor)
Max 7.6 81 8.73 2.7 1340 560 Min 6.5 35 7.5 0.07 80 4
CPCB conducted monitoring as part of NWMP 2017 for Valapattanam River in Parassinikadavu station in Kannur. The results are given below.
At Parassinikadavu Monthly Monitoring
2017 pH Conductivity DO BOD Nitrate N
TC FC
Unit µmhos/cm mg/l mg/l mg/l no/100 ml
no/100 ml
Max 7.6 47600 8 2.7 0.92 1430 920 Min 6.2 86 1.6 0.2 0.18 100 12
Kadambrayar River:
CPCB conducted monitoring as part of NWMP 2017 for Kadambrayar River in 2 stations in Ernakulam district. The results are given below.
At Brahmapuram Monthly Monitoring
2017 pH Conductivity DO BOD Nitrate N
TC FC
Unit µmhos/cm mg/l mg/l mg/l no/100 ml no/100 ml
Max 6.7 189 2.2 6.4 1.4 10000 6300 Min 6 80 0 1.6 0.05 900 620
At Manakkakadavu
Max 7.3 132 3.4 5.2 1.4 9400 4300 Min 6.1 71 0 1.2 0.11 350 280
Chitrapuzha River:
CPCB conducted monitoring as part of NWMP 2017 for Chitrapuzha River in Irumpanam station in Ernakulam district. The results are given below.

Kochi Bengaluru Industrial Corridor –Draft Perspective Plan for overall KBIC region - Draft
431
At Irumpanam Monthly Monitoring
2017 pH Conductivity DO BOD Nitrate N
TC FC
Unit µmhos/cm mg/l mg/l mg/l no/100 ml no/100 ml
Max 7.2 9700 5.5 4.6 5.37 7900 5800
Min 6.2 118 0.6 0.8 0.83 220 140
E.1.2. Tamil Nadu
As per the by CPCB ENVIS-Water Quality data-2016, River Water Quality data of districts in KBIC is given below:
Cauvery River:
At Mettur
2016 Temp. DO pH Conductivity BOD Nitrate N
FC TC
Unit °C mg/l µmhos/cm mg/l mg/l MPN/100 ml
MPN/100 ml
Min 29 5.7 7.5 475 0.8 0 170 390
Max 32 8.4 8.8 1000 3 0.8 2100 3200
At Pallipalayam 2016 Temp. DO pH Conductivity BOD Nitrate
N FC TC
Unit °C mg/l µmhos/cm mg/l mg/l MPN/100 ml
MPN/100 ml
Min 25 5.4 7.3 330 2 0.2 210 430 Max 33 7.5 8.7 855 6.2 0.4 2200 4900
At Erode near Chirapalayam
2016 Temp. DO pH Conductivity BOD Nitrate N
FC TC
Unit °C mg/l µmhos/cm mg/l mg/l MPN/100 ml
MPN/100 ml
Min 26 0.6 7.1 290 1.2 0 330 480
Max 34 7.2 8.6 1140 6 0.5 3500 9200 At Velore near Kattipalayam
2016 Temp. DO pH Conductivity BOD Nitrate N
FC TC
Unit °C mg/l µmhos/cm mg/l mg/l MPN/100 ml
MPN/100 ml
Min 25 5.7 7.1 350 1 0 210 400
Max 32 7.7 9 930 2.6 0.5 1400 2200
At Mohanur near Pattaipalayam
2016 Temp. DO pH Conductivity BOD Nitrate N
FC TC
Unit °C mg/l µmhos/cm mg/l mg/l MPN/100 ml
MPN/100 ml
Min 25 4.5 7 415 0.6 0 170 390
Max 32 6.9 8.8 999 4.2 0.6 1700 2800 At Komarapalayam, Namakal
2016 Temp. DO pH Conductivity BOD Nitrate N
FC TC
Unit °C mg/l µmhos/cm mg/l mg/l MPN/100 ml
MPN/100 ml
Min 26 4 7.1 369 1.1 0 220 400
Max 33 7.5 8.7 625 5.8 1.1 4600 7000
At Urachikottai, Erode

Kochi Bengaluru Industrial Corridor –Draft Perspective Plan for overall KBIC region - Draft
432
2016 Temp. DO pH Conductivity BOD Nitrate N
FC TC
Unit °C mg/l µmhos/cm mg/l mg/l MPN/100 ml
MPN/100 ml
Min 26 4.7 7.2 298 1.3 0 210 430
Max 36 8.3 9 535 4.4 0.9 1100 1700
At Vairapalayam, Namakal 2016 Temp. DO pH Conductivity BOD Nitrate
N FC TC
Unit °C mg/l µmhos/cm mg/l mg/l MPN/100 ml
MPN/100 ml
Min 26 4.1 7.1 299 0.9 0 170 390 Max 33 8.4 8.6 620 3.1 0.5 2100 3900
At Pugalur, Karur
2016 Temp. DO pH Conductivity BOD Nitrate N
FC TC
Unit °C mg/l µmhos/cm mg/l mg/l MPN/100 ml
MPN/100 ml
Min 26 5.1 7.3 320 1 0 93 190
Max 28 7.4 9.3 992 2.5 0.3 940 2200
Bhavani River:
At Sirumugai
2016 Temp. DO pH Conductivity BOD Nitrate N
FC TC
Unit °C mg/l µmhos/cm mg/l mg/l MPN/100 ml
MPN/100 ml
Min 25 6 6.7 96 0.5 0 78 170
Max 27 8 8 270 2 1.3 1100 1700
At Bhavani 2016 Temp. DO pH Conductivity BOD Nitrate
N FC TC
Unit °C mg/l µmhos/cm mg/l mg/l MPN/100 ml
MPN/100 ml
Min 26 4.8 7 310 0.4 0 130 260 Max 34 7.6 8.5 770 2.4 1.6 1200 2200
At Bhavani Sagar
2016 Temp. DO pH Conductivity BOD Nitrate N
FC TC
Unit °C mg/l µmhos/cm mg/l mg/l MPN/100 ml
MPN/100 ml
Min 23 5.5 6.9 140 1.2 0 68 170
Max 34 7.8 8.4 280 2.7 0.8 580 1200
Bhavani U/S of Kalingarayan Canal (B5), Erode 2016 Temp. DO pH Conductivity BOD Nitrate
N FC TC
Unit °C mg/l µmhos/cm mg/l mg/l MPN/100 ml
MPN/100 ml
Min 27 4.5 7.2 285 1 0 460 630 Max 33 6.7 8.2 540 2.4 1 700 1100
Bhavani D/S of Kalingarayan Canal (B10), Erode
2016 Temp. DO pH Conductivity BOD Nitrate N
FC TC
Unit °C mg/l µmhos/cm mg/l mg/l MPN/100 ml
MPN/100 ml
Min 27 5.9 7.6 290 0.6 0 490 840
Max 33 7.6 8.5 530 1.7 1.1 790 1400

Kochi Bengaluru Industrial Corridor –Draft Perspective Plan for overall KBIC region - Draft
433
Thirumanimuthar River:
At Salem, D/S of Sago & Textile
2016 Temp. DO pH Conductivity BOD Nitrate N
FC TC
Unit °C mg/l µmhos/cm mg/l mg/l MPN/100 ml
MPN/100 ml
Min 25 6.2 2130 11 0 17000 26000
Max 30 8.1 2690 192 2 54000000 92000000
Vasista River:
At Salem, D/S of Sago Industries Effluent
2016 Temp. DO pH Conductivity BOD Nitrate N
FC TC
Unit °C mg/l µmhos/cm mg/l mg/l MPN/100 ml
MPN/100 ml
Min 27 2.1 6.4 1520 22 0 210000 320000
Max 34 2.1 8.1 3500 675 2.7 54000000 92000000
Sarabanga River:
At Salem D/S of Textile Dying Industries Effluent
2016 Temp. DO pH Conductivity BOD Nitrate N
FC TC
Unit °C mg/l µmhos/cm mg/l mg/l MPN/100 ml
MPN/100 ml
Min 25 3.5 6.6 1900 7.8 0 4900 9400
Max 31 5.4 8.4 3890 78 2.2 5400000 9400000

Kochi Bengaluru Industrial Corridor –Draft Perspective Plan for overall KBIC region - Draft
434
E.2. Work flow for the Forest Clearance
Figure 198: Process for Forest Clearance (stage-1: Form A & B)

Kochi Bengaluru Industrial Corridor –Draft Perspective Plan for overall KBIC region - Draft
435
Figure 199: Process for Forest Clearance (stage-1: Form C)

Kochi Bengaluru Industrial Corridor –Draft Perspective Plan for overall KBIC region - Draft
436
Appendix F. - Power infrastructure
F.1. Details of works in the Palakkad Region
Table 165: Power infrastructure works in Palakkad region
Task wise consolidation of works for each Financial Year
Tasks - consolidated UoM 2018-
19 2019-
20 2020-
21 2021-
22 Total
HT line Construction - OH km 71 83 70 41 265
HT line Construction - UG km 0.4 1.7 2.6 2.8 7.5
HT line Construction - ABC km 6 17 18 20 61
HT line Construction - CC km 0 0 0 0 0
HT line Construction - Total km 77.4 101.7 90.6 63.79 333.5
Transformer Installation - 15/25 kVA No 1 1 5 0 7
Transformer Installation - 100 kVA No 67 56 43 35 201
Transformer Installation - 160 kVA No 0 0 0 0 0
Transformer Installation - 250 kVA No 0 0 0 0 0
Transformer Installation - 500 kVA No 0 0 0 0 0
Transformer Installation - Total No 68 57 48 35 208
LT line Construction - OH km 33 36 34 28 131
LT line Construction - UG km 0 0 0 0 0
LT line Construction - ABC km 5 12 8 10 35
LT line Construction-Total km 38 48 42 38 166
Construction-FPI No 313 129 242 155 839
Switches - RMU No 0 0 0 0 0
Switches - LBS No 0 0 0 0 0
Switches- AB No 282 210 174 112 778
Section Fuses No 335 446 340 791 1912
Switches & Fuses-Total No 617 656 514 903 2690
Construction-Others km 3318 5723 3493 3582 16116
Conversion SP to TP km 94 203 187 144 628
Conversion LT OH to ABC km 0 0 0 0 0
Conversion LT OH to HVDS km 0 0 0 0 0
Conversion HT OH to ABC km 7 39 52 24 122
Faulty Meter Changing No 32552 27501 25515 26728 112296

Kochi Bengaluru Industrial Corridor –Draft Perspective Plan for overall KBIC region - Draft
437
Task wise consolidation of works for each Financial Year
Tasks - consolidated UoM 2018-
19 2019-
20 2020-
21 2021-
22 Total
Installation of Border Meter No 22 2 1 4 29
Installation of DTR Meter No 67 443 54 69 633
F.2. Details of works in the Thrissur Region
Table 166: Power infrastructure works in Thrissur region
Task wise consolidation of works for each Financial Year
Tasks - consolidated UoM 2018- 19
2019- 20
2020- 21
2021- 22
Total
HT line Construction - OH km 112 123 125 62 424
HT line Construction – ABC km 9.52 13.3 12.25 7.12 42.19
HT line Construction - CC km 12.35 8.8 11.9 5.3 38.35
HT line Construction – UG km 7.51 6.19 7.39 5.14 26.23
HT line Construction – LTOH to HVDS Km 0.9 0.25 2.05 0.3 3.5
HT line Construction – LT – OH Km 49.56 48.86 57.9 54.17 210.5
HT line Construction – LT – ABC km 38 42 43.9 25.5 149.7
HT line Construction – LT – UG km 0 0 0 0 0
Transformer Installation - 15/25 kVA No 5 1 6 3 15
Transformer Installation - 100 kVA No 56 68 35 15 176
Transformer Installation - 160 kVA No 2 2
Transformer Installation - 250 kVA No 0 1 0 0 1
Replacement of DTR – 100kVA No 1 16 0 6 23
Replacement of DTR – 160kVA No 1 8 0 6 15
Replacement of DTR – 250kVA No 0 2 0 1 3
Replacement of DTR – 500kVA No 0 0 0 0 0
Construction-FPI No 164 306 122 160 752
Switches - RMU No 3 35 23 19 80
Switches - LBS No 10 49 94 26 179
Switches- AB No 636 737 113 200 1684
Construction-Others Nos 2917 3211 1919 1655 9702
Conversion SP to TP km 178.6 304.7 270.28 174.8 928.51
Conversion HT OH to ABC km 21.15 17.05 24.28 18 80
Reconductoring – HT – HT OH Line Km 102.3 228.45 170.8 59.5 561.05

Kochi Bengaluru Industrial Corridor –Draft Perspective Plan for overall KBIC region - Draft
438
Task wise consolidation of works for each Financial Year
Tasks - consolidated UoM 2018- 19
2019- 20
2020- 21
2021- 22
Total
Reconductoring – LT – LT OH Line Km 3178.6 3856.7 3576 2534 13145.92
Standardization – HT Line Km 3 7 4 0.4 14.4
Standardization – LT Line Km 32.9 33.02 24.13 5.37 95.4
Standardization – Tx Station No 152 244 178 207 781
Standardization – Poles and structures No 708 1256 1429 1527 4920
Loss reduction - Broader Meter No 69 12 8 1 90
Loss reduction - DTR Meter No 31 46 38 58 173
Loss reduction - Faulty Meter No 58760 45343 38686 35722 178511
Loss reduction - Shifting DTR No 19 2 0 1 22
Loss reduction - Shifting HT line Km 14.5 13.95 7.95 8.8 45.2
Loss reduction - Shifting LT line Km
Loss reduction - Tx Earting No 150 150 0 68 368
Loss reduction - Pipe Earthing No 20 150 75 700 945
Loss reduction - Pole Earthing No 728 1408 550 600 3286
Dismantling Lines Km 0 2.5 0 4.03 7.6
Dismantling DTR No
New Connection No

Kochi Bengaluru Industrial Corridor –Draft Perspective Plan for overall KBIC region - Draft
439
Copyright © 2022 FDOKUMEN