Overall-Mouth Disinfection by Photodynamic Therapy Using ...
89
-
Upload
khangminh22 -
Category
Documents
-
view
0 -
download
0
Transcript of Overall-Mouth Disinfection by Photodynamic Therapy Using ...
Overall-Mouth Disinfection by PhotodynamicTherapy Using Curcumin
Natalia Costa Araujo, M.D.,1 Carla Raquel Fontana, Ph.D.,2,3
Marleny Elizabeth Martinez Gerbi, Ph.D.1 and Vanderlei Salvador Bagnato, Ph.D.3
Abstract
Background data: Photodynamic therapy is a technique that involves the activation of photosensitizers by lightin the presence of tissue oxygen, resulting in the production of reactive radicals capable of inducing cell death.Objective: The present study assessed the overall susceptibility of pathogens of salivary flora to photodynamictherapy after sensitization with curcumin and exposure to blue light at 450 nm. Methods: A randomized trialwas executed with 13 adult volunteers. Three different groups were analyzed: L-D- (no light, no drug; controlgroup), L-D + (treated only with the drug; curcumin group) and L + D + (treated with drug and light; photo-dynamic therapy group). Non-stimulated saliva samples were collected for bacterial counts at baseline and afterthe experimental phase, and adverse events experienced were recorded. Serial dilutions were performed, and theresulting samples were cultured on blood agar plates in microaerophilic conditions. The number of colony-forming units was then determined. Results: There was a considerable difference between the two experimentalgroups with regard to effectiveness of bacterial reduction. In the L-D + group, the bacterial decline was con-siderably smaller (9%) than in the L + D + group, with a 68% decrease in bacteria. A statistically significantreduction in the bacterial population was observed only in the photodynamic therapy group ( p < 0.05). Con-clusions: Photodynamic therapy was found to be effective in the reduction of salivary microorganisms. Nosignificant reduction was found for the group in which only curcumin was used, proving the absence of darktoxicity of the drug. This work shows that overall disinfection of the mouth can be done with a simple procedureinvolving photodynamic action.
Introduction
The diversity of biological surfaces in the oral cavityprovides many ecological sites for colonization by a va-
riety of oral bacterial species. The mouth is a favorable habitatfor > 700 bacterial species because of the presence of nutrients,epithelial debris, and secretions.1 Therefore, the risk of infec-tion is increased in intra-oral surgical procedures, because it ispractically impossible to attain aseptic conditions, as a resultof the large number of bacteria in the normal mouth. Localpostoperative infections are one of the main causes of mor-bidity in oral surgery.2 In some cases, the mouth cavity caneven be the main cause of contamination for many types ofsurgery. Some surgeons advocate the routine use of prophy-lactic systemic antibiotics to decrease the risk of postoperativeinfection. However, antibiotics may be associated with unfa-vorable side effects, ranging from gastrointestinal distur-bances to anaphylactic shock and development of resistance.3
Another option for decreasing the risk of postoperativeinfection by temporary reduction of intra-oral bacterialcounts is the use of oral antiseptics. Disinfecting solutions,ideally, should be safe to use and effective against pathogens,and should not cause adverse tissue reaction. The most fre-quently used are chlorhexidine solutions.4
Chlorhexidine causes an immediate reduction in thenumber of salivary bacteria because of its broad activityspectrum.5 Its mechanism of action involves interactionswith external cell components and the cytoplasmic mem-brane, causing a high rate of leakage of intracellular com-ponents and interactions with cytoplasmic constituents.6
Alteration in taste; burning sensation; increase of calculusformation; staining of the teeth and restorative materials;and, more rarely, oral mucosa desquamation and parotidswelling are effects related to its use.7
Recently, alternatives that might offer the possibility ofefficient intra-oral bacterial count reduction with minimum
1Dental School of Pernambuco, University of Pernambuco, Camaragibe, PE, Brazil.2Department of Clinical Analysis, School of Pharmaceutical Sciences, University of Sao Paulo State (UNESP), Araraquara, SP, Brazil.3Institute of Physics of Sao Carlos, University of Sao Paulo (USP), Sao Carlos, SP, Brazil.
Photomedicine and Laser SurgeryVolume 30, Number 2, 2012ª Mary Ann Liebert, Inc.Pp. 96–101DOI: 10.1089/pho.2011.3053
96
damage to systemic health have been sought. In these cir-cumstances, photodynamic therapy (PDT) may offer thepossibility of a new approach to oral disinfection.
PDT has been used as a treatment for cancer as well asother nonmalignant diseases.8,9 PDT involves the use of aphotosensitizer (PS) that is activated by exposure to light of aspecific wavelength in the presence of oxygen. The excited PSbinds to the target cell and induces the formation of oxygenspecies, causing localized photodamage and cell death.9–11
One advantage of PDT as compared to antibiotics is thatbacteria do not develop resistance to oxygen species. Ascompared to chlorhexidine, PDT does not cause the reportedside-effects.
An ideal PS should be nontoxic and should display localtoxicity only after activation by illumination.12 Curcumin, acompound isolated from Curcuma longa l., has been used forcenturies as a medicine, dietary pigment, and spice. The drugpossesses a variety of traditional pharmaceutical applicationsfor diseases, including wounds, liver diseases, microbial ef-fects, and inflamed joints.13 Curcumin has proved nontoxicin a number of cell culture and whole animal studies. It has arather broad absorption peak in the range of 300–500 nm(maximum *430 nm) and exerts potent phototoxic effects inmicromolar amounts. Therefore, curcumin has potential as aPS for treatment of localized superficial infections in themouth or skin.14 In addition, this PS has economical ad-vantages considering its low cost, simple manipulation, andgreat effectiveness.
The effectiveness of PDT against oral bacteria has been thesubject of several studies.15–20 Zanin et al.18 showed thephotodynamic activity of some PS on biofilms of Strepto-coccus mutans, Streptococcus sobrinus, and Streptococcus san-guinis. Zanin et al.20 evaluated the phototoxic effect oftoluidine blue O (TBO) on the viability of S. mutans biofilmsand observed reductions up to 99.99%. Wood et al.17 ob-served the successful photodynamic effects of erythrosine inthe killing of S. mutans biofilms. Fontana et al.15 showed thephotodynamic action of methylene blue on human dentalplaque microorganisms.
The efficacy of photodynamic action on microorganismshas been extensively investigated using various sensitizers.However, none of those studies used curcumin as a PS fororal decontamination.
In this study, we aim to investigate the effects of PDT onbacteria derived from human saliva. The goal of our researchwas to detect the susceptibility of pathogens of salivary florato PDT after sensitization with curcumin and exposure toblue light at 450 nm.
Materials and Methods
Subjects
Samples of saliva were taken from 13 healthy subjectsaged 25 through 50 years. The study group was composed of7 female and 6 male participants. The criteria for exclusionfrom the study were age < 18 years, pregnancy, using partialor total dentures or orthodontic brackets, presence of sys-temic diseases, or smoking habit (Fig. 1). None of the subjectshad used antibiotics or had undergone medical or dentaltreatment during the 3 months prior to sampling. The vol-unteers were not allowed to practice any oral hygiene tech-nique (brushing or flossing) and followed a zero diet (no food)
during the 12 h prior to sampling. Permission to collect salivasamples was authorized by the Ethics Committee of theUniversity of Pernambuco (UPE), protocol number 033/11.All subjects also gave their informed consent.
Preparation of blood agar culture plates
An enriched agar medium was prepared, containing20 g/L of trypticase soy agar (Oxoid Ltd., Basingstoke,Hampshire, England), 26 g/L of brain - heart infusion agar(Oxoid Ltd., Basingstoke, Hampshire, England), 10 g/L ofyeast extract (BBL), and 5 mg/L of hemin (Sigma ChemicalCo., St. Louis, MO). The medium was autoclaved andcooled down to 50C. Then, 5% defibrinated sheep blood(NewProv LTDA, Pinhais PR, Brazil) and 5 mg/mL ofmenadione (Sigma Chemical Co., St. Louis, MO) wereadded under aseptic conditions.
PS
Curcumin [1,7-bis-(4-hydroxy-3-methoxyphenyl)-1,6-hep-tadiene-3,5-dione] is an excellent lead compound for drugdesign and development on the basis of its explicit bioac-tivities, nontoxicity, and easy synthesis. Curcumin preparedby PDT–Pharma (Cravinhos SP, Brazil) was dissolved insterile distilled water to give a solution at concentration of1.5 g/L before use.
The ultraviolet-visible absorption spectra of this solutionwere recorded from 300 to 700 nm using quartz cuvettes witha 1-cm path length on a Cary 50 Bio UV-Vis spectrometer(Varian, Darmstadt, Germany), and were characterized by along-wavelength maximum at 430 nm.
Light source
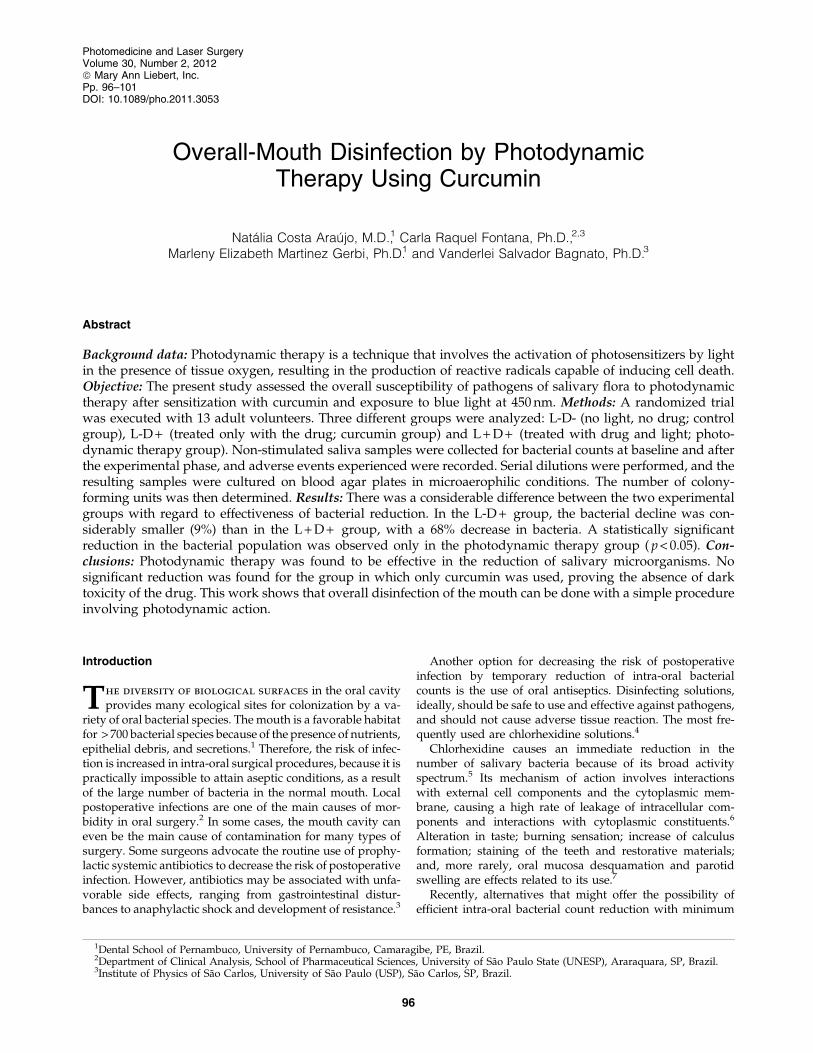
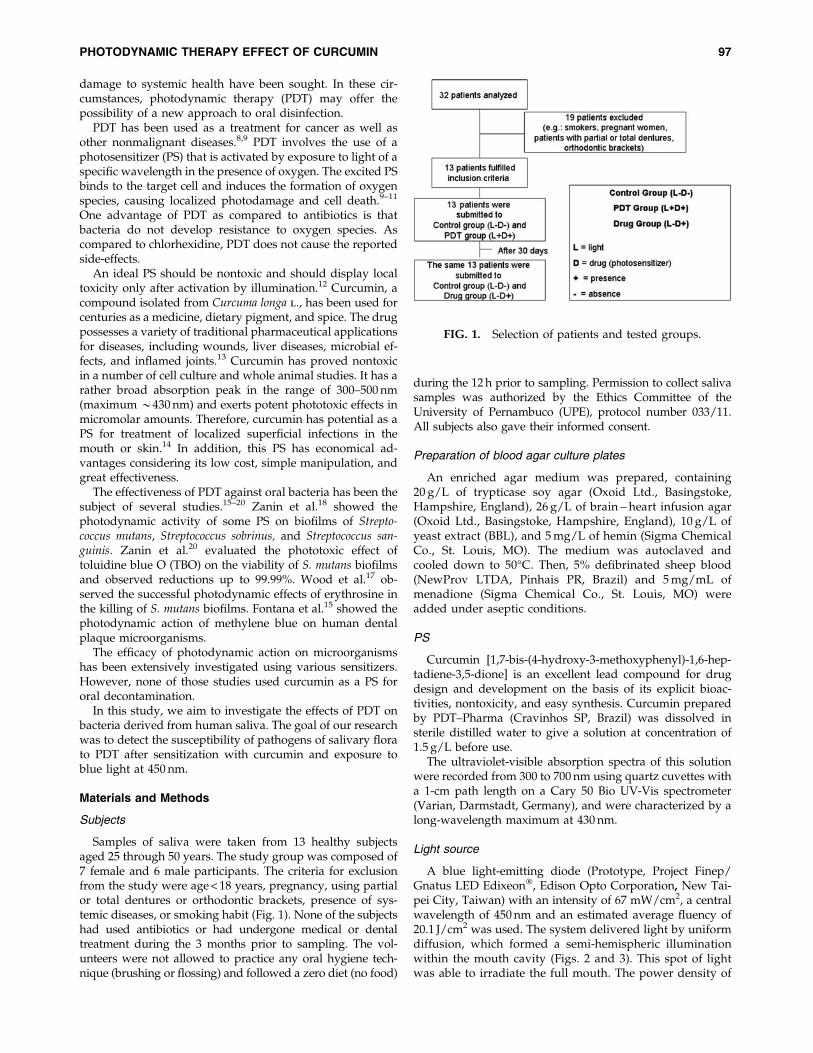
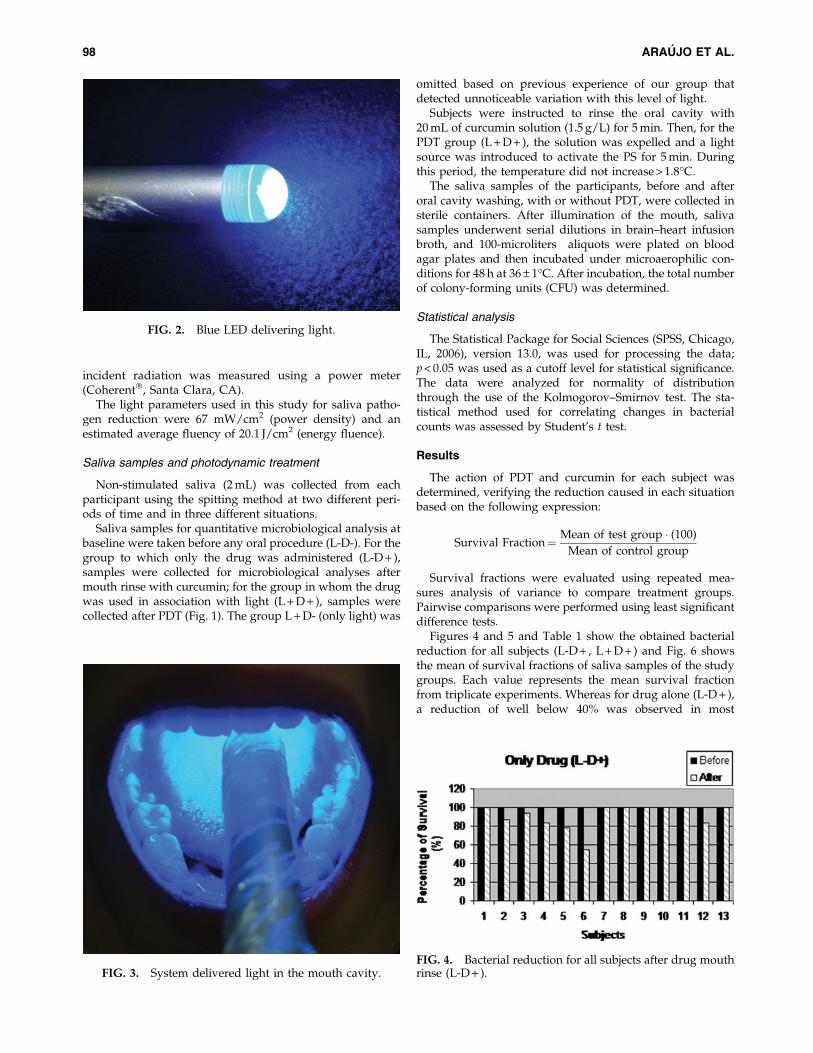
A blue light-emitting diode (Prototype, Project Finep/Gnatus LED Edixeon, Edison Opto Corporation, New Tai-pei City, Taiwan) with an intensity of 67 mW/cm2, a centralwavelength of 450 nm and an estimated average fluency of20.1 J/cm2 was used. The system delivered light by uniformdiffusion, which formed a semi-hemispheric illuminationwithin the mouth cavity (Figs. 2 and 3). This spot of lightwas able to irradiate the full mouth. The power density of
FIG. 1. Selection of patients and tested groups.
PHOTODYNAMIC THERAPY EFFECT OF CURCUMIN 97
incident radiation was measured using a power meter(Coherent, Santa Clara, CA).
The light parameters used in this study for saliva patho-gen reduction were 67 mW/cm2 (power density) and anestimated average fluency of 20.1 J/cm2 (energy fluence).
Saliva samples and photodynamic treatment
Non-stimulated saliva (2 mL) was collected from eachparticipant using the spitting method at two different peri-ods of time and in three different situations.
Saliva samples for quantitative microbiological analysis atbaseline were taken before any oral procedure (L-D-). For thegroup to which only the drug was administered (L-D + ),samples were collected for microbiological analyses aftermouth rinse with curcumin; for the group in whom the drugwas used in association with light (L + D + ), samples werecollected after PDT (Fig. 1). The group L + D- (only light) was
omitted based on previous experience of our group thatdetected unnoticeable variation with this level of light.
Subjects were instructed to rinse the oral cavity with20 mL of curcumin solution (1.5 g/L) for 5 min. Then, for thePDT group (L + D + ), the solution was expelled and a lightsource was introduced to activate the PS for 5 min. Duringthis period, the temperature did not increase > 1.8C.
The saliva samples of the participants, before and afteroral cavity washing, with or without PDT, were collected insterile containers. After illumination of the mouth, salivasamples underwent serial dilutions in brain–heart infusionbroth, and 100-microliters aliquots were plated on bloodagar plates and then incubated under microaerophilic con-ditions for 48 h at 36 – 1C. After incubation, the total numberof colony-forming units (CFU) was determined.
Statistical analysis
The Statistical Package for Social Sciences (SPSS, Chicago,IL, 2006), version 13.0, was used for processing the data;p < 0.05 was used as a cutoff level for statistical significance.The data were analyzed for normality of distributionthrough the use of the Kolmogorov–Smirnov test. The sta-tistical method used for correlating changes in bacterialcounts was assessed by Student’s t test.
Results
The action of PDT and curcumin for each subject wasdetermined, verifying the reduction caused in each situationbased on the following expression:
Survival Fraction¼ Mean of test group (100)
Mean of control group
Survival fractions were evaluated using repeated mea-sures analysis of variance to compare treatment groups.Pairwise comparisons were performed using least significantdifference tests.
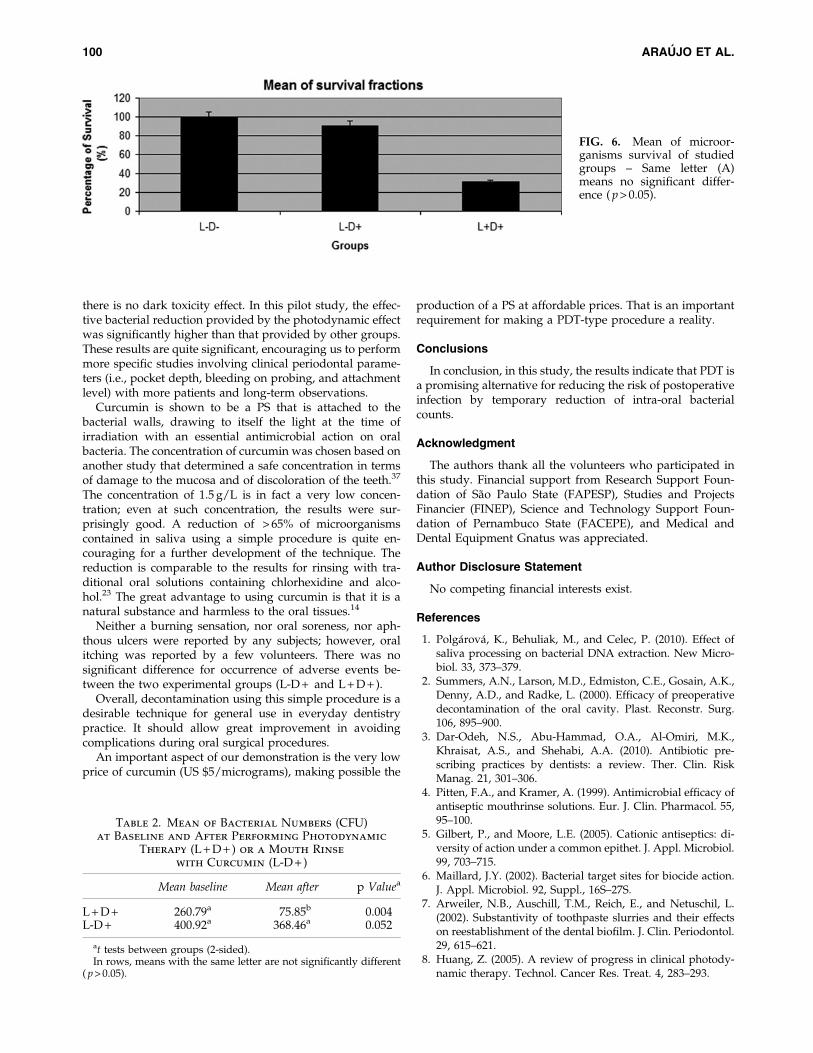
Figures 4 and 5 and Table 1 show the obtained bacterialreduction for all subjects (L-D + , L + D + ) and Fig. 6 showsthe mean of survival fractions of saliva samples of the studygroups. Each value represents the mean survival fractionfrom triplicate experiments. Whereas for drug alone (L-D + ),a reduction of well below 40% was observed in most
FIG. 2. Blue LED delivering light.
FIG. 3. System delivered light in the mouth cavity.FIG. 4. Bacterial reduction for all subjects after drug mouthrinse (L-D + ).
98 ARAUJO ET AL.
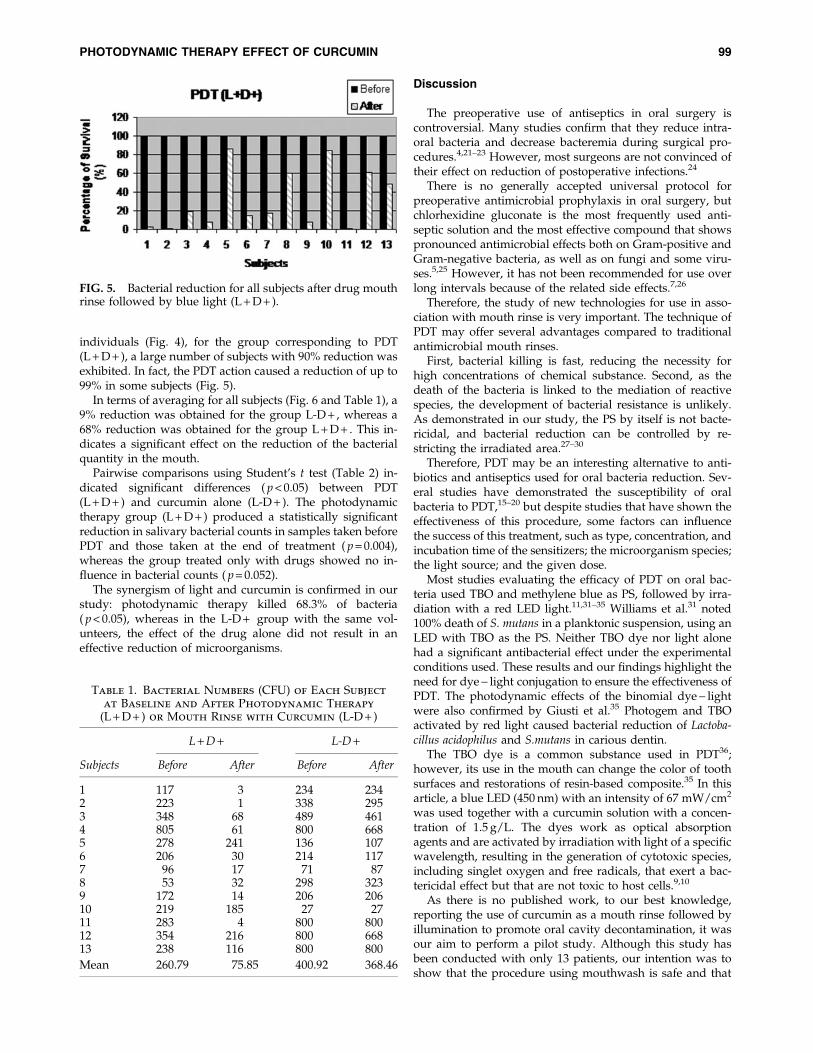
individuals (Fig. 4), for the group corresponding to PDT(L + D + ), a large number of subjects with 90% reduction wasexhibited. In fact, the PDT action caused a reduction of up to99% in some subjects (Fig. 5).
In terms of averaging for all subjects (Fig. 6 and Table 1), a9% reduction was obtained for the group L-D + , whereas a68% reduction was obtained for the group L + D + . This in-dicates a significant effect on the reduction of the bacterialquantity in the mouth.
Pairwise comparisons using Student’s t test (Table 2) in-dicated significant differences ( p < 0.05) between PDT(L + D + ) and curcumin alone (L-D + ). The photodynamictherapy group (L + D + ) produced a statistically significantreduction in salivary bacterial counts in samples taken beforePDT and those taken at the end of treatment ( p = 0.004),whereas the group treated only with drugs showed no in-fluence in bacterial counts ( p = 0.052).
The synergism of light and curcumin is confirmed in ourstudy: photodynamic therapy killed 68.3% of bacteria( p < 0.05), whereas in the L-D + group with the same vol-unteers, the effect of the drug alone did not result in aneffective reduction of microorganisms.
Discussion
The preoperative use of antiseptics in oral surgery iscontroversial. Many studies confirm that they reduce intra-oral bacteria and decrease bacteremia during surgical pro-cedures.4,21–23 However, most surgeons are not convinced oftheir effect on reduction of postoperative infections.24
There is no generally accepted universal protocol forpreoperative antimicrobial prophylaxis in oral surgery, butchlorhexidine gluconate is the most frequently used anti-septic solution and the most effective compound that showspronounced antimicrobial effects both on Gram-positive andGram-negative bacteria, as well as on fungi and some viru-ses.5,25 However, it has not been recommended for use overlong intervals because of the related side effects.7,26
Therefore, the study of new technologies for use in asso-ciation with mouth rinse is very important. The technique ofPDT may offer several advantages compared to traditionalantimicrobial mouth rinses.
First, bacterial killing is fast, reducing the necessity forhigh concentrations of chemical substance. Second, as thedeath of the bacteria is linked to the mediation of reactivespecies, the development of bacterial resistance is unlikely.As demonstrated in our study, the PS by itself is not bacte-ricidal, and bacterial reduction can be controlled by re-stricting the irradiated area.27–30
Therefore, PDT may be an interesting alternative to anti-biotics and antiseptics used for oral bacteria reduction. Sev-eral studies have demonstrated the susceptibility of oralbacteria to PDT,15–20 but despite studies that have shown theeffectiveness of this procedure, some factors can influencethe success of this treatment, such as type, concentration, andincubation time of the sensitizers; the microorganism species;the light source; and the given dose.
Most studies evaluating the efficacy of PDT on oral bac-teria used TBO and methylene blue as PS, followed by irra-diation with a red LED light.11,31–35 Williams et al.31 noted100% death of S. mutans in a planktonic suspension, using anLED with TBO as the PS. Neither TBO dye nor light alonehad a significant antibacterial effect under the experimentalconditions used. These results and our findings highlight theneed for dye - light conjugation to ensure the effectiveness ofPDT. The photodynamic effects of the binomial dye - lightwere also confirmed by Giusti et al.35 Photogem and TBOactivated by red light caused bacterial reduction of Lactoba-cillus acidophilus and S.mutans in carious dentin.
The TBO dye is a common substance used in PDT36;however, its use in the mouth can change the color of toothsurfaces and restorations of resin-based composite.35 In thisarticle, a blue LED (450 nm) with an intensity of 67 mW/cm2
was used together with a curcumin solution with a concen-tration of 1.5 g/L. The dyes work as optical absorptionagents and are activated by irradiation with light of a specificwavelength, resulting in the generation of cytotoxic species,including singlet oxygen and free radicals, that exert a bac-tericidal effect but that are not toxic to host cells.9,10
As there is no published work, to our best knowledge,reporting the use of curcumin as a mouth rinse followed byillumination to promote oral cavity decontamination, it wasour aim to perform a pilot study. Although this study hasbeen conducted with only 13 patients, our intention was toshow that the procedure using mouthwash is safe and that
FIG. 5. Bacterial reduction for all subjects after drug mouthrinse followed by blue light (L + D + ).
Table 1. Bacterial Numbers (CFU) of Each Subject
at Baseline and After Photodynamic Therapy
(L + D + ) or Mouth Rinse with Curcumin (L-D + )
L + D + L-D +
Subjects Before After Before After
1 117 3 234 2342 223 1 338 2953 348 68 489 4614 805 61 800 6685 278 241 136 1076 206 30 214 1177 96 17 71 878 53 32 298 3239 172 14 206 20610 219 185 27 2711 283 4 800 80012 354 216 800 66813 238 116 800 800
Mean 260.79 75.85 400.92 368.46
PHOTODYNAMIC THERAPY EFFECT OF CURCUMIN 99
there is no dark toxicity effect. In this pilot study, the effec-tive bacterial reduction provided by the photodynamic effectwas significantly higher than that provided by other groups.These results are quite significant, encouraging us to performmore specific studies involving clinical periodontal parame-ters (i.e., pocket depth, bleeding on probing, and attachmentlevel) with more patients and long-term observations.
Curcumin is shown to be a PS that is attached to thebacterial walls, drawing to itself the light at the time ofirradiation with an essential antimicrobial action on oralbacteria. The concentration of curcumin was chosen based onanother study that determined a safe concentration in termsof damage to the mucosa and of discoloration of the teeth.37
The concentration of 1.5 g/L is in fact a very low concen-tration; even at such concentration, the results were sur-prisingly good. A reduction of > 65% of microorganismscontained in saliva using a simple procedure is quite en-couraging for a further development of the technique. Thereduction is comparable to the results for rinsing with tra-ditional oral solutions containing chlorhexidine and alco-hol.23 The great advantage to using curcumin is that it is anatural substance and harmless to the oral tissues.14
Neither a burning sensation, nor oral soreness, nor aph-thous ulcers were reported by any subjects; however, oralitching was reported by a few volunteers. There was nosignificant difference for occurrence of adverse events be-tween the two experimental groups (L-D + and L + D + ).
Overall, decontamination using this simple procedure is adesirable technique for general use in everyday dentistrypractice. It should allow great improvement in avoidingcomplications during oral surgical procedures.
An important aspect of our demonstration is the very lowprice of curcumin (US $5/micrograms), making possible the
production of a PS at affordable prices. That is an importantrequirement for making a PDT-type procedure a reality.
Conclusions
In conclusion, in this study, the results indicate that PDT isa promising alternative for reducing the risk of postoperativeinfection by temporary reduction of intra-oral bacterialcounts.
Acknowledgment
The authors thank all the volunteers who participated inthis study. Financial support from Research Support Foun-dation of Sao Paulo State (FAPESP), Studies and ProjectsFinancier (FINEP), Science and Technology Support Foun-dation of Pernambuco State (FACEPE), and Medical andDental Equipment Gnatus was appreciated.
Author Disclosure Statement
No competing financial interests exist.
References
1. Polgarova, K., Behuliak, M., and Celec, P. (2010). Effect ofsaliva processing on bacterial DNA extraction. New Micro-biol. 33, 373–379.
2. Summers, A.N., Larson, M.D., Edmiston, C.E., Gosain, A.K.,Denny, A.D., and Radke, L. (2000). Efficacy of preoperativedecontamination of the oral cavity. Plast. Reconstr. Surg.106, 895–900.
3. Dar-Odeh, N.S., Abu-Hammad, O.A., Al-Omiri, M.K.,Khraisat, A.S., and Shehabi, A.A. (2010). Antibiotic pre-scribing practices by dentists: a review. Ther. Clin. RiskManag. 21, 301–306.
4. Pitten, F.A., and Kramer, A. (1999). Antimicrobial efficacy ofantiseptic mouthrinse solutions. Eur. J. Clin. Pharmacol. 55,95–100.
5. Gilbert, P., and Moore, L.E. (2005). Cationic antiseptics: di-versity of action under a common epithet. J. Appl. Microbiol.99, 703–715.
6. Maillard, J.Y. (2002). Bacterial target sites for biocide action.J. Appl. Microbiol. 92, Suppl., 16S–27S.
7. Arweiler, N.B., Auschill, T.M., Reich, E., and Netuschil, L.(2002). Substantivity of toothpaste slurries and their effectson reestablishment of the dental biofilm. J. Clin. Periodontol.29, 615–621.
8. Huang, Z. (2005). A review of progress in clinical photody-namic therapy. Technol. Cancer Res. Treat. 4, 283–293.
FIG. 6. Mean of microor-ganisms survival of studiedgroups – Same letter (A)means no significant differ-ence ( p > 0.05).
Table 2. Mean of Bacterial Numbers (CFU)at Baseline and After Performing Photodynamic
Therapy (L + D + ) or a Mouth Rinse
with Curcumin (L-D + )
Mean baseline Mean after p Valuea
L + D + 260.79a 75.85b 0.004L-D + 400.92a 368.46a 0.052
at tests between groups (2-sided).In rows, means with the same letter are not significantly different
( p > 0.05).
100 ARAUJO ET AL.
9. Al-Watban, F.A., and Zhang, X.Y. (2005). Photodynamictherapy of human undifferentiated thyroid carcinoma-bearingnude mice using topical 5-aminolevulinic acid. Photomed.Laser Surg. 23, 206–211.
10. Komerik, N., and Wilson, M. (2002). Factors influencing thesusceptibility of Gram-negative bacteria to toluidine blue O-mediated lethal photosensitization. J. Appl. Microbiol. 92,618–623.
11. O’neill, J.F., Hope, C.K., and Wilson, M. (2002). Oral bacteriain multi-species biofilms can be killed by red light in thepresence of toluidine blue. Lasers Surg. Med. 31, 86–90.
12. Meisel, P., and Kocher, T. (2005). Photodynamic therapy forperiodontal diseases: state of the art. J. Photochem. Photo-biol. B. 79, 159–170.
13. Aggarwal, B.B., Sundaram, C., Malani, N., and Ichikawa, H.(2007). Curcumin: the Indian solid gold. Adv. Exp. Med.Biol. 595, 1–75.
14. Haukvik, T., Bruzell, E., Kristensen, S., and Tønnesen,H.H. (2010). Photokilling of bacteria by curcumin in se-lected polyethylene glycol 400 (PEG 400) preparations.Studies on curcumin and curcuminoids, XLI. Pharmazie65, 600–606.
15. Fontana, C.R., Abernethy, A.D., Som, S., et al. (2009). Theantibacterial effect of photodynamic therapy in dental pla-que-derived biofilms. J. Periodontal Res. 44, 751–759.
16. Metcalf, D., Robinson, C., Devine, D., and Wood, S. (2006).Enhancement of erythrosine-mediated photodynamic ther-apy of Streptococcus mutans biofilms by light fractionation.J. Antimicrob. Chemother. 58, 190–192.
17. Wood, S., Metcalf, D., Devine, D., and Robinson, C. (2006).Erythrosine is a potential photosensitizer for the photody-namic therapy of oral plaque biofilms. J. Antimicrob. Che-mother. 57, 680–684.
18. Zanin, I. C., Lobo, M.M., Rodrigues, L.K., Pimenta, L.A.,Hofling, J.F., and Goncalves, R.B. (2006). Photosensitizationof in vitro biofilms by toluidine blue O combined with alight-emitting diode. Eur. J. Oral Sci. 114, 64–69.
19. Komerik, N., and MacRobert, A.J. (2006). Photodynamictherapy as an alternative antimicrobial modality for oralinfections. J. Environ. Pathol. Toxicol. Oncol. 25, 487–504.
20. Zanin, I. C., Goncalves, R.B., Junior, A.B., Hope, C.K., andPratten, J. (2005). Susceptibility of Streptococcus mutansbiofilms to photodynamic therapy: an in vitro study. J. An-timicrob. Chemother. 56, 324–330.
21. Netuschil, L., Weiger, R., Preisler, R., and Brecx, M. (1995).Plaque bacteria counts and vitality during chlorhexidine,meridol and listerine mouthrinses. Eur. J. Oral Sci. 103,355–361.
22. Tomas, I., Cousido, M.C., Tomas, M., Limeres, J., Garcıa–Caballero, L., and Diz, P. (2008). In vivo bactericidal effect of0.2% chlorhexidine but not 0.12% on salivary obligate an-aerobes. Arch. Oral Biol. 53, 1186–1191.
23. Herrera, D., Roldan, S., Santacruz, I., Santos, S., Masdevall,M., and Sanz, M. (2003). Differences in antimicrobial activityof four commercial 0.12% chlorhexidine mouthrinse formu-lations: an in vitro contact test and salivary bacterial countsstudy. J. Clin. Periodontol. 30, 307–314.
24. Heit, J.M., Farhood, V.W., and Edwards, R.C. (1991). Surveyon antibiotic prophylaxis for intraoral orthognathic surgery.J. Oral Maxillofac. Surg. 49, 340–342.
25. McDonnell, G., and Russell, A.D. (1999). Antiseptics anddisinfectants: activity, action, and resistance. Clin. Microbiol.Rev. 12, 147–179.
26. Owens, J., Addy, M., Faulkner, J., Lockwood, C., and Adair,R. (1997). A short-term clinical study design to investigatethe chemical plaque inhibitory properties of mouthrinseswhen used as adjuncts to toothpastes applied to chlorhex-idine. J. Clin. Periodontol. 24, 732–737.
27. Tamietti, B.F., Machado, A.H., Maftoum–Costa, M., Da Sil-va, N.S., Tedesco, A.C., and Pacheco–Soares, C. (2007).Analysis of mitochondrial activity related to cell death afterPDT with AlPCS(4) . Photomed. Laser Surg. 25, 175–179.
28. Burns, T., Wilson, M., and Pearson, G.J. (1995). Effect ofdentine and collagen on the lethal photosensitization ofStreptococcus mutans. Caries Res. 29, 192–197.
29. Wilson, M., and Dobson, J. (1993). Lethal photosensitizationof oral anaerobic bacteria. Clin. Infect. Dis. 16, S414–S415.
30. Wilson, M., Tracy, B., and Pratten, J. (1996). Killing ofStreptococcus sanguis in biofilms using a light-activated an-timicrobial agent. J. Antimicrob. Chemother. 37, 377–381.
31. Williams, J.A., Pearson G.J., Colles, M.J., and Wilson, M.(2003). The effect of variable energy input from a novellight source on the photoactivated bactericidal action oftoluidine blue O on Streptococcus Mutans. Caries Res. 37,190–193.
32. Wilson, M., Dobson, J., and Harvey, W. (1992). Sensitizationof oral bacteria to killing by low-power laser radiation. Curr.Microbiol. 25, 77–81.
33. Wilson, M., Burns, T., and Pratten, J. (1996). Killing ofStreptococcus sanguis in biofilms using a lightactivated an-timicrobial agent. J. Antimicrob. Chemother. 37, 377–381.
34. Wilson, M., Burns, T., Pratten, J., and Pearson, G.J. (1995).Bacteria in supragingival plaque samples can be killed bylow-power laser light in the presence of a photosensitizer. J.Appl. Bacteriol. 78, 569–574.
35. Giusti, J.S., Santos–Pinto, L., Pizzolito, A.C., et al. (2008).Antimicrobial photodynamic action on dentin using a light-emitting diode light source. Photomed. Laser Surg. 26, 281–287.
36. Usacheva, M.N., Teichert, M.C., and Biel, M.A. (2001).Comparison of the methylene blue and toluidine blue pho-tobactericidal efficacy against gram-positive and gram-negative microorganisms. Lasers Surg. Med. 29, 165–173.
37. Sharma, R.A., Gescher, A.J., and Steward, W.P. (2005).Curcumin: the story so far. Eur. J. Cancer 41, 1955–1968.
Address correspondence to:Natalia Costa Araujo
57 Dom Sebastiao Leme StreetRecife, PE
Brazil 52011-160
E-mail: [email protected]
PHOTODYNAMIC THERAPY EFFECT OF CURCUMIN 101
P
Pah
NGS
a
b
c
d
A
AS
1d
hotodiagnosis and Photodynamic Therapy (2012) 9, 60—68
Available online at www.sciencedirect.com
jo ur nal homepage: www.elsev ier .com/ locate /pdpdt
hotodiagnosis and treatment of condylomacuminatum using 5-aminolevulinic acid andomemade devices
atalia Mayumi Inada PhDa,∗, Mardoqueu Martins da Costab, Orlando C.C.uimarãesa, Elizeu da Silva Ribeiroa, Cristina Kurachia,ilvana Maria Quintanac, Wellington Lombardid, Vanderlei Salvador Bagnatoa
Instituto de Física de São Carlos (IFSC/USP), Laboratório de Biofotônica, São Carlos, São Paulo, BrazilEscola de Engenharia de São Carlos (EESC/USP), São Carlos, São Paulo, BrazilFaculdade de Medicina de Ribeirão Preto (FMRP/USP), Ribeirão Preto, São Paulo, BrazilFaculdade de Medicina de Araraquara (UNIARA), Araraquara, São Paulo, Brazilvailable online 20 October 2011
KEYWORDSHumanpapillomavirus;Condyloma;Homemade device;Photodiagnosis;Photodynamictherapy
Summary Background: The objective of this study was to improve the feasibility of applyingtopic 5-aminolevulinic acid (ALA) in photodiagnosis (PD) and treatment of condyloma caused byhuman papillomavirus (HPV) using two homemade handheld devices and to discuss the photody-namic therapy (PDT) as a suitable alternative for each of the cases studied. Both, protoporphyrinIX production and photodegradation were analyzed, and the pain experienced during the illu-mination was correlated with the light intensities. Methods: A total of 40 women with differentgrades of lesions caused by HPV were chosen from patients of the School of Medicine of RibeirãoPreto (University of Sao Paulo) and of the Unit of Public Health of Araraquara, Sao Paulo. Results:We did not encounter any unexpected difficulties using our devices during the treatment. Theexistence of an easily observable reddish fluorescence with large intensity concentrated on thelesions is the clinical indication of the penetration and the selective concentration of protopor-phyrin IX in the clinical and subclinical lesions rather than in the healthy tissue. The aestheticresults were much better than those obtained by conventional techniques as surgery or cryo-genics, with no recurrence reported after two years of treatment. Conclusions: Our results are
proof for the various advantages using ALA cream for the PD and PDT in many different cases ofcondyloma by HPV. This study will be continued to investigate the PpIX photobleaching and theirradiance and fluence rate to optimize conducting the clinical trials, to improve the devicesand therefore increase the treatment response.© 2011 Elsevier B.V. All rights re∗ Corresponding author at: Instituto de Física de São Carlos, Universidav. Trabalhador São-carlense, no 400, Centro, 13566-590 São Carlos,P, Brazil. Tel.: +55 16 3373 9810; fax: +55 16 3373 9811.
E-mail address: [email protected] (N.M. Inada).
572-1000/$ — see front matter © 2011 Elsevier B.V. All rights reserved.oi:10.1016/j.pdpdt.2011.09.001
served.
de de São Paulo, Grupo de Óptica, Laboratório de Biofotônica,
py in
cmsPp
tttirahCO5nd
g2tctu
ddtf
M
C
A5Fwd(
P
STi(oEi20tMnh
New approach using photodiagnosis and photodynamic thera
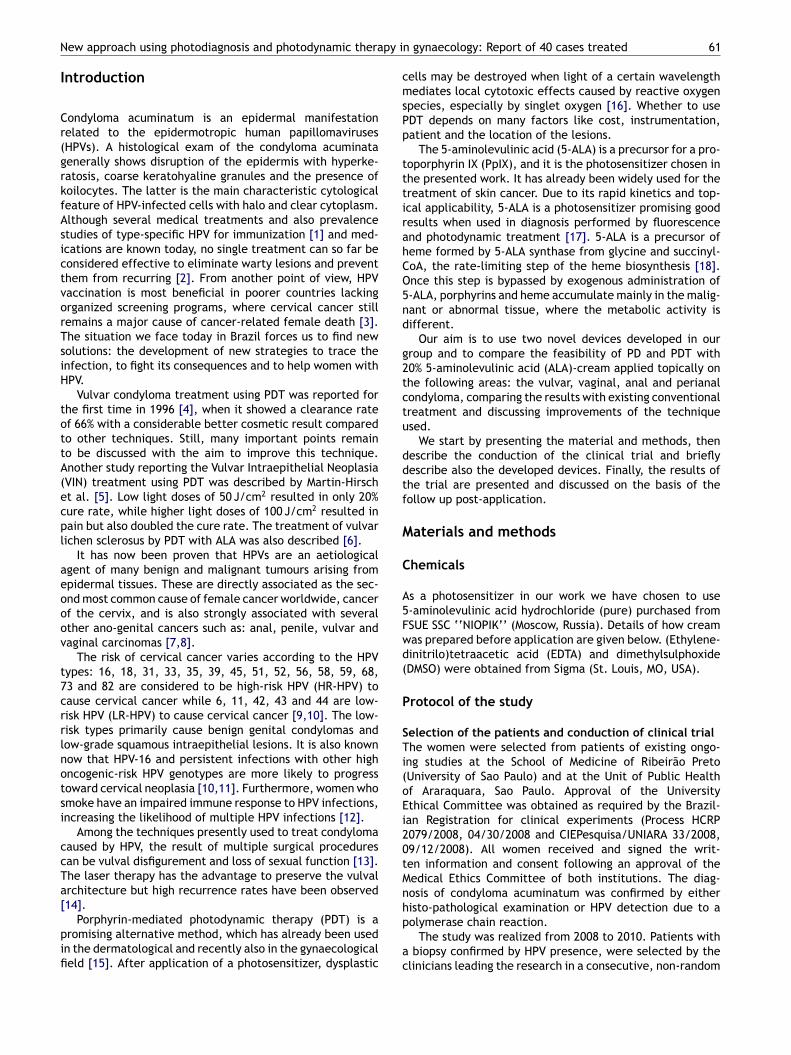
Introduction
Condyloma acuminatum is an epidermal manifestationrelated to the epidermotropic human papillomaviruses(HPVs). A histological exam of the condyloma acuminatagenerally shows disruption of the epidermis with hyperke-ratosis, coarse keratohyaline granules and the presence ofkoilocytes. The latter is the main characteristic cytologicalfeature of HPV-infected cells with halo and clear cytoplasm.Although several medical treatments and also prevalencestudies of type-specific HPV for immunization [1] and med-ications are known today, no single treatment can so far beconsidered effective to eliminate warty lesions and preventthem from recurring [2]. From another point of view, HPVvaccination is most beneficial in poorer countries lackingorganized screening programs, where cervical cancer stillremains a major cause of cancer-related female death [3].The situation we face today in Brazil forces us to find newsolutions: the development of new strategies to trace theinfection, to fight its consequences and to help women withHPV.
Vulvar condyloma treatment using PDT was reported forthe first time in 1996 [4], when it showed a clearance rateof 66% with a considerable better cosmetic result comparedto other techniques. Still, many important points remainto be discussed with the aim to improve this technique.Another study reporting the Vulvar Intraepithelial Neoplasia(VIN) treatment using PDT was described by Martin-Hirschet al. [5]. Low light doses of 50 J/cm2 resulted in only 20%cure rate, while higher light doses of 100 J/cm2 resulted inpain but also doubled the cure rate. The treatment of vulvarlichen sclerosus by PDT with ALA was also described [6].
It has now been proven that HPVs are an aetiologicalagent of many benign and malignant tumours arising fromepidermal tissues. These are directly associated as the sec-ond most common cause of female cancer worldwide, cancerof the cervix, and is also strongly associated with severalother ano-genital cancers such as: anal, penile, vulvar andvaginal carcinomas [7,8].
The risk of cervical cancer varies according to the HPVtypes: 16, 18, 31, 33, 35, 39, 45, 51, 52, 56, 58, 59, 68,73 and 82 are considered to be high-risk HPV (HR-HPV) tocause cervical cancer while 6, 11, 42, 43 and 44 are low-risk HPV (LR-HPV) to cause cervical cancer [9,10]. The low-risk types primarily cause benign genital condylomas andlow-grade squamous intraepithelial lesions. It is also knownnow that HPV-16 and persistent infections with other highoncogenic-risk HPV genotypes are more likely to progresstoward cervical neoplasia [10,11]. Furthermore, women whosmoke have an impaired immune response to HPV infections,increasing the likelihood of multiple HPV infections [12].
Among the techniques presently used to treat condylomacaused by HPV, the result of multiple surgical procedurescan be vulval disfigurement and loss of sexual function [13].The laser therapy has the advantage to preserve the vulvalarchitecture but high recurrence rates have been observed[14].
Porphyrin-mediated photodynamic therapy (PDT) is apromising alternative method, which has already been usedin the dermatological and recently also in the gynaecologicalfield [15]. After application of a photosensitizer, dysplastic
p
ac
gynaecology: Report of 40 cases treated 61
ells may be destroyed when light of a certain wavelengthediates local cytotoxic effects caused by reactive oxygen
pecies, especially by singlet oxygen [16]. Whether to useDT depends on many factors like cost, instrumentation,atient and the location of the lesions.
The 5-aminolevulinic acid (5-ALA) is a precursor for a pro-oporphyrin IX (PpIX), and it is the photosensitizer chosen inhe presented work. It has already been widely used for thereatment of skin cancer. Due to its rapid kinetics and top-cal applicability, 5-ALA is a photosensitizer promising goodesults when used in diagnosis performed by fluorescencend photodynamic treatment [17]. 5-ALA is a precursor ofeme formed by 5-ALA synthase from glycine and succinyl-oA, the rate-limiting step of the heme biosynthesis [18].nce this step is bypassed by exogenous administration of-ALA, porphyrins and heme accumulate mainly in the malig-ant or abnormal tissue, where the metabolic activity isifferent.
Our aim is to use two novel devices developed in ourroup and to compare the feasibility of PD and PDT with0% 5-aminolevulinic acid (ALA)-cream applied topically onhe following areas: the vulvar, vaginal, anal and perianalondyloma, comparing the results with existing conventionalreatment and discussing improvements of the techniquesed.
We start by presenting the material and methods, thenescribe the conduction of the clinical trial and brieflyescribe also the developed devices. Finally, the results ofhe trial are presented and discussed on the basis of theollow up post-application.
aterials and methods
hemicals
s a photosensitizer in our work we have chosen to use-aminolevulinic acid hydrochloride (pure) purchased fromSUE SSC ‘‘NIOPIK’’ (Moscow, Russia). Details of how creamas prepared before application are given below. (Ethylene-initrilo)tetraacetic acid (EDTA) and dimethylsulphoxideDMSO) were obtained from Sigma (St. Louis, MO, USA).
rotocol of the study
election of the patients and conduction of clinical trialhe women were selected from patients of existing ongo-
ng studies at the School of Medicine of Ribeirão PretoUniversity of Sao Paulo) and at the Unit of Public Healthf Araraquara, Sao Paulo. Approval of the Universitythical Committee was obtained as required by the Brazil-an Registration for clinical experiments (Process HCRP079/2008, 04/30/2008 and CIEPesquisa/UNIARA 33/2008,9/12/2008). All women received and signed the writ-en information and consent following an approval of theedical Ethics Committee of both institutions. The diag-osis of condyloma acuminatum was confirmed by eitheristo-pathological examination or HPV detection due to a
olymerase chain reaction.The study was realized from 2008 to 2010. Patients with biopsy confirmed by HPV presence, were selected by thelinicians leading the research in a consecutive, non-random
6
maiA
PBbtrti
TA5pbit(btpts
L
Wbma1adasmsliap
t2at
P
Twpst6
F
TadctsLftmtfbi
C
Btmu7w
P
Ihodv7s3
R
T‘r
tBD
FwAaarlaa
2
anner. Written informed consent was obtained followingpproval of the Human Medical Ethics Committee of bothnstitutions. Prior to the trial, serological ELISA HBsAg, ELISAnti HCV, VDRL and ELISA Anti HIV were performed.
reparation of the women for the PDTefore the condyloma illumination, the full area coveredy lesions was locally anesthetized with 2% xylocaine (infil-ration anesthesia). If necessary, based on the women’seaction and pain report [19], the women received addi-ionally an anti-inflammatory intravenous drug during thellumination.
he photosensitizer and the local topical application ofLA-Aminolevulinic acid ALA is a metabolic prodrug of thehotosensitizer and its cream (20%; wt/wt) was preparedy dissolving ALA (FSUE SSC ‘‘NIOPIK’’ — Moscow, Russia)n a sterile NaCl solution (0.9%) immediately before thereatment and incorporating this mix in a emollient creamoil-in-water emulsion containing 1 mM EDTA and 3% DMSO)efore the application. The women were asked not to go tohe toilet while waiting for the cream to take its effect. Thehotodynamic therapy was started 6 h after application ofhe 20% 5-aminolevulinic acid ALA cream. This protocol wastandardized and used with all patients in this study.
ight device and illumination
e developed a device named ‘‘PDT Flex Use’’, opticallyased on 640 nm LED (Light Emitting Diodes) arrays. The illu-ination probes were anatomically designed for the specific
pplications: a cylinder measuring 30 mm in diameter and15 mm in length for the intravaginal illumination, applyingn average light intensity of 45 mW/cm2. This device pro-uces a uniform illumination on the surface, and it allowst the same time an interior illumination without creatinghadows. A smaller circular probe for external illuminationeasuring 36 mm in diameter and an average light inten-
ity of 150 mW/cm2 is used to illuminate the small lesionsocalized at the perineum. Finally, a probe for externalllumination measuring 74 mm in diameter and an aver-ge optical source of 60 mW/cm2 was developed. This thirdrobe is used for overall illumination.
An external water circulation device ensures that theemperature increase during illumination is kept at less thanC. This device is placed in a small suitcase together withn electronic control (to allow control of both expositionime and light intensity, kept constant in this study).
hotodynamic therapy
he patient was asked to lie down on the operating tableith their legs in stirrups. The clothing was removed and the
reviously applied ALA-cream was washed off using salineolution. Six hours after the ALA application the area to bereated was illuminated by the ‘‘PDT Flex Use’’ system at40 nm and a total dose of 200 J/cm2.cidl
N.M. Inada et al.
luorescence measurement
he fluorescence of the lesions was evaluated prior to andfter the PDT using other homemade device (unpublishedata) to achieve wide-field fluorescence images. That spe-ific handheld unit has a compact light source, composed ofwo high-intensity Light-Emitting Diodes (LEDs), the emis-ion being centered at 405 and 450 nm, a LED Concentratorens and five optical filters. The system was positioned inront of the lesions at a distance of approximately 5 cmo induce fluorescence. The use of fluorescence allows toeasure the appropriate production of PpIX before the
reatment as well verify that the photosensitizer has beenully used after the treatment. The PpIX production inducedy the ALA can be proven by the red fluorescence observedn the image.
linical response analysis
iopsies were collected for histological exams performedo diagnose condyloma by HPV before and after the treat-ent. Pictures of the full extension of the warts were taken
sing a digital camera Sony H50® coupled to a macro lens of4 mm, and the images obtained before and after the PDTere compared.
rotoporphyrin IX photobleaching
mages were taken using a camera Sony H50® coupled to ouromemade fluorescence imaging device. A sequence of flu-rescence images (representing 30 sessions of PDT) takenuring the treatment was stored and the PpIX fluorescenceariation was plotted using an algorithm method (Matlab®
.5 — The MathWorks, USA). For this experiment only themaller probe was used for external illumination, with a6 mm diameter and a light intensity of 150 mW/cm2.
esults
he results of this study are presented in three parts: the‘PDT Flex Use’’ device evaluation, the PpIX photobleachingesults and the clinical outcome.
As for the ‘‘PDT Flex Use’’ device, it was developed inhe Physics Institute of Sao Carlos, University of Sao Paulo,razil, and is optically based on 640 nm LED (Light Emittingiodes) arrays (Fig. 1).
As for the condyloma treatment outcome using the ‘‘PDTlex Use’’, a total of 40 women with different grades ofarts caused by HPV participated in this study (Table 1).s expected, the women presented different responsesccording to varying characteristics: types of condyloma,ge, immunological and nutritional conditions. Women agesanged from 16 to 65 years. 29% of the women had smallesions and 71% had multiple long lesions. In our work inbout 90% of the cases a complete clearance of the wartsfter less than three sessions was observed. Only in two
ases we observed no response: one of them is the case of anmmunosuppressed patient by HIV. The other patient, whoid not show any results to the treatment presented condy-oma with pigmented and hyperkeratinic lesions, which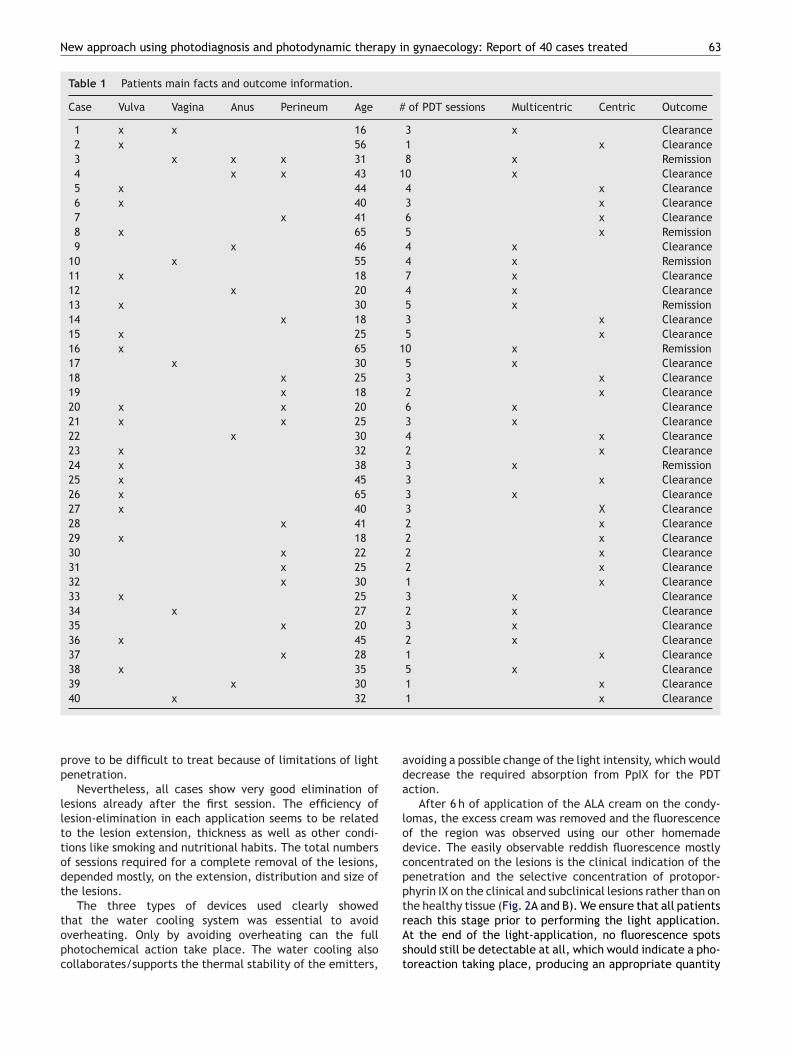
New approach using photodiagnosis and photodynamic therapy in gynaecology: Report of 40 cases treated 63
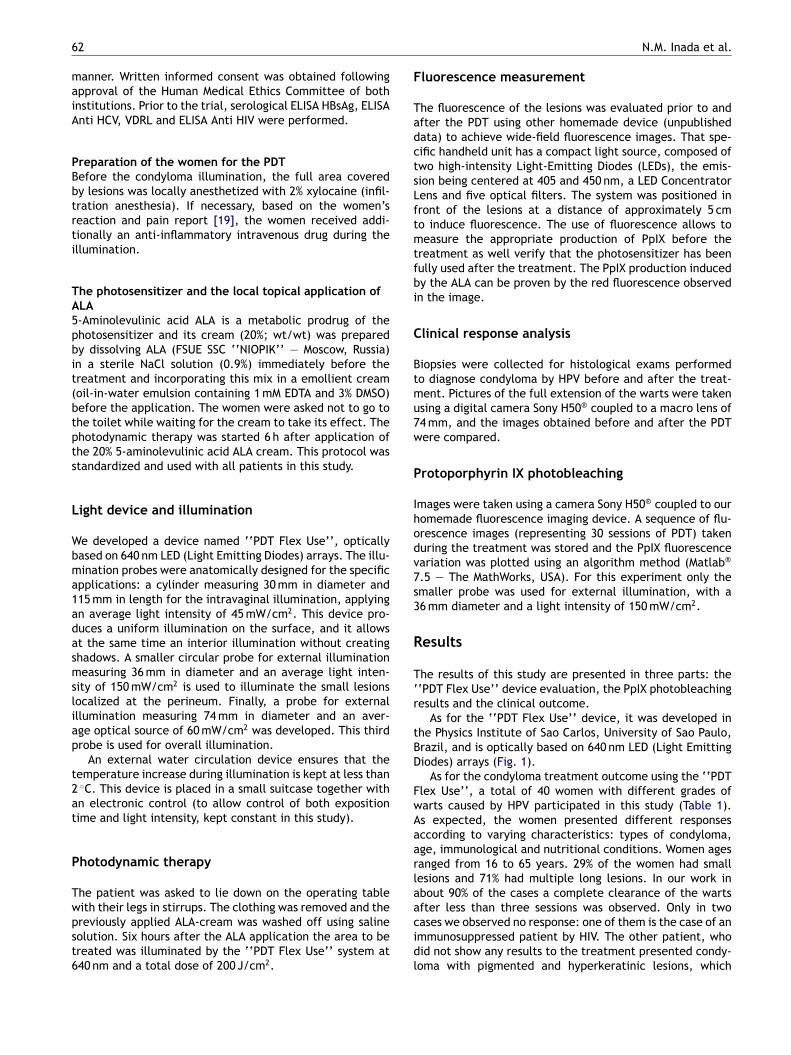
Table 1 Patients main facts and outcome information.
Case Vulva Vagina Anus Perineum Age # of PDT sessions Multicentric Centric Outcome
1 x x 16 3 x Clearance2 x 56 1 x Clearance3 x x x 31 8 x Remission4 x x 43 10 x Clearance5 x 44 4 x Clearance6 x 40 3 x Clearance7 x 41 6 x Clearance8 x 65 5 x Remission9 x 46 4 x Clearance
10 x 55 4 x Remission11 x 18 7 x Clearance12 x 20 4 x Clearance13 x 30 5 x Remission14 x 18 3 x Clearance15 x 25 5 x Clearance16 x 65 10 x Remission17 x 30 5 x Clearance18 x 25 3 x Clearance19 x 18 2 x Clearance20 x x 20 6 x Clearance21 x x 25 3 x Clearance22 x 30 4 x Clearance23 x 32 2 x Clearance24 x 38 3 x Remission25 x 45 3 x Clearance26 x 65 3 x Clearance27 x 40 3 X Clearance28 x 41 2 x Clearance29 x 18 2 x Clearance30 x 22 2 x Clearance31 x 25 2 x Clearance32 x 30 1 x Clearance33 x 25 3 x Clearance34 x 27 2 x Clearance35 x 20 3 x Clearance36 x 45 2 x Clearance37 x 28 1 x Clearance38 x 35 5 x Clearance39 x 30 1 x Clearance40 x 32 1 x Clearance
ada
lodcppt
prove to be difficult to treat because of limitations of lightpenetration.
Nevertheless, all cases show very good elimination oflesions already after the first session. The efficiency oflesion-elimination in each application seems to be relatedto the lesion extension, thickness as well as other condi-tions like smoking and nutritional habits. The total numbersof sessions required for a complete removal of the lesions,depended mostly, on the extension, distribution and size ofthe lesions.
The three types of devices used clearly showed
that the water cooling system was essential to avoidoverheating. Only by avoiding overheating can the fullphotochemical action take place. The water cooling alsocollaborates/supports the thermal stability of the emitters,rAst
voiding a possible change of the light intensity, which wouldecrease the required absorption from PpIX for the PDTction.
After 6 h of application of the ALA cream on the condy-omas, the excess cream was removed and the fluorescencef the region was observed using our other homemadeevice. The easily observable reddish fluorescence mostlyoncentrated on the lesions is the clinical indication of theenetration and the selective concentration of protopor-hyrin IX on the clinical and subclinical lesions rather than onhe healthy tissue (Fig. 2A and B). We ensure that all patients
each this stage prior to performing the light application.t the end of the light-application, no fluorescence spotshould still be detectable at all, which would indicate a pho-oreaction taking place, producing an appropriate quantity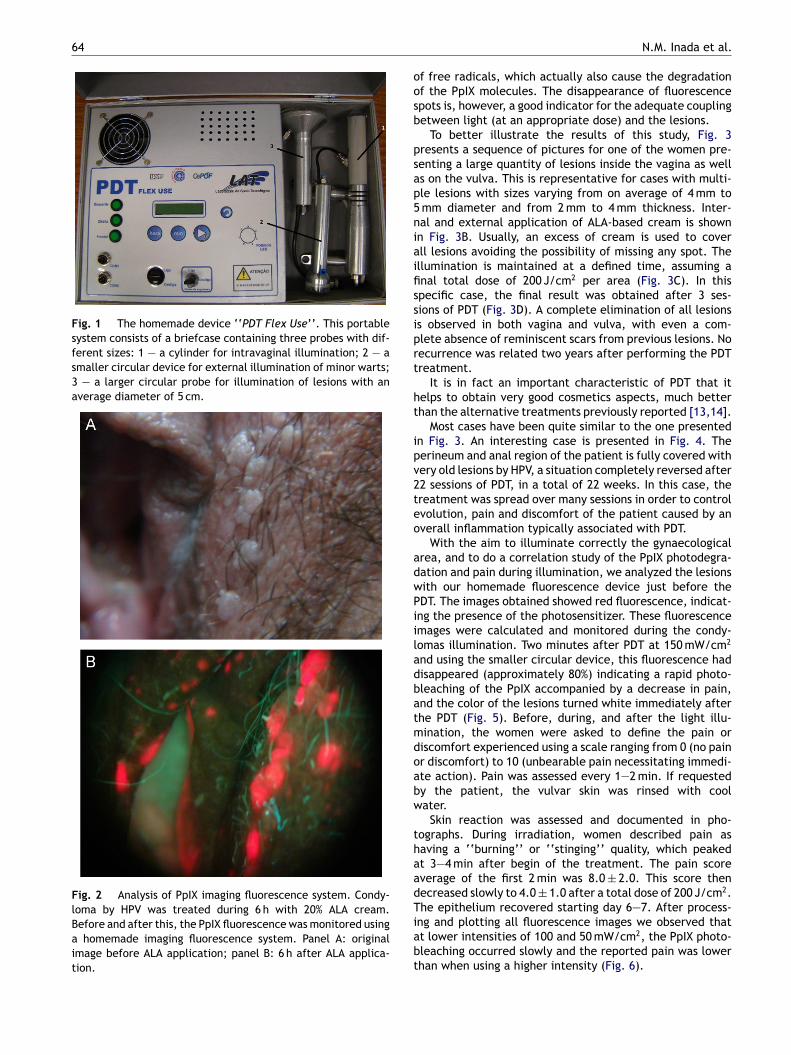
64
Fig. 1 The homemade device ‘‘PDT Flex Use’’. This portablesystem consists of a briefcase containing three probes with dif-ferent sizes: 1 — a cylinder for intravaginal illumination; 2 — asmaller circular device for external illumination of minor warts;3 — a larger circular probe for illumination of lesions with anaverage diameter of 5 cm.
Fig. 2 Analysis of PpIX imaging fluorescence system. Condy-loma by HPV was treated during 6 h with 20% ALA cream.Before and after this, the PpIX fluorescence was monitored usinga homemade imaging fluorescence system. Panel A: originalimage before ALA application; panel B: 6 h after ALA applica-tion.
oosb
psap5niaifissiprt
ht
ipv2teo
adwPiiladbatmdoabw
thaadTiabt
N.M. Inada et al.
f free radicals, which actually also cause the degradationf the PpIX molecules. The disappearance of fluorescencepots is, however, a good indicator for the adequate couplingetween light (at an appropriate dose) and the lesions.
To better illustrate the results of this study, Fig. 3resents a sequence of pictures for one of the women pre-enting a large quantity of lesions inside the vagina as wells on the vulva. This is representative for cases with multi-le lesions with sizes varying from on average of 4 mm to
mm diameter and from 2 mm to 4 mm thickness. Inter-al and external application of ALA-based cream is shownn Fig. 3B. Usually, an excess of cream is used to coverll lesions avoiding the possibility of missing any spot. Thellumination is maintained at a defined time, assuming anal total dose of 200 J/cm2 per area (Fig. 3C). In thispecific case, the final result was obtained after 3 ses-ions of PDT (Fig. 3D). A complete elimination of all lesionss observed in both vagina and vulva, with even a com-lete absence of reminiscent scars from previous lesions. Noecurrence was related two years after performing the PDTreatment.
It is in fact an important characteristic of PDT that itelps to obtain very good cosmetics aspects, much betterhan the alternative treatments previously reported [13,14].
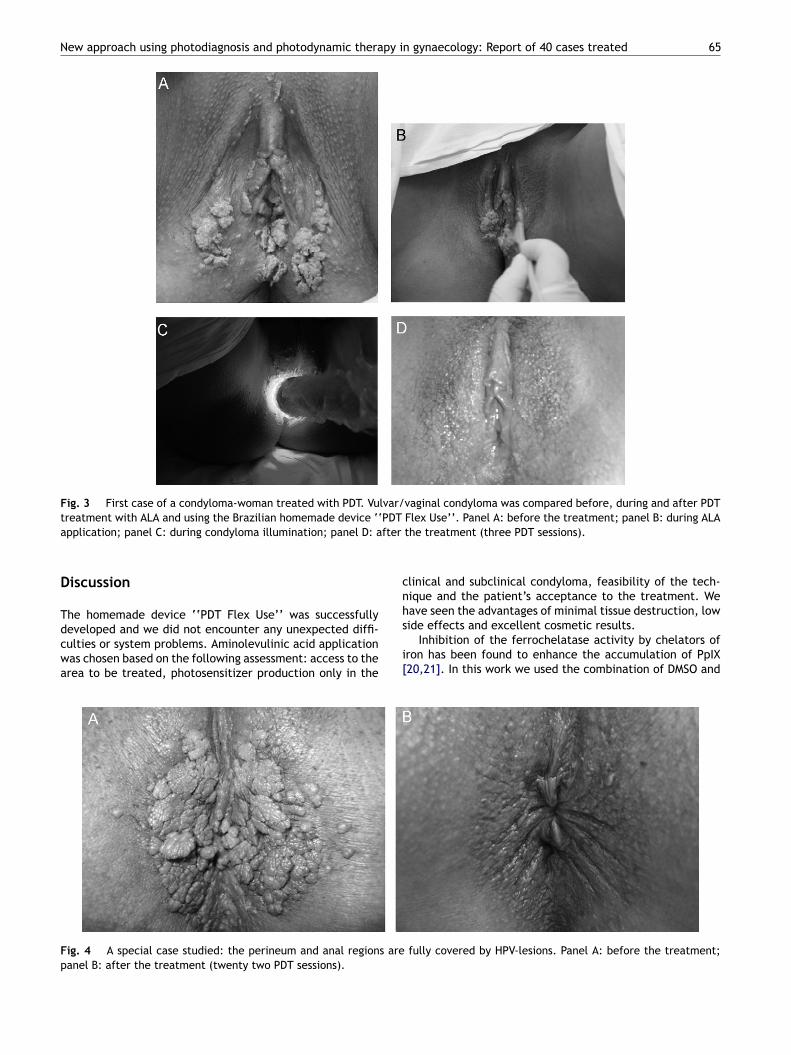
Most cases have been quite similar to the one presentedn Fig. 3. An interesting case is presented in Fig. 4. Theerineum and anal region of the patient is fully covered withery old lesions by HPV, a situation completely reversed after2 sessions of PDT, in a total of 22 weeks. In this case, thereatment was spread over many sessions in order to controlvolution, pain and discomfort of the patient caused by anverall inflammation typically associated with PDT.
With the aim to illuminate correctly the gynaecologicalrea, and to do a correlation study of the PpIX photodegra-ation and pain during illumination, we analyzed the lesionsith our homemade fluorescence device just before theDT. The images obtained showed red fluorescence, indicat-ng the presence of the photosensitizer. These fluorescencemages were calculated and monitored during the condy-omas illumination. Two minutes after PDT at 150 mW/cm2
nd using the smaller circular device, this fluorescence hadisappeared (approximately 80%) indicating a rapid photo-leaching of the PpIX accompanied by a decrease in pain,nd the color of the lesions turned white immediately afterhe PDT (Fig. 5). Before, during, and after the light illu-ination, the women were asked to define the pain oriscomfort experienced using a scale ranging from 0 (no painr discomfort) to 10 (unbearable pain necessitating immedi-te action). Pain was assessed every 1—2 min. If requestedy the patient, the vulvar skin was rinsed with coolater.
Skin reaction was assessed and documented in pho-ographs. During irradiation, women described pain asaving a ‘‘burning’’ or ‘‘stinging’’ quality, which peakedt 3—4 min after begin of the treatment. The pain scoreverage of the first 2 min was 8.0 ± 2.0. This score thenecreased slowly to 4.0 ± 1.0 after a total dose of 200 J/cm2.he epithelium recovered starting day 6—7. After process-
ng and plotting all fluorescence images we observed thatt lower intensities of 100 and 50 mW/cm2, the PpIX photo-leaching occurred slowly and the reported pain was lowerhan when using a higher intensity (Fig. 6).
New approach using photodiagnosis and photodynamic therapy in gynaecology: Report of 40 cases treated 65
Fig. 3 First case of a condyloma-woman treated with PDT. Vulvar/vaginal condyloma was compared before, during and after PDTtreatment with ALA and using the Brazilian homemade device ‘‘PDT Flex Use’’. Panel A: before the treatment; panel B: during ALA
fter
cnh
application; panel C: during condyloma illumination; panel D: a
Discussion
The homemade device ‘‘PDT Flex Use’’ was successfully
developed and we did not encounter any unexpected diffi-culties or system problems. Aminolevulinic acid applicationwas chosen based on the following assessment: access to thearea to be treated, photosensitizer production only in thes
i[
Fig. 4 A special case studied: the perineum and anal regions arepanel B: after the treatment (twenty two PDT sessions).
the treatment (three PDT sessions).
linical and subclinical condyloma, feasibility of the tech-ique and the patient’s acceptance to the treatment. Weave seen the advantages of minimal tissue destruction, low
ide effects and excellent cosmetic results.Inhibition of the ferrochelatase activity by chelators ofron has been found to enhance the accumulation of PpIX20,21]. In this work we used the combination of DMSO and
fully covered by HPV-lesions. Panel A: before the treatment;
66 N.M. Inada et al.
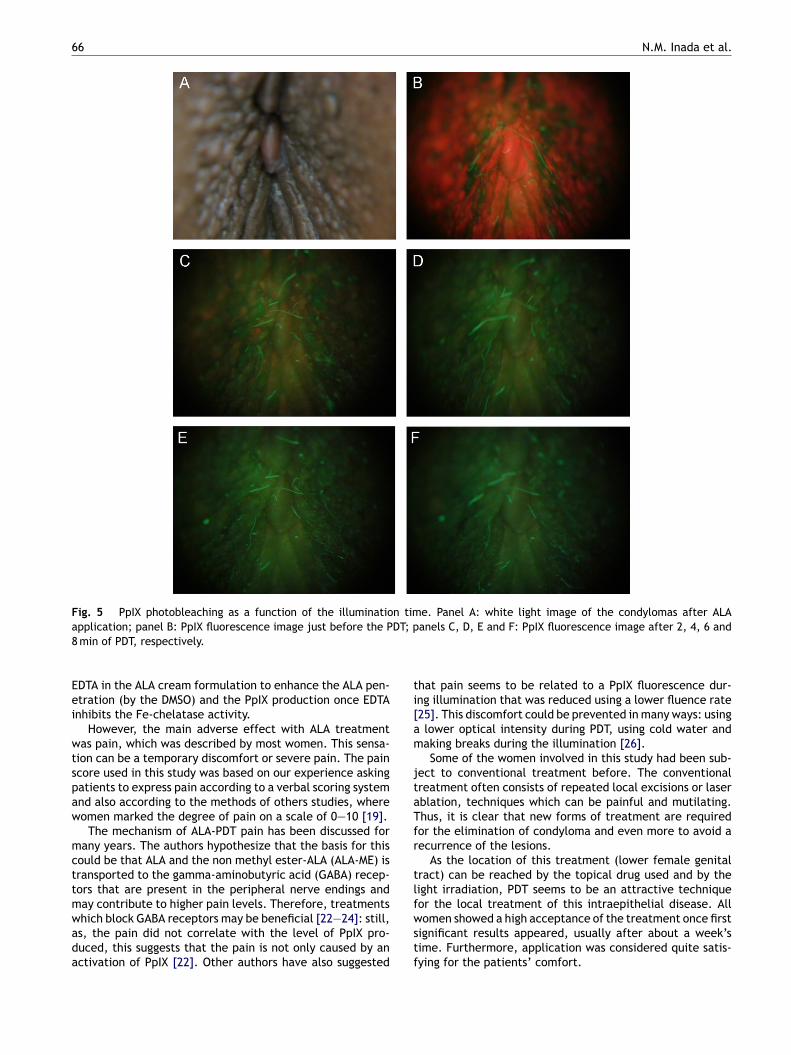
Fig. 5 PpIX photobleaching as a function of the illumination time. Panel A: white light image of the condylomas after ALAa DT; p8
Eei
wtspaw
mcttmwada
ti[am
jtaTfr
tlf
pplication; panel B: PpIX fluorescence image just before the P min of PDT, respectively.
DTA in the ALA cream formulation to enhance the ALA pen-tration (by the DMSO) and the PpIX production once EDTAnhibits the Fe-chelatase activity.
However, the main adverse effect with ALA treatmentas pain, which was described by most women. This sensa-
ion can be a temporary discomfort or severe pain. The paincore used in this study was based on our experience askingatients to express pain according to a verbal scoring systemnd also according to the methods of others studies, whereomen marked the degree of pain on a scale of 0—10 [19].
The mechanism of ALA-PDT pain has been discussed forany years. The authors hypothesize that the basis for this
ould be that ALA and the non methyl ester-ALA (ALA-ME) isransported to the gamma-aminobutyric acid (GABA) recep-ors that are present in the peripheral nerve endings anday contribute to higher pain levels. Therefore, treatments
hich block GABA receptors may be beneficial [22—24]: still,s, the pain did not correlate with the level of PpIX pro-uced, this suggests that the pain is not only caused by anctivation of PpIX [22]. Other authors have also suggestedwstf
anels C, D, E and F: PpIX fluorescence image after 2, 4, 6 and
hat pain seems to be related to a PpIX fluorescence dur-ng illumination that was reduced using a lower fluence rate25]. This discomfort could be prevented in many ways: using
lower optical intensity during PDT, using cold water andaking breaks during the illumination [26].Some of the women involved in this study had been sub-
ect to conventional treatment before. The conventionalreatment often consists of repeated local excisions or laserblation, techniques which can be painful and mutilating.hus, it is clear that new forms of treatment are requiredor the elimination of condyloma and even more to avoid aecurrence of the lesions.
As the location of this treatment (lower female genitalract) can be reached by the topical drug used and by theight irradiation, PDT seems to be an attractive techniqueor the local treatment of this intraepithelial disease. All
omen showed a high acceptance of the treatment once firstignificant results appeared, usually after about a week’sime. Furthermore, application was considered quite satis-ying for the patients’ comfort.
New approach using photodiagnosis and photodynamic therapy in
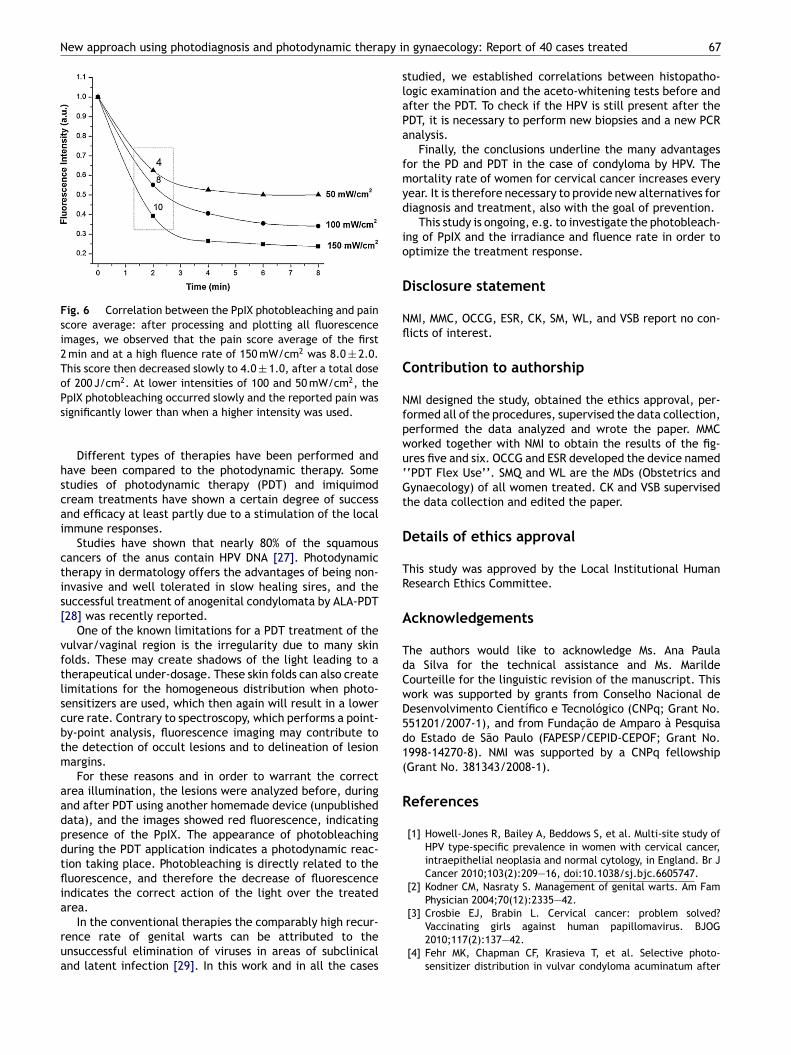
Fig. 6 Correlation between the PpIX photobleaching and painscore average: after processing and plotting all fluorescenceimages, we observed that the pain score average of the first2 min and at a high fluence rate of 150 mW/cm2 was 8.0 ± 2.0.This score then decreased slowly to 4.0 ± 1.0, after a total doseof 200 J/cm2. At lower intensities of 100 and 50 mW/cm2, the
slaPa
fmyd
io
D
Nfl
C
Nfpwu‘Gt
D
TR
A
TdCwD5d1(
R
PpIX photobleaching occurred slowly and the reported pain wassignificantly lower than when a higher intensity was used.
Different types of therapies have been performed andhave been compared to the photodynamic therapy. Somestudies of photodynamic therapy (PDT) and imiquimodcream treatments have shown a certain degree of successand efficacy at least partly due to a stimulation of the localimmune responses.
Studies have shown that nearly 80% of the squamouscancers of the anus contain HPV DNA [27]. Photodynamictherapy in dermatology offers the advantages of being non-invasive and well tolerated in slow healing sires, and thesuccessful treatment of anogenital condylomata by ALA-PDT[28] was recently reported.
One of the known limitations for a PDT treatment of thevulvar/vaginal region is the irregularity due to many skinfolds. These may create shadows of the light leading to atherapeutical under-dosage. These skin folds can also createlimitations for the homogeneous distribution when photo-sensitizers are used, which then again will result in a lowercure rate. Contrary to spectroscopy, which performs a point-by-point analysis, fluorescence imaging may contribute tothe detection of occult lesions and to delineation of lesionmargins.
For these reasons and in order to warrant the correctarea illumination, the lesions were analyzed before, duringand after PDT using another homemade device (unpublisheddata), and the images showed red fluorescence, indicatingpresence of the PpIX. The appearance of photobleachingduring the PDT application indicates a photodynamic reac-tion taking place. Photobleaching is directly related to thefluorescence, and therefore the decrease of fluorescenceindicates the correct action of the light over the treatedarea.
In the conventional therapies the comparably high recur-
rence rate of genital warts can be attributed to theunsuccessful elimination of viruses in areas of subclinicaland latent infection [29]. In this work and in all the casesgynaecology: Report of 40 cases treated 67
tudied, we established correlations between histopatho-ogic examination and the aceto-whitening tests before andfter the PDT. To check if the HPV is still present after theDT, it is necessary to perform new biopsies and a new PCRnalysis.
Finally, the conclusions underline the many advantagesor the PD and PDT in the case of condyloma by HPV. Theortality rate of women for cervical cancer increases every
ear. It is therefore necessary to provide new alternatives foriagnosis and treatment, also with the goal of prevention.
This study is ongoing, e.g. to investigate the photobleach-ng of PpIX and the irradiance and fluence rate in order toptimize the treatment response.
isclosure statement
MI, MMC, OCCG, ESR, CK, SM, WL, and VSB report no con-icts of interest.
ontribution to authorship
MI designed the study, obtained the ethics approval, per-ormed all of the procedures, supervised the data collection,erformed the data analyzed and wrote the paper. MMCorked together with NMI to obtain the results of the fig-res five and six. OCCG and ESR developed the device named‘PDT Flex Use’’. SMQ and WL are the MDs (Obstetrics andynaecology) of all women treated. CK and VSB supervised
he data collection and edited the paper.
etails of ethics approval
his study was approved by the Local Institutional Humanesearch Ethics Committee.
cknowledgements
he authors would like to acknowledge Ms. Ana Paulaa Silva for the technical assistance and Ms. Marildeourteille for the linguistic revision of the manuscript. Thisork was supported by grants from Conselho Nacional deesenvolvimento Científico e Tecnológico (CNPq; Grant No.51201/2007-1), and from Fundacão de Amparo à Pesquisao Estado de São Paulo (FAPESP/CEPID-CEPOF; Grant No.998-14270-8). NMI was supported by a CNPq fellowshipGrant No. 381343/2008-1).
eferences
[1] Howell-Jones R, Bailey A, Beddows S, et al. Multi-site study ofHPV type-specific prevalence in women with cervical cancer,intraepithelial neoplasia and normal cytology, in England. Br JCancer 2010;103(2):209—16, doi:10.1038/sj.bjc.6605747.
[2] Kodner CM, Nasraty S. Management of genital warts. Am FamPhysician 2004;70(12):2335—42.
[3] Crosbie EJ, Brabin L. Cervical cancer: problem solved?
Vaccinating girls against human papillomavirus. BJOG2010;117(2):137—42.[4] Fehr MK, Chapman CF, Krasieva T, et al. Selective photo-sensitizer distribution in vulvar condyloma acuminatum after
6
[
[
[
[
[
[
[
[
[
[
[
[
[
[
[
[
[
[
[
8
application of 5-aminolevulinic acid. Am J Obstst Gynecol1996;174(3):951—7, doi:10.1016/S0002-9378(96)70332-0.
[5] Martin-Hirsch PL, Whitehurst C, Buckley CH, Moore JV, Kitch-ener HC. Photodynamic treatment for lower genital tractintraepithelial neoplasia. The Lancet 1998;351(9113):1403,doi:10.1016/S0140-6736(98)24019-0.
[6] Hillemanns P, Untch M, Pröve F, Baumgartner R, Hillemanns M,Korell M. Photodynamic therapy of vulvar lichen sclerosus with5-aminolevulinic acid. Obstet Gynecol 1999;93(1):71—4.
[7] Bosch FX, Manos MM, Munoz N, et al. Prevalence of humanpapillomavirus in cervical cancer: a worldwide perspective.International biological study on cervical cancer (IBSCC) StudyGroup. J Natl Cancer Inst 1995;87(11):796—802.
[8] Walboomers JM, Jacobs MV, Manos MM, et al. Humanpapillomavirus is a necessary cause of invasive cer-vical cancer worldwide. J Pathol 1999;189(1):12—9,doi:10.1002/(SICI)1096-9896(199909)189:1<12::AID-PATH431>3.0.CO;2-F.
[9] Franco E, Villa L, Rohan T, Ferenczy A, Petzl-Erler M,Matlashewski G. Design and methods of the Ludwig-McGill lon-gitudinal study of the natural history of human papillomavirusinfection and cervical neoplasia in Brazil. Ludwig-McGill StudyGroup. Rev Panam Salud Publica 1999;6(4):223—33.
10] Trottier H, Mahmud S, Costa MC, et al. Human papillomavirusinfections with multiple types and risk of cervical neopla-sia. Cancer Epidemiol Biomarkers Prev 2006;15(7):1274—80,doi:10.1158/1055-9965.EPI-06-0129.
11] Sasagawa T, Basha W, Yamazaki H, Inoue M. High-risk and mul-tiple human papillomavirus infections associated with cervicalabnormalities in Japanese women. Cancer Epidemiol Biomark-ers Prev 2001;10(1):45—52.
12] Simen-Kapeu A, Kataja V, Yliskoski M, et al. Smoking impairshuman papillomavirus (HPV) type 16 and 18 capsids antibodyresponse following natural HPV infection. Scand J Infect Dis2008;40(9):745—51, doi:10.1080/00365540801995360.
13] Andersen BL, Turnquist D, LaPolla J, Turner D. Sexual function-ing after treatment of in situ vulvar cancer: preliminary report.Obstet Gynecol 1998;71(1):15—9.
14] Herod JJ, Shafi MI, Rollason TP, Jordan JA, Luesley DM. Vulvarintraepithelial neoplasia: long term follow up of treated anduntreated women. Br J Obstet Gynaecol 1996;103(5):446—52.
15] Kennedy JC, Pottier RH, Pross DC. Photodynamic ther-apy with endogenous protoporphyrin IX: basic principlesand present clinical experience. J Photochem Photobiol B1990;6(1—2):143—8, doi:10.1016/1011-1344(90)85083-9.
16] Henderson B, Dougherty T. How does photodynamictherapy work? Photochem Photobiol 1992;55(1):145—57,
doi:10.1111/j.1751-1097.1992.tb04222.x.17] Kennedy JC, Pottier RH. Endogenous protoporphyrin IX, aclinically useful photosensitizer for photodynamic therapy. JPhotochem Photobiol B 1992;14(4):275—92.
[
N.M. Inada et al.
18] Peng Q, Warloe T, Berg K, et al. 5-Aminolevulinicacid-based photodynamic therapy. Clinical researchand future challenges. Cancer 1997;79(12):2282—308,doi:10.1002/(SICI)1097-0142(19970615)79:12<2282::AID-CNCR2>3.0.CO;2-O.
19] Cottrell WJ, Paquette AD, Keymel KR, Foster TH, OseroffAR. Irradiance-dependent photobleaching and pain in delta-aminolevulinic acid-photodynamic therapy of superficial basalcell carcinomas. Clin Cancer Res 2008;14(14):4475—83,doi:10.1158/1078-0432.CCR-07-5199.
20] Liu HF, Xu SZ, Zhang CR. Influence of CaNa2 EDTA on topical 5-aminolaevulinic acid photodynamic therapy. Chin Med J (Engl)2004;117(6):922—6.
21] Casas A, Fukuda H, Di Venosa G, Batlle AM. The influence of thevehicle on the synthesis of porphyrins after topical applicationof 5-aminolaevulinic acid. Implications in cutaneous photo-dynamic sensitization. Br J Dermatol 2000;143(3):564—72,doi:10.1111/j.1365-2133.2000.03711.x.
22] Wiegell SR, Stender IM, Na R, Wulf HC. Pain associatedwith photodynamic therapy using 5-aminolevulinic acid or 5-aminolevulinic acid methylester on tape-stripped normal skin.Arch Dermatol 2003;139(9):1173—7.
23] Rud E, Gederaas O, Høgset A, Berg K. 5-Aminolevulinicacid, but not 5-aminolevulinic acid esters, is trans-ported into adenocarcinoma cells by system BETAtransporters. Photochem Photobiol 2000;71(5):640—7,doi:10.1562/0031-8655(2000)0710640AABNAA2.0.CO2.
24] Warren CB, Karai LJ, Vidimos A, Maytin EV. Pain asso-ciated with aminolevulinic acid-photodynamic therapy ofskin disease. J Am Acad Dermatol 2009;61(6):1033—43,doi:10.1016/j.jaad.2009.03.048.
25] Wiegell SR, Skiveren J, Philipsen PA, Wulf HC. Painduring photodynamic therapy is associated with protopor-phyrin IX fluorescence and fluence rate. Br J Dermatol2008;158(4):727—33, doi:10.1111/j.1365-2133.2008.08451.x.
26] Wiegell SR, Haedersdal M, Wulf HC. Cold water and pauses inillumination reduces pain during photodynamic therapy: a ran-domized clinical study. Acta Derm Venereol 2009;89(2):145—9,doi:10.2340/00015555-0568.
27] Frisch M, Fenger C, van den Brule AJ, et al. Variants ofsquamous cell carcinoma of the anal canal and perianal skinand their relation to human papillomaviruses. Cancer Res1999;59(3):753—7.
28] Nucci V, Torchia D, Cappugi P. Treatment of anogenitalcondylomata acuminata with topical photodynamic therapy:report of 14 cases and review. Int J Infect Dis 2010;14S:e280—2.
29] Wang HW, Wang XL, Zhang LL, Guo MX, Huang Z. Aminolevulinicacid (ALA)-assisted photodynamic diagnosis of subclinical andlatent HPV infection of external genital region. PhotodiagnosisPhotodyn Ther 2008;5(4):251—5.
ORIGINAL ARTICLE
Photodynamic inactivation of microorganisms presenton complete dentures. A clinical investigationPhotodynamic disinfection of complete dentures
Daniela Garcia Ribeiro & Ana Cláudia Pavarina & Lívia Nordi Dovigo &
Ewerton Garcia de Oliveira Mima & Ana Lucia Machado &
Vanderlei Salvador Bagnato & Carlos Eduardo Vergani
Received: 5 January 2011 /Accepted: 4 March 2011 /Published online: 12 April 2011# Springer-Verlag London Ltd 2011
Abstract The aim of this study was to evaluate theeffectiveness of photodynamic therapy (PDT) for thedisinfection of complete dentures. Biofilm samples werecollected from dentures of 60 denture users who wererandomly divided into four experimental groups (n=15each): subjects whose maxillary dentures were sprayed with50 and 100 mg/l of Photogem® suspension (groups P50Sand P100S) and patients whose maxillary dentures weretreated with 50 and 100 mg/l of Photogem® gel (groupsP50G and P100G). Dentures with photosensitizers were leftin the dark for 30 min (pre-irradiation time) and thenirradiated with blue LED light at 37.5 J/cm2 (26 min).Denture samples were taken with sterile cotton swab before(left side surfaces) and after (right side surfaces) PDT. All
microbial material was diluted and plated on selectivemedia for Candida spp., Staphylococcus mutans spp.,streptococci and a non-selective media. After incubation(48 h/37°C), the number of colony-forming units (cfu/ml)was counted. Microorganisms grown on selective media wereidentified using biochemical methods before and after PDT.The data were submitted to McNemar and Kruskal–Wallistests (α=0.05). No growth after PDTwas observed in 60, 53,47, and 40% of dentures from P100G, P50G, P100S, andP50S groups, respectively. When evidence of microorgan-isms’ growth was observed, PDT regimens eliminated over90% of microorganisms on dentures. This clinical studyshowed that PDT was effective for disinfecting dentures.
Keywords Complete denture . Disinfection . Infectioncontrol . Photochemotherapy . Sterilization
Introduction
The potential risk of dentists acquiring or transmittinginfectious diseases during clinical procedures has been amajor concern in dental practice. A previous studydemonstrated that all materials sent from dental offices tothe dental laboratories, including prostheses, were contam-inated with different species of microorganisms [27].Therefore, prosthodontic patients can be considered ahigh-risk group for transmission of infectious diseases aswell as being susceptible to acquiring them.
Dental prostheses can act as a potential source ofinfection because pathogenic microorganisms are capableof adhering to and surviving on acrylic resin surfaces,
D. G. RibeiroDepartment of Dentistry, Ponta Grossa State University,Ponta Grossa, Paraná, Brazil
A. C. Pavarina (*) : L. N. Dovigo :A. L. Machado :C. E. VerganiDepartment of Dental Materials and Prosthodontics,Araraquara Dental School, UNESP – Univ Estadual Paulista,Humaitá Street, 1680, 14.801-903,Araraquara, SP, Brazile-mail: [email protected]
E. G. de Oliveira MimaDentistry School, São Francisco University,São Francisco de Assis Avenue, 218,12916–900, Bragança Paulista, SP, Brazil
V. S. BagnatoPhysics Institute, USP – University of São Paulo,Caixa Postal 369,13560–970, São Carlos, SP, Brazil
Lasers Med Sci (2012) 27:161–168DOI 10.1007/s10103-011-0912-3
promoting biofilm formation. Denture biofilms are complexstructures similar to those found in dental plaque, except forthe extensive presence of Candida spp. [23]. Differentspecies of oral and non-oral pathogens are associated withdenture plaque, including Candida spp., Staphylococcus spp.,Streptococcus spp., Lactobacillus spp., Pseudomonas spp.,Enterobacter spp. and Actinomyces spp. [15]. The presence ofthis microflora has been implicated in many local [44] andsystemic pathologies [15], such as caries, periodontal disease,mucosa inflammation, urinary tract infections, conjunctivitis,pneumonia, meningitis, abscess, septicemia, and endocarditis.
The probable transmission of infectious agents betweenpatients and dental staff has led to an effort to find methodsfor reducing the occurrence of cross-contamination inprosthodontic practice. Denture disinfection is an importantprocedure that must be performed before dentures are sentto the laboratory and before they are inserted in the patient.Chemical agents have been widely applied to reducemicrobial contamination of dentures [22]. Nevertheless,some of the recommended denture-soaking solutions havebeen reported to change or damage the physical [32] andmechanical properties [1] of acrylic resins. Anotheralternative for denture disinfection may be microwaveirradiation. Despite its effectiveness for inactivating micro-organisms [28], many types of dentures cannot be dis-infected by microwave, for example, removable partialdentures, because they are constructed with a metalframework. Bearing in mind that the denture materialsshould not be adversely affected by the disinfectionprocess, many researchers have conducted studies to seekalternative therapies for denture decontamination.
Photodynamic therapy (PDT) seems to be a promisingmethod for inactivating microorganisms. Until recently, themain application of PDT was to treat neoplasms [4] andnon-neoplastic [22] disorders. However, the use of thistechnique for the treatment of microbial infection [39] isalso gaining interest due to the growing resistance ofmicroorganisms to conventional antimicrobial agents.Many studies have shown PDT to be highly effective forinactivating viruses [40], bacteria [16], and fungi [34]. Thebasic principle of this approach is based on the irradiationof a compound known as a photosensitizer (PS) with a lightsource, which causes cell death through the generation ofreactive oxygen species (e.g., singlet oxygen). Several lightsources have been applied to activate the PS. Althoughlaser is the most commonly used light, another alternativelight source for PDT is light-emitting diodes (LEDs). TheLED device presents some advantages in comparison withlaser light, such as: narrow-band non-coherent energy,lower cost and simple technology, being suitable forilluminating different targets. Moreover, there are differentcolors of LED light, which have radiations covering almostall the visible electromagnetic spectra.
Although the majority of studies have suggested antimi-crobial PDT for the management of localized infections,this procedure may also emerge as a promising process fordisinfection. Drinking water contaminated with a range ofbacteria was disinfected using Rose Bengal, eosin, andmethylene blue associated with a halogen lamp [21].Furthermore, recent publications have reported the use ofPDT in blood decontamination [41]. In dentistry, PDT canhave important clinical applications such as the disinfectionof root canals, periodontal pockets, and carious lesions [11,42]. In the periodontal field, PDT has shown its efficacy forthe treatment of periodontitis and peri-implantitis in animalmodels and clinical trials [9, 10].
Thus, this clinical study evaluated the effectiveness of PDTfor disinfecting complete maxillary dentures worn by patientsas a potential method to prevent cross-contamination. Thehematoporphyrin derivative Photogem® was selected as PSand was associated with blue LED illumination.
Methods
Study population
Maxillary complete dentures of 60 patients, aged between 45–80 years, with a mean age 62.5 years, were included in thisstudy. The patients, recruited from UNESP - São Paulo StateUniversity/ Araraquara Dental School, were invited bytelephone to participate in the survey. They presented healthyoral mucosa, a good general health status and had beenwearingtheir dentures for at least 6 months. Furthermore, one of theinclusion criteria was that the volunteers had not, or were notsoaking dentures in a disinfectant solution. All the patientsreceived verbal oral hygiene instructions. The examiners woregloves, protective clothing, masks, and eye protection duringall clinical and laboratory procedures. After attending eachpatient and performing microbial culture, the operator’sgloves were discarded and replaced with sterile gloves. Theresearch protocol was approved by the Ethics Committee ofthe Araraquara Dental School/ UNESP – São Paulo StateUniversity and each patient provided written consent toparticipate in this study.
Clinical procedures
The sixty patients were randomly divided into four experi-mental groups (P50S, P100S, P50G, and P100G) of 15subjects each. Blind investigators were responsible for theclinical procedures such as: first denture biofilm collection,PDT procedures, and second denture biofilm collection.Microbiological procedures were carried out by one examiner.The first collection of biological material (control) of eachdenture was performed before PDT treatment. Control
162 Lasers Med Sci (2012) 27:161–168
samples were collected from the left half of all denturesurfaces, which were vigorously rubbed for 1 min with asterile cotton swab. Denture biofilm samples were placed intubes containing 4.5 ml of sterile saline solution.
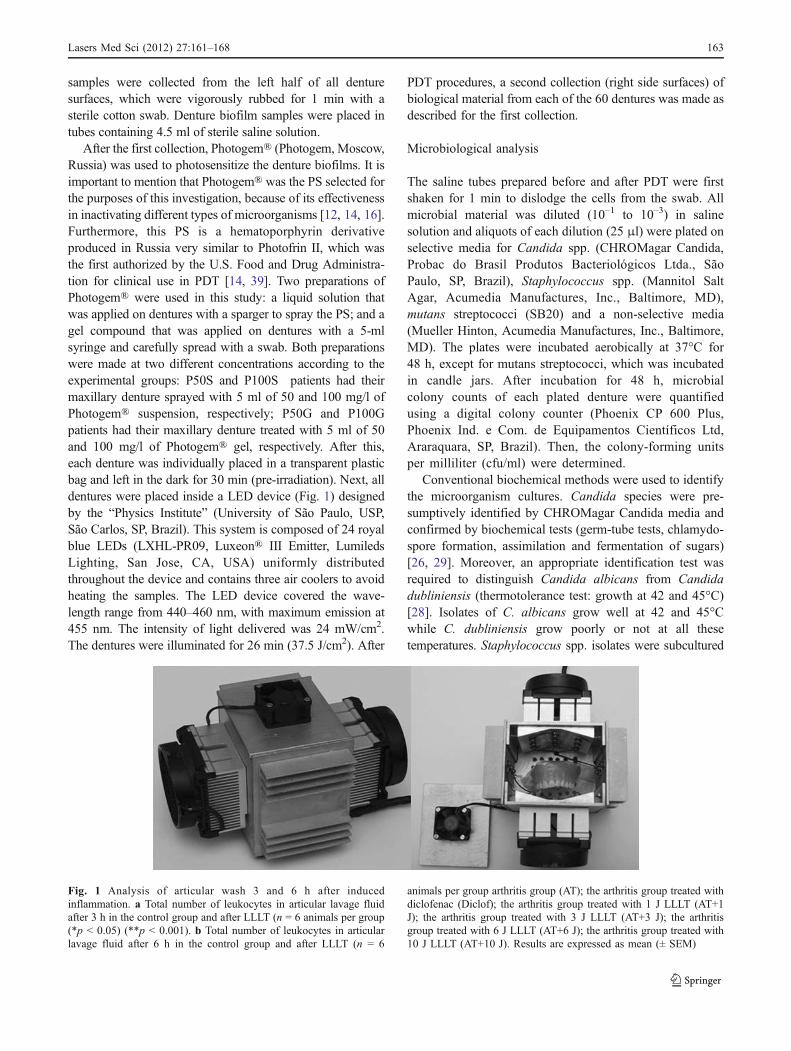
After the first collection, Photogem® (Photogem, Moscow,Russia) was used to photosensitize the denture biofilms. It isimportant to mention that Photogem® was the PS selected forthe purposes of this investigation, because of its effectivenessin inactivating different types of microorganisms [12, 14, 16].Furthermore, this PS is a hematoporphyrin derivativeproduced in Russia very similar to Photofrin II, which wasthe first authorized by the U.S. Food and Drug Administra-tion for clinical use in PDT [14, 39]. Two preparations ofPhotogem® were used in this study: a liquid solution thatwas applied on dentures with a sparger to spray the PS; and agel compound that was applied on dentures with a 5-mlsyringe and carefully spread with a swab. Both preparationswere made at two different concentrations according to theexperimental groups: P50S and P100S patients had theirmaxillary denture sprayed with 5 ml of 50 and 100 mg/l ofPhotogem® suspension, respectively; P50G and P100Gpatients had their maxillary denture treated with 5 ml of 50and 100 mg/l of Photogem® gel, respectively. After this,each denture was individually placed in a transparent plasticbag and left in the dark for 30 min (pre-irradiation). Next, alldentures were placed inside a LED device (Fig. 1) designedby the “Physics Institute” (University of São Paulo, USP,São Carlos, SP, Brazil). This system is composed of 24 royalblue LEDs (LXHL-PR09, Luxeon® III Emitter, LumiledsLighting, San Jose, CA, USA) uniformly distributedthroughout the device and contains three air coolers to avoidheating the samples. The LED device covered the wave-length range from 440–460 nm, with maximum emission at455 nm. The intensity of light delivered was 24 mW/cm2.The dentures were illuminated for 26 min (37.5 J/cm2). After
PDT procedures, a second collection (right side surfaces) ofbiological material from each of the 60 dentures was made asdescribed for the first collection.
Microbiological analysis
The saline tubes prepared before and after PDT were firstshaken for 1 min to dislodge the cells from the swab. Allmicrobial material was diluted (10–1 to 10–3) in salinesolution and aliquots of each dilution (25 μl) were plated onselective media for Candida spp. (CHROMagar Candida,Probac do Brasil Produtos Bacteriológicos Ltda., SãoPaulo, SP, Brazil), Staphylococcus spp. (Mannitol SaltAgar, Acumedia Manufactures, Inc., Baltimore, MD),mutans streptococci (SB20) and a non-selective media(Mueller Hinton, Acumedia Manufactures, Inc., Baltimore,MD). The plates were incubated aerobically at 37°C for48 h, except for mutans streptococci, which was incubatedin candle jars. After incubation for 48 h, microbialcolony counts of each plated denture were quantifiedusing a digital colony counter (Phoenix CP 600 Plus,Phoenix Ind. e Com. de Equipamentos Científicos Ltd,Araraquara, SP, Brazil). Then, the colony-forming unitsper milliliter (cfu/ml) were determined.
Conventional biochemical methods were used to identifythe microorganism cultures. Candida species were pre-sumptively identified by CHROMagar Candida media andconfirmed by biochemical tests (germ-tube tests, chlamydo-spore formation, assimilation and fermentation of sugars)[26, 29]. Moreover, an appropriate identification test wasrequired to distinguish Candida albicans from Candidadubliniensis (thermotolerance test: growth at 42 and 45°C)[28]. Isolates of C. albicans grow well at 42 and 45°Cwhile C. dubliniensis grow poorly or not at all thesetemperatures. Staphylococcus spp. isolates were subcultured
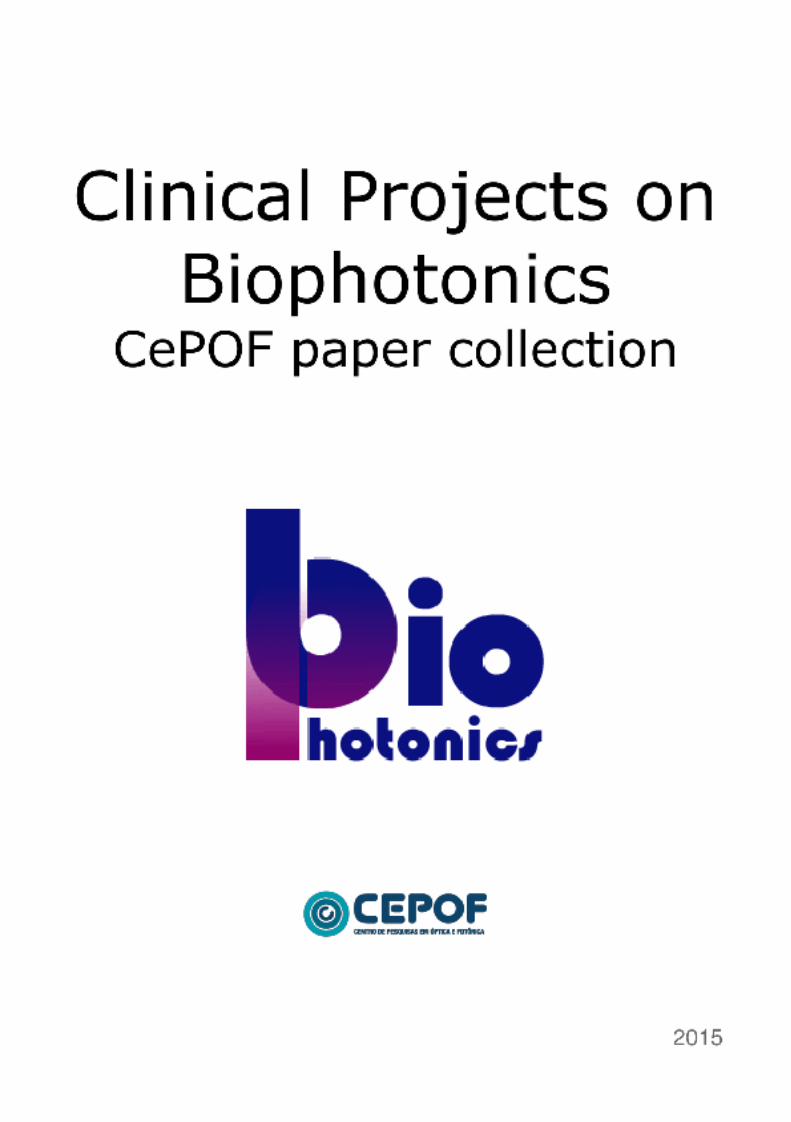
Fig. 1 Analysis of articular wash 3 and 6 h after inducedinflammation. a Total number of leukocytes in articular lavage fluidafter 3 h in the control group and after LLLT (n = 6 animals per group(*p < 0.05) (**p < 0.001). b Total number of leukocytes in articularlavage fluid after 6 h in the control group and after LLLT (n = 6
animals per group arthritis group (AT); the arthritis group treated withdiclofenac (Diclof); the arthritis group treated with 1 J LLLT (AT+1J); the arthritis group treated with 3 J LLLT (AT+3 J); the arthritisgroup treated with 6 J LLLT (AT+6 J); the arthritis group treated with10 J LLLT (AT+10 J). Results are expressed as mean (± SEM)
Lasers Med Sci (2012) 27:161–168 163
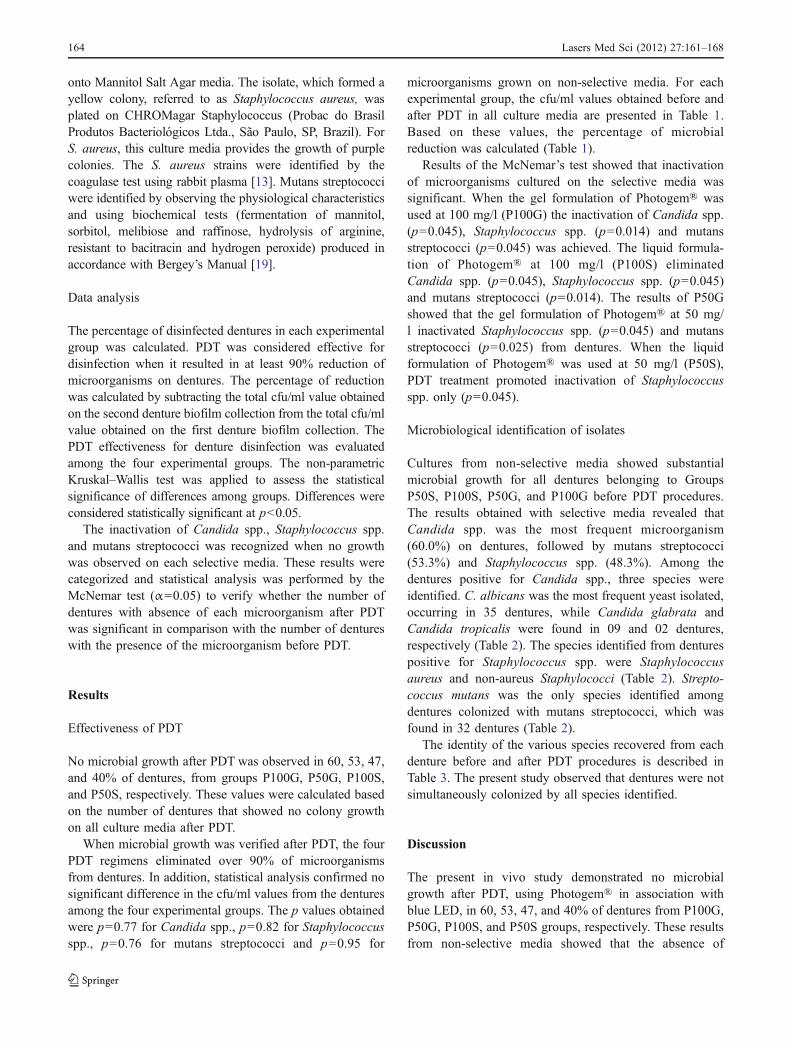
onto Mannitol Salt Agar media. The isolate, which formed ayellow colony, referred to as Staphylococcus aureus, wasplated on CHROMagar Staphylococcus (Probac do BrasilProdutos Bacteriológicos Ltda., São Paulo, SP, Brazil). ForS. aureus, this culture media provides the growth of purplecolonies. The S. aureus strains were identified by thecoagulase test using rabbit plasma [13]. Mutans streptococciwere identified by observing the physiological characteristicsand using biochemical tests (fermentation of mannitol,sorbitol, melibiose and raffinose, hydrolysis of arginine,resistant to bacitracin and hydrogen peroxide) produced inaccordance with Bergey’s Manual [19].
Data analysis
The percentage of disinfected dentures in each experimentalgroup was calculated. PDT was considered effective fordisinfection when it resulted in at least 90% reduction ofmicroorganisms on dentures. The percentage of reductionwas calculated by subtracting the total cfu/ml value obtainedon the second denture biofilm collection from the total cfu/mlvalue obtained on the first denture biofilm collection. ThePDT effectiveness for denture disinfection was evaluatedamong the four experimental groups. The non-parametricKruskal–Wallis test was applied to assess the statisticalsignificance of differences among groups. Differences wereconsidered statistically significant at p<0.05.
The inactivation of Candida spp., Staphylococcus spp.and mutans streptococci was recognized when no growthwas observed on each selective media. These results werecategorized and statistical analysis was performed by theMcNemar test (α=0.05) to verify whether the number ofdentures with absence of each microorganism after PDTwas significant in comparison with the number of dentureswith the presence of the microorganism before PDT.
Results
Effectiveness of PDT
No microbial growth after PDT was observed in 60, 53, 47,and 40% of dentures, from groups P100G, P50G, P100S,and P50S, respectively. These values were calculated basedon the number of dentures that showed no colony growthon all culture media after PDT.
When microbial growth was verified after PDT, the fourPDT regimens eliminated over 90% of microorganismsfrom dentures. In addition, statistical analysis confirmed nosignificant difference in the cfu/ml values from the denturesamong the four experimental groups. The p values obtainedwere p=0.77 for Candida spp., p=0.82 for Staphylococcusspp., p=0.76 for mutans streptococci and p=0.95 for
microorganisms grown on non-selective media. For eachexperimental group, the cfu/ml values obtained before andafter PDT in all culture media are presented in Table 1.Based on these values, the percentage of microbialreduction was calculated (Table 1).
Results of the McNemar’s test showed that inactivationof microorganisms cultured on the selective media wassignificant. When the gel formulation of Photogem® wasused at 100 mg/l (P100G) the inactivation of Candida spp.(p=0.045), Staphylococcus spp. (p=0.014) and mutansstreptococci (p=0.045) was achieved. The liquid formula-tion of Photogem® at 100 mg/l (P100S) eliminatedCandida spp. (p=0.045), Staphylococcus spp. (p=0.045)and mutans streptococci (p=0.014). The results of P50Gshowed that the gel formulation of Photogem® at 50 mg/l inactivated Staphylococcus spp. (p=0.045) and mutansstreptococci (p=0.025) from dentures. When the liquidformulation of Photogem® was used at 50 mg/l (P50S),PDT treatment promoted inactivation of Staphylococcusspp. only (p=0.045).
Microbiological identification of isolates
Cultures from non-selective media showed substantialmicrobial growth for all dentures belonging to GroupsP50S, P100S, P50G, and P100G before PDT procedures.The results obtained with selective media revealed thatCandida spp. was the most frequent microorganism(60.0%) on dentures, followed by mutans streptococci(53.3%) and Staphylococcus spp. (48.3%). Among thedentures positive for Candida spp., three species wereidentified. C. albicans was the most frequent yeast isolated,occurring in 35 dentures, while Candida glabrata andCandida tropicalis were found in 09 and 02 dentures,respectively (Table 2). The species identified from denturespositive for Staphylococcus spp. were Staphylococcusaureus and non-aureus Staphylococci (Table 2). Strepto-coccus mutans was the only species identified amongdentures colonized with mutans streptococci, which wasfound in 32 dentures (Table 2).
The identity of the various species recovered from eachdenture before and after PDT procedures is described inTable 3. The present study observed that dentures were notsimultaneously colonized by all species identified.
Discussion
The present in vivo study demonstrated no microbialgrowth after PDT, using Photogem® in association withblue LED, in 60, 53, 47, and 40% of dentures from P100G,P50G, P100S, and P50S groups, respectively. These resultsfrom non-selective media showed that the absence of
164 Lasers Med Sci (2012) 27:161–168
microbial growth varied according to PDT regimes. Thehighest frequency of dentures with no growth (60 and 53%)was observed with the Photogem® in gel formulation, bothat 100 and 50 mg/l, respectively. Experimental examina-tions [17, 24, 38] have revealed that the gel formulation canbe more efficient than the liquid for disinfection purposes.Gomes et al. [17] showed that chlorhexidine gluconate gelwas more efficient than the liquid presentation at equivalentconcentrations against selected endodontic microorganisms.Another investigation [38] also proved that chlorhexidine ingel form eliminated S. aureus and C. albicans isolated frominfected root canals. According to the research of Paolantonioet al. [24], filling the internal implant cavity with chlorhex-idine gel resulted in a significant reduction in the totalbacterial count and it proved to have a long-lasting antimi-crobial effect when compared with chlorhexidine solution.The above-mentioned studies suggested that the highereffectiveness of the gel formulation was because the gel keptthe chemical substance in contact with the microorganisms fora longer time than the liquid formulation did. Photogem® gelis capable of remaining on the denture surfaces throughout thepre-irradiation and illumination procedures, which mayexplain the better results obtained for Groups P100G andP50G. It is possible that the denture biofilm being kept in
constant contact with the PS gel favored photosensitiza-tion of the microorganisms, and improved the effective-ness of PDT.
PDT resulted in a substantial reduction in the viablemicroorganism counts from dentures. This disinfection wasobserved after the four PDT treatments, since they allsignificantly reduced over 90% of the microorganisms onthe dentures. Although the present investigation was thefirst to describe the clinical use of PDT for denturedisinfection, the results presented here can be compared toresearch that applied PDT for clinical disinfection indentistry. Dörtbudak et al. [11] showed that the applicationof toluidine blue O (TBO) and laser for implant surfacedisinfection was capable of significantly reducing (2 logsteps on an average) the initial values for the three bacteriagroups tested. In another study, [30] the subgingival plaquesamples from patients were exposed to laser in the presenceof TBO and achieved significant reductions (over 90%) inthe viability of aerobic and anaerobic organisms. Giusti etal. [14] evaluated the use of Photogem® in association withred LED light for decontaminating carious bovine dentinand observed that the initial number of bacteria wasreduced by more than 90% after PDT treatment.
In addition to the studies already mentioned, the resultsare also corroborated by the findings of several in vitrostudies [3, 25, 33, 36]. These aforementioned investigationsshowed that bacterial and yeast species are susceptible toPDT, including those found in dentures worn by edentulouspatients. Soares et al. [33] obtained a significant reductionin the growth of planktonic C. albicans, C. tropicalis andCandida parapsilosis cultures after PDT mediated by TBOwith LED light. Another in vitro study [3] demonstrated thepossibility of photosensitizing C. albicans and C. glabratawith light-induced inactivation by using Photofrin® and anHg arc lamp. According to Tegos et al. [36], the use of achlorin(e6) conjugate in conjunction with a diode laserefficiently killed microbial suspensions of S. aureus. Thesusceptibility of one S. mutans strain was verified by usinga dental light polymerizer in association with Rose Bengaldye [25]. The results of the above-mentioned studies areconsistent with those of the present study, which also
Table 1 Mean of cfu/ml values obtained before and after PDT and percentage of reduction (%) obtained in each experimental group according tothe culture media
Culture Media
Groups CHROMagar Mannitol Salt Agar SB20 Mueller Hinton
Before PDT After PDT % Before PDT After PDT % Before PDT After PDT % Before PDT After PDT %
P50S 3.16E+03 4.00E+01 98.7 1.04E+03 1.33E+01 98.7 8.53E+03 1.12E+02 98.6 3.46E+05 1.16E+03 99.6
P100S 8.37E+03 3.47E+01 99.5 2.85E+02 2.13E+01 92.5 3.92E+05 5.87E+01 99.9 2.67E+06 5.28E+02 99.9
P50G 1.57E+04 1.20E+02 99.2 3.95E+03 5.87E+01 98.5 6.79E+04 3.49E+02 99.4 5.45E+05 5.65E+02 99.8
P100G 2.96E+03 2.88E+02 90.2 4.59E+02 4.00E+01 91.2 1.17E+05 1.17E+02 99.9 6.22E+05 1.20E+03 99.8
Table 2 Prevalence of the different species identified in 60 maxillarydentures before PDT procedures
Identified species Dentures (n = 60)
Number %
Candida spp. 36 60.0
C. albicans 35 58.3
C. glabrata 09 15.0
C. tropicalis 02 3.3
Staphylococcus spp. 29 48.3
Staphylococcus aureus 23 38.3
non-aureus Staphylococci 06 10.0
Mutans streptococci 32 53.3
Streptococcus mutans 32 53.3
Lasers Med Sci (2012) 27:161–168 165
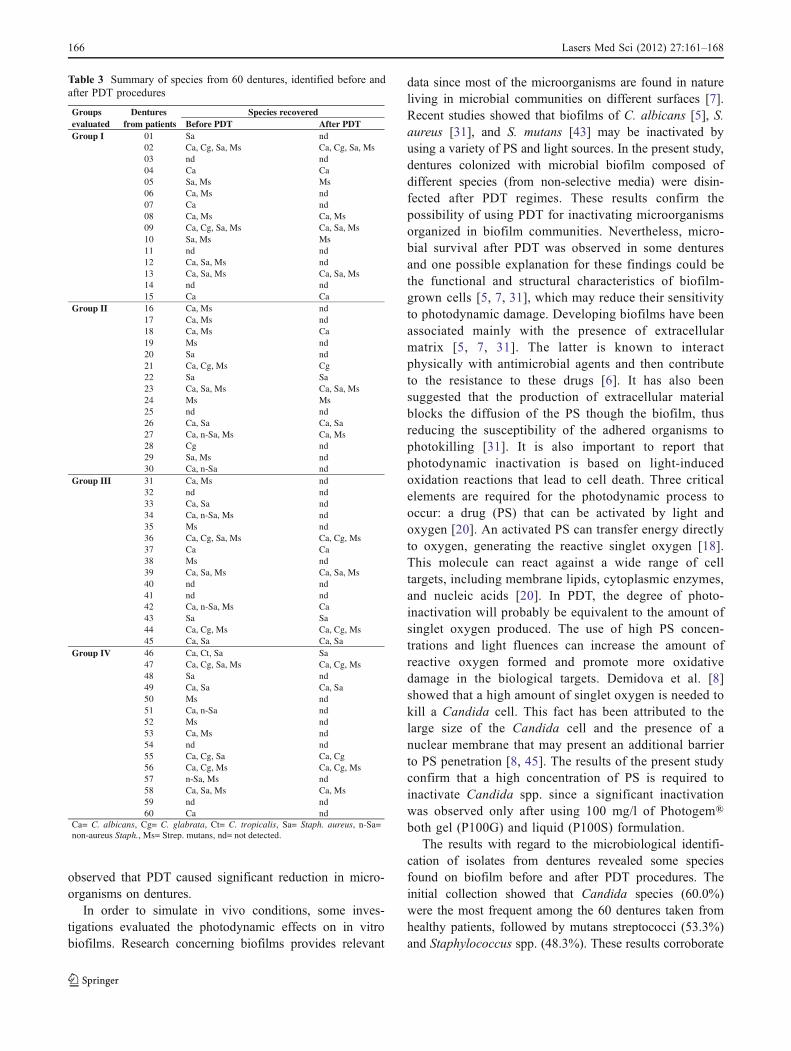
observed that PDT caused significant reduction in micro-organisms on dentures.
In order to simulate in vivo conditions, some inves-tigations evaluated the photodynamic effects on in vitrobiofilms. Research concerning biofilms provides relevant
data since most of the microorganisms are found in natureliving in microbial communities on different surfaces [7].Recent studies showed that biofilms of C. albicans [5], S.aureus [31], and S. mutans [43] may be inactivated byusing a variety of PS and light sources. In the present study,dentures colonized with microbial biofilm composed ofdifferent species (from non-selective media) were disin-fected after PDT regimes. These results confirm thepossibility of using PDT for inactivating microorganismsorganized in biofilm communities. Nevertheless, micro-bial survival after PDT was observed in some denturesand one possible explanation for these findings could bethe functional and structural characteristics of biofilm-grown cells [5, 7, 31], which may reduce their sensitivityto photodynamic damage. Developing biofilms have beenassociated mainly with the presence of extracellularmatrix [5, 7, 31]. The latter is known to interactphysically with antimicrobial agents and then contributeto the resistance to these drugs [6]. It has also beensuggested that the production of extracellular materialblocks the diffusion of the PS though the biofilm, thusreducing the susceptibility of the adhered organisms tophotokilling [31]. It is also important to report thatphotodynamic inactivation is based on light-inducedoxidation reactions that lead to cell death. Three criticalelements are required for the photodynamic process tooccur: a drug (PS) that can be activated by light andoxygen [20]. An activated PS can transfer energy directlyto oxygen, generating the reactive singlet oxygen [18].This molecule can react against a wide range of celltargets, including membrane lipids, cytoplasmic enzymes,and nucleic acids [20]. In PDT, the degree of photo-inactivation will probably be equivalent to the amount ofsinglet oxygen produced. The use of high PS concen-trations and light fluences can increase the amount ofreactive oxygen formed and promote more oxidativedamage in the biological targets. Demidova et al. [8]showed that a high amount of singlet oxygen is needed tokill a Candida cell. This fact has been attributed to thelarge size of the Candida cell and the presence of anuclear membrane that may present an additional barrierto PS penetration [8, 45]. The results of the present studyconfirm that a high concentration of PS is required toinactivate Candida spp. since a significant inactivationwas observed only after using 100 mg/l of Photogem®both gel (P100G) and liquid (P100S) formulation.
The results with regard to the microbiological identifi-cation of isolates from dentures revealed some speciesfound on biofilm before and after PDT procedures. Theinitial collection showed that Candida species (60.0%)were the most frequent among the 60 dentures taken fromhealthy patients, followed by mutans streptococci (53.3%)and Staphylococcus spp. (48.3%). These results corroborate
Table 3 Summary of species from 60 dentures, identified before andafter PDT procedures
Groups Dentures Species recoveredevaluated from patients Before PDT After PDTGroup I dnaS10
02 Ca, Cg, Sa, Ms Ca, Cg, Sa, Msdndn30aCaC40sMsM,aS50
dnsM,aC60dnaC70
sM,aCsM,aC8009 Ca, Cg, Sa, Ms Ca, Sa, Ms
sMsM,aS01dndn11
12 Ca, Sa, Ms nd13 Ca, Sa, Ms Ca, Sa, Ms
dndn41aCaC51
Group II dnsM,aC61dnsM,aC71aCsM,aC81dnsM91dnaS02
21 Ca, Cg, Ms CgaSaS22
23 Ca, Sa, Ms Ca, Sa, MssMsM42
dndn52aS,aCaS,aC62
27 Ca, n-Sa, Ms Ca, MsdngC82dnsM,aS92dnaS-n,aC03
Group III dnsM,aC13dndn23dnaS,aC33
34 Ca, n-Sa, Ms nddnsM53
36 Ca, Cg, Sa, Ms Ca, Cg, MsaCaC73dnsM83
39 Ca, Sa, Ms Ca, Sa, Msdndn04dndn14
42 Ca, n-Sa, Ms CaaSaS34
44 Ca, Cg, Ms Ca, Cg, MsaS,aCaS,aC54
Group IV aSaS,tC,aC6447 Ca, Cg, Sa, Ms Ca, Cg, Ms
dnaS84aS,aCaS,aC94
dnsM05dnaS-n,aC15dnsM25dnsM,aC35dndn45
55 Ca, Cg, Sa Ca, Cg56 Ca, Cg, Ms Ca, Cg, Ms
dnsM,aS-n7558 Ca, Sa, Ms Ca, Ms
dndn95dnaC06
Ca= C. albicans, Cg= C. glabrata, Ct= C. tropicalis, Sa= Staph. aureus, n-Sa=non-aureus Staph., Ms= Strep. mutans, nd= not detected.
166 Lasers Med Sci (2012) 27:161–168
those of Ribeiro et al., [28] who found the same threespecies in maxillary dentures, and Candida spp. appearedwith the highest frequency of appearance (76.6%). Anotherstudy [2] reported the presence of C. albicans, S. aureus,and S. mutans on the inner surface of complete denturestaken from patients. C. albicans was isolated in 66.7% ofthe dentures, while S. aureus and S. mutans were isolatedfrom 49.5% of the dentures. The present study observedthat the yeast species isolated from dentures were C.albicans, C. glabrata and C. tropicalis. Vanden Abbeeleet al. [37] confirmed that C. albicans (77.9%) was thecommonest yeast found on patients’ dentures, followed byC. glabrata (44.1%) and C. tropicalis (19.1%), respectively.After PDT treatments, the species were identified as C.albicans, C. glabrata, S. aureus and S. mutans. Someinvestigations [15, 35] have related the presence ofCandida, Staphylococcus, and Streptococcus species ondentures to the development of systemic infections [35]such as pneumonia, and local infections such as denture-induced stomatitis [2]. Although the present researchshowed a reduction of more than 90% of microorganismsfrom all dentures, the persistence of pathogenic micro-organisms on dentures after disinfection procedures maybe cause for concern. Preferably, these procedures shouldbe efficient for completely eliminating microorganisms,allowing denture sterilization and assuredly preventingcross-contamination between the dental office and dentallaboratory personnel. Thus, further research is needed todetermine an effective combination of PS concentrationwith light fluence for preventing cross-infection in dentalpractice.
In conclusion, this clinical study showed that PDT waseffective in disinfecting dentures since the four treatmentsinactivated over 90% of microorganisms on the dentures.Gel formulation of Photogem® was more efficient forphotosensitizing denture biofilm when compared withliquid form. Nevertheless, these results must be interpretedwith caution because the survival of any microorganism ondenture after PDT could be an infection hazard for dentalstaff and patients. Thus, to establish an effective infection-control program, it is important to not only decrease thenumber of microorganisms but also eliminate them fromdentures. For this reason, a possible future direction in researchto improve PDT effectiveness may be the investigation ofhigher Photogem® concentrations in order to achieve sterili-zation of dentures, as well as the evaluation of conventionaldisinfection methods to compare with PDT efficacy.
Acknowledgments This research was supported by São PauloCouncil of Research (FAPESP Grant No. 2005/02192-8).
Conflict of interest The authors declare that they have no conflictsof interest.
References
1. Asad T, Watkinson AC, Huggett R (1992) The effect ofdisinfection procedures on flexural properties of denture baseacrylic resins. J Prosthet Dent 68:191–195
2. Baena-Monroy T, Moreno-Maldonado V, Franco-Martínez F,Aldape-Barrios B, Quindós G, Sánchez-Vargas LO (2005)Candida albicans, Staphylococcus aureus and Streptococcusmutans colonization in patients wearing dental prosthesis. MedOral Patol Oral Cir Bucal 10:E27–E29
3. Bliss JM, Bigelow CE, Foster TH, Haidaris CG (2004) Suscep-tibility of Candida species to photodynamic effects of Photofrin.Antimicrob Agents Chemother 48:2000–2006
4. Brow SB, Brown EA, Walker I (2004) The present and the futurerole of photodynamic therapy in cancer treatment. Lancet Oncol5:497–508
5. Chabrier-Roselló Y, Foster TH, Pérez-Nazario N, Mitra S,Haidaris CG (2005) Sensitivity of Candida albicans germ tubesand biofilms to Photofrin-mediated phototoxicity. AntimicrobAgents Chemother 49:4288–4295
6. Chandra J, Kuhn DM, Mukherjee PK, Hoyer LL, McCormick T,Ghannoum MA (2001) Biofilm formation by the fungal pathogenCandida albicans: development, architecture, and drug resistance.J Bacteriol 183:5385–5394
7. Costerton JW, Lewandowski Z, Caldwell DE, Korber DR,Lappin-Scott HM (1995) Microbial biofilms. Annu Rev Microbiol49:711–745
8. Demidova TN, Hamblin MR (2005) Effect of cell-photosensitizerbinding and cell density on microbial photoinactivation. Anti-microb Agents Chemother 49:2329–2335
9. de Oliveira RR, Novaes AB Jr, Garlet GP, de Souza RF, Taba MJr, Sato S, de Souza SL, Palioto DB, Grisi MF, Feres M (2010)The effect of a single episode of antimicrobial photodynamictherapy in the treatment of experimental periodontitis. Microbio-logical profile and cytokine pattern in the dog mandible. LasersMed Sci. doi:10.1007/s10103-010-0864-z
10. de Paula EC, de Freitas PM, Esteves-Oliveira M, Aranha AC,Ramalho KM, Simões A, Bello-Silva MS, Tunér J (2010) Laserphototherapy in the treatment of periodontal disease. A review.Lasers Med Sci 25(6):781–792
11. Dörtbudak O, Haas R, Bernhart T, Mailath-Pokorny G (2001) Lethalphotosensitization for decontamination of implant surfaces in thetreatment of peri-implantitis. Clin Oral Implants Res 12:104–108
12. Dovigo LN, Pavarina AC, de Oliveira Mima EG, Vergani CE,Giampaolo ET, Bagnato VS (2011) Fungicidal effect of photody-namic therapy against fluconazoleresistant Candida albicans andCandida glabrata. Mycoses 54:123–30
13. Gaillot O, Wetsch M, Fortineau N, Berche P (2000) Evaluation ofCHROMagar Staph. aureus, a new chromogenic medium, forisolation and presumptive identification of Staphylococcus aureusfrom human clinical specimens. J Clin Microbiol 38:1587–1591
14. Giusti JS, Santos-Pinto L, Pizzolito AC, Helmerson K, Carvalho-Filho E, Kurachi C et al (2008) Antimicrobial photodynamicaction on dentin using a light-emitting diode light source.Photomed Laser Surg 26:281–287
15. Glass RT, Bullard JW, Hadley CS, Mix EW, Conrad RS (2001)Partial spectrum of microorganisms found in dentures andpossible disease implications. J Am Osteopath Assoc 101:92–94
16. Gois MM, Kurachi C, Santana EJ, Mima EG, Spolidório DM,Pelino JE et al (2010) Susceptibility of Staphylococcus aureus toporphyrin-mediated photodynamic antimicrobial chemotherapy:an in vitro study. Lasers Med Sci 25(3):391–395
17. Gomes BPFA, Ferraz CCR, Zaia AA, Souza-Filho FJ (1999)Variations in the susceptibility of selected microorganisms to
Lasers Med Sci (2012) 27:161–168 167
endodontic irrigants (BES Spring Meeting Abstract). J Endod25:299
18. Hamblin MR, Hasan T (2004) Photodynamic therapy: a newantimicrobial approach to infectious disease? Photochem Photo-biol Sci 3:436–450
19. Hardie JM (1986) Oral streptococci. In: Bergey DH (ed)Bergey’s manual of systematic bacteriology. Williams &Wilkins, Baltimore, pp 1054–1563
20. Henderson B, Dougherty TJ (1992) How does the photodynamictherapy work? Photochem Photobiol 55:145–157
21. Kuznetsova NA, Makarov DA, Kaliya OL, Vorozhtsov GN (2007)Photosensitized oxidation by dioxygen as the base for drinkingwater disinfection. J Hazard Mater 146:487–491
22. Mennel S, Barbazetto I, Meyer CH, Peter S, Stur M (2007) Ocularphotodynamic therapy-standard applications and new indications(part 1). Review of the literature and personal experience.Ophthalmologica 221:216–226
23. Nikawa H, Hamada T, Yamamoto T (1998) Denture plaque-pastand recent concerns. J Dent 26:299–304
24. Paolantonio M, Perinetti G, D'Ercole S, Graziani F, Catamo G,Sammartino G et al (2008) Internal decontamination of dentalimplants: an in vivo randomized microbiologic 6-month trial onthe effects of a chlorhexidine gel. J Periodontol 79:1419–1425
25. Paulino TP, Ribeiro KF, Thedei G Jr, Tedesco AC, Ciancaglini P(2005) Use of hand-held photopolymerizer to photoinactivateStreptococcus mutans. Arch Oral Biol 50:353–359
26. Pfaller MA, Houston A, Coffmann S (1996) Application ofCHROMagar Candida for rapid screening of clinical specimensfor Candida albicans, Candida tropicalis, Candida krusei, andCandida (Torulopsis) glabrata. J Clin Microbiol 34:58–61
27. Powell GL, Runnells RD, Saxon BA, Whisenant BK (1990) Thepresence and identification of organisms transmitted to dentallaboratories. J Prosthet Dent 64:235–237
28. Ribeiro DG, Pavarina AC, Dovigo LN, Spolidorio DM, GiampaoloET, Vergani CE (2009) Denture disinfection by microwave irradia-tion: a randomized clinical study. J Dent 37:666–672
29. Sandven P (1990) Laboratory identification and sensitivity testingof yeast isolates. Acta Odontol Scand 48:27–36
30. Sarkar S, Wilson M (1993) Lethal photosensitization of bacteria insubgingival plaque from patients with chronic periodontitis. JPeriodontal Res 28:204–210
31. Sharma M, Visai L, Bragheri F, Cristiani I, Gupta PK, Speziale P(2008) Toluidine blue-mediated photodynamic effects on staphy-lococcal biofilms. Antimicrob Agents Chemother 52:299–305
32. Shen C, Javid NS, Colaizzi FA (1989) The effect of glutaraldehydebase disinfectants on denture base resins. J Prosthet Dent 61:583–589
33. Soares BM, da Silva DL, Sousa GR, Amorim JC, de ResendeMA, Pinotti M et al (2009) In vitro photodynamic inactivation ofCandida spp. growth and adhesion to buccal epithelial cells. JPhotochem Photobiol B 94:65–70
34. Souza RC, Junqueira JC, Rossoni RD, Pereira CA, Munin E,Jorge AO (2010) Comparison of the photodynamic fungicidalefficacy of methylene blue, toluidine blue, malachite green andlow-power laser irradiation alone against Candida albicans.Lasers Med Sci 25(3):385–389
35. Sumi Y, Kagami H, Ohtsuka Y, Kakinoki Y, Haruguchi Y, MiyamotoH (2003) High correlation between the bacterial species in dentureplaque and pharyngeal microflora. Gerodontology 20:84–87
36. Tegos GP, Anbe M, Yang C, Demidova TN, Satti M, Mroz P et al(2006) Protease-stable polycationic photosensitizer conjugatesbetween polyethyleneimine and chlorine(e6) for broad-spectrumantimicrobial photoinactivation. Antimicrob Agents Chemother50:1402–1410
37. Vanden Abbeele A, De Meel H, Ahariz M, Perraudin JP, Beyer I,Courtois P (2008) Denture contamination by yeasts in the elderly.Gerodontology 25:222–228
38. Vianna ME, Gomes BPFA, Berber VB, Zaia AA, Ferraz CCR,Souza-Filho FJ (2004) In vitro evaluation of the antimicrobialactivity of chlorhexidine and sodium hypochlorite. Oral Surg OralMed Oral Pathol 97:79–84
39. Wainwright M (1998) Photodynamic antimicrobial chemotherapy(PACT). J Antimicrob Chemother 42:13–28
40. Wainwright M (2004) Photoinactivation of viruses. PhotochemPhotobiol Sci 3:406–411
41. Wainwright M, Mohr H, Walker WH (2007) Phenothiaziniumderivatives for pathogen inactivation in blood products. J Photo-chem Photobiol B 86:45–58
42. Walsh LJ (2003) The current status of laser applications indentistry. Aust Dent J 48:146–155
43. Zanin IC, Gonçalves RB, Junior AB, Hope CK, Pratten J (2005)Susceptibility of Streptococcus mutans biofilms to photodynamictherapy: an in vitro study. J Antimicrob Chemother 56:324–330
44. Zarb GA, Mackay HF (1980) The partially edentulous patient. I.The biologic price of prosthodontic intervention. Aust Dent J25:63–68
45. Zeina B, Greenman J, Purcell WM, Das B (2001) Killing ofcutaneous microbial species by photodynamic therapy. Br JDermatol 144:274–278
168 Lasers Med Sci (2012) 27:161–168
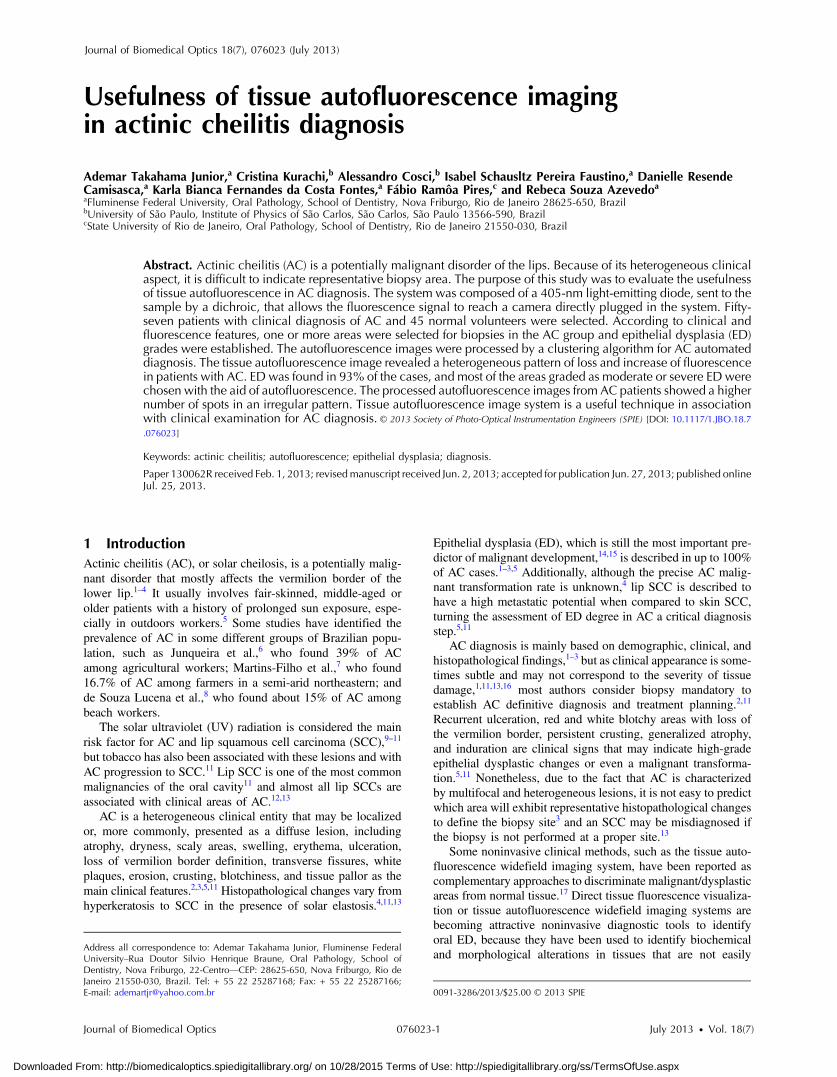
Usefulness of tissue autofluorescence imagingin actinic cheilitis diagnosis
Ademar Takahama Junior,a Cristina Kurachi,b Alessandro Cosci,b Isabel Schausltz Pereira Faustino,a Danielle ResendeCamisasca,a Karla Bianca Fernandes da Costa Fontes,a Fábio Ramôa Pires,c and Rebeca Souza Azevedoa
aFluminense Federal University, Oral Pathology, School of Dentistry, Nova Friburgo, Rio de Janeiro 28625-650, BrazilbUniversity of São Paulo, Institute of Physics of São Carlos, São Carlos, São Paulo 13566-590, BrazilcState University of Rio de Janeiro, Oral Pathology, School of Dentistry, Rio de Janeiro 21550-030, Brazil
Abstract. Actinic cheilitis (AC) is a potentially malignant disorder of the lips. Because of its heterogeneous clinicalaspect, it is difficult to indicate representative biopsy area. The purpose of this study was to evaluate the usefulnessof tissue autofluorescence in AC diagnosis. The system was composed of a 405-nm light-emitting diode, sent to thesample by a dichroic, that allows the fluorescence signal to reach a camera directly plugged in the system. Fifty-seven patients with clinical diagnosis of AC and 45 normal volunteers were selected. According to clinical andfluorescence features, one or more areas were selected for biopsies in the AC group and epithelial dysplasia (ED)grades were established. The autofluorescence images were processed by a clustering algorithm for AC automateddiagnosis. The tissue autofluorescence image revealed a heterogeneous pattern of loss and increase of fluorescencein patients with AC. ED was found in 93% of the cases, and most of the areas graded as moderate or severe ED werechosen with the aid of autofluorescence. The processed autofluorescence images from AC patients showed a highernumber of spots in an irregular pattern. Tissue autofluorescence image system is a useful technique in associationwith clinical examination for AC diagnosis. © 2013 Society of Photo-Optical Instrumentation Engineers (SPIE) [DOI: 10.1117/1.JBO.18.7
.076023]
Keywords: actinic cheilitis; autofluorescence; epithelial dysplasia; diagnosis.
Paper 130062R received Feb. 1, 2013; revisedmanuscript received Jun. 2, 2013; accepted for publication Jun. 27, 2013; published onlineJul. 25, 2013.
1 IntroductionActinic cheilitis (AC), or solar cheilosis, is a potentially malig-nant disorder that mostly affects the vermilion border of thelower lip.1–4 It usually involves fair-skinned, middle-aged orolder patients with a history of prolonged sun exposure, espe-cially in outdoors workers.5 Some studies have identified theprevalence of AC in some different groups of Brazilian popu-lation, such as Junqueira et al.,6 who found 39% of ACamong agricultural workers; Martins-Filho et al.,7 who found16.7% of AC among farmers in a semi-arid northeastern; andde Souza Lucena et al.,8 who found about 15% of AC amongbeach workers.
The solar ultraviolet (UV) radiation is considered the mainrisk factor for AC and lip squamous cell carcinoma (SCC),9–11
but tobacco has also been associated with these lesions and withAC progression to SCC.11 Lip SCC is one of the most commonmalignancies of the oral cavity11 and almost all lip SCCs areassociated with clinical areas of AC.12,13
AC is a heterogeneous clinical entity that may be localizedor, more commonly, presented as a diffuse lesion, includingatrophy, dryness, scaly areas, swelling, erythema, ulceration,loss of vermilion border definition, transverse fissures, whiteplaques, erosion, crusting, blotchiness, and tissue pallor as themain clinical features.2,3,5,11 Histopathological changes vary fromhyperkeratosis to SCC in the presence of solar elastosis.4,11,13
Epithelial dysplasia (ED), which is still the most important pre-dictor of malignant development,14,15 is described in up to 100%of AC cases.1–3,5 Additionally, although the precise AC malig-nant transformation rate is unknown,4 lip SCC is described tohave a high metastatic potential when compared to skin SCC,turning the assessment of ED degree in AC a critical diagnosisstep.5,11
AC diagnosis is mainly based on demographic, clinical, andhistopathological findings,1–3 but as clinical appearance is some-times subtle and may not correspond to the severity of tissuedamage,1,11,13,16 most authors consider biopsy mandatory toestablish AC definitive diagnosis and treatment planning.2,11
Recurrent ulceration, red and white blotchy areas with loss ofthe vermilion border, persistent crusting, generalized atrophy,and induration are clinical signs that may indicate high-gradeepithelial dysplastic changes or even a malignant transforma-tion.5,11 Nonetheless, due to the fact that AC is characterizedby multifocal and heterogeneous lesions, it is not easy to predictwhich area will exhibit representative histopathological changesto define the biopsy site3 and an SCC may be misdiagnosed ifthe biopsy is not performed at a proper site.13
Some noninvasive clinical methods, such as the tissue auto-fluorescence widefield imaging system, have been reported ascomplementary approaches to discriminate malignant/dysplasticareas from normal tissue.17 Direct tissue fluorescence visualiza-tion or tissue autofluorescence widefield imaging systems arebecoming attractive noninvasive diagnostic tools to identifyoral ED, because they have been used to identify biochemicaland morphological alterations in tissues that are not easily
Address all correspondence to: Ademar Takahama Junior, Fluminense FederalUniversity–Rua Doutor Silvio Henrique Braune, Oral Pathology, School ofDentistry, Nova Friburgo, 22-Centro—CEP: 28625-650, Nova Friburgo, Rio deJaneiro 21550-030, Brazil. Tel: + 55 22 25287168; Fax: + 55 22 25287166;E-mail: [email protected] 0091-3286/2013/$25.00 © 2013 SPIE
Journal of Biomedical Optics 076023-1 July 2013 • Vol. 18(7)
Journal of Biomedical Optics 18(7), 076023 (July 2013)
Downloaded From: http://biomedicaloptics.spiedigitallibrary.org/ on 10/28/2015 Terms of Use: http://spiedigitallibrary.org/ss/TermsOfUse.aspx
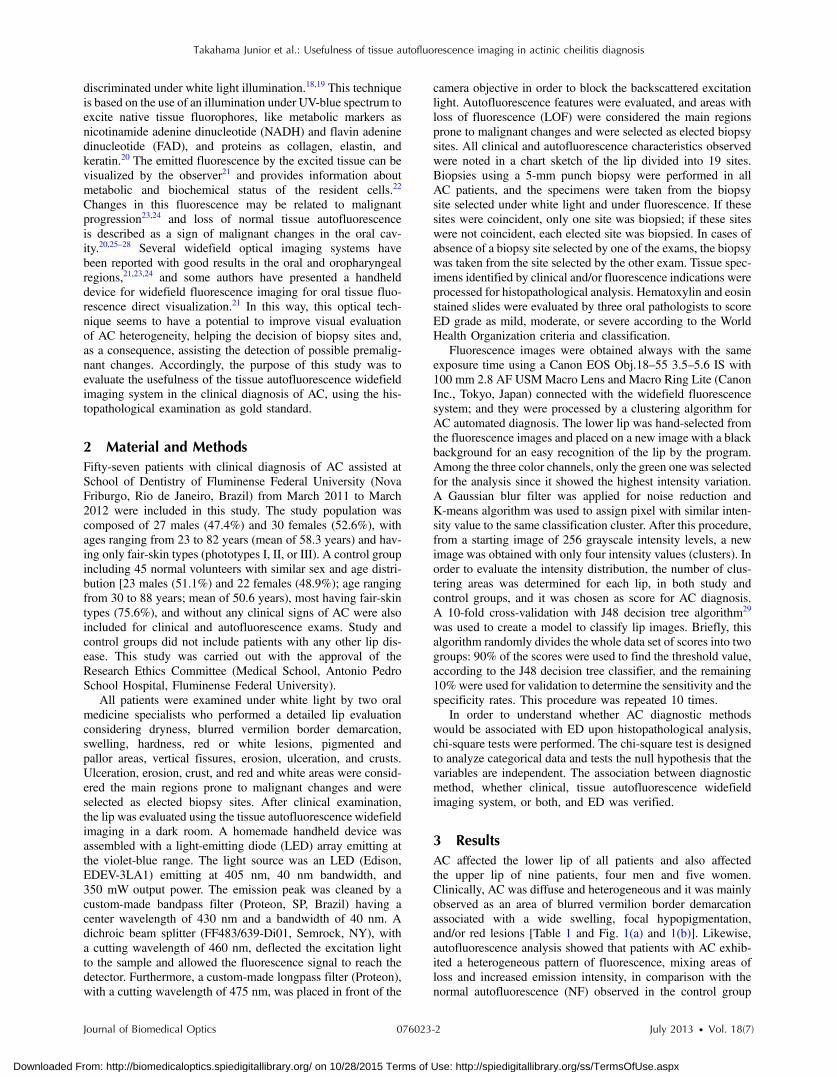
discriminated under white light illumination.18,19 This techniqueis based on the use of an illumination under UV-blue spectrum toexcite native tissue fluorophores, like metabolic markers asnicotinamide adenine dinucleotide (NADH) and flavin adeninedinucleotide (FAD), and proteins as collagen, elastin, andkeratin.20 The emitted fluorescence by the excited tissue can bevisualized by the observer21 and provides information aboutmetabolic and biochemical status of the resident cells.22
Changes in this fluorescence may be related to malignantprogression23,24 and loss of normal tissue autofluorescenceis described as a sign of malignant changes in the oral cav-ity.20,25–28 Several widefield optical imaging systems havebeen reported with good results in the oral and oropharyngealregions,21,23,24 and some authors have presented a handhelddevice for widefield fluorescence imaging for oral tissue fluo-rescence direct visualization.21 In this way, this optical tech-nique seems to have a potential to improve visual evaluationof AC heterogeneity, helping the decision of biopsy sites and,as a consequence, assisting the detection of possible premalig-nant changes. Accordingly, the purpose of this study was toevaluate the usefulness of the tissue autofluorescence widefieldimaging system in the clinical diagnosis of AC, using the his-topathological examination as gold standard.
2 Material and MethodsFifty-seven patients with clinical diagnosis of AC assisted atSchool of Dentistry of Fluminense Federal University (NovaFriburgo, Rio de Janeiro, Brazil) from March 2011 to March2012 were included in this study. The study population wascomposed of 27 males (47.4%) and 30 females (52.6%), withages ranging from 23 to 82 years (mean of 58.3 years) and hav-ing only fair-skin types (phototypes I, II, or III). A control groupincluding 45 normal volunteers with similar sex and age distri-bution [23 males (51.1%) and 22 females (48.9%); age rangingfrom 30 to 88 years; mean of 50.6 years), most having fair-skintypes (75.6%), and without any clinical signs of AC were alsoincluded for clinical and autofluorescence exams. Study andcontrol groups did not include patients with any other lip dis-ease. This study was carried out with the approval of theResearch Ethics Committee (Medical School, Antonio PedroSchool Hospital, Fluminense Federal University).
All patients were examined under white light by two oralmedicine specialists who performed a detailed lip evaluationconsidering dryness, blurred vermilion border demarcation,swelling, hardness, red or white lesions, pigmented andpallor areas, vertical fissures, erosion, ulceration, and crusts.Ulceration, erosion, crust, and red and white areas were consid-ered the main regions prone to malignant changes and wereselected as elected biopsy sites. After clinical examination,the lip was evaluated using the tissue autofluorescence widefieldimaging in a dark room. A homemade handheld device wasassembled with a light-emitting diode (LED) array emitting atthe violet-blue range. The light source was an LED (Edison,EDEV-3LA1) emitting at 405 nm, 40 nm bandwidth, and350 mW output power. The emission peak was cleaned by acustom-made bandpass filter (Proteon, SP, Brazil) having acenter wavelength of 430 nm and a bandwidth of 40 nm. Adichroic beam splitter (FF483/639-Di01, Semrock, NY), witha cutting wavelength of 460 nm, deflected the excitation lightto the sample and allowed the fluorescence signal to reach thedetector. Furthermore, a custom-made longpass filter (Proteon),with a cutting wavelength of 475 nm, was placed in front of the
camera objective in order to block the backscattered excitationlight. Autofluorescence features were evaluated, and areas withloss of fluorescence (LOF) were considered the main regionsprone to malignant changes and were selected as elected biopsysites. All clinical and autofluorescence characteristics observedwere noted in a chart sketch of the lip divided into 19 sites.Biopsies using a 5-mm punch biopsy were performed in allAC patients, and the specimens were taken from the biopsysite selected under white light and under fluorescence. If thesesites were coincident, only one site was biopsied; if these siteswere not coincident, each elected site was biopsied. In cases ofabsence of a biopsy site selected by one of the exams, the biopsywas taken from the site selected by the other exam. Tissue spec-imens identified by clinical and/or fluorescence indications wereprocessed for histopathological analysis. Hematoxylin and eosinstained slides were evaluated by three oral pathologists to scoreED grade as mild, moderate, or severe according to the WorldHealth Organization criteria and classification.
Fluorescence images were obtained always with the sameexposure time using a Canon EOS Obj.18–55 3.5–5.6 IS with100 mm 2.8 AF USMMacro Lens and Macro Ring Lite (CanonInc., Tokyo, Japan) connected with the widefield fluorescencesystem; and they were processed by a clustering algorithm forAC automated diagnosis. The lower lip was hand-selected fromthe fluorescence images and placed on a new image with a blackbackground for an easy recognition of the lip by the program.Among the three color channels, only the green one was selectedfor the analysis since it showed the highest intensity variation.A Gaussian blur filter was applied for noise reduction andK-means algorithm was used to assign pixel with similar inten-sity value to the same classification cluster. After this procedure,from a starting image of 256 grayscale intensity levels, a newimage was obtained with only four intensity values (clusters). Inorder to evaluate the intensity distribution, the number of clus-tering areas was determined for each lip, in both study andcontrol groups, and it was chosen as score for AC diagnosis.A 10-fold cross-validation with J48 decision tree algorithm29
was used to create a model to classify lip images. Briefly, thisalgorithm randomly divides the whole data set of scores into twogroups: 90% of the scores were used to find the threshold value,according to the J48 decision tree classifier, and the remaining10%were used for validation to determine the sensitivity and thespecificity rates. This procedure was repeated 10 times.
In order to understand whether AC diagnostic methodswould be associated with ED upon histopathological analysis,chi-square tests were performed. The chi-square test is designedto analyze categorical data and tests the null hypothesis that thevariables are independent. The association between diagnosticmethod, whether clinical, tissue autofluorescence widefieldimaging system, or both, and ED was verified.
3 ResultsAC affected the lower lip of all patients and also affectedthe upper lip of nine patients, four men and five women.Clinically, AC was diffuse and heterogeneous and it was mainlyobserved as an area of blurred vermilion border demarcationassociated with a wide swelling, focal hypopigmentation,and/or red lesions [Table 1 and Fig. 1(a) and 1(b)]. Likewise,autofluorescence analysis showed that patients with AC exhib-ited a heterogeneous pattern of fluorescence, mixing areas ofloss and increased emission intensity, in comparison with thenormal autofluorescence (NF) observed in the control group
Journal of Biomedical Optics 076023-2 July 2013 • Vol. 18(7)
Takahama Junior et al.: Usefulness of tissue autofluorescence imaging in actinic cheilitis diagnosis
Downloaded From: http://biomedicaloptics.spiedigitallibrary.org/ on 10/28/2015 Terms of Use: http://spiedigitallibrary.org/ss/TermsOfUse.aspx
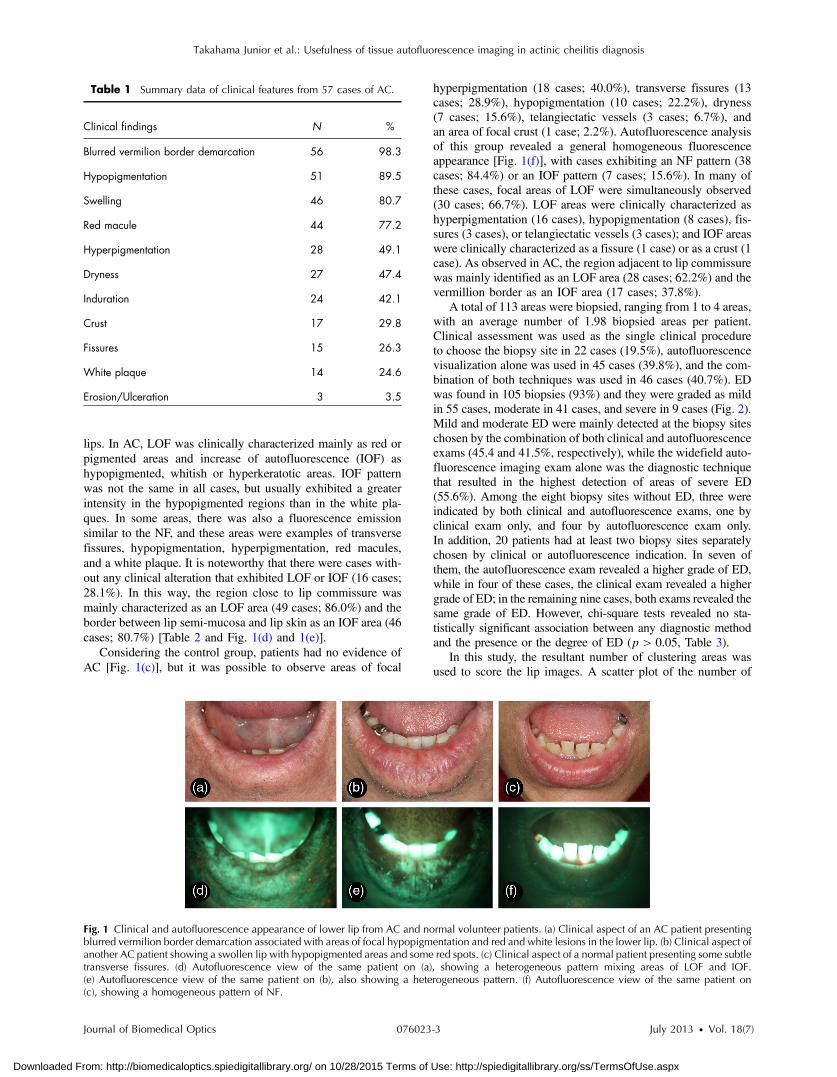
lips. In AC, LOF was clinically characterized mainly as red orpigmented areas and increase of autofluorescence (IOF) ashypopigmented, whitish or hyperkeratotic areas. IOF patternwas not the same in all cases, but usually exhibited a greaterintensity in the hypopigmented regions than in the white pla-ques. In some areas, there was also a fluorescence emissionsimilar to the NF, and these areas were examples of transversefissures, hypopigmentation, hyperpigmentation, red macules,and a white plaque. It is noteworthy that there were cases with-out any clinical alteration that exhibited LOF or IOF (16 cases;28.1%). In this way, the region close to lip commissure wasmainly characterized as an LOF area (49 cases; 86.0%) and theborder between lip semi-mucosa and lip skin as an IOF area (46cases; 80.7%) [Table 2 and Fig. 1(d) and 1(e)].
Considering the control group, patients had no evidence ofAC [Fig. 1(c)], but it was possible to observe areas of focal
hyperpigmentation (18 cases; 40.0%), transverse fissures (13cases; 28.9%), hypopigmentation (10 cases; 22.2%), dryness(7 cases; 15.6%), telangiectatic vessels (3 cases; 6.7%), andan area of focal crust (1 case; 2.2%). Autofluorescence analysisof this group revealed a general homogeneous fluorescenceappearance [Fig. 1(f)], with cases exhibiting an NF pattern (38cases; 84.4%) or an IOF pattern (7 cases; 15.6%). In many ofthese cases, focal areas of LOF were simultaneously observed(30 cases; 66.7%). LOF areas were clinically characterized ashyperpigmentation (16 cases), hypopigmentation (8 cases), fis-sures (3 cases), or telangiectatic vessels (3 cases); and IOF areaswere clinically characterized as a fissure (1 case) or as a crust (1case). As observed in AC, the region adjacent to lip commissurewas mainly identified as an LOF area (28 cases; 62.2%) and thevermillion border as an IOF area (17 cases; 37.8%).
A total of 113 areas were biopsied, ranging from 1 to 4 areas,with an average number of 1.98 biopsied areas per patient.Clinical assessment was used as the single clinical procedureto choose the biopsy site in 22 cases (19.5%), autofluorescencevisualization alone was used in 45 cases (39.8%), and the com-bination of both techniques was used in 46 cases (40.7%). EDwas found in 105 biopsies (93%) and they were graded as mildin 55 cases, moderate in 41 cases, and severe in 9 cases (Fig. 2).Mild and moderate ED were mainly detected at the biopsy siteschosen by the combination of both clinical and autofluorescenceexams (45.4 and 41.5%, respectively), while the widefield auto-fluorescence imaging exam alone was the diagnostic techniquethat resulted in the highest detection of areas of severe ED(55.6%). Among the eight biopsy sites without ED, three wereindicated by both clinical and autofluorescence exams, one byclinical exam only, and four by autofluorescence exam only.In addition, 20 patients had at least two biopsy sites separatelychosen by clinical or autofluorescence indication. In seven ofthem, the autofluorescence exam revealed a higher grade of ED,while in four of these cases, the clinical exam revealed a highergrade of ED; in the remaining nine cases, both exams revealed thesame grade of ED. However, chi-square tests revealed no sta-tistically significant association between any diagnostic methodand the presence or the degree of ED (p > 0.05, Table 3).
In this study, the resultant number of clustering areas wasused to score the lip images. A scatter plot of the number of
Table 1 Summary data of clinical features from 57 cases of AC.
Clinical findings N %
Blurred vermilion border demarcation 56 98.3
Hypopigmentation 51 89.5
Swelling 46 80.7
Red macule 44 77.2
Hyperpigmentation 28 49.1
Dryness 27 47.4
Induration 24 42.1
Crust 17 29.8
Fissures 15 26.3
White plaque 14 24.6
Erosion/Ulceration 3 3.5
Fig. 1 Clinical and autofluorescence appearance of lower lip from AC and normal volunteer patients. (a) Clinical aspect of an AC patient presentingblurred vermilion border demarcation associated with areas of focal hypopigmentation and red and white lesions in the lower lip. (b) Clinical aspect ofanother AC patient showing a swollen lip with hypopigmented areas and some red spots. (c) Clinical aspect of a normal patient presenting some subtletransverse fissures. (d) Autofluorescence view of the same patient on (a), showing a heterogeneous pattern mixing areas of LOF and IOF.(e) Autofluorescence view of the same patient on (b), also showing a heterogeneous pattern. (f) Autofluorescence view of the same patient on(c), showing a homogeneous pattern of NF.
Journal of Biomedical Optics 076023-3 July 2013 • Vol. 18(7)
Takahama Junior et al.: Usefulness of tissue autofluorescence imaging in actinic cheilitis diagnosis
Downloaded From: http://biomedicaloptics.spiedigitallibrary.org/ on 10/28/2015 Terms of Use: http://spiedigitallibrary.org/ss/TermsOfUse.aspx
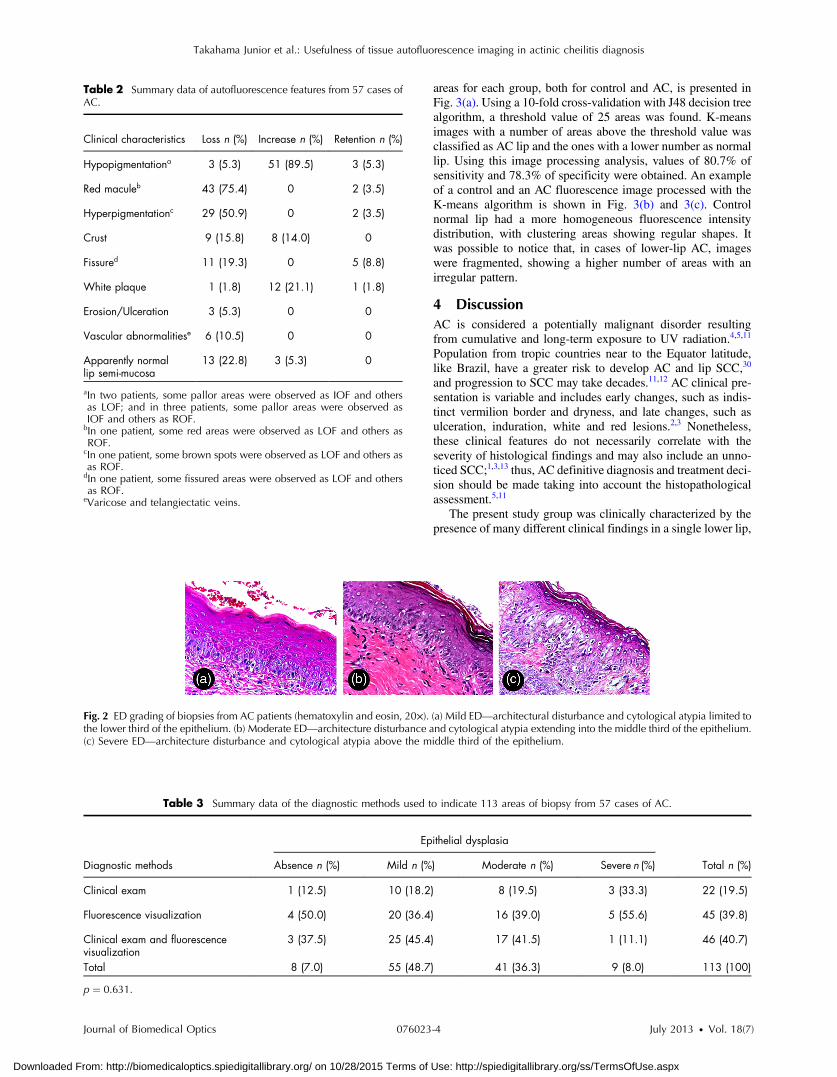
areas for each group, both for control and AC, is presented inFig. 3(a). Using a 10-fold cross-validation with J48 decision treealgorithm, a threshold value of 25 areas was found. K-meansimages with a number of areas above the threshold value wasclassified as AC lip and the ones with a lower number as normallip. Using this image processing analysis, values of 80.7% ofsensitivity and 78.3% of specificity were obtained. An exampleof a control and an AC fluorescence image processed with theK-means algorithm is shown in Fig. 3(b) and 3(c). Controlnormal lip had a more homogeneous fluorescence intensitydistribution, with clustering areas showing regular shapes. Itwas possible to notice that, in cases of lower-lip AC, imageswere fragmented, showing a higher number of areas with anirregular pattern.
4 DiscussionAC is considered a potentially malignant disorder resultingfrom cumulative and long-term exposure to UV radiation.4,5,11
Population from tropic countries near to the Equator latitude,like Brazil, have a greater risk to develop AC and lip SCC,30
and progression to SCC may take decades.11,12 AC clinical pre-sentation is variable and includes early changes, such as indis-tinct vermilion border and dryness, and late changes, such asulceration, induration, white and red lesions.2,3 Nonetheless,these clinical features do not necessarily correlate with theseverity of histological findings and may also include an unno-ticed SCC;1,3,13 thus, AC definitive diagnosis and treatment deci-sion should be made taking into account the histopathologicalassessment.5,11
The present study group was clinically characterized by thepresence of many different clinical findings in a single lower lip,
Table 2 Summary data of autofluorescence features from 57 cases ofAC.
Clinical characteristics Loss n (%) Increase n (%) Retention n (%)
Hypopigmentationa 3 (5.3) 51 (89.5) 3 (5.3)
Red maculeb 43 (75.4) 0 2 (3.5)
Hyperpigmentationc 29 (50.9) 0 2 (3.5)
Crust 9 (15.8) 8 (14.0) 0
Fissured 11 (19.3) 0 5 (8.8)
White plaque 1 (1.8) 12 (21.1) 1 (1.8)
Erosion/Ulceration 3 (5.3) 0 0
Vascular abnormalitiese 6 (10.5) 0 0
Apparently normallip semi-mucosa
13 (22.8) 3 (5.3) 0
aIn two patients, some pallor areas were observed as IOF and othersas LOF; and in three patients, some pallor areas were observed asIOF and others as ROF.bIn one patient, some red areas were observed as LOF and others asROF.
cIn one patient, some brown spots were observed as LOF and others asas ROF.dIn one patient, some fissured areas were observed as LOF and othersas ROF.
eVaricose and telangiectatic veins.
Fig. 2 ED grading of biopsies from AC patients (hematoxylin and eosin, 20×). (a) Mild ED—architectural disturbance and cytological atypia limited tothe lower third of the epithelium. (b) Moderate ED—architecture disturbance and cytological atypia extending into the middle third of the epithelium.(c) Severe ED—architecture disturbance and cytological atypia above the middle third of the epithelium.
Table 3 Summary data of the diagnostic methods used to indicate 113 areas of biopsy from 57 cases of AC.
Diagnostic methods
Epithelial dysplasia
Total n (%)Absence n (%) Mild n (%) Moderate n (%) Severe n (%)
Clinical exam 1 (12.5) 10 (18.2) 8 (19.5) 3 (33.3) 22 (19.5)
Fluorescence visualization 4 (50.0) 20 (36.4) 16 (39.0) 5 (55.6) 45 (39.8)
Clinical exam and fluorescencevisualization
3 (37.5) 25 (45.4) 17 (41.5) 1 (11.1) 46 (40.7)
Total 8 (7.0) 55 (48.7) 41 (36.3) 9 (8.0) 113 (100)
p ¼ 0.631.
Journal of Biomedical Optics 076023-4 July 2013 • Vol. 18(7)
Takahama Junior et al.: Usefulness of tissue autofluorescence imaging in actinic cheilitis diagnosis
Downloaded From: http://biomedicaloptics.spiedigitallibrary.org/ on 10/28/2015 Terms of Use: http://spiedigitallibrary.org/ss/TermsOfUse.aspx
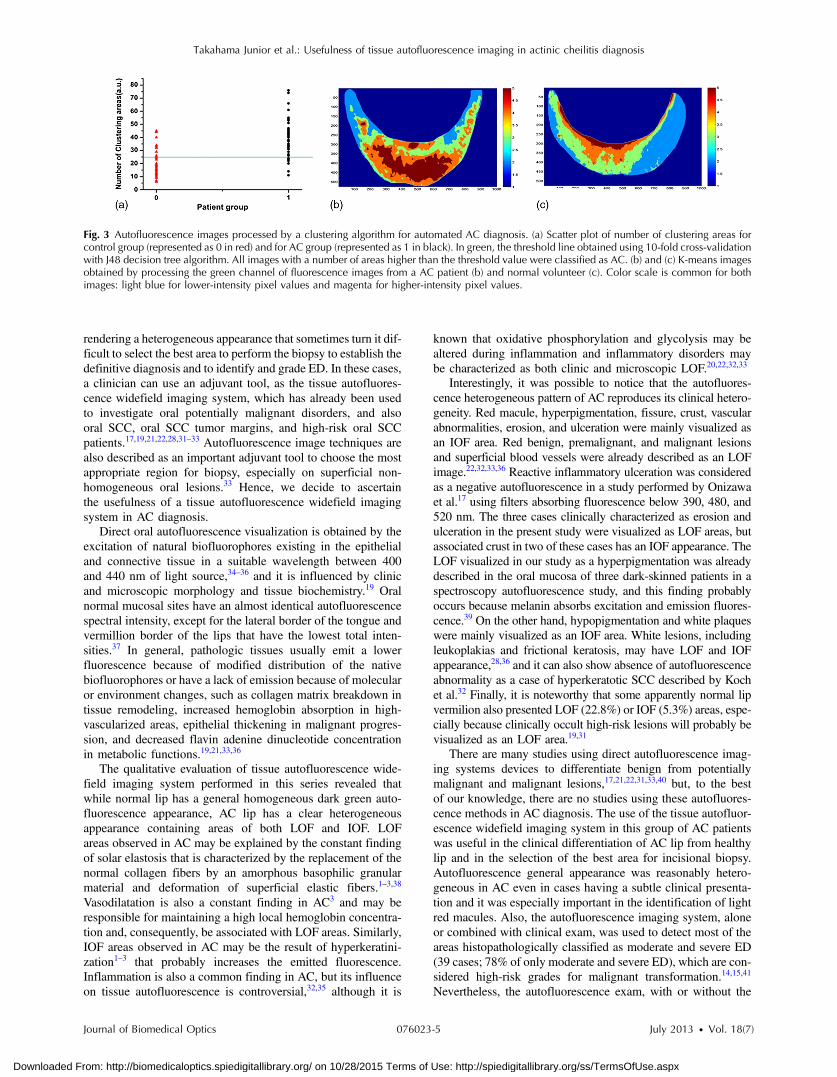
rendering a heterogeneous appearance that sometimes turn it dif-ficult to select the best area to perform the biopsy to establish thedefinitive diagnosis and to identify and grade ED. In these cases,a clinician can use an adjuvant tool, as the tissue autofluores-cence widefield imaging system, which has already been usedto investigate oral potentially malignant disorders, and alsooral SCC, oral SCC tumor margins, and high-risk oral SCCpatients.17,19,21,22,28,31–33 Autofluorescence image techniques arealso described as an important adjuvant tool to choose the mostappropriate region for biopsy, especially on superficial non-homogeneous oral lesions.33 Hence, we decide to ascertainthe usefulness of a tissue autofluorescence widefield imagingsystem in AC diagnosis.
Direct oral autofluorescence visualization is obtained by theexcitation of natural biofluorophores existing in the epithelialand connective tissue in a suitable wavelength between 400and 440 nm of light source,34–36 and it is influenced by clinicand microscopic morphology and tissue biochemistry.19 Oralnormal mucosal sites have an almost identical autofluorescencespectral intensity, except for the lateral border of the tongue andvermillion border of the lips that have the lowest total inten-sities.37 In general, pathologic tissues usually emit a lowerfluorescence because of modified distribution of the nativebiofluorophores or have a lack of emission because of molecularor environment changes, such as collagen matrix breakdown intissue remodeling, increased hemoglobin absorption in high-vascularized areas, epithelial thickening in malignant progres-sion, and decreased flavin adenine dinucleotide concentrationin metabolic functions.19,21,33,36
The qualitative evaluation of tissue autofluorescence wide-field imaging system performed in this series revealed thatwhile normal lip has a general homogeneous dark green auto-fluorescence appearance, AC lip has a clear heterogeneousappearance containing areas of both LOF and IOF. LOFareas observed in AC may be explained by the constant findingof solar elastosis that is characterized by the replacement of thenormal collagen fibers by an amorphous basophilic granularmaterial and deformation of superficial elastic fibers.1–3,38
Vasodilatation is also a constant finding in AC3 and may beresponsible for maintaining a high local hemoglobin concentra-tion and, consequently, be associated with LOF areas. Similarly,IOF areas observed in AC may be the result of hyperkeratini-zation1–3 that probably increases the emitted fluorescence.Inflammation is also a common finding in AC, but its influenceon tissue autofluorescence is controversial,32,35 although it is
known that oxidative phosphorylation and glycolysis may bealtered during inflammation and inflammatory disorders maybe characterized as both clinic and microscopic LOF.20,22,32,33
Interestingly, it was possible to notice that the autofluores-cence heterogeneous pattern of AC reproduces its clinical hetero-geneity. Red macule, hyperpigmentation, fissure, crust, vascularabnormalities, erosion, and ulceration were mainly visualized asan IOF area. Red benign, premalignant, and malignant lesionsand superficial blood vessels were already described as an LOFimage.22,32,33,36 Reactive inflammatory ulceration was consideredas a negative autofluorescence in a study performed by Onizawaet al.17 using filters absorbing fluorescence below 390, 480, and520 nm. The three cases clinically characterized as erosion andulceration in the present study were visualized as LOF areas, butassociated crust in two of these cases has an IOF appearance. TheLOF visualized in our study as a hyperpigmentation was alreadydescribed in the oral mucosa of three dark-skinned patients in aspectroscopy autofluorescence study, and this finding probablyoccurs because melanin absorbs excitation and emission fluores-cence.39 On the other hand, hypopigmentation and white plaqueswere mainly visualized as an IOF area. White lesions, includingleukoplakias and frictional keratosis, may have LOF and IOFappearance,28,36 and it can also show absence of autofluorescenceabnormality as a case of hyperkeratotic SCC described by Kochet al.32 Finally, it is noteworthy that some apparently normal lipvermilion also presented LOF (22.8%) or IOF (5.3%) areas, espe-cially because clinically occult high-risk lesions will probably bevisualized as an LOF area.19,31
There are many studies using direct autofluorescence imag-ing systems devices to differentiate benign from potentiallymalignant and malignant lesions,17,21,22,31,33,40 but, to the bestof our knowledge, there are no studies using these autofluores-cence methods in AC diagnosis. The use of the tissue autofluor-escence widefield imaging system in this group of AC patientswas useful in the clinical differentiation of AC lip from healthylip and in the selection of the best area for incisional biopsy.Autofluorescence general appearance was reasonably hetero-geneous in AC even in cases having a subtle clinical presenta-tion and it was especially important in the identification of lightred macules. Also, the autofluorescence imaging system, aloneor combined with clinical exam, was used to detect most of theareas histopathologically classified as moderate and severe ED(39 cases; 78% of only moderate and severe ED), which are con-sidered high-risk grades for malignant transformation.14,15,41
Nevertheless, the autofluorescence exam, with or without the
Fig. 3 Autofluorescence images processed by a clustering algorithm for automated AC diagnosis. (a) Scatter plot of number of clustering areas forcontrol group (represented as 0 in red) and for AC group (represented as 1 in black). In green, the threshold line obtained using 10-fold cross-validationwith J48 decision tree algorithm. All images with a number of areas higher than the threshold value were classified as AC. (b) and (c) K-means imagesobtained by processing the green channel of fluorescence images from a AC patient (b) and normal volunteer (c). Color scale is common for bothimages: light blue for lower-intensity pixel values and magenta for higher-intensity pixel values.
Journal of Biomedical Optics 076023-5 July 2013 • Vol. 18(7)
Takahama Junior et al.: Usefulness of tissue autofluorescence imaging in actinic cheilitis diagnosis
Downloaded From: http://biomedicaloptics.spiedigitallibrary.org/ on 10/28/2015 Terms of Use: http://spiedigitallibrary.org/ss/TermsOfUse.aspx
use of clinical exam in the diagnostic approach, indicates mostcases with mild or no ED (52 cases; 82.5%). The aforemen-tioned findings reinforce the impression that this device maybe helpful in confirming the diagnosis of premalignant andmalignant conditions, but it is not helpful in discriminatinglow-risk lesions from high-risk lesions without the clinical inter-pretation.21,22,28,32,33,36 Yet, the value of this technology isremarkable in cases of apparently normal mucosa or semi-mucosa having an LOF appearance in patients with AC andother potentially malignant disorders or a previous history oforal cancer.19,22,28,31
Promising results were obtained by this study for an opera-tor-independent classification by means of an automatedalgorithm. Using K-means clustering algorithm, fluorescenceimages were processed, improving the discrimination of theheterogeneous fluorescence of AC patients. Due to the inherentcurvature of the lower lip, the central part of the illuminated areareceived a higher excitation intensity, resulting, in general, in ahigher fluorescence intensity in this region and a lower resolu-tion contrast at the image borders. Even with this nonuniformillumination condition, present in all cases of normal and AClips, the proposed image processing showed relevant results.The heterogeneous fluorescence intensity distribution was themain feature observed in AC lips; so a threshold value of num-ber of clustering areas was defined in this diagnostic algorithm.Misclassified lips showed, in the clinical assessment, hyperpig-mentation, ulceration, and dryness. These false results reinforcethe fact that fluorescence imaging is an auxiliary diagnostic tooland does not replace clinical examination. Tissue autofluores-cence visualization presents additional information for theclinician to improve diagnostic resolution, as also stated bysome authors when reporting that LOF is not useful in diagnos-ing premalignant and malignant conditions if the associatedclinical interpretation is not performed with caution.22,33
The values of sensitivity and specificity for the tissue auto-fluorescence imaging system in the identification of oral dys-plastic or malignant lesions vary in the literature. Studiesevaluating patients at risk for oral cancer revealed sensitivityvalues varying from 98 to 100% and specificity values varyingfrom 80.8 to 100% when discriminating normal mucosa andbenign lesion from ED and cancer,21,28,33 but these values varyfrom 30 to 84% of sensitivity and from 15.3 to 63% of speci-ficity in the identification of ED.22,36 A study using the auto-fluorescence imaging system coupled with an objectiveimaging analysis, similar to the present study, found 100% ofsensitivity and 91.4% of specificity in the discrimination ofnormal tissue from ED and malignancy.40 Our results of 80.7%sensitivity and 78.3% specificity show the potential of autofluor-escence imaging as an auxiliary tool to discriminate AC in lowerlip. This lower diagnostic resolution was already expected, sincethe AC tissue condition is more similar to the normal tissue, thanthe alterations observed at a carcinoma. In addition, as thepresent results showed, even a normal lip may present clinicalvariations, such as areas of hyperpigmentation, fissures, hypo-pigmentation, dryness, and punctiform red spots. Therefore, theautofluorescence from an AC lip will not be as distinct as theone from a normal lip, when compared to the autofluorescenceseen in an SCC lip. The use of more complex algorithms andthe addition of other fluorescence features may result in highersensitivity and specificity.
Tissue autofluorescence widefield imaging system seems tobe a valuable technique for assisting AC diagnosis, mainly in the
identification of suspicious areas for incisional biopsy. However,it does not substitute clinical examination because LOF mayrepresent benign variations that do not indicate a propensityto malignant development. As a result, the association of theautofluorescence technique with the physical exam may contrib-ute to enhance our naked eye visualization in the identificationof potentially malignant changes in this clinically heterogeneouslesion.
AcknowledgmentsWe would like to thank Fundação Carlos Chagas Filho deAmparo à Pesquisa do Estado do Rio de Janeiro (FAPERJ),Fundação de Amparo à Pesquisa do Estado de São Paulo(FAPESP), and Conselho Nacional de DesenvolvimentoCientífico e Tecnológico (CNPq) for the financial support.
References1. G. E. Kaugars et al., “Actinic cheilitis: a review of 152 cases,” Oral
Surg. Oral Med. Oral Pathol. Oral Radiol. Endod. 88(2), 181–186(1999).
2. A. Markopoulos, E. Albanidou-Farmaki, and I. Kayavis, “Actiniccheilitis: clinical and pathologic characteristics in 65 cases,” Oral Dis.10(4), 212–216 (2004).
3. A. S. R. Cavalcante, A. L. Anbinder, and Y. R. Carvalho, “Actiniccheilitis: clinical and histological features,” J. Oral Maxillofac. Surg.66(3), 498–503 (2008).
4. I. van der Waal, “Potentially malignant disorders of the oral and oro-pharyngeal mucosa; terminology, classification and present conceptsof management,” Oral Oncol. 45(4–5), 317–323 (2009).
5. N. W. Savage, C. McKay, and C. Faulkner, “Actinic cheilitis in dentalpractice,” Australian Dental J. 55(Suppl 1), 78–84 (2010).
6. J. L. Junqueira et al., “Actinic cheilitis among agricultural workers inCampinas, Brazil,” Community Dent. Health 28(1), 60–63 (2011).
7. P. R. Martins-Filho, L. C. Da Silva, and M. R. Piva, “The prevalence ofactinic cheilitis in farmers in a semi-arid northeastern region of Brazil,”Int. J. Dermatol. 50(9) 1109–1114 (2011).
8. E. E. de Souza Lucena et al., “Prevalence and factors associated toactinic cheilitis in beach workers,” Oral Dis. 18(6), 575–579 (2012).
9. D. D. Picascia and J. K. Robinson, “Actinic cheilitis: a review of theetiology, differential diagnosis, and treatment,” J. Am. Acad. Dermatol.17(2 Pt 1), 255–264 (1987).
10. J. G. de Visscher and I. van der Waal, “Etiology of cancer of the lip.A review,” Int. J. Oral Maxillofac. Surg. 27(3), 199–203 (1998).
11. Y. T. Jadotte and R. A. Schwartz, “Solar cheilosis: an ominous precur-sor: part I. Diagnostic insights,” J. Am. Acad. Dermatol. 66(2), 173–184(2012).
12. J. H. Main and M. Pavone, “Actinic cheilitis and carcinoma of the lip,”J. Can. Dent. Assoc. 60(2), 113–116 (1994).
13. M. M. S. Nico, E. A. Rivitti, and S. V. Lourenco, “Actinic cheilitis:histologic study of the entire vermilion and comparison with previousbiopsy,” J. Cutan. Pathol. 34(4), 309–314 (2007).
14. P. M. Speight, “Update on oral epithelial dysplasia and progressionto cancer,” Head Neck Pathol. 1(1), 61–66 (2007).
15. S. Warnakulasuriya et al., “Oral epithelial dysplasia classification sys-tems: predictive value, utility, weaknesses and scope for improvement,”J. Oral Pathol. Med. 37(3), 127–133 (2008).
16. F. C. Xavier et al., “WNT-5A, but not matrix metalloproteinase 3 orbeta-catenin protein, expression is related to early stages of lip carcino-genesis,” J. Oral Pathol. Med. 38(9), 708–715 (2009).
17. K. Onizawa et al., “Usefulness of fluorescence photography for diag-nosis of oral cancer,” Int. J. Oral Maxillofac. Surg. 28(3), 206–210(1999).
18. W. H. Westra and D. Sidransky, “Fluorescence visualization in oralneoplasia: shedding light on an old problem,” Clin. Cancer Res.12(22), 6594–6597 (2006).
19. C. F. Poh et al., “Direct fluorescence visualization of clinically occulthigh-risk oral premalignant disease using a simple hand-held device,”Head Neck 29(1), 71–76 (2007).
Journal of Biomedical Optics 076023-6 July 2013 • Vol. 18(7)
Takahama Junior et al.: Usefulness of tissue autofluorescence imaging in actinic cheilitis diagnosis
Downloaded From: http://biomedicaloptics.spiedigitallibrary.org/ on 10/28/2015 Terms of Use: http://spiedigitallibrary.org/ss/TermsOfUse.aspx
20. I. Pavlova et al., “Understanding the biological basis of autofluorescenceimaging for oral cancer detection: high-resolution fluorescence micros-copy in viable tissue,” Clin. Cancer Res. 14(8), 2396–2404 (2008).
21. P. Lane et al., “Simple device for the direct visualization of oral cavitytissue fluorescence,” J. Biomed. Opt. 11(2), 024006 (2006).
22. C. S. Farah et al., “Efficacy of tissue autofluorescence imaging(VELScope) in the visualization of oral mucosal lesions,” HeadNeck 34(6), 856–862 (2012).
23. D. C. de Veld et al., “The status of in vivo autofluorescence spectros-copy and imaging for oral oncology,” Oral Oncol. 41(2), 117–131(2005).
24. D. Roblyer et al., “Multispectral optical imaging device for in vivodetection of oral neoplasia,” J. Biomed. Opt. 13(2), 024019 (2008).
25. S. P. Schantz et al., “In vivo native cellular fluorescence and histologicalcharacteristics of head and neck cancer,” Clin. Cancer Res. 4(5),1177–1182 (1998).
26. A. Gillenwater et al., “Noninvasive diagnosis of oral neoplasia basedon fluorescence spectroscopy and native tissue autofluorescence,”Arch. Otolaryngol. Head Neck Surg. 124(11), 1251–1258 (1998).
27. N. Ramanujam, “Fluorescence spectroscopy of neoplastic and non-neoplastic tissues,” Neoplasia 2(1–2), 89–117 (2000).
28. A. Moro et al., “Autofluorescence and early detection of mucosallesions in patients at risk for oral cancer,” J. Craniofac. Surg. 21(6),1899–1903 (2010).
29. R. Quinlan, C4.5: Programs for Machine Learning, Morgan KaufmannPublishers, San Mateo, CA (1993).
30. E. Kornevs et al., “5 year experience with lower lip cancer,”Stomatologija 7(3), 95–98 (2005).
31. C. F. Poh et al., “Fluorescence visualization detection of field alterationsin tumor margins of oral cancer patients,” Clin. Cancer Res. 12(22),6716–6722 (2006).
32. F. P. Koch et al., “Effectiveness of autofluorescence to identify suspi-cious oral lesions—a prospective, blinded clinical trial,” Clin. OralInvestig. 15(6), 975–982 (2011).
33. M. Scheer et al., “Autofluorescence imaging of potentially malignantmucosa lesions,” Oral Surg. Oral Med. Oral Pathol. Oral Radiol.Endod. 111(5), 568–577 (2011).
34. C. S. Betz et al., “Autofluorescence imaging and spectroscopy of normaland malignant mucosa in patients with head and neck cancer,” LasersSurg. Med. 25(4), 323–334 (1999).
35. E. Svistun et al., “Vision enhancement system for detection of oral cav-ity neoplasia based on autofluorescence,” Head Neck 26(3), 205–215(2004).
36. K. H. Awan, P. R. Morgan, and S. Warnakulasuriya, “Evaluation of anautofluorescence based imaging system (VELscope™) in the detectionof oral potentially malignant disorders and benign keratosis,”Oral Oncol. 47(4), 274–277 (2011).
37. D. C. de Veld et al., “Autofluorescence characteristics of healthyoral mucosa at different anatomical sites,” Lasers Surg. Med. 32(5),367–376 (2003).
38. S. Imayama et al., “Ultraviolet-B irradiation deforms the configurationof elastic fibers during the induction of actinic elastosis in rats,”J. Dermatol. Sci. 7(1), 32–38 (1994).
39. D. C. de Veld et al., “Effects of individual characteristics on healthyoral mucosa autofluorescence spectra,” Oral Oncol. 40(8), 815–823(2004).
40. D. Roblyer et al., “Objective detection and delineation of oral neoplasiausing autofluorescence imaging,” Cancer Prev. Res. 2(5), 423–431(2009).
41. O. Kujan et al., “Evaluation of a new binary system of grading oralepithelial dysplasia for prediction of malignant transformation,”Oral Oncol. 42(10), 987–993 (2006).
Journal of Biomedical Optics 076023-7 July 2013 • Vol. 18(7)
Takahama Junior et al.: Usefulness of tissue autofluorescence imaging in actinic cheilitis diagnosis
Downloaded From: http://biomedicaloptics.spiedigitallibrary.org/ on 10/28/2015 Terms of Use: http://spiedigitallibrary.org/ss/TermsOfUse.aspx
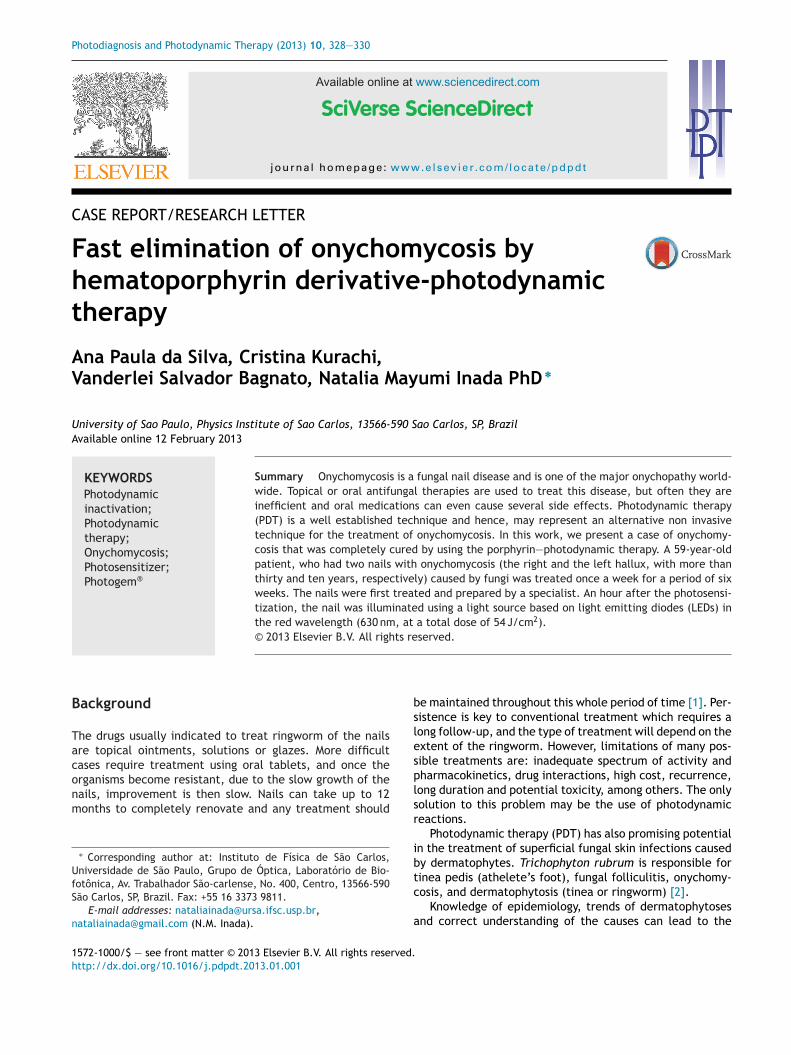
P
C
Fht
AV
UA
B
Taconm
UfS
n
1h
hotodiagnosis and Photodynamic Therapy (2013) 10, 328—330
Available online at www.sciencedirect.com
jo ur nal ho mepage: www.elsev ier .com/ locate /pdpdt
ASE REPORT/RESEARCH LETTER
ast elimination of onychomycosis byematoporphyrin derivative-photodynamicherapy
na Paula da Silva, Cristina Kurachi,anderlei Salvador Bagnato, Natalia Mayumi Inada PhD ∗
niversity of Sao Paulo, Physics Institute of Sao Carlos, 13566-590 Sao Carlos, SP, Brazilvailable online 12 February 2013
KEYWORDSPhotodynamicinactivation;Photodynamictherapy;Onychomycosis;
Summary Onychomycosis is a fungal nail disease and is one of the major onychopathy world-wide. Topical or oral antifungal therapies are used to treat this disease, but often they areinefficient and oral medications can even cause several side effects. Photodynamic therapy(PDT) is a well established technique and hence, may represent an alternative non invasivetechnique for the treatment of onychomycosis. In this work, we present a case of onychomy-cosis that was completely cured by using the porphyrin—photodynamic therapy. A 59-year-oldpatient, who had two nails with onychomycosis (the right and the left hallux, with more than
Photosensitizer;Photogem® thirty and ten years, respectively) caused by fungi was treated once a week for a period of sixweeks. The nails were first treated and prepared by a specialist. An hour after the photosensi-tization, the nail was illuminated using a light source based on light emitting diodes (LEDs) inthe red wavelength (630 nm, at a total dose of 54 J/cm2).© 2013 Elsevier B.V. All rights reserved.
bsles
ackground
he drugs usually indicated to treat ringworm of the nailsre topical ointments, solutions or glazes. More difficultases require treatment using oral tablets, and once the
rganisms become resistant, due to the slow growth of theails, improvement is then slow. Nails can take up to 12onths to completely renovate and any treatment should∗ Corresponding author at: Instituto de Física de São Carlos,niversidade de São Paulo, Grupo de Óptica, Laboratório de Bio-otônica, Av. Trabalhador São-carlense, No. 400, Centro, 13566-590ão Carlos, SP, Brazil. Fax: +55 16 3373 9811.
E-mail addresses: [email protected],[email protected] (N.M. Inada).
plsr
ibtc
a
572-1000/$ — see front matter © 2013 Elsevier B.V. All rights reserved.ttp://dx.doi.org/10.1016/j.pdpdt.2013.01.001
e maintained throughout this whole period of time [1]. Per-istence is key to conventional treatment which requires aong follow-up, and the type of treatment will depend on thextent of the ringworm. However, limitations of many pos-ible treatments are: inadequate spectrum of activity andharmacokinetics, drug interactions, high cost, recurrence,ong duration and potential toxicity, among others. The onlyolution to this problem may be the use of photodynamiceactions.
Photodynamic therapy (PDT) has also promising potentialn the treatment of superficial fungal skin infections causedy dermatophytes. Trichophyton rubrum is responsible for
inea pedis (athelete’s foot), fungal folliculitis, onychomy-osis, and dermatophytosis (tinea or ringworm) [2].Knowledge of epidemiology, trends of dermatophytosesnd correct understanding of the causes can lead to the
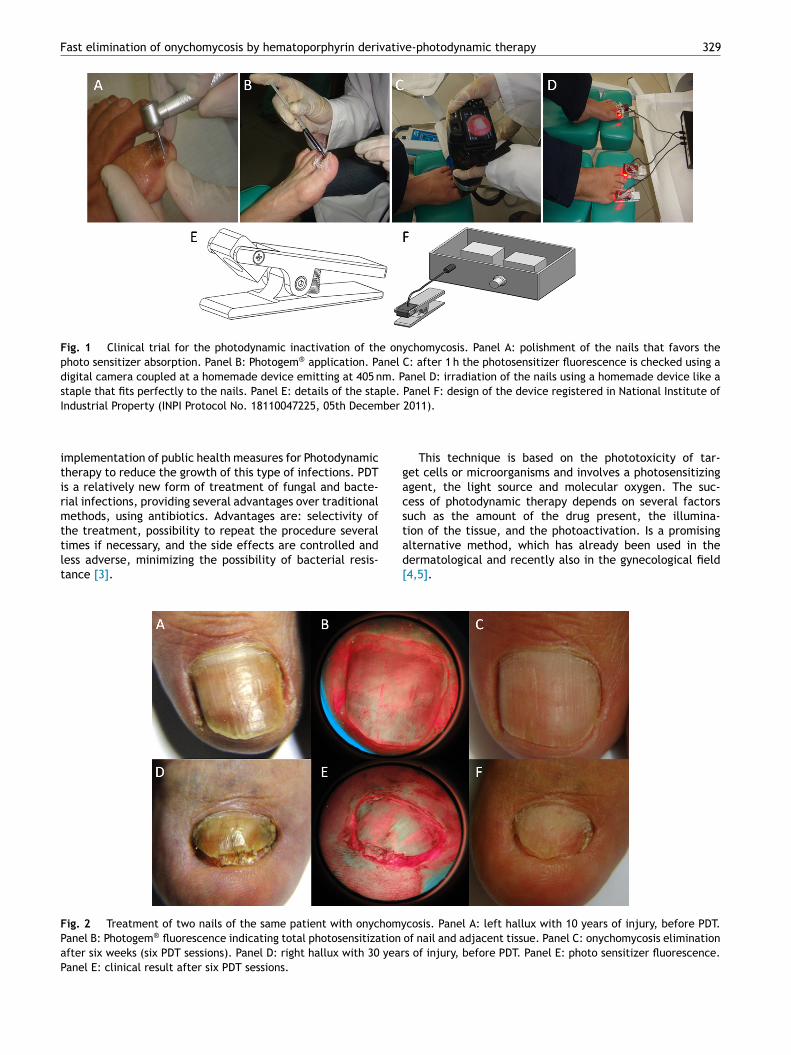
Fast elimination of onychomycosis by hematoporphyrin derivative-photodynamic therapy 329
Fig. 1 Clinical trial for the photodynamic inactivation of the onychomycosis. Panel A: polishment of the nails that favors thephoto sensitizer absorption. Panel B: Photogem® application. Panel C: after 1 h the photosensitizer fluorescence is checked using adigital camera coupled at a homemade device emitting at 405 nm. Panel D: irradiation of the nails using a homemade device like astaple that fits perfectly to the nails. Panel E: details of the staple. Panel F: design of the device registered in National Institute of
ber
gacs
Industrial Property (INPI Protocol No. 18110047225, 05th Decem
implementation of public health measures for Photodynamictherapy to reduce the growth of this type of infections. PDTis a relatively new form of treatment of fungal and bacte-rial infections, providing several advantages over traditionalmethods, using antibiotics. Advantages are: selectivity of
the treatment, possibility to repeat the procedure severaltimes if necessary, and the side effects are controlled andless adverse, minimizing the possibility of bacterial resis-tance [3].tad[
Fig. 2 Treatment of two nails of the same patient with onychomyPanel B: Photogem® fluorescence indicating total photosensitization
after six weeks (six PDT sessions). Panel D: right hallux with 30 yearPanel E: clinical result after six PDT sessions.
2011).
This technique is based on the phototoxicity of tar-et cells or microorganisms and involves a photosensitizinggent, the light source and molecular oxygen. The suc-ess of photodynamic therapy depends on several factorsuch as the amount of the drug present, the illumina-
ion of the tissue, and the photoactivation. Is a promisinglternative method, which has already been used in theermatological and recently also in the gynecological field4,5].cosis. Panel A: left hallux with 10 years of injury, before PDT.of nail and adjacent tissue. Panel C: onychomycosis eliminations of injury, before PDT. Panel E: photo sensitizer fluorescence.
3
pCla
C
WwllAa1mcti
amsttchpihca
cTdc
taaif
D
Iudwp9bsam
A
TdCestN
R
[
[
[
[
30
In this study we analyze the efficiency of a hematopor-hyrin derivative compound (Photogem®, Limited Liabilityompany Photogem, Moscow, Russia) applied topically, fol-
owed by PDT using a portable homemade device andnatomic based on LEDs.
ase study
e conducted this study with a patient (male, 59 years old)ith nail diseases caused by fungus. This patient had the
esions for approximately 30 (right hallux) and 10 (left hal-ux) years and was treated with the solution Photogem®.pproval of the University Ethical Committee was obtaineds required (79th Ethics Committee Meeting on November6, 2010). The patient had not responded to oral treat-ent with fluconazole, and was positive for the laboratory
ultures indicating the presence of fungi, has been invitedo participate in this study. The patiente signed a writtennformed consent form.
An emollient solution of 20% urea is applied for 10 min,nd approximately 0.5 mm thick of nails is removed by aicro motor with pneumatic diamond drill. The photosen-
itizer Photogem® (1 ml, 5 mg/ml) was applied topically tohe nails (Fig. 1, panels A and B). After a period of 1 h pro-ected from light the presence of the photosensitizer washecked using a digital camera Sony H50® coupled at otheromemade device based on LEDs emitting at 405 nm (Fig. 1,anel C and Fig. 2, panels B and E). Then the region waslluminated for 9 min (total fluence of 54 J/cm2) using aomemade light source containing one LED each anatomi-ally staple emitting at 630 nm, with an intensity measuredt the nail surface of 100 mW/cm2 (Fig. 1, panels D—F).
Seven days after the illumination, there was a clini-al evaluation to confirm the response to the treatment.he follow-up treatment was done. The process wasocumented using images (photographs weekly clinicalases).
The patient reported no pain, neither during the irradia-ion nor later. The sessions were repeated once a week, with
total of six sessions of PDT. Complete healing was reportedfter an irradiation over six weeks (Fig. 2, panels A—F) andn addition, the microorganism culture indicated negativeor fungi.
[
A.P.d. Silva et al.
iscussion and conclusion
n this work we are presenting a new clinical trialsing porphyrin and a homemade device anatomicallyesigned for the treatment of the onychomycosis. Thisork represents part of a complete research that com-ares two different photosensitizers and involves around0 patients. Other compound photoactivated at 450 nm iseing evaluated and we are working to present the resultsoon. The in vitro studies such as confocal microscopyre ongoing to understand the photodynamic inactivationechanisms.
cknowledgements
his work has been supported by grants from Fundacãoe Amparo à Pesquisa do Estado de São Paulo (FAPESP;EPOF Grant No. 98/14270-8) and Financiadora de Estudos
Projeto FINEP-Gnatus (Grant No. 554339/2010-2). APS wasupported by a Conselho Nacional de Desenvolvimento Cien-ífico e Tecnológico fellowship (CNPq FINEP-Gnatus; Granto. 381132/2010-2).
eferences
1] Gupta AK, Ryder JE, Johnson AM. Cumulative meta-analysisof systemic antifungal agents for the treatment of onychomy-cosis. British Journal of Dermatology 2004;150(3):537—44,doi:10.1046/j.1365-2133.2003.05728.x.
2] Dai T, Fuchs BB, Coleman JJ, Prates RA, Astrakas C,St Denis TG, et al. Concepts and principles of photodynamictherapy as an alternative antifungal discovery platform. FrontMicrobiology 2012;3:120, doi:10.3389/fmicb.2012.00120.
3] Gonzales FP, Maisch T. Photodynamic inactivation for controllingCandida albicans infections. Fungal Biology 2012;116(1):1—10,http://dx.doi.org/10.1016/j.funbio.2011.10.001
4] Inada NM, Costa MM, Guimarães OC, Ribeiro Eda S, KurachiC, Quintana SM, et al. Photodiagnosis and treatment ofcondyloma acuminatum using 5-aminolevulinic acid andhomemade devices. Photodiagnosis Photodynamic Theraphy
2012;9(1):60—8, doi:10.1016/j.pdpdt.2011.09.001.5] Allison RR, Bagnato VS, Sibata CH. Future of oncologicphotodynamic therapy. Future Oncology 2010;6(6):929—40,doi:10.2217/fon.10.51.
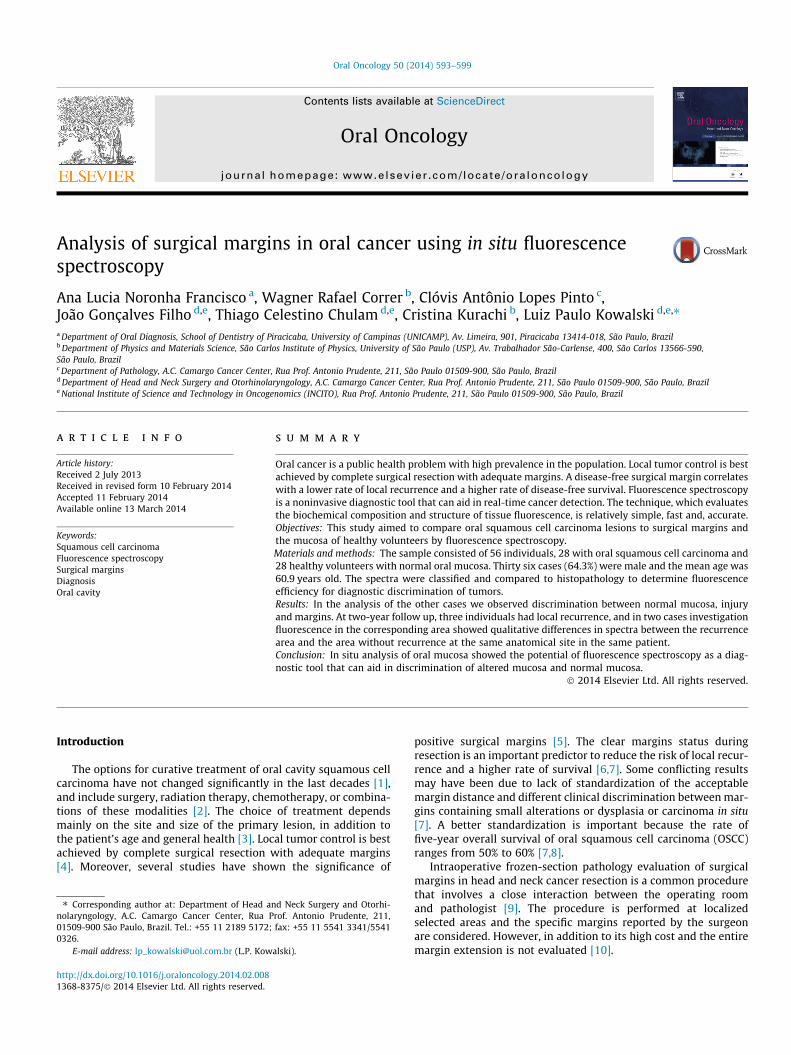
Oral Oncology 50 (2014) 593–599
Contents lists available at ScienceDirect
Oral Oncology
journal homepage: www.elsevier .com/locate /ora loncology
Analysis of surgical margins in oral cancer using in situ fluorescencespectroscopy
http://dx.doi.org/10.1016/j.oraloncology.2014.02.0081368-8375/ 2014 Elsevier Ltd. All rights reserved.
⇑ Corresponding author at: Department of Head and Neck Surgery and Otorhi-nolaryngology, A.C. Camargo Cancer Center, Rua Prof. Antonio Prudente, 211,01509-900 São Paulo, Brazil. Tel.: +55 11 2189 5172; fax: +55 11 5541 3341/55410326.
E-mail address: [email protected] (L.P. Kowalski).
Ana Lucia Noronha Francisco a, Wagner Rafael Correr b, Clóvis Antônio Lopes Pinto c,João Gonçalves Filho d,e, Thiago Celestino Chulam d,e, Cristina Kurachi b, Luiz Paulo Kowalski d,e,⇑a Department of Oral Diagnosis, School of Dentistry of Piracicaba, University of Campinas (UNICAMP), Av. Limeira, 901, Piracicaba 13414-018, São Paulo, Brazilb Department of Physics and Materials Science, São Carlos Institute of Physics, University of São Paulo (USP), Av. Trabalhador São-Carlense, 400, São Carlos 13566-590,São Paulo, Brazilc Department of Pathology, A.C. Camargo Cancer Center, Rua Prof. Antonio Prudente, 211, São Paulo 01509-900, São Paulo, Brazild Department of Head and Neck Surgery and Otorhinolaryngology, A.C. Camargo Cancer Center, Rua Prof. Antonio Prudente, 211, São Paulo 01509-900, São Paulo, Brazile National Institute of Science and Technology in Oncogenomics (INCITO), Rua Prof. Antonio Prudente, 211, São Paulo 01509-900, São Paulo, Brazil
a r t i c l e i n f o
Article history:Received 2 July 2013Received in revised form 10 February 2014Accepted 11 February 2014Available online 13 March 2014
Keywords:Squamous cell carcinomaFluorescence spectroscopySurgical marginsDiagnosisOral cavity
s u m m a r y
Oral cancer is a public health problem with high prevalence in the population. Local tumor control is bestachieved by complete surgical resection with adequate margins. A disease-free surgical margin correlateswith a lower rate of local recurrence and a higher rate of disease-free survival. Fluorescence spectroscopyis a noninvasive diagnostic tool that can aid in real-time cancer detection. The technique, which evaluatesthe biochemical composition and structure of tissue fluorescence, is relatively simple, fast and, accurate.Objectives: This study aimed to compare oral squamous cell carcinoma lesions to surgical margins andthe mucosa of healthy volunteers by fluorescence spectroscopy.Materials and methods: The sample consisted of 56 individuals, 28 with oral squamous cell carcinoma and28 healthy volunteers with normal oral mucosa. Thirty six cases (64.3%) were male and the mean age was60.9 years old. The spectra were classified and compared to histopathology to determine fluorescenceefficiency for diagnostic discrimination of tumors.Results: In the analysis of the other cases we observed discrimination between normal mucosa, injuryand margins. At two-year follow up, three individuals had local recurrence, and in two cases investigationfluorescence in the corresponding area showed qualitative differences in spectra between the recurrencearea and the area without recurrence at the same anatomical site in the same patient.Conclusion: In situ analysis of oral mucosa showed the potential of fluorescence spectroscopy as a diag-nostic tool that can aid in discrimination of altered mucosa and normal mucosa.
2014 Elsevier Ltd. All rights reserved.
Introduction
The options for curative treatment of oral cavity squamous cellcarcinoma have not changed significantly in the last decades [1],and include surgery, radiation therapy, chemotherapy, or combina-tions of these modalities [2]. The choice of treatment dependsmainly on the site and size of the primary lesion, in addition tothe patient’s age and general health [3]. Local tumor control is bestachieved by complete surgical resection with adequate margins[4]. Moreover, several studies have shown the significance of
positive surgical margins [5]. The clear margins status duringresection is an important predictor to reduce the risk of local recur-rence and a higher rate of survival [6,7]. Some conflicting resultsmay have been due to lack of standardization of the acceptablemargin distance and different clinical discrimination between mar-gins containing small alterations or dysplasia or carcinoma in situ[7]. A better standardization is important because the rate offive-year overall survival of oral squamous cell carcinoma (OSCC)ranges from 50% to 60% [7,8].
Intraoperative frozen-section pathology evaluation of surgicalmargins in head and neck cancer resection is a common procedurethat involves a close interaction between the operating roomand pathologist [9]. The procedure is performed at localizedselected areas and the specific margins reported by the surgeonare considered. However, in addition to its high cost and the entiremargin extension is not evaluated [10].
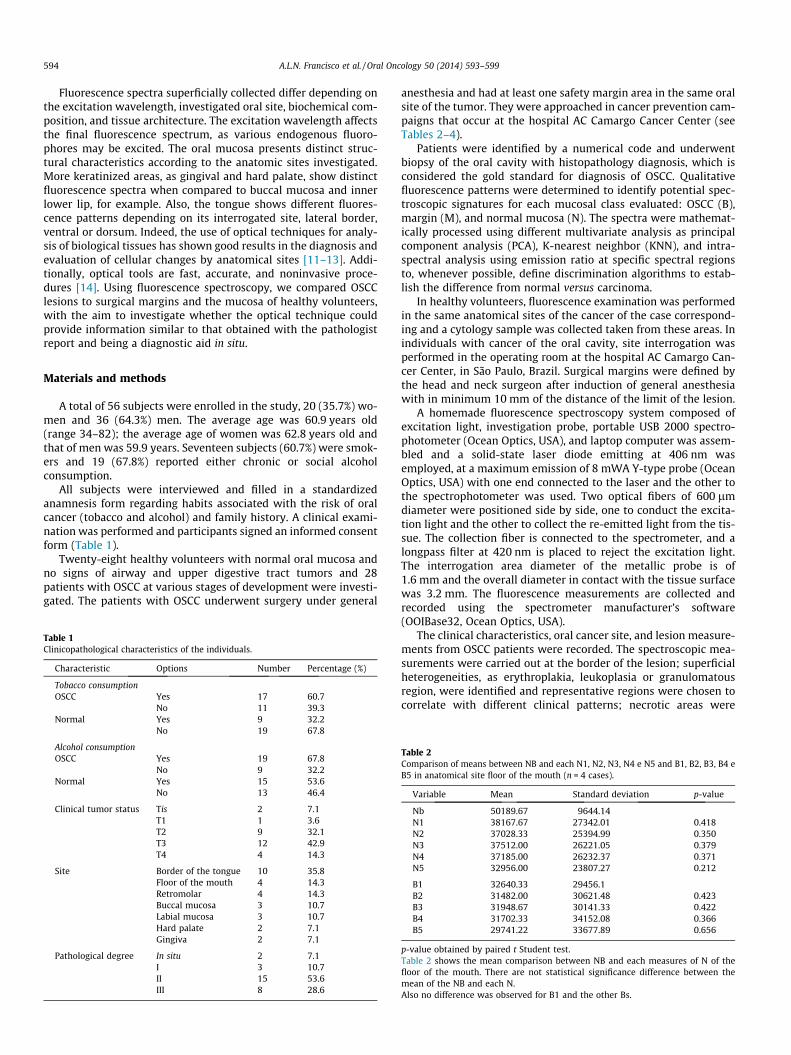
594 A.L.N. Francisco et al. / Oral Oncology 50 (2014) 593–599
Fluorescence spectra superficially collected differ depending onthe excitation wavelength, investigated oral site, biochemical com-position, and tissue architecture. The excitation wavelength affectsthe final fluorescence spectrum, as various endogenous fluoro-phores may be excited. The oral mucosa presents distinct struc-tural characteristics according to the anatomic sites investigated.More keratinized areas, as gingival and hard palate, show distinctfluorescence spectra when compared to buccal mucosa and innerlower lip, for example. Also, the tongue shows different fluores-cence patterns depending on its interrogated site, lateral border,ventral or dorsum. Indeed, the use of optical techniques for analy-sis of biological tissues has shown good results in the diagnosis andevaluation of cellular changes by anatomical sites [11–13]. Addi-tionally, optical tools are fast, accurate, and noninvasive proce-dures [14]. Using fluorescence spectroscopy, we compared OSCClesions to surgical margins and the mucosa of healthy volunteers,with the aim to investigate whether the optical technique couldprovide information similar to that obtained with the pathologistreport and being a diagnostic aid in situ.
Materials and methods
A total of 56 subjects were enrolled in the study, 20 (35.7%) wo-men and 36 (64.3%) men. The average age was 60.9 years old(range 34–82); the average age of women was 62.8 years old andthat of men was 59.9 years. Seventeen subjects (60.7%) were smok-ers and 19 (67.8%) reported either chronic or social alcoholconsumption.
All subjects were interviewed and filled in a standardizedanamnesis form regarding habits associated with the risk of oralcancer (tobacco and alcohol) and family history. A clinical exami-nation was performed and participants signed an informed consentform (Table 1).
Twenty-eight healthy volunteers with normal oral mucosa andno signs of airway and upper digestive tract tumors and 28patients with OSCC at various stages of development were investi-gated. The patients with OSCC underwent surgery under general
Table 1Clinicopathological characteristics of the individuals.
Characteristic Options Number Percentage (%)
Tobacco consumptionOSCC Yes 17 60.7
No 11 39.3Normal Yes 9 32.2
No 19 67.8
Alcohol consumptionOSCC Yes 19 67.8
No 9 32.2Normal Yes 15 53.6
No 13 46.4
Clinical tumor status Tis 2 7.1T1 1 3.6T2 9 32.1T3 12 42.9T4 4 14.3
Site Border of the tongue 10 35.8Floor of the mouth 4 14.3Retromolar 4 14.3Buccal mucosa 3 10.7Labial mucosa 3 10.7Hard palate 2 7.1Gingiva 2 7.1
Pathological degree In situ 2 7.1I 3 10.7II 15 53.6III 8 28.6
anesthesia and had at least one safety margin area in the same oralsite of the tumor. They were approached in cancer prevention cam-paigns that occur at the hospital AC Camargo Cancer Center (seeTables 2–4).
Patients were identified by a numerical code and underwentbiopsy of the oral cavity with histopathology diagnosis, which isconsidered the gold standard for diagnosis of OSCC. Qualitativefluorescence patterns were determined to identify potential spec-troscopic signatures for each mucosal class evaluated: OSCC (B),margin (M), and normal mucosa (N). The spectra were mathemat-ically processed using different multivariate analysis as principalcomponent analysis (PCA), K-nearest neighbor (KNN), and intra-spectral analysis using emission ratio at specific spectral regionsto, whenever possible, define discrimination algorithms to estab-lish the difference from normal versus carcinoma.
In healthy volunteers, fluorescence examination was performedin the same anatomical sites of the cancer of the case correspond-ing and a cytology sample was collected taken from these areas. Inindividuals with cancer of the oral cavity, site interrogation wasperformed in the operating room at the hospital AC Camargo Can-cer Center, in São Paulo, Brazil. Surgical margins were defined bythe head and neck surgeon after induction of general anesthesiawith in minimum 10 mm of the distance of the limit of the lesion.
A homemade fluorescence spectroscopy system composed ofexcitation light, investigation probe, portable USB 2000 spectro-photometer (Ocean Optics, USA), and laptop computer was assem-bled and a solid-state laser diode emitting at 406 nm wasemployed, at a maximum emission of 8 mWA Y-type probe (OceanOptics, USA) with one end connected to the laser and the other tothe spectrophotometer was used. Two optical fibers of 600 lmdiameter were positioned side by side, one to conduct the excita-tion light and the other to collect the re-emitted light from the tis-sue. The collection fiber is connected to the spectrometer, and alongpass filter at 420 nm is placed to reject the excitation light.The interrogation area diameter of the metallic probe is of1.6 mm and the overall diameter in contact with the tissue surfacewas 3.2 mm. The fluorescence measurements are collected andrecorded using the spectrometer manufacturer’s software(OOIBase32, Ocean Optics, USA).
The clinical characteristics, oral cancer site, and lesion measure-ments from OSCC patients were recorded. The spectroscopic mea-surements were carried out at the border of the lesion; superficialheterogeneities, as erythroplakia, leukoplasia or granulomatousregion, were identified and representative regions were chosen tocorrelate with different clinical patterns; necrotic areas were
Table 2Comparison of means between NB and each N1, N2, N3, N4 e N5 and B1, B2, B3, B4 eB5 in anatomical site floor of the mouth (n = 4 cases).
Variable Mean Standard deviation p-value
Nb 50189.67 9644.14N1 38167.67 27342.01 0.418N2 37028.33 25394.99 0.350N3 37512.00 26221.05 0.379N4 37185.00 26232.37 0.371N5 32956.00 23807.27 0.212
B1 32640.33 29456.1B2 31482.00 30621.48 0.423B3 31948.67 30141.33 0.422B4 31702.33 34152.08 0.366B5 29741.22 33677.89 0.656
p-value obtained by paired t Student test.Table 2 shows the mean comparison between NB and each measures of N of thefloor of the mouth. There are not statistical significance difference between themean of the NB and each N.Also no difference was observed for B1 and the other Bs.
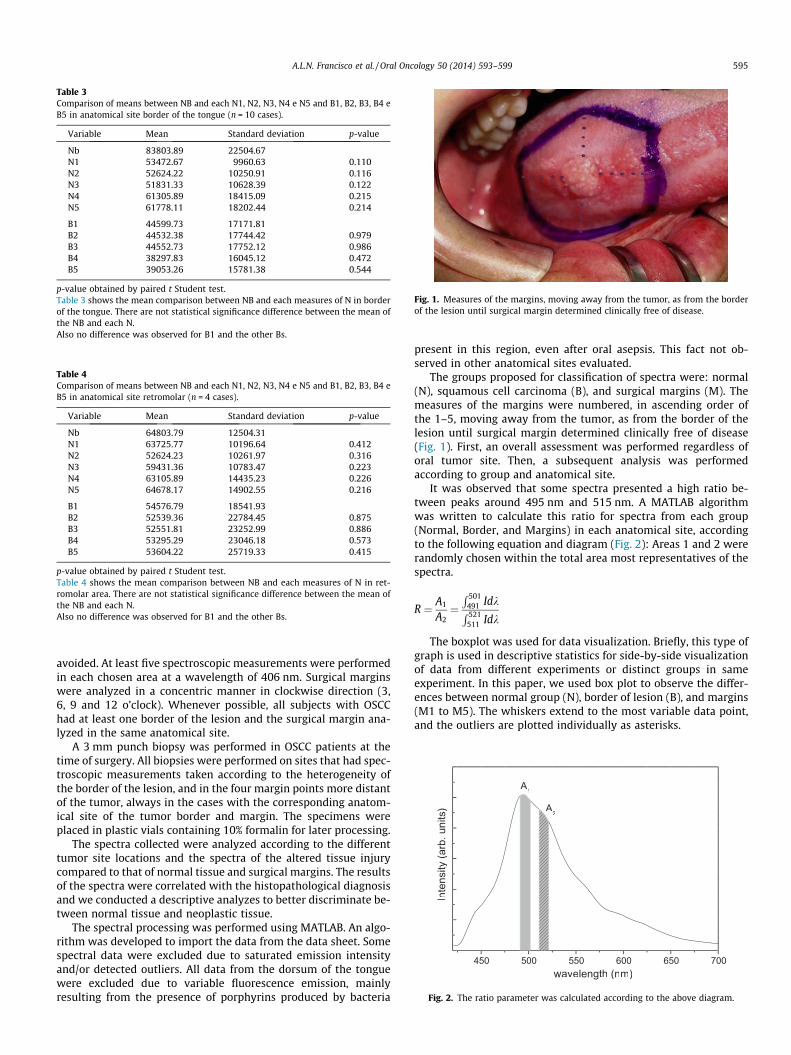
Table 3Comparison of means between NB and each N1, N2, N3, N4 e N5 and B1, B2, B3, B4 eB5 in anatomical site border of the tongue (n = 10 cases).
Variable Mean Standard deviation p-value
Nb 83803.89 22504.67N1 53472.67 9960.63 0.110N2 52624.22 10250.91 0.116N3 51831.33 10628.39 0.122N4 61305.89 18415.09 0.215N5 61778.11 18202.44 0.214
B1 44599.73 17171.81B2 44532.38 17744.42 0.979B3 44552.73 17752.12 0.986B4 38297.83 16045.12 0.472B5 39053.26 15781.38 0.544
p-value obtained by paired t Student test.Table 3 shows the mean comparison between NB and each measures of N in borderof the tongue. There are not statistical significance difference between the mean ofthe NB and each N.Also no difference was observed for B1 and the other Bs.
Table 4Comparison of means between NB and each N1, N2, N3, N4 e N5 and B1, B2, B3, B4 eB5 in anatomical site retromolar (n = 4 cases).
Variable Mean Standard deviation p-value
Nb 64803.79 12504.31N1 63725.77 10196.64 0.412N2 52624.23 10261.97 0.316N3 59431.36 10783.47 0.223N4 63105.89 14435.23 0.226N5 64678.17 14902.55 0.216
B1 54576.79 18541.93B2 52539.36 22784.45 0.875B3 52551.81 23252.99 0.886B4 53295.29 23046.18 0.573B5 53604.22 25719.33 0.415
p-value obtained by paired t Student test.Table 4 shows the mean comparison between NB and each measures of N in ret-romolar area. There are not statistical significance difference between the mean ofthe NB and each N.Also no difference was observed for B1 and the other Bs.
Fig. 1. Measures of the margins, moving away from the tumor, as from the borderof the lesion until surgical margin determined clinically free of disease.
450 500 550 600 650 700
A2
Inte
nsity
(arb
.uni
ts)
wavelength (nm)
A1
Fig. 2. The ratio parameter was calculated according to the above diagram.
A.L.N. Francisco et al. / Oral Oncology 50 (2014) 593–599 595
avoided. At least five spectroscopic measurements were performedin each chosen area at a wavelength of 406 nm. Surgical marginswere analyzed in a concentric manner in clockwise direction (3,6, 9 and 12 o’clock). Whenever possible, all subjects with OSCChad at least one border of the lesion and the surgical margin ana-lyzed in the same anatomical site.
A 3 mm punch biopsy was performed in OSCC patients at thetime of surgery. All biopsies were performed on sites that had spec-troscopic measurements taken according to the heterogeneity ofthe border of the lesion, and in the four margin points more distantof the tumor, always in the cases with the corresponding anatom-ical site of the tumor border and margin. The specimens wereplaced in plastic vials containing 10% formalin for later processing.
The spectra collected were analyzed according to the differenttumor site locations and the spectra of the altered tissue injurycompared to that of normal tissue and surgical margins. The resultsof the spectra were correlated with the histopathological diagnosisand we conducted a descriptive analyzes to better discriminate be-tween normal tissue and neoplastic tissue.
The spectral processing was performed using MATLAB. An algo-rithm was developed to import the data from the data sheet. Somespectral data were excluded due to saturated emission intensityand/or detected outliers. All data from the dorsum of the tonguewere excluded due to variable fluorescence emission, mainlyresulting from the presence of porphyrins produced by bacteria
present in this region, even after oral asepsis. This fact not ob-served in other anatomical sites evaluated.
The groups proposed for classification of spectra were: normal(N), squamous cell carcinoma (B), and surgical margins (M). Themeasures of the margins were numbered, in ascending order ofthe 1–5, moving away from the tumor, as from the border of thelesion until surgical margin determined clinically free of disease(Fig. 1). First, an overall assessment was performed regardless oforal tumor site. Then, a subsequent analysis was performedaccording to group and anatomical site.
It was observed that some spectra presented a high ratio be-tween peaks around 495 nm and 515 nm. A MATLAB algorithmwas written to calculate this ratio for spectra from each group(Normal, Border, and Margins) in each anatomical site, accordingto the following equation and diagram (Fig. 2): Areas 1 and 2 wererandomly chosen within the total area most representatives of thespectra.
R ¼ A1
A2¼R 501
491 IdkR 521
511 Idk
The boxplot was used for data visualization. Briefly, this type ofgraph is used in descriptive statistics for side-by-side visualizationof data from different experiments or distinct groups in sameexperiment. In this paper, we used box plot to observe the differ-ences between normal group (N), border of lesion (B), and margins(M1 to M5). The whiskers extend to the most variable data point,and the outliers are plotted individually as asterisks.
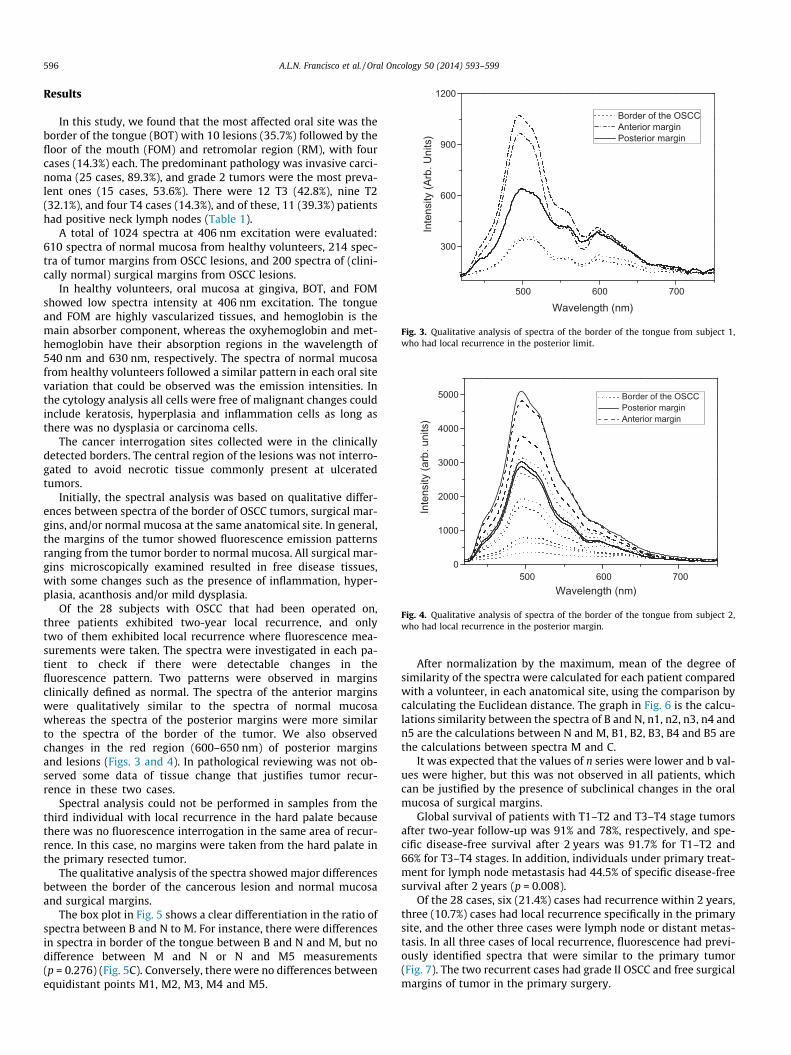
500 600 700
300
600
900
1200
Inte
nsity
(Arb
. Uni
ts)
Wavelength (nm)
Border of the OSCC Anterior margin Posterior margin
Fig. 3. Qualitative analysis of spectra of the border of the tongue from subject 1,who had local recurrence in the posterior limit.
500 600 7000
1000
2000
3000
4000
5000
Inte
nsity
(arb
. uni
ts)
Wavelength (nm)
Border of the OSCC Posterior margin Anterior margin
Fig. 4. Qualitative analysis of spectra of the border of the tongue from subject 2,who had local recurrence in the posterior margin.
596 A.L.N. Francisco et al. / Oral Oncology 50 (2014) 593–599
Results
In this study, we found that the most affected oral site was theborder of the tongue (BOT) with 10 lesions (35.7%) followed by thefloor of the mouth (FOM) and retromolar region (RM), with fourcases (14.3%) each. The predominant pathology was invasive carci-noma (25 cases, 89.3%), and grade 2 tumors were the most preva-lent ones (15 cases, 53.6%). There were 12 T3 (42.8%), nine T2(32.1%), and four T4 cases (14.3%), and of these, 11 (39.3%) patientshad positive neck lymph nodes (Table 1).
A total of 1024 spectra at 406 nm excitation were evaluated:610 spectra of normal mucosa from healthy volunteers, 214 spec-tra of tumor margins from OSCC lesions, and 200 spectra of (clini-cally normal) surgical margins from OSCC lesions.
In healthy volunteers, oral mucosa at gingiva, BOT, and FOMshowed low spectra intensity at 406 nm excitation. The tongueand FOM are highly vascularized tissues, and hemoglobin is themain absorber component, whereas the oxyhemoglobin and met-hemoglobin have their absorption regions in the wavelength of540 nm and 630 nm, respectively. The spectra of normal mucosafrom healthy volunteers followed a similar pattern in each oral sitevariation that could be observed was the emission intensities. Inthe cytology analysis all cells were free of malignant changes couldinclude keratosis, hyperplasia and inflammation cells as long asthere was no dysplasia or carcinoma cells.
The cancer interrogation sites collected were in the clinicallydetected borders. The central region of the lesions was not interro-gated to avoid necrotic tissue commonly present at ulceratedtumors.
Initially, the spectral analysis was based on qualitative differ-ences between spectra of the border of OSCC tumors, surgical mar-gins, and/or normal mucosa at the same anatomical site. In general,the margins of the tumor showed fluorescence emission patternsranging from the tumor border to normal mucosa. All surgical mar-gins microscopically examined resulted in free disease tissues,with some changes such as the presence of inflammation, hyper-plasia, acanthosis and/or mild dysplasia.
Of the 28 subjects with OSCC that had been operated on,three patients exhibited two-year local recurrence, and onlytwo of them exhibited local recurrence where fluorescence mea-surements were taken. The spectra were investigated in each pa-tient to check if there were detectable changes in thefluorescence pattern. Two patterns were observed in marginsclinically defined as normal. The spectra of the anterior marginswere qualitatively similar to the spectra of normal mucosawhereas the spectra of the posterior margins were more similarto the spectra of the border of the tumor. We also observedchanges in the red region (600–650 nm) of posterior marginsand lesions (Figs. 3 and 4). In pathological reviewing was not ob-served some data of tissue change that justifies tumor recur-rence in these two cases.
Spectral analysis could not be performed in samples from thethird individual with local recurrence in the hard palate becausethere was no fluorescence interrogation in the same area of recur-rence. In this case, no margins were taken from the hard palate inthe primary resected tumor.
The qualitative analysis of the spectra showed major differencesbetween the border of the cancerous lesion and normal mucosaand surgical margins.
The box plot in Fig. 5 shows a clear differentiation in the ratio ofspectra between B and N to M. For instance, there were differencesin spectra in border of the tongue between B and N and M, but nodifference between M and N or N and M5 measurements(p = 0.276) (Fig. 5C). Conversely, there were no differences betweenequidistant points M1, M2, M3, M4 and M5.
After normalization by the maximum, mean of the degree ofsimilarity of the spectra were calculated for each patient comparedwith a volunteer, in each anatomical site, using the comparison bycalculating the Euclidean distance. The graph in Fig. 6 is the calcu-lations similarity between the spectra of B and N, n1, n2, n3, n4 andn5 are the calculations between N and M, B1, B2, B3, B4 and B5 arethe calculations between spectra M and C.
It was expected that the values of n series were lower and b val-ues were higher, but this was not observed in all patients, whichcan be justified by the presence of subclinical changes in the oralmucosa of surgical margins.
Global survival of patients with T1–T2 and T3–T4 stage tumorsafter two-year follow-up was 91% and 78%, respectively, and spe-cific disease-free survival after 2 years was 91.7% for T1–T2 and66% for T3–T4 stages. In addition, individuals under primary treat-ment for lymph node metastasis had 44.5% of specific disease-freesurvival after 2 years (p = 0.008).
Of the 28 cases, six (21.4%) cases had recurrence within 2 years,three (10.7%) cases had local recurrence specifically in the primarysite, and the other three cases were lymph node or distant metas-tasis. In all three cases of local recurrence, fluorescence had previ-ously identified spectra that were similar to the primary tumor(Fig. 7). The two recurrent cases had grade II OSCC and free surgicalmargins of tumor in the primary surgery.
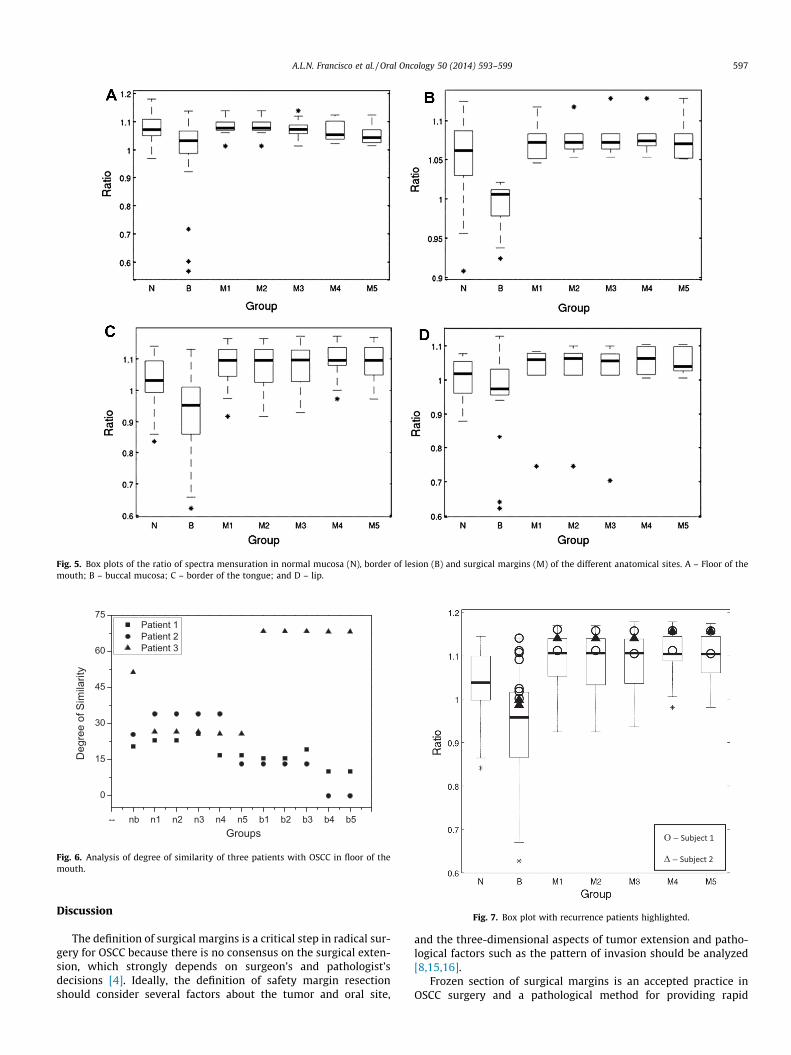
Fig. 5. Box plots of the ratio of spectra mensuration in normal mucosa (N), border of lesion (B) and surgical margins (M) of the different anatomical sites. A – Floor of themouth; B – buccal mucosa; C – border of the tongue; and D – lip.
-- nb n1 n2 n3 n4 n5 b1 b2 b3 b4 b5
0
15
30
45
60
75 Patient 1 Patient 2 Patient 3
Deg
ree
of S
imila
rity
Groups
Fig. 6. Analysis of degree of similarity of three patients with OSCC in floor of themouth.
Fig. 7. Box plot with recurrence patients highlighted.
A.L.N. Francisco et al. / Oral Oncology 50 (2014) 593–599 597
Discussion
The definition of surgical margins is a critical step in radical sur-gery for OSCC because there is no consensus on the surgical exten-sion, which strongly depends on surgeon’s and pathologist’sdecisions [4]. Ideally, the definition of safety margin resectionshould consider several factors about the tumor and oral site,
and the three-dimensional aspects of tumor extension and patho-logical factors such as the pattern of invasion should be analyzed[8,15,16].
Frozen section of surgical margins is an accepted practice inOSCC surgery and a pathological method for providing rapid
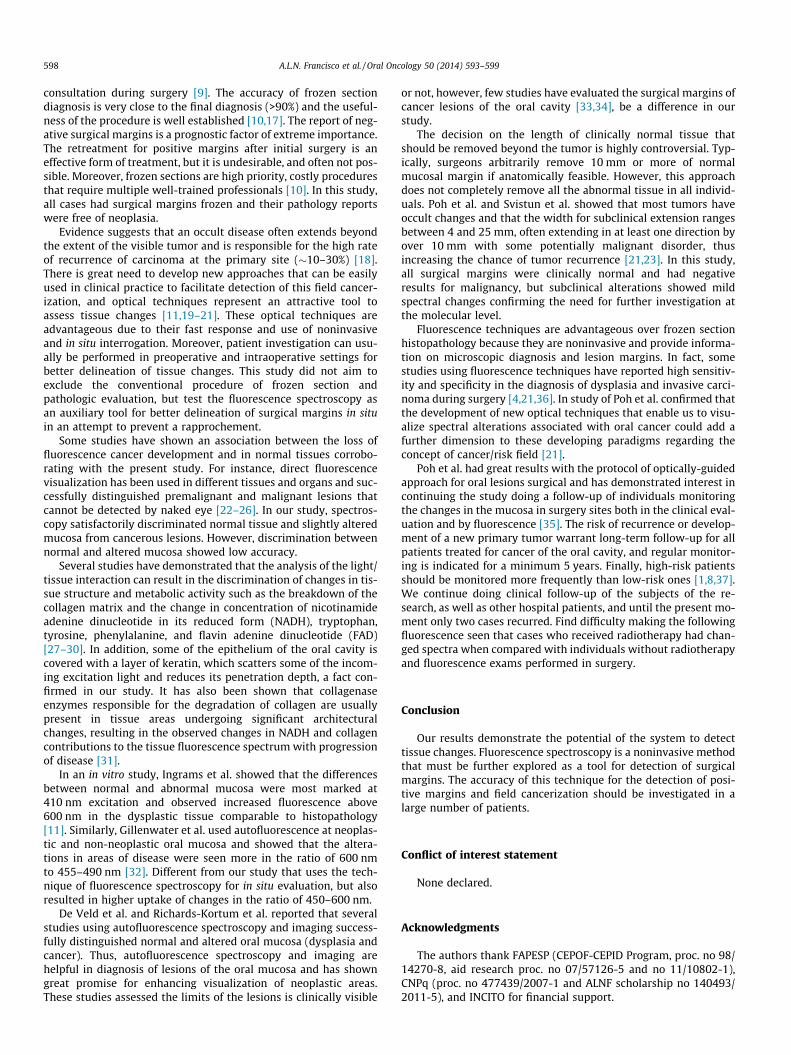
598 A.L.N. Francisco et al. / Oral Oncology 50 (2014) 593–599
consultation during surgery [9]. The accuracy of frozen sectiondiagnosis is very close to the final diagnosis (>90%) and the useful-ness of the procedure is well established [10,17]. The report of neg-ative surgical margins is a prognostic factor of extreme importance.The retreatment for positive margins after initial surgery is aneffective form of treatment, but it is undesirable, and often not pos-sible. Moreover, frozen sections are high priority, costly proceduresthat require multiple well-trained professionals [10]. In this study,all cases had surgical margins frozen and their pathology reportswere free of neoplasia.
Evidence suggests that an occult disease often extends beyondthe extent of the visible tumor and is responsible for the high rateof recurrence of carcinoma at the primary site (10–30%) [18].There is great need to develop new approaches that can be easilyused in clinical practice to facilitate detection of this field cancer-ization, and optical techniques represent an attractive tool toassess tissue changes [11,19–21]. These optical techniques areadvantageous due to their fast response and use of noninvasiveand in situ interrogation. Moreover, patient investigation can usu-ally be performed in preoperative and intraoperative settings forbetter delineation of tissue changes. This study did not aim toexclude the conventional procedure of frozen section andpathologic evaluation, but test the fluorescence spectroscopy asan auxiliary tool for better delineation of surgical margins in situin an attempt to prevent a rapprochement.
Some studies have shown an association between the loss offluorescence cancer development and in normal tissues corrobo-rating with the present study. For instance, direct fluorescencevisualization has been used in different tissues and organs and suc-cessfully distinguished premalignant and malignant lesions thatcannot be detected by naked eye [22–26]. In our study, spectros-copy satisfactorily discriminated normal tissue and slightly alteredmucosa from cancerous lesions. However, discrimination betweennormal and altered mucosa showed low accuracy.
Several studies have demonstrated that the analysis of the light/tissue interaction can result in the discrimination of changes in tis-sue structure and metabolic activity such as the breakdown of thecollagen matrix and the change in concentration of nicotinamideadenine dinucleotide in its reduced form (NADH), tryptophan,tyrosine, phenylalanine, and flavin adenine dinucleotide (FAD)[27–30]. In addition, some of the epithelium of the oral cavity iscovered with a layer of keratin, which scatters some of the incom-ing excitation light and reduces its penetration depth, a fact con-firmed in our study. It has also been shown that collagenaseenzymes responsible for the degradation of collagen are usuallypresent in tissue areas undergoing significant architecturalchanges, resulting in the observed changes in NADH and collagencontributions to the tissue fluorescence spectrum with progressionof disease [31].
In an in vitro study, Ingrams et al. showed that the differencesbetween normal and abnormal mucosa were most marked at410 nm excitation and observed increased fluorescence above600 nm in the dysplastic tissue comparable to histopathology[11]. Similarly, Gillenwater et al. used autofluorescence at neoplas-tic and non-neoplastic oral mucosa and showed that the altera-tions in areas of disease were seen more in the ratio of 600 nmto 455–490 nm [32]. Different from our study that uses the tech-nique of fluorescence spectroscopy for in situ evaluation, but alsoresulted in higher uptake of changes in the ratio of 450–600 nm.
De Veld et al. and Richards-Kortum et al. reported that severalstudies using autofluorescence spectroscopy and imaging success-fully distinguished normal and altered oral mucosa (dysplasia andcancer). Thus, autofluorescence spectroscopy and imaging arehelpful in diagnosis of lesions of the oral mucosa and has showngreat promise for enhancing visualization of neoplastic areas.These studies assessed the limits of the lesions is clinically visible
or not, however, few studies have evaluated the surgical margins ofcancer lesions of the oral cavity [33,34], be a difference in ourstudy.
The decision on the length of clinically normal tissue thatshould be removed beyond the tumor is highly controversial. Typ-ically, surgeons arbitrarily remove 10 mm or more of normalmucosal margin if anatomically feasible. However, this approachdoes not completely remove all the abnormal tissue in all individ-uals. Poh et al. and Svistun et al. showed that most tumors haveoccult changes and that the width for subclinical extension rangesbetween 4 and 25 mm, often extending in at least one direction byover 10 mm with some potentially malignant disorder, thusincreasing the chance of tumor recurrence [21,23]. In this study,all surgical margins were clinically normal and had negativeresults for malignancy, but subclinical alterations showed mildspectral changes confirming the need for further investigation atthe molecular level.
Fluorescence techniques are advantageous over frozen sectionhistopathology because they are noninvasive and provide informa-tion on microscopic diagnosis and lesion margins. In fact, somestudies using fluorescence techniques have reported high sensitiv-ity and specificity in the diagnosis of dysplasia and invasive carci-noma during surgery [4,21,36]. In study of Poh et al. confirmed thatthe development of new optical techniques that enable us to visu-alize spectral alterations associated with oral cancer could add afurther dimension to these developing paradigms regarding theconcept of cancer/risk field [21].
Poh et al. had great results with the protocol of optically-guidedapproach for oral lesions surgical and has demonstrated interest incontinuing the study doing a follow-up of individuals monitoringthe changes in the mucosa in surgery sites both in the clinical eval-uation and by fluorescence [35]. The risk of recurrence or develop-ment of a new primary tumor warrant long-term follow-up for allpatients treated for cancer of the oral cavity, and regular monitor-ing is indicated for a minimum 5 years. Finally, high-risk patientsshould be monitored more frequently than low-risk ones [1,8,37].We continue doing clinical follow-up of the subjects of the re-search, as well as other hospital patients, and until the present mo-ment only two cases recurred. Find difficulty making the followingfluorescence seen that cases who received radiotherapy had chan-ged spectra when compared with individuals without radiotherapyand fluorescence exams performed in surgery.
Conclusion
Our results demonstrate the potential of the system to detecttissue changes. Fluorescence spectroscopy is a noninvasive methodthat must be further explored as a tool for detection of surgicalmargins. The accuracy of this technique for the detection of posi-tive margins and field cancerization should be investigated in alarge number of patients.
Conflict of interest statement
None declared.
Acknowledgments
The authors thank FAPESP (CEPOF-CEPID Program, proc. no 98/14270-8, aid research proc. no 07/57126-5 and no 11/10802-1),CNPq (proc. no 477439/2007-1 and ALNF scholarship no 140493/2011-5), and INCITO for financial support.
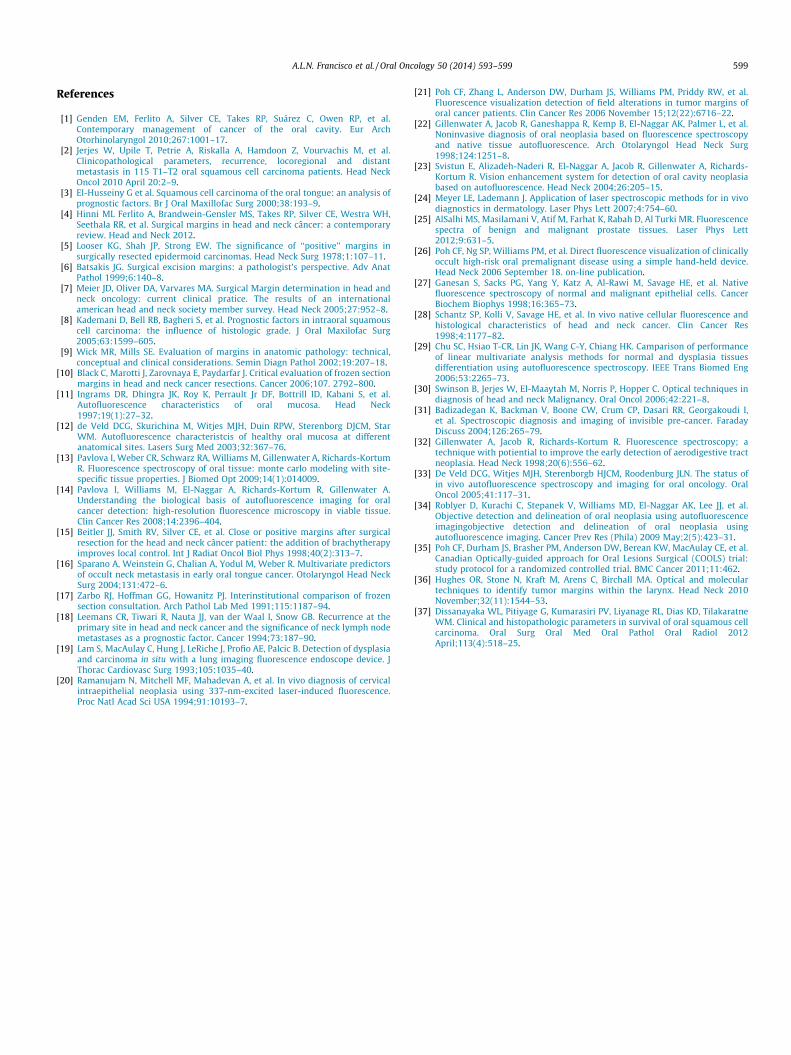
A.L.N. Francisco et al. / Oral Oncology 50 (2014) 593–599 599
References
[1] Genden EM, Ferlito A, Silver CE, Takes RP, Suárez C, Owen RP, et al.Contemporary management of cancer of the oral cavity. Eur ArchOtorhinolaryngol 2010;267:1001–17.
[2] Jerjes W, Upile T, Petrie A, Riskalla A, Hamdoon Z, Vourvachis M, et al.Clinicopathological parameters, recurrence, locoregional and distantmetastasis in 115 T1–T2 oral squamous cell carcinoma patients. Head NeckOncol 2010 April 20:2–9.
[3] El-Husseiny G et al. Squamous cell carcinoma of the oral tongue: an analysis ofprognostic factors. Br J Oral Maxillofac Surg 2000;38:193–9.
[4] Hinni ML Ferlito A, Brandwein-Gensler MS, Takes RP, Silver CE, Westra WH,Seethala RR, et al. Surgical margins in head and neck câncer: a contemporaryreview. Head and Neck 2012.
[5] Looser KG, Shah JP, Strong EW. The significance of ‘‘positive’’ margins insurgically resected epidermoid carcinomas. Head Neck Surg 1978;1:107–11.
[6] Batsakis JG. Surgical excision margins: a pathologist’s perspective. Adv AnatPathol 1999;6:140–8.
[7] Meier JD, Oliver DA, Varvares MA. Surgical Margin determination in head andneck oncology: current clinical pratice. The results of an internationalamerican head and neck society member survey. Head Neck 2005;27:952–8.
[8] Kademani D, Bell RB, Bagheri S, et al. Prognostic factors in intraoral squamouscell carcinoma: the influence of histologic grade. J Oral Maxilofac Surg2005;63:1599–605.
[9] Wick MR, Mills SE. Evaluation of margins in anatomic pathology: technical,conceptual and clinical considerations. Semin Diagn Pathol 2002;19:207–18.
[10] Black C, Marotti J, Zarovnaya E, Paydarfar J. Critical evaluation of frozen sectionmargins in head and neck cancer resections. Cancer 2006;107. 2792–800.
[11] Ingrams DR, Dhingra JK, Roy K, Perrault Jr DF, Bottrill ID, Kabani S, et al.Autofluorescence characteristics of oral mucosa. Head Neck1997;19(1):27–32.
[12] de Veld DCG, Skurichina M, Witjes MJH, Duin RPW, Sterenborg DJCM, StarWM. Autofluorescence characteristcis of healthy oral mucosa at differentanatomical sites. Lasers Surg Med 2003;32:367–76.
[13] Pavlova I, Weber CR, Schwarz RA, Williams M, Gillenwater A, Richards-KortumR. Fluorescence spectroscopy of oral tissue: monte carlo modeling with site-specific tissue properties. J Biomed Opt 2009;14(1):014009.
[14] Pavlova I, Williams M, El-Naggar A, Richards-Kortum R, Gillenwater A.Understanding the biological basis of autofluorescence imaging for oralcancer detection: high-resolution fluorescence microscopy in viable tissue.Clin Cancer Res 2008;14:2396–404.
[15] Beitler JJ, Smith RV, Silver CE, et al. Close or positive margins after surgicalresection for the head and neck câncer patient: the addition of brachytherapyimproves local control. Int J Radiat Oncol Biol Phys 1998;40(2):313–7.
[16] Sparano A, Weinstein G, Chalian A, Yodul M, Weber R. Multivariate predictorsof occult neck metastasis in early oral tongue cancer. Otolaryngol Head NeckSurg 2004;131:472–6.
[17] Zarbo RJ, Hoffman GG, Howanitz PJ. Interinstitutional comparison of frozensection consultation. Arch Pathol Lab Med 1991;115:1187–94.
[18] Leemans CR, Tiwari R, Nauta JJ, van der Waal I, Snow GB. Recurrence at theprimary site in head and neck cancer and the significance of neck lymph nodemetastases as a prognostic factor. Cancer 1994;73:187–90.
[19] Lam S, MacAulay C, Hung J, LeRiche J, Profio AE, Palcic B. Detection of dysplasiaand carcinoma in situ with a lung imaging fluorescence endoscope device. JThorac Cardiovasc Surg 1993;105:1035–40.
[20] Ramanujam N, Mitchell MF, Mahadevan A, et al. In vivo diagnosis of cervicalintraepithelial neoplasia using 337-nm-excited laser-induced fluorescence.Proc Natl Acad Sci USA 1994;91:10193–7.
[21] Poh CF, Zhang L, Anderson DW, Durham JS, Williams PM, Priddy RW, et al.Fluorescence visualization detection of field alterations in tumor margins oforal cancer patients. Clin Cancer Res 2006 November 15;12(22):6716–22.
[22] Gillenwater A, Jacob R, Ganeshappa R, Kemp B, El-Naggar AK, Palmer L, et al.Noninvasive diagnosis of oral neoplasia based on fluorescence spectroscopyand native tissue autofluorescence. Arch Otolaryngol Head Neck Surg1998;124:1251–8.
[23] Svistun E, Alizadeh-Naderi R, El-Naggar A, Jacob R, Gillenwater A, Richards-Kortum R. Vision enhancement system for detection of oral cavity neoplasiabased on autofluorescence. Head Neck 2004;26:205–15.
[24] Meyer LE, Lademann J. Application of laser spectroscopic methods for in vivodiagnostics in dermatology. Laser Phys Lett 2007;4:754–60.
[25] AlSalhi MS, Masilamani V, Atif M, Farhat K, Rabah D, Al Turki MR. Fluorescencespectra of benign and malignant prostate tissues. Laser Phys Lett2012;9:631–5.
[26] Poh CF, Ng SP, Williams PM, et al. Direct fluorescence visualization of clinicallyoccult high-risk oral premalignant disease using a simple hand-held device.Head Neck 2006 September 18. on-line publication.
[27] Ganesan S, Sacks PG, Yang Y, Katz A, Al-Rawi M, Savage HE, et al. Nativefluorescence spectroscopy of normal and malignant epithelial cells. CancerBiochem Biophys 1998;16:365–73.
[28] Schantz SP, Kolli V, Savage HE, et al. In vivo native cellular fluorescence andhistological characteristics of head and neck cancer. Clin Cancer Res1998;4:1177–82.
[29] Chu SC, Hsiao T-CR, Lin JK, Wang C-Y, Chiang HK. Camparison of performanceof linear multivariate analysis methods for normal and dysplasia tissuesdifferentiation using autofluorescence spectroscopy. IEEE Trans Biomed Eng2006;53:2265–73.
[30] Swinson B, Jerjes W, El-Maaytah M, Norris P, Hopper C. Optical techniques indiagnosis of head and neck Malignancy. Oral Oncol 2006;42:221–8.
[31] Badizadegan K, Backman V, Boone CW, Crum CP, Dasari RR, Georgakoudi I,et al. Spectroscopic diagnosis and imaging of invisible pre-cancer. FaradayDiscuss 2004;126:265–79.
[32] Gillenwater A, Jacob R, Richards-Kortum R. Fluorescence spectroscopy; atechnique with potiential to improve the early detection of aerodigestive tractneoplasia. Head Neck 1998;20(6):556–62.
[33] De Veld DCG, Witjes MJH, Sterenborgb HJCM, Roodenburg JLN. The status ofin vivo autofluorescence spectroscopy and imaging for oral oncology. OralOncol 2005;41:117–31.
[34] Roblyer D, Kurachi C, Stepanek V, Williams MD, El-Naggar AK, Lee JJ, et al.Objective detection and delineation of oral neoplasia using autofluorescenceimagingobjective detection and delineation of oral neoplasia usingautofluorescence imaging. Cancer Prev Res (Phila) 2009 May;2(5):423–31.
[35] Poh CF, Durham JS, Brasher PM, Anderson DW, Berean KW, MacAulay CE, et al.Canadian Optically-guided approach for Oral Lesions Surgical (COOLS) trial:study protocol for a randomized controlled trial. BMC Cancer 2011;11:462.
[36] Hughes OR, Stone N, Kraft M, Arens C, Birchall MA. Optical and moleculartechniques to identify tumor margins within the larynx. Head Neck 2010November;32(11):1544–53.
[37] Dissanayaka WL, Pitiyage G, Kumarasiri PV, Liyanage RL, Dias KD, TilakaratneWM. Clinical and histopathologic parameters in survival of oral squamous cellcarcinoma. Oral Surg Oral Med Oral Pathol Oral Radiol 2012April;113(4):518–25.
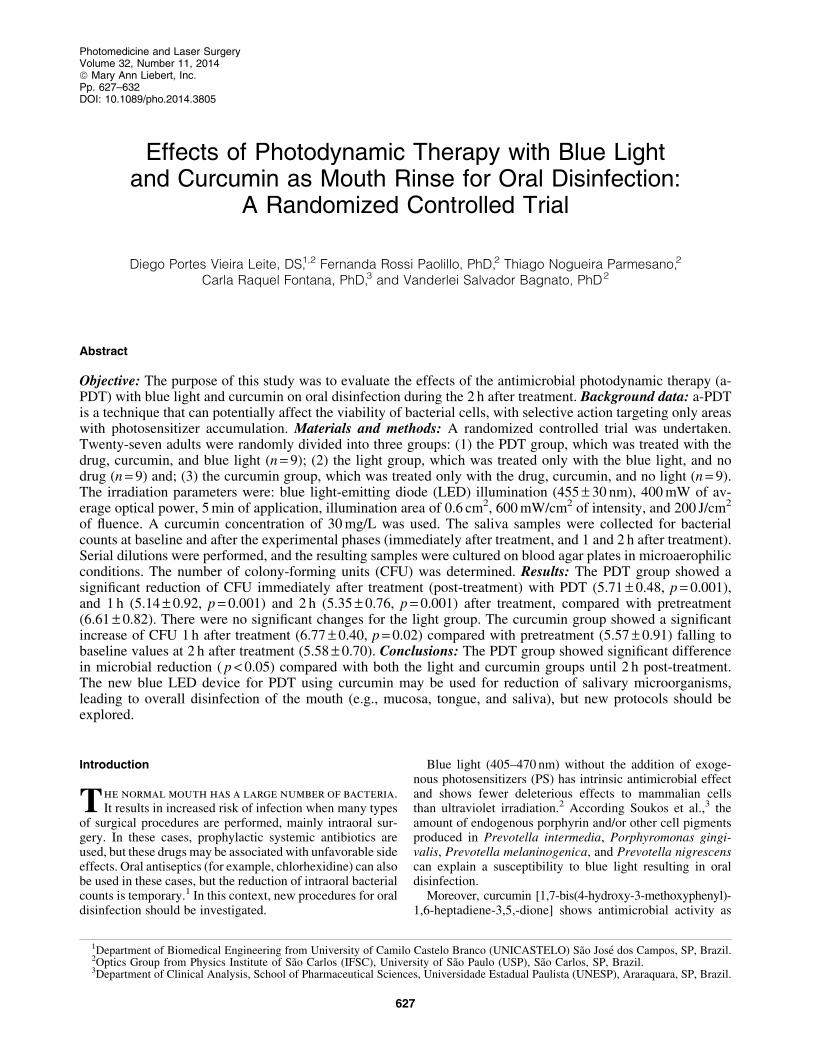
Effects of Photodynamic Therapy with Blue Lightand Curcumin as Mouth Rinse for Oral Disinfection:
A Randomized Controlled Trial
Diego Portes Vieira Leite, DS,1,2 Fernanda Rossi Paolillo, PhD,2 Thiago Nogueira Parmesano,2
Carla Raquel Fontana, PhD,3 and Vanderlei Salvador Bagnato, PhD2
Abstract
Objective: The purpose of this study was to evaluate the effects of the antimicrobial photodynamic therapy (a-PDT) with blue light and curcumin on oral disinfection during the 2 h after treatment. Background data: a-PDTis a technique that can potentially affect the viability of bacterial cells, with selective action targeting only areaswith photosensitizer accumulation. Materials and methods: A randomized controlled trial was undertaken.Twenty-seven adults were randomly divided into three groups: (1) the PDT group, which was treated with thedrug, curcumin, and blue light (n = 9); (2) the light group, which was treated only with the blue light, and nodrug (n = 9) and; (3) the curcumin group, which was treated only with the drug, curcumin, and no light (n = 9).The irradiation parameters were: blue light-emitting diode (LED) illumination (455 – 30 nm), 400 mW of av-erage optical power, 5 min of application, illumination area of 0.6 cm2, 600 mW/cm2 of intensity, and 200 J/cm2
of fluence. A curcumin concentration of 30 mg/L was used. The saliva samples were collected for bacterialcounts at baseline and after the experimental phases (immediately after treatment, and 1 and 2 h after treatment).Serial dilutions were performed, and the resulting samples were cultured on blood agar plates in microaerophilicconditions. The number of colony-forming units (CFU) was determined. Results: The PDT group showed asignificant reduction of CFU immediately after treatment (post-treatment) with PDT (5.71 – 0.48, p = 0.001),and 1 h (5.14 – 0.92, p = 0.001) and 2 h (5.35 – 0.76, p = 0.001) after treatment, compared with pretreatment(6.61 – 0.82). There were no significant changes for the light group. The curcumin group showed a significantincrease of CFU 1 h after treatment (6.77 – 0.40, p = 0.02) compared with pretreatment (5.57 – 0.91) falling tobaseline values at 2 h after treatment (5.58 – 0.70). Conclusions: The PDT group showed significant differencein microbial reduction ( p < 0.05) compared with both the light and curcumin groups until 2 h post-treatment.The new blue LED device for PDT using curcumin may be used for reduction of salivary microorganisms,leading to overall disinfection of the mouth (e.g., mucosa, tongue, and saliva), but new protocols should beexplored.
Introduction
The normal mouth has a large number of bacteria.It results in increased risk of infection when many types
of surgical procedures are performed, mainly intraoral sur-gery. In these cases, prophylactic systemic antibiotics areused, but these drugs may be associated with unfavorable sideeffects. Oral antiseptics (for example, chlorhexidine) can alsobe used in these cases, but the reduction of intraoral bacterialcounts is temporary.1 In this context, new procedures for oraldisinfection should be investigated.
Blue light (405–470 nm) without the addition of exoge-nous photosensitizers (PS) has intrinsic antimicrobial effectand shows fewer deleterious effects to mammalian cellsthan ultraviolet irradiation.2 According Soukos et al.,3 theamount of endogenous porphyrin and/or other cell pigmentsproduced in Prevotella intermedia, Porphyromonas gingi-valis, Prevotella melaninogenica, and Prevotella nigrescenscan explain a susceptibility to blue light resulting in oraldisinfection.
Moreover, curcumin [1,7-bis(4-hydroxy-3-methoxyphenyl)-1,6-heptadiene-3,5,-dione] shows antimicrobial activity as
1Department of Biomedical Engineering from University of Camilo Castelo Branco (UNICASTELO) Sao Jose dos Campos, SP, Brazil.2Optics Group from Physics Institute of Sao Carlos (IFSC), University of Sao Paulo (USP), Sao Carlos, SP, Brazil.3Department of Clinical Analysis, School of Pharmaceutical Sciences, Universidade Estadual Paulista (UNESP), Araraquara, SP, Brazil.
Photomedicine and Laser SurgeryVolume 32, Number 11, 2014ª Mary Ann Liebert, Inc.Pp. 627–632DOI: 10.1089/pho.2014.3805
627
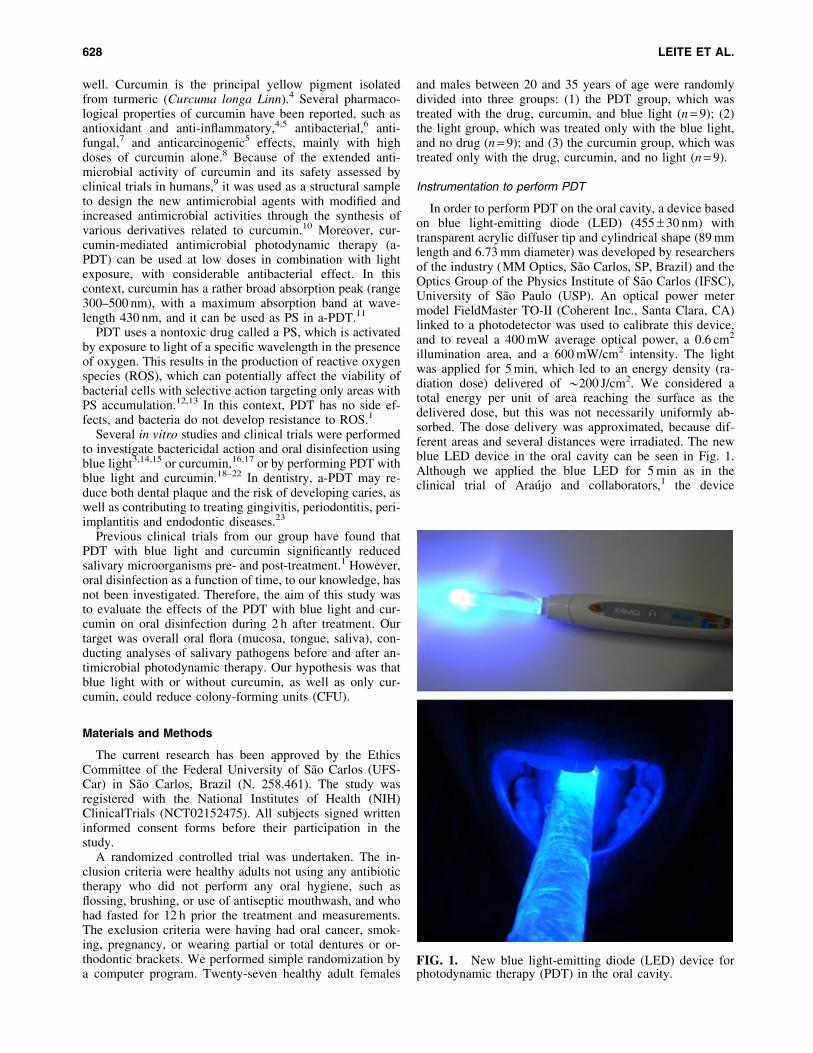
well. Curcumin is the principal yellow pigment isolatedfrom turmeric (Curcuma longa Linn).4 Several pharmaco-logical properties of curcumin have been reported, such asantioxidant and anti-inflammatory,4,5 antibacterial,6 anti-fungal,7 and anticarcinogenic5 effects, mainly with highdoses of curcumin alone.8 Because of the extended anti-microbial activity of curcumin and its safety assessed byclinical trials in humans,9 it was used as a structural sampleto design the new antimicrobial agents with modified andincreased antimicrobial activities through the synthesis ofvarious derivatives related to curcumin.10 Moreover, cur-cumin-mediated antimicrobial photodynamic therapy (a-PDT) can be used at low doses in combination with lightexposure, with considerable antibacterial effect. In thiscontext, curcumin has a rather broad absorption peak (range300–500 nm), with a maximum absorption band at wave-length 430 nm, and it can be used as PS in a-PDT.11
PDT uses a nontoxic drug called a PS, which is activatedby exposure to light of a specific wavelength in the presenceof oxygen. This results in the production of reactive oxygenspecies (ROS), which can potentially affect the viability ofbacterial cells with selective action targeting only areas withPS accumulation.12,13 In this context, PDT has no side ef-fects, and bacteria do not develop resistance to ROS.1
Several in vitro studies and clinical trials were performedto investigate bactericidal action and oral disinfection usingblue light3,14,15 or curcumin,16,17 or by performing PDT withblue light and curcumin.18–22 In dentistry, a-PDT may re-duce both dental plaque and the risk of developing caries, aswell as contributing to treating gingivitis, periodontitis, peri-implantitis and endodontic diseases.23
Previous clinical trials from our group have found thatPDT with blue light and curcumin significantly reducedsalivary microorganisms pre- and post-treatment.1 However,oral disinfection as a function of time, to our knowledge, hasnot been investigated. Therefore, the aim of this study wasto evaluate the effects of the PDT with blue light and cur-cumin on oral disinfection during 2 h after treatment. Ourtarget was overall oral flora (mucosa, tongue, saliva), con-ducting analyses of salivary pathogens before and after an-timicrobial photodynamic therapy. Our hypothesis was thatblue light with or without curcumin, as well as only cur-cumin, could reduce colony-forming units (CFU).
Materials and Methods
The current research has been approved by the EthicsCommittee of the Federal University of Sao Carlos (UFS-Car) in Sao Carlos, Brazil (N. 258.461). The study wasregistered with the National Institutes of Health (NIH)ClinicalTrials (NCT02152475). All subjects signed writteninformed consent forms before their participation in thestudy.
A randomized controlled trial was undertaken. The in-clusion criteria were healthy adults not using any antibiotictherapy who did not perform any oral hygiene, such asflossing, brushing, or use of antiseptic mouthwash, and whohad fasted for 12 h prior the treatment and measurements.The exclusion criteria were having had oral cancer, smok-ing, pregnancy, or wearing partial or total dentures or or-thodontic brackets. We performed simple randomization bya computer program. Twenty-seven healthy adult females
and males between 20 and 35 years of age were randomlydivided into three groups: (1) the PDT group, which wastreated with the drug, curcumin, and blue light (n = 9); (2)the light group, which was treated only with the blue light,and no drug (n = 9); and (3) the curcumin group, which wastreated only with the drug, curcumin, and no light (n = 9).
Instrumentation to perform PDT
In order to perform PDT on the oral cavity, a device basedon blue light-emitting diode (LED) (455 – 30 nm) withtransparent acrylic diffuser tip and cylindrical shape (89 mmlength and 6.73 mm diameter) was developed by researchersof the industry (MM Optics, Sao Carlos, SP, Brazil) and theOptics Group of the Physics Institute of Sao Carlos (IFSC),University of Sao Paulo (USP). An optical power metermodel FieldMaster TO-II (Coherent Inc., Santa Clara, CA)linked to a photodetector was used to calibrate this device,and to reveal a 400 mW average optical power, a 0.6 cm2
illumination area, and a 600 mW/cm2 intensity. The lightwas applied for 5 min, which led to an energy density (ra-diation dose) delivered of *200 J/cm2. We considered atotal energy per unit of area reaching the surface as thedelivered dose, but this was not necessarily uniformly ab-sorbed. The dose delivery was approximated, because dif-ferent areas and several distances were irradiated. The newblue LED device in the oral cavity can be seen in Fig. 1.Although we applied the blue LED for 5 min as in theclinical trial of Araujo and collaborators,1 the device
FIG. 1. New blue light-emitting diode (LED) device forphotodynamic therapy (PDT) in the oral cavity.
628 LEITE ET AL.
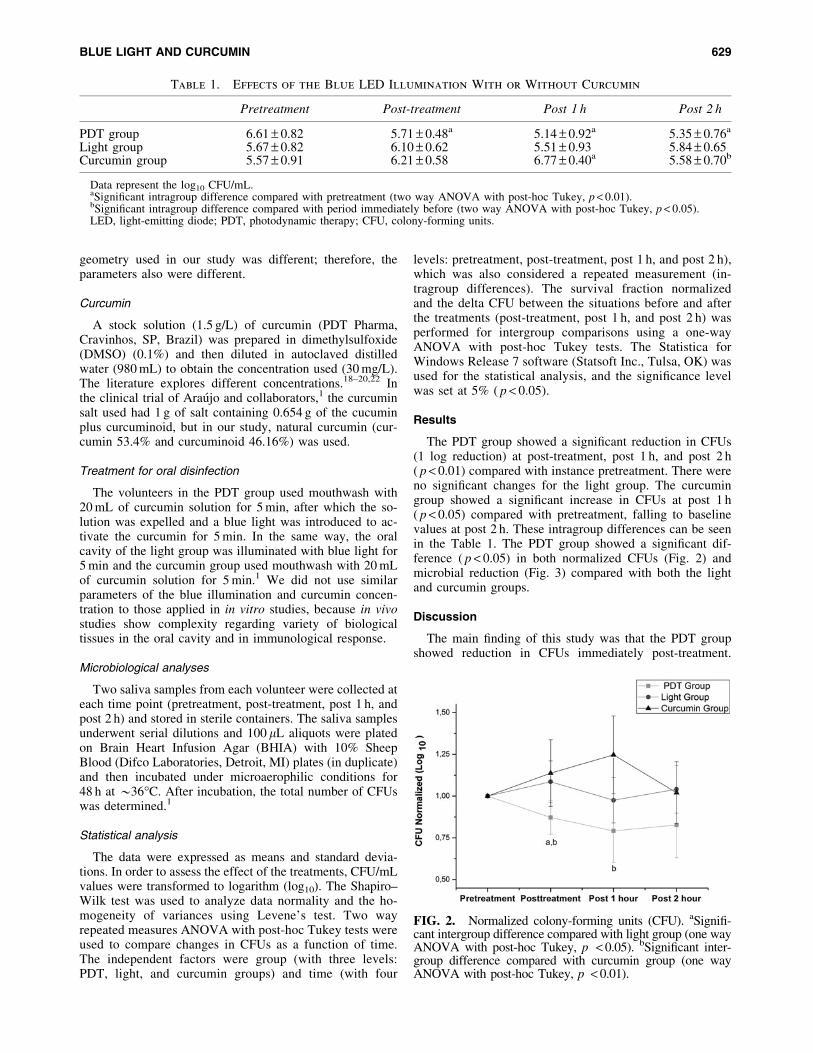
geometry used in our study was different; therefore, theparameters also were different.
Curcumin
A stock solution (1.5 g/L) of curcumin (PDT Pharma,Cravinhos, SP, Brazil) was prepared in dimethylsulfoxide(DMSO) (0.1%) and then diluted in autoclaved distilledwater (980 mL) to obtain the concentration used (30 mg/L).The literature explores different concentrations.18–20,22 Inthe clinical trial of Araujo and collaborators,1 the curcuminsalt used had 1 g of salt containing 0.654 g of the cucuminplus curcuminoid, but in our study, natural curcumin (cur-cumin 53.4% and curcuminoid 46.16%) was used.
Treatment for oral disinfection
The volunteers in the PDT group used mouthwash with20 mL of curcumin solution for 5 min, after which the so-lution was expelled and a blue light was introduced to ac-tivate the curcumin for 5 min. In the same way, the oralcavity of the light group was illuminated with blue light for5 min and the curcumin group used mouthwash with 20 mLof curcumin solution for 5 min.1 We did not use similarparameters of the blue illumination and curcumin concen-tration to those applied in in vitro studies, because in vivostudies show complexity regarding variety of biologicaltissues in the oral cavity and in immunological response.
Microbiological analyses
Two saliva samples from each volunteer were collected ateach time point (pretreatment, post-treatment, post 1 h, andpost 2 h) and stored in sterile containers. The saliva samplesunderwent serial dilutions and 100 lL aliquots were platedon Brain Heart Infusion Agar (BHIA) with 10% SheepBlood (Difco Laboratories, Detroit, MI) plates (in duplicate)and then incubated under microaerophilic conditions for48 h at *36C. After incubation, the total number of CFUswas determined.1
Statistical analysis
The data were expressed as means and standard devia-tions. In order to assess the effect of the treatments, CFU/mLvalues were transformed to logarithm (log10). The Shapiro–Wilk test was used to analyze data normality and the ho-mogeneity of variances using Levene’s test. Two wayrepeated measures ANOVA with post-hoc Tukey tests wereused to compare changes in CFUs as a function of time.The independent factors were group (with three levels:PDT, light, and curcumin groups) and time (with four
levels: pretreatment, post-treatment, post 1 h, and post 2 h),which was also considered a repeated measurement (in-tragroup differences). The survival fraction normalizedand the delta CFU between the situations before and afterthe treatments (post-treatment, post 1 h, and post 2 h) wasperformed for intergroup comparisons using a one-wayANOVA with post-hoc Tukey tests. The Statistica forWindows Release 7 software (Statsoft Inc., Tulsa, OK) wasused for the statistical analysis, and the significance levelwas set at 5% ( p < 0.05).
Results
The PDT group showed a significant reduction in CFUs(1 log reduction) at post-treatment, post 1 h, and post 2 h( p < 0.01) compared with instance pretreatment. There wereno significant changes for the light group. The curcumingroup showed a significant increase in CFUs at post 1 h( p < 0.05) compared with pretreatment, falling to baselinevalues at post 2 h. These intragroup differences can be seenin the Table 1. The PDT group showed a significant dif-ference ( p < 0.05) in both normalized CFUs (Fig. 2) andmicrobial reduction (Fig. 3) compared with both the lightand curcumin groups.
Discussion
The main finding of this study was that the PDT groupshowed reduction in CFUs immediately post-treatment.
Table 1. Effects of the Blue LED Illumination With or Without Curcumin
Pretreatment Post-treatment Post 1 h Post 2 h
PDT group 6.61 – 0.82 5.71 – 0.48a 5.14 – 0.92a 5.35 – 0.76a
Light group 5.67 – 0.82 6.10 – 0.62 5.51 – 0.93 5.84 – 0.65Curcumin group 5.57 – 0.91 6.21 – 0.58 6.77 – 0.40a 5.58 – 0.70b
Data represent the log10 CFU/mL.aSignificant intragroup difference compared with pretreatment (two way ANOVA with post-hoc Tukey, p < 0.01).bSignificant intragroup difference compared with period immediately before (two way ANOVA with post-hoc Tukey, p < 0.05).LED, light-emitting diode; PDT, photodynamic therapy; CFU, colony-forming units.
FIG. 2. Normalized colony-forming units (CFU). aSignifi-cant intergroup difference compared with light group (one wayANOVA with post-hoc Tukey, p < 0.05). bSignificant inter-group difference compared with curcumin group (one wayANOVA with post-hoc Tukey, p < 0.01).
BLUE LIGHT AND CURCUMIN 629
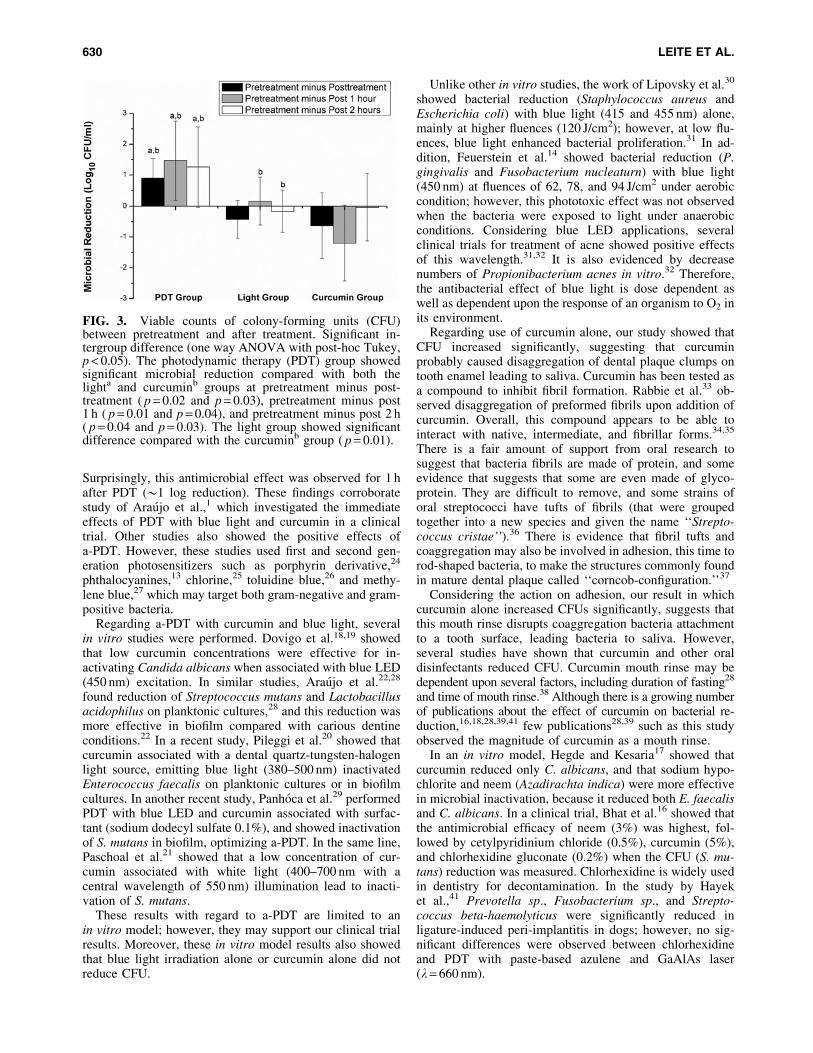
Surprisingly, this antimicrobial effect was observed for 1 hafter PDT (*1 log reduction). These findings corroboratestudy of Araujo et al.,1 which investigated the immediateeffects of PDT with blue light and curcumin in a clinicaltrial. Other studies also showed the positive effects ofa-PDT. However, these studies used first and second gen-eration photosensitizers such as porphyrin derivative,24
phthalocyanines,13 chlorine,25 toluidine blue,26 and methy-lene blue,27 which may target both gram-negative and gram-positive bacteria.
Regarding a-PDT with curcumin and blue light, severalin vitro studies were performed. Dovigo et al.18,19 showedthat low curcumin concentrations were effective for in-activating Candida albicans when associated with blue LED(450 nm) excitation. In similar studies, Araujo et al.22,28
found reduction of Streptococcus mutans and Lactobacillusacidophilus on planktonic cultures,28 and this reduction wasmore effective in biofilm compared with carious dentineconditions.22 In a recent study, Pileggi et al.20 showed thatcurcumin associated with a dental quartz-tungsten-halogenlight source, emitting blue light (380–500 nm) inactivatedEnterococcus faecalis on planktonic cultures or in biofilmcultures. In another recent study, Panhoca et al.29 performedPDT with blue LED and curcumin associated with surfac-tant (sodium dodecyl sulfate 0.1%), and showed inactivationof S. mutans in biofilm, optimizing a-PDT. In the same line,Paschoal et al.21 showed that a low concentration of cur-cumin associated with white light (400–700 nm with acentral wavelength of 550 nm) illumination lead to inacti-vation of S. mutans.
These results with regard to a-PDT are limited to anin vitro model; however, they may support our clinical trialresults. Moreover, these in vitro model results also showedthat blue light irradiation alone or curcumin alone did notreduce CFU.
Unlike other in vitro studies, the work of Lipovsky et al.30
showed bacterial reduction (Staphylococcus aureus andEscherichia coli) with blue light (415 and 455 nm) alone,mainly at higher fluences (120 J/cm2); however, at low flu-ences, blue light enhanced bacterial proliferation.31 In ad-dition, Feuerstein et al.14 showed bacterial reduction (P.gingivalis and Fusobacterium nucleaturn) with blue light(450 nm) at fluences of 62, 78, and 94 J/cm2 under aerobiccondition; however, this phototoxic effect was not observedwhen the bacteria were exposed to light under anaerobicconditions. Considering blue LED applications, severalclinical trials for treatment of acne showed positive effectsof this wavelength.31,32 It is also evidenced by decreasenumbers of Propionibacterium acnes in vitro.32 Therefore,the antibacterial effect of blue light is dose dependent aswell as dependent upon the response of an organism to O2 inits environment.
Regarding use of curcumin alone, our study showed thatCFU increased significantly, suggesting that curcuminprobably caused disaggregation of dental plaque clumps ontooth enamel leading to saliva. Curcumin has been tested asa compound to inhibit fibril formation. Rabbie et al.33 ob-served disaggregation of preformed fibrils upon addition ofcurcumin. Overall, this compound appears to be able tointeract with native, intermediate, and fibrillar forms.34,35
There is a fair amount of support from oral research tosuggest that bacteria fibrils are made of protein, and someevidence that suggests that some are even made of glyco-protein. They are difficult to remove, and some strains oforal streptococci have tufts of fibrils (that were groupedtogether into a new species and given the name ‘‘Strepto-coccus cristae’’).36 There is evidence that fibril tufts andcoaggregation may also be involved in adhesion, this time torod-shaped bacteria, to make the structures commonly foundin mature dental plaque called ‘‘corncob-configuration.’’37
Considering the action on adhesion, our result in whichcurcumin alone increased CFUs significantly, suggests thatthis mouth rinse disrupts coaggregation bacteria attachmentto a tooth surface, leading bacteria to saliva. However,several studies have shown that curcumin and other oraldisinfectants reduced CFU. Curcumin mouth rinse may bedependent upon several factors, including duration of fasting28
and time of mouth rinse.38 Although there is a growing numberof publications about the effect of curcumin on bacterial re-duction,16,18,28,39,41 few publications28,39 such as this studyobserved the magnitude of curcumin as a mouth rinse.
In an in vitro model, Hegde and Kesaria17 showed thatcurcumin reduced only C. albicans, and that sodium hypo-chlorite and neem (Azadirachta indica) were more effectivein microbial inactivation, because it reduced both E. faecalisand C. albicans. In a clinical trial, Bhat et al.16 showed thatthe antimicrobial efficacy of neem (3%) was highest, fol-lowed by cetylpyridinium chloride (0.5%), curcumin (5%),and chlorhexidine gluconate (0.2%) when the CFU (S. mu-tans) reduction was measured. Chlorhexidine is widely usedin dentistry for decontamination. In the study by Hayeket al.,41 Prevotella sp., Fusobacterium sp., and Strepto-coccus beta-haemolyticus were significantly reduced inligature-induced peri-implantitis in dogs; however, no sig-nificant differences were observed between chlorhexidineand PDT with paste-based azulene and GaAlAs laser(k = 660 nm).
FIG. 3. Viable counts of colony-forming units (CFU)between pretreatment and after treatment. Significant in-tergroup difference (one way ANOVA with post-hoc Tukey,p < 0.05). The photodynamic therapy (PDT) group showedsignificant microbial reduction compared with both thelighta and curcuminb groups at pretreatment minus post-treatment ( p = 0.02 and p = 0.03), pretreatment minus post1 h ( p = 0.01 and p = 0.04), and pretreatment minus post 2 h( p = 0.04 and p = 0.03). The light group showed significantdifference compared with the curcuminb group ( p = 0.01).
630 LEITE ET AL.
The action of curcumin alone as mouth rinse is quiteencouraging for a further development of the technique, asprewash plaque remover and the reduction of 1 log for 2 hafter PDT is an excellent result, considering the advantagesof curcumin being a natural substance and harmless to theoral tissues. Overall, decontamination using a simple pro-cedure is desirable for general use in dentistry. In thiscontext, the reduction of bacterial counts and its maintenanceduring 2 h are important for several intraoral surgical proce-dures during a single session. Moreover, bacterial reductionis initiated on superficial surfaces of the oral environment,and after multiples sessions of PDT, deeper layers can beachieved. PDT is cumulatively bactericidal.42 However,some limitations of our study were the small sample size pergroup, and not having used different procedures for opti-mizing a-PDT. Future studies should explore these aspects.
Conclusions
In conclusion, in this study, the results indicate that cur-cumin has a potential to disaggregate oral plaque, and thenew blue LED device for PDT-curcumin may be used forreduction of salivary microorganisms lasting 2 h, leading tooverall disinfection of the mouth for several intraoral sur-gical procedures during a single session of dentistry. How-ever, new protocols should be explored to optimize a-PDT.
Acknowledgments
The authors thank the National Council for Scientific andTechnological Development (CNPq) - grant no. 573587/2008 and the Sao Paulo Research Foundation (FAPESP) -grant nos. 2013/07276-1 and 2013/14001-9 for financialsupport. The authors also acknowledge scientific contributionsand helpful advice from Herica Ricci and Vitor Hugo Panhoca.
Author Disclosure Statement
No competing financial interests exist.
References
1. Araujo, N.C., Fontana, C.R., Gerbi, M.E., and Bagnato,V.S. (2012). Overall-mouth disinfection by photodynamictherapy using curcumin. Photomed. Laser Surg. 30, 96–101.
2. Dai, T., Gupta, A., Murray, C.K., Vrahas, M.S., Tegos,G.P., and Hamblin, M.R. (2012). Blue light for infectiousdiseases: Propionibacterium acnes, Helicobacter pylori, andbeyond? Drug Resist. Updat. 15, 223–236.
3. Soukos, N.S., Som, S., Abernethy, A.D., Ruggiero, K.,Dunham, J., Lee, C, Doukas, A.G., and Goodson, J.M.(2005). Phototargeting oral black-pigmented bacteria. An-timicrob. Agents Chemother. 49, 1391–1396.
4. Somparn, P., Phisalaphong, C., Nakornchai, S., Unchern,S., and Morales, N.P. (2007). Comparative antioxidantactivities of curcumin and its demethoxy and hydrogenatedderivatives. Biol. Pharm. Bull. 30, 74–78.
5. Aggarwal, B.B., Kumar, A., and Bharti, A.C. (2003). An-ticancer potential of curcumin: preclinical and clinicalstudies. Anticancer Res. 23, 363–398.
6. Tajbakhsh, S., Mohammadi, K., Deilami, I., Keivan, Z.,Fouladvand, M., Ramedani, E., and Asayesh, G. (2008).Antibacterial activity of indium curcumin and indium dia-cetylcurcumin. Afr. J. Biotechnol. 7, 3832–3835.
7. Martins, C.V., da Silva, D.L., Neres, A.T., Magalhaes, T.F.,Watanabe, G.A., Modolo, L.V., Sabino, A.A., de Fatima,A., and de Resende, M.A. (2009). Curcumin as a promisingantifungal of clinical interest. J. Antimicrob. Chemother.63, 337–339.
8. Moghadamtousi, S.Z., Kadir, H.A., Hassandarvish, P., Ta-jik, H., Abubakar, S., and Zandi, K. (2014). A review onantibacterial, antiviral, and antifungal activity of curcumin.Biomed. Res. Int. 2014:186864.
9. Hatcher, H., Planalp, R., Cho, J., Torti, F.M., and Torti,S.V. (2008). Curcumin: from ancient medicine to currentclinical trials. Cell Mol. Life Sci. 65, 1631–1652.
10. Anand, P., Kunnumakkara, A.B., Newman, R.A., and Ag-garwal, B.B. (2007). Bioavailability of curcumin: problemsand promises. Mol Pharm. 4, 807–818.
11. Haukvik, T., Bruzell, E., Kristensen, S., and Tønnesen,H.H. (2010). Photokilling of bacteria by curcumin in se-lected polyethylene glycol 400 (PEG 400) preparations.Studies on curcumin and curcuminoids, XLI. Pharmazie 65,600–606.
12. Dai, T., Huang, Y.Y., and Hamblin, M.R. (2009). Photo-dynamic therapy for localized infections state of the art.Photodiagnosis Photodyn Ther. 6, 170–188.
13. Longo, J.P., Leal, S.C., Simioni, A.R., de Fatima,M.M.A.S., Tedesco, A.C., and Azevedo, R.B. (2012).Photodynamic therapy disinfection of carious tissue medi-ated by aluminum-chloride-phthalocyanine entrapped incationic liposomes: an in vitro and clinical study. LasersMed. Sci. 27, 575–584.
14. Feuerstein, O., Ginsburg, I., Dayan, E., Veler, D., andWeiss, E.I. (2005). Mechanism of visible light phototox-icity on Porphyromonas gingivalis and Fusobacterium nu-cleatum. Photochem. Photobiol. Photochem. Photobiol. 81,1186–1189.
15. Bumah, V.V., Masson–Meyers, D.S., Cashin, S.E., andEnwemeka, C.S. (2013). Wavelength and bacterial densityinfluence the bactericidal effect of blue light on methicillin-resistant Staphylococcus aureus (MRSA). Photomed. LaserSurg. 31, 547–553.
16. Bhat, P.K., Badiyani, B.K., Sarkar, S., Chengappa, S., andBhaskar, N.N. (2012). Effectiveness of antimicrobial so-lutions on Streptococcus mutans in used toothbrushes.World J. Dent. 3, 6–10.
17. Hegde, V., and Kesaria, D.P. (2013). Comparative evalu-ation of antimicrobial activity of neem, propolis, turmeric,liquorice and sodium hypochlorite as root canal irrigantsagainst E. Faecalis and C. Albicans – An in vitro study.Endodontology 25, 38–45.
18. Dovigo, L.N., Pavarina, A.C., Carmello, J.C., Machado,A.L., Brunetti, I.L., and Bagnato, V.S. (2011). Suscept-ibility of clinical isolates of Candida to photodynamic ef-fects of curcumin. Lasers Surg. Med. 43, 927–934.
19. Dovigo, L.N., Pavarina, A.C., Ribeiro, A.P., Brunetti, I.L.,Costa, C.A., Jacomassi, D.P., Bagnato, V.S., and Kurachi,C. (2011). Investigation of the photodynamic effects ofcurcumin against Candida albicans. Photochem. Photobiol.87, 895–903.
20. Pileggi, G., Wataha, J.C., Girard, M., Grad, I., Schrenzel, J.,Lange, N., and Bouillaguet, S. (2013). Blue light-mediatedinactivation of Enterococcus faecalis in vitro. Photo-diagnosis Photodyn. Ther. 10, 134–140.
21. Paschoal, M.A., Santos–Pinto, L., Lin, M., and Duarte, S.(2014). Streptococcus mutans photoinactivation by com-bination of short exposure of a broad-spectrum visible light
BLUE LIGHT AND CURCUMIN 631
and low concentrations of photosensitizers. Photomed.Laser Surg. 32, 175–180.
22. Araujo, N.C., Fontana, C.R., Bagnato, V.S., and Gerbi,M.E. (2014). Photodynamic antimicrobial therapy of cur-cumin in biofilms and carious dentine. Lasers Med. Sci. 29,629–635.
23. Gursoy, H., Ozcakir–Tomruk, C., Tanalp, J., and Yilmaz,S. (2013). Photodynamic therapy in dentistry: a literaturereview. Clin. Oral Investig. 17, 1113–1125.
24. Fontana, C.R., Lerman, M.A., Patel, N., Grecco, C., Costa,C.A., Amiji, M.M., Bagnato, V.S., and Soukos, N.S.(2013). Safety assessment of oral photodynamic therapy inrats. Lasers Med. Sci. 28, 479–486.
25. Fekrazad, R., Bargrizan, M., Sajadi, S., and Sajadi, S.(2011). Evaluation of the effect of photoactivated disin-fection with Radachlorin against Streptococcus mutans(an in vitro study). Photodiagnosis Photodyn. Ther. 8, 249–253.
26. Komerik, N., Nakanishi, H., MacRobert, A.J., Henderson,B., Speight, P., and Wilson, M. (2003). In vivo killing ofPorphyromonas gingivalis by toluidine blue-mediatedphotosensitization in an animal model. Antimicrob. AgentsChemother. 47, 932–940.
27. Soukos, N.S., Chen, P.S., Morris, J.T., Ruggiero, K.,Abernethy, A.D., Som, S., Foschi, F., Doucette, S., Bam-mann, L.L., Fontana, C.R., Doukas, A.G., and Stashenko,P.P. (2006). Photodynamic therapy for endodontic disin-fection. J. Endod. 32, 979–984.
28. Araujo, N.C., Fontana, C.R., Bagnato, V.S., and Gerbi,M.E. (2012). Photodynamic effects of curcumin againstcariogenic pathogens. Photomed. Laser Surg. 30, 393–399.
29. Panhoca, V.H., Geralde, M.C., Correa, T.Q., Carvalho,M.T., Souza, C.W.O.S., and Bagnato, V.S. (2014). En-hancement of the photodynamic therapy effects on Strep-tococcus Mutans biofilm. J. Phys. Sci. Applic. 4, 107–114.
30. Lipovsky, A., Nitzan, Y., Gedanken, A., and Lubart, R.(2010). Visible light-induced killing of bacteria as a func-tion of wavelength: implication for wound healing. LasersSurg. Med. 42, 467–472.
31. Wheeland, R.G., and Koreck, A. (2012). Safety and ef-fectiveness of a new blue light device for the self-treatmentof mild-to-moderate acne. J. Clin. Aesthet. Dermatol. 5,25–31.
32. Kawada, A., Aragane, Y., Kameyama, H., Sangen, Y., andTezuka, T. (2002). Acne phototherapy with a high–intensity,enhanced, narrow-band, blue light source: an open study andin vitro investigation. J. Dermatol. Sci. 30, 129–135.
33. Rabiee, A., Ebrahim–Habibi, A., Ghasemi, A., and Nemat–Gorgani, M. (2013). How curcumin affords effective pro-tection against amyloid fibrillation in insulin. Food Funct.4, 1474–1480.
34. Palmal, S., Maity, A.R., Singh, B.K., Basu, S., Jana, N.R.,and Jana, N.R. (2014). Inhibition of amyloid fibril growthand dissolution of amyloid fibrils by curcumin-gold nano-particles. Chemistry 20, 6184–6191.
35. Marchiani, A., Rozzo, C., Fadda, A., Delogu, G., andRuzza, P. (2014). Curcumin and curcumin-like molecules:from spice to drugs. Curr. Med. Chem. 21, 204–222.
36. Handley, P.S., Correia, F.F., Russell, K., Rosan, B., andDiRienzo, J.M. (2005). Association of a novel highmolecular weight, serine-rich protein (SrpA) with fibril-mediated adhesion of the oral biofilm bacterium Strepto-coccus cristatus. Oral Microbiol. Immunol. 20, 131–140.
37. Levesque, C., Lamothe, J., and Frenette, M. (2003).Coaggregation of Streptococcus salivarius with period-ontopathogens: evidence for involvement of fimbriae in theinteraction with Prevotella intermedia. Oral Microbiol.Immunol. 18, 333–337.
38. Muglikar, S., Patil, K.C., Shivswami, S., and Hegde, R.(2013). Efficacy of curcumin in the treatment of chronicgingivitis: a pilot study. Oral Health Prev. Dent. 11, 81–86.
39. Bhawana, Basniwal, R.K., Buttar, H.S., Jain, V.K., andJain, N. (2011). Curcumin nanoparticles: preparation,characterization, and antimicrobial study. J Agric FoodChem. 59, 2056–2061.
40. Vimala, K., Varaprasad, K., Sadiku, R., Ramam, K., andKanny, K. (2013). Development of novel protein-Ag na-nocomposite for drug delivery and inactivation of bacterialapplications. Int. J. Biol. Macromol. 63, 75–82.
41. Hayek, R.R., Araujo, N.S., Gioso, M.A., Ferreira, J., Bap-tista–Sobrinho, C.A., Yamada, A.M., and Ribeiro, M.S.(2005). Comparative study between the effects of photo-dynamic therapy and conventional therapy on microbialreduction in ligature-induced peri-implantitis in dogs. J.Periodontol. 76, 1275–1281.
42. Muller Campanile, V.S., Giannopoulou, C., Campanile, G.,Cancela, J.A., and Mombelli, A. (2013). Single or repeatedantimicrobial photodynamic therapy as adjunct to ultra-sonic debridement in residual periodontal pockets: clinical,microbiological, and local biological effects. Lasers Med.Sci. 2013 May 10. [Epub ahead of print].
Address correspondence to:Fernanda Rossi Paolillo
University of Sao Paulo (USP)Av. Trabalhador Saocarlense
400 – Centro, CEP 13560-970Sao Carlos, SP
Brazil
E-mail: [email protected]
632 LEITE ET AL.
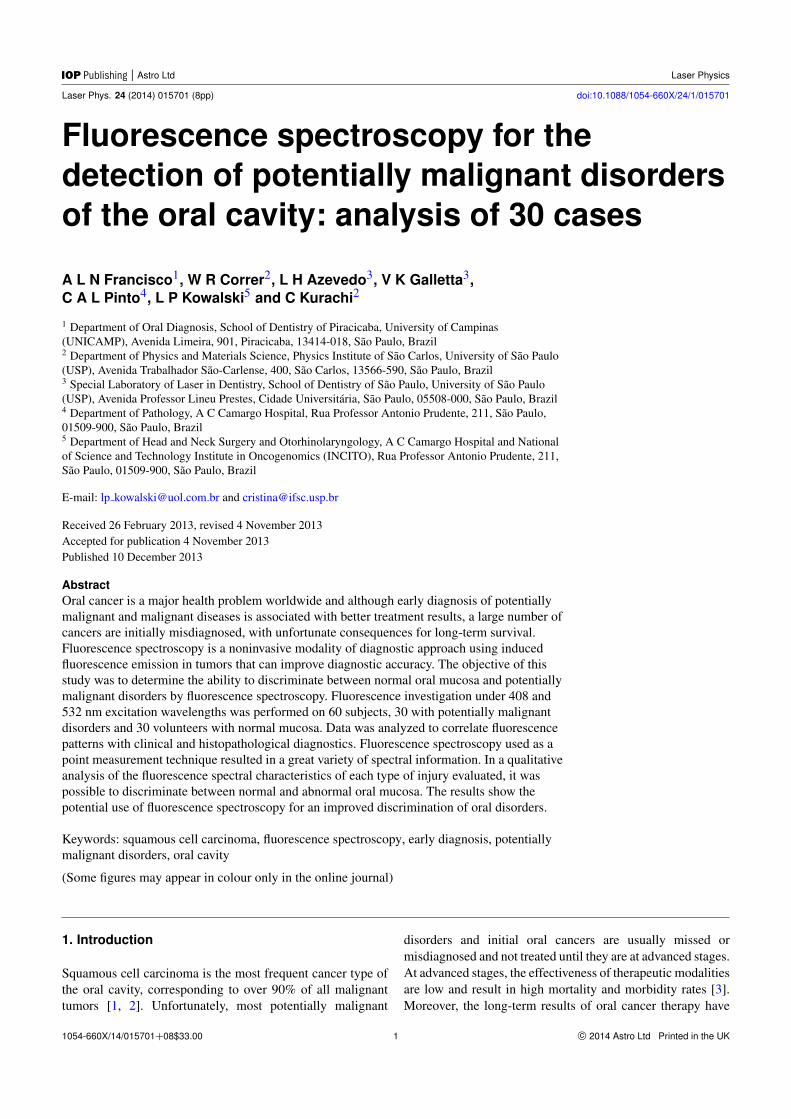
| Astro Ltd Laser Physics
Laser Phys. 24 (2014) 015701 (8pp) doi:10.1088/1054-660X/24/1/015701
Fluorescence spectroscopy for thedetection of potentially malignant disordersof the oral cavity: analysis of 30 cases
A L N Francisco1, W R Correr2, L H Azevedo3, V K Galletta3,C A L Pinto4, L P Kowalski5 and C Kurachi2
1 Department of Oral Diagnosis, School of Dentistry of Piracicaba, University of Campinas(UNICAMP), Avenida Limeira, 901, Piracicaba, 13414-018, Sao Paulo, Brazil2 Department of Physics and Materials Science, Physics Institute of Sao Carlos, University of Sao Paulo(USP), Avenida Trabalhador Sao-Carlense, 400, Sao Carlos, 13566-590, Sao Paulo, Brazil3 Special Laboratory of Laser in Dentistry, School of Dentistry of Sao Paulo, University of Sao Paulo(USP), Avenida Professor Lineu Prestes, Cidade Universitaria, Sao Paulo, 05508-000, Sao Paulo, Brazil4 Department of Pathology, A C Camargo Hospital, Rua Professor Antonio Prudente, 211, Sao Paulo,01509-900, Sao Paulo, Brazil5 Department of Head and Neck Surgery and Otorhinolaryngology, A C Camargo Hospital and Nationalof Science and Technology Institute in Oncogenomics (INCITO), Rua Professor Antonio Prudente, 211,Sao Paulo, 01509-900, Sao Paulo, Brazil
E-mail: lp [email protected] and [email protected]
Received 26 February 2013, revised 4 November 2013Accepted for publication 4 November 2013Published 10 December 2013
AbstractOral cancer is a major health problem worldwide and although early diagnosis of potentiallymalignant and malignant diseases is associated with better treatment results, a large number ofcancers are initially misdiagnosed, with unfortunate consequences for long-term survival.Fluorescence spectroscopy is a noninvasive modality of diagnostic approach using inducedfluorescence emission in tumors that can improve diagnostic accuracy. The objective of thisstudy was to determine the ability to discriminate between normal oral mucosa and potentiallymalignant disorders by fluorescence spectroscopy. Fluorescence investigation under 408 and532 nm excitation wavelengths was performed on 60 subjects, 30 with potentially malignantdisorders and 30 volunteers with normal mucosa. Data was analyzed to correlate fluorescencepatterns with clinical and histopathological diagnostics. Fluorescence spectroscopy used as apoint measurement technique resulted in a great variety of spectral information. In a qualitativeanalysis of the fluorescence spectral characteristics of each type of injury evaluated, it waspossible to discriminate between normal and abnormal oral mucosa. The results show thepotential use of fluorescence spectroscopy for an improved discrimination of oral disorders.
Keywords: squamous cell carcinoma, fluorescence spectroscopy, early diagnosis, potentiallymalignant disorders, oral cavity
(Some figures may appear in colour only in the online journal)
1. Introduction
Squamous cell carcinoma is the most frequent cancer type ofthe oral cavity, corresponding to over 90% of all malignanttumors [1, 2]. Unfortunately, most potentially malignant
disorders and initial oral cancers are usually missed ormisdiagnosed and not treated until they are at advanced stages.At advanced stages, the effectiveness of therapeutic modalitiesare low and result in high mortality and morbidity rates [3].Moreover, the long-term results of oral cancer therapy have
11054-660X/14/015701+08$33.00 c© 2014 Astro Ltd Printed in the UK
Laser Phys. 24 (2014) 015701 A L N Francisco et al
been significantly hindered by the development of secondprimary tumors. Therefore, early detection of neoplasticchanges in the oral cavity is essential to improve survivalrates [4].
In clinical practice, an accurate clinical examinationand biopsy of a suspect lesion must be done to determinethe diagnosis [5]. However, most oral cavity squamouscell carcinomas do not originate from potentially malignantdisorders nor from other noticeable clinical changes in theoral mucosa [6, 7]. Most potentially malignant disordersare clinically present as leukoplakia or erythroplakia, buthistologically they may have a wide range of phenotypessuch as hyperkeratosis or dysplasia [8]. On the otherhand, similar clinical features of carcinomas at the initialstage and benign lesions are major factors making earlycancer diagnosis a difficult task. Incisional biopsy remainsas the gold standard diagnostic method for the detectionof oral neoplasia, but the choice of a proper biopsysite in a large non-homogeneous potentially malignantdisorder or malignant lesion is not simple and can resultin misdiagnosis. Recently, optical techniques have beendeveloped, aiming to became auxiliary tools to addressthese challenges [9–12]. Due to its sensitivity to tissuealterations, optical diagnosis has been indicated, not only forcancer detection, but also for other diagnostic applications,such as dental calculus and demineralization [13, 14].Among those techniques, fluorescence spectroscopy is anoninvasive, accurate and fast diagnostic method that canbe potentially used for the early detection and diagnosisof cancer in real time [15]. Its principal feature relieson the fact that several changes taking place alongtumorigenesis alter light/tissue interactions, including tissuefluorescence, and these normal oral mucosa and potentiallymalignant or malignant lesions present distinct fluorescencespectra [16, 17].
Pavlova et al studied a Monte Carlo model that showedvariations in optical parameters associated with neoplasticdevelopment that influence the intensity and shape of thefluorescence spectra. Changes associated with dysplasticprogression were associated with a decreased fluorescenceintensity and an emission shift to longer wavelengths [17].Several in vitro and in vivo studies have shown the efficiencyof fluorescence spectroscopy for oral cancer discriminationwith high rates of sensitivity and specificity [10, 16]. Clinicalstudies have also presented the potential of this techniqueto improve cancer diagnosis, even though the discriminationof potentially malignant disorders versus cancer is stillcontradictory in the literature [18, 10].
In this study, we report the results obtained using a doubleexcitation fluorescence spectroscopy system in 30 patientspresenting oral leukoplakia and/or erythroplakia and in 30volunteers with normal oral mucosa. Spectral analysis wasperformed using principal component analysis combined withclinical impression and histopathological diagnosis.
2. Patients and methods
The subjects included in this prospective clinical study were30 volunteers with normal oral mucosa and no history of
malignancy in the upper digestive tract, and 30 patients withpotentially malignant disorders clinically detectable at variousstages of development. All subjects were over 18 years old,both genders, smokers and nonsmokers. The investigatedlesions were located in the oral cavity and a biopsy was takenfor histological diagnosis. The biopsy site was chosen basedonly on clinical examination. All patients were investigated atthe Special Laboratory of Laser in Dentistry, University of SaoPaulo (LELO-USP) and Hospital A C Camargo, Sao Paulo,after a written informed consent was signed.
A homemade fluorescence spectroscopy system was usedin this study. The system is composed of two excitationlasers (408 nm diode laser and 532 nm frequency-doubledNd:YAG laser), a Y-type probe (Ocean Optics, USA), aUSB-spectrometer (USB-4000-Ocean Optics, USA) and alaptop. The Y-type probe with two 600 µm optical fibers isconnected on one end to the excitation laser and the otherend to the spectrometer, and the investigation tip is enclosedin an aluminum handpiece. The external diameter of theinterrogation tip is 2.5 mm.
All subjects answered an anamnestic form with medicalinformation about habits associated with the etiology ofcancer (smoking and alcohol), family history, among others.A detailed clinical examination was carried out, resultingin a clinical diagnosis following the classification in normalmucosa and abnormal mucosa (erythroplakia, leukoplakia orerythroleukoplakia) and the definition of the biopsy site.
A mouth washing with saline solution was performedjust before optical measurements to minimize possiblecontaminants in the mucosa, such as food scraps. The subjectshad fasted for at least 1 h before the examination to preventdye intake and alteration of the fluorescence pattern of theinvestigated mucosa.
Each measurement site was assessed using excitationwavelengths at 408 and 532 nm. For patients with a clinicallydetectable lesion with a diameter of less than 1 cm, theentire altered area was screened with the needed points tocover the lesion surface. In patients with lesions greaterthan 1 cm in diameter, and in the case of identification ofsurface heterogeneity, representative regions were chosen tocorrelate with different clinical patterns, avoiding any area ofnecrosis. In each chosen site, at least five spectra, for eachexcitation wavelength, were taken to check the variabilityon measurement performance. All the optical measurementswere taken by a single operator (ALNF).
Four-mm punch biopsies were taken after the previousdentist/physician decision based on clinical impression, andthe correlated fluorescence spectrum identified. The tissuesample was stained for HE analysis and the slides wereevaluated by certified pathologists blinded to the clinicalimpression and fluorescence spectra (figure 1).
Normal volunteers were investigated at distinct oral sites:lateral border of the tongue, dorsum of the tongue, floor ofthe mouth, lower lip mucosa, buccal mucosa, gingiva andhard palate, with five optical measurements per excitationwavelength for each site. Cytological material was collectedfrom all investigated sites using Oral CDX brush biopsy andfixed with 95% ethanol for the smear slide.
2
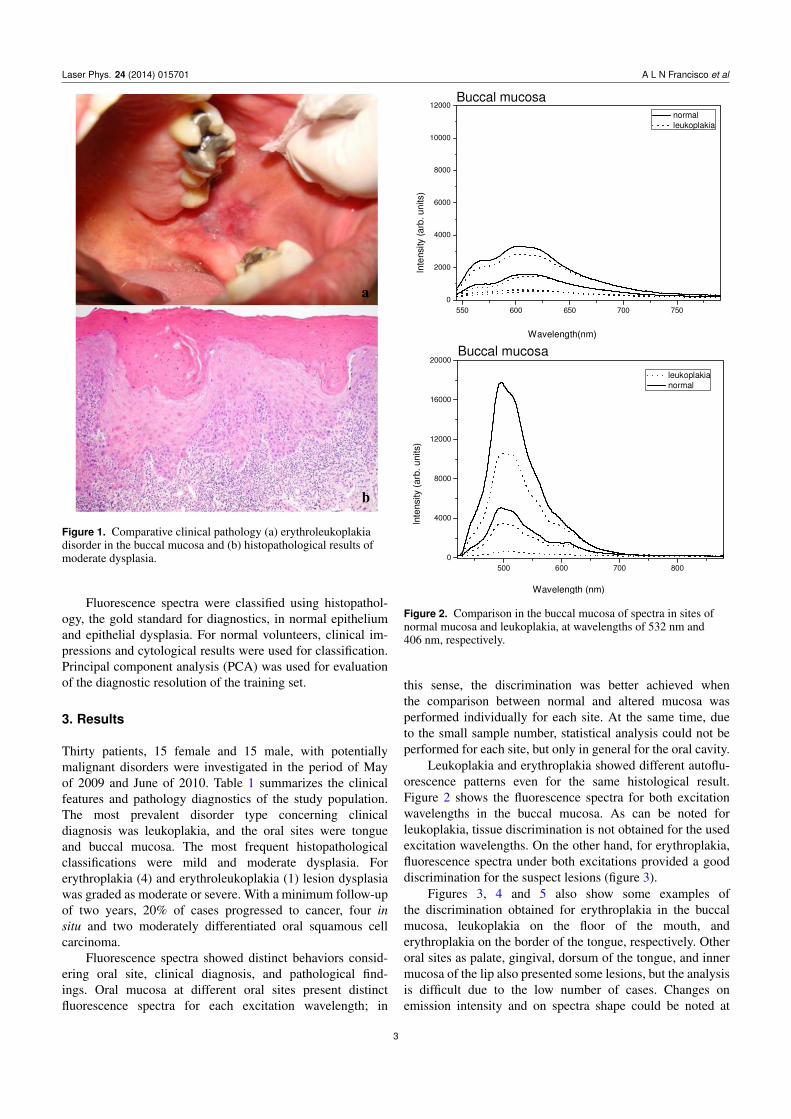
Laser Phys. 24 (2014) 015701 A L N Francisco et al
Figure 1. Comparative clinical pathology (a) erythroleukoplakiadisorder in the buccal mucosa and (b) histopathological results ofmoderate dysplasia.
Fluorescence spectra were classified using histopathol-ogy, the gold standard for diagnostics, in normal epitheliumand epithelial dysplasia. For normal volunteers, clinical im-pressions and cytological results were used for classification.Principal component analysis (PCA) was used for evaluationof the diagnostic resolution of the training set.
3. Results
Thirty patients, 15 female and 15 male, with potentiallymalignant disorders were investigated in the period of Mayof 2009 and June of 2010. Table 1 summarizes the clinicalfeatures and pathology diagnostics of the study population.The most prevalent disorder type concerning clinicaldiagnosis was leukoplakia, and the oral sites were tongueand buccal mucosa. The most frequent histopathologicalclassifications were mild and moderate dysplasia. Forerythroplakia (4) and erythroleukoplakia (1) lesion dysplasiawas graded as moderate or severe. With a minimum follow-upof two years, 20% of cases progressed to cancer, four insitu and two moderately differentiated oral squamous cellcarcinoma.
Fluorescence spectra showed distinct behaviors consid-ering oral site, clinical diagnosis, and pathological find-ings. Oral mucosa at different oral sites present distinctfluorescence spectra for each excitation wavelength; in
Figure 2. Comparison in the buccal mucosa of spectra in sites ofnormal mucosa and leukoplakia, at wavelengths of 532 nm and406 nm, respectively.
this sense, the discrimination was better achieved whenthe comparison between normal and altered mucosa wasperformed individually for each site. At the same time, dueto the small sample number, statistical analysis could not beperformed for each site, but only in general for the oral cavity.
Leukoplakia and erythroplakia showed different autoflu-orescence patterns even for the same histological result.Figure 2 shows the fluorescence spectra for both excitationwavelengths in the buccal mucosa. As can be noted forleukoplakia, tissue discrimination is not obtained for the usedexcitation wavelengths. On the other hand, for erythroplakia,fluorescence spectra under both excitations provided a gooddiscrimination for the suspect lesions (figure 3).
Figures 3, 4 and 5 also show some examples ofthe discrimination obtained for erythroplakia in the buccalmucosa, leukoplakia on the floor of the mouth, anderythroplakia on the border of the tongue, respectively. Otheroral sites as palate, gingival, dorsum of the tongue, and innermucosa of the lip also presented some lesions, but the analysisis difficult due to the low number of cases. Changes onemission intensity and on spectra shape could be noted at
3
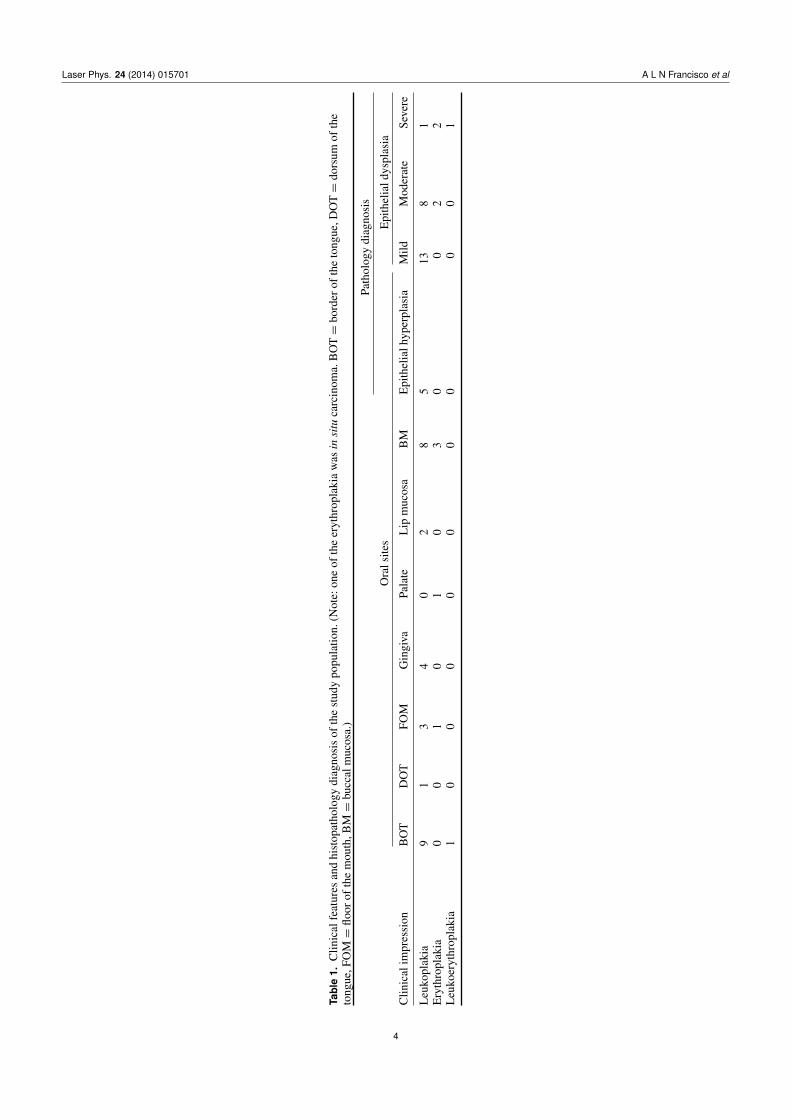
Laser Phys. 24 (2014) 015701 A L N Francisco et al
Tab
le1.
Clin
ical
feat
ures
and
hist
opat
holo
gydi
agno
sis
ofth
est
udy
popu
latio
n.(N
ote:
one
ofth
eer
ythr
opla
kia
was
insi
tuca
rcin
oma.
BO
T=
bord
erof
the
tong
ue,D
OT=
dors
umof
the
tong
ue,F
OM=
floor
ofth
em
outh
,BM=
bucc
alm
ucos
a.)
Clin
ical
impr
essi
on
Path
olog
ydi
agno
sis
Ora
lsite
sE
pith
elia
ldys
plas
ia
BO
TD
OT
FOM
Gin
giva
Pala
teL
ipm
ucos
aB
ME
pith
elia
lhyp
erpl
asia
Mild
Mod
erat
eSe
vere
Leu
kopl
akia
91
34
02
85
138
1E
ryth
ropl
akia
00
10
10
30
02
2L
euko
eryt
hrop
laki
a1
00
00
00
00
01
4
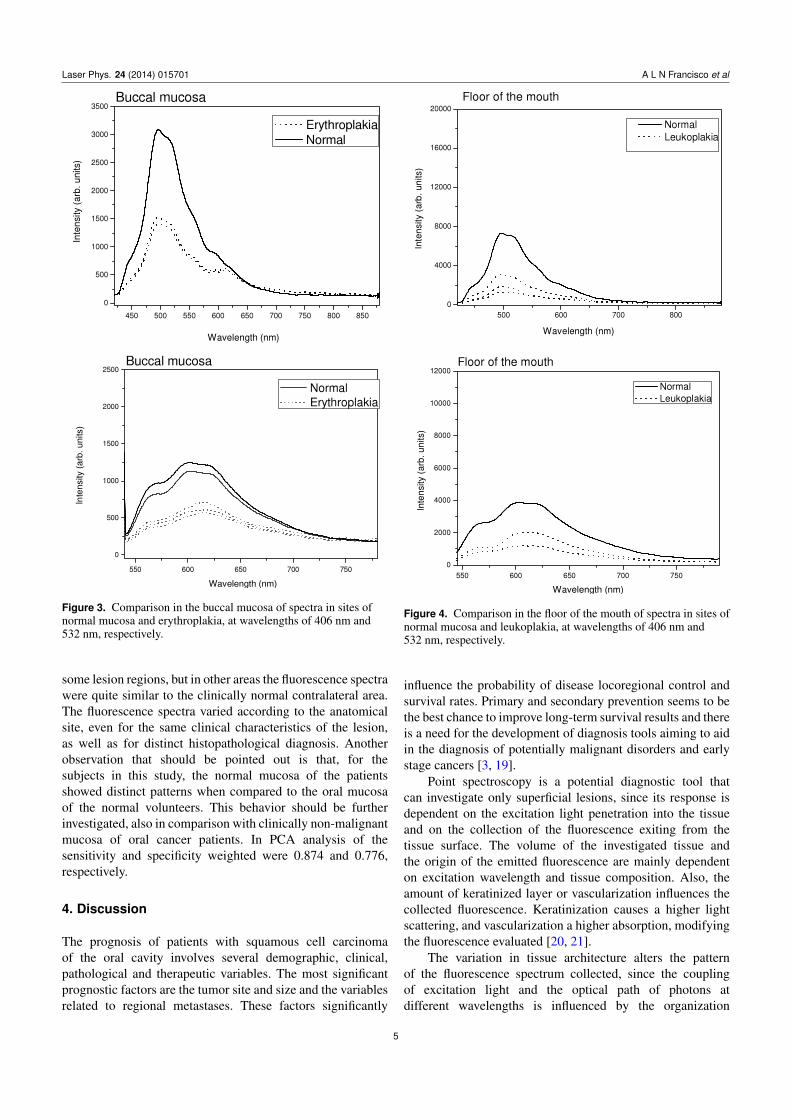
Laser Phys. 24 (2014) 015701 A L N Francisco et al
Figure 3. Comparison in the buccal mucosa of spectra in sites ofnormal mucosa and erythroplakia, at wavelengths of 406 nm and532 nm, respectively.
some lesion regions, but in other areas the fluorescence spectrawere quite similar to the clinically normal contralateral area.The fluorescence spectra varied according to the anatomicalsite, even for the same clinical characteristics of the lesion,as well as for distinct histopathological diagnosis. Anotherobservation that should be pointed out is that, for thesubjects in this study, the normal mucosa of the patientsshowed distinct patterns when compared to the oral mucosaof the normal volunteers. This behavior should be furtherinvestigated, also in comparison with clinically non-malignantmucosa of oral cancer patients. In PCA analysis of thesensitivity and specificity weighted were 0.874 and 0.776,respectively.
4. Discussion
The prognosis of patients with squamous cell carcinomaof the oral cavity involves several demographic, clinical,pathological and therapeutic variables. The most significantprognostic factors are the tumor site and size and the variablesrelated to regional metastases. These factors significantly
Figure 4. Comparison in the floor of the mouth of spectra in sites ofnormal mucosa and leukoplakia, at wavelengths of 406 nm and532 nm, respectively.
influence the probability of disease locoregional control andsurvival rates. Primary and secondary prevention seems to bethe best chance to improve long-term survival results and thereis a need for the development of diagnosis tools aiming to aidin the diagnosis of potentially malignant disorders and earlystage cancers [3, 19].
Point spectroscopy is a potential diagnostic tool thatcan investigate only superficial lesions, since its response isdependent on the excitation light penetration into the tissueand on the collection of the fluorescence exiting from thetissue surface. The volume of the investigated tissue andthe origin of the emitted fluorescence are mainly dependenton excitation wavelength and tissue composition. Also, theamount of keratinized layer or vascularization influences thecollected fluorescence. Keratinization causes a higher lightscattering, and vascularization a higher absorption, modifyingthe fluorescence evaluated [20, 21].
The variation in tissue architecture alters the patternof the fluorescence spectrum collected, since the couplingof excitation light and the optical path of photons atdifferent wavelengths is influenced by the organization
5
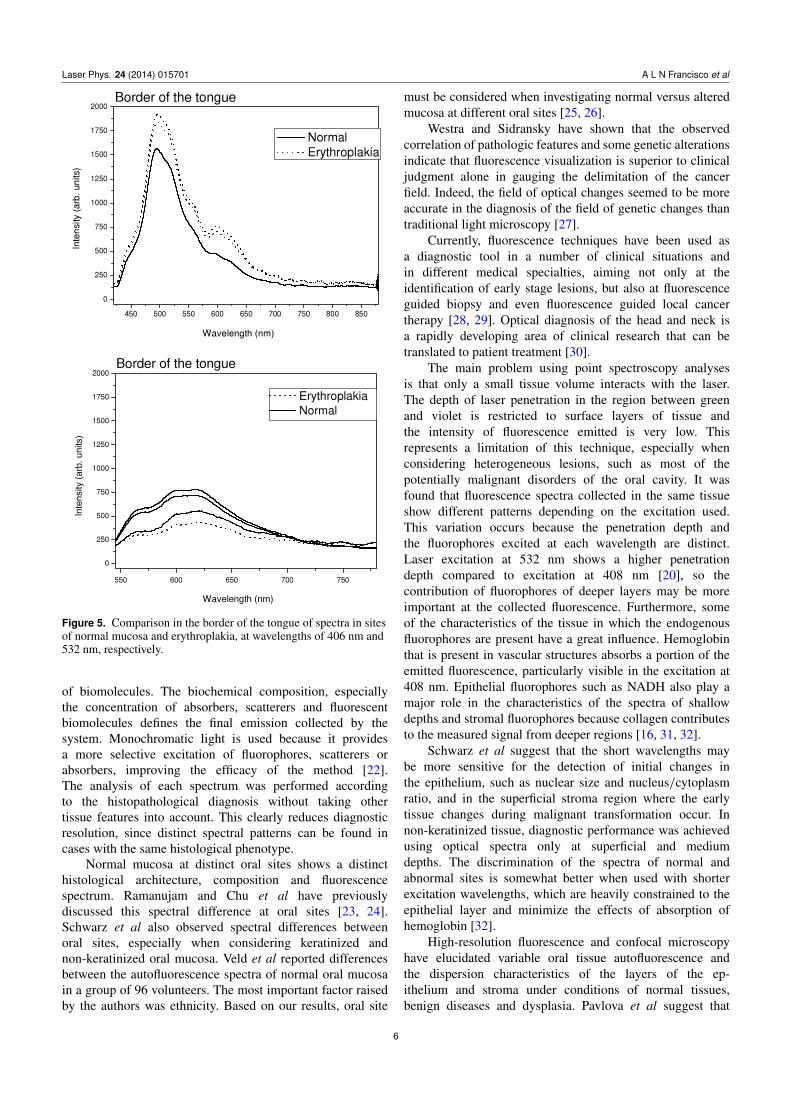
Laser Phys. 24 (2014) 015701 A L N Francisco et al
Figure 5. Comparison in the border of the tongue of spectra in sitesof normal mucosa and erythroplakia, at wavelengths of 406 nm and532 nm, respectively.
of biomolecules. The biochemical composition, especiallythe concentration of absorbers, scatterers and fluorescentbiomolecules defines the final emission collected by thesystem. Monochromatic light is used because it providesa more selective excitation of fluorophores, scatterers orabsorbers, improving the efficacy of the method [22].The analysis of each spectrum was performed accordingto the histopathological diagnosis without taking othertissue features into account. This clearly reduces diagnosticresolution, since distinct spectral patterns can be found incases with the same histological phenotype.
Normal mucosa at distinct oral sites shows a distincthistological architecture, composition and fluorescencespectrum. Ramanujam and Chu et al have previouslydiscussed this spectral difference at oral sites [23, 24].Schwarz et al also observed spectral differences betweenoral sites, especially when considering keratinized andnon-keratinized oral mucosa. Veld et al reported differencesbetween the autofluorescence spectra of normal oral mucosain a group of 96 volunteers. The most important factor raisedby the authors was ethnicity. Based on our results, oral site
must be considered when investigating normal versus alteredmucosa at different oral sites [25, 26].
Westra and Sidransky have shown that the observedcorrelation of pathologic features and some genetic alterationsindicate that fluorescence visualization is superior to clinicaljudgment alone in gauging the delimitation of the cancerfield. Indeed, the field of optical changes seemed to be moreaccurate in the diagnosis of the field of genetic changes thantraditional light microscopy [27].
Currently, fluorescence techniques have been used asa diagnostic tool in a number of clinical situations andin different medical specialties, aiming not only at theidentification of early stage lesions, but also at fluorescenceguided biopsy and even fluorescence guided local cancertherapy [28, 29]. Optical diagnosis of the head and neck isa rapidly developing area of clinical research that can betranslated to patient treatment [30].
The main problem using point spectroscopy analysesis that only a small tissue volume interacts with the laser.The depth of laser penetration in the region between greenand violet is restricted to surface layers of tissue andthe intensity of fluorescence emitted is very low. Thisrepresents a limitation of this technique, especially whenconsidering heterogeneous lesions, such as most of thepotentially malignant disorders of the oral cavity. It wasfound that fluorescence spectra collected in the same tissueshow different patterns depending on the excitation used.This variation occurs because the penetration depth andthe fluorophores excited at each wavelength are distinct.Laser excitation at 532 nm shows a higher penetrationdepth compared to excitation at 408 nm [20], so thecontribution of fluorophores of deeper layers may be moreimportant at the collected fluorescence. Furthermore, someof the characteristics of the tissue in which the endogenousfluorophores are present have a great influence. Hemoglobinthat is present in vascular structures absorbs a portion of theemitted fluorescence, particularly visible in the excitation at408 nm. Epithelial fluorophores such as NADH also play amajor role in the characteristics of the spectra of shallowdepths and stromal fluorophores because collagen contributesto the measured signal from deeper regions [16, 31, 32].
Schwarz et al suggest that the short wavelengths maybe more sensitive for the detection of initial changes inthe epithelium, such as nuclear size and nucleus/cytoplasmratio, and in the superficial stroma region where the earlytissue changes during malignant transformation occur. Innon-keratinized tissue, diagnostic performance was achievedusing optical spectra only at superficial and mediumdepths. The discrimination of the spectra of normal andabnormal sites is somewhat better when used with shorterexcitation wavelengths, which are heavily constrained to theepithelial layer and minimize the effects of absorption ofhemoglobin [32].
High-resolution fluorescence and confocal microscopyhave elucidated variable oral tissue autofluorescence andthe dispersion characteristics of the layers of the ep-ithelium and stroma under conditions of normal tissues,benign diseases and dysplasia. Pavlova et al suggest that
6
Laser Phys. 24 (2014) 015701 A L N Francisco et al
the oral epithelium can be divided into three layerswith different optical properties. The oral epithelium iscomposed of a superficial layer of keratin, which variesin thickness depending on the anatomical location. Themain fluorophore of the superficial epithelium is keratin,which is above the non-keratinized epithelium occupied byintermediate and basal cells. The fluorescence from thenon-keratinized epithelium is associated with metabolic flu-orophores NADH and FAD, which increase in samples of oraldysplasias [16, 33].
The carcinogenic process involves a biochemical sig-naling between the epithelium and the extracellular matrix,with greater alterations in the optical properties in thesuperficial stroma than those in the deep stroma by diseaseprogression. The fluorescence related to collagen, elastinand angiogenesis is significantly reduced in oral dysplasticlesions and inflammatory lesions, especially in the stromallayer underneath the dysplastic epithelium. The progressionof dysplasia in oral mucosa results in a decrease in the volumefraction of collagen, decreased dispersion of the stroma,and angiogenesis that may also be more prominent in thesuperficial stroma [10, 33].
The presence of inflammation may be another com-plicating factor for spectroscopic diagnosis of oral lesions.Autofluorescence of inflammatory conditions and cancermay be difficult to distinguish, since both are correlatedto reduced emission. As inflammation mainly affects thestroma with concomitant changes in the dysplastic epithelium,depth-sensitive spectral data, in particular the data derivedfrom the more superficial layers, may furnish more usefulinformation for the discrimination of benign lesions frommalignant or dysplastic lesions [32].
Erythematous lesions show lower fluorescence intensitywhen compared to leukoplakia lesions, likely due to a higherconcentration of hemoglobin, the most important endogenousabsorber, which absorbs excitation light in both spectralregions of violet and green as well as the emitted fluorescencein the tissue. Leukoplakic lesions behave differently inre-emission of light because they are rich in keratin, which hasa prominent role in the phenomena of scattering, absorptionand fluorescence intensity re-emitted [18].
We also observed distinct spectral features at thefluorescence emission between 500 and 560 nm. Thisemission region has been correlated with the endogenousfluorophores NADH and FAD, both present at the epithelialcells and relevant for metabolic evaluation. Our optical setupdoes not discriminate at what tissue layer the emissionoriginates. The collected fluorescence spectrum is a resultof the emission from the epithelium and superficial stroma.Possibly an excitation/collection setup as described bySchwarz et al would improve the diagnostic resolution [32].
Pavlova et al studied the fluorescence emission under UVexcitation from four different locations in the tongue of asingle patient. One of the four sites was clinically and his-tologically normal; the other three sites were oral lesions thatwere histologically diagnosed as inflammation, dysplasia andcancer, respectively. The normal oral tissue was characterizedby strong epithelial and stromal autofluorescence. In contrast,
the lesion diagnosed with severe inflammation showed arelevant decrease in the fluorescence of both epithelium andstroma. Moreover, while the fluorescence of normal tissuestroma originated from collagen fibers, the changes observedat the inflammatory condition was due to the inflammatorycells in the stroma. The oral lesion diagnosed with dysplasiawas characterized by increased epithelial thickness withfluorescent cells throughout the epithelium and a decrease influorescence of the superficial stroma. A diagnostic techniquewith a fast response can provide important information toclinicians, helping in the classification of the lesion, thescanning of large areas, border delineation of the lesion, andalso the choice of biopsy site [17, 18, 10, 19, 20, 33].
Distinguishing clinical features were observed in differ-ent behaviors of the fluorescence spectra. The violet excitationshowed better discrimination of normal versus malignantpotential in comparison with excitation at 532 nm. Theresults show the potential use of fluorescence spectroscopyon the discrimination of oral lesions. When there is aprogression from the normal state to an altered state, thisis reflected in the spectral characteristics of fluorescence oftissues, which may be correlated with the histopathologicalexamination of tissues. Our results demonstrate the potentialof fluorescence spectroscopy to diagnose objectively andnoninvasively distinguishing sites of dysplastic oral mucosa.Moreover, these results support the use of depth-sensitiveoptical spectroscopy to improve performance in the diagnosis.
Acknowledgments
The financial support provided by FAPESP (CEPOF-CEPIDProgram, proc. no. 07/57126-5 and ALNF scholarship no.09/12938-8), CNPq (proc. no. 477439/2007-1), INCITO andProfessors Dr Dante Antonio Migliare and Carlos de PaulaEduardo.
References
[1] Mashberg A et al 1993 Tobacco smoking, alcohol drinking,and cancer of the oral cavity and oropharynx among USveterans Cancer 72 1369–75
[2] Andre K et al 1995 Role of alcohol and tobacco in theaetiology of head and neck cancer: a case—control study inthe Doubs region of France Eur. J. Cancer Oral Oncol.31b 301–9
[3] Kowalski L P, Parise O and Lehn C 2008 Diagnosticoe Tratamento—Cancer de Cabeca e Pescoco 1st edn (SaoPaulo: Revisada Ed Ambito) pp 93–141, Parte II
[4] Nayak G S et al 2006 Principal component analysis andartificial neural network analysis of oral tissue fluorescencespectra: classification of normal premalignant andmalignant pathological conditions Biopolymers 82 152–66
[5] Gillenwater A et al 1998 Noninvasive diagnosis of oralneoplasia based on fluorescence spectroscopy and nativetissue autofluorescence Arch. Otolaryngol. Head Neck Surg.124 1251–8
[6] Silverman S Jr, Gorsky M and Lozada F 1984 Oralleukoplakia and malignant transformation: a follow-upstudy of 257 patients Cancer 53 563–8
[7] Silverman S Jr 1968 Observations on the clinicalcharacteristics and natural history of oral leukoplakia J. Am.Dent. Assoc. 76 772–7
7
Laser Phys. 24 (2014) 015701 A L N Francisco et al
[8] Kademani D 2007 Symp. on solid tumors Oral Cancer MayoClin. Proc. 82 878–87
[9] Tsai T, Chen H M, Wang C Y, Tsai J C, Chen C T andChiang C P 2003 In vivo autofluorescence spectroscopy oforal premalignant and malignant lesions: distortion offluorescence intensity by submucous fibrosis Lasers Surg.Med. 33 40–7
[10] Veld D C G, Witjes M J H, Sterenborg H J C M andRoodenburg J L N 2005 The status of in vivoautofluorescence spectroscopy and imaging for oraloncology Oral Oncol. 41 117–31
[11] Dietterle S et al 2008 In vivo diagnosis and non-inasivemonitoring of Imiquimod 5% cream for non-melanomaskin cancer using confocal laser scanning microscopy LaserPhys. Lett. 5 752–9
[12] Meyer L E and Lademann J 2007 Application of laserspectroscopic methods for in vivo diagnostics indermatology Laser Phys. Lett. 4 754–60
[13] Gonchukov S, Biryukova T, Sukhinina A and Vdovin Yu 2010Fluorescence detection of dental calculus Laser Phys. Lett.7 812–6
[14] Chen Q G, Lin B, Chen Z B, Zhu H H and Chen H 2010 Pilotstudy on early detection of dental demineralization basedon laser induced fluorescence Laser Phys. Lett. 7 752–6
[15] AlSalhi M S, Masilamani V, Atif M, Farhat K, Rabah D andAl Turki M R 2012 Fluorescence spectra of benign andmalignant prostate tissues Laser Phys. Lett. 9 631–5
[16] Pavlova I et al 2008 Monte Carlo model to describe depthselective fluorescence spectra of epithelial tissue:applications for diagnosis of oral precancer J. Biomed. Opt.13 064012
[17] Pavlova I, Weber C R, Schwarz R A, Williams M D,Gillenwater A M and Richards-Kortum R 2009Fluorescence spectroscopy of oral tissue: Monte Carlomodeling with site-specific tissue properties J. Biomed.Opt. 14 014009
[18] van Staveren H J, van Veen R L P, Speelman O C,Witjes M J H, Star W M and Roodenburg J L N 2000Classification of clinical autofluorescence spectra of oralleukoplakia using a artificial neural network: a pilot studyOral Oncol. 36 286–93
[19] Reibel J 2003 Prognosis of oral pre-malignant lesions:significance of clinical, histopathological, and molecularbiological characteristics Crit. Rev. Oral Biol. Med.14 47–62
[20] Kurachi C, Bagnato V S, Fontana C R and Rosa L E B 2008Fluorescence spectroscopy for the detection of tongue
carcinoma—validation in an animal model J. Biomed. Opt.13 034018
[21] Rahman M S et al 2010 Evaluation of a low-cost, portableimaging system for early detection of oral cancer HeadNeck Oncol. 22 10
[22] Welch A J et al 1997 Propagation of fluorescent light LasersSurg. Med. 21 166–78
[23] Ramanujam N 2000 Fluorescence spectroscopy of neoplasticand non-neoplastic tissues Neoplasia 2 89–117
[24] Chu S C, Hsiao T-C R, Lin J K, Wang C-Y and Chiang H K2006 Comparison of performance of linear multivariateanalysis methods for normal and dysplasia tissuesdifferentiation using autofluorescence spectroscopy IEEETrans. Biomed. Eng. 53 2265–73
[25] Schwarz R A et al 2009 Noninvasive evaluation of oral lesionsusing depth-sensitive optical spectroscopy Cancer115 1669–79
[26] Veld D C G, Skurichina M, Witjes M J H, Duin R P W,Sterenborg D J C M and Star W M 2003 Autofluorescencecharacteristcis of healthy oral mucosa at differentanatomical sites Lasers Surg. Med. 32 367–76
[27] Westra W H and Sidransky D 2006 Fluorescence visualizationin oral neoplasia: shedding light on an old problem Clin.Cancer Res. 12 6594–7
[28] Moghissi K, Stringer M R and Hons K D B A 2008Fluorescence photodiagnosis in clinical practicePhotodiagn. Photodyn. Ther. 5 235–7
[29] Bedard N, Pierce M, El-Nagger A, Anandasabapathy S,Gillenwater A and Richards-Kortum R 2010 Emerging rolesfor multimodal optical imaging in early cancer detection: aglobal challenge Technol. Cancer Res. Treat. 9 211–7
[30] Upile T et al 2009 Head & neck optical diagnostics: vision ofthe future of surgery Head Neck Oncol. 1 25
[31] Heintzelman D L et al 2000 Optimal excitation wavelengthsfor in vivo detection of oral neoplasia using fluorescencespectroscopy Photochem. Photobiol. 72 103–13
[32] Schwarz R A, Gao W, Daye D, Williams M D,Richards-Kortum R and Gillenwater A M 2008Autofluorescence and diffuse reflectance spectroscopy oforal epithelial tissue using a depth-sensitive fiber-opticprobe Appl. Opt. 47 825–34
[33] Pavlova I, Williams M, El-Naggar A, Richards-Kortum R andGillenwater A 2008 Understanding the biological basis ofautofluorescence imaging for oral cancer detection:high-resolution fluorescence microscopy in viable tissueClin. Cancer Res. 14 2396–404
8
P
EdPp
DNJC
a
Cb
A
f
p
1h
hotodiagnosis and Photodynamic Therapy (2014) 11, 22—26
Available online at www.sciencedirect.com
ScienceDirect
jo ur nal ho mepage: www.elsev ier .com/ locate /pdpdt
xperience and BCC subtypes aseterminants of MAL-PDT response:reliminary results of a national Brazilianroject
ora P. Ramirez MD, MSca,∗, Cristina Kurachia,atalia M. Inadaa, Lilian T. Moriyamaa, Ana G. Salviob,osé D. Vollet Filhoa, Layla Piresa, Hilde H. Buzzáa,intia Teles de Andradea, Clovis Grecoa, Vanderlei S. Bagnatoa
Biophotonics Laboratory, São Carlos Institute of Physics, University of São Paulo (USP), 13566-590 Sãoarlos, São Paulo, BrazilSkin Department, Amaral Carvalho Foundation, Brazilvailable online 8 January 2014
KEYWORDSNon-melanoma skincancer;Photodynamictherapy;National Brazilianproject;BCC subtypes;Doctor experience;
Summary Non-melanoma skin cancer is the most prevalent cancer type in Brazil and world-wide. Photodynamic therapy (PDT) is a noninvasive technique with excellent cosmetic outcomeand good curative results, when used for the initial stages of skin cancer. A Brazilian programwas established to determine the efficacy of methyl aminolevulinate (MAL)-PDT, using Braziliandevice and drug. The equipment is a dual device that combines the photodiagnosis, based onwidefield fluorescence, and the treatment at 630 nm. A protocol was defined for the treatmentof basal cell carcinoma with 20% MAL cream application. The program also involves the trainingof the medical teams at different Brazilian regions, and with distinct facilities and previousPDT education. In this report we present the partial results of 27 centers with 366 treated BCClesions in 294 patients. A complete response (CR) was observed in 76.5% (280/366). The better
Determinantsresponse was observed for superficial BCC, with CR 160 lesions (80.4%), when compared withnodular or pigmented BCC. Experienced centers presented CR of 85.8% and 90.6% for superfi-cial and nodular BCC respectively. A high influence of the previous doctor experience on the CRvalues was observed, especially due to a better tumor selection.ts re
© 2013 Elsevier B.V. All righ∗ Corresponding author. Tel.: +55 1688029300;ax: +55 1633739810.
E-mail addresses: [email protected],[email protected] (D.P. Ramirez).
I
Tcii
572-1000/$ — see front matter © 2013 Elsevier B.V. All rights reserved.ttp://dx.doi.org/10.1016/j.pdpdt.2013.11.001
served.
ntroduction
he non-melanoma skin cancer (NMSC) represents the mostommon type of cancer worldwide. In the United States,t accounts for more than 2 million cases per year and,n Brazil, more than 130,000 new cases were estimated
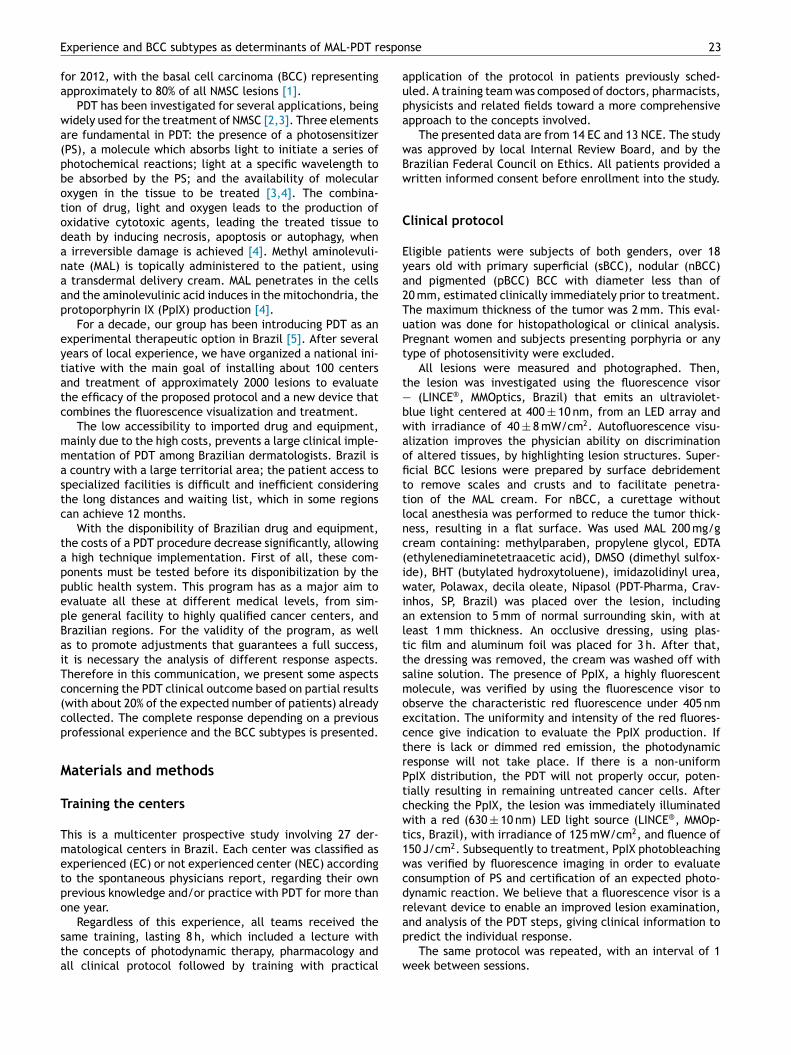
espo
aupa
wBw
C
Eya2TuPt
t—bwaofittlnc(iwialttsmoectrPtcwt1wcdr
Experience and BCC subtypes as determinants of MAL-PDT r
for 2012, with the basal cell carcinoma (BCC) representingapproximately to 80% of all NMSC lesions [1].
PDT has been investigated for several applications, beingwidely used for the treatment of NMSC [2,3]. Three elementsare fundamental in PDT: the presence of a photosensitizer(PS), a molecule which absorbs light to initiate a series ofphotochemical reactions; light at a specific wavelength tobe absorbed by the PS; and the availability of molecularoxygen in the tissue to be treated [3,4]. The combina-tion of drug, light and oxygen leads to the production ofoxidative cytotoxic agents, leading the treated tissue todeath by inducing necrosis, apoptosis or autophagy, whena irreversible damage is achieved [4]. Methyl aminolevuli-nate (MAL) is topically administered to the patient, usinga transdermal delivery cream. MAL penetrates in the cellsand the aminolevulinic acid induces in the mitochondria, theprotoporphyrin IX (PpIX) production [4].
For a decade, our group has been introducing PDT as anexperimental therapeutic option in Brazil [5]. After severalyears of local experience, we have organized a national ini-tiative with the main goal of installing about 100 centersand treatment of approximately 2000 lesions to evaluatethe efficacy of the proposed protocol and a new device thatcombines the fluorescence visualization and treatment.
The low accessibility to imported drug and equipment,mainly due to the high costs, prevents a large clinical imple-mentation of PDT among Brazilian dermatologists. Brazil isa country with a large territorial area; the patient access tospecialized facilities is difficult and inefficient consideringthe long distances and waiting list, which in some regionscan achieve 12 months.
With the disponibility of Brazilian drug and equipment,the costs of a PDT procedure decrease significantly, allowinga high technique implementation. First of all, these com-ponents must be tested before its disponibilization by thepublic health system. This program has as a major aim toevaluate all these at different medical levels, from sim-ple general facility to highly qualified cancer centers, andBrazilian regions. For the validity of the program, as wellas to promote adjustments that guarantees a full success,it is necessary the analysis of different response aspects.Therefore in this communication, we present some aspectsconcerning the PDT clinical outcome based on partial results(with about 20% of the expected number of patients) alreadycollected. The complete response depending on a previousprofessional experience and the BCC subtypes is presented.
Materials and methods
Training the centers
This is a multicenter prospective study involving 27 der-matological centers in Brazil. Each center was classified asexperienced (EC) or not experienced center (NEC) accordingto the spontaneous physicians report, regarding their ownprevious knowledge and/or practice with PDT for more thanone year.
Regardless of this experience, all teams received thesame training, lasting 8 h, which included a lecture withthe concepts of photodynamic therapy, pharmacology andall clinical protocol followed by training with practical
ap
w
nse 23
pplication of the protocol in patients previously sched-led. A training team was composed of doctors, pharmacists,hysicists and related fields toward a more comprehensivepproach to the concepts involved.
The presented data are from 14 EC and 13 NCE. The studyas approved by local Internal Review Board, and by therazilian Federal Council on Ethics. All patients provided aritten informed consent before enrollment into the study.
linical protocol
ligible patients were subjects of both genders, over 18ears old with primary superficial (sBCC), nodular (nBCC)nd pigmented (pBCC) BCC with diameter less than of0 mm, estimated clinically immediately prior to treatment.he maximum thickness of the tumor was 2 mm. This eval-ation was done for histopathological or clinical analysis.regnant women and subjects presenting porphyria or anyype of photosensitivity were excluded.
All lesions were measured and photographed. Then,he lesion was investigated using the fluorescence visor
(LINCE®, MMOptics, Brazil) that emits an ultraviolet-lue light centered at 400 ± 10 nm, from an LED array andith irradiance of 40 ± 8 mW/cm2. Autofluorescence visu-lization improves the physician ability on discriminationf altered tissues, by highlighting lesion structures. Super-cial BCC lesions were prepared by surface debridemento remove scales and crusts and to facilitate penetra-ion of the MAL cream. For nBCC, a curettage withoutocal anesthesia was performed to reduce the tumor thick-ess, resulting in a flat surface. Was used MAL 200 mg/gream containing: methylparaben, propylene glycol, EDTAethylenediaminetetraacetic acid), DMSO (dimethyl sulfox-de), BHT (butylated hydroxytoluene), imidazolidinyl urea,ater, Polawax, decila oleate, Nipasol (PDT-Pharma, Crav-
nhos, SP, Brazil) was placed over the lesion, includingn extension to 5 mm of normal surrounding skin, with ateast 1 mm thickness. An occlusive dressing, using plas-ic film and aluminum foil was placed for 3 h. After that,he dressing was removed, the cream was washed off withaline solution. The presence of PpIX, a highly fluorescentolecule, was verified by using the fluorescence visor to
bserve the characteristic red fluorescence under 405 nmxcitation. The uniformity and intensity of the red fluores-ence give indication to evaluate the PpIX production. Ifhere is lack or dimmed red emission, the photodynamicesponse will not take place. If there is a non-uniformpIX distribution, the PDT will not properly occur, poten-ially resulting in remaining untreated cancer cells. Afterhecking the PpIX, the lesion was immediately illuminatedith a red (630 ± 10 nm) LED light source (LINCE®, MMOp-
ics, Brazil), with irradiance of 125 mW/cm2, and fluence of50 J/cm2. Subsequently to treatment, PpIX photobleachingas verified by fluorescence imaging in order to evaluateonsumption of PS and certification of an expected photo-ynamic reaction. We believe that a fluorescence visor is aelevant device to enable an improved lesion examination,
nd analysis of the PDT steps, giving clinical information toredict the individual response.The same protocol was repeated, with an interval of 1eek between sessions.
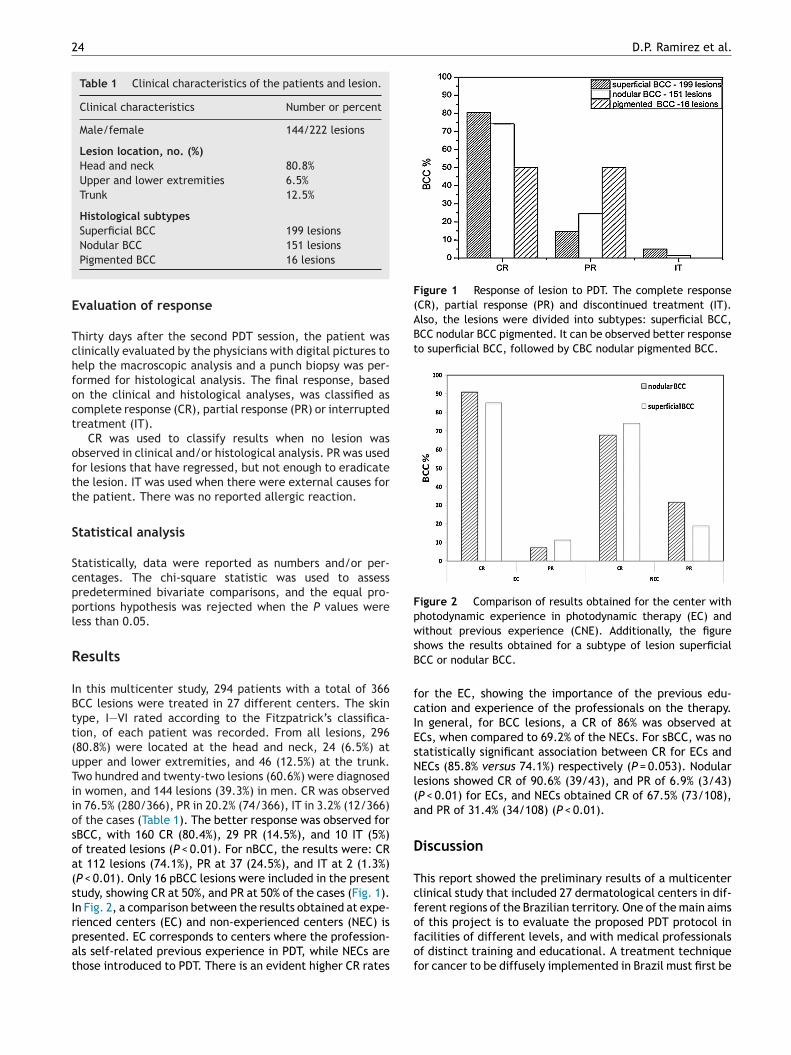
24 D.P. Ramirez et al.
Table 1 Clinical characteristics of the patients and lesion.
Clinical characteristics Number or percent
Male/female 144/222 lesions
Lesion location, no. (%)Head and neck 80.8%Upper and lower extremities 6.5%Trunk 12.5%
Histological subtypesSuperficial BCC 199 lesions
E
Tchfoct
oftt
S
Scppl
R
IBtt(uTiiosoa(sIrpat
Figure 1 Response of lesion to PDT. The complete response(CR), partial response (PR) and discontinued treatment (IT).Also, the lesions were divided into subtypes: superficial BCC,BCC nodular BCC pigmented. It can be observed better responseto superficial BCC, followed by CBC nodular pigmented BCC.
Figure 2 Comparison of results obtained for the center withphotodynamic experience in photodynamic therapy (EC) andwithout previous experience (CNE). Additionally, the figuresB
fcIEsNl(a
D
Tcf
Nodular BCC 151 lesionsPigmented BCC 16 lesions
valuation of response
hirty days after the second PDT session, the patient waslinically evaluated by the physicians with digital pictures toelp the macroscopic analysis and a punch biopsy was per-ormed for histological analysis. The final response, basedn the clinical and histological analyses, was classified asomplete response (CR), partial response (PR) or interruptedreatment (IT).
CR was used to classify results when no lesion wasbserved in clinical and/or histological analysis. PR was usedor lesions that have regressed, but not enough to eradicatehe lesion. IT was used when there were external causes forhe patient. There was no reported allergic reaction.
tatistical analysis
tatistically, data were reported as numbers and/or per-entages. The chi-square statistic was used to assessredetermined bivariate comparisons, and the equal pro-ortions hypothesis was rejected when the P values wereess than 0.05.
esults
n this multicenter study, 294 patients with a total of 366CC lesions were treated in 27 different centers. The skinype, I—VI rated according to the Fitzpatrick’s classifica-ion, of each patient was recorded. From all lesions, 29680.8%) were located at the head and neck, 24 (6.5%) atpper and lower extremities, and 46 (12.5%) at the trunk.wo hundred and twenty-two lesions (60.6%) were diagnosedn women, and 144 lesions (39.3%) in men. CR was observedn 76.5% (280/366), PR in 20.2% (74/366), IT in 3.2% (12/366)f the cases (Table 1). The better response was observed forBCC, with 160 CR (80.4%), 29 PR (14.5%), and 10 IT (5%)f treated lesions (P < 0.01). For nBCC, the results were: CRt 112 lesions (74.1%), PR at 37 (24.5%), and IT at 2 (1.3%)P < 0.01). Only 16 pBCC lesions were included in the presenttudy, showing CR at 50%, and PR at 50% of the cases (Fig. 1).n Fig. 2, a comparison between the results obtained at expe-
ienced centers (EC) and non-experienced centers (NEC) isresented. EC corresponds to centers where the profession-ls self-related previous experience in PDT, while NECs arehose introduced to PDT. There is an evident higher CR ratesofof
hows the results obtained for a subtype of lesion superficialCC or nodular BCC.
or the EC, showing the importance of the previous edu-ation and experience of the professionals on the therapy.n general, for BCC lesions, a CR of 86% was observed atCs, when compared to 69.2% of the NECs. For sBCC, was notatistically significant association between CR for ECs andECs (85.8% versus 74.1%) respectively (P = 0.053). Nodular
esions showed CR of 90.6% (39/43), and PR of 6.9% (3/43)P < 0.01) for ECs, and NECs obtained CR of 67.5% (73/108),nd PR of 31.4% (34/108) (P < 0.01).
iscussion
his report showed the preliminary results of a multicenterlinical study that included 27 dermatological centers in dif-erent regions of the Brazilian territory. One of the main aims
f this project is to evaluate the proposed PDT protocol inacilities of different levels, and with medical professionalsf distinct training and educational. A treatment techniqueor cancer to be diffusely implemented in Brazil must first be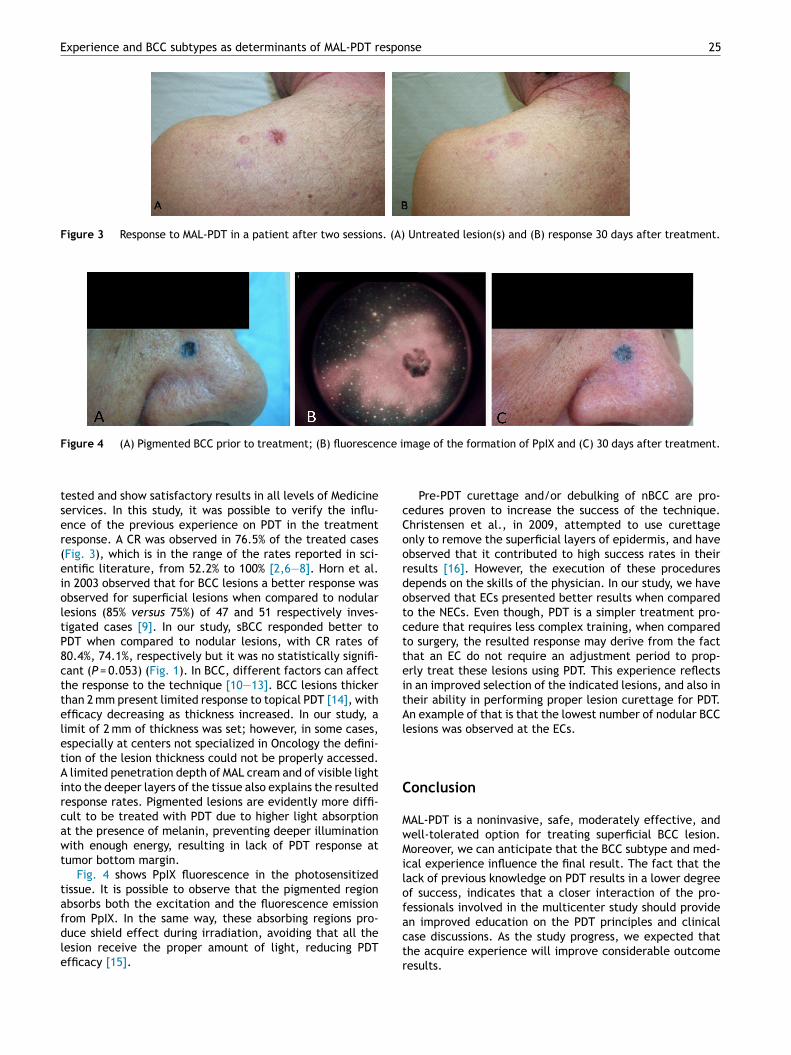
Experience and BCC subtypes as determinants of MAL-PDT response 25
Figure 3 Response to MAL-PDT in a patient after two sessions. (A) Untreated lesion(s) and (B) response 30 days after treatment.
nce i
cCoordotctteitAl
C
MwMilof
Figure 4 (A) Pigmented BCC prior to treatment; (B) fluoresce
tested and show satisfactory results in all levels of Medicineservices. In this study, it was possible to verify the influ-ence of the previous experience on PDT in the treatmentresponse. A CR was observed in 76.5% of the treated cases(Fig. 3), which is in the range of the rates reported in sci-entific literature, from 52.2% to 100% [2,6—8]. Horn et al.in 2003 observed that for BCC lesions a better response wasobserved for superficial lesions when compared to nodularlesions (85% versus 75%) of 47 and 51 respectively inves-tigated cases [9]. In our study, sBCC responded better toPDT when compared to nodular lesions, with CR rates of80.4%, 74.1%, respectively but it was no statistically signifi-cant (P = 0.053) (Fig. 1). In BCC, different factors can affectthe response to the technique [10—13]. BCC lesions thickerthan 2 mm present limited response to topical PDT [14], withefficacy decreasing as thickness increased. In our study, alimit of 2 mm of thickness was set; however, in some cases,especially at centers not specialized in Oncology the defini-tion of the lesion thickness could not be properly accessed.A limited penetration depth of MAL cream and of visible lightinto the deeper layers of the tissue also explains the resultedresponse rates. Pigmented lesions are evidently more diffi-cult to be treated with PDT due to higher light absorptionat the presence of melanin, preventing deeper illuminationwith enough energy, resulting in lack of PDT response attumor bottom margin.
Fig. 4 shows PpIX fluorescence in the photosensitizedtissue. It is possible to observe that the pigmented regionabsorbs both the excitation and the fluorescence emission
from PpIX. In the same way, these absorbing regions pro-duce shield effect during irradiation, avoiding that all thelesion receive the proper amount of light, reducing PDTefficacy [15].actr
mage of the formation of PpIX and (C) 30 days after treatment.
Pre-PDT curettage and/or debulking of nBCC are pro-edures proven to increase the success of the technique.hristensen et al., in 2009, attempted to use curettagenly to remove the superficial layers of epidermis, and havebserved that it contributed to high success rates in theiresults [16]. However, the execution of these proceduresepends on the skills of the physician. In our study, we havebserved that ECs presented better results when comparedo the NECs. Even though, PDT is a simpler treatment pro-edure that requires less complex training, when comparedo surgery, the resulted response may derive from the facthat an EC do not require an adjustment period to prop-rly treat these lesions using PDT. This experience reflectsn an improved selection of the indicated lesions, and also inheir ability in performing proper lesion curettage for PDT.n example of that is that the lowest number of nodular BCC
esions was observed at the ECs.
onclusion
AL-PDT is a noninvasive, safe, moderately effective, andell-tolerated option for treating superficial BCC lesion.oreover, we can anticipate that the BCC subtype and med-
cal experience influence the final result. The fact that theack of previous knowledge on PDT results in a lower degreef success, indicates that a closer interaction of the pro-essionals involved in the multicenter study should provide
n improved education on the PDT principles and clinicalase discussions. As the study progress, we expected thathe acquire experience will improve considerable outcomeesults.
2
A
T(F
R [
[
[
[
[
[
[
6
cknowledgments
he authors acknowledge the financial support by BNDES09.2.1458.1) and MMOptics. We appreciate support fromAPESP (Program CEPID-INCT), CNPq, CAPES and FINEP.
eferences
[1] Kim RH, Armstrong AW. Nonmelanoma skin cancer. Dermato-logic Clinics 2012;30(1):125—39, ix.
[2] Lehmann P. Methyl aminolaevulinate-photodynamic therapy: areview of clinical trials in the treatment of actinic keratosesand nonmelanoma skin cancer. British Journal of Dermatology2007;156(5):793—801.
[3] Moseley H, et al. Clinical and research applications of photody-namic therapy in dermatology: experience of the Scottish PDTCentre. Lasers in Surgery and Medicine 2006;38(5):403—16.
[4] Agostinis P, et al. Photodynamic therapy of cancer: an update.CA: A Cancer Journal for Clinicians 2011;61(4):250—81.
[5] Bagnato VS, et al. PDT experience in Brazil: a regional pro-file. Photodiagnosis and Photodynamic Therapy 2005;2(2):107—18.
[6] Calzavarapinton PG. Repetitive photodynamic therapy withtopical delta-aminolevulinic-acid as an appropriate approachto the routine treatment of superficial nonmelanoma skintumors. Journal of Photochemistry and Photobiology B: Biology1995;29(1):53—7.
[7] Surrenti T, et al. Efficacy of photodynamic therapy with methylaminolevulinate in the treatment of superficial and nodular
basal cell carcinoma: an open-label trial. European Journal ofDermatology 2007;17(5):412—5.[8] Lindberg-Larsen R, Solvsten H, Kragballe K. Evaluationof recurrence after photodynamic therapy with topical
D.P. Ramirez et al.
methylaminolaevulinate for 157 basal cell carcinomas in 90patients. Acta Dermato-Venereologica 2012;92(2):144—7.
[9] Horn M, et al. Topical methyl aminolaevulinate photo-dynamic therapy in patients with basal cell carcinomaprone to complications and poor cosmetic outcome withconventional treatment. British Journal of Dermatology2003;149(6):1242—9.
10] Christensen E, et al. Pre-treatment evaluation of basal cell car-cinoma for photodynamic therapy: comparative measurementof tumour thickness in punch biopsy and excision specimens.Acta Dermato-Venereologica 2011;91(6):651—5.
11] Fink-Puches R, et al. Long-term follow-up and histologicalchanges of superficial nonmelanoma skin cancers treatedwith topical delta-aminolevulinic acid photodynamic therapy.Archives of Dermatology 1998;134(7):821—6.
12] Christensen E, Mørk C, Skogvoll E. High and sustained efficacyafter two sessions of topical 5-aminolaevulinic acid photody-namic therapy for basal cell carcinoma: a prospective, clinicaland histological 10-year follow-up study. British Journal of Der-matology 2012;166(6):1342—8.
13] Vinciullo C, et al. Photodynamic therapy with topical methylaminolaevulinate for ‘difficult-to-treat’ basal cell carcinoma.British Journal of Dermatology 2005;152(4):765—72.
14] Morton CA, et al. Photodynamic therapy for basal cellcarcinoma: effect of tumor thickness and duration of photo-sensitizer application on response. Archives of Dermatology1998;134(2):248—9.
15] Szeimies RM. Methyl aminolevulinate-photodynamictherapy for basal cell carcinoma. Dermatologic Clinics2007;25(1):89—94.
16] Christensen E, et al. Photodynamic therapy with 5-
aminolaevulinic acid, dimethylsulfoxide and curettage inbasal cell carcinoma: a 6-year clinical and histological follow-up. Journal of the European Academy of Dermatology andVenereology 2009;23(1):58—66.
Impact of fat distribution on metabolic, cardiovascularand symptomatic aspects in postmenopausal women
Fernanda Rossi Paolillo & Juliana Cristina Milan &
Alessandra Rossi Paolillo & Sérgio Luiz Brasileiro Lopes &
Cristina Kurachi & Vanderlei Salvador Bagnato &
Audrey Borghi-Silva
Received: 10 July 2012 /Accepted: 21 May 2013 /Published online: 27 September 2013# Research Society for Study of Diabetes in India 2013
Abstract The aim of this study was to investigate theanthropometric, metabolic, cardiovascular and symptomaticprofile in gynoid and android postmenopausal women.Forty five postmenopausal women aged 50 to 60 yearswere divided into two groups according to fat distribution[waist-to-hip ratio (WHR)]: gynoid group (WHR between0.68 and 0.8; N=13) and android group (WHR>0.8; N=32). Body composition, skinfold thickness, serum/plasmaestradiol, creatinine, urea, lipid profile, glucose and insulin,maximal exercise testing and menopause rating scale(MRS) were evaluated. The android group when comparedto the gynoid group showed (P<0.05): (i) higher values ofbody mass, BMI, waist circumference, body fat, lean massand skinfold thickness; (ii) higher values of estradiol,
triglycerides, very low-density lipoprotein (VLDL) andinsulin levels with lower insulin sensitivity (%S) and great-er insulin resistance (%IR) index; (iii) higher blood pres-sure (BP) during rest and lower maximal heart rate(HRmax) during maximal exercise testing and; (iv) higherscores of the somatic and urogenital-sexual symptoms. Thisstudy suggests that android postmenopausal women developfeatures that can lead to metabolic syndrome (MetS) andfuture cardiovascular disease (CVD), and these womenmay present higher scores of somatic and urogenital-sexualsymptoms.
Keywords Postmenopausal women . Body composition .
Metabolic syndrome . Menopause symptoms
F. R. Paolillo :C. Kurachi :V. S. BagnatoOptics Group from Instituto de Física de São Carlos (IFSC),University of São Paulo (USP)(Av. Trabalhador Sãocarlense, 400 - Centro,CEP 13560-970, São Carlos, SP, Brazil
C. Kurachie-mail: [email protected]
V. S. Bagnatoe-mail: [email protected]
F. R. Paolillo :C. Kurachi :V. S. BagnatoBiotechnology Program, Federal University of São Carlos(UFSCar), São Carlos, Brazil
J. C. Milan :A. Borghi-SilvaCardiopulmonary Physiotherapy Laboratory, Department ofPhysical Therapy, Federal University of São Carlos (UFSCar),Rodovia Washington Luiz, Km. 235, Caixa Postal 676, CEP13565-905, São Carlos, SP, Brazil
J. C. Milane-mail: [email protected]
A. Borghi-Silvae-mail: [email protected]
A. R. PaolilloBioengineer Program, University of São Paulo (USP),Av. Trabalhador Sãocarlense, 400 - Centro,CEP 13560-970, São Carlos, SP, Brazile-mail: [email protected]
S. L. B. LopesDepartment of Medicine, Federal University of São Carlos(UFSCar), Rodovia Washington Luiz, Km. 235, Caixa Postal 676,CEP 13565-905, São Carlos, SP, Brazile-mail: [email protected]
F. R. Paolillo (*)University of São Paulo (USP),Av. Trabalhador Sãocarlense, 400 - Centro,CEP 13560-970, São Carlos, SP, Brazile-mail: [email protected]
Int J Diabetes Dev Ctries (January–March 2014) 34(1):32–39DOI 10.1007/s13410-013-0132-4
Introduction
Changes in body composition have been observed in post-menopausal women, due to hormonal changes [1]. After themenopause, the gynoid fat distribution gradually changes toan android distribution with an increased upper body fat, inthe abdominal region [2]. These are associatedwith decreasedaerobic capacity and reduced total energy expenditure [3] andmay lead to the metabolic syndrome (MetS), as evidenced byandrogenic obesity, insulin resistance, diabetes melittus (typeII), hypertension and dyslipidemia [4, 5]. According to theNational Cholesterol Education Program/Adult TreatmentPanel III (NCEP/ATP III) definition [6], MetS is diagnosedwhen three of the above mentioned criteria are met, and CVDis the leading cause of mortality and morbidity in postmeno-pausal woman [2].
It is not clear whether the transition to menopause in-creases the CVD risk for all women or only for those whodevelop features of the MetS [7]. Studies [8, 9] have iden-tified the menopausal transition a trigger for changes in thebody fat distribution in healthy middle-aged women.Moreover, the type of body fat distribution is related to thepossibility of developing metabolic disorder, mainly as an-drogenic obesity plays an important role in MetS [5, 10].
The objective of our study was to investigate anthropo-metric, metabolic, cardiovascular and symptomatic profilesin gynoid and android postmenopausal women. The hypoth-esis of the present study was that postmenopausal andro-genic obesity increases both the risk of developing MetSand CVD, as well as the magnitude of the postmenopausalsymptoms, when compared to gynecoid obesity.
Materials and methods
The study research has been approved by the Ethics Committeeof the Federal University of São Carlos (UFSCar) in SãoCarlos, Brazil (no. 159/2010). All participants signed a writtenconsent form before starting the first testing session. The studywas registered with NIH Clinical Trials (NCT01745042).
Participants
A cross-sectional survey was conducted. Inclusion criteriawere healthy postmenopausal Caucasian women, Brazilians,between 50 and 60 years of age. The postmenopausalperiod was defined by an absence of menstruation formore than 12 months. Exclusion criteria were symptomsand signs of any neurological, metabolic, inflammatoryand/or cardiologic disease as well as cigarette smokingand use of any mediators, including hormone replace-ment therapy (HRT). The women were divided according to
the fat distribution [waist-to-hip ratio (WHR)] [11] into twogroups:
1) Gynoid (WHR between 0.68 and 0.8; N=13)2) Android (WHR>0.8; N=32)
Assessment of body composition and skinfolds
Anthropometric data were used to determine the body massindex [BMI: body weight (in kg) divided by height (in m)squared] and the WHR [waist circumference (in cm) dividedby hip circumference (in cm)]. The anatomical landmarks tomeasure the circumference (cm), in the upright position ofthe body were: 1) waist: measured at the above the iliaccrest; 2) hip: measured at the largest protuberance of thebuttocks [12]. The body fat and lean mass were measured bythe bipolar electrical bioimpedance of the upper limbs(OMRON®, Kyoto, Japan) [13]. The measurements of theskinfolds (in mm) were performed in the upright position,the caliper was placed at specific locations on the right sideof the body, which was relaxed and dry. Three measure-ments were reformed at each location to obtain an average.The anatomic locations for these measurements were: tri-ceps, subscapular, suprailiac, abdominal, anterior thigh, me-dial calf [14, 15].
Assessment of biochemical exams
Blood was collected after a 12-hour fasting according tostandard laboratory procedures of the Medical SchoolHospital of our Institution. Serum level of estradiol, urea,creatinine, triglycerides, total cholesterol, high-density lipo-protein (HDL) cholesterol, low-density lipoprotein (LDL)cholesterol, very low-density lipoprotein (VLDL) cholesterol,insulin and glucose were measured. Low-density lipoprotein(LDL) cholesterol was calculated according to Friedewald’sformula [LDL=colesterol total−(HDL+VLDL)]. Very low-density lipoprotein (VLDL) cholesterol was calculated accordingto: triglycerides divided by 5.
AccordingtotheCastelli Index,higherLDLlevelsand lowerHDL levels result in greater risk [16, 17]: (i) Castelli Index I:total cholesterol/HDL, (ii) Castelli index II: LDL/HDL.
The Homeostasis Model Assessment (HOMA) β, whichestimates the functioning of pancreatic β cells, the HOMA%S, which estimates insulin sensitivity and HOMA %IR,which estimates insulin resistance were calculated [18]. Thereference values for some of the parameters are: glucose≤100 mg/dL, insulin from 2.6 to 24.9 uUI/ml, triglycerides≤150 mg/dL, total cholesterol≤200 mg/dl and HDL≥50 mg/dL,LDL≤130 mg/dL and VLDL up to 40 mg/dL [5, 19, 20].
Int J Diabetes Dev Ctries (January–March 2014) 34(1):32–39 33
Assessment of cardiovascular responses during restand maximal exercise testing
The subjects had a 12-lead conventional ECG recording(Ergo, HeartWare Ltda, Belo Horizonte, MG, Brazil) underrest and an ergometric test. For the incremental exercisetesting on a treadmill we used the Modified BruceProtocol [21]. The systolic blood pressure (SBP) and thediastolic blood pressure (DBP) were measured at rest and ateach step of the test using the auscultatory sphygmomanom-eter. Estimated maximum oxygen consumption (VO2max)achieved at peak exercise [22] was determined using themethod described by the American Heart Association [23].The metabolic equivalents (METs) were determined by theformula: VO2 / 3.5 [23].
Assessment of menopause symptoms
Symptoms of menopause were assessed by the Meno-pause Rating Scale (MRS) of Hauser et al. [24], translatedinto Portuguese and was previously used in a descriptivestudy [25]. The MRS questionnaire is composed of 11items divided into three subscales: (1) somatic symptomssuch as hot flashes, heart discomfort, sleeping problems,and muscle and joint problems (items 1–3 and 11); (2)psychological symptoms such as depressive mood, irrita-bility, anxiety, and physical and mental exhaustion (items4–7); and (3) urogenital-sexual problems such as bladderproblems and vaginal dryness (items 8–10). The totalscore per each subscale (somatic, psychological, andurogenital-sexual) is the sum of each graded itemcontained in that subscale. The total MRS score is thesum of the scores obtained for each subscale. The scoreswere also obtained by averaging the items. The magnitudeof the symptoms can be categorized according to theseverity of the symptoms for each domain of the MRS:absent or occasional (0–4 points), mild (5–8 points), mod-erate (9–15 points) or severe (≥16 points). Higher scoresobtained by the MRS point toward severe symptoms anda poor quality of life [25].
Statistical analysis
Measurements were expressed as mean and standard de-viations. The Shapiro-Wilk test was used to analyze the datanormality. Comparisons between the gynoid and androidgroups were made using the unpaired Student’s t test. Toinvestigate the relationship between the key variables, weused the Pearson product–moment correlation coefficients.The level of statistical significance was 5 % (P<0.05). Forthe statistical analysis the software Statistica for WindowsRelease 7 (Statsoft Inc., Tulsa, OK) was used.
Results
The clinical characteristics can be seen in Table 1. Theandroid group showed significantly higher values for bodymass, BMI, waist circumference, body fat, lean mass andskinfolds (P<0.05). Compared to gynoid group, androidwomen had significantly higher values of estradiol, triglyc-erides, VLDL, Castelli index I and insulin with lower insu-lin sensitivity and greater insulin resistance. The SBP andDBP values during rest were significantly higher, and themaximal heart rate (HRmax) during maximal exercise test-ing showed lower values for the android group (P<0.05)(Table 2). There were no significant differences (P≥0.05) inthe estimated VO2max (Table 2). The magnitude of thesomatic and urogenital-sexual symptoms was significantlyhigher for the android group compared to the gynoid group(Table 3).
There were lower but significant correlations betweenestradiol and body fat (r=0.41, P<0.01) as well as WHRfor both triglycerides (r=0.42, P<0.01) and insulin (r=0.34,P<0.05). There were also significant correlations betweenwaist circumference with Castelli index I (r=0.43, P<0.01,Fig. 1a). SBP during rest was moderately correlated tosubscapular skinfold (r=0.56, P<0.001, Fig. 1b), suprailiacskinfold (r=0.47, P<0.01), triceps skinfold (r=0.32, P<0.05), abdominal skinfold (r=0.39, P<0.01), body fat (r=0.51, P<0.001), triglycerides (r=0.32, P<0.05) and glucose(r=0.51, P<0.001). Regarding the menopause symptoms,there were lower but significant inverse correlations be-tween the HOMA %β-cell and the somatic symptoms (r=−0.39, P<0.05) as well as positive correlations betweenurogenital-sexual symptoms and circumference of waist(r=0.37, P<0.05, Fig. 1c).
Discussion
This study shows that android postmenopausal women de-velop features that can lead to MetS, and that they havehigher scores of somatic and urogenital-sexual symptoms.Estradiol levels had positive correlations with body fat. Inabdominal fat stores, androgens are converted to estrogen[12] which stimulates lipogenesis [26] and can explain thathigher BMI, body fat percentage and subcutaneous fat in theandroid group. A mobilization of fat from the adipocytes tothe visceral region is related to changes in the glucoseutilization that leading to insulin resistance, increased lipidaccumulation and increased production of triglycerides.Hyperinsulinemia results in enhanced sodium reabsorptionand increased sympathetic nervous system activity, whichmay contribute to hypertension, and to increased levels offree fatty acids [27].
34 Int J Diabetes Dev Ctries (January–March 2014) 34(1):32–39
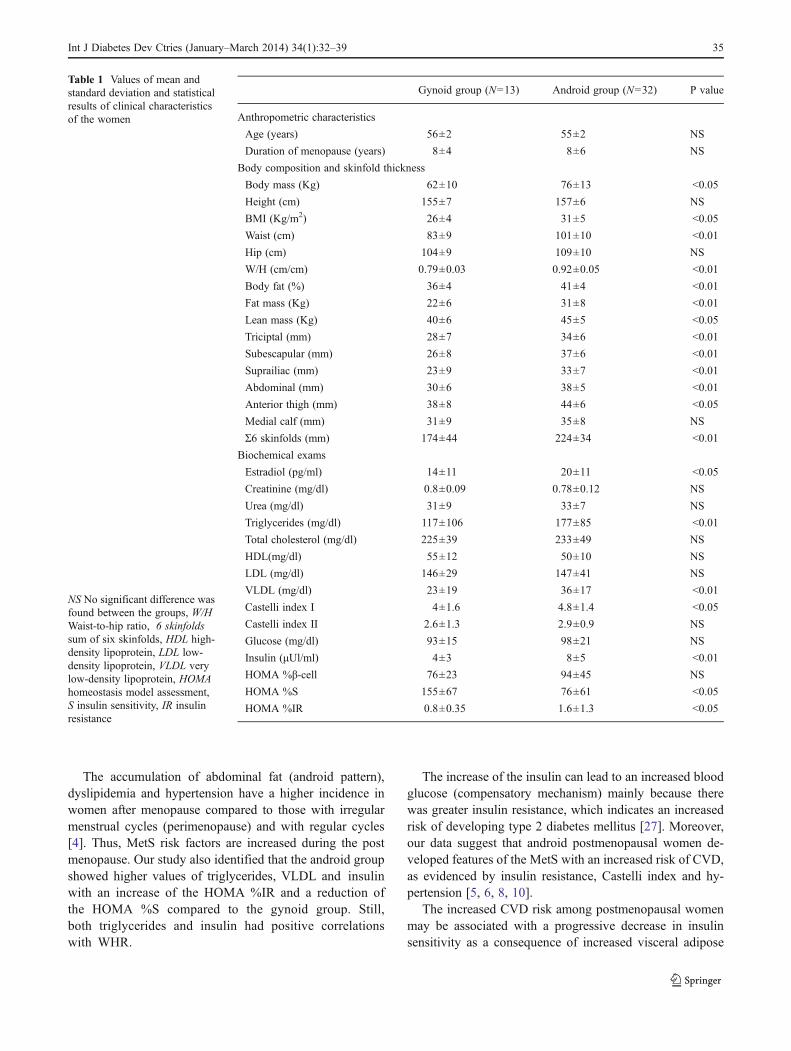
The accumulation of abdominal fat (android pattern),dyslipidemia and hypertension have a higher incidence inwomen after menopause compared to those with irregularmenstrual cycles (perimenopause) and with regular cycles[4]. Thus, MetS risk factors are increased during the postmenopause. Our study also identified that the android groupshowed higher values of triglycerides, VLDL and insulinwith an increase of the HOMA %IR and a reduction ofthe HOMA %S compared to the gynoid group. Still,both triglycerides and insulin had positive correlationswith WHR.
The increase of the insulin can lead to an increased bloodglucose (compensatory mechanism) mainly because therewas greater insulin resistance, which indicates an increasedrisk of developing type 2 diabetes mellitus [27]. Moreover,our data suggest that android postmenopausal women de-veloped features of the MetS with an increased risk of CVD,as evidenced by insulin resistance, Castelli index and hy-pertension [5, 6, 8, 10].
The increased CVD risk among postmenopausal womenmay be associated with a progressive decrease in insulinsensitivity as a consequence of increased visceral adipose
Table 1 Values of mean andstandard deviation and statisticalresults of clinical characteristicsof the women
NS No significant difference wasfound between the groups, W/HWaist-to-hip ratio, 6 skinfoldssum of six skinfolds, HDL high-density lipoprotein, LDL low-density lipoprotein, VLDL verylow-density lipoprotein, HOMAhomeostasis model assessment,S insulin sensitivity, IR insulinresistance
Gynoid group (N=13) Android group (N=32) P value
Anthropometric characteristics
Age (years) 56±2 55±2 NS
Duration of menopause (years) 8±4 8±6 NS
Body composition and skinfold thickness
Body mass (Kg) 62±10 76±13 <0.05
Height (cm) 155±7 157±6 NS
BMI (Kg/m2) 26±4 31±5 <0.05
Waist (cm) 83±9 101±10 <0.01
Hip (cm) 104±9 109±10 NS
W/H (cm/cm) 0.79±0.03 0.92±0.05 <0.01
Body fat (%) 36±4 41±4 <0.01
Fat mass (Kg) 22±6 31±8 <0.01
Lean mass (Kg) 40±6 45±5 <0.05
Triciptal (mm) 28±7 34±6 <0.01
Subescapular (mm) 26±8 37±6 <0.01
Suprailiac (mm) 23±9 33±7 <0.01
Abdominal (mm) 30±6 38±5 <0.01
Anterior thigh (mm) 38±8 44±6 <0.05
Medial calf (mm) 31±9 35±8 NS
Σ6 skinfolds (mm) 174±44 224±34 <0.01
Biochemical exams
Estradiol (pg/ml) 14±11 20±11 <0.05
Creatinine (mg/dl) 0.8±0.09 0.78±0.12 NS
Urea (mg/dl) 31±9 33±7 NS
Triglycerides (mg/dl) 117±106 177±85 <0.01
Total cholesterol (mg/dl) 225±39 233±49 NS
HDL(mg/dl) 55±12 50±10 NS
LDL (mg/dl) 146±29 147±41 NS
VLDL (mg/dl) 23±19 36±17 <0.01
Castelli index I 4±1.6 4.8±1.4 <0.05
Castelli index II 2.6±1.3 2.9±0.9 NS
Glucose (mg/dl) 93±15 98±21 NS
Insulin (μUl/ml) 4±3 8±5 <0.01
HOMA %β-cell 76±23 94±45 NS
HOMA %S 155±67 76±61 <0.05
HOMA %IR 0.8±0.35 1.6±1.3 <0.05
Int J Diabetes Dev Ctries (January–March 2014) 34(1):32–39 35
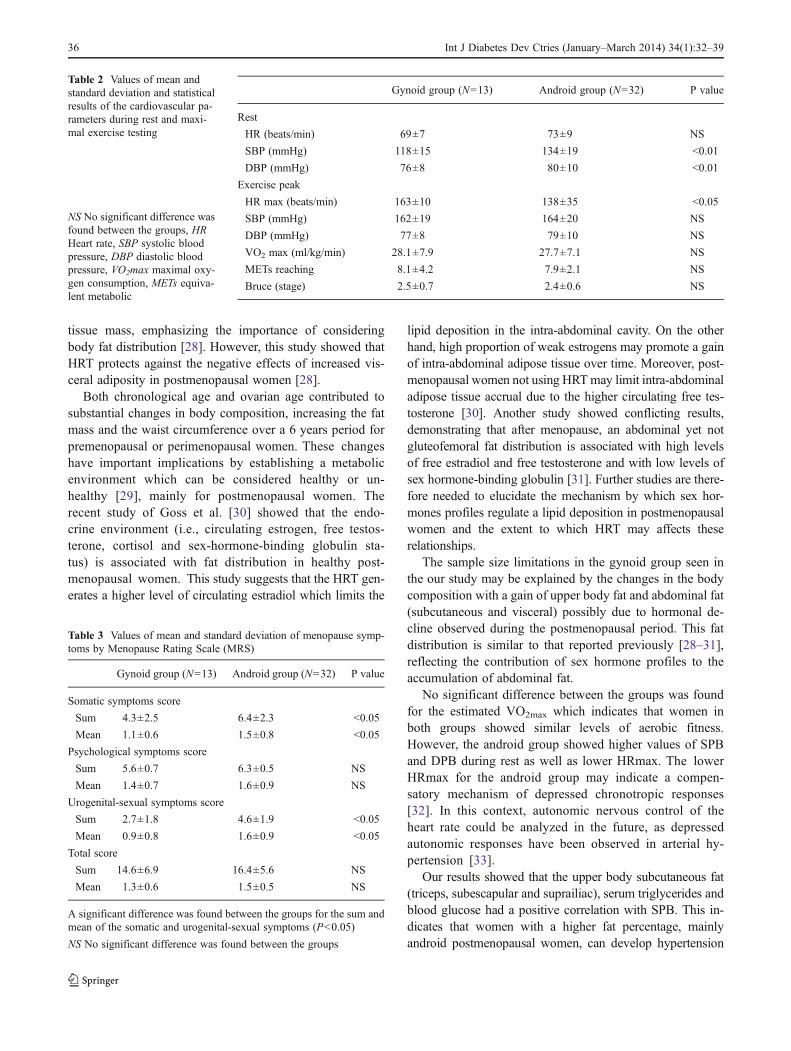
tissue mass, emphasizing the importance of consideringbody fat distribution [28]. However, this study showed thatHRT protects against the negative effects of increased vis-ceral adiposity in postmenopausal women [28].
Both chronological age and ovarian age contributed tosubstantial changes in body composition, increasing the fatmass and the waist circumference over a 6 years period forpremenopausal or perimenopausal women. These changeshave important implications by establishing a metabolicenvironment which can be considered healthy or un-healthy [29], mainly for postmenopausal women. Therecent study of Goss et al. [30] showed that the endo-crine environment (i.e., circulating estrogen, free testos-terone, cortisol and sex-hormone-binding globulin sta-tus) is associated with fat distribution in healthy post-menopausal women. This study suggests that the HRT gen-erates a higher level of circulating estradiol which limits the
lipid deposition in the intra-abdominal cavity. On the otherhand, high proportion of weak estrogens may promote a gainof intra-abdominal adipose tissue over time. Moreover, post-menopausal women not using HRTmay limit intra-abdominaladipose tissue accrual due to the higher circulating free tes-tosterone [30]. Another study showed conflicting results,demonstrating that after menopause, an abdominal yet notgluteofemoral fat distribution is associated with high levelsof free estradiol and free testosterone and with low levels ofsex hormone-binding globulin [31]. Further studies are there-fore needed to elucidate the mechanism by which sex hor-mones profiles regulate a lipid deposition in postmenopausalwomen and the extent to which HRT may affects theserelationships.
The sample size limitations in the gynoid group seen inthe our study may be explained by the changes in the bodycomposition with a gain of upper body fat and abdominal fat(subcutaneous and visceral) possibly due to hormonal de-cline observed during the postmenopausal period. This fatdistribution is similar to that reported previously [28–31],reflecting the contribution of sex hormone profiles to theaccumulation of abdominal fat.
No significant difference between the groups was foundfor the estimated VO2max which indicates that women inboth groups showed similar levels of aerobic fitness.However, the android group showed higher values of SPBand DPB during rest as well as lower HRmax. The lowerHRmax for the android group may indicate a compen-satory mechanism of depressed chronotropic responses[32]. In this context, autonomic nervous control of theheart rate could be analyzed in the future, as depressedautonomic responses have been observed in arterial hy-pertension [33].
Our results showed that the upper body subcutaneous fat(triceps, subescapular and suprailiac), serum triglycerides andblood glucose had a positive correlation with SPB. This in-dicates that women with a higher fat percentage, mainlyandroid postmenopausal women, can develop hypertension
Table 2 Values of mean andstandard deviation and statisticalresults of the cardiovascular pa-rameters during rest and maxi-mal exercise testing
NS No significant difference wasfound between the groups, HRHeart rate, SBP systolic bloodpressure, DBP diastolic bloodpressure, VO2max maximal oxy-gen consumption, METs equiva-lent metabolic
Gynoid group (N=13) Android group (N=32) P value
Rest
HR (beats/min) 69±7 73±9 NS
SBP (mmHg) 118±15 134±19 <0.01
DBP (mmHg) 76±8 80±10 <0.01
Exercise peak
HR max (beats/min) 163±10 138±35 <0.05
SBP (mmHg) 162±19 164±20 NS
DBP (mmHg) 77±8 79±10 NS
VO2 max (ml/kg/min) 28.1±7.9 27.7±7.1 NS
METs reaching 8.1±4.2 7.9±2.1 NS
Bruce (stage) 2.5±0.7 2.4±0.6 NS
Table 3 Values of mean and standard deviation of menopause symp-toms by Menopause Rating Scale (MRS)
Gynoid group (N=13) Android group (N=32) P value
Somatic symptoms score
Sum 4.3±2.5 6.4±2.3 <0.05
Mean 1.1±0.6 1.5±0.8 <0.05
Psychological symptoms score
Sum 5.6±0.7 6.3±0.5 NS
Mean 1.4±0.7 1.6±0.9 NS
Urogenital-sexual symptoms score
Sum 2.7±1.8 4.6±1.9 <0.05
Mean 0.9±0.8 1.6±0.9 <0.05
Total score
Sum 14.6±6.9 16.4±5.6 NS
Mean 1.3±0.6 1.5±0.5 NS
A significant difference was found between the groups for the sum andmean of the somatic and urogenital-sexual symptoms (P<0.05)
NS No significant difference was found between the groups
36 Int J Diabetes Dev Ctries (January–March 2014) 34(1):32–39
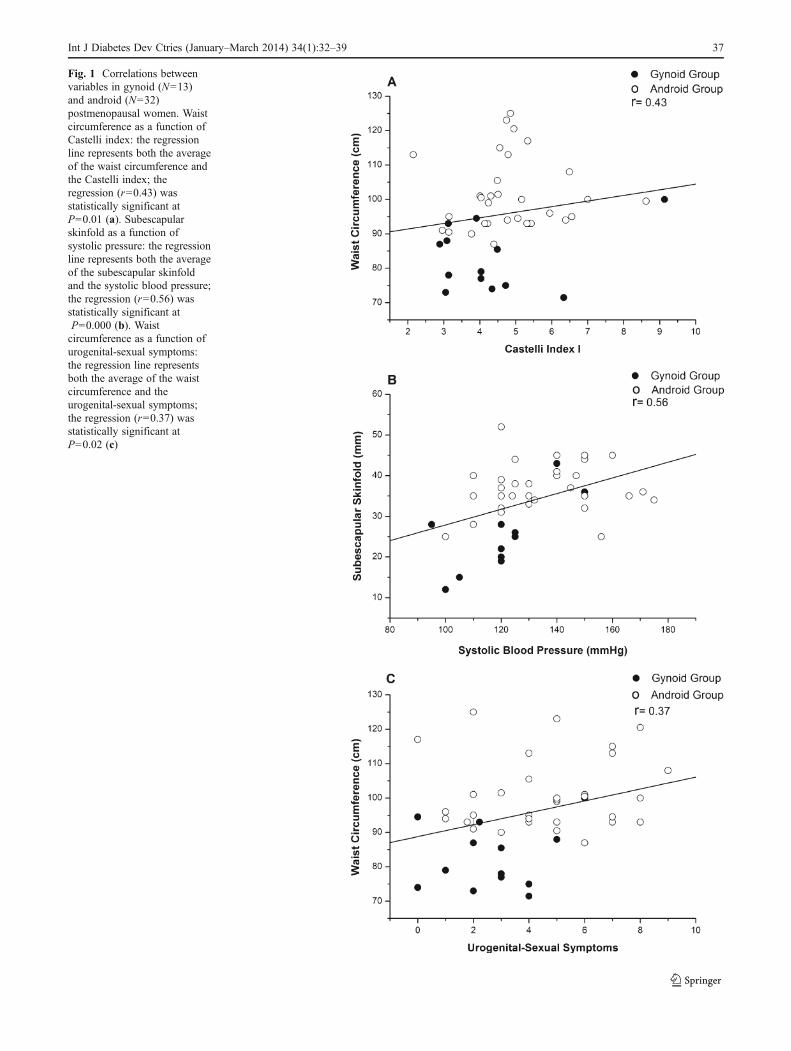
Fig. 1 Correlations betweenvariables in gynoid (N=13)and android (N=32)postmenopausal women. Waistcircumference as a function ofCastelli index: the regressionline represents both the averageof the waist circumference andthe Castelli index; theregression (r=0.43) wasstatistically significant atP=0.01 (a). Subescapularskinfold as a function ofsystolic pressure: the regressionline represents both the averageof the subescapular skinfoldand the systolic blood pressure;the regression (r=0.56) wasstatistically significant atP=0.000 (b). Waistcircumference as a function ofurogenital-sexual symptoms:the regression line representsboth the average of the waistcircumference and theurogenital-sexual symptoms;the regression (r=0.37) wasstatistically significant atP=0.02 (c)
Int J Diabetes Dev Ctries (January–March 2014) 34(1):32–39 37
associated with dyslipidemia and insulin resistance with at-tendant complications [19]. These findings were corroboratedby a longitudinal study, where even in adolescents (12–18 years) the increase in blood pressure was associated withan increased BMI, abdominal fat and upper body subcutane-ous fat [15]. Moreover, in another study, Lee et al. [34]observed that postmenopausal women with MetS showed ahigher total score of MRS and a higher subscale score for thesomatic symptoms.
Higher somatic symptoms were observed in the androidgroup. Hot flush, sweating, insomnia, dizziness and heartdiscomfort, palpitations and, muscle and, joint problems occurwith a higher frequency in postmenopausal women, mainly forthose with an increased body mass. Android fat distributionand a higher BMI can result in a poor quality of life duringmenopause [11].
Weakness and fatigue of the lower abdominal and pelvicfloor muscles in postmenopausal women can result in uri-nary incontinence. Higher BMI can result in a higher intra-abdominal pressure and in development and recurrence ofurinary incontinence [35]. Lower levels of sexual desire andlower frequency of penile–vaginal intercourse were associ-ated with more body fat and larger waist or hip circumfer-ence as well as lower arousal, orgasm, and lubrication, whenassociated with MetS during the premenopausal state [36,37]. Moreover, sexual pain and orgasmic disorder also occurdue to hypoestrogenemia [38].
However, in our study, the psychological symptoms weresimilar for the both groups, being commonly encounteredby women in this period of life [39] and they were notinfluenced by the type of fat distribution. A descriptivestudy in Brazil showed that perimenopausal women, butnot postmenopausal women, were at greater risk to undergominor psychiatric disorders [40]. A low level of education,memory loss, irritability, and the menopausal transition wererisk factors which may lead to positive findings in a screen-ing for minor psychiatric disorders [40]. However, the mag-nitude of all symptoms estimated by MRS for the gynoidand android group ranged from occasional to moderate. Thismay be due to the fact that, probably, a higher magnitude ofthese symptoms occurs in the menopausal transition.
However, an advantage for the android group observed inthe current study is the larger muscle mass compared to thegynoid group. This is important since the aging process in-duces a loss of muscle mass due to atrophy and neuromusculardegeneration [41]. The bigger muscle mass in the obesepostmenopausal women can be influenced by weight-bearing effects, which improves muscular function [22].
Several strategies have been developed to reduce MetSand CVD risk factors, for example, medication use [42], dietprograms [43], physical exercise program [44] andphototherapeutic technologies such as treatments using laser[45] or light-emitting diodes (LED) [46].
The limitations of this study were: we only used anthro-pometric parameters and electrical bioimpedance to measurebody composition and these do not distinguish betweenaccumulations of visceral and subcutaneous abdominal fat.In this context, imaging techniques (e.g., computed tomog-raphy, magnetic resonance and ultrasonography), whichcan distinguish fat from other tissues should be used infuture studies.
In conclusion, postmenopausal women with central obesitypresent a greater risk to developMetS and CVD, because thesewomen showed higher rates of hypertension, dyslipidemia,insulin resistance and hyperinsulinemia, leaving them proneto the development of a higher magnitude of somatic andurogenital-sexual symptoms. Moreover, the association ofandrogenic obesity with hypertension, hipertriglyceridemiaand insulin resistance can also amplify the occurrence ofMetS and future CVD during the postmenopausal period.Finally, the somatic and urogenital-sexual dysfunction couldalso occurs more often in these women than in those present-ing the gynoid pattern.
Acknowledgments We thank the participants without whom thisstudy would not have been possible. We acknowledge the supportfrom Fundação de Amparo à Pesquisa do Estado de São Paulo(FAPESP) –Grant no. 98/14270-8 and 09/01842-0; Conselho Nacional deDesenvolvimento Científico e Tecnológico (CNPq) – Grant no. 150949/2011-1 and 151008/2012-4; Coordenação de Aperfeiçoamento de Pessoalde Nível Superior (CAPES).
Conflicts of interest None
References
1. Messier V, Karelis AD, Lavoie ME, Brochu M, Faraj M, StrycharI, et al. Metabolic profile and quality of life in class I sarcopenicoverweight and obese postmenopausal women: a MONET study.Appl Physiol Nutr Metab. 2009;34:18–24.
2. Gorodeski GI. Update on cardiovascular disease in post-menopausalwomen. Best Pract Res Clin Obstet Gynaecol. 2002;16:329–55.
3. Lovejoy JC, Champagne CM, Jonge L, Xie H, Smith SR. Increasedvisceral fat and decreased energy expenditure during the menopausaltransition. Int J Obes (Lond). 2008;32:949–58.
4. Ebrahimpour P, Fakhrzadeh H, Heshmat R, Ghodsi M, BandarianF, Larijani B. Metabolic syndrome and menopause: a population-based study. Diab Metab Syndr Clin Res Rev. 2010;4:5–9.
5. Blümel JE, Legorreta D, Chedraui P, Ayala F, Bencosme A,Danckers L, et al. Optimal waist circumference cutoff valuefor defining the metabolic syndrome in postmenopausal LatinAmerican women. Menopause J N Am Menopause Soc. 2012.doi:10.1097/gme.0b013e318231fc79.
6. Corona G, Mannucci E, Petrone L, Schulman C, Balercia G, FisherAD, et al. A comparison of NCEP-ATPIII and IDF metabolic syn-drome definitions with relation to metabolic syndrome-associatedsexual dysfunction. J Sex Med. 2007;4:789–96.
7. Misso ML, Jang C, Adams J, Tran J, Murata Y, Bell R, et al.Differential expression of factors involved in fat metabolism withage and the menopause transition. Maturitas. 2005;51:299–306.
38 Int J Diabetes Dev Ctries (January–March 2014) 34(1):32–39
8. Feng Y, Hong X,Wilker E, Li Z, ZhangW, Jin D, et al. Effects of ageat menarche, reproductive years, and menopause on metabolic riskfactors for cardiovascular diseases. Atherosclerosis. 2008;196:590–7.
9. Toth MJ, Tchernof A, Sites CK, Poehlman ET. Effect of meno-pausal status on body composition and abdominal fat distribution.Int J Obes. 2000;24:226–31.
10. Després JP, Lemieux I. Abdominal obesity and metabolic syn-drome. Nature. 2006;44:881–7.
11. Castelo-Branco C, Palacios S, Ferrer-Barriendos J, Cancelo MJ,Quereda F, Alberich X. Impact of anthropometric parameters onquality of life during menopause. Fertil Steril. 2009;96:1947–52.
12. Li S, Wagner R, Holm K, Lehotsky J, Zinaman MJ. Relationshipbetween soft tissue body composition and bone mass in perimen-opausal women. Maturitas Eur Menopause J. 2004;47:99–105.
13. Fujibayashi M, Hamada T, Matsumoto T, Kiyohara N, Tanaka S,Kotani K, et al. Thermoregulatory sympathetic nervous systemactivity and diet-induced waist-circumference reduction in obeseJapanese women. Am J Hum Biol. 2009;21:828–35.
14. Moreno LA, Mesana MI, González-Gross M, Gil CM, Fleta J,Wärnberg J, et al. Anthropometric body fat composition referencevalues in Spanish adolescents. The AVENA Study. Eur J Clin Nutr.2006;60:191–6.
15. Maximova K, O’Loughlin J, Paradis G, Hanley JA, Lynch J. Changesin anthropometric characteristics and blood pressure during adoles-cence. Epidemiology. 2010;21:324–31.
16. Bagnoli VR, Fonseca AM, Halbe HW, Sauerbronn AVD, Pinotti JA.Como diagnosticar e tratar a síndrome do climatério. Rev Bras Med.2007;64:99–109.
17. Wilson PWF, Anderson KM, Harris T, Kannel WB, Castelli WP.Determinants of change in total cholesterol and HDL-C with age:the Framingham Study. J Gerontol Med Sci. 1994;49:M252–7.
18. HOMA Calculator. University of Oxford: Diabetes Trials Unit.www.dtu.ox.ac.uk/homacalculator/index.php.
19. Gorodeski EZ, Gorodeski GI. Epidemiology and risk factors ofcardiovascular disease in postmenopausal women. In: Lobo RA,editor. Treatment of the menopausal women: basic and clinical as-pects. 3rd ed. San Diego: Academic; 2007. p. 405–52.
20. Romaguera J, Ortiz AP, Roca FJ, Colón G, Suárez E. Factorsassociated with metabolic syndrome in a sample of women inPuerto Rico. Menopause J N Am Menopause Soc. 2010;17:388–92.
21. Johnson PH, Cowley AJ, Kinnear WJM. A randomized controlledtrial of inspiratory muscle training in stable chronic heart failure. EurHeart J. 1998;19:1249–53.
22. Paolillo FR, Milan JC, Bueno PG, Paolillo AR, Borghi-Silva A,Parizotto NA, et al. Effects of excess body mass on strength andfatigability of quadriceps in postmenopausal women.Menopause J NAm Menopause Soc. 2012. doi:10.1097/gme.0b013e3182364e80.
23. Haskell WL, Lee IM, Pate RR. Physical activity and public health:updated recommendation for adults from the American College ofSports Medicine and the American Heart Association. Med SciSports Exerc. 2007;39:1423–34.
24. Hauser GA, Huber IC, Keller PJ, Lauritzen C, Schneider H.Evaluation of climacteric symptoms (Menopause Rating Scale).Zentralbl Gynakol. 1994;116:16–23.
25. De Lorenzi D, Catan LB, Cusin T, Feline R, Bassani F, Arpini AC.Caracterização da qualidade de vida segundo o estado menopausalentre as mulheres da região sul do Brasil. Rev Bras Saúde MaternInfant. 2009;9:459–66.
26. Rossi ABR, Vergnanini AL. Cellulite: a review. Eur Acad DermatolVenereol. 2000;14:251–62.
27. Eckel R, Grundy S, Zimmet. The metabolic syndrome. Lancet.2005;365:1415–28.
28. Munoz J, Derstine A, Gower BA. Fat distribution and insulin sensi-tivity in postmenopausal women: influence of hormone replacement.Obes Res. 2002;10:424–31.
29. Sowers MF, Zheng H, Tomey K, Karvonen-Gutierrez C, Jannausch M,Li X, et al. Changes in body composition in women over six years atmidlife: ovarian and chronological aging. J Clin Endocrinol Metab.2007;92:895–901.
30. Goss AM,Darnell BE, BrownMA, Oster RA, Gower BA. Longitudinalassociations of the endocrine environment on fat partitioning in post-menopausal women. Obesity (Silver Spring). 2012;20:939–44.
31. Liedtke S, Schmidt ME, Vrieling A, Lukanova A, Becker S, KaaksR, et al. Postmenopausal sex hormones in relation to body fatdistribution. Obesity (Silver Spring). 2012;20:1088–95.
32. Lauer MS, Okin PM, Larson MG, Evans JC, Levy D. Impairedheart rate response to graded exercise: prognostic implications ofchronotropic incompetence in the Framingham Heart Study.Circulation. 1996;93:1520–6.
33. Pal GK, Pal P, Nanda N, Amudharaj D, Karthik S. Spectral analysisof heart rate variability (HRV) may predict the future development ofessential hypertension. Med Hypotheses. 2009;72:183–5.
34. Lee SW, Jo HH, KimMR, Kwon DJ, You YO, Kim JH. Associationbetween menopausal symptoms and metabolic syndrome in post-menopausal women. Arch Gynecol Obstet. 2011;285:541–8.
35. Noblett KL, Jesen JK, Ostergard DR. The relationship of bodymass index to intra-abdominal pressure as measured by multichan-nel cystometry. Int Urogynecol J. 1997;8:323–6.
36. Esposito K, Ciotola M, Marfella R, Di Tommaso D, Cobellis L,Giugliano D. The metabolic syndrome: a cause of sexual dysfunc-tion in women. Int J Impot Res. 2005;17:224–6.
37. Esposito K, Giuliano D. Obesity, the metabolic syndrome, andsexual dysfunction. Int J Impot Res. 2005;17:391–8.
38. Tan O, Bradshaw K, Carr BR. Management of vulvovaginal atrophyrelated sexual dysfunction in postmenopausal women: an up-to-datereview. Menopause J N Am Menopause Soc. 2012. doi:10.1097/gme.0b013e31821f92df.
39. Timur S, Sahyn NH. The prevalence of depression symptoms andinfluencing factors among perimenopausal and postmenopausalwomen. Menopause J N Am Menopause Soc. 2010;17:545–51.
40. Oppermann K, Fuchs SC, Donato G, Bastos CA, Spritzer PM. Physical,psychological, and menopause-related symptoms and minor psychiatricdisorders in a community-based sample of Brazilian premenopausal,perimenopausal, and postmenopausal women. Menopause J N AmMenopause Soc. 2012. doi:10.1097/gme.0b013e31822ba026.
41. Messier V, Rabasa-Lhoret R, Barbat-Artigas S, Elisha B, KareliscAD, Aubertin-Leheudre M. Menopause and sarcopenia: a potentialrole for sex hormones. Maturitas. 2011;68:331–6.
42. Koh Y, Ben-Ezra V, Biggerstaff KD, Nichols DL. Responses ofblood lipids and lipoproteins to extended-release niacin and exer-cise in sedentary postmenopausal women. J Gerontol A Biol SciMed Sci. 2010;65A:924–32.
43. Nicklas BJ, Katzel LI, Bunyard LB, Dennis KE, Goldberg AP. Effects ofan American Heart Association diet and weight loss on lipoprotein lipidsin obese, postmenopausal women. Am J Clin Nuir. 1997;66:853–9.
44. Hagner W, Hagner-Derengowska M, Wiacek M, Zubrzycki IZ.Changes in level of VO2max, blood lipids, and waist circumferencein the response tomoderate endurance training as a function of ovarianaging. Menopause J N Am Menopause Soc. 2009;16:1009–13.
45. Rushdi TA. Effect of low-level laser therapy on cholesterol and triglyc-eride serum levels in ICU patients: a controlled, randomized study.EJCTA. 2010;4:95–9.
46. Paolillo FR, Milan JC, Aniceto IV, Barreto SG, Rebelatto JR,Borghi-Silva A, et al. Effects of infrared-LED illumination appliedduring high-intensity treadmill training in postmenopausal women.Photomed Laser Surg. 2011;29:639–45.
Int J Diabetes Dev Ctries (January–March 2014) 34(1):32–39 39
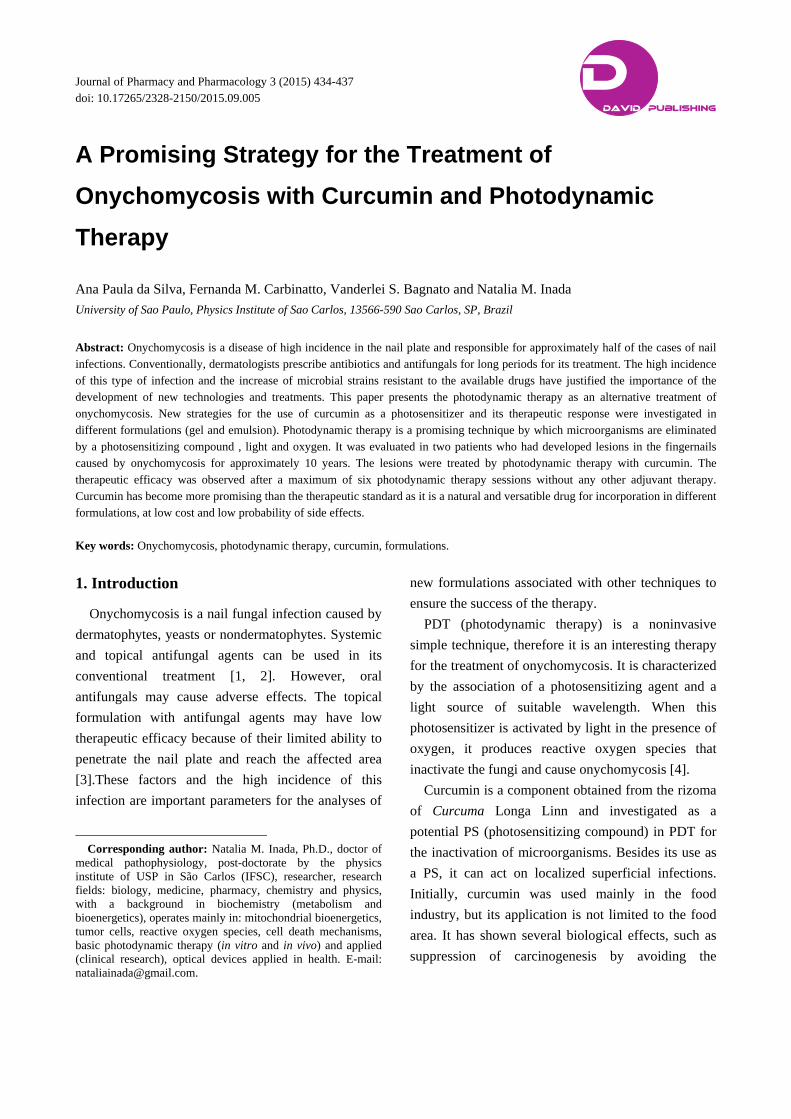
Journal of Pharmacy and Pharmacology 3 (2015) 434-437 doi: 10.17265/2328-2150/2015.09.005
A Promising Strategy for the Treatment of
Onychomycosis with Curcumin and Photodynamic
Therapy
Ana Paula da Silva, Fernanda M. Carbinatto, Vanderlei S. Bagnato and Natalia M. Inada
University of Sao Paulo, Physics Institute of Sao Carlos, 13566-590 Sao Carlos, SP, Brazil
Abstract: Onychomycosis is a disease of high incidence in the nail plate and responsible for approximately half of the cases of nail infections. Conventionally, dermatologists prescribe antibiotics and antifungals for long periods for its treatment. The high incidence of this type of infection and the increase of microbial strains resistant to the available drugs have justified the importance of the development of new technologies and treatments. This paper presents the photodynamic therapy as an alternative treatment of onychomycosis. New strategies for the use of curcumin as a photosensitizer and its therapeutic response were investigated in different formulations (gel and emulsion). Photodynamic therapy is a promising technique by which microorganisms are eliminated by a photosensitizing compound , light and oxygen. It was evaluated in two patients who had developed lesions in the fingernails caused by onychomycosis for approximately 10 years. The lesions were treated by photodynamic therapy with curcumin. The therapeutic efficacy was observed after a maximum of six photodynamic therapy sessions without any other adjuvant therapy. Curcumin has become more promising than the therapeutic standard as it is a natural and versatible drug for incorporation in different formulations, at low cost and low probability of side effects.
Key words: Onychomycosis, photodynamic therapy, curcumin, formulations.
1. Introduction
Onychomycosis is a nail fungal infection caused by
dermatophytes, yeasts or nondermatophytes. Systemic
and topical antifungal agents can be used in its
conventional treatment [1, 2]. However, oral
antifungals may cause adverse effects. The topical
formulation with antifungal agents may have low
therapeutic efficacy because of their limited ability to
penetrate the nail plate and reach the affected area
[3].These factors and the high incidence of this
infection are important parameters for the analyses of
Corresponding author: Natalia M. Inada, Ph.D., doctor of
medical pathophysiology, post-doctorate by the physics institute of USP in São Carlos (IFSC), researcher, research fields: biology, medicine, pharmacy, chemistry and physics, with a background in biochemistry (metabolism and bioenergetics), operates mainly in: mitochondrial bioenergetics, tumor cells, reactive oxygen species, cell death mechanisms, basic photodynamic therapy (in vitro and in vivo) and applied (clinical research), optical devices applied in health. E-mail: [email protected].
new formulations associated with other techniques to
ensure the success of the therapy.
PDT (photodynamic therapy) is a noninvasive
simple technique, therefore it is an interesting therapy
for the treatment of onychomycosis. It is characterized
by the association of a photosensitizing agent and a
light source of suitable wavelength. When this
photosensitizer is activated by light in the presence of
oxygen, it produces reactive oxygen species that
inactivate the fungi and cause onychomycosis [4].
Curcumin is a component obtained from the rizoma
of Curcuma Longa Linn and investigated as a
potential PS (photosensitizing compound) in PDT for
the inactivation of microorganisms. Besides its use as
a PS, it can act on localized superficial infections.
Initially, curcumin was used mainly in the food
industry, but its application is not limited to the food
area. It has shown several biological effects, such as
suppression of carcinogenesis by avoiding the
D DAVID PUBLISHING
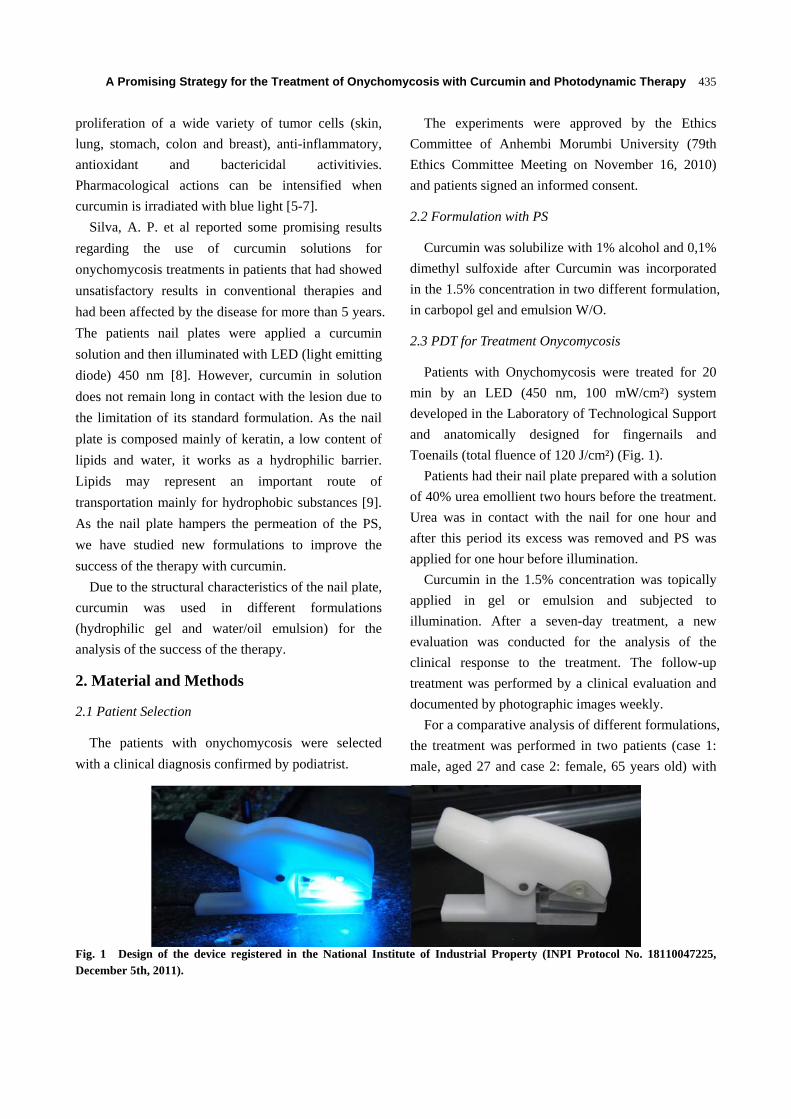
A Promising Strategy for the Treatment of Onychomycosis with Curcumin and Photodynamic Therapy
435
proliferation of a wide variety of tumor cells (skin,
lung, stomach, colon and breast), anti-inflammatory,
antioxidant and bactericidal activitivies.
Pharmacological actions can be intensified when
curcumin is irradiated with blue light [5-7].
Silva, A. P. et al reported some promising results
regarding the use of curcumin solutions for
onychomycosis treatments in patients that had showed
unsatisfactory results in conventional therapies and
had been affected by the disease for more than 5 years.
The patients nail plates were applied a curcumin
solution and then illuminated with LED (light emitting
diode) 450 nm [8]. However, curcumin in solution
does not remain long in contact with the lesion due to
the limitation of its standard formulation. As the nail
plate is composed mainly of keratin, a low content of
lipids and water, it works as a hydrophilic barrier.
Lipids may represent an important route of
transportation mainly for hydrophobic substances [9].
As the nail plate hampers the permeation of the PS,
we have studied new formulations to improve the
success of the therapy with curcumin.
Due to the structural characteristics of the nail plate,
curcumin was used in different formulations
(hydrophilic gel and water/oil emulsion) for the
analysis of the success of the therapy.
2. Material and Methods
2.1 Patient Selection
The patients with onychomycosis were selected
with a clinical diagnosis confirmed by podiatrist.
The experiments were approved by the Ethics
Committee of Anhembi Morumbi University (79th
Ethics Committee Meeting on November 16, 2010)
and patients signed an informed consent.
2.2 Formulation with PS
Curcumin was solubilize with 1% alcohol and 0,1%
dimethyl sulfoxide after Curcumin was incorporated
in the 1.5% concentration in two different formulation,
in carbopol gel and emulsion W/O.
2.3 PDT for Treatment Onycomycosis
Patients with Onychomycosis were treated for 20
min by an LED (450 nm, 100 mW/cm²) system
developed in the Laboratory of Technological Support
and anatomically designed for fingernails and
Toenails (total fluence of 120 J/cm²) (Fig. 1).
Patients had their nail plate prepared with a solution
of 40% urea emollient two hours before the treatment.
Urea was in contact with the nail for one hour and
after this period its excess was removed and PS was
applied for one hour before illumination.
Curcumin in the 1.5% concentration was topically
applied in gel or emulsion and subjected to
illumination. After a seven-day treatment, a new
evaluation was conducted for the analysis of the
clinical response to the treatment. The follow-up
treatment was performed by a clinical evaluation and
documented by photographic images weekly.
For a comparative analysis of different formulations,
the treatment was performed in two patients (case 1:
male, aged 27 and case 2: female, 65 years old) with
Fig. 1 Design of the device registered in the National Institute of Industrial Property (INPI Protocol No. 18110047225, December 5th, 2011).
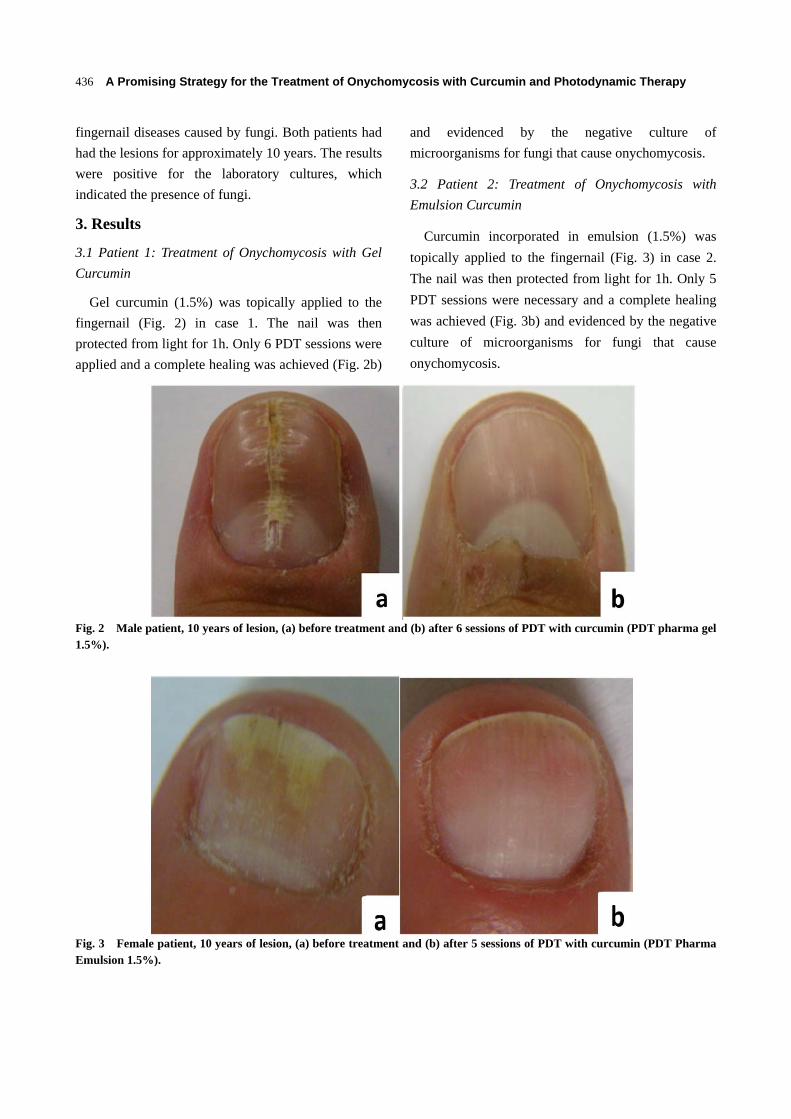
A Promising Strategy for the Treatment of Onychomycosis with Curcumin and Photodynamic Therapy
436
fingernail diseases caused by fungi. Both patients had
had the lesions for approximately 10 years. The results
were positive for the laboratory cultures, which
indicated the presence of fungi.
3. Results
3.1 Patient 1: Treatment of Onychomycosis with Gel
Curcumin
Gel curcumin (1.5%) was topically applied to the
fingernail (Fig. 2) in case 1. The nail was then
protected from light for 1h. Only 6 PDT sessions were
applied and a complete healing was achieved (Fig. 2b)
and evidenced by the negative culture of
microorganisms for fungi that cause onychomycosis.
3.2 Patient 2: Treatment of Onychomycosis with
Emulsion Curcumin
Curcumin incorporated in emulsion (1.5%) was
topically applied to the fingernail (Fig. 3) in case 2.
The nail was then protected from light for 1h. Only 5
PDT sessions were necessary and a complete healing
was achieved (Fig. 3b) and evidenced by the negative
culture of microorganisms for fungi that cause
onychomycosis.
Fig. 2 Male patient, 10 years of lesion, (a) before treatment and (b) after 6 sessions of PDT with curcumin (PDT pharma gel 1.5%).
Fig. 3 Female patient, 10 years of lesion, (a) before treatment and (b) after 5 sessions of PDT with curcumin (PDT Pharma Emulsion 1.5%).
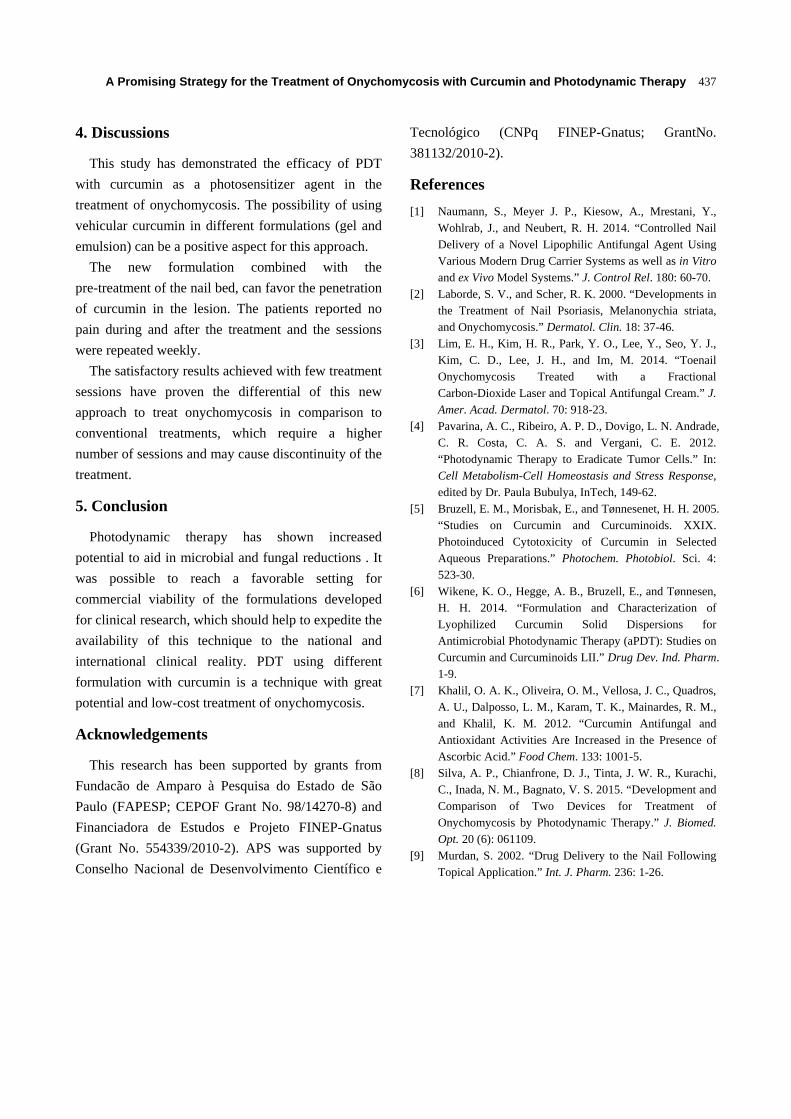
A Promising Strategy for the Treatment of Onychomycosis with Curcumin and Photodynamic Therapy
437
4. Discussions
This study has demonstrated the efficacy of PDT
with curcumin as a photosensitizer agent in the
treatment of onychomycosis. The possibility of using
vehicular curcumin in different formulations (gel and
emulsion) can be a positive aspect for this approach.
The new formulation combined with the
pre-treatment of the nail bed, can favor the penetration
of curcumin in the lesion. The patients reported no
pain during and after the treatment and the sessions
were repeated weekly.
The satisfactory results achieved with few treatment
sessions have proven the differential of this new
approach to treat onychomycosis in comparison to
conventional treatments, which require a higher
number of sessions and may cause discontinuity of the
treatment.
5. Conclusion
Photodynamic therapy has shown increased
potential to aid in microbial and fungal reductions . It
was possible to reach a favorable setting for
commercial viability of the formulations developed
for clinical research, which should help to expedite the
availability of this technique to the national and
international clinical reality. PDT using different
formulation with curcumin is a technique with great
potential and low-cost treatment of onychomycosis.
Acknowledgements
This research has been supported by grants from
Fundacão de Amparo à Pesquisa do Estado de São
Paulo (FAPESP; CEPOF Grant No. 98/14270-8) and
Financiadora de Estudos e Projeto FINEP-Gnatus
(Grant No. 554339/2010-2). APS was supported by
Conselho Nacional de Desenvolvimento Científico e
Tecnológico (CNPq FINEP-Gnatus; GrantNo.
381132/2010-2).
References
[1] Naumann, S., Meyer J. P., Kiesow, A., Mrestani, Y., Wohlrab, J., and Neubert, R. H. 2014. “Controlled Nail Delivery of a Novel Lipophilic Antifungal Agent Using Various Modern Drug Carrier Systems as well as in Vitro and ex Vivo Model Systems.” J. Control Rel. 180: 60-70.
[2] Laborde, S. V., and Scher, R. K. 2000. “Developments in the Treatment of Nail Psoriasis, Melanonychia striata, and Onychomycosis.” Dermatol. Clin. 18: 37-46.
[3] Lim, E. H., Kim, H. R., Park, Y. O., Lee, Y., Seo, Y. J., Kim, C. D., Lee, J. H., and Im, M. 2014. “Toenail Onychomycosis Treated with a Fractional Carbon-Dioxide Laser and Topical Antifungal Cream.” J. Amer. Acad. Dermatol. 70: 918-23.
[4] Pavarina, A. C., Ribeiro, A. P. D., Dovigo, L. N. Andrade, C. R. Costa, C. A. S. and Vergani, C. E. 2012. “Photodynamic Therapy to Eradicate Tumor Cells.” In: Cell Metabolism-Cell Homeostasis and Stress Response, edited by Dr. Paula Bubulya, InTech, 149-62.
[5] Bruzell, E. M., Morisbak, E., and Tønnesenet, H. H. 2005. “Studies on Curcumin and Curcuminoids. XXIX. Photoinduced Cytotoxicity of Curcumin in Selected Aqueous Preparations.” Photochem. Photobiol. Sci. 4: 523-30.
[6] Wikene, K. O., Hegge, A. B., Bruzell, E., and Tønnesen, H. H. 2014. “Formulation and Characterization of Lyophilized Curcumin Solid Dispersions for Antimicrobial Photodynamic Therapy (aPDT): Studies on Curcumin and Curcuminoids LII.” Drug Dev. Ind. Pharm. 1-9.
[7] Khalil, O. A. K., Oliveira, O. M., Vellosa, J. C., Quadros, A. U., Dalposso, L. M., Karam, T. K., Mainardes, R. M., and Khalil, K. M. 2012. “Curcumin Antifungal and Antioxidant Activities Are Increased in the Presence of Ascorbic Acid.” Food Chem. 133: 1001-5.
[8] Silva, A. P., Chianfrone, D. J., Tinta, J. W. R., Kurachi, C., Inada, N. M., Bagnato, V. S. 2015. “Development and Comparison of Two Devices for Treatment of Onychomycosis by Photodynamic Therapy.” J. Biomed. Opt. 20 (6): 061109.
[9] Murdan, S. 2002. “Drug Delivery to the Nail Following Topical Application.” Int. J. Pharm. 236: 1-26.
Can low-level laser therapy (LLLT) associated with an aerobic plusresistance training change the cardiometabolic risk in obese women? Aplacebo-controlled clinical trial
Fernanda Oliveira Duarte a,⁎, Marcela Sene-Fiorese b, Antonio Eduardo de Aquino Junior a,c,Raquel Munhoz da Silveira Campos d, Deborah Cristina Landi Masquio d, Lian Tock e,Ana Claudia Garcia de Oliveira Duarte f, Ana Raimunda Dâmaso d,Vanderlei Salvador Bagnato b,c, Nivaldo Antonio Parizotto a,c
a Therapeutic Resources Laboratory, Department of Physiotherapy, Federal University of São Carlos (UFSCar), Rodovia Washington Luis, Km 235, 13565-905 São Carlos, São Paulo, Brazilb São Carlos Institute of Physics, University of São Paulo (USP), Avenida Trabalhador Sãocarlense, 400, PO Box 369, 13560-970 São Carlos, São Paulo, Brazilc Post-Graduated Program of Biotechnology, Federal University of São Carlos (UFSCar), Rodovia Washington Luis, Km 235, 13565-905 São Carlos, São Paulo, Brazild Post-Graduated Program of Nutrition, Federal University of São Paulo (UNIFESP), Rua Marselhesa, 650, 04021-001 São Paulo, São Paulo, Brazile Weight Science, rua Teodoro Sampaio, 744, Cj. 98, 05406-000 São Paulo, São Paulo, Brazilf Nutrition andMetabolism Applied to Exercise Laboratory, Department of Physical Education, Federal University of São Carlos (UFSCar), RodoviaWashington Luis, Km 235, 13565-905 São Carlos,São Paulo, Brazil
a b s t r a c ta r t i c l e i n f o
Article history:Received 12 May 2015Received in revised form 28 August 2015Accepted 31 August 2015Available online 2 September 2015
Keywords:ObesityLow-level laser therapy (LLLT)Aerobic exerciseResistance exerciseInflammationCardiometabolic risk
Introduction:Obesity is one of themost important link factors to coronary artery disease developmentmainly dueto the pro-inflammatory and pro-thrombotic states favoring atherosclerosis progression. The LLLT acts in the cel-lularmetabolism and it is highly effective to improve inflammation. The sameoccur in response to different kindsof exercise. However, we have not known the associate effects using LLLT therapies with aerobic plus resistancetraining as strategy specifically with target at human obesity control and its comorbidities.Objective: Investigate the effects of the LLLT associated with aerobic plus resistance training on cardiometabolicrisk factors in obese women.Methodology: Women aged 20–40 years (BMI ≥ 30 kg/m2), were divided into 2 groups: Phototherapy (PHOTO)and Placebo. They were trained aerobic plus resistance exercises (in a concurrent mode), 1 h, 3 times/week during16weeks. Phototherapywas applied after each exercise session for 16min,with infrared laser,wavelength 808 nm,continuous output, power 100 mW, and energy delivery 50 J. The body composition was measured withbioimpedance. Inflammatory mark concentrations were measured using a commercially available multiplex.Results: LLLT associatedwith aerobic plus resistance trainingwas effective in decrease neck (P= 0.0003) andwaistcircumferences (P=0.02); percentual of fat (P=0.04); visceral fat area (P=0.02);HOMA-IR (P=0.0009); Leptin(P= 0.03) and ICAM (P= 0.03). Also, the reduction in leptin (P= 0.008) and ICAM-1 (0, 05) was muchmore ex-pressive in the phototherapy group in comparison to placebo group when analyzed by delta values.Conclusion: LLLT associated with concurrent exercise (aerobic plus resistance training) potentiates the exercise ef-fects of decreasing the cardiometabolic risk factors in obese woman. These results suggest the LLLT associated withexercises as a new therapeutic tool in the control of obesity and its comorbidities for obese people, targeting to op-timize the strategies to control the cardiometabolic risk factors in these populations.
© 2015 Elsevier B.V. All rights reserved.
1. Introduction
Obesity is a complex disease and its pathogenesis is multifactorial,resulting mainly from sedentary behaviors coupled with inadequate
eating habits [1,2]. It is strongly associatedwith subclinical inflammation,metabolic syndrome, type 2 diabetes and an elevated risk of cardiovas-cular diseases [3]. Some cytokineswith higher concentrations in obesitypromote the development of cardiovascular disease, mainly pro-inflammatory proteins such as leptin, plasminogen activator inhibitor(PAI-1), interleukin-6 (IL-6), tumor necrosis factors alpha (TNF-α), in-tracellular adhesion molecule 1 (ICAM-1) and vascular cell adhesionmolecule 1 (VCAM-1), among others [4,5].
Journal of Photochemistry & Photobiology, B: Biology 153 (2015) 103–110
⁎ Corresponding author at: Therapeutic Resourses Laboratory, Department ofPhysiotherapy, Federal University of São Carlos (UFSCar), Rodovia Washington Luis, Km235, 13565-905 São Carlos, São Paulo, Brazil. Tel.: +55 16 3351 8985.
E-mail address: [email protected] (F.O. Duarte).
http://dx.doi.org/10.1016/j.jphotobiol.2015.08.0261011-1344/© 2015 Elsevier B.V. All rights reserved.
Contents lists available at ScienceDirect
Journal of Photochemistry & Photobiology, B: Biology
j ourna l homepage: www.e lsev ie r .com/ locate / jpb
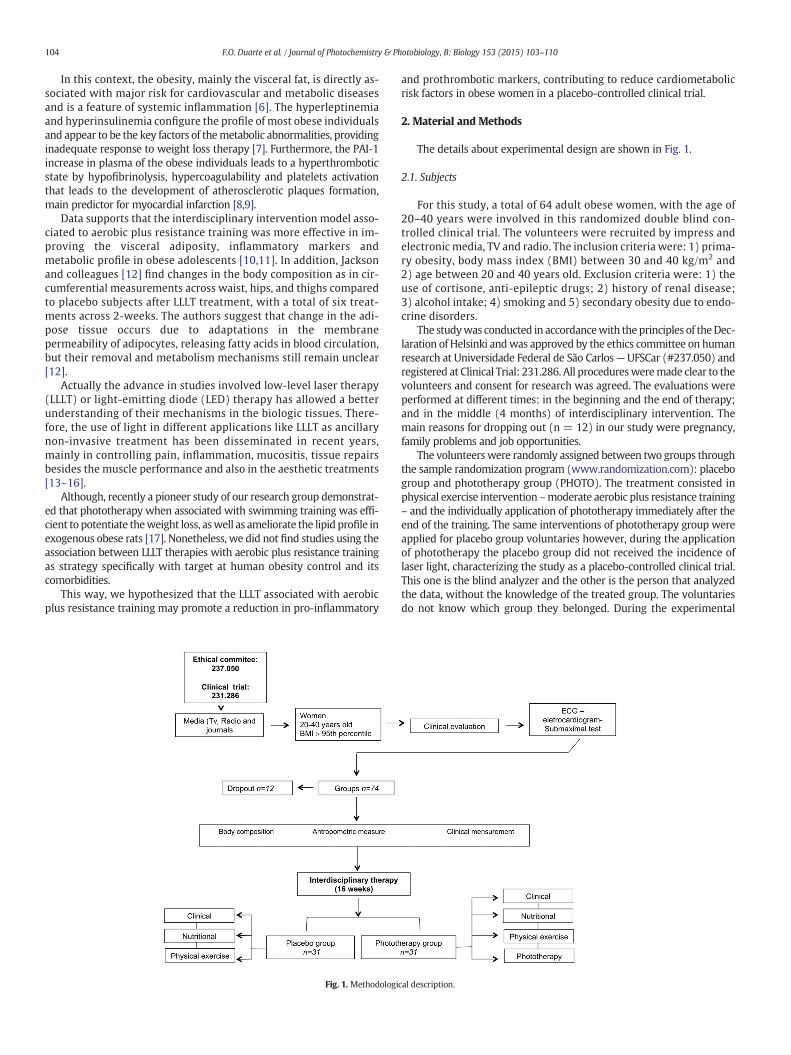
In this context, the obesity, mainly the visceral fat, is directly as-sociated with major risk for cardiovascular and metabolic diseasesand is a feature of systemic inflammation [6]. The hyperleptinemiaand hyperinsulinemia configure the profile of most obese individualsand appear to be the key factors of themetabolic abnormalities, providinginadequate response to weight loss therapy [7]. Furthermore, the PAI-1increase in plasma of the obese individuals leads to a hyperthromboticstate by hypofibrinolysis, hypercoagulability and platelets activationthat leads to the development of atherosclerotic plaques formation,main predictor for myocardial infarction [8,9].
Data supports that the interdisciplinary intervention model asso-ciated to aerobic plus resistance training was more effective in im-proving the visceral adiposity, inflammatory markers andmetabolic profile in obese adolescents [10,11]. In addition, Jacksonand colleagues [12] find changes in the body composition as in cir-cumferential measurements across waist, hips, and thighs comparedto placebo subjects after LLLT treatment, with a total of six treat-ments across 2-weeks. The authors suggest that change in the adi-pose tissue occurs due to adaptations in the membranepermeability of adipocytes, releasing fatty acids in blood circulation,but their removal and metabolism mechanisms still remain unclear[12].
Actually the advance in studies involved low-level laser therapy(LLLT) or light-emitting diode (LED) therapy has allowed a betterunderstanding of their mechanisms in the biologic tissues. There-fore, the use of light in different applications like LLLT as ancillarynon-invasive treatment has been disseminated in recent years,mainly in controlling pain, inflammation, mucositis, tissue repairsbesides the muscle performance and also in the aesthetic treatments[13–16].
Although, recently a pioneer study of our research group demonstrat-ed that phototherapy when associated with swimming training was effi-cient to potentiate theweight loss, aswell as ameliorate the lipid profile inexogenous obese rats [17]. Nonetheless, we did not find studies using theassociation between LLLT therapies with aerobic plus resistance trainingas strategy specifically with target at human obesity control and itscomorbidities.
This way, we hypothesized that the LLLT associated with aerobicplus resistance training may promote a reduction in pro-inflammatory
and prothrombotic markers, contributing to reduce cardiometabolicrisk factors in obese women in a placebo-controlled clinical trial.
2. Material and Methods
The details about experimental design are shown in Fig. 1.
2.1. Subjects
For this study, a total of 64 adult obese women, with the age of20–40 years were involved in this randomized double blind con-trolled clinical trial. The volunteers were recruited by impress andelectronic media, TV and radio. The inclusion criteria were: 1) prima-ry obesity, body mass index (BMI) between 30 and 40 kg/m2 and2) age between 20 and 40 years old. Exclusion criteria were: 1) theuse of cortisone, anti-epileptic drugs; 2) history of renal disease;3) alcohol intake; 4) smoking and 5) secondary obesity due to endo-crine disorders.
The studywas conducted in accordancewith the principles of theDec-laration of Helsinki andwas approved by the ethics committee on humanresearch at Universidade Federal de São Carlos—UFSCar (#237.050) andregistered at Clinical Trial: 231.286. All proceduresweremade clear to thevolunteers and consent for research was agreed. The evaluations wereperformed at different times: in the beginning and the end of therapy;and in the middle (4 months) of interdisciplinary intervention. Themain reasons for dropping out (n = 12) in our study were pregnancy,family problems and job opportunities.
The volunteerswere randomly assigned between two groups throughthe sample randomization program (www.randomization.com): placebogroup and phototherapy group (PHOTO). The treatment consisted inphysical exercise intervention –moderate aerobic plus resistance training– and the individually application of phototherapy immediately after theend of the training. The same interventions of phototherapy group wereapplied for placebo group voluntaries however, during the applicationof phototherapy the placebo group did not received the incidence oflaser light, characterizing the study as a placebo-controlled clinical trial.This one is the blind analyzer and the other is the person that analyzedthe data, without the knowledge of the treated group. The voluntariesdo not know which group they belonged. During the experimental
Fig. 1. Methodological description.
104 F.O. Duarte et al. / Journal of Photochemistry & Photobiology, B: Biology 153 (2015) 103–110
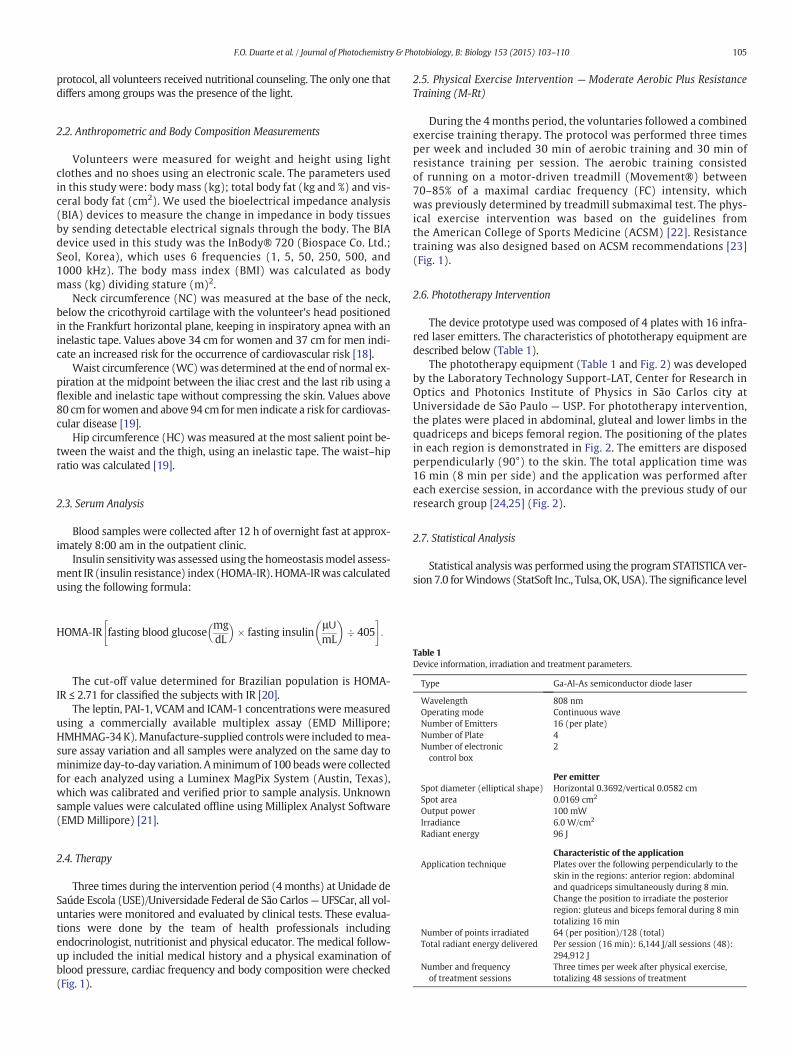
protocol, all volunteers received nutritional counseling. The only one thatdiffers among groups was the presence of the light.
2.2. Anthropometric and Body Composition Measurements
Volunteers were measured for weight and height using lightclothes and no shoes using an electronic scale. The parameters usedin this study were: body mass (kg); total body fat (kg and %) and vis-ceral body fat (cm2). We used the bioelectrical impedance analysis(BIA) devices to measure the change in impedance in body tissuesby sending detectable electrical signals through the body. The BIAdevice used in this study was the InBody® 720 (Biospace Co. Ltd.;Seol, Korea), which uses 6 frequencies (1, 5, 50, 250, 500, and1000 kHz). The body mass index (BMI) was calculated as bodymass (kg) dividing stature (m)2.
Neck circumference (NC) was measured at the base of the neck,below the cricothyroid cartilage with the volunteer's head positionedin the Frankfurt horizontal plane, keeping in inspiratory apnea with aninelastic tape. Values above 34 cm for women and 37 cm for men indi-cate an increased risk for the occurrence of cardiovascular risk [18].
Waist circumference (WC)was determined at the end of normal ex-piration at the midpoint between the iliac crest and the last rib using aflexible and inelastic tape without compressing the skin. Values above80 cm forwomen and above 94 cm formen indicate a risk for cardiovas-cular disease [19].
Hip circumference (HC) was measured at the most salient point be-tween the waist and the thigh, using an inelastic tape. The waist–hipratio was calculated [19].
2.3. Serum Analysis
Blood samples were collected after 12 h of overnight fast at approx-imately 8:00 am in the outpatient clinic.
Insulin sensitivitywas assessed using the homeostasismodel assess-ment IR (insulin resistance) index (HOMA-IR). HOMA-IRwas calculatedusing the following formula:
HOMA‐IR fasting blood glucosemgdL
fasting insulin
μ∪mL
405
:
The cut-off value determined for Brazilian population is HOMA-IR ≤ 2.71 for classified the subjects with IR [20].
The leptin, PAI-1, VCAM and ICAM-1 concentrations were measuredusing a commercially available multiplex assay (EMD Millipore;HMHMAG-34K).Manufacture-supplied controlswere included tomea-sure assay variation and all samples were analyzed on the same day tominimize day-to-day variation. Aminimumof 100 beadswere collectedfor each analyzed using a Luminex MagPix System (Austin, Texas),which was calibrated and verified prior to sample analysis. Unknownsample values were calculated offline using Milliplex Analyst Software(EMD Millipore) [21].
2.4. Therapy
Three times during the intervention period (4 months) at Unidade deSaúde Escola (USE)/Universidade Federal de São Carlos—UFSCar, all vol-untaries were monitored and evaluated by clinical tests. These evalua-tions were done by the team of health professionals includingendocrinologist, nutritionist and physical educator. The medical follow-up included the initial medical history and a physical examination ofblood pressure, cardiac frequency and body composition were checked(Fig. 1).
2.5. Physical Exercise Intervention — Moderate Aerobic Plus ResistanceTraining (M-Rt)
During the 4 months period, the voluntaries followed a combinedexercise training therapy. The protocol was performed three timesper week and included 30 min of aerobic training and 30 min ofresistance training per session. The aerobic training consistedof running on a motor-driven treadmill (Movement®) between70–85% of a maximal cardiac frequency (FC) intensity, whichwas previously determined by treadmill submaximal test. The phys-ical exercise intervention was based on the guidelines fromthe American College of Sports Medicine (ACSM) [22]. Resistancetraining was also designed based on ACSM recommendations [23](Fig. 1).
2.6. Phototherapy Intervention
The device prototype used was composed of 4 plates with 16 infra-red laser emitters. The characteristics of phototherapy equipment aredescribed below (Table 1).
The phototherapy equipment (Table 1 and Fig. 2) was developedby the Laboratory Technology Support-LAT, Center for Research inOptics and Photonics Institute of Physics in São Carlos city atUniversidade de São Paulo — USP. For phototherapy intervention,the plates were placed in abdominal, gluteal and lower limbs in thequadriceps and biceps femoral region. The positioning of the platesin each region is demonstrated in Fig. 2. The emitters are disposedperpendicularly (90°) to the skin. The total application time was16 min (8 min per side) and the application was performed aftereach exercise session, in accordance with the previous study of ourresearch group [24,25] (Fig. 2).
2.7. Statistical Analysis
Statistical analysis was performed using the program STATISTICA ver-sion 7.0 forWindows (StatSoft Inc., Tulsa, OK, USA). The significance level
Table 1Device information, irradiation and treatment parameters.
Type Ga-Al-As semiconductor diode laser
Wavelength 808 nmOperating mode Continuous waveNumber of Emitters 16 (per plate)Number of Plate 4Number of electroniccontrol box
2
Per emitterSpot diameter (elliptical shape) Horizontal 0.3692/vertical 0.0582 cmSpot area 0.0169 cm2
Output power 100 mWIrradiance 6.0 W/cm2
Radiant energy 96 J
Characteristic of the applicationApplication technique Plates over the following perpendicularly to the
skin in the regions: anterior region: abdominaland quadriceps simultaneously during 8 min.Change the position to irradiate the posteriorregion: gluteus and biceps femoral during 8 mintotalizing 16 min
Number of points irradiated 64 (per position)/128 (total)Total radiant energy delivered Per session (16 min): 6,144 J/all sessions (48):
294,912 JNumber and frequencyof treatment sessions
Three times per week after physical exercise,totalizing 48 sessions of treatment
105F.O. Duarte et al. / Journal of Photochemistry & Photobiology, B: Biology 153 (2015) 103–110
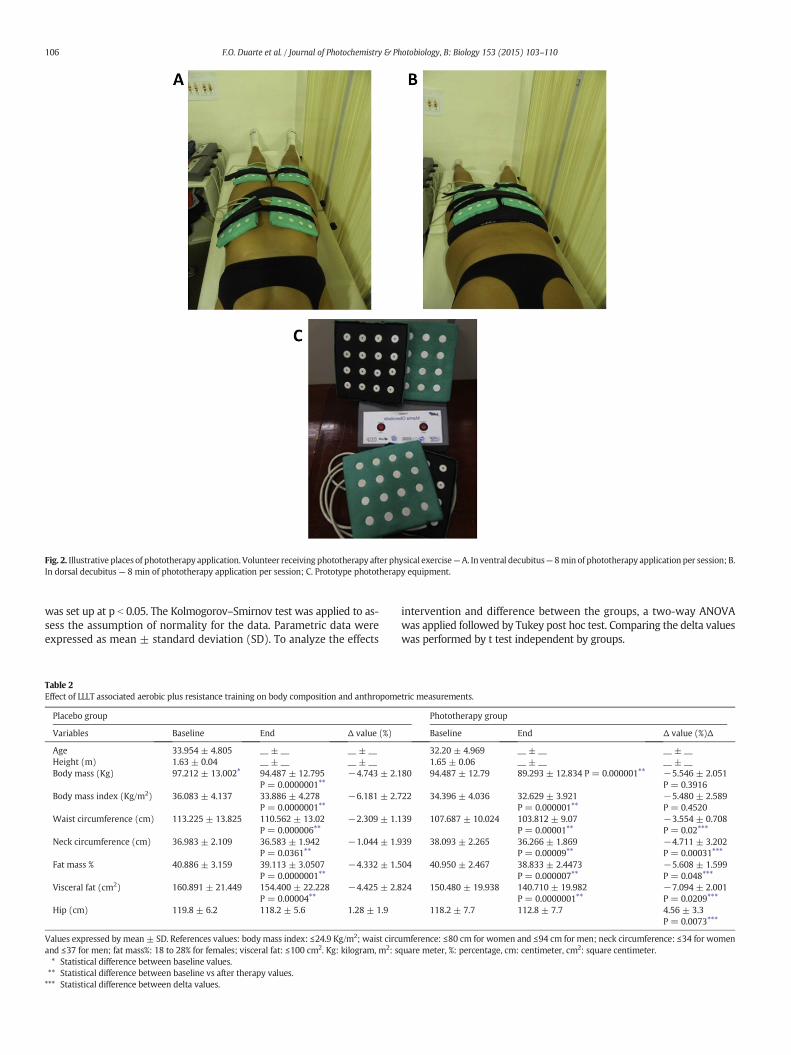
was set up at p b 0.05. The Kolmogorov–Smirnov test was applied to as-sess the assumption of normality for the data. Parametric data wereexpressed as mean ± standard deviation (SD). To analyze the effects
intervention and difference between the groups, a two-way ANOVAwas applied followed by Tukey post hoc test. Comparing the delta valueswas performed by t test independent by groups.
Fig. 2. Illustrative places of phototherapy application. Volunteer receiving phototherapy after physical exercise—A. In ventral decubitus— 8min of phototherapy application per session; B.In dorsal decubitus— 8 min of phototherapy application per session; C. Prototype phototherapy equipment.
Table 2Effect of LLLT associated aerobic plus resistance training on body composition and anthropometric measurements.
Placebo group Phototherapy group
Variables Baseline End Δ value (%) Baseline End Δ value (%)Δ
Age 33.954 ± 4.805 __ ± __ __ ± __ 32.20 ± 4.969 __ ± __ __ ± __Height (m) 1.63 ± 0.04 __ ± __ __ ± __ 1.65 ± 0.06 __ ± __ __ ± __Body mass (Kg) 97.212 ± 13.002⁎ 94.487 ± 12.795
P = 0.0000001⁎⁎−4.743 ± 2.180 94.487 ± 12.79 89.293 ± 12.834 P = 0.000001⁎⁎ −5.546 ± 2.051
P = 0.3916Body mass index (Kg/m2) 36.083 ± 4.137 33.886 ± 4.278
P = 0.0000001⁎⁎−6.181 ± 2.722 34.396 ± 4.036 32.629 ± 3.921
P = 0.000001⁎⁎−5.480 ± 2.589P = 0.4520
Waist circumference (cm) 113.225 ± 13.825 110.562 ± 13.02P = 0.000006⁎⁎
−2.309 ± 1.139 107.687 ± 10.024 103.812 ± 9.07P = 0.00001⁎⁎
−3.554 ± 0.708P = 0.02⁎⁎⁎
Neck circumference (cm) 36.983 ± 2.109 36.583 ± 1.942P = 0.0361⁎⁎
−1.044 ± 1.939 38.093 ± 2.265 36.266 ± 1.869P = 0.00009⁎⁎
−4.711 ± 3.202P = 0.00031⁎⁎⁎
Fat mass % 40.886 ± 3.159 39.113 ± 3.0507P = 0.0000001⁎⁎
−4.332 ± 1.504 40.950 ± 2.467 38.833 ± 2.4473P = 0.000007⁎⁎
−5.608 ± 1.599P = 0.048⁎⁎⁎
Visceral fat (cm2) 160.891 ± 21.449 154.400 ± 22.228P = 0.00004⁎⁎
−4.425 ± 2.824 150.480 ± 19.938 140.710 ± 19.982P = 0.0000001⁎⁎
−7.094 ± 2.001P = 0.0209⁎⁎⁎
Hip (cm) 119.8 ± 6.2 118.2 ± 5.6 1.28 ± 1.9 118.2 ± 7.7 112.8 ± 7.7 4.56 ± 3.3P = 0.0073⁎⁎⁎
Values expressed by mean ± SD. References values: body mass index: ≤24.9 Kg/m2; waist circumference: ≤80 cm for women and ≤94 cm for men; neck circumference: ≤34 for womenand ≤37 for men; fat mass%: 18 to 28% for females; visceral fat: ≤100 cm2. Kg: kilogram, m2: square meter, %: percentage, cm: centimeter, cm2: square centimeter.⁎ Statistical difference between baseline values.⁎⁎ Statistical difference between baseline vs after therapy values.⁎⁎⁎ Statistical difference between delta values.
106 F.O. Duarte et al. / Journal of Photochemistry & Photobiology, B: Biology 153 (2015) 103–110
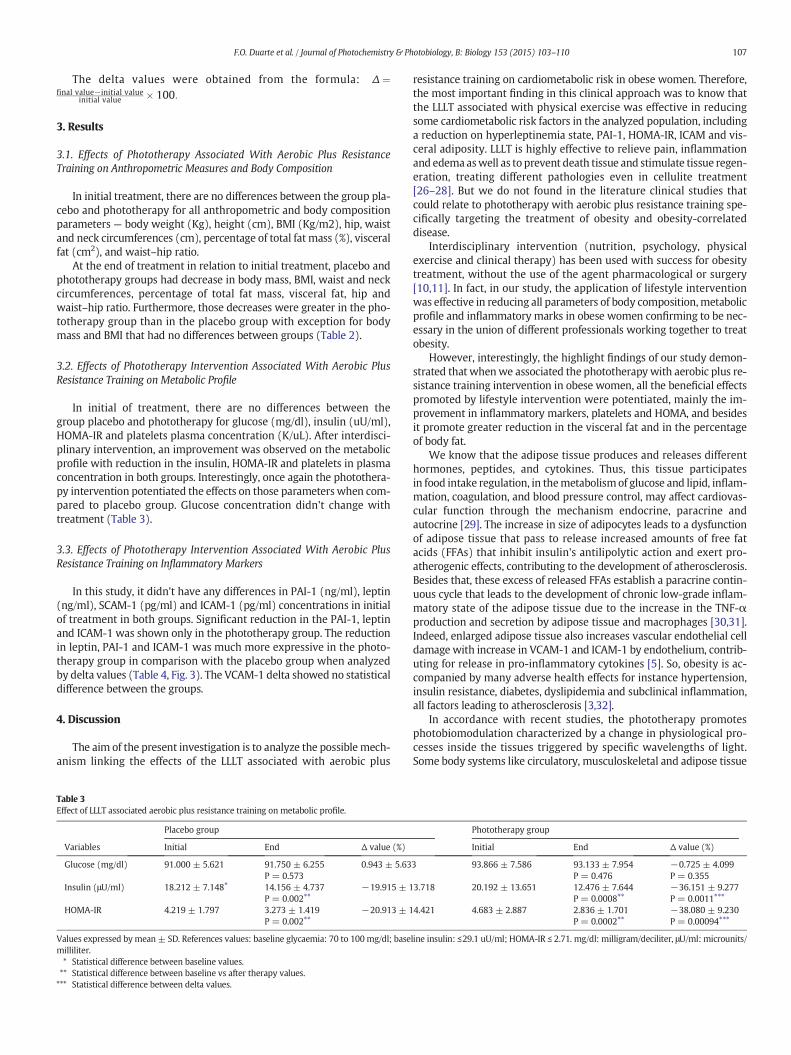
The delta values were obtained from the formula: Δ ¼final value−initial value
initial value 100:
3. Results
3.1. Effects of Phototherapy Associated With Aerobic Plus ResistanceTraining on Anthropometric Measures and Body Composition
In initial treatment, there are no differences between the group pla-cebo and phototherapy for all anthropometric and body compositionparameters — body weight (Kg), height (cm), BMI (Kg/m2), hip, waistand neck circumferences (cm), percentage of total fat mass (%), visceralfat (cm2), and waist–hip ratio.
At the end of treatment in relation to initial treatment, placebo andphototherapy groups had decrease in body mass, BMI, waist and neckcircumferences, percentage of total fat mass, visceral fat, hip andwaist–hip ratio. Furthermore, those decreases were greater in the pho-totherapy group than in the placebo group with exception for bodymass and BMI that had no differences between groups (Table 2).
3.2. Effects of Phototherapy Intervention Associated With Aerobic PlusResistance Training on Metabolic Profile
In initial of treatment, there are no differences between thegroup placebo and phototherapy for glucose (mg/dl), insulin (uU/ml),HOMA-IR and platelets plasma concentration (K/uL). After interdisci-plinary intervention, an improvement was observed on the metabolicprofile with reduction in the insulin, HOMA-IR and platelets in plasmaconcentration in both groups. Interestingly, once again the photothera-py intervention potentiated the effects on those parameters when com-pared to placebo group. Glucose concentration didn't change withtreatment (Table 3).
3.3. Effects of Phototherapy Intervention Associated With Aerobic PlusResistance Training on Inflammatory Markers
In this study, it didn't have any differences in PAI-1 (ng/ml), leptin(ng/ml), SCAM-1 (pg/ml) and ICAM-1 (pg/ml) concentrations in initialof treatment in both groups. Significant reduction in the PAI-1, leptinand ICAM-1 was shown only in the phototherapy group. The reductionin leptin, PAI-1 and ICAM-1 was much more expressive in the photo-therapy group in comparison with the placebo group when analyzedby delta values (Table 4, Fig. 3). The VCAM-1 delta showed no statisticaldifference between the groups.
4. Discussion
The aim of the present investigation is to analyze the possiblemech-anism linking the effects of the LLLT associated with aerobic plus
resistance training on cardiometabolic risk in obese women. Therefore,the most important finding in this clinical approach was to know thatthe LLLT associated with physical exercise was effective in reducingsome cardiometabolic risk factors in the analyzed population, includinga reduction on hyperleptinemia state, PAI-1, HOMA-IR, ICAM and vis-ceral adiposity. LLLT is highly effective to relieve pain, inflammationand edemaaswell as to prevent death tissue and stimulate tissue regen-eration, treating different pathologies even in cellulite treatment[26–28]. But we do not found in the literature clinical studies thatcould relate to phototherapy with aerobic plus resistance training spe-cifically targeting the treatment of obesity and obesity-correlateddisease.
Interdisciplinary intervention (nutrition, psychology, physicalexercise and clinical therapy) has been used with success for obesitytreatment, without the use of the agent pharmacological or surgery[10,11]. In fact, in our study, the application of lifestyle interventionwas effective in reducing all parameters of body composition,metabolicprofile and inflammatory marks in obese women confirming to be nec-essary in the union of different professionals working together to treatobesity.
However, interestingly, the highlight findings of our study demon-strated that whenwe associated the phototherapy with aerobic plus re-sistance training intervention in obese women, all the beneficial effectspromoted by lifestyle intervention were potentiated, mainly the im-provement in inflammatory markers, platelets and HOMA, and besidesit promote greater reduction in the visceral fat and in the percentageof body fat.
We know that the adipose tissue produces and releases differenthormones, peptides, and cytokines. Thus, this tissue participatesin food intake regulation, in themetabolismof glucose and lipid, inflam-mation, coagulation, and blood pressure control, may affect cardiovas-cular function through the mechanism endocrine, paracrine andautocrine [29]. The increase in size of adipocytes leads to a dysfunctionof adipose tissue that pass to release increased amounts of free fatacids (FFAs) that inhibit insulin's antilipolytic action and exert pro-atherogenic effects, contributing to the development of atherosclerosis.Besides that, these excess of released FFAs establish a paracrine contin-uous cycle that leads to the development of chronic low-grade inflam-matory state of the adipose tissue due to the increase in the TNF-αproduction and secretion by adipose tissue and macrophages [30,31].Indeed, enlarged adipose tissue also increases vascular endothelial celldamage with increase in VCAM-1 and ICAM-1 by endothelium, contrib-uting for release in pro-inflammatory cytokines [5]. So, obesity is ac-companied by many adverse health effects for instance hypertension,insulin resistance, diabetes, dyslipidemia and subclinical inflammation,all factors leading to atherosclerosis [3,32].
In accordance with recent studies, the phototherapy promotesphotobiomodulation characterized by a change in physiological pro-cesses inside the tissues triggered by specific wavelengths of light.Some body systems like circulatory, musculoskeletal and adipose tissue
Table 3Effect of LLLT associated aerobic plus resistance training on metabolic profile.
Placebo group Phototherapy group
Variables Initial End Δ value (%) Initial End Δ value (%)
Glucose (mg/dl) 91.000 ± 5.621 91.750 ± 6.255P = 0.573
0.943 ± 5.633 93.866 ± 7.586 93.133 ± 7.954P = 0.476
−0.725 ± 4.099P = 0.355
Insulin (μU/ml) 18.212 ± 7.148⁎ 14.156 ± 4.737P = 0.002⁎⁎
−19.915 ± 13.718 20.192 ± 13.651 12.476 ± 7.644P = 0.0008⁎⁎
−36.151 ± 9.277P = 0.0011⁎⁎⁎
HOMA-IR 4.219 ± 1.797 3.273 ± 1.419P = 0.002⁎⁎
−20.913 ± 14.421 4.683 ± 2.887 2.836 ± 1.701P = 0.0002⁎⁎
−38.080 ± 9.230P = 0.00094⁎⁎⁎
Values expressed by mean ± SD. References values: baseline glycaemia: 70 to 100 mg/dl; baseline insulin: ≤29.1 uU/ml; HOMA-IR ≤ 2.71. mg/dl: milligram/deciliter, μU/ml: microunits/milliliter.⁎ Statistical difference between baseline values.⁎⁎ Statistical difference between baseline vs after therapy values.⁎⁎⁎ Statistical difference between delta values.
107F.O. Duarte et al. / Journal of Photochemistry & Photobiology, B: Biology 153 (2015) 103–110
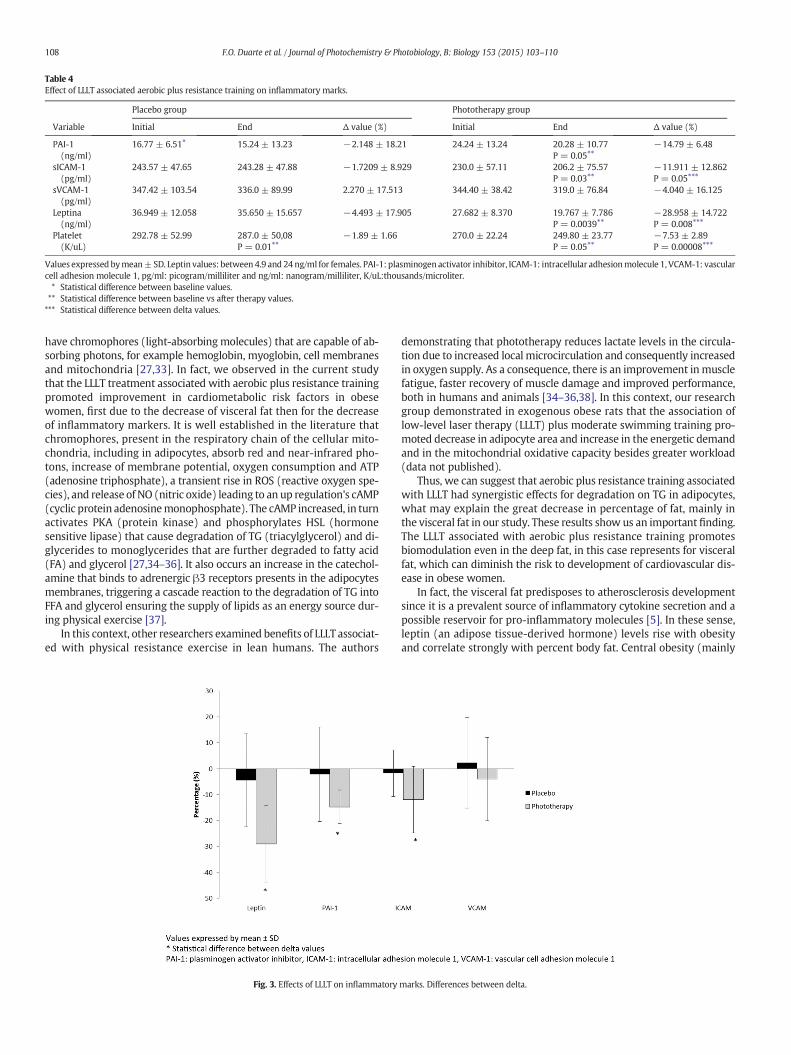
have chromophores (light-absorbingmolecules) that are capable of ab-sorbing photons, for example hemoglobin, myoglobin, cell membranesand mitochondria [27,33]. In fact, we observed in the current studythat the LLLT treatment associated with aerobic plus resistance trainingpromoted improvement in cardiometabolic risk factors in obesewomen, first due to the decrease of visceral fat then for the decreaseof inflammatory markers. It is well established in the literature thatchromophores, present in the respiratory chain of the cellular mito-chondria, including in adipocytes, absorb red and near-infrared pho-tons, increase of membrane potential, oxygen consumption and ATP(adenosine triphosphate), a transient rise in ROS (reactive oxygen spe-cies), and release of NO (nitric oxide) leading to an up regulation's cAMP(cyclic protein adenosinemonophosphate). The cAMP increased, in turnactivates PKA (protein kinase) and phosphorylates HSL (hormonesensitive lipase) that cause degradation of TG (triacylglycerol) and di-glycerides to monoglycerides that are further degraded to fatty acid(FA) and glycerol [27,34–36]. It also occurs an increase in the catechol-amine that binds to adrenergic β3 receptors presents in the adipocytesmembranes, triggering a cascade reaction to the degradation of TG intoFFA and glycerol ensuring the supply of lipids as an energy source dur-ing physical exercise [37].
In this context, other researchers examined benefits of LLLT associat-ed with physical resistance exercise in lean humans. The authors
demonstrating that phototherapy reduces lactate levels in the circula-tion due to increased local microcirculation and consequently increasedin oxygen supply. As a consequence, there is an improvement inmusclefatigue, faster recovery of muscle damage and improved performance,both in humans and animals [34–36,38]. In this context, our researchgroup demonstrated in exogenous obese rats that the association oflow-level laser therapy (LLLT) plus moderate swimming training pro-moted decrease in adipocyte area and increase in the energetic demandand in the mitochondrial oxidative capacity besides greater workload(data not published).
Thus, we can suggest that aerobic plus resistance training associatedwith LLLT had synergistic effects for degradation on TG in adipocytes,what may explain the great decrease in percentage of fat, mainly inthe visceral fat in our study. These results show us an important finding.The LLLT associated with aerobic plus resistance training promotesbiomodulation even in the deep fat, in this case represents for visceralfat, which can diminish the risk to development of cardiovascular dis-ease in obese women.
In fact, the visceral fat predisposes to atherosclerosis developmentsince it is a prevalent source of inflammatory cytokine secretion and apossible reservoir for pro-inflammatory molecules [5]. In these sense,leptin (an adipose tissue-derived hormone) levels rise with obesityand correlate strongly with percent body fat. Central obesity (mainly
Table 4Effect of LLLT associated aerobic plus resistance training on inflammatory marks.
Placebo group Phototherapy group
Variable Initial End Δ value (%) Initial End Δ value (%)
PAI-1(ng/ml)
16.77 ± 6.51⁎ 15.24 ± 13.23 −2.148 ± 18.21 24.24 ± 13.24 20.28 ± 10.77P = 0.05⁎⁎
−14.79 ± 6.48
sICAM-1(pg/ml)
243.57 ± 47.65 243.28 ± 47.88 −1.7209 ± 8.929 230.0 ± 57.11 206.2 ± 75.57P = 0.03⁎⁎
−11.911 ± 12.862P = 0.05⁎⁎⁎
sVCAM-1(pg/ml)
347.42 ± 103.54 336.0 ± 89.99 2.270 ± 17.513 344.40 ± 38.42 319.0 ± 76.84 −4.040 ± 16.125
Leptina(ng/ml)
36.949 ± 12.058 35.650 ± 15.657 −4.493 ± 17.905 27.682 ± 8.370 19.767 ± 7.786P = 0.0039⁎⁎
−28.958 ± 14.722P = 0.008⁎⁎⁎
Platelet(K/uL)
292.78 ± 52.99 287.0 ± 50,08P = 0.01⁎⁎
−1.89 ± 1.66 270.0 ± 22.24 249.80 ± 23.77P = 0.05⁎⁎
−7.53 ± 2.89P = 0.00008⁎⁎⁎
Values expressed bymean±SD. Leptin values: between 4.9 and 24 ng/ml for females. PAI-1: plasminogen activator inhibitor, ICAM-1: intracellular adhesionmolecule 1, VCAM-1: vascularcell adhesion molecule 1, pg/ml: picogram/milliliter and ng/ml: nanogram/milliliter, K/uL:thousands/microliter.⁎ Statistical difference between baseline values.⁎⁎ Statistical difference between baseline vs after therapy values.⁎⁎⁎ Statistical difference between delta values.
Fig. 3. Effects of LLLT on inflammatory marks. Differences between delta.
108 F.O. Duarte et al. / Journal of Photochemistry & Photobiology, B: Biology 153 (2015) 103–110
the visceral fat), as well as waist and more recently neck circumfer-ences, all of them are associated to high risk of insulin resistance andmetabolic complications [42–46].
Besides that, both hyperleptinemia and insulin resistance are con-sidered risk factors for cardiometabolic disease. Due to the leptin rolein regulating blood pressure and activating the sympathetic nervoussystem, insulin resistance, platelet aggregation, arterial thrombosis, an-giogenesis, and inflammatory vascular responses, the leptin has a closerelationship with the development of coronary heart disease, when inhyperleptinemia state, as our volunteers at the beginning of treatment[39,47]. Thereby, in this current study, the LLLT associated with aerobicplus resistance training can auxiliary decrease the cardiometabolic riskobserved in obesity, since this treatment reduce hyperleptinemia stateand insulin resistance measured by HOMA-IR, beyond greater decreasein waist and neck circumferences compared to a placebo group.
In a recent study, the authors observed that LLLT can modulate thebalance between pro and anti-inflammatory cytokines, both systemical-ly and peripherally in lean rats [40]. Other study shows that laser irradi-ation with wavelength of 808 nm, similar with our study, in coronaryartery, results in increase of anti-inflammatory and decrease in thepro-inflammatory interleukins levels [41]. In fact, we observed in thecurrent study evidence that LLLT in wavelength of 808 nm promoted,beyond the effect on the reduction of adipose tissue, a systemic effectin the modulation of inflammatory process. The LLLT associated withaerobic plus resistance training decreased PAI-1, ICAM-1, VCAM-1besides reducing circulating concentrations of leptin and insulin asdiscussed above.
These findings are important since in most cases of obesity, individ-uals have vascular endothelial cell damage that in turn expresses celladhesion molecules 1 (CAMs), including ICAM-1 and VCAM-1. Circulat-ing leukocytes are selective attracting and monocytes chemotactic pro-tein 1 (MCP-1) are released by endothelial cells that stimulate to recruitmononuclear cell circulating differentiated into macrophages in thevesselwall. This development in the local inflammatory responses stim-ulates other cell types to produce pro-inflammatory cytokines, resultingin an inflammatory response that magnified beyond the original localarea of endothelial dysfunction [32].
Furthermore, themain inhibitor of fibrinolysis, the PAI-1 (plasmino-gen inhibitor of fibrinolysis) increase in plasma of the obese individualsleads to a hyperthrombotic state by hypofibrinolysis, hypercoagulabilityand platelets activation that leads to development of atheroscleroticplaques formation, the main predictor for myocardial infarction [8,9].Besides that, oxidative stress transforms an anti-atherosclerotic NO-producing enzyme into pro-atherosclerotic superoxide producing one,in addition to stimulates the inducible nitric oxide synthase raising theoxidative stress. Therefore, oxidative stress has been linked to increasedplatelet activation, characteristics in many obese individuals [32]. In arecent review, the authors showed some studies, with rats and humans,about the effect of the exercise aerobic and/or resistance training on in-flammation in adipose tissue and endothelial cells, decreasing pro-inflammatory cytokine expression and increasing anti-inflammatoryprotein expression in this tissue [5]. These authors also show thatchronic exercise aswell reduce the number of pro-inflammatorymono-cytes and increase circulating numbers of regulatory T cells, which re-lease anti-inflammatory cytokines and reduce chronic inflammation.
In this manner, the biophotomodulation generated by LLLT canaffect the application area, as well as the surrounding regions affectmetabolic changes, generating systemic effects [48]. In accordancewith Novoselova and colleagues [49], the tissue irradiated with low-power laser produces signaling factors that will circulate into the lym-phatic system and blood vessels. This way, associated the exercise ef-fects with the local and systemic effects promoted by LLLT on theinflammation decreases dramatically the cardiometabolic risk in obeseindividuals. Finally, despite this as being a new study that uses new tech-nologies (laser) aiming to control cardiometabolic disease in obesewomen, we were able to show that associated effects of exercise with
LLLT, include the local and systemic improvements, is corroboratingwith an improvement in inflammatory state and a substantially decreasein the cardiometabolic risk factors in these individuals.
In conclusion, the results observed in the present investigation sug-gest that LLLT associated with aerobic plus resistance training may be anew therapeutic tool in targeting to optimize the control of cardiomet-abolic risk factors in obese people.
Conflict of Interest
None disclosed.
Financial Support
We thank the financial support for all research agencies like: CNPq(150177/2014-3); CNPq 300654/2013-8; FAPESP (2013/19046-0);FAPESP (2013/04136-4).
Acknowledgments
We thank Ms Jorge Camargo Oishi for the assistance with statisticalanalyses, Ms Cynthia Aparecida Castro and Ms Karina Ana da Silva fortechnical support during the training protocol and data collection andPaulo Henrique Colturato Reame for opening his gym (Oxy) for devel-opment to the project.
References
[1] F.O. Duarte, M. Sene-Fiorese, N.C. Cheik, A.S. Maria, A.E. de Aquino Jr., J.C. Oishi, E.A.Rossi, A.C. Garcia de Oliveira Duarte, A.R. Dâmaso, Food restriction and refeeding in-duces changes in lipid pathways and fat deposition in the adipose and hepatic tis-sues in rats with diet-induced obesity, Exp. Physiol. 97 (7) (Jul 2012) 882–894,http://dx.doi.org/10.1113/expphysiol.2011.064121.
[2] F.C. Corgosinho, C. Ackel-D'Elia, S. Tufik, A.R. Dâmaso, A. de Piano, L. Sanches Pde,R.M. Campos, P.L. Silva, J. Carnier, L. Tock, M.L. Andersen, G.A. Moreira, M.Pradella-Hallinan, L.M. Oyama, M.T. de Mello, Beneficial effects of a multifaceted1-year lifestyle intervention on metabolic abnormalities in obese adolescents withand without sleep-disordered breathing, Metab. Syndr. Relat. Disord. 13 (3) (Apr2015) 110–118, http://dx.doi.org/10.1089/met.2014.0110.
[3] N. Alexopoulos, D. Katritsis, P. Raggi, Visceral adipose tissue as a source of inflamma-tion and promoter of atherosclerosis, Atherosclerosis 233 (1) (Mar 2014) 104–112,http://dx.doi.org/10.1016/j.atherosclerosis.2013.12.023.
[4] L. Jamar, P. Pisani, L.M. Oyama, C. Belote, D.C.L. Masquio, V.A. Furuya, J.P. Carvalho-Ferreira, S.G. Andrade-Silva, A.R. Dâmaso, D.A. Caranti, Is the neck circumferencean emergent predictor for inflammatory status in obese adults? Int. J. Clin. Pract.67 (3) (Mar 2013) 217–224, http://dx.doi.org/10.1111/ijcp.12041.
[5] T. You, N.C. Arsenis, B.L. Disanzo, M.J. Lamonte, Effects of exercise training on chronicinflammation in obesity: current evidence and potential mechanisms, Sports Med.43 (4) (Apr 2013) 243–256, http://dx.doi.org/10.1007/s40279-013-0023-3.
[6] Jing-ya Zhou, Hui Ge, Ming-fan Zhu, Li-jun Wang, Li Chen, Yao-zong Tan, Yu-mingChen, Hui-lian Zhu, Neck circumference as an independent predictive contributorto cardio-metabolic syndrome, Cardiovasc. Diabetol. 16 (May 2013) 12–76, http://dx.doi.org/10.1186/1475-2840-12-76.
[7] R.B. Harris, Leptin: much more than a satiety signal, Annu. Rev. Nutr. 20 (2000 July)45–75, http://dx.doi.org/10.1146/annurev.nutr.20.1.45.
[8] V.Z. Rocha, E.J. Folco, Inflammatory concepts of obesity, Int. J. Inflamm. 2011 (May2011) 1–14, http://dx.doi.org/10.4061/2011/529061.
[9] J. Chudek, A. Wiecek, Adipose tissue, inflammation and endothelial dysfunction,Pharmacol. Rep. 58 (Suppl.) (2006) 81–810.
[10] A.R. Dâmaso, A. de Piano, R.M. Campos, F.C. Corgosinho, W. Siegfried, D.A. Caranti,D.C. Masquio, J. Carnier, P. Sanches de L, P. Leão da Silva, C.M. Nascimento, L.M.Oyama, A.D. Dantas, M.T. de Mello, S. Tufik, L. Tock, Multidisciplinary approach tothe treatment of obese adolescents: effects on cardiovascular risk factors, inflamma-tory profile, and neuroendocrine regulation of energy balance, Int. J. Endocrinol.2013 (2013) 541032, http://dx.doi.org/10.1155/2013/541032.
[11] A.R. Dâmaso, R.M. Campos, D.A. Caranti, A. de Piano, M. Fisberg, D. Foschini, P.D.Sanches, L. Tock, H.M. Lederman, S. Tufik, M.T. de Mello, Aerobic plus resistancetraining was more effective in improving the visceral adiposity, metabolic profileand inflammatory markers than aerobic training in obese adolescents, J. SportsSci. 32 (15) (2014) 1435–1445, http://dx.doi.org/10.1080/02640414.2014.900692.
[12] R.F. Jackson, F.A. Stern, R. Neira, C.L. Ortiz-Neira, J. Maloney, Application of low-levellaser therapy for noninvasive body contouring, Lasers Surg. Med. 44 (3) (2012 Mar)211–217, http://dx.doi.org/10.1002/lsm.22007.
[13] C. Ferraresi, O.T. de Brito, Z.L. de Oliveira, R.B. de Menezes Reiff, V. Baldissera, S.E. deAndrade Perez, E. Matheucci Junior, N.A. Parizotto, Effects of low level laser therapy(808 nm) on physical strength training in humans, Lasers Med. Sci. 26 (3) (2011May) 349–358, http://dx.doi.org/10.1007/s10103-010-0855-0.
109F.O. Duarte et al. / Journal of Photochemistry & Photobiology, B: Biology 153 (2015) 103–110
[14] F.R. Paolillo, J.C. Milan, I.V. Aniceto, S.G. Barreto, J.R. Rebelatto, A. Borghi-Silva, N.A.Parizotto, C. Kurachi, V.S. Bagnato, Effects of infrared-LED illumination applied dur-ing high intensity treadmill training in postmenopausal women, Photomed. LaserSurg. 29 (9) (2011 Sep) 639–645, http://dx.doi.org/10.1089/pho.2010.2961.
[15] T. Fujimura, A. Mitani, M. Fukuda, M. Mogi, K. Osawa, S. Takahashi, M. Aino, Y.Iwamura, S. Miyajima, H. Yamamoto, T. Noguchi, Irradiation with a low-leveldiode laser induces the developmental endothelial locus-1 gene and reduces proin-flammatory cytokines in epithelial cells, Lasers Med Sci. 29 (3) (May 2014)987–994, http://dx.doi.org/10.1007/s10103-013-1439-6.
[16] F.G. Basso, T.N. Pansani, D.G. Soares, D.L. Scheffel, V.S. Bagnato, C.A. Costa, J. Hebling,Biomodulation of inflammatory cytokines related to oral mucositis by low-levellaser therapy, Photochem. Photobiol. 4 (2015 Mar), http://dx.doi.org/10.1111/php.12445.
[17] A.E. Aquino Jr., M. Sene-Fiorese, F.R. Paolillo, F.O. Duarte, J.C. Oishi, A.A. Pena Jr., A.C.Duarte, M.R. Hamblin, V.S. Bagnato, N.A. Parizotto, Low-level laser therapy (LLLT)combined with swimming training improved the lipid profile in rats fed withhigh-fat diet, Lasers Med. Sci. 28 (5) (2013 Sep) 1271–1280, http://dx.doi.org/10.1007/s10103-012-1223-z.
[18] S.R. Preis, J.M. Massaro, U. Hoffmann, R.B. D'Agostino Sr., D. Levy, S.J. Robins, J.B.Meigs, R.S. Vasan, C.J. O'Donnell, C.S. Fox, Neck circumference as a novel measureof cardiometabolic risk: the Framingham Heart study, J. Clin. Endocrinol. Metab.95 (8) (2010 Aug) 3701–3710, http://dx.doi.org/10.1210/jc.2009-1779.
[19] C. Nishida, G.T. Ko, S. Kumanyika, Body fat distribution and noncommunicable dis-eases in populations: overview of the 2008 WHO Expert Consultation on Waist Cir-cumference andWaist–Hip Ratio, Eur. J. Clin. Nutr. 64 (1) (2010 Jan) 2–5, http://dx.doi.org/10.1038/ejcn.2009.139.
[20] B. Geloneze, E.M. Repetto, S.R. Geloneze, M.A. Tambascia, M.N. Ermetice, The thresh-old value for insulin resistance (HOMA-IR) in an admixture population IR in theBrazilian Metabolic Syndrome Study, Diabetes Res. Clin. Pract. 72 (2) (2006 May)219–220.
[21] L. Dossus, S. Becker, D. Achaintre, R. Kaaks, S. Rinaldi, Validity of multiplex-based as-says for cytokinemeasurements in serum and plasma from “non-diseased” subjects:comparison with ELISA, J. Immunol. Methods 350 (1–2) (2009 Oct 31) 125–132,http://dx.doi.org/10.1016/j.jim.2009.09.001.
[22] J.E. Donnelly, S.N. Blair, J.M. Jakicic, M.M. Manore, J.W. Rankin, B.K. Smith, AmericanCollege of Sports Medicine Position Stand. Appropriate physical activity interventionstrategies for weight loss and prevention of weight regain for adults, Med. Sci.Sports Exerc. 41 (2) (2009 Feb) 459–471, http://dx.doi.org/10.1249/MSS.0b013e3181949333.
[23] W.J. Kraemer, N.A. Ratamess, D.N. French, Resistance training for health and perfor-mance, Curr. Sports Med. Rep. 1 (3) (2002 Jun) 165–171.
[24] M. Sene-Fiorese, F.O. Duarte, A.E. de Aquino Junior, R.M. Campos, D.C. Masquio, L.Tock, A.C. Duarte, A.R. Dâmaso, N.A. Parizotto, V.S. Bagnato, The potential of photo-therapy to reduce body fat, insulin resistance and “metabolic inflexibility” related toobesity in women undergoing weight loss treatment, Lasers Surg. Med. 47 (6) (Jul2015), http://dx.doi.org/10.1002/lsm.22395.
[25] R.M. da Silveira Campos, A.R. Dâmaso, D.C. Masquio, A.E. Aquino Jr., M. Sene-Fiorese,F.O. Duarte, L. Tock, N.A. Parizotto, V.S. Bagnato, Low-level laser therapy (LLLT) asso-ciated with aerobic plus resistance training to improve inflammatory biomarkers inobese adults, Lasers Med. Sci. 30 (5) (2015 Jul) 1553–1563, http://dx.doi.org/10.1007/s10103-015-1759-9.
[26] K.H. Beckmann, G. Meyer-Hamme, S. Schröder, Low level laser therapy for the treat-ment of diabetic foot ulcers: a critical survey, Evid. Based Complement. Alternat.Med. 2014 (2014) 626127, http://dx.doi.org/10.1155/2014/626127.
[27] P. Avci, T.T. Nyame, G.K. Gupta, M. Sadasivam,M.R. Hamblin, Low-level laser therapyfor fat layer reduction: a comprehensive review, Lasers Surg. Med. 45 (6) (2013Aug) 349–357, http://dx.doi.org/10.1002/lsm.22153.
[28] F.R. Paolillo, A. Borghi-Silva, N.A. Parizotto, C. Kurachi, V.S. Bagnato, New treatmentof cellulite with infrared-LED illumination applied during high-intensity treadmilltraining, J. Cosmet. Laser Ther. 13 (4) (2011 Aug) 166–171, http://dx.doi.org/10.3109/14764172.2011.594065.
[29] L. Badimon, R. Hernández Vera, G. Vilahur, Atherothrombotic risk in obesity,Hamostaseologie 33 (4) (2013) 259–268, http://dx.doi.org/10.5482/HAMO-13-07-0034.
[30] B. Gustafson, A. Hammarstedt, C.X. Andersson, U. Smith, Inflamed adipose tissue: aculprit underlying the metabolic syndrome and atherosclerosis, Arterioscler.Thromb. Vasc. Biol. 27 (11) (2007 Nov) 2276–2283, http://dx.doi.org/10.1161/ATVBAHA.107.147835.
[31] S. De Ferranti, D. Mozaffarian, The perfect storm: obesity, adipocyte dysfunction, andmetabolic consequences, Clin. Chem. 54 (6) (2008 Jun) 945–955, http://dx.doi.org/10.1373/clinchem.2007.100156.
[32] K. Osawa, T. Miyoshi, Y. Koyama, S. Sato, N. Akagi, Y. Morimitsu, M. Kubo, H.Sugiyama, K. Nakamura, H. Morita, S. Kanazawa, H. Ito, Differential association of
visceral adipose tissue with coronary plaque characteristics in patients with andwithout diabetes mellitus, Cardiovasc. Diabetol. 14 (Mar 2014) 13–61, http://dx.doi.org/10.1186/1475-2840-13-61.
[33] L.M. Nguyen, A.G. Malamo, K.A. Larkin-Kaiser, P.A. Borsa, P.J. Adhihetty, Effect ofnear-infrared light exposure on mitochondrial signaling in C2C12 muscle cells, Mi-tochondrion 14 (1) (2014 Jan) 42–48, http://dx.doi.org/10.1016/j.mito.2013.11.001.
[34] C. Ferraresi, B. Kaippert, P. Avci, Y.Y. Huang, M.V. de Sousa, V.S. Bagnato, N.A.Parizotto, M.R. Hamblin, Low-level laser (light) therapy increases mitochondrialmembrane potential and ATP synthesis in C2C12 myotubes with a peak responseat 3–6 h, Photochem. Photobiol. 91 (2) (2015 Mar) 411–416, http://dx.doi.org/10.1111/php.12397.
[35] W.H. de Brito Vieira, R.M. Bezerra, R.A. Queiroz, N.F. Maciel, N.A. Parizotto, C.Ferraresi, Use of low-level laser therapy (808 nm) to muscle fatigue resistance: arandomized double-blind crossover trial, Photomed. Laser Surg. 32 (12) (2014Dec) 678–685, http://dx.doi.org/10.1089/pho.2014.3812.
[36] F.R. Paolillo, R. Arena, D.B. Dutra, R. de Cassia Marqueti Durigan, H.S. de Araujo, H.C.de Souza, N.A. Parizotto, G. Cipriano Jr., G. Chiappa, A. Borghi-Silva, Low-level lasertherapy associated with high intensity resistance training on cardiac autonomiccontrol of heart rate and skeletal muscle remodeling in wistar rats, Lasers Surg.Med. 46 (10) (2014 Dec) 796–803, http://dx.doi.org/10.1002/lsm.22298.
[37] Adriano Eduardo Lima-Silva, Fernando Adami, Fábio Yuzo Nakamura, FernandoRoberto de-Oliveira, Monique da Silva Gevaerd, Fat metabolism during exercise:mechanisms of regulation, Rev. Bras.Cineantropom. Desempenho Hum. 8 (4)(2006) 106–114 (ISSN 1980-0037. Article in Portuguese).
[38] C. Ferraresi, M.V. de Sousa, Y.Y. Huang, V.S. Bagnato, N.A. Parizotto, M.R. Hamblin,Time response of increases in ATP and muscle resistance to fatigue after low-levellaser (light) therapy (LLLT) in mice, Lasers Med. Sci. 30 (4) (2015 May)1259–1267, http://dx.doi.org/10.1007/s10103-015-1723-8.
[39] S.B. Chai, F. Sun, X.L. Nie, J. Wang, Leptin and coronary heart disease: a systematicreview and meta-analysis, Atherosclerosis 233 (1) (Mar 2014) 3–10, http://dx.doi.org/10.1016/j.atherosclerosis.2013.11.069.
[40] V.S. Hentschke, R.B. Jaenisch, L.A. Schmeing, P.R. Cavinato, L.L. Xavier, P. Dal Lago,Low-level laser therapy improves the inflammatory profile of rats with heart failure,Lasers Med Sci. 28 (3) (Lasers Med Sci. 2013 May) 1007–1016, http://dx.doi.org/10.1007/s10103-012-1190-4.
[41] A. Derkacz, M. Protasiewicz, R. Poręba, A. Doroszko, R. Andrzejak, Effect of the intra-vascular low energy laser illumination during percutaneous coronary interventionon the inflammatory process in vascular wall, Lasers Med. Sci. 28 (3) (2013 May)763–768, http://dx.doi.org/10.1007/s10103-012-1142-z.
[42] L.L. Ben-Noun, A. Laor, Relationship between changes in neck circumference andcardiovascular risk factors, Exp. Clin. Cardiol. 11 (1) (Spring 2006) 14–20.
[43] M. Sharda, P. Jain, A. Gupta, D. Nagar, A. Soni, Correlation and comparison of variousanthropometric measurements of body fat distribution and sagittal abdominal di-ameter as a screening tool for cardio metabolic risk factors and ischaemic heart dis-ease in elderly population, J. Assoc. Physicians India 63 (2015) 22–26.
[44] C. Stabe, A.C. Vasques, M.M. Lima, M.A. Tambascia, J.C. Pareja, A. Yamanaka, B.Geloneze, Neck circumference as a simple tool for identifying the metabolic syn-drome and insulin resistance: results from the Brazilian Metabolic SyndromeStudy, Clin. Endocrinol. (Oxf) 78 (6) (Jun 2013) 874–881, http://dx.doi.org/10.1111/j.1365-2265.2012.04487.x.
[45] C.J. Hsieh, P.W. Wang, T.Y. Chen, The relationship between regional abdominal fatdistribution and both insulin resistance and subclinical chronic inflammation innon-diabetic adults, Diabetol. Metab. Syndr. 6 (1) (Apr 1 2014) 49, http://dx.doi.org/10.1186/1758-5996-6-49.
[46] L.S. Rallidis, K. Baroutsi, M. Zolindaki, M. Karagianni, C. Varounis, N. Dagres, J. Lekakis,M. Anastasiou-Nana, Visceral adipose tissue is a better predictor of subclinical carotidatherosclerosis compared with waist circumference, Ultrasound Med. Biol. 40 (6)(Jun 2014) 1083–1088, http://dx.doi.org/10.1016/j.ultrasmedbio.2013.12.017.
[47] P.L. Sanches, M.T. deMello, N. Elias, F.A. Fonseca, R.M. Campos, J. Carnier, A. de Piano,D.C. Masquio, P.L. Silva, L.M. Oyama, F.C. Corgosinho, C.M. Nascimento, L. Tock, C.A.D'Elia, S. Tufik, A.R. Dâmaso, Hyperleptinemia: implications on the inflammatorystate and vascular protection in obese adolescents submitted to an interdisciplinarytherapy, Inflammation 37 (1) (Feb 2014) 35–43, http://dx.doi.org/10.1007/s10753-013-9709-9.
[48] T.Y. Fukuda, M.M. Tanji, S.R. Silva, M.N. Sato, H. Plapler, Infrared low-level diodelaser on inflammatory process modulation in mice: pro- and anti-inflammatory cy-tokines, Lasers Med. Sci. 28 (5) (Sep 2013) 1305–1313, http://dx.doi.org/10.1007/s10103-012-1231-z.
[49] E.G. Novoselova, O.V. Glushkova, D.A. Cherenkov, V.M. Chudnovsky, E.E. Fesenko, Ef-fects of low-power laser radiation on mice immunity, Photodermatol. Photoimmunol.Photomed. 22 (1) (Feb 2006) 33–38.
110 F.O. Duarte et al. / Journal of Photochemistry & Photobiology, B: Biology 153 (2015) 103–110
ORIGINAL ARTICLE
Comparative clinical study of light analgesic effecton temporomandibular disorder (TMD)using red and infrared led therapy
Vitor Hugo Panhoca & Rosane de Fatima Zanirato Lizarelli & Silvia Cristina Nunez &
Renata Campi de Andrade Pizzo & Clovis Grecco & Fernanda Rossi Paolillo &
Vanderlei Salvador Bagnato
Received: 30 April 2013 /Accepted: 16 September 2013 /Published online: 3 October 2013# Springer-Verlag London 2013
Abstract Low-level laser therapy (LLLT) has been widelyapplied in pain relief in several clinical situations, includingtemporomandibular disorders (TMD). However, the effects ofLED therapy on TMD has not been investigated. This studyaims to evaluate the effects of red and infrared LEDs on: (1)tissue temperature in ex vivo and (2) pain relief and mandib-ular range of motion in patients with TMD. Thirty patientsbetween 18 and 40 years old were included and randomlyassigned to three groups. The two experimental groups were:the red LED (630±10 nm) group and the infrared LED (850±
10 nm) group. The irradiation parameters were 150 mW,300 mW/cm2, 18 J/cm2, and 9 J/point. The positive controlgroup received an infrared laser (780 nm) with 70mW, 1.7W/cm2, 105 J/cm2, and 4.2 J/point. LED and laser therapies wereapplied bilaterally to the face for 60 s/point. Five points wereirradiated: three points around the temporomandibular joint(TMJ), one point for the temporalis, and one near the masseter.Eight sessions of phototherapy were performed, twice a weekfor 4 weeks. Pain induced by palpating the masseter muscleand mandibular range of motion (maximum oral aperture)weremeasured at baseline, immediately after treatment, 7 daysafter treatment, and 30 days after treatment. There was anincrease in tissue temperature during both the red and theinfrared LED irradiation in ex vivo. There was a significantreduction of pain and increase of the maximum oral aperturefor all groups (p ≥0.05). There was no significant difference inpain scores and maximum oral aperture between groups atbaseline or any periods after treatment (p ≥0.05). The currentstudy showed that red and infrared LED therapy can be usefulin improving outcomes related to pain relief and orofacialfunction for TMD patients. We conclude that LED devicesconstitute an attractive alternative for LLLT.
Keywords Laser therapy . LED therapy . TMD . Pain relief .
Oral aperture
Introduction
Temporomandibular disorder (TMD) is a common clinicalcomplaint among patients in dental practices. TMD occursas a result of malfunction in the jaw, jaw joint, and or sur-rounding facial muscles, and it is characterized by pain anddiscomfort in facial muscles mostly, when chewing or during
V. H. Panhoca (*) :C. Grecco : F. R. Paolillo :V. S. BagnatoOptics Group from Physics Institute of São Carlos (IFSC), Universityof São Paulo (USP), Brazil. Av. Trabalhador Sancarlense,400-Centro, 13560-970 São Carlos, SP, Brazile-mail: [email protected]
C. Greccoe-mail: [email protected]
F. R. Paolilloe-mail: [email protected]
V. S. Bagnatoe-mail: [email protected]
R. de Fatima Zanirato Lizarelli : R. C. d. A. PizzoNILO-Nucleo Integrado de Laser em Odontologia, Rua Orlandia,1156, Jardim Paulista Ribeirão Preto, SP 14090-240, Brazil
R. de Fatima Zanirato Lizarellie-mail: [email protected]
R. C. d. A. Pizzoe-mail: [email protected]
S. C. NunezDepartment of Integrated Teaching and Research INPES/CETAO,Av. Indianápolis, 153-Moema, 04063-000 São Paulo, Brazile-mail: [email protected]
Lasers Med Sci (2015) 30:815–822DOI 10.1007/s10103-013-1444-9
jaw movement. TMDs fall into three main categories: (1)myofascial pain, is the most common form of TMD, whichis characterized by discomfort or pain in the masticatorymuscles and sometimes in the neck and shoulder muscles;(2) internal derangement of the joint associated with adislocated jaw or displaced disc and an injury to the condyle;and (3) degenerative joint disease, including osteoarthritis orrheumatoid arthritis in the jaw joint [1, 2].
Managing TMD is a challenge for dental practitioners;often analgesics are prescribed to ameliorate acute pain, butthe long-term treatment is difficult to project [3]. TMD alsohas a psychological component. Therefore, the guidelines forTMD treatment recommend noninvasive approaches to man-aging this condition. Low-level laser therapy (LLLT) is con-sidered a viable noninvasive and nonpharmacologicalalternative.
LLLT has been reported as an analgesia for several differ-ent painful conditions, such as cervical dentin hypersensitiv-ity, trigeminal neuralgia, headaches, and especially TMD.Previous studies have shown the beneficial effects of red[4–6] and infrared [7–11] lasers in TMD management. Ther-apeutic “optical window” corresponds to red and near-infraredwavelengths, where the effective tissue penetration of light ismaximal [12]. For this reason, red and infrared wavelengthsare used to relieve both acute and chronic pain and inflamma-tion [13, 14].
The analgesic mechanisms of light is not clearly under-stood although several have been proposed, including the gatecontrol theory, modulation of endogenous opioids production,anti-inflammatory effects, direct inhibition of neural activityand slowed conduction velocity in peripheral nerves [15].However, several factors may influence an analgesic response:patient diagnoses, symptoms, pain duration, laser irradiationlocation, distance from laser probe to skin, laser type, wave-length, laser mode (continuous or pulsed), average power,power density, energy, fluence, number of sessions, laserirradiation point size, and co-interventions (e.g., exercises,dry needling, and drugs) [14].
Regarding output power, clinical studies use red laser withan average power of 15 [5] or 30 mW [6] as well as infraredlaser with an average power of 17 [16], 40 [9], 50 [10, 17], 70[18], or 100 mW [13] for reduced pain and increased orofacialfunction for TMDmanagement. Moreover, infrared laser withhigher power, for example, 400 mW [11, 19, 20] has also beenused to relieve pain and improve mobility of the joint forTMD treatment. However, it is a well-known fact that increas-ing laser power and exposure time may lead to higher localtemperature and risk of tissue damage [21, 22].
In contemporary research, the use of LEDs for therapeutictreatment is growing. Studies have shown that lasers andLEDs operating at similar parameters produce equivalenteffects [23–26]. A review of the literature shows the effective-ness of LEDs in dentistry [26], dermatology and aesthetic
medicine [24, 27–29], sport medicine [30, 31], and especiallyfor pain relief [32].
However, to our knowledge, no previous studies haveassessed the effects of LED therapy on TMD management.Therefore, this study aims to evaluate the effects of red andinfrared LEDs on: (1) tissue temperature in ex vivo humanhemi-head and (2) pain relief and mandibular range of motionin patients with TMD. Our hypothesis was that the use ofLEDs may present a new approach for therapeutic treatmentof TMD, when compared with LLLT.
Materials and methods
This study is part of a larger project that aims to develop clinicalprotocols LED systems for therapy. All procedures were ap-proved by the Ethics Committee of the Federal University ofSão Carlos, São Carlos, Brazil (approval no. 23112.004838/2010-28). All subjects provided written informed consent andagreed to participate in the study. The study was registered withNIH ClinicalTrials (NCT01873937).
Devices used in this study
To perform LED irradiation, a prototype device (Fisioled,MM Optics Ltda, São Carlos, São Paulo, Brazil) was devel-oped specifically for this project. The device includes twohandpieces with polished acrylic tips. Each handpiece in-cludes one red (630±10 nm) or one infrared (850±10 nm)LED with a fixed output power of 150 mW and illuminationarea of 0.5 cm2.
For this clinical trial, the positive control group was treated,as suggested by the ethical committee. A 780-nm laser (TwinLaser, MM Optics Ltda, São Carlos, São Paulo, Brazil) wasused, because infrared lasers are a well-accepted and efficienttherapy for pain relief [33]. This wavelength is commonlyused for TMD treatment [7–11]. This device has adjustableoutput power ranging from 5 to 70 mW and a spot area of0.04 cm2.
A FieldMaster TO-II optical power meter (Coherent Inc.,Santa Clara, CA, USA) linked to a photodetector was used tocalibrate these systems.
Thermal mapping
Thermal mapping during LED irradiation was performed onan ex vivo human hemi-head (Fig. 1a) provided by the labo-ratory of anatomy at the University of São Paulo’s (RibeirãoPreto, SP, Brazil campus) dental school.
Subcutaneous temperature measurements were performedin the anatomical specimen. A high-precision digital ther-mometer (MT 600, Minipa, São Paulo, Brazil) coupled witha computer program that captured the electrical signals, was
816 Lasers Med Sci (2015) 30:815–822
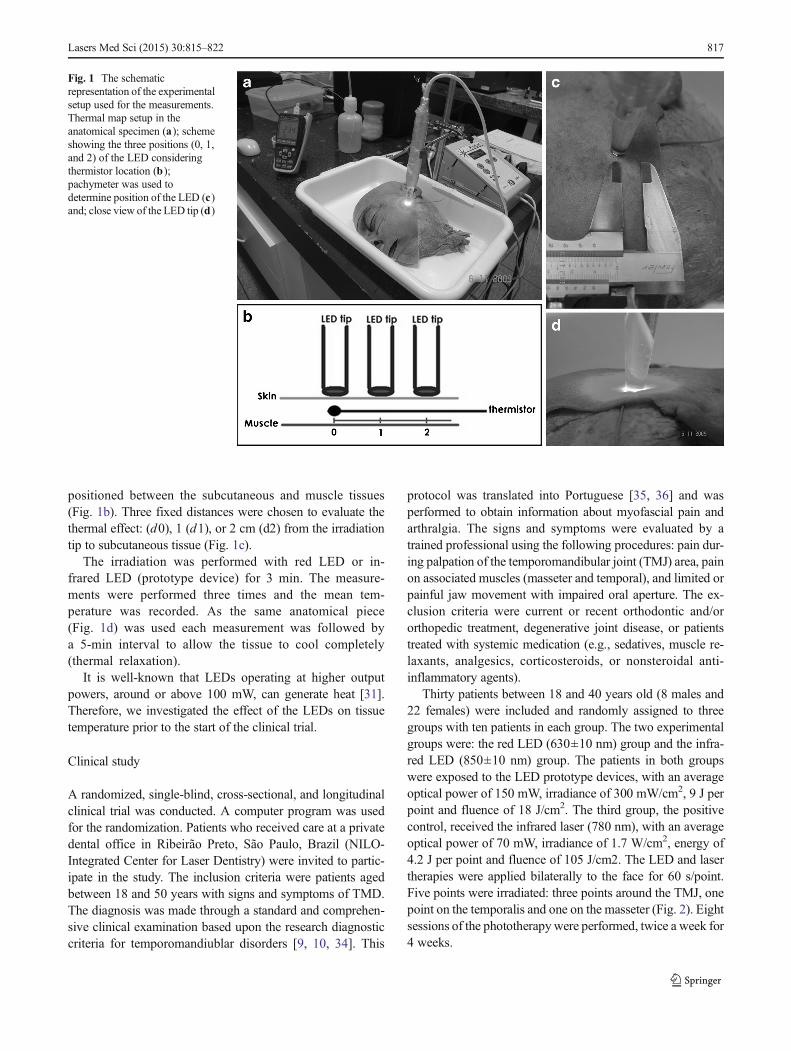
positioned between the subcutaneous and muscle tissues(Fig. 1b). Three fixed distances were chosen to evaluate thethermal effect: (d0), 1 (d1), or 2 cm (d2) from the irradiationtip to subcutaneous tissue (Fig. 1c).
The irradiation was performed with red LED or in-frared LED (prototype device) for 3 min. The measure-ments were performed three times and the mean tem-perature was recorded. As the same anatomical piece(Fig. 1d) was used each measurement was followed bya 5-min interval to allow the tissue to cool completely(thermal relaxation).
It is well-known that LEDs operating at higher outputpowers, around or above 100 mW, can generate heat [31].Therefore, we investigated the effect of the LEDs on tissuetemperature prior to the start of the clinical trial.
Clinical study
A randomized, single-blind, cross-sectional, and longitudinalclinical trial was conducted. A computer program was usedfor the randomization. Patients who received care at a privatedental office in Ribeirão Preto, São Paulo, Brazil (NILO-Integrated Center for Laser Dentistry) were invited to partic-ipate in the study. The inclusion criteria were patients agedbetween 18 and 50 years with signs and symptoms of TMD.The diagnosis was made through a standard and comprehen-sive clinical examination based upon the research diagnosticcriteria for temporomandiublar disorders [9, 10, 34]. This
protocol was translated into Portuguese [35, 36] and wasperformed to obtain information about myofascial pain andarthralgia. The signs and symptoms were evaluated by atrained professional using the following procedures: pain dur-ing palpation of the temporomandibular joint (TMJ) area, painon associated muscles (masseter and temporal), and limited orpainful jaw movement with impaired oral aperture. The ex-clusion criteria were current or recent orthodontic and/ororthopedic treatment, degenerative joint disease, or patientstreated with systemic medication (e.g., sedatives, muscle re-laxants, analgesics, corticosteroids, or nonsteroidal anti-inflammatory agents).
Thirty patients between 18 and 40 years old (8 males and22 females) were included and randomly assigned to threegroups with ten patients in each group. The two experimentalgroups were: the red LED (630±10 nm) group and the infra-red LED (850±10 nm) group. The patients in both groupswere exposed to the LED prototype devices, with an averageoptical power of 150 mW, irradiance of 300 mW/cm2, 9 J perpoint and fluence of 18 J/cm2. The third group, the positivecontrol, received the infrared laser (780 nm), with an averageoptical power of 70 mW, irradiance of 1.7 W/cm2, energy of4.2 J per point and fluence of 105 J/cm2. The LED and lasertherapies were applied bilaterally to the face for 60 s/point.Five points were irradiated: three points around the TMJ, onepoint on the temporalis and one on the masseter (Fig. 2). Eightsessions of the phototherapywere performed, twice a week for4 weeks.
Fig. 1 The schematicrepresentation of the experimentalsetup used for the measurements.Thermal map setup in theanatomical specimen (a); schemeshowing the three positions (0, 1,and 2) of the LED consideringthermistor location (b);pachymeter was used todetermine position of the LED (c)and; close view of the LED tip (d)
Lasers Med Sci (2015) 30:815–822 817
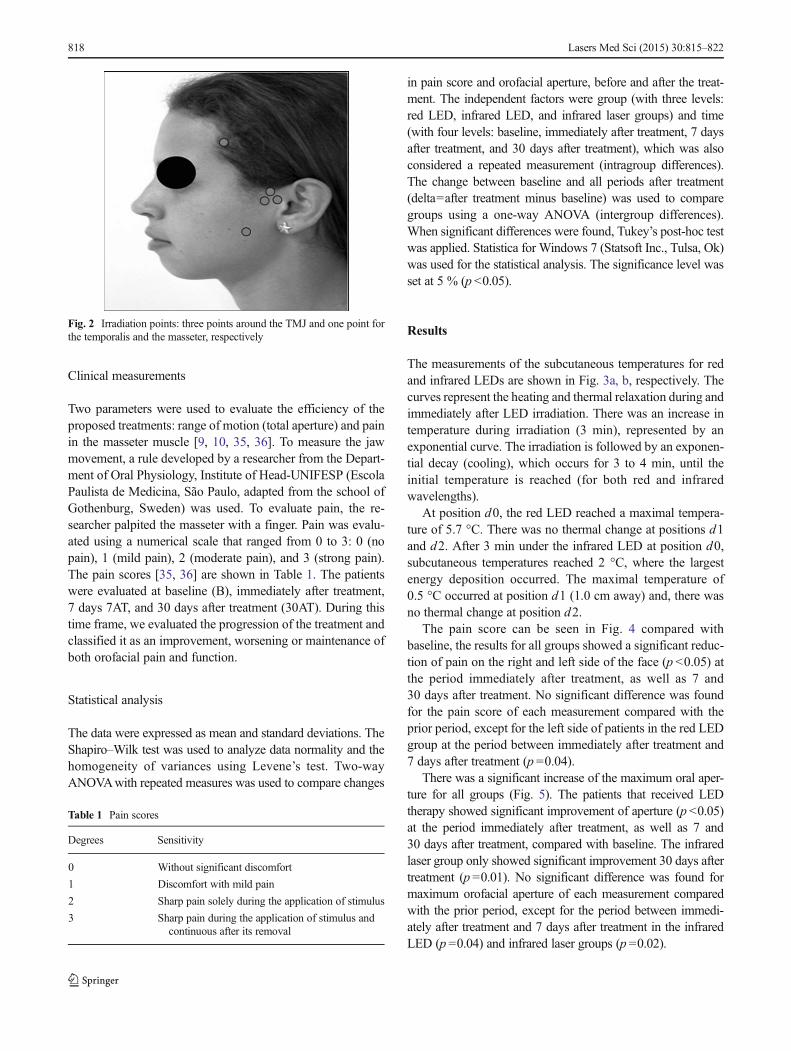
Clinical measurements
Two parameters were used to evaluate the efficiency of theproposed treatments: range of motion (total aperture) and painin the masseter muscle [9, 10, 35, 36]. To measure the jawmovement, a rule developed by a researcher from the Depart-ment of Oral Physiology, Institute of Head-UNIFESP (EscolaPaulista de Medicina, São Paulo, adapted from the school ofGothenburg, Sweden) was used. To evaluate pain, the re-searcher palpited the masseter with a finger. Pain was evalu-ated using a numerical scale that ranged from 0 to 3: 0 (nopain), 1 (mild pain), 2 (moderate pain), and 3 (strong pain).The pain scores [35, 36] are shown in Table 1. The patientswere evaluated at baseline (B), immediately after treatment,7 days 7AT, and 30 days after treatment (30AT). During thistime frame, we evaluated the progression of the treatment andclassified it as an improvement, worsening or maintenance ofboth orofacial pain and function.
Statistical analysis
The data were expressed as mean and standard deviations. TheShapiro–Wilk test was used to analyze data normality and thehomogeneity of variances using Levene’s test. Two-wayANOVAwith repeated measures was used to compare changes
in pain score and orofacial aperture, before and after the treat-ment. The independent factors were group (with three levels:red LED, infrared LED, and infrared laser groups) and time(with four levels: baseline, immediately after treatment, 7 daysafter treatment, and 30 days after treatment), which was alsoconsidered a repeated measurement (intragroup differences).The change between baseline and all periods after treatment(delta=after treatment minus baseline) was used to comparegroups using a one-way ANOVA (intergroup differences).When significant differences were found, Tukey’s post-hoc testwas applied. Statistica for Windows 7 (Statsoft Inc., Tulsa, Ok)was used for the statistical analysis. The significance level wasset at 5 % (p <0.05).
Results
The measurements of the subcutaneous temperatures for redand infrared LEDs are shown in Fig. 3a, b, respectively. Thecurves represent the heating and thermal relaxation during andimmediately after LED irradiation. There was an increase intemperature during irradiation (3 min), represented by anexponential curve. The irradiation is followed by an exponen-tial decay (cooling), which occurs for 3 to 4 min, until theinitial temperature is reached (for both red and infraredwavelengths).
At position d0, the red LED reached a maximal tempera-ture of 5.7 °C. There was no thermal change at positions d1and d2. After 3 min under the infrared LED at position d0,subcutaneous temperatures reached 2 °C, where the largestenergy deposition occurred. The maximal temperature of0.5 °C occurred at position d1 (1.0 cm away) and, there wasno thermal change at position d2.
The pain score can be seen in Fig. 4 compared withbaseline, the results for all groups showed a significant reduc-tion of pain on the right and left side of the face (p <0.05) atthe period immediately after treatment, as well as 7 and30 days after treatment. No significant difference was foundfor the pain score of each measurement compared with theprior period, except for the left side of patients in the red LEDgroup at the period between immediately after treatment and7 days after treatment (p =0.04).
There was a significant increase of the maximum oral aper-ture for all groups (Fig. 5). The patients that received LEDtherapy showed significant improvement of aperture (p <0.05)at the period immediately after treatment, as well as 7 and30 days after treatment, compared with baseline. The infraredlaser group only showed significant improvement 30 days aftertreatment (p =0.01). No significant difference was found formaximum orofacial aperture of each measurement comparedwith the prior period, except for the period between immedi-ately after treatment and 7 days after treatment in the infraredLED (p =0.04) and infrared laser groups (p =0.02).
Fig. 2 Irradiation points: three points around the TMJ and one point forthe temporalis and the masseter, respectively
Table 1 Pain scores
Degrees Sensitivity
0 Without significant discomfort
1 Discomfort with mild pain
2 Sharp pain solely during the application of stimulus
3 Sharp pain during the application of stimulus andcontinuous after its removal
818 Lasers Med Sci (2015) 30:815–822
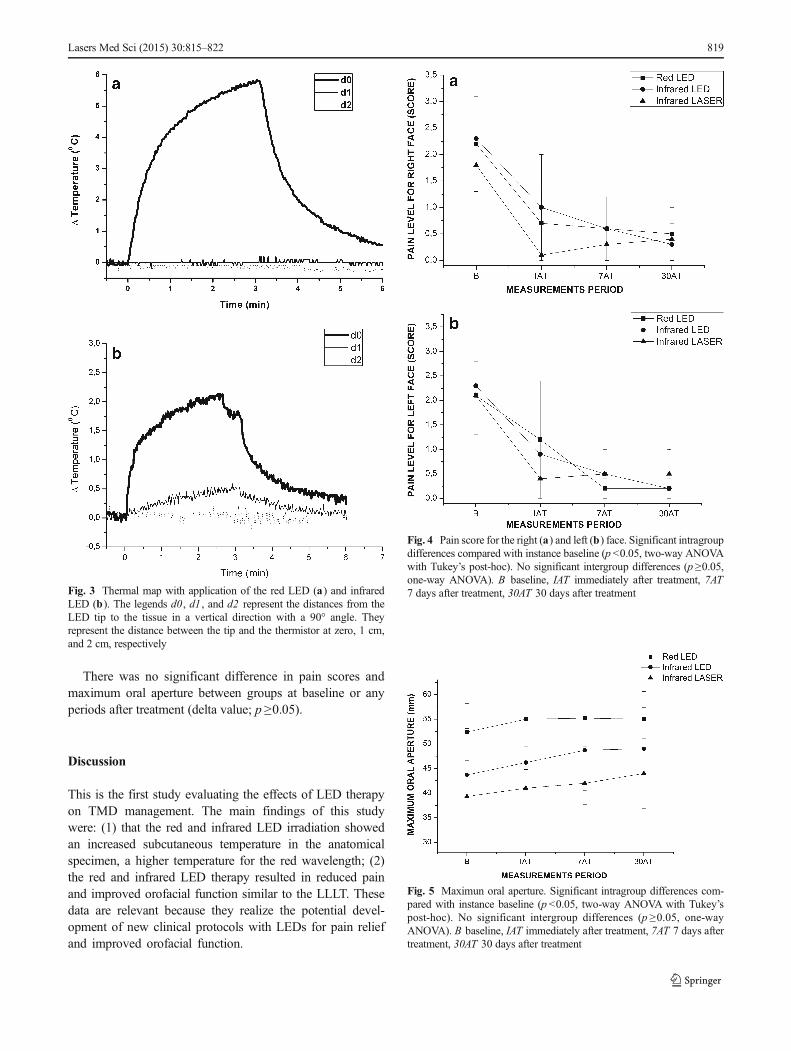
There was no significant difference in pain scores andmaximum oral aperture between groups at baseline or anyperiods after treatment (delta value; p ≥0.05).
Discussion
This is the first study evaluating the effects of LED therapyon TMD management. The main findings of this studywere: (1) that the red and infrared LED irradiation showedan increased subcutaneous temperature in the anatomicalspecimen, a higher temperature for the red wavelength; (2)the red and infrared LED therapy resulted in reduced painand improved orofacial function similar to the LLLT. Thesedata are relevant because they realize the potential devel-opment of new clinical protocols with LEDs for pain reliefand improved orofacial function.
Fig. 4 Pain score for the right (a) and left (b) face. Significant intragroupdifferences compared with instance baseline (p <0.05, two-way ANOVAwith Tukey’s post-hoc). No significant intergroup differences (p ≥0.05,one-way ANOVA). B baseline, IAT immediately after treatment, 7AT7 days after treatment, 30AT 30 days after treatment
Fig. 5 Maximun oral aperture. Significant intragroup differences com-pared with instance baseline (p <0.05, two-way ANOVA with Tukey’spost-hoc). No significant intergroup differences (p ≥0.05, one-wayANOVA). B baseline, IAT immediately after treatment, 7AT 7 days aftertreatment, 30AT 30 days after treatment
Fig. 3 Thermal map with application of the red LED (a) and infraredLED (b). The legends d0, d1 , and d2 represent the distances from theLED tip to the tissue in a vertical direction with a 90° angle. Theyrepresent the distance between the tip and the thermistor at zero, 1 cm,and 2 cm, respectively
Lasers Med Sci (2015) 30:815–822 819
Although the current study applied LED therapy for TMDtreatment, LEDs with higher output power reaching 3W havebeen used for other purposes in dental patients without sideeffects, such as photo activation of dental bleaching gel [37]and curing of composite resins [38].
According to thermal map, LEDs with higher power in-creased tissue temperature; however, the red radiation producedhigher temperatures compared with infrared radiation. In thiscontext, red wavelengths are more absorbed by tissue surfacecomponents than infrared wavelengths. The absorbed energycan be dissipated in the form of heat around the skin surface.Conversely, the infrared wavelengths can penetrate deeply intothe body tissues which has lower scattering and absorptionproperties [39]. Remarkably, the heat remains localized. Thisfinding is very interesting and presents an appealing clinicalapproach application geometry. Considering the clinical effec-tiveness, it would suggest performing punctual irradiation onthe target area, especially when dealing with a large area (largerthan the beam diameter); the points must be equidistant for redLED, at amaximum of 1.0 cm, to ensure the uniform irradiationof the entire region. It is important to emphasize that weanalyzed ex vivo specimen prior to clinical trials and livingtissues is highly complex and has optical properties defined byvarying rates of absorption, scattering, transmission, and reflec-tion. Moreover, patients have the ability to thermoregulate and,therefore, the parameters of LED therapy used in the currentstudy were safe during TMD treatment.
Clinical trials have been performed to investigate the TMJarea temperature when applying a CO2 laser (1.0 W) posi-tioned 10 cm above the skin [40, 41]. This laser caused asignificant increase in facial temperature because it improvedthe microcirculation via the vasodilator reflex [40]. Moreover,after the TMJ area was exposed to phototherapy, there was asignificant increase in the diameter and blood flow volume ofsuperficial temporal artery, compared with the baseline [41].
Thermal effects can explain the reduced pain and theincreased functionality, because phototherapy can lead tolymphatic drainage, improve oxygen supply and transport,and utilization of metabolic substrates [31].
Several studies [42–44] have shown that temperaturechanges induced by phototherapy can be associated withalteration in nerve conduction velocities which result inanalgesic effects [15]. Regarding nerve conduction, in astudy of Vinck et al. [32], infrared LED therapy, with anaverage power of 160 mW, was performed on healthy sub-jects and showed an immediate and localized effect on theconduction characteristics of nerves, with a reduced numberof impulses per unit of time for pain relief [32]. In thecurrent study, we used similar average power as Vincket al. [32] (150×160 mW), but the device’s geometry (probearea of 0.5×18 cm2) is different and, consequently, thefluences are different as well. For the same reason, the LEDsand laser parameters used in our study are different.
Concerning fluence parameters, we chose the applied dosebased on typical doses used in regular practice (around 100 J/cm2 seemed reasonable). Pöntinen [45] showed that a fluenceof 4 J/cm2 at skin level will maintain an irradiance at depths inthe range of 0.5–2.5 cm. When irradiating joints or muscles, afluence of 100–300 J/cm2 was attenuated to 2 J/cm2 andirradiance can be maintained at certain depths [31, 45].
One of the limitations of the current study is the differencebetween laser and LED parameters. LED and laser prototypedevices with the same geometry and parameters should bedeveloped for future studies. However, our study showedsimilar effects for LED and laser therapies on TMDmanagement.
LEDs are not monochromatic, nor coherent, and cover amuch broader range of wavelengths. Whereas lasers aremonochromatic, coherent, and preserve collimation duringpropagation. Additionally, coherence is not lost in lasers uponentering tissue, but the length of coherence is reduced and splitup into small speckles throughout the irradiated volume [46].However, our study showed that the coherence property oflight was not exclusively responsible for cellular response andthe outcomes of phototherapy. Therefore, LED devices con-stitute an attractive alternative for phototherapy. In this con-text, LEDs have a comparably low operational cost, allowirradiation of larger areas, and can be configured to producemultiple wavelengths with an absorption of photons by sev-eral chromophores [29, 30].
Concerning different wavelengths, red and infrared radia-tion can act on different sites of the tissue. For example, redlight acts on mitochondria, whereas infrared acts on bothmitochondria and cellular membrane [47]. The combinedeffects of both wavelengths can be advantageous for tissuebiostimulation or biomodulation. Future studies should beperformed combining red and infrared radiation for TMDtreatment.
Only one clinical trial [48] has investigated the immediateeffects of red LED therapy (640±10 nm) on masseter musclesof subjects with healthy TMJ. However, long-term effectswere not investigated and subjects with TMD were excludedfrom the study. In this study, compared with the results in aplacebo group, the subjects who received LED therapyshowed increased muscle activity and fatigue resistance.
Future studies investigating the effects of different param-eters of irradiation on pain relief and improvement of orofacialfunction should be performed.
Conclusions
The current study showed that red and infrared LED therapycan be useful in improving outcomes related to pain relief andmandibular range of motion for TMD patients. In addition,LED and laser therapy showed similar results. In this context,
820 Lasers Med Sci (2015) 30:815–822
LEDs can be considered as an attractive alternative to the useof LLLT.
Acknowledgments We would like to thank the National Council forScientific and Technological Development (CNPq)—grant no. 552720/2009-7 and the São Paulo Research Foundation (FAPESP)—grant no.2013/07276-1 for financial support.
References
1. Fricton JR (2004) Temporomandibular muscle and joint disorders.Pain 109:530
2. Núñez SC, Garcez AS, Suzuki SS, Ribeiro MS (2006) Managementof mouth opening in patients with temporomandibular disordersthrough low-level laser therapy and transcutaneous electrical neuralstimulation. Photomed Laser Surg 24:45–49
3. Weinberg LA (1980) The etiology, diagnosis, and treatment of TMJdysfunction-pain syndrome. Part II: differential diagnosis. J ProsthetDent 43:58–70
4. Ibuldu E, Cakmak A, Disci R, Aydin R (2004) Comparison of laser,dry needling and placebo laser treatments in myofascial syndrome.Photomed Laser Surg 22:306–311
5. De Medeiros JS, Vieira GF, Nishimura PY (2005) Laser applicationeffects on the bite strength of the masseter muscle, as an orofacialpain treatment. Photomed Laser Surg 23:373–376
6. Emshoff R, Bösch R, Pümpel E, Schöning H, Strobl H (2008) Low-level laser therapy for treatment of temporomandibular joint pain: adouble-blind and placebo-controlled trial. Oral Surg Oral Med OralPathol Oral Radiol Endod 105:452–456
7. Conti PCR (1997) Low level laser therapy in the treatment of tem-poromandibular disorders (TMD): a double blind pilot study. JCraniomandib Pract 15:144–149
8. Gur A, Sarac AJ, Cevik R, Altindag O, Sarac S (2004) Efficacy of904 nm gallium arsenide low level laser therapy in the managementof chronic myofascial pain in the neck: a double-blind and random-ized trial. Lasers Surg Med 35:229–235
9. Salmos-Brito JA, de Menezes RF, Teixeira CE, Gonzaga RK,Rodrigues BH, Braz R, Bessa-Nogueira RV, Gerbi ME (2013)Evaluation of low-level laser therapy in patients with acute andchronic temporomandibular disorders. Lasers Med Sci 28:57–64
10. Ahrari F, Madani AS, Ghafouri ZS, Tunér J (2013) The efficacy oflow-level laser therapy for the treatment of myogenous temporoman-dibular joint disorder. Lasers Med Sci (in press)
11. Gökçen-Röhlig B, Kipirdi S, Baca E, Keskin H, Sato S (2012)Evaluation of orofacial function in temporomandibular disorder pa-tients after low-level laser therapy. Acta Odontol Scand 4:1–6
12. Huang YY, Chen ACH, Carroll JD, Hamblin MR (2009) Biphasicdose response in low level light therapy. Dose Response 7:358–383
13. de Moraes Maia ML, Ribeiro MA, Maia LG, Stuginski-Barbosa J,Costa YM, Porporatti AL, Conti PC, Bonjardim LR (2013).Evaluation of low-level laser therapy effectiveness on the pain andmasticatory performance of patients with myofascial pain. LasersMed Sci (in press)
14. Jang H, Lee H (2012) Meta-analysis of pain relief effects by laserirradiation on joint areas. Photomed Laser Surg 30(8):405–417
15. Chow R et al (2011) Inhibitory effects of laser irradiation on periph-eral mammalian nerves and relevance to analgesic effects: a system-atic review. Photomed Laser Surg 29:365–381
16. Kulekcioglu S, Sivrioglu K, Ozcan O, ParlakM (2003) Effectivenessof low–level laser therapy in temporomandibular disorder. Scand JRheumatol 32:114–118.
17. Ferreira L A, de Oliveira R G, Guimarães J P, Carvalho A C P, DePaula, M V Q (2013). Laser acupuncture in patients with temporo-mandibular dysfunction: a randomized controlled trial. Lasers MedSci (in press)
18. Hotta PT, Hotta TH, Bataglion C, Bataglion SA, de Souza CoronattoEA, Siéssere S, Regalo SCH (2010) Emg analysis after laser acu-puncture in patients with temporomandibular dysfunction (TMD).Implications for practice. Complement Ther Clin Pract 16(3):158–160
19. Fikackova H, Dostalova T, Navratil L, Klaschka J (2007)Effectiveness of low-level laser therapy in temporomandbular jointdisorders: a placebo-controlled study. Photomed Laser Surg 25:297–303
20. Oz S, Gokçen-Rohlig B, Saruhanoglu A, Tuncer EB (2010)Management of myofacial pain: low-level laser therapy versus oc-clusal splints. J Craniofac Surg 21:1722–1728
21. Walsh LJ (1997) The current status of low level laser therapy indentistry, part 1, soft tissue applications. Aust Dent J 42(4):247–254
22. Stadler I, Lanzafame RJ, Oskoui P, Zhang RY, Coleman J, WhittakerM (2004) Alteration of skin temperature during low-level laser irra-diation at 830 nm in a mouse model. Photomed Laser Sur 22(3):227–231
23. Sopena EP, Serra MC, Sopena M, Lopez-Silva SM (1996) Cubanexperience for therapy in dentistry with light-emitting diodes. ProcSPIE 2630:147–154
24. Corazza AV, Jorge J, Kurachi C, Bagnato VS (2007)Photobiomodulation on the angiogenesis of skin wounds in ratsusing different light sources. Photomed Laser Surg 25:102–106
25. Bastos JLN, Lizarelli RFZ, Parizotto NA (2009) Comparative studyof laser and LED systems of low intensity applied to tendon healing.Laser Physics 19(9):1925–1931
26. Lizarelli RFZ, Miguel FAC, Freitas–Pontes KM, Villa GEP, NunezSC, Bagnato VS (2010) Dentin hypersensitivity clinical study com-paring LILT and LEDT keeping the same irradiation parameters.Laser Physics Letters 7(11):805–811
27. Barolet D (2008) Light-emitting diodes (LEDs) in dermatology.Semin Cutan Med Surg 27(4):227–238
28. Paolillo FR, Borghi-Silva A, Parizotto NA, Kurachi C, Bagnato VS(2011) New treatment of cellulite with infrared-LED illuminationapplied during high-intensity treadmill training. J Cosmet LaserTher 13(4):166–171
29. Paolillo FR,Milan JC, Aniceto IV, Barreto SG, Rebelatto JR, Borghi-Silva A, Bagnato VS (2011) Effects of infrared-LED illuminationapplied during high-intensity treadmill training in postmenopausalwomen. Photomed Laser Surg 29(9):639–645
30. Paolillo FR, Corazza AV, Borghi-Silva A, Parizotto NA, Kurachi C,Bagnato VS (2013) Infrared LED irradiation applied during high-intensity treadmill training improves maximal exercise tolerance inpostmenopausal women: a 6-month longitudinal study. Lasers MedSci 28:415–422
31. Paolillo FR, Lins EC, Corazza AV, Kurachi C, Bagnato VS (2013)Thermography applied during exercises with or without infraredlight-emitting diode irradiation: individual and comparative analysis.Photomed Laser Surg 31(7):349–355
32. Vinck E, Coorevits P, Cagnie B, De Muynck M, Vanderstraeten G,Cambier D (2005) Evidence of changes in sural nerve conductionmediated by light emitting diode irradiation. Lasers Med Sci 20:35–40
33. Petrucci A, Sgolastra F, Gatto R, Mattei A, Monaco A (2011)Effectiveness of low-level laser therapy in temporomandibular dis-orders: a systematic review and meta-analysis. J Orofac Pain 25(4):298
34. Dworkin SF, LeResche L (1992) Research diagnostic criteria fortemporomandibular disorders: review, criteria, examinations andspecifications, critique. J Craniomandib Disord 6(4):301–355
35. Pereira FJ Jr, Huggins KH, Dworkin SF et al (2004) Critérios dediagnóstico para pesquisa das desordens temporomandibulares RDC/
Lasers Med Sci (2015) 30:815–822 821
TMD. Tradução oficial para a língua portuguesa. J Bras Clin OdontolInt 8:384–395
36. KomisnkyM, Lucena LBS, Siqueira JTTet al (2004)Adaptação culturaldo questionário "Research diagnostic criteria for temporomandibulardisorders" axis II para o português. Jl Bras Clin Odontol Int 4(1):51–61
37. Florez FLE, Andrade MF, Campos EA, Oliveira Júnior OB, BagnatoVS, Panhoca VH (2011) In-office dental bleaching efficacy assess-ment in function of the light exposure regime by digital colorimetricreflectance spectroscopy. J Dent Oral Hyg 3(8):99–105
38. Leonard DL, Charlton DG, Roberts HW, Cohen ME (2002)Polymerization efficiency of LED curing lights. J Esthet RestorDent 14(5):286–295
39. Svanberg S (2002) Tissue diagnostics using lasers. In: Waynant RW(ed) Lasers in medicine. CRC Press, Boca Raton, FL, pp 135–169
40. Makihara E, Makihara M, Masumi SI, Sakamoto E (2005)Evaluation of facial thermographic changes before and after low-level laser irradiation. Photomed Laser Ther 23(2):191–195
41. Makihara E, Masumi SI (2008) Blood flow changes of a superficialtemporal artery before and after low-level laser irradiation applied to thetemporomandibular joint area. J Jpn Prosthodont Soc 52(2):167–170
42. Lowe AS, Baxter GD, Walsh DM, Allen JM (1994) Effect of lowintensity laser (830 nm) irradiation on skin temperature and antidrom-ic conduction latencies in the human median nerve: relevance ofradiant exposure. Lasers Surg Med 14(1):40–46
43. Lowe AS, Baxter GD,Walsh DM, Allen JM (1995) The relevance ofpulse repetition rate and radiant exposure to the neurophysiologicaleffects of low-intensity laser (820 nm/pulsed wave) irradiation uponskin temperature and antidromic conduction latencies in the humanmedian nerve. Laser Med Sci 10(4):253–259
44. Noble JG, Lowe AS, Baxter GD (2001) Monochromatic infraredirradiation (890 nm): effect of a multisource array upon conduction inthe human median nerve. J Clin Laser Med Surg 19(6):291–295
45. Pöntinen PJ (2000) Laseracupuncture. In: Simunovic Z (ed) Lasers inmedicine and dentistry: basic and up-to-date clinical application oflow-energy-level laser therapy (LLLT). Vitgraf, Rijeka, Croatia, pp55–475
46. Hode T, Jenkins P, Jordison S, Hode L. (2011). To what extent iscoherence lost in tissue? SPIE BiOS-International Society for Opticsand Photonics, Bellingham, WA, pp. 788703–788703
47. Eells JT, Wong-Riley MT, VerHoeve J, Henry M, Buchman EV,Kane MP, Gould LJ, Das R, Jett M, Hodgson BD, Margolis D,Whelan HT (2004) Mitochondrial signal transduction in acceleratedwound and retinal healing by near-infrared light therapy.Mitochondrion 4(5):559–567
48. Kelencz CA, Muñoz IS, Amorim CF, Nicolau RA (2010) Effectof low-power gallium-aluminum-arsenium noncoherent light(640 nm) on muscle activity: a clinical study. Photomed LaserSurg 28(5):647–652
822 Lasers Med Sci (2015) 30:815–822
cepof.ifsc.usp.br
Grupo de Óptica / CePOF, Instituto de Física de São Carlos, Universidade de São Paulo Av. Trabalhador Sancarlense, 400, Centro, CP 369, 13560970, São Carlos SP
Telefones: (16) 33739810; 33739823 Fax: 33739811