Evaluation of Multiple Disinfection Methods to Mitigate ...
68
University of Tennessee, Knoxville University of Tennessee, Knoxville TRACE: Tennessee Research and Creative TRACE: Tennessee Research and Creative Exchange Exchange Masters Theses Graduate School 5-2015 Evaluation of Multiple Disinfection Methods to Mitigate Evaluation of Multiple Disinfection Methods to Mitigate Contaminated Irrigation Water Contaminated Irrigation Water Tianju Chang University of Tennessee - Knoxville, [email protected] Follow this and additional works at: https://trace.tennessee.edu/utk_gradthes Part of the Bioresource and Agricultural Engineering Commons Recommended Citation Recommended Citation Chang, Tianju, "Evaluation of Multiple Disinfection Methods to Mitigate Contaminated Irrigation Water. " Master's Thesis, University of Tennessee, 2015. https://trace.tennessee.edu/utk_gradthes/3352 This Thesis is brought to you for free and open access by the Graduate School at TRACE: Tennessee Research and Creative Exchange. It has been accepted for inclusion in Masters Theses by an authorized administrator of TRACE: Tennessee Research and Creative Exchange. For more information, please contact [email protected].
-
Upload
khangminh22 -
Category
Documents
-
view
0 -
download
0
Transcript of Evaluation of Multiple Disinfection Methods to Mitigate ...
University of Tennessee, Knoxville University of Tennessee, Knoxville
TRACE: Tennessee Research and Creative TRACE: Tennessee Research and Creative
Exchange Exchange
Masters Theses Graduate School
5-2015
Evaluation of Multiple Disinfection Methods to Mitigate Evaluation of Multiple Disinfection Methods to Mitigate
Contaminated Irrigation Water Contaminated Irrigation Water
Tianju Chang University of Tennessee - Knoxville, [email protected]
Follow this and additional works at: https://trace.tennessee.edu/utk_gradthes
Part of the Bioresource and Agricultural Engineering Commons
Recommended Citation Recommended Citation Chang, Tianju, "Evaluation of Multiple Disinfection Methods to Mitigate Contaminated Irrigation Water. " Master's Thesis, University of Tennessee, 2015. https://trace.tennessee.edu/utk_gradthes/3352
This Thesis is brought to you for free and open access by the Graduate School at TRACE: Tennessee Research and Creative Exchange. It has been accepted for inclusion in Masters Theses by an authorized administrator of TRACE: Tennessee Research and Creative Exchange. For more information, please contact [email protected].

To the Graduate Council:
I am submitting herewith a thesis written by Tianju Chang entitled "Evaluation of Multiple
Disinfection Methods to Mitigate Contaminated Irrigation Water." I have examined the final
electronic copy of this thesis for form and content and recommend that it be accepted in partial
fulfillment of the requirements for the degree of Master of Science, with a major in Biosystems
Engineering Technology.
John R. Buchanan, Major Professor
We have read this thesis and recommend its acceptance:
Mark Radosevich, Arnold Saxton
Accepted for the Council:
Carolyn R. Hodges
Vice Provost and Dean of the Graduate School
(Original signatures are on file with official student records.)

Evaluation of Multiple Disinfection
Methods to Mitigate Contaminated
Irrigation Water
A Thesis Presented for the
Master of Science
Degree
The University of Tennessee, Knoxville
Tianju Chang
May 2015

ii
Copyright © 2015 by Tianju Chang
All rights reserved.

iii
Acknowledgements
First, I want to thank my parents. They support me and give me courage to go abroad to
continue my study. And I really appreciate the help from my major advisor Dr. John
Buchanan. He is very professional and patient. I want thank him for offering me assistantship
and giving me a lot of help when I was in trouble. I want to thank Dr. Mark Radosevich as
well. I will never forget his encouragement when I did not know how to speak on the stage. I
also want to thank Dr. Arnold Saxton, who gave me sufficient suggestions in statistics.
Finally, I want to appreciate the Center of Produce Safety for funding this project.

iv
Abstract
Outbreak of foodborne pathogens associated with fresh produce is a concern to produce
growers. Irrigation water is one of the pathways of produce contamination. The U.S. Food
and Drug Administration (FDA) proposed a set of guidelines for irrigation water that includes
a maximum generic E.coli count lower than 126MPN/100mL. Irrigation is typically a
continuous-flow process: water is withdrawn from a source and applied to a crop. In order to
disinfect irrigation water, a process must be developed to provide treatment while the water is
in the hydraulic network. However, studies related to the continuous flow irrigation water
disinfection (CFIWD) system are lacking and this study focused on testing different
disinfection treatments in CFIWD System. Water samples containing both generic E.coli and
Shiga-toxin producing E.coli (STEC) were used to study different disinfection methods.
Physical and chemical disinfection methods, including ultraviolet light treatment,
peroxyacetic acid (PAA), chlorine dioxide (ClO2) and UV/PAA combined treatment, were
used in this investigation to analyze their disinfection efficiency in highly-contaminated
water. Bacteria were enumerated before and after treatment. In general, all the treatments
were able to inactivate generic E.coli and STEC. Turbidity, total nitrogen, total carbon and
pH measurements were taken with all samples. Turbidity was the most significant parameter
that negatively limited the efficacy of the UV treatment. Chlorine dioxide was found to have
higher disinfection efficiency than PAA treatment. PAA/UV treatment did not show any
synergistic effect for eliminating generic E.coli.

v
Table of Contents
Chapter 1 Introduction and General Information ............................................................................ 1
Chapter 2 Literature Review .......................................................................................................... 6
Chapter 3 Materials and Methods ................................................................................................. 14
Overview ................................................................................................................................... 14
Water Sources ........................................................................................................................... 14
Water Treatment System........................................................................................................... 15
UV radiation.......................................................................................................................... 15
Peroxyacetic acid(PAA)........................................................................................................ 16
Chlorine dioxide(ClO2) ......................................................................................................... 17
Experimental Procedure ............................................................................................................ 17
Enumeration .............................................................................................................................. 18
Water parameter analysis .......................................................................................................... 19
pH .......................................................................................................................................... 19
Turbidity ............................................................................................................................... 19
Total Suspended Solids(TSS) ............................................................................................... 19
Total Dissolved Solids(TDS) ................................................................................................ 19
Total Carbon(TC).................................................................................................................. 21
Total Nitrogen(TN) ............................................................................................................... 21
Calculation and Statistics .......................................................................................................... 21
Chapter 4 Results and Discussion ................................................................................................ 23
Ultraviolet light ......................................................................................................................... 25
Peroxyacetic Acid (PAA) ......................................................................................................... 25
PAA/UV .................................................................................................................................... 32
ClO2........................................................................................................................................... 36
Chapter 5 Conclusions and Recommendations ............................................................................ 37
List of References ......................................................................................................................... 41
Appendix ....................................................................................................................................... 46
Vita ................................................................................................................................................ 58

vi
List of Tables
Table 3.1 Technical characteristics of the UV device .................................................................. 17
Table 4.1 Bacterial inactivation and several water paramter values used in UV treatment ......... 24
Table 4.2 Bacterial inactivation and several water parameter values used in PAA treatment ..... 28
Table 4.3 Bacterial inactivation and several water parameter values used in PAA/UV
treatment ....................................................................................................................... 31
Table 4.4 Comparison of disinfection efficiency between combined treatment with individual
treatments ...................................................................................................................... 33
Table 4.5 Bacterial inactivation and several water parameter values used in ClO2 treatment ..... 34
Table 4.6 Comparison of disinfection efficiency between PAA and ClO2 treatment .................. 35

vii
List of Figures
Figure 3.1 Water treatment system (From top to bottom: Full view of the system, filter and
entrance of chemicals, UV system) .............................................................................. 16
Figure 4.1a Ridge analysis for UV treatment ............................................................................... 20
Figure 4.1b Ridge plot for UV treatment ...................................................................................... 26
Figure 4.1c Contour plot of predicted response surface for UV treatment ................................... 26
Figure 4.2 Linear regression model for PAA treatment ............................................................... 27
Figure 4.3 3D plot for multiple regression of PAA/UV treatment ............................................... 30
Figure 4.4 Nonlinear regression model for ClO2 treatment .......................................................... 36
viii
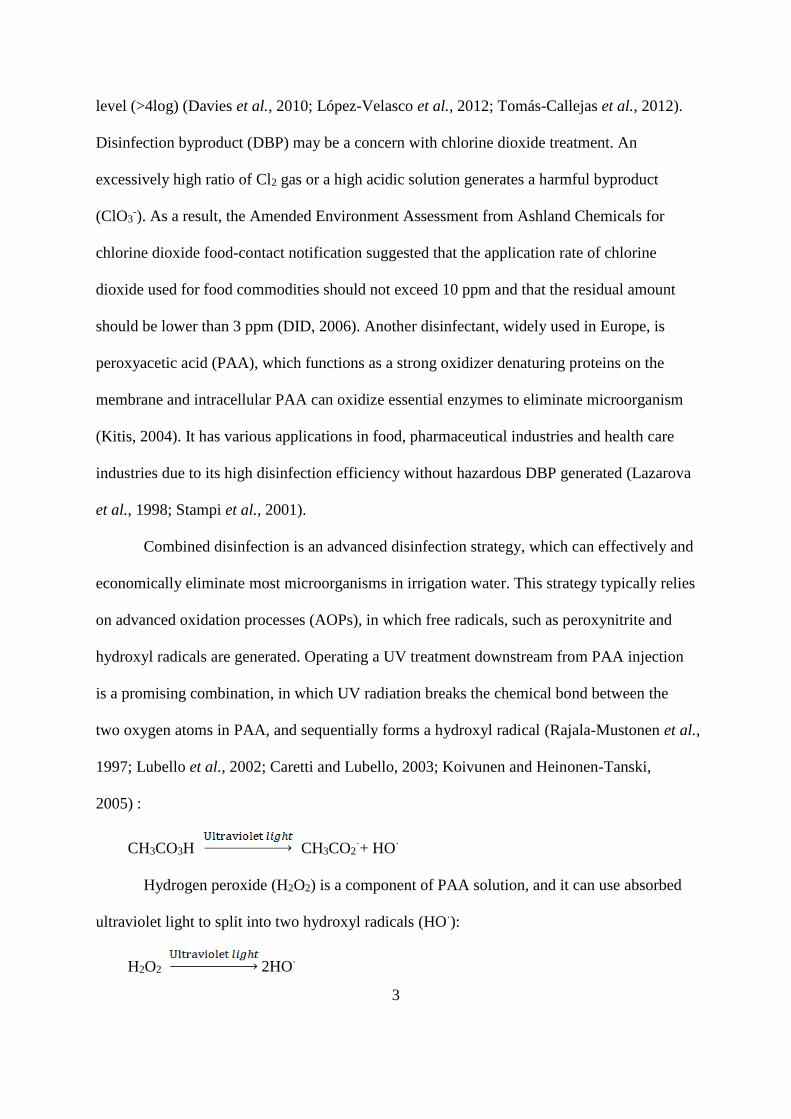
Abbreviation
CFIWD Continuous Flow Irrigation Water Disinfection
CFU Colony Forming Unit
ClO2 Chlorine Dioxide
DBD Disinfection Byproduct
mJ/cm2 millijoule per centimeter squared
NTU Nephelometric Turbidity Unit
PAA Peroxyacetic Acid
STEC Shiga-toxin producing E.coli
TC Total Carbon
TDS Total Dissolved Solids
TN Total Nitrogen
TSS Total Suspended Solids
UV Ultraviolet Light
MPN Most Probable Number

1
Chapter 1
Introduction and General Information
Fresh-cut fruits and vegetables are an important part of a healthy diet. However,
because they are often consumed raw or with minimal processing, there is a pathogen
contamination risk associated with fresh produce, which can cause illness and death as well
as economic loss. In 2009, 134 deaths, 7125 hospitalizations and 1,193,970 illnesses
associated with produce contaminations were reported with a correlated expense of $1.4
billion (Batz et al., 2012). Furthermore, 364 disease outbreaks associated with foodborne-
pathogen contamination have been reported over the last decade (U.S. Dept. of Agriculture,
2013). Irrigation water is one of the potential avenues for produce contamination for two
reasons. First, over 50% of growers use surface water as irrigation source, which might
contain a variety of pathogenic microorganisms such as Clostridium botulinum, Clostridium
perfringens, and Escherichia coli O157:H7, a Shiga toxin-producing E. coli (Steele and
Odumeru, 2004). Additionally, 54.5% of crops in U.S. are grown under overhead irrigation,
which further increases the risk of produce contamination, because the edible portions of raw
or fresh-cut fruits and vegetables are more likely to be in contact with contaminated irrigation
water (USDA-NASS, 2008). In response to the potential for foodborne pathogens to be
transmitted by irrigation water, the U.S. Food and Drug Administration (FDA) recently
proposed a set of guidelines for irrigation water quality, limiting the concentration of generic
E.coli to a geometric mean of 126MPN/100mL (FDA, 2013). Dr. Annette Wszelaki,
University of Tennessee, investigated irrigation water quality and took water samples from
13 farms with a total of 28 irrigation water sources, including 12 surface-water sources, 14
wells, and 2 municipal water sources. Sample analyses indicated that from 2010 to 2012, at
least 2% to 17% water sources had generic E.coli above the allowable limits (Dr. Wszelaki’s

2
unpublished data). When limits are exceeded, mitigation strategies are required for those
growers who continue to use the surface water to irrigate produce that is intended for fresh-
cut market or is consumed raw.
Typically, mitigation strategies include individual and combined disinfection methods.
Individual disinfection methods could be either physical or chemical methods. Ultraviolet
light (UV) is one of the promising physical disinfection methods, which can damage
microorganisms’ DNA or RNA or can interfere with DNA replication without creating any
harmful disinfection byproducts (DBD). Previous studies have shown UV’s high efficiency in
eliminating pathogenic microorganisms when used for sanitizing drinking water, irrigation
water and other municipal water (Qualls et al., 1983; Oppenheimer, 2002; EPA, 2006;
Munoz et al., 2007; Cantwell and Hofmann, 2008; USDA-NASS, 2008; Jones et al., 2014).
One concern with UV light disinfection is that high turbidity may affect the efficacy due to
limited penetration capacity (Qualls et al., 1983; Christensen and Linden, 2001; Cantwell and
Hofmann, 2008). However, as more advanced disinfection systems and devices have been
developed, high level (>5log) of pathogen inactivation may be achieved even in water
sources with high turbidity (>20NTU) (Milly et al., 2007; Jones et al., 2014). Chemical
methods typically inactivate pathogenic microorganisms via chemical reactions with
membrane components or nucleic acids. Chlorine dioxide is a highly effective disinfectants.
The disinfection function of chlorine dioxide is by its unique one-electron transfer
mechanism where chlorine dioxide (ClO2) is reduced to chloride (Cl-), chlorite (ClO2-) and
chlorate (ClO3-) (Bergmann and Koparal, 2005). Chlorine dioxide’s strong oxidation capacity
results in the destruction of amino acids, inhibition of RNA synthesis and disruption of the
microorganisms’ ability to synthesize protein (EPA, 1999). Low concentrations of chlorine
dioxide (1-5 ppm) and a short contact times (<1min) can achieve a high bacterial inactivation
3
level (>4log) (Davies et al., 2010; López-Velasco et al., 2012; Tomás-Callejas et al., 2012).
Disinfection byproduct (DBP) may be a concern with chlorine dioxide treatment. An
excessively high ratio of Cl2 gas or a high acidic solution generates a harmful byproduct
(ClO3-). As a result, the Amended Environment Assessment from Ashland Chemicals for
chlorine dioxide food-contact notification suggested that the application rate of chlorine
dioxide used for food commodities should not exceed 10 ppm and that the residual amount
should be lower than 3 ppm (DID, 2006). Another disinfectant, widely used in Europe, is
peroxyacetic acid (PAA), which functions as a strong oxidizer denaturing proteins on the
membrane and intracellular PAA can oxidize essential enzymes to eliminate microorganism
(Kitis, 2004). It has various applications in food, pharmaceutical industries and health care
industries due to its high disinfection efficiency without hazardous DBP generated (Lazarova
et al., 1998; Stampi et al., 2001).
Combined disinfection is an advanced disinfection strategy, which can effectively and
economically eliminate most microorganisms in irrigation water. This strategy typically relies
on advanced oxidation processes (AOPs), in which free radicals, such as peroxynitrite and
hydroxyl radicals are generated. Operating a UV treatment downstream from PAA injection
is a promising combination, in which UV radiation breaks the chemical bond between the
two oxygen atoms in PAA, and sequentially forms a hydroxyl radical (Rajala-Mustonen et al.,
1997; Lubello et al., 2002; Caretti and Lubello, 2003; Koivunen and Heinonen-Tanski,
2005) :
CH3CO3H CH3CO2
·+ HO·
Hydrogen peroxide (H2O2) is a component of PAA solution, and it can use absorbed
ultraviolet light to split into two hydroxyl radicals (HO·):
H2O2 2HO·
4
Hydroxyl radicals are strong oxidizers and advance the disinfection process by
oxidizing microorganisms’ cellular components and generating degradable products:
Cellular components Degradable compounds + CO2+ H2O
The higher efficiency of UV/PAA combination has been mentioned in several studies.
Less PAA and a lower UV dose were required to achieve the same level of pathogenic
microorganism reduction, as compared to individual UV or PAA treatment (Rajala-Mustonen
et al., 1997; Lubello et al., 2002; Gehr et al., 2003; Koivunen and Heinonen-Tanski, 2005).
Additionally, operating UV treatment after PAA treatment was demonstrated to have a higher
disinfection efficiency than operating PAA before UV treatment (Caretti and Lubello, 2003).
There are two categories of treatment processes: batch style and continuous flow. In
the research literature, scientists have investigated using batch-style (i.e. the treatment of the
source water in large tanks before irrigation) as a means of removing both plant and human
pathogens. This type of treatment allows the water to be tested before application to the crop.
However, this method requires a reactor volume that would be equivalent to the volume of
water needed for irrigation. This can be a practical application for greenhouse and nurseries,
but is not practical for field scale crop production. The continuous flow method provides
treatment within the irrigation system. In other words, the irrigation system becomes the
reactor. The primary disadvantages of the approach is that the water cannot be tested (for
pathogens) before some of the water is applied to the crop. Regarding irrigation water
disinfection, the research literature is more focused toward batch-style treatment. A recent
literature search could not find examples of providing continuous flow disinfection for
irrigation water.
The goal of this study was to test the disinfection efficiency of these disinfection
methods UV, PAA, ClO2 and PAA/UV on the continuous flow irrigation system. Generic

5
E.coli’s and STEC’s inactivation level were considered as the measure in this study to
evaluate the disinfection efficiency. There were three objectives in this study: 1.compare the
disinfection efficiency between individual treatments and combined treatment and determine
the synergistic effect of combined treatment; 2. determine the impact of different water
parameters (i.e, pH, turbidity, total carbon and total nitrogen) on these disinfection methods;
3.compare PAA treatment with ClO2 treatment and determine which one is more effective.
The results showed either individual or combined treatment were able to mitigate the
issue of contaminated irrigation water. A regression model was generated for each
disinfection method and the models indicated that either individual or combined treatments
can have a high disinfection efficiency. With sufficient disinfectant dosages, generic E.coli
contaminated irrigation water was able to meet the requirement proposed by the FDA.
Likewise with sufficient disinfectant dosage, STEC was able to be completely eliminated.
PAA/UV treatment did not show higher disinfection efficiency than the simple summation of
two individual treatments for generic E.coli when they treated the same contaminated water
sample. Chlorine dioxide was shown to have higher disinfection efficiency for generic E.coli
than PAA treatment.

6
Chapter 2
Literature Review
Irrigation water has recently become a focal point in produce safety due to its ability
to serve as a potential avenue for produce contamination (EPA, 2006). Disinfection, as an
essential process for water purification, might be the only way to address this issue. In
general, disinfection methods consist of physical and chemical disinfection methods. Physical
methods include ultraviolet light, ultrasound, carbon atom related antibacterial materials,
electrochemical treatment and membrane filtration. They have the advantages of not
generating disinfection byproducts (DBP) and can have high disinfection efficiencies, but
their high cost might limit their general application for irrigation water. Chemical disinfection
methods basically rely on oxidation-reduction reactions to inactivate microorganisms.
Commonly used disinfectants include chlorine, chlorine dioxide, peroxyacetic acid and metal
compounds. They are commonly used in practice and have high disinfection efficiencies, but
may generate disinfection byproducts that may create additional toxicity. The combination of
physical methods with chemical methods is another strategy to effectively mitigate
pathogenic microbial contamination. One of the primary goals of this project is to have
continuous flow irrigation water disinfection (CFIWD) system, so this review will go through
the methods mentioned above and analyze if they are appropriate for this system.
Ultraviolet light (UV light) is a promising and commonly used physical disinfection
method. The basic principle of this method mainly relies on the generation of UV-B (315-
280nm) and UV-C (280nm-100nm) radiation, which can damage the DNA or RNA of
microorganisms and interfere with DNA replication. One advantage of this method is that no
byproducts are generated by UV radiation. Another advantage of UV is that it is easy to
install and has high disinfection efficiency. In clear water, UV light can achieve more than 5

7
log inactivation of generic E.coli with UV dose of 10mW·s/cm2 (Chang et al., 1985).
However, its efficiency is usually questionable when being used to sanitize highly turbid
waters, since suspended solids can usually block or absorb UV light or shield pathogens from
the UV light. In the last century, Qualls et al.(1983) found that suspended particles in
secondary treated effluent waste water could protect coliforms from UV light. However, this
group also found that when the dosage of UV was operated greater than 12mW•s /cm2,
generic E.coli were totally inactivated in the unfiltered sample (14 NTU). Christensen and
Linden (2001) found that without filtration step, turbidity greater than 10 NTU might affect
UV dose delivery. Low turbidity (less than 10NTU) might not affect UV light efficiency.
Oppenheimer (2002) found that in bench scale and pilot scale studies, 0.65 to 7 NTU of
turbidity did not influence the efficiency of UV light to inactivate Giardia muris or C.
parvum. New disinfection technology has been developed to provide more exposure of the
UV to the water contents (Milly et al., 2007). An example of an advanced UV treatment
device is the Cider Sure Processor (FPE, Inc., Rochester, NY). Jones et al. (2014) found that
this UV device could consistently achieve a minimum 5-log difference of E. coli O157:H7,
when a dosage of 14.2mJ/cm2 of UV was exposed to water sample that ranged in turbidity
from 1,000 to 2,400 NTU turbidity. UV devices are relatively small and can be directly
installed in the irrigation-water delivering line. However, the high initial cost might prevent
UV from adopted for irrigation applications.
Electrochemical disinfection method is another typical physical treatment.
Electrochemical device typically can be separated into two categories: direct electrolyzers
and mixed oxidant generators. For this review only direct will be discussed. Basically, this
method relies on reduction-oxidation (redox) reactions, in which electrons are generated from
one element and moved from one element to another. This method is able to inactivate a

8
variety of pathogens, including virus, bacteria and protozoa. In comparison with chemical
disinfection methods, electrochemical methods do not require the handling and storage of
hazardous chemicals. However, this method does not fit in well with the irrigation systems
for two reasons. First, the efficiency of this method largely depends on electrode materials
and water parameters (i.e. flow rate, current density), so it may be difficult to incorporate into
a typical irrigation system (Kerwick, 2005). Second, high initial cost of these devices might
limit the field-scale application.
Chlorine dioxide treatment is a widely used chemical disinfection method. The
disinfection function of chlorine dioxide is based on its unique one-electron transfer
mechanism where it is reduced to chloride (Cl-), chlorite (ClO2-) and chlorate (ClO3-)
(Bergmann and Koparal, 2005). Chlorine dioxide reacts directly with amino acids, RNA and
cell membrane to destroy bacteria. Low concentrations of chlorine dioxide and short contact
times can achieve high bacterial inactivation levels. Benarde et al.(1965) documented a 99%
inactivation in a clear water with a pH 8.5 that contained 15,000 cells/mL of fecal coliforms,
using 2mg/L ClO2 dose and 30sec of contact time. Chlorine dioxide cannot be stored and has
to be generated on site. In comparison with hypochlorite, ClO2 itself is not harmful and not
part of the breakpoint chlorination process, but the major concern for chlorine dioxide
treatment is that commercial chlorine dioxide reactors might generate some byproducts
besides of ClO2, such as ClO3- and Cl2, but no hypochlorite reactions occur during
disinfection process (EPA, 1999). Considering potential hazardousness, Amended
Environment Assessment suggested that the application rate of chlorine dioxide used for food
commodities should not exceed 10 ppm and the residual amount should be lower than 3 ppm
(DID,2006). Turbidity as low as 5NTU have been shown to have limited impact on
disinfection efficiency. Barbeau et al. (2005a) found that providing 0.45µm of filtration

9
membrane, which dramatically decreased the turbidity, had limited impact on improving
efficacy of chlorine dioxide as the original turbidity was not very high (<2.7NTU). Several
other studies held the similar opinions (Boyce et al., 1981; Springthorpe et al., 2001; Barbeau
et al., 2005b). But Narkis et al.(1995) found that after suspended solid crushing, 1-2log of
EES’s (enriched effluent suspension) coliform had recovered. They thought microorganisms
might be entrapped in suspended solids to survive. High turbidity (160NTU) was thought to
significantly reduce the Oxidation Reduction Potential (ORP) of chlorine dioxide and thus
extend the required contact time, when low levels of chlorine dioxide were used (Tomás-
Callejas et al., 2012).
Peroxyacetic acid (PAA) is another strong oxidant that is used as the water
disinfectant. PAA is generated by reacting acetic acid with hydrogen peroxide (Alasri et al.,
1992). The resulting solution is an equilibrium of acetic acid (AA), hydrogen peroxide
(H2O2), and PAA, which creates a strong acid (pH below 2) that has a pungent acetic odor
(Kitis, 2004). Like other oxidizing disinfectants, peroxyacetic acid functions by oxidizing the
cell membranes and inner cell structures of microorganisms. It has the advantage of
delivering high disinfection efficiency at low concentrations. Five log reduction of E.coli was
achieved by operating at 1.5-2.0 ppm of PAA with 20 mins of contact time (Stampi et al.,
2001). Likewise, three log reduction of fecal coliforms and fecal streptococci was reported by
Lazarova et al.(1998), using 10mg/L PAA and 10 minutes contact time. Another advantage
of using PAA is that it does not generate disinfection byproducts (DBD), and the residues are
degradable and environmentally friendly (Dell'Erba et al., 2004). Turbidity may impact
efficiency of PAA treatment (Stampi et al., 2001; Gehr and Cochrane, 2002). Koivunen et al.
(2005) found that 2 log more coliforms survived when the turbidity was 55 NTU as compared
to a similar water that had a turbidity of 1.9 NTU. Sánchez et al. (1995) found that the

10
optimal dose for total coliform in a raw wastewater (over 20 NTU) was about 20 mg/L with a
contact time of about 10 minutes. Higher concentrations and longer contact times could
improve efficiency of PAA treatments, nevertheless, might also result in negative effects.
Studies showed that PAA disinfection was associated with the increase of organic content in
the effluent due to the remaining acetic acid, which could increase the possibility of microbial
regrowth (Lazarova et al., 1998; Dell'Erba et al., 2004).
In order to optimize the efficiencies of individual disinfection treatments and reduce
the cost for physical facilities, combined treatments were regarded as the priority solution.
Often, physical and chemical treatments are combined to create more effective oxidizers.
These advanced oxidation processes (AOPs) generate additional free radicals and provide
additional oxidation of microbial components (such as amino acids cysteine, tryptophan or
viral RNA). Most free radicals exists as hydroxyls (HO·), which has high oxidation potential
(E=2.31V) but short life span (about 10μs). Typical methods of generating AOPs include
UV/PAA, UV/H2O2, O3/H2O2 and O3/UV. The increased disinfection efficiency of these
combinations are well documented within the research literature (Munter, 2001; Gehr et al.,
2003; Rizvi et al., 2013).
Operating UV light downstream from peroxyacetic acid injection is one of the
promising combinations. UV radiation breaks the chemical bond between two oxygen atoms
in PAA, and sequentially forms the hydroxyl radical(Rajala-Mustonen et al., 1997; Lubello et
al., 2002; Caretti and Lubello, 2003; Koivunen and Heinonen-Tanski, 2005).Furthermore, the
hydrogen peroxide (H2O2) is also split into two hydroxyl radicals (HO·) by absorption of
ultraviolet light. The disinfection by-products include organic components (dead cell mass
and acetic acid), hydrogen and water, all of which can assimilate in the environment. The
high efficiency of UV/PAA is mentioned in the research literatures. Koivunen and Heinonen-
11
Tanski (2005) demonstrated that in peptone water (E.coli media) containing 0.8NTU of
turbidity, 3mg/L PAA with a contact time (CT) of 30s combined with 10mW·s/cm2 of UV
disinfection can achieve at least 5log (>99%) generic E.coli reduction, whereas individual
PAA method (3mg/L, CT=30s) alone could only achieve 2.8log E.coli reduction. Likewise,
the UV method (10mWs/cm2) alone got 1.4log E.coli inactivation. Caretti and Lubello (2003)
found that 2mg/L of PAA (CT=30min) combined with 192mW·s/cm2 UV exposure was the
optimum combination to eliminate total coliform 106 MPN/100mL in the effluent (average
turbidity=1.9NTU), however as individual disinfection methods (same concentration and
same CT) the same level of reduction could not be achieved. In addition, Caretti and Lubello
(2003) also found that injecting PAA before UV exposure could inactivate more microbes
than injecting PAA after UV exposure. Several studies reported that when PAA was
combined with UV light, sufficient reduction of microbes could be achieved with the shorter
retention time in UV reactors and lower PAA concentration as compared to the single
treatment methods (Rajala-Mustonen et al., 1997; Lubello et al., 2002; Gehr et al., 2003).
Combination of UV light with chlorine dioxide is not an appropriate strategy for sanitation,
especially if any bromide ions are in solution, then the photochemical reaction of chlorine
dioxide could catalyze the formation of brominated by-products. However, this combination
could have a high disinfection efficiency (DID, 2006).
Chemical disinfection methods have similar pros and cons for use in CFIWD system.
Disinfection equipment, such as pipes and injection pumps, are easily fitted onto irrigation
systems to provide continuous-flow disinfection. In addition, the initial equipment cost of
disinfection is lower, as compared to UV; however, with chemical treatment-there is the
significant long term cost of resuppling chemicals. For example, Zero Tol 2.0, which contains
9.5L of 2000 ppm peroxyacetic acid costs $186.83 (Zero Tol, BioSafe Systems LLC).
12
Antimicrobial nanomaterial is another type of disinfectant, including biological
substances, metal and metal oxides, and carbon related materials. They use either shear force
or oxidation-reduction reactions to eliminate microorganisms. Chitosan, which derives from
chitin, is synthesize to a polymer and serves as nanoparticles to inactive microorganisms.
Several treatment mechanisms have been proposed, including interaction of positively
charged chitosan with negative charged cell membrane and chitosan chelated metal caused
enzyme activity inhibition (Li et al., 2008). Another biological substance is a peptide
nanotube. It has been proposed that it can form a channel that creates osmotic collapse and
degrades microbial membranes (Gazit, 2007). These biological substances are biodegradable
and environmental friendly, but they are not easy to synthetize and difficult to use on a large
scale. Silver compounds and silver ions can serve as a metal disinfectant and have been used
in hospital sanitation and residential-scale water treatment. Several authors have speculated
about the role that silver plays in disinfection; however, the actual mechanism is largely
unknown (Rabea et al., 2003; Qi et al., 2004). Metal oxides like TiO2 and ZnO can serve as
disinfectants as well. Their photocatalytic properties, associated with generation of hydroxyl
radicals, facilitate inactivating pathogenic organisms (Ghadiri et al., 1993). The common
problem with employing metal materials is their toxicity for the environment. High dosage of
metal compounds might lead to interference of immune cells’ function and disruption of
marine ecosystem (Zhu et al., 2011). Fullerenes (i.e, C60, C70) and carbon nanotubes are two
typical carbon-related antibacterial nanomaterials. Some explanations for their disinfection
mechanisms have been proposed, but considerable questions still remain. The major concern
for this method is the aggregation of particles, which might dramatically reduce the
antibacterial efficiencies of these materials (Wick et al., 2007).
13
These disinfection strategies, either single or combined, have been studied in
reclaimed water systems, drinking water systems and other water systems (Caretti and
Lubello, 2003; Wang et al., 2011; Wang et al., 2012). However, the research literature is
lacking information about studies concerning highly-effective disinfection methods for
continuous-flow irrigation water. This project is going to evaluate efficiencies of UV light,
PAA, chlorine dioxide and combined UV with PAA methods in continuous-flow irrigation
water disinfection (CFIWD) system. Several water parameters (pH, turbidity, TN, TC, TSS,
and TDS) will be evaluated as well. The hypotheses of study were:
1. All the treatments will be able to reduce number of generic E.coli down below than
126MPN/100mL.
2. All the treatments have the capacity to inactivate shiga toxin-producing E.coli.
3. Turbidity will have negative effect on UV treatment.
4. Combined treatment of PAA/UVV have a synergistic effect on the generic E.coli
inactivation.

14
Chapter 3
Materials and Methods
Overview
A laboratory-scale irrigation system was designed and constructed to evaluate various
water disinfection methods. This system allowed for variable-rate chemical disinfectant
injection and/or for variable-rate UV irradiation. Microbial enumeration was conducted on
water samples taken from the system discharge and compared to the water samples taken
from the water source.
Irrigation Water Source
The source water used in this experiment was collected from a pond that serves to
water cattle at the University of Tennessee’s Plateau Research and Education Center
(Crossville, TN). This water was known to contain both STEC and generic E.coli. During the
fall and winter of 2014, pond water was collected in a 1,000 L tank and transported back to
the laboratory. In order to better simulate highly contaminated conditions, nutrients
(consisting of 8.0g peptone and yeast extract, 5.2 g salt, and 2.6 g Chromogenic mix
(CHROMagar, Paris, France)) were added to the transported tank to culture the water borne
microbes for 24 h. The transported tank water was thoroughly agitated before being pumped
into a 210 L container that was used to simulate an irrigation surface water source.
Water Treatment System
The simulated irrigation system consisted of a submergible pump (Finish Thompson
Inc., MA), a flow meter (Seametric Inc., Seattle), a filter (ARKAL Inc., Jordan Valley, Israel)
and a ball valve to control the flow rate. Figure 3.1 contains pictures of CFIWD system. The
pipes and components had 1.9 cm (0.75 inch) nominal diameters. Concentrated chemical
disinfectants were injected (PAA or ClO2) into the discharge pipe by diaphragm pump

15
(PULSAFEEDER, Punta Corda, USA) with an injection rate set at 42 mL/min. A UV lamp
box was connected pipes downstream from the injection point. Valves were used to by-pass
the UV lamp as needed. The water-delivery side of the irrigation system was constructed with
15m (50 ft) of 1.9 cm (0.75 inch) nominal diameter polyethylene tubing. This tubing
simulated the disinfectant contact time that would be provided in the hydraulic network
before water is applied to a crop. Each treatment had its own set of water-delivery tubing to
prevent cross contamination. Water samples were collected at the end of the delivery tubing.
To evaluate the synergistic effect of the combined treatment (UV/PAA), UV treatment was
operated downstream from the PAA treatment.
UV radiation
UV radiation was provided to the source water using a Sterilight SM80 (VIQUA,
Ontario, Canada). The technical characteristics of the UV device are given in Table 3.1. The
UV dose was varied by changing the flow rate through the device. A valve at the end of the
tubing was used to restrict the flow rate. This UV device is designed to provide 52.67 mJ/cm2
at a flow rate of 3.79 L/min (1 gpm). For this project, flow through the UV device ranged
from 2.65 to 16.2 L/min (0.70-4.27 gpm). A read-out was used to indicate UV efficiency (%),
which is a parameter in the UV model. Using the manufacturer’s information, a linear model
was created to estimate the UV dosage at various flow rate (equ (1)). For this project, the UV
dose ranged from 10.6 to 41.2 mJ/cm2 (4.27 to 0.98 gpm) were operated.

16
Figure 3.1 Water treatment system (From top to bottom: Full view of the
system, filter and entrance of chemicals, UV system).

17
Table 3.1 Technical characteristics of the UV device
Intensity of UV (mJ/cm2) = (-45.42*flow rate (L/min) +64.667)*UV Efficiency (%)(1)
Peroxyacetic acid (PAA)
The PAA source was SaniDate 12, a 12% peroxyacetic acid (12,000ppm) concentrate
manufactured by BioSafe Systems LLC (East Hartford, USA). Different concentrations of
PAA were injected into irrigation system using the fixed pump rate (42mL/min) and
consistent irrigation water flow rates (1gpm). A Peracetic Acid Vacu-vials Kit (CHEMetrics,
Midland, USA) and HACH Spectrophotometer (HACH, Company, Loveland, CO, USA)
were used to measure PAA concentrations. This is a colorimetric procedure by which the
absorbance of 515nm light source is directly related to the PAA concentration using the
manufacturer’s equation:
Concentration of PAA(ppm)=0.92(abs)2+4.84(abs)-0.01…………………………(2)
where abs means absorption.
Technical characteristics of Sterilight SM80
Length (cm) 103.0
Diameter(cm) 10.0
Max current(Amp) 2.4
Lamp Power(W) 200
Maximum operating pressure(PSI) 100
Ambient temperature(℃) 2~40

18
Chlorine dioxide (ClO2)
Chlorine dioxide was made using a ClO2 solution delivery system developed by ICA
TriNova (Newnan,GA,USA). Basically, a pack containing sodium hypochlorate and a pack
of activator are put into 5L of water, and the reaction will generate a 1000 ppm chlorine
dioxide solution. Various concentrations of ClO2 were evaluated the irrigation water
maintaining the fixed pump rate (42mL/min) and consistent water flow rates (1gpm).
Residual ClO2 concentrations were measured by using the DPD Standard Method
4500(HACH Company, Loveland, CO, USA) and HACH Spectrophotometer (HACH,
Company, Loveland, CO, USA).
Experimental Procedure
To minimize any residual effects from previous tests, the hydraulic network was
flushed for at least three minutes before a new experiment. Generally, a given treatment was
run and three rounds of samples were collected. For each round, the water sample was
assigned a different treatment level. Water samples were collected at the end of the tubing
three to six minutes after the water started to be pumped into the system. Non-disinfected
control samples were collected from a sampling port located just before the filter at the
beginning and end of each run to determine the concentration of bacteria entering the system.
A second set of control samples were collected at the end of tubing before the initiation of
treatment. The bacterial population was dynamic and care was taking not to exceed the upper
limit of the enumeration method. Source water samples were serially diluted (×10, ×20,
×50, ×100, ×250, ×500 and ×1000) to determine which dilution factor was appropriate
for the enumeration method (range: 0-2419.6MPN/100mL).

19
Enumeration
During each event, water samples were taken at predesigned times for microbial
enumeration and for water quality parameters. These samples were taken from system
discharge. For enumeration, water samples were taken before and after treatment and control
samples were taken after each set of experiment as well. 100mL water samples were
collected in a container that contained 10mg of sodium thiosulphate. The sodium thiosulphate
was used to neutralize the ClO2 and PAA to stop the disinfection process. An additional 1 L
was collected for water quality analyses. After the sodium thiosulphate tablet was dissolved,
1mL of the water sample was collected from the 100mL water sample for Shiga-toxin
producing Escherichia coli (STEC) culture.
A most probable number method (MPN) was used to enumerate the generic E.coli in
the water samples. For this method, 100mL of sample water was mixed with a commercial-
prepared powdered growth media (Colilert, IDEXX,Westbrook, USA). When the powder
was fully dissolved, the mixture was poured into a Quanti-Tray/2000 (IDEXX, Westbrook,
USA) for incubation. Water samples were placed in incubator at 37℃ for 24 hours. A 365nm
UV light was used to detect fluorescence (indicator of E.coli) to determine the MPN.
Enumeration of STEC began by taking 100μL of the 1mL water sample and
transferring to petri dishes with prepared CHROMagarTM STEC(consisting of 8.0g peptone
and yeast extract, 5.2g salt, and 2.6 g Chromogenic mix) (CHROMagar, Paris, France).
Spread plate count method was used to determine the number of STEC colonies on the plates.
No dilution was needed since there was low STEC in the samples. These samples were
placed in an incubator for 24 hours and at a temperature of 37℃. All the experiments related
to STEC enumeration were conducted in a Level II Biosafety Laboratory.

20
Water parameter analysis
pH
A HQ40d Portable pH Meter (HACH, Loveland, USA) was used to measure pH. This
meter was calibrated using standard buffers.
Turbidity
A 2100P Portable Turbidimeter (HACH, Loveland, USA) was used to measure
turbidity. Before each use, a standard turbid solution was used to check the meter’s
calibration.
Total Suspended Solids (TSS)
To determine total suspended solids, this project followed standard methods 2540-D (APHA,
2005) below to determine TSS:
I. Before sampling, soak glass fiber filters in distilled water, drying them at 103℃, and
weigh and record their weights.
II. Place the dried, weighed glass fiber filter onto a filtering flask – wrinkled side up.
Shake the sample bottle first, then pour in 50mL water sample and turn on the pump.
III. Dry the filter at 102℃ for 24hrs. Let it cool to room temperature and weigh it. Record
the end weight.
IV. The increase in weight represents TSS. Calculate TSS by using the equation below.
This experiment followed the equation below to calculate TSS:
TSS (mg/L) = ([A-B]*1000)/90 ………………………… (3)
Where A = end weight of the filtering flask
B = initial weight of the filtering flask
Total Dissolved Solids (TDS)
This project followed the standard method below to determine the TDS (APHA, 2005):

21
I. Before sampling, soak glass fiber filters in distilled water, drying them at 103℃, and
weigh and record their weights.
II. Place the dried, weighed glass fiber filter onto a filtering flask – wrinkled side up.
Shake the sample bottle first, then pour in 50mL water sample and turn on the pump.
III. Dry the filtering flask at 102℃ for 24hrs. Let it cool to room temperature and weigh it.
Record the end weight.
IV. The increase in weight represents TDS. Calculate TDS by using the equation below:
TDS (mg/L) = ([A-B]*1000)/50……………………… (4)
Where A = end weight of the filtering flask
B = initial weight of the filtering flask
Total Carbon (TC)
Total carbon was measured by TOC-V Analyzer (SHIMADZU Corporation). A TOC-
V Analyzer combusts the samples to 680℃ in an oxygen-rich environment inside
combustion tubes packed with a platinum catalyst, which function as electrocatalyst to
catalyze the oxidation reaction. The resulting carbon dioxide generated by oxidation is
measured using an infrared gas analyzer.
Total Nitrogen (TN)
Total nitrogen was measured by TNM-1 Analyzer (SHIMADZU Corporation). When
the sample is injected into the combustion tube, the nitrogen compounds in the sample
thermally decomposes to create nitrogen monoxide, which is cooled in the dehumidifier and a
chemiluminescence detector utilizes the gas-phase chemiluminescence of ozone and nitrogen
22
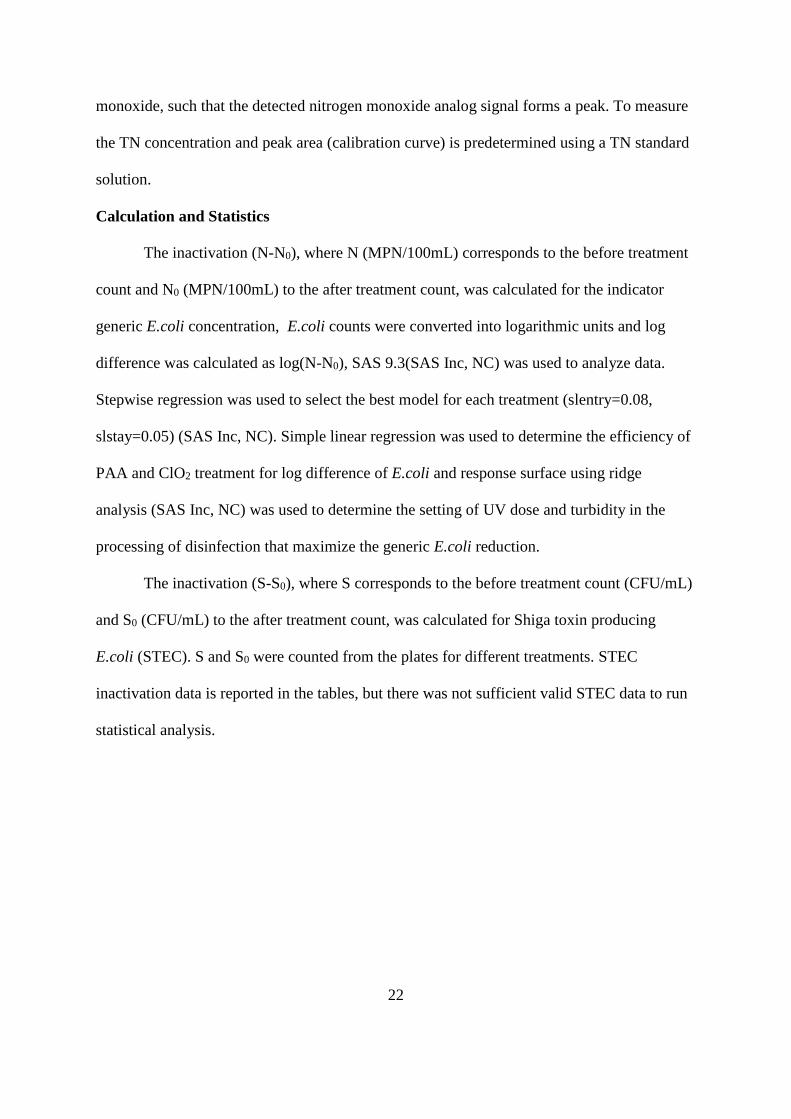
monoxide, such that the detected nitrogen monoxide analog signal forms a peak. To measure
the TN concentration and peak area (calibration curve) is predetermined using a TN standard
solution.
Calculation and Statistics
The inactivation (N-N0), where N (MPN/100mL) corresponds to the before treatment
count and N0 (MPN/100mL) to the after treatment count, was calculated for the indicator
generic E.coli concentration, E.coli counts were converted into logarithmic units and log
difference was calculated as log(N-N0), SAS 9.3(SAS Inc, NC) was used to analyze data.
Stepwise regression was used to select the best model for each treatment (slentry=0.08,
slstay=0.05) (SAS Inc, NC). Simple linear regression was used to determine the efficiency of
PAA and ClO2 treatment for log difference of E.coli and response surface using ridge
analysis (SAS Inc, NC) was used to determine the setting of UV dose and turbidity in the
processing of disinfection that maximize the generic E.coli reduction.
The inactivation (S-S0), where S corresponds to the before treatment count (CFU/mL)
and S0 (CFU/mL) to the after treatment count, was calculated for Shiga toxin producing
E.coli (STEC). S and S0 were counted from the plates for different treatments. STEC
inactivation data is reported in the tables, but there was not sufficient valid STEC data to run
statistical analysis.

23
Chapter 4
Results and Discussion
This project used water samples from the Plateau Research and Education Center
(Crossville, TN). All the experiments were conducted using laboratory-scale irrigation system,
which allowed for variable-rate chemical disinfectant injection and/or for variable-rate UV
irradiation. Microbial enumeration was conducted on water samples taken from the system
discharge and compared to the water samples taken from the water source.
Ultraviolet light (UV)
Original data including log difference of generic E.coli, reduction of STEC, and
several other water parameters were recorded (See Table 4.1). Variables including UV dose,
pH, Turbidity, TC, TN, TSS and TDS were put into the selection regression model methods
to determine the best model to explain the differences in the log difference of generic E.coli.
The results indicated that UV dose was significant (P<0.05). Previous studies showed that
turbidity also significantly impacted the disinfection efficiency (Qualls et al., 1983;
Christensen and Linden, 2001; Oppenheimer et al., 2002). So this study investigated effect of
turbidity in the UV disinfection model as well. Turbidiy was shown to have significant effect
in multiple regression model when the data set did not include the zero treatment control
samples. The model was:
Log difference of generic E.coli = 0.08 UV dose – 0.04Turbidity+ 2.31 ……………(5)
The model was able to explain 95% difference of log difference of generic E.coli. UV dose
and turbidity could explain 95% and 42% of difference, respectively.
But this model did not fit the data set containing control samples. Surface response using
ridge analysis was more appropriate to determine the model that fit the data set with control
data. A quadratic model for UV treatment fit the data (P<0.05), and explained 98.6% of

24
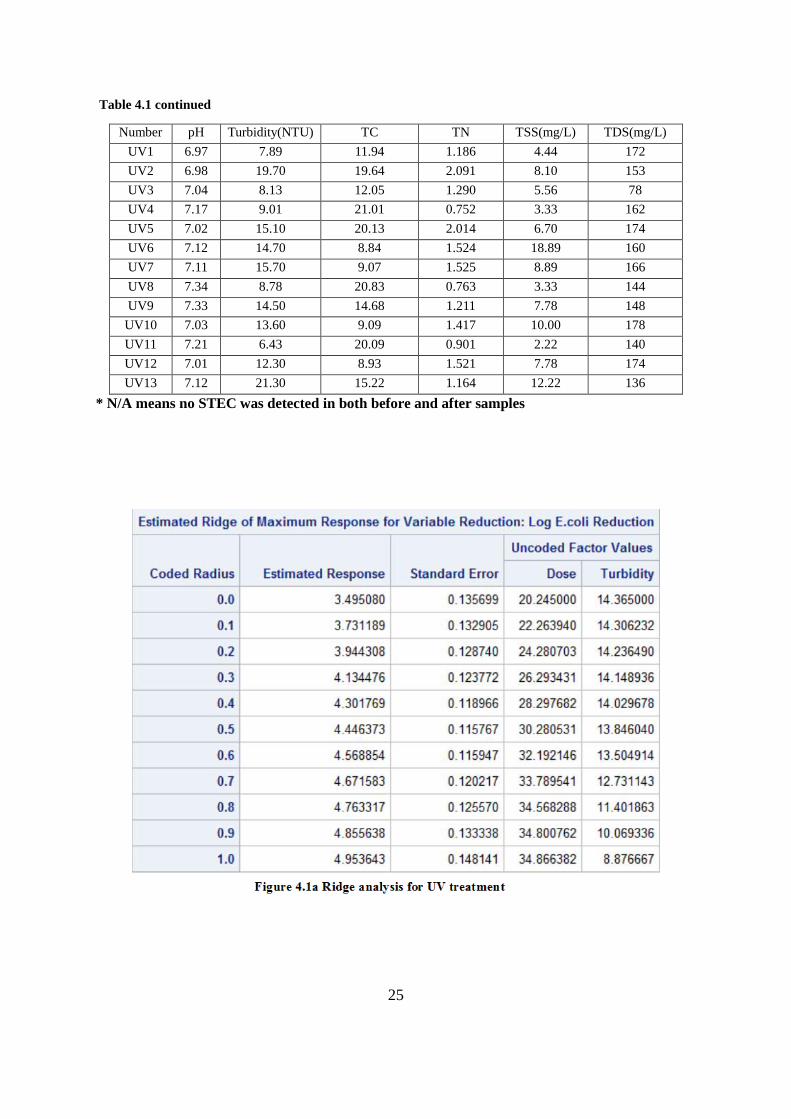
difference of E.coli’s log difference. The canonical analysis indicated that the predicted
response surface is shaped like a saddle (See SAS outputs in Appendix ) . The eigenvalue of
0.44 showed that the valley orientation was less curved that the hill orientation, with an
eigenvalue of -1.15. Because the canonical analysis resulted in a saddle point, the estimated
surface does not have a unique optimum. However, ridge analysis and ridge plot indicated
that maximum log difference of generic E.coli resulted from relative high UV dosage and low
turbidity (see Figure 4.1 a and Figure 4.1 b). The contour plot of predicted response surface
confirmed this conclusion (see Figure 4.1 c).
Table 4.1 Bacterial inactivation and several water parameter values used in UV treatment
Number UV dose
(mJ/cm2)
Flow
rate
(gpm)
Log
residual
E.coli
Log
difference
of generic
E.coli
Final STEC
Count(CFU/mL)
STEC
Reduction(CFU/mL)
UV1 10.60 4.27 4.26 2.99 30 120
UV2 12.96 3.14 3.11 2.64 0 N/A
UV3 14.98 3.83 4.22 3.42 10 140
UV4 16.24 3.37 5.09 3.45 90 720
UV5 22.80 1.51 2.36 3.18 0 N/A
UV6 25.71 2.14 4.96 3.96 0 >30
UV7 27.71 2.31 4.94 4.16 0 >30
UV8 27.75 1.99 5.04 4.26 70 740
UV9 34.77 1.19 3.71 4.99 0 >350
UV10 37.07 1.04 2.80 5.00 0 >30
UV11 37.94 0.94 3.84 5.08 0 810
UV12 38.50 1.43 2.00 5.00 0 >30
UV13 40.49 0.70 2.40 5.02 0 >350
25
Table 4.1 continued
* N/A means no STEC was detected in both before and after samples
Number pH Turbidity(NTU) TC TN TSS(mg/L) TDS(mg/L)
UV1 6.97 7.89 11.94 1.186 4.44 172
UV2 6.98 19.70 19.64 2.091 8.10 153
UV3 7.04 8.13 12.05 1.290 5.56 78
UV4 7.17 9.01 21.01 0.752 3.33 162
UV5 7.02 15.10 20.13 2.014 6.70 174
UV6 7.12 14.70 8.84 1.524 18.89 160
UV7 7.11 15.70 9.07 1.525 8.89 166
UV8 7.34 8.78 20.83 0.763 3.33 144
UV9 7.33 14.50 14.68 1.211 7.78 148
UV10 7.03 13.60 9.09 1.417 10.00 178
UV11 7.21 6.43 20.09 0.901 2.22 140
UV12 7.01 12.30 8.93 1.521 7.78 174
UV13 7.12 21.30 15.22 1.164 12.22 136
26
Figure 4.1c Response Contour for UV treatment
27
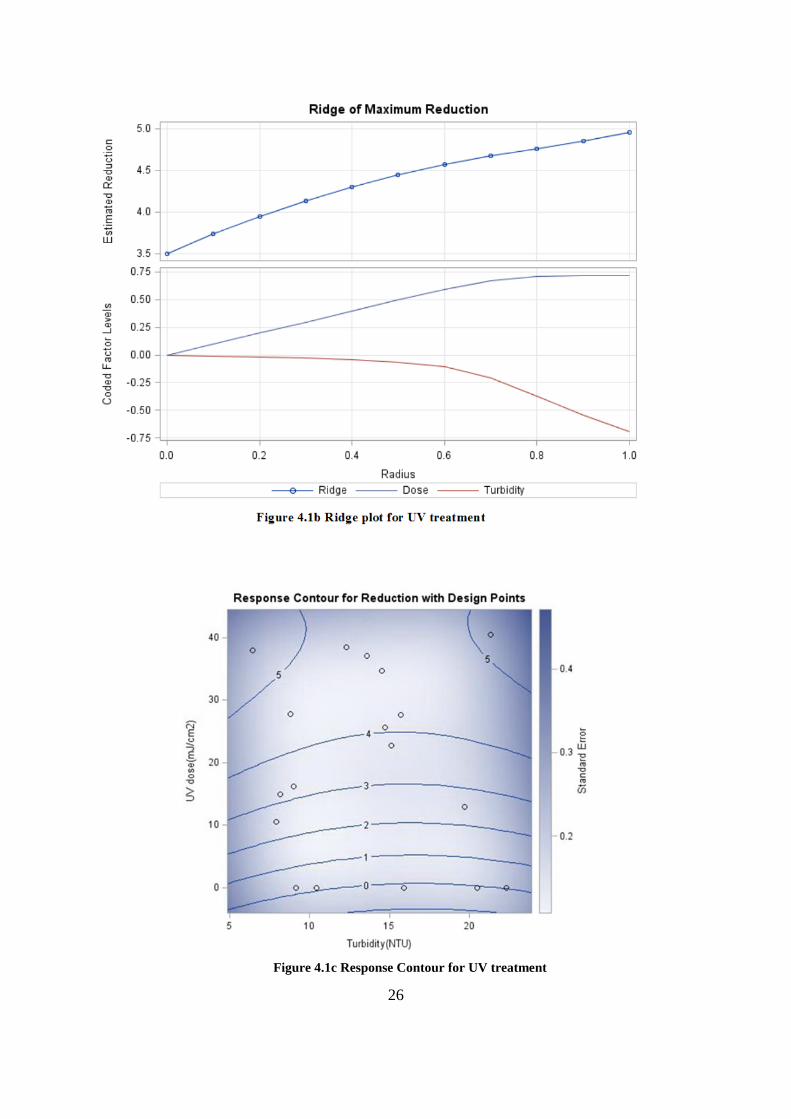
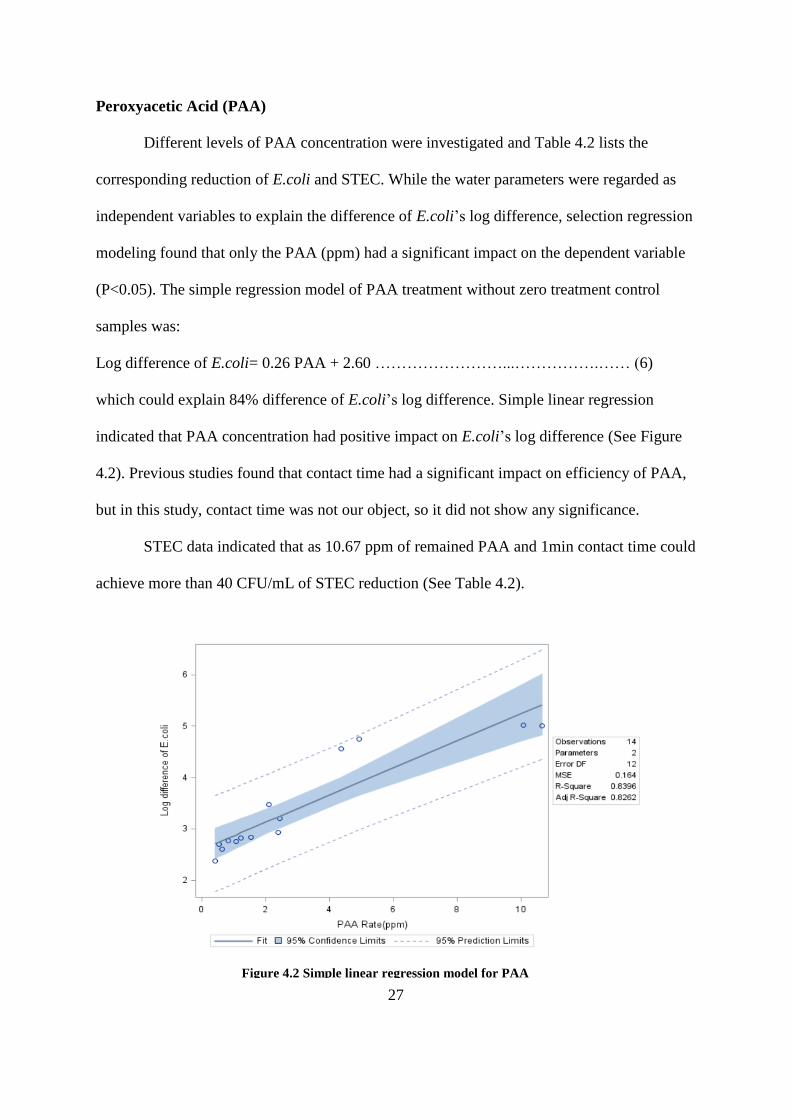
Peroxyacetic Acid (PAA)
Different levels of PAA concentration were investigated and Table 4.2 lists the
corresponding reduction of E.coli and STEC. While the water parameters were regarded as
independent variables to explain the difference of E.coli’s log difference, selection regression
modeling found that only the PAA (ppm) had a significant impact on the dependent variable
(P<0.05). The simple regression model of PAA treatment without zero treatment control
samples was:
Log difference of E.coli= 0.26 PAA + 2.60 ……………………...…………….…… (6)
which could explain 84% difference of E.coli’s log difference. Simple linear regression
indicated that PAA concentration had positive impact on E.coli’s log difference (See Figure
4.2). Previous studies found that contact time had a significant impact on efficiency of PAA,
but in this study, contact time was not our object, so it did not show any significance.
STEC data indicated that as 10.67 ppm of remained PAA and 1min contact time could
achieve more than 40 CFU/mL of STEC reduction (See Table 4.2).
Figure 4.2 Simple linear regression model for PAA
treatment

28
Table 4.2 Bacterial inactivation and several water parameter values used in PAA experiments
Number Designed PAA
(ppm)
Flow rate
(gpm)
Injection
PAA (ppm)
Remaining PAA
(ppm)
Contact
time(min)
Log residual
E.coli
Log difference
of E.coli
PAA1 1 1.11 99.9 0.418 1.1075 2.82 2.37
PAA2 1 1.22 109.8 0.645 1.225 4.22 2.61
PAA3 1.5 1.02 137.7 0.549 1.3 2.32 2.69
PAA4 2 1.02 183.6 0.824 1.3 2.10 2.76
PAA5 3 1.11 299.7 1.068 1.1075 2.47 2.76
PAA6 3 1.22 329.4 1.231 1.225 4.21 2.83
PAA7 5 1.02 459 1.546 1.3 1.08 2.84
PAA8 5 1.11 499.5 2.388 1.1075 1.01 2.94
PAA9 5 1.09 490.5 2.112 1.0925 5.09 3.48
PAA10 5 1.22 549 2.445 1.225 4.19 3.20
PAA11 10 1.09 981 4.936 1.0925 4.86 4.75
PAA12 10 1.18 1062 4.363 1.1775 4.83 4.56
PAA13 20 1.09 1962 10.073 1.0925 4.35 5.02
PAA14 20 1.18 2124 10.670 1.1775 3.01 5.01
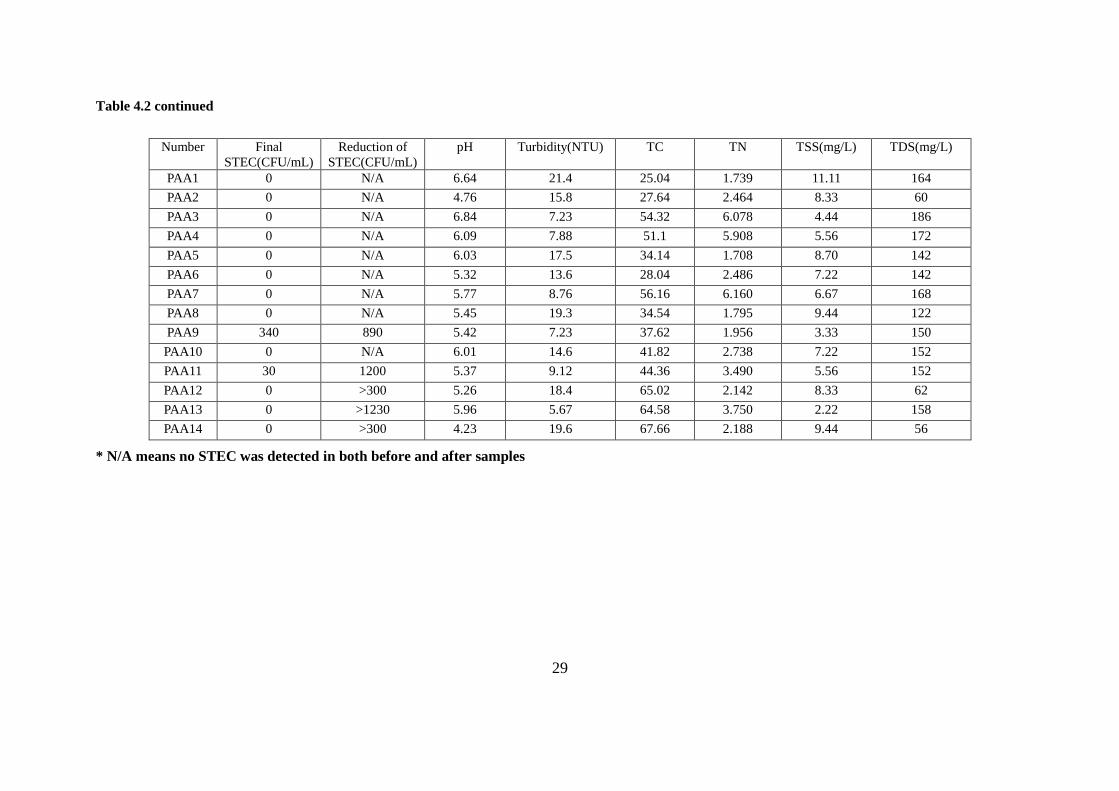
29
Table 4.2 continued
* N/A means no STEC was detected in both before and after samples
Number Final
STEC(CFU/mL)
Reduction of
STEC(CFU/mL)
pH Turbidity(NTU) TC TN TSS(mg/L) TDS(mg/L)
PAA1 0 N/A 6.64 21.4 25.04 1.739 11.11 164
PAA2 0 N/A 4.76 15.8 27.64 2.464 8.33 60
PAA3 0 N/A 6.84 7.23 54.32 6.078 4.44 186
PAA4 0 N/A 6.09 7.88 51.1 5.908 5.56 172
PAA5 0 N/A 6.03 17.5 34.14 1.708 8.70 142
PAA6 0 N/A 5.32 13.6 28.04 2.486 7.22 142
PAA7 0 N/A 5.77 8.76 56.16 6.160 6.67 168
PAA8 0 N/A 5.45 19.3 34.54 1.795 9.44 122
PAA9 340 890 5.42 7.23 37.62 1.956 3.33 150
PAA10 0 N/A 6.01 14.6 41.82 2.738 7.22 152
PAA11 30 1200 5.37 9.12 44.36 3.490 5.56 152
PAA12 0 >300 5.26 18.4 65.02 2.142 8.33 62
PAA13 0 >1230 5.96 5.67 64.58 3.750 2.22 158
PAA14 0 >300 4.23 19.6 67.66 2.188 9.44 56

30
PAA/UV
Original data including log difference of generic E.coli, reduction of STEC, and
several other water parameters were recorded (See Table 4.3) The selection model for the
combined treatment indicated that UV dose, PAA concentration and turbidity significantly
explained the results of E.coli’s log difference (P<0.05). The multiple regression model was:
Log difference of E.coli= 0.09 UV dose + 0.39 PAA + 1.63 ……………….………….. (7)
which could explain 76% difference of E.coli’s UV log difference. PAA and turbidity
explained 73% and 60% of difference, respectively. 3D model based on PAA/UV real
data indicated that with the increase of UV dose and PAA, higher generic E.coli reduction
could be achieved (See Figure 4.3).
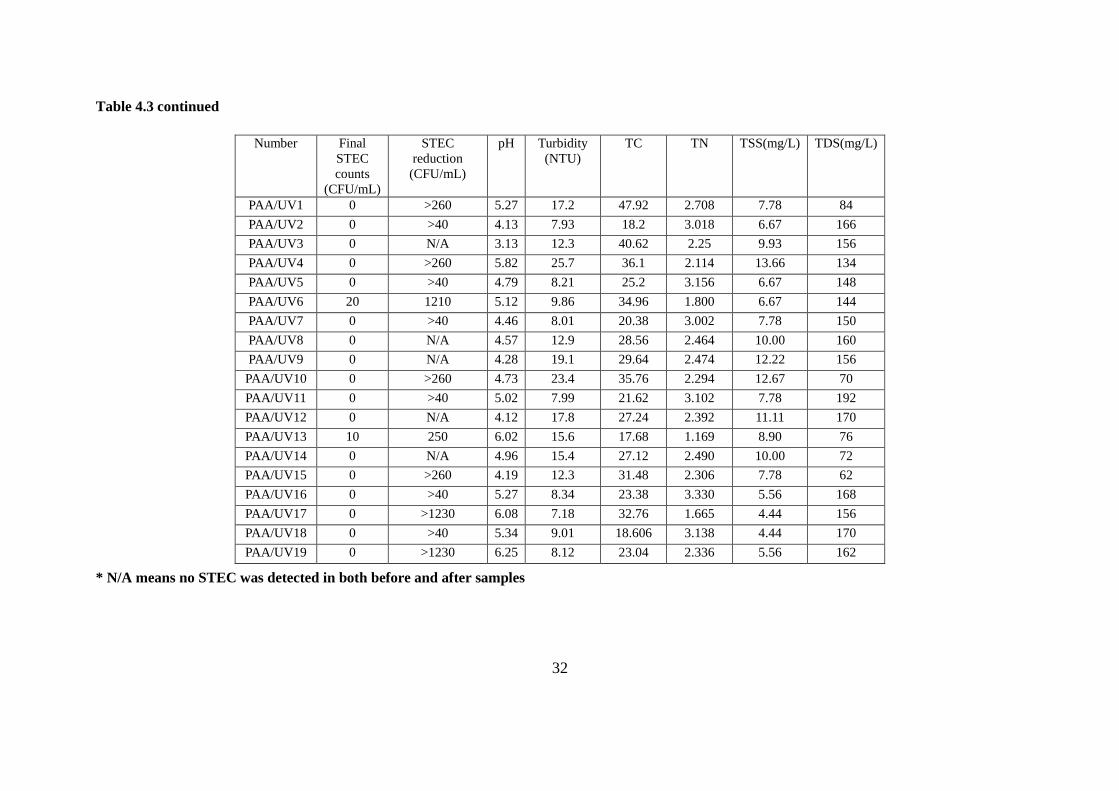
STEC data in indicated that 41.2 mJ/cm2 of UV dose with 6.2 ppm of remained PAA
(>1min CT) could achieve at least 40 CFU/mL of STEC reduction (Table 4.3).
Figure 4.3 3D plot of the experimental data from the PAA/UV experiments

31
Table 4.3 Bacterial inactivation and several water parameter values used in PAA/UV treatment
Number UV dose
(mJ/cm2)
CT
(min)
Flow
rate(gpm)
Designed
PAA (ppm)
Injection
PAA (ppm)
Final PAA
(ppm)
Log
residual
E.coli
Log
difference
of E.coli
PAA/UV1 13.830 0.34 3.91 5.00 1759.50 2.889 5.05 3.33
PAA/UV2 15.827 0.35 3.80 11.00 3762.00 6.202 4.82 4.79
PAA/UV3 15.911 0.35 3.83 4.00 1378.80 2.349 3.34 4.22
PAA/UV4 18.383 0.39 3.40 3.00 918.00 1.316 5.06 3.20
PAA/UV5 18.839 0.37 3.54 7.00 2230.20 3.482 4.90 4.69
PAA/UV6 19.166 0.43 3.11 3.00 839.70 1.037 5.07 4.20
PAA/UV7 19.405 0.39 3.42 9.00 2770.20 4.762 4.79 4.82
PAA/UV8 20.810 0.39 3.40 3.00 918.00 1.476 3.33 4.23
PAA/UV9 20.936 0.37 3.55 3.50 1118.25 1.530 3.30 4.23
PAA/UV10 21.455 0.44 3.04 2.00 547.20 0.881 5.04 3.76
PAA/UV11 23.809 0.44 3.00 5.00 1350.00 2.657 4.12 5.06
PAA/UV12 24.131 0.51 3.15 2.50 708.75 1.189 3.07 4.25
PAA/UV13 24.569 0.48 2.80 0.50 126.00 0.239 5.04 3.77
PAA/UV14 24.858 0.54 3.03 2.00 545.40 0.938 3.08 4.25
PAA/UV15 26.568 0.53 2.51 1.00 225.90 0.348 5.03 3.95
PAA/UV16 29.227 0.51 2.62 3.00 707.40 1.391 4.31 5.03
PAA/UV17 36.813 0.88 1.51 2.00 271.80 0.604 4.43 5.02
PAA/UV18 40.951 0.93 1.42 1.00 127.80 0.468 4.29 5.04
PAA/UV19 41.235 1.35 0.98 1.00 88.20 0.318 4.36 5.04
32
Table 4.3 continued
* N/A means no STEC was detected in both before and after samples
Number Final
STEC
counts
(CFU/mL)
STEC
reduction
(CFU/mL)
pH Turbidity
(NTU)
TC TN TSS(mg/L) TDS(mg/L)
PAA/UV1 0 >260 5.27 17.2 47.92 2.708 7.78 84
PAA/UV2 0 >40 4.13 7.93 18.2 3.018 6.67 166
PAA/UV3 0 N/A 3.13 12.3 40.62 2.25 9.93 156
PAA/UV4 0 >260 5.82 25.7 36.1 2.114 13.66 134
PAA/UV5 0 >40 4.79 8.21 25.2 3.156 6.67 148
PAA/UV6 20 1210 5.12 9.86 34.96 1.800 6.67 144
PAA/UV7 0 >40 4.46 8.01 20.38 3.002 7.78 150
PAA/UV8 0 N/A 4.57 12.9 28.56 2.464 10.00 160
PAA/UV9 0 N/A 4.28 19.1 29.64 2.474 12.22 156
PAA/UV10 0 >260 4.73 23.4 35.76 2.294 12.67 70
PAA/UV11 0 >40 5.02 7.99 21.62 3.102 7.78 192
PAA/UV12 0 N/A 4.12 17.8 27.24 2.392 11.11 170
PAA/UV13 10 250 6.02 15.6 17.68 1.169 8.90 76
PAA/UV14 0 N/A 4.96 15.4 27.12 2.490 10.00 72
PAA/UV15 0 >260 4.19 12.3 31.48 2.306 7.78 62
PAA/UV16 0 >40 5.27 8.34 23.38 3.330 5.56 168
PAA/UV17 0 >1230 6.08 7.18 32.76 1.665 4.44 156
PAA/UV18 0 >40 5.34 9.01 18.606 3.138 4.44 170
PAA/UV19 0 >1230 6.25 8.12 23.04 2.336 5.56 162
33
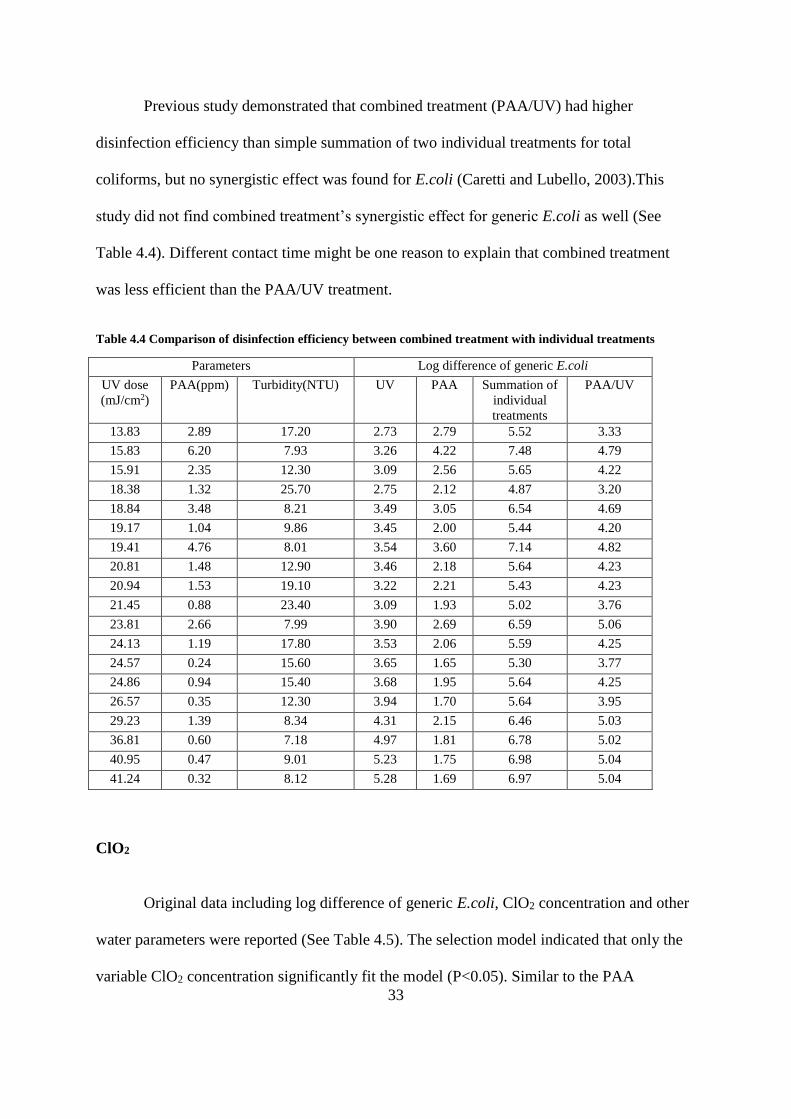
Previous study demonstrated that combined treatment (PAA/UV) had higher
disinfection efficiency than simple summation of two individual treatments for total
coliforms, but no synergistic effect was found for E.coli (Caretti and Lubello, 2003).This
study did not find combined treatment’s synergistic effect for generic E.coli as well (See
Table 4.4). Different contact time might be one reason to explain that combined treatment
was less efficient than the PAA/UV treatment.
Table 4.4 Comparison of disinfection efficiency between combined treatment with individual treatments
ClO2
Original data including log difference of generic E.coli, ClO2 concentration and other
water parameters were reported (See Table 4.5). The selection model indicated that only the
variable ClO2 concentration significantly fit the model (P<0.05). Similar to the PAA
Parameters Log difference of generic E.coli
UV dose
(mJ/cm2)
PAA(ppm) Turbidity(NTU) UV PAA Summation of
individual
treatments
PAA/UV
13.83 2.89 17.20 2.73 2.79 5.52 3.33
15.83 6.20 7.93 3.26 4.22 7.48 4.79
15.91 2.35 12.30 3.09 2.56 5.65 4.22
18.38 1.32 25.70 2.75 2.12 4.87 3.20
18.84 3.48 8.21 3.49 3.05 6.54 4.69
19.17 1.04 9.86 3.45 2.00 5.44 4.20
19.41 4.76 8.01 3.54 3.60 7.14 4.82
20.81 1.48 12.90 3.46 2.18 5.64 4.23
20.94 1.53 19.10 3.22 2.21 5.43 4.23
21.45 0.88 23.40 3.09 1.93 5.02 3.76
23.81 2.66 7.99 3.90 2.69 6.59 5.06
24.13 1.19 17.80 3.53 2.06 5.59 4.25
24.57 0.24 15.60 3.65 1.65 5.30 3.77
24.86 0.94 15.40 3.68 1.95 5.64 4.25
26.57 0.35 12.30 3.94 1.70 5.64 3.95
29.23 1.39 8.34 4.31 2.15 6.46 5.03
36.81 0.60 7.18 4.97 1.81 6.78 5.02
40.95 0.47 9.01 5.23 1.75 6.98 5.04
41.24 0.32 8.12 5.28 1.69 6.97 5.04

34
treatment model, contact time was not the objective in this study, so we cannot tell its
significance for ClO2 disinfection efficiency. The linear regression model for this treatment
can only explain 55% difference of E.coli’s log difference. Nonlinear model might be more
appropriate for ClO2 data. The nonlinear regression model was:
Log difference of generic E.coli = 0.79 ln (ClO2) + 3.49…………………………… (8)
This nonlinear regression model was able to explain 88% of difference of log difference of
generic E.coli. Higher concentration of residual ClO2 was shown to inactivate higher generic
E.coli reduction (See Figure 4.4).
STEC data indicated that as 9.92 ppm of remained ClO2 and 1min contact time could
achieve more than 20 CFU/mL of STEC reduction (see Table 4.5).
Table 4.5 Bacterial inactivation and several water parameter values used in ClO2 treatment
Number Designed
ClO2
(ppm)
Injection
of
ClO2
(ppm)
Residual
ClO2
(ppm)
Log
residual
ClO2
flow
rate
(gpm)
CT
(min)
Log
residual of
generic
E.coli
Log
reduction
of E.coli
ClO21 0.5 69.75 0.09 -2.41 1.55 1.55 3.85 0.90
ClO22 0.5 58.5 0.11 -2.21 1.3 1.3 2.91 1.16
ClO23 1 93.6 0.14 -1.97 1.04 1.28 2.71 2.41
ClO24 1 139.5 0.24 -1.43 1.55 1.55 3.81 2.76
ClO25 1 117 0.32 -1.14 1.3 1.3 2.01 2.86
ClO26 1 140.4 0.45 -0.80 1.56 1.56 4.28 3.47
ClO27 2 187.2 0.49 -0.71 1.04 1.28 0.72 2.89
ClO28 1.5 209.25 0.97 -0.03 1.55 1.55 3.54 3.56
ClO29 1.5 175.5 1.02 0.02 1.3 1.3 0.30 2.92
ClO210 3 213.3 1.13 0.12 0.79 0.79 4.01 4.08
ClO211 5 229.5 2.78 1.02 0.51 0.51 3.64 4.25
ClO212 5 513 2.81 1.03 1.14 1.14 3.64 4.05
ClO213 10 1026 4.67 1.54 1.14 1.14 4.70 4.78
ClO214 20 2052 9.92 2.29 1.14 1.14 3.01 5.04

35
Table 4.5 continued
* N/A means no STEC was detected in both before and after samples
ClO2 was found to have high disinfection efficiency at low concentration in this study.
In comparison with PAA treatment, our data showed that ClO2 treatment was more efficient
than PAA treatment at the concentration between 1 to 5 ppm (See Table 4.6).
Table 4.6 Comparison of disinfection efficiency between PAA and ClO2 treatment
Parameters Log difference of generic E.coli
PAA(ppm) ClO2(ppm) PAA ClO2
0.5 0.5 2.73 2.94
1 1 2.86 3.49
1.5 1.5 2.99 3.81
2 2 3.12 4.04
2.5 2.5 3.25 4.21
3 3 3.38 4.36
3.5 3.5 3.51 4.48
4 4 3.64 4.59
4.5 4.5 3.77 4.68
5 5 3.90 4.76
Number Final STEC
counts
(CFU/L)
Reduction of
STEC
(CFU/mL)
pH Turbidity
(NTU)
TC TN TSS
(mg/L)
TDS
(mg/L)
ClO21 10 10 7.21 8.72 11.86 1.106 3.32 134
ClO22 0 N/A 7.13 9.56 10.97 1.339 2.22 194
ClO23 0 N/A 7.2 10.2 17.07 0.7368 5.56 86
ClO24 0 >20 7.33 7.32 11.80 1.116 3.32 144
ClO25 0 N/A 7.02 8.96 10.56 1.318 3.33 168
ClO26 0 >110 7.23 8.73 10.17 1.029 4.44 82
ClO27 0 N/A 7.15 9.78 17.7 0.7074 4.44 92
ClO28 0 >20 7.07 6.95 11.69 1.073 2.22 158
ClO29 0 N/A 6.97 7.67 10.83 1.448 4.44 182
ClO210 0 >110 7.08 10.3 10.90 0.9828 5.56 84
ClO211 0 >110 6.87 11.4 11.31 1.035 6.67 84
ClO212 0 510 6.87 14.1 19.47 0.663 8.89 126
ClO213 40 560 6.7 12.5 19.6 0.6455 7.78 132
ClO214 0 >600 6.91 11.3 21.45 0.803 7.78 74

36
Figure 4.4 Nonlinear regression model for ClO2 treatment

37
Chapter 5
Conclusions and Recommendations
To investigate efficiencies of individual and combined disinfection treatments for
irrigation water, this study used microbial-contaminated water collected from a pond that
serves to water cattle at the Plateau Research and Education Center (Crossville, TN).
Additional nutrients were added to the water to culture the bacteria, thus simulate high-
polluted irrigation water. A continuous flow irrigation water disinfection (CFIWD) system
was constructed to simulate field-scale irrigation systems. Individual ultraviolet light (UV)
disinfection, peroxyacetic acid (PAA) disinfection, chlorine dioxide (ClO2) disinfection and a
combined UV/PAA treatment were tested in this CFIWD System. Generic E.coli and shiga
toxin-producing E.coli (STEC) were measured to evaluate the disinfection efficiency of each
treatment. Different water parameters (i.e. turbidity, pH, TC, TN, TSS, and TDS) were
monitored to determine any effect on the treatment potential.
For the UV inactivation experiments, UV dose and turbidity were found to be
significantly associated with the disinfection efficacy. In general, UV dose positively
impacted the disinfection efficacy, whereas turbidity had negative effect. A disinfection
efficiency model for the UV application (CFIWD System) was determined by this study. The
model can be used to adjust the UV dosage relative to source water contamination situation
and turbidity. The laboratory-scale model demonstrated that a UV radiation method can be
easily attached to an irrigation system and can be used to mitigate microbial contaminate
irrigation source water. Another advantage for UV method is that it is easy for farm workers
who may not have the skills to operate chemical injection systems. However, UV method has
two major limitations when used to treat large flow rates: the initial cost of the UV unit and
the lack of residual treatment downstream of the UV system.

38
For the evaluated water quality parameters, statistical analysis indicated that only the
PAA concentration was significantly related to the PAA disinfection efficiency. While
previous studies have shown that contact time was an important factor in determining PAA
disinfection efficiency (Sánchez et al., 1995), contact time is not an objective of this research,
so we cannot tell its importance in this study. Irrigation systems are designed to have internal
water velocities between 0.9 and 2.4 m/s - a typical system may hold a unit of water for two
minutes or less. Thus, the project decided to determine the required dosage based on very
short contact times. Some articles also found that turbidity negatively influenced the
disinfection efficiency of PAA, but this experiment did not find the relationship between
turbidity and PAA’s disinfection efficiency within the evaluated range (approximately 5 to 20
NTU). PAA treatment was able to meet the requirement of FDA and higher PAA rates could
achieve higher inactivation levels of generic E.coli, but the additional acid reduced the
irrigation water pH and thus might result in damaging plant’s root and soil acidification.
As a means of improving disinfection efficiency and reducing chemical inputs, the
combined PAA/UV treatment was tested in this study. Synergistic effect of the combined
treatment came from the generation of hydroxyl radicals (Rajala-Mustonen et al., 1997;
Lubello et al., 2002; Caretti and Lubello, 2003; Koivunen and Heinonen-Tanski, 2005). The
disinfection model in this study showed that PAA rate and UV dose positively impacted the
disinfection efficiency. In comparison with simple summation of individual PAA and UV
treatment, the combined treatment did not show synergistic effect on inactivating generic
E.coli (See Table 4.4). Caretti and Lubello (2003) demonstrated that conducting PAA before
UV treatment had synergistic effect on inactivating total coliforms, but not on E.coli. This
study might partially confirm their conclusion. Contact time might be another reason to
39
explain that combined treatment was less effective than summation of two individual
treatments.
Chlorine dioxide (ClO2) was another disinfectant investigated by this study. The
statistical model showed that the ClO2 rate had a significant impact on its disinfection
efficiency. Analogous to PAA treatment, contact time was held relatively constant during this
investigation, so we cannot tell its importance in this study. In comparison with PAA
treatment, ClO2 seemed to have higher disinfection efficacy than PAA treatment (See Table
4.6). Maybe, this is because ClO2 solution has more free radicals than PAA, especially at low
concentration. Although chlorine dioxide has strong disinfection capacity, it is quite volatile
when exposed to ultraviolet light and it must be manufactured onsite. Furthermore,
disinfection byproduct (DBP) (i.e, chlorate and chlorine gas) might be generated as well
when exposed to ultraviolet light (DID, 2006).
At this time, FDA has no specific limits for Shiga toxin-producing E.coli (STEC), but
it should be completely eliminated in the irrigation water to minimize potential outbreaks.
Either the individual or combined treatments were able to eliminate STEC, but for the sake of
eliminating all STEC and economically cut the cost, combined treatment PAA/UV is highly
recommended, using an UV dosage of 41.2mJ/cm2 of UV and 6.2 ppm PAA (CT>1min).
The results of our study should be considered preliminary data on continuous flow
irrigation water disinfection system (CFIWD System). More experiments in the laboratory
and in the field need to be conducted to further refine the use of disinfection methods on
CFIWD Systems. In addition, many questions still remained, such as how much pathogens
are transferred to the surface of produce, how the chemical’s residuals impact the growth of
the plants, and whether these disinfectants were able to eliminate plant pathogens from
irrigation water.

40
List of References
41
Alasri, A., Roques, C., Michel, G., Cabassud, C., Aptel, P., 1992. Bactericidal properties of
peracetic acid and hydrogen peroxide, alone and in combination, and chlorine and
formaldehyde against bacterial water strains. Canadian journal of microbiology 38, 635-642.
APHA. 2005. Standard methods for examination of water and wastewater. American Public
Health Association, Washington, DC.
Barbeau, B., Desjardins, R., Mysore, C., Prévost, M., 2005a. Impacts of water quality on
chlorine and chlorine dioxide efficacy in natural waters. Water Research 39, 2024-2033.
Barbeau, B., Huffman, D., Mysore, C., Desjardins, R., Clément, B., & Prévost, M. (2005).
Examination of discrete and counfounding effects of water quality parameters during the
inactivation of MS2 phages and Bacillus subtilis spores with chlorine dioxide. Journal of
Environmental Engineering and Science, 4(2), 139-151.
Batz, M.B., Hoffmann, S., Morris Jr, J.G., 2012. Ranking the disease burden of 14 pathogens
in food sources in the United States using attribution data from outbreak investigations and
expert elicitation. Journal of Food Protection 75, 1278-1291.
Benarde, M.A., Israel, B.M., Olivieri, V.P., Granstrom, M.L., 1965. Efficiency of chlorine
dioxide as a bactericide. Applied Microbiology 13, 776-780.
Bergmann, H., Koparal, S., 2005. The formation of chlorine dioxide in the electrochemical
treatment of drinking water for disinfection. Electrochimica acta 50, 5218-5228.
Boyce, D.S., Sproul, O.J., Buck, C., 1981. The effect of bentonite clay on ozone disinfection
of bacteria and viruses in water. Water Research 15, 759-767.
Cantwell, R.E., Hofmann, R., 2008. Inactivation of indigenous coliform bacteria in unfiltered
surface water by ultraviolet light. Water research 42, 2729-2735.
Caretti, C., Lubello, C., 2003. Wastewater disinfection with PAA and UV combined
treatment: a pilot plant study. Water Research 37, 2365-2371.
Chang, J.C., Ossoff, S.F., Lobe, D.C., Dorfman, M.H., Dumais, C.M., Qualls, R.G., Johnson,
J.D., 1985. UV inactivation of pathogenic and indicator microorganisms. Applied and
Environmental Microbiology 49, 1361-1365.
Christensen, J., Linden, K., 2001. Ultraviolet disinfection of unfiltered drinking water:
particle impacts. Conference proceedings of first international congress on UV technologies,
pp. 14-16.
Davies, L.R., Treadwell, D.D., Alligood, M.R., Cantliffe, D.J., 2010. Chlorine Dioxide as a
Sanitizer for Closed Loop Irrigation Systems in Bell Pepper. HortScience. Amer
Sochorticultural Science 113 S West St, STE200, Alexandria, VA 22314-2851 USA, pp. 515-
515.

42
Dell'Erba, A., Falsanisi, D., Liberti, L., Notarnicola, M., Santoro, D., 2004. Disinfecting
behaviour of peracetic acid for municipal wastewater reuse. Desalination 168, 435-442.
DID, 2006. Revised environmental assessment for chlorine dioxide food-contact notification
Ashland Specialty Chemical Company, Covington, KY.
EPA, 1999. Alternative disinfectants and oxidants Guidance Manual. EPA 815-R-99-014.
Disinfectant Use in Water Treatment, Washington, DC.
EPA, 2006. UV Disinfection Guidance Manual., EPA 815-R-06-007, Washington, DC.
Food and Drug Administration, 2013. Standards for the Growing, Harvesting, Packing, and
Holding of Produce for Human Consumption; Proposed Rule., Rockville, MD.
Gazit, E., 2007. Self-assembled peptide nanostructures: the design of molecular building
blocks and their technological utilization. Chemical Society Reviews 36, 1263-1269.
Gehr, R., Cochrane, D., 2002. Peracetic acid (PAA) as a disinfectant for municipal
wastewaters: encouraging performance results from physicochemical as well as biological
effluents. Proceedings of the Water Environment Federation 2002, 182-198.
Gehr, R., Wagner, M., Veerasubramanian, P., Payment, P., 2003. Disinfection efficiency of
peracetic acid, UV and ozone after enhanced primary treatment of municipal wastewater.
Water Research 37, 4573-4586.
Ghadiri, M.R., Granja, J.R., Milligan, R.A., McRee, D.E., Khazanovich, N., 1993. Self-
assembling organic nanotubes based on a cyclic peptide architecture. Nature 366, 324 - 327
Jones, L.A., Worobo, R.W., Smart, C.D., 2014. UV Light Inactivation of Human and Plant
Pathogens in Unfiltered Surface Irrigation Water. Applied and Environmental Microbiology
80, 849-854.
Kerwick, M. I., et al. "Electrochemical disinfection, an environmentally acceptable method of
drinking water disinfection?." Electrochimica Acta 50.25 (2005): 5270-5277.
Kitis, M., 2004. Disinfection of wastewater with peracetic acid: a review. Environment
International 30, 47-55.
Koivunen, J., Heinonen-Tanski, H., 2005. Inactivation of enteric microorganisms with
chemical disinfectants, UV irradiation and combined chemical/UV treatments. Water
Research 39, 1519-1526.
López-Velasco, G., Tomás-Callejas, A., Sbodio, A., Artés-Hernández, F., Suslow, T.V., 2012.
Chlorine dioxide dose, water quality and temperature affect the oxidative status of tomato
processing water and its ability to inactivate Salmonella. Food Control 26, 28-35.

43
Lazarova, V., Janex, M., Fiksdal, L., Oberg, C., Barcina, I., Pommepuy, M., 1998. Advanced
wastewater disinfection technologies: short and long term efficiency. Water Science &
Technology 38, 109-117.
Li, Q., Mahendra, S., Lyon, D.Y., Brunet, L., Liga, M.V., Li, D., Alvarez, P.J., 2008.
Antimicrobial nanomaterials for water disinfection and microbial control: potential
applications and implications. Water Research 42, 4591-4602.
Lubello, C., Caretti, C., Gori, R., 2002. Comparison between PAA/UV and H2O2/UV
disinfection for wastewater reuse. Water Supply 2, 205-212.
Milly, P., Toledo, R., Chen, J., Kazem, B., 2007. Hydrodynamic cavitation to improve bulk
fluid to surface mass transfer in a nonimmersed ultraviolet system for minimal processing of
opaque and transparent fluid foods. Journal of Food Science 72, M407-M413.
Munoz, A., Craik, S., Kresta, S., 2007. Computational fluid dynamics for predicting
performance of ultraviolet disinfection sensitivity to particle tracking inputs. Journal of
Environmental Engineering and Science 6, 285-301.
Munter, R., 2001. Advanced oxidation processes–current status and prospects. Proc. Estonian
Acad. Sci. Chem 50, 59-80.
Narkis, N., Armon, R., Offer, R., Orshansky, F., Friedland, E., 1995. Effect of suspended
solids on wastewater disinfection efficiency by chlorine dioxide. Water Research 29, 227-236.
Oppenheimer, J. T. Gillogly, G.Stolarik, and R.Ward., 2002. Comparing Efficiency of Low
and Medium Pressure UV Light for Inactivating Giardia muris and Cryptosporidium parvum
in Waters With Low and High Levels of Turbidity., Proc. AWWA Ann. Conf., New Orlean.
Qi, L., Xu, Z., Jiang, X., Hu, C., Zou, X., 2004. Preparation and antibacterial activity of
chitosan nanoparticles. Carbohydrate Research 339, 2693-2700.
Qualls, R.G., Flynn, M.P., Johnson, J.D., 1983. The role of suspended particles in ultraviolet
disinfection. Journal (Water Pollution Control Federation), 1280-1285.
Rabea, E.I., Badawy, M.E.-T., Stevens, C.V., Smagghe, G., Steurbaut, W., 2003.
Chitosan as antimicrobial agent: applications and mode of action. Biomacromolecules 4,
1457-1465.
Rajala-Mustonen, R., Toivola, P., Heinonen-Tanski, H., 1997. Effects of peracetic acid and
UV irradiation on the inactivation of coliphages in wastewater. Water Science & Technology
35, 237-241.
Rizvi, H., Ahmad, N., Yasar, A., Bukhari, K., Khan, H., 2013. Disinfection of UASB-Treated
Municipal Wastewater by H2O2, UV, Ozone, PAA, H2O2/Sunlight, and Advanced Oxidation
Processes: Regrowth Potential of Pathogens. Polish Journal of Environmental Studies 22,
1153.
44
Sánchez-Ruiz, C., Martínez-Royano, S., Tejero-Monzón, I., 1995. An evaluation of the
efficiency and impact of raw wastewater disinfection with peracetic acid prior to ocean
discharge. Water Science & Technology 32, 159-166.
Springthorpe, S., Sander, M., Nolan, K., Sattar, S., 2001. Comparison of static and dynamic
disinfection models for bacteria and viruses in water of varying quality. Water Science &
Technology 43, 147-154.
Stampi, S., De Luca, G., Zanetti, F., 2001. Evaluation of the efficiency of peracetic acid in
the disinfection of sewage effluents. Journal of Applied Microbiology 91, 833-838.
Steele, M., Odumeru, J., 2004. Irrigation water as source of foodborne pathogens on fruit and
vegetables. Journal of Food Protection 67, 2839-2849.
Tomás-Callejas, A., López-Gálvez, F., Sbodio, A., Artés, F., Artés-Hernández, F., Suslow,
T.V., 2012. Chlorine dioxide and chlorine effectiveness to prevent Escherichia coli O157: H7
and Salmonella cross-contamination on fresh-cut Red Chard. Food Control 23, 325-332.
United States Department of Agriculture, 2013. Agricultural Statistics, National Agricultural
Statistics Service. Available at:
http://www.nass.usda.gov/Publications/Ag_Statistics/2013/index.asp
USDA NASS, 2008 Census of Agriculture, Ag Census Web Maps. Available at:
www.agcensus.usda.gov/Publications/2008/Online_Resources/Ag_Census_Web_Maps/Over
view/.
Wang, X., Hu, X., Hu, C., Wei, D., 2011. Sequential use of ultraviolet light and chlorine for
reclaimed water disinfection. Journal of Environmental Sciences 23, 1605-1610.
Wang, X., Hu, X., Wang, H., Hu, C., 2012. Synergistic effect of the sequential use of UV
irradiation and chlorine to disinfect reclaimed water. water research 46, 1225-1232.
Wick, P., Manser, P., Limbach, L.K., Dettlaff-Weglikowska, U., Krumeich, F., Roth, S.,
Stark, W.J., Bruinink, A., 2007. The degree and kind of agglomeration affect carbon
nanotube cytotoxicity. Toxicology Letters 168, 121-131.
Zhu, X., Zhou, J., Cai, Z., 2011. TiO2 nanoparticles in the marine environment: Impact on the
toxicity of tributyltin to abalone (Haliotis diversicolor supertexta) embryos. Environmental
Science & Technology 45, 3753-3758.

45
Appendix

46
Water samples collected from Plateau Station (2014)
Sample
Date
Number of
E.coli(MPN/100mL)
Turbidity(NTU)
19-May 110 29.4
19-May 116.9 30.5
27-May 686.7 30
27-May 478.6 32.5
2-Jun 648.8 25.8
2-Jun 686.7 28.3
2-Jun 686.7 24.5
20-Jun 121.3 24.9
20-Jun 199.7 47.5
20-Jun 221.1 30.9
10-Jul 360.9 16.4
10-Jul 416 16.6
10-Jul 285.1 16.4
17-Jul 689.3 28.7
17-Jul 549.3 27.2
17-Jul 501.2 28.2
31-Jul 791.5 30.3
31-Jul 601.5 29.4
31-Jul 387.7 26.4
14-Aug 1 6.67
14-Aug 2 6.94
14-Aug 1 6.9
28-Aug 574.8 12.3
28-Aug 601.5 14.5
28-Aug 629.4 13.2
4-Sep 17.3 10.7
4-Sep 15.8 7.56
4-Sep 19.7 3.43
12-Sep 118.7 6.85
12-Sep 137.6 8.18
12-Sep 101.9 7.15
18-Sep 1 6.11
18-Sep <1 7.28
18-Sep 2 8.03
25-Sep 3 6.26
2-Oct <1 6.02

47
UV treatment
SAS codes
Multiple regression
title 'Multiple regression for UV treatment';
data UV;
input Dose Reduction pH Turbidity TC TN TSS TDS;
label Dose='UV dose(mJ/cm2)'
Reduction='Log E.coli Reduction'
Turbidity='Turbidity(NTU)'
pH='pH'
TC='Total carbon'
TN='Total nitrogen'
TSS='Total suspended solids'
TDS='Total Dissolved solids';
datalines;
0.00 0.00 7.04 15.90 8.75 1.56 12.22 246.00
0.00 0.00 7.02 10.40 11.74 1.13 6.33 78.00
0.00 0.00 7.04 20.50 15.05 1.14 15.55 140.00
0.00 0.00 7.38 10.40 16.84 0.65 7.78 148.00
0.00 0.00 6.80 9.15 18.12 0.78 5.56 182.00
0.00 0.00 7.01 22.30 23.41 1.31 10.00 141.00
10.60 2.99 6.97 7.89 11.94 1.19 4.44 172.00
12.96 2.64 6.98 19.70 19.64 2.09 8.10 153.00
14.98 3.42 7.04 8.13 12.05 1.29 5.56 78.00
16.24 3.45 7.17 9.01 21.01 0.75 3.33 162.00
22.80 3.18 7.02 15.10 20.13 2.01 6.70 174.00
25.71 3.96 7.12 14.70 8.84 1.52 18.89 160.00
27.71 4.16 7.11 15.70 9.07 1.53 8.89 166.00
27.75 4.26 7.34 8.78 20.83 0.76 3.33 144.00
34.77 4.99 7.33 14.50 14.68 1.21 7.78 148.00
37.07 5.00 7.03 13.60 9.09 1.42 10.00 178.00
37.94 5.08 7.21 6.43 20.09 0.90 2.22 140.00
38.50 5.00 7.01 12.30 8.93 1.52 7.78 174.00
40.49 5.02 7.12 21.30 15.22 1.16 12.22 136.00
;
proc phreg data=UV;
model Reduction= Dose pH Turbidity pH TC TN TSS TDS/selection=stepwise
slentry=0.08 slstay=0.05 details;
run;
%include '//client/c:\danda.sas';
%reg(UV, Reduction, Dose Turbidity);
run;
goptions reset=all cback=white border htitle=12pt htext=10pt;
title'E.coli reduction for UV treatment';
footnote j=1 'Source: Tianju Chang';
proc g3grid data=UV out=UV1;
grid Dose*Turbidity=Reduction/ axis1=0 to 50 by 0.5
axis2=0 to 30 by 0.5;
run;
proc g3d data=UV1;
plot Dose*Turbidity=Reduction/rotate=45 tilt=60 grid;
run;

48
Surface response using ridge analysis
title 'Response surface regression using ridge analysis for UV treatment';
data UV;
input Dose Reduction pH Turbidity TC TN TSS TDS;
label Dose='UV dose(mJ/cm2)'
Reduction='Log E.coli Reduction'
Turbidity='Turbidity(NTU)'
pH='pH'
TC='Total carbon'
TN='Total nitrogen'
TSS='Total suspended solids'
TDS='Total Dissolved solids';
datalines;
0.00 0.00 7.04 15.90 8.75 1.56 12.22 246.00
0.00 0.00 7.02 10.40 11.74 1.13 6.33 78.00
0.00 0.00 7.04 20.50 15.05 1.14 15.55 140.00
0.00 0.00 7.38 10.40 16.84 0.65 7.78 148.00
0.00 0.00 6.80 9.15 18.12 0.78 5.56 182.00
0.00 0.00 7.01 22.30 23.41 1.31 10.00 141.00
10.60 2.99 6.97 7.89 11.94 1.19 4.44 172.00
12.96 2.64 6.98 19.70 19.64 2.09 8.10 153.00
14.98 3.42 7.04 8.13 12.05 1.29 5.56 78.00
16.24 3.45 7.17 9.01 21.01 0.75 3.33 162.00
22.80 3.18 7.02 15.10 20.13 2.01 6.70 174.00
25.71 3.96 7.12 14.70 8.84 1.52 18.89 160.00
27.71 4.16 7.11 15.70 9.07 1.53 8.89 166.00
27.75 4.26 7.34 8.78 20.83 0.76 3.33 144.00
34.77 4.99 7.33 14.50 14.68 1.21 7.78 148.00
37.07 5.00 7.03 13.60 9.09 1.42 10.00 178.00
37.94 5.08 7.21 6.43 20.09 0.90 2.22 140.00
38.50 5.00 7.01 12.30 8.93 1.52 7.78 174.00
40.49 5.02 7.12 21.30 15.22 1.16 12.22 136.00
;
proc phreg data=UV;
model Reduction= Dose pH Turbidity pH TC TN TSS TDS/selection=stepwise
slentry=0.08 slstay=0.05 details;
run;
ods graphics on;
proc rsreg data=UV plots=(ridge surface);
model Reduction= Dose Turbidity;
ridge max;
run;
ods graphics off;
SAS outputs

49
Multiple regression
Response surface with ridge analysis
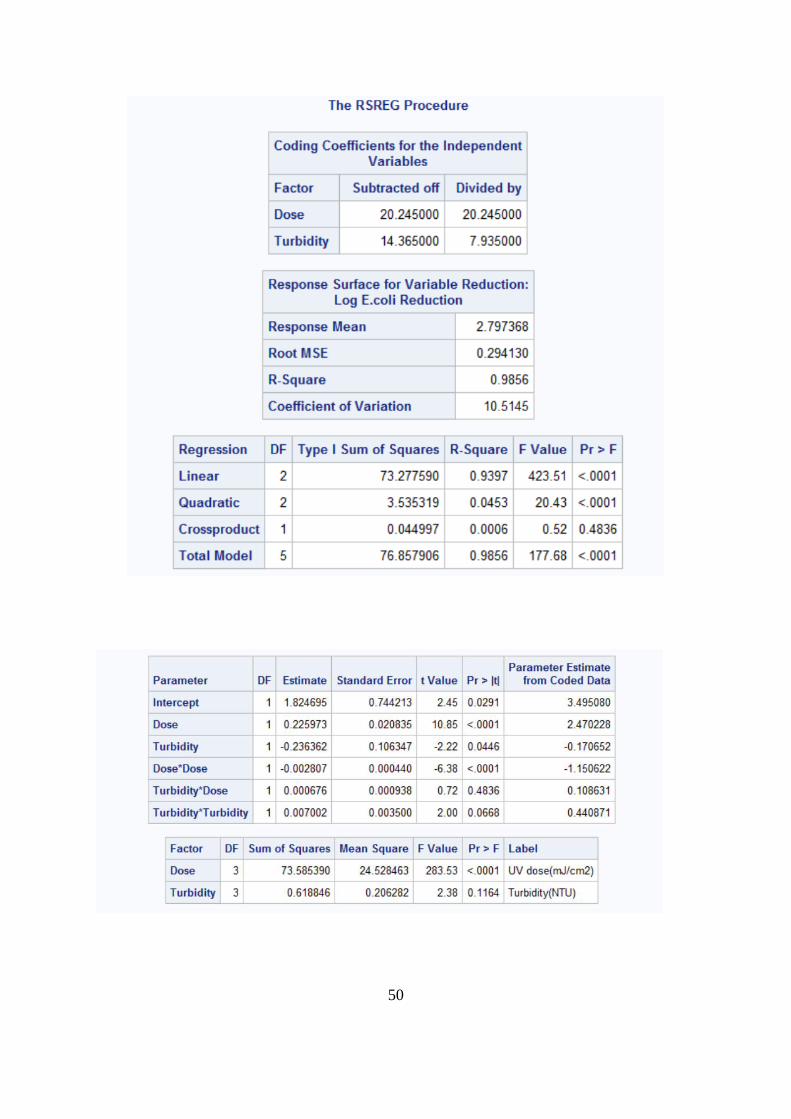
50

51
PAA
SAS codes title 'Selection regression model for PAA treatment';
data PAA;
input Rate CT Reduction pH Turbidity TC TN TSS TDS;
label Rate='PAA Rate(ppm)'
CT='Contact Time'
Reduction='Log difference of E.coli'
Turbidity='Turbidity(NTU)'
TC='Total Carbon'
TN='Total Nitrogen'
TSS='Total Suspended Solids(mg/L)'
TDS='Total Disolved Solids(mg/L)';
datalines;
0.54866748 1.3 2.694605199 6.84 7.23 54.32 6.078 4.44 186
0.82393788 1.3 2.762453482 6.09 7.88 51.1 5.908 5.56 172
1.54638272 1.3 2.840231595 5.77 8.76 56.16 6.160 6.67 168
0.41804348 1.1075 2.369215857 6.64 21.4 25.04 1.739 11.11 164
1.06789232 1.1075 2.760949951 6.03 17.5 34.14 1.708 8.70 142
2.38834112 1.1075 2.936614262 5.45 19.3 34.54 1.795 9.44 122
2.11227708 1.0925 3.477121255 5.42 7.23 37.62 1.956 3.33 150
4.93582592 1.0925 4.745465169 5.37 9.12 44.36 3.490 5.56 152
10.07363568 1.0925 5.021809277 5.96 5.67 64.58 3.750 2.22 158

52
4.36261232 1.1775 4.555547862 5.26 18.4 65.02 2.142 8.33 62
10.67025392 1.1775 5.010670899 4.23 19.6 67.66 2.188 9.44 56
0.64491008 1.225 2.609594409 4.76 15.8 27.64 2.464 8.33 60
1.231023 1.225 2.828015064 5.32 13.6 28.04 2.486 7.22 142
2.44522352 1.225 3.203848464 6.01 14.6 41.82 2.738 7.22 152
;
proc phreg data=PAA;
model Reduction=Rate CT pH Turbidity TC TN TSS TDS/selection=stepwise
slentry=0.08 slstay=0.05 details;
run;
%include '//client/c:\danda.sas';
title 'Regression Model for PAA treatment';
%reg(PAA, Reduction, Rate);
run;
SAS outputs
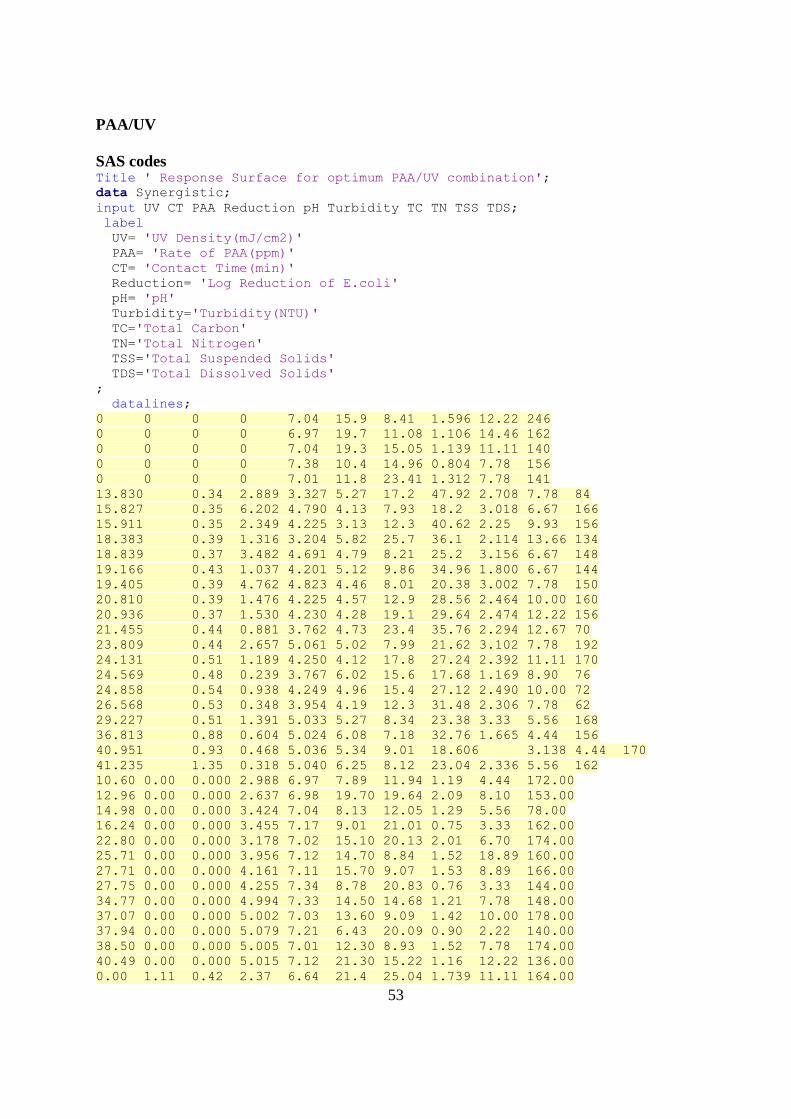
53
PAA/UV
SAS codes Title ' Response Surface for optimum PAA/UV combination';
data Synergistic;
input UV CT PAA Reduction pH Turbidity TC TN TSS TDS;
label
UV= 'UV Density(mJ/cm2)'
PAA= 'Rate of PAA(ppm)'
CT= 'Contact Time(min)'
Reduction= 'Log Reduction of E.coli'
pH= 'pH'
Turbidity='Turbidity(NTU)'
TC='Total Carbon'
TN='Total Nitrogen'
TSS='Total Suspended Solids'
TDS='Total Dissolved Solids'
;
datalines;
0 0 0 0 7.04 15.9 8.41 1.596 12.22 246
0 0 0 0 6.97 19.7 11.08 1.106 14.46 162
0 0 0 0 7.04 19.3 15.05 1.139 11.11 140
0 0 0 0 7.38 10.4 14.96 0.804 7.78 156
0 0 0 0 7.01 11.8 23.41 1.312 7.78 141
13.830 0.34 2.889 3.327 5.27 17.2 47.92 2.708 7.78 84
15.827 0.35 6.202 4.790 4.13 7.93 18.2 3.018 6.67 166
15.911 0.35 2.349 4.225 3.13 12.3 40.62 2.25 9.93 156
18.383 0.39 1.316 3.204 5.82 25.7 36.1 2.114 13.66 134
18.839 0.37 3.482 4.691 4.79 8.21 25.2 3.156 6.67 148
19.166 0.43 1.037 4.201 5.12 9.86 34.96 1.800 6.67 144
19.405 0.39 4.762 4.823 4.46 8.01 20.38 3.002 7.78 150
20.810 0.39 1.476 4.225 4.57 12.9 28.56 2.464 10.00 160
20.936 0.37 1.530 4.230 4.28 19.1 29.64 2.474 12.22 156
21.455 0.44 0.881 3.762 4.73 23.4 35.76 2.294 12.67 70
23.809 0.44 2.657 5.061 5.02 7.99 21.62 3.102 7.78 192
24.131 0.51 1.189 4.250 4.12 17.8 27.24 2.392 11.11 170
24.569 0.48 0.239 3.767 6.02 15.6 17.68 1.169 8.90 76
24.858 0.54 0.938 4.249 4.96 15.4 27.12 2.490 10.00 72
26.568 0.53 0.348 3.954 4.19 12.3 31.48 2.306 7.78 62
29.227 0.51 1.391 5.033 5.27 8.34 23.38 3.33 5.56 168
36.813 0.88 0.604 5.024 6.08 7.18 32.76 1.665 4.44 156
40.951 0.93 0.468 5.036 5.34 9.01 18.606 3.138 4.44 170
41.235 1.35 0.318 5.040 6.25 8.12 23.04 2.336 5.56 162
10.60 0.00 0.000 2.988 6.97 7.89 11.94 1.19 4.44 172.00
12.96 0.00 0.000 2.637 6.98 19.70 19.64 2.09 8.10 153.00
14.98 0.00 0.000 3.424 7.04 8.13 12.05 1.29 5.56 78.00
16.24 0.00 0.000 3.455 7.17 9.01 21.01 0.75 3.33 162.00
22.80 0.00 0.000 3.178 7.02 15.10 20.13 2.01 6.70 174.00
25.71 0.00 0.000 3.956 7.12 14.70 8.84 1.52 18.89 160.00
27.71 0.00 0.000 4.161 7.11 15.70 9.07 1.53 8.89 166.00
27.75 0.00 0.000 4.255 7.34 8.78 20.83 0.76 3.33 144.00
34.77 0.00 0.000 4.994 7.33 14.50 14.68 1.21 7.78 148.00
37.07 0.00 0.000 5.002 7.03 13.60 9.09 1.42 10.00 178.00
37.94 0.00 0.000 5.079 7.21 6.43 20.09 0.90 2.22 140.00
38.50 0.00 0.000 5.005 7.01 12.30 8.93 1.52 7.78 174.00
40.49 0.00 0.000 5.015 7.12 21.30 15.22 1.16 12.22 136.00
0.00 1.11 0.42 2.37 6.64 21.4 25.04 1.739 11.11 164.00
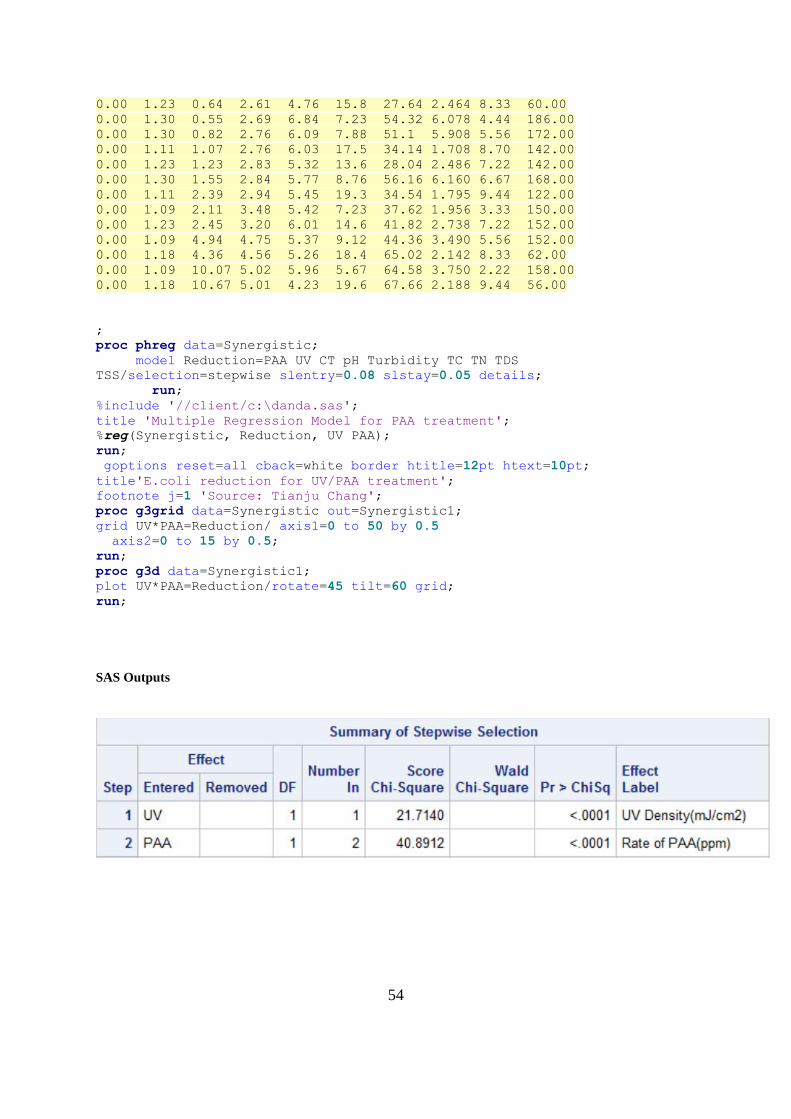
54
0.00 1.23 0.64 2.61 4.76 15.8 27.64 2.464 8.33 60.00
0.00 1.30 0.55 2.69 6.84 7.23 54.32 6.078 4.44 186.00
0.00 1.30 0.82 2.76 6.09 7.88 51.1 5.908 5.56 172.00
0.00 1.11 1.07 2.76 6.03 17.5 34.14 1.708 8.70 142.00
0.00 1.23 1.23 2.83 5.32 13.6 28.04 2.486 7.22 142.00
0.00 1.30 1.55 2.84 5.77 8.76 56.16 6.160 6.67 168.00
0.00 1.11 2.39 2.94 5.45 19.3 34.54 1.795 9.44 122.00
0.00 1.09 2.11 3.48 5.42 7.23 37.62 1.956 3.33 150.00
0.00 1.23 2.45 3.20 6.01 14.6 41.82 2.738 7.22 152.00
0.00 1.09 4.94 4.75 5.37 9.12 44.36 3.490 5.56 152.00
0.00 1.18 4.36 4.56 5.26 18.4 65.02 2.142 8.33 62.00
0.00 1.09 10.07 5.02 5.96 5.67 64.58 3.750 2.22 158.00
0.00 1.18 10.67 5.01 4.23 19.6 67.66 2.188 9.44 56.00
;
proc phreg data=Synergistic;
model Reduction=PAA UV CT pH Turbidity TC TN TDS
TSS/selection=stepwise slentry=0.08 slstay=0.05 details;
run;
%include '//client/c:\danda.sas';
title 'Multiple Regression Model for PAA treatment';
%reg(Synergistic, Reduction, UV PAA);
run;
goptions reset=all cback=white border htitle=12pt htext=10pt;
title'E.coli reduction for UV/PAA treatment';
footnote j=1 'Source: Tianju Chang';
proc g3grid data=Synergistic out=Synergistic1;
grid UV*PAA=Reduction/ axis1=0 to 50 by 0.5
axis2=0 to 15 by 0.5;
run;
proc g3d data=Synergistic1;
plot UV*PAA=Reduction/rotate=45 tilt=60 grid;
run;
SAS Outputs

55
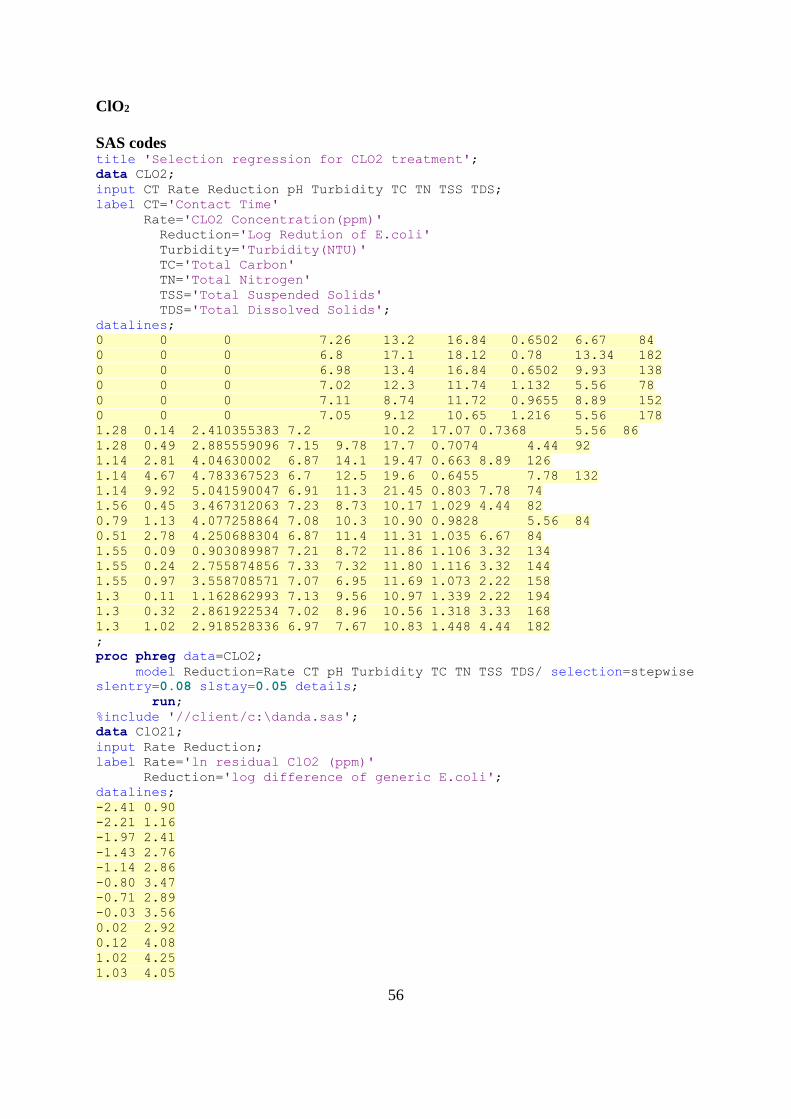
56
ClO2
SAS codes title 'Selection regression for CLO2 treatment';
data CLO2;
input CT Rate Reduction pH Turbidity TC TN TSS TDS;
label CT='Contact Time'
Rate='CLO2 Concentration(ppm)'
Reduction='Log Redution of E.coli'
Turbidity='Turbidity(NTU)'
TC='Total Carbon'
TN='Total Nitrogen'
TSS='Total Suspended Solids'
TDS='Total Dissolved Solids';
datalines;
0 0 0 7.26 13.2 16.84 0.6502 6.67 84
0 0 0 6.8 17.1 18.12 0.78 13.34 182
0 0 0 6.98 13.4 16.84 0.6502 9.93 138
0 0 0 7.02 12.3 11.74 1.132 5.56 78
0 0 0 7.11 8.74 11.72 0.9655 8.89 152
0 0 0 7.05 9.12 10.65 1.216 5.56 178
1.28 0.14 2.410355383 7.2 10.2 17.07 0.7368 5.56 86
1.28 0.49 2.885559096 7.15 9.78 17.7 0.7074 4.44 92
1.14 2.81 4.04630002 6.87 14.1 19.47 0.663 8.89 126
1.14 4.67 4.783367523 6.7 12.5 19.6 0.6455 7.78 132
1.14 9.92 5.041590047 6.91 11.3 21.45 0.803 7.78 74
1.56 0.45 3.467312063 7.23 8.73 10.17 1.029 4.44 82
0.79 1.13 4.077258864 7.08 10.3 10.90 0.9828 5.56 84
0.51 2.78 4.250688304 6.87 11.4 11.31 1.035 6.67 84
1.55 0.09 0.903089987 7.21 8.72 11.86 1.106 3.32 134
1.55 0.24 2.755874856 7.33 7.32 11.80 1.116 3.32 144
1.55 0.97 3.558708571 7.07 6.95 11.69 1.073 2.22 158
1.3 0.11 1.162862993 7.13 9.56 10.97 1.339 2.22 194
1.3 0.32 2.861922534 7.02 8.96 10.56 1.318 3.33 168
1.3 1.02 2.918528336 6.97 7.67 10.83 1.448 4.44 182
;
proc phreg data=CLO2;
model Reduction=Rate CT pH Turbidity TC TN TSS TDS/ selection=stepwise
slentry=0.08 slstay=0.05 details;
run;
%include '//client/c:\danda.sas';
data ClO21;
input Rate Reduction;
label Rate='ln residual ClO2 (ppm)'
Reduction='log difference of generic E.coli';
datalines;
-2.41 0.90
-2.21 1.16
-1.97 2.41
-1.43 2.76
-1.14 2.86
-0.80 3.47
-0.71 2.89
-0.03 3.56
0.02 2.92
0.12 4.08
1.02 4.25
1.03 4.05

57
1.54 4.78
2.29 5.04
%reg( ClO21, Reduction, Rate);
run;
SAS outputs

58
Vita
Tianju Chang was born in Chendu, China. He graduated from Liewu High School in
Chengdu, China. He got his bachelor degree in China Agricultural University. He entered
University of Tennessee in 2013. He was pursing his master degree in Biosystems
Engineering Technology and his minor degree in Statistics.