3. Laboratory Test Results 3.1 Overall
40
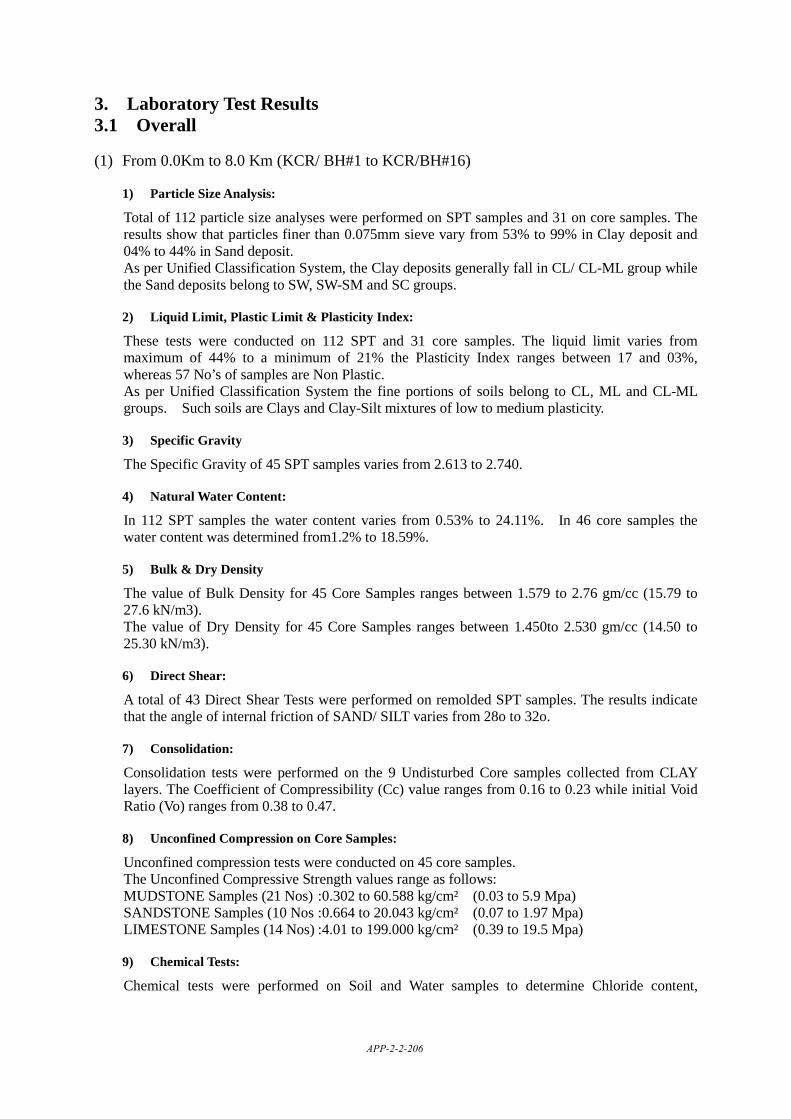
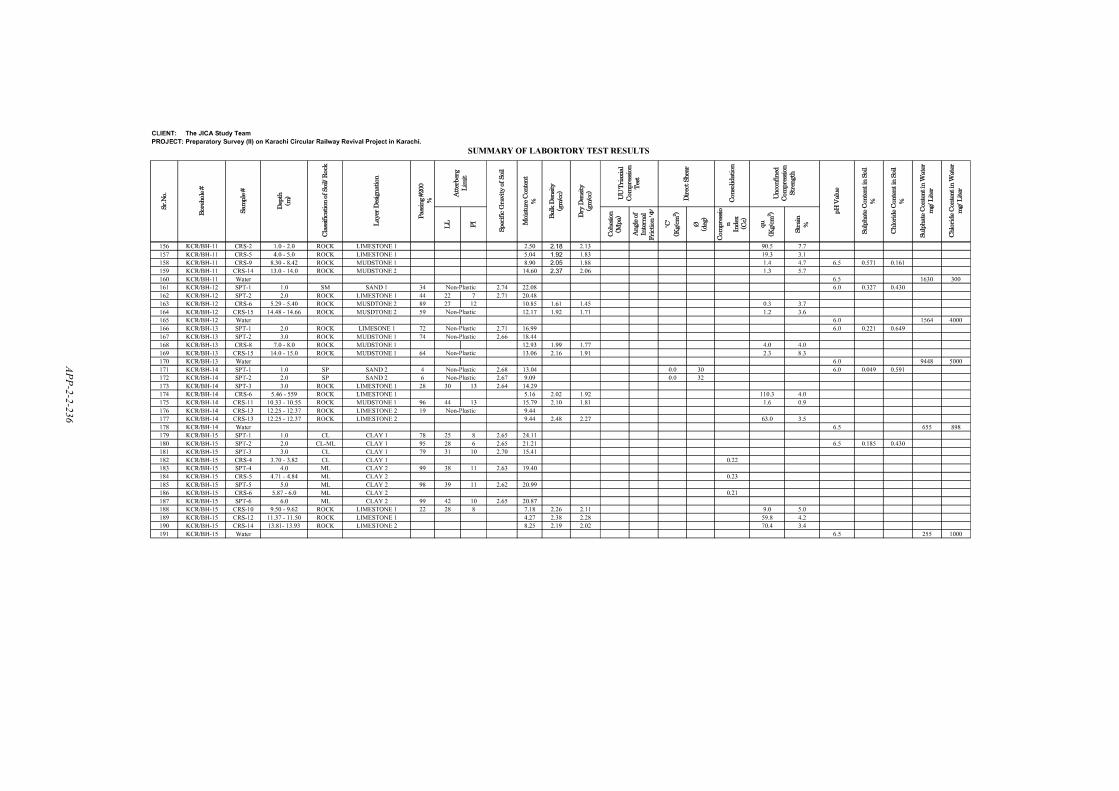
3. Laboratory Test Results 3.1 Overall (1) From 0.0Km to 8.0 Km (KCR/ BH#1 to KCR/BH#16) 1) Particle Size Analysis: Total of 112 particle size analyses were performed on SPT samples and 31 on core samples. The results show that particles finer than 0.075mm sieve vary from 53% to 99% in Clay deposit and 04% to 44% in Sand deposit. As per Unified Classification System, the Clay deposits generally fall in CL/ CL-ML group while the Sand deposits belong to SW, SW-SM and SC groups. 2) Liquid Limit, Plastic Limit & Plasticity Index: These tests were conducted on 112 SPT and 31 core samples. The liquid limit varies from maximum of 44% to a minimum of 21% the Plasticity Index ranges between 17 and 03%, whereas 57 No’s of samples are Non Plastic. As per Unified Classification System the fine portions of soils belong to CL, ML and CL-ML groups. Such soils are Clays and Clay-Silt mixtures of low to medium plasticity. 3) Specific Gravity The Specific Gravity of 45 SPT samples varies from 2.613 to 2.740. 4) Natural Water Content: In 112 SPT samples the water content varies from 0.53% to 24.11%. In 46 core samples the water content was determined from1.2% to 18.59%. 5) Bulk & Dry Density The value of Bulk Density for 45 Core Samples ranges between 1.579 to 2.76 gm/cc (15.79 to 27.6 kN/m3). The value of Dry Density for 45 Core Samples ranges between 1.450to 2.530 gm/cc (14.50 to 25.30 kN/m3). 6) Direct Shear: A total of 43 Direct Shear Tests were performed on remolded SPT samples. The results indicate that the angle of internal friction of SAND/ SILT varies from 28o to 32o. 7) Consolidation: Consolidation tests were performed on the 9 Undisturbed Core samples collected from CLAY layers. The Coefficient of Compressibility (Cc) value ranges from 0.16 to 0.23 while initial Void Ratio (Vo) ranges from 0.38 to 0.47. 8) Unconfined Compression on Core Samples: Unconfined compression tests were conducted on 45 core samples. The Unconfined Compressive Strength values range as follows: MUDSTONE Samples (21 Nos) :0.302 to 60.588 kg/cm² (0.03 to 5.9 Mpa) SANDSTONE Samples (10 Nos :0.664 to 20.043 kg/cm² (0.07 to 1.97 Mpa) LIMESTONE Samples (14 Nos) :4.01 to 199.000 kg/cm² (0.39 to 19.5 Mpa) 9) Chemical Tests: Chemical tests were performed on Soil and Water samples to determine Chloride content, APP-2-2-206
-
Upload
khangminh22 -
Category
Documents
-
view
2 -
download
0
Transcript of 3. Laboratory Test Results 3.1 Overall
3. Laboratory Test Results 3.1 Overall
(1) From 0.0Km to 8.0 Km (KCR/ BH#1 to KCR/BH#16)
1) Particle Size Analysis:
Total of 112 particle size analyses were performed on SPT samples and 31 on core samples. The results show that particles finer than 0.075mm sieve vary from 53% to 99% in Clay deposit and 04% to 44% in Sand deposit. As per Unified Classification System, the Clay deposits generally fall in CL/ CL-ML group while the Sand deposits belong to SW, SW-SM and SC groups.
2) Liquid Limit, Plastic Limit & Plasticity Index:
These tests were conducted on 112 SPT and 31 core samples. The liquid limit varies from maximum of 44% to a minimum of 21% the Plasticity Index ranges between 17 and 03%, whereas 57 No’s of samples are Non Plastic. As per Unified Classification System the fine portions of soils belong to CL, ML and CL-ML groups. Such soils are Clays and Clay-Silt mixtures of low to medium plasticity.
3) Specific Gravity
The Specific Gravity of 45 SPT samples varies from 2.613 to 2.740.
4) Natural Water Content:
In 112 SPT samples the water content varies from 0.53% to 24.11%. In 46 core samples the water content was determined from1.2% to 18.59%.
5) Bulk & Dry Density
The value of Bulk Density for 45 Core Samples ranges between 1.579 to 2.76 gm/cc (15.79 to 27.6 kN/m3). The value of Dry Density for 45 Core Samples ranges between 1.450to 2.530 gm/cc (14.50 to 25.30 kN/m3).
6) Direct Shear:
A total of 43 Direct Shear Tests were performed on remolded SPT samples. The results indicate that the angle of internal friction of SAND/ SILT varies from 28o to 32o.
7) Consolidation:
Consolidation tests were performed on the 9 Undisturbed Core samples collected from CLAY layers. The Coefficient of Compressibility (Cc) value ranges from 0.16 to 0.23 while initial Void Ratio (Vo) ranges from 0.38 to 0.47.
8) Unconfined Compression on Core Samples:
Unconfined compression tests were conducted on 45 core samples. The Unconfined Compressive Strength values range as follows: MUDSTONE Samples (21 Nos) :0.302 to 60.588 kg/cm² (0.03 to 5.9 Mpa) SANDSTONE Samples (10 Nos :0.664 to 20.043 kg/cm² (0.07 to 1.97 Mpa) LIMESTONE Samples (14 Nos) :4.01 to 199.000 kg/cm² (0.39 to 19.5 Mpa)
9) Chemical Tests:
Chemical tests were performed on Soil and Water samples to determine Chloride content,
APP-2-2-206
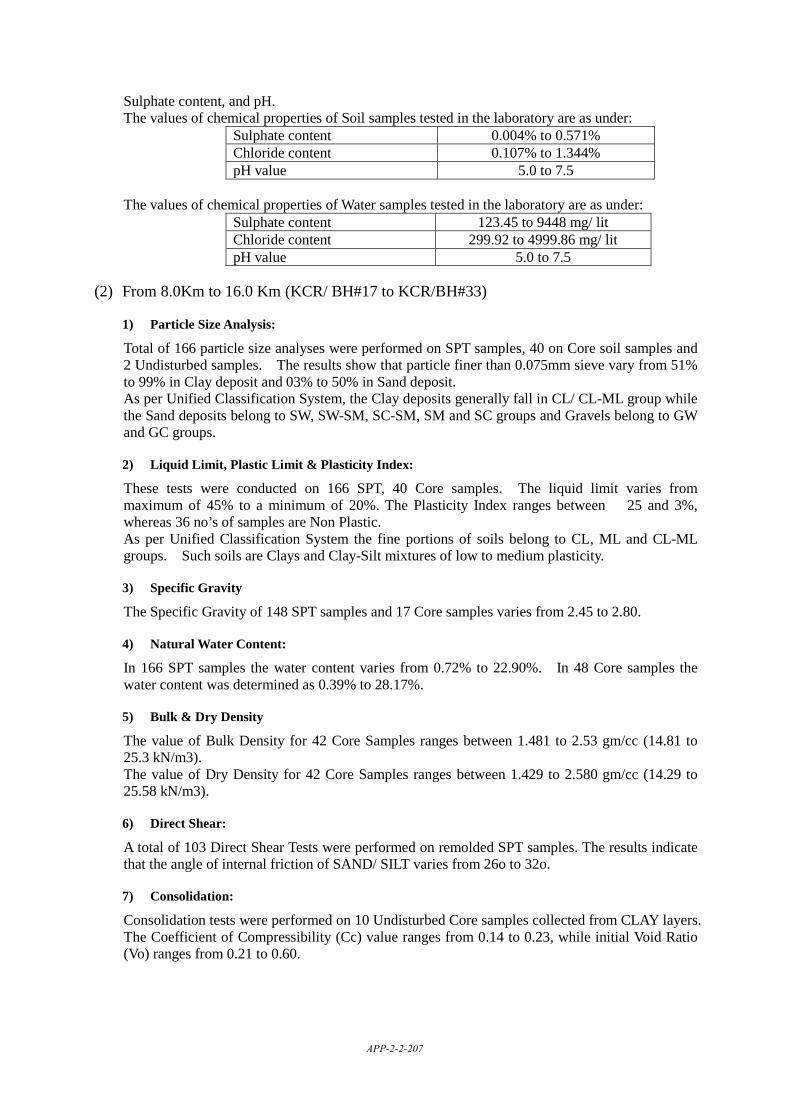
Sulphate content, and pH. The values of chemical properties of Soil samples tested in the laboratory are as under:
Sulphate content 0.004% to 0.571% Chloride content 0.107% to 1.344% pH value 5.0 to 7.5
The values of chemical properties of Water samples tested in the laboratory are as under:
Sulphate content 123.45 to 9448 mg/ lit Chloride content 299.92 to 4999.86 mg/ lit pH value 5.0 to 7.5
(2) From 8.0Km to 16.0 Km (KCR/ BH#17 to KCR/BH#33)
1) Particle Size Analysis:
Total of 166 particle size analyses were performed on SPT samples, 40 on Core soil samples and 2 Undisturbed samples. The results show that particle finer than 0.075mm sieve vary from 51% to 99% in Clay deposit and 03% to 50% in Sand deposit. As per Unified Classification System, the Clay deposits generally fall in CL/ CL-ML group while the Sand deposits belong to SW, SW-SM, SC-SM, SM and SC groups and Gravels belong to GW and GC groups.
2) Liquid Limit, Plastic Limit & Plasticity Index:
These tests were conducted on 166 SPT, 40 Core samples. The liquid limit varies from maximum of 45% to a minimum of 20%. The Plasticity Index ranges between 25 and 3%, whereas 36 no’s of samples are Non Plastic. As per Unified Classification System the fine portions of soils belong to CL, ML and CL-ML groups. Such soils are Clays and Clay-Silt mixtures of low to medium plasticity.
3) Specific Gravity
The Specific Gravity of 148 SPT samples and 17 Core samples varies from 2.45 to 2.80.
4) Natural Water Content:
In 166 SPT samples the water content varies from 0.72% to 22.90%. In 48 Core samples the water content was determined as 0.39% to 28.17%.
5) Bulk & Dry Density
The value of Bulk Density for 42 Core Samples ranges between 1.481 to 2.53 gm/cc (14.81 to 25.3 kN/m3). The value of Dry Density for 42 Core Samples ranges between 1.429 to 2.580 gm/cc (14.29 to 25.58 kN/m3).
6) Direct Shear:
A total of 103 Direct Shear Tests were performed on remolded SPT samples. The results indicate that the angle of internal friction of SAND/ SILT varies from 26o to 32o.
7) Consolidation:
Consolidation tests were performed on 10 Undisturbed Core samples collected from CLAY layers. The Coefficient of Compressibility (Cc) value ranges from 0.14 to 0.23, while initial Void Ratio (Vo) ranges from 0.21 to 0.60.
APP-2-2-207
8) Unconfined Compression on Core Samples:
Unconfined compression tests were conducted on 42 core samples of soil and rock. The Unconfined Compressive Strength values range as follows: Stiff to Hard CLAY Samples (14 Nos):0.510 to 7.343 kg/cm² (0.05 to 0.72 Mpa) MUDSTONE Samples (18 Nos):0.390 to 40.532 kg/cm²(0.039 to 3.98 Mpa) SANDSTONE Samples (8 Nos):1.543 to 31.000 kg/cm²(0.15 to 3.04 Mpa) LIMESTONE Samples (2 Nos):40.532 to 117.254 kg/cm²(3.98 to 11.50 Mpa)
9) Chemical Tests:
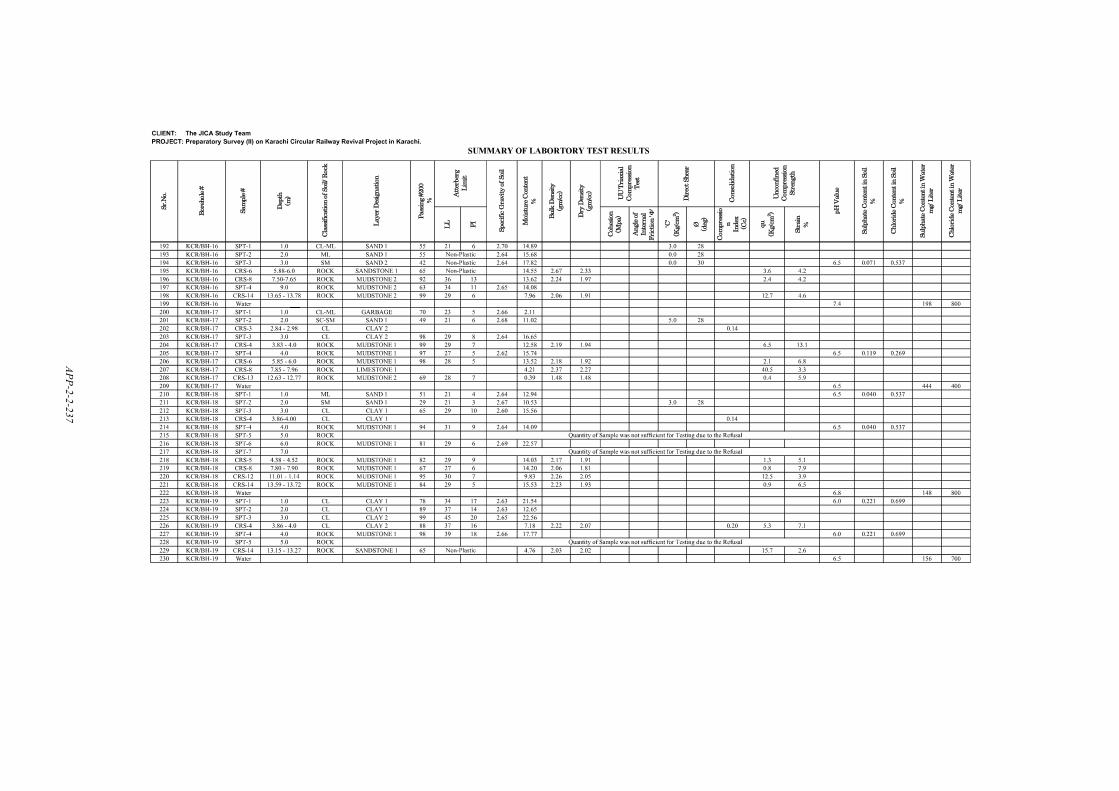
Chemical tests were performed on 19 Nos of Soil and 17 Nos of Water samples to determine Chloride content, Sulphate content, and pH. The values of chemical properties of Soil samples tested in the laboratory are as under:
Sulphate content 0.030% to 0.420% Chloride content 0.110% to 0.700 % pH value 5.0 to 9.0
The values of chemical properties of Water samples tested in the laboratory are as under:
Sulphate content 65.84 to 444.42 mg/lit Chloride content 399.90 To 799.98 mg/lit pH value 5.0 to 9.0
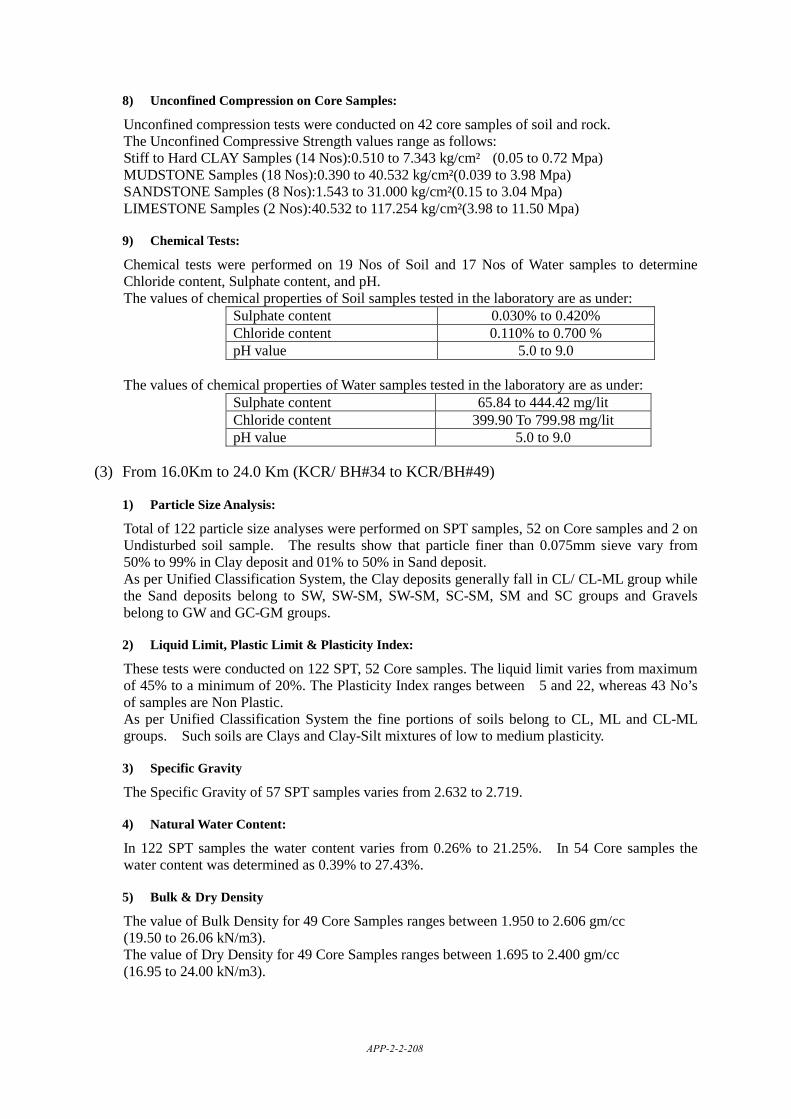
(3) From 16.0Km to 24.0 Km (KCR/ BH#34 to KCR/BH#49)
1) Particle Size Analysis:
Total of 122 particle size analyses were performed on SPT samples, 52 on Core samples and 2 on Undisturbed soil sample. The results show that particle finer than 0.075mm sieve vary from 50% to 99% in Clay deposit and 01% to 50% in Sand deposit. As per Unified Classification System, the Clay deposits generally fall in CL/ CL-ML group while the Sand deposits belong to SW, SW-SM, SW-SM, SC-SM, SM and SC groups and Gravels belong to GW and GC-GM groups.
2) Liquid Limit, Plastic Limit & Plasticity Index:
These tests were conducted on 122 SPT, 52 Core samples. The liquid limit varies from maximum of 45% to a minimum of 20%. The Plasticity Index ranges between 5 and 22, whereas 43 No’s of samples are Non Plastic. As per Unified Classification System the fine portions of soils belong to CL, ML and CL-ML groups. Such soils are Clays and Clay-Silt mixtures of low to medium plasticity.
3) Specific Gravity
The Specific Gravity of 57 SPT samples varies from 2.632 to 2.719.
4) Natural Water Content:
In 122 SPT samples the water content varies from 0.26% to 21.25%. In 54 Core samples the water content was determined as 0.39% to 27.43%.
5) Bulk & Dry Density
The value of Bulk Density for 49 Core Samples ranges between 1.950 to 2.606 gm/cc (19.50 to 26.06 kN/m3). The value of Dry Density for 49 Core Samples ranges between 1.695 to 2.400 gm/cc (16.95 to 24.00 kN/m3).
APP-2-2-208
6) UU Triaxial Compression:
Unconsolidated Undrained Triaxial compression test was performed on one Undisturbed Clay sample extracted from 4.3 to 4.8m depth. The test was conducted in SOILCON Soil Mechanics Laboratory, Lahore. The results shows that Undrained Cohesion is 0.27Mpa whereas angle of internal friction `phi’ is 0.0 degrees.
7) Direct Shear:
A total of 79 Direct Shear Tests were performed on remolded SPT samples. The results indicate that the angle of internal friction of SAND/ SILT varies from 26o to 32o.
8) Consolidation:
Consolidation tests were performed on 9 Undisturbed Core samples collected from CLAY layers. The Coefficient of Compressibility (Cc) value ranges from 0.15 to 0.26 while initial Void Ratio (Vo) values from 0.32 to 0.60.
9) Unconfined Compression on Core Samples:
Unconfined compression tests were conducted on 50 core samples of soil and rock. The Unconfined Compressive Strength values range as follows: Stiff to Hard CLAY Samples (15 Nos):0.646 to 16.445 kg/cm² (0.64 to 1.62 Mpa) MUDSTONE Samples (31 Nos) :0.640 to 220.14 kg/cm² (0.63 to 21.6 Mpa) SANDSTONE Samples (4 Nos) :0.490 to 37.687 kg/cm² (0.05 to 3.70 Mpa)
10) Chemical Tests:
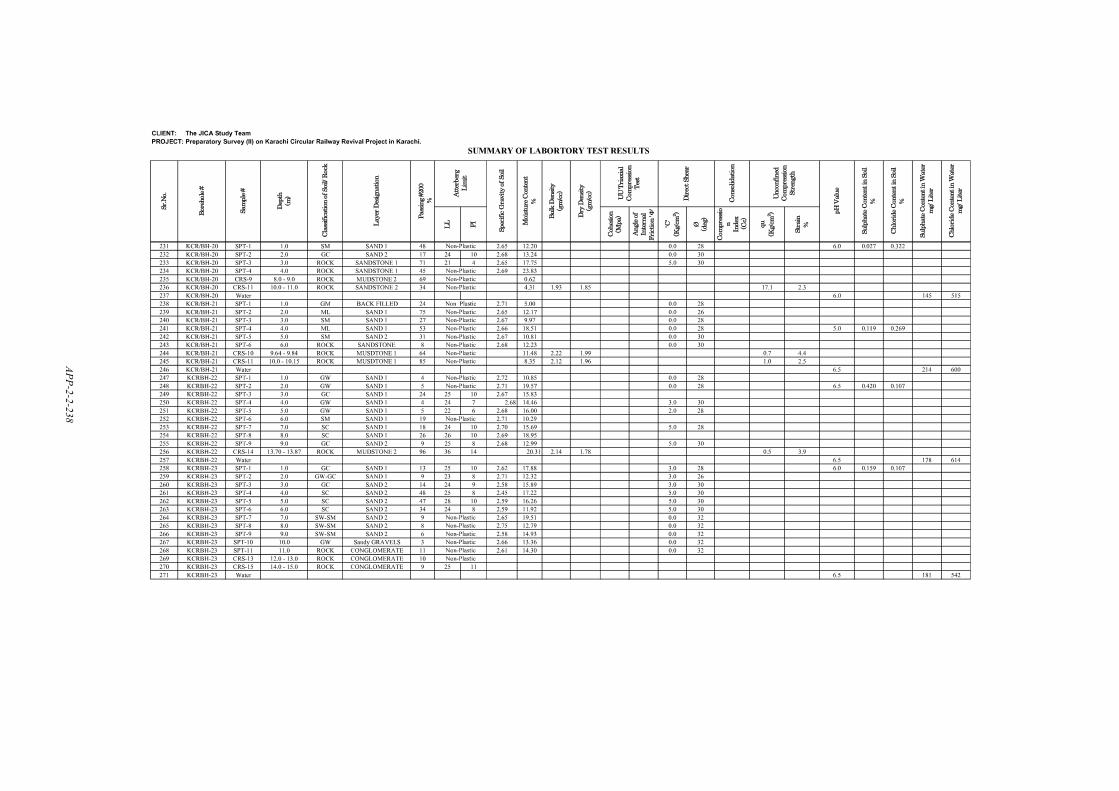
Chemical tests were performed on 17 Nos of Soil and 16 Nos of Water samples to determine Chloride content, Sulphate content, and pH. The values of chemical properties of Soil samples tested in the laboratory are as under:
Sulphate content 0.022% to 0.668% Chloride content 0.043% to 0.447 % pH value 5.5 to 7.7
The values of chemical properties of Water samples tested in the laboratory are as under:
Sulphate content 123.45 to 2197.40 mg/lit Chloride content 119.99 To 1550 mg/lit pH value 5.5 to 7.7
(4) From 24.0Km to 32.0 Km (KCR/ BH#50 to KCR/BH#64)
1) Particle Size Analysis:
Total of 243 particle size analyses were performed on SPT samples, 53 core samples and 14 Undisturbed soil sample. The results show that particle finer than 0.075mm sieve vary from 51% to 99% in Clay deposit and 01% to 49% in Sand deposit. As per Unified Classification System, the Clay deposits generally fall in CL/ CL-ML group while the Sand deposits belong to SW, SW-SM, SW-SM, SC-SM, SM and SC groups and Gravels belong to GW and GC-GM groups.
2) Liquid Limit, Plastic Limit & Plasticity Index:
These tests were conducted on 243 SPT and 53 Core samples. The liquid limit varies from maximum of 49% to a minimum of 21%. The Plasticity Index ranges between 4 and 29, whereas 119 No’s of samples are Non Plastic. As per Unified Classification System the fine portions of soils belong to CL, ML and CL-ML
APP-2-2-209
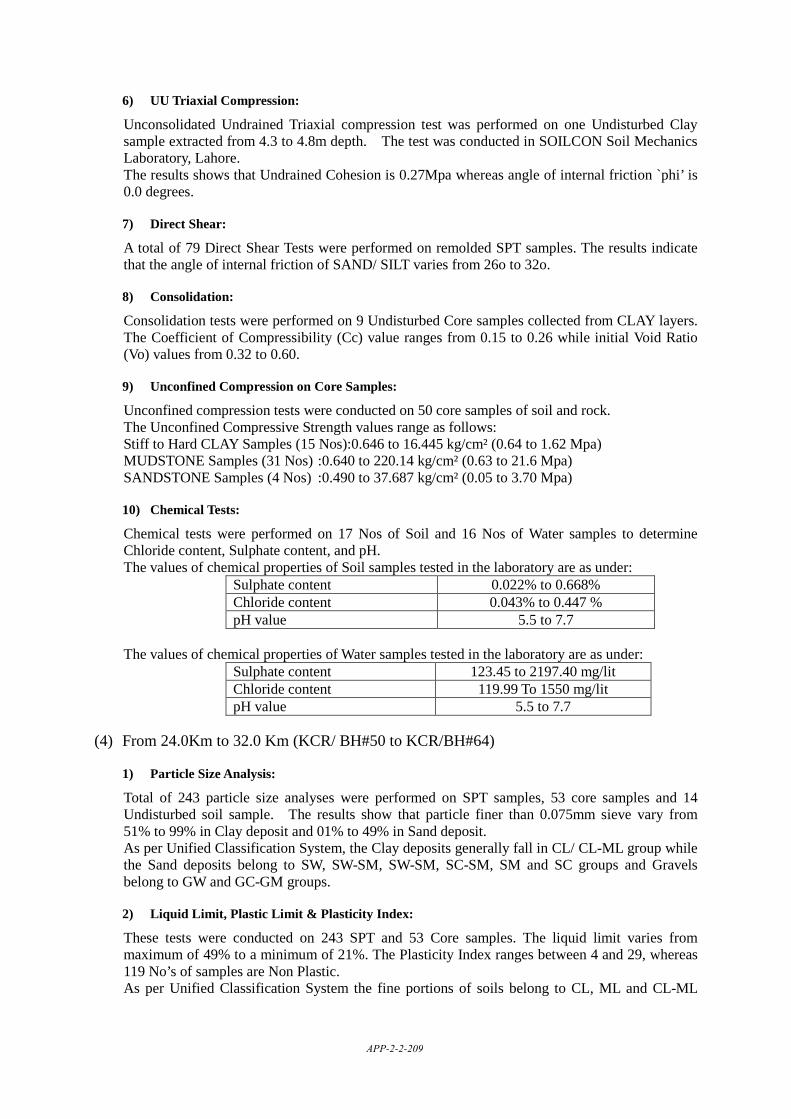
groups. Such soils are Clays and Clay-Silt mixtures of low to medium plasticity.
3) Specific Gravity:
The Specific Gravity of 245 SPT samples are varies from 2.262 to 2.813.
4) Natural Water Content:
In 243 SPT samples the water content varies from 2.25% to 38.21%. In 64 Core samples the water content was determined as 0.80% to 28.17%.
5) Bulk & Dry Density
The value of Bulk Density for 53 Core Samples ranges between 1.938 to 2.511 gm/cc (19.38 to 25.11 kN/m3). The value of Dry Density for 53 Core Samples ranges between 1.656 to 2.31 gm/cc (16.56 to 23.1 kN/m3).
6) UU Triaxial Compression:
Unconsolidated Undrained Triaxial compression test was performed on 10 Undisturbed Clay sample extracted from 10 bore holes at varied horizons (min. 2.0m to max. 5.5m depth). The tests were conducted in SOILCON Soil Mechanics Laboratory, Lahore. The results show that Undrained Cohesion ranges from 0.0 to 0.14 Mpa whereas angle of internal friction ‘phi’ ranges from 0.0 to 17 degrees.
7) Direct Shear:
A total of 149 Direct Shear Tests were performed on remolded SPT samples. The results indicate that the angle of internal friction of SAND/ SILT varies from 26o to 32o.
8) Consolidation:
Consolidation tests were performed on 19 Undisturbed Core samples collected from CLAY layers. The Coefficient of Compressibility (Cc) value ranges from 0.13 to 0.28 while initial Void Ratio (Vo) ranges from 0.30 to 0.57.
9) Unconfined Compression on Core Samples:
Unconfined compression tests were conducted on 53 core samples of soil and rock. The Unconfined Compressive Strength values range as follows: Stiff to Hard CLAY Samples(26 Nos):0.541 to 11.315 kg/cm² (0.05 to 1.10Mpa) MUDSTONE Samples (10 Nos): 1.080 to 24.449 kg/cm² (0.10 to 2.4 Mpa) SANDSTONE Samples (9 Nos): 0.661 to 72.714 kg/cm² (0.06 to 7.2 Mpa) CONGLOMERTAE Samples (8 Nos):0.590 to 166 kg/cm² (0.05 to 16.3 Mpa)
10) Chemical Tests:
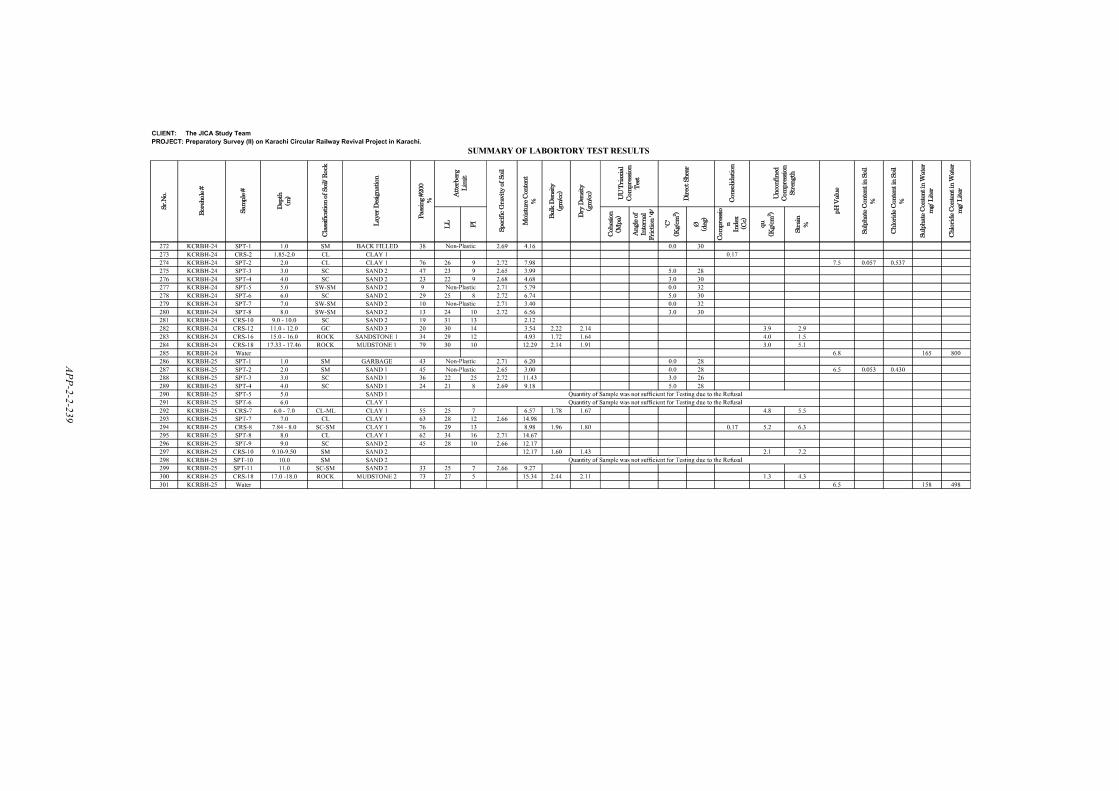
Chemical tests were performed on 15 Nos of Soil and 15 Nos of Water samples to determine Chloride content, Sulphate content, and pH. The values of chemical properties of Soil samples tested in the laboratory are as under:
Sulphate content 0.027 to 0.955% Chloride content 0.054% to 0.194% pH value 6 to 8
The values of chemical properties of Water samples tested in the laboratory are as under:
Sulphate content 221.55 to 1300.3 mg/lit Chloride content 28.69 to 2499.33 mg/lit pH value 6 to 8
APP-2-2-210
(5) From 32.0Km to 40.0 Km (KCR/ BH#65 to KCR/BH#81)
1) Particle Size Analysis:
Total of 63 particle size analyses were performed on SPT samples and 49 Core samples and one Undisturbed soil sample. The results show that particle finer than 0.075mm sieve vary from 50% to 99% in Clay deposit and 05% to 48% in Sand deposit. As per Unified Classification System, the Clay deposits generally fall in CL/ CL-ML group while the Sand deposits belong to SW, SW-SM, SW-SM, SC-SM, SM and SC groups and Gravels belong to GW and GC-GM groups.
2) Liquid Limit, Plastic Limit & Plasticity Index:
These tests were conducted on 63 SPT and 49 Core samples and one Undisturbed soil sample. The liquid limit varies from maximum of 48% to a minimum of 20%. The Plasticity Index ranges between 4 and 24, whereas 35 No’s of samples are Non Plastic. As per Unified Classification System the fine portions of soils belong to CL, ML and CL-ML groups. Such soils are Clays and Clay-Silt mixtures of low to medium plastic.
3) Specific Gravity:
The Specific Gravity of 62 SPT samples varies from 2.605 to 2.721
4) Natural Water Content:
In 63 SPT samples the water content varies from 1.10% to 37.39%. In 82 Core samples the water content was determined as 0.93% to 20.60%.
5) Bulk & Dry Density
The value of Bulk Density for 83 Core Samples ranges between 1.684 to 2.897gm/cc (16.84 to 28.97 kN/m3). The value of Dry Density for 83 Core Samples ranges between 1.406 to 2.750gm/cc (14.06 to 27.38 kN/m3).
6) UU Triaxial Compression:
Unconsolidated undrained triaxial compression test was performed on one Undisturbed Clay sample extracted from 5.30 to 5.65m depth. The test was conducted in SOILCON Soil Mechanics Laboratory, Lahore. The test shows that Undrained Cohesion is 0.12Mpa whereas angle of internal friction `phi’ is 0.0 degrees.
7) Direct Shear:
A total of 33 Direct Shear Tests were performed on remolded SPT samples. The results indicate that the angle of internal friction of SAND/ SILT varies from 26o to 32o.
8) Consolidation:
Consolidation tests were performed on 03 Undisturbed Core samples collected from CLAY layers. The Coefficient of Compressibility (Cc) value ranges from 0.15 to 0.25 while initial Void Ratio (Vo) varies from 0.31 to 0.54.
9) Unconfined Compression on Core Samples:
Unconfined compression tests were conducted on 72 core samples of soil and rock. The Unconfined Compressive Strength values range as follows: MUDSTONE Samples (54 Nos):0.339 to 136.123kg/cm² (0.04 to 13.4 Mpa) LIMESTONE Samples (5 Nos):11.102 to 150.099kg/cm² (1.09 to 14.71 Mpa)
APP-2-2-211
SANDSTONE Samples (7 Nos):1.982 to 132.04 kg/cm² (0.20 to 12.94Mpa) CONGLOMERATE Samples (1 Nos):166 kg/cm² (16.3 Mpa)
10) Chemical Tests:
Chemical tests were performed on 17 Nos of Soil and 17 Nos of Water samples to determine Chloride content, Sulphate content, and pH. The values of chemical properties of Soil samples tested in the laboratory are as under:
Sulphate content 0.008% to 0.889% Chloride content 0.027% to 0.806% pH value 5.5 to 7.5
The values of chemical properties of Water samples tested in the laboratory are as under:
Sulphate content 16.46 to 8211.04 mg/lit Chloride content 288.43 to 1499.96 mg/lit pH value 5.5 to 7.5
(6) From 40.0Km to 43.0 Km (KCR/ BH#82 to KCR/BH#86)
1) Particle Size Analysis:
Total of 46 particle size analyses were performed on SPT samples and 11 on Core samples. The results show that particle finer than 0.075mm sieve vary from 56% to 99% in Clay deposit and 14% to 36% in Sand deposit. As per Unified Classification System, the Clay deposits generally fall in CL/ CL-ML group while the Sand deposits belong to SW, SW-SM, SW-SM, SC-SM, SM and SC groups and Gravels belong to GW and GC-GM groups.
2) Liquid Limit, Plastic Limit & Plasticity Index:
These tests were conducted on 46 SPT and 11 Core samples. The liquid limit varies from maximum of 42% to a minimum of 22%. The Plasticity Index ranges between 7 and 19, whereas 15 No’s of samples are Non Plastic. As per Unified Classification System the fine portions of soils belong to CL, ML and CL-ML groups. Such soils are Clays and Clay-Silt mixtures of low to medium plastic.
3) Specific Gravity:
The Specific Gravity of 45 SPT samples varies from 2.586 to 2.712
4) Natural Water Content:
In 44 SPT samples the water content varies from 3.22% to 26.67%. In 17 Core samples the water content was determined as 2.11% to 28.43%.
5) Bulk & Dry Density
The value of Bulk Density for Undisturbed 17 Core Samples ranges between 1.885 to 2.417gm/cc (18.85 to 24.17kN/m3). The value of Dry Density for 17 Core Samples ranges between 1.649 to 2.367gm/cc (16.49 to 23.67 kN/m3).
6) Direct Shear:
A total of 13 Direct Shear Tests were performed on remolded SPT samples. The results indicate that the angle of internal friction of SAND/ SILT varies from 26o to 30o.
APP-2-2-212
7) Consolidation:
Consolidation tests were performed on one Undisturbed Core sample collected from CLAY layers. The Coefficient of Compressibility (Cc) value is 0.24. while initial Void Ratio (Vo) is 0.50.
8) Unconfined Compression on Core Samples:
Unconfined compression tests were conducted on 17 core samples of soil and rock. The Unconfined Compressive Strength values range as follows: MUDSTONE Samples (12 Nos): 0.954 to 134.89kg/cm² (0.10 to 13.22 Mpa) LIMESTONE Samples (4 Nos):7.791 to 57.17kg/cm² (0.77 to 5.60 Mpa) SANDSTONE Samples(1 Nos):3.564kg/cm² (0.35Mpa)
9) Chemical Tests:
Chemical tests were performed on 5 Nos of Soil and 5 Nos of Water samples to determine Chloride content, Sulphate content, and pH. The values of chemical properties of Soil samples tested in the laboratory are as under:
Sulphate content 0.027% to 0.301% Chloride content 0.269% to 0.645% pH value 5.5 to 7.5
The values of chemical properties of Water samples tested in the laboratory are as under:
Sulphate content 188.37 to 576.1 mg/lit Chloride content 348.98 to 999.97 mg/lit pH value 5.5 to 7.5
(7) KCR/ BH#87 to KCR/BH#90
1) Particle Size Analysis:
Total of 30 particle size analyses were performed on SPT samples and 07 Core samples and one Undisturbed soil sample. The results show that particle finer than 0.075mm sieve vary from 51% to 99% in Clay deposit and 06% to 49% in Sand deposit. As per Unified Classification System, the Clay deposits generally fall in CL/ CL-ML group while the Sand deposits belong to SW, SW-SM, SW-SM, SC-SM, SM and SC groups and Gravels belong to GW and GC-GM groups.
2) Liquid Limit, Plastic Limit & Plasticity Index:
These tests were conducted on 30 SPT, 07 Core samples and one Undisturbed samples. The liquid limit varies from maximum of 39% to a minimum of 23%. The Plasticity Index ranges between 5 and 18, whereas 16 No’s of samples are Non Plastic. As per Unified Classification System the fine portions of soils belong to CL, ML and CL-ML groups. Such soils are Clays and Clay-Silt mixtures of low to medium plastic.
3) Specific Gravity:
The Specific Gravity of 30 SPT samples varies from 2.635 to 2.719
4) Natural Water Content:
In 30 SPT samples the water content varies from 5.03% to 24.78%. In 07 Core samples the water content was determined as 2.26% to 10.21%.
5) Bulk & Dry Density
The value of Bulk Density for 7 Core Samples ranges between 2.121 to 2.491gm/cc (21.21 to 24.91 kN/m3).
APP-2-2-213
The value of Dry Density for 07 Core Samples ranges between 1.862 to 2.400gm/cc (18.62 to 24.0 kN/m3).
6) UU Triaxial Compression:
Unconsolidated undrained triaxial compression test was performed on one Undisturbed Clay sample extracted from 4.0 to 4.5m depth from KCR/BH#88A.The test was conducted in SOILCON Soil Mechanics Laboratory, Lahore. The results shows that Undrained Cohesion is 0.015Mpa whereas angle of internal friction `phi’ is 10.0 degrees.
7) Direct Shear:
A total of 19 Direct Shear Tests were performed on remolded SPT samples. The results indicate that the angle of internal friction of SAND/ SILT varies from 26o to 32o.
8) Unconfined Compression on Core Samples:
Unconfined compression tests were conducted on 7 core samples of soil and rock. The Unconfined Compressive Strength values range as follows: Stiff to Hard CLAY Samples(1 Nos) :0.359kg/cm² (0.04 Mpa) MUDSTONE Samples (4 Nos) :0.777 to 12.726kg/cm² (0.08 to 1.25 Mpa) SANDSTONE Samples (2 Nos) :20.728 to 25.313 kg/cm² (2.03 to 2.48 Mpa) Results show that at relatively shallow depths the unconfined compressive strength range between 0.359 to 25.313kg/cm².
9) Chemical Tests:
Chemical tests were performed on 4 Nos of Soil and 4 Nos of Water samples to determine Chloride content, Sulphate content, and pH. The values of chemical properties of Soil samples tested in the laboratory are as under:
Sulphate content 0.058% to 0.274% Chloride content 0.302% to 0.645% pH value 6 to 8.5
The values of chemical properties of Water samples tested in the laboratory are as under:
Sulphate content 189.29 to 1473.2 mg/lit Chloride content 684.39 to 7099.79 mg/lit pH value 6 to 8.5
APP-2-2-214
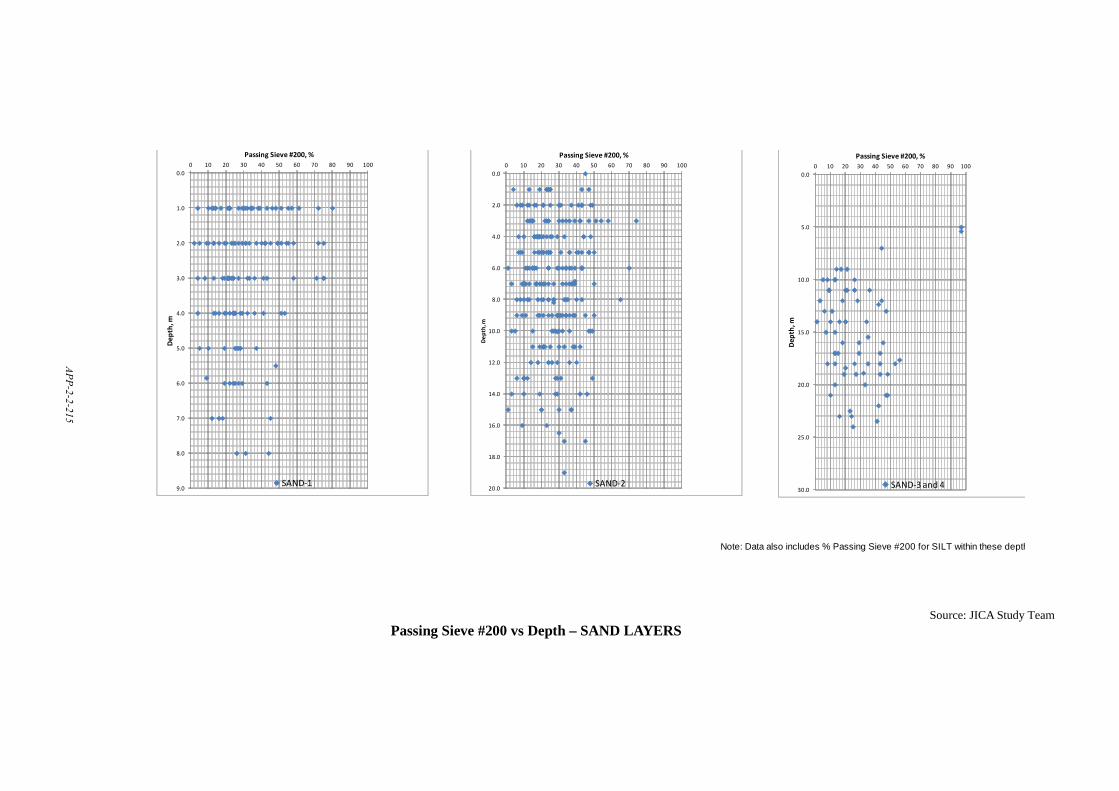
Note: Data also includes % Passing Sieve #200 for SILT within these depth
0.0
1.0
2.0
3.0
4.0
5.0
6.0
7.0
8.0
9.0
0 10 20 30 40 50 60 70 80 90 100De
pth,
m
Passing Sieve #200, %
SAND-1
0.0
2.0
4.0
6.0
8.0
10.0
12.0
14.0
16.0
18.0
20.0
0 10 20 30 40 50 60 70 80 90 100
Dept
h, m
Passing Sieve #200, %
SAND-2
0.0
5.0
10.0
15.0
20.0
25.0
30.0
0 10 20 30 40 50 60 70 80 90 100
Dept
h, m
Passing Sieve #200, %
SAND-3 and 4
Passing Sieve #200 vs Depth – SAND LAYERS Source: JICA Study Team
APP-2-2-215
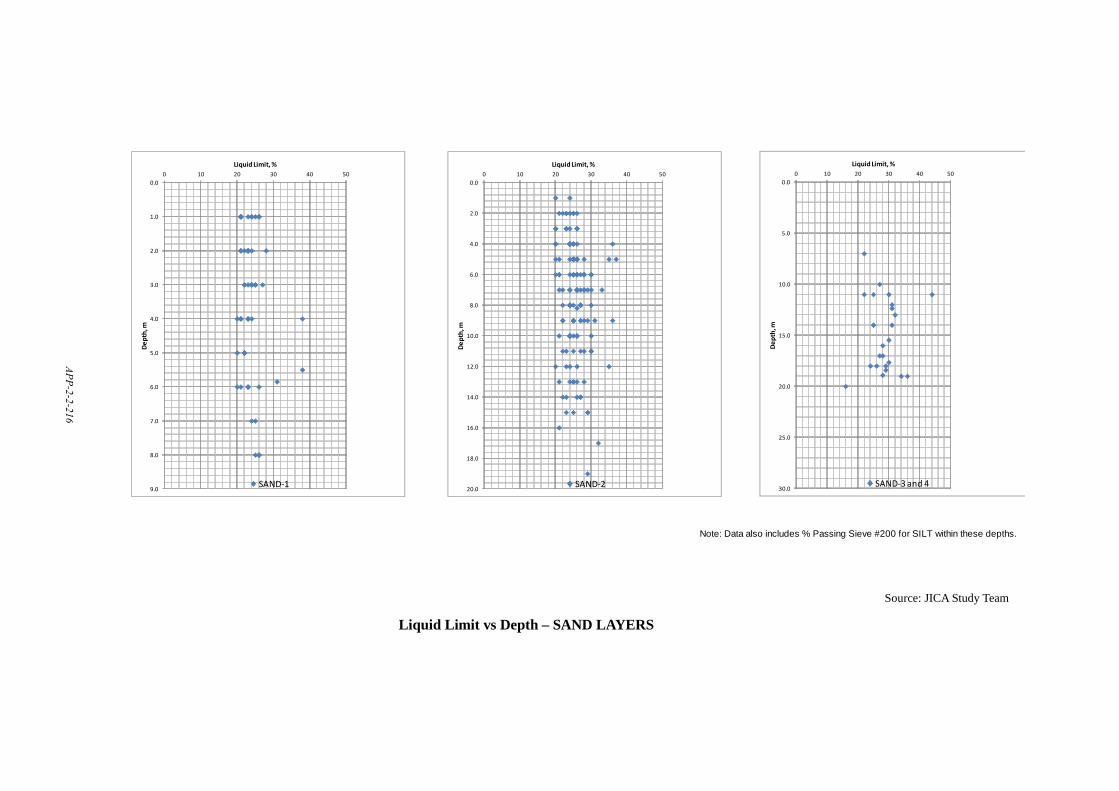
Note: Data also includes % Passing Sieve #200 for SILT within these depths.
FIG- 7.2 : Liquid Limit vs Depth - SAND LAYERS
0.0
1.0
2.0
3.0
4.0
5.0
6.0
7.0
8.0
9.0
0 10 20 30 40 50
Dept
h, m
Liquid Limit, %
SAND-1
0.0
2.0
4.0
6.0
8.0
10.0
12.0
14.0
16.0
18.0
20.0
0 10 20 30 40 50
Dept
h, m
Liquid Limit, %
SAND-2
0.0
5.0
10.0
15.0
20.0
25.0
30.0
0 10 20 30 40 50
Dept
h, m
Liquid Limit, %
SAND-3 and 4
Liquid Limit vs Depth – SAND LAYERS
Source: JICA Study Team
APP-2-2-216

Note: Data also includes % Passing Sieve #200 for SILT within these depths.
FIG- 7.3 : Plasticity vs Depth - SAND LAYERS
0.0
1.0
2.0
3.0
4.0
5.0
6.0
7.0
8.0
9.0
0 10 20 30 40 50
Dept
h, m
Plasticity Index - PI
SAND-1
0.0
2.0
4.0
6.0
8.0
10.0
12.0
14.0
16.0
18.0
20.0
0 10 20 30 40 50
Dept
h, m
Plasticity Index - PI
SAND-2
0.0
5.0
10.0
15.0
20.0
25.0
30.0
0 10 20 30 40 50
Dept
h, m
Plasticity Index - PI
SAND-3 and 4
Plasticty vs Depth – SAND LAYERS
Source: JICA Study Team
APP-2-2-217
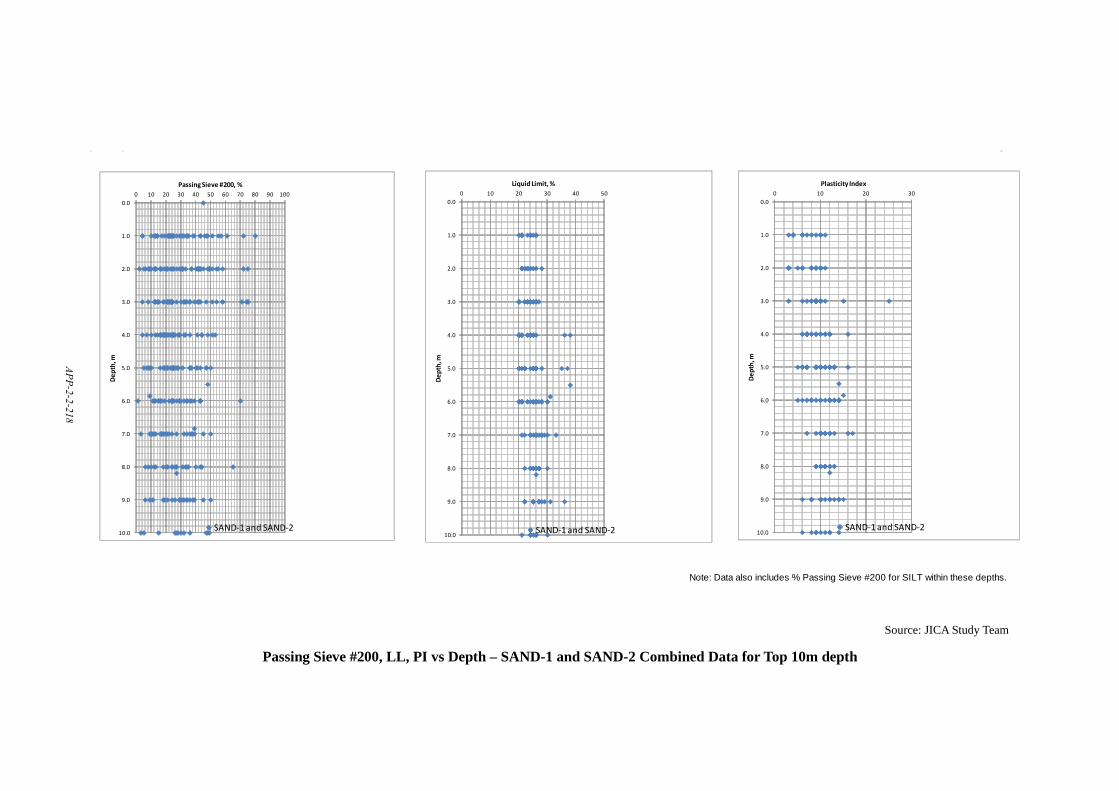
Note: Data also includes % Passing Sieve #200 for SILT within these depths.
FIG- 7.4 : Passing #200, LL and PI vs Depth - SAND-1 and SAND-2 Combined Data for Top 10 m depth
0.0
1.0
2.0
3.0
4.0
5.0
6.0
7.0
8.0
9.0
10.0
0 10 20 30 40 50 60 70 80 90 100
Dept
h, m
Passing Sieve #200, %
SAND-1 and SAND-2
0.0
1.0
2.0
3.0
4.0
5.0
6.0
7.0
8.0
9.0
10.0
0 10 20 30 40 50
Dept
h, m
Liquid Limit, %
SAND-1 and SAND-2
0.0
1.0
2.0
3.0
4.0
5.0
6.0
7.0
8.0
9.0
10.0
0 10 20 30
Dept
h, m
Plasticity Index
SAND-1 and SAND-2
Passing Sieve #200, LL, PI vs Depth – SAND-1 and SAND-2 Combined Data for Top 10m depth
Source: JICA Study Team
APP-2-2-218
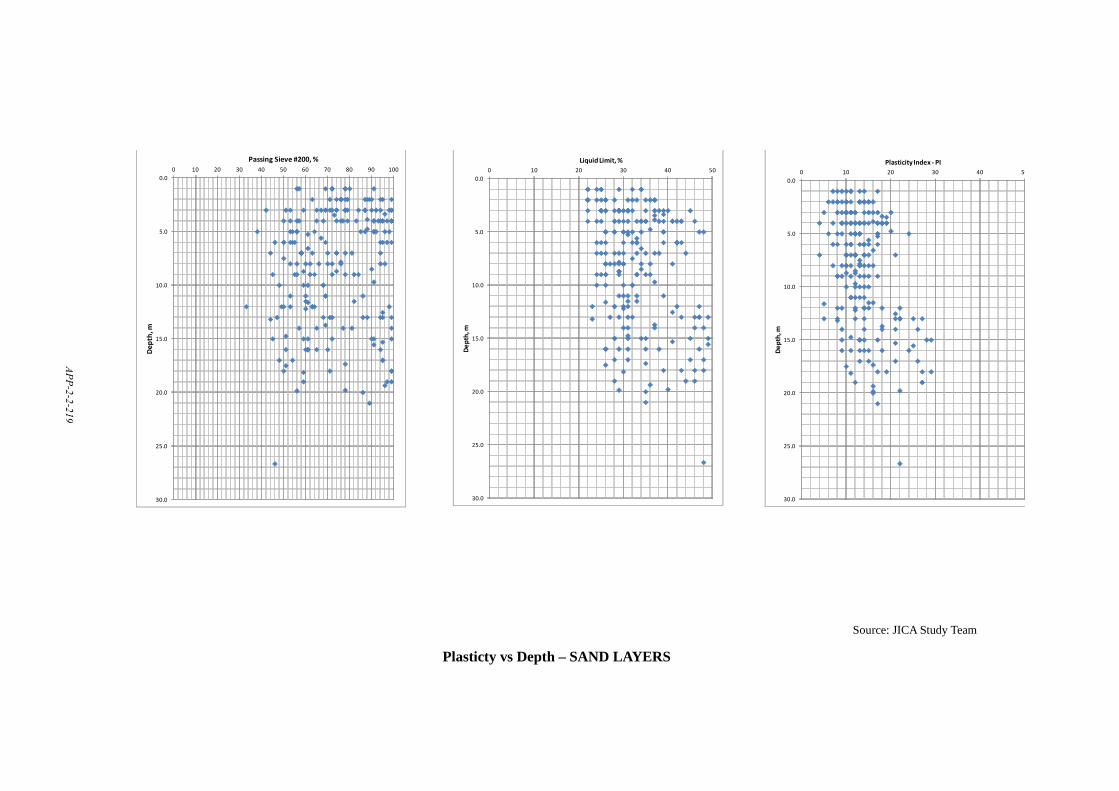
FIG- 7.5 : Passing Sieve #200, LL, PI vs Depth - CLAY LAYERS
0.0
5.0
10.0
15.0
20.0
25.0
30.0
0 10 20 30 40 50 60 70 80 90 100
Dept
h, m
Passing Sieve #200, %
0.0
5.0
10.0
15.0
20.0
25.0
30.0
0 10 20 30 40 50
Dept
h, m
Liquid Limit, %
0.0
5.0
10.0
15.0
20.0
25.0
30.0
0 10 20 30 40 50
Dept
h, m
Plasticity Index - PI
Plasticty vs Depth – SAND LAYERS
Source: JICA Study Team
APP-2-2-219
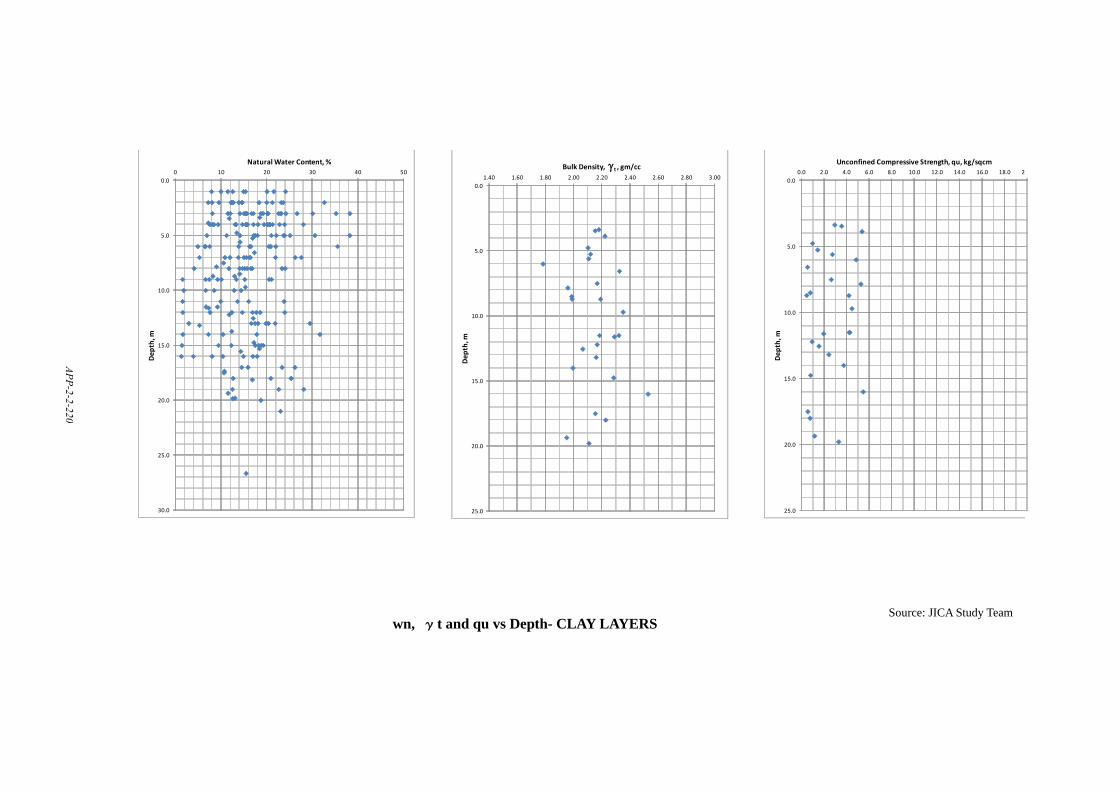
FIG- 7.6 : wn, γt and qu vs Depth -CLAY LAYERS
0.0
5.0
10.0
15.0
20.0
25.0
30.0
0 10 20 30 40 50
Dept
h, m
Natural Water Content, %
0.0
5.0
10.0
15.0
20.0
25.0
1.40 1.60 1.80 2.00 2.20 2.40 2.60 2.80 3.00
Dept
h, m
Bulk Density, γt , gm/cc
0.0
5.0
10.0
15.0
20.0
25.0
0.0 2.0 4.0 6.0 8.0 10.0 12.0 14.0 16.0 18.0 20
Dept
h, m
Unconfined Compressive Strength, qu, kg/sqcm
wn, γt and qu vs Depth- CLAY LAYERS Source: JICA Study Team
APP-2-2-220
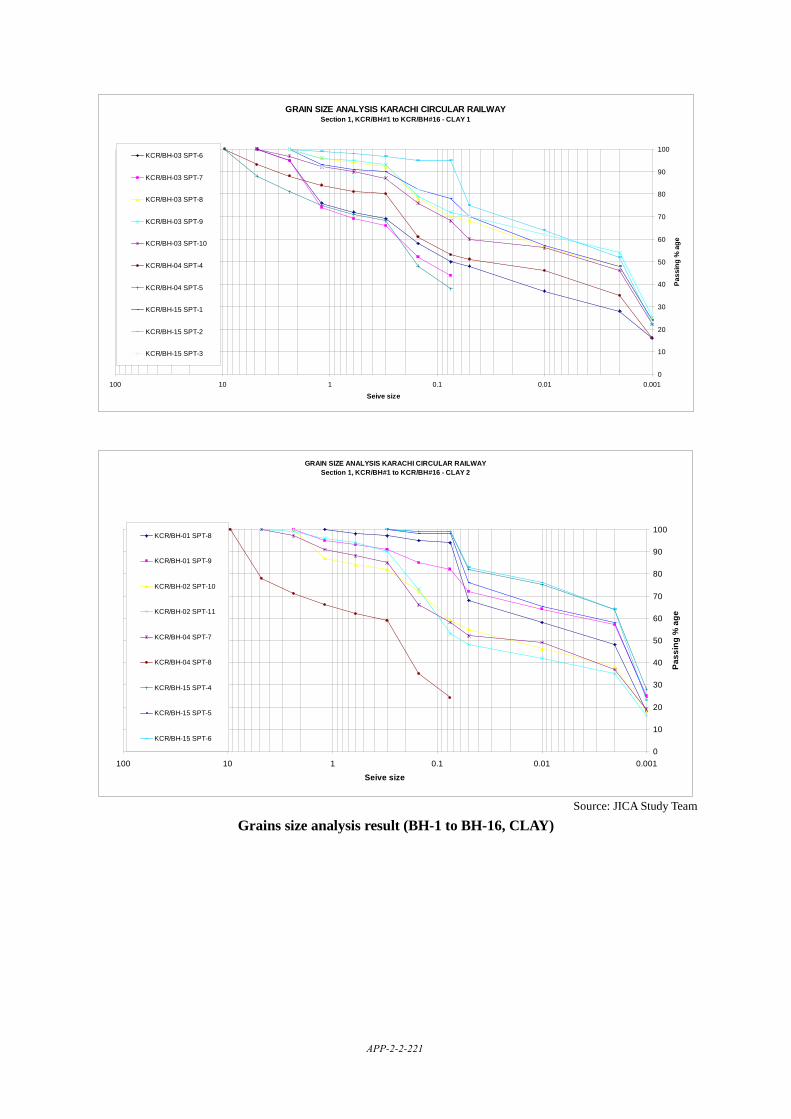
GRAIN SIZE ANALYSIS KARACHI CIRCULAR RAILWAY Section 1, KCR/BH#1 to KCR/BH#16 - CLAY 1
0
10
20
30
40
50
60
70
80
90
100
0.0010.010.1110100
Seive size
Pass
ing
% a
ge
KCR/BH-03 SPT-6
KCR/BH-03 SPT-7
KCR/BH-03 SPT-8
KCR/BH-03 SPT-9
KCR/BH-03 SPT-10
KCR/BH-04 SPT-4
KCR/BH-04 SPT-5
KCR/BH-15 SPT-1
KCR/BH-15 SPT-2
KCR/BH-15 SPT-3
GRAIN SIZE ANALYSIS KARACHI CIRCULAR RAILWAY Section 1, KCR/BH#1 to KCR/BH#16 - CLAY 2
0
10
20
30
40
50
60
70
80
90
100
0.0010.010.1110100
Seive size
Pass
ing
% a
ge
KCR/BH-01 SPT-8
KCR/BH-01 SPT-9
KCR/BH-02 SPT-10
KCR/BH-02 SPT-11
KCR/BH-04 SPT-7
KCR/BH-04 SPT-8
KCR/BH-15 SPT-4
KCR/BH-15 SPT-5
KCR/BH-15 SPT-6
Source: JICA Study Team
Grains size analysis result (BH-1 to BH-16, CLAY)
APP-2-2-221
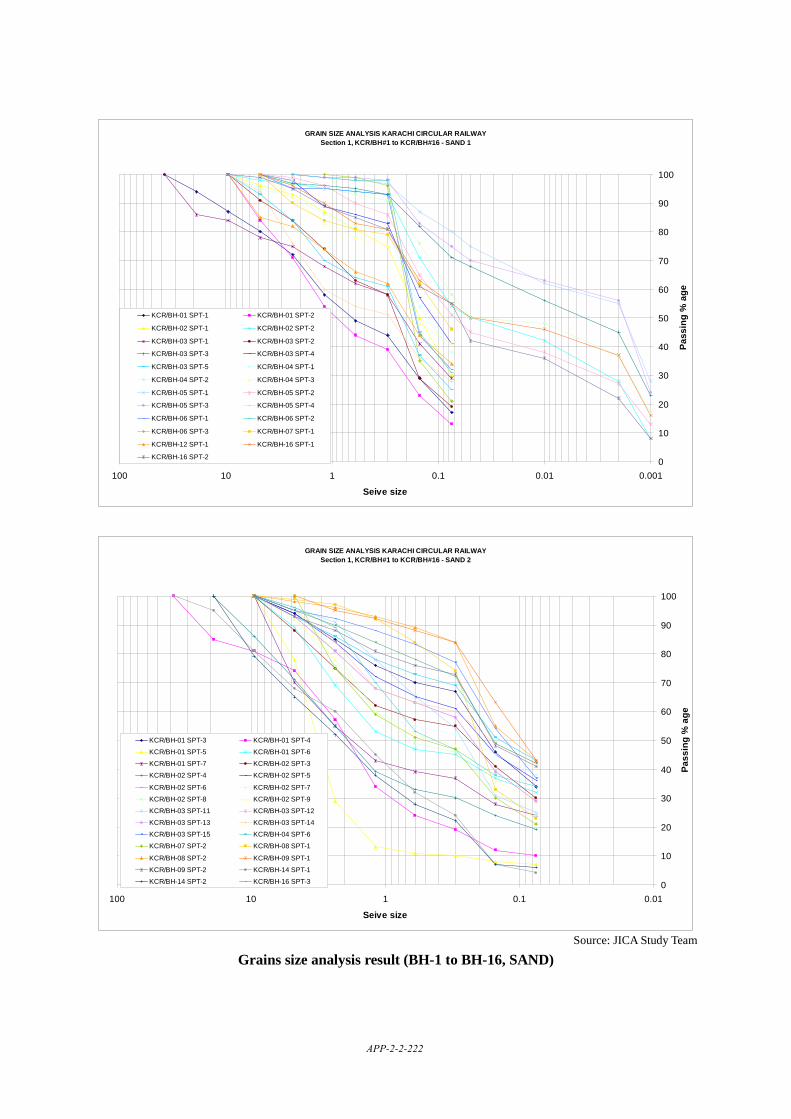
GRAIN SIZE ANALYSIS KARACHI CIRCULAR RAILWAY Section 1, KCR/BH#1 to KCR/BH#16 - SAND 1
0
10
20
30
40
50
60
70
80
90
100
0.0010.010.1110100
Seive size
Pass
ing
% a
ge
KCR/BH-01 SPT-1 KCR/BH-01 SPT-2
KCR/BH-02 SPT-1 KCR/BH-02 SPT-2
KCR/BH-03 SPT-1 KCR/BH-03 SPT-2
KCR/BH-03 SPT-3 KCR/BH-03 SPT-4
KCR/BH-03 SPT-5 KCR/BH-04 SPT-1
KCR/BH-04 SPT-2 KCR/BH-04 SPT-3
KCR/BH-05 SPT-1 KCR/BH-05 SPT-2
KCR/BH-05 SPT-3 KCR/BH-05 SPT-4
KCR/BH-06 SPT-1 KCR/BH-06 SPT-2
KCR/BH-06 SPT-3 KCR/BH-07 SPT-1
KCR/BH-12 SPT-1 KCR/BH-16 SPT-1
KCR/BH-16 SPT-2
GRAIN SIZE ANALYSIS KARACHI CIRCULAR RAILWAY Section 1, KCR/BH#1 to KCR/BH#16 - SAND 2
0
10
20
30
40
50
60
70
80
90
100
0.010.1110100
Seive size
Pass
ing
% a
ge
KCR/BH-01 SPT-3 KCR/BH-01 SPT-4
KCR/BH-01 SPT-5 KCR/BH-01 SPT-6
KCR/BH-01 SPT-7 KCR/BH-02 SPT-3
KCR/BH-02 SPT-4 KCR/BH-02 SPT-5
KCR/BH-02 SPT-6 KCR/BH-02 SPT-7
KCR/BH-02 SPT-8 KCR/BH-02 SPT-9
KCR/BH-03 SPT-11 KCR/BH-03 SPT-12
KCR/BH-03 SPT-13 KCR/BH-03 SPT-14
KCR/BH-03 SPT-15 KCR/BH-04 SPT-6
KCR/BH-07 SPT-2 KCR/BH-08 SPT-1
KCR/BH-08 SPT-2 KCR/BH-09 SPT-1
KCR/BH-09 SPT-2 KCR/BH-14 SPT-1
KCR/BH-14 SPT-2 KCR/BH-16 SPT-3
Source: JICA Study Team
Grains size analysis result (BH-1 to BH-16, SAND)
APP-2-2-222
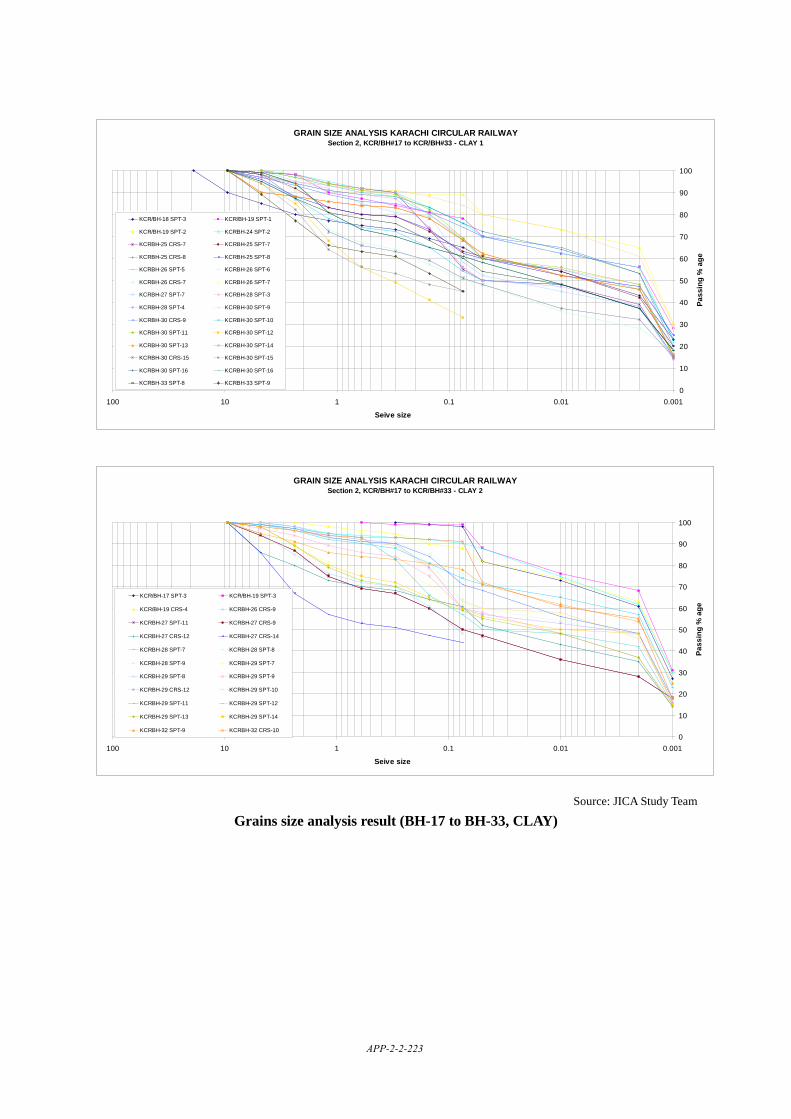
GRAIN SIZE ANALYSIS KARACHI CIRCULAR RAILWAY Section 2, KCR/BH#17 to KCR/BH#33 - CLAY 1
0
10
20
30
40
50
60
70
80
90
100
0.0010.010.1110100
Seive size
Pass
ing
% a
ge
KCR/BH-18 SPT-3 KCR/BH-19 SPT-1
KCR/BH-19 SPT-2 KCRBH-24 SPT-2
KCRBH-25 CRS-7 KCRBH-25 SPT-7
KCRBH-25 CRS-8 KCRBH-25 SPT-8
KCRBH-26 SPT-5 KCRBH-26 SPT-6
KCRBH-26 CRS-7 KCRBH-26 SPT-7
KCRBH-27 SPT-7 KCRBH-28 SPT-3
KCRBH-28 SPT-4 KCRBH-30 SPT-9
KCRBH-30 CRS-9 KCRBH-30 SPT-10
KCRBH-30 SPT-11 KCRBH-30 SPT-12
KCRBH-30 SPT-13 KCRBH-30 SPT-14
KCRBH-30 CRS-15 KCRBH-30 SPT-15
KCRBH-30 SPT-16 KCRBH-30 SPT-16
KCRBH-33 SPT-8 KCRBH-33 SPT-9
GRAIN SIZE ANALYSIS KARACHI CIRCULAR RAILWAY Section 2, KCR/BH#17 to KCR/BH#33 - CLAY 2
0
10
20
30
40
50
60
70
80
90
100
0.0010.010.1110100
Seive size
Pass
ing
% a
ge
KCR/BH-17 SPT-3 KCR/BH-19 SPT-3
KCR/BH-19 CRS-4 KCRBH-26 CRS-9
KCRBH-27 SPT-11 KCRBH-27 CRS-9
KCRBH-27 CRS-12 KCRBH-27 CRS-14
KCRBH-28 SPT-7 KCRBH-28 SPT-8
KCRBH-28 SPT-9 KCRBH-29 SPT-7
KCRBH-29 SPT-8 KCRBH-29 SPT-9
KCRBH-29 CRS-12 KCRBH-29 SPT-10
KCRBH-29 SPT-11 KCRBH-29 SPT-12
KCRBH-29 SPT-13 KCRBH-29 SPT-14
KCRBH-32 SPT-9 KCRBH-32 CRS-10
Source: JICA Study Team
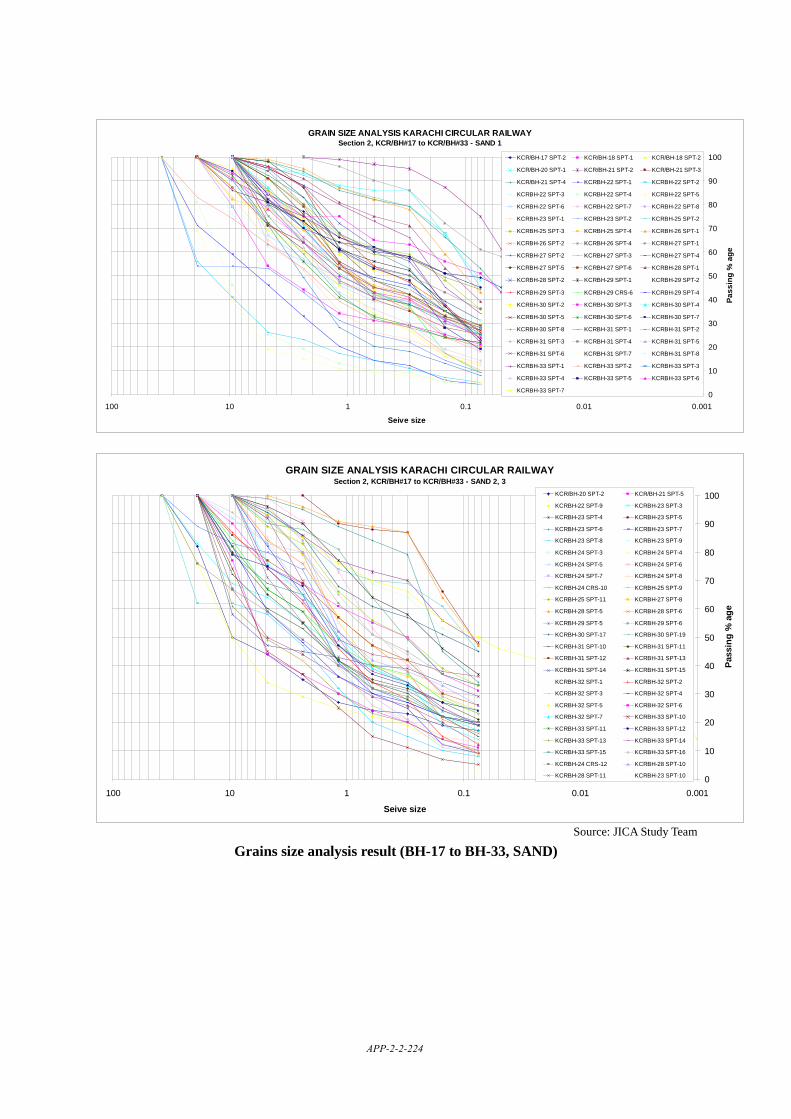
Grains size analysis result (BH-17 to BH-33, CLAY)
APP-2-2-223
GRAIN SIZE ANALYSIS KARACHI CIRCULAR RAILWAY Section 2, KCR/BH#17 to KCR/BH#33 - SAND 1
0
10
20
30
40
50
60
70
80
90
100
0.0010.010.1110100
Seive size
Pass
ing
% a
ge
KCR/BH-17 SPT-2 KCR/BH-18 SPT-1 KCR/BH-18 SPT-2
KCR/BH-20 SPT-1 KCR/BH-21 SPT-2 KCR/BH-21 SPT-3
KCR/BH-21 SPT-4 KCRBH-22 SPT-1 KCRBH-22 SPT-2
KCRBH-22 SPT-3 KCRBH-22 SPT-4 KCRBH-22 SPT-5
KCRBH-22 SPT-6 KCRBH-22 SPT-7 KCRBH-22 SPT-8
KCRBH-23 SPT-1 KCRBH-23 SPT-2 KCRBH-25 SPT-2
KCRBH-25 SPT-3 KCRBH-25 SPT-4 KCRBH-26 SPT-1
KCRBH-26 SPT-2 KCRBH-26 SPT-4 KCRBH-27 SPT-1
KCRBH-27 SPT-2 KCRBH-27 SPT-3 KCRBH-27 SPT-4
KCRBH-27 SPT-5 KCRBH-27 SPT-6 KCRBH-28 SPT-1
KCRBH-28 SPT-2 KCRBH-29 SPT-1 KCRBH-29 SPT-2
KCRBH-29 SPT-3 KCRBH-29 CRS-6 KCRBH-29 SPT-4
KCRBH-30 SPT-2 KCRBH-30 SPT-3 KCRBH-30 SPT-4
KCRBH-30 SPT-5 KCRBH-30 SPT-6 KCRBH-30 SPT-7
KCRBH-30 SPT-8 KCRBH-31 SPT-1 KCRBH-31 SPT-2
KCRBH-31 SPT-3 KCRBH-31 SPT-4 KCRBH-31 SPT-5
KCRBH-31 SPT-6 KCRBH-31 SPT-7 KCRBH-31 SPT-8
KCRBH-33 SPT-1 KCRBH-33 SPT-2 KCRBH-33 SPT-3
KCRBH-33 SPT-4 KCRBH-33 SPT-5 KCRBH-33 SPT-6
KCRBH-33 SPT-7
GRAIN SIZE ANALYSIS KARACHI CIRCULAR RAILWAY Section 2, KCR/BH#17 to KCR/BH#33 - SAND 2, 3
0
10
20
30
40
50
60
70
80
90
100
0.0010.010.1110100
Seive size
Pass
ing
% a
ge
KCR/BH-20 SPT-2 KCR/BH-21 SPT-5
KCRBH-22 SPT-9 KCRBH-23 SPT-3
KCRBH-23 SPT-4 KCRBH-23 SPT-5
KCRBH-23 SPT-6 KCRBH-23 SPT-7
KCRBH-23 SPT-8 KCRBH-23 SPT-9
KCRBH-24 SPT-3 KCRBH-24 SPT-4
KCRBH-24 SPT-5 KCRBH-24 SPT-6
KCRBH-24 SPT-7 KCRBH-24 SPT-8
KCRBH-24 CRS-10 KCRBH-25 SPT-9
KCRBH-25 SPT-11 KCRBH-27 SPT-8
KCRBH-28 SPT-5 KCRBH-28 SPT-6
KCRBH-29 SPT-5 KCRBH-29 SPT-6
KCRBH-30 SPT-17 KCRBH-30 SPT-19
KCRBH-31 SPT-10 KCRBH-31 SPT-11
KCRBH-31 SPT-12 KCRBH-31 SPT-13
KCRBH-31 SPT-14 KCRBH-31 SPT-15
KCRBH-32 SPT-1 KCRBH-32 SPT-2
KCRBH-32 SPT-3 KCRBH-32 SPT-4
KCRBH-32 SPT-5 KCRBH-32 SPT-6
KCRBH-32 SPT-7 KCRBH-33 SPT-10
KCRBH-33 SPT-11 KCRBH-33 SPT-12
KCRBH-33 SPT-13 KCRBH-33 SPT-14
KCRBH-33 SPT-15 KCRBH-33 SPT-16
KCRBH-24 CRS-12 KCRBH-28 SPT-10
KCRBH-28 SPT-11 KCRBH-23 SPT-10
Source: JICA Study Team
Grains size analysis result (BH-17 to BH-33, SAND)
APP-2-2-224
GRAIN SIZE ANALYSIS KARACHI CIRCULAR RAILWAY Section 3, KCR/BH#34 to KCR/BH#49 - CLAY 1
0
10
20
30
40
50
60
70
80
90
100
0.0010.010.1110100
Seive size
Pass
ing
% a
ge
KCRBH-37 SPT-1
KCRBH-37 SPT-2
KCRBH-37 SPT-3
KCRBH-40 SPT-1
KCRBH-40 SPT-2
KCRBH-40 SPT-3
KCRBH-40 SPT-4
KCRBH-44 SPT-2
KCRBH-44 SPT-3
KCRBH-45 SPT-1
KCRBH-45 SPT-2
KCRBH-45 SPT-3
KCRBH-45 CRS-4
KCRBH-46 SPT-1
KCRBH-49 SPT-5
GRAIN SIZE ANALYSIS KARACHI CIRCULAR RAILWAY Section 3, KCR/BH#34 to KCR/BH#49 - CLAY 2
0
10
20
30
40
50
60
70
80
90
100
0.0010.010.1110100
Seive size
Pass
ing
% a
ge
KCRBH-34 CRS-17
KCRBH-37 CRS-20
KCRBH-39 SPT-10
KCRBH-39 CRS-17
KCRBH-40 CRS-15
KCRBH-40 CRS-19
KCRBH-43 SPT-1
KCRBH-43 SPT-2
KCRBH-43 SPT-3
KCRBH-43 SPT-4
KCRBH-45 SPT-4
KCRBH-46 SPT-4
KCRBH-46 CRS-5
KCRBH-47 SPT-3
KCRBH-48 SPT-4
KCRBH-48 SPT-5
KCRBH-48 SPT-6
KCRBH-48 CRS-4
KCRBH-49 SPT-7
KCRBH-47 SPT-4
Source: JICA Study Team
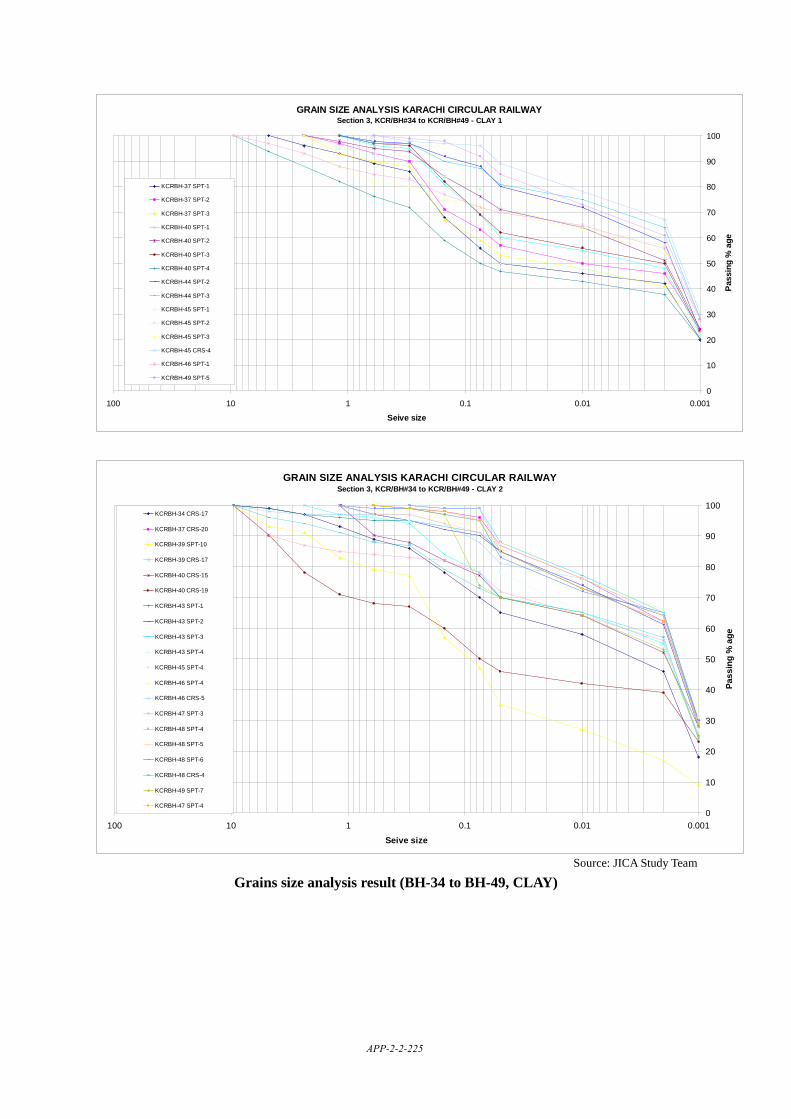
Grains size analysis result (BH-34 to BH-49, CLAY)
APP-2-2-225
GRAIN SIZE ANALYSIS KARACHI CIRCULAR RAILWAY Section 3, KCR/BH#34 to KCR/BH#49 - SAND 1
0
10
20
30
40
50
60
70
80
90
100
0.0010.010.1110100
Seive size
Pass
ing
% a
ge
KCRBH-34 SPT-1
KCRBH-36 SPT-2
KCRBH-41 SPT-1
KCRBH-41 SPT-2
KCRBH-41 SPT-3
KCRBH-44 SPT-1
KCRBH-47 SPT-1
KCRBH-47 SPT-2
KCRBH-49 SPT-1
KCRBH-49 SPT-2
KCRBH-49 SPT-3
KCRBH-49 SPT-4
GRAIN SIZE ANALYSIS KARACHI CIRCULAR RAILWAY Section 3, KCR/BH#34 to KCR/BH#49 - SAND 2
0
10
20
30
40
50
60
70
80
90
100
0.0010.010.1110100
Seive size
Pass
ing
% a
ge
KCRBH-34 SPT-2 KCRBH-34 SPT-3 KCRBH-34 SPT-4
KCRBH-34 SPT-5 KCRBH-34 SPT-6 KCRBH-34 SPT-7
KCRBH-34 SPT-8 KCRBH-34 SPT-9 KCRBH-34 SPT-10
KCRBH-34 SPT-11 KCRBH-34 SPT-12 KCRBH-34 SPT-13
KCRBH-34 CRS-20 KCRBH-35 SPT-2 KCRBH-35 SPT-3
KCRBH-35 SPT-4 KCRBH-35 SPT-5 KCRBH-35 SPT-6
KCRBH-35 SPT-7 KCRBH-35 SPT-8 KCRBH-35 SPT-9
KCRBH-35 SPT-10 KCRBH-35 SPT-11 KCRBH-35 SPT-12
KCRBH-35 SPT-13 KCRBH-35 SPT-14 KCRBH-35 CRS-16
KCRBH-35 CRS-19 KCRBH-36 SPT-3 KCRBH-36 SPT-4
KCRBH-36 SPT-5 KCRBH-36 SPT-6 KCRBH-36 SPT-7
KCRBH-36 SPT-8 KCRBH-37 SPT-4 KCRBH-37 SPT-5
KCRBH-37 SPT-6 KCRBH-37 SPT-7 KCRBH-37 SPT-8
KCRBH-37 SPT-9 KCRBH-37 SPT-10 KCRBH-38 SPT-1
KCRBH-38 SPT-2 KCRBH-38 SPT-3 KCRBH-38 SPT-4
KCRBH-38 CRS-13 KCRBH-39 SPT-2 KCRBH-39 SPT-3
KCRBH-39 SPT-4 KCRBH-39 SPT-5 KCRBH-39 SPT-6
KCRBH-39 SPT-7 KCRBH-39 SPT-8 KCRBH-39 SPT-9
KCRBH-40 SPT-5 KCRBH-40 SPT-6 KCRBH-40 SPT-7
KCRBH-41 SPT-5 KCRBH-41 SPT-6 KCRBH-41 CRS-10
KCRBH-41 CRS-13 KCRBH-42 SPT-1 KCRBH-42 SPT-2
KCRBH-42 SPT-3 KCRBH-42 SPT-4 KCRBH-42 SPT-5
KCRBH-42 SPT-6 KCRBH-42 CRS-8 KCRBH-42 SPT-8
KCRBH-42 SPT-9 KCRBH-46 SPT-2 KCRBH-46 SPT-3
KCRBH-47 SPT-5 KCRBH-47 CRS-6 KCRBH-49 SPT-6
Source: JICA Study Team
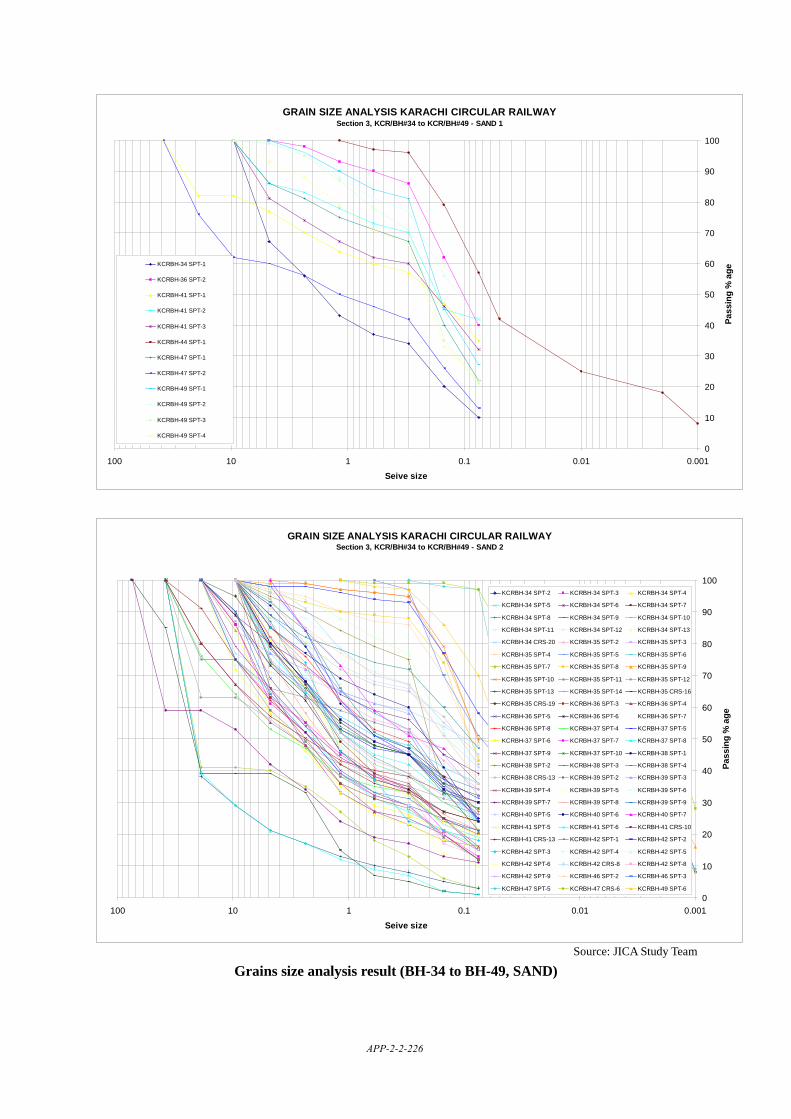
Grains size analysis result (BH-34 to BH-49, SAND)
APP-2-2-226
GRAIN SIZE ANALYSIS KARACHI CIRCULAR RAILWAY Section 4, KCR/BH#49 to KCR/BH#64 - CLAY 1
0
10
20
30
40
50
60
70
80
90
100
0.0010.010.1110100
Seive size
Pass
ing
% a
ge
KCRBH-50 SPT-3 KCRBH-50 SPT-4
KCRBH-51 CRS-6 KCRBH-51 SPT-6
KCRBH-52 SPT-3 KCRBH-52 SPT-4
KCRBH-52 SPT-5 KCRBH-53 SPT-3
KCRBH-54 SPT-2 KCRBH-54 SPT-3
KCRBH-54 SPT-4 KCRBH-54 SPT-5
KCRBH-55 SPT-3 KCRBH-55 SPT-5
KCRBH-55 CRS-6 KCRBH-55 SPT-6
KCRBH-56 SPT-3 KCRBH-57 SPT-5
KCRBH-57 SPT-6 KCRBH-57 SPT-7
KCRBH-58 SPT-3 KCRBH-58 SPT-4
KCRBH-58 SPT-5 KCRBH-61 SPT-3
KCRBH-62 SPT-3 KCRBH-62 SPT-4
KCRBH-62 SPT-6 KCRBH-63 SPT-2
GRAIN SIZE ANALYSIS KARACHI CIRCULAR RAILWAY Section 4, KCR/BH#49 to KCR/BH#64 - CLAY 2, 3
0
10
20
30
40
50
60
70
80
90
100
0.0010.010.1110100
Seive size
Pass
ing
% a
ge
KCRBH-50 SPT-11 KCRBH-50 CRS-12 KCRBH-51 SPT-12 KCRBH-51 CRS-13KCRBH-52 SPT-8 KCRBH-53 SPT-12 KCRBH-53 SPT-13 KCRBH-53 SPT-14KCRBH-53 SPT-15 KCRBH-54 SPT-8 KCRBH-54 SPT-9 KCRBH-56 CRS-8KCRBH-56 SPT-8 KCRBH-57 SPT-18 KCRBH-57 SPT-19 KCRBH-57 SPT-20KCRBH-57 SPT-21 KCRBH-58 SPT-11 KCRBH-58 SPT-12 KCRBH-58 SPT-13KCRBH-59 SPT-7 KCRBH-59 SPT-8 KCRBH-59 SPT-10 KCRBH-60 SPT-9KCRBH-60 CRS-13 KCRBH-61 SPT-5 KCRBH-61 SPT-6 KCRBH-61 SPT-7KCRBH-61 SPT-8 KCRBH-62 SPT-15 KCRBH-62 SPT-16 KCRBH-62 CRS-18KCRBH-64 SPT-6 KCRBH-52 SPT-13 KCRBH-52 CRS-14 KCRBH-52 SPT-15KCRBH-52 CRS-16 KCRBH-52 SPT-16 KCRBH-54 SPT-12 KCRBH-54 SPT-13KCRBH-54 SPT-15 KCRBH-54 SPT-16 KCRBH-54 SPT-17 KCRBH-54 CRS-18KCRBH-55 CRS-16 KCRBH-55 SPT-12 KCRBH-55 SPT-13 KCRBH-55 SPT-14KCRBH-55 SPT-15 KCRBH-55 CRS-20 KCRBH-56 SPT-12 KCRBH-56 SPT-13KCRBH-56 CRS-14 KCRBH-56 SPT-14 KCRBH-56 SPT-15 KCRBH-58 SPT-17KCRBH-58 CRS-18 KCRBH-58 SPT-18 KCRBH-58 SPT-19 KCRBH-59 SPT-15KCRBH-60 CRS-27 KCRBH-56 CRS-29
Source: JICA Study Team
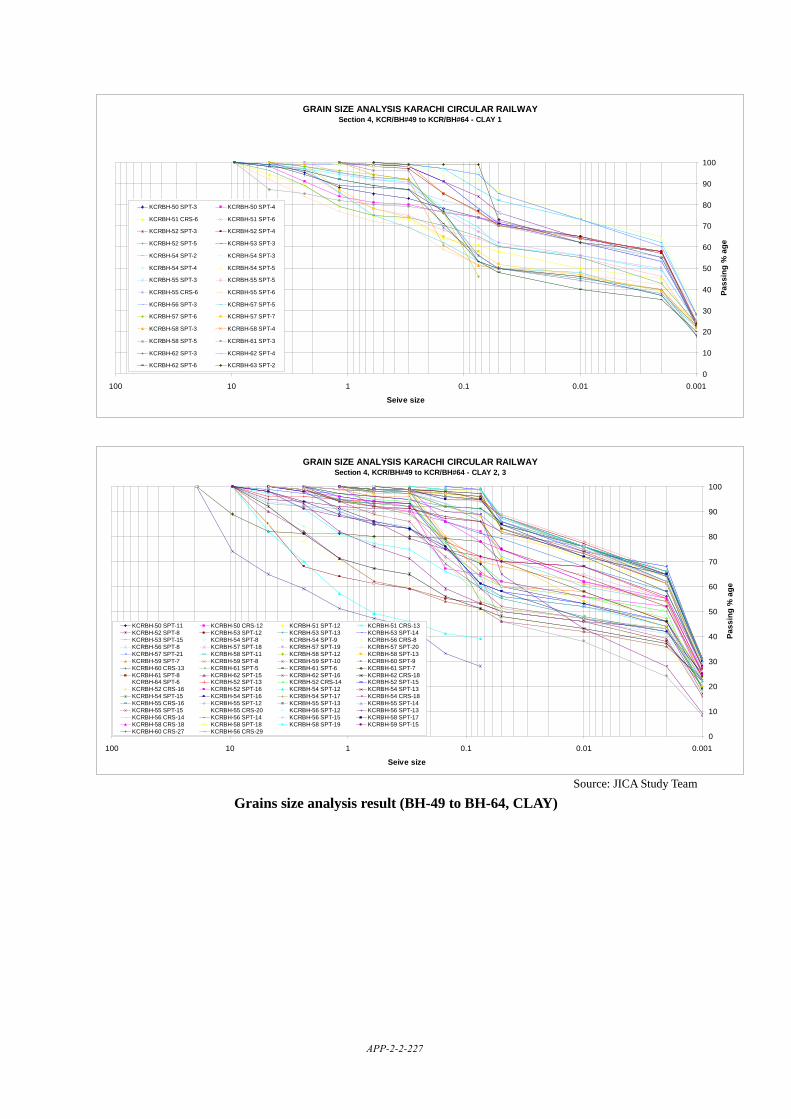
Grains size analysis result (BH-49 to BH-64, CLAY)
APP-2-2-227
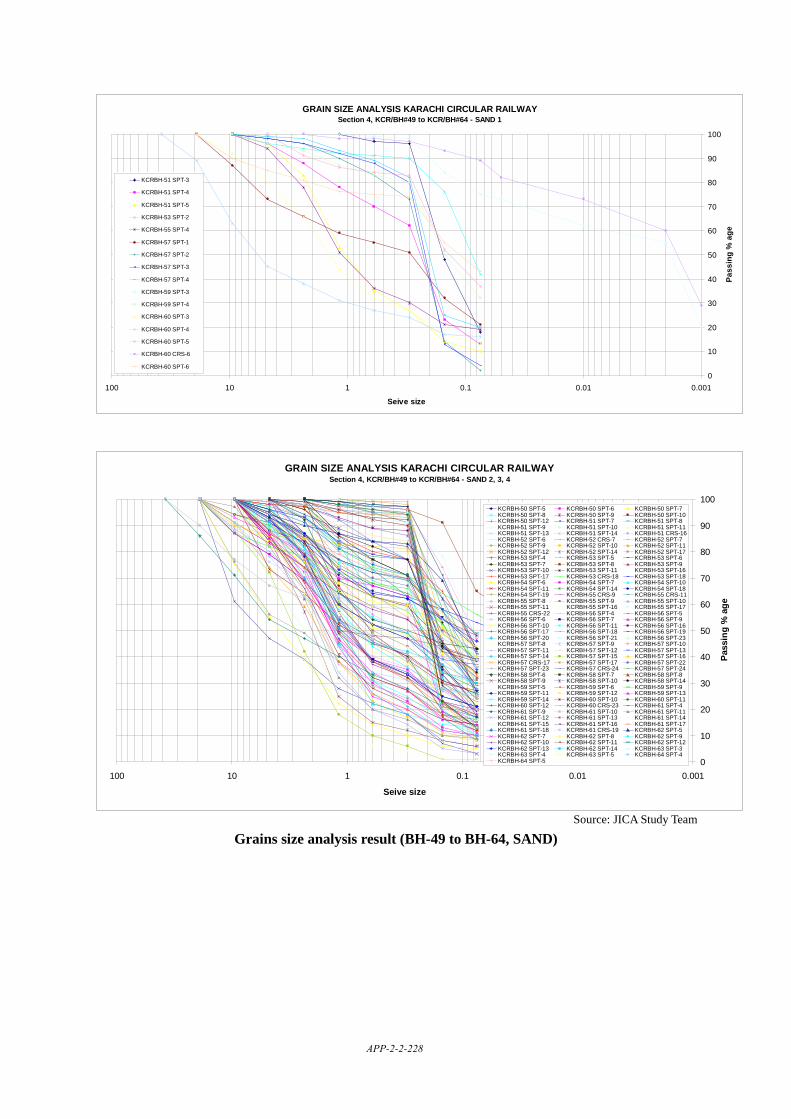
GRAIN SIZE ANALYSIS KARACHI CIRCULAR RAILWAY Section 4, KCR/BH#49 to KCR/BH#64 - SAND 1
0
10
20
30
40
50
60
70
80
90
100
0.0010.010.1110100
Seive size
Pass
ing
% a
ge
KCRBH-51 SPT-3
KCRBH-51 SPT-4
KCRBH-51 SPT-5
KCRBH-53 SPT-2
KCRBH-55 SPT-4
KCRBH-57 SPT-1
KCRBH-57 SPT-2
KCRBH-57 SPT-3
KCRBH-57 SPT-4
KCRBH-59 SPT-3
KCRBH-59 SPT-4
KCRBH-60 SPT-3
KCRBH-60 SPT-4
KCRBH-60 SPT-5
KCRBH-60 CRS-6
KCRBH-60 SPT-6
GRAIN SIZE ANALYSIS KARACHI CIRCULAR RAILWAY Section 4, KCR/BH#49 to KCR/BH#64 - SAND 2, 3, 4
0
10
20
30
40
50
60
70
80
90
100
0.0010.010.1110100
Seive size
Pass
ing
% a
ge
KCRBH-50 SPT-5 KCRBH-50 SPT-6 KCRBH-50 SPT-7KCRBH-50 SPT-8 KCRBH-50 SPT-9 KCRBH-50 SPT-10KCRBH-50 SPT-12 KCRBH-51 SPT-7 KCRBH-51 SPT-8KCRBH-51 SPT-9 KCRBH-51 SPT-10 KCRBH-51 SPT-11KCRBH-51 SPT-13 KCRBH-51 SPT-14 KCRBH-51 CRS-16KCRBH-52 SPT-6 KCRBH-52 CRS-7 KCRBH-52 SPT-7KCRBH-52 SPT-9 KCRBH-52 SPT-10 KCRBH-52 SPT-11KCRBH-52 SPT-12 KCRBH-52 SPT-14 KCRBH-52 SPT-17KCRBH-53 SPT-4 KCRBH-53 SPT-5 KCRBH-53 SPT-6KCRBH-53 SPT-7 KCRBH-53 SPT-8 KCRBH-53 SPT-9KCRBH-53 SPT-10 KCRBH-53 SPT-11 KCRBH-53 SPT-16KCRBH-53 SPT-17 KCRBH-53 CRS-18 KCRBH-53 SPT-18KCRBH-54 SPT-6 KCRBH-54 SPT-7 KCRBH-54 SPT-10KCRBH-54 SPT-11 KCRBH-54 SPT-14 KCRBH-54 SPT-18KCRBH-54 SPT-19 KCRBH-55 CRS-9 KCRBH-55 CRS-11KCRBH-55 SPT-8 KCRBH-55 SPT-9 KCRBH-55 SPT-10KCRBH-55 SPT-11 KCRBH-55 SPT-16 KCRBH-55 SPT-17KCRBH-55 CRS-22 KCRBH-56 SPT-4 KCRBH-56 SPT-5KCRBH-56 SPT-6 KCRBH-56 SPT-7 KCRBH-56 SPT-9KCRBH-56 SPT-10 KCRBH-56 SPT-11 KCRBH-56 SPT-16KCRBH-56 SPT-17 KCRBH-56 SPT-18 KCRBH-56 SPT-19KCRBH-56 SPT-20 KCRBH-56 SPT-21 KCRBH-56 SPT-23KCRBH-57 SPT-8 KCRBH-57 SPT-9 KCRBH-57 SPT-10KCRBH-57 SPT-11 KCRBH-57 SPT-12 KCRBH-57 SPT-13KCRBH-57 SPT-14 KCRBH-57 SPT-15 KCRBH-57 SPT-16KCRBH-57 CRS-17 KCRBH-57 SPT-17 KCRBH-57 SPT-22KCRBH-57 SPT-23 KCRBH-57 CRS-24 KCRBH-57 SPT-24KCRBH-58 SPT-6 KCRBH-58 SPT-7 KCRBH-58 SPT-8KCRBH-58 SPT-9 KCRBH-58 SPT-10 KCRBH-58 SPT-14KCRBH-59 SPT-5 KCRBH-59 SPT-6 KCRBH-59 SPT-9KCRBH-59 SPT-11 KCRBH-59 SPT-12 KCRBH-59 SPT-13KCRBH-59 SPT-14 KCRBH-60 SPT-10 KCRBH-60 SPT-11KCRBH-60 SPT-12 KCRBH-60 CRS-23 KCRBH-61 SPT-4KCRBH-61 SPT-9 KCRBH-61 SPT-10 KCRBH-61 SPT-11KCRBH-61 SPT-12 KCRBH-61 SPT-13 KCRBH-61 SPT-14KCRBH-61 SPT-15 KCRBH-61 SPT-16 KCRBH-61 SPT-17KCRBH-61 SPT-18 KCRBH-61 CRS-19 KCRBH-62 SPT-5KCRBH-62 SPT-7 KCRBH-62 SPT-8 KCRBH-62 SPT-9KCRBH-62 SPT-10 KCRBH-62 SPT-11 KCRBH-62 SPT-12KCRBH-62 SPT-13 KCRBH-62 SPT-14 KCRBH-63 SPT-3KCRBH-63 SPT-4 KCRBH-63 SPT-5 KCRBH-64 SPT-4KCRBH-64 SPT-5
Source: JICA Study Team
Grains size analysis result (BH-49 to BH-64, SAND)
APP-2-2-228
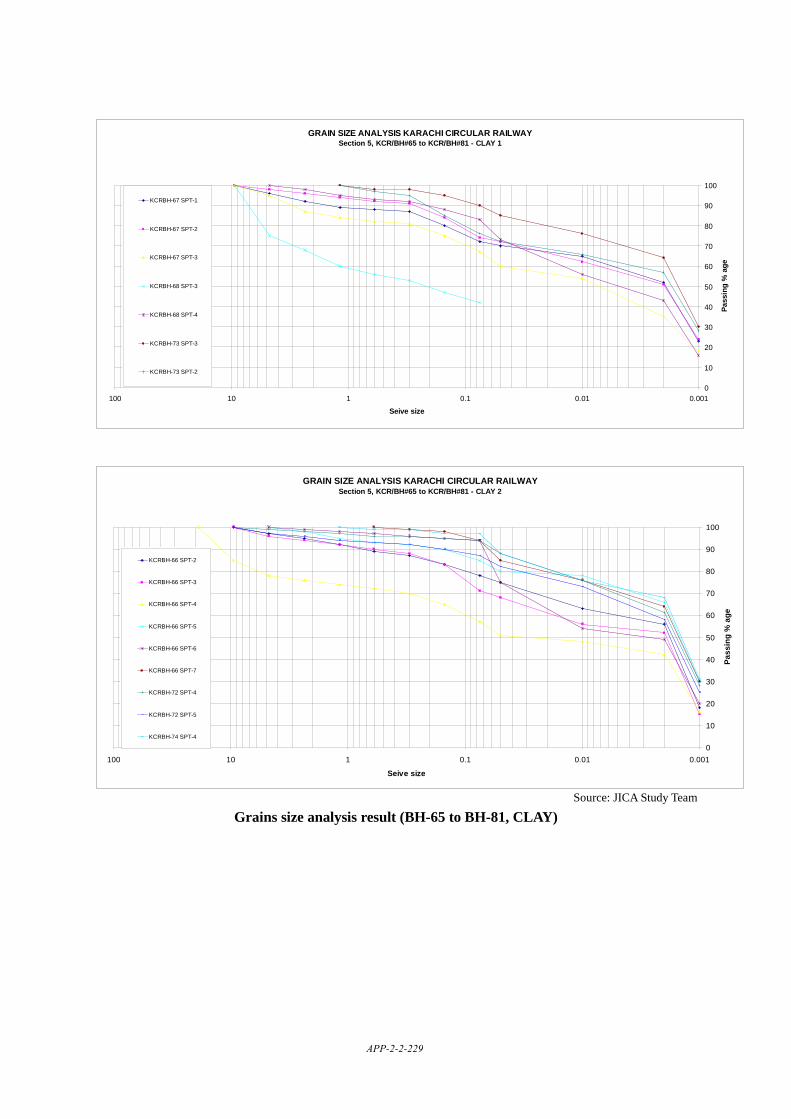
GRAIN SIZE ANALYSIS KARACHI CIRCULAR RAILWAY Section 5, KCR/BH#65 to KCR/BH#81 - CLAY 1
0
10
20
30
40
50
60
70
80
90
100
0.0010.010.1110100
Seive size
Pass
ing
% a
ge
KCRBH-67 SPT-1
KCRBH-67 SPT-2
KCRBH-67 SPT-3
KCRBH-68 SPT-3
KCRBH-68 SPT-4
KCRBH-73 SPT-3
KCRBH-73 SPT-2
GRAIN SIZE ANALYSIS KARACHI CIRCULAR RAILWAY Section 5, KCR/BH#65 to KCR/BH#81 - CLAY 2
0
10
20
30
40
50
60
70
80
90
100
0.0010.010.1110100
Seive size
Pass
ing
% a
ge
KCRBH-66 SPT-2
KCRBH-66 SPT-3
KCRBH-66 SPT-4
KCRBH-66 SPT-5
KCRBH-66 SPT-6
KCRBH-66 SPT-7
KCRBH-72 SPT-4
KCRBH-72 SPT-5
KCRBH-74 SPT-4
Source: JICA Study Team
Grains size analysis result (BH-65 to BH-81, CLAY)
APP-2-2-229
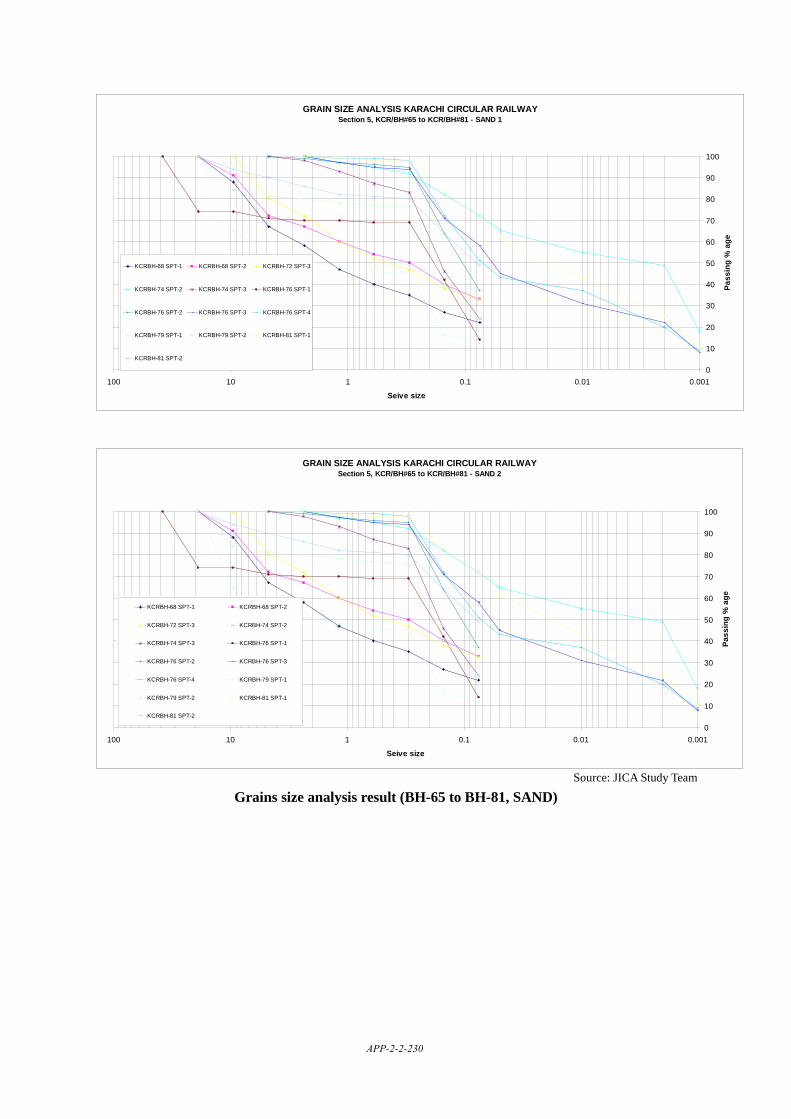
GRAIN SIZE ANALYSIS KARACHI CIRCULAR RAILWAY Section 5, KCR/BH#65 to KCR/BH#81 - SAND 1
0
10
20
30
40
50
60
70
80
90
100
0.0010.010.1110100
Seive size
Pass
ing
% a
ge
KCRBH-68 SPT-1 KCRBH-68 SPT-2 KCRBH-72 SPT-3
KCRBH-74 SPT-2 KCRBH-74 SPT-3 KCRBH-76 SPT-1
KCRBH-76 SPT-2 KCRBH-76 SPT-3 KCRBH-76 SPT-4
KCRBH-79 SPT-1 KCRBH-79 SPT-2 KCRBH-81 SPT-1
KCRBH-81 SPT-2
GRAIN SIZE ANALYSIS KARACHI CIRCULAR RAILWAY Section 5, KCR/BH#65 to KCR/BH#81 - SAND 2
0
10
20
30
40
50
60
70
80
90
100
0.0010.010.1110100
Seive size
Pass
ing
% a
ge
KCRBH-68 SPT-1 KCRBH-68 SPT-2
KCRBH-72 SPT-3 KCRBH-74 SPT-2
KCRBH-74 SPT-3 KCRBH-76 SPT-1
KCRBH-76 SPT-2 KCRBH-76 SPT-3
KCRBH-76 SPT-4 KCRBH-79 SPT-1
KCRBH-79 SPT-2 KCRBH-81 SPT-1
KCRBH-81 SPT-2
Source: JICA Study Team
Grains size analysis result (BH-65 to BH-81, SAND)
APP-2-2-230
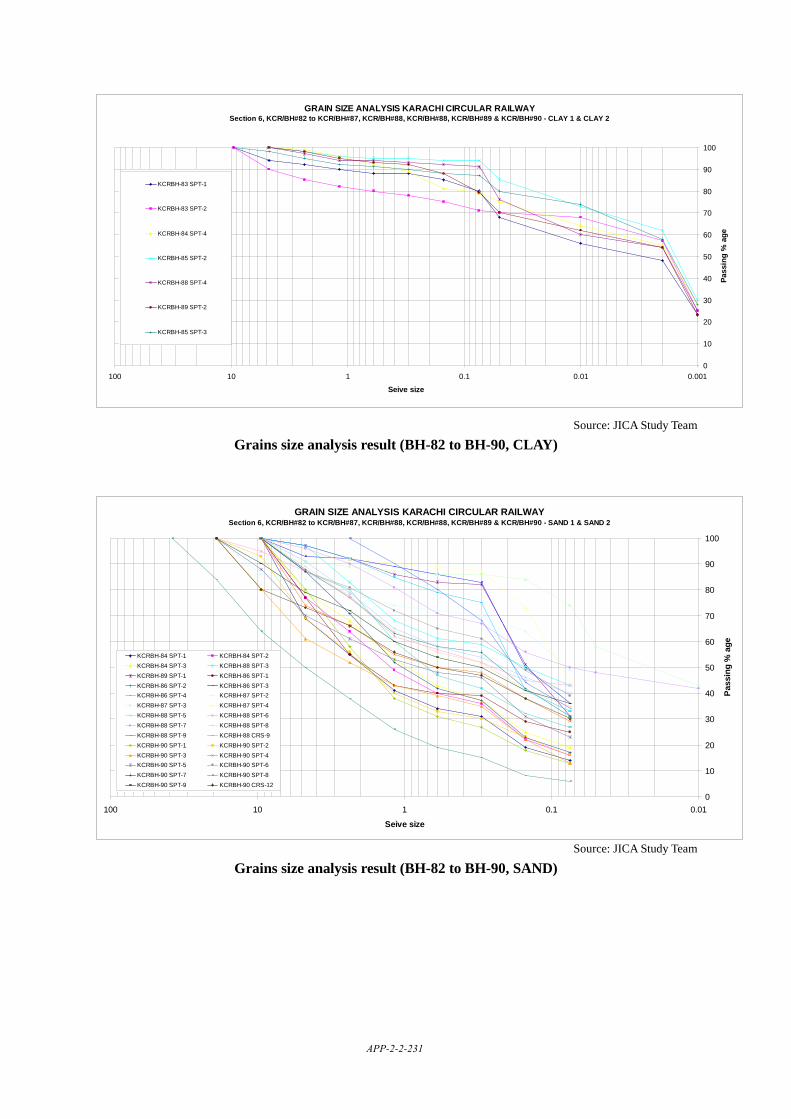
GRAIN SIZE ANALYSIS KARACHI CIRCULAR RAILWAY Section 6, KCR/BH#82 to KCR/BH#87, KCR/BH#88, KCR/BH#88, KCR/BH#89 & KCR/BH#90 - CLAY 1 & CLAY 2
0
10
20
30
40
50
60
70
80
90
100
0.0010.010.1110100
Seive size
Pass
ing
% a
ge
KCRBH-83 SPT-1
KCRBH-83 SPT-2
KCRBH-84 SPT-4
KCRBH-85 SPT-2
KCRBH-88 SPT-4
KCRBH-89 SPT-2
KCRBH-85 SPT-3
Source: JICA Study Team
Grains size analysis result (BH-82 to BH-90, CLAY)
GRAIN SIZE ANALYSIS KARACHI CIRCULAR RAILWAY Section 6, KCR/BH#82 to KCR/BH#87, KCR/BH#88, KCR/BH#88, KCR/BH#89 & KCR/BH#90 - SAND 1 & SAND 2
0
10
20
30
40
50
60
70
80
90
100
0.010.1110100
Seive size
Pass
ing
% a
ge
KCRBH-84 SPT-1 KCRBH-84 SPT-2KCRBH-84 SPT-3 KCRBH-88 SPT-3KCRBH-89 SPT-1 KCRBH-86 SPT-1KCRBH-86 SPT-2 KCRBH-86 SPT-3KCRBH-86 SPT-4 KCRBH-87 SPT-2KCRBH-87 SPT-3 KCRBH-87 SPT-4KCRBH-88 SPT-5 KCRBH-88 SPT-6KCRBH-88 SPT-7 KCRBH-88 SPT-8KCRBH-88 SPT-9 KCRBH-88 CRS-9KCRBH-90 SPT-1 KCRBH-90 SPT-2KCRBH-90 SPT-3 KCRBH-90 SPT-4KCRBH-90 SPT-5 KCRBH-90 SPT-6KCRBH-90 SPT-7 KCRBH-90 SPT-8KCRBH-90 SPT-9 KCRBH-90 CRS-12
Source: JICA Study Team
Grains size analysis result (BH-82 to BH-90, SAND)
APP-2-2-231
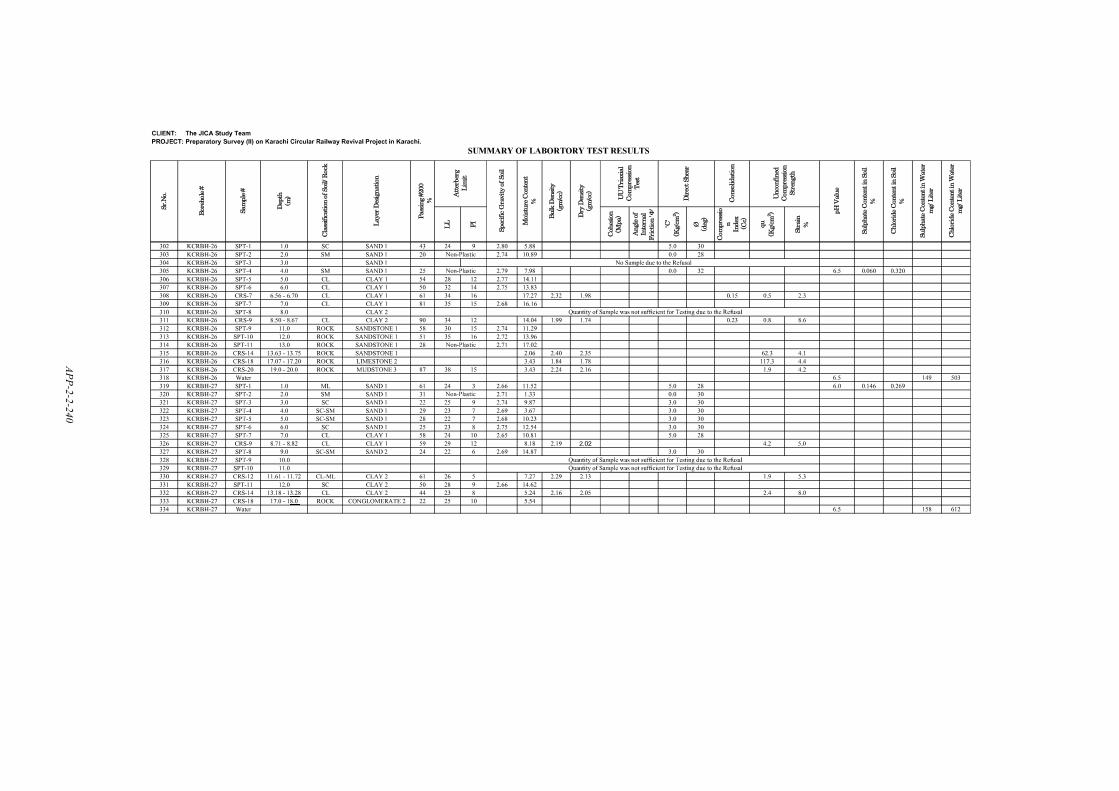
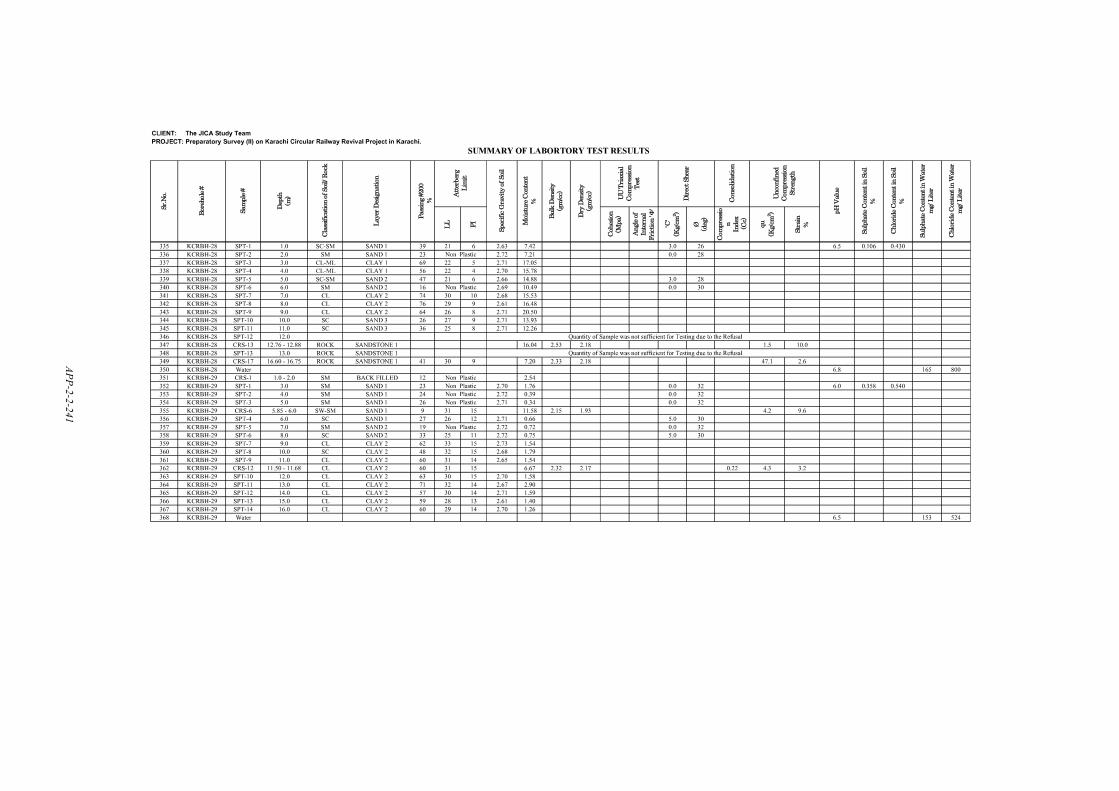
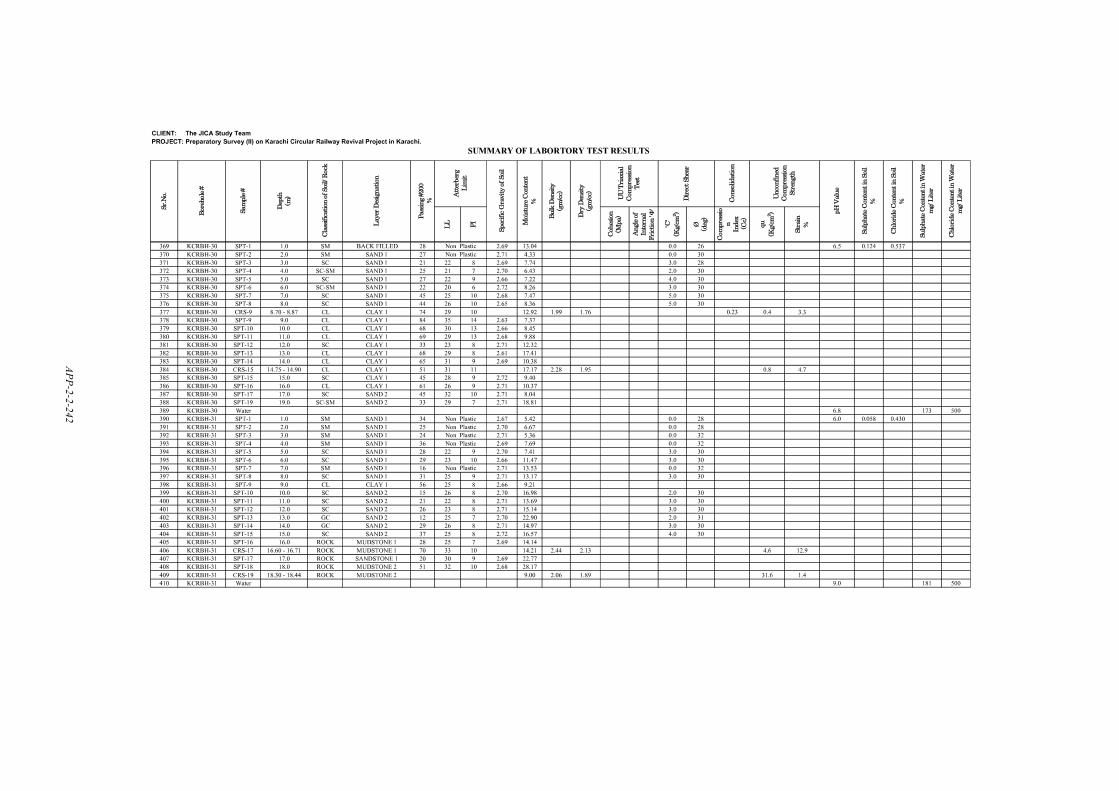
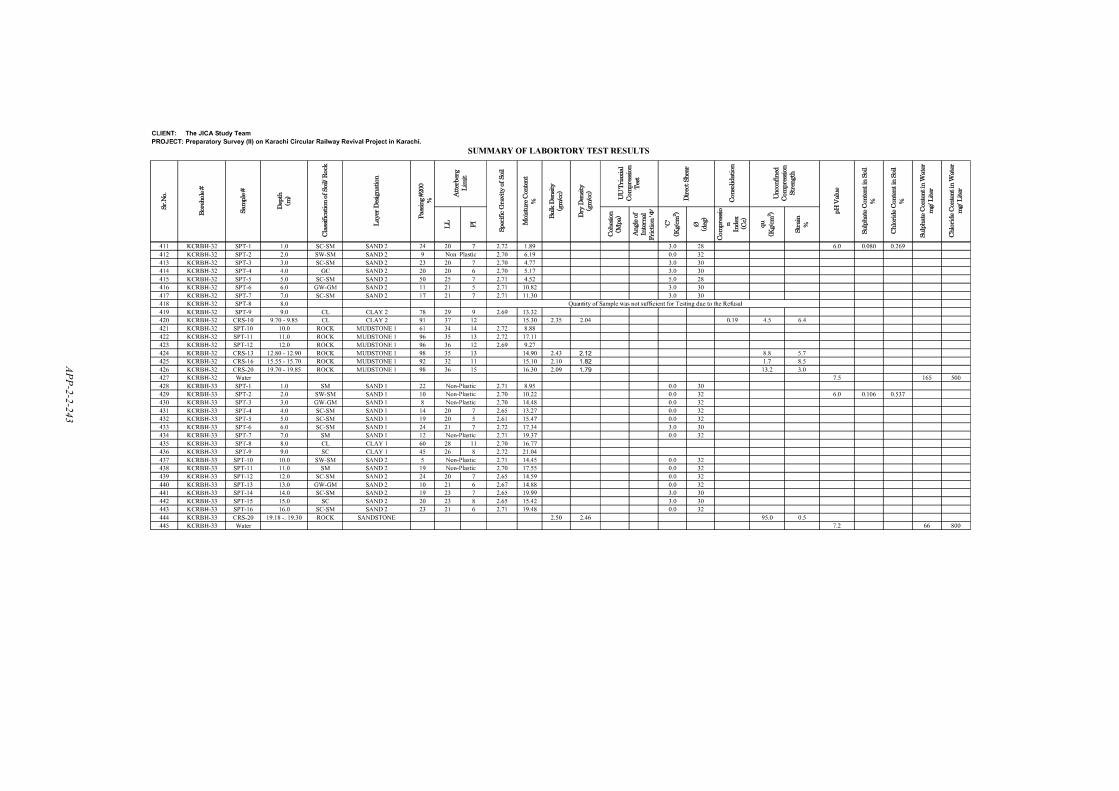
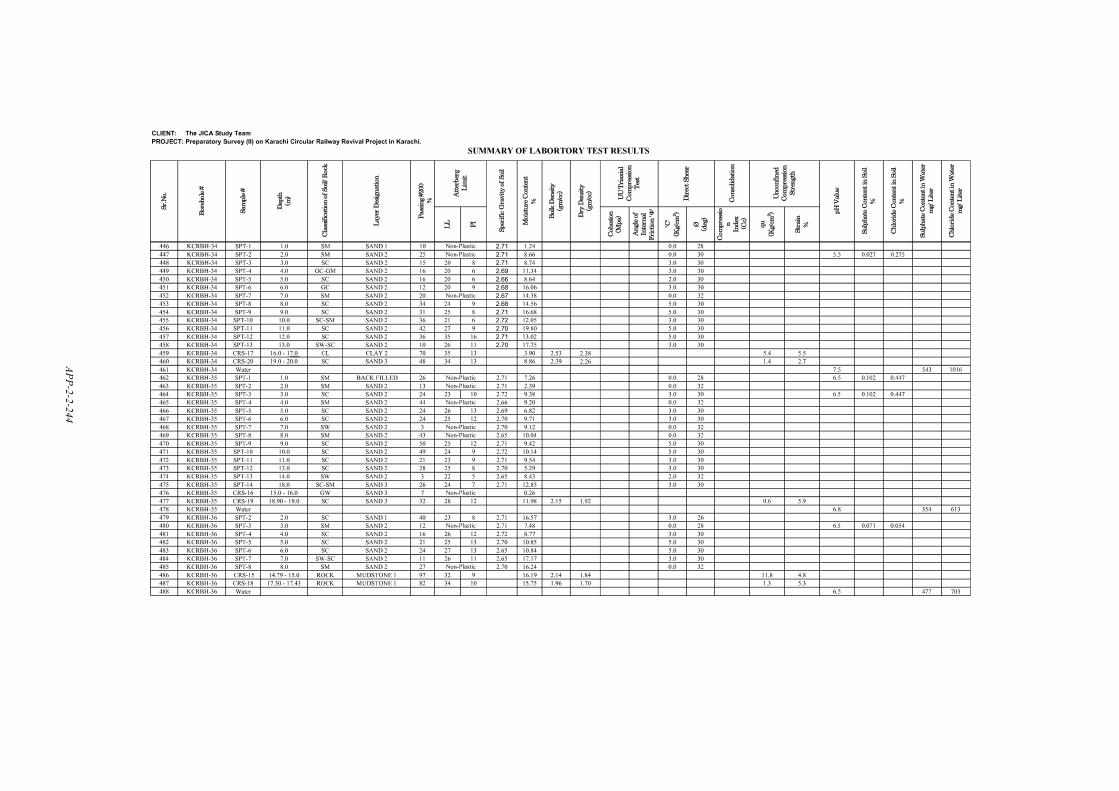
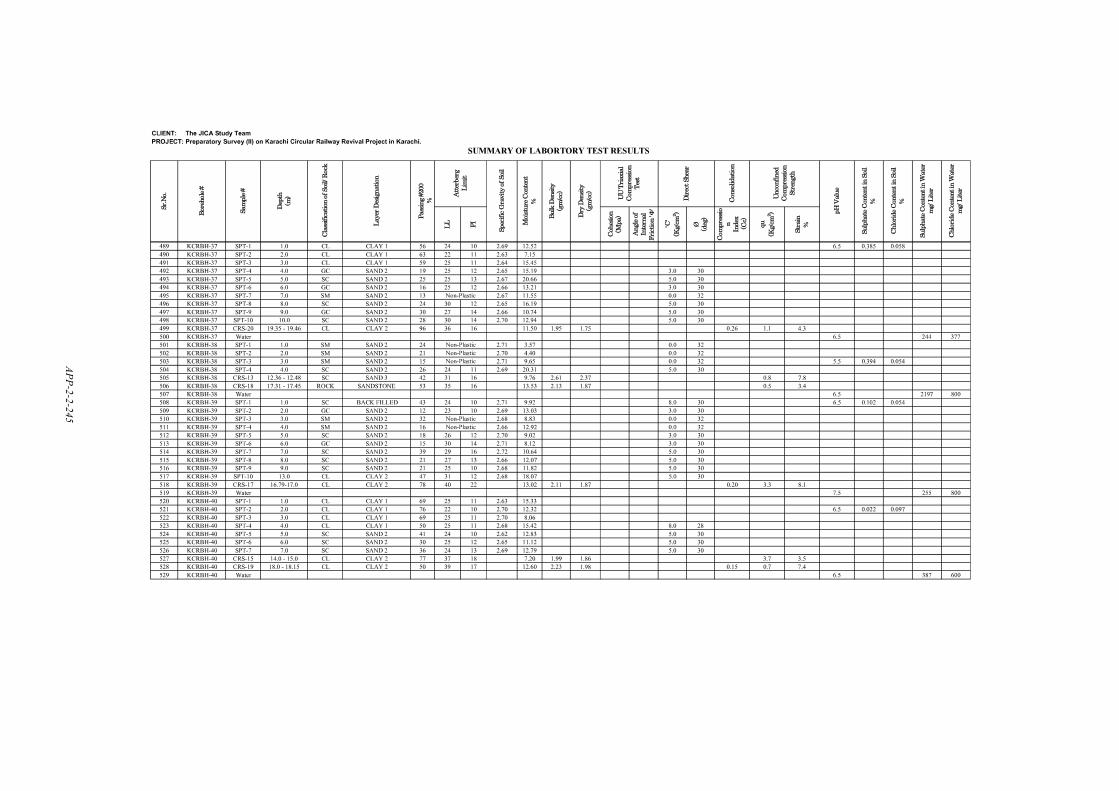
Consolidation
LL
PI
Cohesion(Mpa)
Angle of Internal
Friction ''
'C'(Kg/cm
2)
Ø(deg)
Compression
Index (Cc)
qu(Kg/cm
2)
Strain%
Sr.No.
Borehole #
Sample #
Depth(m)
Classification of Soil/ Rock
Layer Designation
Moisture Content%
Chloride Content in Watermg/ Liter
Direct Shear
Dry Density(gm/cc)
Bulk Density(gm/cc)
Specific Gravity of Soil
Passing #200 %
Atterberg Limit
Sulphate Content in Soil%
Sulphate Content in Watermg/ Liter
Chloride Content in Soil%
UnconfinedCompression
Strength
pH Value
UU Triaxial Compression
Test
APP2 - 2 - 2 0 3
3.2 Summary
APP-2-2-232
Con
solid
atio
n
LL PI
Coh
esio
n(M
pa)
Ang
le o
f In
tern
al
Fri
ctio
n '
'
'C'
(Kg/
cm2 )
Ø(d
eg)
Com
pres
sio
nIn
dex
(Cc)
qu(K
g/cm
2 )
Stra
in%
Sr.N
o.
Bor
ehol
e #
Sam
ple
#
Dep
th(m
)
Cla
ssif
icat
ion
of S
oil/
Roc
k
Lay
er D
esig
natio
n
Moi
stur
e C
onte
nt%
Chl
orid
e C
onte
nt in
Wat
erm
g/ L
iter
Dir
ect S
hear
Dry
Den
sity
(gm
/cc)
Bul
k D
ensi
ty(g
m/c
c)
Spec
ific
Gra
vity
of
Soil
Pass
ing
#200
%
Att
erbe
rg
Lim
it
Sulp
hate
Con
tent
in S
oil
%
Sulp
hate
Con
tent
in W
ater
mg/
Lit
er
Chl
orid
e C
onte
nt in
Soi
l%
Unc
onfi
ned
Com
pres
sion
St
reng
th
pH V
alue
UU
Tri
axia
l C
ompr
essi
on
Tes
t
AP
P2
-2
-2
04
APP-2-2-233
Con
solid
atio
n
LL PI
Coh
esio
n(M
pa)
Ang
le o
f In
tern
al
Fri
ctio
n '
'
'C'
(Kg/
cm2 )
Ø(d
eg)
Com
pres
sio
nIn
dex
(Cc)
qu(K
g/cm
2 )
Stra
in%
Sr.N
o.
Bor
ehol
e #
Sam
ple
#
Dep
th(m
)
Cla
ssif
icat
ion
of S
oil/
Roc
k
Lay
er D
esig
natio
n
Moi
stur
e C
onte
nt%
Chl
orid
e C
onte
nt in
Wat
erm
g/ L
iter
Dir
ect S
hear
Dry
Den
sity
(gm
/cc)
Bul
k D
ensi
ty(g
m/c
c)
Spec
ific
Gra
vity
of
Soil
Pass
ing
#200
%
Att
erbe
rg
Lim
it
Sulp
hate
Con
tent
in S
oil
%
Sulp
hate
Con
tent
in W
ater
mg/
Lit
er
Chl
orid
e C
onte
nt in
Soi
l%
Unc
onfi
ned
Com
pres
sion
St
reng
th
pH V
alue
UU
Tri
axia
l C
ompr
essi
on
Tes
t
AP
P2
-2
-2
05
APP-2-2-234
Con
solid
atio
n
LL PI
Coh
esio
n(M
pa)
Ang
le o
f In
tern
al
Fri
ctio
n '
'
'C'
(Kg/
cm2 )
Ø(d
eg)
Com
pres
sio
nIn
dex
(Cc)
qu(K
g/cm
2 )
Stra
in%
Sr.N
o.
Bor
ehol
e #
Sam
ple
#
Dep
th(m
)
Cla
ssif
icat
ion
of S
oil/
Roc
k
Lay
er D
esig
natio
n
Moi
stur
e C
onte
nt%
Chl
orid
e C
onte
nt in
Wat
erm
g/ L
iter
Dir
ect S
hear
Dry
Den
sity
(gm
/cc)
Bul
k D
ensi
ty(g
m/c
c)
Spec
ific
Gra
vity
of
Soil
Pass
ing
#200
%
Att
erbe
rg
Lim
it
Sulp
hate
Con
tent
in S
oil
%
Sulp
hate
Con
tent
in W
ater
mg/
Lit
er
Chl
orid
e C
onte
nt in
Soi
l%
Unc
onfi
ned
Com
pres
sion
St
reng
th
pH V
alue
UU
Tri
axia
l C
ompr
essi
on
Tes
t
AP
P2
-2
-2
06
APP-2-2-235
Con
solid
atio
n
LL PI
Coh
esio
n(M
pa)
Ang
le o
f In
tern
al
Fri
ctio
n '
'
'C'
(Kg/
cm2 )
Ø(d
eg)
Com
pres
sio
nIn
dex
(Cc)
qu(K
g/cm
2 )
Stra
in%
Sr.N
o.
Bor
ehol
e #
Sam
ple
#
Dep
th(m
)
Cla
ssif
icat
ion
of S
oil/
Roc
k
Lay
er D
esig
natio
n
Moi
stur
e C
onte
nt%
Chl
orid
e C
onte
nt in
Wat
erm
g/ L
iter
Dir
ect S
hear
Dry
Den
sity
(gm
/cc)
Bul
k D
ensi
ty(g
m/c
c)
Spec
ific
Gra
vity
of
Soil
Pass
ing
#200
%
Att
erbe
rg
Lim
it
Sulp
hate
Con
tent
in S
oil
%
Sulp
hate
Con
tent
in W
ater
mg/
Lit
er
Chl
orid
e C
onte
nt in
Soi
l%
Unc
onfi
ned
Com
pres
sion
St
reng
th
pH V
alue
UU
Tri
axia
l C
ompr
essi
on
Tes
t
AP
P2
-2
-2
07
APP-2-2-236
Con
solid
atio
n
LL PI
Coh
esio
n(M
pa)
Ang
le o
f In
tern
al
Fri
ctio
n '
'
'C'
(Kg/
cm2 )
Ø(d
eg)
Com
pres
sio
nIn
dex
(Cc)
qu(K
g/cm
2 )
Stra
in%
Sr.N
o.
Bor
ehol
e #
Sam
ple
#
Dep
th(m
)
Cla
ssif
icat
ion
of S
oil/
Roc
k
Lay
er D
esig
natio
n
Moi
stur
e C
onte
nt%
Chl
orid
e C
onte
nt in
Wat
erm
g/ L
iter
Dir
ect S
hear
Dry
Den
sity
(gm
/cc)
Bul
k D
ensi
ty(g
m/c
c)
Spec
ific
Gra
vity
of
Soil
Pass
ing
#200
%
Att
erbe
rg
Lim
it
Sulp
hate
Con
tent
in S
oil
%
Sulp
hate
Con
tent
in W
ater
mg/
Lit
er
Chl
orid
e C
onte
nt in
Soi
l%
Unc
onfi
ned
Com
pres
sion
St
reng
th
pH V
alue
UU
Tri
axia
l C
ompr
essi
on
Tes
t
AP
P2
-2
-2
08
APP-2-2-237
Con
solid
atio
n
LL PI
Coh
esio
n(M
pa)
Ang
le o
f In
tern
al
Fri
ctio
n '
'
'C'
(Kg/
cm2 )
Ø(d
eg)
Com
pres
sio
nIn
dex
(Cc)
qu(K
g/cm
2 )
Stra
in%
Sr.N
o.
Bor
ehol
e #
Sam
ple
#
Dep
th(m
)
Cla
ssif
icat
ion
of S
oil/
Roc
k
Lay
er D
esig
natio
n
Moi
stur
e C
onte
nt%
Chl
orid
e C
onte
nt in
Wat
erm
g/ L
iter
Dir
ect S
hear
Dry
Den
sity
(gm
/cc)
Bul
k D
ensi
ty(g
m/c
c)
Spec
ific
Gra
vity
of
Soil
Pass
ing
#200
%
Att
erbe
rg
Lim
it
Sulp
hate
Con
tent
in S
oil
%
Sulp
hate
Con
tent
in W
ater
mg/
Lit
er
Chl
orid
e C
onte
nt in
Soi
l%
Unc
onfi
ned
Com
pres
sion
St
reng
th
pH V
alue
UU
Tri
axia
l C
ompr
essi
on
Tes
t
AP
P2
-2
-2
09
APP-2-2-238
Con
solid
atio
n
LL PI
Coh
esio
n(M
pa)
Ang
le o
f In
tern
al
Fri
ctio
n '
'
'C'
(Kg/
cm2 )
Ø(d
eg)
Com
pres
sio
nIn
dex
(Cc)
qu(K
g/cm
2 )
Stra
in%
Sr.N
o.
Bor
ehol
e #
Sam
ple
#
Dep
th(m
)
Cla
ssif
icat
ion
of S
oil/
Roc
k
Lay
er D
esig
natio
n
Moi
stur
e C
onte
nt%
Chl
orid
e C
onte
nt in
Wat
erm
g/ L
iter
Dir
ect S
hear
Dry
Den
sity
(gm
/cc)
Bul
k D
ensi
ty(g
m/c
c)
Spec
ific
Gra
vity
of
Soil
Pass
ing
#200
%
Att
erbe
rg
Lim
it
Sulp
hate
Con
tent
in S
oil
%
Sulp
hate
Con
tent
in W
ater
mg/
Lit
er
Chl
orid
e C
onte
nt in
Soi
l%
Unc
onfi
ned
Com
pres
sion
St
reng
th
pH V
alue
UU
Tri
axia
l C
ompr
essi
on
Tes
t
AP
P2
-2
-2
10
APP-2-2-239
Con
solid
atio
n
LL PI
Coh
esio
n(M
pa)
Ang
le o
f In
tern
al
Fri
ctio
n '
'
'C'
(Kg/
cm2 )
Ø(d
eg)
Com
pres
sio
nIn
dex
(Cc)
qu(K
g/cm
2 )
Stra
in%
Sr.N
o.
Bor
ehol
e #
Sam
ple
#
Dep
th(m
)
Cla
ssif
icat
ion
of S
oil/
Roc
k
Lay
er D
esig
natio
n
Moi
stur
e C
onte
nt%
Chl
orid
e C
onte
nt in
Wat
erm
g/ L
iter
Dir
ect S
hear
Dry
Den
sity
(gm
/cc)
Bul
k D
ensi
ty(g
m/c
c)
Spec
ific
Gra
vity
of
Soil
Pass
ing
#200
%
Att
erbe
rg
Lim
it
Sulp
hate
Con
tent
in S
oil
%
Sulp
hate
Con
tent
in W
ater
mg/
Lit
er
Chl
orid
e C
onte
nt in
Soi
l%
Unc
onfi
ned
Com
pres
sion
St
reng
th
pH V
alue
UU
Tri
axia
l C
ompr
essi
on
Tes
t
AP
P2
-2
-2
11
APP-2-2-240
Con
solid
atio
n
LL PI
Coh
esio
n(M
pa)
Ang
le o
f In
tern
al
Fri
ctio
n '
'
'C'
(Kg/
cm2 )
Ø(d
eg)
Com
pres
sio
nIn
dex
(Cc)
qu(K
g/cm
2 )
Stra
in%
Sr.N
o.
Bor
ehol
e #
Sam
ple
#
Dep
th(m
)
Cla
ssif
icat
ion
of S
oil/
Roc
k
Lay
er D
esig
natio
n
Moi
stur
e C
onte
nt%
Chl
orid
e C
onte
nt in
Wat
erm
g/ L
iter
Dir
ect S
hear
Dry
Den
sity
(gm
/cc)
Bul
k D
ensi
ty(g
m/c
c)
Spec
ific
Gra
vity
of
Soil
Pass
ing
#200
%
Att
erbe
rg
Lim
it
Sulp
hate
Con
tent
in S
oil
%
Sulp
hate
Con
tent
in W
ater
mg/
Lit
er
Chl
orid
e C
onte
nt in
Soi
l%
Unc
onfi
ned
Com
pres
sion
St
reng
th
pH V
alue
UU
Tri
axia
l C
ompr
essi
on
Tes
t
AP
P2
-2
-2
12
APP-2-2-241
Con
solid
atio
n
LL PI
Coh
esio
n(M
pa)
Ang
le o
f In
tern
al
Fri
ctio
n '
'
'C'
(Kg/
cm2 )
Ø(d
eg)
Com
pres
sio
nIn
dex
(Cc)
qu(K
g/cm
2 )
Stra
in%
Sr.N
o.
Bor
ehol
e #
Sam
ple
#
Dep
th(m
)
Cla
ssif
icat
ion
of S
oil/
Roc
k
Lay
er D
esig
natio
n
Moi
stur
e C
onte
nt%
Chl
orid
e C
onte
nt in
Wat
erm
g/ L
iter
Dir
ect S
hear
Dry
Den
sity
(gm
/cc)
Bul
k D
ensi
ty(g
m/c
c)
Spec
ific
Gra
vity
of
Soil
Pass
ing
#200
%
Att
erbe
rg
Lim
it
Sulp
hate
Con
tent
in S
oil
%
Sulp
hate
Con
tent
in W
ater
mg/
Lit
er
Chl
orid
e C
onte
nt in
Soi
l%
Unc
onfi
ned
Com
pres
sion
St
reng
th
pH V
alue
UU
Tri
axia
l C
ompr
essi
on
Tes
t
AP
P2
-2
-2
13
APP-2-2-242
Con
solid
atio
n
LL PI
Coh
esio
n(M
pa)
Ang
le o
f In
tern
al
Fri
ctio
n '
'
'C'
(Kg/
cm2 )
Ø(d
eg)
Com
pres
sio
nIn
dex
(Cc)
qu(K
g/cm
2 )
Stra
in%
Sr.N
o.
Bor
ehol
e #
Sam
ple
#
Dep
th(m
)
Cla
ssif
icat
ion
of S
oil/
Roc
k
Lay
er D
esig
natio
n
Moi
stur
e C
onte
nt%
Chl
orid
e C
onte
nt in
Wat
erm
g/ L
iter
Dir
ect S
hear
Dry
Den
sity
(gm
/cc)
Bul
k D
ensi
ty(g
m/c
c)
Spec
ific
Gra
vity
of
Soil
Pass
ing
#200
%
Att
erbe
rg
Lim
it
Sulp
hate
Con
tent
in S
oil
%
Sulp
hate
Con
tent
in W
ater
mg/
Lit
er
Chl
orid
e C
onte
nt in
Soi
l%
Unc
onfi
ned
Com
pres
sion
St
reng
th
pH V
alue
UU
Tri
axia
l C
ompr
essi
on
Tes
t
AP
P2
-2
-2
14
APP-2-2-243
Con
solid
atio
n
LL PI
Coh
esio
n(M
pa)
Ang
le o
f In
tern
al
Fri
ctio
n '
'
'C'
(Kg/
cm2 )
Ø(d
eg)
Com
pres
sio
nIn
dex
(Cc)
qu(K
g/cm
2 )
Stra
in%
Sr.N
o.
Bor
ehol
e #
Sam
ple
#
Dep
th(m
)
Cla
ssif
icat
ion
of S
oil/
Roc
k
Lay
er D
esig
natio
n
Moi
stur
e C
onte
nt%
Chl
orid
e C
onte
nt in
Wat
erm
g/ L
iter
Dir
ect S
hear
Dry
Den
sity
(gm
/cc)
Bul
k D
ensi
ty(g
m/c
c)
Spec
ific
Gra
vity
of
Soil
Pass
ing
#200
%
Att
erbe
rg
Lim
it
Sulp
hate
Con
tent
in S
oil
%
Sulp
hate
Con
tent
in W
ater
mg/
Lit
er
Chl
orid
e C
onte
nt in
Soi
l%
Unc
onfi
ned
Com
pres
sion
St
reng
th
pH V
alue
UU
Tri
axia
l C
ompr
essi
on
Tes
t
AP
P2
-2
-2
15
APP-2-2-244
Con
solid
atio
n
LL PI
Coh
esio
n(M
pa)
Ang
le o
f In
tern
al
Fri
ctio
n '
'
'C'
(Kg/
cm2 )
Ø(d
eg)
Com
pres
sio
nIn
dex
(Cc)
qu(K
g/cm
2 )
Stra
in%
Sr.N
o.
Bor
ehol
e #
Sam
ple
#
Dep
th(m
)
Cla
ssif
icat
ion
of S
oil/
Roc
k
Lay
er D
esig
natio
n
Moi
stur
e C
onte
nt%
Chl
orid
e C
onte
nt in
Wat
erm
g/ L
iter
Dir
ect S
hear
Dry
Den
sity
(gm
/cc)
Bul
k D
ensi
ty(g
m/c
c)
Spec
ific
Gra
vity
of
Soil
Pass
ing
#200
%
Att
erbe
rg
Lim
it
Sulp
hate
Con
tent
in S
oil
%
Sulp
hate
Con
tent
in W
ater
mg/
Lit
er
Chl
orid
e C
onte
nt in
Soi
l%
Unc
onfi
ned
Com
pres
sion
St
reng
th
pH V
alue
UU
Tri
axia
l C
ompr
essi
on
Tes
t
AP
P2
-2
-2
16
APP-2-2-245