A Laboratory Method for Determination of Overall Haemostatic Potential in Plasma. I. Method Design...
12
Thrombosis Research 96 (1999) 145–156 REGULAR ARTICLE A Laboratory Method for Determination of Overall Haemostatic Potential in Plasma. I. Method Design and Preliminary Results Shu He 1 , Katarina Bremme 2 and Margareta Blomba ¨ck 1 1 Department of Laboratory Medicine/Coagulation Research and 2 Department of Woman and Child Health, Karolinska Institutet, Karolinska Hospital, Stockholm, Sweden. (Received 27 November 1998 by Editor H. Suomela; revised/accepted 15 April 1999) ings imply that the ABS-sums not only offer a Abstract general information about fibrin generation and lysis in vitro, but also reflect the OHPP (i.e., final The aim of this study was to design a simple labora- combined effects of platelet activity, coagulation, tory method that can screen the overall haemo- and fibrinolysis in vivo). Preliminary results were static potential in plasma (OHPP) when a hyper- satisfactory; the levels of OHPP, expressed as the or hypocoagulable state is present. A fibrin time ABS-sums, were higher in normal pregnant women curve was made via spectrophotometric registra- than in the controls, and even higher in preeclamp- tion of fibrin generation and lysis in plasma, to tic patients than in pregnant women with no which exogenous thrombin and tissue type plas- complications, which corresponds to the different minogen activator was added. The area under the grades of hypercoagulability in the three groups. curve, calculated by the sum of absorbance (ABS- Moreover, the level of OHPP was considerably sum), varied in correlation to the concentrations lower in an untreated infant with von Willebrand’s of platelets or purified pro-/anticoagulants: tissue disease type 3 and in factor VIII- or factor IX- factor, von Willebrand factor, fibrinogen, anti- deficient plasma samples. 1999 Elsevier Science thrombin, plasminogen, or plasminogen activator Ltd. All rights reserved. inhibitor type 1. The ABS-sums also changed in positive relation to the haemostatic function inves- Key Words: Haemostasis; Fibrin generation; Fibrin lysis; tigated in 16 menopausal women and 14 young Laboratory method healthy nonpregnant women (controls). The find- H yper- or hypocoagulability can lead to var- Abbreviations: OHPP, overall haemostatic potential in plasma; ious pathological conditions. A large spec- t-PA, tissue plasminogen activator; AT, antithrombin; PAI-1, trum of laboratory tests exist to identify plasminogen activator inhibitor type 1; TF, tissue factor; vWF, von Willebrand factor; ABS, absorbance values; ABS-sum, sum this imbalance in the haemostatic system and to of absorbance values; F112, prothrombin fragment 112; TAT, locate the underlying causes. Since the haemostatic thrombin antithrombin complex; HELLP, hemolysis, elevated process comprises multiple activation and inhibi- lives enzymes and low platelets; ADP, adenosine diphosphate; ATU, antithrombin units; AU, arbitrary units. tion steps [1,2], a definite conclusion can hardly be Corresponding author: Margareta Blomba ¨ ck, MD, PhD, Blood made depending only on routine analysis of a single Coagulation Research, Clinical Chemistry Building, L2 V, Karo- variable, or even of several variables. It has been linska Hospital, S-17176 Stockholm, Sweden. Tel: 46 (8) 5177 4437; Fax: 46 (8) 31 24 38; E-mail: ,[email protected].. especially difficult to detect patients with hypercoa- 0049-3848/99 $–see front matter 1999 Elsevier Science Ltd. All rights reserved. PII S0049-3848(99)00092-4
-
Upload
independent -
Category
Documents
-
view
0 -
download
0
Transcript of A Laboratory Method for Determination of Overall Haemostatic Potential in Plasma. I. Method Design...

Thrombosis Research 96 (1999) 145–156
REGULAR ARTICLE
A Laboratory Methodfor Determination of OverallHaemostatic Potential in Plasma.I. Method Design and Preliminary ResultsShu He1, Katarina Bremme2 and Margareta Blomback1
1Department of Laboratory Medicine/Coagulation Research and 2Department ofWoman and Child Health, Karolinska Institutet, Karolinska Hospital, Stockholm, Sweden.
(Received 27 November 1998 by Editor H. Suomela; revised/accepted 15 April 1999)
ings imply that the ABS-sums not only offer aAbstractgeneral information about fibrin generation andlysis in vitro, but also reflect the OHPP (i.e., finalThe aim of this study was to design a simple labora-combined effects of platelet activity, coagulation,tory method that can screen the overall haemo-and fibrinolysis in vivo). Preliminary results werestatic potential in plasma (OHPP) when a hyper-satisfactory; the levels of OHPP, expressed as theor hypocoagulable state is present. A fibrin timeABS-sums, were higher in normal pregnant womencurve was made via spectrophotometric registra-than in the controls, and even higher in preeclamp-tion of fibrin generation and lysis in plasma, totic patients than in pregnant women with nowhich exogenous thrombin and tissue type plas-complications, which corresponds to the differentminogen activator was added. The area under thegrades of hypercoagulability in the three groups.curve, calculated by the sum of absorbance (ABS-Moreover, the level of OHPP was considerablysum), varied in correlation to the concentrationslower in an untreated infant with von Willebrand’sof platelets or purified pro-/anticoagulants: tissuedisease type 3 and in factor VIII- or factor IX-factor, von Willebrand factor, fibrinogen, anti-deficient plasma samples. 1999 Elsevier Sciencethrombin, plasminogen, or plasminogen activatorLtd. All rights reserved.inhibitor type 1. The ABS-sums also changed in
positive relation to the haemostatic function inves-Key Words: Haemostasis; Fibrin generation; Fibrin lysis;tigated in 16 menopausal women and 14 youngLaboratory methodhealthy nonpregnant women (controls). The find-
Hyper- or hypocoagulability can lead to var-Abbreviations: OHPP, overall haemostatic potential in plasma; ious pathological conditions. A large spec-t-PA, tissue plasminogen activator; AT, antithrombin; PAI-1,
trum of laboratory tests exist to identifyplasminogen activator inhibitor type 1; TF, tissue factor; vWF,von Willebrand factor; ABS, absorbance values; ABS-sum, sum this imbalance in the haemostatic system and toof absorbance values; F112, prothrombin fragment 112; TAT, locate the underlying causes. Since the haemostaticthrombin antithrombin complex; HELLP, hemolysis, elevated
process comprises multiple activation and inhibi-lives enzymes and low platelets; ADP, adenosine diphosphate;ATU, antithrombin units; AU, arbitrary units. tion steps [1,2], a definite conclusion can hardly beCorresponding author: Margareta Blomback, MD, PhD, Blood made depending only on routine analysis of a singleCoagulation Research, Clinical Chemistry Building, L2 V, Karo-
variable, or even of several variables. It has beenlinska Hospital, S-17176 Stockholm, Sweden. Tel: 46 (8) 51774437; Fax: 46 (8) 31 24 38; E-mail: ,[email protected].. especially difficult to detect patients with hypercoa-
0049-3848/99 $–see front matter 1999 Elsevier Science Ltd. All rights reserved.PII S0049-3848(99)00092-4

146 S. He et al./Thrombosis Research 96 (1999) 145–156
enzymes and low platelets (HELLP) syndrome wasgulation in a simple way. Thus the clinical practiceincluded.needs a parameter that can demonstrate the com-
4. Healthy, young nonpregnant women (n523, 20–40bined effects of the pro- and anticoagulants (i.e.,years old), as controls for the above groups, whoplatelet activity, coagulation, and fibrinolysis). Wewere sampled in the follicular phase of a normalwere thus interested in establishing a method formenstrual cycle [5,6] and asked to refrain from usingscreening the overall haemostatic potential incontraceptive pills for 2 months prior to the bloodplasma (OHPP).sampling.
It is likely that studies on fibrin generation and 5. A 4-day-old male infant with von Willebrand’s dis-lysis contribute to our previously mentioned goal. ease type 3. His plasma levels of von WillebrandWilliams et al. described a fibrin time curve in factor antigen and factor VIII were less than 0.05which not only the exogenous thrombin and tissue IU/mL and 0.037 IU/mL, respectively.type plasminogen activator but also the endoge-
Blood samples obtained from the subjects abovenous procoagulants and anticoagulants regulatedwere drawn into 0.129 mol/L trisodium citrate (1the reaction [3]. Thus, variations in the curve forms,part trisodium citrate19 parts blood, pH 7.4).as found during the administration of acetylsalicylicWithin 60 minutes of sampling, the citrated bloodacid and after its withdrawal [3], should result fromwas centrifuged at 30003g for 20 minutes at roomhaemostatic changes in the circulating blood if thetemperature. The plasma was deep-frozen in ali-original concentrations of the two exogenous en-quots of 0.5 mL at 2708C until further assays couldzymes are not altered. Thus studies of the curvebe performed.form open up the possibility of examining the
OHPP in hyper- or hypocoagulable states.In the fibrin time curve, the continuous registra- 1.2. Other Plasma Materials
tion of absorbance indicates the varying fibrin lev-els. The area under the curve may therefore be Normal pooled plasma, obtained from 13 bloodregarded as a laboratory parameter for determin- donors, and calibrated against international stan-ing the OHPP. This paper describes our work to dards, containing about 1 IU or U/mL of the hae-establish such a laboratory method and reports mostatic factors and inhibitors were used.the preliminary results obtained from some plasma Plasminogen-depleted plasma was obtained fromsamples with hyper- or hypocoagulability. American Diagnostica, Greenwich, USA; factor
IX-deficient plasma was obtained from HelenaLaboratories, Beaumont, Texas, USA; and factor1. Materials and MethodsVIII-deficient plasma was obtained from Diagnos-tica Stago, Asnieres-Sur-Seine, France.1.1. Individual Plasma Samples
1.3. Reagents, Microplates,Five groups of subjects gave informed consent forand Spectrophotometerparticipation in studies approved by the local eth-
ics committee:20 mg of Actilyse recombinant tissue plasminogen1. Healthy menopausal women (n516, 47–72 years old).activator (t-PA) (Boehringer Ingelheim, Germany)2. Women in normal gestational weeks 35–38 (n524,was dissolved in 20 mL of the manufacturer’s sol-21–37 years old), who were healthy before the preg-vent, giving a concentration of 1 mg/mL. Bovinenancy.
3. Preeclamptic women in gestational weeks 35–38 thrombin (2500 IU/mg protein) (Sigma Chemical(n516, 22–43 years old), who were healthy before Company, St. Louis, MO, USA) was dissolved inpregnancy. In this group, five women suffered from distilled water, giving a concentration of 100 IU/mild preeclampsia, with a blood pressure of 140/90– mL. The above solutions were prepared in small160/110 mmHg and proteinuria of at least 0.3 g/24 aliquots of 50 mL and stored at 2708C until fur-hours, and 11 suffered from severe preeclampsia,
ther use.with a blood pressure over 160/110 mmHg and pro-Other reagents were provided by different com-teinuria of at least 0.3 g/24 hours, or a blood pressure
mercial sources: adenosine diphosphate (ADP)of 140/90–160/110 mmHg and proteinuria over 5 g/24hours [4]. No patient with hemolysis, elevated lives from Signa-Aldrich, Stockholm, Sweden; anti-

147S. He et al./Thrombosis Research 96 (1999) 145–156
thrombin (AT) from Pharmacia & Upjohn; Stock-holm, Sweden; fibrinogen from IMCO, Stockholm,Sweden; hirudin from Pentapharm, Basle, Switzer-land; pefabloc from Boehringer Mannheim, Mann-heim, Germany; plasminogen activator inhibitortype 1 (PAI-1) from Biopool, Umea, Sweden; re-combinant Lys-78 plasminogen (plasminogen)from Novo Nordisk, Bagsvaerd, Denmark; tissuefactor (TF) from American Diagnostica, Green-wich, USA. Platelet concentrates (16803106/mL)and the von Willebrand factor (vWF) were giftsfrom the Blood Centre of the Karolinska Hospitaland from Dr. Claudine Mazurier, Laboratoire Re-cherche Hemostase, Lille, Cedex, France, respec-tively.
Microplates were purchased from DynatechLaboratories, Chantilly, VA, USA. The spectro-photometer used, unless otherwise stated, was aTitertek Multiskan from Flow Laboratories,Solna, Sweden.
Fig. 1. (A) Fibrin time curve and the area under the curve.1.4. Fibrin Time Curve Determination (B) The area under the fibrin time curve expressed by
ABS-sum values over the observation course.To make a fibrin time curve and determine thearea under the curve, the following procedurewas followed.
We calculated as follows:1. Buffer A contained 66 mmol/L Tris and 130 mmol/
L NaCl (pH 7.4). Buffer B was prepared shortly be- ABS-sum5ABS-sum (X)ABS-sum (N)
31005percent of normalfore the assay commenced by adding CaCl2, throm-bin, and t-PA into buffer A, making the final concen-
The “ABS-sum (X)” or “ABS-sum (N)” is atrations 33 mmol/L, 0.4 IU/L, and 1400 ng/mL,mean summation of ABS values obtained fromrespectively.double wells of an unknown plasma sample or from2. To make a fibrin time curve: 150 mL of normal pooledat least six wells of the normal pooled plasma runplasma or unknown plasma were diluted with 150in parallel, respectively.mL of buffer B in microplate wells, making the final
concentrations: Tris 33.0 mmol/L, NaCl 65.0 mmol/L, CaCl2 16.5 mmol/L, t-PA 700 ng/mL, and thrombin 1.5. Levels of F112 and D-Dimers in Vitro0.2 IU/mL. Absorbance (ABS) was measured usinga spectrophotometer at 405 nm and making readings To observe changes of prothrombin fragment 112every minute from time zero until 30 minutes. Blank (F112) levels in vitro, normal pooled plasma wasassays were performed in parallel by adding 150 mL prepared in six aliquots of 150 mL in plastic tubes,of buffer A to 150 mL of normal pooled plasma or the in which fibrin generation and lysis were initiatedunknown plasma in the microplate wells. Turbidity
in the presence of exogenous thrombin and t-PAprofiles were generated by plotting mean absorbance(Figure 3A). To stop the reaction, hirudin with a fi-of at least two aliquots of the same sample (Figurenal concentration of 226 antithrombin units (ATU)/1A). In the studies shown in Figure 2 different dosesmL was added into consecutive tubes at 3-minuteof the exogenous thrombin or t-PA were used.intervals, starting at time zero and ending after3. To determine the area under the curve (Figure 1B):15 minutes. After centrifugation at 20003g for 10Based on the principle of integrals, the area underminutes, levels of F112 in the supernatant werethe curve was expressed by a summation of the ABS
values recorded during the 30 minutes (ABS-sum). assayed. A similar experiment was run to observe

148 S. He et al./Thrombosis Research 96 (1999) 145–156
Fig. 2. Fibrin time curves in the presenceof exogenous thrombin or t-PA with dif-ferent final concentrations. (A) The finalconcentrations of exogenous thrombinwere 0.1, 0.2, 0.4, 0.8, or 1.6 IU/mL and700 ng/mL of t-PA. (B) The final concen-trations of the two enzymes were 0.2 IU/mL and 0, 175, 350, 700 or 1400 ng/mL, re-spectively.
changes in the D-dimer levels (Figure 3B), in which tions of 492, 164, 55, and 0 arbitrary units (AU)/mL, using final concentrations of exogenous t-PApefabloc (final concentration54.0 mmol/L) insteadof 700 ng/mL and 350 ng/mL, respectively. Theof hirudin was added into consecutive tubes atconcentration of thrombin was 0.2 IU/mL in both2-minute intervals from time zero to the 10th mi-experiments (Figure 6).nute, and then at intervals of 4 minutes from 10
to 30 minutes.1.7. Influence of AddedPlatelets on the Curve Forms1.6. Influence of Added Procoagulants
or Anticoagulants on the Curve FormsTo the normal pooled plasma a platelet concentratewas added; the final platelet count was 2103106/In the presence of exogenous thrombin and t-PAmL. This platelet-rich plasma was divided into twowith final concentrations of 0.2 IU/mL and 700 ng/parts. In one part, ADP-induced platelet aggrega-mL, respectively (Figure 4), the fibrin time curvestion was measured. The other part was used for
were made in pooled normal plasma where the making fibrin time curves after an incubation atdifferent final concentrations of AT, TF, vWF, or room temperature for 5 minutes with or withoutfibrinogen were added. The concentrations of the exogenous ADP (Figure 7). The final concentra-various components, originally existing in the plas- tion of the added ADP (8.3 mmol/L) was the samema, were not included in the calculations. as that used in the measurement of platelet aggre-
For studying the influence of plasminogen (Fig- gation. Parallel experiments were run in the normalure 5), the fibrin time curves were made in the pooled plasma in which platelets had been re-normal pooled plasma and in plasminogen-depleted moved.plasma, to which plasminogen had been added ornot, making the different final concentrations of 1.8. Other Laboratory Methodthis proenzyme.
With regard to the influence of PAI-1, experi- Levels of fibrin D-dimers were analysed with animmunoturbidimetric assay, using reagents fromments were run twice with the inhibitor concentra-

149S. He et al./Thrombosis Research 96 (1999) 145–156
ence (Mann-Whitney test) or correlation (Spear-man analysis) between two groups of variables,respectively. Significance was shown by a p valueon the level of 5% (,0.05), 1% (,0.01), or0.1% (,0.001).
2. Results
2.1. Fibrin Time Curvein Normal Pooled Plasma
In the normal pooled plasma comprising the exoge-nous t-PA of 700 mg/mL (Figure 2A), the ABS-sums rose with the increasing concentrations ofadded thrombin. If the final concentration of exog-enous thrombin was 0.2 IU/mL, elevations in theABS-sums and reductions in the added t-PA wereparallel (Figure 2B).
A concentration of F112 (0.9 mmol/L) was seenat time zero. After 3 minutes the concentrationwas already as high as 41.6 mmol/L; however, thelevels did not increase further after that (Figure3A). At time zero the level of D-dimers was 0.12mg/L, and the level then gradually increased, reach-ing a level of 174.44 mg/L at 30 minutes (Figure 3B).Fig. 3. Levels of F112 and fibrin D-dimers assayed in the
course of fibrin generation and lysis.2.2. Fibrin Time Curve inNormal Pooled Plasma with AddedPlatelets or with Purified Pro-/Anticoagulants
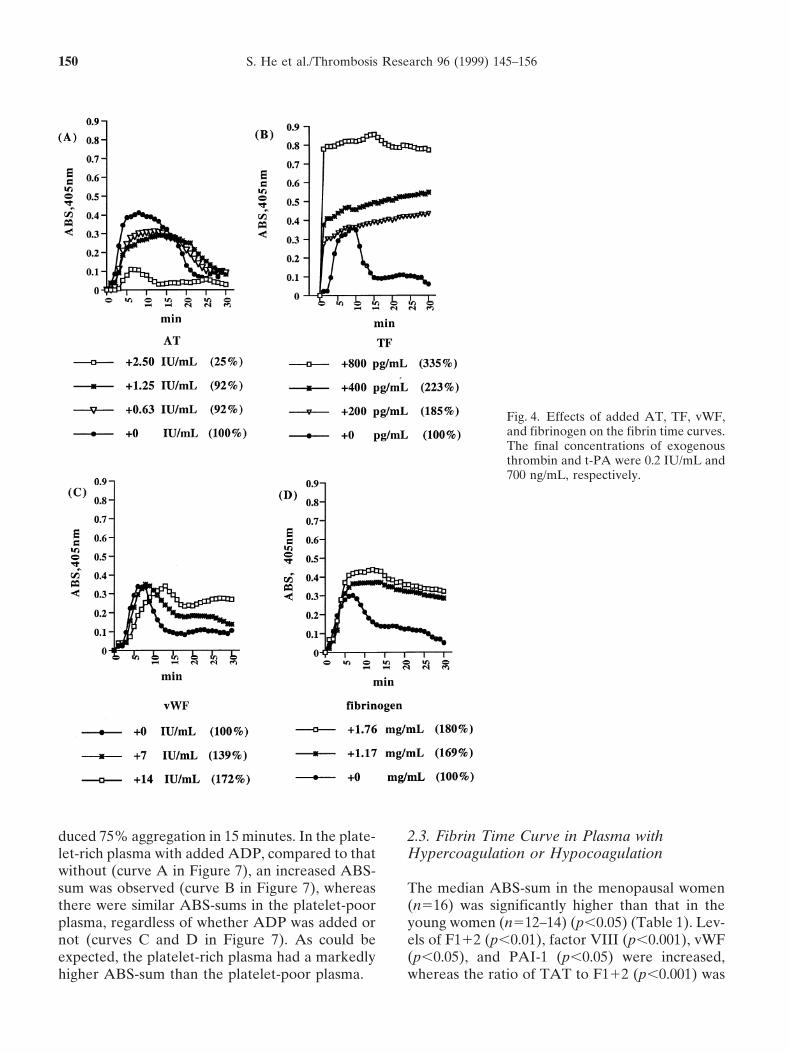
Boehringer Mannheim, Mannheim, Germany [7].Elevations in ABS-sums corresponded to the de-Levels of F112 and thrombin-antithrombin com-creases of added AT (Figure 4A) and the increasesplex (TAT) were tested with ELISAs, using kitsof added vWF (Figure 4B), TF (Figure 4C), orfrom Behringwerke, Marburg, Germany [8,9].fibrinogen (Figure 4D). In the plasminogen-vWFag was also assayed with an ELISA, using
vWF antibodies from IMCO Corp., Stockholm, depleted plasma to which plasminogen (Figure 5)Sweden [10]. Amidolytic methods were used to had been added, smaller amounts of the proenzymedetermine factor VIII activity and PAI-1 activity, resulted in enhancements of the ABS-sums.using kits from Chromogenix, Molndal, Sweden In the presence of a t-PA concentration of 700[11] and Biopool, Umea, Sweden [12], respectively. ng/mL (Figure 6A), an enhanced ABS-sum (191%)Levels of fibrinogen were analysed with a polymer- resulted from the addition of PAI-1 with a finalization method [13]. Platelet aggregation stimu- concentration of 492 AU/mL, whereas lower finallated by ADP were measured with a platelet aggre- concentrations of this inhibitor (55 or 164 AU/gation profiler (Model PAP-4). mL) led to ABS-sums similar to that in the normal
pooled plasma without exogenous PAI-1. In con-trast, when a lower t-PA level of 350 ng/mL was1.9. Statisticsused (Figure 6B), progressive elevations in concen-trations of added PAI-1 brought about correspond-The Microsoft Excel and StatView programs (foring increases in ABS-sums.a Macintosh computer) were used to calculate the
ABS-sum and to assess whether there was a differ- Addition of ADP to the platelet-rich plasma in-
150 S. He et al./Thrombosis Research 96 (1999) 145–156
Fig. 4. Effects of added AT, TF, vWF,and fibrinogen on the fibrin time curves.The final concentrations of exogenousthrombin and t-PA were 0.2 IU/mL and700 ng/mL, respectively.
duced 75% aggregation in 15 minutes. In the plate- 2.3. Fibrin Time Curve in Plasma withHypercoagulation or Hypocoagulationlet-rich plasma with added ADP, compared to that
without (curve A in Figure 7), an increased ABS-sum was observed (curve B in Figure 7), whereas The median ABS-sum in the menopausal women
(n516) was significantly higher than that in thethere were similar ABS-sums in the platelet-poorplasma, regardless of whether ADP was added or young women (n512–14) (p,0.05) (Table 1). Lev-
els of F112 (p,0.01), factor VIII (p,0.001), vWFnot (curves C and D in Figure 7). As could beexpected, the platelet-rich plasma had a markedly (p,0.05), and PAI-1 (p,0.05) were increased,
whereas the ratio of TAT to F112 (p,0.001) washigher ABS-sum than the platelet-poor plasma.

151S. He et al./Thrombosis Research 96 (1999) 145–156
who belonged to the three groups of nonpregnantcontrols, normal pregnancy, and preeclampsia, re-spectively (Figure 11). ABS was registered for 300minutes starting from time zero. After the highestABS value, the ABS had a tendency to decrease.
3. Discussion
3.1. Fibrin Generation and Lysis in Vitro
Fibrinogen and plasminogen were present in theplasma we examined. When a fibrin time curvewas made, the fibrinogen was gradually convertedinto a fibrin gel via a catalytic reaction by thrombin.At the same time, because of the addition of t-PA,the plasminogen activation was triggered to pro-duce plasmin, which, in turn, digested the fibrininto its soluble fragments, such as D-dimers. Sincet-PA on its own is a poor enzyme for the plasmino-gen activation, but fibrin and fibrin breakdownproducts are able to raise the catalytic property by
Fig. 5. Effects of added plasminogen on the fibrin time 50-fold [14], the fibrinolytic function should pro-curves. The final concentrations of t-PA and thrombin were
gressively rise with increasing fibrin generation and700 ng/mL and 0.2 IU/mL, respectively. NP-PL: normalaccumulation of the breakdown products. The ratepooled plasma; PD-PL: plasminogen-depleted plasma.of fibrin generation may therefore be superior tothe rate of fibrin lysis in the earlier period of obser-vation, as seen by the increasing ABS values.
decreased in the menopausal group compared to Under the stronger effect of fibrin and fibrin break-that of the younger women. However, TAT levels down products, the t-PA became more active inwere not significantly different (p.0.05). Twenty- the plasminogen activation, and the fibrin lysis waseight subjects in these two groups had test results thus accelerated, leading to the decline in ABSof ABS-sums as well as of TAT/F112 (Figure 8). values. This description implies that each ABSThese two variables were significantly correlated value on the curve represents a fibrin level at the(rs520.71, p,0.01). No statistical correlation was corresponding time point, and that the area underfound between the ABS-sums and the levels of the curve, expressed by the ABS-sum, gives generalother variables (p.0.05). information about fibrin generation and lysis
The normal pregnant women had a lower median throughout the measurement period.ABS-sum than the preeclampsia patients, though itwas higher than for the normal controls (p,0.001) 3.2. Thrombin Generation in Vitro(Figure 9). Between the patient groups with severe(n511) and mild (n55) preeclampsia, median lev- Since t-PA function is extremely low in citratedels of the ABS-sums (204 and 178%, respectively) plasma, the plasminogen activation almost exclu-did not differ significantly (p.0.05). sively depended on the exogenous t-PA. In the
The ABS-sum of a plasma sample obtained from transformation of fibrinogen to fibrin, the throm-the newborn infant with severe von Willebrand’s bin activity originated not only from the enzymedisease type 3 was 44% of normal. In the factor added into buffer B and the trace amounts origi-IX- and factor VIII-deficient plasma, the ABS- nally present in the plasma, but also from produc-sums were 42 and 39% of normal, respectively (Fig- tion in the reaction process due to presence ofure 10). prothrombin in the normal pooled plasma and the
feedback activation of thrombin by thrombin itselfFibrin time curves were made for three subjects
152 S. He et al./Thrombosis Research 96 (1999) 145–156
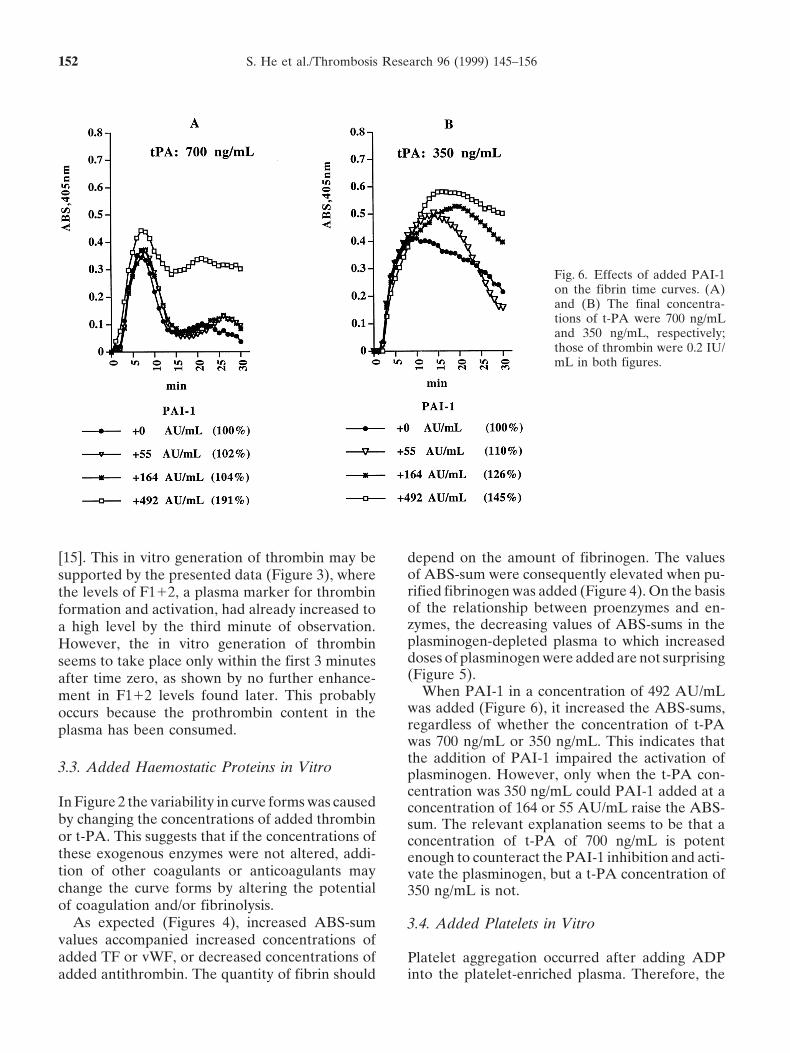
Fig. 6. Effects of added PAI-1on the fibrin time curves. (A)and (B) The final concentra-tions of t-PA were 700 ng/mLand 350 ng/mL, respectively;those of thrombin were 0.2 IU/mL in both figures.
[15]. This in vitro generation of thrombin may be depend on the amount of fibrinogen. The valuesof ABS-sum were consequently elevated when pu-supported by the presented data (Figure 3), whererified fibrinogen was added (Figure 4). On the basisthe levels of F112, a plasma marker for thrombinof the relationship between proenzymes and en-formation and activation, had already increased tozymes, the decreasing values of ABS-sums in thea high level by the third minute of observation.plasminogen-depleted plasma to which increasedHowever, the in vitro generation of thrombindoses of plasminogen were added are not surprisingseems to take place only within the first 3 minutes(Figure 5).after time zero, as shown by no further enhance-
When PAI-1 in a concentration of 492 AU/mLment in F112 levels found later. This probablywas added (Figure 6), it increased the ABS-sums,occurs because the prothrombin content in theregardless of whether the concentration of t-PAplasma has been consumed.was 700 ng/mL or 350 ng/mL. This indicates thatthe addition of PAI-1 impaired the activation of
3.3. Added Haemostatic Proteins in Vitro plasminogen. However, only when the t-PA con-centration was 350 ng/mL could PAI-1 added at a
In Figure 2 the variability in curve forms was caused concentration of 164 or 55 AU/mL raise the ABS-by changing the concentrations of added thrombin sum. The relevant explanation seems to be that aor t-PA. This suggests that if the concentrations of concentration of t-PA of 700 ng/mL is potentthese exogenous enzymes were not altered, addi- enough to counteract the PAI-1 inhibition and acti-tion of other coagulants or anticoagulants may vate the plasminogen, but a t-PA concentration ofchange the curve forms by altering the potential 350 ng/mL is not.of coagulation and/or fibrinolysis.
As expected (Figures 4), increased ABS-sum 3.4. Added Platelets in Vitrovalues accompanied increased concentrations ofadded TF or vWF, or decreased concentrations of Platelet aggregation occurred after adding ADP
into the platelet-enriched plasma. Therefore, theadded antithrombin. The quantity of fibrin should

153S. He et al./Thrombosis Research 96 (1999) 145–156
Fig. 7. Effects of added platelets and/or ADP on the fibrintime curves.
difference in the ABS-sums between the platelet-rich plasma with or without ADP (curves A andB in Figure 7) may account for the platelet aggrega-tion in vitro. Since thrombin is a strong promoterof platelet aggregation, the striking increase inplatelet aggregation induced by the exogenousthrombin seems to be the reason for the markedrise of ABS-sum in the platelet-rich plasma (curvesA and B in Figure 7) compared to the platelet-poor plasma (curves C and D in Figure 7). Thisimplies, as could be expected, that platelet activitydisturbs the coagulation function in vivo, and inturn indirectly influences the ABS-sum measuredin the platelet-poor plasma in vitro.
3.5. Haemostatic Changes in Vivo
The above discussion has confirmed the effect ofadded procoagulants or anticoagulants on thecurve form in vitro. The investigation in the groupsof young, healthy nonpregnant and menopausalwomen (Table 1) further indicates that the ABS- T
able
1.A
BS-
sum
and
leve
lsof
som
eha
emos
tati
cpr
otei
nsin
youn
ghe
alth
yno
npre
gnan
tw
omen
and
inhe
alth
ym
enop
ausa
lw
omen PA
I-1
(AU
/mL
)A
BS-
sum
F11
2T
AT
Fac
tor
VII
IvW
FF
ibri
noge
n(%
ofno
rmal
)(m
mol
/L)
(mg/
L)
TA
T/F
112
(IU
/mL
)(I
U/m
L)
(g/L
),
1515
–30
.30
You
ngw
omen
n14
1213
1214
1414
130
0R
ange
61–1
550.
4–1.
21.
1–3.
01.
74–4
.80
068–
1.26
0.64
–1.6
42.
4–3.
7M
edia
n93
0.7
1.8
2.90
0.96
1.04
3.05
Men
opau
sal
wom
enn
1616
1616
1616
169
34
Ran
ge53
–195
0.5–
4.8
0.8–
4.3
0.42
–2.9
20.
78–2
.10
0.65
–2.5
82.
2–4.
3M
edia
n12
21.
22.
51.
621.
461.
413.
1p
valu
e(M
ann-
Whi
tney
orch
i-sq
uare
),
0.05
,0.
01.
0.05
,0.
001
,0.
001
,0.
05.
0.05
,0.
05(x
2 57.
50)
Ref
eren
cele
vel
used
rout
inel
y0.
4–1.
1,
4.0
0.50
–1.5
00.
60–1
.41
2.1–
4.2
,15
sum should reflect the haemostatic condition in

154 S. He et al./Thrombosis Research 96 (1999) 145–156
Fig. 8. Correlation between the ABS sums and ratios ofTAT/F112 in the young women and menopausal women.Spearman analysis was used.
vivo. Compared to the young, healthy nonpregnantwomen, the menopausal women had an enhancedmedian level of ABS-sum. This increase in the Fig. 10. The fibrin time curves made in factor VIII- or IX-ABS-sum was parallel to the concentrations of the deficient plasma and in plasma obtained from a patient with
von Willebrand’s disease type 3. NP-PL: normal pooledendogenous coagulants, factor VIII, vWF, andplasma; VIII-deficient PL: a commercial factor VIII-defi-PAI-1, as well as F112. The ratio of TAT to F112cient plasma; IX-deficient PL: a commercial factor IX-deficient plasma; vWD PL: plasma obtained from an un-treated patient with severe von Willebrand’s disease type 3.
might indirectly show the inhibitory capacity of ATon thrombin. Its levels were significantly correlatedto the ABS-sums. Thus, we believe that the vari-ability of ABS-sums corresponds to the haemostat-ical function in circulating blood, especially regard-ing the activity of thrombin stemming from theexamined plasma.
3.6. Monitoring the OHPP inHyper- or Hypocoagulable States
During the last decade, several methods have beenused to determine the thrombin generated, such asthe assay of prothrombin fragment 112, thrombin-Fig. 9. (A) Box-plots of the ABS-sums in the groups ofantithrombin complexes, and an assay to determineyoung, healthy nonpregnant women and pregnant women
with or without preeclampsia. The pregnant women with the thrombin potential [8,9,16]. However, theseor without preeclampsia were sampled in gestational weeks methods do not include the fibrin formation as35–38. The box plots indicate the 10th, 25th, 50th, 75th, the fundamental step, nor do they describe theand 90th percentiles. The 50th percentiles of the individual
fibrinolytic potential or the balance between thevalues are contained within the box. Values either abovesystems.the 90th or below the 10th percentiles are represented by
small open circles. In the present study, it is most likely that the

155S. He et al./Thrombosis Research 96 (1999) 145–156
Fig. 11. Fibrin time curves made in three sub-jects belonging to the groups of nonpregnantcontrols (Non-p) and pregnant women with(PE) or without (NP) preeclampsia. The ABSvalues were recorded for 300 minutes.
values of the ABS-sums are able to offer combined 3.7. Future Workinformation about the properties of the procoagu-
To identify whether the OHPP values are patholog-lants and anticoagulants (i.e., the activities of plate-ically high or low in the examined plasma, a refer-let activity, coagulation, and fibrinolysis) in theence level of this parameter must be investigatedexamined plasma. Thus, our study has opened upin the general population. Also, evaluation of thethe possibility for monitoring the OHPP in certainspecificity and sensitivity is needed.hyper- or hypocoagulable conditions, using a sim-
Since this method was not sensitive enough tople and economical method for determining theincreases in PAI-1 levels when using the t-PA con-ABS-sum in the clinical laboratory.centration of 700 ng/mL, a lower t-PA concentra-The preliminary results are satisfactory. The val-tion, such as 350 ng/mL, needs to be tried, espe-ues of the ABS-sum were higher in the normalcially for testing the influence of PAI-1 on thepregnant women than in the healthy nonpregnantcurve form.women, and were further increased in the pre-
The thrombin generation in vitro may only takeeclamptic patients. The findings agree with theplace in the early stage when the curve is madewell-known observations that a hypercoagulable(Figure 3A). Thus, it is unlikely that if the recordingstate exists in healthy pregnant women and thattime were longer than 30 minutes, a later rise inenhanced coagulation and depressed fibrinolysisthe ABS values would appear in the curve withare more striking when a pregnancy is complicatedan “open end.” The prolonged observation in theby preeclampsia [17–20]. Additionally, our previ-samples obtained from the three women (Figureous studies suggest that the haemostatic function10) supports this conclusion. However, a shorterdoes not depend on the severity of preeclampsiacourse of observation should not be recommended,when determined by the clinical features of hyper-as a higher OHPP value sometimes depends ontension and proteinuria [4,20]. This viewpoint isthe slower decreases in ABS after the curve peak,supported by the nonsignificant difference in thebut not the quicker increases before the peak (Fig-median levels of the ABS-sum between the womenures 4–6). In order to adopt this method in a busywith severe or mild preeclampsia.clinical laboratory surrounding, automation of theIn patients with severe von Willebrand’s diseaseexperimental technique must be studied.type 3, coagulation function is markedly decreased
if no substitution therapy has been given. As ex-The authors thank Dr. Kamaran Fatah in our research group,pected, the ABS-sum was considerably low in theprofessor Lars Boreus in the Pharmacology Department, and asso-untreated infant. Similarly, the ABS-sums wereciate professors Nils Egberg and Jan Svensson in the Coagulationalso reduced in the factor VIII- or IX-deficientLaboratory for stimulating discussions. We also thank Gunhild
plasma. The findings demonstrate that this method Nilsson, Inger Blomberg, and Elisabeth Soderlind of the Coagula-may be of value for detection of some disorders tion Laboratory for their help in the laboratory work. This study
was supported by funds from the Heart and Lung Foundationcaused by deficiency of certain procoagulants.

156 S. He et al./Thrombosis Research 96 (1999) 145–156
(numbers 9841068, 9841138, and 9841497), Karolinska Institutet, schild C, Nilsson IM, Sjorin E, Vinazzer H.and the Swedish Society for Medical Research (number 980151). Clinical application of a chromogenic substrate
method for determination of factor VIII activ-ity. Thromb Haemost 1985;54:818–23.
12. Chmielewska J, Wiman B. Determination ofReferencestissue plasminogen activator and its “fast” in-hibitor in plasma. Clin Chem 1986;32:482–5.1. Macfarlane RG. An enzyme cascade in the
13. Vermylen C, de Vreker RA, Verstraete M. Ablood clotting mechanism, and its function as abiochemical amplifier. Nature 1964;202:498–9. rapid enzymatic method for assay of fibrinogen
2. Newland JR. Blood coagulation: A review. Am fibrin polymerization time (FPT test). ClinJ Obstet Gynecol 1987;156:1420–2. Chem Acta 1963;8:418–24.
3. Williams S, Fatah K, Ivert T, Blomback M. 14. Doolittle RF. The molecular biology of fibrin.The effect of acetylsalicylic acid on fibrin gel In: Stamatoyannopoulos G, Nienhuis AW,lysis by tissue plasminogen activator. Blood Majerus PW, Varmus H, editors. The Molecu-Coag Fibrinol 1995;6:718–25. lar Basis of Blood Diseases. Philadelphia: W.B.
4. Davey DA, MacGillivray I. The classification Saunders Company; 1994. p. 701–23.and definition of the hypertensive disorders of 15. Hemker HC. Thrombin generation, an essen-pregnancy. Am J Obstet Gynecol 1988;158: tial step in haemostasis and thrombosis. In:892–8. Bloom AL, Forbes CD, Thomas DP, Tudden-
5. Blomback M, Eneroth P, Landgren BM, La- ham EGD, editors. Haemostasis and Throm-gerstrom M, Anderson O. On the intraindivid- bosis. Edinburgh: Churchill Livingstone; 1994.ual and gender variability of haemostatic com- p. 477–90.ponents. Thromb Haemost 1992;67:70–5. 16. Hemker HC, Wielders S, Kessels H, Beguin S.
6. Andersson O, Blomback M, Bremme K, Continuous registration of thrombin genera-Wramsby H. Prediction of changes in levels of tion in plasma, its use for the determinationhaemostatic variables during natural menstrual of the thrombin potential. Thromb Haemostcycle and ovarian hyperstimulation. Thromb 1993;70:617–24.Haemost 1997;77:901–4. 17. Hellgren M, Blomback M. Studies on blood
7. Hubbuch A, Adema E, Gebert U, Herz R. coagulation and fibrinolysis in pregnancy, dur-Multicentre evaluation of Tina-quant D-dimer, ing delivery and in the puerperium. Gynecola latex based reagent for BM/Hitachi Systems.
Obstet Invest 1981;12:141–54.Klin Lab 1995;41:383–6.
18. Bremme K, Ostlund E, Almqvist I, Heinonen8. Pelzer H, Schwarz A, Stuber W. DeterminationK, Blomback M. Enhanced thrombin genera-of human prothrombin activation fragmenttion and fibrinolytic activity in normal preg-112 in plasma with an antibody against a syn-nancy and the puerperium. Obstet Gynecolthetic peptide. Thromb Haemost 1991;1992;80:132–7.65:153–9.
19. Greer IA. Pathological processes in preg-9. Pelzer H, Schwartz A, Heimburger N. Deter-nancy-induced hypertension and intrauterinemination of human thrombin antithrombin IIIgrowth retardation: “an excess of heatedcomplex in plasma with an enzyme-linked im-blood.” In: Greer IA, Turpie AGG, Forbesmunosorbent assay. Thromb Haemost 1988;CD, editors. Haemostasis and Thrombosis in59:101–6.Obstetrics and Gynecology. London: Chap-10. Silveira AMV, Yamamoto T, Adamson L,man & Hall Medical; 1992. p. 163–202.Hessel B, Blomback B. Application of an en-
20. He S, Bremme K, Blomback M. Acquired defi-zyme-linked immunosorbent assay (ELISA) tociency of antithrombin in association with avon Willebrand factor (vWF) and its deriva-hypercoagulable state and impaired functiontives. Thromb Res 1986;43:91–102.of liver and/or kidney in preeclampsia. Blood11. Rosen S, Andersson M, Blomback M, Hag-
glund U, Larrieu MJ, Wolf M, Boyer C, Roth- Coag Fibrinol 1997;8:232–8.