
Measuring efficiency, effectiveness and overall performance in ...
18
Measuring efficiency, effectiveness and overall performance in the Chinese construction industry Xiancun Hu and Chunlu Liu School of Architecture and Built Environment, Deakin University, Geelong, Australia Abstract Purpose – The purpose of this paper is to develop a simultaneous measurement of overall performance and its two dimensions of efficiency and effectiveness in the case of Chinese construction industry. Design/methodology/approach – A relational two-stage data envelopment analysis (DEA) method, which builds a relationship between component stages and can effectively identify inefficient stages, is developed and applied in order to measure overall performance, efficiency and effectiveness. Findings – The construction industry of the Eastern region in China demonstrated the best results for overall performance, efficiency and effectiveness. The gaps between regions were primarily reflected in differences of pure technical efficiency. Performance indicators in the whole construction industry improved steadily and but could be improved more effectively. The coefficients of variation became smaller and more well-balanced across the whole industry. Practical implications – Improving overall performance should focus on promoting construction efficiency at the project level and increasing management effectiveness at the company level. Sustainable development policies, which may include large investment and preferential policies, can narrow performance differences among the regions’ construction industries, and ultimately promote overall performance for the whole industry. Originality/value – The relational two-stage DEA model is further developed in a variable returns-to-scale condition. The developed approach is generic and can provide a pathway for simultaneously measuring performance, efficiency and effectiveness and to recognise competitive advantages for promoting sustainable development. Keywords China, Effectiveness, Construction industry, Efficiency, Overall performance, Relational two-stage data envelopment analysis Paper type Technical paper Introduction Failure of performance measurement in the construction industry has been criticised in much literature, including a review by Yang et al. (2010). As performance measurement is crucial for management activities, various studies of performance measurement can be found from academics and practitioners in the construction domain (Tsolas, 2011). Lin and Shen (2007) reviewed papers related to performance measurement in the construction industry, and classified them into those with overall performance measurement and those with partial performance measurement. Partial performance studies demonstrate one aspect of performance (Lin and Shen, 2007; Deng and Smyth, 2013), such as safety performance, profitability, or schedule performance, and therefore are incapable of illustrating a complete view of performance. Overall performance is a combination of technical/functional performance and process/expressive performance, and can comprehensively describe what construction “is” and how it “works” (Liu and Fellows, 1999). Accordingly, overall performance can be regarded as a single indicator to measure performance in construction management research (Deng and Smyth, 2013). The evaluation of overall performance, which can prevent wrong decisions that improve Engineering, Construction and Architectural Management Vol. 25 No. 6, 2018 pp. 780-797 © Emerald Publishing Limited 0969-9988 DOI 10.1108/ECAM-06-2016-0131 Received 3 June 2016 Revised 9 September 2016 15 August 2017 Accepted 15 September 2017 The current issue and full text archive of this journal is available on Emerald Insight at: www.emeraldinsight.com/0969-9988.htm 780 ECAM 25,6
-
Upload
khangminh22 -
Category
Documents
-
view
3 -
download
0
Transcript of Measuring efficiency, effectiveness and overall performance in ...
Measuring efficiency,effectiveness and overall
performance in the Chineseconstruction industry
Xiancun Hu and Chunlu LiuSchool of Architecture and Built Environment, Deakin University,
Geelong, Australia
AbstractPurpose – The purpose of this paper is to develop a simultaneous measurement of overall performance andits two dimensions of efficiency and effectiveness in the case of Chinese construction industry.Design/methodology/approach – A relational two-stage data envelopment analysis (DEA) method, whichbuilds a relationship between component stages and can effectively identify inefficient stages, is developedand applied in order to measure overall performance, efficiency and effectiveness.Findings – The construction industry of the Eastern region in China demonstrated the best results foroverall performance, efficiency and effectiveness. The gaps between regions were primarily reflected indifferences of pure technical efficiency. Performance indicators in the whole construction industry improvedsteadily and but could be improved more effectively. The coefficients of variation became smaller and morewell-balanced across the whole industry.Practical implications – Improving overall performance should focus on promoting constructionefficiency at the project level and increasing management effectiveness at the company level. Sustainabledevelopment policies, which may include large investment and preferential policies, can narrowperformance differences among the regions’ construction industries, and ultimately promote overallperformance for the whole industry.Originality/value – The relational two-stage DEA model is further developed in a variable returns-to-scalecondition. The developed approach is generic and can provide a pathway for simultaneouslymeasuring performance, efficiency and effectiveness and to recognise competitive advantages forpromoting sustainable development.Keywords China, Effectiveness, Construction industry, Efficiency, Overall performance,Relational two-stage data envelopment analysisPaper type Technical paper
IntroductionFailure of performance measurement in the construction industry has been criticised inmuch literature, including a review by Yang et al. (2010). As performance measurement iscrucial for management activities, various studies of performance measurement can befound from academics and practitioners in the construction domain (Tsolas, 2011). Lin andShen (2007) reviewed papers related to performance measurement in the constructionindustry, and classified them into those with overall performance measurement and thosewith partial performance measurement. Partial performance studies demonstrate oneaspect of performance (Lin and Shen, 2007; Deng and Smyth, 2013), such as safetyperformance, profitability, or schedule performance, and therefore are incapable ofillustrating a complete view of performance. Overall performance is a combination oftechnical/functional performance and process/expressive performance, and cancomprehensively describe what construction “is” and how it “works” (Liu and Fellows,1999). Accordingly, overall performance can be regarded as a single indicator tomeasure performance in construction management research (Deng and Smyth, 2013).The evaluation of overall performance, which can prevent wrong decisions that improve
Engineering, Construction andArchitectural ManagementVol. 25 No. 6, 2018pp. 780-797© Emerald Publishing Limited0969-9988DOI 10.1108/ECAM-06-2016-0131
Received 3 June 2016Revised 9 September 201615 August 2017Accepted 15 September 2017
The current issue and full text archive of this journal is available on Emerald Insight at:www.emeraldinsight.com/0969-9988.htm
780
ECAM25,6
one metric at the expense of decreasing overall firm efficiency, is particularly important(El-Mashaleh et al., 2007).
In general, an overall performance measurement is defined as a process quantifying theefficiency and effectiveness of an action (Neely et al., 1995). Past studies (e.g. Rämö, 2002;Tsolas, 2011) have defined efficiency as “doing things right” and effectiveness as “doing theright things”. Efficiency and effectiveness measurements are critical in determining a firm’soverall success in the highly competitive construction industry (El-Mashaleh et al., 2007).Tsolas (2011) measured efficiency and effectiveness as two dimensions of the performanceof construction firms. In non-storable commodity research, Chiou et al. (2010) analysedoverall performance via a joint measurement of efficiency and effectiveness using integrateddata envelopment analysis (DEA) approaches. However, in the construction domain, verylittle literature that simultaneously measures overall performance, efficiency andeffectiveness can be identified.
The DEA application to performance measurement has been successfully described inmany construction studies (Horta et al., 2010). DEA is a non-parametric method used toinvestigate the relative efficiency of a decision-making unit (DMU) by projecting productionvariables in geometric figures. Compared to parametric and semi-parametric methods,which both assume a specific production function in estimation, the non-parametric methoddoes not consider how to choose a specific production function and is not concerned withhow to impose distributional assumptions on the efficiency term (Hampf, 2013). DEA wasfirst introduced on the basis of the economic theory of Pareto optimality by Charnes et al.(1978). In the construction domain, earlier researchers employed the DEA approach tomeasuring the technical efficiency of an organisation (Ruddock, 1994) and to attempting tomeasure the performance of engineering (Busby, 1995). After these applications, the DEAapproach gradually became the principal technique for measuring efficiency related tosituations of multiple inputs and multiple outputs in construction.
The remainder of this paper includes three procedures. First, the primary gaps betweenthe current two-stage DEA research in construction and the relational two-stage DEAapproach are indicated. Second, the relational two-stage DEAmodel, although it can be usedin other sectors, is provided in modelling overall performance for the construction industry.Third, the Chinese construction industry, which has become the largest construction marketin the world (Comu et al., 2013), is selected as an example to apply the new approach so as toevaluate its overall performance.
A two-stage DEA approach in constructionThe DEA approach, which is also called the standard or one-stage DEA approach, is one ofthe most frequently used techniques for overall performance measurement in construction(Yang et al., 2010). The DEA method has been significantly utilised to measure andbenchmark overall performance for construction firms (El-Mashaleh et al., 2007), tobenchmark safety performance for construction contractors (El-Mashaleh et al., 2010), tocompare energy productivity and total factor productivity performance in the constructionindustry (Hu and Liu, 2016a), to assess the performance of construction companies byintegrating several key performance indicators (Horta et al., 2010) and to measure overallperformance for the construction industry (Horta et al., 2012). This is mainly because theDEA technique provides significant managerial information concerning rankings andtargets in performance evaluation (Horta et al., 2010), and DEA results have highercorrelations with traditional performance indicators than do common econometric models(Cummins and Zi, 1998). However, these performance measurements, which are merelybased on the results of one-stage efficiency scores, could be more precisely measured.
There are three powerful reasons for the popularity of DEA (El-Mashaleh et al., 2010).First, DEA as a linear programming-based technique can solve complicated problems with
781
Chineseconstruction
industry
multiple inputs and multiple outputs (Kuo et al., 2008). Second, DEA avoids the assumptionof prior conditions in constructing models, such as the weights and prices of inputs andoutputs. Finally, DEA need not have the same measurement units for all variables andso is very useful for choosing data. As a deterministic method, DEA compares everyindividual production unit so as to identify the best practices. Moreover, the variousscaling adjustments made for graphical purposes do not affect the relationships amonginput–output variables in the DEA technique (El-Mashaleh et al., 2007). However, DEA hasbeen criticised in that it treats a whole production system as a “black box” and ignoresthe internal structure of the system (Du et al., 2011). In order to open this black box, thedeveloped technique of a two-stage DEA model has been employed to investigate theconstruction production system and its internal structure.
The two-stage DEA approach is a type of DEA which measures the performance of aproduction system with a two-stage structure. In the construction domain, Tsolas (2011, 2013)first analysed the two-stage structure so as to investigate the performance of constructionfirms. Tsolas (2011) decomposed the construction production system into two stages,profitability efficiency and effectiveness, and utilised the standard two-stage DEA approachto measure these. This approach neglects the functions of the intermediate product of totalrevenue in the measurement process. In the first stage, the intermediate product should beproduced so as to improve profitability efficiency; however, the intermediate product shouldbe reserved in the second stage in order to improve effectiveness. These requirements arecontradictory. A significant point is that the intermediate product should be equal between thefirst and second stages in the measurement process. To overcome this shortcoming, Tsolas(2013) applied a separate two-stage DEA model (so named in Chiou et al. (2010)), where aninput-oriented model was used in the first stage to measure profitability efficiency and anoutput-oriented model was used in the second stage to measure the performance of the stockmarket, respectively. Chiou et al. (2010) indicated that the measurement of the separatetwo-stage DEAmodel should be further developed because the two stages are not interrelated.In addition, these two papers did not measure overall performance for the whole system.In spite of this, two-stage DEA research provides a rational pathway to simultaneouslymeasuring overall performance and its two dimensions in construction.
The original linear programme of the relational two-stage DEA model was proposed byKao and Hwang (2008) under a constant returns-to-scale (CRS) condition. The modelmeasures the efficiency of the whole system and its components at the same time by takinginto account the interrelationship of the components within the system (Kao, 2009).The model not only suitably describes the relationship between the whole system and thecomponent sub-stages, but also more adequately measures efficiency scores (Kao, 2009).Therefore, the calculating scores of the model can help decision makers to more capablyidentify inefficient components and production benchmarks. The relational two-stage DEAmodel based on CRS and a global benchmark technology has been applied to assessprofitability performance in the Australian construction industry (Hu and Liu, 2016b).The present study develops an envelopment form for the relational two-stage DEA modelunder a variable returns-to-scale (VRS) condition. Under the VRS condition, an efficiencyscore in a whole system is not equal to the product of scores from two separate stages as in arelational two-stage DEA model (Chen et al., 2009). CRS assumes the proportional change inoutputs is equal to the proportional change in inputs. However, the proportional change inoutputs is not the same as the change in inputs under VRS. Therefore, conventionally, DEAmodels under CRS measure technical efficiency and under VRS measure pure technicalefficiency (Tsolas, 2013). As construction scale plays an important role in constructiondevelopment, the VRS model can provide an opportunity to investigate pure technicalefficiency and scale efficiency. This approach is first applied to construction and provides asignificant pathway to evaluate performance, efficiency and effectiveness simultaneously.
782
ECAM25,6
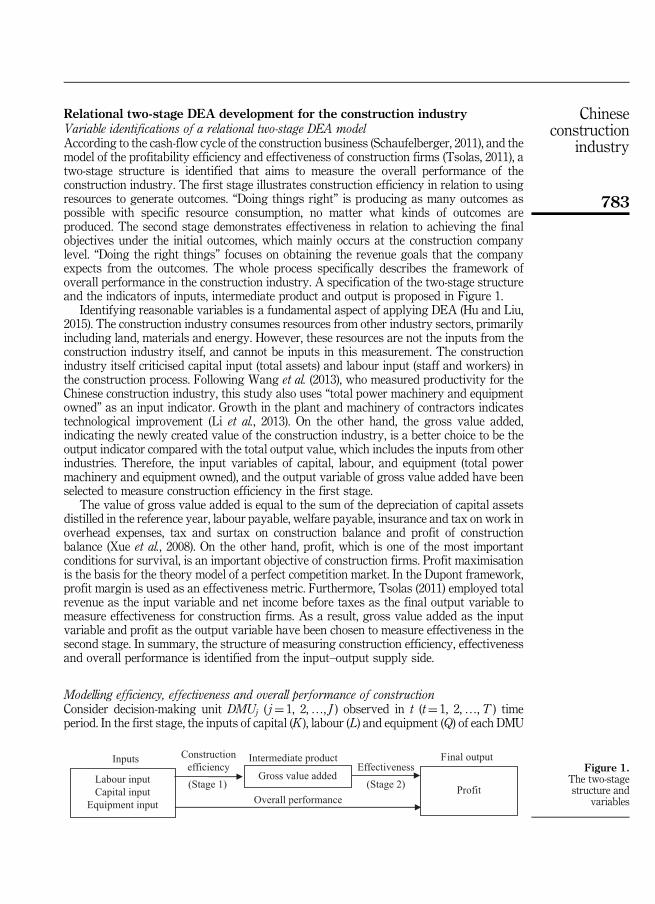
Relational two-stage DEA development for the construction industryVariable identifications of a relational two-stage DEA modelAccording to the cash-flow cycle of the construction business (Schaufelberger, 2011), and themodel of the profitability efficiency and effectiveness of construction firms (Tsolas, 2011), atwo-stage structure is identified that aims to measure the overall performance of theconstruction industry. The first stage illustrates construction efficiency in relation to usingresources to generate outcomes. “Doing things right” is producing as many outcomes aspossible with specific resource consumption, no matter what kinds of outcomes areproduced. The second stage demonstrates effectiveness in relation to achieving the finalobjectives under the initial outcomes, which mainly occurs at the construction companylevel. “Doing the right things” focuses on obtaining the revenue goals that the companyexpects from the outcomes. The whole process specifically describes the framework ofoverall performance in the construction industry. A specification of the two-stage structureand the indicators of inputs, intermediate product and output is proposed in Figure 1.
Identifying reasonable variables is a fundamental aspect of applying DEA (Hu and Liu,2015). The construction industry consumes resources from other industry sectors, primarilyincluding land, materials and energy. However, these resources are not the inputs from theconstruction industry itself, and cannot be inputs in this measurement. The constructionindustry itself criticised capital input (total assets) and labour input (staff and workers) inthe construction process. Following Wang et al. (2013), who measured productivity for theChinese construction industry, this study also uses “total power machinery and equipmentowned” as an input indicator. Growth in the plant and machinery of contractors indicatestechnological improvement (Li et al., 2013). On the other hand, the gross value added,indicating the newly created value of the construction industry, is a better choice to be theoutput indicator compared with the total output value, which includes the inputs from otherindustries. Therefore, the input variables of capital, labour, and equipment (total powermachinery and equipment owned), and the output variable of gross value added have beenselected to measure construction efficiency in the first stage.
The value of gross value added is equal to the sum of the depreciation of capital assetsdistilled in the reference year, labour payable, welfare payable, insurance and tax on work inoverhead expenses, tax and surtax on construction balance and profit of constructionbalance (Xue et al., 2008). On the other hand, profit, which is one of the most importantconditions for survival, is an important objective of construction firms. Profit maximisationis the basis for the theory model of a perfect competition market. In the Dupont framework,profit margin is used as an effectiveness metric. Furthermore, Tsolas (2011) employed totalrevenue as the input variable and net income before taxes as the final output variable tomeasure effectiveness for construction firms. As a result, gross value added as the inputvariable and profit as the output variable have been chosen to measure effectiveness in thesecond stage. In summary, the structure of measuring construction efficiency, effectivenessand overall performance is identified from the input–output supply side.
Modelling efficiency, effectiveness and overall performance of constructionConsider decision-making unit DMUj ( j¼ 1, 2,…, J ) observed in t (t¼ 1, 2,…,T ) timeperiod. In the first stage, the inputs of capital (K ), labour (L) and equipment (Q) of each DMU
Inputs
Labour inputCapital input
Equipment input
Constructionefficiency(Stage 1)
Intermediate product
Gross value added
Overall performance
Final output
Profit
Effectiveness(Stage 2)
Figure 1.The two-stagestructure and
variables
783
Chineseconstruction
industry
produce quantities of gross value added (V ). The production technology set F1 in the firststage is Ft
1 (Kt, Lt, Qt )¼ {(Vt ), Kt, Lt, Qt produce Vt at time t}. In the second stage, theintermediate product of gross value added produces quantities of profits (P). The productiontechnology set F2 in the second stage is Ft
2 (Vt )¼ {(Pt ), Vt produces Pt at time t}. Theinputs, intermediate product and output are all non-negative. The production technologysets are constructed by contemporaneous technology for three important reasons. First, thecontemporaneous production technology determines a production frontier from all DMUsthat occur in the same time, and identified benchmark technology(s) can be feasiblytransferred in practise. Second, the case of the Chinese construction industry with 31 DMUs(discussed in the next section) satisfies the important requirement of DEA that the numberof DMUs should be more than two times the sum of the numbers of inputs and outputs(Sun, 2011). Finally, the contemporaneous production technology ensures the consistency ofstatistical data at every calculation period, and avoids the weakness of statistical changesduring all research periods. As well as contemporaneous technology, many productiontechnology set definitions have been proposed in DEA, such as intertemporal technology,sequential technology, window technology and global technology.
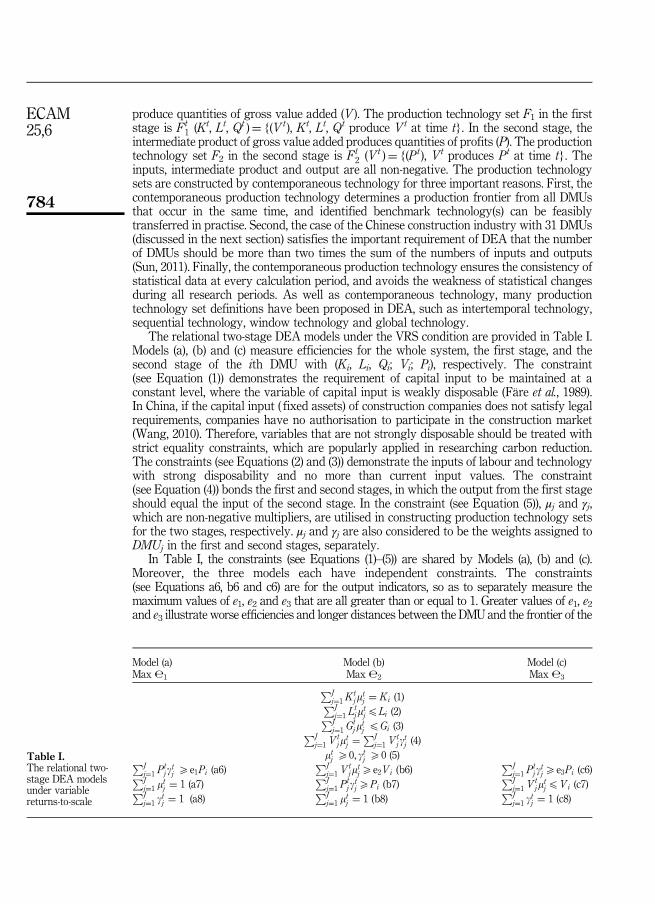
The relational two-stage DEA models under the VRS condition are provided in Table I.Models (a), (b) and (c) measure efficiencies for the whole system, the first stage, and thesecond stage of the ith DMU with (Ki, Li, Qi; Vi; Pi), respectively. The constraint(see Equation (1)) demonstrates the requirement of capital input to be maintained at aconstant level, where the variable of capital input is weakly disposable (Färe et al., 1989).In China, if the capital input ( fixed assets) of construction companies does not satisfy legalrequirements, companies have no authorisation to participate in the construction market(Wang, 2010). Therefore, variables that are not strongly disposable should be treated withstrict equality constraints, which are popularly applied in researching carbon reduction.The constraints (see Equations (2) and (3)) demonstrate the inputs of labour and technologywith strong disposability and no more than current input values. The constraint(see Equation (4)) bonds the first and second stages, in which the output from the first stageshould equal the input of the second stage. In the constraint (see Equation (5)), μj and γj,which are non-negative multipliers, are utilised in constructing production technology setsfor the two stages, respectively. μj and γj are also considered to be the weights assigned toDMUj in the first and second stages, separately.
In Table I, the constraints (see Equations (1)–(5)) are shared by Models (a), (b) and (c).Moreover, the three models each have independent constraints. The constraints(see Equations a6, b6 and c6) are for the output indicators, so as to separately measure themaximum values of e1, e2 and e3 that are all greater than or equal to 1. Greater values of e1, e2and e3 illustrate worse efficiencies and longer distances between the DMU and the frontier of the
Model (a) Model (b) Model (c)Max ℮1 Max ℮2 Max ℮3
PJj¼1 K
tjm
tj ¼ Ki (1)PJ
j¼1 Ltjm
tjpLi (2)PJ
j¼1 Gtjm
tj pGi (3)PJ
j¼1 Vtjm
tj ¼
PJj¼1 V
tjg
tj (4)
mtj X0; gtj X0 (5)PJ
j¼1 Ptjg
tj Xe1Pi (a6)
PJj¼1 V
tjm
tjXe2Vi (b6)
PJj¼1 P
tjg
tjXe3Pi (c6)PJ
j¼1 mtj ¼ 1 (a7)
PJj¼1 P
tjg
tjXPi (b7)
PJj¼1 V
tjm
tjpVi (c7)PJ
j¼1 gtj ¼ 1 (a8)
PJj¼1 m
tj ¼ 1 (b8)
PJj¼1 g
tj ¼ 1 (c8)
Table I.The relational two-stage DEA modelsunder variablereturns-to-scale
784
ECAM25,6
production technology set; in other words, the DMU is producing more final outputs in currentconditions. The constraint (see Equation (b7)) illustrates a precondition without influencing thefinal output in the first stage; and the next constraint (see Equation (c7)) requires that the inputof the intermediate product must not be more than the current value in the second stage.The constraints (see Equations (a7), (a8), (b8) and (c8)) are VRS conditions. Furthermore, whendeleting these constraints (see Equations (a7), (a8), (b8) and (c8)), efficiencies in the whole system,the first stage, and the second stage can be obtained through the relational two-stage DEAmodels under a CRS condition, considered e4, e5 and e36, respectively.
As measured from an output-oriented function of DEA, overall performance,construction efficiency and construction effectiveness are the reciprocals of e4, e5 and e6,respectively. The overall pure technical efficiency (OPTE), pure technical efficiency ofthe first stage (PTE-1), and pure technical efficiency of the second stage (PTE-2) are therespective reciprocals of e1, e2 and e3. Moreover, the overall scale efficiency (OSE),scale efficiency in the first stage (SE-1) and scale efficiency in the second stage (SE-2) are theproportions between overall performance and OPTE, between construction efficiency andPTE-1, and between effectiveness and PTE-2, respectively. The relationships among overallefficiency, pure technical efficiency and scale efficiency have been investigated in muchliterature; this is called an efficiency decomposition approach (e.g. Tsolas, 2013).
Three critical enhancements of the relational two-stage DEA model can be observed. First,the relational model can measure overall efficiency for the whole system, e.g. Model (a).Second, when measuring stages’ efficiencies, the relational model includes all constraints fromboth stages, embodied in the constraints (see Equations (1)–(5)). Finally, the intermediateproduct is considered in the measurement process. A constraint (see Equation (4)) explores therelationship between the first stage and the second stage following the practical function ofintermediate products. In practice, the input to production cannot exceed existing maximumvalues and is completely consumed in order to achieve the maximum output. Therefore, theintermediate product is totally transformed from the first stage to the second stage, which isalso in compliance with modern accounting standards. In addition, if there were oneintermediate product in a production system, efficiency in each stage that is measured via therelational two-stage DEAmodel would be equal to the result that is measured by the standardtwo-stage DEA method (Cook et al., 2010). However, if two or more intermediate productsexisted, the equation would not be correct (e.g. Kao and Hwang, 2008).
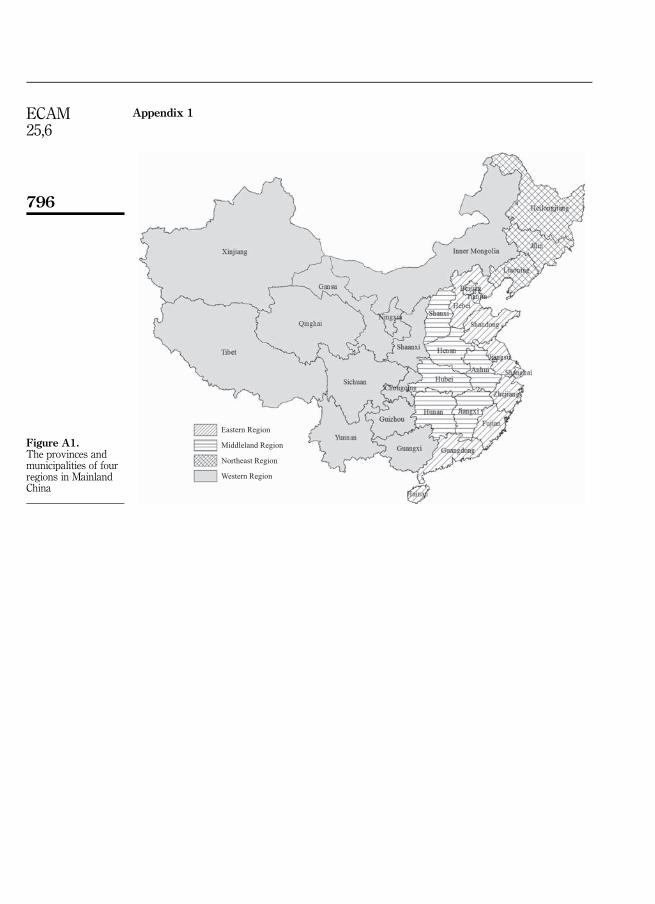
Measurement and discussions for construction industries in ChinaVariables and data used for empirical analysisThe methodology that is described in the previous section is now applied to the constructionindustries of the Chinese provinces and municipalities in Mainland China. China, which hasa wealth of land, is usually divided into four regions: eastern, middleland, northeast andwestern regions. The economic development plans from the central government, such as thewestern region development programme and the revitalisation of the old industrial basein Northeast China, are always designed according to the different development situationsin each region. Xue et al. (2008) measured the productivity of the four regions in the Chineseconstruction industry. The provinces and municipalities of the four regions are described inFigure A1. The abbreviations used in the present study are given in Table AI.
The construction industry from each province or municipality is a DMU in our research.The results of the four regions take the form of weighted mean values resulting from thescores of each DMU in the region. The weighting factor is the total output value divided bythe sum of the total output value of each region. Because the total output value representscomprehensive ability and relative importance for an industry or area, many studies(e.g. Voigt et al., 2014) have used it as a weighted factor. Besides, if the profit of a DMU werenegative, the scores for the whole system and for the second stage would be regarded as
785
Chineseconstruction
industry
zero for this DMU. There are some useful methods for dealing with negative data in DEA;the interested reader can refer to Pastor and Ruiz (2007). This particular approach has beenchosen in our study because few DMUs have negative values and it is impracticable in apractical construction process to replace data.
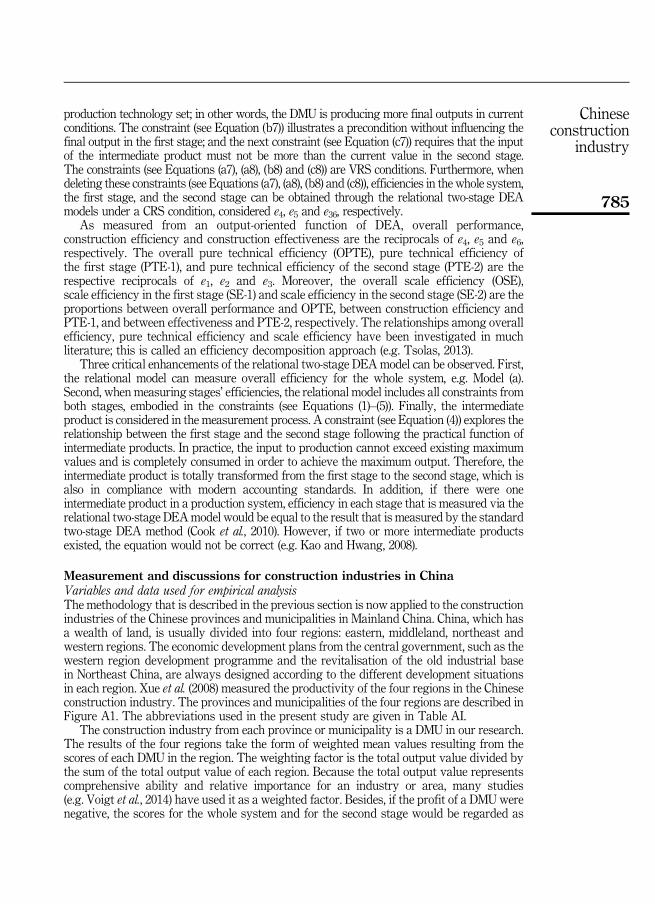
Raw data of inputs, intermediate product and output are directly drawn from the ChinaStatistical Yearbooks, which are published annually by the National Bureau of Statistics ofChina (NBSC, 2014), and are available online (www.stats.gov.cn/english/Statisticaldata/AnnualData). The data were collected in April 2016. The summary statistics for all factorsare described in Table II. The data of labour input are “Number of staff and workers in theconstruction enterprises by registration status and region”. The data of capital input are“Assets of construction enterprises by region”. The technology input of “Total power ofmachinery and equipment owned” is selected from “Number and power of machinery andequipment owned by construction enterprises”. The data of the intermediate product are“Value added of construction by region”. The data of final output are “Total profits ofconstruction enterprises by registration status and region”. According to Table II, largegaps among the DMUs are observed in relation to all variables, especially the variables ofgross value added and total profit (without considering negative values).
Measurement of China’s provincial construction industriesThere are 31 DMUs due to 31 provinces and 18 research time periods in the case of theChinese construction industry. All mathematical operations have been implemented inMicrosoft Excel worksheets. The three models under the conditions of CRS and VRS wereindividually solved using MS Excel Solver, which is an add-in to the Excel programme.First, according to the models of Table I under the VRS condition, the annual results ofOPTE, PTE-1 and PTE-2 are obtained for each DMU. Second, utilising the models under theCRS condition, overall performance (OP), construction efficiency (CE) and effectiveness (Ef )are obtained. Third, the OSE, SE-1 and SE-2 are calculated based on these indicators usingthe efficiency decomposition approach. Finally, the annual figures for overall performance,construction efficiency, effectiveness, OPTE, PTE-1, PTE-2, OSE, SE-1 and SE-2 in fourregions in China are calculated from each DMU in this region on a weighted average basis.
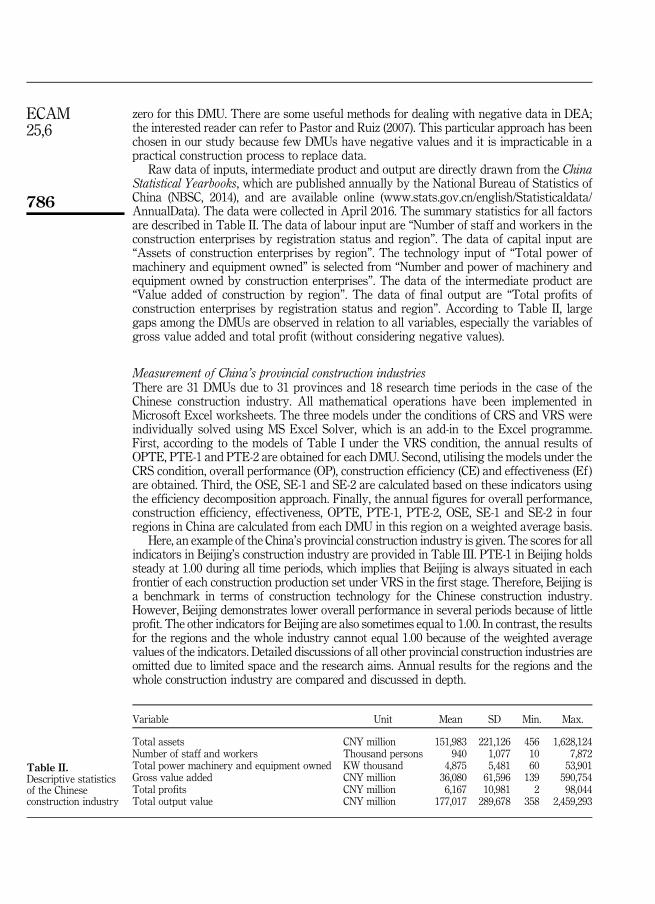
Here, an example of the China’s provincial construction industry is given. The scores for allindicators in Beijing’s construction industry are provided in Table III. PTE-1 in Beijing holdssteady at 1.00 during all time periods, which implies that Beijing is always situated in eachfrontier of each construction production set under VRS in the first stage. Therefore, Beijing isa benchmark in terms of construction technology for the Chinese construction industry.However, Beijing demonstrates lower overall performance in several periods because of littleprofit. The other indicators for Beijing are also sometimes equal to 1.00. In contrast, the resultsfor the regions and the whole industry cannot equal 1.00 because of the weighted averagevalues of the indicators. Detailed discussions of all other provincial construction industries areomitted due to limited space and the research aims. Annual results for the regions and thewhole construction industry are compared and discussed in depth.
Variable Unit Mean SD Min. Max.
Total assets CNY million 151,983 221,126 456 1,628,124Number of staff and workers Thousand persons 940 1,077 10 7,872Total power machinery and equipment owned KW thousand 4,875 5,481 60 53,901Gross value added CNY million 36,080 61,596 139 590,754Total profits CNY million 6,167 10,981 2 98,044Total output value CNY million 177,017 289,678 358 2,459,293
Table II.Descriptive statisticsof the Chineseconstruction industry
786
ECAM25,6
A significant fact to note is that calculated figures between different years cannot be directlycompared with each other in the contemporaneous technology of DEA. For instance, the overallperformance of Beijing was 0.71 and 0.69 in 1995 and 1996, respectively, which does not showthat the actual performance in 1996 was worse than in 1995. Here, the scores for Beijing merelyindicate that the efficiency distance between Beijing and the frontier of the productiontechnology set increased from 1995 to 1996. In other words, the relative performance of Beijingdeclined from 1995 to 1996, compared with other provincial construction industries.
Measurement of construction industries for four regionsOverall performance, OPTE and OSE for the construction industry in China are computedvia Model 1 under CRS and VRS conditions and the efficiency decomposition approach, anddisplayed in Table IV. The construction industry in the eastern region attained betteroverall performance than any other region in all research periods. In 1997–2004, the westernregion demonstrated the second-best performance, which could have resulted from thestated strategy of the western region development programme (Xue et al., 2008). From 2005to 2014, the Northeast region developed the second-best performance, which could be due tothe stated strategy of revitalizing the old industrial base of Northeast China. The nationaleconomic context strongly affects construction company performance (Horta et al., 2012).The construction industry can benefit from heavy investment, tax preference and policysupport of the stated development strategy in China. In 1997 and 1998, the profits of mostprovinces in the Northeast region were negative, which led to the lowest performance forthis region. The middleland region did not attain a rapid increase in overall performance,but showed a stable and excellent score for average value. OPTE demonstrates similartrends to overall performance in the four regions, where the eastern region was the leadingregion and the other three regions illustrated approximate achievements. However, theeastern region lagged behind the other regions in the OSE factor, although there were nolarge gaps among them.
Table V illustrates the construction efficiency and its decomposition components calculatedvia Model 2 under CRS and VRS conditions and the efficiency decomposition method.
Year OP OPTE OSE CE PTE-1 SE-1 Ef PTE-2 SE-2
1995 0.71 0.71 1.00 1.00 1.00 1.00 0.71 0.71 1.001996 0.69 0.78 0.89 0.89 1.00 0.89 0.78 0.78 1.001997 0.46 0.75 0.61 0.91 0.98 0.93 0.50 0.77 0.661998 0.63 0.78 0.81 0.98 1.00 0.98 0.65 0.78 0.831999 0.61 0.77 0.79 1.00 1.00 1.00 0.61 0.77 0.792000 0.52 0.76 0.68 0.95 1.00 0.95 0.55 0.76 0.712001 0.32 0.69 0.46 1.00 1.00 1.00 0.32 0.69 0.462002 0.55 0.94 0.59 0.90 1.00 0.90 0.61 0.94 0.652003 0.54 0.81 0.67 1.00 1.00 1.00 0.54 0.81 0.672004 0.54 0.81 0.67 1.00 1.00 1.00 0.54 0.81 0.672005 0.74 0.97 0.77 1.00 1.00 1.00 0.74 0.97 0.772006 1.00 1.00 1.00 1.00 1.00 1.00 1.00 1.00 1.002007 0.66 1.00 0.66 1.00 1.00 1.00 0.66 1.00 0.662008 0.48 0.55 0.87 1.00 1.00 1.00 0.48 0.55 0.872009 0.74 1.00 0.74 1.00 1.00 1.00 0.74 1.00 0.742010 1.00 1.00 1.00 1.00 1.00 1.00 1.00 1.00 1.002011 1.00 1.00 1.00 1.00 1.00 1.00 1.00 1.00 1.002012 1.00 1.00 1.00 1.00 1.00 1.00 1.00 1.00 1.002013 1.00 1.00 1.00 1.00 1.00 1.00 1.00 1.00 1.002014 1.00 1.00 1.00 1.00 1.00 1.00 1.00 1.00 1.00
Table III.An example of results
of all indicators forBeijing
787
Chineseconstruction
industry
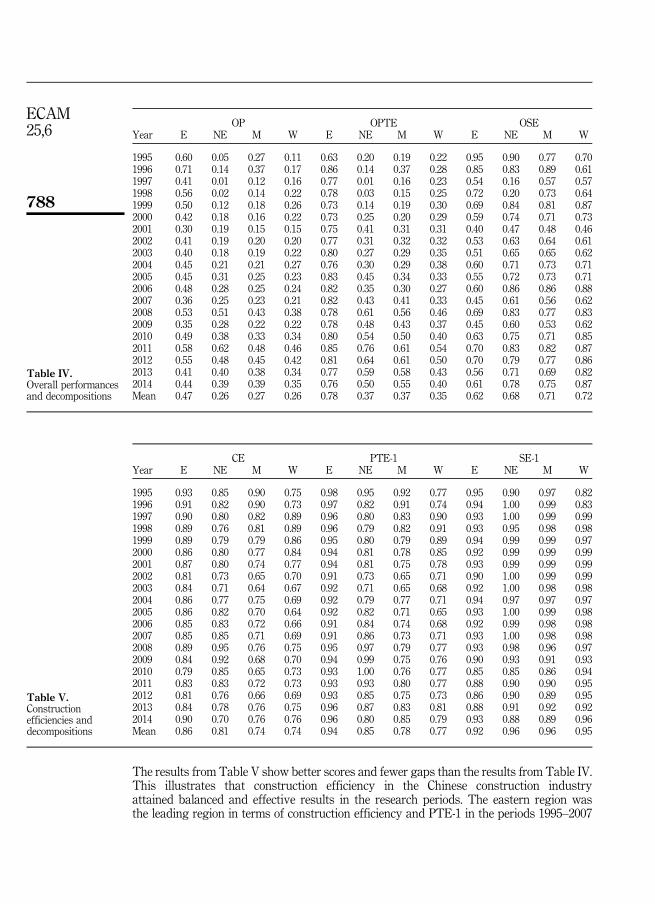
The results from Table V show better scores and fewer gaps than the results from Table IV.This illustrates that construction efficiency in the Chinese construction industryattained balanced and effective results in the research periods. The eastern region wasthe leading region in terms of construction efficiency and PTE-1 in the periods 1995–2007
OP OPTE OSEYear E NE M W E NE M W E NE M W
1995 0.60 0.05 0.27 0.11 0.63 0.20 0.19 0.22 0.95 0.90 0.77 0.701996 0.71 0.14 0.37 0.17 0.86 0.14 0.37 0.28 0.85 0.83 0.89 0.611997 0.41 0.01 0.12 0.16 0.77 0.01 0.16 0.23 0.54 0.16 0.57 0.571998 0.56 0.02 0.14 0.22 0.78 0.03 0.15 0.25 0.72 0.20 0.73 0.641999 0.50 0.12 0.18 0.26 0.73 0.14 0.19 0.30 0.69 0.84 0.81 0.872000 0.42 0.18 0.16 0.22 0.73 0.25 0.20 0.29 0.59 0.74 0.71 0.732001 0.30 0.19 0.15 0.15 0.75 0.41 0.31 0.31 0.40 0.47 0.48 0.462002 0.41 0.19 0.20 0.20 0.77 0.31 0.32 0.32 0.53 0.63 0.64 0.612003 0.40 0.18 0.19 0.22 0.80 0.27 0.29 0.35 0.51 0.65 0.65 0.622004 0.45 0.21 0.21 0.27 0.76 0.30 0.29 0.38 0.60 0.71 0.73 0.712005 0.45 0.31 0.25 0.23 0.83 0.45 0.34 0.33 0.55 0.72 0.73 0.712006 0.48 0.28 0.25 0.24 0.82 0.35 0.30 0.27 0.60 0.86 0.86 0.882007 0.36 0.25 0.23 0.21 0.82 0.43 0.41 0.33 0.45 0.61 0.56 0.622008 0.53 0.51 0.43 0.38 0.78 0.61 0.56 0.46 0.69 0.83 0.77 0.832009 0.35 0.28 0.22 0.22 0.78 0.48 0.43 0.37 0.45 0.60 0.53 0.622010 0.49 0.38 0.33 0.34 0.80 0.54 0.50 0.40 0.63 0.75 0.71 0.852011 0.58 0.62 0.48 0.46 0.85 0.76 0.61 0.54 0.70 0.83 0.82 0.872012 0.55 0.48 0.45 0.42 0.81 0.64 0.61 0.50 0.70 0.79 0.77 0.862013 0.41 0.40 0.38 0.34 0.77 0.59 0.58 0.43 0.56 0.71 0.69 0.822014 0.44 0.39 0.39 0.35 0.76 0.50 0.55 0.40 0.61 0.78 0.75 0.87Mean 0.47 0.26 0.27 0.26 0.78 0.37 0.37 0.35 0.62 0.68 0.71 0.72
Table IV.Overall performancesand decompositions
CE PTE-1 SE-1Year E NE M W E NE M W E NE M W
1995 0.93 0.85 0.90 0.75 0.98 0.95 0.92 0.77 0.95 0.90 0.97 0.821996 0.91 0.82 0.90 0.73 0.97 0.82 0.91 0.74 0.94 1.00 0.99 0.831997 0.90 0.80 0.82 0.89 0.96 0.80 0.83 0.90 0.93 1.00 0.99 0.991998 0.89 0.76 0.81 0.89 0.96 0.79 0.82 0.91 0.93 0.95 0.98 0.981999 0.89 0.79 0.79 0.86 0.95 0.80 0.79 0.89 0.94 0.99 0.99 0.972000 0.86 0.80 0.77 0.84 0.94 0.81 0.78 0.85 0.92 0.99 0.99 0.992001 0.87 0.80 0.74 0.77 0.94 0.81 0.75 0.78 0.93 0.99 0.99 0.992002 0.81 0.73 0.65 0.70 0.91 0.73 0.65 0.71 0.90 1.00 0.99 0.992003 0.84 0.71 0.64 0.67 0.92 0.71 0.65 0.68 0.92 1.00 0.98 0.982004 0.86 0.77 0.75 0.69 0.92 0.79 0.77 0.71 0.94 0.97 0.97 0.972005 0.86 0.82 0.70 0.64 0.92 0.82 0.71 0.65 0.93 1.00 0.99 0.982006 0.85 0.83 0.72 0.66 0.91 0.84 0.74 0.68 0.92 0.99 0.98 0.982007 0.85 0.85 0.71 0.69 0.91 0.86 0.73 0.71 0.93 1.00 0.98 0.982008 0.89 0.95 0.76 0.75 0.95 0.97 0.79 0.77 0.93 0.98 0.96 0.972009 0.84 0.92 0.68 0.70 0.94 0.99 0.75 0.76 0.90 0.93 0.91 0.932010 0.79 0.85 0.65 0.73 0.93 1.00 0.76 0.77 0.85 0.85 0.86 0.942011 0.83 0.83 0.72 0.73 0.93 0.93 0.80 0.77 0.88 0.90 0.90 0.952012 0.81 0.76 0.66 0.69 0.93 0.85 0.75 0.73 0.86 0.90 0.89 0.952013 0.84 0.78 0.76 0.75 0.96 0.87 0.83 0.81 0.88 0.91 0.92 0.922014 0.90 0.70 0.76 0.76 0.96 0.80 0.85 0.79 0.93 0.88 0.89 0.96Mean 0.86 0.81 0.74 0.74 0.94 0.85 0.78 0.77 0.92 0.96 0.96 0.95
Table V.Constructionefficiencies anddecompositions
788
ECAM25,6
and 2012–2014, whereas the northeast region achieved the highest scores in 2008–2011.The northeast region was also the second-most productive region from the average valuesfor construction efficiency and PTE-1. Advanced construction technologies can promotethe improvement of construction efficiency. A suitable example is the Liaoning province inthe northeast region, which assisted large construction enterprises to build research anddevelopment (R&D) Centres and subsidised construction enterprises to replace constructionequipment. The middleland and western regions demonstrated lower achievements becauseof worsening in PTE-1. In addition, the figures for scale efficiency in all regions areapproximate. Heavy real estate investments resulted in a dramatic expansion ofconstruction demands in China (Li et al. 2013); this can lead to increases in constructionprojects and scale merit.
Effectiveness and its decompositions for the Chinese construction industry have beenobtained using Model 3 under CRS and VRS conditions and the efficiency decompositionmethod, as shown in Table VI. The eastern region displays top scores among all regions foreffectiveness in the research periods. That is mostly due to an outstanding enhancement ofPTE-2, which embodies advanced enterprise management technologies in the easternregion. However, regarding SE-2, the eastern region was slightly less efficient than the otherregions. Therefore, the eastern region needs to concern itself with issues of enterprise scale,such as overstaffing, bureaucratic organisation and inefficient operation. The western,middleland and northeast regions demonstrate similar results in three indicators:effectiveness, PTE-2 and SE-2. The three regions display gradual increases in terms ofPTE-2 and effectiveness. However, there are still marked gaps between these regions andthe eastern region, as evidenced in the results for PTE-2 and effectiveness. Therefore, theconstruction industries in these three regions need to determine ways to enhance theirenterprise management abilities, for instance, by introducing knowledgeableadministrators, communicating with advanced businesses and adopting modernenterprise management systems.
Ef PTE-2 SE-2Year E NE M W E NE M W E NE M W
1995 0.64 0.21 0.19 0.13 0.64 0.21 0.19 0.13 1.00 1.00 0.80 0.721996 0.78 0.17 0.39 0.19 0.84 0.17 0.39 0.19 0.93 0.84 0.90 0.621997 0.45 0.01 0.14 0.17 0.79 0.01 0.19 0.24 0.58 0.16 0.57 0.581998 0.62 0.03 0.17 0.24 0.80 0.03 0.18 0.26 0.78 0.21 0.74 0.651999 0.55 0.15 0.22 0.29 0.75 0.17 0.23 0.32 0.74 0.90 0.84 0.892000 0.48 0.23 0.20 0.26 0.75 0.29 0.24 0.33 0.65 0.79 0.74 0.752001 0.34 0.24 0.20 0.19 0.79 0.49 0.39 0.38 0.43 0.48 0.51 0.482002 0.49 0.27 0.31 0.29 0.83 0.40 0.46 0.44 0.59 0.67 0.69 0.632003 0.47 0.24 0.28 0.32 0.84 0.36 0.42 0.47 0.57 0.68 0.68 0.682004 0.52 0.27 0.29 0.38 0.81 0.36 0.37 0.50 0.65 0.76 0.77 0.762005 0.52 0.33 0.35 0.37 0.88 0.48 0.46 0.47 0.60 0.73 0.77 0.782006 0.55 0.32 0.35 0.35 0.86 0.38 0.35 0.36 0.68 0.86 0.99 0.962007 0.42 0.27 0.32 0.30 0.86 0.47 0.51 0.45 0.50 0.61 0.63 0.662008 0.60 0.54 0.56 0.51 0.81 0.63 0.67 0.58 0.75 0.85 0.84 0.882009 0.41 0.30 0.32 0.31 0.81 0.48 0.49 0.44 0.52 0.65 0.66 0.712010 0.62 0.46 0.52 0.46 0.84 0.54 0.58 0.49 0.75 0.87 0.90 0.942011 0.71 0.74 0.67 0.63 0.89 0.81 0.71 0.66 0.80 0.91 0.95 0.952012 0.68 0.63 0.69 0.61 0.85 0.73 0.75 0.65 0.81 0.89 0.93 0.952013 0.49 0.51 0.50 0.45 0.80 0.67 0.69 0.53 0.62 0.78 0.75 0.882014 0.50 0.55 0.52 0.46 0.78 0.62 0.64 0.51 0.65 0.88 0.83 0.91Mean 0.54 0.32 0.36 0.35 0.81 0.42 0.45 0.42 0.68 0.73 0.77 0.77
Table VI.Effectiveness factorsand decompositions
789
Chineseconstruction
industry
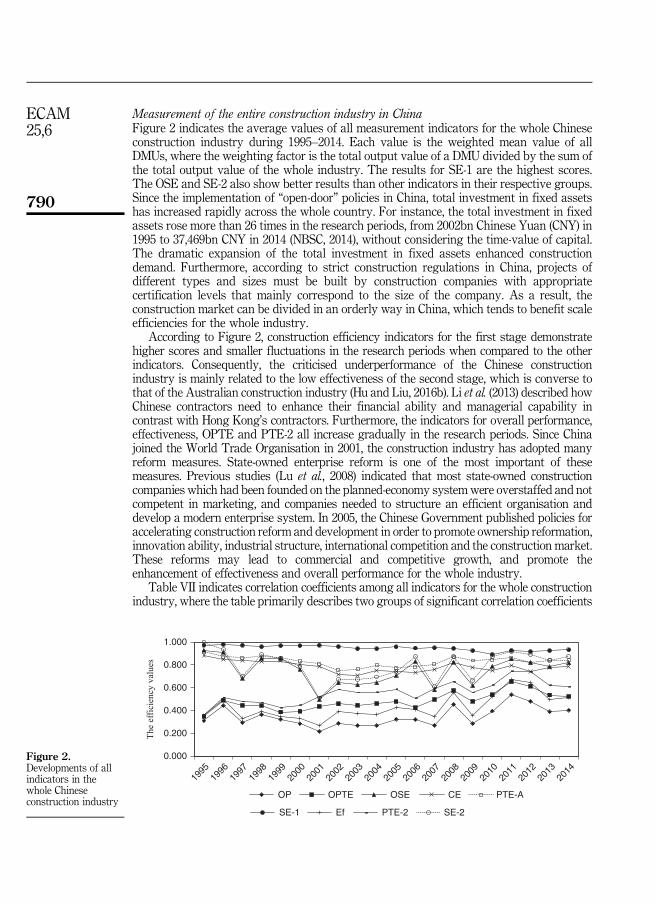
Measurement of the entire construction industry in ChinaFigure 2 indicates the average values of all measurement indicators for the whole Chineseconstruction industry during 1995–2014. Each value is the weighted mean value of allDMUs, where the weighting factor is the total output value of a DMU divided by the sum ofthe total output value of the whole industry. The results for SE-1 are the highest scores.The OSE and SE-2 also show better results than other indicators in their respective groups.Since the implementation of “open-door” policies in China, total investment in fixed assetshas increased rapidly across the whole country. For instance, the total investment in fixedassets rose more than 26 times in the research periods, from 2002bn Chinese Yuan (CNY) in1995 to 37,469bn CNY in 2014 (NBSC, 2014), without considering the time-value of capital.The dramatic expansion of the total investment in fixed assets enhanced constructiondemand. Furthermore, according to strict construction regulations in China, projects ofdifferent types and sizes must be built by construction companies with appropriatecertification levels that mainly correspond to the size of the company. As a result, theconstruction market can be divided in an orderly way in China, which tends to benefit scaleefficiencies for the whole industry.
According to Figure 2, construction efficiency indicators for the first stage demonstratehigher scores and smaller fluctuations in the research periods when compared to the otherindicators. Consequently, the criticised underperformance of the Chinese constructionindustry is mainly related to the low effectiveness of the second stage, which is converse tothat of the Australian construction industry (Hu and Liu, 2016b). Li et al. (2013) described howChinese contractors need to enhance their financial ability and managerial capability incontrast with Hong Kong’s contractors. Furthermore, the indicators for overall performance,effectiveness, OPTE and PTE-2 all increase gradually in the research periods. Since Chinajoined the World Trade Organisation in 2001, the construction industry has adopted manyreform measures. State-owned enterprise reform is one of the most important of thesemeasures. Previous studies (Lu et al., 2008) indicated that most state-owned constructioncompanies which had been founded on the planned-economy systemwere overstaffed and notcompetent in marketing, and companies needed to structure an efficient organisation anddevelop a modern enterprise system. In 2005, the Chinese Government published policies foraccelerating construction reform and development in order to promote ownership reformation,innovation ability, industrial structure, international competition and the construction market.These reforms may lead to commercial and competitive growth, and promote theenhancement of effectiveness and overall performance for the whole industry.
Table VII indicates correlation coefficients among all indicators for the whole constructionindustry, where the table primarily describes two groups of significant correlation coefficients
0.000
1995
1996
1997
1998
1999
2000
2001
2002
2003
2004
2005
2006
2007
2008
2009
2010
2011
2012
2013
2014
0.200
0.400
0.600
0.800
1.000
The
effic
ienc
y va
lues
OP OPTE OSE CE PTE-A
SE-1 Ef PTE-2 SE-2
Figure 2.Developments of allindicators in thewhole Chineseconstruction industry
790
ECAM25,6
among them. The first group is that the indicators for overall performance, constructionefficiency and effectiveness are all strongly correlated with their respective pure technicalefficiency and not correlated with their scale efficiency. Many studies have addressed theimportance of technologies as organisational competitive resources, e.g. Hampson and Tatum(1997). However, the more that advanced technologies are purchased or imported in theChinese construction industry, the less they are utilised and operated fully and capably(Li et al., 2013). As a result, overall performance and pure technical efficiency are barelysatisfactory in the construction industry. Moreover, the size and history of constructioncompanies are not foundations for achieving competitive advantage in the Chineseconstruction industry (Lu et al., 2008). Li et al. (2013) also linked this idea that the scaleof construction firms is not a determinant for contractors’ efficiency, although the Chineseconstruction market has expanded rapidly. Consequently, construction companies can operateand improve pure technical abilities so as to enhance their overall performances. The secondgroup with strong correlations is the indicators between the whole system and the secondstage. The correlation coefficients for overall performance and effectiveness, OPTE and PTE-2,the OSE and SE-2 are 0.93, 0.96 and 0.94, respectively. Previous scholars have shown thattaking advantage of firm resources adequately is important for performance development(Barney, 1991). Saving human resource costs and management expenses by taking advantageof firm resources clearly improves company profitability, and then benefits overallperformance in the allocation of gross value added. The above two groups with significantcorrelations can also be obtained from Figure 2.
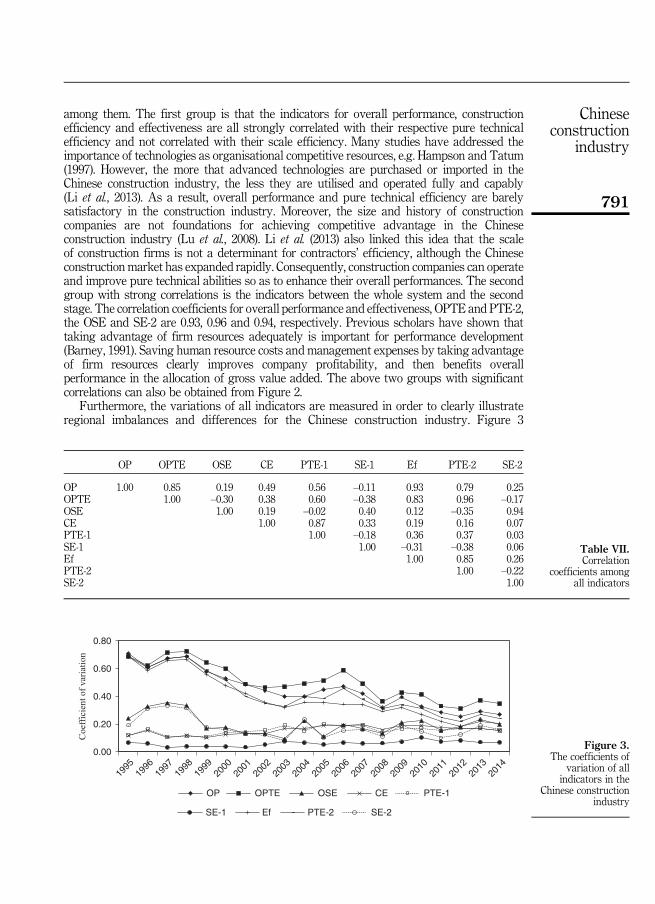
Furthermore, the variations of all indicators are measured in order to clearly illustrateregional imbalances and differences for the Chinese construction industry. Figure 3
OP OPTE OSE CE PTE-1 SE-1 Ef PTE-2 SE-2
OP 1.00 0.85 0.19 0.49 0.56 –0.11 0.93 0.79 0.25OPTE 1.00 –0.30 0.38 0.60 –0.38 0.83 0.96 –0.17OSE 1.00 0.19 –0.02 0.40 0.12 –0.35 0.94CE 1.00 0.87 0.33 0.19 0.16 0.07PTE-1 1.00 –0.18 0.36 0.37 0.03SE-1 1.00 –0.31 –0.38 0.06Ef 1.00 0.85 0.26PTE-2 1.00 –0.22SE-2 1.00
Table VII.Correlation
coefficients amongall indicators
0.00
0.20
0.40
0.60
0.80
1995
1996
1997
1998
1999
2000
2001
2002
2003
2004
2005
2006
2007
2008
2009
2010
2011
2012
2013
2014
OP OPTE OSE CE PTE-1
SE-1 Ef PTE-2 SE-2
Coe
ffici
ent o
f var
iatio
n
Figure 3.The coefficients of
variation of allindicators in the
Chinese constructionindustry
791
Chineseconstruction
industry
demonstrates the coefficients of variation (CV) for the whole construction industry during1995–2014. The CV is expressed as the standard deviation of an indicator divided by itsmean (Wang et al., 2013). It is mainly employed to measure differences and imbalances inregional development. Larger CV scores of an indicator illustrate more differences amongregions in relation to this indicator. According to Figure 3, all indicators for the first stageshow slight improving variations. Variations in scale efficiency indicators are not obviousafter 1999. The CVs for overall performance, effectiveness, OPTE and PTE-2 demonstratemarked reductions during the research periods, which implies that the differences of thefour indicators decreased obviously among all DMUs. Furthermore, the CVs of all indicatorsapproach each other with respect to their trends in the research periods. As a result, theimplementation of regional development strategies and deep reforms in the Chineseconstruction industry can reduce imbalances among provincial construction industries.
All in all, three primary implications can be summarised from this investigation of theChinese construction industry, which could benefit performance enhancement for otherregions and countries. First of all, improving overall performance in the constructionindustry should not only focus on promoting construction efficiency at the project level, butshould also pay more attention to increasing management ability at the company level.From the standpoint of developing profitability in the allocation of gross value added,enhancing enterprise management abilities mainly includes saving labour costs bydeveloping human resource management capability, reducing the depreciation of capitalassets by developing construction plant and equipment management capability, anddecreasing management costs by developing resource allocation capability. Furthermore,promoting techniques is a significant pathway to enhancing overall performance, includingconstruction technologies and management techniques, and this could be achieved throughtechnological communication among different regions. The Counterpart Support policy andEast–West Interaction policy have been implemented for many years in China, and so thecoastal eastern regions provide personnel exchanges, and technological and capitalsupports to the western regions (Lu and Deng, 2013). Therefore, it can be seen that theimbalances among provincial construction industries have been clearly reduced in China.Finally, overall performance of the construction industry is highly influenced by macrodevelopment policies. Sustainable development policies, which may include largeinvestment and preferential policies, can narrow performance differences among theregions’ construction industries, and ultimately promote overall performance for the wholeindustry. For instance, the Chinese central government has launched the Great WestDevelopment Strategy, the Northeast revival strategy and “the rise of central China”programme, coming with sustained large investment (Chen and Zheng, 2008), which candevelop the overall performance of the construction industry because of the growth ofconstruction scale efficiency.
ConclusionThis study has modelled overall performance and its two dimensions of efficiency andeffectiveness, and measured them simultaneously with a relational two-stage DEA approach.A sample of the Chinese construction industries was evaluated. Among the four regions ofChina, the construction industry of the eastern region demonstrated the best results for overallperformance, construction efficiency and effectiveness, whereas the other three regions gainedapproximate figures for these indicators. The gaps between them were primarily reflected indifferences of pure technical efficiency. The Chinese construction industry could promote openmarkets and enterprise communications among regions in order to narrow technicaldifferences. For the whole construction industry, scale efficiency illustrated the greatestachievements of all indicators, and this was caused by a dramatic increase in the totalinvestment in fixed assets, especially in the real estate industry. Overall performance,
792
ECAM25,6
construction efficiency and effectiveness were all strongly correlated with pure technicalefficiency and not correlated with scale efficiency. The overall performance indicators werebetter correlated with the effectiveness indicators, which demonstrate the significance ofenterprise management for construction industry performance. Furthermore, the inefficiencyof the Chinese construction industry was mainly embodied in the indicator of effectiveness.Furthermore, the coefficients of variation became smaller and more well-balanced across thewhole industry. Consequently, the whole Chinese construction industry showed healthydevelopment in the activity periods, especially in construction efficiency.
The study primarily contributes to the body of knowledge of construction research intwo aspects. First, the method in this study promotes the progress of current DEA researchin construction. The relational two-stage DEA method can produce adequate results whenmeasuring efficiencies, because the relationship is considered between the first and secondstages. Second, this study provides a pathway for simultaneously measuring performance,efficiency and effectiveness in construction. The relational two-stage DEA model not onlyprovides overall scores for the whole system, but also yields scores in individual stages. TheVRS form of the relational two-stage DEA model is proposed so as to investigate puretechnical efficiency and scale efficiency. Furthermore, contemporaneous technology andvariable with weak disposability have been applied in order to properly use the DEAapproach. However, because of the factor of contemporaneous technology, a limitation ofthis study is that the calculated figures between different years cannot be directly comparedwith each other. Although DEA has been widely applied to solve construction issues, therelational two-stage DEA model can easily be replicated to investigate the performance ofconstruction projects, organisations or industries. A two-stage DEA, which is a type ofnetwork DEA, could be applied to quantify overall performance, to identify internalinefficiency components and to recognise competitive advantages for a complex productionsystem. However, investigating production structures and identifying support data maydemand future research in the construction domain. Further work could also apply newmethods to microcosmic analyses to attain more detailed results for enhancing overallperformance in construction processes.
References
Barney, J. (1991), “Firm resources and sustained competitive advantage”, Journal of Management,Vol. 17 No. 1, pp. 99-120.
Busby, J. (1995), “Measuring the performance of engineering: the data fusion problem”, Journal ofManagement in Engineering, Vol. 5 No. 3, pp. 117-120.
Charnes, A., Cooper, W.W. and Rhodes, E. (1978), “Measuring the efficiency of decision making units”,European Journal of Operational Research, Vol. 2 No. 6, pp. 429-444.
Chen, M. and Zheng, Y. (2008), “China’s regional disparity and its policy responses”, China & WorldEconomy, Vol. 16 No. 4, pp. 16-32.
Chen, Y., Liang, L. and Zhu, J. (2009), “Equivalence in two-stage DEA approaches”, European Journal ofOperational Research, Vol. 193 No. 2, pp. 600-604.
Chiou, Y.-C., Lan, L.W. and Yen, B.T.H. (2010), “A joint measurement of efficiency and effectiveness fornon-storable commodities: integrated data envelopment analysis approaches”, European Journalof Operational Research, Vol. 201 No. 2, pp. 477-489.
Comu, S., Taylor, J.E. and Messner, J.I. (2013), “Two-dimensional globalizing index for engineeringand construction companies”, Journal of Management in Engineering, Vol. 31 No. 2, pp. 1-8,doi: 10.1061/(ASCE)ME.1943–5479.0000234.
Cook, W.D., Liang, L. and Zhu, J. (2010), “Measuring performance of two-stage network structures byDEA: a review and future perspective”, Omega, Vol. 38 No. 6, pp. 423-430.
793
Chineseconstruction
industry
Cummins, J.D. and Zi, H. (1998), “Comparison of frontier efficiency methods: an application to the USlife insurance industry”, Journal of Productivity Analysis, Vol. 10 No. 2, pp. 131-152.
Deng, F. and Smyth, H. (2013), “Contingency-based approach to firm performance in construction:critical review of empirical research”, Journal of Construction Engineering and Management,Vol. 139 No. 10, pp. 04013004-1-04013004-14.
Du, J., Liang, L., Chen, Y., Cook, W.D. and Zhu, J. (2011), “A bargaining game model for measuringperformance of two-stage network structures”, European Journal of Operational Research,Vol. 210 No. 2, pp. 390-397.
El-Mashaleh, M.S., Edward Minchin, R. Jr and O’Brien, W.J. (2007), “Management of construction firmperformance using benchmarking”, Journal of Management in Engineering, Vol. 23 No. 1, pp. 10-17.
El-Mashaleh, M.S., Rababeh, S.M. and Hyari, K.H. (2010), “Utilizing data envelopment analysis tobenchmark safety performance of construction contractors”, International Journal of ProjectManagement, Vol. 28 No. 1, pp. 61-67.
Färe, R., Grosskopf, S., Lovell, C.K. and Pasurka, C. (1989), “Multilateral productivity comparisonswhen some outputs are undesirable: a nonparametric approach”, The Review of Economics andStatistics, Vol. 71 No. 1, pp. 90-98.
Hampf, B. (2013), Nonparametric Efficiency Analysis in the Presence of Undesirable Outputs, DarmstadtUniversity of Technology, Darmstadt.
Hampson, K. and Tatum, C.B. (1997), “Technology strategy and competitive performance in bridgeconstruction”, Journal of Construction Engineering and Management, Vol. 123 No. 2, pp. 153-161.
Horta, I.M., Camanho, A.S. and Da Costa, J.M. (2010), “Performance assessment of constructioncompanies integrating key performance indicators and data envelopment analysis”, Journal ofConstruction Engineering and Management, Vol. 136 No. 5, pp. 581-594.
Horta, I.M., Camanho, A.S. and Da Costa, J.M. (2012), “Performance assessment of constructioncompanies: a study of factors promoting financial soundness and innovation in the industry”,International Journal of Production Economics, Vol. 137 No. 1, pp. 84-93.
Hu, X. and Liu, C. (2015), “Managing undesirable outputs in the Australian construction industry usingdata envelopment analysis models”, Journal of Cleaner Production, Vol. 101, pp. 148-157.
Hu, X. and Liu, C. (2016a), “Energy productivity and total-factor productivity in the Australianconstruction industry”, Architectural Science Review, Vol. 59 No. 5, pp. 432-444.
Hu, X. and Liu, C. (2016b), “Profitability performance assessment in the Australian constructionindustry: a global relational two-stage DEA method”, Construction Management and Economics,Vol. 34 No. 3, pp. 147-159.
Kao, C. (2009), “Efficiency decomposition in network data envelopment analysis: a relational model”,European Journal of Operational Research, Vol. 192 No. 3, pp. 949-962.
Kao, C. and Hwang, S.-N. (2008), “Efficiency decomposition in two-stage data envelopment analysis: anapplication to non-life insurance companies in Taiwan”, European Journal of OperationalResearch, Vol. 185 No. 1, pp. 418-429.
Kuo, Y., Yang, T. and Huang, G.W. (2008), “The use of grey relational analysis in solving multipleattribute decision-making problems”, Computers & Industrial Engineering, Vol. 55 No. 1, pp. 80-93.
Li, J., Chiang, Y.H., Choi, T.N. and Man, K.F. (2013), “Determinants of efficiency of contractors in HongKong and China: panel data model analysis”, Journal of Construction Engineering andManagement, Vol. 139 No. 9, pp. 1211-1223.
Lin, G. and Shen, Q. (2007), “Measuring the performance of value management studies in construction:critical review”, Journal of Management in Engineering, Vol. 23 No. 1, pp. 2-9.
Liu, A. and Fellows, R. (1999), “Cultural issues”, in Rowlinson, S. and McDermott, P. (Eds), ProcurementSystems: A Guide to Best Practice in Construction, E&FN Spon, London, pp. 141-162.
Lu, W., Shen, L. and Yam, M.C. (2008), “Critical success factors for competitiveness of contractors: Chinastudy”, Journal of Construction Engineering and Management, Vol. 134 No. 12, pp. 972-982.
794
ECAM25,6
Lu, Z. and Deng, X. (2013), “Regional policy and regional development: a case study of China’s Westerndevelopment strategy”, Annales Universitatis Apulensis: Series Oeconomica, Vol. 15 No. 1,pp. 250-264.
National Bureau of Statistics of China (NBSC) (2014), China Statistical Yearbook, China StatisticsPress, Beijing.
Neely, A., Gregory, M. and Platts, K. (1995), “Performance measurement system design: a literaturereview and research agenda”, International Journal of Operations & Production Management,Vol. 15 No. 4, pp. 80-116.
Pastor, J.T. and Ruiz, J.L. (2007), “Variables with negative values in DEA”, in Zhu, J. and Cook, W. (Eds),Modeling data Irregularities and Structural Complexities in Data Envelopment Analysis, Springer,New York, NY, pp. 63-84.
Rämö, H. (2002), “Doing things right and doing the right things time and timing in projects”,International Journal of Project Management, Vol. 20 No. 7, pp. 569-574.
Ruddock, L. (1994), Performance and Efficiency Measurement in Local Authority BuildingOrganisations, doctoral thesis, University of Salford, Salford.
Schaufelberger, J.E. (2011), Construction Business Management, Pearson Higher Ed., NJ.
Sun, C.C. (2011), “Evaluating and benchmarking productive performances of six industries in TaiwanHsin Chu Industrial Science Park”, Expert Systems with Applications, Vol. 38 No. 3, pp. 2195-2205.
Tsolas, I.E. (2011), “Modelling profitability and effectiveness of Greek-listed construction firms: anintegrated DEA and ratio analysis”, Construction Management and Economics, Vol. 29 No. 8,pp. 795-807.
Tsolas, I.E. (2013), “Modelling profitability and stock market performance of listed construction firmson the Athens exchange: two-stage DEA approach”, Journal of Construction Engineering andManagement, Vol. 139 No. 1, pp. 111-119.
Voigt, S., De Cian, E., Schymura, M. and Verdolini, E. (2014), “Energy intensity developments in 40major economies: structural change or technology improvement?”, Energy Economics, Vol. 41No. 1, pp. 47-62.
Wang, X., Chen, Y., Liu, B., Shen, Y. and Sun, H. (2013), “A total factor productivity measure for theconstruction industry and analysis of its spatial difference: a case study in China”, ConstructionManagement and Economics, Vol. 31 No. 10, pp. 1059-1071.
Wang, Y. (2010), “Analysis of system development of China’s construction market in the thirties yearsof reform and opening-up”, Proceeding, W107–Special Track 18th CIB World Building Congress,Salford, May, p. 25.
Xue, X., Shen, Q., Wang, Y. and Lu, J. (2008), “Measuring the productivity of the construction industryin China by using DEA-based Malmquist productivity indices”, Journal of ConstructionEngineering and Management, Vol. 134 No. 1, pp. 64-71.
Yang, H., Yeung, J.F., Chan, A.P., Chiang, Y. and Chan, D.W. (2010), “A critical review of performancemeasurement in construction”, Journal of Facilities Management, Vol. 8 No. 4, pp. 269-284.
(The Appendix follows overleaf.)
795
Chineseconstruction
industry
Appendix 1
Eastern Region
Middleland Region
Northeast Region
Western Region
Figure A1.The provinces andmunicipalities of fourregions in MainlandChina
796
ECAM25,6
Appendix 2
Corresponding authorChunlu Liu can be contacted at: [email protected]
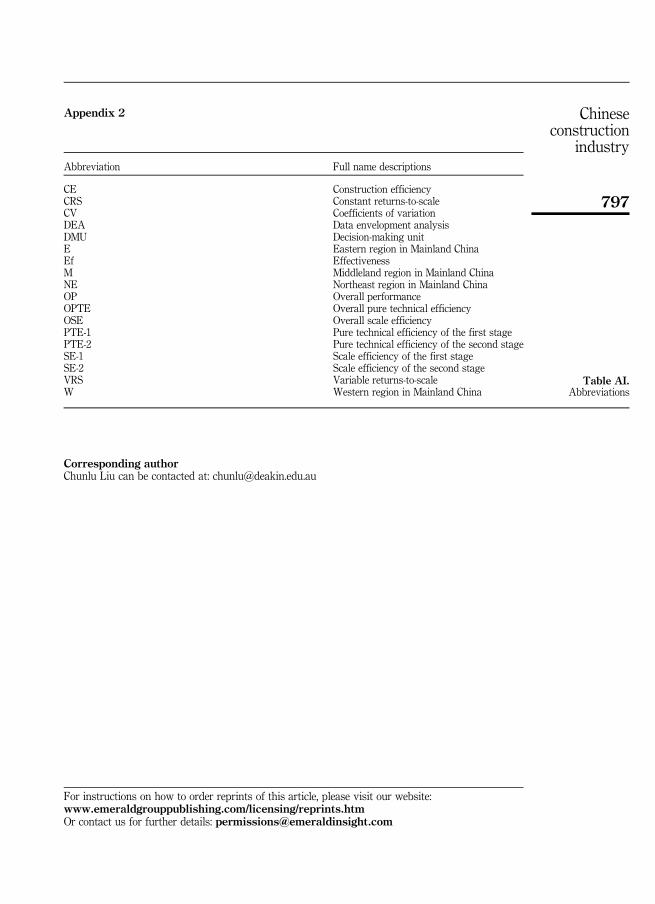
Abbreviation Full name descriptions
CE Construction efficiencyCRS Constant returns-to-scaleCV Coefficients of variationDEA Data envelopment analysisDMU Decision-making unitE Eastern region in Mainland ChinaEf EffectivenessM Middleland region in Mainland ChinaNE Northeast region in Mainland ChinaOP Overall performanceOPTE Overall pure technical efficiencyOSE Overall scale efficiencyPTE-1 Pure technical efficiency of the first stagePTE-2 Pure technical efficiency of the second stageSE-1 Scale efficiency of the first stageSE-2 Scale efficiency of the second stageVRS Variable returns-to-scaleW Western region in Mainland China
Table AI.Abbreviations
For instructions on how to order reprints of this article, please visit our website:www.emeraldgrouppublishing.com/licensing/reprints.htmOr contact us for further details: [email protected]
797
Chineseconstruction
industry