Deliverable D2.2 Overall Architecture and Interfaces Definition

The overall economic and environmental effectiveness of a combined carbonfootprinting and feedback systemClimate Bonus project report (WP6)
Adriaan PerrelsAri NissinenAnna Sahari Research Reports 143:5 December 2009
Research Reports 143:5
Government Institute for
Economic Research


VATT RESEARCH REPORTS
143:5
The overall economic and environmental effectiveness of a combined carbon footprinting and feedback system
Climate Bonus project report (WP6)
Adriaan Perrels Ari Nissinen Anna Sahari
Valtion taloudellinen tutkimuskeskus Government Institute for Economic Research
Helsinki 2009

Climate Bonus – a carbon bonus/credit system for households
Kulutuksen ilmastovaikutus – ostosten ilmastopäästöjen hallintaa kuluttajan valinnoin
http://extranet.vatt.fi/climatebonus/
ISBN 978-951-561-899-3 (nid.) ISBN 978-951-561-900-6 (PDF)
ISSN 0788-5008 (nid.) ISSN 1795-3340 (PDF)
Valtion taloudellinen tutkimuskeskus
Government Institute for Economic Research
Arkadiankatu 7, 00100 Helsinki, Finland
Email: [email protected]
Oy Nord Print Ab
Helsinki, December 2009
Graphic design: Niilas Nordenswan

The overall economic and environmental effectiveness of a combined carbon footprinting and feedback system
Climate Bonus project report (WP6)
December 2009
Adriaan Perrels (VATT) Ari Nissinen (SYKE) Anna Sahari (VATT)
Funded by
Tekes, the Finnish Funding Agency for Technology and Innovation
Elisa Oyj
HK Ruokatalo Oy
Nokia Oyj tytäryhtiöineen
Ruokakesko Oy
Stora Enso Oyj Consumer Board
Tuulia International Oy

The Climate Bonus Research Consortium
Government Institute for Economic Research (VATT), coordinator
Perrels Adriaan (project leader), Heikkilä Tuomo (project manager), Sahari Anna, Tuovinen Tarja
Technical Research Centre of Finland (VTT)
Hongisto Mikko, Järvinen Timo, Kallio Arto, Lehtinen Juha-Matti, Melin Magnus, Södergård Caj
Agrifood Research Finland (MTT)
Katajajuuri Juha-Matti, Kurppa Sirpa, Nurmi Pauliina, Saarinen Merja, Usva Kirsi
Finnish Environment Institute (SYKE)
Koskela Sirkka, Nissinen Ari, Pakarinen Suvi, Seppälä Jyri, Tenhunen Jyrki
National Consumer Research Centre (KTK)
Hyvönen Kaarina, Saastamoinen Mika, Timonen Päivi
The project produced the following project reports:
Perrels A. – Hongisto M. – Hyvönen K. – Katajajuuri J.M. – Nissinen A. (2009): A quick scan of climate policy services and of underlying data system approaches – Climate Bonus project report (WP1), VATT Research Reports 143:1
Usva K. – Hongisto M. – Saarinen M. – Katajajuuri J. M. – Nissinen A. – Perrels A. – Nurmi P. – Kurppa S. – Koskela S. (2009): Towards certified carbon footprints of products – a road map for data production – Climate Bonus project report (WP3), VATT Research Reports 143:2
Perrels A. – Nissinen A. – Sahari A. (2009): Reviewing key building blocks of an integrated carbon footprinting and consumer purchases’ monitoring & reward system – interaction with the consumer – Climate Bonus project report (WP4), VATT Research Reports 143:3
Hyvönen K. – Saastamoinen M. – Timonen P. – Kallio A. – Hongisto M. – Melin M. – Södergård C. – Perrels A. (2009): Kuluttajien näkemyksiä kotitalouden ilmastovaikutusten seuranta- ja palautejärjestelmästä – Climate Bonus hankeraportti (WP5), VATT Tutkimukset 143:4.
Perrels A. – Nissinen A. – Sahari A. (2009): The overall economic and environmental effectiveness of a combined carbon footprinting and feedback system – Climate Bonus project report (WP6), VATT Research Reports 143:5.
Perrels A. – Heikkilä T. – Hongisto M. – Hyvönen K. – Katajajuuri J.M. – Nissinen A. – Usva K. (2009): Sustainable Consumption and Production Exposed – Synthesis report of the CLIMATE BONUS study concerning combined use of carbon footprinting, monitoring, feedback, and rewards, VATT Research Reports 143:6.

The overall economic and environmental effectiveness of a combined carbon footprinting and feedback system Climate Bonus project report (WP6) Government Institute for Economic Research VATT Research Reports 143:5/2009 Adriaan Perrels – Ari Nissinen – Anna Sahari
Abstract
This report is the fifth in a series of reports produced by the Climate Bonus study. In this project is surveyed what are the possibilities and effectiveness of the combined use of (1) verified carbon footprints (possibly visualised through labels), (2) personalised monitoring and feedback services to households regarding the greenhouse gas intensities of their purchases, (3) a reward system (bonuses) for consumers who manage to reduce the embodied emissions, and (4) a secondary reward system for retailers that successfully reduce the emission intensity of their sales. The present report starts with a review of how the large scale introduction of the envisaged carbon footprinting and feedback system would interact with existing policy instruments and measures. Subsequently, it discusses the options and obstacles regarding economically sensible deployment of the system, and tentative cost ranges. Finally, it introduced preliminary estimates of the emission reduction potential the envisaged system may be able to tap into and of the value the emission reduction potential could represent. As regards realisation of the potential some suggestions are done as regards improving the fit with existing instruments. Key words: bonus systems, carbon compensation, carbon footprints, carbon offset, embodied emissions, feedback, policy instruments, interaction effects, LCA, lifecycle analysis, voluntary emission trade JEL classification: D1, D8, Q01, Q54, Q56
Tiivistelmä
Käsillä oleva raportti on viides osa Climate Bonus – Kulutuksen ilmastovaikutus -tutkimushankkeen raporttisarjassa. Tässä osahankkeessa tarkastellaan, mitkä ovat mahdollisuudet ja mikä on toimien tehokkuus käytettäessä yhdessä (1) todennettuja hiilijalanjälkiä (ehkä esitettynä tuotemerkein), (2) kotitalouskohta-isia monitorointi- ja palautepalveluja ostosten kasvihuonekaasusisällöistä, (3) palkkiojärjestelmää kuluttajille, jotka vähentävät toteutuneita päästöjään ja (4) toisen asteen palkkiojärjestelmää kaupoille tai kauppaketjuille, jotka onnistuvat vähentämään myytyjen tuotteiden päästöintensiteettiä. Raportin aluksi tarkastel-laan, miten edellä hahmotellun hiilijalanjälki- ja palautejärjestelmän laajamittai-nen käyttöönotto vaikuttaisi nyt käytössä oleviin politiikkavälineisiin ja mittaamiseen. Seuraavaksi tarkastellaan edellä esitetyn taloudellisessa mielessä herkän järjestelmän vaihtoehtoisia toteutusratkaisuja ja esteitä sekä järjestelmän kustannusvaikutuksia. Raportin lopuksi esitetään alustavia arvioita päästöjen vähennyspotentiaalista ja päästövähennyksen arvosta, joita kuvatun järjestelmän käytöllä voitaisiin saavuttaa. Myös uuden järjestelmän käyttöönotosta ja sovittamisesta yhteen olemassa olevien instrumenttien kanssa esitetään alustavia ehdotuksia. Asiasanat: palkkiojärjestelmät, hiilikompensaatio, hiilijalanjäljet, välilliset päästöt, palaute, politiikkavälineet, vuorovaikutukset, elinkaariarviointi (LCA), elinkaarianalyysi, vapaaehtoinen päästökauppa JEL luokittelu: D1, D8, Q01, Q54, Q56

Foreword The study Climate Bonus – a carbon bonus/credit system for households is carried out by a truly wide scoped cross-sector consortium. It is amalgamating a wide range of sector knowledge, experience, and co-operation, and ranges from basic research to applied research. The ambition of this project is to create and gauge new approaches and solutions for climate change mitigation. The focus of Climate Bonus study is to give consumers, manufacturers and trade knowledge, means and opportunities to make selection in every day life to avoid carbon emissions.
The project may also be regarded as a very fitting example of the kind of integrated approach which the Advisory Board for Sector Research intends to promote. Furthermore, the project is also an example of how a substantial national research effort can create the basis for international co-operation, not only subsequently, but also concurrently. In fact for many national research themes it is straightaway beneficial to include a meaningful share of international co-operation, exchange or review.
This fifth report concludes the series of reports (apart from a separate summary report) by offering some insights about the emission reduction potential that this system could address, if it would get fully deployed in Finland. There are many factors that affect this deployment, including supportive government policies and pro-active and creative service provision by the private sector, in particular the retail sector. The assessment illustrates that there is room for private initiative and voluntary action in addition to and in conjunction with government driven policies. It should be realized that eventually a process of structural and far reaching reductions in greenhouse gas emission intensities of many different products and services can only be achieved linking the dynamics of innovation to incited behavioural change of consumers. The envisaged Climate Bonus system aspires to create the mutual reassurance between consumers and producers that there is demand for low emission product alternatives and hence that these products will be ever more offered to consumers. This requires a refined system of information provision, certification, feedback, and rewards in order to overcome the barriers owing to asymmetry in information and transaction costs. The envisaged system can also be regarded as an example of how concretely the transition towards a more sustainable economy can be facilitated by this kind of multi-layered – yet user-friendly – informational services. Helsinki, December 2009 Seija Ilmakunnas Director General


Contents
1 Introduction 1
2 Interaction with existing policy instruments 3
2.1 Classifying policy instruments 3
2.2 An overview of instruments aimed at consumers in Finland 4
2.2.1 Housing 7
2.2.2 Transport 8
2.2.3 Food 9
2.2.4 Other consumption 9
2.3 Effects of existing policy instruments 10
2.4 Instrumental features of the Climate Bonus system 11
2.5 Interaction of current instruments with the Climate Bonus system 13
2.6 A closer look at informational tools and Climate Bonus 16
3 Economic mechanisms affecting deployment of the system 18
3.1 Introduction 18
3.2 Reviewing the mechanisms 19
3.2.1 Product differentiation 19
3.2.2 Transaction cost and learning curves 23
3.2.3 Cost and risk minimisation 25
3.3 The deployment factors and context 26
4 Estimates of the economic and environmental effectiveness 30
4.1 Static and dynamic potential 30
4.2 The static and dynamic emission reduction potential 31
4.3 Responsiveness to prices 34
4.4 Exploiting the complementarity with existing instruments – suggestions for links 39
5 Conclusions and recommendations 43
References


1 Introduction
The integrated supply side and demand side information service package that constitutes the Climate Bonus concept encompasses several types of innovations. Firstly, it involves technical or technical-institutional innovations regarding data organisation at the supply side. Equally important, it entails similar types of innovations for feedback interfaces for households at the consumer side. It also implies social innovations, since a successful uptake of the concept presupposes changes in shopping habits. In turn such changes can only abound and be lasting when built on systemised reflective behaviour facilitated by monitoring of cumulating impacts of purchases. Last but not least it can also be regarded as a policy innovation. Eventually the purpose of the integrated package is to assist in the reduction of greenhouse gas emissions stemming from production and consumption of products and services. The integrated package can be understood as an example of how the process of sustainable transition can be put into practice. Typical for a sustainable transition is the mutually complementary interplay between public and private initiatives. In this context public initiatives predominantly concern the provision or support of basic physical and institutional infrastructure, of basic rules and side-conditions, and of an appropriate social-economic policy basis (fiscal, market conditions, etc.). The actual process and product innovations should come from the private sector in dialogue with households.
In the other work packages aspects of the technical and social innovations are studied (WP3, WP4) as well as tested in a consumer pilot (WP5). The present report of work package 6 concerns the review of the information service package from a policy point of view. On the one hand that means that possible positive and negative interaction with existing instruments is reviewed. Positive interaction implies that the existence of other instruments reinforces the effectiveness of the proposed information service package. On the other hand negative interaction implies that the effectiveness of this policy innovation and/or of existing instruments would be decreased. It is also relevant to get an idea what the overall effectiveness of the information service package would be, both in economic and in environmental terms. Given the still very early stage of development, it is impossible to say anything definitive or precise about costs. Instead, orders of magnitude can be indicated. A similar approach will be adopted with respect to the emission reduction potential that this information service package could address. Besides, both for cost-effectiveness and environmental effectiveness it can make a lot of difference whether the existing instrument portfolio will be amended.

2 Introduction
Chapter 2 gives a review of possible interactions with existing policy instruments and also reflects on the informational functions. Chapter 3 deals with the economic mechanisms that can get the system going. This includes also reflection on the role of innovations and alternative strategies to ‘mainstream’ the service. Chapter 4 provides a review of the tentative (gu)estimates of the economic and environmental effectiveness. Chapter 5 concludes with recommendations.

Interaction with existing policy instruments 3
2 Interaction with existing policy instruments
2.1 Classifying policy instruments
Prior to introducing a classification of instruments it may be useful to explain the difference between policy instruments and measures. The former imply some kind of legislation or regulation that aims to incite actors (households, companies) to do something. Measures are indeed the actions or investments incited by the policy instrument. Sometimes it may be hard to separate measures from policies. For example, in the case of green public procurement the instrument boils down to a package measures.
The service package, which Climate Bonus encompasses, has features of a policy instrument as well as of a measure. It incentivises consumers to shift to less emission intensive alternatives and incentivises producers to come up with low emission alternatives. This would classify it as an instrument. Yet, it is in fact assisting with behavioural change and emission audits and hence could also be regarded as a measure. Furthermore, it is set up as a private service (with some public good features) instead of a public service. Nevertheless in the background it needs public climate policy targets in order to be able to identify objectives for companies as well as to impute shadow prices of emission reductions.
All in all, the Climate Bonus service package could be regarded as a kind of voluntary agreement (see below), however, in this case with a more complicated (layered) obligation structure. The role of the public sector would concern the formulation of overarching targets, (co-)funding of development and demonstration efforts, ensuring the establishment of a system of quality control, and possibly the establishment or support of a reward system.
Four categories of instrument types can be distinguished (see e.g. Perrels, 2000; ASCEE Team, 2008), being:
1. Fiscal and financial instruments, such as taxes, levies for self financing systems (earmarked tax), subsidies and grants, which either increase the price of polluting to the polluter or decrease the price of being cleaner, and thereby incite (more) action to invest in energy efficiency, emission abatement, fuel switching and renewable energy.
2. Regulating instruments that due to direct or indirect intervention influence the volume of (fossil) energy used or emissions caused; a subdivision can be made between:
1. Rationing and prescription (e.g. emission quota, mandatory technologies and procedures), and

4 Interaction with existing policy instruments
2. Performance standards and benchmarks (e.g. total material requirement (TMR) targets, building performance standards).
3. Instruments that imply deregulation, either through the establishment of (quasi) markets or by delegating a large degree of freedom to companies or institutions within the framework of a negotiated package deal; examples are:
a. Emission permit trading and green certificates (for ‘green electricity’); b. Voluntary agreements (maximise degrees of freedom through
delegation). A voluntary agreement (VA) can be regarded as a package that can be filled in various ways and can also contain fiscal and regulating features.
4. Supportive actions, which aim at the improvement of knowledge levels and market transparency, either by adding knowledge (R&D) or by improving the accessibility (dissemination, training, etc.). Such actions lower the costs, especially the transaction cost, for environmentally benign technical and organisational innovations. Last but not least a systematic evaluation and monitoring of policy implementation belongs to this category. Supportive actions can virtually always be combined with other types of instruments.
2.2 An overview of instruments aimed at consumers in Finland
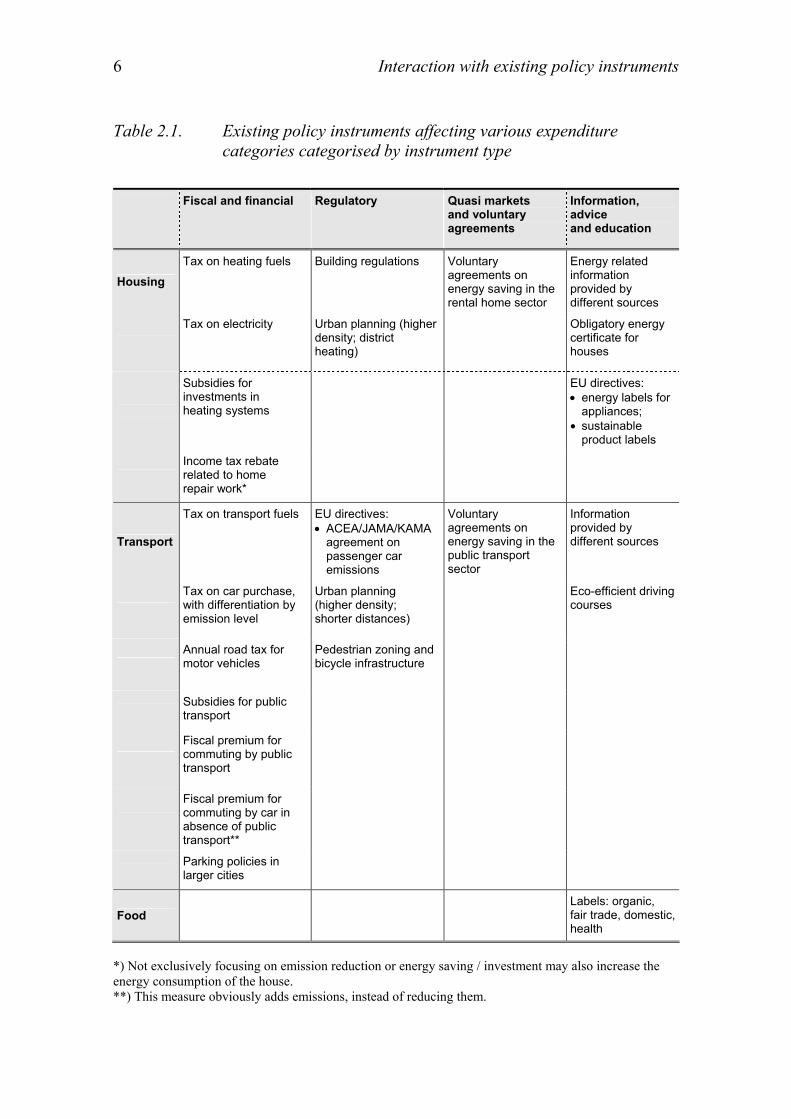
Table 2.1 (page 6) indicates that in the Finnish case climate policy instruments with respect to housing, transport and foodstuffs often take the form of either economic incentives (fiscal and financial) or informational services (information, advice and education). Only housing is subject to command and control policy. The proposed Climate Bonus system would fit into the category of information instruments, although if bonuses are granted, these could be considered as a form of subsidies, or – when mobilised within the system – as a revolving fund. In principle, information instruments work well with economic incentives, as they complement each other in guiding the choices of consumers.
It must be noted that this table lists only those instruments targeted at consumers and at climate policy related issues such as energy use. In relation to food, there are several ways of influencing the agricultural production process but these are not considered here1. Also transport is affected by many factors which are not policy instruments as such or not targeted specifically at consumers. Overall, with given demographic trends the need for transport is largely guided by regional and urban land use developments and planning. The interplay between 1 A wider scoped scan of other policies which may indirectly affect the effectiveness of climate policies would be useful in order to ensure better overall effectiveness of the climate policy package. Such an endeavour obviously goes well beyond the purpose of this report.

Interaction with existing policy instruments 5
trends and planning determines how shops, services, workplaces and homes are situated within municipalities and across urban regions. The availability and situation of, for example, bicycle and pedestrian routes also impacts on how much these means of transport are used. Another influential factor is the opportunity to use a company car. This benefit may take the form of the employer paying all expenses related to the car, or that the user of the car pays for fuel. In principle, a company car is a fixed cost to the employee, indicating that the unit cost gets smaller the more the car is used, while the marginal cost for the consumer may be indeed very low. This coupled with free parking space at the work place and free or low price parking facilities in large shopping centres makes the car the attractive default travel mode for many households.
It is worthwhile to note that, in addition to the instruments listed here, consumers have in recent years been targeted by several information campaigns and numerous newspaper articles related to climate change. There are also many internet sites dedicated to increasing awareness of the issue. Campaigns and websites are often organised by NGOs or government funded actors. There is also a government agency, Motiva, whose task is to promote efficient use of energy and renewable energy.
The following sections (after table 2.1) will examine the present policy instruments in more detail for each consumption category. Subsequently, an analysis of interactions with Climate Bonus can be carried out. At this point the final design and form of the new instrument is still open for discussion, thus the analysis of interactions can take into consideration alternative ways of implementing Climate Bonus. The goal is to identify features that the new instrument should have so as to function in the best possible way in the existing setting.
6 Interaction with existing policy instruments
Table 2.1. Existing policy instruments affecting various expenditure categories categorised by instrument type
Fiscal and financial Regulatory Quasi markets
and voluntary agreements
Information, advice and education
Housing
Tax on heating fuels Building regulations Voluntary agreements on energy saving in the rental home sector
Energy related information provided by different sources
Tax on electricity Urban planning (higher density; district heating)
Obligatory energy certificate for houses
Subsidies for investments in heating systems
EU directives: • energy labels for
appliances; • sustainable
product labels
Income tax rebate related to home repair work*
Transport
Tax on transport fuels EU directives: • ACEA/JAMA/KAMA
agreement on passenger car emissions
Voluntary agreements on energy saving in the public transport sector
Information provided by different sources
Tax on car purchase, with differentiation by emission level
Urban planning (higher density; shorter distances)
Eco-efficient driving courses
Annual road tax for motor vehicles
Pedestrian zoning and bicycle infrastructure
Subsidies for public transport
Fiscal premium for commuting by public transport
Fiscal premium for commuting by car in absence of public transport**
Parking policies in larger cities
Food Labels: organic,
fair trade, domestic, health
*) Not exclusively focusing on emission reduction or energy saving / investment may also increase the energy consumption of the house. **) This measure obviously adds emissions, instead of reducing them.

Interaction with existing policy instruments 7
2.2.1 Housing
The environmental impacts from housing originate mostly from electricity consumption and from the energy use related to heating the building. The need for heating is much dependent on the structural qualities of the building: insulation, choice of windows and building materials, etc. This issue is addressed by the code of building regulations, which states minimum levels of insulation for walls and windows. The regulatory text also includes guidance on what would be the preferred values, which is not necessarily the minimum level required. The structure of the regulations is in the process of being renewed, with the goal of gradually moving towards low-energy housing and measuring based on the total energy consumption of buildings. Meanwhile, the current standards are planned to be renewed in 2010 with stricter requirements for energy efficiency. The new regulations will tighten the standards related to insulation, ventilation and energy efficiency by approximately 30–40%. Further modifications based on the new structure of regulations are supposed to come into force in 2012. (www.ymparisto.fi: Ministry of Environment, visited 2.7.2008).
To increase the knowledge about the energy consumption of buildings, the energy certificate was introduced at the beginning of year 2008. All new houses must now have an energy certificate which categorises buildings into different energy efficiency levels, as does the energy label for appliances. In addition to the classification of the building into one of the categories from A to G, the certificate also includes more detailed information on the energy consumption values of the building. From 2009 onwards, the certificate must be drawn up for all houses and apartments that are sold or rented, with the exemption of detached houses and housing co-operations of less than six apartments. Also in 2008 came into force a new law that requires regular checks on air-conditioning equipment. The owner of the building is required to check the equipment at least once in ten years. (www.ymparisto.fi: Ministry of Environment, visited 2.7.2008).
The economic instruments related to housing take the form of taxes and subsidies. However, the taxes are fiscal in nature and are not targeted at environmental goals. Households pay a tax on electricity and heating fuels. Electricity used by households is taxed at a higher rate than electricity for industrial customers. The tax rate is 0.87 c/kWh (www.finlex.fi, visited 4.7.2008). Light fuel oil is taxed at 2.94 c/l (Customs, visited 7.7.2008). Detached or semi-detached homes are eligible for subsidies concerning investments related to changing the heating system into a less emitting one. Subsidies are granted for joining the district heating network, installing a wood-based heating system, installing a ground source heat pump system or renewing oil heating by adding a solar collector. A subsidy is also available for solar collectors, when these are connected to an existing heating system. At most the subsidy may be 10% of the connection fee for district heating or 15% of the total
8 Interaction with existing policy instruments
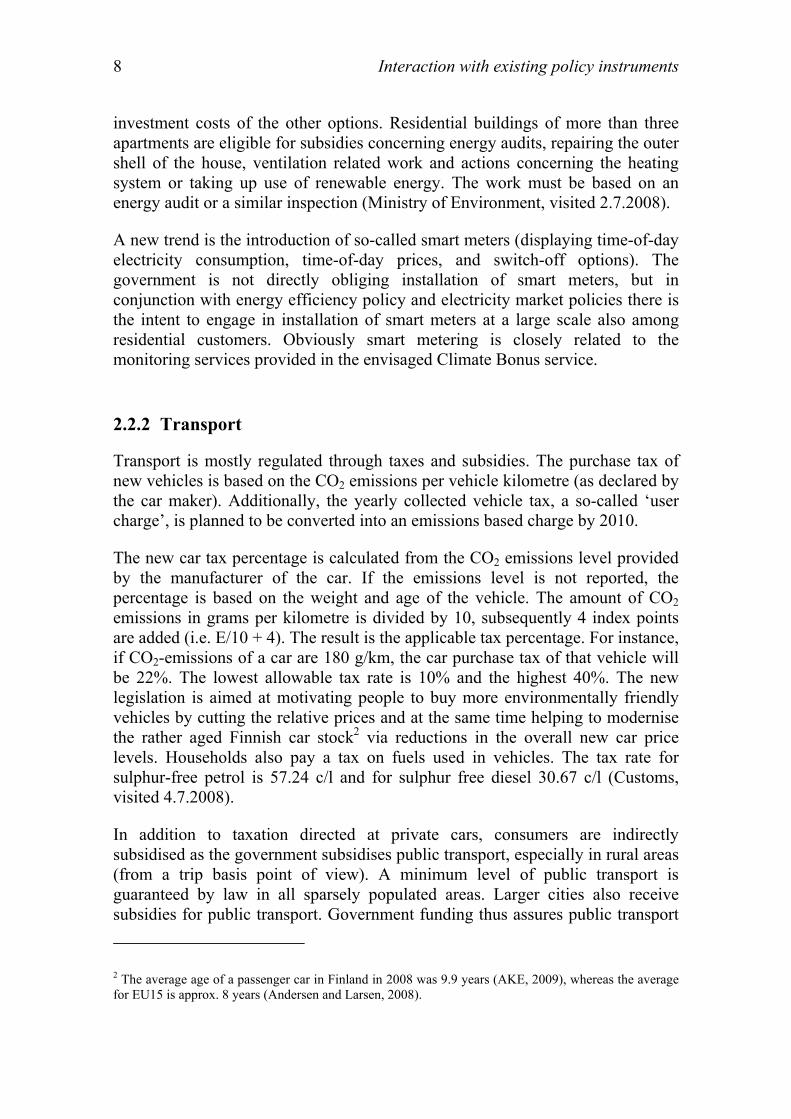
investment costs of the other options. Residential buildings of more than three apartments are eligible for subsidies concerning energy audits, repairing the outer shell of the house, ventilation related work and actions concerning the heating system or taking up use of renewable energy. The work must be based on an energy audit or a similar inspection (Ministry of Environment, visited 2.7.2008).
A new trend is the introduction of so-called smart meters (displaying time-of-day electricity consumption, time-of-day prices, and switch-off options). The government is not directly obliging installation of smart meters, but in conjunction with energy efficiency policy and electricity market policies there is the intent to engage in installation of smart meters at a large scale also among residential customers. Obviously smart metering is closely related to the monitoring services provided in the envisaged Climate Bonus service.
2.2.2 Transport
Transport is mostly regulated through taxes and subsidies. The purchase tax of new vehicles is based on the CO2 emissions per vehicle kilometre (as declared by the car maker). Additionally, the yearly collected vehicle tax, a so-called ‘user charge’, is planned to be converted into an emissions based charge by 2010.
The new car tax percentage is calculated from the CO2 emissions level provided by the manufacturer of the car. If the emissions level is not reported, the percentage is based on the weight and age of the vehicle. The amount of CO2 emissions in grams per kilometre is divided by 10, subsequently 4 index points are added (i.e. E/10 + 4). The result is the applicable tax percentage. For instance, if CO2-emissions of a car are 180 g/km, the car purchase tax of that vehicle will be 22%. The lowest allowable tax rate is 10% and the highest 40%. The new legislation is aimed at motivating people to buy more environmentally friendly vehicles by cutting the relative prices and at the same time helping to modernise the rather aged Finnish car stock2 via reductions in the overall new car price levels. Households also pay a tax on fuels used in vehicles. The tax rate for sulphur-free petrol is 57.24 c/l and for sulphur free diesel 30.67 c/l (Customs, visited 4.7.2008).
In addition to taxation directed at private cars, consumers are indirectly subsidised as the government subsidises public transport, especially in rural areas (from a trip basis point of view). A minimum level of public transport is guaranteed by law in all sparsely populated areas. Larger cities also receive subsidies for public transport. Government funding thus assures public transport
2 The average age of a passenger car in Finland in 2008 was 9.9 years (AKE, 2009), whereas the average for EU15 is approx. 8 years (Andersen and Larsen, 2008).

Interaction with existing policy instruments 9
in areas where otherwise it would not be profitable, while subsidies to cities should help in keeping prices at a competitive level and the network relatively dense.
2.2.3 Food
The eating habits of households have for years been actively targeted by information campaigns concerning health issues. The awareness and concern about environmental impacts of food production is a more recent issue. Furthermore there are also initiatives focusing on social implications of particular food production chains. These trends tie in with increasing interest in the welfare of livestock animals and the concerns about social implications of export oriented food production in developing countries.
In addition to advertising and campaigns, labelling is common concerning food products. In Finland, widely used and well-known food labels are the blue swan, (which stands for domestic production), organic food labels – both domestic and international, the fair trade label, and the heart label, which stands for a better choice concerning fats and salt within its product group. In general the labels can be divided into two categories: those providing information on the production process3, such as organic and fair trade labels and those related to health issues. Information is also distributed through websites, which often provide additional and background information for labelled products (Finnish food information, visited 2.7.2008).
Concerning the production process of food, there are many stages where different instruments are in place. Farmers may apply for an environmental subsidy, which is granted on the condition that the farmer performs certain actions, such as establishing a buffer strip between the fields and adjacent ditches, canals, rivers or lakes. The food processing industry (including logistics) is facing the same fuel taxes and norms as other industries outside EU ETS. Large food processing firms and retail chains often have their own environmental management systems.
2.2.4 Other consumption
Some categories of daily consumer goods and most white goods already have energy labels. The energy label for white goods is mandatory, based on EU legislation. In addition there exists an EU-wide ecolabel for better than average products. Both instruments are currently under the process of being extended (COM 2008). The Community Ecolabel Scheme is being revised so that the ecolabel can be extended to more product groups and the process of obtaining the 3 In the WP4 report, chapter 4, environmental labels (for food and other products) are discussed with respect to their technical and institutional background and regarding their effectiveness for consumers.

10 Interaction with existing policy instruments
label can be made less burdensome in order to encourage more producers to apply for the label. This label is voluntary.
The Ecodesign Directive will be extended to cover all energy-related products, setting minimum standards for products to be introduced to the internal market. The Energy Labelling Directive, which has been successful in increasing the market share of energy efficient appliances, will be extended to cover a wider range of products.
2.3 Effects of existing policy instruments
Many of the policy instruments targeted at household consumption were originally not motivated on environmental grounds. Taxes on fuel and electricity are classified as environmental taxes, but are predominantly if not entirely fiscal. Only recently have environmental aspects been taken up more actively, good examples are the new building regulations and the reform of the vehicle taxation system.
Due to the non-environmental reasoning behind the greater part of the regulation, it is difficult to estimate the sensitivity of consumers to these instruments and the potential environmental benefits resulting from instrument implementation. Furthermore, the impact of taxes is mixing with impacts of variations in prices of crude oil and wholesale electricity, and of rising incomes (at least until recently), and technical developments (regarding energy efficiency and otherwise), as well as demographic developments. Concerning housing, changes are slow to occur as the building stock renews slowly and large renovations in existing (old) buildings are only done with intervals of decades. It will take several years before the impacts of the new regulations and energy-related advice will become visible. There are no Finnish studies available regarding estimates of price and income elasticity of residential energy demand. From various international studies (Espey and Espey, 2004; Dahl, 1993) we do know that the price elasticity of residential energy demand tends to be low (i.e. around -0.1 ~ -0.2 in the short run and rising to -0.4 ~ -0.5 in the long run), whereas the income elasticity is often above 1.0. From these figures can be inferred that only steadily rising energy prices (i.e. due to annual increments of the energy/carbon tax) would lead to lasting significant effects on residential energy demand.
The market introduction of smart meters (for electricity consumption) is picking up only recently. Hence for the time being no assessment of its large scale impact can be made in Finland. Yet, on the basis of pilot studies and experiences in other countries (see also chapter 3 in the report of WP4), we can expect an impact of 4% to 10% compared to a baseline development of energy consumption.

Interaction with existing policy instruments 11
Similarly for transport, the vehicle tax reform was introduced at the beginning of 2008 and consequently sound empirical evidence of its impact can not be produced before summer 20094. According to the monitored sales of new cars (website of the Motor vehicle registration agency AKE), the average specific emission level (per km) of newly sold cars in 2008 was lower than the corresponding figures of 2007 and 2006. Yet, also other effects may have been kicking in, such as (lagged effects) of high fuel prices, scaled down income expectations, and an overall heightened awareness of and attention for the need to reduce greenhouse gas emissions. Moreover, the monitoring figures of AKE are an average based on declared fuel consumption per model, not an average of actually observed emissions (or of fuel consumption).
The food consumption of Finnish households has been documented for several years. As regards to food choice it is clear that information campaigns have had an effect. Eating habits have changed in favour of a more healthy diet, but the development has been slow and becomes visible when looking at data spanning several decades. For example, it is clear that from the 1950’s, the use of animal fat has declined whereas the consumption of fruit and vegetables and skimmed milk has increased (THL, 2008). No doubt this development is due not only to increased knowledge of health issues, but is also much a result of better availability of different food products and the general increase in the wealth and education levels of consumers. However, the trends in food consumption show that behaviour can be changed, if the required knowledge is present and consumers are offered alternatives to traditional choices. Also, the information related to health issues has been consistently provided by several official sources, and the dietary recommendations affect all food served at nursery schools, schools and canteens.
2.4 Instrumental features of the Climate Bonus system
The Climate Bonus system provides information prior to and during choice making. Furthermore, it provides feedback (ex-post) on the achieved emission levels of the realised purchases, both in comparison to previous periods and in comparison to peer groups. It also may include a reward system for those households that succeed in structural reductions of their attributed emissions.
The monitoring information for households, preferably tailored to the household’s profile, assists households to rearrange choices within and across product categories such that the resulting cumulated footprint is lower. The resulting emission reduction effect at the aggregate level can be regarded as a
4 In fact VATT is carrying out a quantitative assessment of the effects of the car tax reform, alongside other effects such as transport fuel prices, and household income developments.

12 Interaction with existing policy instruments
static emission reduction effect, as it supposes no changes in technologies. At best only the mixture (contribution) of various (given) technologies has changed.
At aggregate (national) levels the system can provide market information to retail chains and product chains regarding the apparent willingness of households to change product choices, both at detailed specific product levels and at product category levels (i.e. consumption style changes). This kind of information can facilitate (and precipitate) the market introduction of low emission alternatives of current products. After some initial phase this information could even be used in product chain related voluntary agreements to adopt carbon footprint reduction targets.
In principal also a reward system for the most successful retail chains or product chains could be devised. The emission intensity of the total sales (or of delineated product groups within the total sales) of competing retail chains could be followed. The best of class in a certain year could get a reward. It is not clear whether this reward should be earmarked for further investments in emission reductions, as this may lead to temporisation of introduction of low emission alternatives. Instead of rewarding retail chains (which in turn are supposed to activate product chains) product chains could also be addressed directly. In theory this may be more effective, but in practice institutional delineation of product chains could be difficult. Instead of rewarding the overall intensity of sales, rewards could be targeted to the most substantive low emission alternatives, possibly per product category (in order to avoid too much focus on a few easy picks only). All in all the purpose of the reward system for the production side is to add more significance to market feedback from consumers regarding desired low emission alternatives. In other words it is supposed to boost the dynamics in emission reduction innovation.
The monitoring system for households can include an option for buying emission compensation services. Such services operate in the so-called voluntary emission market, which in practice means that non-obliged parties purchase emission rights generated in emission reduction projects certified under the Clean Development Mechanism (CDM) or under the Joint Implementation (JI) arrangement. CDM projects are typically generated in developing countries, whereas JI projects are realised in so-called Annex B countries (those with an emission reduction obligation under the Kyoto Protocol).
Emission reduction potential in various stages of production can for example be identified in a greenhouse gas audit carried out in the context of a voluntary agreement of a product chain already monitored in Climate Bonus. In principle it would be possible to orientate voluntary emission compensation services towards CDM and JI projects that realise emission reduction in production phases of product chains participating in the Climate Bonus system. Please note that JI projects can be realised also in wealthy EU countries, including Finland itself.

Interaction with existing policy instruments 13
This would add a financing cycle into the entire scheme thereby facilitating the dynamics mentioned above and offering more options for households on the other hand.
2.5 Interaction of current instruments with the Climate Bonus system
Before putting in place a new instrument, it is important to determine how it would fit into the existing setting of consumer regulation. New measures will be mainly useful, if they target emission reduction potential (through behaviour) that current instruments cannot reach. Another reason for introducing a new instrument is the case in which it addresses an already targeted emission reduction potential more cost effectively or more comprehensively than the existing instruments. Finally, a new instrument (or elements thereof) may make existing instruments more effective. For example, more effective provision of information regarding product choices may sensitize people with respect to other incentives with the same purpose. All in all it means that Climate Bonus can be complementary by improving the effectiveness of existing instruments and by addressing potential, which has so far been left untouched. Yet, Climate Bonus can also be largely a substitute (i.e. a duplicate) to existing instruments. Finally, there will existing policy instruments with which Climate Bonus is not interacting. For the instruments discussed in the previous section table 2.2 is summarizing the kind of actions these instruments are inciting and providing indications whether Climate Bonus affects the listed actions as well.
Summarising, it can be inferred from table 2.2 that the envisaged Climate Bonus system partially covers the same actions as current instruments. This is especially true for housing and transport. In most cases the interaction is of a complementary nature, whereas the complementarity could be sometimes quite weak. As regards building regulations there is very little if any interaction. On the other hand smart metering in conjunction with Demand Side Management (DSM) has a large overlap with the envisaged Climate Bonus system. This would imply that – assuming a significant uptake of smart metering – the envisaged Climate Bonus system would have very modest additional effects as regards to home energy. It will be probably still helpful to enable a link between the smart metering system and the Climate Bonus system in order to allow the household to have a complete as possible picture of their emission impacts.
With respect to instruments that aim to incite to purchase more energy efficient models (such energy certificates and car purchase tax differentiation) the Climate Bonus system would provide comparison and verification options. For example, when a new car purchase is considered the cumulative emissions and fuel use of the current car can be extracted from the Climate Bonus monitoring system. Furthermore, ex-post the energy performance of the new car can be monitored easily.

14 Interaction with existing policy instruments
With respect to food products there is some interaction with various labelling schemes. Obviously, product labels which inform about a product’s carbon footprint, directly support the information service provide by Climate Bonus. However, if these labels are not harmonised (at product category level at least) there is a risk of confusion. Food products may also carry various labels simultaneously (fair trade, ecological, health effects, carbon footprint), which may lead to an oversupply of information for the consumer. On the other hand the Climate Bonus system can be extended with additional modules, e.g. regarding the nutrition values of foodstuffs. So, multi-label packages do not need to be conflicting with a Climate Bonus system, but again this would require co-ordination and harmonisation.
The comprehensiveness of the Climate Bonus system in terms of the ability to cover many different product groups is an extra advantage (i.e. lowering transaction cost) over all kinds of separately operating feedback systems, each reporting on one aspect of household consumption.
All in all, when accounting for the emergence of smart metering, the value added for housing may be limited, whereas for transport and food products the value added in terms of additional emission reduction potential seems to be larger. When considering the extended Climate Bonus system, i.e. including emission compensation services and links to CDM and JI projects in the involved supply chains, the value added increases further, while in that case the comprehensiveness of the system would make it attractive to integrate or link also the smart metering services.

Interaction with existing policy instruments 15
Table 2.2. Interaction of Climate Bonus with current policy instruments
Current
Instrument Targeted action (numbering refers to approximate order of relevance – no.1 represents prime effect)
Climate Bonus affects:
Housing Tax on heating fuels
1. Consumption level (of given fuel) 2. Choice of heating fuel (possibly in conjunction
with modifications in the heating system) 3. Choice of heating system (enabling more radical
reductions)
all; same order of relevance; complementary
Tax on electricity
1. Consumption level (with given equipment) 2. Choice of (electric) heating system (enabling
more radical reductions) 3. Choice of other electric equipment
all; more helpful for no.3 than no.2; complementary
Subsidies for energy systems
1. Choice (renewal) of heating system (enabling more radical reductions)
Somewhat; complementary
Building regulations
1. Overall energy consumption of the building regarding heating/cooling and hot tap water. Only relevant in the design phase and for large renovations. Building norms ensure ‘a floor’ in the energy quality of new homes.
not
Energy certificate
1. Exemplifying energy quality and resulting cost as part of overall housing cost at the moment of dwelling choice.
2. Improving the comparability of energy qualities of different homes for potential buyers
no.2 – somewhat;Verification of energy certificate
DSM + smart meters
1. Demand reduction in periods with high loads and prices
2. Learning to save energy and energy cost through regular feedback
no.2; duplication or integration
Transport Tax on transport fuels
1. Consumption level (of a given fuel and car), implying either changes in driving style and/or in mobility patterns and volume
2. Choice of car model (in terms of fuel efficiency and fuel choice)
all; same order of relevance; complementary
Tax on vehicle purchase
1. Choice of car model (in terms of fuel efficiency, fuel choice, and car size)
complementary; verification option
Annual tax on vehicle
1. Replacement of car (with low or deteriorating energy efficiency) by newer / more efficient model
complementary; verification option
Subsidies for public transport
1. To keep part of the car owners as regular public transport users
2. To keep mobility affordable for captive customers 3. Urban air quality 4. Attenuate multiple car ownership in households
somewhat
Food Labels 1. Purchase decisions in the shop, primarily choices between close substitutes
2. Create new loyalty dimensions (own health, environment, fair trade, local economy)
all; complementary or conflict depends on label scheme

16 Interaction with existing policy instruments
2.6 A closer look at informational tools and Climate Bonus
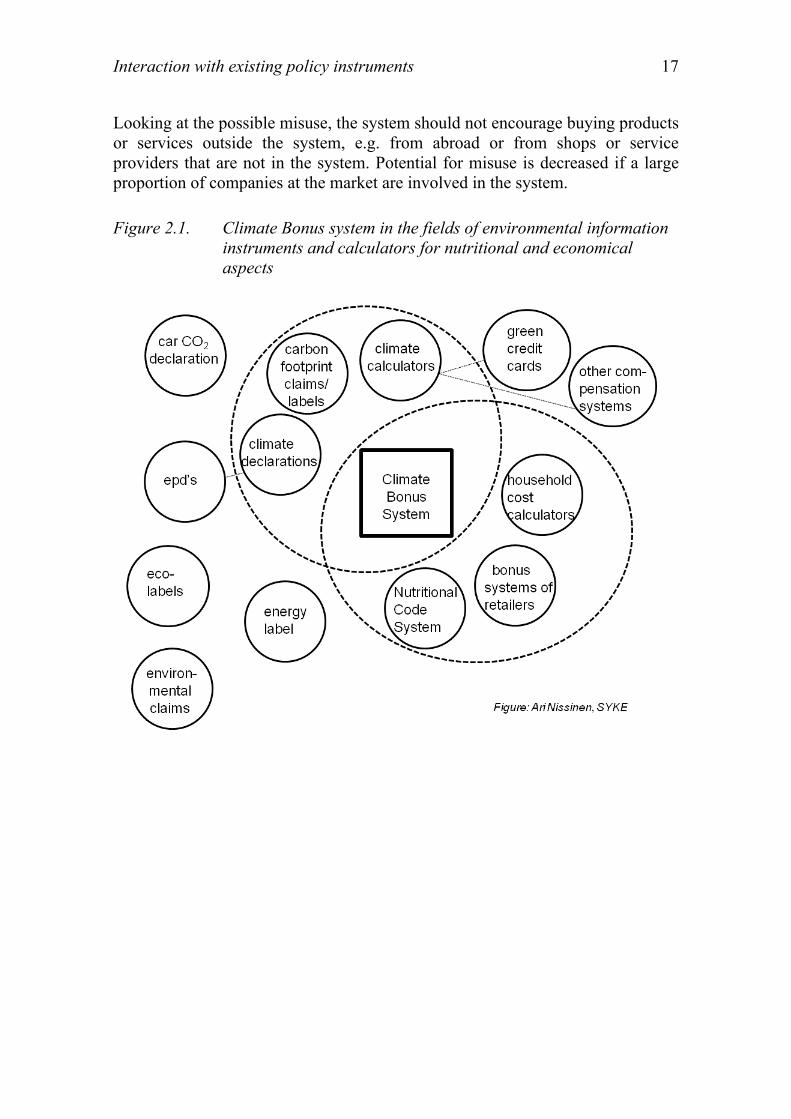
The Climate Bonus system integrates many properties and features of different instruments for delivering environmental information to people and persuading them to change their behaviour to a more climate friendly one. It takes information and may work hand in hand with climate labels, like the one by Carbon Trust. It includes a climate calculator. Supporting the information given by eco-labels, it can inform about choices that have smaller carbon footprint than other comparable products. It can use the climate impact data from environmental product declarations (epd's) and give benchmarks to the values from epd's.
The Climate Bonus System includes specific features which make it quite unique in the field of environmental information (and in the field of environmental policy instruments). First, regarding the type of information, it collects and handles quantitative climate impact information from the levels of individual households, market, country levels and any level between. Second, the data collection from each level is automatic, which is crucial to minimise the work load of consumers. Third, regarding the motivation of people to use the system, it offers a reward to consumers from climate friendly behaviour and purchasing choices.
If other calculator type services could be joined to the same service as the Climate Bonus System (Figure 2.1), they could certainly reinforce each other. These services include economical calculators and guiding system as well as nutritional calculation and guiding system, e.g. the Nutrition Code System (www.ravintokoodi.fi).
Note that Climate Bonus System is not just an information instrument, as it includes also the economical guiding effect (i.e. bonus-reward, likewise the bonus systems of retailers). Eco-labels refer here to type I labels (standard ISO 14024), epd's to type III environmental product declarations (ISO 14025), and environ-mental claims to self-declared environmental claims of type II (ISO 14023).
The steering effect of a bonus system depends on how well it succeeds in guiding, encouraging and motivating the consumer to choices that for sure cause less CO2 emissions than the choices that the consumer would do without the system. (Vice versa, also 'punishing' about choices that cause large CO2 emissions can be important). In addition, the relevance of the system depends on how well the system covers the most important sources of CO2 emissions in the private consumption. It also depends on the possibilities to misuse the system. Finally, the accuracy of the product/service -specific data also has implications for the steering effects that the system may have.
Interaction with existing policy instruments 17
Looking at the possible misuse, the system should not encourage buying products or services outside the system, e.g. from abroad or from shops or service providers that are not in the system. Potential for misuse is decreased if a large proportion of companies at the market are involved in the system.
Figure 2.1. Climate Bonus system in the fields of environmental information instruments and calculators for nutritional and economical aspects
18 Economic mechanisms affecting deployment of the system
3 Economic mechanisms affecting deployment of the system
3.1 Introduction
Even though the Climate Bonus system enables the identification of emission reduction potential that is economically beneficial from an aggregate societal point of view (i.e. a net social benefit could be produced when realizing it), the mere existence of that potential does not suffice to ensure its exploitation. There are up-front costs for the involved product chains and retailers. This means that the installation of the system should also produce benefits that should more than compensate for the costs in order to make the endeavour commercially attractive. It does not need to be beneficial for all producers and retailers; instead there should be just enough producers and retailers that see new opportunities in product differentiation on the basis of a product’s carbon footprint. Successful exploitation of this new dimension will incite or oblige other – but not necessarily all – producers and retailers to follow suit.
The system should be regarded as beneficial by a sufficiently large number of consumers. Initially the number of participating customers needs to be large enough to represent some critical mass in terms of demand for an initial collection of products. Over time the participation should increase, e.g. from 10% to 50% of the households, in order to incite ever more producers to offer low emission alternatives. The benefits for the consumer can constitute both monetary (material) and immaterial benefits. A consumer may realise that the aggregate effect of the endeavours of consumers may help to avoid higher carbon taxes or higher norms or limitations for certain products. The monitoring system may also turn out to be a good support for household management and thereby creating benefits either through savings or through quality improvements in the acquired portfolio of products and services. A consumer may also derive moral satisfaction from doing ‘a good thing for society’ or it may be just a matter of ‘warm glow’ (see also the reports of WP1 and WP4).
There are several mechanisms that can be instrumental to get producers and consumers willing to invest and participate in the system. These mechanisms will be briefly discussed below. In short they are:
o Product differentiation from a producer point of view:
• enabling price mark-ups by adding new features (such as carbon footprints) to a product
• distinguishing from others through lower emissions

Economic mechanisms affecting deployment of the system 19
• building a new basis for customer loyalty
o Product differentiation from a consumer point of view:
• new attributes may enable a consumer to get a product or service that is nearer to the ‘idea’ and hence a willingness to pay something extra results
• combination of new and existing attributes may even enable the creation of new (self-produced) attributes
o Transaction cost reductions:
• enlarging the potential number of participating consumers when the required time use, mental effort and material cost get smaller
• inciting producers to engage in participation (data generation) if the cost of participating and data generation go down (and at the same time consumer participation goes up)
o Cost minimisation:
• avoiding risks of regulatory costs related to climate policy
• reducing risks of environmental product innovation thanks to enhanced market information
• trying to create emission reduction investment funding via voluntary emission markets
3.2 Reviewing the mechanisms
3.2.1 Product differentiation
Perfect competition is an unattractive situation for any producer in any market. It means low profits and high risks. Therefore there is already a natural inclination within a market that producers try to differentiate from each other by offering variations of a certain product. These variations can concern key qualities of a product, e.g. durability or taste, but variations can also be realised regarding e.g. packaging (sizes, colours, etc.). From a producer point of view it is important to find variations or options to add attributes that have little consequences for the costs and for which consumers seem willing to pay extra.
In more affluent societies an increasing number of consumers is also interested in the social and environmental consequences of the production and use of a product or service. This consumer interest opens up new opportunities for producers to add attributes related to this interest. On the one hand a producer can try to reduce the environmental and/or social impacts of production and advertise these achievements. On the other hand the producer can reveal – at a
20 Economic mechanisms affecting deployment of the system
fairly detailed level – what are the environmental impacts of a product (e.g. the amount of greenhouse gas emissions per kg product – a so-called carbon footprint as also targeted in the Climate Bonus system). The latter approach can be used together with the first approach of marketing emission reduction efforts, but it can also be applied separately e.g. when the concerned product is supposed to compare quite favourably with many competing products.
Focusing on foodstuffs and other daily purchases, one can assume that most of the concerned products are sold in fairly and sometimes even very competitive markets in which already a great deal of product differentiation exists. This means that new attributes can be very welcome, but the manoeuvring space for price increases (to accommodate extra cost) is often limited. Figure 3.1 summarises an example market, in which one can roughly distinguish a supply of standard products with high price elasticity of demand and modest margins, and a supply of up-market products with a lower price elasticity of demand and better margins (‘up-market premium’). Yet, the sales volumes in the up-market section are smaller.
As can be seen in figure 3.1 price rises of standard products are heavier penalised in terms of demand reduction, as compared to price rises of up-market products. In this light a producer which produces both standard and up-market products can better first introduce the carbon label in the up-market segment. In that case the producer may be able to earn part of the costs back via a price increase and a part via expansion of market share. Thanks to learning effects the unit-cost of carbon footprinting will go down and subsequently the producer may be able to introduce the label for standard products.
The producer may also decide right from the start that adding of carbon footprints could assist in rebranding a product and thereby enable to charge a higher price without too high penalties. So, gradually the space between the up-market and the standard market may get filled up (figure 3.2). In case of sufficient success other producers will follow and consequently the remaining standard product market becomes more marginal with even higher price elasticity (very price sensitive customers) and lower margins. Beyond some degree of adoption the carbon footprint starts to become a standard attribute and its absence would start to become a minus (a reason for rebate) rather than the presence of a valuable extra attribute.

Economic mechanisms affecting deployment of the system 21
Figure 3.1. A market with two segments, with different demand elasticities and margins
price
quantityQs0Qu0
ps0
pu0
’upmarket’
’standard product’
upmarket premium
price
quantityQs0Qu0
ps0
pu0
’upmarket’
’standard product’
upmarket premium
Figure 3.2. A market with two segments, with different demand elasticities and margins, after introduction of the carbon footprint as an extra attribute
price
quantityQs1Qu1
ps1
pu1
’extended upmarket’
’remaining standard product’
Carbon footprinting enablesproduct differentiation and premiumsbut may squeeze the standard market
price
quantityQs1Qu1
ps1
pu1
’extended upmarket’
’remaining standard product’
Carbon footprinting enablesproduct differentiation and premiumsbut may squeeze the standard market
22 Economic mechanisms affecting deployment of the system
It should be realised that consumer response to carbon labelling and/or monitoring can be more elaborate than anticipated. Due to budget constraints and linkages between products reallocation in one segment of the household budget leads to reallocation in other segments5. From an environmental point of view the resulting overall change in emission effects of purchases should be the prime criterion. The possible consequences of overall budget reallocation are discussed in chapter 4.
The envisaged Climate Bonus system could be extended with monitoring and feedback information for other dimensions of consumptions, such as personal health (which closely relates with food choice and ways of moving around) and monetary budget management. Apart from the ability to attract more users by adding services, it also entails so-called economies of scope (i.e. the unit cost of each of these services would be higher when provided separately). The increase in the number of users relates to the well known economies of scale (see also next section).
The above described product differentiation mechanisms can assist in a smooth introduction of – eventually – widely used carbon footprints. Retailers and retail chains regard their shopping services also as a product or rather a product portfolio, which indeed should distinguish itself favourably from the portfolios of other retailers. In the case of adding carbon footprint information, monitoring and feedback as attributes product differentiation with respect to the service packages of retail chains is however not without problems. On the one hand the possibility to link these attributes with existing marketing and client loyalty systems will lower the threshold for participation. On the other hand for consumers without a predominant retailer in their shopping patterns it would necessitate the use of various monitoring systems. The latter could be overcome by using a separate overarching aggregator monitoring service. Technically that would be easy to realise, but it should remain both commercially and behaviourally attractive to do so. Notwithstanding the challenge of this aggregation problem for the consumer the development pathway via retail chains (or groupings) seems more viable than to create straightaway a national system. The latter alternative risks eliminating the market mechanisms, such as (service) product differentiation and client loyalty, which motivate commercial parties to engage in these systems.
5 These budget allocation effects should be distinguished from effects regarding reshuffled choices within a product group to which new alternatives are added, i.e. the so-called context effects (see section 2.1 in the WP4 report)
Economic mechanisms affecting deployment of the system 23
3.2.2 Transaction cost and learning curves
When the number of participating firms and the number of generated footprints increases the cost of footprints and the cost impacts for consumer products can be expected to diminish. This makes entry ever more attractive for a steadily increasing number of producers. With reference to figure 3.1 it means that it is not anymore necessary to transform a standard product into an up-market product, but they may be already enough manoeuvring space within the standard product segment. In turn this would imply that a larger number of customers would get involved or at least quicker involved than otherwise would be the case. Furthermore, a larger offer of products with carbon footprints also raises the interest among consumers to use the Climate Bonus system as the information gets ever more accurate.
The transaction cost concept is also relevant at the consumer side. Consumers put in effort to browse and interpret information provided by the monitoring service. It also costs time that could have been used for other purposes. Therefore, better user interfaces that are easier to use and which can be tailored to the information needs of the consumer will reduce the transaction cost for the consumer and thereby improve the prospects that consumers are willing to use the system as well as that consumer keep on using the system. A larger number of consumers implies larger markets and/or more reliable feedback about consumer dynamics with respect to various product groups. In turn these features make the system more attractive for producers.
The threshold effect of transaction cost is among others influenced by the media used for communication with consumers. As such the envisaged Climate Bonus system requires at least an internet based system (see section 2 of the report of WP5 for a technical outline), but there could also be a role for mobile phones (see the report of WP5). Furthermore, the effectiveness of the information in the Climate Bonus system also depends on the extent and quality of carbon labelling on products, on other information in shops, and on other (background) information, such as through internet, newspapers, television, etc. When denoting all these other channels as auxiliary channels, it is clear that reduction of the use auxiliary channels reduces the overall carbon footprinting cost for the producer and/or retailer, but shifts in fact the transaction cost to the consumer (who will somehow have to do more effort). In as far as the reduced use of auxiliary information channels leads to less or slower response by consumers, the cost reduction of less auxiliary channels may be cancelled out again (at least at the level of unit cost per footprinted and/or low emission product). Since information availability and its contextual suitability are so essential for the intended changes, it seems that a cost minimising strategy with respect to media channel use is not recommendable. Furthermore, the economies of scale and scope are large, which

24 Economic mechanisms affecting deployment of the system
means that eventually the up-front cost should not be too much decisive in development of the system6.
The scale effects and learning effects of carbon footprinting can be expected to be significant7. On the other hand the overall costs are nonetheless substantial. It is therefore important to provide at least a crude picture of the orders of magnitude of the cost. Table 3.1 summarises the total cost of carbon footprinting large numbers of products at different unit-cost of carbon footprints. The table also shows how these total cost levels relate to the aggregate food expenditures in Finland and the entire EU respectively. It should be stressed that the figures represent only a hypothetical calculatory exercise with the aim to show the order of magnitude of scale effects. The average price per footprint is based on interval information and anecdotic examples from experts. Since carbon footprinting has been so far mostly applied to single and quite dissimilar products, costs tend be high and with a large variation between products, countries, and methodological rigour. So, even though it is possible to find examples of unit-cost of 100 000 Euro, 30 000 Euro seems a good enough representative level for the unit-cost of carbon footprinting when there is limited scope for learning and cost sharing. The level of 7 000 Euro is not based on rigorous analysis, but is a tentative compromise level where – in the context of large scale footprinting – a reasonable level of rigour is combined with important steps in cost efficiency, e.g. thanks to shared analysis and (procedural) learning. The 2 000 Euro level represents a situation where very large improvements in cost efficiency have been realised, either due to extensive learning curve effects (might be relevant in the long run) or due to more compromises with respect to rigour. Even though maintenance of the carbon footprint system will be necessary, the greater part of the above costs is up-front, i.e. one time, costs.
The indicators regarding the shares in total food expenditures of households represent the assumption that the cost of carbon footprinting would be spread out over a large part of the sales of non-durable products. This may happen to some extent, but is probably not stretched out over the entire sales. So, for a subset of products the shares would be higher than shown in table 3.1. This notion underscores the need to keep the share low, e.g. well under 1%. In other words a prospect of limited scale and learning effects (30 000 Euro level) makes large scale uptake of carbon footprinting unlikely, as long as footprinting is mostly done at a national level. When the average unit-cost get under the 10 000 Euro prospects start to improve. At the national level (in Finland) an order of magnitude of 10 000 products may suffice. At an EU level there will be more
6 During the concluding CLIMATE BONUS seminar of 8-5-2008 various speakers pointed at this feature, while referring to the practical experiences of the Carbon Trust and others. 7 An expert of the Sustainable Consumption Institute (Heinz Stichnote) affirmed that these effects are very substantial.

Economic mechanisms affecting deployment of the system 25
diversity within each product group, thereby necessitating larger numbers of products. Nevertheless the scale effect of consumption at EU level is much stronger than the effect of the necessary (minimum) number of footprinted products. This hints at the advantages of co-operation and harmonisation at international level.
Table 3.1. Hypothetical scale effects for carbon footprint costs*
Cost as share of total food expenditures Average price
/ footprint (€) Number of products
Total cost of footprinting (mln. €)
Finland only EU level **
30 000 10000 300 1.8% 0.0%
- 35000 1050 6.2% 0.1%
- 100000 3000 17.6% 0.3%
7 000 10000 70 0.4% 0.0%
- 35000 245 1.4% 0.0%
- 100000 700 4.1% 0.1%
2 000 10000 20 0.1% 0.0%
- 35000 70 0.4% 0.0%
- 100000 200 1.2% 0.0%
*) NB! Figures are hypothetical, though partly based on indicative intervals provided by various professionals; please do not use out of context. **) N.B! shares lower than 0.05% are rounded off at 0.0%
3.2.3 Cost and risk minimisation
The information collected and processed for the generation of carbon footprints is often also very helpful for the identification of production stages and technologies for which a significant emission reduction potential exists. In other words it comes close to or even practically includes a greenhouse gas emission audit (similar to an energy efficiency audit). A part of this potential represents straightaway commercially attractive cost savings options. The rest of the potential would need some outside assistance or incitement to be realised. Over time the potential may shrink or increase due to – inter alia – technological development in production processes and changes in product portfolios.
Apart from cost savings, the realisation of emission reductions enables the introduction of low(er) emission product alternatives. Such products fit well with a carbon footprint strategy, not the least as consumers seem to expect that more low carbon alternatives come on offer when they are participating in carbon monitoring services (see also section 6.1.7 of the report of WP5). The monitoring
26 Economic mechanisms affecting deployment of the system
service provides feedback from consumers about the interests, wishes and inclinations that consumers have with respect to carbon footprint reduction. This helps to lower the market risks of eco-innovations.
By adding options for voluntary offset services it may be possible to use those means for the investment in emission reduction in the supply chain. In conjunction with this it would be very helpful to assess the applicability of CDM and JI for addressing the emission reduction potential in the identified production establishments and sectors.
The participation of companies in a system such as Climate Bonus can also be regarded as an anticipatory action which may prevent public regulation or at least helps to accommodate proposed new regulation to the actions already taken or underway. It offers options to achieve emission reductions in a way which is better suited to the company in comparison to alternatives implying imposed obligations.
3.3 The deployment factors and context
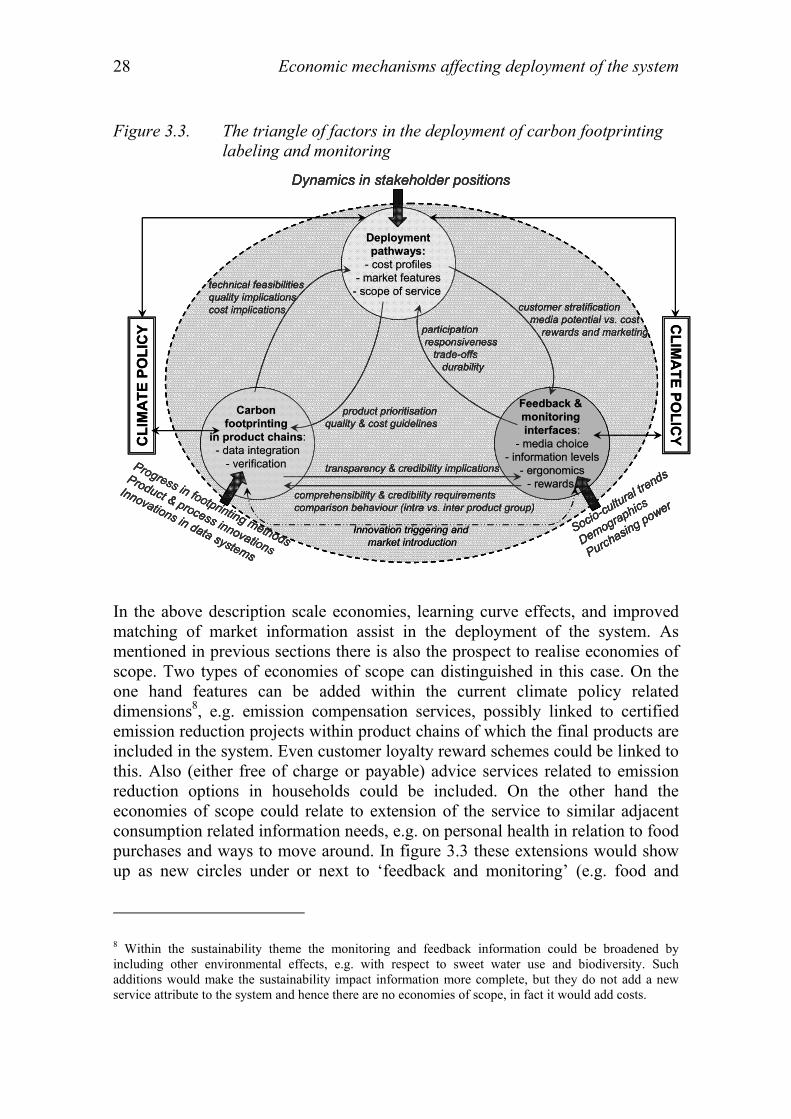
As has been explained in the reports of WP3, WP4 and WP5, the effectiveness of the envisaged system is determined by three sets of factors, being (1) the accuracy, comprehensiveness, and tractability of the recorded emissions per product chain, product group, etc., (2) the appeal and incitement effect of the monitoring and feedback service for consumers, and (3) the deployment strategy of the system in conjunction with product-market strategies of products and product groups included in the system.
When a sector or a large retail chain or an entire country endeavours into the development and deployment of a system such as envisaged in Climate Bonus it seems indispensable to make first strategic choices regarding the eventual ambition levels of the system. The ambition levels can refer to the targeted amount of emission reduction, to the number or specificity of products involved, the degree of involvement of the retail sector (notably the retail chains), and to the participation rate of consumers. This doesn’t mean that all these ambition levels are prefixed at the very start, but a minimum level of quality and scope should be clear when building up the system at the production side. With reference to figure 3.3 this means that at a strategic level (top of fig. 3.3; ‘deployment pathways’) is indicated – on the basis of prior knowledge – in which product areas the high quality footprinting system should be developed first and how that should be embedded in a wider scoped monitoring and feedback system offered to consumers (customers).
At the production side these guidelines could include cost ranges for the footprints, preferred level of product-specificity and comparability, etc. At the
Economic mechanisms affecting deployment of the system 27
consumer side it should indicate the levels of information and scope of product categories that monitoring system offers to consumers, and the learning opportunities of those systems. Furthermore, alongside this information and feedback channel it should consider the interaction with information provided on packages (labels), in shops, and elsewhere in electronic and printed media (not the least by sources outside the control of the strategy maker). Obviously also the role of pricing and price differentiation should be considered. When subsequently the plans are operationalised at the production and the consumer side the direct interaction between these two sets of factors should be kept in mind. In particular the accuracy and reliability of the data and the resulting footprint are key issues in this respect. Also the apparent meaningfulness (or lack thereof) of particular product comparisons for consumers is important for guiding the decisions regarding the precision levels in the carbon footprinting data system.
After an initial system is established the evaluation of the feedback from customers, both through the remitted information and through the purchasing decisions, should help to guide the evolution of the system. Similarly, experiences at the production side with the operation of the initial emission information system should help to guide its further development, notably with respect to reducing the costs footprinting and optimising the accuracy of the system. Through these learning processes the system will evolve into a more comprehensive system. However, its development pathway will also be affected by the way the overall climate policy is developing as well by the technical developments in carbon footprinting methods and information systems.
28 Economic mechanisms affecting deployment of the system
Figure 3.3. The triangle of factors in the deployment of carbon footprinting labeling and monitoring
Carbon footprinting
in product chains:- data integration
- verification
Feedback & monitoring interfaces:
- media choice- information levels
- ergonomics- rewards
Deploymentpathways:
- cost profiles- market features
- scope of service technical feasibilitiesquality implicationscost implications
product prioritisationquality & cost guidelines
participationresponsiveness
trade-offsdurability
customer stratificationmedia potential vs. cost
rewards and marketing
transparency & credibility implications
comprehensibility & credibility requirementscomparison behaviour (intra vs. inter product group)
Dynamics in stakeholder positions
Progress in footprinting methods
Product & process innovations
Innovations in data systems
Socio-cultural trends
Demographics
Purchasing power
Innovation triggering and market introduction
CL
IMA
TE
PO
LIC
Y
CL
IMA
TE
PO
LIC
Y
Carbon footprinting
in product chains:- data integration
- verification
Feedback & monitoring interfaces:
- media choice- information levels
- ergonomics- rewards
Deploymentpathways:
- cost profiles- market features
- scope of service technical feasibilitiesquality implicationscost implications
product prioritisationquality & cost guidelines
participationresponsiveness
trade-offsdurability
customer stratificationmedia potential vs. cost
rewards and marketing
transparency & credibility implications
comprehensibility & credibility requirementscomparison behaviour (intra vs. inter product group)
Dynamics in stakeholder positions
Progress in footprinting methods
Product & process innovations
Innovations in data systems
Socio-cultural trends
Demographics
Purchasing power
Innovation triggering and market introduction
Carbon footprinting
in product chains:- data integration
- verification
Feedback & monitoring interfaces:
- media choice- information levels
- ergonomics- rewards
Deploymentpathways:
- cost profiles- market features
- scope of service technical feasibilitiesquality implicationscost implications
product prioritisationquality & cost guidelines
participationresponsiveness
trade-offsdurability
customer stratificationmedia potential vs. cost
rewards and marketing
transparency & credibility implications
comprehensibility & credibility requirementscomparison behaviour (intra vs. inter product group)
Dynamics in stakeholder positions
Progress in footprinting methods
Product & process innovations
Innovations in data systems
Socio-cultural trends
Demographics
Purchasing power
Innovation triggering and market introduction
CL
IMA
TE
PO
LIC
Y
CL
IMA
TE
PO
LIC
Y
In the above description scale economies, learning curve effects, and improved matching of market information assist in the deployment of the system. As mentioned in previous sections there is also the prospect to realise economies of scope. Two types of economies of scope can distinguished in this case. On the one hand features can be added within the current climate policy related dimensions8, e.g. emission compensation services, possibly linked to certified emission reduction projects within product chains of which the final products are included in the system. Even customer loyalty reward schemes could be linked to this. Also (either free of charge or payable) advice services related to emission reduction options in households could be included. On the other hand the economies of scope could relate to extension of the service to similar adjacent consumption related information needs, e.g. on personal health in relation to food purchases and ways to move around. In figure 3.3 these extensions would show up as new circles under or next to ‘feedback and monitoring’ (e.g. food and
8 Within the sustainability theme the monitoring and feedback information could be broadened by including other environmental effects, e.g. with respect to sweet water use and biodiversity. Such additions would make the sustainability impact information more complete, but they do not add a new service attribute to the system and hence there are no economies of scope, in fact it would add costs.
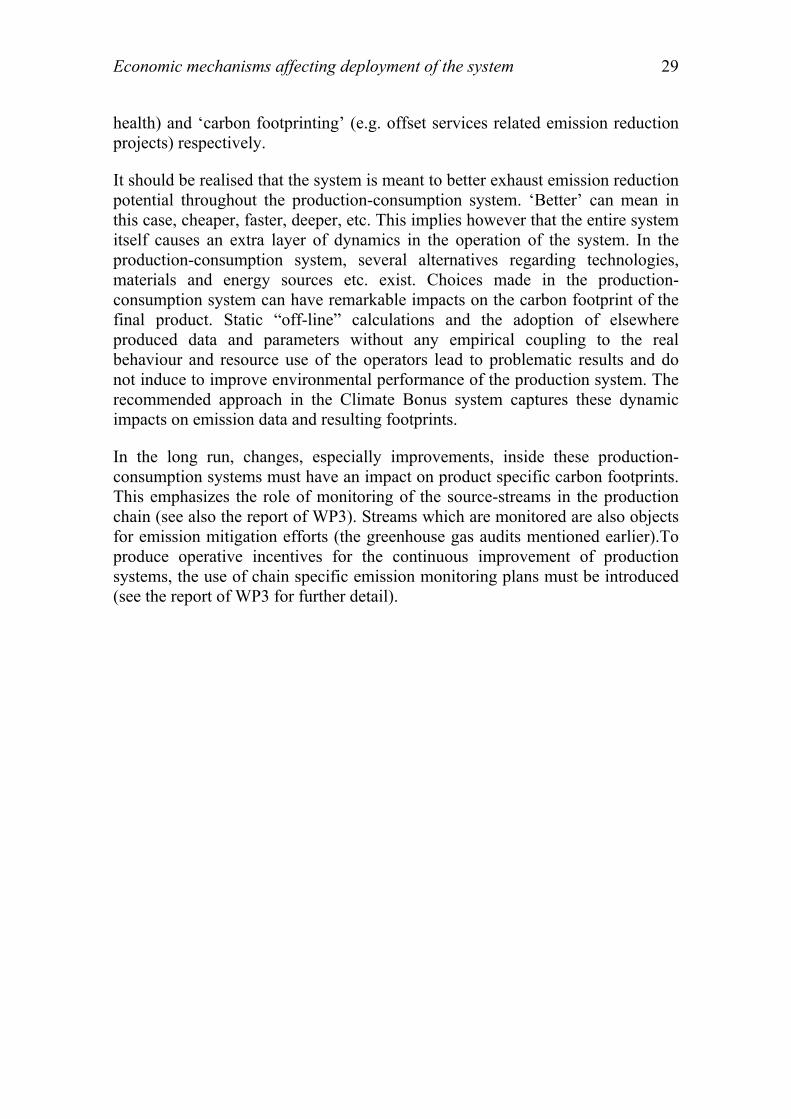
Economic mechanisms affecting deployment of the system 29
health) and ‘carbon footprinting’ (e.g. offset services related emission reduction projects) respectively.
It should be realised that the system is meant to better exhaust emission reduction potential throughout the production-consumption system. ‘Better’ can mean in this case, cheaper, faster, deeper, etc. This implies however that the entire system itself causes an extra layer of dynamics in the operation of the system. In the production-consumption system, several alternatives regarding technologies, materials and energy sources etc. exist. Choices made in the production-consumption system can have remarkable impacts on the carbon footprint of the final product. Static “off-line” calculations and the adoption of elsewhere produced data and parameters without any empirical coupling to the real behaviour and resource use of the operators lead to problematic results and do not induce to improve environmental performance of the production system. The recommended approach in the Climate Bonus system captures these dynamic impacts on emission data and resulting footprints.
In the long run, changes, especially improvements, inside these production-consumption systems must have an impact on product specific carbon footprints. This emphasizes the role of monitoring of the source-streams in the production chain (see also the report of WP3). Streams which are monitored are also objects for emission mitigation efforts (the greenhouse gas audits mentioned earlier).To produce operative incentives for the continuous improvement of production systems, the use of chain specific emission monitoring plans must be introduced (see the report of WP3 for further detail).
30 Estimates of the economic and environmental effectiveness
4 Estimates of the economic and environmental effectiveness
4.1 Static and dynamic potential
When assessing the emission reduction potential that the Climate Bonus system could address, it is important to distinguish between so-called static and dynamic effects. The static effects represent the short term impacts of the changes in consumer choices and the changes in budget allocation. In other words by shifting demand towards – already existing – less emission intensive products a certain net reduction in overall emissions attributable to consumption can be expected. This change in overall emissions is realised without any new technologies. At best one can say that in some cases low emission production technologies will win some ground at the expense of emission intensive production technologies.
The dynamic effects start to kick in when producers switch to technologies and inputs that are less emission intensive and consumers start to buy the resulting less emission intensive products instead of the more emission intensive products that were so far on offer. Low emission innovations can mean that consumers can continue to buy products from an originally typically emission intensive product category or even are pulled back to such a category. Low emission innovations may also entail more complicated product service combinations. For example, instead of (multiple) car ownership a household may choose to contract into a car sharing service in combination with public transport season cards.
Even though at this stage neither of the effects (static or dynamic) can be estimated very accurately, it is somewhat easier to simulate the static effects than the dynamic effects. The reason is that by means of consumer pilots and with the aid of consumption expenditure models we can get at least some impression of the structure, pace and order of magnitude of the changes. Yet, as regards the generation of low emission product innovations there are larger uncertainties with respect the pace of change, market uptake, sector coverage, etc. Considering the achievements based on greenhouse gas audits in the UK (The Carbon Trust programme ‘Managing carbon in the supply chain’; see also report of WP1) significant emission reductions can be achieved against low cost or sometimes even net cost savings. Therefore in the long run the dynamic effect can be expected to become as important as or even more important than the static effect. On the other hand the static effect produces results more quickly and is therefore important as an incitement to companies to start participation already soon. Furthermore, as consumer participation can be expected to build up gradually (e.g. 10% of the households 1½ year after introducing the system and 70% after 7 years), the static effect will continue to be significant during the participation
Estimates of the economic and environmental effectiveness 31
build-up period, meaning that subsequent cohorts of new participating households will only by then realise their static emission reduction potential.
Another complication is that the static and dynamic emission reduction potentials cannot be simply aggregated. Some of the dynamic effects, i.e. product and process innovations, may invoke a reversion of purchase patterns. The reversion means that people start to buy again products, in their low emission variety, from which they had turned away earlier. In that case the dynamic and static effects are largely substitutes instead of complements.
In this respect it is also good to realise that – a priori – it is uncertain to what extent the emission reductions are realised domestically and to what extent abroad. Provided that even in initial stages the greater part of the emission data allows for reasonable detailed assessments, e.g. at least at product sub-category level, while having also a fairly complete coverage, it should be possible to assess (approximately) to what extent the changes in consumption and production have caused emission reduction domestically and abroad respectively. It can not even be excluded that either domestically or abroad an increase of emissions occurs (which would be more than compensated by a reduction in the other area).
4.2 The static and dynamic emission reduction potential
As discussed in the report of WP4 there is empirical evidence regarding the responsiveness of consumers in feedback experiments and services. All in all an impact of 5% to 15% reduction in the target variable (in this case monitored emissions of consumer purchases) seems to be a reasonable expectation level. During the consumer pilot of the Climate Bonus study the recorded average emission intensity went down by 4%, but that is a very haphazard result based on a short period and a small group (see section 5 of the report of WP5). When checking the variation in emission intensities across participating families it seems that larger reductions simply by not too far fetched changes in product choices must be possible. All in all it seems therefore wise at this stage to stick to the above mentioned interval of 5% ~ 15% in conjunction with the static potential only.
The next challenge is to link the 5% ~ 15% interval to the emission amount embodied by the product categories addressed via the envisaged Climate Bonus system. Furthermore, also the degree of participation of households in the Climate Bonus service affects the eventually feasible static emission reduction potential.
The envisaged Climate Bonus system seems especially effective and complementary for the consumption categories ‘foodstuffs’ and ‘transportation’.

32 Estimates of the economic and environmental effectiveness
In addition there are some remaining smaller consumption categories with high emission intensities, which could be included. Examples are the product group ‘products for gardening, cut flowers, etc.’ and building materials (for do-it-yourself). Last but not least the consumption category ‘home energy’ can be included, despite the fact that various existing and upcoming measures leave relatively little complementary effect for the envisaged Climate Bonus system. Nevertheless links with smart metering systems, the energy certificates for homes, and with heating system renewal decision making can be expected to produce some extra emission reductions.
The exploitation of the dynamic potential (i.e. the market introduction of low emission innovations) will start up somewhat later, when the strength and direction of the consumer responses have become more established and also the rate of participation has achieved a certain (minimum) level. Figure 4.1 illustrates the progressing of the exploitation of the static and dynamic potential over a period of 132 months. For simplicity symmetric saturation processes have been assumed, therefore the uptake of the static potential shows a slower pace in the beginning than should be expected (and should be aimed). The static potential represents the reference level for the index (full exploitation = 1).
Figure 4.1. Example of the exploitation pathways of the addressable static and dynamic potential, while accounting for interaction effects when aggregating the potentials
0,0
0,5
1,0
1,5
2,0
2,5
1 9
17
25
33
41
49
57
65
73
81
89
97
10
5
11
3
12
1
12
9
month
po
ten
tial
sat
ura
tio
n in
dex
(re
f=st
atic
=1) static potential
saturation
dynamic potentialsaturation
total potentialsaturation
Table 4.1 provides a summary of tentative estimates of the likely intervals of the emission reduction potentials addressed by the envisaged Climate Bonus system complementary to existing or expected policies. In other words the estimated

Estimates of the economic and environmental effectiveness 33
emission reduction are intently cautious and don’t try to capture reductions that presumably could also be achieved by current and foreseen policies. The responsiveness assumptions are based on the intervals typically found in the literature (see section 3 of the report of WP4). The upper and lower bounds for the participation rates of households (25% and 75%) are chosen with an eye to the feedback provided in the pilot phase (see section 6.3 of the report of WP5).
The estimated potential may not look spectacular, but should be understood as based on additionality assumptions. One may even wonder how sensible it is to present such tentative estimates, as the intended contribution to a sustainable transition implies all kinds of intricate interactions and consequently a distinct emission reduction potential becomes a rather artificial construct. Furthermore, the premise of the entire concept has been that far reaching emission reductions are needed in the upcoming decades, which means that every additional megaton of emission reduction gets ever more valuable. For the period up to 2020 prices in the European Emission Trade System are expected to rise well beyond 25 Euro per ton CO2 in the later part of that period (Bolle, 2009). This would mean that the estimated emission reduction potential of the Climate Bonus system represents an annual value which easily exceeds 50 million and could go beyond 175 million Euro. The current economic crises might cause the EU ETS prices to go up less or to surpass the 25 Euro limit later and as a consequence the value estimates of the reduction potential would be (somewhat) lower (Ecofys, 2009).
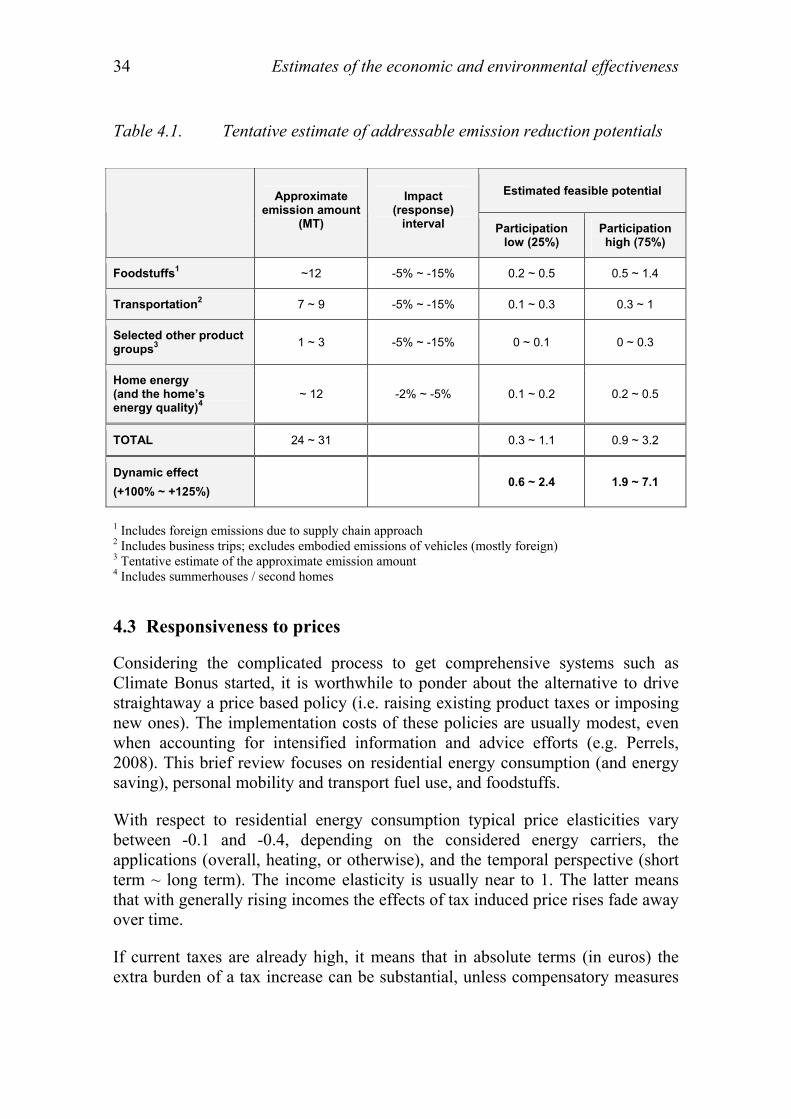
34 Estimates of the economic and environmental effectiveness
Table 4.1. Tentative estimate of addressable emission reduction potentials
Estimated feasible potential Approximate
emission amount (MT)
Impact (response)
interval Participation low (25%)
Participation high (75%)
Foodstuffs1 ~12 -5% ~ -15% 0.2 ~ 0.5 0.5 ~ 1.4
Transportation2 7 ~ 9 -5% ~ -15% 0.1 ~ 0.3 0.3 ~ 1
Selected other product groups3
1 ~ 3 -5% ~ -15% 0 ~ 0.1 0 ~ 0.3
Home energy (and the home’s energy quality)4
~ 12 -2% ~ -5% 0.1 ~ 0.2 0.2 ~ 0.5
TOTAL 24 ~ 31 0.3 ~ 1.1 0.9 ~ 3.2
Dynamic effect
(+100% ~ +125%) 0.6 ~ 2.4 1.9 ~ 7.1
1 Includes foreign emissions due to supply chain approach 2 Includes business trips; excludes embodied emissions of vehicles (mostly foreign) 3 Tentative estimate of the approximate emission amount 4 Includes summerhouses / second homes
4.3 Responsiveness to prices
Considering the complicated process to get comprehensive systems such as Climate Bonus started, it is worthwhile to ponder about the alternative to drive straightaway a price based policy (i.e. raising existing product taxes or imposing new ones). The implementation costs of these policies are usually modest, even when accounting for intensified information and advice efforts (e.g. Perrels, 2008). This brief review focuses on residential energy consumption (and energy saving), personal mobility and transport fuel use, and foodstuffs.
With respect to residential energy consumption typical price elasticities vary between -0.1 and -0.4, depending on the considered energy carriers, the applications (overall, heating, or otherwise), and the temporal perspective (short term ~ long term). The income elasticity is usually near to 1. The latter means that with generally rising incomes the effects of tax induced price rises fade away over time.
If current taxes are already high, it means that in absolute terms (in euros) the extra burden of a tax increase can be substantial, unless compensatory measures

Estimates of the economic and environmental effectiveness 35
are taken. Yet, even in case of compensatory mechanisms the risks for unfavourable equity effects increase the higher the existing tax is. Furthermore, the consequent elaboration of compensation mechanisms implies an increase in the implementation cost.
In Finland residential energy consumption is not severely taxed, when compared to many other (wealthy) EU countries. Consequently, there would be manoeuvring space to raise energy taxes in the upcoming years. This is indeed also planned in the current Finnish climate policy portfolio. According to Perrels (2008) given current taxes and prices, energy tax increases in Finland seem to be a more efficient policy instrument than tradable white certificates, also when accounting for compensation and intensified information provision. Please note that this tax measure denotes a general energy price increase for households. In addition, in conjunction with Demand Side Management and smart metering there can be time-of-day tariffs, which can have also some energy saving effect (and an emission reduction effect).
For transportation there seems to be much less room for generic – sufficiently effective – fuel price increases. Transport fuel taxes are already very high, whereas the price elasticity is not more negative than the residential energy demand price elasticity, while the income elasticity for fuel demand tends to be higher than the one for residential energy demand. Furthermore, volatility in oil prices makes energy efficiency efforts in transport economically more risky. Perrels (2008) indicates that current fuel tax policies don’t seem to provide much (additional) potential for emission reduction9. Largely for these reasons ever more countries, including Finland, have resorted to a differentiation of the car purchase tax according to a car’s emissions per km. This policy has had already an effect (see e.g. http://www.ake.fi/AKE_EN/, the web site of the Finnish Vehicle Administration AKE)10 and both gradient of differentiation and the reference emission level can be changed to enhance the effect, but the stock renewal process can only be sped up to some extent. In other words the car purchase tax is meaningful, but has its limits. Therefore, it can be expected that the envisaged Climate Bonus system can really provide complementary effects as regard emission reduction in passenger transport. It appeals both to day-to-day travel behaviour as well as to more strategic choices on car ownership, model choice, and as well as residential location.
As regards price elasticities of foodstuffs, most figures would refer to expenditures, whereas we need also information about (the changes in) physical volumes. Thanks to the collection of amounts (kilos) of foodstuffs bought in the
9 Of course countries with high fuel taxes tend to have more fuel efficient car stocks than countries with low fuel taxes (cf. USA >> Germany >> Italy), hence the word ’additional’ in brackets. 10 VATT is currently assessing the effectiveness of the car purchase tax differentiation.

36 Estimates of the economic and environmental effectiveness
Finnish consumer expenditure surveys it is possible to assess both changes in allocated values, purchased volumes (kilos, litres), and the unit-price (the resulting average price per kg for that sort of product or product group). A renewed consumer expenditure model11 (Tuovinen and Perrels, forthcoming) allows us to assess each of these responses.
By means of the consumer expenditure model we simulated the effects of price changes of the product categories meat, dairy products, and vegetables. The assumed baseline scenario price developments were changed for the period 2010–2015. For meat and dairy products the price level increases 10% more than in the baseline, and for vegetables the price increases 10% less than in the baseline. The category price index changes affects the relative prices of all other foodstuff categories and (marginally) also the overall food price index and overall consumer price index. These effects have been taken into account in the simulations. This also means that the total budgets for foodstuffs do differ marginally across the alternatives (each price change has been assessed separately).
Figures 4.2 and 4.3 show the implications for unit-prices and changes in annual kilos per category per household respectively. It is important to stress here that the exact figures are not essential here, and somewhat different results could be produced. Essential is to show that similar price signals for different product categories evoke quite differently sized effects with respect to the unit-price and the resulting kilos purchased. Even though the carbon footprint is not directly part of the price it is good to realise that the eventual effects on overall budget allocation (in volume terms) can be surprising. The simulation, which covers a long period (2005–2025), also showed that it matters what price change comes first.
A tentative check of the implied changes of the embodied greenhouse gas emissions (using the intensity figures as used in the pilot) indicates that the increase of the meat price 10% above the baseline trend results in a reshuffle that bears the risk of increasing the overall emission content of the purchased food basket by 0.1 to 0.2 MT. The same price increase for dairy products seems to result in only small (insignificant) changes in the aggregate emission content. Last but not least the price decrease for vegetables of 10% from the baseline trend may result in a slight increase of the overall emissions of the food basket (~0.06 MT). The numerical results are very uncertain and to their level should not be attached much significance. However, the main message is that price
11 The model structure is in some ways similar to an earlier version (e.g. used in the KulMaKunta study, Perrels et al, 2006), but its now essentially an age cohort based model, re-estimated with new extended datasets.

Estimates of the economic and environmental effectiveness 37
based policies for foodstuffs would only work if they are very precisely targeted. Yet, to fulfil that requirement one would need product specific carbon footprints!
Figure 4.2. Impacts of price index changes per product category on the resulting kilo prices per category (vegt. = vegetables)
Unit-prices (€/kg) per product category in different price scenarios
0
1
2
3
4
5
6
7
Cereals Meat Fish Dairy Fruits Vegetables
baseline
vegt. -10%
dairy +10%
meat +10%
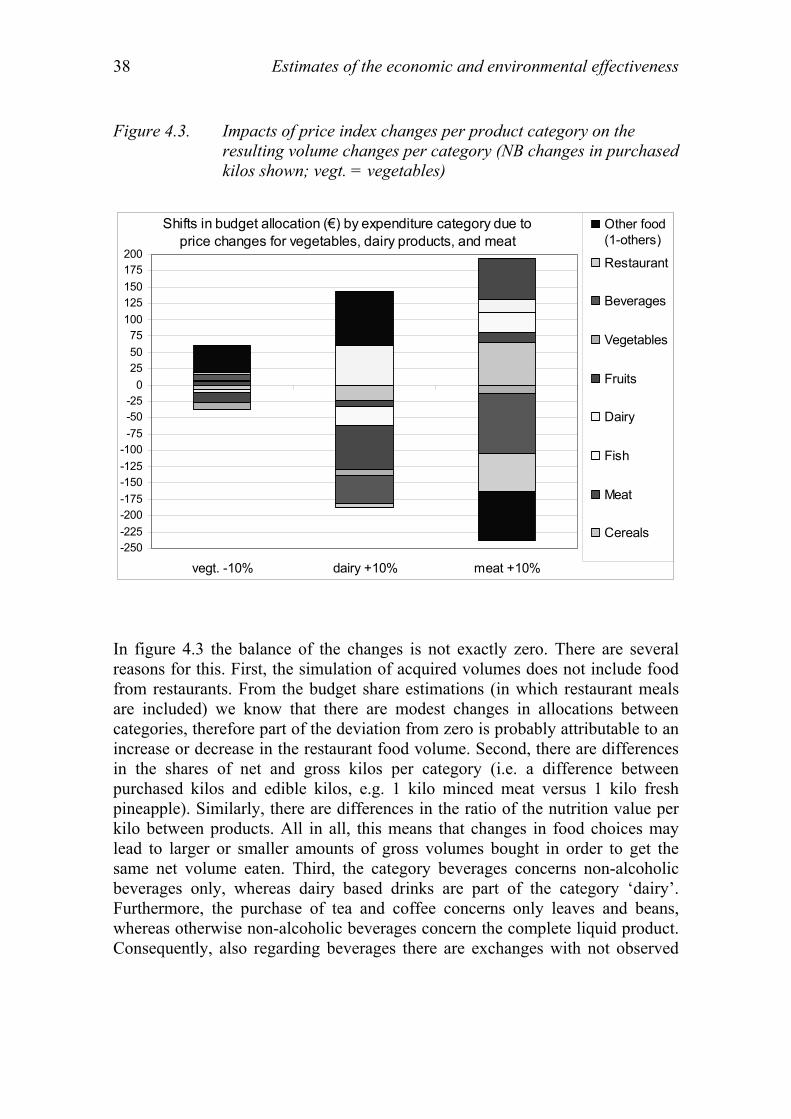
38 Estimates of the economic and environmental effectiveness
Figure 4.3. Impacts of price index changes per product category on the resulting volume changes per category (NB changes in purchased kilos shown; vegt. = vegetables)
Shifts in budget allocation (€) by expenditure category due to price changes for vegetables, dairy products, and meat
-250-225
-200-175
-150-125
-100-75
-50-25
0
2550
75100
125150
175200
vegt. -10% dairy +10% meat +10%
Other food(1-others)
Restaurant
Beverages
Vegetables
Fruits
Dairy
Fish
Meat
Cereals
In figure 4.3 the balance of the changes is not exactly zero. There are several reasons for this. First, the simulation of acquired volumes does not include food from restaurants. From the budget share estimations (in which restaurant meals are included) we know that there are modest changes in allocations between categories, therefore part of the deviation from zero is probably attributable to an increase or decrease in the restaurant food volume. Second, there are differences in the shares of net and gross kilos per category (i.e. a difference between purchased kilos and edible kilos, e.g. 1 kilo minced meat versus 1 kilo fresh pineapple). Similarly, there are differences in the ratio of the nutrition value per kilo between products. All in all, this means that changes in food choices may lead to larger or smaller amounts of gross volumes bought in order to get the same net volume eaten. Third, the category beverages concerns non-alcoholic beverages only, whereas dairy based drinks are part of the category ‘dairy’. Furthermore, the purchase of tea and coffee concerns only leaves and beans, whereas otherwise non-alcoholic beverages concern the complete liquid product. Consequently, also regarding beverages there are exchanges with not observed

Estimates of the economic and environmental effectiveness 39
categories, and therefore it may seem as if people start to consume more or less liquids12.
4.4 Exploiting the complementarity with existing instruments – suggestions for links
In table 2.2 was summarized what kind of interactions between existing instruments and the envisaged Climate Bonus system seem to be relevant. In this section some ideas are put forward how these interactions could be exploited by adapting various instruments and considering clear links between these instruments and the Climate Bonus system. It can also mean that some tasks are probably better served by other instruments.
Housing
As regards housing the most important source of direct and embodied emissions is energy use, for heating, hot tap water and appliances and lighting. For most houses many decisions regarding energy efficiency and the choice of building materials are done prior to the consumer can have any influence. Furthermore, during the lifetime of a residential building the individual consumer may still not have much influence if it concerns a rental home or an apartment building. Even though this could be remediated to some extent by offering participatory decision making in a way, which is appealing. Owners-occupiers of terraced houses and detached houses (together about 55% of the housing stock) and owners of summerhouses have more leeway to influence the energy efficiency during the lifetime of the house. Sooner or later they will face investments in a new heating system, whereas also at some point more significant maintenance, renovation or upgrading investments are to be considered. In a part of these cases they may be even involved in the design phase of the house and thereby affect the initial energy efficiency quality of the building. Yet, in all these cases the informational role of a Climate Bonus like system will be very modest as it is more oriented towards recurrent decisions regarding purchase and use. In occasional larger investment decision cases for households, separate focused and tailored information and advice is probably more effective.
As regards the regular (contractual) purchase of home energy (electricity, heat, heating oil) the envisaged Climate Bonus system may have some effect with respect to awareness raising regarding energy cost, emissions and prices. This awareness raising potential may however be much more effective when the currently arising intelligent metering systems would be interconnected with a
12 For a given population (like in these simulations) variations in annual liquid consumption are unlikely, except for weather effects. Yet, weather circumstances are obviously not included in these simulations.
40 Estimates of the economic and environmental effectiveness
monitoring and feedback system as envisaged in Climate Bonus. The latter system provides more options for longer term learning and comparison. Furthermore, in that case also purchase and use of appliances could be included more beneficially. Up to now appliances were regarded as somewhat problematic, as the embodied emissions of the appliance are usually much smaller than the energy use related emissions created over the lifetime of the appliance, whereas a default carbon footprint label would only show the embodied emissions. All in all good linkages with smart metering and inclusion of electric appliances as a product category could produce more significant effects regarding emission reductions. Yet, it will also be more demanding to include it in the feedback system without reducing the user friendliness of the system.
Energy certificates for houses, which have become a mandatory component of the EU building directive13, are typically meant to promote potential buyers to compare the projected energy consumption and energy cost of homes. Again, the envisaged monitoring and feedback system could be a basis to provide comparison with energy and emission budgets of the current home, and – for example – offer options to investigate the consequences of another house for the overall emission budget of a household. An interesting extension would be to also include an estimate of the consequences for emissions caused by mobility, i.e. how is the new house located with respect to work and services as compared to the current house.
As a last aspect building materials could be mentioned. Most owners-occupiers will modify their home at least to some extent. Building materials often have a high carbon footprint themselves. Yet, in case these materials are used in an endeavour to improve the energy efficiency of a house, it may be counterproductive to select the products with the lowest carbon footprint. Obviously, the inclusion of this kind of products, as a distinct group, in the envisaged Climate Bonus system would require a broader based assessment of the purpose of the building materials. However, such an assessment easily goes beyond the scope of feedback and easy advice of the envisaged system.
Transport
Since both the purchase of transport fuels and of public transport services are foreseen to be included in the envisaged system households get already a quite good view of the greenhouse gas emissions of their mobility. Similar to comments made with respect to housing also in this case linking options and/or extension of the service often relate to large purchase decisions, i.e. a car or a
13 Energy certificates should be available when the object is on sale. In Finland existing detached homes are excepted for the time being.
Estimates of the economic and environmental effectiveness 41
house. The Finnish national vehicle registry (AKA) provides web based services for checking the emissions per kilometre of a large range of car models on offer. On the basis of that information and foreseen annual transport performance a projection of annual emissions caused by mobility can be made, e.g. comparing the currently owned and contemplated car model (and/or residential location).
The current purchase car tax which depends on the CO2 emissions per kilometre is obviously promoting the selection of cars with low(er) emission levels. The annual registration tax is also planned to be reformed into emission level dependent. This would by and large promote the discarding of old cars. In that respect the taxation of car ownership and use would promote awareness on and reflection on the emissions of mobility of a household.
One of the problems with changing mobility habits is that the intermediate steps between car ownership and not owning any car are not promoted. Local car sharing schemes, combined tickets and season cards for public transport + car use, etc. are not widely available and otherwise not very competitively priced. For example, in comparison to many Western European countries (including those with comparable purchase and fuel taxes for cars) rental car rates in Finland are appreciably higher (often up to or beyond 50% for a given car category). The climate conditions (extra set of tires, extra maintenance) explain a part of the difference, but by no means of all of it. Promoting measures could include fiscal measures either for consumers and/or entrepreneurs in this product-service area, exemption from parking fees, own tariff in case of a congestion tax, etc.
Food With respect to food (and various other repeatedly bought products) the government could promote the emergence of a harmonized transparent certification system for the carbon footprint generation, whereas also some framework agreements could be made with respect to carbon labelling on products (see the report of WP3 for more details). Given the variation across products and brands it may turn out to be counter-productive to insist on complete standardization, but some key elements could be the same in order to raise trust and reduce confusion among consumers. Eventually this is also conducive for the effectiveness of the information and the scheme.
As has been shown in section 4.3 an attempt to raise prices of high emission foodstuffs by means of raising value added tax or imposing an excise duty on certain products has a high failure risk. The reasons are that on the one hand the relation between pricing and emission intensity is quite weak, while on the other hand consumers may respond to the price changes in ways which eventually result in no net change in emissions, or even a rise. This would be only solvable

42 Estimates of the economic and environmental effectiveness
if product-brand specific carbon footprints are available for all products concerned.
It seems worthwhile to try to widen the scope of feedback. In particular in the case of food health aspects, i.e. the nutrition value14 of the purchased foodstuffs could be reported in a similar way in connection with or integrated in the envisaged Climate Bonus system. In a similar fashion mobility and emissions could be supplemented with a monitoring scheme regarding daily physical exercise.
14 In Finland the retail chain Kesko is already offering such a feedback service named ’Ravintokoodi’.

Conclusions and recommendations 43
5 Conclusions and recommendations
The envisaged Climate Bonus system will interact with existing policy instruments that promote climate policy goals. As regards residential energy use there may be expected a large overlap with smart metering and Demand Side Management activities, whereas for other elements of housing there will be only modest or barely interaction. However, it would be possible to exploit positive interaction with energy certificates for houses. With respect to transportation and personal mobility there is often weak to notable complementarity with existing instruments, but no overlaps. As there is so far barely consumer oriented climate policy applied to foodstuffs the contribution of the envisaged Climate Bonus system may be expected to be relatively important. Other consumption categories have not been explicitly screened for interaction effects.
Even though it is of major importance that product prices adequately reflect the environmental impacts embodied in those products, price based policies (taxation) will have limited (remaining) leeway in transportation and risks creating spurious effects with regard to food choices.
The envisaged Climate Bonus system seems particularly relevant for the following consumption categories (in decreasing order of significance):
• Foodstuffs and beverages
• Transportation and personal mobility
• Residential energy use / home refurbishment
• Some remaining emission intensive goods
Due to the nature of the system, i.e. contributing to sustainable transition, the emission reduction potential specifically attributable to the Climate Bonus system is not easy to distinguish. Furthermore, at the present stage only very tentative estimates would be possible anyhow. Nevertheless, the overall medium term emission reduction potential specifically attributable to this system is tentatively rated at 3 ~ 7 MT, which would represent an annual value of 75 million to 175 million Euro. Of this reduction potential probably 40% ~ 50% is a so-called static potential realised by the changes in consumer choices. The remainder concerns the so-called dynamic potential, which includes the introduction of low emission product alternatives and product-service combinations.
To enhance the effects of the Climate Bonus system as well as of other policies several links could be created or reinforced.

44 Conclusions and recommendations
The Climate Bonus system could be linked with the smart energy meters of a home. This would allow the Climate Bonus system to allow for more complete feedback. It could also suggest advice to purchase more energy efficient appliances, etc.
The information provided in building energy certificate could be compared to peer-group achievements and could be used to show the implications of the indicated energy quality for the emission budget of the household.
To enhance the monitoring of emissions caused by travelling the use of electronic payment methods and electronic month cards, etc. in public transport and transport fuel sales would greatly facilitate reliable data feed into the monitoring system. Similarly it would also require the involved companies to provide adequate emission data per product or service type. By using harmonised electronic systems it may also be easier to provide combined mobility services aimed at minimal emissions.
Standardization in food labelling should be promoted, preferably at an international (EU) level, but where necessary with some national variations in order not to compromise effectiveness. Standardization in carbon footprinting and underlying data systems should be promoted, in particular at an international scale.
In order to keep the development manageable the Climate Bonus system has so far focused on greenhouse gas emissions. In later stages other environmental effects could be added in order to better represent sustainability effects. Similarly, it seems worthwhile both for consumers and for producers (due to economies of scope) to add other type of monitoring and feedback services as well, e.g. for health effects of food and of ways of moving around. Another option is a link with recycling of products and materials.
Already in the present test design the option for buying emission compensation service was included. This option could be further elaborated. The compensation revenues could be in particular channeled to emission reduction projects in the product chains already covered by the Climate Bonus system. A next step would be to acquire certification for these emission reduction projects such that they would be fit for producing credits under the Joint Implementation system (e.g. if the project is in Europe) or under the Clean Development Mechanism (predominantly non-OECD countries outside Europe). Even the system for earning loyalty points can be considered for linking to these emission reduction investment options.
References
Andersen F.M. – Larsen H. (2008): Modeling and Forecasting the Number of Elvs in 25 EU Member States, Conference paper, 16th GERPISA International Symposium, http://www.risoe.dk/rispubl/art/2008_69.pdf
ASCEE Team (2008): Policy Instruments to promote Sustainable Consumption, Final report of the EU project ‘Assessing the potential of various instruments for sustainable consumption practices and greening of the market’ (ASCEE), Brussels/Heidelberg/Oslo, http://www.ioew.de/home/ downloaddateien/ASCEE_Workshop_Background_Paper.pdf
Bolle T. (2009): Balancing the carbon market – overview of carbon price estimates. Report WAB 500102 029, Netherlands Environmental Assessment Agency, Bilthoven, Netherlands.
COM 2008 397 Final. Communication from the commission the European Parliament, the Council, the European Economic and Social Committee and the Committee of the Regions on the Sustainable Consumption and Production and Sustainable Industrial Policy Action Plan.
Dahl C. (1993), A survey of energy demand elasticities in support of the development of the NEMS, MPRA Paper No. 13962, http://mpra.ub.uni-muenchen.de/13962/.
Duchin F. – Levine S.H. (2007): Tracking Global Factor Inputs, Factor Earnings, and Emissions Associated with Consumption in a World Modeling Framework. Rensselaer Working Paper in Economics 0714, Rensselaer Polytecnic Institute.
Ecofys (2009): EU climate policy impact in 2020 – with a focus on the effectiveness of emissions trading policy in an economic recession scenario. Utrecht, the Netherlands.
Espey James A..– Espey Molly (2004): Turning on the Lights: A Meta-analysis of Residential Electricity Demand Elasticities, Journal of Agricultural and Applied Economics, April 2004, 36:1, pp. 65–81.
Jackson T. – Papathanasopoulou E. – Bradley P. – Druckman A. (2007): Attributing UK Carbon Emissions to Functional Consumer Needs: Methodology and Pilot Results, RESOLVE Working paper 07-01, University of Surrey.
Leire C. – Thidell Å. (2005): Product-related environmental information to guide consumer purchases – a review and analysis of research on perceptions, understanding and use among Nordic consumers. Journal of Cleaner Production, 13, 1061–1070.
L.E.K. Consulting (2007): The L.E.K. Consulting 2007 Carbon Footprint Report.
Perrels A. (2000): Selecting Instruments for a Greenhouse Gas Policy in Finland, VATT research report no. 69, Helsinki.
Perrels A. (2006): User response and equity considerations regarding emission cap and trade schemes for travel, invited paper, Colloquium “Transport, energy and greenhouse gases: will rationing be necessary?” – Lyon, 4~5 December 2006, http://www.let.fr/ejc2006/papiers/Perrels-EJC2006-ppt.pdf (a revised version will reappear in Energy Efficiency 2010).
Perrels A. (2008): Market imperfections and economic efficiency of white certificate systems, Energy Efficiency, Vol. 1, (No.4), pp.349-371, http://www.springerlink.com/content/v6303347157g572n/
Perrels Adriaan – Ahlqvist Kirsti – Heiskanen Eva – Lahti Pekka (2006): Kestävän kulutuksen mahdollisuudet ekotehokkaassa elinympäristössä (the sustainable consumption potential in an eco-efficient living environment), VATT Research report 120. http://www.vatt.fi/file/vatt_publication_pdf/t120.pdf
Seppälä J. – Mäenpää I. – Koskela S. – Mattila T. – Nissinen A. – Katajajuuri J-M – Härmä T. – Korhonen M-R – Saarinen M. – Virtanen Y. (2009): Environmental impacts of material flows caused by the Finnish economy (ENVIMAT), manuscript 12.3.2009. (In Finnish: Suomen kansantalouden materiaalivirtojen ympäristövaikutusten arviointi ENVIMAT-mallilla). Project web pages in English: www.environment.fi/syke/envimat
Stehfest E. – Bouwman A.F. – Van Vuuren D.P. – Den Elzen M.G.J. – Eickhout B. – Jeuken M. – Van Oorschot M. – Kabat P. (2008): Vleesconsumptie en Klimaatbeleid (Meat Consumption and Climate Policy), Planbureau voor de Leefomgeving, report PBL 500110004.
Terveyden ja Hyvinvoinnin Laitos THL (2008), Aikuisväestön terveys 2007 (The health situation of the adult population 2007), National Institute for Health and Welfare, Helsinki.
Tuovinen T. – Perrels A. (2010): An Age Cohort based Multi-level Consumer Expenditure Model for Finland. VATT Research report (forthcoming), Helsinki.
Van Dooren C. van (2008): Klimaat is hot, CO2-label nog lauwwarm (Climate is hot, CO2 label lukewarm, summary of a seminar on CO2 labelling), Voedingsmiddelentechnologie, Vol. 41, Nro 9, pp.26–29.
Consulted web sites
Customs: www.tulli.fi
Finnish Energy Industries: www.energia.fi
Finnish Food Information: www.finfood.fi
Finnish national agency for the promotion of energy efficiency Motiva: www.motiva.fi
Ministry of the Environmnet: www.ymparisto.fi, visited 2.7.2008
Ministry of Finance: www.vm.fi
Finnish Vehicle Registry AKE www.ake.fi
Statistics Finland 2008: www.tilastokeskus.fi.
http://www.nuspaarpas.nl/www_en/index.html


VATT TUTKIMUKSET -SARJASSA ILMESTYNEITÄ
PUBLISHED VATT RESEARCH REPORTS
140. Lyytikäinen Teemu: Studies on the Effects of Property Taxation, Rent Control and Housing Allowances. Helsinki 2008.
141. Lehtonen Sanna – Lyytikäinen Teemu – Moisio Antti: Kuntien rahoitus- ja valtionosuusjärjestelmä: Vaihtoehtoja uudistuksen toteuttamiseksi. Helsinki 2008.
142. Pekkala Johanna: Tuloerojen ja terveyden välinen yhteys Suomessa. Helsinki 2009.
143:1. Perrels Adriaan – Hongisto Mikko – Hyvönen Kaarina – Katajajuuri Juha-Matti – Nissinen Ari: A quick scan of climate policy services and of underlying data system approaches. Climate Bonus project report (WP1). Helsinki 2009.
144. Karvinen Anni-Mari: Maahanmuuttajien poismuutto Suomesta. Helsinki 2009.
145. Sahari Anna – Perrels Adriaan: Ekotehokkuutta parantavat investoinnit kesämökeillä. Helsinki 2009.
146. Tuovinen Tarja: Ääriarvomenetelmät sähkömarkkinoiden riskinarvioinnissa. Helsinki 2009.
147. Honkatukia Juha – Kinnunen Jouko – Marttila Kimmo: Väestön ikääntymisestä johtuvien julkisten kulutusmenojen kasvun rakenteelliset vaikutukset. Helsinki 2009.
148. Kari Seppo – Kröger Outi: Osakkeiden normaalituoton verovapaus: Norjan osakeverotuksen malli. Helsinki 2009.
149. Mälkönen Ville – Seppälä Timo: Terveyspalvelusetelien hyvinvointi- ja kustannusvaikutukset jonotetuissa toimenpiteissä. Helsinki 2009.
150. Honkatukia Juha: VATTAGE – A dynamic, applied general equilibrium model of the Finnish economy. Helsinki 2009.
151. Räty Tarmo: Julkaisujen vaativuus tieteenaloittain. Helsinki 2009.
143:3. Perrels Adriaan – Nissinen Ari – Sahari Anna: Reviewing key building blocks of an integrated carbon footprinting and consumer purchases’ monitoring & reward system – interaction with the consumer. Climate Bonus project report (WP4). Helsinki 2009.
143:4. Hyvönen Kaarina – Saastamoinen Mika – Timonen Päivi – Kallio Arto – Hongisto Mikko – Melin Magnus – Södergård Caj – Perrels Adriaan: Kuluttajien näkemyksiä kotitalouden ilmastovaikutusten seuranta- ja palautejärjestelmästä. Climate Bonus -hankeraportti (WP5). Helsinki 2009.
143:2. Usva Kirsi – Hongisto Mikko – Saarinen Merja – Nissinen Ari – Katajajuuri Juha-Matti – Perrels Adriaan – Nurmi Pauliina – Kurppa Sirpa – Koskela Sirkka: Towards certified carbon footprints of products – a road map for data production. Climate Bonus project report (WP3). Helsinki 2009.
152. Kirjavainen Tanja – Kangasharju Aki – Aaltonen Juho: Hovioikeuksien käsittelyaikojen erot ja aluerakenne. Helsinki 2009.
153. Kari Seppo – Kerkelä Leena: Oman pääoman tuoton vähennyskelpoisuus yritysverotuksessa – Belgian malli. Helsinki 2009.

ISBN 978-951-561-899-3ISSN 0788-5008
Valtion taloudellinen tutkimuskeskus Government Institute for Economic ResearchP.O.Box 1279 FI-00101 Helsinki Finland
Copyright © 2022 FDOKUMEN