Molecular Changes in Asphaltenes within H 2 Plasma
10
Molecular Changes in Asphaltenes within H 2 Plasma Juan C. Poveda,* ,† Daniel Molina, † Horacio Martínez, ‡ Oswaldo Florez, ‡ and Bernardo Campillo § † Laboratorio de Espectroscopia Ató mica Molecular, Escuela de Química, Universidad Industrial de Santander, Bucaramanga, Santander, Colombia A.A. 678 ‡ Instituto de Ciencias Físicas, Universidad Nacional Autó noma de Mé xico, Cuernavaca, Morelos, Me ́ xico C.P. 62210 § Facultad de Química, Universidad Nacional Autó noma de Me ́ xico, Cd. Universitaria D.F., Me ́ xico C.P. 04510 ABSTRACT: In the present work, the chemical changes in asphaltenes, solid residues, when they are treated with hydrogen plasma were analyzed. H 2 plasma was characterized by the presence of electrons, H + and H 2 + ions, at kinetic energies as low as 30 eV. These species can interact with the asphaltenes to produce changes in the chemical structure by different mechanisms such as bond cleavage, recombination, and condensation. Asphaltene samples were exposed to different treatment times (up to 120 min). The plasma was characterized by optical emission spectroscopy (OES) as well as by the different products created in the reactions of asphaltenes. The presence of C + , CH + ,C 2 + , NH + , and V + was confirmed. Spectroscopic techniques such as Fourier transform infrared spectroscopy (FT-IR), matrix-assisted laser desorption ionization-time of flight-mass spectrometry (MALDI- TOF-MS), nuclear magnetic resonance spectroscopy ( 1 H NMR and 13 C NMR), and X-ray diffractometry (XRD) were used to characterize the chemical composition of asphaltenes at the different treatment times. Chemical changes were analyzed from the molecular structural parameters calculated by the above-mentioned spectroscopic techniques. Possible changes in the asphaltene cluster structures were analyzed using XRD. This work explores the application of plasma technologies to modify the chemical composition of asphaltenes and obtain valuable chemical products resulting from a plasma treatment process. 1. INTRODUCTION The main global production of crude oils is currently focused on heavy crude oils, which are rich in heavier compounds corresponding to the resin and asphaltene fractions. 1,2 These compounds are important in the thermodynamic properties of crude oils and their fractions. 3−5 Changes in the downstream conditions, pressure and temperature, of heavy crude oils can dramatically affect the properties of the fluids, with the asphaltenes being deposited in many of the cases. Deposition of asphaltenes in pipelines has serious implications for the transport of crude oils. 6−8 Significant additional effort is required to maintain production efficiency because of the deposition of asphaltenes. Higher amounts of the heavy fractions in crude oils have forced the technological develop- ment of new strategies to overcome the limitations imposed by heavier fractions in the thermal cracking reactors, hydro- genation processes, and other processes that require catalysts. Chemical changes in the asphaltenes and resins have been studied because it is very important to know how these compounds behave when samples are exposed to different gases as oxygen under various experimental conditions. 9,10 Other reports have considered the chemical changes that occur when samples are thermally treated under different reaction conditions such as temperature, pressure, and time for reaction. 11−13 Few studies have been reported regarding the chemical changes in asphaltenes when these compounds are exposed to plasmas under low energy conditions where the electrons reach kinetic energies of a few electronvolts (eV), lower than the ionization energies of asphaltene mole- cules. 14−16 We are interested in knowing the chemical changes that occur when asphaltenes are exposed to plasmas produced by different gases under low pressure regimes. We analyze actually in a new set of experiments the chemical changes when asphaltenes are exposed to oxygen, methane, and hydrogen plasmas at different exposure times and gas pressures. When heavy oil or its fractions are treated by plasma technologies, several advantages can be observed. First, treatment favors molecular breaking under gentle conditions requiring no high pressures and high temperatures, with a consequent energy saving. Second, the products of molecular breakdown of heavy ends can be used in later stages of the refining processes and increased production of fractions and products of higher economic value. And third, these technologies can be applied equally to any fraction regardless of the chemical nature of crude oils used. To our knowledge, technologically feasible implementation of these processes requires additional effort and more research to try to understand the complex processes occurring at the molecular level. In the present work, asphaltenes from a Colombian heavy crude oil, obtained by the ASTM procedure D6560-12, 17 were exposed to plasma produced in a hydrogen atmosphere. The plasma and the chemical species resulting from the decomposition of samples were characterized using optical emission spectroscopy. The decomposition efficiency of samples and the chemical changes were analyzed as a function of the exposure time. Chemical changes were interpreted using the structural parameters calculated from the above-mentioned spectroscopic techniques such as 1 H and 13 C NMR spectros- copy, MALDI-TOF, FT-IR, and XRD. Received: January 30, 2013 Revised: January 3, 2014 Published: January 5, 2014 Article pubs.acs.org/EF © 2014 American Chemical Society 735 dx.doi.org/10.1021/ef401773t | Energy Fuels 2014, 28, 735−744
-
Upload
independent -
Category
Documents
-
view
1 -
download
0
Transcript of Molecular Changes in Asphaltenes within H 2 Plasma
Molecular Changes in Asphaltenes within H2 PlasmaJuan C. Poveda,*,† Daniel Molina,† Horacio Martínez,‡ Oswaldo Florez,‡ and Bernardo Campillo§
†Laboratorio de Espectroscopia Atomica Molecular, Escuela de Química, Universidad Industrial de Santander, Bucaramanga,Santander, Colombia A.A. 678‡Instituto de Ciencias Físicas, Universidad Nacional Autonoma de Mexico, Cuernavaca, Morelos, Mexico C.P. 62210§Facultad de Química, Universidad Nacional Autonoma de Mexico, Cd. Universitaria D.F., Mexico C.P. 04510
ABSTRACT: In the present work, the chemical changes in asphaltenes, solid residues, when they are treated with hydrogenplasma were analyzed. H2 plasma was characterized by the presence of electrons, H+ and H2
+ ions, at kinetic energies as low as 30eV. These species can interact with the asphaltenes to produce changes in the chemical structure by different mechanisms such asbond cleavage, recombination, and condensation. Asphaltene samples were exposed to different treatment times (up to 120 min).The plasma was characterized by optical emission spectroscopy (OES) as well as by the different products created in thereactions of asphaltenes. The presence of C+, CH+, C2
+, NH+, and V+ was confirmed. Spectroscopic techniques such as Fouriertransform infrared spectroscopy (FT-IR), matrix-assisted laser desorption ionization-time of flight-mass spectrometry (MALDI-TOF-MS), nuclear magnetic resonance spectroscopy (1H NMR and 13C NMR), and X-ray diffractometry (XRD) were used tocharacterize the chemical composition of asphaltenes at the different treatment times. Chemical changes were analyzed from themolecular structural parameters calculated by the above-mentioned spectroscopic techniques. Possible changes in the asphaltenecluster structures were analyzed using XRD. This work explores the application of plasma technologies to modify the chemicalcomposition of asphaltenes and obtain valuable chemical products resulting from a plasma treatment process.
1. INTRODUCTION
The main global production of crude oils is currently focusedon heavy crude oils, which are rich in heavier compoundscorresponding to the resin and asphaltene fractions.1,2 Thesecompounds are important in the thermodynamic properties ofcrude oils and their fractions.3−5 Changes in the downstreamconditions, pressure and temperature, of heavy crude oils candramatically affect the properties of the fluids, with theasphaltenes being deposited in many of the cases. Depositionof asphaltenes in pipelines has serious implications for thetransport of crude oils.6−8 Significant additional effort isrequired to maintain production efficiency because of thedeposition of asphaltenes. Higher amounts of the heavyfractions in crude oils have forced the technological develop-ment of new strategies to overcome the limitations imposed byheavier fractions in the thermal cracking reactors, hydro-genation processes, and other processes that require catalysts.Chemical changes in the asphaltenes and resins have been
studied because it is very important to know how thesecompounds behave when samples are exposed to different gasesas oxygen under various experimental conditions.9,10 Otherreports have considered the chemical changes that occur whensamples are thermally treated under different reactionconditions such as temperature, pressure, and time forreaction.11−13 Few studies have been reported regarding thechemical changes in asphaltenes when these compounds areexposed to plasmas under low energy conditions where theelectrons reach kinetic energies of a few electronvolts (eV),lower than the ionization energies of asphaltene mole-cules.14−16 We are interested in knowing the chemical changesthat occur when asphaltenes are exposed to plasmas producedby different gases under low pressure regimes. We analyzeactually in a new set of experiments the chemical changes when
asphaltenes are exposed to oxygen, methane, and hydrogenplasmas at different exposure times and gas pressures.When heavy oil or its fractions are treated by plasma
technologies, several advantages can be observed. First,treatment favors molecular breaking under gentle conditionsrequiring no high pressures and high temperatures, with aconsequent energy saving. Second, the products of molecularbreakdown of heavy ends can be used in later stages of therefining processes and increased production of fractions andproducts of higher economic value. And third, thesetechnologies can be applied equally to any fraction regardlessof the chemical nature of crude oils used. To our knowledge,technologically feasible implementation of these processesrequires additional effort and more research to try tounderstand the complex processes occurring at the molecularlevel.In the present work, asphaltenes from a Colombian heavy
crude oil, obtained by the ASTM procedure D6560-12,17 wereexposed to plasma produced in a hydrogen atmosphere. Theplasma and the chemical species resulting from thedecomposition of samples were characterized using opticalemission spectroscopy. The decomposition efficiency ofsamples and the chemical changes were analyzed as a functionof the exposure time. Chemical changes were interpreted usingthe structural parameters calculated from the above-mentionedspectroscopic techniques such as 1H and 13C NMR spectros-copy, MALDI-TOF, FT-IR, and XRD.
Received: January 30, 2013Revised: January 3, 2014Published: January 5, 2014
Article
pubs.acs.org/EF
© 2014 American Chemical Society 735 dx.doi.org/10.1021/ef401773t | Energy Fuels 2014, 28, 735−744

2. EXPERIMENTAL SECTION2.1. Plasma Generation and Asphaltene Erosion. The
experimental setup and technique to generate the plasma was recentlyreported, and it is shown in Figure 1.18 A brief description is reported
here. Two stainless steel circular plate plasma electrodes were used, 1mm thick and 30 mm in diameter. The electrodes are located at thecenter of the reaction chamber with 7 mm gap spacing. The amount of200 mg of asphaltene samples was pressed into a flake on the electrodeand exposed to H2 plasma glow discharge. A continuous dynamic flowof H2 gas (99.99% purity) was let in the system through Mathesonflowmeter model FM1000 at 1.5 L/min. The H2 gas was introducedinto the reaction chamber using a lateral flange. The same gasconnection was used for the pressure sensor (MKS, type 270 signalconditioner and 690A11TRC MKS Baratron). A DC discharge wasused to generate the plasma in H2 gas. Plasma particles weremonitored by plasma emission spectroscopy through a quartz windowusing an optical fiber (solarization-resistant UV and fiber diameter sizeof 400 μm) that was connected to the entrance aperture of a high-resolution Ocean Optics Inc. Spectrometer model HR2000CG-UV-NIR (101.6 mm focal length, 5 μm inlet and outlet slits, and 300 linesmm−1) in the spectral region 200−1100 nm at a resolution of ∼0.35nm (an OFLV-200-1100 order-sorting filter was installed to eliminatesecond- and third-order effects) with a Sony ILX511B linear siliconCCD array (2048 individual pixels with 14 μm × 200 μm pixel sizeand sensitivity of 75 photons/count at 400 nm). The low noise level(with 250:1 signal-to-noise ratio at full signal) of the CCD allows longintegration times (resolution times between 1 ms and 20 s) andtherefore the detection of very low emission intensities. Thespectrometer was calibrated using an Ar source (Ocean Optics Inc.).The spectra data were obtained with a 10 s integration time. The fiberoptic was positioned to collect the emission light appearing on theasphaltene-H2 plasma. The H2 pressure was 5.0 Torr, with a flow of 1.5L/min. The discharge power supply was maintained at an output of340 V (VD) and a current (ID) of 0.15 A (50 W), which was measuredusing a digital Tektronix multimeter model DM2510.To avoid any contamination due to particle and gas deposition into
the experimental apparatus, the entire chamber (window, electrodes,walls, wires) was cleaned. The inside surface of the plasma chamberwas cleaned with a volatile solvent like chloroform, and the electrodes
and wires were sonicated, washed, and dried at a temperature of 70 °C.Before each experiment, the chamber was maintained at the basepressure for a period of time of 2 h to remove residual solvent andmoisture. The base pressure of the plasma chamber of 6.3 × 10⁻³ m3
volume was 7.5 × 10⁻³ Torr (measured with a Thermovac sensorTR211 connected to a Thermovac TM20 digital controller), achievedusing a mechanical pump (Trivac D10, Leybold Pump with a nominalpumping speed of 11.8 m3 h−1). With the present pressure conditions,the signal corresponding to background pressure (water vapor,hydrogen, etc.) contribution was estimated to be in the order of0.015%.
In order to observe the erosion of the asphaltene exposed to H2plasma, an asphaltene sample was placed on one of the electrodesinside the discharge zone. Before exposing it to the plasma, the samplewas kept under a vacuum of 7.5 × 10⁻³ Torr. Since asphaltene has avapor pressure, some material could evaporate; it is estimated that theamount exposed of asphaltene has a maximum reduction of 10%during the time exposure to the vacuum environment, which wasconsidered in the measurements.
The asphaltene mass loss (mL) was determined in % of the sample,which is calculated according to the equation mL = (Δm)100%/m0,where Δm is the mass of asphaltene lost from the initial mass (m0)during the plasma treatment. Mass measurements were carried outusing a LECO 250 Balance.
2.2. Infrared Spectroscopy of Asphaltenes. Infrared spectra ofthe asphaltene samples were collected on a Bruker TENSOR-270 FT-IR spectrometer in the spectral range from 370 to 7500 cm−1. We usein the analysis the spectral range from 500 to 4000 cm−1, 64 scans perspectra, and a resolution of 1 cm−1. The FT-IR spectrometer wasequipped with a low noise DLATGS (deuterated L-α-alanine dopedtriglycine sulfate) detector with KBr windows. FT-IR spectra weremeasured by the attenuated total reflectance (ATR) technique using aBruker ATR A225 sample cell equipped with a diamond crystal ofquadrate area of 2 × 2 mm2 and a spectral range of crystal from 10000to 10 cm−1. The FT-IR spectrometer was controlled using the OPUSsoftware. Calculated areas of main observed signals in the FT-IRspectra are reported in Table 2.
2.3. Matrix Assisted Laser Desorption Ionization. MALDI-TOF spectra were acquired using a Bruker Reflex II MALDI-TOFMass Spectrometer equipped with a Nd:YAG laser emitting at thethird harmonic 355 nm and repetition rate of 500 Hz, with a pulsewidth of 3.5 ns. Ions were extracted and accelerated from theionization region by a pulsed ion extraction system designed by Brukerwith a delay of 1.2 ns and extraction voltage of 20 kV. The voltages ofthe Einzel lens and deflection plates in the ion optics region wereoptimized to obtain the best possible resolution. The TOF-MSanalyzer was operated in the reflector mode equipped with amicrochannel plate detector. Reflection plates were polarized at 25kV to obtain a potential gradient according to the kinetic energy of theions, allowing the best reflection properties and refocusing the ionsclose to the detector. The mass spectrometer was calibrated prior tomeasurements. The asphaltenes were dissolved completely inchloroform to yield solutions of approximately 3 wt %. No matrixwas used because the chemical nature of the asphaltenes can absorbthe ionizing radiation as well as the chromophores used in the mainMALDI experiments. The sample was deposited in a sample holder inamounts of 4 μL, and the chloroform evaporated in the air. This
Figure 1. Plasma chamber.
Table 1. Identified Species from Emission Spectra
λ (nm) species systems transitions
315.7 CH 4300 Å system A2Δ−X2Π337.1 NH 3360 Å system A3Π−X3Σ−
358.8 C2 Deslandres−D’Azambuja system c1Πg−b1Πu
388.9 CH 3900 Å system B2Σ−X2Π405.0 V 1s22s22p63s23p63d34s24F3/2431.4 CH 4300 Å system A2Δ−X2Π653.3 H
Energy & Fuels Article
dx.doi.org/10.1021/ef401773t | Energy Fuels 2014, 28, 735−744736

procedure was repeated five times to concentrate the sample in theionization region. The sample holder was then placed in thespectrometer, and measurements were made.2.4. NMR Spectroscopy. The 1H and 13C NMR spectra were
measured on a Bruker Advance III spectrometer operating at 400 and100 MHz, respectively. The 1H NMR samples were 4 wt % solutionsin CDCl3 (99.8% D). The 30° pulses (Bruker zg30 pulse sequence)were used, with a sweep width of 49000 Hz, 32K points, and a delaytime of 2 s. Sixteen scans were averaged for each spectrum. The 13CNMR samples were in 10 wt % solutions in CDCl3 (99.8% D) usingCr(acac)3 as the paramagnetic relaxation reagent at a 0.05 Mconcentration. The 30° pulses (Bruker zgig30 pulse sequence) wereused, with a sweep width of 22400.0 Hz, 32K points, and a delay timeof 20 s. The zgig30 pulse sequence suppresses the Overhauser effectand the C−H coupling with an inverse gated decoupling sequence,composite pulse decoupling (CPD). Three thousand scans wereaveraged for each spectrum. In both cases, spectra were recorded usinga 5 mm probe with a spinning rate of 10 Hz and 298.15 Ktemperature. Free induction decays (FIDs) were processed usingMestreNova.19
2.5. X-ray Diffraction. X-ray diffractograms were measured using aBruker D8 Advance automated diffractometer on finely groundpowders of asphaltenes. In this ground-powdered form, the quality ofthe diffraction pattern is improved. The diffractometer uses an X-raytube with a copper target (Kα1 1.5406 Å) operating at 40 kV and 30mA, a nickel filter as a monochromator, an autodivergent slit at 0.6mm, and a soller slit at 2.5° and is equipped with a lynxeye lineardetector. A 2θ angle was scanned from 5 to 80° in steps of 0.015° with5 s per step. The baseline was corrected using the data points outsiderectangle method with a second-order function to connect outsidepoints of rectangles. Data were smoothed using Savitzky−Golayfiltering. Peak profile analysis was performed to fit the diffractionprofile and determine the peak positions, full widths at half-maximum(fwhm), background profiles, and peak areas. Single peaks wereassumed to have Gaussian profiles. The characteristics of peaks γ, 002,100, 004, and 110 were calculated.
3. RESULTS AND DISCUSSION
3.1. OES Measurements. Throughout the plasmairradiation process, the OES arrangement was adapted tomeasure spectra every 5 min. Figure 2 shows a selected surveyspectra and represents a typical OES measurement of the H2-plasma glow discharge of the asphaltene, at various exposedtimes ranging from 5 to 30 min. The OES spectrum obtainedafter 5 min of plasma exposure is relatively low. The identifiedspecies in the spectra shown in Figure 4 are listed and reportedin Table 1.20 Then, at 30 min of plasma exposed, the OES
spectrum is considerably extensive, showing the NH, CH, C2,and V as the dominant species in the spectra. In addition to thespecies aforementioned, an emission appears of Hγ arising fromthe H2 plasma discharge.We can see from Figure 2 that the molecular band intensities
observed gradually increase during the initial 10 min of plasmatreatment, followed by an increment in the subsequent 30 min,reaching their highest intensity. As the treatment timeincreases, the band intensities decrease. That means thatasphaltene reacts and produced similar products during allincrements of the treatment time. The discharge time ofmaximum erosion was at 30 min. Therefore, the intensity of theproduct generated in the plasma coming from the asphaltenedecreased with increasing discharge time, being correlated withthe mass loss.Plasma processing opens the possibility for changing the
chemical structure of asphaltenes, and many processes with
Table 2. Integrated Intensities of Main Signals in the IR Spectra of Asphaltenes
time to the H2 plasma (min)
group cm−1 0 15 30 60 120
CHout‑of‑plane (aromatics) 748.3a 0.3701 0.5700 0.6197 0.4725 0.4963808.1 0.4507 0.9851 1.0698 0.5494 0.9058864.1 0.4660 0.6791 0.7093 0.6203 0.6435total 1.2868 2.2342 2.3988 1.6418 2.0393
CH3 symm. bending 1373.3 0.2323 0.3318 0.3798 0.3486 0.3177CH2 bending 1441.3 0.7490 1.2804 1.4624 1.2652 1.2210CH2 bending + CH3 asymm. bending 1459.5 0.5453 0.8066 0.9899 0.9182 0.8541aliphatic C−H 2831.6 2.9895 3.2145 4.1549 4.7494 3.8019CH2 symm. stretching 2851.9 1.3230 3.3816 3.7817 3.1806 3.5433C−Hstretching
b 2900.8 4.8184 6.0978 6.0564 6.8474 3.9541CH2 symm. stretching 2924.5 1.1942 4.3372 6.4232 3.9976 6.6808CH3 asymm. stretching 2954.9 1.4192 2.2610 2.7213 2.4820 2.0892
a748.3 cm−1 overlapping with rocking vibrations of long (CH2)n, n > 2. symm, symmetrical; asymm, asymmetrical. bC−H stretching of branched-chain alkanes.
Figure 2. Emission spectra of asphaltene-H2 plasma.
Energy & Fuels Article
dx.doi.org/10.1021/ef401773t | Energy Fuels 2014, 28, 735−744737

different reaction kinetics occur. A variety of species such asexcited molecules, free radicals, and ions are generated by freeelectron impacts and H2 plasma, and asphaltenes. The reactionscan comprise numerous products: electrons (e), positivemolecular ions (H2
+), radicals (H), atoms (C, H, N, O, V),and hydrogen molecule. The base experimental data of the rateconstants for electron collision dissociation in such plasma atlow energies can implicate substantial atoms and moleculesproduced from asphaltene and H2, which are not welldetermined. On the other hand, the rate constants can becalculated when the dependence of cross sections as a functionof the energy are well established. Any chemical kinetic modelrequires the electron collision ionization and dissociation crosssections of the reactions involved. It is also required to considerthe neutral gas (H2) reactions, photoreactions, and recombi-nation. Therefore, we propose a qualitative interpretation of theway that the observed species were formed.Under the present conditions in this experiment, the OES
spectra observed consist of the emission of the hydrogenmolecular and lines of hydrogen atomic (Hα and Hβ). Theradiating species (H2 and H2
+) are produced by electron impactexcitation followed by
υΠ → Π +υ υ″ hH (C ) H (B )u g23
23
(1)
υΣ → Σ +υ υ+ + + +
″ hH (B ) H (X )u g22
22
(2)
The mechanism of H2 plasma-initiated erosion is producedby the interaction of the e, H2
+, H2, H, H+, and energetic
photons with the asphaltene surface (much research has beenperformed on the molecular nature of asphaltenes).21−24
Regarding the natural complexity of asphaltene, the moleculararrangement is difficult to describe their structures, soasphaltene has been defined by ASPH. We can propose thepossible reactions may be
+
→ + + + +
+ + *γ
+ • +
+ +
e hv
e hv
( , H , H , H , H , ) ASPH
CH NH C V H
( , H , H , H, H , ) ASPH
2 2
2
2 2 (3)
Equation 3 displays the proposed reaction that produced theerosion of the asphaltenes and the formation of the productsobserved in OES measurements (molecules of C2, CH, and NHand the atoms V and H).From the experimental conditions50 W of discharge
power, 6.3 × 10⁻³ m3 of discharge volume, and ∼5.0 Torr ofpressurea low ionization degree (∼10−7) of molecularhydrogen was found. As a result, the species more abundantin the plasma composition is the precursor (H2) and there isonly a small intensity of other compounds (CH, NH, C2, V,and Hγ), as displayed in Figure 2.The H2 plasma (without asphaltene) displays only signals
coming from the H2, so the background of the system produceda low signal. Interactions with the discharge wall may affect theintensity of several products in a low-pressure discharge. Thesesignals are important in low pressures, especially when thechamber radius (250 mm) is approximately equal to the ionmean free path. In the present experiment, the electrodes (30mm) are 8.3 times smaller than the chamber radius. Weexpected a low contribution from the wall background to theemission spectra.The asphaltene mass loss (mL) was measured at 15, 30, 60,
and 120 min treatment times. Figure 3 shows the asphaltene
mass loss (mL) versus treatment time. The final asphaltenemass loss−time data obtained was the result of fiveindependent measurements. Increasing the treatment time inH2 discharge, the asphaltene has an erosion rate of 0.63 mg/min throughout the first 45 min. Between 60 and 240 min oftreatment time, the mass loss is approximately constant becausethe erosion rate of the asphaltene was low in that particularperiod, and significant changes in the spectroscopic data are notobserved.From J = ID/S, where ID is the current discharge (0.15 A)
and S is the electrode surface (7.07 × 10⁻⁴ m2), the plasma-ionflux (J) reaching the cathode was obtained. The plasma-ion fluxwas ∼7.95 × 10²² m−2 min−1. Considering that the principal ionproduct was H2
+, J was approximately 0.26 g m−2 min−1. It isobserved for the first 45 min that the treatment time andasphaltene mass loss have a linear correlation.
3.2. FT-IR Spectroscopy. Fourier transform infraredspectroscopy was used for the determination of the mainchemical groups of asphaltenes. Quantitative analysis waspossible on the basis of the calculated areas of signals ofchemical groups of interest.The most commonly observed absorption bands in
asphaltenes are found at frequencies of 700, 780, 840, and880 cm−1, for the aromatic C−H bending vibrations, out-of-plane. Signals at 725 and 760 cm−1 correspond to rockingvibrations of long (CH2)n moieties with n > 2, which canoverlap with the C−H bending vibrations of aromatics. Thesharp peak at 1306 cm−1 could be due to the presence of ethersor esters. The peak near 1030.5 cm−1 can be assigned either toester linkages or sulfoxides present in the asphaltenes.25,26
At frequencies of 1510 and 1580 cm−1, deformationvibrations of a benzene ring are detected, and the band at1610 cm−1 is assigned to the CC bond of an aromatic ring(see Figure 4). Stretching vibrations of the CH bond appearat 1625 and 1650 cm−1, and typical CH stretching vibrationsin condensed aromatic hydrocarbons are observed at 3040 and3060 cm−1. The bands observed at 1373.3 and 2872.0 cm−1
correspond to symmetrical bending and stretching vibrations,respectively, of methyl groups in which all of the CH bondsextend and contract in phase. The bands at 1459.5 and 2924.5cm−1 are due to methylene groups of alkyl side chains in
Figure 3. Time profile of mass loss of asphaltene sample treated by airplasma.
Energy & Fuels Article
dx.doi.org/10.1021/ef401773t | Energy Fuels 2014, 28, 735−744738

aromatic hydrocarbons and naphthenes, and the absorptionbands at 1441.3 and 1459.5 cm−1 assigned to CH2 groups canpresent contributions of CH3 bending modes.27 Other bandscan be assigned to heteroatoms in the molecular structure, i.e.,the absorption band centered at 3440 cm−1, and arecharacteristic of nitrogen-containing groups. In the region3500−3750 cm−1, signals assigned to the OH stretchingvibrational mode appear. The bands at 3652 and 3668 cm−1 areassigned to OH groups in the surface of asphaltene layerssandwiched between two of them. Other bands around 3700cm−1 are also assigned to OH stretching contributions: some ofwhich are assigned to hydroxyl groups in the surface of themicrocrystals, including hydroxyl groups at the brokenedges.28,29
From a quantitative point of view, the FT-IR data are used toobtain information about the ratio of groups in the sample.Some authors analyze asphaltenes and observe the linearrelationship of the relative intensities of alkane vibrationalfrequencies between 1380 and 1460 cm−1 and the ratio (νCH2/νCH3) of the aliphatics.30−33 Direct applications of themethodology have been reported by Benkhedda and Landaisto analyze the change of the average aliphatic chain length ofmature coals, by deconvolution of the FT-IR spectra, in theregion 1360−1390 cm−1 (see Figure 4).33 The relation mCH3/(nCH2 + mCH3) was used to calculate the ratio of methyl tomethylene groups obtained from the peak intensities at 1373.0and 1459.5 cm−1 as follows:
+=
mn m
II
CHCH CH
3
2 3
1373.0
1459.5(4)
Calculated ratios are reported in Table 3.FT-IR deconvolution analysis in the range 2700−3100 cm−1
allows us to characterize the CH3(asym), CH2(asym), CH, CH3(sym),and CH2(sym) vibrational modes. From calculated areas of
2924.5 and 2954.9 cm−1 signals, it is possible to obtain thenCH2/mCH3 ratio (see Table 3).34 Deconvolution analysismust be applied to different regions in the FT-IR spectra fordetermination of intensities of signals where signals cannot bedifferentiated. Yen et al. calculated the ratio of HMe (number ofhydrogen atoms in methyl groups) to Hsat (number ofhydrogen atoms attached to saturated carbon atoms) usingthe following equation:35
= ′ ′⎛⎝⎜
⎞⎠⎟K
AA
KHH
, where is 2.4Me
sat
1373.3
2920.0 (5)
Also, we calculate the nCH2/mCH3 ratio by using the signalsat 2851.9, 2924.5, and 2954.7 cm−1, as the ratio (A2851.9 +A2924.5)/A2954.7; results are reported in Table 3.In Figure 4, we present the differential spectra of asphaltene
samples after subtracting the FT-IR spectrum of the asphaltenesample before plasma exposure, as is suggested by Chang.36
Changes in the chemical structure of asphaltenes were analyzedthrough the groups of signals, 700−900, 1030, 1300−1500,2900−3000, and 3500−3750 cm−1. The three absorption bandsfrom 700 to 900 cm−1 are assigned to the aromatic C−H out-of-plane bending vibrations; in this region also appear thesignals of long alkyl chains (CH2)n, 725−760 cm−1. Thus, theanalysis of aromatic cores is difficult because the overlapping ofsignals in this region. As can be seen in Figure 4, whenasphaltene samples are exposed to the plasma, the relativeintensities of signals changes, indicating chemical changesoccurring when interaction with plasma particles takes place,but a clear tendency is not observed.The signals of CH3 and CH2 groups appear from 1300 to
1500 cm−1, and the relative areas change as the treatment timeincreases (see Table 3). The ratio of hydrogens in CH3 tohydrogens in CH2 groups can also be analyzed using the regionbetween 2900 and 3000 cm−1. Analyzing the reported data inTable 3, we can see that the results allow us to observe aprogressive increment of CH2 groups when they are comparedwith CH3. This indicates that CH2 groups are produced as theplasma particles (H+, H•, H2
+) interact with asphaltenes.During the first 30 min, the signals of CH2 bending andsymmetric stretching of CH3 increase but decrease at longertimes. A similar behavior was observed for the signals between2850 and 2970 cm−1 assigned to the symmetric CH2 andantisymmetric CH3 stretching. One possible mechanisminvolves the hydrogenation of aromatic units in the peripheryto form cyclic paraffins before the formation of linear paraffins,which can explain the changes in the calculated ratios reportedin Table 3.In the region from 3500 to 3750 cm−1, amines and hydroxyl
groups appear.28,29 The presence of free OH groups can beobserved beyond 3600 cm−1. These signals appear changing
Figure 4. Differential FTIR spectra of asphaltenes after subtractingFTIR spectra of the reference sample of asphaltenes.
Table 3. Structural Parameters Calculated from IR Data
time to the H2 plasma (min)
parameter 0 15 30 60 120 reference
nCH2/mCH3a 1.91 4.65 5.77 3.87 7.89 Coelho34
mCH3/(nCH2 + mCH3)b 0.44 0.43 0.40 0.39 0.38 Benkhedda33
HCH3/Hsat
c 0.48 0.19 0.15 0.21 0.12 Yen35
nCH2/mCH3d 1.77 3.41 3.75 2.89 4.89 authors
aUsing the 2924.5 and 2954.9 cm−1 peaks. bUsing the 1373.0 and 1459.5 cm−1 peaks. cUsing the 1373.0 and 2924.5 cm−1 peaks. dUsing the 2924.5,2851.9, and 2954.7 cm−1 peaks.
Energy & Fuels Article
dx.doi.org/10.1021/ef401773t | Energy Fuels 2014, 28, 735−744739

their intensities as the plasma treatment is prolonged. Thesignal at 3750 cm−1 is attributed to free OH on the surface ofthe material, most likely outside the aromatic cores of theasphaltenes. From Figure 4, we observe that signals of OHgroups increase progressively as the exposure time to theplasma also increases. The increment in the OH signal can bethe result of either ether or keto to alcohol functionalitiesconversion, R−O−R′ to ROH or R′OH and R−CO−R′ to R−CH(−OH)−R′.Chemical changes in the aromatic core were observed in the
region 700−900 cm−1. The signals 748.34, 808.13, and 864.07cm−1 are more prominent at 30 min; at this exposure time, thearomatic core is richer in hydrogen than substitutions of alkylgroups. Two of the possible reaction mechanisms can be eitherthe aromatization of naphthenic rings joined to aromatics, byhydrogen elimination via C−H bond break, or the alkylelimination via C−C bond break and inclusion of hydrogenform plasma particles. Thus, the above-mentioned mechanismsneed to be supported on the basis of the structural parametersusing data from NMR and XRD spectroscopies.When plasma particles and asphaltenes interact, C−H and
C−C bond breaking occurs. If hydrogen elimination takes placefrom cyclic paraffins, there is an aromatization process, resultingin an increment of the signals of aromatics at 700−900 cm−1,also supported by the growth observed of signals at 1565−1600cm−1 (C−C stretch of aromatics). Otherwise, if hydrogeninteracts either with cyclic paraffins or outside of aromaticstructures and it is linked to the structure, a hydrogenationprocess takes place and the ratios of CH2 to CH3 increase asthe treatment time also increases (see Table 3). Also, if C−Cbond breaks occur, this process facilitates the removal of lowmolecular fragments, which are evacuated by the vacuumsystem of the plasma chamber. The signal at 1030 cm−1
increases as the exposition time to plasma also increases; thissignal is assigned to sulfoxides possibly due to the oxidation ofthiophenes.3.3. Matrix Assisted Laser Desorption Ionization Mass
Spectrometry. MALDI-TOF spectra of asphaltene withoutplasma erosion and after 15 min of exposure to plasma aredisplayed in Figure 5. Spectra were analyzed making adeconvolution of envelopes and calculating the minimumnumber of Gaussians required for reconstruction. For all cases,the number of Gaussian functions needed to obtain a goodcorrelation with experimental data was four. From deconvolu-tion processes, we observe that the Gaussian functions were
centered in the ranges 1616−1655, 2096−2164, 2867−3110,and 5139−5597 Da, corresponding to the range of mass profiledistributions; results of deconvolution are presented in Table 4.Because the laser radiation desorbs the sample by a fast thermalheating, it is possible to obtain clusters with several moleculesper cluster unit; the ionization occurs by proton transfermechanisms, being registered as ions M−H+. From the results,it was possible to observe that the interactions of molecules inthe molecular mass ranges of 1616−1655 and 2096−2164 canproduce clusters with two and three molecules per cluster unit,observed in the region of masses of 2867−3110 and 5139−5507, respectively. To our knowledge, MALDI-TOF-MS hasbeen useful in determining the molecular profile distributionsof heavy fractions from crude oils, but many aspects ofprocesses taking place during the desorption and ionizationremain unrevealed.37,38 Desorption and ionization processes arevery sensitive to the radiation intensities and wavelengthsbecause the wavelength can promote either resonant or non-resonant photon absorption, as has been reported by otherauthors.39−42 In the present study, it was difficult to follow thechanges of molecular weight distributions because theformation of cluster darkens the analysis. From data in Table4, we observe that the relative amount of mass distributioncentered at 1616−1655 and 2096−2164 Da decreases as thetreatment time increases, while the higher mass clusters, 2867−3110 and 5139−5507 Da, increase. Interaction of asphalteneswith plasma particles favors the formation of larger clusters.
3.4. Nuclear Magnetic Resonance Spectroscopy. NMRspectroscopy yields information about the hydrogen and carbondistribution in the molecular environments like differentregions for aromatics, unsaturated and alkyl chains. Becauseasphaltenes are a mixture of thousands of compounds, theNMR spectra are difficult to be analyzed. Thus, the NMRspectra would be divided into regions, with each regionassigned to a chemical group. In the NMR spectra, theintegrated areas are commensurate to the relative amount ofatomic nucleus of the different chemical groups present in thesample. Quantitative experimental conditions are needed toobtain useful structural data. The main chemical groups presentin asphaltenes and the spectral ranges where these chemicalgroups appear in 1H and 13C NMR spectra are shown in Table5, with normalized integrated areas also presented. 1H and 13CNMR spectra of reference sample of asphaltenes are presentedin Figure 6a and b, respectively. Chemical changes ofasphaltenes can be inferred from these data analyzed on thebasis of the time in the plasma. From 1H NMR data, changeswere observed in the naphthenic and paraffinic structure. Theamount of hydrogen in mono-aromatic rings changes as thetreatment time increases, but no clear tendency was observed.The main changes were observed in the relative number ofhydrogen atoms located in polycyclic aromatic rings; thenumber increases as the exposure time to the plasma alsoincreases. In examining the carbon data in Table 5, importantchanges were observed for the carbons in naphthenic structuresand the number of aromatic carbons bonded to eithernaphthenic or paraffinic carbons. Small changes were alsoobserved for the number of catacondensed aromatic carbons,which increase as the treatment time is prolonged. We canargue that the chemical changes occurring during the plasmatreatment as a result of the interaction between atomic andmolecular hydrogen and asphaltenes involve two differentpathways. One pathway could be the Cα or Cβ bond cleavagefor paraffinic or naphthenic structures joined to aromatic rings
Figure 5. MALDI-TOF spectra of asphaltenes without plasma erosionand after 15 min.
Energy & Fuels Article
dx.doi.org/10.1021/ef401773t | Energy Fuels 2014, 28, 735−744740
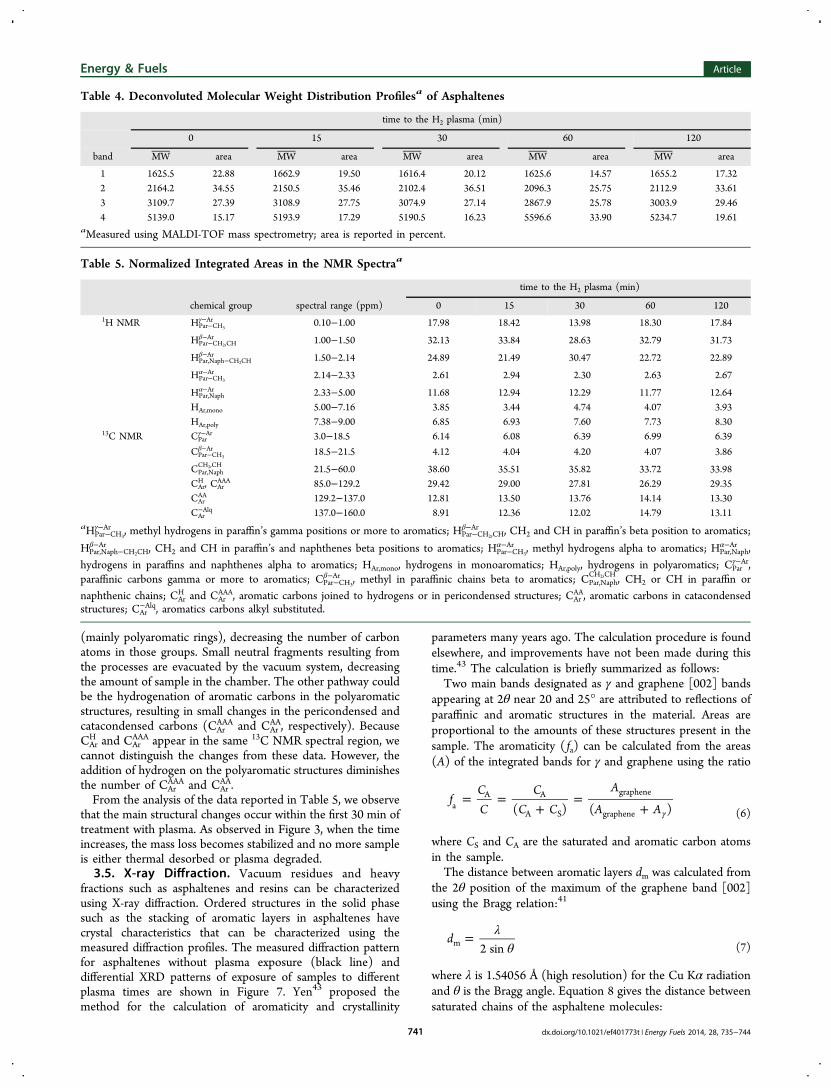
(mainly polyaromatic rings), decreasing the number of carbonatoms in those groups. Small neutral fragments resulting fromthe processes are evacuated by the vacuum system, decreasingthe amount of sample in the chamber. The other pathway couldbe the hydrogenation of aromatic carbons in the polyaromaticstructures, resulting in small changes in the pericondensed andcatacondensed carbons (CAr
AAA and CArAA, respectively). Because
CArH and CAr
AAA appear in the same 13C NMR spectral region, wecannot distinguish the changes from these data. However, theaddition of hydrogen on the polyaromatic structures diminishesthe number of CAr
AAA and CArAA.
From the analysis of the data reported in Table 5, we observethat the main structural changes occur within the first 30 min oftreatment with plasma. As observed in Figure 3, when the timeincreases, the mass loss becomes stabilized and no more sampleis either thermal desorbed or plasma degraded.3.5. X-ray Diffraction. Vacuum residues and heavy
fractions such as asphaltenes and resins can be characterizedusing X-ray diffraction. Ordered structures in the solid phasesuch as the stacking of aromatic layers in asphaltenes havecrystal characteristics that can be characterized using themeasured diffraction profiles. The measured diffraction patternfor asphaltenes without plasma exposure (black line) anddifferential XRD patterns of exposure of samples to differentplasma times are shown in Figure 7. Yen43 proposed themethod for the calculation of aromaticity and crystallinity
parameters many years ago. The calculation procedure is foundelsewhere, and improvements have not been made during thistime.43 The calculation is briefly summarized as follows:Two main bands designated as γ and graphene [002] bands
appearing at 2θ near 20 and 25° are attributed to reflections ofparaffinic and aromatic structures in the material. Areas areproportional to the amounts of these structures present in thesample. The aromaticity ( fa) can be calculated from the areas(A) of the integrated bands for γ and graphene using the ratio
= =+
=+ γ
fCC
CC C
A
A A( ) ( )aA A
A S
graphene
graphene (6)
where CS and CA are the saturated and aromatic carbon atomsin the sample.The distance between aromatic layers dm was calculated from
the 2θ position of the maximum of the graphene band [002]using the Bragg relation:41
λθ
=d2 sinm (7)
where λ is 1.54056 Å (high resolution) for the Cu Kα radiationand θ is the Bragg angle. Equation 8 gives the distance betweensaturated chains of the asphaltene molecules:
Table 4. Deconvoluted Molecular Weight Distribution Profilesa of Asphaltenes
time to the H2 plasma (min)
0 15 30 60 120
band MW area MW area MW area MW area MW area
1 1625.5 22.88 1662.9 19.50 1616.4 20.12 1625.6 14.57 1655.2 17.322 2164.2 34.55 2150.5 35.46 2102.4 36.51 2096.3 25.75 2112.9 33.613 3109.7 27.39 3108.9 27.75 3074.9 27.14 2867.9 25.78 3003.9 29.464 5139.0 15.17 5193.9 17.29 5190.5 16.23 5596.6 33.90 5234.7 19.61
aMeasured using MALDI-TOF mass spectrometry; area is reported in percent.
Table 5. Normalized Integrated Areas in the NMR Spectraa
time to the H2 plasma (min)
chemical group spectral range (ppm) 0 15 30 60 1201H NMR HPar−CH3
γ−Ar 0.10−1.00 17.98 18.42 13.98 18.30 17.84
HPar−CH2,CHβ−Ar 1.00−1.50 32.13 33.84 28.63 32.79 31.73
HPar,Naph−CH2CHβ−Ar 1.50−2.14 24.89 21.49 30.47 22.72 22.89
HPar−CH3
α−Ar 2.14−2.33 2.61 2.94 2.30 2.63 2.67
HPar,Naphα−Ar 2.33−5.00 11.68 12.94 12.29 11.77 12.64
HAr,mono 5.00−7.16 3.85 3.44 4.74 4.07 3.93HAr,poly 7.38−9.00 6.85 6.93 7.60 7.73 8.30
13C NMR CParγ−Ar 3.0−18.5 6.14 6.08 6.39 6.99 6.39
CPar−CH3
β−Ar 18.5−21.5 4.12 4.04 4.20 4.07 3.86
CPar,NaphCH2,CH 21.5−60.0 38.60 35.51 35.82 33.72 33.98
CArH , CAr
AAA 85.0−129.2 29.42 29.00 27.81 26.29 29.35CAr
AA 129.2−137.0 12.81 13.50 13.76 14.14 13.30CAr
−Alq 137.0−160.0 8.91 12.36 12.02 14.79 13.11aHPar−CH3
γ−Ar , methyl hydrogens in paraffin’s gamma positions or more to aromatics; HPar−CH2,CHβ−Ar , CH2 and CH in paraffin’s beta position to aromatics;
HPar,Naph−CH2CHβ−Ar , CH2 and CH in paraffin’s and naphthenes beta positions to aromatics; HPar−CH3
α−Ar , methyl hydrogens alpha to aromatics; HPar,Naphα−Ar ,
hydrogens in paraffins and naphthenes alpha to aromatics; HAr,mono, hydrogens in monoaromatics; HAr,poly, hydrogens in polyaromatics; CParγ−Ar,
paraffinic carbons gamma or more to aromatics; CPar−CH3
β−Ar , methyl in paraffinic chains beta to aromatics; CPar,NaphCH2,CH , CH2 or CH in paraffin or
naphthenic chains; CArH and CAr
AAA, aromatic carbons joined to hydrogens or in pericondensed structures; CArAA, aromatic carbons in catacondensed
structures; CAr−Alq, aromatics carbons alkyl substituted.
Energy & Fuels Article
dx.doi.org/10.1021/ef401773t | Energy Fuels 2014, 28, 735−744741

λθ
=γd5
(8 sin ) (8)
The average diameter of the aromatic units can be calculatedusing the Scherrer crystallite size formula:
λω θ
= =LB
1.84( cos )
0.92a
1/2 (9)
where B1/2 is the full width at half-maximum using the band[110] and ω is the bandwidth.The average thickness of the asphaltene cluster measured
perpendicularly to the aromatic layers was calculated from thefull width of the [002] band at half-maximum using the ratio
ω θ= =LB
0.9 cos0.45
c1/2 (10)
The number of aromatic layers in an asphaltene cluster, M, wascalculated from the above values of Lc and dm:
= +MLd
1c
m (11)
The structural parameters as determined by XRD are presentedin Table 6.
X-ray diffraction patterns need to be processes to calculatethe main characteristics of the observed bands. The baselinewas corrected by a linear combination of two second-orderpolynomials. In this procedure, three points are defined on thebasis of the observed pattern. Two points define the lower andhigher points in the pattern, and a third point defines aminimum located between the [002] and [100] bands. Thechange in baseline had little influence on the results such as thearomaticity. Nevertheless, all of the patterns needed to beprocessed using a similar procedure. Changes in the XRDpatterns were observed when differential patterns werecalculated, as presented in Figure 7. Relative areas of γ and(002) bands as well the (100) and (004) bands decrease as theexposure time gets longer. Main changes were observed as thetime reaches 60−120 min of plasma exposure.The three major bands (γ, 002, and 100) at 2θ values of 20,
25, and 44° were used as the initial parameters for the analysis.At high 2θ values, the 004 band was observed, approximately53°. The structural parameters of samples were calculated usingdata obtained from XRD patterns, peak positions, fwhm, andareas in the equations reported in Table 6; the results arereported in Table 7.Changes in the structural parameters were observed as the
exposure time to the plasma was increased. The interplanardistance between aromatic layers does not reflect significantchanges, being of the order of 3.53 Å. Likewise, with theaverage distance of paraffinic side chains being of the order of5.85 Å, the increments in distances compared to the aromaticmoieties can be attributed to steric hindrance of the chains,
Figure 6. (a) 1H NMR and (b) 13C NMR spectra of originalasphaltenes (reference sample).
Figure 7. XRD pattern of asphaltenes without plasma treatment (blackline) and differential XRD patterns of asphaltenes with differentplasma erosion times.
Table 6. Structural Parameters That Can Be Obtained fromX-ray Data
fa factor of aromaticity A002/(A002 + Aγ)dm distance between aromatic sheets λ/2 sin θ
dγ distance between paraffinic chains λ/2 sin θ
La average diameter of aromatic layers, alphacarbons included
0.92/B1/2 [110]
Lc average diameter of the clusters 0.45/B1/2 [002]M number of aromatic layers per cluster Lc/dm + 1CA aromatic carbons per molecule La
2/2.62CAU number of aromatic carbons per aromatic unit,
including alpha carbons(La + 1.23)/0.615
N number of aromatic centers per molecule CA/CAU
Energy & Fuels Article
dx.doi.org/10.1021/ef401773t | Energy Fuels 2014, 28, 735−744742

having many different possible orientations. More visiblestructural changes were observed when we analyzed thediameters of the aromatic layers. The diameters of the aromaticlayers were reduced from 20.46 to 15.15 Å at plasma exposuretimes of 120 min. Indicating that atomic hydrogen from plasmainteracts with asphaltenes to introduce hydrogen in thearomatic cores, resulting in the increment of paraffinic sidechains, afterward paraffins can experience a C−C bond breakbeing evacuated from a plasma chamber. FT-IR data shows thatthe ratio (nCH2 + mCH3)/mCH3 decreases as the exposuretime increases (see Table 3), but also from NMR data, thecalculated structural parameters show that the aromatic coresincrease the alkyl substitution; see the CAr
−Alq parameter in Table5. From 1H NMR data, the HAr,poly parameter shows that thenumber of hydrogens on a polyaromatic ring increases at longerexposure times. Compared with the CAr
H and CArAAA parameters,
the initial and final values shown in Table 5 do not presentimportant changes, indicating that the number of CAr
AAA mustdecrease to be consistent with the observed values of HAr,polyand HAr,mono (see Table 5).Without considering the paraffinic units, we can define the
La/Lc ratio, which can be useful to define a shape factor foraromatic cores of clusters. In the original sample, the La/Lc ratioreaches values of 0.71, indicating a cylindrical shape notconspicuously changing in plasma exposure times up to 30 min.At longer exposure times, the shapes of clusters are morecylindrical than the shapes observed at short exposure times.The La/Lc ratio can reach values of 0.51 and 0.49 at 60 and 120min of plasma exposure time, respectively. Analyzingparameters such as M, CA, CAU, and N, we can conclude thatstructural changes occur at the periphery of aromatic moieties,changing their diameters as well the number of aromaticcarbons. We do not observe significant changes in the numberof aromatic layers per cluster. Compared with the MALDI-TOFexperiments, where energy is transferred to sample from laserradiation and dissociation of clusters is possible, in the XRDmeasurement, asphaltene clusters do not dissociate, so theMALDI-TOF mass spectra do not show evidence of higher sizeclusters, as those are measured in XRD experiments.
4. CONCLUSIONSThe results of the work are summarized as follows: thechemical changes in asphaltenes when they are treated withhydrogen plasma were analyzed as the exposure time increased.Chemical changes were followed at exposure times of 0, 15, 30,60, and 120 min using the data from OES, MALDI-TOF-MS,FT-IR, XRD, and 1H and 13C NMR spectroscopy.Mass loss in the samples can be the result of two different
processes. One is the thermal desorption of low volatile
compounds in the plasma vacuum chamber, resulting fromheating of sample at the first stages of the process by the plasmaparticle−asphaltene interactions. The second is the chemicaldegradations of asphaltenes, the results of the chemical bondbreaks when plasma particles interact with asphaltenes. Underthese conditions, different processes could take place, i.e.,hydrogenation of aromatic cores, naphthene ring-opening, andseveral other dissociation processes activated by collisionalprocesses when plasma particles interact with asphaltenes.Using OES, the products of the decomposition of
asphaltenes were identified (C+, CH+, C2+, NH+, V+). By
comparing the asphaltene decomposition products with speciesfound in the pure hydrogen plasma, the asphaltenedecomposition species were shown to result exclusively fromchemical decomposition of asphaltenes.FT-IR data show that the ratio of CH2 to CH3 in asphaltenes
decreases as the times for exposure to plasma increase,indicating a decrease in the average length of paraffinic chains.Changes in the aromatic cores were observed by analyzing thepatterns of signals at 700−800 cm−1. MALDI-TOF data hadshown that the formation and detection of clusters in the TOFspectra were possible. From NMR data, relative quantities ofdifferent structural fragments reveal that changes in thenumbers of aromatic hydrogens indicate that this number ofaromatic hydrogens increases as the exposure time increases.The results of 1H NMR and 13C NMR indicate changes in thearomatic structure results of the plasma exposure.X-ray diffraction was useful to characterize changes in the
clusters when asphaltene samples were either chemically orphysically modified. The main changes were analyzed on thebasis of the shape factor determined from La and Lc parametersfor clusters. Evidence for the change in the clusters of thearomatic units was obtained.Chemical changes were analyzed using the average molecular
parameters (AMPs) calculated by compiling the structuralinformation obtained by different spectroscopic techniques.Possible changes in the asphaltene cluster structures wereanalyzed using XRD. Plasmas under different conditions,operating pressures, types and energy of particles can be usedsatisfactorily to recover amounts of heavy fractions as gasesfrom lighter fractions. Additional work is needed to find anindustrial way for these procedures to be used.
■ AUTHOR INFORMATION
Corresponding Author*E-mail: [email protected].
NotesThe authors declare no competing financial interest.
■ ACKNOWLEDGMENTS
The authors D.M. and J.C.P. acknowledge the support of theEscuela de Quimica-UIS for the FT-IR measurements andVicerectoria de Investigaciones (VIE) of the UniversidadIndustrial de Santander for measurements of NMR spectros-copy, XRD, and MALDI-TOF-MS at the facilities of ParqueTecnologico de Guatiguara. The authors H.M., B C., and O.F.acknowledge the financial support of CONACyT 128714,DGAPA-UNAM 105010, and Mr. Anselmo Gonzalez and Mr.Ivan Puente for their technical support. Also, we acknowledgethe technician support of Jose Luis Pinto and Mari HelenaTorres at XRD and NMR facilities.
Table 7. Structural Parameters Calculated from X-ray Data
time to the H2 plasma (min)
parameter 0 15 30 60 120
fa 0.14 0.14 0.13 0.12 0.12dm (Å) 3.53 3.53 3.54 3.54 3.53dγ (Å) 5.87 5.86 5.93 5.94 5.88La (Å) 20.46 20.42 20.44 15.86 15.15Lc (Å) 28.76 28.92 28.65 31.04 30.72M 9.15 9.19 9.10 9.77 9.69CA 159.8 159.2 159.5 96.0 87.6CAU 35.3 35.2 35.2 27.8 26.6N 4.53 4.52 4.53 3.45 3.29
Energy & Fuels Article
dx.doi.org/10.1021/ef401773t | Energy Fuels 2014, 28, 735−744743

■ REFERENCES(1) Sims, R. A. H.; Hastings, A.; Schlamadinger, B.; Taylor, G.;Smith, P. Global Change Biol. 2006, 12, 2054−2076.(2) Poddar, S. K.; Ragsdale, R.; Geosits, R. F.; Hood, R. L.; Lynch, K.Z. ROSE asphaltenes, a fuel with a future, Proceedings of the 1994National Petroleum Refiners Association (NPRA) annual meeting, SanAntonio, TX, Mar 20−22, 1994.(3) Schabron, J. F.; Speight, J. G. Pet. Sci. Technol. 1998, 16, 361−375.(4) Erickson, D. D.; Niesen, V. G.; Brown, T. S. Thermodynamicsmeasurement and prediction of paraffin precipitation, Paper No. SPE26604, Proceedings of the SPE Annual Technical Conference andExhibition, Houston, TX, Oct 3−6, 1993.(5) Andersen, S. I.; Keul, A.; Stenby, E. Pet. Sci. Technol. 1997, 15,611−645.(6) Thanh, N. X.; Hsieh, M.; Philp, R. P. Org. Geochem. 1999, 30,119−132.(7) Zaki, N.; Butz, Th.; Kessel, D. Pet. Sci. Technol. 2001, 19, 425−435.(8) Ramirez-Jaramillo, E.; Lira-Galeana, C.; Manero, O. Energy Fuels2006, 20, 1184−1196.(9) Boukir, A.; Aries, E.; Guilliano, M.; Asia, L.; Doumenq, P.; Mille,G. Chemosphere 2001, 43, 279−286.(10) Ciajolo, A.; Barbella, R. Fuel 1984, 63, 657−661.(11) Seki, H.; Kumata, F. Energy Fuels 2000, 14, 980−985.(12) Ancheyta, J.; Centeno, G.; Trejo, F.; Marroquin, G. Energy Fuels2003, 17, 1233−1238.(13) Trejo, F.; Ancheyta, J.; Rana, M. Energy Fuels 2008, 23, 429−439.(14) Martínez, H.; Flores, O.; Poveda, J. C.; Campillo, B. Plasma Sci.Technol. 2012, 14, 303−311.(15) Gambus, G.; Patino, P.; Mendez, B.; Sifontes, A.; Navea, J.;Martín, P.; Taylor, P. Energy Fuels 2001, 15, 881−886.(16) Salmanova, Ch. K.; Akhmedbekova, S. F.; Mamedov, A. P.;Kyazimov, S. M.; Abdulova, Sh. N. Chem. Technol. Fuels Oils 2007, 43,415−421.(17) American Society for Testing and Materials (ASTM). ASTMmethod D6560-12. Determination of asphaltenes (Heptane insolubles) incrude petroleum and petroleum products; ASTM: West Conshohocken,PA, 2001.(18) Martínez, H.; Avellaneda, D. Nucl. Instrum. Methods 2012, B272,351−356.(19) MestReNova, version 8.1.0-11315; software for NMR dataprocessing; Mestrelab Research S.L. Chemistry Software Solutions:Santiago de Compostela, Spain, 2012.(20) Pearse, R. W. B.; Gaydon, A. G. The identification of molecularspectra; University Printing House Cambridge: Cambridge, GreatBritain, 1976.(21) Poveda, J. C.; Molina, D. Pet. Sci. Technol. 2012, 84−85, 1−7.(22) Morgan, T. J.; Alvarez-Rodríguez, P.; George, A.; Herod, A. A.;Kandiyoti, R. Energy Fuels 2010, 24, 3977−3989.(23) Garcia, D. M.; Murgich, J.; Andersen, S. I. Pet. Sci. Technol. 2004,22, 735−758.(24) Mullins, O. C.; Sabbah, H.; Eyssautier, J.; Pomerantz, A. E.;Barre, L.; Ballard Andrews, A.; Ruiz-Morales, Y.; Mostowfi, F.;McFarlane, R.; Goual, L.; Lepkowicz, R.; Cooper, T.; Orbulescu, J.;Leblanc, R. M.; Edwards, J.; Zare, R. N. Energy Fuels 2012, 26, 3986−4003.(25) Michels, R.; Langlois, E.; Ruau, O.; Mansuy, M.; Elie, M.;Landias, P. Energy Fuels 1996, 10, 39−48.(26) Wilt, B. K.; Welch, W. T. Energy Fuels 1998, 12, 1008−1012.(27) Malhotra, V. M.; Buckmaster, H. A. Preprints from ACSSymposium on Trace Elements in Petroleum Geochemistry, Dallas, TX,Apr 9−14, 1989.(28) Brown, F. R.; Friedman, S.; Makovsky, L. E.; Schweighardt, F. K.Appl. Spectrosc. 1977, 31, 241−243.(29) Siddiqui, M. N. Pet. Sci. Technol. 2003, 21, 1601−1615.(30) A-Liang, W.; Que, G.; Chen, Y.; Liu, C. Asphaltenes andasphalts. In Chemical Composition and Characteristics of Residues of
Chinese Crude Oils Development in Petroleum Science; Yen, T. F.,Chilingarian, G. V., Eds.; Elsevier: New York, 2000; Vol. 2, Chapter10, p 287.(31) Bellamy, L. J. The Infrared Spectra of Complex Molecules; JohnWiley & Sons Inc.: New York, 1957; pp 18−20.(32) Liu, D.; Wang, Z.; Zhou, J.; Deng, W.; Liang, S.; Que, G.Symposium on General Papers Presented before the Division ofPetroleum Chemistry, Inc., 222nd ACS National Meeting, AmericanChemistry Society, Chicago, IL, Aug 26−30, 2001.(33) Benkhedda, Z.; Landais, P. Energy Fuels 1992, 6, 166−172.(34) Coelho, R. R.; Hovell, I.; de Mello Monte, M.; Middea, A.;Lopez de Souza, A. Fuel Process. Technol. 2006, 87, 325−333.(35) Yen, T. F.; Wu, W. H.; Chilingar, G. V. Energy Sources 1984, 7,203−235.(36) Chang, Ch.-L.; Fogler, S. Langmuir 1994, 10, 1758−1766.(37) Poveda, J. C.; Guerrero, A.; Alvarez, I.; Cisneros, C. J.Photochem. Photobiol., A 2010, 215, 140−146.(38) Tanaka, R.; Saato, S.; Takanohashi, T.; Hunt, J. E.; Winans, R. E.Energy Fuels 2004, 18, 1405−1413.(39) Qian, K.; Edwards, K. E.; Siski, M.; Olmstead, W. N.; Mennito,A. S.; Dechert, G. J.; Hoosain, N. E. Energy Fuels 2007, 21, 1042−1047.(40) Hortal, A. R.; Hurtado, P.; Martínez-Haya, B.; Mullins, O. C.Energy Fuels 2007, 21, 2863−2868.(41) Tanaka, R.; Sato, S.; Takanohashi, T.; Hunt, J. E.; Winans, R. E.Energy Fuels 2004, 18, 1405−1413.(42) Pomerantz, A. E.; Hammond, M. R.; Morrow, A. L.; Mullins, O.C.; Zare, R. N. Energy Fuels 2009, 23, 1162−1168.(43) Yen, T. F. Anal. Chem. 1961, 33, 1587−1594.
Energy & Fuels Article
dx.doi.org/10.1021/ef401773t | Energy Fuels 2014, 28, 735−744744