Block by calcium of ATP-activated channels in pheochromocytoma cells
Upload
independentCategory
view
5download
0
Plasma Metanephrines Are Markers ofPheochromocytoma Produced by Catechol-O-Methyltransferase Within Tumors
GRAEME EISENHOFER, HARRY KEISER, PETER FRIBERG, EVA MEZEY,THANH-TRUC HUYNH, BHARGAVA HIREMAGALUR, TODD ELLINGSON,SUSHIL DUDDEMPUDI, AGNES EIJSBOUTS, AND JACQUES W. M. LENDERS
Clinical Neuroscience Branch, National Institute of Neurological Disorders and Stroke (G.E., E.M.,T.-T.H., B.H., T.E., S.D.) and Hypertension Endocrine Branch, National Heart Lung and BloodInstitute (H.K.), National Institutes of Health, Bethesda, Maryland 20892-1424; Department of ClinicalPhysiology, University of Goteborg, Goteborg, Sweden (P.F.); and Departments of Rheumatology (A.E.)and Internal Medicine (J.W.M.L.), St. Radboud University Hospital, Nijmegen, The Netherlands
ABSTRACTThis study examined whether the high sensitivity of plasma free
metanephrines for diagnosis of pheochromocytoma may result fromproduction of free metanephrines within tumors. Presence in pheo-chromocytomas of catechol-O-methyltransferase (COMT), the en-zyme responsible for conversion of catecholamines to metanephrines,was confirmed by Western blot analysis, enzyme assay, and immu-nohistochemistry. Western blot analysis and enzyme assay indicatedthat membrane-bound and not soluble COMT was the predominantform of the enzyme in pheochromocytoma. Immunohistochemistryrevealed colocalization of COMT in the same chromaffin cells wherecatecholamines are translocated into storage vesicles by the vesicularmonoamine transporter. Levels of free metanephrines in pheochro-mocytoma over 10,000 times higher than plasma concentrations inthe same patients before removal of tumors indicated production of
metanephrines within tumors. Comparisons of the production ofmetanephrines in patients with pheochromocytoma with productionfrom catecholamines released or infused into the circulation indicatedthat more than 93% of the consistently elevated levels of circulatingfree metanephrines in patients with pheochromocytoma are derivedfrom metabolism before and not after release of catecholamines intothe circulation. The data indicate that the elevated plasma levels offree metanephrines in patients with pheochromocytoma are derivedfrom catecholamines produced and metabolized within tumors. Sometumors do not secrete catecholamines, but all appear to metabolizecatecholamines to free metanephrines, thus explaining the bettersensitivity of plasma free metanephrines over other tests for diagnosisof pheochromocytoma. (J Clin Endocrinol Metab 83: 2175–2185,1998)
PHEOCHROMOCYTOMAS are tumors of chromaffincells most commonly arising from the adrenal me-
dulla and usually presenting with hypertension. Unequiv-ocal diagnosis of the tumor typically requires confirmationby several tests. Perhaps the most important diagnostictest is biochemical evidence of excessive catecholamineproduction by the tumor. This is usually achieved usingmeasurements of catecholamines in urine or plasma (1–3)or of certain catecholamine metabolites in urine (3–5).However, none of these commonly used tests reliably con-firms or excludes the presence of a tumor in every patientwith pheochromocytoma (6).
A new test with more promise than other tests involvesmeasurements of free metanephrines (normetanephrine andmetanephrine) in plasma (7). These O-methylated metabo-lites of norepinephrine and epinephrine are produced by theenzyme, catechol-O-methyltransferase (COMT) and are rap-idly metabolized to sulfate conjugates by the enzyme, mono-amine-preferring phenolsulfotransferase. The resultingsulfate conjugates are present in plasma and urine in con-
centrations more than 25-fold higher than those of the freemetanephrines (8). Assays of urine metanephrines typicallyemploy a deconjugation step so that sulfate-conjugatedmetanephrines comprise the bulk of these measurements.Thus, these commonly used assays of urinary metanephrinesare largely measurements of metabolites (i.e. sulfate-conju-gated derivatives) that are different from those of the freemetanephrines (7).
In a study of over 50 patients with pheochromocytoma,every patient had elevated plasma concentrations of freeunconjugated metanephrines, showing that this test reliablyexcludes the presence of a tumor, whereas measurements ofplasma catecholamines or urine metanephrines do not (9). Aquestion arising from this study is why measurements of freemetanephrines should provide a more superior method fordiagnosis of pheochromocytoma than measurements of theparent amines or other metabolites? Our hypothesis for thesuperiority of plasma free metanephrines over other tests isthat in patients with pheochromocytoma, free metaneph-rines are produced mainly from metabolism of cat-echolamines within the tumor, not from catecholamines me-tabolized after their secretion into the circulation. Becausesome tumors do not secrete catecholamines or secrete themepisodically (10–13), ongoing metabolism of catecholaminesto free metanephrines within tumors would explain the bet-
Received January 22, 1998. Revision received February 23, 1998. Ac-cepted March 2, 1998.
Address all correspondence and requests for reprints to: Graeme Eisen-hofer, Building 10, Room 4D20, National Institutes of Health 10 CenterDrive, Bethesda, Maryland 20892-1424. E-mail: [email protected].
0021-972X/98/$03.00/0 Vol. 83, No. 6Journal of Clinical Endocrinology and Metabolism Printed in U.S.A.Copyright © 1998 by The Endocrine Society
2175

ter sensitivity of free metanephrines compared with the par-ent amines and other metabolites for diagnosis of the tumor.
In the present study, the hypothesis outlined above wasexamined by several procedures designed to assess thesource of plasma metanephrines in patients with pheo-chromocytoma. The presence of COMT in tumor tissuewas examined using Western blot analysis and immuno-histochemical localization of the enzyme. The capacity ofpheochromocytomas to produce free metanephrines wasfurther examined from measurements of COMT enzymeactivity and the presence of O-methylated amine metab-olites in tumor tissue. Finally, comparisons of the produc-tion of metanephrines from the parent amines in patientswith pheochromocytoma vs. production in other subjectsreceiving insulin tolerance tests or infusions of radiola-beled catecholamines enabled estimation of amounts ofmetanephrines derived from metabolism of circulatingcatecholamines, as distinct from those derived from me-tabolism of catecholamines within tumors.
Materials and MethodsSubjects
The patient database for this report includes 82 patients with histo-logically proven pheochromocytomas, half of whom were studied at theNational Institutes of Health (Bethesda, MD), and the rest of whom wereexamined at several other centers within the United States or in TheNetherlands (St. Radboud University Hospital, Nijmegen) or Sweden(Sahlgrenska Hospital, University of Goteborg, Goteborg). Other datafrom 52 of these patients have been reported previously in a study thatexamined the sensitivity and specificity of plasma metanephrines in thediagnosis of pheochromocytoma (9). The present study examines thesource of the elevated plasma metanephrines in patients with pheo-chromocytoma. Blood samples were obtained from all patients, andsamples of tumor tissue were obtained at surgery from 34 patients.Additional data includes the results of glucagon stimulation tests ormultiple blood sampling in selected patients.
For comparison purposes, the data in this report are also derived fromsubject groups without pheochromocytoma (healthy normotensives andpatients with angina pectoris or congestive heart failure) who receivediv infusions of 3H-labeled catecholamines or bolus injections of insulin.Other subjects provided samples of normal liver or adrenal medulladuring surgical procedures for conditions other than pheochromocy-toma. Upper reference limits of normal (URLs) for plasma concentra-tions of metanephrines and catecholamines are the same as those es-tablished in our previous report (9).
All studies were approved by the appropriate institutional reviewboards, and all patients and subjects gave their informed consent toparticipate in studies.
Insulin tolerance tests
Insulin tolerance tests were carried out in seven healthy volunteers(two males and five females; mean 6 sd; age, 51.9 6 8.5 yr) to examineplasma metanephrine responses to release of catecholamines from theadrenals. These studies were carried out between 0800 and 1100 h afteran overnight fast with subjects supine. A catheter inserted into an an-tecubital vein was used for administration of insulin and sampling ofblood. Thirty minutes later, insulin was administered as an iv bolusinjection at a dose of 0.1 U/kg. Blood samples (10 mL) were obtainedimmediately before and at 30, 45, 120, and 180 min after the injection ofinsulin.
Infusions of 3H-labeled catecholamines
Infusions of 3H-labeled norepinephrine and epinephrine were carriedout in 13 patients with angina pectoris, 25 patients with congestive heartfailure, and 10 normal control subjects to examine production of meta-
nephrines from circulating catecholamines. All subjects were supineduring infusion of radiotracers. The radiotracers (L-2,5,6-[3H]norepi-nephrine, 40–60 Ci/mmol; L-N-methyl-[3H]epinephrine, 65–75 Ci/mmol; New England Nuclear Corp., Boston, MA) were infused simul-taneously into a forearm vein at 1.0–1.5 mCi/min. Blood samples weretaken at intervals between 15 and 146 min after the start of infusions.
Glucagon stimulation tests
Plasma concentrations of metanephrines and catecholamines wereexamined in six pheochromocytoma patients with a positive test resultto glucagon (i.e. a more than 3-fold increase in plasma norepinephrine)and one patient with a negative test result but a large increase in plasmaepinephrine. For this test, patients received a 1-mg iv bolus dose ofglucagon. Venous blood was sampled in the supine position immedi-ately before the bolus of glucagon and at 2 min after the bolus.
In the patient with the negative test result but the large increase inplasma epinephrine, blood was sampled at 5 min before and immedi-ately before the glucagon and at intervals of 1, 2, 3, 4, 5, 10, and 20 minafter glucagon. Two other blood samples were taken from this patienton 2 separate days preceding the day of the glucagon stimulation test.
Patient with paroxysmal hypertension
Blood samples were taken from an antecubital vein on three occasionsin one 42-yr-old female patient with a pheochromocytoma and parox-ysmal attacks of flushing, palpitations, and chest pain. On one occasiona blood sample was taken and measurements of blood pressure andheart rate were recorded when the patient was free of the above symp-toms. On a second occasion blood samples and hemodynamic measure-ments were taken during a paroxysmal attack lasting 10 min. On a thirdoccasion a blood sample was taken and hemodynamic measurementsrecorded within 10 min after the end of a paroxysmal attack.
Collection of blood and tissue samples
All blood samples were transferred into tubes containing an an-ticoagulant (heparin or EDTA) and immediately placed on ice untilcentrifuged (4 C) to separate the plasma. Plasma samples were storedat 280 C until assayed for concentrations of catecholamines andmetanephrines.
Samples of pheochromocytoma tissue were obtained within 40 minof removal of tumors from 34 patients. For comparison purposes inassays of COMT enzyme activity, samples of normal liver were obtainedfrom three patients who underwent partial hepatectomies. Samples ofnormal adrenal tissue were also obtained from another patient whounderwent an adrenalectomy for a small adrenal cortical adenoma.Samples of excised tissue were placed on ice immediately after removal,extraneous tissue removed, and small 50- to 400-mg pieces were dis-sected apart and placed on dry ice before storage at 280 C.
Plasma and tissue catecholamines and metanephrines
Plasma and tissue concentrations of catecholamines and metaneph-rines were quantified by liquid chromatography with electrochemicaldetection. Tissue concentrations were determined in weighed samplesof tissue that were homogenized in at least 5 vol 0.4 m perchloric acidwith 0.5 mm EDTA. Homogenized samples were centrifuged (1500 3 gfor 15 min at 4 C), and supernatants were collected and stored at 280C until assayed. Concentrations of catecholamines (norepinephrine andepinephrine) were determined after extraction from plasma or perchlo-ric acid tissue supernatants using alumina absorption as described pre-viously (14). Concentrations of metanephrines were determined usinga different liquid chromatography procedure after extraction onto solidphase ion exchange columns (7). Concentrations of 3H-labeled norepi-nephrine, epinephrine, normetanephrine, and metanephrine were de-termined by scintillation counting of mobile phase eluants collectedfrom the outlet of the electrochemical cell after separation by liquidchromatography.
Intraassay coefficients of variation (CVs) were 1.9% for norepineph-rine, 3.0% for epinephrine, 4.2% for normetanephrine, and 3.3% formetanephrine. Interassay CVs were 6.5% for norepinephrine, 11.4% forepinephrine, 6.5% for normetanephrine, and 5.7% for metanephrine.
2176 EISENHOFER ET AL. JCE & M • 1998Vol 83 • No 6

Western blot analysis of COMT
Antibody to human COMT, raised in guinea pig against purifiedrecombinant (Escherichia coli) soluble-COMT was kindly provided as agift by Dr. Ismo Ulmanen (Orion Corp., Orion Pharma, Espoo, Finland).The antibody is highly selective for human COMT and does not cross-react with rat COMT (our unpublished data). Samples of human pheo-chromocytoma, adrenal medulla and liver tissue were homogenized in2% SDS buffer (50 mm Tris, pH 6.8, 2.5% glycerol, 2% mercaptoethanol),boiled immediately for 10 min at 100 C, and then chilled for 5 min onice. Samples of tissue preparations, with equivalent amounts of proteins(15 mg), were resolved on a 12% SDS-polyacrylamide gel and transferredto nitrocellulose membranes using a Bio-Rad transblot apparatus (Bio-Rad, Hercules, CA). After transfer, nitrocellulose membranes wereblocked in Tris buffered saline (50 mm Tris, pH 7.4, 0.9% NaCl, 0.05%Tween-20 and 5% BSA) for 1 h. Nitrocellulose membranes were thenincubated for 1 h with antihuman COMT primary antibody at a 1:1000dilution. Membranes were then washed three times for 5 min with Trisbuffered saline and incubated for 45 min with secondary antibody(antiguinea pig IgG) conjugated to horseradish peroxidase at 1:20,000dilution. Detection of the two bands corresponding to the 30-kDamembrane-bound and 24-kDa soluble species of COMT was achievedby the enhanced chemiluminescence method.
COMT enzyme assay
Tissue samples (50–700 mg) were homogenized in at least 4 volphosphate buffer (50 mm sodium phosphate and 0.5 mm dithiothreitol,pH 7.5). Homogenates were centrifuged at 100,000 3 g for 30 min (4 C).Supernatant fractions were used for assays of soluble COMT activity,and the washed and resuspended pellets used for assays of membrane-bound COMT activity. The above method does not completely purify thetwo species of COMT (the supernatant fraction includes some of thelarger membrane form of the enzyme), but does provide fractions en-riched with either soluble or membrane-bound COMT.
COMT activity was assessed by incubation (37 C for 30 min) of 100mL tissue preparation in a total volume of 500 mL containing 50 mmsodium phosphate buffer (pH 7.5), 5 mm MgCl2, 2 mm S-adenosylme-thionine, and 0.4 mm 3,4-dihydroxybenzylamine as substrate (SigmaChemical Co., St. Louis, MO). The reaction was terminated by additionof 100 mL 2 m perchloric acid. Samples were then centrifuged at 1500 3g for 15 min to separate the supernatant, which was used for measure-ments of the 3-methoxy-4-hydroxybenzylamine (MHBA) producedfrom 3,4-dihydroxybenzylamine. Amounts of MHBA in 10-mL samplesof supernatant were determined by liquid chromatography with elec-trochemical detection. COMT activity was determined from the rate ofproduction of MHBA and expressed as picomole of MHBA producedper minute per milligram of protein. These activities were determinedunder saturating conditions of substrate and therefore represent max-imum velocity (Vmax) values. Division of these values by Michaelis-Menten affinity constant (Km) values previously determined by Lottaand colleagues (15) for human membrane-bound COMT (24.1 mm) andhuman soluble COMT (369 mm) provided additional estimates ofCOMT activity. The intra- and interassay CVs were 4.7% and 16.6%,respectively.
Immunohistochemistry
Localizations of COMT in different cells or the same cells wherecatecholamines are stored were examined by double staining of tissuesections with antibodies raised against COMT and against the vesicularmonoamine transporters 1 and 2 (VMAT-1 and VMAT-2). Samples ofpheochromocytoma tissue—frozen on dry ice soon after collection andstored at 280 C—were cut into 12-mm-thick sections using a Frigocut E2800 cryostat (Reichert, Heidelberg, Germany). The frozen sections weremounted onto silanized slides and fixed in 4% paraformaldehyde fix-ative for 10 min, followed by multiple washes in PBS. To decreasenonspecific staining, the fixed sections were incubated at room temper-ature in PBS (pH 7.4) with 0.6% Triton X-100 and 1% BSA (diluent) for30 min, and then washed in PBS. Primary antibody to COMT, raised inguinea pig (the same antibody used for Western blot analysis), wasdiluted 1:300 in the diluent described above. Primary antibodies toVMAT-1 and VMAT-2, raised in rabbits (Phoenix Pharmaceuticals,
Mountain View, CA), were both diluted to 1:2000. The use of theseantibodies in the immunohistochemical localization of VMAT-1 andVMAT-2 to endocrine cells and neurons has been documented previ-ously (16). Tissue sections were first incubated overnight at 4 C in theguinea pig antibody to COMT and then incubated for 1 h at roomtemperature in the rabbit antibody to either VMAT-1 or VMAT-2. Sec-tions were then incubated for consecutive 1-h periods at room temper-ature with a 1:2000 dilution of antiguinea pig IgG conjugated to CY3fluorochrome followed by 1:100 dilution of antirabbit IgG conjugated tofluorescein isothiocyanate (Jackson Immunologicals, West Grove, PA).After application of secondary antibodies, sections were washed indistilled water, air dried, and coverslipped using Cytoseal 60 mountingmedium (Stephens Scientific, Riverdale, NJ). Immunofluorescent label-ing was viewed with a Leitz Dialux 20 fluorescence microscope (Leitz,Wetzlar, Germany) using appropriate filters. Negative controls includedincubations in nonimmune mouse IgG or normal rabbit serum insteadof the primary antibody or incubations without primary and/or thesecondary antibodies.
Statistical analyses
The distributions of plasma and tumor tissue concentrations of cat-echolamines and metanephrines in patients with pheochromocytomawere highly skewed. Normal distributions were obtained after loga-rithmic transformation of the data. Mean values for these variables aretherefore provided as geometric means. Corresponding confidence in-tervals and standard errors were established from the normalized data.All other results for normally distributed data are expressed as arith-metic means 6 sem. Where data showed nonnormal distributions, sta-tistical tests of significance were carried out on normalized data. Thesetests included paired t tests and ANOVA for repeated measures withpost hoc tests carried out using Scheffe’s F test. Relationships betweentissue concentrations of catecholamines and metanephrines or betweentumor mass and plasma catecholamines or metanephrines were exam-ined by linear regression analysis, significance established using Pear-son’s correlation coefficient.
ResultsCOMT immunoblots
Western blot analysis showed two forms of COMT cor-responding to the larger 30-kDa membrane-bound form andthe smaller 25-kDa soluble form of the enzyme (Fig. 1). Bothsoluble and membrane-bound COMT were detected consis-
FIG. 1. Western blot analysis of membrane-bound and soluble formsof COMT in samples from six pheochromocytomas (PHEO 1–6), onesample of human liver, and one sample of normal human adrenalmedulla (AD MD). Positions of membrane-bound COMT (MB) andsoluble COMT (S) polypeptides are depicted on right and molecularmass standards on left. Amount of total protein used was 12 mg foreach sample.
METANEPHRINES IN PHEOCHROMOCYTOMA 2177
tently in pheochromocytoma tissue, with the membrane-bound form of the enzyme showing a much greater abun-dance than the soluble form. In a single sample of normaladrenal medulla, COMT was almost totally present in themembrane-bound form. Soluble and membrane-boundCOMT were also detected in human liver where the patternwas reversed with a considerably greater abundance of thesoluble over the membrane-bound form of the enzyme. Themembrane-bound form of COMT was considerably moreabundant in both adrenal medulla and pheochromocytomatissue than in liver.
COMT enzyme activity
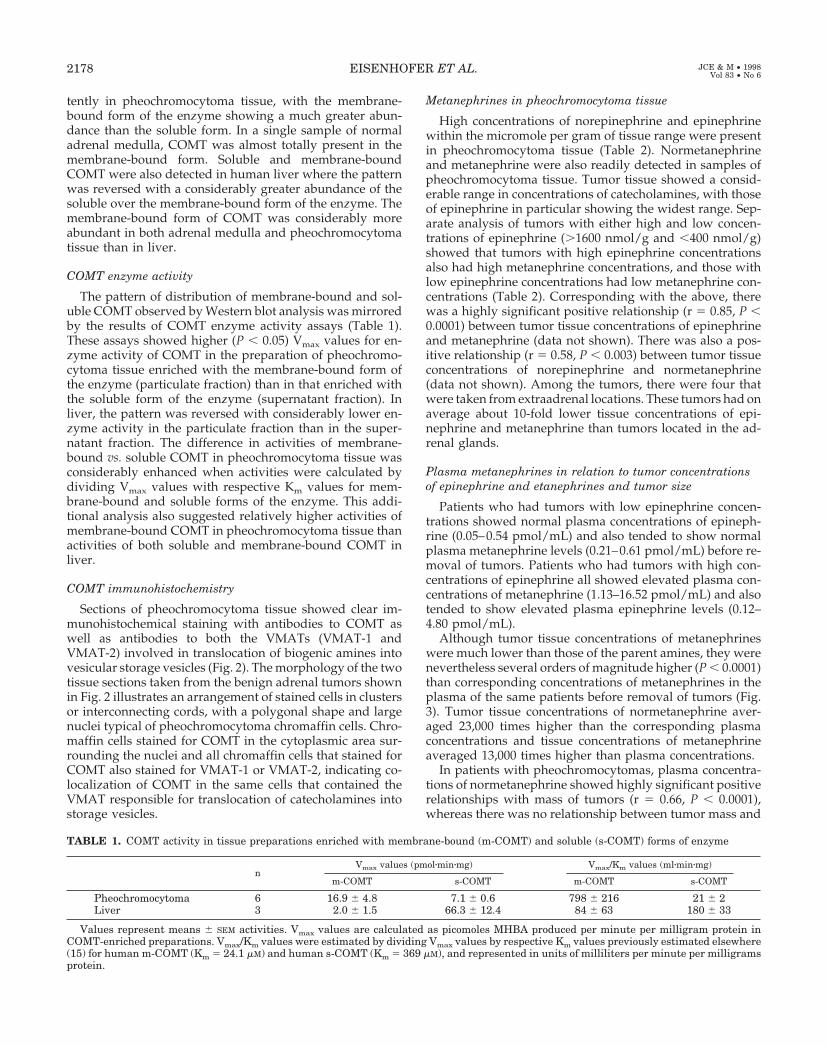
The pattern of distribution of membrane-bound and sol-uble COMT observed by Western blot analysis was mirroredby the results of COMT enzyme activity assays (Table 1).These assays showed higher (P , 0.05) Vmax values for en-zyme activity of COMT in the preparation of pheochromo-cytoma tissue enriched with the membrane-bound form ofthe enzyme (particulate fraction) than in that enriched withthe soluble form of the enzyme (supernatant fraction). Inliver, the pattern was reversed with considerably lower en-zyme activity in the particulate fraction than in the super-natant fraction. The difference in activities of membrane-bound vs. soluble COMT in pheochromocytoma tissue wasconsiderably enhanced when activities were calculated bydividing Vmax values with respective Km values for mem-brane-bound and soluble forms of the enzyme. This addi-tional analysis also suggested relatively higher activities ofmembrane-bound COMT in pheochromocytoma tissue thanactivities of both soluble and membrane-bound COMT inliver.
COMT immunohistochemistry
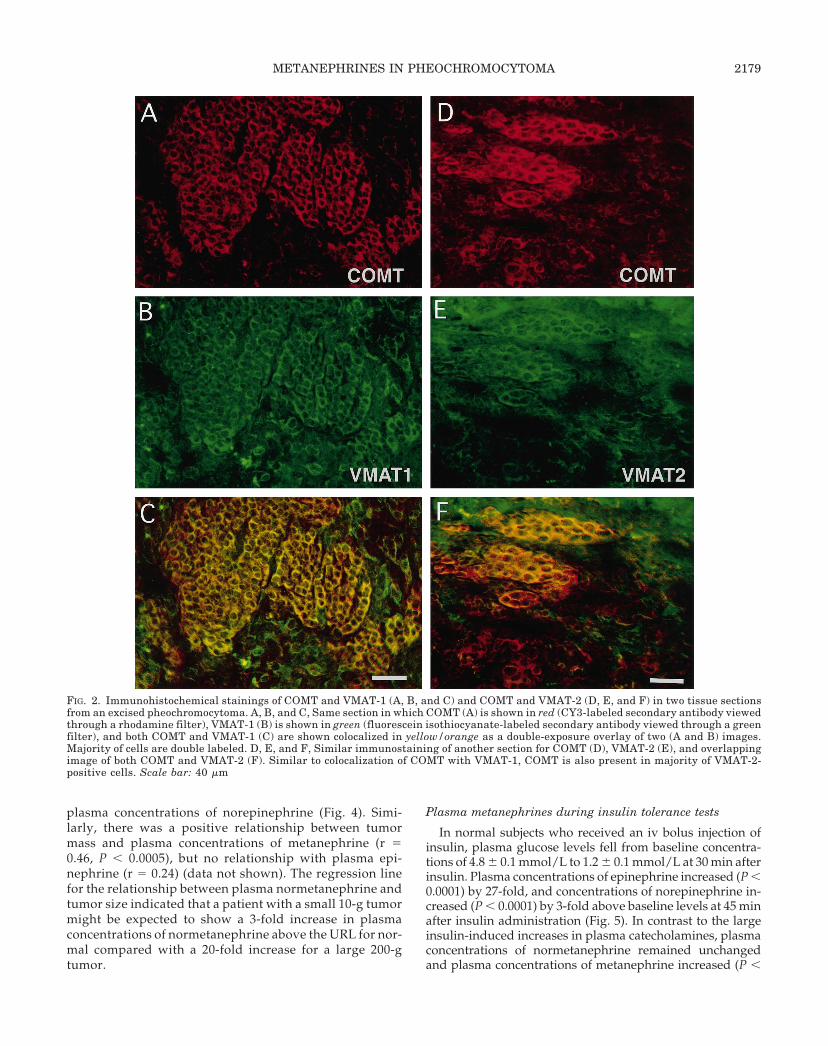
Sections of pheochromocytoma tissue showed clear im-munohistochemical staining with antibodies to COMT aswell as antibodies to both the VMATs (VMAT-1 andVMAT-2) involved in translocation of biogenic amines intovesicular storage vesicles (Fig. 2). The morphology of the twotissue sections taken from the benign adrenal tumors shownin Fig. 2 illustrates an arrangement of stained cells in clustersor interconnecting cords, with a polygonal shape and largenuclei typical of pheochromocytoma chromaffin cells. Chro-maffin cells stained for COMT in the cytoplasmic area sur-rounding the nuclei and all chromaffin cells that stained forCOMT also stained for VMAT-1 or VMAT-2, indicating co-localization of COMT in the same cells that contained theVMAT responsible for translocation of catecholamines intostorage vesicles.
Metanephrines in pheochromocytoma tissue
High concentrations of norepinephrine and epinephrinewithin the micromole per gram of tissue range were presentin pheochromocytoma tissue (Table 2). Normetanephrineand metanephrine were also readily detected in samples ofpheochromocytoma tissue. Tumor tissue showed a consid-erable range in concentrations of catecholamines, with thoseof epinephrine in particular showing the widest range. Sep-arate analysis of tumors with either high and low concen-trations of epinephrine (.1600 nmol/g and ,400 nmol/g)showed that tumors with high epinephrine concentrationsalso had high metanephrine concentrations, and those withlow epinephrine concentrations had low metanephrine con-centrations (Table 2). Corresponding with the above, therewas a highly significant positive relationship (r 5 0.85, P ,0.0001) between tumor tissue concentrations of epinephrineand metanephrine (data not shown). There was also a pos-itive relationship (r 5 0.58, P , 0.003) between tumor tissueconcentrations of norepinephrine and normetanephrine(data not shown). Among the tumors, there were four thatwere taken from extraadrenal locations. These tumors had onaverage about 10-fold lower tissue concentrations of epi-nephrine and metanephrine than tumors located in the ad-renal glands.
Plasma metanephrines in relation to tumor concentrationsof epinephrine and etanephrines and tumor size
Patients who had tumors with low epinephrine concen-trations showed normal plasma concentrations of epineph-rine (0.05–0.54 pmol/mL) and also tended to show normalplasma metanephrine levels (0.21–0.61 pmol/mL) before re-moval of tumors. Patients who had tumors with high con-centrations of epinephrine all showed elevated plasma con-centrations of metanephrine (1.13–16.52 pmol/mL) and alsotended to show elevated plasma epinephrine levels (0.12–4.80 pmol/mL).
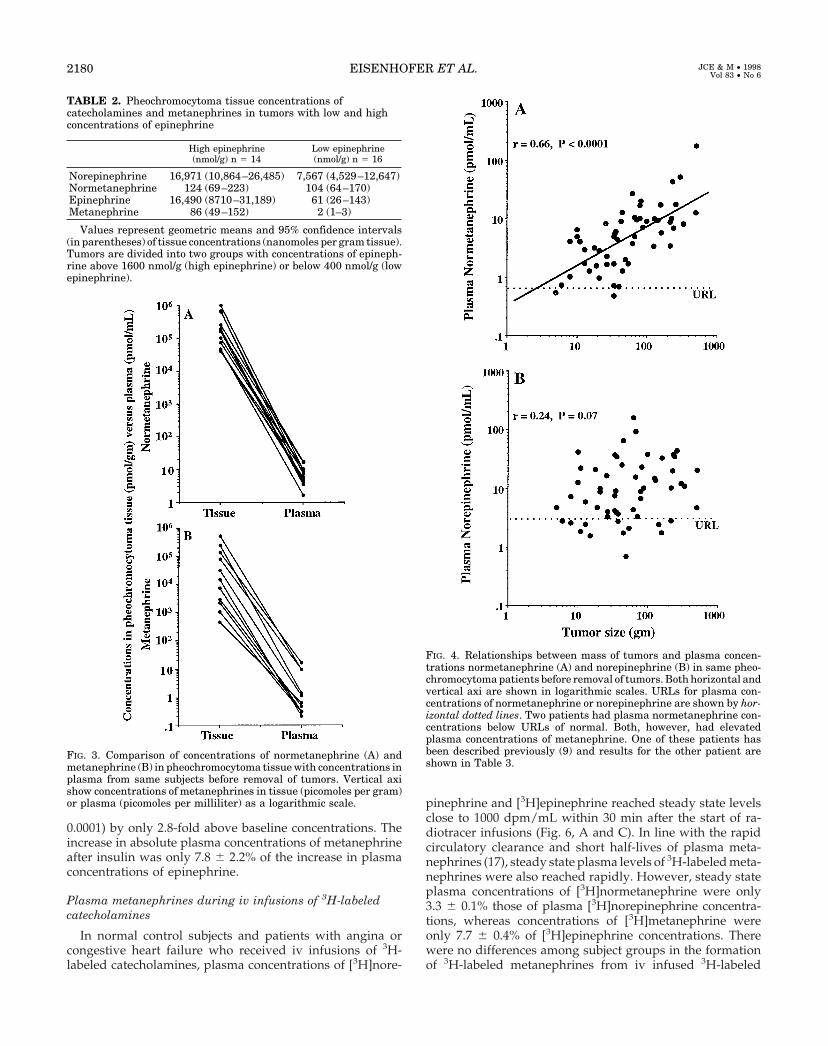
Although tumor tissue concentrations of metanephrineswere much lower than those of the parent amines, they werenevertheless several orders of magnitude higher (P , 0.0001)than corresponding concentrations of metanephrines in theplasma of the same patients before removal of tumors (Fig.3). Tumor tissue concentrations of normetanephrine aver-aged 23,000 times higher than the corresponding plasmaconcentrations and tissue concentrations of metanephrineaveraged 13,000 times higher than plasma concentrations.
In patients with pheochromocytomas, plasma concentra-tions of normetanephrine showed highly significant positiverelationships with mass of tumors (r 5 0.66, P , 0.0001),whereas there was no relationship between tumor mass and
TABLE 1. COMT activity in tissue preparations enriched with membrane-bound (m-COMT) and soluble (s-COMT) forms of enzyme
nVmax values (pmolzminzmg) Vmax/Km values (mlzminzmg)
m-COMT s-COMT m-COMT s-COMT
Pheochromocytoma 6 16.9 6 4.8 7.1 6 0.6 798 6 216 21 6 2Liver 3 2.0 6 1.5 66.3 6 12.4 84 6 63 180 6 33
Values represent means 6 SEM activities. Vmax values are calculated as picomoles MHBA produced per minute per milligram protein inCOMT-enriched preparations. Vmax/Km values were estimated by dividing Vmax values by respective Km values previously estimated elsewhere(15) for human m-COMT (Km 5 24.1 mM) and human s-COMT (Km 5 369 mM), and represented in units of milliliters per minute per milligramsprotein.
2178 EISENHOFER ET AL. JCE & M • 1998Vol 83 • No 6
plasma concentrations of norepinephrine (Fig. 4). Simi-larly, there was a positive relationship between tumormass and plasma concentrations of metanephrine (r 50.46, P , 0.0005), but no relationship with plasma epi-nephrine (r 5 0.24) (data not shown). The regression linefor the relationship between plasma normetanephrine andtumor size indicated that a patient with a small 10-g tumormight be expected to show a 3-fold increase in plasmaconcentrations of normetanephrine above the URL for nor-mal compared with a 20-fold increase for a large 200-gtumor.
Plasma metanephrines during insulin tolerance tests
In normal subjects who received an iv bolus injection ofinsulin, plasma glucose levels fell from baseline concentra-tions of 4.8 6 0.1 mmol/L to 1.2 6 0.1 mmol/L at 30 min afterinsulin. Plasma concentrations of epinephrine increased (P ,0.0001) by 27-fold, and concentrations of norepinephrine in-creased (P , 0.0001) by 3-fold above baseline levels at 45 minafter insulin administration (Fig. 5). In contrast to the largeinsulin-induced increases in plasma catecholamines, plasmaconcentrations of normetanephrine remained unchangedand plasma concentrations of metanephrine increased (P ,
FIG. 2. Immunohistochemical stainings of COMT and VMAT-1 (A, B, and C) and COMT and VMAT-2 (D, E, and F) in two tissue sectionsfrom an excised pheochromocytoma. A, B, and C, Same section in which COMT (A) is shown in red (CY3-labeled secondary antibody viewedthrough a rhodamine filter), VMAT-1 (B) is shown in green (fluorescein isothiocyanate-labeled secondary antibody viewed through a greenfilter), and both COMT and VMAT-1 (C) are shown colocalized in yellow/orange as a double-exposure overlay of two (A and B) images.Majority of cells are double labeled. D, E, and F, Similar immunostaining of another section for COMT (D), VMAT-2 (E), and overlappingimage of both COMT and VMAT-2 (F). Similar to colocalization of COMT with VMAT-1, COMT is also present in majority of VMAT-2-positive cells. Scale bar: 40 mm
METANEPHRINES IN PHEOCHROMOCYTOMA 2179
0.0001) by only 2.8-fold above baseline concentrations. Theincrease in absolute plasma concentrations of metanephrineafter insulin was only 7.8 6 2.2% of the increase in plasmaconcentrations of epinephrine.
Plasma metanephrines during iv infusions of 3H-labeledcatecholamines
In normal control subjects and patients with angina orcongestive heart failure who received iv infusions of 3H-labeled catecholamines, plasma concentrations of [3H]nore-
pinephrine and [3H]epinephrine reached steady state levelsclose to 1000 dpm/mL within 30 min after the start of ra-diotracer infusions (Fig. 6, A and C). In line with the rapidcirculatory clearance and short half-lives of plasma meta-nephrines (17), steady state plasma levels of 3H-labeled meta-nephrines were also reached rapidly. However, steady stateplasma concentrations of [3H]normetanephrine were only3.3 6 0.1% those of plasma [3H]norepinephrine concentra-tions, whereas concentrations of [3H]metanephrine wereonly 7.7 6 0.4% of [3H]epinephrine concentrations. Therewere no differences among subject groups in the formationof 3H-labeled metanephrines from iv infused 3H-labeled
FIG. 3. Comparison of concentrations of normetanephrine (A) andmetanephrine (B) in pheochromocytoma tissue with concentrations inplasma from same subjects before removal of tumors. Vertical axishow concentrations of metanephrines in tissue (picomoles per gram)or plasma (picomoles per milliliter) as a logarithmic scale.
FIG. 4. Relationships between mass of tumors and plasma concen-trations normetanephrine (A) and norepinephrine (B) in same pheo-chromocytoma patients before removal of tumors. Both horizontal andvertical axi are shown in logarithmic scales. URLs for plasma con-centrations of normetanephrine or norepinephrine are shown by hor-izontal dotted lines. Two patients had plasma normetanephrine con-centrations below URLs of normal. Both, however, had elevatedplasma concentrations of metanephrine. One of these patients hasbeen described previously (9) and results for the other patient areshown in Table 3.
TABLE 2. Pheochromocytoma tissue concentrations ofcatecholamines and metanephrines in tumors with low and highconcentrations of epinephrine
High epinephrine(nmol/g) n 5 14
Low epinephrine(nmol/g) n 5 16
Norepinephrine 16,971 (10,864–26,485) 7,567 (4,529–12,647)Normetanephrine 124 (69–223) 104 (64–170)Epinephrine 16,490 (8710–31,189) 61 (26–143)Metanephrine 86 (49–152) 2 (1–3)
Values represent geometric means and 95% confidence intervals(in parentheses) of tissue concentrations (nanomoles per gram tissue).Tumors are divided into two groups with concentrations of epineph-rine above 1600 nmol/g (high epinephrine) or below 400 nmol/g (lowepinephrine).
2180 EISENHOFER ET AL. JCE & M • 1998Vol 83 • No 6

catecholamines as reflected by steady state ratios of plasma3H-labeled metanephrines to catecholamines.
Plasma metanephrines during glucagon stimulation
In six pheochromocytoma patients who showed a pos-itive glucagon-stimulation test result for the presence of atumor (.3-fold increase in plasma norepinephrine),plasma norepinephrine and epinephrine concentrationsboth increased (P , 0.005) by an average of 7-fold abovebaseline values (Fig. 7, A and C). Despite these large in-creases in plasma catecholamines, plasma concentrationsof normetanephrine and metanephrine showed littlechange and were not consistently elevated by glucagon(Fig. 7, B and D).
In one patient with a pheochromocytoma in whomblood was sampled over 3 days and at repeated intervalsbefore and for 20 min after glucagon, there was no increasein plasma norepinephrine after glucagon (negative testresult), but there was a large 10-fold increase in plasmaepinephrine peaking at 2 min after glucagon (Fig. 7, F andG). The 10-fold increase in plasma epinephrine was asso-
ciated with a transient small (,20% above baseline) in-crease in plasma metanephrine peaking at 2–3 min afterglucagon. This nonsymptomatic patient, with multiple en-docrine neoplasia type II syndrome, was diagnosed bychance with an adrenal pheochromocytoma following rou-tine work-up for another condition. The patient repeatedlyhad normal plasma concentrations of norepinephrine onthe 1st and 3rd days of blood sampling and normal base-line concentrations of epinephrine on all 3 days of bloodsampling. Despite these normal plasma levels of cat-
FIG. 5. Plasma concentrations (mean 6 SEM) of epinephrine andmetanephrine (A) and of norepinephrine and normetanephrine (B)before and at intervals after iv bolus injection of insulin in sevennormal subjects. Time of injection of insulin is denoted by dottedvertical line and arrow. E, epinephrine; MN, metanephrine; NE,norepinephrine; NMN, normetanephrine. *, Denotes a significantlyhigher concentration than that before insulin and at 180 min afterinsulin.
FIG. 6. Comparison of formation metanephrines from iv infused3H-labeled catecholamines in subjects without pheochromocytoma(A and C) with formation of metanephrines from catecholamines inpatients with pheochromocytoma (B and D). Steady state plasmalevels of [3H]normetanephrine ([3H]NMN) formed from iv infused[3H]norepinephrine ([3H]NE) were only 3.3 6 0.1% those of plasma[3H]norepinephrine concentrations (A) and steady state plasmalevels of [3H]metanephrine ([3H]MN) formed from iv infused[3H]epinephrine ([3H]E) were only 7.7 6 0.4% those of plasma[3H]epinephrine concentrations (C). Dashed horizontal arrowsshow small amounts of plasma normetanephrine (NMN) or meta-nephrine (MN) expected to be derived from metabolism of norepi-nephrine (NE) or epinephrine (E) released into circulation of pa-tients with pheochromocytoma (solid portions of bars). Thisassumes similar formation of metanephrines from circulating cat-echolamines as shown in A and C for subjects without pheochro-mocytoma (see Fig. 7 and Table 3 for validity). Large amounts ofplasma normetanephrine or metanephrine not accounted for bymetabolism of norepinephrine or epinephrine released into circu-lation are shown by percent values in solid blocks bounded byvertical arrows. These amounts represent proportions of normeta-nephrine or metanephrine derived from metabolism of norepineph-rine (93.9%) or epinephrine (97.7%) before and not after release ofcatecholamines into circulation of patients with pheochromocy-toma (i.e. presumably amounts derived from metabolism withintumors).
METANEPHRINES IN PHEOCHROMOCYTOMA 2181
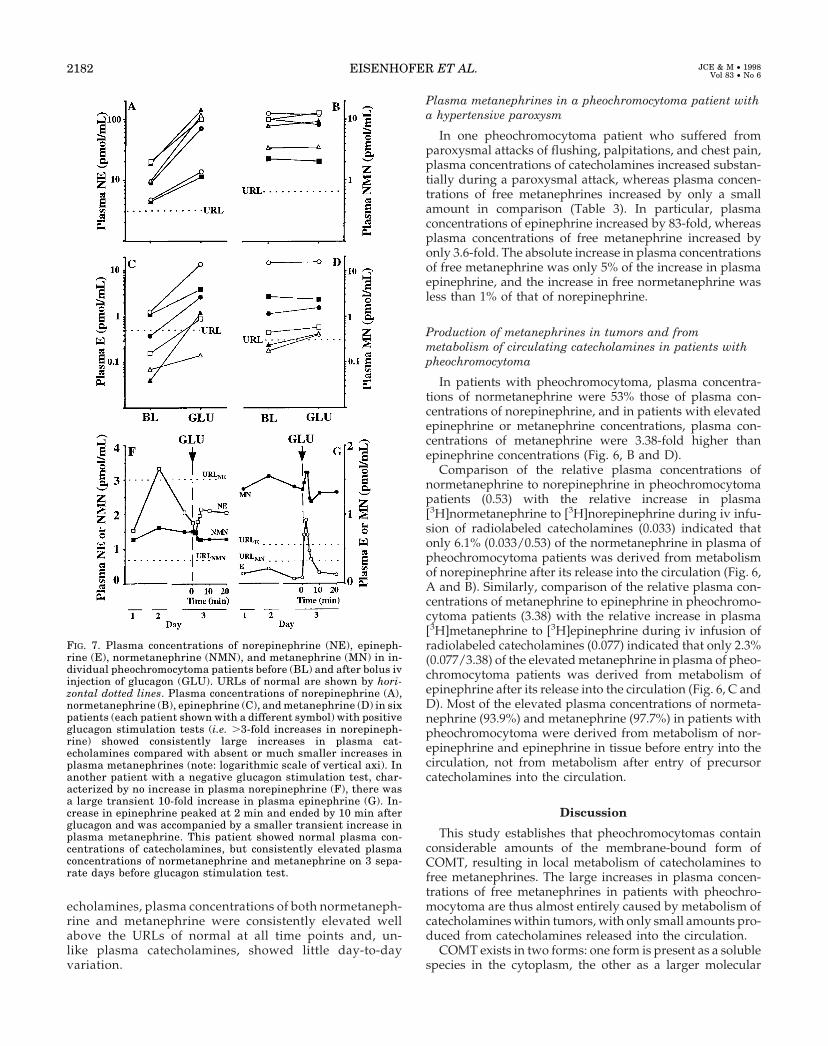
echolamines, plasma concentrations of both normetaneph-rine and metanephrine were consistently elevated wellabove the URLs of normal at all time points and, un-like plasma catecholamines, showed little day-to-dayvariation.
Plasma metanephrines in a pheochromocytoma patient witha hypertensive paroxysm
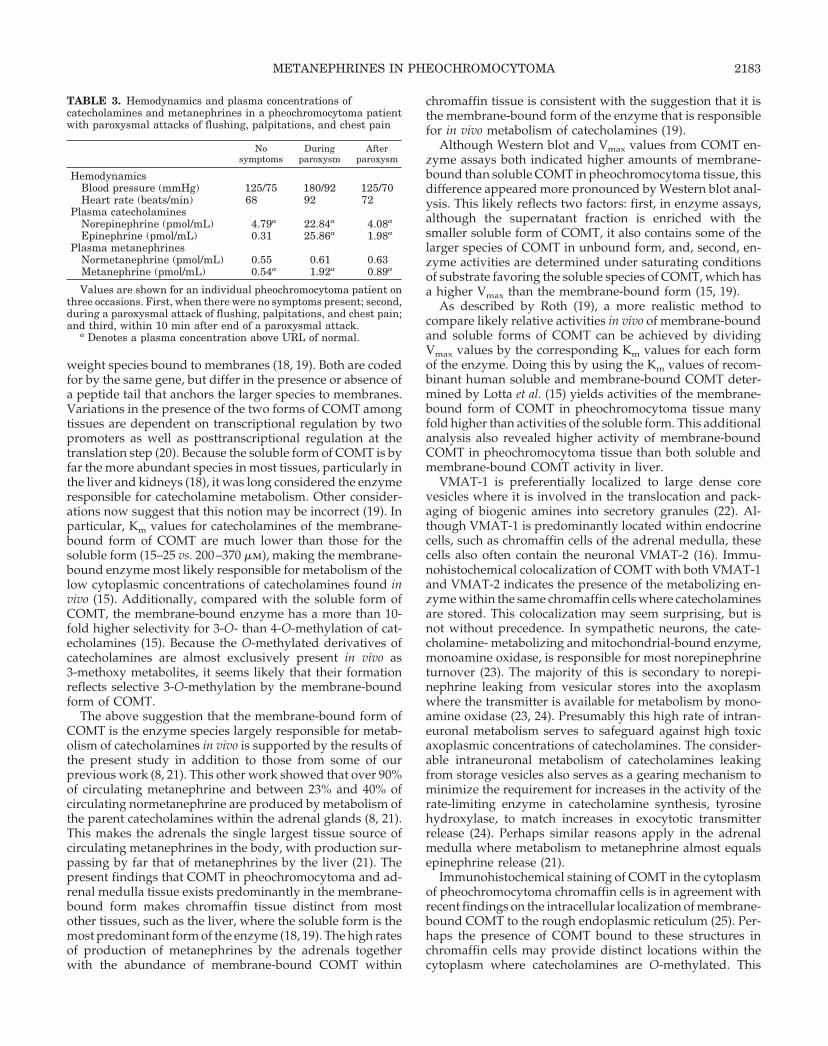
In one pheochromocytoma patient who suffered fromparoxysmal attacks of flushing, palpitations, and chest pain,plasma concentrations of catecholamines increased substan-tially during a paroxysmal attack, whereas plasma concen-trations of free metanephrines increased by only a smallamount in comparison (Table 3). In particular, plasmaconcentrations of epinephrine increased by 83-fold, whereasplasma concentrations of free metanephrine increased byonly 3.6-fold. The absolute increase in plasma concentrationsof free metanephrine was only 5% of the increase in plasmaepinephrine, and the increase in free normetanephrine wasless than 1% of that of norepinephrine.
Production of metanephrines in tumors and frommetabolism of circulating catecholamines in patients withpheochromocytoma
In patients with pheochromocytoma, plasma concentra-tions of normetanephrine were 53% those of plasma con-centrations of norepinephrine, and in patients with elevatedepinephrine or metanephrine concentrations, plasma con-centrations of metanephrine were 3.38-fold higher thanepinephrine concentrations (Fig. 6, B and D).
Comparison of the relative plasma concentrations ofnormetanephrine to norepinephrine in pheochromocytomapatients (0.53) with the relative increase in plasma[3H]normetanephrine to [3H]norepinephrine during iv infu-sion of radiolabeled catecholamines (0.033) indicated thatonly 6.1% (0.033/0.53) of the normetanephrine in plasma ofpheochromocytoma patients was derived from metabolismof norepinephrine after its release into the circulation (Fig. 6,A and B). Similarly, comparison of the relative plasma con-centrations of metanephrine to epinephrine in pheochromo-cytoma patients (3.38) with the relative increase in plasma[3H]metanephrine to [3H]epinephrine during iv infusion ofradiolabeled catecholamines (0.077) indicated that only 2.3%(0.077/3.38) of the elevated metanephrine in plasma of pheo-chromocytoma patients was derived from metabolism ofepinephrine after its release into the circulation (Fig. 6, C andD). Most of the elevated plasma concentrations of normeta-nephrine (93.9%) and metanephrine (97.7%) in patients withpheochromocytoma were derived from metabolism of nor-epinephrine and epinephrine in tissue before entry into thecirculation, not from metabolism after entry of precursorcatecholamines into the circulation.
Discussion
This study establishes that pheochromocytomas containconsiderable amounts of the membrane-bound form ofCOMT, resulting in local metabolism of catecholamines tofree metanephrines. The large increases in plasma concen-trations of free metanephrines in patients with pheochro-mocytoma are thus almost entirely caused by metabolism ofcatecholamines within tumors, with only small amounts pro-duced from catecholamines released into the circulation.
COMT exists in two forms: one form is present as a solublespecies in the cytoplasm, the other as a larger molecular
FIG. 7. Plasma concentrations of norepinephrine (NE), epineph-rine (E), normetanephrine (NMN), and metanephrine (MN) in in-dividual pheochromocytoma patients before (BL) and after bolus ivinjection of glucagon (GLU). URLs of normal are shown by hori-zontal dotted lines. Plasma concentrations of norepinephrine (A),normetanephrine (B), epinephrine (C), and metanephrine (D) in sixpatients (each patient shown with a different symbol) with positiveglucagon stimulation tests (i.e. .3-fold increases in norepineph-rine) showed consistently large increases in plasma cat-echolamines compared with absent or much smaller increases inplasma metanephrines (note: logarithmic scale of vertical axi). Inanother patient with a negative glucagon stimulation test, char-acterized by no increase in plasma norepinephrine (F), there wasa large transient 10-fold increase in plasma epinephrine (G). In-crease in epinephrine peaked at 2 min and ended by 10 min afterglucagon and was accompanied by a smaller transient increase inplasma metanephrine. This patient showed normal plasma con-centrations of catecholamines, but consistently elevated plasmaconcentrations of normetanephrine and metanephrine on 3 sepa-rate days before glucagon stimulation test.
2182 EISENHOFER ET AL. JCE & M • 1998Vol 83 • No 6
weight species bound to membranes (18, 19). Both are codedfor by the same gene, but differ in the presence or absence ofa peptide tail that anchors the larger species to membranes.Variations in the presence of the two forms of COMT amongtissues are dependent on transcriptional regulation by twopromoters as well as posttranscriptional regulation at thetranslation step (20). Because the soluble form of COMT is byfar the more abundant species in most tissues, particularly inthe liver and kidneys (18), it was long considered the enzymeresponsible for catecholamine metabolism. Other consider-ations now suggest that this notion may be incorrect (19). Inparticular, Km values for catecholamines of the membrane-bound form of COMT are much lower than those for thesoluble form (15–25 vs. 200–370 mm), making the membrane-bound enzyme most likely responsible for metabolism of thelow cytoplasmic concentrations of catecholamines found invivo (15). Additionally, compared with the soluble form ofCOMT, the membrane-bound enzyme has a more than 10-fold higher selectivity for 3-O- than 4-O-methylation of cat-echolamines (15). Because the O-methylated derivatives ofcatecholamines are almost exclusively present in vivo as3-methoxy metabolites, it seems likely that their formationreflects selective 3-O-methylation by the membrane-boundform of COMT.
The above suggestion that the membrane-bound form ofCOMT is the enzyme species largely responsible for metab-olism of catecholamines in vivo is supported by the results ofthe present study in addition to those from some of ourprevious work (8, 21). This other work showed that over 90%of circulating metanephrine and between 23% and 40% ofcirculating normetanephrine are produced by metabolism ofthe parent catecholamines within the adrenal glands (8, 21).This makes the adrenals the single largest tissue source ofcirculating metanephrines in the body, with production sur-passing by far that of metanephrines by the liver (21). Thepresent findings that COMT in pheochromocytoma and ad-renal medulla tissue exists predominantly in the membrane-bound form makes chromaffin tissue distinct from mostother tissues, such as the liver, where the soluble form is themost predominant form of the enzyme (18, 19). The high ratesof production of metanephrines by the adrenals togetherwith the abundance of membrane-bound COMT within
chromaffin tissue is consistent with the suggestion that it isthe membrane-bound form of the enzyme that is responsiblefor in vivo metabolism of catecholamines (19).
Although Western blot and Vmax values from COMT en-zyme assays both indicated higher amounts of membrane-bound than soluble COMT in pheochromocytoma tissue, thisdifference appeared more pronounced by Western blot anal-ysis. This likely reflects two factors: first, in enzyme assays,although the supernatant fraction is enriched with thesmaller soluble form of COMT, it also contains some of thelarger species of COMT in unbound form, and, second, en-zyme activities are determined under saturating conditionsof substrate favoring the soluble species of COMT, which hasa higher Vmax than the membrane-bound form (15, 19).
As described by Roth (19), a more realistic method tocompare likely relative activities in vivo of membrane-boundand soluble forms of COMT can be achieved by dividingVmax values by the corresponding Km values for each formof the enzyme. Doing this by using the Km values of recom-binant human soluble and membrane-bound COMT deter-mined by Lotta et al. (15) yields activities of the membrane-bound form of COMT in pheochromocytoma tissue manyfold higher than activities of the soluble form. This additionalanalysis also revealed higher activity of membrane-boundCOMT in pheochromocytoma tissue than both soluble andmembrane-bound COMT activity in liver.
VMAT-1 is preferentially localized to large dense corevesicles where it is involved in the translocation and pack-aging of biogenic amines into secretory granules (22). Al-though VMAT-1 is predominantly located within endocrinecells, such as chromaffin cells of the adrenal medulla, thesecells also often contain the neuronal VMAT-2 (16). Immu-nohistochemical colocalization of COMT with both VMAT-1and VMAT-2 indicates the presence of the metabolizing en-zyme within the same chromaffin cells where catecholaminesare stored. This colocalization may seem surprising, but isnot without precedence. In sympathetic neurons, the cate-cholamine- metabolizing and mitochondrial-bound enzyme,monoamine oxidase, is responsible for most norepinephrineturnover (23). The majority of this is secondary to norepi-nephrine leaking from vesicular stores into the axoplasmwhere the transmitter is available for metabolism by mono-amine oxidase (23, 24). Presumably this high rate of intran-euronal metabolism serves to safeguard against high toxicaxoplasmic concentrations of catecholamines. The consider-able intraneuronal metabolism of catecholamines leakingfrom storage vesicles also serves as a gearing mechanism tominimize the requirement for increases in the activity of therate-limiting enzyme in catecholamine synthesis, tyrosinehydroxylase, to match increases in exocytotic transmitterrelease (24). Perhaps similar reasons apply in the adrenalmedulla where metabolism to metanephrine almost equalsepinephrine release (21).
Immunohistochemical staining of COMT in the cytoplasmof pheochromocytoma chromaffin cells is in agreement withrecent findings on the intracellular localization of membrane-bound COMT to the rough endoplasmic reticulum (25). Per-haps the presence of COMT bound to these structures inchromaffin cells may provide distinct locations within thecytoplasm where catecholamines are O-methylated. This
TABLE 3. Hemodynamics and plasma concentrations ofcatecholamines and metanephrines in a pheochromocytoma patientwith paroxysmal attacks of flushing, palpitations, and chest pain
Nosymptoms
Duringparoxysm
Afterparoxysm
HemodynamicsBlood pressure (mmHg) 125/75 180/92 125/70Heart rate (beats/min) 68 92 72
Plasma catecholaminesNorepinephrine (pmol/mL) 4.79a 22.84a 4.08a
Epinephrine (pmol/mL) 0.31 25.86a 1.98a
Plasma metanephrinesNormetanephrine (pmol/mL) 0.55 0.61 0.63Metanephrine (pmol/mL) 0.54a 1.92a 0.89a
Values are shown for an individual pheochromocytoma patient onthree occasions. First, when there were no symptoms present; second,during a paroxysmal attack of flushing, palpitations, and chest pain;and third, within 10 min after end of a paroxysmal attack.
a Denotes a plasma concentration above URL of normal.
METANEPHRINES IN PHEOCHROMOCYTOMA 2183
may serve to compartmentalize intracellular sites of cate-cholamine metabolism away from those of synthesis andstorage.
Apart from the presence in tumor tissue of membrane-bound COMT, the capacity of COMT in pheochromocytomasto metabolize catecholamines is also reflected by the highconcentrations of metanephrines in tumor tissue. Althoughthese concentrations are less than 2% those of the parentamines, it must be recognized that catecholamines are se-questered in chromaffin granules at concentrations 104–105
times higher than those in the cytoplasm (26), where they areavailable for metabolism by COMT. The high tissue levels ofmetanephrines in pheochromocytomas are in agreementwith previous findings (27–29). However, the additionalfindings of the present study that these levels are over 10,000times higher than plasma concentrations of metanephrinesillustrate how these high tissue levels may easily make amajor contribution to the elevated levels of plasma meta-nephrines found in patients with pheochromocytoma.
Estimation of the proportion of circulating metanephrinesproduced from metabolism of catecholamines released intothe circulation can be achieved by examination of the pro-duction of metanephrines from iv infused catecholamines orfrom catecholamines released directly into the circulation bythe adrenals (30). The results of the insulin tolerance testsshowed that plasma metanephrines are relatively insensitiveto large increases in adrenal release of catecholamines, withthe increase in plasma metanephrine only 7.8% that of theincrease in plasma epinephrine. This result is remarkablyclose to the findings during iv infusions of 3H-labeled cat-echolamines, where the increase in plasma [3H]metaneph-rine was 7.7% of the increase in [3H]epinephrine. Assumingsimilar metabolism of circulating catecholamines in patientswith pheochromocytoma (an assumption dealt with in theparagraph below), if all the metanephrine in plasma wasderived from epinephrine released into the circulation, thenplasma concentrations of metanephrine would be expectedto be close to 8% of those of epinephrine. Instead, the elevatedplasma concentrations of metanephrine in patients withpheochromocytoma were over 200% higher than concentra-tions of epinephrine. A similar situation was observed fornormetanephrine indicating that only small proportions ofboth plasma-free normetanephrine (,7%) and metanephrine(,3%) are derived from metabolism of catecholamines aftertheir release into the circulation from pheochromocytomas.
The independence of metanephrine production on metab-olism of catecholamines released into the circulation fromtumors was further illustrated by the relative lack of increasein plasma metanephrines after glucagon in patients with apositive glucagon stimulation test characterized by large in-creases in plasma catecholamines. Similarly, in one patientwith an episodically active tumor, plasma concentrations ofnorepinephrine increased by nearly 5-fold and epinephrineby more than 80-fold during a paroxysmal hypertensive at-tack. Despite these large increases, plasma concentrations offree metanephrine increased by only 6% of the increase inepinephrine, and plasma concentrations of free normeta-nephrine remained stable. The relative increases in plasmafree metanephrines after increased catecholamine releaseinto the circulation in patients with pheochromocytoma were
slight and thus similar to those in normal subjects duringinsulin tolerance tests and iv infusions of catecholamines.This indicates little difference in metabolism of circulatingcatecholamines that could account for the high plasma con-centrations of free metanephrines relative to catecholaminesin patients with pheochromocytoma. Thus, in patients withpheochromocytoma, more than 93% of the free normeta-nephrine and 97% of the free metanephrine in plasma arederived from metabolism of catecholamines before releaseinto the circulation, almost all of this representing metabo-lism within tumors.
A similar conclusion to the above was reached by Croutand Sjoerdsma (29) many years ago when they observed thatthe urinary excretion of catecholamines and their metabolitesin patients with pheochromocytoma showed a completelydifferent profile from that in subjects receiving iv infusionsof catecholamines. These investigators also showed that tu-mor size was not a determinant of catecholamine excretion,but did influence the excretion of catecholamine metabolites.Similarly, in the present study highly significant positiverelationships between tumor size and plasma concentrationsof free metanephrines contrasted with complete lack of re-lationships between tumor size and plasma concentrations ofcatecholamines. These findings provide further evidence forthe independence of elevations in plasma levels of meta-nephrines on catecholamine release from pheochromocyto-mas. More importantly, the findings also show how the mag-nitude of increases in plasma free metanephrines abovenormal can provide information about tumor size, whereaselevations in catecholamines do not.
Although the above analysis establishes that elevated cir-culating levels of free metanephrines in patients with pheo-chromocytoma are largely produced independently of cat-echolamine release from tumors, this does not in itselfexplain why plasma free metanephrines should provide abetter diagnostic test for a tumor than the parent aminesthemselves. A plausible explanation, however, follows fromother findings that a proportion of patients with pheochro-mocytoma harbor tumors that are nonfunctional or quiescentand do not secrete catecholamines or secrete catecholaminesepisodically (10–13). In these patients, plasma and urinarycatecholamines typically yield false negative tests. In con-trast, plasma free metanephrines (normetanephrine or meta-nephrine) appear to be much more consistently elevated (9),indicating that even when tumors are not secreting cat-echolamines, they are actively metabolizing catecholaminesto the free metanephrines. An example of a catecholamineproducing and metabolizing, yet nonsecreting tumor, is il-lustrated by the present results for the patient shown in Fig.7, F and G. This patient, with multiple endocrine neoplasiatype II syndrome, was only diagnosed with a tumor after aroutine computed tomography (CT) scan revealed an adre-nal lesion. Plasma catecholamines were normal or nearnormal in every sample, whereas plasma concentrations ofnormetanephrine and metanephrine were both consistentlyelevated well above the URLs of normal in each of 11 separatesamples taken over the course of 3 separate days. Clearly thispatient had a tumor that produced and metabolizedcatecholamines to metanephrines, but did not secrete
2184 EISENHOFER ET AL. JCE & M • 1998Vol 83 • No 6

catecholamines into the bloodstream in amounts sufficient tocause a positive test result.
In conclusion, the present study shows that pheochromo-cytomas have an unusually higher content of the membrane-bound than the soluble form of COMT. However, it appearsthat the membrane-bound and not the soluble form of COMTis the enzyme species responsible for metabolism of cat-echolamines in vivo. The high content of membrane-boundCOMT in the same tumor cells where catecholamines aresynthesized and stored leads to considerable production offree metanephrines within pheochromocytomas. Thus, theelevated plasma levels of free metanephrines in patients withpheochromocytoma are produced independently of cate-cholamine release by tumors. Because some tumors are qui-escent or nonfunctional and do not readily or continuallysecrete catecholamines, measurements of free metanephrinesprovide a more reliable marker for the presence of a pheo-chromocytoma than do the parent amines.
Acknowledgments
We are grateful Ms. Courtney Holmes, Ms. Anneli Ambring, Mr.Jacques J. Willemson, and Mr. Douglas Hooper for expert technicalassistance; and Dr. Albert Verhofstad, Ms. Joan Folio, RN, and Ms. JanetWard Sakol, RN, MSN for assistance in obtaining patient samples andinformation from patient records. Thanks are also extended to the manyclinicians and their patients who participated in this study.
References
1. Bravo EL, Tarazi RC, Gifford RW, Stewart BH. 1979 Circulating and urinarycatecholamines in pheochromocytoma. Diagnostic and pathophysiologic im-plications. N Engl J Med. 301:682–686.
2. Duncan MW, Compton P, Lazarus L, Smythe GA. 1988 Measurement ofnorepinephrine and 3,4-dihydroxyphenylglycol in urine and plasma for thediagnosis of pheochromocytoma. N Engl J Med. 319:136–142.
3. Manger WM, Gifford Jr RW. 1993 Pheochromocytoma: current diagnosis andmanagement. Cleve Clin J Med. 60:365–378.
4. Manu P, Runge LA. 1984 Biochemical screening for pheochromocytoma. Su-periority of urinary metanephrines measurements. Am J Epidemiol.120:788–790.
5. Heron E, Chatellier G, Billaud E, Foos E, Plouin PF. 1996 The urinarymetanephrine-to-creatinine ratio for the diagnosis of pheochromocytoma.Ann Intern Med. 125:300–303.
6. Bravo EL. 1994 Evolving concepts in the pathophysiology, diagnosis, andtreatment of pheochromocytoma. Endocr Rev. 15:356–368.
7. Lenders JWM, Eisenhofer G, Armando I, Keiser HR, Goldstein DS, KopinIJ. 1993 Determination of plasma metanephrines by liquid chromatographywith electrochemical detection. Clin Chem. 39:97–103.
8. Eisenhofer G, Friberg P, Pacak K, et al. 1995 Plasma metadrenalines: do theyprovide useful information about sympatho-adrenal function and catechol-amine metabolism? Clin Sci. 88:533–542.
9. Lenders JW, Keiser HR, Goldstein DS, et al. 1995 Plasma metanephrines inthe diagnosis of pheochromocytoma. Ann Intern Med. 123:101–109.
10. Manger WM, Gifford RW. 1996 Clinical and experimental pheochromocy-toma. Cambridge: Blackwell Science. pp 333–365.
11. Sinclair D, Shenkin A, Lorimer AR. 1991 Normal catecholamine productionin a patient with a paroxysmally secreting phaeochromocytoma. Ann ClinBiochem. 28:417–419.
12. Stewart MF, Reed P, Weinkove C, Moriarty KJ, Ralston AJ. 1993 Biochemicaldiagnosis of phaeochromocytoma: two instructive case reports. J Clin Pathol.46:280–282.
13. Shawar L, Svec F. 1996 Pheochromocytoma with elevated metanephrines asthe only biochemical finding. J La State Med Soc. 148:535–538.
14. Eisenhofer G, Goldstein DS, Stull R, et al. 1986 Simultaneous liquid-chro-matographic determination of 3,4-dihydroxyphenylglycol, catecholamines,and 3,4-dihydroxyphenylalanine in plasma, and their responses to inhibitionof monoamine oxidase. Clin Chem. 32:2030–2033.
15. Lotta T, Vidgren J, Tilgmann C, et al. 1995 Kinetics of human soluble andmembrane-bound catechol O-methyltransferase: a revised mechanism anddescription of the thermolabile variant of the enzyme. Biochemistry.34:4202–4210.
16. Weihe E, Schafer MK, Erickson JD, Eiden LE. 1994 Localization of vesicularmonoamine transporter isoforms (VMAT1 and VMAT2) to endocrine cells andneurons in rat. J Mol Neurosci. 5:149–164.
17. Eisenhofer G. 1994 Plasma normetanephrine for examination of extraneuronaluptake and metabolism of noradrenaline in rats. Naunyn Schmiedebergs ArchPharmacol. 349:259–269.
18. Guldberg HC, Marsden CA. 1975 Catechol-O-methyl transferase: pharmaco-logical aspects and physiological role. Pharmacol Rev. 27:135–206.
19. Roth JA. 1992 Membrane-bound catechol-O-methyltransferase: a reevaluationof its role in the O-methylation of the catecholamine neurotransmitters. RevPhysiol Biochem Pharmacol. 120:1–29.
20. Tenhunen J, Salminen M, Lundstrom K, Kiviluoto T, Savolainen R, Ul-manen I. 1994 Genomic organization of the human catechol O-methyltrans-ferase gene and its expression from two distinct promoters. Eur J Biochem.223:1049–1059.
21. Eisenhofer G, Rundqvist B, Aneman A, et al. 1995 Regional release andremoval of catecholamines and extraneuronal metabolism to metanephrines.J Clin Endocrinol Metab. 80:3009–3017.
22. Liu Y, Schweitzer ES, Nirenberg MJ, Pickel VM, Evans CJ, Edwards RH. 1994Preferential localization of a vesicular monoamine transporter to dense corevesicles in PC12 cells. J Cell Biol. 127:1419–1433.
23. Eisenhofer G, Friberg P, Rundqvist B, et al. 1996 Cardiac sympathetic nervefunction in congestive heart failure. Circulation. 93:1667–1676.
24. Eisenhofer G, Rundqvist B, Friberg P. 1998 Determinants of cardiac tyrosinehydroxylase activity during exercise-induced sympathetic activation in hu-mans. Am J Physiol. 274:R626–R634.
25. Ulmanen I, Peranen J, Tenhunen J, et al. 1997 Expression and intracellularlocalization of catechol O-methyltransferase in transfected mammalian cells.Eur J Biochem. 243:452–459.
26. Schuldiner S, Shirvan A, Linial M. 1995 Vesicular neurotransmitter trans-porters: from bacteria to humans. Physiol Rev. 75:369–392.
27. Sjoerdsma A, King WM, Leeper LC, Udenfriend S. 1957 Demonstration of the3-methoxy analog of norepinephrine in man. Science. 127:876.
28. Kopin IJ, Axelrod J. 1960 Presence of 3-methoxy-4-hydroxyphenylglycol andmetanephrine in phaechromocytoma tissue. Nature. 185–788.
29. Crout JR, Sjoerdsma A. 1964 Turnover and metabolism of catecholamines inpatients with pheochromocytoma. J Clin Invest. 43:94–102.
30. Lenders JW, Kvetnansky R, Pacak K, Goldstein DS, Kopin IJ, Eisenhofer G.1993 Extraneuronal metabolism of endogenous and exogenous norepineph-rine and epinephrine in rats. J Pharmacol Exp Ther. 266:288–293.
METANEPHRINES IN PHEOCHROMOCYTOMA 2185
Copyright © 2022 FDOKUMEN


![Usefulness of [18F]-DA and [18F]-DOPA for PET imaging in a mouse model of pheochromocytoma](https://static.fdokumen.com/doc/165x107/6325a7d9852a7313b70e9a7d/usefulness-of-18f-da-and-18f-dopa-for-pet-imaging-in-a-mouse-model-of-pheochromocytoma.jpg)