Modulation of Cell Adhesion Molecules in Various Epithelial Cell Lines after Treatment with PP2
15
Modulation of Cell Adhesion Molecules in Various Epithelial Cell Lines after Treatment with PP2 ² Anna Maria Calcagno,* ,‡,§ Jennifer M. Fostel, |,⊥ Randal P. Orchekowski, |,# James T. Alston, |,∇ William B. Mattes, |,O Teruna J. Siahaan, ‡ and Joseph A. Ware |,@ Department of Pharmaceutical Chemistry, The UniVersity of Kansas, Lawrence, Kansas 66047, and Pharmacia Corporation, Kalamazoo, Michigan 49007 Received November 4, 2004 Abstract: Regulation and expression of E-cadherin and other adhesion molecules were evaluated after exposure to a selective inhibitor of the Src family of tyrosine kinases and inducer of E-cadherin, PP2. E-cadherin is located within the intercellular junction, and it is involved in the management of paracellular permeability of various epithelial barriers in the body. Epithelial cell lines HCT-116, HT29, Caco-2, LS174T, and ARPE-19 were examined for morphological, functional, protein, and mRNA changes following 20 μM PP2 treatment. PP2 treatment caused cell clustering in Caco-2, HT29, and HCT-116 cells. E-cadherin also redistributed to the points of cell contact in Caco-2 cells. These changes suggest increased E-cadherin-dependent cell adhesion. Studies evaluating transepithelial electrical resistance, an established measurement of paracellular permeability, displayed increases in resistance for the Caco-2 cells following PP2 treatment, which correlates with our microscopy data. In addition, E-cadherin protein levels increased for all cells except HCT-116. ARPE-19 cells did not express E-cadherin at the protein or mRNA level. Expression of adhesion molecules varied for the cell lines, and only Claudin 3 mRNA expression was significantly increased in the three intestinal cell lines treated with PP2. Overall, our data suggest that E-cadherin is positively regulated by inhibition of Src tyrosine kinases at the functional and protein expression levels within these epithelial cell lines. Keywords: E-cadherin; paracellular drug delivery; adhesion molecules; epithelial cells; PP2; SRC inhibitors Introduction The two major routes for drugs to cross biological barriers are the transcellular route and the paracellular pathway. Although many drugs utilize the transcellular route, several limitations exist. First of all, only drugs with the appropriate physiochemical properties can traverse transcellularly. 1 Hy- drophilic and charged moieties are unable to use the transcellular path. Second, drugs utilizing the transcellular route must also face efflux transporters as well as various drug metabolizing enzymes before leaving the cell. 2 These conditions severely restrict drug delivery. On the other hand, the passage of hydrophilic drugs through the paracellular pathway is only limited by size. Paracellular drug delivery is regulated by the various adhesion molecules within the intercellular junction. E-cadherin is a critical adhesion molecule located within the adherens junction that organizes epithelial cells into biological barriers. 3 Various factors have * To whom correspondence should be addressed. Mailing ad- dress: Laboratory of Cell Biology, National Cancer Institute, NIH, Building 37, Room 2120, 37 Convent Dr MSC4256, Bethesda, MD 20892-4256. Tel: (301) 435-6303. Fax: (301) 402-0450. E-mail: [email protected]. ² Presented in part at the American Association of Pharmaceutical Scientists Annual Meeting, October 2003. ‡ The University of Kansas. § Presently with the National Cancer Institute, Bethesda, MD 20892. | Pharmacia Corporation. ⊥ Presently with Alpha-Gamma Technologies, Inc., Raleigh, NC 27609. # Presently with The Van Andel Research Institute, Grand Rapids, MI 49503. 3 Presently with Pfizer Global Research and Development, St. Louis, MO 63141. O Presently with Gene Logic, Gaithersburg, MD 20879. @ Presently with Pfizer Global Research and Development, Ann Arbor, MI 48105. (1) Martinez, M.; Amidon, G. A mechanistic approach to understand- ing the factors affecting drug absorption: a review of fundamen- tals. J. Clin. Pharmacol. 2002, 42 (6), 620-643. (2) Wacher, V.; Salphati, L.; Benet, L. Active secretion and entero- cytic drug metabolism barriers to drug absorption. AdV. Drug DeliVery ReV. 2001, 46 (1-3), 89-102. articles 170 MOLECULAR PHARMACEUTICS VOL. 2, NO. 3, 170-184 10.1021/mp0499003 CCC: $30.25 © 2005 American Chemical Society Published on Web 03/08/2005
Transcript of Modulation of Cell Adhesion Molecules in Various Epithelial Cell Lines after Treatment with PP2

Modulation of Cell Adhesion Molecules in VariousEpithelial Cell Lines after Treatment with PP2 †
Anna Maria Calcagno,*,‡,§ Jennifer M. Fostel,|,⊥ Randal P. Orchekowski,|,#
James T. Alston,|,∇ William B. Mattes, |,O Teruna J. Siahaan,‡ andJoseph A. Ware|,@
Department of Pharmaceutical Chemistry, The UniVersity of Kansas, Lawrence,Kansas 66047, and Pharmacia Corporation, Kalamazoo, Michigan 49007
Received November 4, 2004
Abstract: Regulation and expression of E-cadherin and other adhesion molecules were evaluatedafter exposure to a selective inhibitor of the Src family of tyrosine kinases and inducer of E-cadherin,PP2. E-cadherin is located within the intercellular junction, and it is involved in the management ofparacellular permeability of various epithelial barriers in the body. Epithelial cell lines HCT-116, HT29,Caco-2, LS174T, and ARPE-19 were examined for morphological, functional, protein, and mRNAchanges following 20 µM PP2 treatment. PP2 treatment caused cell clustering in Caco-2, HT29, andHCT-116 cells. E-cadherin also redistributed to the points of cell contact in Caco-2 cells. Thesechanges suggest increased E-cadherin-dependent cell adhesion. Studies evaluating transepithelialelectrical resistance, an established measurement of paracellular permeability, displayed increasesin resistance for the Caco-2 cells following PP2 treatment, which correlates with our microscopydata. In addition, E-cadherin protein levels increased for all cells except HCT-116. ARPE-19 cells didnot express E-cadherin at the protein or mRNA level. Expression of adhesion molecules varied for thecell lines, and only Claudin 3 mRNA expression was significantly increased in the three intestinal celllines treated with PP2. Overall, our data suggest that E-cadherin is positively regulated by inhibitionof Src tyrosine kinases at the functional and protein expression levels within these epithelial cell lines.
Keywords: E-cadherin; paracellular drug delivery; adhesion molecules; epithelial cells; PP2; SRCinhibitors
IntroductionThe two major routes for drugs to cross biological barriers
are the transcellular route and the paracellular pathway.
Although many drugs utilize the transcellular route, severallimitations exist. First of all, only drugs with the appropriatephysiochemical properties can traverse transcellularly.1 Hy-drophilic and charged moieties are unable to use thetranscellular path. Second, drugs utilizing the transcellularroute must also face efflux transporters as well as variousdrug metabolizing enzymes before leaving the cell.2 Theseconditions severely restrict drug delivery. On the other hand,the passage of hydrophilic drugs through the paracellularpathway is only limited by size. Paracellular drug deliveryis regulated by the various adhesion molecules within theintercellular junction. E-cadherin is a critical adhesionmolecule located within the adherens junction that organizesepithelial cells into biological barriers.3 Various factors have
* To whom correspondence should be addressed. Mailing ad-dress: Laboratory of Cell Biology, National Cancer Institute,NIH, Building 37, Room 2120, 37 Convent Dr MSC4256,Bethesda, MD 20892-4256. Tel: (301) 435-6303. Fax: (301)402-0450. E-mail: [email protected].
† Presented in part at the American Association of PharmaceuticalScientists Annual Meeting, October 2003.
‡ The University of Kansas.§ Presently with the National Cancer Institute, Bethesda, MD 20892.| Pharmacia Corporation.⊥ Presently with Alpha-Gamma Technologies, Inc., Raleigh, NC
27609.# Presently with The Van Andel Research Institute, Grand Rapids,
MI 49503.3 Presently with Pfizer Global Research and Development, St.
Louis, MO 63141.O Presently with Gene Logic, Gaithersburg, MD 20879.@ Presently with Pfizer Global Research and Development, Ann
Arbor, MI 48105.
(1) Martinez, M.; Amidon, G. A mechanistic approach to understand-ing the factors affecting drug absorption: a review of fundamen-tals.J. Clin. Pharmacol.2002, 42 (6), 620-643.
(2) Wacher, V.; Salphati, L.; Benet, L. Active secretion and entero-cytic drug metabolism barriers to drug absorption.AdV. DrugDeliVery ReV. 2001, 46 (1-3), 89-102.
articles
170 MOLECULAR PHARMACEUTICS VOL. 2, NO. 3, 170-184 10.1021/mp0499003 CCC: $30.25 © 2005 American Chemical SocietyPublished on Web 03/08/2005

been shown to be influential in the expression and regulationof E-cadherin.4,5 Changes in E-cadherin interactions have animpact on the integrity of the epithelial barrier and in turnon the paracellular permeability of small, hydrophilic drugs.3
The Src family of kinases, one of the largest and mostexamined subfamilies of nonreceptor tyrosine kinases, hasbeen identified as a disruptor of E-cadherin-dependent cell-cell adhesions.6 The Src family consists of nine members,which share a similar structure and common pathways ofregulation and function.7,8 Only three of the nine membersof the Src family are found in epithelial cells, and these in-clude Src, Fyn, and Yes, which are ubiquitously expressed.9
The multiplicity of substrates for Src contains proteins witha variety of functions that either interact directly with Srcor have been shown to be phosphorylated in Src transformedcells.9-11 This list is too large to include here; however, ofparticular significance are E-cadherin andâ-catenin, two im-portant cell adhesion molecules of the adherens junction,which are known substrates of Src. Src phosphorylates theE-cadherin complex and induces its ubiquitination causinga disruption of cell-cell contacts in MDCK cells.12 Investi-gators have also shown that inhibition of c-Src increases theadhesive nature of the E-cadherin/catenin complex and in-hibits metastasis.13,14 Recent reports indicate that the pyra-zolopyrimidine PP2, a selective inhibitor of the Src familyof tyrosine kinases, prevents the Src-dependent phosphory-
lation of p120 andâ-catenin and the subsequent loss of epi-thelial barrier function during chemical anoxia.15 PP2 ef-fectively inhibits the Src family members Fyn, Lck, and Hckat nanomolar concentrations in vitro and at higher concentra-tions in intact cells.16 Moreover, treatment with 20µM PP2resulted in a 40-50% growth inhibition in HT29 cells.13 PP2selectively targets the Src family kinases, and it binds to thehydrophobic pocket near the ATP-binding site on the en-zyme, which is specific to the Src kinase family.17 However,this compound also interferes with the catalytic activity ofthe PDGF receptor at low concentrations, which is not a con-cern for our work since only the ARPE-19 cells express thePDGF receptor, and no changes were found in our work forthis gene following PP2 treatment in the ARPE-19 cells.18,19
Although others have evaluated the effects of PP2 incertain epithelial cell lines, our work is a comprehensivestudy evaluating five epithelial cell lines after exposure toPP2. A comparison of four intestinal cell lines and one retinalepithelial cell line that lacks E-cadherin was performed. Ourhypothesis was that intercellular junction regulation ofE-cadherin via Src kinases is similar among epithelial cells.In this study, the effects of treatment with 20µM PP2 for48 h were evaluated at the morphological, functional, protein,and gene expression levels. This dose regimen was utilizedfor all studies due to the significant morphological effectsthat it produced in our preliminary studies for nearly all celllines after 48 h of treatment. Although our work focusesmainly on the effects on E-cadherin within these cells, wewere also able to examine the regulation of genomicexpression of thousands of genes following inhibition of Src
(3) Lutz, K. L.; Siahaan, T. J. Molecular structure of the apicaljunction complex and its contribution to the paracellular barrier.J. Pharm. Sci. 1997, 86, 977-984.
(4) Fukata, M.; Kaibuchi, K. Rho-family GTPases in cadherin-mediated cell-cell adhesion.Nat. ReV. Mol. Cell Biol. 2001, 2(12), 887-897.
(5) Aplin, A. E.; Howe, A.; Alahari, S. K.; Juliano, R. L. Signaltransduction and signal modulation by cell adhesion receptors:the role of integrins, cadherins, immunoglobulin-cell adhesionmolecules, and selectins.Pharmacol. ReV. 1998, 50 (2), 197-263.
(6) Frame, M. C.; Fincham, V. J.; Carragher, N. O.; Wyke, J. A.v-Src’s hold over actin and cell adhesions.Nat. ReV. Mol. CellBiol. 2002, 3 (4), 233-245.
(7) Tatosyan, A. G.; Mizenina, O. A. Kinases of the Src family:structure and functions.Biochemistry (Moscow)2000, 65 (1), 49-58.
(8) Hubbard, S. R.; Till, J. H. Protein tyrosine kinase structure andfunction.Annu. ReV. Biochem. 2000, 69, 373-398.
(9) Thomas, S. M.; Brugge, J. S. Cellular functions regulated by Srcfamily kinases.Annu. ReV. Cell DeV. Biol. 1997, 13, 513-609.
(10) al-Obeidi, F. A.; Wu, J. J.; Lam, K. S. Protein tyrosine kinases:structure, substrate specificity, and drug discovery.Biopolymers1998, 47 (3), 197-223.
(11) Brown, M. T.; Cooper, J. A. Regulation, substrates and functionsof src.Biochim. Biophys. Acta 1996, 1287 (2-3), 121-149.
(12) Fujita, Y.; Krause, G.; Scheffner, M.; Zechner, D.; Leddy, H. E.;Behrens, J.; Sommer, T.; Birchmeier, W. Hakai, a c-Cbl-likeprotein, ubiquitinates and induces endocytosis of the E-cadherincomplex.Nat. Cell Biol. 2002, 4 (3), 222-231.
(13) Nam, J. S.; Ino, Y.; Sakamoto, M.; Hirohashi, S. Src family kinaseinhibitor PP2 restores the E-cadherin/catenin cell adhesion systemin human cancer cells and reduces cancer metastasis.Clin. CancerRes. 2002, 8 (7), 2430-2436.
(14) Owens, D. W.; McLean, G. W.; Wyke, A. W.; Paraskeva, C.;Parkinson, E. K.; Frame, M. C.; Brunton, V. G. The catalyticactivity of the Src family kinases is required to disrupt cadherin-dependent cell-cell contacts.Mol. Biol. Cell 2000, 11 (1), 51-64.
(15) Sinha, D.; Wang, Z.; Price, V. R.; Schwartz, J. H.; Lieberthal,W. Chemical anoxia of tubular cells induces activation of c-Srcand its translocation to the zonula adherens.Am. J. Physiol. RenalPhysiol. 2003, 284 (3), F488-F497.
(16) Hanke, J. H.; Gardner, J. P.; Dow, R. L.; Changelian, P. S.;Brissette, W. H.; Weringer, E. J.; Pollok, B. A.; Connelly, P. A.Discovery of a novel, potent, and Src family-selective tyrosinekinase inhibitor. Study of Lck- and FynT-dependent T cellactivation.J. Biol. Chem. 1996, 271 (2), 695-701.
(17) Zhu, X.; Kim, J. L.; Newcomb, J. R.; Rose, P. E.; Stover, D. R.;Toledo, L. M.; Zhao, H.; Morgenstern, K. A. Structural analysisof the lymphocyte-specific kinase Lck in complex with non-selective and Src family selective kinase inhibitors.Struct. FoldingDes. 1999, 7 (6), 651-661.
(18) Blake, R. A.; Broome, M. A.; Liu, X.; Wu, J.; Gishizky, M.; Sun,L.; Courtneidge, S. A. SU6656, a selective src family kinaseinhibitor, used to probe growth factor signaling.Mol. Cell. Biol.2000, 20 (23), 9018-9027.
(19) Waltenberger, J.; Uecker, A.; Kroll, J.; Frank, H.; Mayr, U.;Bjorge, J. D.; Fujita, D.; Gazit, A.; Hombach, V.; Levitzki, A.;Bohmer, F. D. A dual inhibitor of platelet-derived growth factorbeta-receptor and Src kinase activity potently interferes withmotogenic and mitogenic responses to PDGF in vascular smoothmuscle cells. A novel candidate for prevention of vascularremodeling.Circ. Res. 1999, 85 (1), 12-22.
Effects of PP2 on Adhesion Molecules articles
VOL. 2, NO. 3 MOLECULAR PHARMACEUTICS 171
family kinases by PP2 through the use of microarraytechnology. Surprisingly, mRNA expression did not correlatebetween the studied epithelial cell lines, and only the Claudin3 gene displayed an increase after treatment for all theintestinal cell lines. In general, inhibition of Src caused anincrease in cell adhesion regulated by E-cadherin in mostepithelial cell lines. Understanding the influences of Srckinases on the integrity of epithelial barriers is crucial foreffective paracellular drug delivery and in the design ofspecific modulators of this process.
MethodsCell Culture. The following cell lines were purchased
from ATCC (Rockville, MD): ARPE-19, Caco-2, HCT-116,HT29, and LS174T. All cell lines utilized in this work arehuman epithelial cell lines with adherent growth properties.The ARPE-19 cells are derived from normal retinal pig-mented epithelium while the other four cell lines originatefrom colorectal adenocarcinoma cells. All experiments wereperformed using cells within 20 additional passages of thatreceived from ATCC. The culture medium for each cell linewas made as recommended by ATCC. Media componentswere purchased from Gibco (Carlsbad, CA). Cells weregrown in 150 cm2 Corning cell culture flasks (Corning, NY)at 37 °C and 5% CO2. Cells were fed every other day. Atconfluency, the cells were dissociated with trypsin-EDTA(Gibco) per ATCC subculturing protocol and seeded in6-well Corning Costar polystyrene plates (Corning) at adensity of 1× 10⁶ cells per well.
Cells were grown for 24 h after seeding in the 6-wellplates. A 20µM PP2 (Calbiochem, San Diego, CA) solutionwas added to these subconfluent cells at the 24-h mark afterseeding (dose 1). The PP2 solution was exchanged 24 hfollowing the first dose (dose 2) and was removed 24 h later.Two doses were administered, and the total exposure timeto 20µM PP2 was 48 h for all cell lines except the Caco-2cells, which were also treated for 96 h. These dosingschedules were used for the evaluation of protein and mRNAlevels following PP2 treatment. In the morphological studies,additional exposure time to PP2 was evaluated. The PP2 wasdissolved in DMSO (Sigma, St. Louis, MO) and furtherdiluted with the appropriate medium for each cell line; thefinal concentration of DMSO was 0.1% for the PP2 and thecontrol medium. Light microscope images of the cells weretaken at various time points using a Leica DMRBE micro-scope (Bannockburn, IL) using a 2.5× Leica lens. Imageswere captured using a Nikon DXM1200 digital camera(Melville, NY) utilizing the Nikon imaging program Act-1.Adobe Photoshop 7.0 was used to adjust the brightness andcontrast of the images.
Confocal Imaging.Caco-2 cells were seeded on Lab-TekII coverglass chambers, No. 1.5 (Nunc, Rochester, NY), onday zero at a density of 100000 cells per well. After 24 h ofgrowth, either PP2 or the control medium was added to thewell and exchanged daily for 96 h of total exposure to 20µM PP2. The PP2 and control medium were prepared asdescribed in the previous section. Prior to the experiment,the chambers were washed twice with PBS (Gibco) and then
blocked for 1 h atroom temperature with 10% normal goatserum (Gibco) in PBS. The chambers were then washedtwice with PBS. A 1:50 solution of the DECMA-1 clone ofthe rat anti-mouse E-cadherin antibody (Sigma) in PBS/1%normal goat serum was added to all cell chambers for 1 h atroom temperature followed by two washes with PBS. Thegoat anti-rat Alexa Fluor 488 conjugated antibody (MolecularProbes, Eugene, OR) was incubated with the cells for 30min at room temperature. This secondary antibody wasdiluted 1:1000 in PBS/1% normal goat serum. Following twowashes with PBS, images were acquired on a LSM510confocal microscope (Carl Zeiss, Thornwood, NY) with a25× Plan-neofluor 0.8 numerical aperture lens with thecorrection collar adjusted for water immersion. Fluorescencewas imaged using 488-nm argon laser excitation and a 505-nm long-pass emission filter. The transmitted light imagewas captured simultaneously in a second detector usingdifferential interference contrast (DIC) optics.
Transepithelial Electrical Resistance (TER) and Man-nitol Flux Determination. ARPE-19 and Caco-2 cells wereplated on 6-well Corning Costar Transwell plates (Corning,NY) at a density of 1× 10⁶ cells per well and 650000 cellsper well, respectively. Cells were grown for 8 days andallowed to form confluent monolayers prior to treatment with20µM PP2, and the transepithelial electrical resistance (TER)was measured on days 4, 7, and 8 with a chopstick apparatususing a voltmeter (Millipore, Bedford, MA). Measurementswere taken from three individual monolayers in triplicatefor each treatment condition. The TER was determined aftersubtracting the TER value from the Transwell without cells.The medium with PP2 for the treated cells and mediumwithout PP2 for the control cells were exchanged every 24h starting on day 9, and the TER was measured daily forseveral days beginning with day 10 of growth. Statisticalanalysis was performed using a pairedt-test and two-factorANOVA with replication.
A mannitol flux study was performed on the Caco-2 cellsfollowing 15 days of growth. The Transwells were washedtwice prior to the start of the study. A solution of14C-radiolabeled mannitol (0.25µCi/mL in 10 mM HEPES/PBS)was placed on the apical side of the transwell, and the fluxover time was determined as the basolateral compartmentwas sampled and counted using a Packard 1900 CA liquidscintillation analyzer (Palo Alto, CA) at 30, 60, and 120 min.These studies were performed in triplicate.
RNA and Protein Isolation. After 48 h of treatment with20 µM PP2 or control treatment, RNA and protein wereisolated from the 6-well plates. The RNA isolation wasperformed using the Qiagen Rneasy kit (Valencia, CA)according to the manufacturer’s protocol. RNA samples wereisolated in duplicate. The total RNA extracts were quantifiedusing a spectrophotometer and Softmax software. Theintegrity of the RNA was verified using the Agilent 2100Bioanalyzer (Palo Alto, CA) with the Eukaryote Total RNAassay. The RNA extracts were stored at-80°C until needed.
Protein was isolated from treated and control wells. Themedium was aspirated, and the cells were washed with PBS
articles Calcagno et al.
172 MOLECULAR PHARMACEUTICS VOL. 2, NO. 3
(Gibco). Lysis buffer containing 50 mM Tris, pH 7.0, 1%Triton X 100, and one tablet of Complete Mini ProteaseInhibitor (Roche, Indianapolis, IN) was then added for 15min while the plates were kept on ice. The wells were scrapedusing a Nalgene Nunc No. 23 cell scraper (Rochester, NY)and then transferred to clean vials. The lysate was sonicatedbefore DNase (Qiagen, Valencia, CA) was added. The totalprotein concentration was determined using a Pierce BCAProtein Assay kit (Rockford, IL). The protein extracts werekept at-80°C until analyzed in the Western blotting studies.
GeneChip Eukaryotic Expression Arrays.The isolatedtotal RNA was used with the GeneChip Sample CleanupModule to prepare biotinylated eukaryotic cRNA to hybridizeto the GeneChip expression probe arrays according to themanufacturer’s protocol (Qiagen). Briefly, double-strandedcDNA was prepared from the isolated RNA using theInvitrogen Life Technologies (Carlsbad, CA) SuperScriptsystem with a T7-(dT)24 primer. This double-stranded cDNAwas utilized to make the biotin-labeled cRNA by in vitrotranscription using a labeling kit from Enzo (Farmingdale,NY). The biotinylated cRNA was fragmented for 35 min at94 °C in the provided fragmentation buffer and thenhybridized to the Affymetrix GeneChip U95Av2 (SantaClara, CA) arrays for 16 h at 45°C. The hybridizationmixture also contained the following internal controls toensure hybridization efficiency: control oligonucleotide B250 pM, bioB 1.5 pM, bioC 5 pM, bioD 25 pM, cre 100 pM,and herring sperm DNA 0.1 mg/mL. Each probe array wasthen washed and stained prior to being scanned in duplicateusing the GeneArray Scanner according to the manufacturer’sprocedures (Affymetrix, Santa Clara, CA).
Analysis of GeneChip Data.Affymetrix Microarray Suite5.0 software was used to examine expression data. The chpdata file was analyzed to determine the absent or presentcall from the detection algorithm, which signifies the absenceor presence of a particular mRNA. The signal data werenormalized by magnitude adjustment (Fostel and Vidmar,in preparation), and the fold change was determined for thetreated and control cells for each of the cell types except forLS174T. A change of 2-fold or more was the criterion for asignificant change. The GeneChip data were summarized inthe form of a list of changes in gene expression for adhesionmolecules from the tight junction, adherens junction, anddesmosomes as well as for Src family members. TheGeneChip operating software was used to determine thedetection call of each of the probes, and the softwareindicated a “present” call when the transcript was reliablydetected or an “absent” call when it was not detected. Thiswas performed using the detection algorithm within theAffymetrix software. These detection calls were used withinTable 1 to indicate a change in expression, and a gene wasnot labeled as present unless a “present” call for each of theduplicate microarrays was found by the GeneChip operatingsoftware. A hierarchical clustering using cosine correlationas the distance metric and the complete linkage joiningmethod was performed using Spotfire Functional Genomicssoftware (Somerville, MA).
Western Blotting. Equivalent amounts of protein wereprepared under reducing conditions (with NuPage LDSsample and NuPage reducing buffer) and boiled for 2.5 min.A Bio-Rad (Hercules, CA) Criterion precast gel 7.5% Tris-HCl 1.0 mm was used to separate the proteins using SDS-PAGE. One gel was stained with Coomassie blue (Biorad,Hercules, CA) for 20 min and then destained overnight withBio-Rad destain solution. This Coomassie blue-stained gelverified equal protein loading (data not shown). The HoeferEasy Breeze drying frame (San Francisco, CA) was used todry this gel. The electrophoresed proteins from the secondgel were transferred to an Immun-Blot PVDF membrane(Bio-Rad); then nonspecific binding was blocked with 5%nonfat dried milk solution (Bio-Rad). The blot was cut inhalf, and each half was probed with the appropriate antibod-ies. One half was probed with mouse anti-human E-cadherinantibody (clone 36, Transduction Laboratories, Lexington,KY) at 1:2500 dilution and the other half with mouse anti-actin monoclonal antibody (Chemicon International, Te-mecula, CA) at 1:8000 dilution overnight at 4°C with gentlerocking. The secondary antibody, a goat anti-mouse IgG:horseradish peroxidase conjugate (Transduction Laboratories)at 1:5000 dilution, was used for 1 h at room temperature.Amersham Biosciences ECL Western blotting detectionreagents (Piscataway, NJ) were used to detect the signal asindicated. The blot was exposed to Hyperfilm within aHypercassette by Amersham Pharmacia Biotech (Piscataway,NJ) for various times. A Konica SRX-101A film processor(Scarborough, ME) was used to develop the film.
ResultsPP2 Causes Morphological Changes and Redistribution
of E-Cadherin in Subconfluent Cells.The inhibition of theSrc family of tyrosine kinases plays an important role in cell-to-cell adhesion. It has previously been shown that morpho-logical changes occur in HT29 cells following treatment withPP2.13 We hypothesized that regulation of the intercellularjunction would be similar across epithelial cell lines. Ourstudy was performed to determine if PP2 would elicit similarmorphological changes in the five epithelial cell lines thatwe were evaluating. The morphologies of model intestinalcell lines as well as a retinal epithelial cell line were evaluatedin subconfluent cells after exposure to 20µM PP2 for 48 h.In Figure 1, the images of the HCT-116 cells are depicted.In this cell line, the effects of PP2 were seen after only 3 hof exposure (top left panel). The treated cells begin to clusterwhereas the control cells continue to spread to form acomplete monolayer. No clustering was seen in any of theother cell lines after 3 h, and some differences in cellmorphology were seen after 24 h for the treated and controlcells for the HCT-116, HT29, and Caco-2 cells (data notshown). The greatest morphological changes were seen after48 h for all cell lines. After 48 h of treatment with PP2, thedifferences were more evident for the HCT-116 cells (Figure1c,d). The treated HCT-116 cells show extensive cellclustering and many spaces between the cells, but the controlcells are able to form a complete monolayer.
Effects of PP2 on Adhesion Molecules articles
VOL. 2, NO. 3 MOLECULAR PHARMACEUTICS 173
Cells were evaluated again at the 72-h point, and fewchanges were seen between the treated cells at 48 and 72 h(data not shown). After 96 h of treatment, a statisticallysignificant difference in the transepithelial electrical resis-tance was seen in the Caco-2 monolayers. Consequently, thisprompted us to assess the morphology of the Caco-2 cellsand the distribution of E-cadherin in these cells after 96 hof treatment. The Caco-2 cells treated with PP2 for 96 halso show a clustering effect. The control cells, depicted inFigure 2B, are a confluent monolayer. The LS174T cells do
not show the same response as the other cells after incubationwith PP2. These cells were found not viable following 48-hincubation with 20µM PP2. The control LS174T cellscontinue to spread to form a monolayer and show a slowgrowth rate, which was normal for this particular cell line(Figure 2C,D).
Figure 3 displays the morphological changes in the HT29and ARPE-19 cells. The HT29 cells form cell clusters aftertreatment with PP2 as previously reported by other investiga-tors.13 The control cells for HT29 formed a confluent
Table 1. Gene Expression Summary for the Selected Genesa
Caco-2
96 h 48 h LS174T HCT-116 HT29 ARPE-19
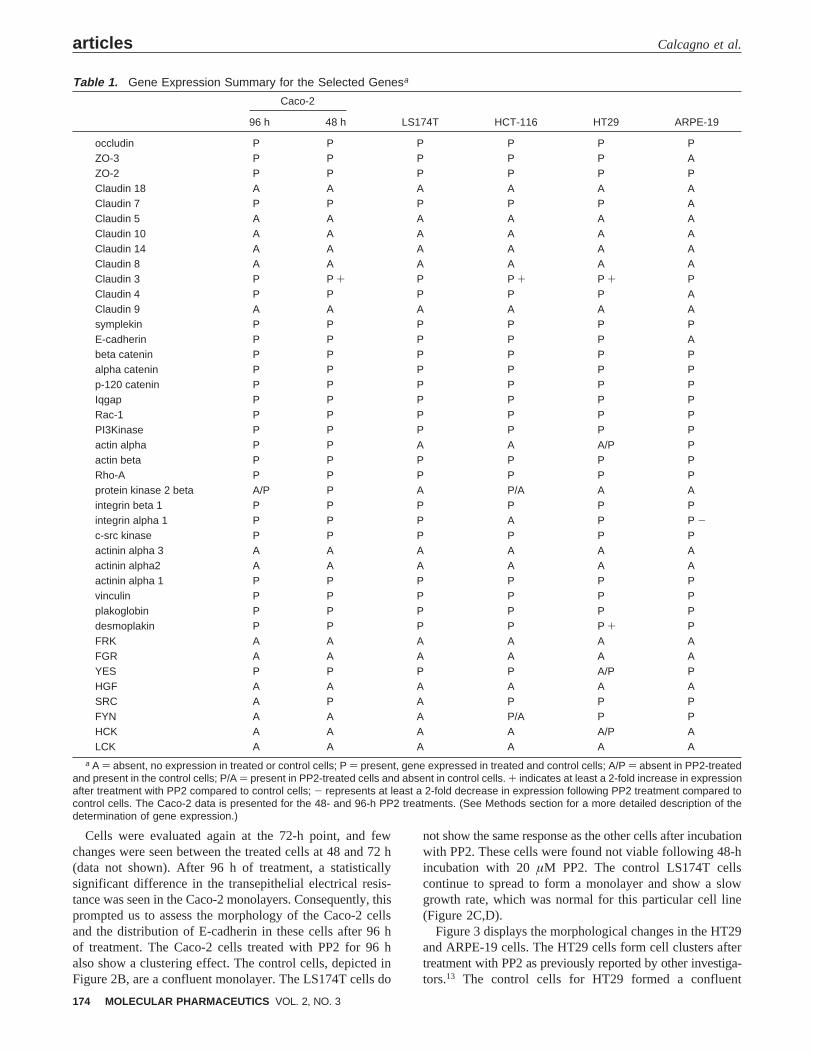
occludin P P P P P PZO-3 P P P P P AZO-2 P P P P P PClaudin 18 A A A A A AClaudin 7 P P P P P AClaudin 5 A A A A A AClaudin 10 A A A A A AClaudin 14 A A A A A AClaudin 8 A A A A A AClaudin 3 P P + P P + P + PClaudin 4 P P P P P AClaudin 9 A A A A A Asymplekin P P P P P PE-cadherin P P P P P Abeta catenin P P P P P Palpha catenin P P P P P Pp-120 catenin P P P P P PIqgap P P P P P PRac-1 P P P P P PPI3Kinase P P P P P Pactin alpha P P A A A/P Pactin beta P P P P P PRho-A P P P P P Pprotein kinase 2 beta A/P P A P/A A Aintegrin beta 1 P P P P P Pintegrin alpha 1 P P P A P P -c-src kinase P P P P P Pactinin alpha 3 A A A A A Aactinin alpha2 A A A A A Aactinin alpha 1 P P P P P Pvinculin P P P P P Pplakoglobin P P P P P Pdesmoplakin P P P P P + PFRK A A A A A AFGR A A A A A AYES P P P P A/P PHGF A A A A A ASRC A P A P P PFYN A A A P/A P PHCK A A A A A/P ALCK A A A A A A
a A ) absent, no expression in treated or control cells; P ) present, gene expressed in treated and control cells; A/P ) absent in PP2-treatedand present in the control cells; P/A ) present in PP2-treated cells and absent in control cells. + indicates at least a 2-fold increase in expressionafter treatment with PP2 compared to control cells; - represents at least a 2-fold decrease in expression following PP2 treatment compared tocontrol cells. The Caco-2 data is presented for the 48- and 96-h PP2 treatments. (See Methods section for a more detailed description of thedetermination of gene expression.)
articles Calcagno et al.
174 MOLECULAR PHARMACEUTICS VOL. 2, NO. 3

monolayer after 48 h of growth. The ARPE-19 treated andcontrol cells (Figure 3c,d) showed no visual difference whenimaged by light microscopy.
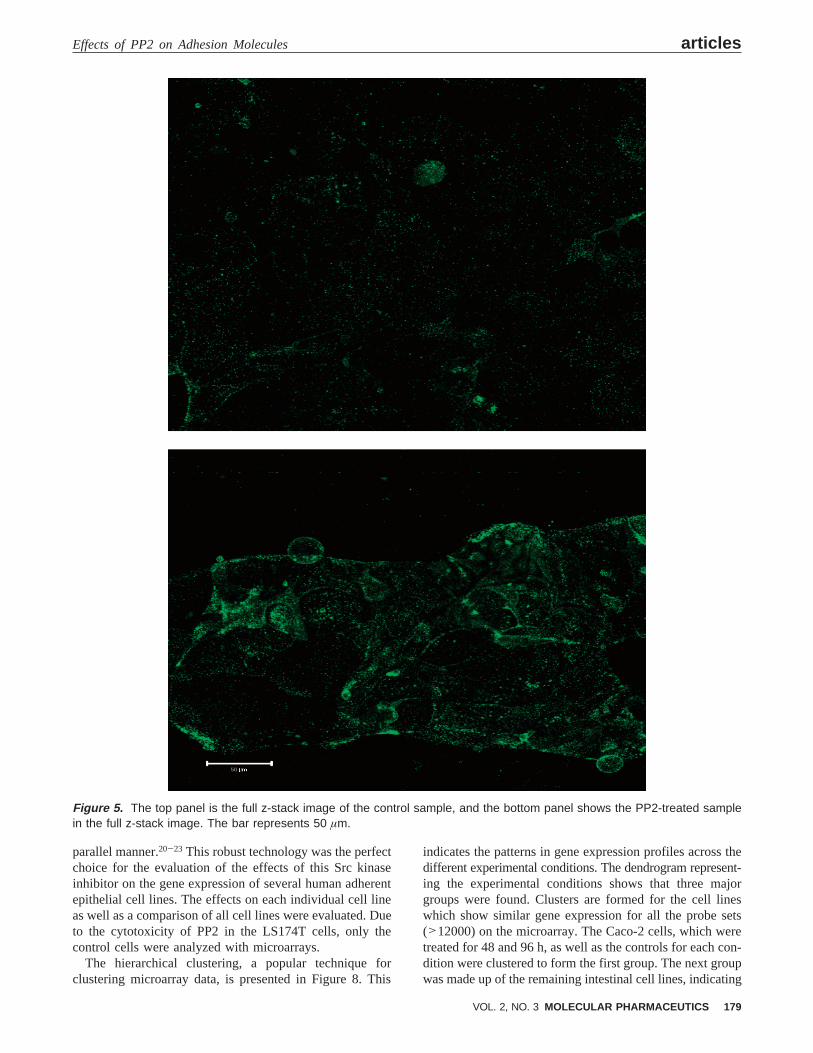
As mentioned previously, the functional changes in theCaco-2 cells following 96 h of treatment with PP2 triggeredfurther evaluation of these cells. To determine if these changeswere attributable to E-cadherin, additional microscopy studieswere performed. The distribution of E-cadherin in the Caco-2cells was examined by confocal microscopy following 96 hof treatment with 20µM PP2 (Figure 4 z-stack flat image).The control cells grew as a thin monolayer of cells over theentire surface of the Lab-tek II chamber, and the immun-ostaining with the DECMA-1 clone of the anti-E-cadherinantibody shows a diffuse staining over the surface of thecells. The diffuse staining was apparent throughout the slicesof the z-stack performed on this sample (Figure 5 depictsz-stack full image). The PP2-treated Caco-2 cells formed a
cluster of cells with a greater thickness than that of the controlcells, and the E-cadherin staining was more intense on theborders of the cells as seen in the fluorescent image andthroughout the z-stack (Figure 5). These data suggest thatthis clustering is a result of cells growing on one anotherand of the redistribution of E-cadherin to the points of cellcontact inhibiting cell motility, which is necessary for thespread of cells and the formation of monolayers.
PP2 Exposure Results in Changes in ParacellularPermeability in Confluent Monolayers. Functional char-acterization of these cells after treatment with PP2 wasperformed using transepithelial electrical resistance (TER)and mannitol flux evaluation to determine paracellularpermeability in confluent monolayers. These measurementswere taken to determine if PP2 treatment would result in adecrease in paracellular permeability due to an increase incell to cell adhesion. The results of these studies are illus-
Figure 1. Light microscopy images of HCT-116 cells. (a) This image, captured after 3 h of treatment with 20 µM PP2, depictsthe early stages of cell clustering in subconfluent cells. (b) The control HCT-116 cells at 3 h are seen in this panel. Cells arespreading to form a monolayer. (c) HCT-116 cells after 48 h of PP2 treatment show more defined cell clusters. (d) These controlcells of HCT-116 after 48 h have formed a complete monolayer. (Magnification of 2.5× for all images.)
Effects of PP2 on Adhesion Molecules articles
VOL. 2, NO. 3 MOLECULAR PHARMACEUTICS 175

trated in Figure 6. The Caco-2 cells were chosen for thesestudies because they are model intestinal cells that developinto tight monolayers. Conversely, the ARPE-19 cells formlooser monolayers with lower TER values than the Caco-2cells, and they lack E-cadherin in the early stages of theirgrowth. The other cell lines in this study did not formmonolayers with measurable TER values; thus, they are notuseful for evaluating paracellular permeability in this manner.
The ARPE-19 confluent monolayers (Figure 6a) show adecrease in TER following treatment with 20µM PP2compared to the control cells. The average TER for thecontrol cells (n ) 3) on day 8 was 147.5( 31.6 Ω‚cm2,and it continued to increase to nearly 180( 23 Ω‚cm2 overthe next 6 days. A statistically significant difference (p <0.01) was observed on day 11 between control cells and cellstreated for 48 h with PP2. The TER was measured throughday 14 of growth, and the trend continued for the remainderof the study. Statistically significant differences (p < 0.01)were found between PP2-treated and control monolayers andbetween the TER values determined on the five treatmentdays using a two-factor ANOVA with replication.
The opposite was detected in the Caco-2 confluentmonolayers (Figure 6b). PP2 treatment produced an increasein TER for the Caco-2 monolayers with a statisticallysignificant difference (p < 0.01) found on day 12 of growthafter 96 h of treatment. The average TER for the controlcells was 830( 51 Ω‚cm2 for the course of the study (n )3). The increase in TER continued for the treated cellmonolayers throughout the study. The ANOVA indicatedthat there was a statistically significant difference (p < 0.01)between the treated and control monolayers. At day 15 ofgrowth, the Caco-2 cells were used to further evaluate theparacellular permeability with a mannitol flux assay. Man-nitol flux results show that Pe) 4.07 × 10⁻⁷ ( 3.64 ×10⁻⁸ for PP2-treated cells and Pe) 2.48× 10⁻⁷ ( 1.84×10⁻⁸ for control monolayers (n ) 3). In each case, theeffective permeability was low; however, the control cellsdisplay statistically significantly less permeability (p < 0.05).
E-Cadherin Protein Expression Is Increased in TwoCell Lines Following PP2 Treatment.As a result of ourprevious findings that E-cadherin redistributes to the pointsof cell contact and that cell adhesion is enhanced, we
Figure 2. Light microscopy images of Caco-2 cells. (A) Subconfluent Caco-2 cells treated for 96 h with PP2 fail to form acomplete monolayer, and cell clusters are seen. (B) Control Caco-2 cells form a confluent monolayer after 96 h of growth. (C)LS174T cells treated with PP2 were found to be not viable after 48 h of treatment. (D) Control LS174T cells after 48 h continueto spread to form a monolayer. (Magnification of 2.5× for all images.)
articles Calcagno et al.
176 MOLECULAR PHARMACEUTICS VOL. 2, NO. 3

determined whether PP2 would cause any alterations in theexpression of E-cadherin. Total protein was isolated fromthe various treated and control cells, and the levels ofE-cadherin protein expression were compared (Figure 7). TheE-cadherin expression level was normalized to the actincontrol for each cell line. The E-cadherin signal for the PP2-treated cells was approximately half that of the HCT-116control cells. The cellular levels of E-cadherin were increasedfor the treated HT29 cells and the Caco-2 cells treated for48 and 96 h. The HT29 cells showed an increase of 50%,which was similar to the results for the Caco-2 cells treatedfor 96 h. The Caco-2 cells treated for 48 h showed thegreatest increase in E-cadherin protein expression. On theother hand, no E-cadherin signal was detected for either thetreated or control ARPE-19 cells, respectively (see lanes 9and 10 in Figure 7).
Gene Expression Analysis Shows an Increase in Clau-din 3 mRNA Levels for Three of the Intestinal Cell Lines
Treated with PP2.Since its inception, great advances havebeen made in oligonucleotide microarray technology. Itsrapid development was triggered by the joining of photoli-thography and solid-phase synthesis to produce the Gene-Chip, which can interrogate a complex mixture in a highly
(20) Fodor, S. P.; Read, J. L.; Pirrung, M. C.; Stryer, L.; Lu, A. T.;Solas, D. Light-directed, spatially addressable parallel chemicalsynthesis.Science1991, 251 (4995), 767-773.
(21) Fodor, S. P.; Rava, R. P.; Huang, X. C.; Pease, A. C.; Holmes,C. P.; Adams, C. L. Multiplexed biochemical assays withbiological chips.Nature1993, 364 (6437), 555-556.
(22) Chee, M.; Yang, R.; Hubbell, E.; Berno, A.; Huang, X. C.; Stern,D.; Winkler, J.; Lockhart, D. J.; Morris, M. S.; Fodor, S. P.Accessing genetic information with high-density DNA arrays.Science1996, 274 (5287), 610-614.
(23) Lipshutz, R. J.; Fodor, S. P.; Gingeras, T. R.; Lockhart, D. J.High-density synthetic oligonucleotide arrays.Nat. Genet. 1999,21 (Suppl. 1), 20-24.
Figure 3. Light microscopy images of subconfluent HT29 and ARPE-19 cells. (a) HT29 cells treated for 48 h with PP2 form cellclusters. (b) After 48 h, control HT29 cells formed a complete monolayer. (c) ARPE-19 cells treated for 48 h with PP2 aredepicted. (d) Control ARPE-19 cells after 48 h of growth are shown. No visible differences can be found between panels c andd. (Magnification of 2.5× for all images.)
Effects of PP2 on Adhesion Molecules articles
VOL. 2, NO. 3 MOLECULAR PHARMACEUTICS 177
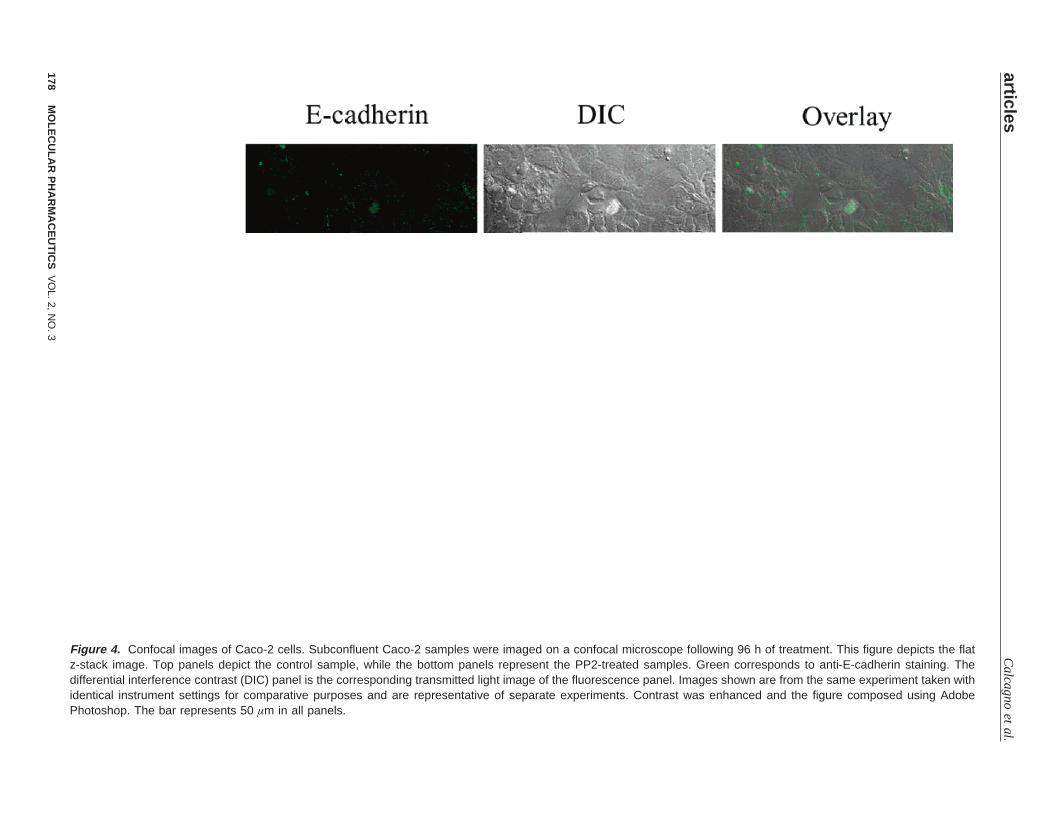
Figure 4. Confocal images of Caco-2 cells. Subconfluent Caco-2 samples were imaged on a confocal microscope following 96 h of treatment. This figure depicts the flatz-stack image. Top panels depict the control sample, while the bottom panels represent the PP2-treated samples. Green corresponds to anti-E-cadherin staining. Thedifferential interference contrast (DIC) panel is the corresponding transmitted light image of the fluorescence panel. Images shown are from the same experiment taken withidentical instrument settings for comparative purposes and are representative of separate experiments. Contrast was enhanced and the figure composed using AdobePhotoshop. The bar represents 50 µm in all panels.
articlesC
alca
gn
oe
ta
l.
178M
OLE
CU
LAR
PH
AR
MA
CE
UT
ICS
VO
L.2,NO
.3
parallel manner.20-23 This robust technology was the perfectchoice for the evaluation of the effects of this Src kinaseinhibitor on the gene expression of several human adherentepithelial cell lines. The effects on each individual cell lineas well as a comparison of all cell lines were evaluated. Dueto the cytotoxicity of PP2 in the LS174T cells, only thecontrol cells were analyzed with microarrays.
The hierarchical clustering, a popular technique forclustering microarray data, is presented in Figure 8. This
indicates the patterns in gene expression profiles across thedifferent experimental conditions. The dendrogram represent-ing the experimental conditions shows that three majorgroups were found. Clusters are formed for the cell lineswhich show similar gene expression for all the probe sets(>12000) on the microarray. The Caco-2 cells, which weretreated for 48 and 96 h, as well as the controls for each con-dition were clustered to form the first group. The next groupwas made up of the remaining intestinal cell lines, indicating
Figure 5. The top panel is the full z-stack image of the control sample, and the bottom panel shows the PP2-treated samplein the full z-stack image. The bar represents 50 µm.
Effects of PP2 on Adhesion Molecules articles
VOL. 2, NO. 3 MOLECULAR PHARMACEUTICS 179

that these cell lines have similar gene expression patterns.The last group contains the ARPE-19 retinal epithelial cells.First of all, the dendrogram shows that the gene expressionpatterns for the treated and control Caco-2 cells are unrelatedto those of the other three intestinal cell lines as the Caco-2cells form their own cluster. This occurrence is quite surpris-ing. This dendrogram also displays that for all experimentalconditions the duplicate microarrays form clusters, indicatingthat that the results were reproducible. Interestingly, the PP2-treated results for a given cell line always formed a largercluster with its untreated controls. This suggests that the PP2
treatment did not change gene expression so dramaticallyacross all the probe sets for these cell lines.
After normalizing the data by magnitude adjustment,analysis was begun by searching for trends in the data.Profiles were searched using the Spotfire software, and nouniform response was displayed to the treatment with PP2in the epithelial cell lines studied. Table 1 displays theexpression data for a list of adhesion molecules from thetight junction, adherens junction, and desmosomes, regulatorsof cell-cell adhesion, and the Src family members. This chartindicates expression of the genes for each cell type and any
Figure 6. Transepithelial electrical resistance (TER) responses to PP2 exposure. (a) ARPE-19 confluent monolayers show adecrease in TER following treatment with PP2. (b) Confluent monolayers of Caco-2 cells treated with PP2 show an increase inTER after 96 h of treatment. PP2 (20 µM) was added to the confluent monolayers after 9 days of growth and exchanged dailythereafter. TER values of PP2-treated cells (n ) 3) were compared to TER values of control cells (n ) 3) and presented as % ofcontrol. The statistically significant difference between the control and treated samples was determined using a paired t-test foreach time point.
articles Calcagno et al.
180 MOLECULAR PHARMACEUTICS VOL. 2, NO. 3

significant changes in expression. An “A” represents absenceand no expression, while “P” indicates presence and gene ex-pression. A 2-fold change was used as the criterion for signif-icant gene expression changes. Treatment with PP2 did causesome changes in gene expression within these cells; however,most changes were less than the 2-fold criterion. Claudin 3showed a 2-fold increase after treatment with PP2 in theHCT-116, HT29, and Caco-2 cells treated for 48 h. In theHT29 cells, desmoplakin also showed an increase in expres-sion following treatment with PP2. In the ARPE-19 cells,there was a 2-fold decrease in expression in integrin alpha 1.
For certain genes, exposure to the PP2 caused their geneexpression to be absent, although expression was detectedin control cells for these genes. A designation of A/P wasused, indicating that the gene was absent for the treated cellsyet present for the control cells. Alpha actin, YES, and HCKare three genes that displayed this behavior in the HT29 cells.Protein kinase 2 beta is another gene in Caco-2 cells treatedfor 96 h that was absent after treatment. The HCT-116 cellsexhibited the opposite effect for protein kinase 2 beta andFYN in which exposure to PP2 caused gene expression tooccur, designated as P/A.
DiscussionMany compounds have been tested for selective inhibition
of the Src family members.24,25 Cell type dictates the
Figure 7. Western blot for E-cadherin (120 kDa) and beta actin (42 kDa) after PP2 treatment. (a) The total protein loaded was4.5 µg per lane. The legend below indicates the samples present within each lane. No signal was detected for E-cadherin inlanes 9 and 10, which corresponds to the ARPE-19 samples. (b) The comparison of the E-cadherin signal for control and treatedcells is presented in this graph. HCT-116 cells show a decrease in total E-cadherin after PP2 treatment for 48 h. Increases inprotein levels of E-cadherin were seen in HT29 cells treated for 48 h, Caco-2 cells treated for 48 h, and Caco-2 cells treatedwith PP2 for 96 h.
Figure 8. Hierarchical clustering of all microarrays usingcosine correlation as the distance metric and the completelinkage joining method. Hierarchical clustering using cosinecorrelation as the distance metric and the complete linkagejoining method was performed using Spotfire FunctionalGenomics software to identify patterns in the microarray data,whereby three groups demonstrated significantly differentgene expression profiles. Cell lines with similar gene expres-sion patterns are clustered together to form a group. Groupone, located on the left, contains all the Caco-2 treatments.Group two consists of the remaining intestinal cell lines, andthe last group is the ARPE-19 cells. The numbers below thedendrogram indicate the sample identification.
Effects of PP2 on Adhesion Molecules articles
VOL. 2, NO. 3 MOLECULAR PHARMACEUTICS 181

expression of Src family members; several Src kinases areexpressed ubiquitously.9 PP2 has been shown to be a potentand selective inhibitor of several Src family members atnanomolar ranges in vitro and low micromolar concentrationsin intact cells; however, PP2 cannot differentiate betweenthe various members of the Src family.16 Investigators haveshown that treatment with 20µM PP2 caused 40-50%growth inhibition in HT29 cells.13 These factors promptedthe use of 20µM PP2 in our studies to investigate the effectsin several other epithelial cell lines. All subconfluentintestinal epithelial cells treated with PP2 showed similarpatterns in cell clustering when examined with light micros-copy. The retinal epithelial cell line, ARPE-19, did not showany morphological changes after PP2 treatment. This sug-gests that the effects of PP2 may not be similar in allepithelial cell lines at this concentration and dose schedule.This phenomenon has been reported previously by otherinvestigators as Src effects have been shown to be cell-typespecific. In particular, in primary keratinocytes isolated fromdouble knockout mice for Src and Fyn, cell adhesion isdefective, indicating the same type of role for Src and Fynin adhesion processes.26 PP2 was found to be cytotoxic tothe LS174T cells. This observation is consistent with theeffects of Src inhibitors in other cell lines. Inhibitors of Srccause inhibition of cell growth and the induction of apoptosisin A431 cells;27 mitotic arrest was reported in breast cancercell lines following treatment with another selective tyrosinekinase inhibitor.28 Recent studies report that the inhibitionof both focal adhesion kinase (FAK) and Src leads toapoptosis in colon cancer cells.29 Our microarray datasuggests that the LS174T cells express the lowest amountof FAK compared to the other intestinal cell lines and thatPP2 treatment causes FAK to increase in expression in theother intestinal cell lines. It is possible that the LS174T cellsmay be more susceptible to apoptosis or mitotic arrest dueto the low expression of FAK, which induces PI3K-AKTdependent anti-apoptotic pathways; however, the exactmechanism is unknown at this time.
PP2 effects on E-cadherin were further investigated byconfocal microscopy. Caco-2 cells treated for 96 h with PP2showed a redistribution of E-cadherin to the points of cellcontact. Cells grew as a thick cluster whereas the controlcells formed a thin monolayer with diffuse staining ofE-cadherin. Similar results were reported in human epidermalkeratinocytes treated with the tyrosine kinase inhibitor,PD162531.14 ARPE-19 control cells were also immun-ostained with the E-cadherin antibody DECMA-1 after 7 daysof growth (data not shown); however, a very low fluores-cence signal was obtained even at the highest concentrationsof antibody. The lack of morphological changes seen in theARPE-19 cells, the lack of staining for E-cadherin, and thelack of a signal for E-cadherin in the Western blot andmicroarray studies indicate that E-cadherin was not presentwithin these cells including those grown for 7 days. Dif-ferentiation of ARPE-19 cells occurs within 3-4 weeks afterreaching confluency.30 Previous investigators report thatE-cadherin expression occurs in late confluence in cells thatalready express N-cadherin and only in a subset of epithelioidcells;31 therefore, E-cadherin would not be expected to befound in our cells. The ARPE-19 cells have been a usefultool in understanding the importance of E-cadherin in theinhibition of Src.
The increase in TER in confluent Caco-2 monolayers withthe inhibition of Src is consistent with the increase in celladhesion. The decrease in the ARPE-19 cells may be due toa decrease in N-cadherin which is constitutively expressedin these cells regardless of confluency time and sinceE-cadherin is not present. The mRNA levels of N-cadherindecreased by 2.3-fold after treatment with PP2, and no otheradhesion molecule expressed in ARPE-19 cells shows asignificant change in expression. The mannitol flux data isnot consistent with the increase in TER for the Caco-2 cells;however, flux assays are not as sensitive to small changesin permeability, and they possess lower time resolutioncompared to TER measurements.32 It has been reported thatchanges in TER do not always correlate with flux studies.32,33
Changes in the intercellular space where E-cadherin is locatedcan cause a change in TER, which reflects the resistance ofboth the tight junction and intercellular space. For the fluxassay, the tight junction serves as the first barrier for thepermeation of mannitol, and changes in the intercellular spacemay not affect the permeability of the tight junction. Thecontrol cells show less paracellular permeability than the
(24) Lawrence, D. S.; Niu, J. Protein kinase inhibitors: the tyrosine-specific protein kinases.Pharmacol. Ther. 1998, 77 (2), 81-114.
(25) Bain, J.; McLauchlan, H.; Elliott, M.; Cohen, P. The specificitiesof protein kinase inhibitors: an update.Biochem. J. 2003, 371(Part 1), 199-204.
(26) Calautti, E.; Grossi, M.; Mammucari, C.; Aoyama, Y.; Pirro, M.;Ono, Y.; Li, J.; Dotto, G. P. Fyn tyrosine kinase is a downstreammediator of Rho/PRK2 function in keratinocyte cell-cell adhesion.J. Cell Biol. 2002, 156 (1), 137-148.
(27) Karni, R.; Levitzki, A. pp60(cSrc) is a caspase-3 substrate and isessential for the transformed phenotype of A431 cells.Mol. CellBiol. Res. Commun. 2000, 3 (2), 98-104.
(28) Moasser, M. M.; Srethapakdi, M.; Sachar, K. S.; Kraker, A. J.;Rosen, N. Inhibition of Src kinases by a selective tyrosine kinaseinhibitor causes mitotic arrest.Cancer Res. 1999, 59 (24), 6145-6152.
(29) Golubovskaya, V. M.; Gross, S.; Kaur, A. S.; Wilson, R. I.; Xu,L.-H.; Yang, X. H.; Cance, W. G. Simultaneous Inhibition of FocalAdhesion Kinase and Src Enhances Detachment and Apoptosisin Colon Cancer Cell Lines.Mol. Cancer Res. 2003, 1 (10), 755-764.
(30) Dunn, K. C.; Aotaki-Keen, A. E.; Putkey, F. R.; Hjelmeland, L.M. ARPE-19, a human retinal pigment epithelial cell line withdifferentiated properties.Exp. Eye Res. 1996, 62 (2), 155-169.
(31) Burke, J. M.; Cao, F.; Irving, P. E.; Skumatz, C. M. Expressionof E-cadherin by human retinal pigment epithelium: delayedexpression in vitro.InVest. Ophthalmol. Visual Sci. 1999, 40 (12),2963-2970.
(32) Yap, A. S.; Mullin, J. M.; Stevenson, B. R. Molecular analysesof tight junction physiology: insights and paradoxes.J. Membr.Biol. 1998, 163 (3), 159-167.
(33) Mitic, L. L.; Anderson, J. M. Molecular architecture of tightjunctions.Annu. ReV. Physiol. 1998, 60, 121-142.
articles Calcagno et al.
182 MOLECULAR PHARMACEUTICS VOL. 2, NO. 3

treated cells. This also suggests that the effects of inhibitingSrc are less prominent when the cells are more mature.Studies indicate that endocytosis of E-cadherin is decreasedin confluent MDCK II cells compared to preconfluent cells.34
Protein expression levels of E-cadherin are increased inHT29 and Caco-2 cells following treatment with PP2. Namet al. reported similar results for HT29 cells.13 It is possiblethat the inhibition of Src prevents the internalization ofE-cadherin and its subsequent proteolysis. PP2 treatment mayalso cause transcriptional activation of E-cadherin or itsposttranslational modifications. Further studies are necessaryto determine which mechanism is responsible for theincrease. In the HCT-116 cells, there is a decrease in thetotal protein levels of E-cadherin. Our microarray data forHCT-116 shows a decrease of nearly 1.5-fold in geneexpression forR-catenin. Studies by Hinck et al. show thatadhesion can be restored in human lung cancer cells whichlack R-catenin but express E-cadherin by transfectingR-cate-nin into these cells.35 This suggests that the interactionbetween E-cadherin andR-catenin is vital for cell-celladhesion. A decrease inR-catenin would cause E-cadherinto be easily removed from the lateral surface of the cellsbecause there would be no linkage to the actin cytoskeleton.
Differences in cell types may account for the decrease inthis cell line. The effects of PP2 may not be as prevalent inthis cell line after prolonged exposure. As mentionedpreviously, the ARPE-19 cells would not be expressingE-cadherin at this stage of their growth, and this was foundin the Western blot results.
Inhibition of the Src family of tyrosine kinases by PP2produced very few changes at the gene expression level forthe adhesion molecules studied. A 2-fold change was usedas the guideline for significant changes. Others have reportedan increase in E-cadherin mRNA expression in HT29 cellsafter treatment with PP2.13 In this work, there was a smallincrease in E-cadherin expression in the HT29 cells; however,it is far less than the 2-fold criterion. For the other intestinalepithelial cells studied, no changes were found in thegenomic expression of E-cadherin. The results of E-cadherinmRNA expression in these three intestinal cell lines wereconfirmed by SYBR-green real-time PCR (data not shown).The LS174T data is included in Table 1, although itrepresents only the expression level in the control cells andnot the comparison of treated and control as in the othercell lines due to the cytotoxicity of PP2 to the LS174T cells.The ARPE-19 cells show no mRNA expression of E-cadherinafter 48 h of growth; this again confirms the results of theWestern blotting. The differences in mRNA and proteinlevels of E-cadherin for the other cells could be due to
various circumstances, including posttranslational modifica-tions, degradation, posttranslational splicing, and messengerstability.36
Only one adhesion molecule, Claudin 3, showed such anincrease for all the intestinal cell lines treated with PP2 for48 h. There was no change, however, in the gene expressionof Claudin 3 in ARPE-19 cells. Claudin 3, a component ofthe tight junctions consisting of four transmembrane domains,was recently discovered.37 The importance of the claudinfamily in the regulation of the tight junctions has recentlybeen demonstrated. Investigators have shown that the threemembrane associated guanine kinases (MAGUKs), ZO-1,ZO-2, and ZO-3, are still recruited to the tight junctions inoccludin-deficient mice and that these MAGUKs, whichcross-link the tight junctional proteins to the actin filaments,also bind to the carboxy terminal of claudins in addition tobinding to occludin.38 Introduction of Claudin 2 into MDCKI cells converted these cells into a more permeable or leakycell type; however, no decrease in paracellular permeabilitywas reported when Claudin 3 was added.39 This indicatesthat expression of Claudin 3 may increase cell adhesion.Thus, our findings suggest a possible relationship betweenSrc inhibition and Claudin 3 expression. Phosphorylationplays a critical role in the interactions within the tightjunction. Tyrosine phosphorylation of ZO-1 increases fol-lowing oxidative stress, and studies implicate this tyrosinephosphorylation in disrupting the interaction between theoccludin-ZO-1 complex and actin cytoskeleton, leading toan increase in paracellular permeability.40 The exact relation-ship between Claudin 3 and Src family members is yet tobe established; however, this work suggests that one mightexist.
Desmoplakin in the HT29 cells also showed an increasein expression after exposure to PP2. Desmoplakin interactswith plakoglobin within the desmosomes, and plakoglobinis a known substrate of the Src family of tyrosine kinases.11
This increase in expression suggests the possibility that the
(34) Le, T. L.; Yap, A. S.; Stow, J. L. Recycling of E-cadherin: apotential mechanism for regulating cadherin dynamics.J. CellBiol. 1999, 146 (1), 219-232.
(35) Hinck, L.; Nathke, I. S.; Papkoff, J.; Nelson, W. J. Dynamics ofcadherin/catenin complex formation: novel protein interactionsand pathways of complex assembly.J. Cell Biol. 1994, 125 (6),1327-1340.
(36) Celis, J. E.; Kruhoffer, M.; Gromova, I.; Frederiksen, C.;Ostergaard, M.; Thykjaer, T.; Gromov, P.; Yu, J.; Palsdottir, H.;Magnusson, N.; Orntoft, T. F. Gene expression profiling: moni-toring transcription and translation products using DNA microar-rays and proteomics.FEBS Lett. 2000, 480 (1), 2-16.
(37) Morita, K.; Furuse, M.; Fujimoto, K.; Tsukita, S. Claudinmultigene family encoding four-transmembrane domain proteincomponents of tight junction strands.Proc. Natl. Acad. Sci. U.S.A.1999, 96 (2), 511-516.
(38) Itoh, M.; Furuse, M.; Morita, K.; Kubota, K.; Saitou, M.; Tsukita,S. Direct binding of three tight junction-associated MAGUKs,ZO-1, ZO-2, and ZO-3, with the COOH termini of claudins.J.Cell Biol. 1999, 147 (6), 1351-1363.
(39) Furuse, M.; Furuse, K.; Sasaki, H.; Tsukita, S. Conversion ofzonulae occludentes from tight to leaky strand type by introducingclaudin-2 into Madin-Darby canine kidney I cells.J. Cell Biol.2001, 153 (2), 263-272.
(40) Rao, R. K.; Basuroy, S.; Rao, V. U.; Karnaky Jr, K. J.; Gupta, A.Tyrosine phosphorylation and dissociation of occludin-ZO-1 andE-cadherin-beta-catenin complexes from the cytoskeleton byoxidative stress.Biochem. J. 2002, 368 (Part 2), 471-481.
Effects of PP2 on Adhesion Molecules articles
VOL. 2, NO. 3 MOLECULAR PHARMACEUTICS 183

stabilization of plakoglobin requires a greater supply ofdesmoplakin for interactions with the intermediate filaments.
Table 1 also lists one other regulator of cell adhesion thatchanged expression levels. This is integrin alpha 1, whichshows a decrease in ARPE-19 cells. Integrins are able toactivate Src kinases which, in turn, phosphorylate proteinsinvolved in integrin-mediated events; investigators also haveshown that Src can function as a scaffold to regulate signalingof integrins.41 This suggests that the inhibition of Src maydecrease the amount of integrin needed. In regard to the genesthat were either turned on or turned off by PP2 treatment, ithas been suggested that various genes show transcription thatis positively or negatively regulated by v-Src. Varioustranscriptional control elements have been implicated in Src’stranscriptional activation.3
The actions of the Src family of tyrosine kinases influencea variety of functions within the body, including celladhesion. Recent discoveries have implicated Src in theendocytosis of E-cadherin since the phosphorylation by Srctriggers the E-cadherin complex to be ubiquitinated by Hakaiand endocytosed in MDCK cells, a model canine epithelialcell.12 Hakai has been shown to interact only with E-cadherin,and studies indicate that this interaction is dependent ontyrosine phosphorylation.
Regulation of the E-cadherin complex plays a critical rolenot only in cell adhesion but also in metastasis, cell invasion,and wound healing. Inhibition of Src in human epidermalkeratinocytes results in enhanced cell adhesion throughE-cadherin even in low calcium concentrations; yet it inhibitswound repair in vitro.14 Src, Fyn, and Yes are all presentwithin the adherens junction. At this time, the disruption ofcell-cell adhesion at the adherens junction cannot beattributed to a particular member of the Src family.14 Owenset al. have shown that the catalytic activity of one or moreof these endogenous Src members is necessary to disassociatecadherin interactions at the adherens junction.14 Studies inCaco-2 cells show that oxidative stress induces activationand translocation of Src.42 This results in the phosphorylation
of components of the tight and adherens junctions and thedissociation of the tight junctions, which increases paracel-lular permeability.
Treatment of epithelial cells with a selective inhibitor ofthe Src family of tyrosine kinases resulted in increased celladhesion in the intestinal cell lines. Caco-2, HT29, and HCT-116 cells displayed cell clustering and compaction, indicatingincreased cell adhesive properties. E-cadherin redistributedto the points of cell contact in Caco-2 cells following PP2treatment. Decreases in TER in ARPE-19 cells followingPP2 treatment may be attributed to the lack of E-cadherinexpression at the early stages of cell growth or possibly thedecrease in another junctional protein. On the other hand,Caco-2 cells exhibited higher TER values after PP2 treat-ment, suggesting that the junctional components, includingE-cadherin, were enhanced. The total protein levels ofE-cadherin increased for all cells except HCT-116, whichshowed a decrease. The lack of expression of E-cadherin atthe protein or mRNA level of the ARPE-19 cells confirmedearlier reports that these cells do not express E-cadherin atearly growth stages. The ARPE-19 cells do not expressE-cadherin after 48 h of growth; however, they do expressother adhesion molecules. The expression of the adhesionmolecules varied for the cell lines studied, and only Claudin3 showed a significant increase in three of the cell linestreated with PP2. These studies suggest that Src may regulatethe expression of this claudin family member althoughadditional work is necessary to understand this relationship.Cell type is an important factor in the expression levels ofadhesion molecules after treatment by PP2. The exactrelationship between E-cadherin and the Src family oftyrosine kinases needs to be elucidated; however, on the basisof these results, it seems reasonable to conclude that Src iscrucial for the regulation of cell adhesion in epithelial cells.
Acknowledgment. We thank Dr. Joseph A. Vetro, Dr.Karen L. Leach, and Dr. James Christensen for criticallyreviewing this manuscript and providing useful suggestions.We thank Pharmacia Corporation for providing A.M.C. theinternship opportunity. A.M.C. was supported by the AFPEPredoctoral Fellowship, a Merck Tuition Fellowship, and thePharmacia Internship Program. This work was also supportedby funding from NIH grants (GM-08359 and EB-00226).We thank Nancy Harmony for her help in preparing thismanuscript.
MP0499003
(41) Cary, L. A.; Klinghoffer, R. A.; Sachsenmaier, C.; Cooper, J. A.SRC catalytic but not scaffolding function is needed for integrin-regulated tyrosine phosphorylation, cell migration, and cellspreading.Mol. Cell. Biol. 2002, 22 (8), 2427-2440.
(42) Basuroy, S.; Sheth, P.; Kuppuswamy, D.; Balasubramanian, S.;Ray, R. M.; Rao, R. K. Expression of Kinase-inactive c-Src DelaysOxidative Stress-induced Disassembly and Accelerates Calcium-mediated Reassembly of Tight Junctions in the Caco-2 CellMonolayer.J. Biol. Chem. 2003, 278 (14), 11916-11924.
articles Calcagno et al.
184 MOLECULAR PHARMACEUTICS VOL. 2, NO. 3