Regulation of Cell Adhesion Strength by Spatial Organization of Focal Adhesions
159
University of South Florida Scholar Commons Graduate eses and Dissertations Graduate School 2011 Regulation of Cell Adhesion Strength by Spatial Organization of Focal Adhesions Kranthi Kumar Elineni University of South Florida, [email protected] Follow this and additional works at: hp://scholarcommons.usf.edu/etd Part of the American Studies Commons , Biomechanics Commons , Cell Biology Commons , and the Mechanical Engineering Commons is Dissertation is brought to you for free and open access by the Graduate School at Scholar Commons. It has been accepted for inclusion in Graduate eses and Dissertations by an authorized administrator of Scholar Commons. For more information, please contact [email protected]. Scholar Commons Citation Elineni, Kranthi Kumar, "Regulation of Cell Adhesion Strength by Spatial Organization of Focal Adhesions" (2011). Graduate eses and Dissertations. hp://scholarcommons.usf.edu/etd/3088
Transcript of Regulation of Cell Adhesion Strength by Spatial Organization of Focal Adhesions

University of South FloridaScholar Commons
Graduate Theses and Dissertations Graduate School
2011
Regulation of Cell Adhesion Strength by SpatialOrganization of Focal AdhesionsKranthi Kumar ElineniUniversity of South Florida, [email protected]
Follow this and additional works at: http://scholarcommons.usf.edu/etd
Part of the American Studies Commons, Biomechanics Commons, Cell Biology Commons, andthe Mechanical Engineering Commons
This Dissertation is brought to you for free and open access by the Graduate School at Scholar Commons. It has been accepted for inclusion inGraduate Theses and Dissertations by an authorized administrator of Scholar Commons. For more information, please [email protected].
Scholar Commons CitationElineni, Kranthi Kumar, "Regulation of Cell Adhesion Strength by Spatial Organization of Focal Adhesions" (2011). Graduate Thesesand Dissertations.http://scholarcommons.usf.edu/etd/3088

Regulation of Cell Adhesion Strength by Spatial Organization of Focal Adhesions
by
Kranthi Kumar Elineni
A dissertation submitted in partial fulfillment of the requirements for the degree of
Doctor of Philosophy Department of Mechanical Engineering
College of Engineering University of South Florida
Major Professor: Nathan Gallant, Ph.D. Alex Volinsky, Ph.D.
Craig Lusk, Ph.D. Ryan Toomey, Ph.D.
Jaya Padmanabhan, Ph.D.
Date of Approval: September 27, 2011
Keywords: Micropatterning, Cell Traction, Integrin, Biomaterial, Tissue Engineering
Copyright © 2011, Kranthi Kumar Elineni

Dedication
I would like to dedicate this dissertation to my wonderful family, particularly to
my parents, Dr. Raghava Rao Elineni and Kanaka Durga Valli Elineni who believed in
hard work, perseverance and compassion as the ultimate elements that lead to a
successful and fulfilling life, and my brother Sravan Kumar Elineni who always believed
and supported my pursuit of academic excellence.

Acknowledgements
I express my sincere gratitude to a group of like-minded people who believed in
me and without whom this accomplishment in life would have been less cherishing. I
thank my major advisor and mentor Dr. Nathan Gallant for giving me this wonderful
opportunity. I am extremely fortunate to have an advisor who gave me the freedom to
explore the vast realm of science and at the same time guided me in the right direction
when I was lost. I also thank all my committee members for their valuable insights into
research and for helping me understand the fundamentals of this interdisciplinary
research project; particularly, Dr. Alex Volinsky for his insights into material science, Dr.
Craig Lusk for exploration into elasticity theory, Dr. Ryan Toomey for his valuable
insights into polymers and smart materials and Dr. Jaya Padmanabhan for introducing me
to the methods in molecular biology. I thank my parents Dr. Raghava Rao Elineni and
Kanaka Durga Valli Elineni for creating a wonderful atmosphere at home and for
nurturing the scientific insight I had from my childhood. I thank my brother Sravan
Kumar Elineni for his constant support and encouragement throughout my academic
career. I would like to thank all my friends for understanding and sharing my passion and
dedication for research especially Navya Bellamkonda, Subba Reddy Bhimavarapu and
Praveen Kumar Chalamalasetty. I would like to thank all the members of the lab who
shared my enthusiasm and helped me during the tough times. Lastly, I would like to
thank the staff of the Mechanical Engineering department for making this a smooth
academic journey.

i
Table of Contents
List of Tables ..................................................................................................................... iii
List of Figures .................................................................................................................... iv
Abstract ............................................................................................................................. vii
Chapter 1. Introduction ........................................................................................................1 1.1 Project Significance ...........................................................................................1 1.2 Specific Aims .....................................................................................................2
Chapter 2. Literature Review ...............................................................................................5 2.1 Integrin Mediated Cell Adhesion .......................................................................5 2.2 Cell Adhesion Strengthening and Focal Adhesion Assembly ...........................6 2.3 Model of Cell Adhesion Strengthening .............................................................8 2.4 Regulation of Cell Adhesion Strength by Complex Interplay Between
Adhesive Components and Cytoskeletal Architecture ....................................10 2.5 Quantitative Assays for Measuring Cell Adhesion ..........................................11
2.5.1 Centrifugation Assay ....................................................................... 12 2.5.2 Hydrodynamic Shear Assay ............................................................. 12
2.5.2.1 Spinning Disk Device ....................................................... 13 2.5.2.2 Radial Flow Chamber ....................................................... 14 2.5.2.3 Parallel Plate Flow Chamber ............................................ 15
2.5.3 Micromanipulation ........................................................................... 16 2.6 Selective Protein Patterning to Manipulate Cell Adhesive Interface ...............16
2.6.1 Microcontact Printing ...................................................................... 17 2.6.2 Patterning Proteins with Self Assembled Monolayers ..................... 18
2.7 List of References ............................................................................................22
Chapter 3. Micropatterned Surfaces to Control Cell Adhesive Area and Cell Spreading Area .................................................................................................29
3.1 Introduction ......................................................................................................29 3.2 Experimental Section .......................................................................................30 3.3 Results and Discussion ....................................................................................32 3.4 Conclusions ......................................................................................................34 3.5 List of References ............................................................................................41
Chapter 4. Microcontact Printing with Stamps Prone to Irreversible Roof Collapse ........44 4.1 Introduction ......................................................................................................44 4.2 Experimental Section .......................................................................................48

ii
4.3 Results ..............................................................................................................49 4.4 Discussion ........................................................................................................66 4.5 Conclusions ......................................................................................................72 4.6 List of References ............................................................................................88
Chapter 5. Regulation of Cell Adhesion Strength by Peripheral Focal Adhesion Distribution ......................................................................................................91
5.1 Introduction ......................................................................................................91 5.2 Experimental Section .......................................................................................94 5.3 Results ..............................................................................................................98 5.4 Discussion ......................................................................................................102 5.5 Conclusions ....................................................................................................108 5.6 List of References ..........................................................................................118
Chapter 6. Mechanical Role of Microtubules in the Evolution of Cell Adhesion Strength ..........................................................................................................121
6.1 Introduction ....................................................................................................121 6.2 Experimental Section .....................................................................................123 6.3 Results and Discussion ..................................................................................127 6.4 Conclusion .....................................................................................................132 6.5 List of References ..........................................................................................141
Chapter 7. Conclusions and Future Considerations .........................................................143

iii
List of Tables
Table 5.1 Micropattern dimensions and corresponding areas ........................................ 110

iv
List of Figures
Fig 2.1 Diagram of a focal adhesion showing the clustering of integrins binding to surface-adsorbed FN. .............................................................................................19
Fig 2.2 Spinning disk and shear stress profile. ..................................................................20
Fig 2.3 Macroscopic and microscopic model for adhesion strengthening. ........................21
Fig 3.1 Schematic diagram delineating cell adhesive area and cell spreading area ..........35
Fig 3.2 Schematic diagram of process flow for micropatterned substrate preparation .............................................................................................................36
Fig 3.3 Conventional μCP did not prevent roof collapse initiation and propagation for stamps with fill factor of 0.5% and structure aspect ratio of 35:1 ...................37
Fig 3.4 Immunostaining indicates fibronectin adsorbed only to micropatterned islands ....................................................................................................................38
Fig 3.5 Representative phase contrast images of micropatterned cells .............................39
Fig 3.6 Immunostained images of fibronectin and vinculin and intensity plots of vinculin on micropatterned cells ............................................................................40
Fig 4.1 Conventional μCP did not prevent roof collapse initiation and propagation for stamps with fill factor of 0.5% and structure aspect ratio of 35:1 ...................74
Fig 4.2 Sequential images during μCP (0 to 1890 ms) show roof collapse propagation ............................................................................................................75
Fig 4.3 Micrograph of the substrate, etched after the collapse propagation (moving left to right) was interrupted ....................................................................76
Fig 4.4 Schematic showing the initiation of conformal contact on peripheral protruding features .................................................................................................77
Fig 4.5 Theoretically obtained values for % of axial compression of the stamp features vs % of stamp features in contact with the substrate during initial conformal contact for various fill factors ...............................................................78

v
Fig 4.6 Representative images of substrates patterned using conventional μCP on gold substrates ........................................................................................................79
Fig 4.7 Schematic showing the initiation of conformal contact at a point on the recessed plane due to erroneous roof contact .......................................................80
Fig 4.8 Representative images of the substrates patterned successfully with a stamp fabricated with features from end to end ...................................................81
Fig 4.9 Erroneous roof contact at the periphery due to an extended recessed plane resulted in spontaneous roof collapse initiation and propagation ........................82
Fig 4.10 Schematic representation of the stamp with discrete square pattern zones and enlarged image from one square pattern zone showing the stamp features. ...............................................................................................................83
Fig 4.11 Schematic of the stamp-substrate interface during conformal contact and representative microscopic image .......................................................................84
Fig 4.12 An annular support column prevented roof collapse propagation into the pattern zone .........................................................................................................85
Fig 4.13 Representative images of various feature geometries printed with the help of annular column .......................................................................................86
Fig 4.14 An annulus with structural aspect ratio of 11500:1 .............................................87
Fig 5.1 Schematic diagram of cells adhered to micropatterned islands that delineate cell adhesive area and cell spreading area ............................................111
Fig 5.2 Immunostained image of a cell ............................................................................112
Fig 5.3 Immunostaining indicates fibronectin adsorbed only to micropatterned islands ..................................................................................................................113
Fig 5.4 Immnunostained images showing fibronectin, actin, nucleus and vinculin on micropatterned islands ....................................................................................114
Fig 5.5 Mean adhesion strength (50) at steady state for cells patterned on micropatterned domains .......................................................................................115
Fig 5.6 Cell spreading area and cell adhesive area ..........................................................116
Fig 5.7 The experimental cell adhesion strength-spreading relationship for peripherally distributed focal adhesions agrees well with theoretical predictions of the adhesive patch model ..............................................................117
Fig 6.1 Fluorescent images of microtubules stained by tubulin tracker ..........................133
vi
Fig 6.2 Immunostained images of cells under various treatment conditions with and without nocodazole .......................................................................................134
Fig 6.3 Cell spreading area dependence on various treatment conditions with serum and nocodazole. .........................................................................................135
Fig 6.4 Dependence of the circularity of cells under various treatment conditions with serum and nocodazole. .................................................................................136
Fig 6.5 Variation of adhesion strength with respect to various treatment conditions with serum and nocodazole. .................................................................................137
Fig 6.6 Immunostained images of fibronectin coated micropatterned islands ................138
Fig 6.7 Adhesion strength of cells cultured in serum showing approximately 10 fold variation between nocodazole untreated and treated cells on micropatterned islands. ........................................................................................139
Fig 6.8 Temporal evolution of adhesion strength for cells cultured in serum and cells cultured in serum and nocodazole ...............................................................140

vii
Abstract
Cell adhesion to extracellular matrix (ECM) is critical to various cellular
processes like cell spreading, migration, growth and apoptosis. At the tissue level, cell
adhesion is important in the pathological and physiological processes that regulate the
tissue morphogenesis. Cell adhesion to the ECM is primarily mediated by the integrin
family of receptors. The receptors that are recruited to the surface are reinforced by
structural and signaling proteins at the adhesive sites forming focal adhesions that
connect the cytoskeleton to further stabilize the adhesions. The functional roles of these
focal adhesions extend beyond stabilizing adhesions and transduce mechanical signals at
the cell-ECM interface in various signaling events. The objective of this research is to
analyze the role of the spatial distribution of the focal adhesions in stabilizing the cell
adhesion to the ECM in relation to cell’s internal force balance.
The central hypothesis was that peripheral focal adhesions stabilize cell adhesion
to ECM by providing for maximum mechanical advantage for resisting detachment as
explained by the membrane peeling mechanism. Micropatterning techniques combined
with robust hydrodynamic shear assay were employed to test our hypothesis. However,
technical difficulties in microcontact printing stamps with small and sparse features made
it challenging to analyze the role of peripheral focal adhesions in stabilizing cell
adhesion. To overcome this limitation, the roof collapse phenomenon in stamps with
small and sparse features (low fill factor stamps) that was detrimental to the reproduction
of the adhesive geometries required to test the hypothesis was analyzed. This analysis

viii
lead to the valuable insight that the non-uniform pressure distribution during initial
contact caused by parallelism error during manual microcontact printing prevented
accurate replication of features on the substrate. To this end, the template of the stamp
was modified so that it included an annular column around the pattern zone that acted as
a collapse barrier and prevented roof collapse propagation into the pattern zone.
Employing this modified stamp, the required geometries for the cell adhesion analysis
were successfully reproduced on the substrates with high throughput.
Adhesive areas were engineered with circular and annular patterns to discern the
contribution of peripheral focal adhesions towards cell adhesion strength. The patterns
were engineered such that two distinct geometries with either constant adhesive area or
constant spreading area were obtained. The significance of annular patterns is that for the
same total adhesive area as the circular pattern, the annular pattern provided for greater
cell spreading thereby increasing the distance of the focal adhesions from the cell’s
center. The adhesion strength analysis was accomplished by utilizing hydrodynamic
shear flow in a spinning disk device that was previously developed. The results indicate
that for a constant total adhesive area, the annular patterns provide for greater adhesion
strength by enhancing cell spreading area and providing for greater moment arm in
resisting detachment due to shear.
The next examination was the effect of the cell’s internal force balance in
stabilizing the cell adhesion. The working hypothesis was that microtubules provide the
necessary forces to resist the tensile forces expressed by the cell contractile machinery,
thereby stabilizing cell adhesion. Since microtubule disruption is known to enhance cell
contractility, its effect on the cell adhesion strength was examined. Moreover, the force

ix
balance in cells was altered by engineering adhesive areas so that the cells were either
spherical or completely spread and then disrupted microtubules to understand the
significance of the force balance in modulating the cell adhesion strength. The results
indicated that disruption of microtubules in cells on adhesive islands resulted in a 10 fold
decrease in adhesion strength compared to untreated controls whereas no significant
change was observed in completely spread cells between treated and untreated controls.
This is in surprising contrast to the previous contractility inhibition studies which indicate
a less pronounced regulation of adhesion strength for both micropatterned and spread
cells. Taken together, these findings suggest that the internal force balance regulated by
cell shape strongly modulates the adhesion strength though the microtubule network.
In summary, this project elucidates the role of peripheral focal adhesions in
regulating the cell adhesion strength. Furthermore, this study also establishes the
importance of the internal force balance towards stabilizing the cell adhesion to the ECM
through the microtubule network.

1
Chapter 1. Introduction
1.1 Project Significance
Cell adhesion to the extracellular matrix (ECM) is a key to a cascade of cellular
events that govern the fate of the cell. While biochemical events explain signaling
mechanisms in a cell, a mechanistic understanding of the cell adhesion process provides
critical information on various cues that control mechanosensation, mechanotransduction
and mechanoresponse. Integrin-mediated cell adhesion to the ECM is central to cell
survival, migration, differentiation and proliferation. While significant contributions have
been made in identifying the functional roles of key components involved in cell
adhesion, there is still a gap in the understanding of the structure-function relationships
that govern the cell adhesion process. Specifically, cell adhesion is understood to be
strongly modulated by cell adhesive area which itself is tightly coupled to the spatial
focal adhesion (FA) organization. Hence it is unclear whether the spatial organization of
FAs or the total available cell adhesive area is responsible for the adhesion strength. This
research project is significant because it provides critical information on adhesion
strength modulation by delineating the contributions of spatial FA organization from total
available adhesive area. Moreover, these analyses along with systematic investigation on
the mechanistic connections between the cytoskeletal architecture and the FA sites
provide valuable information necessary to decipher the mechanisms of cellular force
balance which has been identified as a key that governs various cellular processes. The
goal of the project was to provide new insights into the positional role of FAs in

2
modulating cell-substrate adhesion strength in relation to the cell internal cytoskeletal
architecture. Moreover, present models of cell adhesion consider the interactions of
cytoskeletal components (especially actin stress fibers) through FAs at the adhesion sites.
This research incorporates the role of compressive structures (microtubules) in regulating
the adhesion strength. This investigation fills the void in understanding the cellular force
balance and deciphers the mechanism by which bidirectional cell adhesive interactions
take place that influence both local and global cellular functions.
1.2 Specific Aims
The objective of this project was to elucidate the role of FAs in modulating cell
adhesion strength by systematically manipulating the adhesive interfaces. The central
hypothesis was that peripheral focal adhesions stabilize cell adhesion to ECM by
providing for maximum mechanical advantage for resisting detachment as explained by
the membrane peeling mechanism. The objective was achieved through verification of
the central hypothesis by addressing the following specific aims:
Aim 1 was to develop a microcontact printing technique capable of accurately
replicating sparse sub-cellular scale patterns on substrates
The working hypothesis was that a modified stamp design enables microcontact
printing technique to be employed in patterning substrates using stamps with fill factors
(defined as the ratio of the combined lateral area of the features to the total stamp area)
lower than 1%. This technique coupled with usage of mixed self assembled monolayers
(SAMs) provided the non-fouling background necessary to achieve selective protein
patterning over large areas to control cell spreading for cell adhesion analyses. Thus, a

3
high-throughput yield of patterned substrates that maintain protein activity under
extended cell culture conditions for quantitative studies was obtained.
Aim 2 was to elucidate the role of the spatial distribution of focal adhesions in
modulating cell-substrate adhesion strength.
The working hypothesis was that distribution of focal adhesions away from the
cell center towards the periphery is more efficient in stabilizing cell attachment than
uniformly distributed focal adhesions. Adhesion strength was analyzed as a function of
total available cell adhesive area by varying the extent of cell spreading using
micropatterned substrates. The role of FA in modulating cell adhesion strength was
determined by distributing the total available area for FA formation to allow greater
extent of cell spreading. This enabled the investigation whether the spatial position of FA
modulates adhesion strength (by varying the extent of cell spreading) independently of
the total available adhesive area (by curbing the extent of cell spreading). In addition,
adhesion strength was also analyzed as a function of available cell spreading area by
varying the total available adhesive area. This enabled the determination of whether the
total available adhesive area modulated the adhesion strength over the spatial FA
position.
Aim 3 was to analyze the contribution of cytoskeletal architecture towards cell
adhesion strength in relation to the total available adhesive area and the extent
of cell spreading.
The working hypothesis was that the internal cytoskeletal architecture of the cell
has a significant role in modulation of adhesion strength along with FA position. The
investigation was geared towards determination of the contribution of the microtubule

4
network in modulating the cell adhesion strength. The rationale for the study was that
microtubule network influences the cell internal force balance and the cell shape. The
investigation was conducted by successively inhibiting the contractility machinery and
microtubule polymerization using pharmacological inhibitors. This analyses enabled to
fill the void in understanding the peripheral FA formation in relation to the cytoskeletal
reorganization influencing the transfer of force balance from cell interior to the exterior
(ECM) through FA.

5
Chapter 2. Literature Review
2.1 Integrin Mediated Cell Adhesion
Cell adhesion to extracellular matrix (ECM) is critical for various anchorage
dependent cells and regulates cellular homeostasis (Reddig, Juliano 2005). Moreover, cell
adhesion to the ECM plays a dominant role in mediating and regulating important
cellular processes including but not limited to cell spreading, cell migration, bidirectional
signaling during morphogenesis, tissue homeostasis and wound healing (Disatnik, Rando
1999, Berrier, Yamada 2007, Danen, Sonnenberg 2003, Price et al. 1998). Adhesion of
cells to ECM components specifically fibronectin and laminin is initiated as a surface
phenomenon and primarily mediated by transmembrane heterodimeric receptors that
belong to the integrin family (Hynes 2002). This is a complex process involving
recruitment of integrins to the cell surface, activation, and mechanical coupling to
extracellular ligands (Garcia, Huber & Boettiger 1998). Recent studies have shown the
involvement of integrins in force dependent signal transduction at the leading edge of the
cell that actively take part in the adhesion complex formation, maturation and recycling
thus regulating their binding affinity at respective stages (Puklin-Faucher, Sheetz 2009).
Furthermore, integrin activation or ‘ligand-binding affinity’ is known to regulate cell
adhesion, migration, mechanotransduction and also affect extracellular matrix assembly
thereby playing a vital role in embryonic development and repair (Shattil, Kim &
Ginsberg 2010). These mechanically coupled receptors rapidly interact with the actin
cytoskeleton and cluster together to form focal adhesions (FA)(Fig 2.1), large

6
supramolecular complexes that contain structural proteins like talin, vinculin and α-
actinin and signaling proteins, such as FAK, Src, and paxillin (Geiger et al. 2001).
Supporting these studies, recent investigations suggest regulation of cell adhesion
through changes in integrin’s affinity towards ECM ligands through initial triggering
events, intermediate signaling events and finally, their interaction with cytoskeletal
components (Shattil, Kim & Ginsberg 2010). Early work in cell adhesion was strictly
restricted to initial binding responses (Lotz et al. 1989) as the cell morphology rapidly
changed from a spherical to a more spread morphology and the usual shear assays used to
quantify cell adhesion turn out to be invalid. While significant progress has been
achieved in identifying key components in adhesion signaling, there is still a gap in our
understanding of how adhesive structures regulate adhesion strength with respect to their
spatial organization.
2.2 Cell Adhesion Strengthening and Focal Adhesion Assembly
A widely accepted theory of cell adhesion strengthening was initially proposed by
McClay and Erickson. Briefly, it is stated to be a two step process consisting of initial
integrin-ligand binding followed by rapid strengthening (Lotz et al. 1989). The
strengthening response is understood as a three stage process that includes (a) initial
integrin-ligand binding and simultaneous increase in cell-substrate adhesive area (initial
attachment and spreading), (b) increased receptor recruitment to the adhesive interface
and (c) interactions with cytoskeletal components involving recruitment of intracellular
proteins that lead to enhanced force distribution at the adhesive site via local membrane
stiffening (focal adhesion assembly). Individual investigations of these events support the
roles of these processes (Massia, Hubbell 1991, Maheshwari et al. 2000, Balaban et al.

7
2001b, Tan et al. 2003). Although these investigations explain significant roles of
individual key components and processes (specifically in terms of cell spreading), an
integrated understanding of cell adhesion strengthening is required. Pioneering work to
quantify the adhesion strength and provide a mechanism for cell adhesion strengthening
to fibronectin has been done by Gallant et.al (Gallant, Michael & Garcia 2005). A
spinning disk device was validated for a hydrodynamic shear assay (Fig 2.2) which was
used to apply a range of shear forces on a large population of cells to quantify adhesion
strength (Garcia, Ducheyne & Boettiger 1997). The hydrodynamic shear assay was
employed in combination with micropatterned surfaces that engineer focal adhesion
assembly to analyze cell adhesion strengthening (Gallant et al. 2002). Initial studies using
these approaches indicated that there was initial integrin binding and rapid strengthening
subsequently ensued due to focal adhesion assembly (Garcia, Gallant 2003). Specific
contributions of adhesive area, integrin binding and focal adhesion assembly towards
adhesion strengthening responses were also studied and quantified wherein it was
observed that the adhesion strength varied nonlinearly with adhesive area and also the
time of adhesion (Gallant, Michael & Garcia 2005). This nonlinearity in the adhesion
strength was attributed to peripheral clustering of integrins and subsequent formation of
FAs. A mathematical model was also developed to better explain the experimental data
whose development was based on spatiotemporal distribution and clustering of integrins
and subsequent formation of FAs (Gallant, Garcia 2007). Although, the mathematical
model indicates that peripheral distribution of integrins could play a major role in
modulating adhesion strength, experimental validation of the model remains elusive.

8
2.3 Model of Cell Adhesion Strengthening
In addition to understanding the significance of biochemical events occurring
during cell adhesion, mathematical models provide useful tools to analyze cellular
processes and particularly enable validation of the conceptual models often used to
interpret the experimental data. Several models have been developed to explain the multi-
step receptor mediated cell adhesion process (Bell, Dembo & Bongrand 1984, Evans
1985, Hammer, Lauffenburger 1987, Dembo et al. 1988, Ward, Hammer 1993, Ward,
Dembo & Hammer 1994, Kloboucek et al. 1999). Several of them focus on short term
adhesion except the one by Ward and Hammer that models the influence of focal contact
formation on adhesion strength (Ward, Hammer 1993). An in depth investigation by
Gallant et al (Gallant, Michael & Garcia 2005) led to the development of an adhesion
model that addresses long term adhesion as well (Gallant, Garcia 2007). Macroscopic and
microscopic models were integrated to explain the contributions of receptor recruitment,
clustering and focal adhesion assembly towards adhesion strengthening. The macroscopic
model largely stems from the force balance for a cell in hydrodynamic shear flow (Fig
2.3). Applying static equilibrium to the cell interface and using the analysis for a sphere
near a wall in viscous flow developed by Goldman et al, the forces at the cell-substrate
interface were evaluated (Goldman, Cox & Brenner 1967). In this model, the point of
force application FT is prescribed to be at the periphery of the cell-substrate contact area
assuming peeling model of cell detachment where the largest forces are at the periphery.
The microscopic model examines the adhesion force exerted at the cell adhesive interface
through an area that is subdivided into segments. Three conditions are considered with
each segment consisting of bonds that connect the cell to the underlying substrate: (a)

9
uniformly distributed bonds across the adhesive area, (b) bonds that are clustered (the
segments are filled from the outside to the inside as the segments get saturated with
bonds), and (c) focal adhesion associated bonds (a fraction of bonds associated with the
cytoskeleton are attributed to focal adhesions).
Cell detachment is assumed to occur by membrane peeling. In the case of
uniformly distributed or clustered bonds, an exponential decay is applied from the
periphery to the cell center while focal adhesion associated bonds are considered rigid,
i.e. all bonds must break simultaneously. The resultant force and moment produced by
each segment (Fi) is given by
iii eBfF 11 (2.1)
where f is the individual bond strength, iB is the number of bonds in segment i, is
exponential multiplier and is the fraction of bonds associated with focal adhesions.
Summing all the forces and moments would provide for the total adhesion force. This
model predicts the non-linear variation in adhesion strength with adhesive area
explaining the role of individual key components towards an integrated cell adhesion
strengthening process. Although not yet experimentally validated for spatial FA
distribution, this model accurately predicts the contribution of spatial distribution of the
focal adhesions to cell adhesion strength. It can be inferred from this model that the
exponential bond loading criterion provides for the fact that the peripheral focal
adhesions modulate adhesion strength due to maximum moment arm provided to resist
detachment during hydrodynamic flow.

10
2.4 Regulation of Cell Adhesion Strength by Complex Interplay Between Adhesive
Components and Cytoskeletal Architecture
The mechanical coupling of integrins to actin stress fibers is known to be
mediated by FA assembly, which further influences the cell shape and was established as
a main regulator for FA assembly by transmitting force from the extracellular matrix to
cytoskeletal components (Chen et al. 2003)(Parsons, Horwitz & Schwartz 2010, Maurin
et al. 2008). It is well established that integrins interacting with ECM are coupled to the
cellular cytoskeleton by several structural proteins, such as talin and vinculin (Ezzell et
al. 1997, Chen, Ingber 1999, Wang, Butler & Ingber 1993, Maniotis, Chen & Ingber
1997). Therefore, it may be possible to regulate the mechanical tension inside the cell by
manipulating the cell adhesive interface. Several studies investigated micro and nano
scale regulation of adhesive interface such as critical spacing between integrins so as to
facilitate focal adhesion assembly and its effect on cell spreading and cell adhesion
strength (Massia, Hubbell 1991, Cavalcanti-Adam et al. 2006, Cavalcanti-Adam et al.
2007, Selhuber-Unkel et al. 2010). Many successful attempts have been made to
understand the governance of cellular functions and the functional relevance of a
multitude of structural and signaling adhesive components by probing the complex bio
chemical processes of cell matrix adhesion. Extensive studies during the past decade
indicate that mechanical tension generated within the cytoskeleton of living cells is
emerging as a critical regulator of various biological functions of a cell (Chicurel, Chen
& Ingber 1998). Probing deeper into the mechanical interactions between cell and the
substrate demonstrates the existence of an “inside-out” mechanism whereby changes in
cell shape by global cell distortion increases the cytoskeletal tension and drives the

11
assembly of FA (Chen et al. 2003). As a complimentary approach, changing the elasticity
of the underlying substrate in turn regulated the level of tension that a cell could exert on
the substrate which directly affected the FA assembly. This result indicates the ability of
a cell to transduce signals related to cell morphology and the extent of spreading
(Balaban et al. 2001b, Yeung et al. 2005). Focal adhesions were also observed to be the
anchorage points for the cell and the foci for application of large traction forces during
cell migration (Ballestrem et al. 2000, Roy et al. 2002, Watanabe, Noritake & Kaibuchi
2005, Fournier et al. 2010). In most of the previous analyses, cell contractility was
considered as a modulator for cell adhesion (Geiger et al. 2001, Balaban et al. 2001b,
Geiger, Bershadsky 2001). Careful analysis of the force balance interprets the adhesion
signaling to be modulated by the microtubule network inside the cell owing to the
internal force balance (Bershadsky et al. 1996, Bershadsky, Kozlov & Geiger 2006).
Moreover, geometry based sensing is based on the cellular force balance between
cytoskeletal components and adhesive components internal and external to the cell
leading to a hypothesis that in addition to actin system, the microtubular system
contributes actively to the cell adhesion strength (Vogel, Sheetz 2006).
2.5 Quantitative Assays for Measuring Cell Adhesion
While various methods were developed to characterize cell adhesion, few of these
actually quantify adhesion strength by physically detaching the cells from the substrate.
Quantitative assays for measuring cell adhesion strength can broadly be divided into
centrifugation, hydrodynamic shear and micromanipulation. Each of these broad
spectrums of assays has their own advantages and different implications on the nature of
the data obtained (Christ, Turner 2010).

12
2.5.1 Centrifugation Assay
This assay is based on a population of cells. The most common method involves
seeding cells in a multiwell plate and centrifuging the plate with the top surface of the
plate facing outwards along the radial direction. This configuration allows cells to
experience normal forces and detach. The remaining cells are quantified by either
radioactive labeling (McClay, Wessel & Marchase 1981) or fluorescent imaging.
Experiments are repeated multiple times at various speeds and the adhesion strength is
quantified in terms of the force required to detach 50% of the cells from the surface. In
most scenarios, this assay is used in relative comparisons between treatment conditions.
The force exerted on a cell in a centrifugation assay is given by
gRVF cellmediumcell /)( 2 (2.2)
where cell represents cell density, medium represents density of the medium, cellV
represents volume of the cell, R represents the radius from the center of the rotor to the
plate, represents the angular speed in rad/s, and g is the acceleration due to gravity.
The limitation of this technique lies in the small forces that can be achieved. Hence it can
only be applied in scenarios of weak adhesions. A slight variation of this assay has been
extensively used in the early studies to investigate events during initial cell adhesion (<15
min) in fibroblasts and glioma cells adhered to substrates coated with fibronectin or
tenascin (Lotz et al. 1989).
2.5.2 Hydrodynamic Shear Assay
Hydrodynamic shear assays involve application of well defined fluidic shear
stresses to cells adhered to the substrate. Although, hydrodynamic forces can be applied
in a variety of ways, three most employed techniques are by using spinning disk device,

13
radial flow chamber and the parallel plate flow chamber. Unique to all the hydrodynamic
shear assays is that laminar flow in maintained near the cellular regime irrespective of the
configuration that is determined by the low Reynolds number values obtained by,
UD
Re (2.3)
where is the mass density of the fluid, U is the average velocity, D is the characteristic
dimension and is the fluid viscosity.
The wall shear stress induced by the flow of Newtonian fluid at which 50% of the
cells detach that represents the mean adhesion strength of the cell is given by
0
)(
y
dy
ydu (2.4)
where )( yu represents the flow velocity and y is the distance from the wall in the normal
direction.
2.5.2.1 Spinning Disk Device
The hydrodynamic shear assay is conducted using a spinning disk device which
has been extensively characterized and employed in several cell adhesion investigations
(Garcia, Huber & Boettiger 1998, Gallant, Michael & Garcia 2005, Garcia, Ducheyne &
Boettiger 1997, Garcia, Gallant 2003). The concept used in the spinning disk is that the
hydrodynamic shear force induced due to the flow over the cells that are attached to a
substrate would detach the cells off the surface. The detachment force is proportional to
the hydrodynamic wall shear stress τ. The equation for the wall shear stress is
38.0 r (2.5)

14
where r is the radial distance from the center of the disk (spinning axis), ρ is the fluid
density, µ is the fluid viscosity, and ω is the rotational speed. Following spinning for 5
min, the remaining adherent cells were fixed in 3.7% formaldehyde, permeabilized with
0.1% Triton X-100, and stained with Hoechst to label the nuclei. The number of adherent
cells is counted at specific radial positions using a fluorescent microscope fitted with a
motorized stage and imaging software. Sixty one fields are analyzed per substrate and the
number of cells at specific radial locations was then normalized to the number of cells at
the center of the substrate where negligible shear stress was applied giving the fraction of
adherent cells (f). The detachment profile (f vs. τ) was then fit to a sigmoid curve given
by
501
1
be
f (2.6)
The shear stress for 50% detachment (τ50) is used as the mean cell adhesion
strength.
2.5.2.2 Radial Flow Chamber
The hydrodynamic flow in radial flow chambers is achieved by the outward flow
of fluid from the center of the circular chamber over the cells adhered to the chamber
wall. Therefore, the shear stress decreases with increasing radial distance from the center
of the disk nonlinearly. This configuration contrasts the spinning disk in the sense that the
substrate containing the adhered cells is stationary in radial flow chambers whereas in the
spinning disk, the surface to which the cells are adhered is in motion. The shear stress in
a radial flow chamber is given by (Goldstein, DiMilla 1998),

15
32
2
2 70
33
hr
Q
rh
Q
(2.7)
where Q represents the flow rate and h is the chamber height, is the mass density of the
fluid, r is the radial distance from the center of the chamber and is the fluid viscosity.
The first term in the expression refers to viscous wall shear stress and the second term is
the correction factor to account for the inertial effects due to fluid flow and is desirable to
maintain the inertial term to be less than 5% of the viscous term. This configuration of
radial flow chamber was extensively used in the adhesion studies of mammalian cells to
investigate the effect of fibronectin concentration on cell adhesion strength (Goldstein,
DiMilla 1997, Goldstein, DiMilla 2002).
2.5.2.3 Parallel Plate Flow Chamber
The advantage of the parallel plate flow chamber is that it can be mounted on a
microscope for live observations of cell detachment. As for the configurations, many
variations exist such as two glass plates sealed with a rubber gasket in between or a
PDMS channel sealed to a glass slide. For a given flow rate, the shear stress is constant
along the length of the channel beyond the entrance length, but can vary across the width
of the channel depending on the channel dimensions. However, variation across the width
of the channel is lowered using geometrical aspect ratio of (w>20h) (Truskey, Pirone
1990). The wall shear stress is given by,
2
6
wh
Q (2.8)
where Q represents the flow rate and h is the chamber height, w is the chamber width and
is the fluid viscosity ( h << w ). This configuration was used to study adhesion strength

16
of cells adhered to dentin (Messer et al. 2006) and cartilage (Schinagl et al. 1999) and
also to characterize human skin fibroblasts adhered to glass (van Kooten et al. 1992).
2.5.3 Micromanipulation
Micromanipulation involves single cell studies as opposed to population based
studies of the centrifugation or hydrodynamic shear assays. Two of the most common
micromanipulation techniques are cytodetachment and micropipette aspiration. In
cytodetachment, the force is measured by the elastic deformation of a probe using an
instrument such as an Atomic Force Microscope. While in micropipette aspiration, the
force is determined by the aspiration pressure. A number of other techniques were also
used including microplates, (Thoumine, Meister 2000)optical tweezers (Thoumine et al.
2000) and magnetic tweezers (Walter et al. 2006) to observed single cell mechanics.
2.6 Selective Protein Patterning to Manipulate Cell Adhesive Interface
Successful manipulations of cell-substrate adhesive interactions require precise
geometries of adhesive protein coated areas on the underlying surface. Numerous
approaches have been demonstrated to pattern substrates with proteins. Microcontact
printing (μCP) has emerged to be the most versatile technique to pattern substrate with
various geometries in the sub-cellular scales. This method provides a substrate which has
controllable adhesive area, thereby limiting the extent of spreading which is possible for a
cell. Thus a cell can adhere for long periods and assemble FAs, while still maintaining a
defined contact area and a nearly spherical morphology if the adhesive area is smaller
than a cell. Therefore, the hydrodynamic force on each cell, applied in a detachment-type
assay, is fairly uniform and can easily be computed. Surface micropatterning methods
also allow unlimited possibilities in configurations for manipulating cell adhesive

17
interfaces. By improving this technique to pattern cells over large areas with a high
efficiency, large numbers of cells can be examined in each experiment and robust
measurements taken for statistical analysis.
2.6.1 Microcontact Printing
This technique was originally designed to pattern surfaces with well defined
geometries and chemistries on substrates by forming self-assembled monolayer (SAM)
domains. The patterns are generated through the transfer of ‘ink’ molecules (usually
alkanethiols or alkyl silanes) by conformal contact between the target substrate and
micron sized features protruding from a polymer stamp (Kumar, Whitesides 1993,
Delamarche et al. 1998, Balmer et al. 2005, Schmid, Michel 2000, Xia, Whitesides
1997). As the demands in biological realms have surpassed the micron regime, research
into μCP has led to the development of a variety of stamp materials, inks and fabrication
techniques to permit submicron patterning with explicit replication accuracies (Perl,
Reinhoudt & Huskens 2009). Owing to its simplicity, μCP has since been refined and
applied to patterning proteins, cells and DNA (Ruiz, Chen 2007, Chen et al. 1998, Guan,
Lee 2005). Since patterning substrates involves conformal contact of the protruding
features of the stamp to the substrate, stamp stability often dictates the pattern resolution
that can be achieved (Bietsch, Michel 2000, Hui et al. 2002, Sharp et al. 2004, Zhou et al.
2005, Huang et al. 2005, Decre et al. 2005). Most variations have used
polydimethylsiloxane (PDMS) as the stamp material and have been limited to
reproducing feature sizes usually larger than 1 µm (Whitesides et al. 2001). Nevertheless,
specific applications such as fabrication of spatially directed nanowires (Hsu et al. 2005)
and selective protein patterning to regulate cell-substrate interactions while avoiding cell-

18
cell contact (Gallant, Michael & Garcia 2005, Gallant et al. 2002, Balaban et al. 2001a,
Kane et al. 1999) require complex geometries of small (micron or submicron) and
sparsely patterned features on the substrate. In these situations, stamps with extremely
low fill factors (characterized by less than 1%) are required if μCP is to be used.
Moreover, extremely low fill factors would enable μCP to be employed in the systematic
study of individual adhesion complex assembly with respect to the effect of size, density
and position of adhesive domains in cell-substrate interactions (Massia, Hubbell 1991,
Cavalcanti-Adam et al. 2006, Cavalcanti-Adam et al. 2007). Hence advancements in μCP
under these scenarios will be critical to its applicability in exploring complex biological
phenomena.
2.6.2 Patterning Proteins with Self Assembled Monolayers
Engineering surface chemistry on the substrates is a key to manipulate cell
adhesive interfaces. This is achieved by using self assembled monolayer domains. Protein
adherent SAM domains surrounded by protein resistant non-fouling background with a
different SAM provides for selective domains to which the cells can adhere (Chen et al.
2003, Chen et al. 1998, Kane et al. 1999, Chen et al. 1997). In most studies, a methyl-
terminated or –COOH terminated alkanethiol is used in microcontact printing to form the
protein adsorbing domains. The background is subsequently filled with PEG terminated
alkanethiol which resists protein adsorption (Keselowsky, Collard & Garcia 2004). The
adsorbed proteins (specifically fibronectin) maintain their activity as observed by the
immunostaining with site specific antibody. Thus a cell can adhere for long periods and
assemble focal adhesions, while still maintaining a defined contact area.

19
Fig 2.1 Diagram of a focal adhesion showing the clustering of integrins binding to
surface-adsorbed FN.
Actin Filaments
Microtubules
Cell Membrane
Integrin ReceptorsFocal Adhesions
Nucleus
Substrate (FN)

20
Fig 2.2 Spinning disk and shear stress profile. (a) Spinning disk device; shear stress
varies linearly with radial position. (b) A typical profile of the adherent fraction after
shear stress is applied.
shear stress (dyne/cm2)
0 200 400 600 800 1000 1200 1400
adhe
rent
fra
ctio
n
0.0
0.2
0.4
0.6
0.8
1.0
1.2 experimentfit
a b

21
Fig 2.3 Macroscopic and microscopic model for adhesion strengthening. (a) Free body
diagram of cell attaching to micropatterned substrate under shear flow. The contact area
is discretized into adhesive patches, each producing an adhesive force (Fi). (b) Diagram
for adhesive patch showing three representative states: uniformly distributed bonds,
clustered bonds, and focal adhesion associated bonds. The adhesive patch is located a
distance d (units δ) from moment center (point C). Applied membrane tension results in
cell detachment by peeling of the leading edge of the cell. Bonds in the contact area
resist the applied force.(Gallant, Michael & Garcia 2005)
F s
F a
T s
CF T
F c
F1 F2 F3 F4 F5
receptor clustering
dC
cytoskeletal interactions
tension
a b

22
2.7 List of References
Balaban, N.Q., Schwarz, U.S., Riveline, D., Goichberg, P., Tzur, G., Sabanay, I., Mahalu, D., Safran, S., Bershadsky, A., Addadi, L. & Geiger, B. 2001a, "Force and focal adhesion assembly: a close relationship studied using elastic micropatterned substrates", Nature cell biology, vol. 3, no. 5, pp. 466-472.
Balaban, N.Q., Schwarz, U.S., Riveline, D., Goichberg, P., Tzur, G., Sabanay, I., Mahalu, D., Safran, S., Bershadsky, A., Addadi, L. & Geiger, B. 2001b, "Force and focal adhesion assembly: a close relationship studied using elastic micropatterned substrates", Nature cell biology, vol. 3, no. 5, pp. 466-472.
Ballestrem, C., Wehrle-Haller, B., Hinz, B. & Imhof, B.A. 2000, "Actin-dependent Lamellipodia Formation and Microtubule-dependent Tail Retraction Control-directed Cell Migration", Molecular biology of the cell, vol. 11, no. 9, pp. 2999-3012.
Balmer, T.E., Schmid, H., Stutz, R., Delamarche, E., Michel, B., Spencer, N.D. & Wolf, H. 2005, "Diffusion of Alkanethiols in PDMS and Its Implications on Microcontact Printing (μCP)", Langmuir, vol. 21, no. 2, pp. 622-632.
Bell, G.I., Dembo, M. & Bongrand, P. 1984, "Cell adhesion. Competition between nonspecific repulsion and specific bonding", Biophysical journal, vol. 45, no. 6, pp. 1051-1064.
Berrier, A.L. & Yamada, K.M. 2007, "Cell-matrix adhesion", Journal of cellular physiology, vol. 213, no. 3, pp. 565-573.
Bershadsky, A., Chausovsky, A., Becker, E., Lyubimova, A. & Geiger, B. 1996, "Involvement of microtubules in the control of adhesion-dependent signal transduction", Current Biology, vol. 6, no. 10, pp. 1279-1289.
Bershadsky, A., Kozlov, M. & Geiger, B. 2006, "Adhesion-mediated mechanosensitivity: a time to experiment, and a time to theorize", Current opinion in cell biology, vol. 18, no. 5, pp. 472-481.
Bietsch, A. & Michel, B. 2000, "Conformal contact and pattern stability of stamps used for soft lithography", Journal of Applied Physics, vol. 88, no. 7, pp. 4310-4318.
Cavalcanti-Adam, E., Volberg, T., Micoulet, A., Kessler, H., Geiger, B. & Spatz, J.P. 2007, "Cell Spreading and Focal Adhesion Dynamics Are Regulated by Spacing of Integrin Ligands", Biophysical Journal, vol. 92, no. 8, pp. 2964-2974.
Cavalcanti-Adam, E.A., Micoulet, A., Blümmel, J., Auernheimer, J., Kessler, H. & Spatz, J.P. 2006, "Lateral spacing of integrin ligands influences cell spreading and focal adhesion assembly", European journal of cell biology, vol. 85, no. 3-4, pp. 219-224.
23
Chen, C.S., Alonso, J.L., Ostuni, E., Whitesides, G.M. & Ingber, D.E. 2003, "Cell shape provides global control of focal adhesion assembly", Biochemical and biophysical research communications, vol. 307, no. 2, pp. 355-361.
Chen, C.S. & Ingber, D.E. 1999, "Tensegrity and mechanoregulation: from skeleton to cytoskeleton", Osteoarthritis and Cartilage, vol. 7, no. 1, pp. 81-94.
Chen, C.S., Mrksich, M., Huang, S., Whitesides, G.M. & Ingber, D.E. 1998, "Micropatterned Surfaces for Control of Cell Shape, Position, and Function", Biotechnology progress, vol. 14, no. 3, pp. 356-363.
Chen, C.S., Mrksich, M., Huang, S., Whitesides, G.M. & Ingber, D.E. 1997, "Geometric Control of Cell Life and Death", Science, vol. 276, no. 5317, pp. 1425-1428.
Chicurel, M.E., Chen, C.S. & Ingber, D.E. 1998, "Cellular control lies in the balance of forces", Current opinion in cell biology, vol. 10, no. 2, pp. 232-239.
Christ, K.V. & Turner, K.T. 2010, "Methods to Measure the Strength of Cell Adhesion to Substrates", Journal of Adhesion Science and Technology, vol. 24, pp. 2027-2058.
Danen, E.H. & Sonnenberg, A. 2003, "Integrins in regulation of tissue development and function", The Journal of pathology, vol. 200, no. 4, pp. 471-480.
Decre, M.M.J., Timmermans, P.H.M., van, d.S. & Schroeders, R. 2005, "Numerical and Experimental Study of Critical Roof Collapse Conditions in Soft Lithography", Langmuir, vol. 21, no. 17, pp. 7971-7978.
Delamarche, E., Schmid, H., Bietsch, A., Larsen, N.B., Rothuizen, H., Michel, B. & Biebuyck, H. 1998, "Transport Mechanisms of Alkanethiols during Microcontact Printing on Gold", The Journal of Physical Chemistry B, vol. 102, no. 18, pp. 3324-3334.
Dembo, M., Torney, D.C., Saxman, K. & Hammer, D. 1988, "The Reaction-Limited Kinetics of Membrane-to-Surface Adhesion and Detachment", Proceedings of the Royal Society of London.Series B.Biological Sciences, vol. 234, no. 1274, pp. 55-83.
Disatnik, M. & Rando, T.A. 1999, "Integrin-mediated Muscle Cell Spreading", Journal of Biological Chemistry, vol. 274, no. 45, pp. 32486-32492.
Evans, E.A. 1985, "Detailed mechanics of membrane-membrane adhesion and separation. I. Continuum of molecular cross-bridges", Biophysical Journal, vol. 48, no. 1, pp. 175-183.
Ezzell, R.M., Goldmann, W.H., Wang, N., Parasharama, N. & Ingber, D.E. 1997, "Vinculin Promotes Cell Spreading by Mechanically Coupling Integrins to the Cytoskeleton", Experimental cell research, vol. 231, no. 1, pp. 14-26.

24
Fournier, M.F., Sauser, R., Ambrosi, D., Meister, J. & Verkhovsky, A.B. 2010, "Force transmission in migrating cells", The Journal of cell biology, vol. 188, no. 2, pp. 287-297.
Gallant, N.D. & Andres J. Garcia 2007, "Model of integrin-mediated cell adhesion strengthening", Journal of Biomechanics, vol. 40, no. 6, pp. 1301-1309.
Gallant, N.D., Capadona, J.R., Frazier, A.B., Collard, D.M. & Garcia, A.J. 2002, "Micropatterned Surfaces to Engineer Focal Adhesions for Analysis of Cell Adhesion Strengthening", Langmuir, vol. 18, no. 14, pp. 5579-5584.
Gallant, N.D., Michael, K.E. & Garcia, A.J. 2005, "Cell Adhesion Strengthening: Contributions of Adhesive Area, Integrin Binding, and Focal Adhesion Assembly", Molecular biology of the cell, vol. 16, no. 9, pp. 4329-4340.
Garcia, A. & Gallant, N. 2003, "Stick and grip", Cell biochemistry and biophysics, vol. 39, no. 1, pp. 61-73.
Garcia, A.J., Ducheyne, P. & Boettiger, D. 1997, "Quantification of cell adhesion using a spinning disc device and application to surface-reactive materials", Biomaterials, vol. 18, no. 16, pp. 1091-1098.
Garcia, A.J., Huber, F. & Boettiger, D. 1998, "Force Required to Break alpha 5beta 1 Integrin-Fibronectin Bonds in Intact Adherent Cells Is Sensitive to Integrin Activation State", Journal of Biological Chemistry, vol. 273, no. 18, pp. 10988-10993.
Geiger, B. & Bershadsky, A. 2001, "Assembly and mechanosensory function of focal contacts", Current opinion in cell biology, vol. 13, no. 5, pp. 584-592.
Geiger, B., Bershadsky, A., Pankov, R. & Yamada, K.M. 2001, "Transmembrane crosstalk between the extracellular matrix and the cytoskeleton", Nature reviews. Molecular cell biology, vol. 2, no. 11, pp. 793-805.
Goldman, A.J., Cox, R.G. & Brenner, H. 1967, "Slow viscous motion of a sphere parallel to a plane wall—II Couette flow", Chemical Engineering Science, vol. 22, no. 4, pp. 653-660.
Goldstein, A.S. & DiMilla, P.A. 2002, "Effect of adsorbed fibronectin concentration on cell adhesion and deformation under shear on hydrophobic surfaces", Journal of Biomedical Materials Research, vol. 59, no. 4, pp. 665-675.
Goldstein, A.S. & DiMilla, P.A. 1998, "Comparison of converging and diverging radial flow for measuring cell adhesion", AICHE Journal, vol. 44, no. 2, pp. 465-473.
Goldstein, A.S. & DiMilla, P.A. 1997, "Application of fluid mechanic and kinetic models to characterize mammalian cell detachment in a radial-flow chamber", Biotechnology and bioengineering, vol. 55, no. 4, pp. 616-629.

25
Guan, J. & Lee, L.J. 2005, "Generating highly ordered DNA nanostrand arrays", Proceedings of the National Academy of Sciences of the United States of America, vol. 102, no. 51, pp. 18321-18325.
Hammer, D.A. & Lauffenburger, D.A. 1987, "A dynamical model for receptor-mediated cell adhesion to surfaces", Biophysical Journal, vol. 52, no.3, pp. 475-487.
Hsu, J.W.P., Tian, Z.R., Simmons, N.C., Matzke, C.M., Voigt, J.A. & Liu, J. 2005, "Directed Spatial Organization of Zinc Oxide Nanorods", Nano Letters, vol. 5, no. 1, pp. 83-86.
Huang, Y.Y., Zhou, W., Hsia, K.J., Menard, E., Park, J., Rogers, J.A. & Alleyne, A.G. 2005, "Stamp Collapse in Soft Lithography", Langmuir, vol. 21, no. 17, pp. 8058-8068.
Hui, C.Y., Jagota, A., Lin, Y.Y. & Kramer, E.J. 2002, "Constraints on Microcontact Printing Imposed by Stamp Deformation", Langmuir, vol. 18, no. 4, pp. 1394-1407.
Hynes, R.O. 2002, "Integrins: Bidirectional, Allosteric Signaling Machines", Cell, vol. 110, no. 6, pp. 673-687.
Kane, R.S., Takayama, S., Ostuni, E., Ingber, D.E. & Whitesides, G.M. 1999, "Patterning proteins and cells using soft lithography", Biomaterials, vol. 20, no. 23-24, pp. 2363-2376.
Keselowsky, B.G., Collard, D.M. & Garcia, A.J. 2004, "Surface chemistry modulates focal adhesion composition and signaling through changes in integrin binding", Biomaterials, vol. 25, no. 28, pp. 5947-5954.
Kloboucek, A., Behrisch, A., Faix, J. & Sackmann, E. 1999, "Adhesion-Induced Receptor Segregation and Adhesion Plaque Formation: A Model Membrane Study", Biophysical Journal, vol. 77, no. 4, pp. 2311-2328.
Kumar, A. & Whitesides, G.M. 1993, "Features of gold having micrometer to centimeter dimensions can be formed through a combination of stamping with an elastomeric stamp and an alkanethiol ``ink'' followed by chemical etching", Applied Physics Letters, vol. 63, no. 14, pp. 2002-2004.
Lotz, M., Burdsal, C., Erickson, H. & McClay, D. 1989, "Cell adhesion to fibronectin and tenascin: quantitative measurements of initial binding and subsequent strengthening response", The Journal of cell biology, vol. 109, no. 4, pp. 1795-1805.
Maheshwari, G., Brown, G., Lauffenburger, D., Wells, A. & Griffith, L. 2000, "Cell adhesion and motility depend on nanoscale RGD clustering", Journal of cell science, vol. 113, no. 10, pp. 1677-1686.

26
Maniotis, A., Chen, C. & Ingber, D. 1997, "Demonstration of mechanical connections between integrins, cytoskeletal filaments, and nucleoplasm that stabilize nuclear structure", Proceedings of the National Academy of Sciences, vol. 94, no. 3, pp. 849-854.
Massia, S.P. & Hubbell, J.A. 1991, "An RGD spacing of 440 nm is sufficient for integrin alpha V beta 3-mediated fibroblast spreading and 140 nm for focal contact and stress fiber formation.", The Journal of cell biology, vol. 114, no. 5, pp. 1089-1100.
Maurin, B., Ca, P., Baudriller, H., Montcourrier, P. & Bettache, N. 2008, "Mechanical model of cytoskeleton structuration during cell adhesion and spreading", Journal of Biomechanics, vol. 41, no. 9, pp. 2036-41.
McClay, D.R., Wessel, G.M. & Marchase, R.B. 1981, "Intercellular recognition: quantitation of initial binding events", Proceedings of the National Academy of Sciences, vol. 78, no. 8, pp. 4975-4979.
Messer, R.L.W., Davis, C.M., Lewis, J.B., Adams, Y. & Wataha, J.C. 2006, "Attachment of human epithelial cells and periodontal ligament fibroblasts to tooth dentin", Journal of Biomedical Materials Research Part A, vol. 79A, no. 1, pp. 16-22.
Parsons, J.T., Horwitz, A.R. & Schwartz, M.A. 2010, "Cell adhesion: integrating cytoskeletal dynamics and cellular tension", Nature reviews. Molecular cell biology, vol. 11, no. 9, pp. 633-643.
Perl, A., Reinhoudt, D.N. & Huskens, J. 2009, "Microcontact Printing: Limitations and Achievements", Advanced Materials, vol. 21, no. 22, pp. 2257-2268.
Price, L.S., Leng, J., Schwartz, M.A. & Bokoch, G.M. 1998, "Activation of Rac and Cdc42 by Integrins Mediates Cell Spreading", Molecular biology of the cell, vol. 9, no. 7, pp. 1863-1871.
Puklin-Faucher, E. & Sheetz, M.P. 2009, "The mechanical integrin cycle", Journal of cell science, vol. 122, no. 2, pp. 179-186.
Reddig, P. & Juliano, R. 2005, "Clinging to life: cell to matrix adhesion and cell survival", Cancer and metastasis reviews, vol. 24, no. 3, pp. 425-439.
Roy, P., Rajfur, Z., Pomorski, P. & Jacobson, K. 2002, "Microscope-based techniques to study cell adhesion and migration", Nature cell biology, vol. 4, no. 4, pp. E91-E96.
Ruiz, S.A. & Chen, C.S. 2007, "Microcontact printing: A tool to pattern.", Soft Matter, vol. 3, no. 2, pp. 168-177.
Schinagl, R.M., Kurtis, M.S., Ellis, K.D., Chien, S. & Sah, R.L. 1999, "Effect of seeding duration on the strength of chondrocyte adhesion to articular cartilage", Journal of Orthopaedic Research, vol. 17, no. 1, pp. 121-129.

27
Schmid, H. & Michel, B. 2000, "Siloxane Polymers for High-Resolution, High-Accuracy Soft Lithography", Macromolecules, vol. 33, no. 8, pp. 3042-3049.
Selhuber-Unkel, C., Erdmann, T., López-García, M., Kessler, H., Schwarz, U.S. & Spatz, J.P. 2010, "Cell Adhesion Strength Is Controlled by Intermolecular Spacing of Adhesion Receptors", Biophysical Journal, vol. 98, no. 4, pp. 543-551.
Sharp, K.G., Blackman, G.S., Glassmaker, N.J., Jagota, A. & Hui, C. 2004, "Effect of Stamp Deformation on the Quality of Microcontact Printing: Theory and Experiment", Langmuir, vol. 20, no. 15, pp. 6430-6438.
Shattil, S.J., Kim, C. & Ginsberg, M.H. 2010, "The final steps of integrin activation: the end game", Nature reviews. Molecular cell biology, vol. 11, no. 4, pp. 288-300.
Tan, J.L., Tien, J., Pirone, D.M., Gray, D.S., Bhadriraju, K. & Chen, C.S. 2003, "Cells lying on a bed of microneedles: An approach to isolate mechanical force", Proceedings of the National Academy of Sciences of the United States of America, vol. 100, no. 4, pp. 1484-1489.
Thoumine, O., Kocian, P., Kottelat, A. & Meister, J. 2000, "Short-term binding of fibroblasts to fibronectin: optical tweezers experiments and probabilistic analysis", European Biophysics Journal, vol. 29, no. 6, pp. 398-408.
Thoumine, O. & Meister, J. 2000, "Dynamics of adhesive rupture between fibroblasts and fibronectin: microplate manipulations and deterministic model", European Biophysics Journal, vol. 29, no. 6, pp. 409-419.
Truskey, G.A. & Pirone, J.S. 1990, "The effect of fluid shear stress upon cell adhesion to fibronectin-treated surfaces", Journal of Biomedical Materials Research, vol. 24, no. 10, pp. 1333-1353.
van Kooten, T.G., Schakenraad, J.M., Van der Mei, H.C. & Busscher, H.J. 1992, "Development and use of a parallel-plate flow chamber for studying cellular adhesion to solid surfaces", Journal of Biomedical Materials Research, vol. 26, no. 6, pp. 725-738.
Vogel, V. & Sheetz, M. 2006, "Local force and geometry sensing regulate cell functions", Nature reviews. Molecular cell biology, vol. 7, no. 4, pp. 265-275.
Walter, N., Selhuber, C., Kessler, H. & Spatz, J.P. 2006, "Cellular Unbinding Forces of Initial Adhesion Processes on Nanopatterned Surfaces Probed with Magnetic Tweezers", Nano Letters, vol. 6, no. 3, pp. 398-402.
Wang, N., Butler, J. & Ingber, D. 1993, "Mechanotransduction across the cell surface and through the cytoskeleton", Science, vol. 260, no. 5111, pp. 1124-1127.
Ward, M.D., Dembo, M. & Hammer, D.A. 1994, "Kinetics of cell detachment: peeling of discrete receptor clusters", Biophysical journal, vol. 67, no. 6, pp. 2522-2534.

28
Ward, M.D. & Hammer, D.A. 1993, "A theoretical analysis for the effect of focal contact formation on cell-substrate attachment strength", Biophysical Journal, vol. 64, no. 3, pp. 936-959.
Watanabe, T., Noritake, J. & Kaibuchi, K. 2005, "Regulation of microtubules in cell migration", Trends in Cell Biology, vol. 15, no. 2, pp. 76-83.
Whitesides, G.M., Ostuni, E., Takayama, S., Jiang, X. & Ingber, D.E. 2001, "Soft lithography in biology and biochemistry", Annual Review of Biomedical Engineering, vol. 3, no. 1, pp. 335-373.
Xia, Y. & Whitesides, G.M. 1997, "Extending Microcontact Printing as a Microlithographic Technique", Langmuir, vol. 13, no. 7, pp. 2059-2067.
Yeung, T., Georges, P.C., Flanagan, L.A., Marg, B., Ortiz, M., Funaki, M., Zahir, N., Ming, W., Weaver, V. & Janmey, P.A. 2005, "Effects of substrate stiffness on cell morphology, cytoskeletal structure, and adhesion", Cell motility and the cytoskeleton, vol. 60, no. 1, pp. 24-34.
Zhou, W., Huang, Y., Menard, E., Aluru, N.R., Rogers, J.A. & Alleyne, A.G. 2005, "Mechanism for stamp collapse in soft lithography", Applied Physics Letters, vol. 87, no. 25, pp. 251925-251925-3.

29
Chapter 3. Micropatterned Surfaces to Control Cell Adhesive Area and Cell
Spreading Area
3.1 Introduction
The biomechanical and biochemical cues triggered by the ECM architecture are
critical to the regulation of cell adhesion that impacts various cellular functions such as
spreading, migration, motility, proliferation, differentiation and apoptosis (Gallant,
Michael & Garcia 2005, Ezzell et al. 1997, Ballestrem et al. 2000, Wang et al. 2002,
Chen et al. 1997). Cell adhesion to ECM proteins such as fibronectin and laminin is
primarily mediated by heterodimeric receptors that belong to the integrin family and is
critical to cell survival and regulation of tissue development and function (Stupack,
Cheresh 2002, Hynes 2002, Danen, Sonnenberg 2003, Berrier, Yamada 2007). These
integrins cluster and trigger signaling events resulting in the recruitment of various
structural proteins such as talin, vinculin and signaling proteins such as paxillin, zyxin to
the adhesive sites to form focal adhesions (Geiger, Bershadsky 2001) which further
enhance adhesion strength by coupling integrins to the cytoskeleton (Gallant, Michael &
Garcia 2005, Ward, Hammer 1993) and further act as putative mechanotransducers to the
cell (Wang, Butler & Ingber 1993, Balaban et al. 2001, Chen et al. 2003, Wozniak et al.
2004, Rape, Guo & Wang 2011). Recent investigation into the nanoscale architecture
throws light on the critical spacing between ligands necessary for focal adhesion
formation and regulation of cell adhesion and spreading (Massia, Hubbell 1991,
Cavalcanti-Adam et al. 2006, Cavalcanti-Adam et al. 2007, Selhuber-Unkel et al. 2010).

30
A similar kind of study investigated cell behavior on micropatterned substrates to
understand the limits of ECM geometry on cell adhesion and spreading (Lehnert et al.
2004).
Microcontact printing technique pioneered by Kumar and Whitesides (Kumar,
Whitesides 1993) allowed for widespread usage of micropatterning for biological
investigations. Owing to its simplicity, μCP has since been refined and applied as a
biology tool to pattern proteins, cells and DNA (Ruiz, Chen 2007, Chen et al. 1998,
Guan, Lee 2005). This technique was extensively applied in conjunction with a
hydrodynamic shear assay to systematically study the contributions of adhesive area,
integrin binding and focal adhesion assembly towards adhesion strength (Gallant,
Michael & Garcia 2005, Gallant et al. 2002, Dumbauld et al. 2010). However,
characterizing the specific contribution of the spatial organization of focal adhesions to
cell adhesion strength independent of cell adhesive area remains elusive. In this study,
micropatterned substrates were engineered with adhesive and non-adhesive domains to
control cell shape and dissect the contributions of focal adhesion position independently
of the total cell adhesive area towards adhesion strength (Fig 3.1).
3.2 Experimental Section
Materials
Human plasma fibronectin, Dulbecco’s phosphate-buffered saline (DPBS),
AlexaFluor 488-conjugated secondary antibodies and AlexaFluor 546-conjugated
secondary antibodies were purchased from Invitrogen. Chemical reagents, including 1-
hexadecanethiol [H3C(CH2)15SH] and tri(ethylene glycol)-terminated alkanethiol

31
[HO(CH2CH2O)3(CH2)11SH] and anti-fibronectin polyclonal and anti-vinculin antibodies
were purchased from Sigma-Aldrich.
Elastomeric stamps
Master templates of required patterns were fabricated on silicon wafers using
standard photolithography techniques. Briefly, positive photoresist (Shipley 1813) was
spun onto a precleaned silicon wafer to a thickness of approximately 2 μm. UV exposure
of the resist was required to expose features of micron regime. The exposed areas were
developed leaving behind a template of recessed features. Templates were then exposed
to (tridecafluoro-1, 1, 2, 2-tetrahydrooctyl)-1-trichlorosilane (Sigma-Aldrich) in a
dessicator under vacuum to prevent the polydimethylsiloxane (PDMS) elastomer from
adhering to the exposed silicon. The PDMS precursors and curing agent (Sylgard 184,
Dow Corning Corporation, Midland, MI USA) were mixed in the recommended ratio
(10:1), degassed under vacuum, poured over the template in a 100 mm diameter flat dish
to a thickness of 5 mm, and cured at 65 °C for 2 h. The cured PDMS stamp containing
the desired features was then peeled from the template and cut into a 25 mm square.
Substrates
Glass coverslips (25mm in diameter) were sonicated in 50% ethanol, dried under
a stream of compressed N2 and then oxygen plasma cleaned for 5 min (PE50, Plasma
Etch, Inc., Carson City, NV). These coverslips were sequentially coated with 10 nm of
titanium and 20 nm of gold at a deposition rate of 0.5 Å/s in an electron beam evaporator.
Microcontact printing
For microcontact printing (μCP), the flat back of the stamp was allowed to self
seal to a glass slide to provide a rigid backing. The stamp was inked with 2 mM 1-
32
hexadecanethiol (Sigma-Aldrich) and then gently blown dry with compressed N2. The
stamp was gently placed on the substrate to ensure conformal contact of the features over
the entire area of substrate. The stamp was kept in contact for 10 s to produce an array of
CH3-teminated monolayer islands, to which proteins readily adsorbed. The stamp was
then carefully separated from the substrate with the help of tweezers. The patterned
substrates were incubated in 2 mM ethanolic solution of tri(ethylene glycol)-terminated
alkanethiol for 2 h to create a non-adhesive background around the CH3-terminated
islands. The substrates were rinsed in 95% ethanol and gently dried under a stream of N2.
Protein patterning
The substrates were incubated with fibronectin (20 μg/m in DPBS) (Invitrogen)
for 30 min and then blocked with denatured (65oC, 2 h) 1% bovine serum albumin
(Fisher Scientific, Fair Lawn, New Jersey) for 30 min to avoid non-specific protein
adsorption.
3.3 Results and Discussion
The feasibility of microcontact printing to be employed for the required patterns
for our study was examined. The patterns chosen were (a) 6 μm diameter circular islands;
(b) 10 μm outer, 8 μm inner diameter annular islands; (c) 10 μm diameter circular islands;
(d) 25 μm outer, 23 μm inner diameter annular islands and (e) 25 μm diameter circular
islands. The adhesive island geometries were chosen to delineate cell adhesive area from
cell spreading area to understand the contribution of peripheral distribution of focal
adhesions in regulating cell adhesion strength. The spacing between adhesive islands was
maintained at 75 µm so that each cell is confined to only a single island. (Lehnert et al.
2004)(Fig 3.2) However, due to small feature sizes and large spacing between features,

33
the stamp stability affected accurate replication of the smallest circular patterns (6 μm)
and the more challenging 1µm critical dimensions of the annular patterns. It was
hypothesized that stamp roof collapse prevented accurate pattern replication in 6 µm
circular patterns, 10 µm annular patterns (Fig 3.3) and 25 µm annular patterns (data not
shown).
The pattern sizes of 10 µm and 25 µm circular islands were accurately replicated
and were followed by protein incubation. Fibronectin (20 µg/ml) in complete DPBS was
allowed to incubate onto patterned surfaces of 10 µm and 25 µm adhesive islands for 30
min followed by incubation with denatured 1% BSA for another 30 min.
Immunofluorescence revealed protein tethering only to patterns (Fig 3.4). To achieve
cellular patterning, fibronectin coated samples were seeded with cells at a density of 225
cells/mm2. Phase contrast images taken after 16 hr revealed confinement of cell spreading
to the adhesive islands and the spherical and hemispherical morphology of the cells on 10
µm and 25 µm patterns respectively (Fig 3.5).
The radial intensity distribution in the green channel, representing vinculin (a
focal adhesion protein) on a 10 µm island (Fig 3.6) was examined. Immunofluorescence
staining of FA-localized vinculin in mechanically cleaved cells revealed that the cells
adhered to micropatterned substrates assembled adhesive structures analogous to
conventional focal adhesions in spread cells. Several components typically associated
with focal adhesions, including integrin 5β1, vinculin, talin, -actinin and paxillin,
localized to and remained constrained to the micropatterned areas in earlier studies too
(Gallant, Michael & Garcia 2005). The spatial segregation of focal adhesion proteins in
islands with 10 m diameter was clearly visible (Fig 3.6b). Also the intensity plots for

34
vinculin show enhanced recruitment at the periphery of the 10 m adhesive island (Fig
3.6c). Hence it can be concluded that there is an enhanced recruitment of FAs at the
periphery reinforcing the adhesion strength model explained by Gallant et.al.(Gallant,
Garcia 2007) This might be due to the distribution of mechanical load on the adhesive
structures to allow for the maximum moment arm for which the peripheral structures are
the best bet. Taken together, these results demonstrate that micropatterning approaches
can be applied to engineer adhesive domains and focal adhesion assembly while
controlling overall cell shape.
3.4 Conclusions
Microcontact printing of alkanethiols on gold surface was applied to control cell
adhesive area and cell spreading area but stamp stability posed a problem to accurately
replicate some of the patterns required for the study. However for the patterns that could
be replicated, recruitment of vinculin for cells adhered to the patterns revealed
preferential peripheral organization. So next, the stamp stability in low fill factor stamps
was investigated to achieve accurate pattern replication of all the geometries required to
test our central hypothesis.

35
Fig 3.1 Schematic diagram delineating cell adhesive area and cell spreading area.
Constant adhesive area
Constant spreading area
Varying Spreading area
Varying Adhesive area

36
Fig 3.2 Schematic diagram of process flow for micropatterned substrate preparation.
Silicon wafer
Template
Photoresist
Si
Si
Si
Si
PDMS
PDMS (stamp)
Spin coating
UV exposure through an optical mask
Pour PDMS on wafer
Peel PDMS off the master
PDMS (stamp)
Fibronectin
PEG thiol
Alkane thiol ink
Cells
PDMS (stamp)
Gold surface

37
Fig 3.3 Conventional μCP did not prevent roof collapse initiation and propagation for
stamps with fill factor of 0.5% and structure aspect ratio of 35:1. Cyanide etching
indicates areas of gold substrates that have been contacted by the inked stamp (dark
regions indicate ink protected gold; bright regions indicate etched gold). (a) 6 μm
diameter circular islands (b) 10 μm outer, 8 μm inner diameter annular islands (bars=50
μm).
a b

38
Fig 3.4 Immunostaining indicates fibronectin adsorbed only to micropatterned islands. (a)
10 µm diameter circular islands; (b) 25 µm diameter circular islands (bars=50 µm).
a b

39
Fig 3.5 Representative phase contrast images of micropatterned cells. (a) 10 µm diameter
circular islands; (b) 25 µm diameter circular islands. (Bars=25 µm).
a b

40
Fig 3.6 Immunostained images of fibronectin and vinculin and intensity plots of vinculin
on micropatterned cells. (a) Fibronectin on 10 m adhesive islands, and (b) vinculin
recruitment on 10 m adhesive islands. (c) Intensity plot across two micropatterns circled
in image (b) showing enhanced intensity at the periphery of the micropattern. (Bars=50
µm).
0
20
40
60
80
100
120
140
0 2 4 6 8 10 12
intensity
distance in microns
Intensity vs distance across micropattern
Image 1
Image 2
a b c

41
3.5 List of References
Balaban, N.Q., Schwarz, U.S., Riveline, D., Goichberg, P., Tzur, G., Sabanay, I., Mahalu, D., Safran, S., Bershadsky, A., Addadi, L. & Geiger, B. 2001, "Force and focal adhesion assembly: a close relationship studied using elastic micropatterned substrates", Nature cell biology, vol. 3, no. 5, pp. 466-472.
Ballestrem, C., Wehrle-Haller, B., Hinz, B. & Imhof, B.A. 2000, "Actin-dependent Lamellipodia Formation and Microtubule-dependent Tail Retraction Control-directed Cell Migration", Molecular biology of the cell, vol. 11, no. 9, pp. 2999-3012.
Berrier, A.L. & Yamada, K.M. 2007, "Cell-matrix adhesion", Journal of cellular physiology, vol. 213, no. 3, pp. 565-573.
Cavalcanti-Adam, E., Volberg, T., Micoulet, A., Kessler, H., Geiger, B. & Spatz, J.P. 2007, "Cell Spreading and Focal Adhesion Dynamics Are Regulated by Spacing of Integrin Ligands", Biophysical Journal, vol. 92, no. 8, pp. 2964-2974.
Cavalcanti-Adam, E.A., Micoulet, A., Blümmel, J., Auernheimer, J., Kessler, H. & Spatz, J.P. 2006, "Lateral spacing of integrin ligands influences cell spreading and focal adhesion assembly", European journal of cell biology, vol. 85, no. 3-4, pp. 219-224.
Chen, C.S., Alonso, J.L., Ostuni, E., Whitesides, G.M. & Ingber, D.E. 2003, "Cell shape provides global control of focal adhesion assembly", Biochemical and biophysical research communications, vol. 307, no. 2, pp. 355-361.
Chen, C.S., Mrksich, M., Huang, S., Whitesides, G.M. & Ingber, D.E. 1998, "Micropatterned Surfaces for Control of Cell Shape, Position, and Function", Biotechnology progress, vol. 14, no. 3, pp. 356-363.
Chen, C.S., Mrksich, M., Huang, S., Whitesides, G.M. & Ingber, D.E. 1997, "Geometric Control of Cell Life and Death", Science, vol. 276, no. 5317, pp. 1425-1428.
Danen, E.H. & Sonnenberg, A. 2003, "Integrins in regulation of tissue development and function", The Journal of pathology, vol. 200, no. 4, pp. 471-480.
Dumbauld, D.W., Shin, H., Gallant, N.D., Michael, K.E., Radhakrishna, H. & García, A.J. 2010, "Contractility modulates cell adhesion strengthening through focal adhesion kinase and assembly of vinculin-containing focal adhesions", Journal of cellular physiology, vol. 223, no. 3, pp. 746-756.
Ezzell, R.M., Goldmann, W.H., Wang, N., Parasharama, N. & Ingber, D.E. 1997, "Vinculin Promotes Cell Spreading by Mechanically Coupling Integrins to the Cytoskeleton", Experimental cell research, vol. 231, no. 1, pp. 14-26.
Gallant, N.D. & Andres J. Garcia 2007, "Model of integrin-mediated cell adhesion strengthening", Journal of Biomechanics, vol. 40, no. 6, pp. 1301-1309.
42
Gallant, N.D., Capadona, J.R., Frazier, A.B., Collard, D.M. & Garcia, A.J. 2002, "Micropatterned Surfaces to Engineer Focal Adhesions for Analysis of Cell Adhesion Strengthening", Langmuir, vol. 18, no. 14, pp. 5579-5584.
Gallant, N.D., Michael, K.E. & Garcia, A.J. 2005, "Cell Adhesion Strengthening: Contributions of Adhesive Area, Integrin Binding, and Focal Adhesion Assembly", Molecular biology of the cell, vol. 16, no. 9, pp. 4329-4340.
Geiger, B. & Bershadsky, A. 2001, "Assembly and mechanosensory function of focal contacts", Current opinion in cell biology, vol. 13, no. 5, pp. 584-592.
Guan, J. & Lee, L.J. 2005, "Generating highly ordered DNA nanostrand arrays", Proceedings of the National Academy of Sciences of the United States of America, vol. 102, no. 51, pp. 18321-18325.
Hynes, R.O. 2002, "Integrins: Bidirectional, Allosteric Signaling Machines", Cell, vol. 110, no. 6, pp. 673-687.
Kumar, A. & Whitesides, G.M. 1993, "Features of gold having micrometer to centimeter dimensions can be formed through a combination of stamping with an elastomeric stamp and an alkanethiol ``ink'' followed by chemical etching", Applied Physics Letters, vol. 63, no. 14, pp. 2002-2004.
Lehnert, D., Wehrle-Haller, B., David, C., Weiland, U., Ballestrem, C., Imhof, B.A. & Bastmeyer, M. 2004, "Cell behaviour on micropatterned substrata: limits of extracellular matrix geometry for spreading and adhesion", Journal of cell science, vol. 117, no. 1, pp. 41-52.
Massia, S.P. & Hubbell, J.A. 1991, "An RGD spacing of 440 nm is sufficient for integrin alpha V beta 3-mediated fibroblast spreading and 140 nm for focal contact and stress fiber formation.", The Journal of cell biology, vol. 114, no. 5, pp. 1089-1100.
Rape, A.D., Guo, W. & Wang, Y. 2011, "The regulation of traction force in relation to cell shape and focal adhesions", Biomaterials, vol. 32, no. 8, pp. 2043-2051.
Ruiz, S.A. & Chen, C.S. 2007, "Microcontact printing: A tool to pattern.", Soft Matter, vol. 3, no. 2, pp. 168-177.
Selhuber-Unkel, C., Erdmann, T., López-García, M., Kessler, H., Schwarz, U.S. & Spatz, J.P. 2010, "Cell Adhesion Strength Is Controlled by Intermolecular Spacing of Adhesion Receptors", Biophysical Journal, vol. 98, no. 4, pp. 543-551.
Stupack, D.G. & Cheresh, D.A. 2002, "Get a ligand, get a life: integrins, signaling and cell survival", Journal of cell science, vol. 115, no. 19, pp. 3729-3738.
Wang, N., Butler, J. & Ingber, D. 1993, "Mechanotransduction across the cell surface and through the cytoskeleton", Science, vol. 260, no. 5111, pp. 1124-1127.

43
Wang, N., Ostuni, E., Whitesides, G.M. & Ingber, D.E. 2002, "Micropatterning tractional forces in living cells", Cell motility and the cytoskeleton, vol. 52, no. 2, pp. 97-106.
Ward, M.D. & Hammer, D.A. 1993, "A theoretical analysis for the effect of focal contact formation on cell-substrate attachment strength", Biophysical Journal, vol. 64, no. 3, pp. 936-959.
Wozniak, M.A., Modzelewska, K., Kwong, L. & Keely, P.J. 2004, "Focal adhesion regulation of cell behavior", Biochimica et Biophysica Acta (BBA) - Molecular Cell Research, vol. 1692, no. 2-3, pp. 103-119.

44
Chapter 4. Microcontact Printing with Stamps Prone to Irreversible Roof Collapse
4.1 Introduction
Microcontact printing (μCP) is a technique originally designed to pattern surfaces
with well defined geometries and chemistries on substrates by forming self-assembled
monolayer (SAM) domains. The patterns are generated through the transfer of ‘ink’
molecules (usually alkanethiols or alkyl silanes) by conformal contact between micron
sized features protruding from a polymer stamp and a target substrate (Kumar,
Whitesides 1993, Delamarche et al. 1998, Balmer et al. 2005, Schmid, Michel 2000, Xia,
Whitesides 1997). Due to the growing demand in the application of this technique and
contradictory nature of the μCP process (stamp stability requires stiffer materials while
conformality demands softer materials), it is imperative to understand the mechanisms
underlying μCP to further the applicability of this technique. Extensive work on
establishing the conditions for conformal contact, the mechanics underlying the stability
of the stamps, and the limitations that are imposed by the stamp geometry has provided a
basis for the stamp design criteria (Delamarche et al. 1997, Hui et al. 2002, Bietsch,
Michel 2000). Further investigations into the mechanisms of stamp collapse have
provided insights into the limit of the achievable structural aspect ratios (defined as the
ratio of protruding structure separation to structure height) and stamp fill factors (defined
as the ratio of the combined lateral area of the protruding features to the total stamp area)
(Hui et al. 2002, Sharp et al. 2004, Zhou et al. 2005, Huang et al. 2005). As the
technological demands have surpassed the micron regime, research into μCP has led to
45
the development of a variety of stamp materials, inks and fabrication techniques to permit
submicron patterning with explicit replication accuracies (Perl, Reinhoudt & Huskens
2009).
Owing to its simplicity, μCP has since been refined and applied as a biology tool
to pattern proteins, cells and DNA (Ruiz, Chen 2007, Chen et al. 1998, Guan, Lee 2005).
However, complications arise in specific applications, such as the fabrication of spatially
directed nanowire growth (Hsu et al. 2005) or selective protein patterning to regulate cell-
substrate interactions while avoiding cell-cell contact, (Gallant et al. 2002, Balaban et al.
2001, Kane et al. 1999, Gallant, Michael & Garcia 2005) which require complex
geometries of small (micron or submicron) and sparsely patterned features on the
substrate. In these situations, stamps with extremely low fill factors (characterized by less
than 1%) are required if μCP is to be used. Moreover, extremely low fill factors would
enable μCP to be employed in the systematic study of individual adhesion complex
assembly with respect to the effect of size, density and position of adhesive domains in
cell-substrate interactions (Massia, Hubbell 1991, Cavalcanti-Adam et al. 2006,
Cavalcanti-Adam et al. 2007). In low fill factor stamps, the feature aspect ratio (defined
as the ratio of feature height to feature width) is maintained low (≤ 1) to avoid the
additional stamp stability problems arising from lateral collapse and buckling (Hui et al.
2002). This often leads to high structural aspect ratios (> 10:1) resulting in frequent
confrontation with roof collapse characterized by the undesired contact of the recessed
plane of the stamp to the substrate (Hui et al. 2002). Further complicating matters, the
parasitic roof contact will propagate throughout the pattern zone in low fill factor stamps
when the work of adhesion is higher than the elastic energy of the stamp features
46
(Bietsch, Michel 2000, Perl, Reinhoudt & Huskens 2009). After stamp removal, the
resulting substrate does not replicate the original stamp features due to the additional ink
transfer in unintended areas of stamp contact, thus affecting the yield of the effectively
patterned substrates.
Earlier investigations on stamp stability assumed roof collapse to occur
homogeneously throughout the contact area under uniformly applied external pressure
when the external pressure exceeds the collapse pressure (Hui et al. 2002, Bietsch,
Michel 2000, Sharp et al. 2004, Zhou et al. 2005, Huang et al. 2005, Decre et al. 2005).
Moreover, stamp stability criteria were established under the condition that the conformal
contact between the stamp and the substrate is complete and restricted to the protruding
plane of stamp features under the weight of the stamp (Hui et al. 2002, Bietsch, Michel
2000, Sharp et al. 2004, Zhou et al. 2005, Huang et al. 2005, Decre et al. 2005).
However, due to the large recessed areas in low fill factor stamps, roof collapse is non
homogeneous and was predominantly observed to initiate at the periphery of the stamp-
substrate contact area and propagate even without the application of external pressure
beyond that due to the self weight of the stamp. It was hypothesized that this peripheral
roof collapse initiation and subsequent propagation in low fill factor stamps is due to the
influence of conformal contact propagation on spatiotemporal stamp stability. This
hypothesis is supported by previous observations that the weight of the stamp itself is not
responsible for roof collapse under such scenarios (Zhou et al. 2005, Huang et al. 2005)
and that conformal contact initiates at a point and then propagates until the conformal
contact is complete (Greenwood, Williamson 1966). Although, effective techniques to
avoid roof collapse in high aspect ratio structures have been described, the investigations

47
were limited to high fill factor stamps where the fill factors investigated were mostly
above 10% (Bessueille et al. 2005, Pla-Roca et al. 2007). In such designs, the criterion for
collapse propagation Г (ratio of stamp restoring forces to adhesive forces) is greater than
1,(Bietsch, Michel 2000) thereby concealing the influence of spatiotemporal stamp
stability on roof collapse propagation. Although it can be understood from stamp
mechanics point of view that some kind of a collapse barrier or frame can be used to
enhance stamp stability,(Bietsch, Michel 2000) a more comprehensive understanding of
the stamp stability especially in low fill factor stamps would greatly expand the horizon
of applicability of μCP.
In this study, the peripheral roof collapse phenomenon in low fill factor stamps
was systematically investigated by dissecting it into two dynamic events: (a) roof
collapse initiation and (b) roof collapse propagation. The occurrence of these two events
in relation to the available theories unraveled the influence of conformal contact
propagation on spatiotemporal stamp stability in stamp designs prone to irreversible roof
collapse characterized by Г values lower than 1. To facilitate stamp stability and
successful pattern transfer in the pattern zone, a simple modification to stamp design is
proposed involving the fabrication of stamps with narrow peripheral high fill factor
regions enclosing the low fill factor pattern zones. The limits of applicability of this
modified μCP platform for large area patterning were explored relevant to the structural
aspect ratios and low fill factors under extreme scenarios previously unsuited to
patterning using conventional μCP.

48
4.2 Experimental Section
Elastomeric stamps
Master templates of required patterns were fabricated on silicon wafers using
standard photolithography techniques (Gallant et al. 2002). Briefly, positive photoresist
(Shipley 1813) was spun onto a precleaned silicon wafer to a thickness of approximately
2 μm. Sequential UV exposure of the resist was required to produce features of two size
scales (10-6 and 10-4 m) with a single development on the template. The wafer was
subjected to a primary exposure through an optical mask containing the required low fill
factor stamp features in the pattern zone followed by a secondary exposure through an
optical mask containing high fill factor features in the narrow peripheral zone. A single
development step was used to template wafers with dual scale features. The exposed
areas were developed leaving behind a template of recessed features. Templates were
then exposed to (tridecafluoro-1, 1, 2, 2-tetrahydrooctyl)-1-trichlorosilane in a dessicator
under vacuum to prevent the polydimethylsiloxane (PDMS) elastomer from adhering to
the exposed silicon. The PDMS precursor and curing agent (Sylgard 184, Dow Corning
Corporation, Midland, MI USA) were mixed in the recommended ratio (10:1), degassed
under vacuum, poured over the template in a 100 mm diameter flat dish to a thickness of
5 mm, and cured at 65 °C for 2 h. The cured PDMS stamp containing the desired features
was then peeled from the template and cut into required size ensuring the high fill factor
region was at the periphery where necessary.
49
Substrates
Glass coverslips (25mm in diameter) were sonicated in 50% ethanol, dried under
a stream of compressed N2 and then oxygen plasma cleaned for 5 min (PE50, Plasma
Etch, Inc., Carson City, NV USA). These coverslips were sequentially coated with 10 nm
of titanium and 20 nm of gold at a deposition rate of 0.5 Å/s in an electron beam
evaporator.
Microcontact printing
For μCP, the stamp was inked with 2 mM 1-hexadecanethiol (Sigma-Aldrich,
Inc., St. Louis, MO USA) and then gently blown dry with compressed N2. The flat back
of the stamp was allowed to self seal to a glass slide to provide a rigid backing. The
stamp was gently placed on the substrate to ensure conformal contact of the features over
the entire area of substrate. The stamp was kept in contact for 10 s and then carefully
separated from the substrate with the help of tweezers. Pattern fidelity over the entire
surface was verified by bright field microscopy after etching the substrates in 0.1 mM
KCN (pH 12.0). KCN is highly toxic and proper precautions should be taken. The gold
not protected by ink transfer was etched away appearing as bright areas and the ink
protected gold appeared darker.
4.3 Results
Conventional μCP with low fill factor stamps results in roof collapse
In an effort to address major challenges of μCP in a context relevant to most
users, the entire investigation was conducted using conventional μCP where the stamp is
manually brought into contact with the substrate by gently placing the stamp on the
substrate to ensure that excess pressure is avoided. In this study, the feature geometries

50
and distributions were chosen to investigate the mechanisms of roof collapse independent
from other stamp instabilities such as lateral collapse or buckling. In fact, the feature
aspect ratio (defined as the ratio of feature height to feature width) is maintained
sufficiently low to avoid the stamp stability problems arising from lateral collapse and
buckling (Hui et al. 2002). The first features investigated were 6 μm diameter circular
posts with a height of 2 μm spaced by 75 μm. The resulting effective fill factor was 0.5%
with a structural aspect ratio of 35:1 and feature aspect ratio of 1:3. This configuration
was selected for investigation due to its relevance to recent studies employing μCP such
as to obtain selective biopatterning of small and sparsely spaced features on substrates to
analyze cell-substrate interactions (Gallant, Michael & Garcia 2005, Dumbauld et al.
2010). μCP was carried out carefully with no external pressure as previously described.
The peripheral roof collapse initiation and subsequent propagation was clearly visible
spontaneously upon stamp contact as can be discerned by loss of characteristic
interference fringes. The resulting substrate was etched and imaged to evaluate pattern
fidelity. The representative images (Fig 4.1) show roof contact at unintended regions and
was observed throughout the pattern zone indicating roof collapse over the entire area (~5
cm2). The observed roof collapse was not specific to the shape of the feature as similar
results were observed for other geometries (squares and rectangles) with similar fill
factors and aspect ratios (Fig 4.1). A thin bright region around the post pattern on the
substrate is the residual non-contact area of the roof and is a characteristic of roof
collapse.
To understand the observed roof collapse phenomenon, it was subdivided into two
dynamic events for investigation: (a) roof collapse initiation and (b) roof collapse

51
propagation. The next objective was to explain the occurrence of these two events in the
context of available theoretical mechanisms for roof collapse.
Theoretical analyses of roof collapse initiation does not completely explain the
observed roof collapse in low fill factor stamps
Previous theories on stamp stability were developed based on uniform distribution
of pressure on the entire stamp features. Another inherent assumption was that the
conformal contact propagation between the stamp features and the substrate is complete
and that the roof collapse occurs when the external pressure exceeds the collapse pressure
at which the recessed plane contacts the substrate. To understand the observed roof
collapse initiation in light of the previous theories, first the magnitude of the collapse
pressure was compared to the applied pressure (self weight of the stamp along with rigid
glass backing).
Previous investigation by Bietsch et al., established that the order of magnitude of
the collapse pressure is similar for post configurations and line configurations of the same
width and fill factor (Bietsch, Michel 2000). Thus, theories developed for line and space
gratings were used to analyze the collapse pressure in the present stamps. For the same
width, height and fill factor as the posts, the lines of width 2 a and height h should be
spaced by 2 w given by,
fillfactor
aaw )( (4.1)
For the same fill factor as the posts (0.005), the lines of width 2 a =6 μm should be
spaced by 2 w =1194 μm. The collapse pressure for such line configuration (assuming

52
ah ) was predicted using the analytical expression developed by Hui et al., for shallow
stamp structures given by
12
coscosh12
1
1*
aw
w
w
a
hE
w
(4.2)
where is collapse pressure, *E is defined as 21 E
with E as Young’s modulus (1
Mpa) and is Poisson’s ratio (0.33), 2w as the spacing between the line features, and 2 a
as the width of the feature (Hui et al. 2002). By rearranging the expression, we obtain
given by,
1
1
*
)(2coscosh)(2
aw
waw
hE
(4.3)
Hence, the expression for becomes,
1
1
*
2
)(coscosh2
a
fillfactorwa
fillfactorhE
(4.4)
Evaluating for 2a=6 μm, h=2 μm and fill factor =0.005 with 2 w =1194 μm ,
resulted in 1 kPa which was compared to the pressure (0.2 kPa) exerted by the stamp with
rigid glass backing. Since it was established that the order of magnitude of the collapse
pressure is similar for post configurations and line configurations of the same width and
fill factor, (Bietsch, Michel 2000) it is reasonable to consider the collapse pressure to be 1
kPa for the 6 μm post configuration. It should be noted that the predicted collapse
pressure is accurate to the order of magnitude and not the absolute collapse pressure. In

53
fact, it was established that the value of collapse pressure in the post geometries is 5-50%
greater than for the line configurations with same width and fill factor, (Bietsch, Michel
2000) meaning that the range of collapse pressures can be between 1 kPa and 1.5 kPa.
Nevertheless, these collapse pressure values are larger than the pressure (0.2 kPa) exerted
by the stamp due to self weight implying that roof collapse should not occur due to
uniform pressure exerted by the weight of the stamp on the stamp features, which is in
contradiction of the observed results (Fig 4.1).
To further examine the axial deformation of posts due to self weight of the stamp
and its impact on roof collapse, it was hypothesized that gravity alone is not responsible
for the observed roof collapse. The hypothesis is backed by previous analyses showing
that self weight of the stamp is not responsible for roof collapse (Zhou et al. 2005, Huang
et al. 2005). To test the hypothesis, the axial compression of each feature due to gravity
when the weight of the stamp system is exerted on all the features uniformly was
evaluated. The stamp along with the glass backing weighed 10g acting over 490 mm2
(area of the substrate) resulting in a pressure ( extp ) of 0.2 kPa. postA was defined as the
area of the post and the spacing between them as s . Based on the fill factor, this pressure
is amplified in the posts ( localp ) by the inverse ratio of the fill factor given by
postextlocal A
spp
2
(4.5)
Evaluation of the local pressure resulted in 40.1 kPa on each post. Assuming
elastic deformation and following Hooke’s law, further evaluation of the axial
compression of each post due to this local pressure is given by

54
E
hph local (4.6)
and yielded 80 nm which is approximately only 4% of the feature height. This value is
consistent with previously reported value for axial compression under gravity (Zhou et al.
2005, Huang et al. 2005) confirming that gravity alone could not be responsible for the
observed roof collapse. To complement this analysis, μCP was carried out by placing the
substrate on the stamp and the collapse again initiates only under the weight of the glass
coverslip. Numerical calculations indicate that for a glass coverslip weighing 0.2 g exerts
a uniform pressure of 4.1 Pa resulting in a local pressure of 0.82 kPa on a post. Due to
this local pressure, the deformation of stamp features is evaluated to be 1.6 nm which is
approximately only 0.08% of the feature height. It is to be noted that in this analysis,
deformation of the recessed plane mediated by the feature deformation wasn’t considered
for simplifying the analysis. These results support the hypothesis that gravity alone could
not be responsible for the observed roof collapse as the axial deformations of the features
are well below the feature height under investigation (2 μm).
Theoretical prediction of roof collapse propagation agrees well with
experimental observations in low fill factor stamps
To predict the collapse propagation condition for the current post configuration (6
μm diameter circular posts with a height of 2 μm spaced by s =75 μm), the formulation
developed by Bietsch et al., was employed which compares the restoring force of the
stamp at collapse pressure to surface adhesion forces during roof collapse (Bietsch,
Michel 2000) given by,

55
W
s
(4.7)
For all the values of >1, the roof collapse is reversible upon release of the
external pressure, whereas for values <1, the roof collapse is irreversible implying that
the roof of the stamp does not retract back even if the external pressure is released.
Taking the value of work of adhesion W =0.5 J/m2 from previously reported studies
(Bietsch, Michel 2000) and the spacing between the 6 μm diameter circular posts
investigated in this study ( s =75 μm), resulted in a value of 0.05 which indicates
irreversible collapse. In other words, the adhesive forces are much greater than the
restoring forces in the stamp so that when roof collapse initiates at a certain point, it
propagates throughout the pattern zone. This prediction agrees well with the observed
results (Fig 4.1) that once roof collapse initiated, it propagated throughout the pattern
zone even without any additional external pressure.
Spatiotemporal stamp instability in low fill factor stamps
For low fill factor stamps, the prevailing theory predicted the experimentally
observed roof collapse propagation, but it couldn’t completely explain the initiation of
roof collapse. The existing analyses of roof collapse initiation were developed under the
condition that the conformal contact between the stamp and the substrate is restricted to
the protruding plane of stamp features under the weight of the stamp. Moreover, these
analyses assume that the external pressure applied is uniformly distributed on all the
stamp features. However, it was observed that in low fill factor stamps, roof collapse
initiates even when the external pressure due to the weight of the stamp (0.2 kPa) is lower
than the predicted collapse pressure (1 kPa). Taken together, it can be inferred from this

56
analysis that stamp stability is compromised even before the conformal contact between
the stamp features and the substrate is complete. Thus, it was hypothesized that the nature
of conformal contact induces spatiotemporal stamp instability in low fill factor stamps
implying that the initial stamp-substrate contact is not restricted to the protruding plane of
features. The hypothesis is partially supported by the previous analysis of Greenwood et
al., that demonstrated conformal contact between two surfaces initially occurs at a point
(Greenwood, Williamson 1966) and then propagates either due to externally applied
pressure or due to the work of adhesion between the two surfaces (Bietsch, Michel 2000).
On a macro scale, conformal contact between the stamp and the substrate (glass or gold
coated glass) can be interpreted as an initial contact point that occurs in a particular
region and then propagates as a contact front until the entire stamp achieves complete
conformal contact. Ideally, the conformal contact should be restricted to the protruding
plane of features for accurate pattern replication and stamp stability. However in low fill
factor stamps, the stamp is destabilized which initiates local roof collapse and progresses
to complete roof collapse (Fig 4.2).
This type of roof collapse initiation and propagation was not observed in previous
investigations with higher fill factor stamps ( >1) where the roof collapse was
homogeneous and was reported to occur only when uniformly applied external pressure
exceeded the collapse pressure. To determine if the conformal contact of the protruding
plane of features and roof collapse propagation in low fill factor stamps are two coupled
events, μCP was carried out and the stamp (consisting of 6 μm diameter circular posts
with a height of 2 μm spaced by 75 μm) was separated from the substrate before the roof
collapse propagation was complete throughout the pattern zone. At the transition zone

57
where the roof collapse propagation was intentionally halted, the etched substrate (Fig
4.3) reveals (i) a distinct zone of roof collapse (zone 1); (ii) a zone of partial feature
contact (zone 2) and (iii) a zone of no feature contact (zone 3).
This implies that roof collapse propagation and conformal contact front
propagation are two spatiotemporally synchronized events in low fill factor stamps. It can
be clearly observed that conformal contact of the protruding plane of features precedes
the conformal contact of the recessed plane. Moreover, it was also observed that the
conformal contact between a flat PDMS stamp and a gold substrate proceeded in a
process similar to the roof collapse in low fill factor stamps - both initiated at the
periphery of the stamp-substrate contact area. It was deduced that this peripheral
initiation is due to the inherent parallelism error present between the stamp and the
substrate during initial contact due to manual μCP. Hence the next investigation was on
the peripheral stamp stability against roof collapse during conformal contact propagation
in low fill factor stamps.
Non-uniform pressure distribution during conformal contact propagation
strongly modulates peripheral stamp stability in low fill factor stamps
It has been theoretically established and experimentally observed (Bietsch, Michel
2000) that the conformal contact between the stamp features and the substrate is not
homogeneous throughout the stamp. Rather, it initiates on a small subset of features upon
initial contact and then propagates in the protruding plane for complete conformal contact
of the entire stamp features (Fig 4.4).
Assuming that the initial contact occurs on protruding features, we hypothesized
that the non-uniform pressure distribution (wherein the total stamp load is concentrated

58
on fewer features as the magnitude of the parallelism error increases) during conformal
contact regulates peripheral stamp stability. Since this peripheral roof collapse
phenomenon has not been previously reported in higher fill factor stamps, the influence
of non-uniform pressure distribution was examined on the axial deformation of features
in the area of initial contact (Fig 4.5). A simple one-dimensional analysis of the axial
deformation of the features was performed as a function of the percentage of features
loaded during initial contact (using Eqs (4.5) and (4.6)). Under these conditions, axial
deformation is strongly dependent on the stamp fill factor for uniformly distributed stamp
features. Since fill factors can be increased by either increasing the feature size with
constant spacing between features (Fig 4.5a) or by decreasing the spacing between the
features with constant feature size (Fig 4.5b), a separate analysis was conducted for each
scenario.
Although, precise evaluation of the conditions for roof collapse in post geometries
requires complex numerical analysis under the conditions of a dynamic non-uniform
pressure distribution on the features in contact, this simple analysis provides sufficient
information to fairly predict the behavior of the stamp under such conditions. It can be
deduced from this simulation that as the fill factor of the stamp decreases, the effect of
initial contact area (% of features in contact) greatly affects the axial deformation of the
features thereby influencing the peripheral stamp stability. For higher fill factor stamps
(>5%), the axial deformation of stamp features are less than 10% even when the stamp
load is exerted on only 5% of the total features (due to large parallelism errors). Hence
this peripheral stamp stability problem is seldom encountered in higher fill factor stamps
and successful patterning is realized in most cases (Fig 4.6a). It is to be noted that roof

59
collapse was still observed occasionally in these high fill factor stamps due to a different
mechanism which is explained in the next section. In stamps with fill factors close to 1%,
successful patterning was realized only when extreme care was taken to avoid the non-
uniform pressure distribution. Since μCP was done manually, this turned out to be a
probabilistic event that greatly reduced the yield of faithfully reproduced patterned
substrates (Fig 4.6b,c). However, in lower fill factor stamps (<1%), the effect is more
pronounced due to the fact that, comparatively, the stamp load is exerted on a markedly
smaller total feature area, thereby greatly influencing the axial deformation and hence the
peripheral stamp stability. This simulation indicates that in stamps with fill factor of
0.5%, 50% of the features need to contact the substrate initially to have an axial
deformation lower than 10% implying an almost negligible tolerance for non-uniform
pressure distribution for a stamp with this design. This was observed experimentally
during μCP of stamps with fill factors of 0.5% wherein the peripheral roof collapse was
observed 100% of the time (Fig 4.1). These observations were consistently observed for a
large number of samples over a period of several months, removing any possible
ambiguities arising from manual (conventional) μCP of the stamps onto the substrates.
Large peripheral recessed areas exacerbate roof collapse through a different
mechanism – erroneous roof contact with the substrate
Since the ratio of restoring forces in the stamp to surface adhesive forces is much
lower in low fill factor stamps with high structural aspect ratios ( <1), any contact
between the substrate and the roof of the stamp would spontaneously cause parasitic roof
collapse propagation. It was hypothesized that due to the presence of large exposed
recessed regions at the periphery in the stamp design (a common characteristic feature of

60
the low fill factor stamp), erroneous roof contact with the substrate influences peripheral
stamp stability by initiating roof collapse and subsequent propagation (Fig 4.7). This
condition may be product of the stamp fabrication or a requirement of the pattern design.
To examine the roof collapse initiation mechanism due to erroneous roof contact
with the substrate, a stamp design was chosen which consists of a square pattern zone of
9mm2. The square pattern zone consisted of circular posts of 20 μm diameter, height of 2
μm with a spacing of 75 μm resulting in a fill factor of 5.5% ( <1). It is noted that this
stamp design is highly tolerant of non uniform pressures and typically collapse does not
initiate as indicated (Figs 4.5, 4.6). The stamp was carefully fabricated so that it consisted
of uniformly distributed features from end to end without overhanging recessed regions
in order to avoid the erroneous contact of the roof to the substrate (Fig 4.4). μCP was
carried out and the patterns were successfully transferred to the substrate as observed in
the images of the resulting etched substrates (Fig 4.8)
As a control, another stamp was fabricated with the same features except an
extended roof (50 μm overhang) was introduced at the periphery during the fabrication
process (Fig 4.7). Due to this change in the design, the fill factor of the stamp reduced
from 5.5% to 5.2% which is only a reduction in fill factor by 0.3% and still well above
unity. μCP was carried out and images of the etched substrates demonstrated the
consistent roof collapse initiation at the edge/periphery and subsequent propagation
throughout the pattern zone (Fig 4.9) due to erroneous roof contact with the substrate.
These results indicate that intricate details in the stamp design and fabrication
dramatically change the fate of stamp stability in stamps designs with <1.

61
Limitations imposed by spatiotemporal stamp stability in conventional μCP
with low fill factor stamps
Typically, the pattern design (feature geometry, spacing, and uniform or non-
uniform feature distribution) is fixed by the constraints of specific research application
and should not be limited by the technique. Thus, a contradiction emerged in the utility of
μCP for future applications in biology and nanotechnology. These results underscore that
understanding the dynamic conditions during initial contact is critical to pattern
substrates with stamp designs that involve non-uniformly distributed stamp features or
clustered pattern zones separated by large periods. Considering one such scenario,
repeated square pattern zones similar to the previous design (circular posts of 20 μm
diameter, height of 2 μm with a spacing of 75 μm resulting in a fill factor of 5.5% for
each square pattern zone) were fabricated onto a single stamp with a period of 1 mm in
between the square pattern zones. The total stamp area was approximately 5 cm2 (Fig
4.10) with a global fill factor of approximately 3%.
μCP was carried out and spontaneous roof collapse was observed in the areas
between the discrete clusters of pattern features at the periphery of the stamp upon
contact. The collapse quickly propagated throughout the entire stamp leaving a small
residual moat in each of the discrete clusters as explained elsewhere (Sharp et al. 2004).
The typical directions of the observed roof collapse propagation are depicted in the
schematic representation of the stamp-substrate contact area (Fig 4.11). Images of the
etched substrate reveal areas of roof collapse (Fig 4.11). Complete roof collapse was
observed on all of the 10 samples used in the study. Each time the roof collapse was
observed to originate from the periphery of the stamp-substrate contact area and, more

62
importantly, in between the areas of square pattern zones. The observed roof collapse in
this case is likely unavoidable due to the combined effect of the non-uniform pressure
distribution and the large exposed peripheral recessed regions, thereby ensuring the
collapse.
Taken together, these results suggest that in conventional μCP (a) the parallelism
error (if present) directs the periphery of the stamp to contact the substrate first; (b) the
areas directly vulnerable to roof collapse are the exposed regions of recessed plane at the
periphery of the stamp; and (c) non-uniform pressure distribution influences the
peripheral stamp stability especially in low fill factor stamps. Therefore, rather than
stamp stability criteria dictating the stamp design, understanding the process of conformal
contact and its influence on peripheral stamp stability allows for more rigorous usage of
this technique provided a novel way to enhance peripheral stamp stability is explored.
Hence the next focus was on achieving peripheral stamp stability by means that is not
unique to any particular stamp design but rather be applicable to a variety of stamp
designs irrespective of feature geometry, spacing, and uniform or non-uniform feature
distribution. This more complete understanding of critical factors influencing stamp
stability led to the design of stamps that can be successfully used in conventional μCP.
This novel approach greatly expands the applicability of conventional μCP beyond the
current limitations of patterning a uniform distribution of features with high fill factors.
A narrow peripheral high fill factor zone enclosing the desired pattern zone
enhances peripheral stamp stability
It is evident from these results that if peripheral stamp stability can be enhanced,
then as the conformal contact front proceeds from the periphery throughout the pattern

63
zone, the pressure distribution on the features becomes more uniform and the entire
stamp is stabilized. Moreover, since the zones vulnerable to roof collapse were
established as peripheral regions, we hypothesized that a narrow peripheral high fill
factor zone surrounding the pattern zone would enhance peripheral stamp stability. In
addition, it would also provide a barrier to the collapse propagation even under conditions
when peripheral stamp stability outside the pattern zone is compromised (e.g., extended
stamp roof). Numerous options for the narrow peripheral high fill factor region are
possible including (a) a large number of features with reduced spacing between them, (b)
large features with greater spacing between them, or (c) a combination of large features
with minimal spacing. The criteria determining whether the peripheral high fill factor
inhibits the collapse propagation into the pattern zone is dependent on the ratio of stamp
restoring forces to local adhesive forces characterized by values. Combinations
wherein stamps with a desired pattern were fabricated were examined with additional
circular posts with 500 μm diameter and height of 2 μm placed at radial peripheral
positions with varied spacing and examined the peripheral stamp stability (data not
shown). It was observed that peripheral fill factor of at least 68.8% was required to
provide the necessary restoring force so as to inhibit the roof collapse propagation into
the pattern zone.
To unify the approach, a continuous column enclosing the pattern zone was
chosen to enhance peripheral stamp stability. Since a continuous column protects all the
vulnerable zones at the periphery, it was expected to inhibit propagation of roof collapse
into the enclosed pattern zone. Based on the results on peripheral circular columns, the
stamp was fabricated with an annulus of 23 mm diameter (to match substrate dimension

64
of 25 mm) with a lateral thickness of 250 microns enclosing the pattern zone which
consisted of features to be patterned over an area of 5 cm2. It should be noted that the
height of the annulus and that of the features are equal to 2 μm. Patterning of substrates
was carried out using the modified stamp and imaged for pattern fidelity after etching the
substrates. Micrographs of the etched substrates indicate good pattern fidelity with no
trace of roof collapse over the entire pattern zone (Fig 4.12). The next examination was
on the influence of the dimensions of the annular column on pattern fidelity by
fabricating a series of stamps containing annular columns of diminishing lateral thickness
of 100 μm and 50 μm. No loss in the pattern fidelity or ability to inhibit collapse
propagation was observed (Fig 4.12). It is to be noted that the continuous column
completely inhibits the propagation of roof collapse into the pattern zone but does not
always prevent the occurrence of roof collapse at the periphery in most situations due to
large parallelism errors involved in conventional μCP. In order to understand the relation
between column lateral dimensions towards ability to inhibit collapse propagation,
analysis similar to Fig 4.5 was conducted wherein it was observed that the column lateral
dimensions to support a roof span of 23 mm must be at least 50 μm.
Stamps fabricated with an embedded continuous peripheral column – an
extended μCP platform
The applicability of this technique was further extended to stamps consisting of
various geometries, corresponding fill factors and structural aspect ratios (Fig 4.13).
Images of the etched substrates show faithful pattern replication for stamp feature
geometries approaching a critical dimension of 1 micron and fill factors down to 0.28%
with structure aspect ratios of 50:1 (annulus pattern with a spacing of 100 μm) (Fig
65
4.13d). Pattern transfer was also tested for a composite stamp design consisting of
varying feature geometries and distribution (Fig 4.13e).
To generalize this platform beyond the feature geometries and fill factors
investigated here and in order to test the limit of structural aspect ratio enabled by
utilizing this embedded annular column, a stamp was fabricated exclusively consisting of
an annulus of 23000 μm diameter with lateral width of 250 μm and height of 2 μm
containing no features in the pattern zone. Considering the annulus as the only structure
supporting the roof of the stamp, the structure aspect ratio of the stamp was 11500:1 with
an effective fill factor in the pattern zone of zero. The inked stamp was carefully placed
on the substrate and the characteristic interference patterns suggested that the roof did not
contact the substrate in the enclosed pattern zone. The substrate was etched and imaged
for any trace of roof collapse and it was observed that there was no contact of the roof to
the substrate over the entire area enclosed by the annulus (Fig 4.14a). Similar
experiments with an annulus of 23000 μm diameter with lateral thickness of 50 μm and
height of 2 μm with no features in the pattern zone (structure aspect ratio of the stamp
was 11500:1) also showed no trace of roof collapse over the entire area enclosed by the
annulus (Fig 4.14b).
It can be deduced from these results that by inhibiting the peripheral roof collapse
propagation by fabricating the stamp with an annulus around the pattern zone, the
structure aspect ratios that could be achieved by conventional μCP can be increased from
10:1 to at least 11500:1. This observation reinforces the fact that roof sagging between
features spaced by a few tens or hundreds of microns - a typical spacing in low fill factor
stamps - would not cause roof collapse due to only the combined weight of the stamp and
66
its rigid glass backing. Rather, peripheral roof collapse initiation is due to the parallelism
error which gives rise to feature compression under non-uniform pressure distribution or
erroneous exposed roof contact to the substrate, thus destabilizing the entire stamp.
Although applications that require such extreme structural aspect ratios are not typical,
the value of this platform lies in the flexibility it offers in choosing the pattern geometry,
size and spacing while designing stamps. More importantly, this platform enables μCP to
be employed to successfully pattern substrates with pre- engineered feature geometry,
size and spacing, which is a typical research scenario, rather than the limitations of μCP
dictating the pattern design.
4.4 Discussion
Roof collapse in μCP is characterized by the unwanted contact between the
recessed plane of the stamp and the substrate. To successfully pattern with low fill factor
stamps, high structural and feature aspect ratios need to be employed to eliminate the
other stamp instabilities – lateral collapse and buckling, resulting in increased
susceptibility for roof collapse. It has been experimentally and theoretically verified that
roof collapse occurs when the externally applied pressure exceeds the collapse pressure
value for a certain pattern configuration (Hui et al. 2002, Bietsch, Michel 2000, Sharp et
al. 2004, Zhou et al. 2005, Huang et al. 2005, Decre et al. 2005). The observations from
this study along with established theory suggests that conformal contact between PDMS
and glass (or gold coated glass) does not require externally applied pressure (Bietsch,
Michel 2000). In fact, the high work of adhesion between PDMS and glass (or gold
coated glass) is sufficient to propagate the conformal contact front (Bietsch, Michel
2000). The results of this analysis also reinforce previous reports of Huang et. al that

67
gravity alone is not responsible for the roof collapse (Zhou et al. 2005, Huang et al.
2005). However, in partial contrast to their findings, it was found that roof sagging alone
does not initiate roof collapse under the weight of the stamp (Fig 4.14). Taken together,
these findings suggest that to obtain good pattern fidelity, the operating pressures needed
to be much below the critical collapse pressures and that in most situations, stamping
may be conducted with no additional external pressure. Nevertheless, in the stamp
designs with small features and large recessed areas in between the features, roof collapse
propagation was observed to be a frequently confronted issue in conventional μCP,
limiting its usage in potential research areas spanning micro-nano fabrication, large area
biopatterning and cell biology.
Primary observation in this study is the difference in the mode of roof collapse in
low fill factor stamps. In higher fill factor stamps, roof collapse is homogeneous and
caused by excessive uniform external pressure. However, in low fill factor stamps, roof
collapse is non-homogeneous, occurs at pressures below the collapse pressure and
initiates at the periphery of the stamp-substrate contact area. The typical pattern
structures used in stamps are either categorized into uniform lines or discrete posts of
specified dimension and spacing. The prevailing theories were developed to explain
stamp stability conditions for uniformly distributed line configurations so that two
dimensional analytical treatment was feasible (Hui et al. 2002, Zhou et al. 2005, Huang et
al. 2005). For the more complicated three dimensional treatment of discrete posts,
numerical simulations are used to predict the stamp stability conditions (Bietsch, Michel
2000, Decre et al. 2005). However, in both cases, a few critical assumptions in the

68
existing theories must be noted to understand the peripheral roof collapse phenomenon
observed in low fill factor stamps.
First, the previous stamp stability criteria against roof collapse were formulated
under the condition that the conformal contact between the stamp and the substrate is
complete and restricted to the protruding plane of features under the weight of the stamp
(Hui et al. 2002, Bietsch, Michel 2000, Sharp et al. 2004, Zhou et al. 2005, Huang et al.
2005, Decre et al. 2005). Thus the assumption that there is a uniform pressure distribution
on the stamp features to establish stamp stability holds well. In this scenario, conformal
contact of the protruding plane of stamp features to the substrate and roof collapse are
two distinct events and are independent of each other at pressures relevant to that due to
the weight of the stamp. However, results of the present study suggest that due to slight
parallelism error between the stamp and substrate, the initial contact point would affect
peripheral stamp stability and influence the propagation of conformality, especially in
low fill factor stamps even without any external pressure other than the weight of the
stamp. Our results also establish that in low fill factor stamps, conformal contact of the
protruding plane of features and conformal contact of the recessed plane of the stamp
(roof collapse) are two synchronized, events in contrast to the established theories on
homogeneous roof collapse (Fig 4.3). These results agree well with the theory of
conformal contact wherein the process of contact between two nominally flat surfaces
occurs at a point of protrusion on microscopically rough substrates (Greenwood,
Williamson 1966) and is followed by propagation of the contact front due to the work of
adhesion or externally applied pressure (Bietsch, Michel 2000). This implies that the
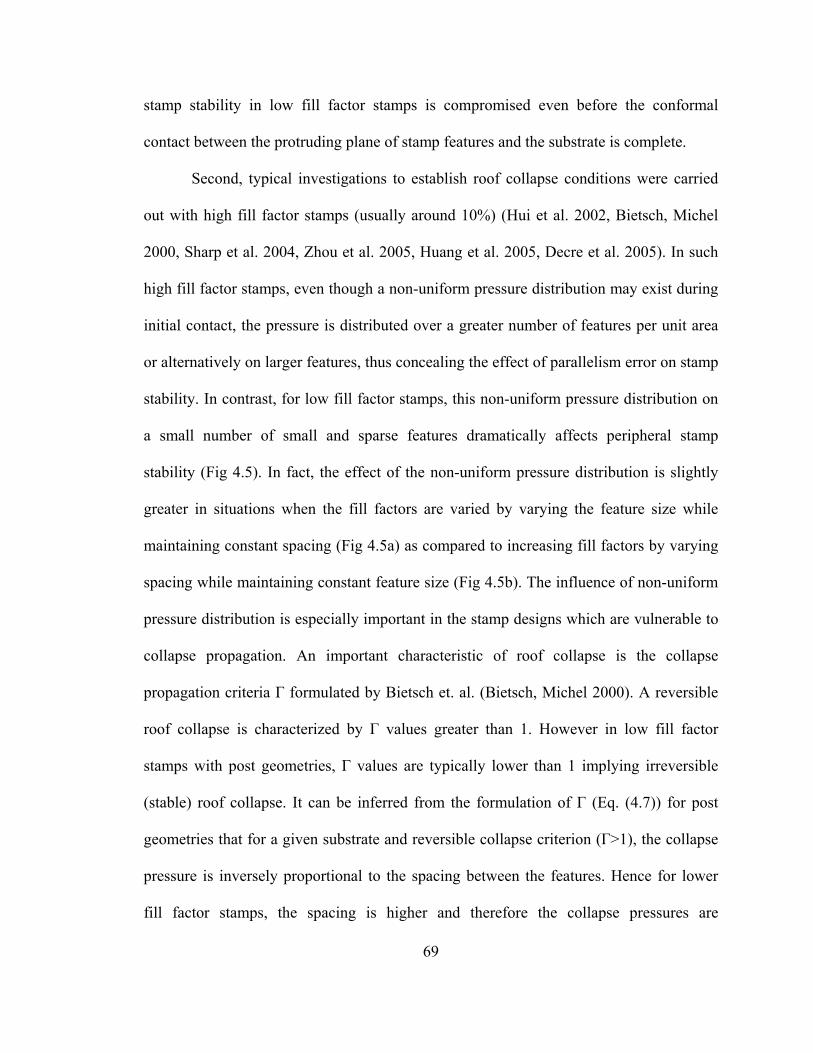
69
stamp stability in low fill factor stamps is compromised even before the conformal
contact between the protruding plane of stamp features and the substrate is complete.
Second, typical investigations to establish roof collapse conditions were carried
out with high fill factor stamps (usually around 10%) (Hui et al. 2002, Bietsch, Michel
2000, Sharp et al. 2004, Zhou et al. 2005, Huang et al. 2005, Decre et al. 2005). In such
high fill factor stamps, even though a non-uniform pressure distribution may exist during
initial contact, the pressure is distributed over a greater number of features per unit area
or alternatively on larger features, thus concealing the effect of parallelism error on stamp
stability. In contrast, for low fill factor stamps, this non-uniform pressure distribution on
a small number of small and sparse features dramatically affects peripheral stamp
stability (Fig 4.5). In fact, the effect of the non-uniform pressure distribution is slightly
greater in situations when the fill factors are varied by varying the feature size while
maintaining constant spacing (Fig 4.5a) as compared to increasing fill factors by varying
spacing while maintaining constant feature size (Fig 4.5b). The influence of non-uniform
pressure distribution is especially important in the stamp designs which are vulnerable to
collapse propagation. An important characteristic of roof collapse is the collapse
propagation criteria Γ formulated by Bietsch et. al. (Bietsch, Michel 2000). A reversible
roof collapse is characterized by Γ values greater than 1. However in low fill factor
stamps with post geometries, Γ values are typically lower than 1 implying irreversible
(stable) roof collapse. It can be inferred from the formulation of Γ (Eq. (4.7)) for post
geometries that for a given substrate and reversible collapse criterion (Γ>1), the collapse
pressure is inversely proportional to the spacing between the features. Hence for lower
fill factor stamps, the spacing is higher and therefore the collapse pressures are
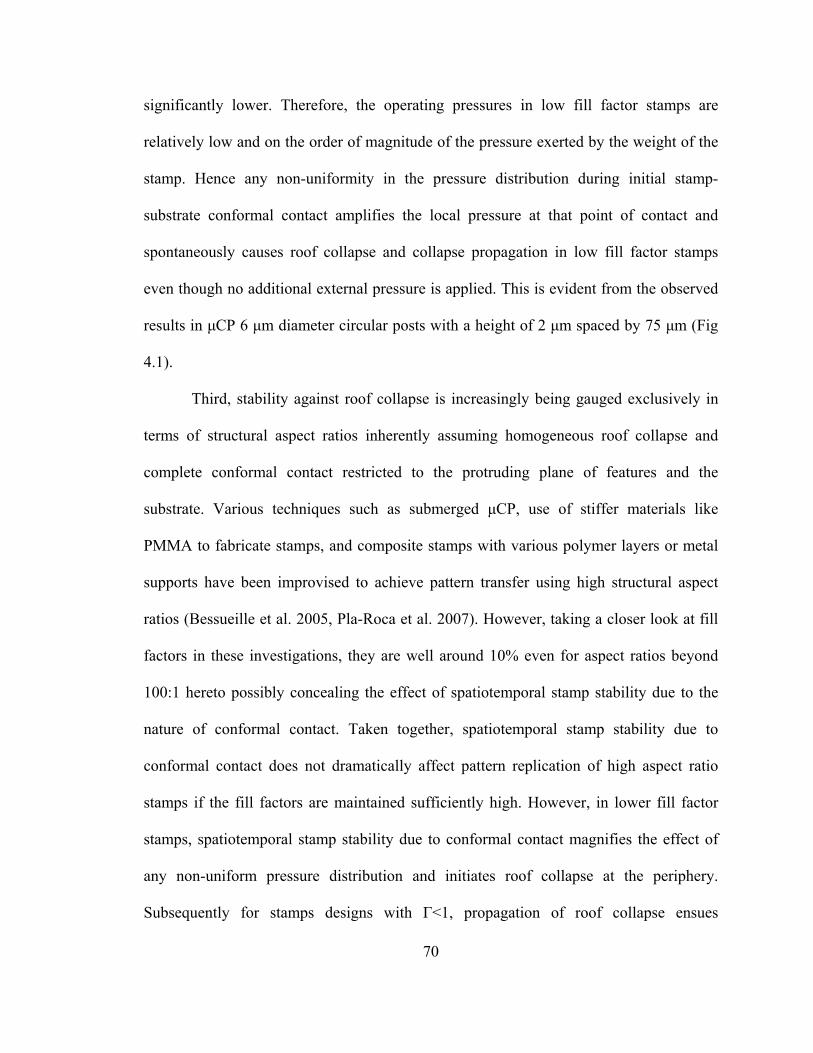
70
significantly lower. Therefore, the operating pressures in low fill factor stamps are
relatively low and on the order of magnitude of the pressure exerted by the weight of the
stamp. Hence any non-uniformity in the pressure distribution during initial stamp-
substrate conformal contact amplifies the local pressure at that point of contact and
spontaneously causes roof collapse and collapse propagation in low fill factor stamps
even though no additional external pressure is applied. This is evident from the observed
results in μCP 6 μm diameter circular posts with a height of 2 μm spaced by 75 μm (Fig
4.1).
Third, stability against roof collapse is increasingly being gauged exclusively in
terms of structural aspect ratios inherently assuming homogeneous roof collapse and
complete conformal contact restricted to the protruding plane of features and the
substrate. Various techniques such as submerged μCP, use of stiffer materials like
PMMA to fabricate stamps, and composite stamps with various polymer layers or metal
supports have been improvised to achieve pattern transfer using high structural aspect
ratios (Bessueille et al. 2005, Pla-Roca et al. 2007). However, taking a closer look at fill
factors in these investigations, they are well around 10% even for aspect ratios beyond
100:1 hereto possibly concealing the effect of spatiotemporal stamp stability due to the
nature of conformal contact. Taken together, spatiotemporal stamp stability due to
conformal contact does not dramatically affect pattern replication of high aspect ratio
stamps if the fill factors are maintained sufficiently high. However, in lower fill factor
stamps, spatiotemporal stamp stability due to conformal contact magnifies the effect of
any non-uniform pressure distribution and initiates roof collapse at the periphery.
Subsequently for stamps designs with Γ<1, propagation of roof collapse ensues

71
threatening accurate pattern replication throughout the pattern zone. Hence it was
deduced that in conventional μCP, the established stamp design criteria in terms of aspect
ratios or fill factors do not individually govern stamp stability but complement each
other.
Two distinct mechanisms were proposed to explain peripheral roof collapse and
propagation observed in low fill factor stamps due to spatiotemporal stamp stability: (i)
exaggerated axial deformation (compression) of stamp features due to the non-uniform
pressure distribution during conformal contact propagation mediates recessed plane
contact to the substrate; or (ii) erroneous contact of the substrate with exposed areas of
the recessed plane at the periphery of the stamp-substrate contact area. By understanding
the mechanisms of roof collapse initiation in low fill factor stamps, it is clear that by
enhancing peripheral stamp stability, pattern transfer can be made possible. Therefore to
facilitate μCP of low fill factor stamps and avoid parasitic roof collapse, stamps with two
regions were fabricated - a narrow peripheral high fill factor region and an enclosed low
fill factor pattern region. Since it was observed that the roof collapse always initiates at
the periphery of the stamp due to contact mechanics, this narrow peripheral high fill
factor region prevented the roof collapse propagation into the pattern zone even though
peripheral stamp stability outside the pattern zone may be compromised in some
scenarios. Absolute inhibition of collapse propagation into the pattern zone was achieved
by fabricating the stamp with an annulus as the high fill factor region enclosing the
pattern zone; however, other high fill factor regions can be effective (ensuring Γ>1 in the
peripheral region) providing for alternative designs. This platform enabled successful
patterning of stamps with fill factors in the pattern zone down to 0.28% which otherwise
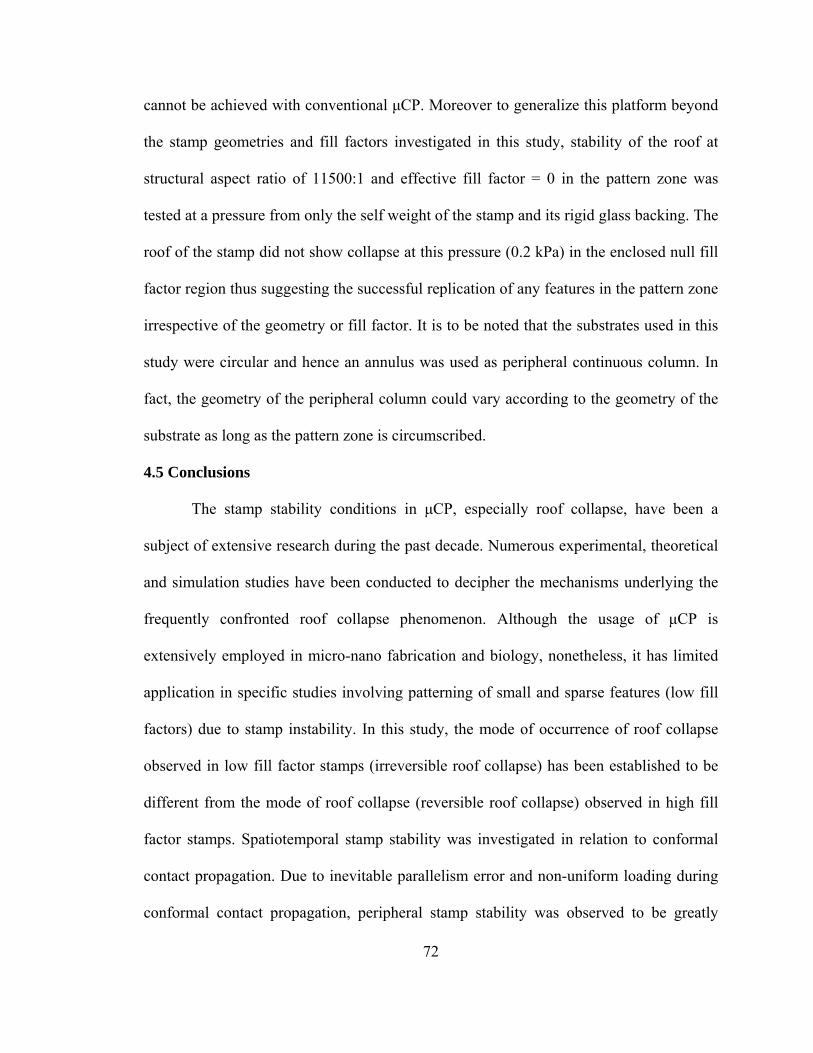
72
cannot be achieved with conventional μCP. Moreover to generalize this platform beyond
the stamp geometries and fill factors investigated in this study, stability of the roof at
structural aspect ratio of 11500:1 and effective fill factor = 0 in the pattern zone was
tested at a pressure from only the self weight of the stamp and its rigid glass backing. The
roof of the stamp did not show collapse at this pressure (0.2 kPa) in the enclosed null fill
factor region thus suggesting the successful replication of any features in the pattern zone
irrespective of the geometry or fill factor. It is to be noted that the substrates used in this
study were circular and hence an annulus was used as peripheral continuous column. In
fact, the geometry of the peripheral column could vary according to the geometry of the
substrate as long as the pattern zone is circumscribed.
4.5 Conclusions
The stamp stability conditions in μCP, especially roof collapse, have been a
subject of extensive research during the past decade. Numerous experimental, theoretical
and simulation studies have been conducted to decipher the mechanisms underlying the
frequently confronted roof collapse phenomenon. Although the usage of μCP is
extensively employed in micro-nano fabrication and biology, nonetheless, it has limited
application in specific studies involving patterning of small and sparse features (low fill
factors) due to stamp instability. In this study, the mode of occurrence of roof collapse
observed in low fill factor stamps (irreversible roof collapse) has been established to be
different from the mode of roof collapse (reversible roof collapse) observed in high fill
factor stamps. Spatiotemporal stamp stability was investigated in relation to conformal
contact propagation. Due to inevitable parallelism error and non-uniform loading during
conformal contact propagation, peripheral stamp stability was observed to be greatly
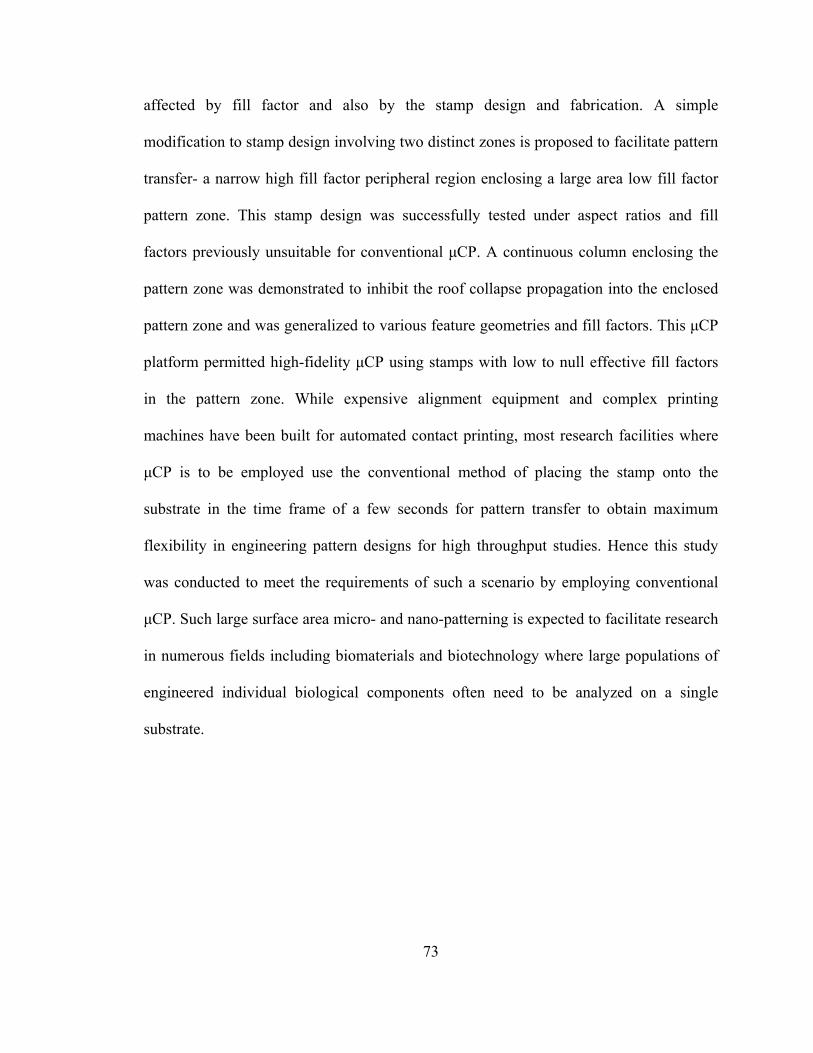
73
affected by fill factor and also by the stamp design and fabrication. A simple
modification to stamp design involving two distinct zones is proposed to facilitate pattern
transfer- a narrow high fill factor peripheral region enclosing a large area low fill factor
pattern zone. This stamp design was successfully tested under aspect ratios and fill
factors previously unsuitable for conventional μCP. A continuous column enclosing the
pattern zone was demonstrated to inhibit the roof collapse propagation into the enclosed
pattern zone and was generalized to various feature geometries and fill factors. This μCP
platform permitted high-fidelity μCP using stamps with low to null effective fill factors
in the pattern zone. While expensive alignment equipment and complex printing
machines have been built for automated contact printing, most research facilities where
μCP is to be employed use the conventional method of placing the stamp onto the
substrate in the time frame of a few seconds for pattern transfer to obtain maximum
flexibility in engineering pattern designs for high throughput studies. Hence this study
was conducted to meet the requirements of such a scenario by employing conventional
μCP. Such large surface area micro- and nano-patterning is expected to facilitate research
in numerous fields including biomaterials and biotechnology where large populations of
engineered individual biological components often need to be analyzed on a single
substrate.

74
Fig 4.1 Conventional μCP did not prevent roof collapse initiation and propagation for
stamps with fill factor of 0.5% and structure aspect ratio of 35:1. Cyanide etching
indicates areas of gold substrates that have been contacted by the inked stamp (dark
regions indicate ink protected gold; bright regions indicate etched gold). DIC images of
stamps (top row) and bright field images of the corresponding etched substrates (bottom
row) for (a) 6 μm diameter circular punches, (b) rectangular punches (8 μm x4 μm) and
(c) pairs of square punches (4 μm x4 μm separated by 8 μm) are shown. The narrow
bright regions surrounding the intended features (insets) indicate the residual non-contact
area between the roof and the substrate (bar = 50 μm, inset bar = 5 μm).
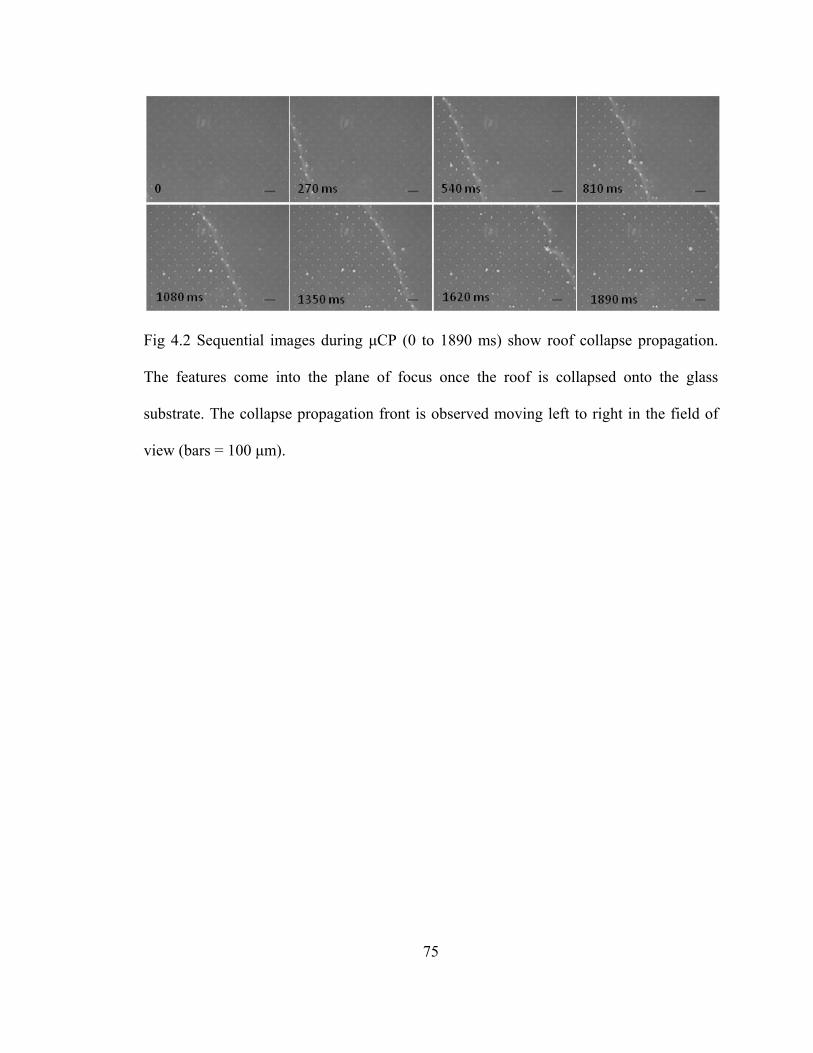
75
Fig 4.2 Sequential images during μCP (0 to 1890 ms) show roof collapse propagation.
The features come into the plane of focus once the roof is collapsed onto the glass
substrate. The collapse propagation front is observed moving left to right in the field of
view (bars = 100 μm).

76
Fig 4.3 Micrograph of the substrate, etched after the collapse propagation (moving left to
right) was interrupted. Image indicates that conformal contact of the protruding plane of
features precedes the conformal contact of the recessed plane. Stamp features are 6 μm
diameter circular posts with a height of 2 μm spaced by 75 μm with a resulting fill factor
of 0.5%. Cyanide etching reveals areas of gold substrates that have been contacted by the
inked stamp (dark regions indicate ink protected gold; bright regions indicate etched
gold) (bar = 100 μm, inset bar = 50 μm).
Zone 1 Zone 2 Zone 3

77
Fig 4.4 Schematic showing the initiation of conformal contact on peripheral protruding
features.

78
Fig 4.5 Theoretically obtained values for % of axial compression of the stamp features vs
% of stamp features in contact with the substrate during initial conformal contact for
various fill factors. Graphs obtained by (a) varying feature size and maintaining constant
spacing between the features; and (b) varying spacing between the features while
maintaining constant feature size.
0
10
20
30
40
50
60
70
80
90
0 20 40 60 80 100
% of axial compression on the stamp
features (µm)
% of stamp features in contact with the substrate
Fill factors at constant feature size
fill factor=0.5%
fill factor=1%
fill factor=5%
fill factor=10%
0
10
20
30
40
50
60
70
80
90
0 20 40 60 80 100
% of axial compression on the stamp
features (µm)
% of stamp features in contact with the substrate
Fill factors at constant feature spacing
fill factor=0.5%
fill factor=1%
fill factor=5%
fill factor=10%
a b
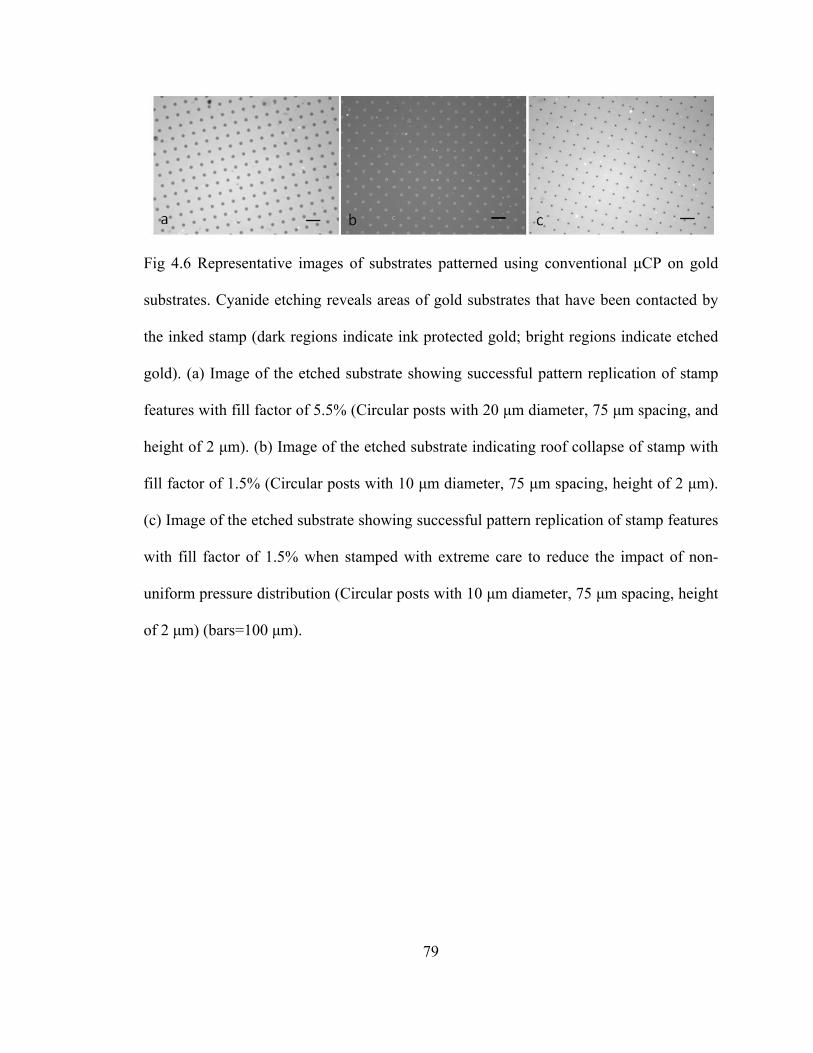
79
Fig 4.6 Representative images of substrates patterned using conventional μCP on gold
substrates. Cyanide etching reveals areas of gold substrates that have been contacted by
the inked stamp (dark regions indicate ink protected gold; bright regions indicate etched
gold). (a) Image of the etched substrate showing successful pattern replication of stamp
features with fill factor of 5.5% (Circular posts with 20 μm diameter, 75 μm spacing, and
height of 2 μm). (b) Image of the etched substrate indicating roof collapse of stamp with
fill factor of 1.5% (Circular posts with 10 μm diameter, 75 μm spacing, height of 2 μm).
(c) Image of the etched substrate showing successful pattern replication of stamp features
with fill factor of 1.5% when stamped with extreme care to reduce the impact of non-
uniform pressure distribution (Circular posts with 10 μm diameter, 75 μm spacing, height
of 2 μm) (bars=100 μm).
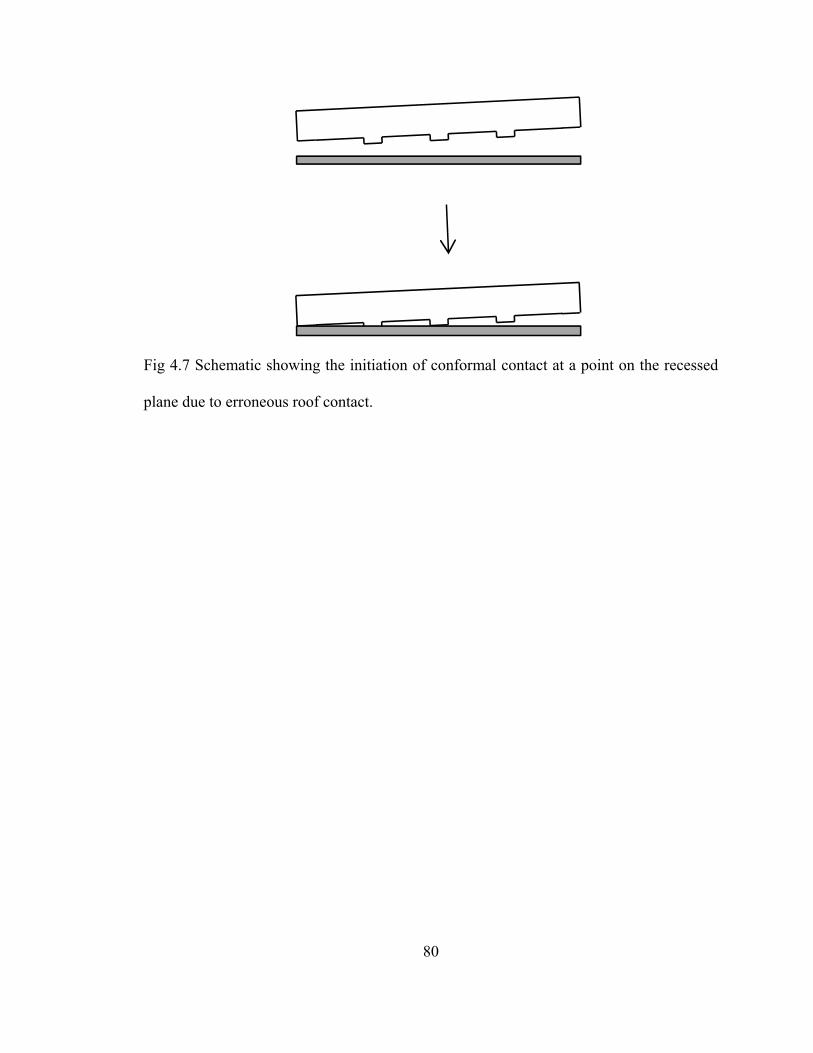
80
Fig 4.7 Schematic showing the initiation of conformal contact at a point on the recessed
plane due to erroneous roof contact.
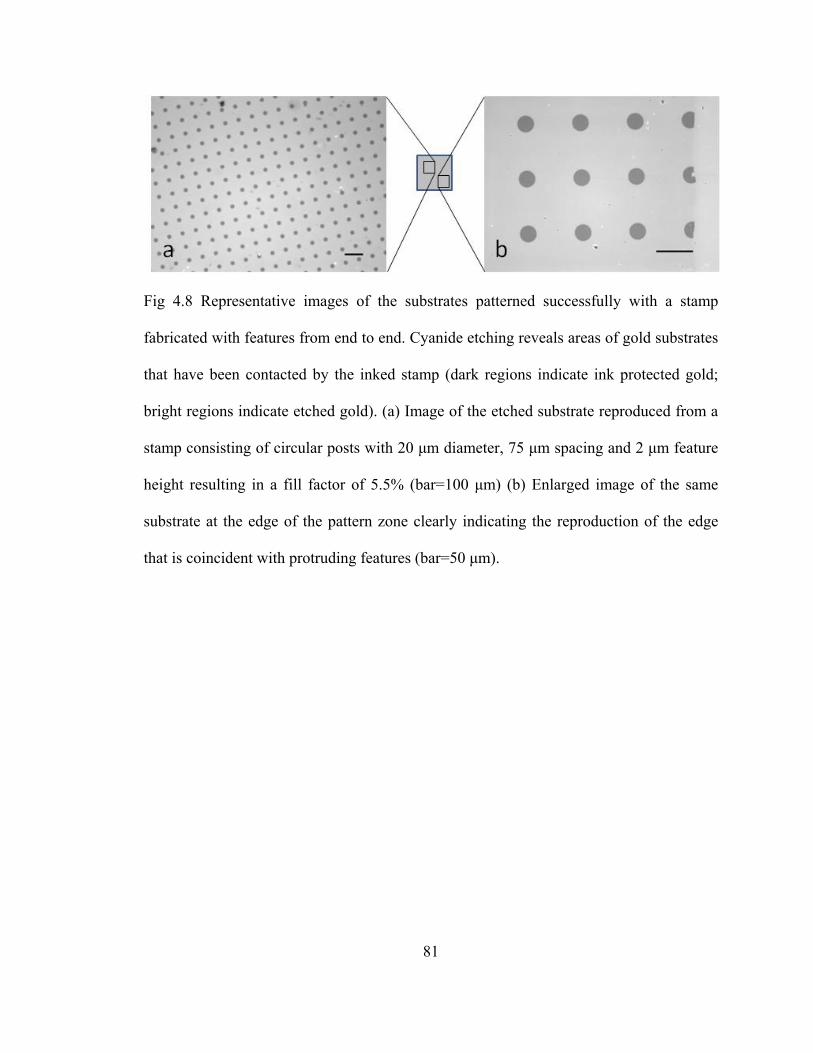
81
Fig 4.8 Representative images of the substrates patterned successfully with a stamp
fabricated with features from end to end. Cyanide etching reveals areas of gold substrates
that have been contacted by the inked stamp (dark regions indicate ink protected gold;
bright regions indicate etched gold). (a) Image of the etched substrate reproduced from a
stamp consisting of circular posts with 20 μm diameter, 75 μm spacing and 2 μm feature
height resulting in a fill factor of 5.5% (bar=100 μm) (b) Enlarged image of the same
substrate at the edge of the pattern zone clearly indicating the reproduction of the edge
that is coincident with protruding features (bar=50 μm).

82
Fig 4.9 Erroneous roof contact at the periphery due to an extended recessed plane
resulted in spontaneous roof collapse initiation and propagation. Cyanide etching reveals
areas of gold substrates that have been contacted by the inked stamp (dark regions
indicate ink protected gold; bright regions indicate etched gold). (a) Representative image
of an etched substrate showing roof contact (bar= 100 μm). (b) Enlarged image at the
periphery of the stamp-substrate contact area [(1) Substrate region not contacted by the
stamp; (2) region of extended recessed plane (roof) of the stamp contacted the substrate
initiating roof collapse] (bar=50 μm).

83
Fig 4.10 Schematic representation of the stamp with discrete square pattern zones and
enlarged image from one square pattern zone showing the stamp features. (Bar=100 μm)

84
Fig 4.11 Schematic of the stamp-substrate interface during conformal contact and
representative microscopic image. The arrows indicating typical directions of roof
collapse propagation. In fact, every peripheral recessed zone indicated by white area in
the stamp is a vulnerable zone for roof collapse initiation and the recessed zones
throughout the pattern area exacerbate the roof collapse propagation once initiated at the
periphery. Enlarged image shows roof contact areas with the substrate. [Cyanide etching
reveals areas of gold substrates that have been contacted by the inked stamp (dark regions
indicate ink protected gold; bright regions indicate etched gold)] (bar=500 μm, inset
bar=50 μm).
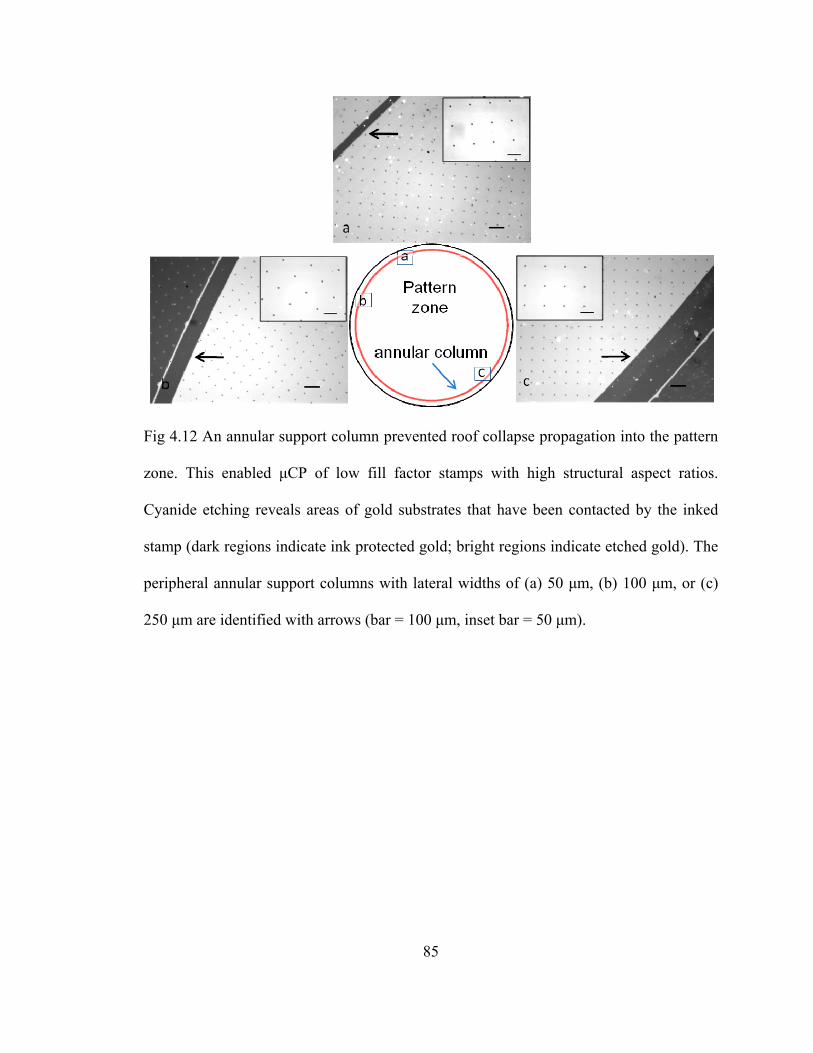
85
Fig 4.12 An annular support column prevented roof collapse propagation into the pattern
zone. This enabled μCP of low fill factor stamps with high structural aspect ratios.
Cyanide etching reveals areas of gold substrates that have been contacted by the inked
stamp (dark regions indicate ink protected gold; bright regions indicate etched gold). The
peripheral annular support columns with lateral widths of (a) 50 μm, (b) 100 μm, or (c)
250 μm are identified with arrows (bar = 100 μm, inset bar = 50 μm).
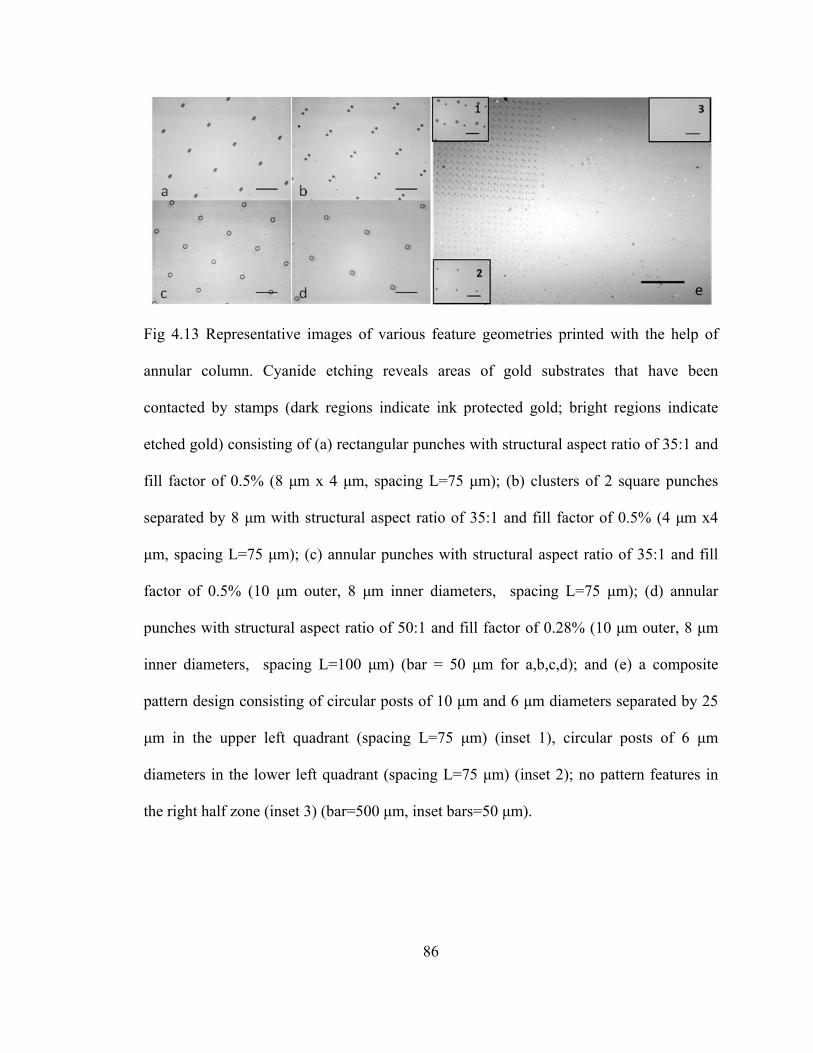
86
Fig 4.13 Representative images of various feature geometries printed with the help of
annular column. Cyanide etching reveals areas of gold substrates that have been
contacted by stamps (dark regions indicate ink protected gold; bright regions indicate
etched gold) consisting of (a) rectangular punches with structural aspect ratio of 35:1 and
fill factor of 0.5% (8 μm x 4 μm, spacing L=75 μm); (b) clusters of 2 square punches
separated by 8 μm with structural aspect ratio of 35:1 and fill factor of 0.5% (4 μm x4
μm, spacing L=75 μm); (c) annular punches with structural aspect ratio of 35:1 and fill
factor of 0.5% (10 μm outer, 8 μm inner diameters, spacing L=75 μm); (d) annular
punches with structural aspect ratio of 50:1 and fill factor of 0.28% (10 μm outer, 8 μm
inner diameters, spacing L=100 μm) (bar = 50 μm for a,b,c,d); and (e) a composite
pattern design consisting of circular posts of 10 μm and 6 μm diameters separated by 25
μm in the upper left quadrant (spacing L=75 μm) (inset 1), circular posts of 6 μm
diameters in the lower left quadrant (spacing L=75 μm) (inset 2); no pattern features in
the right half zone (inset 3) (bar=500 μm, inset bars=50 μm).

87
Fig 4.14 An annulus with structural aspect ratio of 11500:1. Lateral width of the column
being (a) 250 μm or (b) 50 μm prevented roof collapse during μCP using a stamp devoid
of punches in the pattern zone (effective fill factor = 0). Cyanide etching reveals areas of
gold substrates that have been contacted by the stamp (dark regions indicate ink protected
gold; bright regions indicate etched gold) during μCP. Images 1-8 demonstrate ink
transfer via stamp contact at various positions on the substrate (bars = 500 μm, inset bar =
50 μm).
Pattern zone
annular column
1
23
4
57
6
8
1 2 3
5
4
67
8
Pattern zone
annular column
1
23
4
57
6
8
1 2 3
5
4
67
8
a b

88
4.6 List of References
Balaban, N.Q., Schwarz, U.S., Riveline, D., Goichberg, P., Tzur, G., Sabanay, I., Mahalu, D., Safran, S., Bershadsky, A., Addadi, L. & Geiger, B. 2001, "Force and focal adhesion assembly: a close relationship studied using elastic micropatterned substrates", Nature cell biology, vol. 3, no. 5, pp. 466-472.
Balmer, T.E., Schmid, H., Stutz, R., Delamarche, E., Michel, B., Spencer, N.D. & Wolf, H. 2005, "Diffusion of Alkanethiols in PDMS and Its Implications on Microcontact Printing (μCP)", Langmuir, vol. 21, no. 2, pp. 622-632.
Bessueille, F., Pla-Roca, M., Mills, C.A., Martinez, E., Samitier, J. & Errachid, A. 2005, "Submerged Microcontact Printing (SμCP): An Unconventional Printing Technique of Thiols Using High Aspect Ratio, Elastomeric Stamps", Langmuir, vol. 21, no. 26, pp. 12060-12063.
Bietsch, A. & Michel, B. 2000, "Conformal contact and pattern stability of stamps used for soft lithography", Journal of Applied Physics, vol. 88, no. 7, pp. 4310-4318.
Cavalcanti-Adam, E., Volberg, T., Micoulet, A., Kessler, H., Geiger, B. & Spatz, J.P. 2007, "Cell Spreading and Focal Adhesion Dynamics Are Regulated by Spacing of Integrin Ligands", Biophysical Journal, vol. 92, no. 8, pp. 2964-2974.
Cavalcanti-Adam, E.A., Micoulet, A., Blümmel, J., Auernheimer, J., Kessler, H. & Spatz, J.P. 2006, "Lateral spacing of integrin ligands influences cell spreading and focal adhesion assembly", European journal of cell biology, vol. 85, no. 3-4, pp. 219-224.
Chen, C.S., Mrksich, M., Huang, S., Whitesides, G.M. & Ingber, D.E. 1998, "Micropatterned Surfaces for Control of Cell Shape, Position, and Function", Biotechnology progress, vol. 14, no. 3, pp. 356-363.
Decre, M.M.J., Timmermans, P.H.M., van, d.S. & Schroeders, R. 2005, "Numerical and Experimental Study of Critical Roof Collapse Conditions in Soft Lithography", Langmuir, vol. 21, no. 17, pp. 7971-7978.
Delamarche, E., Schmid, H., Bietsch, A., Larsen, N.B., Rothuizen, H., Michel, B. & Biebuyck, H. 1998, "Transport Mechanisms of Alkanethiols during Microcontact Printing on Gold", The Journal of Physical Chemistry B, vol. 102, no. 18, pp. 3324-3334.
Delamarche, E., Schmid, H., Michel, B. & Biebuyck, H. 1997, "Stability of molded polydimethylsiloxane microstructures", Advanced Materials, vol. 9, no. 9, pp. 741-746.
Dumbauld, D.W., Shin, H., Gallant, N.D., Michael, K.E., Radhakrishna, H. & García, A.J. 2010, "Contractility modulates cell adhesion strengthening through focal adhesion kinase and assembly of vinculin-containing focal adhesions", Journal of cellular physiology, vol. 223, no. 3, pp. 746-756.

89
Gallant, N.D., Capadona, J.R., Frazier, A.B., Collard, D.M. & Garcia, A.J. 2002, "Micropatterned Surfaces to Engineer Focal Adhesions for Analysis of Cell Adhesion Strengthening", Langmuir, vol. 18, no. 14, pp. 5579-5584.
Gallant, N.D., Michael, K.E. & Garcia, A.J. 2005, "Cell Adhesion Strengthening: Contributions of Adhesive Area, Integrin Binding, and Focal Adhesion Assembly", Molecular biology of the cell, vol. 16, no. 9, pp. 4329-4340.
Greenwood, J.A. & Williamson, J.B.P. 1966, "Contact of Nominally Flat Surfaces", Proceedings of the Royal Society of London.Series A.Mathematical and Physical Sciences, vol. 295, no. 1442, pp. 300-319.
Guan, J. & Lee, L.J. 2005, "Generating highly ordered DNA nanostrand arrays", Proceedings of the National Academy of Sciences of the United States of America, vol. 102, no. 51, pp. 18321-18325.
Hsu, J.W.P., Tian, Z.R., Simmons, N.C., Matzke, C.M., Voigt, J.A. & Liu, J. 2005, "Directed Spatial Organization of Zinc Oxide Nanorods", Nano Letters, vol. 5, no. 1, pp. 83-86.
Huang, Y.Y., Zhou, W., Hsia, K.J., Menard, E., Park, J., Rogers, J.A. & Alleyne, A.G. 2005, "Stamp Collapse in Soft Lithography", Langmuir, vol. 21, no. 17, pp. 8058-8068.
Hui, C.Y., Jagota, A., Lin, Y.Y. & Kramer, E.J. 2002, "Constraints on Microcontact Printing Imposed by Stamp Deformation", Langmuir, vol. 18, no. 4, pp. 1394-1407.
Kane, R.S., Takayama, S., Ostuni, E., Ingber, D.E. & Whitesides, G.M. 1999, "Patterning proteins and cells using soft lithography", Biomaterials, vol. 20, no. 23-24, pp. 2363-2376.
Kumar, A. & Whitesides, G.M. 1993, "Features of gold having micrometer to centimeter dimensions can be formed through a combination of stamping with an elastomeric stamp and an alkanethiol ``ink'' followed by chemical etching", Applied Physics Letters, vol. 63, no. 14, pp. 2002-2004.
Massia, S.P. & Hubbell, J.A. 1991, "An RGD spacing of 440 nm is sufficient for integrin alpha V beta 3-mediated fibroblast spreading and 140 nm for focal contact and stress fiber formation.", The Journal of cell biology, vol. 114, no. 5, pp. 1089-1100.
Perl, A., Reinhoudt, D.N. & Huskens, J. 2009, "Microcontact Printing: Limitations and Achievements", Advanced Materials, vol. 21, no. 22, pp. 2257-2268.
Pla-Roca, M., Fernandez, J.G., Mills, C.A., Martinez, E. & Samitier, J. 2007, "Micro/Nanopatterning of Proteins via Contact Printing Using High Aspect Ratio PMMA Stamps and NanoImprint Apparatus", Langmuir, vol. 23, no. 16, pp. 8614-8618.

90
Ruiz, S.A. & Chen, C.S. 2007, "Microcontact printing: A tool to pattern.", Soft Matter, vol. 3, no. 2, pp. 168-177.
Schmid, H. & Michel, B. 2000, "Siloxane Polymers for High-Resolution, High-Accuracy Soft Lithography", Macromolecules, vol. 33, no. 8, pp. 3042-3049.
Sharp, K.G., Blackman, G.S., Glassmaker, N.J., Jagota, A. & Hui, C. 2004, "Effect of Stamp Deformation on the Quality of Microcontact Printing: Theory and Experiment", Langmuir, vol. 20, no. 15, pp. 6430-6438.
Xia, Y. & Whitesides, G.M. 1997, "Extending Microcontact Printing as a Microlithographic Technique", Langmuir, vol. 13, no. 7, pp. 2059-2067.
Zhou, W., Huang, Y., Menard, E., Aluru, N.R., Rogers, J.A. & Alleyne, A.G. 2005, "Mechanism for stamp collapse in soft lithography", Applied Physics Letters, vol. 87, no. 25, pp. 251925-251925-3.

91
Chapter 5. Regulation of Cell Adhesion Strength by Peripheral Focal Adhesion
Distribution1
5.1 Introduction
Cell adhesion to the extracellular matrix (ECM) plays a central role in mediating
and regulating important cellular processes including but not limited to cell migration,
bidirectional signaling during morphogenesis, tissue homeostasis and wound healing
(Berrier, Yamada 2007). Adhesion of cells to ECM components, including fibronectin
and laminin, is primarily mediated by transmembrane heterodimeric receptors that belong
to the integrin family (Hynes 2002). Receptor mediated adhesion is a complex process
involving integrin recruitment to the interface, activation, and mechanical coupling to
extracellular ligands (Garcia, Huber & Boettiger 1998). These bound receptors rapidly
interact with the actin cytoskeleton and cluster together to form focal adhesions (FA),
large supramolecular complexes that contain structural proteins like talin, vinculin and α-
actinin and signaling proteins, such as FAK, Src and paxillin (Geiger et al. 2001).
FAs are reinforced and stabilized by actin-myosin contractility which enhances
adhesion strength (Gallant, Michael & Garcia 2005, Dumbauld et al. 2010) and generates
‘cellular traction’ that leads to cell spreading and cell migration by applying mechanical
force on the underlying substrate (Fournier et al. 2010). Since the interactions between
integrins and actin stress fibers are known to be mediated by FA assembly, cell shape
1 Parts of chapter 5 submitted to Biophysical Journal (under second review) as a research article.

92
(cell spreading) has been characterized as a main regulator for FA assembly by
transmitting force from the ECM to cytoskeletal components (Chen et al. 1997, Chen et
al. 1998, Chen et al. 2003). Moreover, extensive studies during the past decade indicate
that mechanical tension generated within the cytoskeleton of living cells is a critical
regulator of various cellular functions (Chicurel, Chen & Ingber 1998, Vogel, Sheetz
2006). Further probing into the mechanical interactions between the cell and the substrate
demonstrated the existence of an “inside-out” mechanism whereby changes in cell shape
by global cell distortion increase the cytoskeletal tension and drive FA assembly (Chen et
al. 2003). As a complimentary approach, changing the elasticity of the underlying
substrate regulated the level of tension that a cell can exert on the substrate which, in
turn, directly affects FA assembly (Balaban et al. 2001).
To elucidate the structure-function relationships between the adhesive
components, micropatterned surfaces complemented by a hydrodynamic shear assay have
been successfully employed by Gallant et al. (Gallant et al. 2002). That work on the
spatiotemporal evolution of cell adhesion strength on micropatterned surfaces dissected
the contributions of adhesive area, integrin binding and FA assembly towards cell
adhesion strengthening (Gallant, Michael & Garcia 2005). It was established that steady
state adhesion strength varied non-linearly with adhesive area and reached a plateau at an
adhesive area of 78 µm2, beyond which further rises in adhesive area did not enhance the
steady state adhesion strength (Gallant, Michael & Garcia 2005). This is in contrast to
studies of cellular traction that demonstrated linear increases in mean traction with
increases in cell spreading area (Wang et al. 2002, Reinhart-King, Dembo & Hammer
2003). The nonlinearity in the adhesion strength was attributed to peripheral clustering of
93
integrins and subsequent formation of FAs (Gallant, Michael & Garcia 2005) in line with
the previous analysis by Ward and Hammer (Ward, Hammer 1993). Mathematical
models that simulate the clustering of integrins and subsequent formation of FAs have
been developed to examine the non-linearity in the adhesion strength with respect to the
adhesive area (Gallant, Andres J. Garcia 2007, Kong, Ji & Dai 2008). However, as the
adhesive area is manipulated, the cell spreading area and the distribution of FAs is
inherently affected. Hence, it is unclear whether the extent of cell spreading modulated
by the spatial distribution of adhesive complexes or the total available adhesive area is
responsible for the enhancement in the adhesion strength. Moreover, it is also unclear
whether the set point area of ~78 µm2, beyond which there is no significant enhancement
in the adhesion strength, is dictated by the total cell adhesive area or by the extent of cell
spreading due to the peripheral distribution of adhesive complexes.
Based on the previous observations of the formation of distinct peripheral
adhesion complexes (Gallant, Michael & Garcia 2005, Dumbauld et al. 2010), it was
hypothesized that the spatial distribution of adhesive complexes plays a significant role in
regulating the cell-substrate adhesion strength. To test this hypothesis, cell adhesive areas
were engineered to delineate the cell spreading area from total cell adhesive area, thereby
enabling us to modulate the position of FAs. In the design of the peripheral adhesion
complexes, the ‘adhesive patch’ size was limited to 1 µm which is consistent with our
earlier experimental and theoretical adhesion models. The usage of soft lithographic
techniques and well defined surface chemistries to fabricate these adhesive surfaces
enabled to control cell shape and adhesive complex position. Specifically, adhesive
islands of constant outer diameter or constant area were engineered to dissect the

94
regulatory roles of total adhesive area and adhesive complex distribution (Fig 5.1). A
hydrodynamic shear assay was used to quantify the adhesion strength of cells cultured on
these micropatterned substrates coated with adhesive proteins, thus enabling us to analyze
the effect of adhesive complex position on the overall adhesion strength independently of
the total cell adhesive area. In light of the recent observations that cellular traction
depends on FA assembly and cell spreading extent, an attempt has been made to contrast
the functional role of these events in cell adhesion and traction. Such a mechanistic
insight into the key biophysical regulators of cell adhesion would be indispensible in
understanding mechanotransduction to manipulate cell adhesive interfaces on
biomaterials which are critical to applications including tissue engineering and in vitro
organ models.
5.2 Experimental Section
Reagents
Dulbecco’s modified Eagle’s medium (Invitrogen, Carlsbad, CA) supplemented
with 10% new born calf serum (Invitrogen) and 1% penicillin-streptomycin (Invitrogen)
was used as complete growth media (CGM). Cell culture reagents, including human
plasma fibronectin and Dulbecco’s phosphate-buffered saline (DPBS), and AlexaFluor
488-conjugated secondary antibodies, Hoechst-33242 and rhodamine-conjugated
phalloidin were purchased from Invitrogen. Chemical reagents, including 1-
hexadecanethiol [H3C(CH2)15SH] and tri(ethylene glycol)-terminated alkanethiol
[HO(CH2CH2O)3(CH2)11SH], and anti-fibronectin polyclonal and anti-vinculin antibodies
were purchased from Sigma-Aldrich.
95
Elastomeric stamps
Master templates of required patterns were fabricated on silicon wafers using
standard photolithography techniques. Briefly, positive photoresist (Shipley 1813) was
spun onto a precleaned silicon wafer to a thickness of approximately 2 μm. Sequential
UV exposure of the resist was required to produce features of two size scales (10-6 and
10-4 m) with a single development on the template. The wafer was subjected to a primary
exposure through an optical mask containing the required low fill factor stamp features in
the pattern zone followed by a secondary exposure through an optical mask containing
the annular peripheral zone. This feature was necessary to prevent the parasitic roof
collapse inherent to low fill factor, large structural aspect ratio stamp designs. The
exposed areas were developed leaving behind a template of recessed features. Templates
were then exposed to (tridecafluoro-1, 1, 2, 2-tetrahydrooctyl)-1-trichlorosilane (Sigma-
Aldrich) in a dessicator under vacuum to prevent the polydimethylsiloxane (PDMS)
elastomer from adhering to the exposed silicon. The PDMS precursors and curing agent
(Sylgard 184, Dow Corning Corporation, Midland, MI USA) were mixed in the
recommended ratio (10:1), degassed under vacuum, poured over the template in a 100
mm diameter flat dish to a thickness of 5 mm, and cured at 65 °C for 2 h. The cured
PDMS stamp containing the desired features was then peeled from the template and cut
into a 25 mm square ensuring the annular region was at the periphery.
Substrates
Glass coverslips (25mm in diameter) were sonicated in 50% ethanol, dried under
a stream of compressed N2 and then oxygen plasma cleaned for 5 min (PE50, Plasma
96
Etch, Inc., Carson City, NV). These coverslips were sequentially coated with 10 nm of
titanium and 20 nm of gold at a deposition rate of 0.5 Å/s in an electron beam evaporator.
Microcontact printing
For microcontact printing (μCP), the flat back of the stamp was allowed to self
seal to a glass slide to provide a rigid backing. The stamp was inked with 2 mM 1-
hexadecanethiol (Sigma-Aldrich) and then gently blown dry with compressed N2. The
stamp was gently placed on the substrate to ensure conformal contact of the features over
the entire area of substrate. The stamp was kept in contact for 10 s to produce an array of
CH3-teminated monolayer islands, to which proteins readily adsorbed. The stamp was
then carefully separated from the substrate with the help of tweezers. The patterned
substrates were incubated in 2 mM ethanolic solution of tri(ethylene glycol)-terminated
alkanethiol for 2 h to create a non-adhesive background around the CH3-terminated
islands. The substrates were rinsed in 95% ethanol and gently dried under a stream of N2.
Protein patterning
The substrates were incubated with fibronectin (20 μg/m in DPBS) (Invitrogen)
for 30 min and then blocked with denatured (65 oC, 2 h) 1% bovine serum albumin
(Fisher Scientific, Fair Lawn, New Jersey) for 30 min to avoid non-specific protein
adsorption.
Cell patterning
NIH3T3 fibroblasts (American Type Culture Collection, Manassas, VA) were
cultured in CGM on tissue culture polystyrene. Cells were passaged every other day and
used between passages of 5 and 20. For experiments, cells were enzymatically lifted from
97
the culture dish using trypsin/EDTA (Invitrogen) and then seeded onto these
micropatterned substrates at a density of 225 cells/mm2 in CGM.
Cell adhesion assay
Cell counts at various radial positions on the substrate were used to quantify the
adhesion strength following exposure to a hydrodynamic flow created by rotation in a
solution of known viscosity and density using a spinning disk device (Garcia, Ducheyne
& Boettiger 1997). Briefly, a micropatterned substrate with the cells seeded on it was
mounted on a spinning platform and spun in 2 mM dextrose in DPBS to apply well
defined hydrodynamic forces to adherent cells. The applied shear stress τ (force/area)
varies linearly from the center of the disk to the periphery according to Eq. (2.5).
Following spinning for 5 min, the remaining adherent cells were fixed in 3.7%
formaldehyde, permeabilized with 0.1% Triton X-100, and stained with Hoechst dye to
identify the nucleus. The number of adherent cells was counted at specific radial
positions using a Nikon eclipse Ti-U fluorescent microscope (Nikon Instruments,
Melville, N.Y.) fitted with a motorized stage and NIS-Elements Advanced Research
software (Nikon Instruments). 61 fields were analyzed per substrate and the number of
cells at specific radial locations was then normalized to the number of cells at the center
of the substrate where negligible shear stress was applied to calculate the fraction of
adherent cells f . The detachment profile ( f vs. τ) was then fit with a sigmoid curve
given by Eq. (2.6). The shear stress for 50% detachment (τ50) was used as the mean cell
adhesion strength.

98
Statistical analysis
Experiments were performed in triplicate in at least three independent
experiments. Data are reported as mean ± SD of the mean, and statistical comparisons
using SigmaPlot 11 (Systat Software, San Jose, CA) were based on analysis of variance
and the Holm-Sidak test for pairwise comparisons, with a p-value < 0.01 considered
significant. Curve fits of experimental data to specified functions were conducted in
SigmaPlot.
5.3 Results
Spatial organization of FAs
NIH3T3 fibroblasts stained for vinculin (a structural FA protein) along with actin
filaments and nuclei indicated preferential recruitment of vinculin towards the periphery
of the cell-substrate interface (Fig 5.2). Using an intensity threshold algorithm provided
by the image analysis software to detect intensity peaks in the green channel of the image
further reinforces the observation of the distinct peripheral preference of FA organization
in a spread cell at 16 h of incubation in CGM. Similar FA enrichment at the adhesive
perimeter was observed previously on fully spread unconstrained and micropatterned
cells (Gallant, Michael & Garcia 2005).
Micropatterned substrates to manipulate the cell adhesive interface
Micropatterned surfaces consisting of adhesive and non-adhesive domains were
used to control the cell-substrate adhesive area and restrict the cell shape by modulating
spreading. This was necessary to investigate the regulation of cell adhesion strength by
cell spreading independently of total adhesive area. μCP (Kumar, Whitesides 1993,
Whitesides et al. 2001) was employed to pattern self-assembled monolayer domains of

99
alkanethiols onto which fibronectin was adsorbed within a non-fouling, non-adhesive
background. However, the standard μCP technique resulted in irreversible roof collapse
and propagation due to stamp instability for the small and sparse features and prevented
their replication on the substrates as discussed in previous chapters 3 and 4. To overcome
this parasitic roof collapse, the peripheral stamp stability was enhanced by embedding an
annular column circumscribing the pattern zone in the stamp design (Fig 4.12).
The μCP technique was previously applied to pattern surfaces to investigate the
effects of cell spreading on cell survival (Chen et al. 1997), the contributions of cell
adhesive area towards cell adhesion strength (Gallant, Michael & Garcia 2005, Gallant et
al. 2002), and cytoskeletal interactions with the ECM (Chen et al. 2003, Chicurel, Chen
& Ingber 1998). μCP was applied in this study to engineer the adhesive domains to
investigate the effect of adhesive complex position on cell adhesion strength while
maintaining similar cell shapes among treatments. Arrays of circular and annulus shaped
islands were engineered to discern the contribution of cell spreading area and total cell
adhesive area towards cell adhesion strength (Fig 5.3). The island dimensions were
engineered to specifically allow for the delineation of total cell adhesive area from cell
spreading area as summarized in Table 5.1. Spacing between the adhesive islands was
maintained at 75 μm to avoid any cell-to-cell contact and ensure that each cell would
interact with a single adhesive island. Fibronectin preferentially adsorbed onto the
stamped islands, whereas the surrounding tri(ethylene glycol)-terminated regions
remained devoid of fibronectin.
It was previously reported that NIH3T3 fibroblasts remained viable for several
days when adhering to fibronectin-coated micropatterned circular islands with

100
dimensions ranging from 2 to 20 µm and remained constrained to the FN area (Gallant,
Michael & Garcia 2005, Gallant et al. 2002). Similarly, in this study NIH3T3 cells
adhered to fibronectin coated islands of similar dimensions and remained constrained to
the patterned areas. Moreover the adhesive structures containing vinculin localized to and
remained confined to the micropatterned domains, and cells maintained a nearly spherical
or hemispherical morphology (Fig 5.4). Taken together, these results demonstrate control
of cell adhesive area to engineer FA size and position which can be used to decouple the
effect of cell spreading area and total cell adhesive area on adhesion strength.
Analysis of cell adhesion strength
Cell adhesion strength was quantified using a well characterized spinning disk
hydrodynamic shear assay that has been used extensively for investigating structure-
function relationships among adhesive components (Gallant, Michael & Garcia 2005,
Gallant et al. 2002, Garcia, Ducheyne & Boettiger 1997, Garcia, Gallant 2003). This
system applies a well defined range of hydrodynamic forces to a population of cells
adhered to micropatterned islands and provides sensitive measurements of adhesion
strength. It was previously established that the wall shear stress (τ) increases linearly with
radial position (r) on the disk surface as given by Eq. 2.5. The shear stress for 50%
detachment (τ50) was established as the adhesion strength to allow for quantitative
comparisons between experimental conditions.
In the previous work it was established that an area of approximately 78 μm2,
which supports half maximal integrin binding, was a “set point” for the segregation of
discrete receptor clusters and that the adhesive strength reaches a plateau at this adhesive
area (Gallant, Michael & Garcia 2005). However, it is unclear whether this set point area
101
refers to total adhesive area or the extent of cell spreading as it was observed that integrin
clustering and FA assembly were observed to be enriched at the periphery. Therefore,
two distinct regimes are considered for analysis in the present study. Regime 1 consists of
micropatterned islands with dimensions that support cell spreading areas up to 78 μm2
and regime 2 consists of island dimensions that supported cell spreading areas greater
than 78 μm2 (Fig 5.3). The results for adherent cells on adhesive islands in regime 1 (Fig
5.5a) indicate that the redistribution of similar adhesive areas to annular shapes with
larger diameters to allow for greater cell spreading enhances adhesion strength by 40%
(comparing 6 µm diameter circular island and 10 µm outer, 8 µm inner diameter annulus
island). Moreover, adhesion strength increased 35% when the adhesive area was
enhanced for islands of similar spreading area (comparing 10 µm outer, 8 µm inner
diameter annulus island and 10 µm diameter circular island).
The results for adherent cells on adhesive islands in regime 2 (Fig 5.5b) indicate
that redistribution of similar adhesive areas to annular shapes with larger diameters to
allow for greater cell spreading with the same adhesive area did not enhance adhesion
strength (comparing 10 µm diameter circular island and 25 µm outer, 23 µm inner
diameter annulus island). Furthermore, comparing cells with similar spreading areas but
different adhesive areas in regime 2 also clearly indicates that for constant cell spreading
area, peripheral FAs accounted for 100% of the adhesion strength (comparing 25 µm
outer, 23 µm inner diameter annulus island and 25 µm diameter circular island). These
results indicate that rises in adhesion strength are limited to regime 1 and further
reinforce the concept of a “set point” total adhesive area of ~78 μm2 to support maximum
cell adhesion strength.

102
5.4 Discussion
Spatial distribution of FAs in regulating cell adhesion strength
It has been observed that FAs tend to accumulate at the periphery of the adhesive
contact area. The results demonstrated that the peripheral distribution of adhesive
complexes occurs in cells that are constrained to micropatterned islands as well as cells
spreading on uniform surfaces (Fig 5.2 and 5.4). In both cases, this arrangement of FAs
allows large changes in cell shape and results in the cell spreading area exceeding the
actual adhesive area. While this enrichment at the leading edge of migrating cells and its
influence on cell traction has been studied extensively, the contribution of this
phenomenon to adhesion strength has not yet been investigated.
To understand the roles of cell spreading area and total cell adhesive area in
modulating adhesion strength, experimentally obtained adhesion strength data were fitted
as functions of spreading area (i) when cell adhesive area was equal to cell spreading area
and (ii) when those same cell adhesive areas allowed for greater cell spreading by
redistributing over annular shapes with larger diameters (Fig 5.6). It was observed that an
exponential curve explained the rises in adhesion strength in both cases. However, when
the adhesive areas were distributed to the periphery to allow for a greater extent of cell
spreading, the non-linearity in the exponential curve is more pronounced. This implies
that the non-linearity in the adhesion strength with respect to area as observed in earlier
studies (Gallant, Michael & Garcia 2005) is predominantly due to the peripheral
distribution of FAs.
In regime 1, an enhancement in spreading area (independently of total adhesive
area) by the peripheral distribution of FAs enhanced adhesion strength by 40% when the

103
outer radius was increased by ~65%. It can be inferred from this observation that below a
“set point” area of 78 μm2, the total adhesive area alone cannot be used as a parameter for
explaining adhesion strength but it can be used in conjunction with cell spreading area.
The regulation of cellular processes by the extent of cell spreading and cell shape was
first identified over three decades ago in primary investigations by Folkman et al.
(Folkman, Moscona 1978). In addition to modulating adhesion strength, peripheral
distribution of FAs has been shown to regulate several important processes during cell-
matrix interactions such as transducing cell shape signals in human tendon fibroblasts to
regulate expression of collagen type I (Li et al. 2008). Cellular traction generated at the
periphery of the cell by the FAs were reported to direct fibronectin matrix assembly in
NIH3T3 fibroblasts during early phases of cell spreading (Lemmon, Chen & Romer
2009). Investigations by Reinhart-King et al. also reinforce the fact that traction in bovine
aortic endothelial cells increases linearly with cell spreading area and was observed to be
maximum at the cell periphery (Reinhart-King, Dembo & Hammer 2003), implying that
peripheral distribution of FAs not only regulates cell adhesion strength but regulates
cellular traction as well.
A second significant observation from this analysis is that in regime 1, adhesion
strength increased only 35% when adhesive area was enhanced approximately 3-fold for
islands of similar spreading area (comparing 10 µm outer, 8 µm inner diameter annulus
island and 10 µm diameter circular island). This could be explained by increases in
integrin binding and FA assembly which both continue to increase with adhesive area
even beyond the 78 μm2 set point (Gallant, Michael & Garcia 2005). However, an
alternative explanation remains to be explored. It is possible that the spatial distribution

104
of FAs results in a more complex organization of the cell’s cytoskeleton, and thus the
way applied hydrodynamic forces are transmitted through the cell is altered. This idea of
cytoskeletal reorganization to modulate cell adhesion strength has been previously
explored in terms of the cytoskeletal prestress (Chen, Gao 2010) and also by the
nanoscale adhesive interface when the spacing between the integrin ligands was varied
(Cavalcanti-Adam et al. 2006, Selhuber-Unkel et al. 2010).
Validation of the ‘adhesive patch’ model
Significant efforts towards understanding the mechanisms of cell adhesion have
been made since the identification of adhesive components including adhesion receptors
and FA complexes. Previously a model was proposed to explain the experimental
observations of adhesion strengthening (Gallant, Andres J. Garcia 2007) which captures
important points of the conceptual model originally developed by Ward and Hammer
(Ward, Hammer 1993, Ward, Dembo & Hammer 1994). The model was based on the
concept of a 1 µm adhesive patch providing a tensional force of 200 nN that resists the
peeling detachment force. The non-linear increase in adhesion strength with adhesive
area was explained in terms of a moment arm that increases with adhesive area which
enhanced the ability of the adhesive patch to withstand the peeling force.
Since it was hypothesized that the FAs at the periphery rather than the total
adhesive area regulated adhesion strength, the micropatterned islands employed in this
study provided for further experimental testing of the adhesive patch model for cell
adhesion strengthening. The formulation derived by Gallant et al. was employed for
evaluating adhesive patch bond strength calculated based on Eq. (2.1). The forces
from all segments were added to calculate , which was referred to as the adhesive patch
TF
TF
105
force. For the simulation purpose, we assumed =1, =0.33, and =600; and used the
previously published value of integrin-ligand bond strength =100 pN (Coussen et al.
2002, Li et al. 2003). To obtain adhesion strength predictions from the model, mechanical
equilibrium was applied to the macroscopic model and the resulting critical shear stress
(adhesion strength) for a spherical cell and hemispherical cell is given by Eq. (5.1) and
Eq. (5.2) respectively (Gallant, Andres J. Garcia 2007, Goldman, Cox & Brenner 1967).
}])/8.0(1[32/{ 5.022 aRRFT (5.1)
)5/( 2aFT (5.2)
To understand how the observed rises in the adhesion strength are related to the
peripheral distribution of adhesive complexes independently of total adhesive area, the
experimentally obtained adhesion strength was plotted against cell spreading area and
compared to the simulated values of adhesion strength (Fig 5.7). It was observed that in
regime 1, the current model was able to strongly predict the adhesion strength for cells on
islands with peripherally distributed FAs. However, the observation of enhanced
adhesion strength for the solid circular island over the annulus with similar outer
diameters indicates that either (i) this simple model does not fully capture the effects of
spatial distribution of adhesive complexes throughout the adhesive area, or (ii) the
adhesion strength rises are not solely governed by events at the adhesive interface but
rather by the cumulative contributions from other biophysical parameters such as the
cell’s cytoskeletal organization that might affect adhesion strength by regulating the
cell’s internal force balance.
iB
f
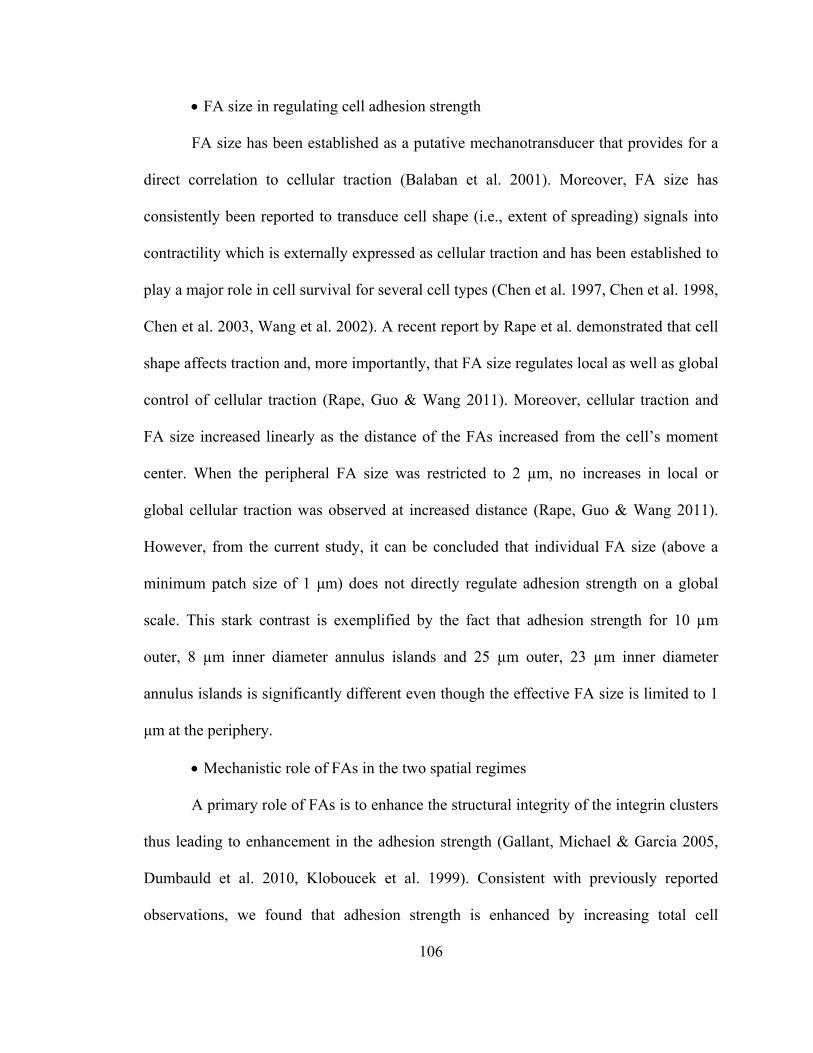
106
FA size in regulating cell adhesion strength
FA size has been established as a putative mechanotransducer that provides for a
direct correlation to cellular traction (Balaban et al. 2001). Moreover, FA size has
consistently been reported to transduce cell shape (i.e., extent of spreading) signals into
contractility which is externally expressed as cellular traction and has been established to
play a major role in cell survival for several cell types (Chen et al. 1997, Chen et al. 1998,
Chen et al. 2003, Wang et al. 2002). A recent report by Rape et al. demonstrated that cell
shape affects traction and, more importantly, that FA size regulates local as well as global
control of cellular traction (Rape, Guo & Wang 2011). Moreover, cellular traction and
FA size increased linearly as the distance of the FAs increased from the cell’s moment
center. When the peripheral FA size was restricted to 2 µm, no increases in local or
global cellular traction was observed at increased distance (Rape, Guo & Wang 2011).
However, from the current study, it can be concluded that individual FA size (above a
minimum patch size of 1 μm) does not directly regulate adhesion strength on a global
scale. This stark contrast is exemplified by the fact that adhesion strength for 10 µm
outer, 8 µm inner diameter annulus islands and 25 µm outer, 23 µm inner diameter
annulus islands is significantly different even though the effective FA size is limited to 1
μm at the periphery.
Mechanistic role of FAs in the two spatial regimes
A primary role of FAs is to enhance the structural integrity of the integrin clusters
thus leading to enhancement in the adhesion strength (Gallant, Michael & Garcia 2005,
Dumbauld et al. 2010, Kloboucek et al. 1999). Consistent with previously reported
observations, we found that adhesion strength is enhanced by increasing total cell

107
adhesive area (Gallant, Michael & Garcia 2005, Dumbauld et al. 2010). A surprising
finding is that adhesion strength rises by either enhancing the total available area or the
cell spreading area, but the saturation value is governed by the total adhesive area of ~78
μm2 irrespective of the spatial distribution of adhesive complexes. The possibility that the
adhesion strength reaches saturation due to limiting receptor or ligand availability has
been ruled out in earlier investigations which indicate that the set point area of ~78 μm2 is
only the half maximal binding value of integrins and FA proteins (talin and vinculin)
(Gallant, Michael & Garcia 2005). However, alternative explanations remain to be
explored. A possible biophysical explanation for the total adhesive area to govern the
saturation of adhesion strength could be the fact that the shape of a cell in vivo where
spreading is minimal might only require a total contact area of ~78 μm2 to effectively
adhere and perform various cellular functions as opposed to the larger spreading areas
which are observed in vitro.
In addition, these results further reinforce that the nonlinearity in the adhesion
strength is predominantly due to the adhesive complex position since only a relatively
small increase in the radius (65%) was required to achieve an enhancement in adhesion
strength similar to that which required a 3-fold increase in the adhesive area. This
analysis demonstrates that the distribution of adhesive patches away from the cell center
is more efficient for stabilizing cell attachment than uniformly dispersing the adhesive
complexes over greater areas.
Contrasting to the observations of adhesion strengthening, investigations of
cellular traction indicate that as the cell spreading area is increased from 500 µm2 to 3000
µm2, the magnitude of traction increases linearly (Wang et al. 2002, Reinhart-King,
108
Dembo & Hammer 2003). It has also been observed that inhibition of contractility
drastically reduces the cellular traction with dissolution of vinculin containing FAs (Cai
et al. 2010). However, inhibiting the formation of FAs reduced adhesion strength only by
30% irrespective of the cell spreading area (Gallant, Michael & Garcia 2005, Dumbauld
et al. 2010). These observations collectively suggest that the functional role of FAs is
different in governing the cell adhesion strength and ability to apply cellular traction. To
explain the structure-function role of FAs in the two regimes of adhesion strengthening,
we hypothesize that FAs in regime 1 primarily enhance adhesion strength and provide
anchorage to the underlying substrate, whereas in regime 2, their mechanistic function
might be to transduce signals so as to provide traction stresses that are critical to the
regulation of important cellular functions including mechanosensation and migration. In
other words, a threshold spread area and quantity of FA reinforced integrin bonds is
required for maximal adhesion strength, but additional FA enhancement and
redistribution provides additional mechanical functions without altering cell adhesion
strength.
5.5 Conclusions
A systematic study of the effect of the spatial distribution of FAs on cell adhesion
strength was conducted by modulating cell adhesive area independently of spreading area
via micropatterning. This approach enabled the identification of novel biophysical
properties of FAs that contribute to adhesion strength, but which contrast sharply with
established FA-cellular traction structure-function relationships. Directing FA assembly
to the cell periphery demonstrated that the distribution of adhesive patches away from the
cell center is more efficient for stabilizing cell attachment than uniformly dispersing the
109
adhesive complexes over greater areas, and results in nonlinear increases in adhesion
strength. However, the maximum cell adhesion strength is governed by the total adhesive
area. In addition, individual FA size does not directly regulate global adhesion strength.
In contrast, cellular traction increases linearly with FA size and its distance from the
cell’s moment center. This work establishes for the first time that the functional role of
FAs is different in governing the cell adhesion strength and applying cellular traction.

110
Table 5.1 Micropattern dimensions and corresponding areas
Micropattern Cell Adhesive
Area
Cell Spreading
Area
6 µm diameter circular island 28 µm2 28 µm2
10 µm outer, 8 µm inner diameter annulus
island 28 µm2 78 µm2
10 µm diameter circular island 78 µm2 78 µm2
25 µm outer, 23 µm inner diameter annulus
island 78 µm2 490 µm2
25 µm diameter circular island 490 µm2 490 µm2

111
Fig 5.1 Schematic diagram of cells adhered to micropatterned islands that delineate cell
adhesive area and cell spreading area.
side profile top view
contact area
constant
area
constant
diameter

112
Fig 5.2 Immunostained image of a cell. (a) Spread cell [blue: nucleus, red: f-actin and
green: vinculin]. (b) Same cell thresholded for peak intensities of vinculin staining
(bars=10 µm).
a b

113
Fig 5.3 Immunostaining indicates fibronectin adsorbed only to micropatterned islands. (a)
6 µm diameter circular islands; (b) 10 µm outer, 8 µm inner diameter annulus islands; (c)
10 µm diameter circular islands; (d) 25 µm outer, 23 µm inner diameter annulus islands;
(e) 25 µm diameter circular islands (bars=50 µm).
Constant adhesive area
Varying adhesive area
Varying spreading area
Constant spreading area
Constant adhesive area
Varying adhesive area
Varying spreading area
Constant spreading area
Regime 1
Regime 2
a b c d e
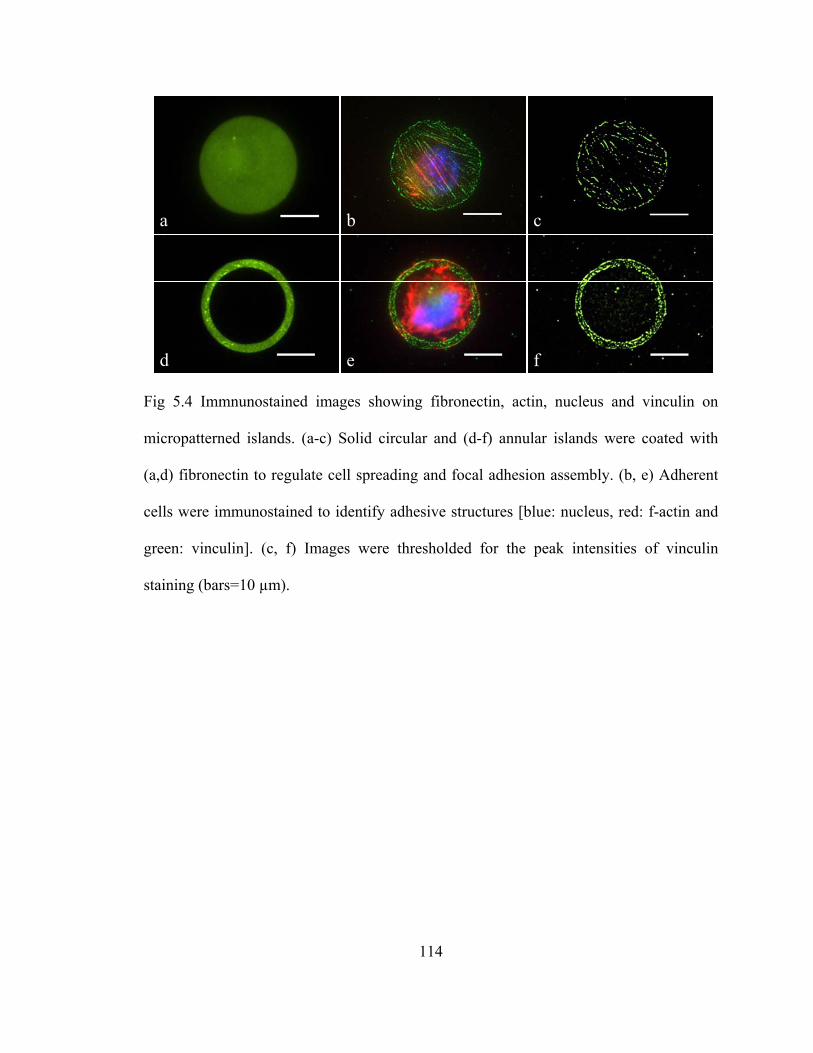
114
Fig 5.4 Immnunostained images showing fibronectin, actin, nucleus and vinculin on
micropatterned islands. (a-c) Solid circular and (d-f) annular islands were coated with
(a,d) fibronectin to regulate cell spreading and focal adhesion assembly. (b, e) Adherent
cells were immunostained to identify adhesive structures [blue: nucleus, red: f-actin and
green: vinculin]. (c, f) Images were thresholded for the peak intensities of vinculin
staining (bars=10 µm).
b ca
d e f

115
Fig 5.5 Mean adhesion strength (50) at steady state for cells patterned on micropatterned
domains. (a) Regime 1 up to 78 μm2 adhesive area and (b) regime 2 from 78 μm2 to 490
μm2 adhesive area (* indicates significant difference P<0.001).
0
100
200
300
400
500
600
700
800
900
1000
6 μm dia solid circle
10 μm dia annulus
10 μm dia solid circle
Adh
esio
n S
tren
gth
(dyn
e/cm
2 )
Constant adhesive area = 28 μm2
Constant spreading area = 78 μm2
*
*
0
100
200
300
400
500
600
700
800
900
1000
10 μm dia solid circle
25 μm dia annulus
25 μm dia solid circle
Adh
esio
n S
tren
gth
(dyn
e/cm
2 ) Constant adhesive area = 78 μm2
Constant spreading area = 490 μm2
b
a

116
Fig 5.6 Cell spreading area and cell adhesive area. Each regulates steady state adhesion
strength. Data are plotted separately for circular and annular islands of two corresponding
adhesive areas. Exponential curves describe the relationships between adhesion strength
and spreading for the different focal adhesion distribution conditions. Symbols represent
mean values but the curves were fit to all data points.
Spreading Area (m2
)
0 100 200 300 400 500
Adh
esio
n S
tren
gth
(dyn
e/cm
2 )
0
100
200
300
400
500
600
700
Cell adhesive area=cell spreading areaPeripherally distributed adhesive areaCell adhesive area=cell spreading area
(exponential fit; r2=0.95)Peripherally distributed adhesive area
(exponential fit; r2=0.92)
Constant adhesive area (78 µm2)
Constant adhesive area (28 µm2)

117
Fig 5.7 The experimental cell adhesion strength-spreading relationship for peripherally
distributed focal adhesions agrees well with theoretical predictions of the adhesive patch
model. Data are plotted separately for circular and annular islands. Exponential curves
describe the relationships between adhesion strength and spreading for the different focal
adhesion distribution conditions. Symbols represent mean values but the curves were fit
to all data points.
Spreading Area (m2)
0 100 200 300 400 500
Adh
esio
n S
tren
gth
(dyn
e/cm
2 )
0
100
200
300
400
500
600
700
Cell adhesive area=cell spreading areaPeripherally distributed adhesive areaAdhesive patch modelCell adhesive area=cell spreading area
(exponential fit; r2=0.89)Peripherally distributed adhesive area
(exponential fit; r2=0.92)Adhesive patch model
(exponential fit; r2=0.93)

118
5.6 List of References
Balaban, N.Q., Schwarz, U.S., Riveline, D., Goichberg, P., Tzur, G., Sabanay, I., Mahalu, D., Safran, S., Bershadsky, A., Addadi, L. & Geiger, B. 2001, "Force and focal adhesion assembly: a close relationship studied using elastic micropatterned substrates", Nature cell biology, vol. 3, no. 5, pp. 466-472.
Berrier, A.L. & Yamada, K.M. 2007, "Cell-matrix adhesion", Journal of cellular physiology, vol. 213, no. 3, pp. 565-573.
Cai, Y., Rossier, O., Gauthier, N.C., Biais, N., Fardin, M., Zhang, X., Miller, L.W., Ladoux, B., Cornish, V.W. & Sheetz, M.P. 2010, "Cytoskeletal coherence requires myosin-IIA contractility", Journal of cell science, vol. 123, no. 3, pp. 413-423.
Cavalcanti-Adam, E.A., Micoulet, A., Blümmel, J., Auernheimer, J., Kessler, H. & Spatz, J.P. 2006, "Lateral spacing of integrin ligands influences cell spreading and focal adhesion assembly", European journal of cell biology, vol. 85, no. 3-4, pp. 219-224.
Chen, B. & Gao, H. 2010, "Mechanical Principle of Enhancing Cell-Substrate Adhesion via Pre-Tension in the Cytoskeleton", Biophysical Journal, vol. 98, no. 10, pp. 2154-2162.
Chen, C.S., Alonso, J.L., Ostuni, E., Whitesides, G.M. & Ingber, D.E. 2003, "Cell shape provides global control of focal adhesion assembly", Biochemical and biophysical research communications, vol. 307, no. 2, pp. 355-361.
Chen, C.S., Mrksich, M., Huang, S., Whitesides, G.M. & Ingber, D.E. 1998, "Micropatterned Surfaces for Control of Cell Shape, Position, and Function", Biotechnology progress, vol. 14, no. 3, pp. 356-363.
Chen, C.S., Mrksich, M., Huang, S., Whitesides, G.M. & Ingber, D.E. 1997, "Geometric Control of Cell Life and Death", Science, vol. 276, no. 5317, pp. 1425-1428.
Chicurel, M.E., Chen, C.S. & Ingber, D.E. 1998, "Cellular control lies in the balance of forces", Current opinion in cell biology, vol. 10, no. 2, pp. 232-239.
Coussen, F., Choquet, D., Sheetz, M.P. & Erickson, H.P. 2002, "Trimers of the fibronectin cell adhesion domain localize to actin filament bundles and undergo rearward translocation", Journal of cell science, vol. 115, no. 12, pp. 2581-2590.
Dumbauld, D.W., Shin, H., Gallant, N.D., Michael, K.E., Radhakrishna, H. & García, A.J. 2010, "Contractility modulates cell adhesion strengthening through focal adhesion kinase and assembly of vinculin-containing focal adhesions", Journal of cellular physiology, vol. 223, no. 3, pp. 746-756.
Folkman, J. & Moscona, A. 1978, "Role of cell shape in growth control", Nature, vol. 273, no. 5661, pp. 345-349.
119
Fournier, M.F., Sauser, R., Ambrosi, D., Meister, J. & Verkhovsky, A.B. 2010, "Force transmission in migrating cells", The Journal of cell biology, vol. 188, no. 2, pp. 287-297.
Gallant, N.D. & Andres J. Garcia 2007, "Model of integrin-mediated cell adhesion strengthening", Journal of Biomechanics, vol. 40, no. 6, pp. 1301-1309.
Gallant, N.D., Capadona, J.R., Frazier, A.B., Collard, D.M. & Garcia, A.J. 2002, "Micropatterned Surfaces to Engineer Focal Adhesions for Analysis of Cell Adhesion Strengthening", Langmuir, vol. 18, no. 14, pp. 5579-5584.
Gallant, N.D., Michael, K.E. & Garcia, A.J. 2005, "Cell Adhesion Strengthening: Contributions of Adhesive Area, Integrin Binding, and Focal Adhesion Assembly", Molecular biology of the cell, vol. 16, no. 9, pp. 4329-4340.
Garcia, A. & Gallant, N. 2003, "Stick and grip", Cell biochemistry and biophysics, vol. 39, no. 1, pp. 61-73.
Garcia, A.J., Ducheyne, P. & Boettiger, D. 1997, "Quantification of cell adhesion using a spinning disc device and application to surface-reactive materials", Biomaterials, vol. 18, no. 16, pp. 1091-1098.
Garcia, A.J., Huber, F. & Boettiger, D. 1998, "Force Required to Break alpha 5beta 1 Integrin-Fibronectin Bonds in Intact Adherent Cells Is Sensitive to Integrin Activation State", Journal of Biological Chemistry, vol. 273, no. 18, pp. 10988-10993.
Geiger, B., Bershadsky, A., Pankov, R. & Yamada, K.M. 2001, "Transmembrane crosstalk between the extracellular matrix and the cytoskeleton", Nature reviews. Molecular cell biology, vol. 2, no. 11, pp. 793-805.
Goldman, A.J., Cox, R.G. & Brenner, H. 1967, "Slow viscous motion of a sphere parallel to a plane wall—II Couette flow", Chemical Engineering Science, vol. 22, no. 4, pp. 653-660.
Hynes, R.O. 2002, "Integrins: Bidirectional, Allosteric Signaling Machines", Cell, vol. 110, no. 6, pp. 673-687.
Kloboucek, A., Behrisch, A., Faix, J. & Sackmann, E. 1999, Adhesion-Induced Receptor Segregation and Adhesion Plaque Formation: A Model Membrane Study, Biophysical Journal, vol. 77, no. 4, pp. 2311-2328.
Kong, D., Ji, B. & Dai, L. 2008, "Nonlinear mechanical modeling of cell adhesion", Journal of theoretical biology, vol. 250, no. 1, pp. 75-84.
Kumar, A. & Whitesides, G.M. 1993, "Features of gold having micrometer to centimeter dimensions can be formed through a combination of stamping with an elastomeric stamp and an alkanethiol ``ink'' followed by chemical etching", Applied Physics Letters, vol. 63, no. 14, pp. 2002-2004.

120
Lemmon, C.A., Chen, C.S. & Romer, L.H. 2009, "Cell Traction Forces Direct Fibronectin Matrix Assembly", Biophysical Journal, vol. 96, no. 2, pp. 729-738.
Li, F., Li, B., Wang, Q. & Wang, J.H. 2008, "Cell shape regulates collagen type I expression in human tendon fibroblasts", Cell motility and the cytoskeleton, vol. 65, no. 4, pp. 332-341.
Li, F., Redick, S.D., Erickson, H.P. & Moy, V.T. 2003, "Force Measurements of the α5β1 Integrin–Fibronectin Interaction", Biophysical journal, vol. 84, no. 2, pp. 1252-1262.
Rape, A.D., Guo, W. & Wang, Y. 2011, "The regulation of traction force in relation to cell shape and focal adhesions", Biomaterials, vol. 32, no. 8, pp. 2043-2051.
Reinhart-King, C., Dembo, M. & Hammer, D.A. 2003, "Endothelial Cell Traction Forces on RGD-Derivatized Polyacrylamide Substrata", Langmuir, vol. 19, no. 5, pp. 1573-1579.
Selhuber-Unkel, C., Erdmann, T., López-García, M., Kessler, H., Schwarz, U.S. & Spatz, J.P. 2010, Cell Adhesion Strength Is Controlled by Intermolecular Spacing of Adhesion Receptors, Biophysical Journal, vol. 98, no. 4, pp. 543-551.
Vogel, V. & Sheetz, M. 2006, "Local force and geometry sensing regulate cell functions", Nature reviews. Molecular cell biology, vol. 7, no. 4, pp. 265-275.
Wang, N., Ostuni, E., Whitesides, G.M. & Ingber, D.E. 2002, "Micropatterning tractional forces in living cells", Cell motility and the cytoskeleton, vol. 52, no. 2, pp. 97-106.
Ward, M.D., Dembo, M. & Hammer, D.A. 1994, "Kinetics of cell detachment: peeling of discrete receptor clusters", Biophysical journal, vol. 67, no. 6, pp. 2522-2534.
Ward, M.D. & Hammer, D.A. 1993, "A theoretical analysis for the effect of focal contact formation on cell-substrate attachment strength", Biophysical Journal, vol. 64, no. 3, pp. 936-959.
Whitesides, G.M., Ostuni, E., Takayama, S., Jiang, X. & Ingber, D.E. 2001, "Soft lithography in biology and biochemistry", Annual Review of Biomedical Engineering, vol. 3, no. 1, pp. 335-373.
121
Chapter 6. Mechanical Role of Microtubules in the Evolution of Cell Adhesion
Strength
6.1 Introduction
Cell adhesion to extracellular matrix (ECM) is known to regulate important
cellular functions such as cell spreading, cell migration, cell proliferation and apoptosis
on a local scale and tissue morphogenesis on a global scale (Berrier, Yamada 2007). This
is a complex process involving recruitment of receptors onto the surface; specifically
heterodimeric receptors that belong to the integrin family (García, Boettiger 1999, Hynes
2002). These receptors then cluster together and recruit intracellular proteins such as
vinculin, talin, paxillin and zyxin that form adhesion complexes, or focal adhesions
(Geiger et al. 2001). These focal adhesions interact with cytoskeletal components and are
further reinforced due to actin-myosin contractility, providing stability to the adhesions
(Dumbauld et al. 2010). Early efforts in understanding the mechanism of adhesion
strengthening was interpreted through membrane peeling where focal adhesions required
the highest peeling force followed by integrin clusters and then the uniformly distributed
receptors (Evans 1985, Lotz et al. 1989). However, with the advent of micropatterning
techniques coupled with hydrodynamic shear assays, the contributions of adhesive area,
integrin binding and focal adhesion assembly towards cell adhesion strength were
experimentally analyzed (Gallant et al. 2002, Gallant, Michael & Garcia 2005, Gallant,
Garcia 2007).
122
Taking a closer look at membrane peeling mechanism to explain the adhesion
strength, it is understood that the applied force is transferred to the focal adhesions on the
substrate through the cell’s cytoskeleton and the membrane. Whereas these mechanical
connections inside the cell are well documented, (Wang, Butler & Ingber 1993, Maniotis,
Chen & Ingber 1997) the contribution of these components towards the evolution of
adhesion strength remains unexplained. Moreover, it is understood that various cellular
functions are controlled by the balance of internal and external cellular forces (Chicurel,
Chen & Ingber 1998). Although, various cytoskeletal components such as actin filaments,
microtubules and intermediate filaments might contribute to the expression of adhesion
strength, only the actin system has been extensively studied. The microtubular system, on
the contrary, has been studied in terms of its involvement in cell spreading, migration,
motility, cell polarity and DNA synthesis (Ballestrem et al. 2000, Watanabe, Noritake &
Kaibuchi 2005, Finkelstein et al. 2004, Small, Kaverina 2003, Bershadsky et al. 1996,
Kadi et al. 1998). However, apart from the fact that involvement of microtubules in
adhesion dependent signaling was investigated (Bershadsky et al. 1996), little is known
as to the contribution towards cell adhesion strength.
Prior investigations indicated that microtubule disruption affects the integrin
dependent signaling cascade that in turn leads to the matrix adhesion assembly and also
the induction of DNA synthesis (Bershadsky et al. 1996). Moreover, cell contractility is
found to be an intermediate step in this signaling cascade (Bershadsky et al. 1996). Here,
the role of microtubules in providing the necessary cellular integrity towards adhesion
strengthening was investigated. Specifically, the effect of microtubule disruption on the

123
spatiotemporal evolution of cell adhesion strength was investigated by using
pharmacological inhibitors.
6.2 Experimental Section
Reagents
Dulbecco’s modified Eagle’s medium (Invitrogen, Carlsbad, CA) supplemented
with 10% new born calf serum (Invitrogen) and 1% penicillin-streptomycin (Invitrogen)
was used as complete growth media (CGM). Cell culture reagents, including human
plasma fibronectin and Dulbecco’s phosphate-buffered saline (DPBS), and AlexaFluor
488-conjugated secondary antibodies, Hoechst-33242, tubulin tracker green and
rhodamine-conjugated phalloidin were purchased from Invitrogen. Chemical reagents,
including 1-hexadecanethiol [H3C(CH2)15SH] and tri(ethylene glycol)-terminated
alkanethiol [HO(CH2CH2O)3(CH2)11SH], and anti-fibronectin polyclonal and anti-
vinculin antibodies were purchased from Sigma-Aldrich. Nocodazole was purchased
from Sigma.
Elastomeric stamps
Master templates of required patterns were fabricated on silicon wafers using
standard photolithography techniques. Briefly, positive photoresist (Shipley 1813) was
spun onto a precleaned silicon wafer to a thickness of approximately 2 μm. Sequential
UV exposure of the resist was required to produce features of two size scales (10-6 and
10-4 m) with a single development on the template. The wafer was subjected to a primary
exposure through an optical mask containing the required low fill factor stamp features in
the pattern zone followed by a secondary exposure through an optical mask containing
the annular peripheral zone. This feature was necessary to prevent the parasitic roof

124
collapse inherent to low fill factor, large structural aspect ratio stamp designs. The
exposed areas were developed leaving behind a template of recessed features. Templates
were then exposed to (tridecafluoro-1, 1, 2, 2-tetrahydrooctyl)-1-trichlorosilane (Sigma-
Aldrich) in a dessicator under vacuum to prevent the polydimethylsiloxane (PDMS)
elastomer from adhering to the exposed silicon. The PDMS precursors and curing agent
(Sylgard 184, Dow Corning Corporation, Midland, MI USA) were mixed in the
recommended ratio (10:1), degassed under vacuum, poured over the template in a 100
mm diameter flat dish to a thickness of 5 mm, and cured at 65 °C for 2 h. The cured
PDMS stamp containing the desired features was then peeled from the template and cut
into a 25 mm square ensuring the annular region was at the periphery.
Substrates
Glass coverslips (25mm in diameter) were sonicated in 50% ethanol, dried under
a stream of compressed N2 and then oxygen plasma cleaned for 5 min (PE50, Plasma
Etch, Inc., Carson City, NV). These coverslips were sequentially coated with 10 nm of
titanium and 20 nm of gold at a deposition rate of 0.5 Å/s in an electron beam evaporator.
Microcontact printing
For microcontact printing (μCP), the flat back of the stamp was allowed to self
seal to a glass slide to provide a rigid backing. The stamp was inked with 2 mM 1-
hexadecanethiol (Sigma-Aldrich) and then gently blown dry with compressed N2. The
stamp was gently placed on the substrate to ensure conformal contact of the features over
the entire area of substrate. The stamp was kept in contact for 10 s to produce an array of
CH3-teminated monolayer islands, to which proteins readily adsorbed. The stamp was
then carefully separated from the substrate with the help of tweezers. The patterned

125
substrates were incubated in 2 mM ethanolic solution of tri(ethylene glycol)-terminated
alkanethiol for 2 h to create a non-adhesive background around the CH3-terminated
islands. The substrates were rinsed in 95% ethanol and gently dried under a stream of N2.
Protein patterning
The substrates were incubated with fibronectin (20 μg/m or 100μg/ml in DPBS)
(Invitrogen) for 30 min and then blocked with denatured (65oC, 2 h) 1% bovine serum
albumin (Fisher Scientific, Fair Lawn, New Jersey) for 30 min to avoid non-specific
protein adsorption.
Cell patterning
NIH3T3 fibroblasts (American Type Culture Collection, Manassas, VA) were
cultured in CGM on tissue culture polystyrene. Cells were passaged every other day and
used between passages of 5 and 20. For experiments, cells were enzymatically lifted from
the culture dish using trypsin/EDTA (Invitrogen) and then seeded onto these
micropatterned substrates at a density of 225 cells/mm2 in CGM. For spread cell adhesion
experiments, the cell seeding was maintained lower than 100 cells/mm2 to avoid cell-cell
contact.
Cell adhesion assay
Cell counts at various radial positions on the substrate were used to quantify the
adhesion strength following exposure to a hydrodynamic flow created by rotation in a
solution of known viscosity and density using a spinning disk device (Garcia, Ducheyne
& Boettiger 1997). Briefly, a micropatterned substrate with the cells seeded on it was
mounted on a spinning platform and spun in 2 mM dextrose in DPBS to apply well
defined hydrodynamic forces to adherent cells. The applied shear stress τ (force/area)

126
varies linearly from the center of the disk to the periphery according to Eq. (2.5).
Following spinning for 5 min, the remaining adherent cells were fixed in 3.7%
formaldehyde, permeabilized with 0.1% Triton X-100, and stained with Hoechst dye to
identify the nucleus. The number of adherent cells was counted at specific radial
positions using a Nikon eclipse Ti-U fluorescent microscope (Nikon Instruments,
Melville, N.Y.) fitted with a motorized stage and NIS-Elements Advanced Research
software (Nikon Instruments). 61 fields were analyzed per substrate and the number of
cells at specific radial locations was then normalized to the number of cells at the center
of the substrate where negligible shear stress was applied to calculate the fraction of
adherent cells f . The detachment profile ( f vs. τ) was then fit with a sigmoid curve
given by Eq. (2.6). The shear stress for 50% detachment (τ50) was used as the mean cell
adhesion strength.
Cytoskeletal disruption
Experiments were preformed in serum, serum free and serum starved conditions.
Serum conditions refer to cells cultured in complete growth medium (CGM). Serum free
refers to cells cultured in serum free media (0.1% ITS-G, 1% BSA, 1% P/S and DMEM).
Serum starved condition refers to cells cultured in serum for incubation time and then
serum starved with serum free media. For microtubule depolymerization, 10 μm
nocodazole in DMSO was added to the media for adhesion analyses.
Statistical analysis
Experiments were performed in triplicate in at least three independent
experiments. Data are reported as mean ± SD of the mean, and statistical comparisons
using SigmaPlot 11 (Systat Software, San Jose, CA) were based on analysis of variance

127
and the Holm-Sidak test for pairwise comparisons, with a p-value < 0.01 considered
significant. Curve fits of experimental data to specified functions were conducted in
SigmaPlot.
6.3 Results and Discussion
Effect of microtubule disruption on cell spreading area and cell morphology
The microtubular system in spread cells was fully developed at incubation times
of over 16 hr, similar to the actin filament system (Fig 6.1a). To investigate the cell
spreading and morphology responses without the microtubular system, 10 μm nocodazole
in DMSO was added to the medium and allowed to incubate for 30 minutes for
microtubules disruption as previously described (Bershadsky et al. 1996). Fluorescent
images of tubulin tracker labeling indicated complete destruction of microtubules after
nocodazole treatment in CGM (Fig 6.1b). A similar response was observed for cells in
serum free and serum starved conditions (data not shown). However, actin filaments were
intact with focal adhesions visualized by immunostaining for vinculin on nocodazole
treated cells under various serum conditions (Fig 6.2) in agreement with previous
observations (Bershadsky et al. 1996). The importance of the presence of serum is that
actin-myosin contractility is maintained and by starving the cells of serum, this
contractility is lost resulting in various consequences including effect on cell adhesion
strength (Dumbauld et al. 2010). Whether there was a change in the contractility upon
microtubule disruption as determined by visualizing the enhancement in actin filaments
was dependent on the serum conditions. It was observed that enhancement in actin
filaments was not observed in cells cultured under serum free conditions. However for
the cells cultured in serum or serum starved conditions, enhancement in the focal

128
adhesions and the actin filaments was observed when nocodazole was introduced (Fig
6.2).
Earlier studies indicated that with microtubule disruption following treatment
with nocodazole, the focal adhesions and actin filaments are reinforced.(Bershadsky et al.
1996) So the next investigation was on this effect experimented systematically in serum,
serum free and serum starved conditions. In the case of cells in serum and treated with
nocodazole, no significant differences were found either in the cell spreading area or cell
morphology compared to untreated controls. In cells cultured in serum-free media, our
image analysis indicates that actin fibers and focal adhesions drastically reduced and the
cells took a spherical morphology upon treatment with nocodazole (Fig 6.3). It was
inferred from the quantification of cell spreading area that there was significant reduction
in the cell spreading area only in the cells that were cultured in serum free media when
treated with nocodazole. Moreover, the cells cultured in serum free media took a
spherical morphology upon treatment with nocodazole (Fig 6.4). However, in serum
starved cells, reinforcement in the actin filaments was observed with no significant
change in the cell spreading area and cell morphology as observed elsewhere (Fig 6.3,
6.4) (Bershadsky et al. 1996).
Effect of microtubule disruption on cell adhesion strength in fully spread cells
It has been established by studies from other research groups that contractility
enhances adhesion strength by approximately 30% under the condition that microtubule
network is undisturbed (Dumbauld et al. 2010). While it is also established that
microtubule disruption enhances contractility in a variety of cell types, (Bershadsky et al.
1996, Kadi et al. 1998) it is valuable to investigate whether such contractility

129
enhancement alters cell adhesion strength. Since cell adhesion to ECM is related to the
cellular force balance through cytoskeletal components, (Maniotis, Chen & Ingber 1997,
Chicurel, Chen & Ingber 1998, Ezzell et al. 1997, Chen et al. 2003) it was hypothesized
that this increase in contractility would result in the enhancement in the cell adhesion
strength. Utilizing, hydrodynamic shear assay the differences in the adhesion strength
were examined between untreated cells and cells treated with nocodazole under serum
and serum free treatment conditions (Fig 6.5). It is surprising that for cells in serum,
microtubule disruption did not significantly change the adhesion strength whereas for the
cells in serum free media, adhesion strength slightly decreased concurrently with the
morphology of the cells changing to spherical. Whether this decrease in adhesion strength
was due to failure at the integrin-ECM sites due to enhancement in cell contractility as
described elsewhere (Kadi et al. 1998) needs to be investigated. Moreover, whether this
interpretation is valid for both serum and serum free conditions remains to be explored.
These results reinforce the concept that the cellular internal force balance is a central
modulator of the cell adhesion strength and that the forces from inside the cell (both
tensional and compressive) must be in perfect balance during cell adhesion to ECM.
However, it is still unclear whether tensional forces due to contractility or the
microtubules (bearing compressive loads due to the contractility of actin-myosin)
dominate in enhancing cell adhesion strength. So next, adhesive area was modulated to
change cell shape and investigate its effect on cell adhesion strength since it is well
documented that cell shape modulates cell internal force balance (Chicurel, Chen &
Ingber 1998, Chen et al. 2003, Chen, Ingber 1999)(Chen et al. 2003).

130
Cell shape strongly modulates the effect of microtubule disruption on cell
adhesion strength
Since it was demonstrated that cell shape (morphology) can be modulated by
engineering the cell adhesive area, (Gallant et al. 2002) the effect of microtubule
disruption on cell adhesion strength was investigated between spread cells and cell
adhered to micropatterned islands. It was hypothesized that microtubule disruption in
cells with spherical and hemispherical morphology significantly reduces cell adhesion
strength since tight balance between tensional and compressive forces exist.
Micropatterned island geometries used in our earlier study were employed i.e., 10 μm
diameter circular islands and 25 μm outer and 23 μm inner diameter annular patterns to
achieve spherical and hemispherical cell morphology. This enabled to achieve alteration
of force balance through modulation of cell shape for further investigation (Fig 6.6).
Interestingly, it was observed that for cells on both the micropatterns, there was
an approximate 10 fold decrease in the adhesion strength for the cells treated with
nocodazole compared to untreated cells under serum conditions (Fig 6.7). The two
possible reasons for the observed dramatic decrease in the adhesion strength could be that
(a) the disruption of microtubules affects cellular cytoskeletal integrity and compromises
the force balance or (b) the enhancement in the contractility following microtubule
disruption could be large enough to aid in the failure of the integrin-ECM bonds due to
the tensional forces from the inside of the cell. It is worthwhile to note that when a cell is
subjected to hydrodynamic flow, both these effects are enhanced at small adhesive areas
(approximately only 10% of the area of a fully spread cell) as can be understood from the
non-linear adhesion model (Dumbauld et al. 2010, Gallant, Michael & Garcia 2005).

131
However, similar experiments performed on spread cells (Fig 6.5) did not significantly
alter the adhesion strength. It can be inferred from this analysis that a threshold spreading
area exists at which the internal force balance would change and the effect of microtubule
disruption on adhesion strength would be less pronounced.
Microtubules in temporal evolution of adhesion strength
In the previous analysis, steady state adhesion strength was examined wherein the
microtubular system was fully developed and then disrupted using pharmacological
inhibitors. However, it is important to understand the role of microtubules in adhesion
strengthening (temporal evolution) since microtubule disruption is known to affect focal
adhesion assembly and disassembly (Digman et al. 2008). To perform the experiment, 10
μM nocodazole was added to CGM at the time of cell seeding and cells were subjected to
hydrodynamic flow for adhesion analysis at 1, 2, 4 and 16 hr. As expected, adhesion
strength responses with respect to time were non-linear (Fig 6.8). However, a surprising
finding was that the adhesion strength saturated at 25% of the maximum adhesion
strength for a fully spread cell in serum. Also comparing these results (Fig 6.8) to
previously described results (Fig 6.5) wherein the microtubular system was allowed to
develop for 16 hr and then depolymerized using nocodazole, the adhesion strengths were
4 fold different. This implies that microtubule polymerization is vital to the temporal
evolution of adhesion. Moreover, just maintaining the contractility in a cell either by the
presence of serum or the disruption of microtubules does not contribute enough to the
adhesion strength but it can be concluded that cell internal force balance is required for
adhesion strengthening. Furthermore, it can also be inferred that adhesion assembly and
disassembly is required for the cell to express its maximum adhesion strength by

132
relocating focal adhesions to the periphery (Gallant, Michael & Garcia 2005, Gallant,
Andres J. Garcia 2007, Digman et al. 2008).
6.4 Conclusion
Previous investigations extensively studied the involvement of microtubules in
the adhesion signaling process. This work establishes that microtubules play a vital role
in stabilizing cell substrate adhesions. Moreover, the morphological changes due to
microtubule disruption were systematically studied under various treatment conditions
resulting in the investigation of the role of microtubules in maintaining cell shape. The
spatiotemporal evolution of adhesion strength was studied with respect to the
contribution of microtubules. This work establishes that internal cellular force balance is
required for the cell to express its maximum adhesion strength and that this effect is more
pronounced when the cell is more spherical. Moreover, it can be inferred that contractility
alone does not regulate adhesion strength rather; the complex interplay between the actin
and microtubular system giving rise to force balance regulates cell adhesion.
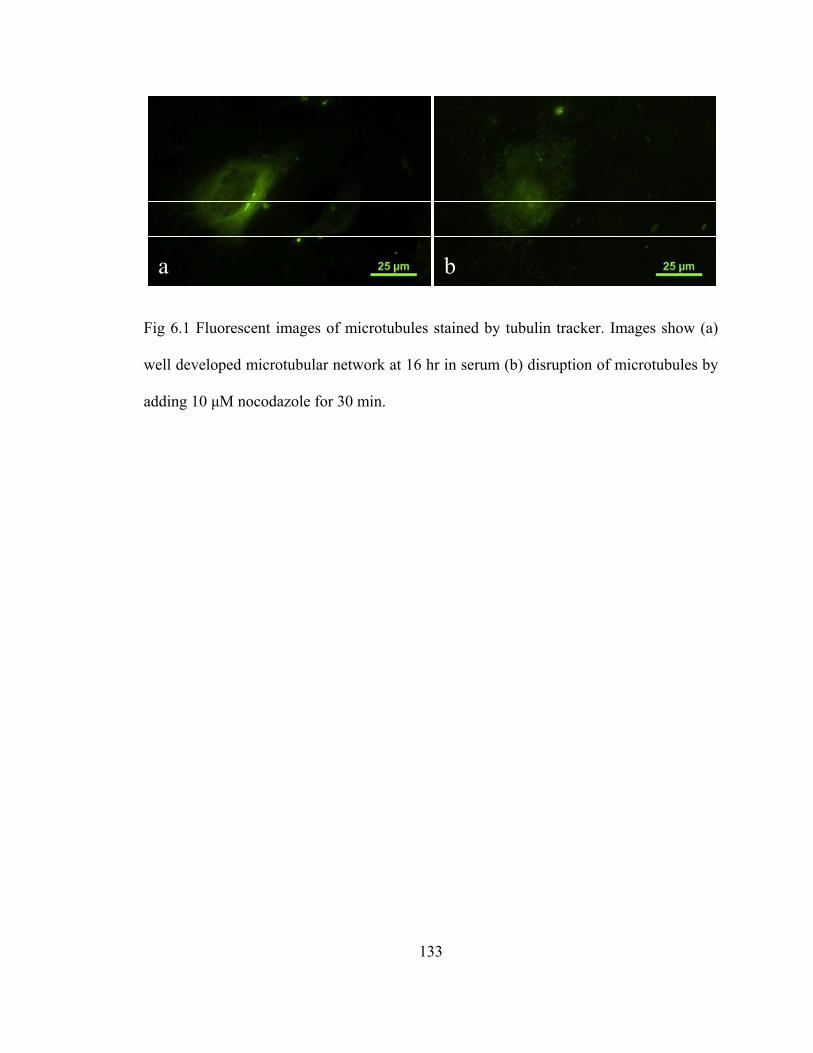
133
Fig 6.1 Fluorescent images of microtubules stained by tubulin tracker. Images show (a)
well developed microtubular network at 16 hr in serum (b) disruption of microtubules by
adding 10 μM nocodazole for 30 min.
a b
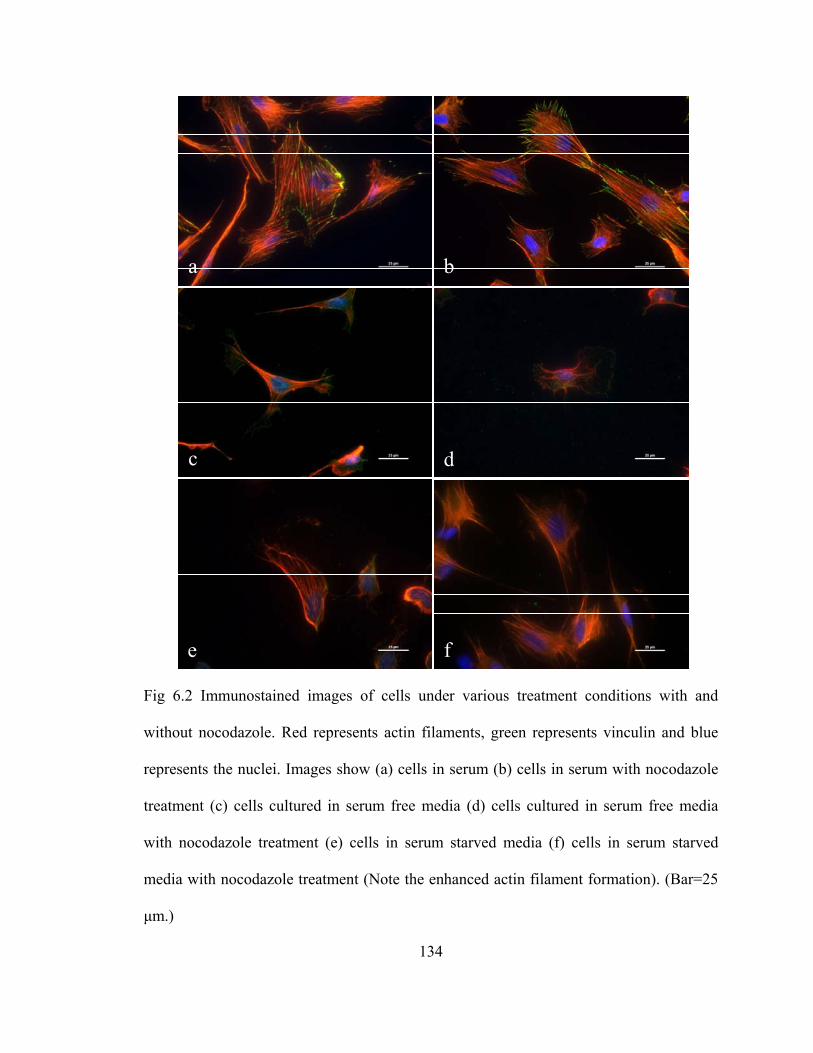
134
Fig 6.2 Immunostained images of cells under various treatment conditions with and
without nocodazole. Red represents actin filaments, green represents vinculin and blue
represents the nuclei. Images show (a) cells in serum (b) cells in serum with nocodazole
treatment (c) cells cultured in serum free media (d) cells cultured in serum free media
with nocodazole treatment (e) cells in serum starved media (f) cells in serum starved
media with nocodazole treatment (Note the enhanced actin filament formation). (Bar=25
μm.)
a b
dc
fe

135
Fig 6.3 Cell spreading area dependence on various treatment conditions with serum and
nocodazole.
Treatment conditions
1 2 3 4 5 6
Cel
l spr
eadi
ng a
rea
( m
2 )
0
200
400
600
800
1000
1200
1400
1600
1800
2000
Cell Spreading Area1 - Serum free2 - Serum free + Nocodazole3 - Serum starved4 - Serum starved + Nocodazole5 - Serum conditions6 - Serum + Nocodazole

136
Fig 6.4 Dependence of the circularity of cells under various treatment conditions with
serum and nocodazole.
Treatment Conditions
1 2 3 4 5 6
Cir
cula
rity
0.0
0.2
0.4
0.6
0.8
1.0
1.2
Circularity1 - Serum free2 - Serum free + Nocodazole3 - Serum starved4 - Serum starved + Nocodazole5 - Serum conditions6 - Serum + Nocodazole
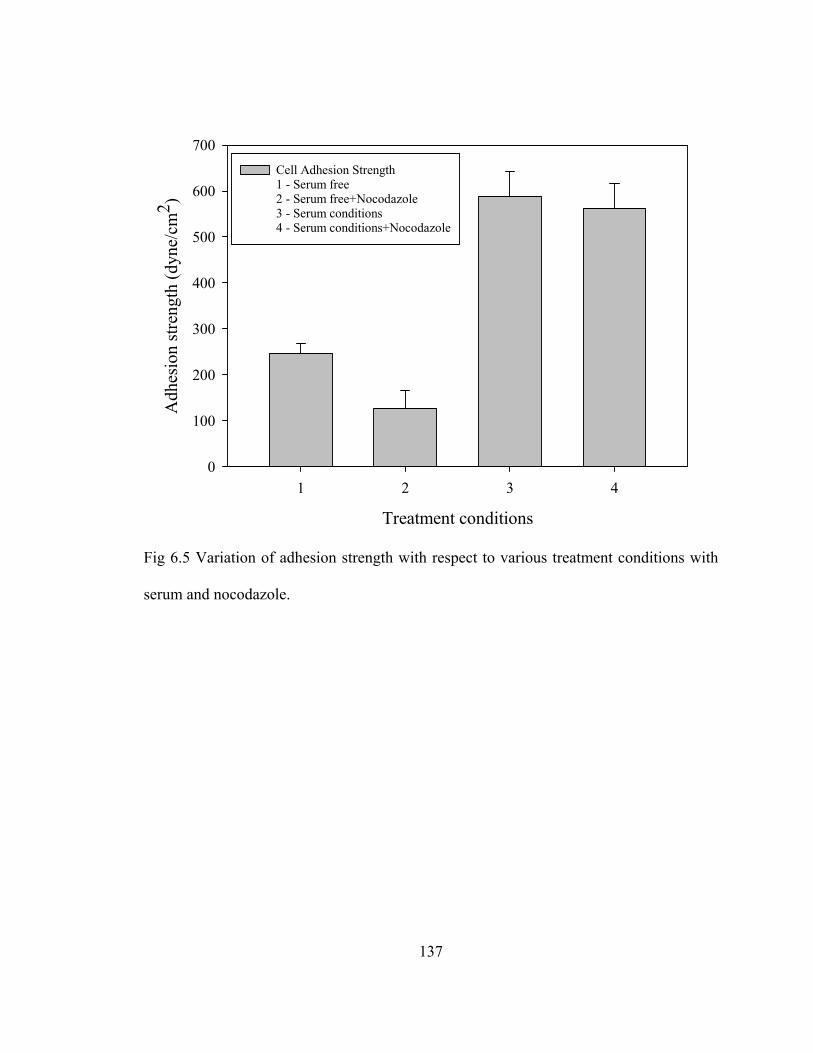
137
Fig 6.5 Variation of adhesion strength with respect to various treatment conditions with
serum and nocodazole.
Treatment conditions
1 2 3 4
Adh
esio
n st
reng
th (
dyne
/cm
2 )
0
100
200
300
400
500
600
700
Cell Adhesion Strength1 - Serum free 2 - Serum free+Nocodazole3 - Serum conditions4 - Serum conditions+Nocodazole
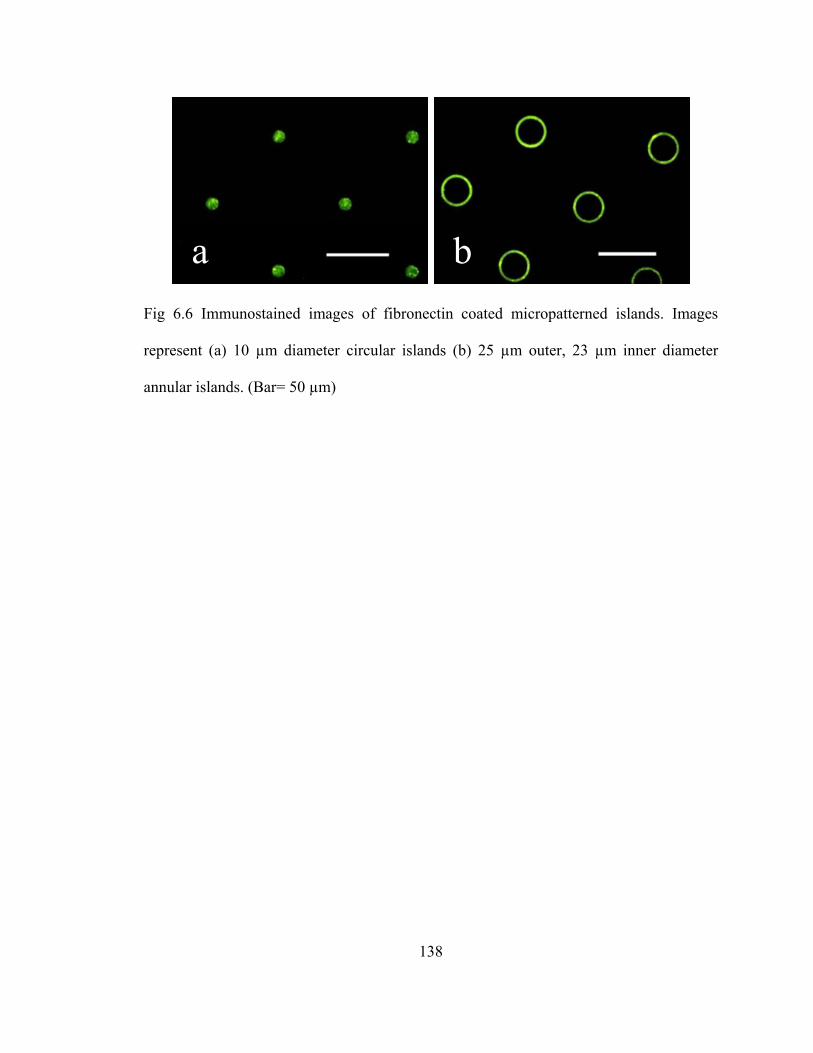
138
Fig 6.6 Immunostained images of fibronectin coated micropatterned islands. Images
represent (a) 10 µm diameter circular islands (b) 25 µm outer, 23 µm inner diameter
annular islands. (Bar= 50 µm)
a b

139
Fig 6.7 Adhesion strength of cells cultured in serum showing approximately 10 fold
variation between nocodazole untreated and treated cells on micropatterned islands.
Treatment conditions
10 µm 10 µm+nocodazole 25 µm annulus 25 µm+nocodazole
Adh
esio
n st
reng
th (
dyne
/cm
2 )
0
100
200
300
400
500
600
700

140
Fig 6.8 Temporal evolution of adhesion strength for cells cultured in serum and cells
cultured in serum and nocodazole.
Incubation time (hr)
0 2 4 6 8 10 12 14 16 18
Adh
esio
n S
tren
gth
(dyn
e/cm
2 )
0
100
200
300
400
500
600
700
Adhesion strength (serum)Exponential fit for adhesion strength(serum)Adhesion strength (serum+nocodazole)Exponential fit for adhesion strength(serum+nocodazole)
141
6.5 List of References
Ballestrem, C., Wehrle-Haller, B., Hinz, B. & Imhof, B.A. 2000, "Actin-dependent Lamellipodia Formation and Microtubule-dependent Tail Retraction Control-directed Cell Migration", Molecular biology of the cell, vol. 11, no. 9, pp. 2999-3012.
Berrier, A.L. & Yamada, K.M. 2007, "Cell-matrix adhesion", Journal of cellular physiology, vol. 213, no. 3, pp. 565-573.
Bershadsky, A., Chausovsky, A., Becker, E., Lyubimova, A. & Geiger, B. 1996, "Involvement of microtubules in the control of adhesion-dependent signal transduction", Current Biology, vol. 6, no. 10, pp. 1279-1289.
Chen, C.S., Alonso, J.L., Ostuni, E., Whitesides, G.M. & Ingber, D.E. 2003, "Cell shape provides global control of focal adhesion assembly", Biochemical and biophysical research communications, vol. 307, no. 2, pp. 355-361.
Chen, C.S. & Ingber, D.E. 1999, "Tensegrity and mechanoregulation: from skeleton to cytoskeleton", Osteoarthritis and Cartilage, vol. 7, no. 1, pp. 81-94.
Chicurel, M.E., Chen, C.S. & Ingber, D.E. 1998, "Cellular control lies in the balance of forces", Current opinion in cell biology, vol. 10, no. 2, pp. 232-239.
Digman, M.A., Brown, C.M., Horwitz, A.R., Mantulin, W.W. & Gratton, E. 2008, "Paxillin dynamics measured during adhesion assembly and disassembly by correlation spectroscopy", Biophysical journal, vol. 94, no. 7, pp. 2819-31.
Dumbauld, D.W., Shin, H., Gallant, N.D., Michael, K.E., Radhakrishna, H. & García, A.J. 2010, "Contractility modulates cell adhesion strengthening through focal adhesion kinase and assembly of vinculin-containing focal adhesions", Journal of cellular physiology, vol. 223, no. 3, pp. 746-756.
Evans, E.A. 1985, "Detailed mechanics of membrane-membrane adhesion and separation. I. Continuum of molecular cross-bridges", Biophysical Journal, vol. 48, no. 1, pp. 175-183.
Ezzell, R.M., Goldmann, W.H., Wang, N., Parasharama, N. & Ingber, D.E. 1997, "Vinculin Promotes Cell Spreading by Mechanically Coupling Integrins to the Cytoskeleton", Experimental cell research, vol. 231, no. 1, pp. 14-26.
Finkelstein, E., Chang, W., Chao, P.-.G., Gruber, D., Minden, A., Hung, C.T. & Bulinski, J.C. 2004, "Roles of microtubules, cell polarity and adhesion in electric-field-mediated motility of 3T3 fibroblasts", Journal of cell science, vol. 117, no. 8, pp. 1533-1545.
Gallant, N.D. & Andres J. Garcia 2007, "Model of integrin-mediated cell adhesion strengthening", Journal of Biomechanics, vol. 40, no. 6, pp. 1301-1309.

142
Gallant, N.D., Capadona, J.R., Frazier, A.B., Collard, D.M. & Garcia, A.J. 2002, "Micropatterned Surfaces to Engineer Focal Adhesions for Analysis of Cell Adhesion Strengthening", Langmuir, vol. 18, no. 14, pp. 5579-5584.
Gallant, N.D., Michael, K.E. & Garcia, A.J. 2005, "Cell Adhesion Strengthening: Contributions of Adhesive Area, Integrin Binding, and Focal Adhesion Assembly", Molecular biology of the cell, vol. 16, no. 9, pp. 4329-4340.
García, A.J. & Boettiger, D. 1999, "Integrin–fibronectin interactions at the cell-material interface: initial integrin binding and signaling", Biomaterials, vol. 20, no. 23-24, pp. 2427-2433.
Garcia, A.J., Ducheyne, P. & Boettiger, D. 1997, "Quantification of cell adhesion using a spinning disc device and application to surface-reactive materials", Biomaterials, vol. 18, no. 16, pp. 1091-1098.
Geiger, B., Bershadsky, A., Pankov, R. & Yamada, K.M. 2001, "Transmembrane crosstalk between the extracellular matrix and the cytoskeleton", Nature reviews. Molecular cell biology, vol. 2, no. 11, pp. 793-805.
Hynes, R.O. 2002, "Integrins: Bidirectional, Allosteric Signaling Machines", Cell, vol. 110, no. 6, pp. 673-687.
Kadi, A., Pichard, V., Lehmann, M., Briand, C., Braguer, D., Marvaldi, J., Rognoni, J. & Luis, J. 1998, "Effect of Microtubule Disruption on Cell Adhesion and Spreading", Biochemical and biophysical research communications, vol. 246, no. 3, pp. 690-695.
Lotz, M., Burdsal, C., Erickson, H. & McClay, D. 1989, "Cell adhesion to fibronectin and tenascin: quantitative measurements of initial binding and subsequent strengthening response", The Journal of cell biology, vol. 109, no. 4, pp. 1795-1805.
Maniotis, A., Chen, C. & Ingber, D. 1997, "Demonstration of mechanical connections between integrins, cytoskeletal filaments, and nucleoplasm that stabilize nuclear structure", Proceedings of the National Academy of Sciences, vol. 94, no. 3, pp. 849-854.
Small, J.V. & Kaverina, I. 2003, "Microtubules meet substrate adhesions to arrange cell polarity", Current opinion in cell biology, vol. 15, no. 1, pp. 40-47.
Wang, N., Butler, J. & Ingber, D. 1993, "Mechanotransduction across the cell surface and through the cytoskeleton", Science, vol. 260, no. 5111, pp. 1124-1127.
Watanabe, T., Noritake, J. & Kaibuchi, K. 2005, "Regulation of microtubules in cell migration", Trends in Cell Biology, vol. 15, no. 2, pp. 76-83.
143
Chapter 7. Conclusions and Future Considerations
The overall objective of the project was to design an experimental platform to
investigate the role of peripheral focal adhesions in modulating the cell adhesion strength.
The hypothesis that the peripheral focal adhesions stabilize cell adhesion to ECM was
formulated based on the previous findings that bond loading is non-uniform across the
adhesive area of the cell and the membrane peeling mechanisms that explain the adhesion
strength based on the ability of the cell to remain attached when subjected to detachment
forces. Although non-linear bond loading models for explaining cell adhesion strength
were widely accepted, this study provided an experimental platform for the validation of
such a model. The systematic analysis of the regulation of adhesion strength by the
position of focal adhesions expands our understanding of the structural and functional
role of focal adhesions in cell adhesion which is known to be fundamental to the
regulation of various biophysical cellular processes like cell spreading, migration,
motility and cellular traction.
The first goal was to develop a stamp design that could be used to microcontact
print the required geometries with alkane thiol ‘ink’ onto Au surfaces. However, the
small and sparse features reaching the limit of the microcontact printing stamp stability
resulted in a phenomenon of roof collapse. Hence accurate replication of pattern
geometries onto the substrates was challenging. Therefore, the roof collapse phenomenon
was studied and the results suggested that non-uniform pressure distribution during initial
144
contact of the stamp onto the surface initiated roof collapse and hindered the accurate
replication of the stamp features. Hence an annular column surrounding the pattern zone
was embedded in the stamp design to provide for additional stability and it also acted as a
barrier to prevent roof collapse propagation into the pattern zone. Utilizing this modified
stamp design the required circular and annular features required for this study were
successfully replicated on the substrates for further protein incubation.
Once the patterns were replicated on the substrates, standard protein incubation
protocols allowed for successful protein adsorption to the patterned island within a non-
fouling background. By combining these micropatterned surfaces with robust
hydrodynamic shear assay, cell adhesion strength was analyzed on various patterns. The
patterns used in this study were circular and annular patterns. The significance of annular
patterns is that for the same total adhesive area as that of circular patterns, the annular
patterns provided for enhanced cell spreading area by distributing the focal adhesions to
the cell periphery. Upon adhesion strength analysis, it was found that for the same total
adhesive area, annular patterns provided for greater adhesion strength indicating the cell’s
preference for recruiting focal adhesions to the periphery for stabilizing focal adhesions.
Moreover, it was clear from the results that the bond loading on a cell is highly non-
uniform as was proposed in previous theoretical models. Also the stark contrast between
the role of focal adhesions in cell adhesion strength and traction forces was that cell
adhesion strength showed a non-linear variation with spreading area whereas previously
published reports of cellular traction indicated linear variation with spreading area. This
implies that the regulatory role of focal adhesions in cell adhesion is different from that
of cellular traction. Moreover, the size of the focal adhesions directly governed the

145
magnitude of traction that was applied on the surface whereas no such correlation was
observed in the adhesion strength.
Since cytoskeletal components are known to play a major role in regulating
various cellular processes and fundamentally cell adhesion, the next studies were on the
specific contribution of microtubules towards regulating cell adhesion strength. Although
actin filaments have been extensively studied as a regulator of cell adhesion and traction
through focal adhesions, few studies investigated the structural role of microtubules in
cell adhesion. Hence the microtubule network was disrupted and its effect on the
adhesion strength was studied under various serum conditions. However, for spread cells
in serum, no enhancement in the adhesion strength was observed even though
microtubule disruption was known to enhance cell contractility. Hence the next study was
aimed at altering the force balance in a cell by modulating the cell shape by engineering
adhesive islands so that the cell takes approximately spherical and hemispherical shapes.
Disruption of microtubules in these micropatterned cells resulted in a 10 fold decrease in
the adhesion strength whereas previous studies indicate that inhibition of actin-myosin
contractility only reduced the adhesion strength by 30% in both micropatterned and
spread cells. However, a similar experiment performed on completely spread cells did not
alter the adhesion strength upon microtubule disruption. It was inferred from this result
that cellular force balance transduced by cell shape regulates cell adhesion strength much
more effectively than individual adhesive regulators like focal adhesions or expression of
cell contractility. Moreover, the temporal evolution of adhesion strength was also studied
wherein focal adhesion disassembly is inhibited by inhibiting microtubule polymerization
and was found that adhesion strength was 4 fold lower than the maximum adhesion

146
strength of the cells in serum. Overall, this indicates that microtubules regulate cell
adhesion strength by providing cellular integrity and necessary force balance which in
turn is dependent on the cell shape.
An important extension of this research would be to systematically study the
mechanotransduction of cellular force balance through cell shape modulated by
microtubules. Due to the inference that disruption of microtubules had a dramatic effect
on the adhesion strength for cells on adhesive islands much smaller than the diameter of
the cell (approximately spherical cell shape) and that disruption of microtubules had no
effect on spread cells at steady state, it is important to understand the transduction
process in relation to cell shape for providing adhesion strength. Based on the fact that
force balance can be modulated by cell shape, various micropattern geometries can be
utilized to systematically investigate the threshold spreading area at which actin system
dominates over the force balance condition in regulating the cell adhesion strength to
further explain the observations in this study.
Overall, this project establishes the structure-function role of the peripheral focal
adhesions in regulating adhesion strength. Moreover, it provides valuable insights into
the regulation of adhesion strength with respect to force balance inside the cell which is
an important component of the cell’s mechanotransduction mechanism. These findings
and future work in this research area can provide insights into the adhesion related
mechanotransduction mechanisms and provide for the better understanding of the cellular
processes based on cell adhesion. This field of research is expected to contribute to the
evolution of tissue engineering by providing valuable cues to engineer biomaterials for
various in vitro and in vivo applications.