
Modelling to study its non-linear effects on Communication System's performance with BER as...
9
MODELLING RF POWER AMPLIFIER TO STUDY ITS NON LINEAR EFFECTS ON RF COMMUNICATION SYSTEM, WITH BER AS A PERFORMANCE MEASURE. Aripirala Manoj Kumar, G. Bharath Reddy, G. Krishna Chaitanya Reddy. 1 Department of Electronic and Communication Engineering, IIIT-Allahabad. [email protected] 2 Department of Electronic and Communication Engineering, IIIT-Allahabad. [email protected] 3 Department of Electronic and Communication Engineering, IIIT-Allahabad. [email protected] ABSTRACT This paper is a study of non-linear effects of RF Amplifiers on Communication Systems Performance. High speed data communication is made possible by Multilevel Modulation schemes. This paper presents a study of these non linear effects on multilevel Modulation schemes like MPSK and MQAM. We make use of Bit Error Ratio (BER) as performance measure. BER vs SNR (Signal-to-Noise Ratio) curves provide comparison between the non linear effects caused by Gain Compression in particular. KEYWORDS Multilevel modulation schemes, MPSK, MQSK, Bit Error Ratio, BER vs SNR curves, Gain Compression. 1. INTRODUCTION In this section we discuss the need to study the non linear effects in RF Amplifiers. This is followed by the modelling of the Communication system in the 2 nd section. In the 3 rd section we describe the method to model the RF Amplifier from different parameters. In 4 th we discuss the results of applying the Amplifier model in the communication system simulator and conclude in the next section. This is followed by Acknowledgements and References. The present day wireless communication applications demand high speed data transmissions. This is made possible by multilevel modulation schemes like M-ary Phase Shift Keying (MPSK) and M-ary Quadrature Amplitude Modulation (MQAM). The Non Linear Effects in RF Amplifier like Gain Compression cause Power Efficiency problems especially in multilevel modulation scheme causing a trade off. There are methods to compensate for these non linear effects. We can increase the input power to the Amplifier but this will cause power efficiency losses. We can also use Compound Semiconductors like GaAs in the RF amplifiers but that will increase the cost of Amplifier making it unsuitable for low cost and small scale integrated circuit implementations. By studying these non linear effects we can optimise the trade offs.
Transcript of Modelling to study its non-linear effects on Communication System's performance with BER as...

MODELLING RF POWER AMPLIFIER TO STUDY ITS NON LINEAR EFFECTS ON RF COMMUNICATION
SYSTEM, WITH BER AS A PERFORMANCE MEASURE.
Aripirala Manoj Kumar, G. Bharath Reddy, G. Krishna Chaitanya Reddy.
1Department of Electronic and Communication Engineering, IIIT-Allahabad. [email protected]
2Department of Electronic and Communication Engineering, IIIT-Allahabad. [email protected]
3Department of Electronic and Communication Engineering, IIIT-Allahabad. [email protected]
ABSTRACT This paper is a study of non-linear effects of RF Amplifiers on Communication Systems Performance. High speed data communication is made possible by Multilevel Modulation schemes. This paper presents a study of these non linear effects on multilevel Modulation schemes like MPSK and MQAM. We make use of Bit Error Ratio (BER) as performance measure. BER vs SNR (Signal-to-Noise Ratio) curves provide comparison between the non linear effects caused by Gain Compression in particular.
KEYWORDS Multilevel modulation schemes, MPSK, MQSK, Bit Error Ratio, BER vs SNR curves, Gain Compression.
1. INTRODUCTION In this section we discuss the need to study the non linear effects in RF Amplifiers. This is
followed by the modelling of the Communication system in the 2nd section. In the 3rd section we describe the method to model the RF Amplifier from different parameters. In 4th we discuss the results of applying the Amplifier model in the communication system simulator and conclude in the next section. This is followed by Acknowledgements and References. The present day wireless communication applications demand high speed data transmissions.
This is made possible by multilevel modulation schemes like M-ary Phase Shift Keying (MPSK) and M-ary Quadrature Amplitude Modulation (MQAM). The Non Linear Effects in RF Amplifier like Gain Compression cause Power Efficiency problems especially in multilevel modulation scheme causing a trade off. There are methods to compensate for these non linear effects. We can increase the input power to the Amplifier but this will cause power efficiency losses.
We can also use Compound Semiconductors like GaAs in the RF amplifiers but that will increase the cost of Amplifier making it unsuitable for low cost and small scale integrated circuit implementations. By studying these non linear effects we can optimise the trade offs.
2. COMMUNICATION SYSTEM SIMULATOR The simulation has been done in MATLAB 7.7.0471. In the simulator the transmitter
transmits bits at a given data rate. These bits are then modulated using multilevel modulation schemes. Then the modulated bits are transmitted through a channel with AWGN. They are then demodulated and sent to the receiver. The received bits are then compared with the sent bits and then BER is evaluated. This BER depends on the SNR of the signal. The following figure shows a block diagram of different elements in the simulator –
Fig.1: Block Diagram of Communication system simulator. Apart from BER another parameter called Error Vector Magnitude (EVM) also serves as a
good performance measure but we restrict our discussion to BER.
2.1. MPSK
Phase Shift Keying uses distinct phases and each of these phases represent a unique symbol pattern of bits. The figure below shows the scatter plot of BPSK signal transmitted at 30000 bits per second.
-1 -0.5 0 0.5 1
-1
-0.5
0
0.5
1
Quadrature
In-Phase
Scatter plot
Fig.2: Scatter plot of 4-PSK . The above figure shows a acatter plot of 4-PSK modulated signal. Scatter plot shows the In-
Phase and Quadrature Components of the modulated signal. Generally after modulation the symbols will be complex( in x +iy for). If the signal values fall beyond a particular threshold in the scatterplot then it will be detected as another symbol thus causing errors. BER vs SNR curves of MPSK for different values of M is shown below –

-2 0 2 4 6 8 10 12 14 16
10-5
10-4
10-3
10-2
10-1
100
SNR
BER
BER vs SNR
4-QAM16-QAM64-QAM256-QAM
Fig.3: BER vs SNR plot of MPSK.
2.2. MQAM
Quadrature Amplitude Modulation is both a digital scheme as well as an analog scheme. It conveys two analog signals or digital bit streams using Amplitude shift keying and these are usually 90 degrees out of phase and so the name Quadrature. The following figure shows signal constellation and scatter plot of the MQAM signal transmitted at 30000 bits per second –
-1 -0.5 0 0.5 1
-1
-0.5
0
0.5
1
Quadrature
In-Phase
Scatter plot
Fig.4: Scatter plot of 16-QAM.
The following plot shows the BER vs SNR curves of MQAM for different values of M.
-2 0 2 4 6 8 10 12 14 16
10-5
10-4
10-3
10-2
10-1
100
SNR
BER
BER vs SNR
4-QAM16-QAM64-QAM256-QAM
Fig.5: BER vs SNR plot of MQAM.

In the plots we can see that BER vs SNR is a decaying curve because as the SNR increases Noise decreases and so the number of errors tend to decrease. During the calculation of BER vs SNR values the number of bit errors become really less and cause some irregularities so we increase the number of simulated bits and there by the ratio remains the same. Now a parametrizable RF Amplifier model is to be applied to the simulator and the above
BER vs SNR curves are used for comparison.
3. AMPLIFIER MODEL The RF Amplifier must be modelled in such a way that it exhibits Gain Compression Effect. And the amount of compression and point of saturation is to be determined by the given parameters.
3.1. Gain Compression
In RF Amplifiers the Gain is not linear. At higher input levels the gain tends to saturate. This effect is called Gain Compression and the parameter to signify Gain Compression is 1-db Compression Point. It is defined as the input power at which the output is 1-db less than the expected value. The system equation of linear power Amplifier is given as – y(t) = a1*x(t).................................(1) Because of the non linearities the system equation of the RF Amplifiers can be generalised as
below –
y(t) = a1*x(t) + a2*x2(t) + a3*x3(t).......................(2) If we apply a sinusoid as the input to the above non linear system the resultant equation
would be – x(t) = A*cos(ωt) y(t) = a1(Acos(ωt))+a2( Acos(ωt))2+ a3 (Acos(ωt))3 = a1(Acos(ωt))+(a2A
2/2)(1 + cos2ωt) + (a3A
3/4) (3cos ωt + cos3ωt ) = a2A
2/2 + (a1A + 3 A3/4) cos ωt + ( a2A2 cos2ωt)/2
+ (a3A3 cos ωt)/4
From the above equations we can observe that even order harmonics vanish if the system has
odd symmetry. The nth harmonic grows approximately proportional to An. In the above equations we can see that the 1st harmonic depends on the coefficients a1 and a3. In modelling the amplifier we have to find out the values of a1 and a3 from given parameters. In this paper we use Gain (G), output power at i-db compression point (P_1db) and saturated
output power (P_sat) to find the coefficients. The following equations show how the values of a1 and a3 are derived from the above mentioned parameters – Gain, G = Vout/Vin

Gain in db, G_db = 20*log(Vout/Vin) In case of linear amplifier Vout = y(t) and Vin = x(t). And for a linear amplifier y(t) = a1*x(t) as
in eq(1). Substituting in above Gain equation we get – G_db = 20*log(y(t)/x(t)) G_db = 20*log(a1*x(t)/x(t)) a1 = 10(G_db/20) From the above equation we get the coefficient of first order term in the non linear system
equation. And since we are concerned about the first major harmonic we can neglect the second order term’s coefficient. And so the system equation becomes – y(t) = a1*x(t) + a3*x3(t)..............(3) So we need the third order term’s coefficient a3. And the parameter P_1db is used to find a3.
P_1db is the output power at 1-db compression point and so the output power is 1_db less than linear value. So – P_1db +1 = 20*log(a1*x(t)) x(t) = 10(P_1db + 1)/20/a1. From this we obtain the input voltage at 1-db compression. And the output voltage is given
by – y(t) = 10(P_1db/20) Substituting in eq(3). we get – a3 = (y(t) –a1*x(t)) / x3(t) So, for any given parameters we can successfully model the RF Amplifier. We modelled the
Amplifier as a C++ class as a Matlab Executable File (.mex). The parameters are taken from Hittit Electronics and the specifications used belong to the HMC413QS16G/ HMC413QS16GE. The following are the specifications of the IC – Gain, G_db = 23db Saturated Output Power, P_sat = 29.5dbm Output Power at 1db Compression point, P_1db = 27dbm Supply Voltage = +2.75V to +5V Output power at 3rd Interception Point, P_IP3 = 40dbm Using the above specifications the amplifier is modelled. The following figures shows the
plot of Output Power to Input Power in db and Output Voltage to Input Voltage in volts of the Amplifier –

-25 -20 -15 -10 -5 0 5 100
5
10
15
20
25
30
35
Input Power
Output Power
actuallinear
Fig.6: Output Power Vs Input Power (in db)
-3 -2 -1 0 1 2 3
-50
-40
-30
-20
-10
0
10
20
30
40
50
Input Voltage
Output Voltage
actuallinear
Fig.7: Output Voltage Vs Input Voltage In the following section we discuss the results of applying the Amplifier Model to the
communication system simulator.
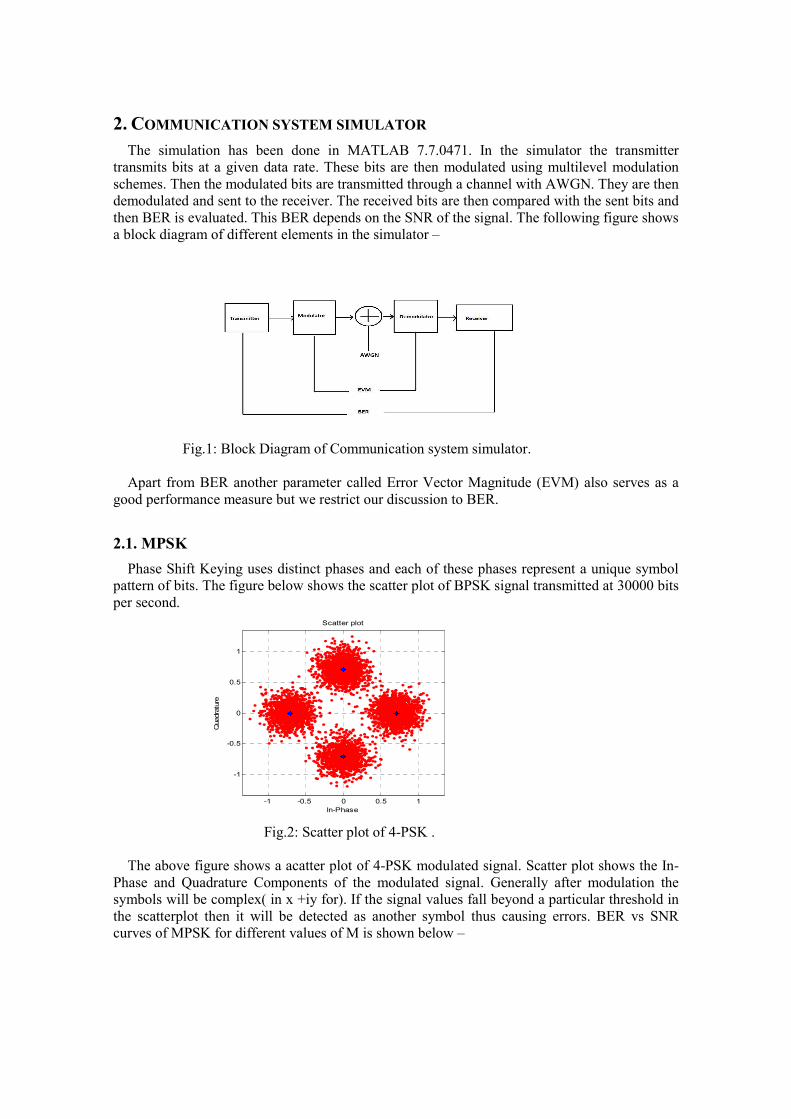
4. RESULTS The following figure shows the BER vs SNR curves of a 16-QAM modulated signal after
applying the Amplifier Model. From the plot we can see that initially because of the gain that signal power increases. As a result BER value decreases. Then as the input signal energy increases the non linearitites come into effect increasing the number of errors and thereby increasing the BER. If the signal energy comes into this range of non linearities there will be distortions causing Amplifier Back off.
-10 -5 0 5 10 15 20 25 3010
-7
10-6
10-5
10-4
10-3
10-2
10-1
100
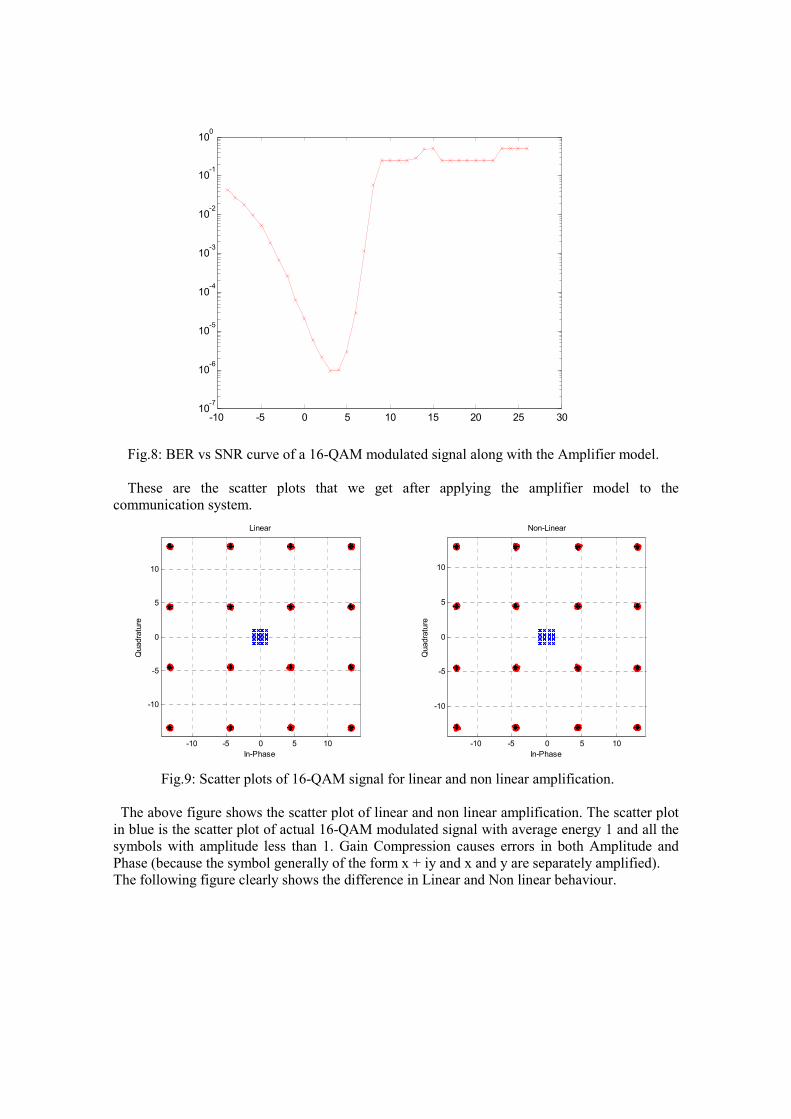
Fig.8: BER vs SNR curve of a 16-QAM modulated signal along with the Amplifier model. These are the scatter plots that we get after applying the amplifier model to the
communication system.
-10 -5 0 5 10
-10
-5
0
5
10
Quadrature
In-Phase
Linear
-10 -5 0 5 10
-10
-5
0
5
10
Quadrature
In-Phase
Non-Linear
Fig.9: Scatter plots of 16-QAM signal for linear and non linear amplification.
The above figure shows the scatter plot of linear and non linear amplification. The scatter plot in blue is the scatter plot of actual 16-QAM modulated signal with average energy 1 and all the symbols with amplitude less than 1. Gain Compression causes errors in both Amplitude and Phase (because the symbol generally of the form x + iy and x and y are separately amplified). The following figure clearly shows the difference in Linear and Non linear behaviour.

-13.5 -13 -12.5 -12
12.4
12.6
12.8
13
13.2
13.4
13.6
13.8Quadrature
In-Phase
Non-Linear
-13.5 -13 -12.5 -1212.4
12.6
12.8
13
13.2
13.4
13.6
13.8
14
14.2
14.4
Quadrature
In-Phase
Linear
Fig.10: Point in the scatter plot at top left corner.
From the above plots we can see that the effect at high energy levels is high.
5. CONCLUSIONS To have a high speed data rate, we require Multilevel Modulation schemes. And from the above observations we can conclude that effects of non linearities in RF Amplifiers cause severe performance losses for these modulation schemes. Hence a proper study of these effects will result in obtaining the optimum tradeoff between data rate and power efficiency.
ACKNOWLEDGEMENTS We would like to thank Dr.Shirshu Verma for his guidance throughout the compilation of the paper. We would like to thank Prof. Peter Jung and Dr. Alexander Viessmann for their valuable guidance throughout the project. REFERENCES 1. Behzad Razavi. RF Microelectronics. Prentice Hall Communication Engineering and
Emerging Technology Series. Prentice Hall Ptr.
2. J. G. Proakis. Digital Communications – 4th Edition. McGraw Hill, 2000.
3. S. C. Cripps. RF Power Amplifiers for Wireless Communication. Artech House. 1999.
4. Farinaz Edalat. Thesis on Effect of Power Amplifier Non Linearity on System Performance Metric, Bit Error Ratio(BER). Sept. 2003.
5. J. C. Feunzalida, O. Shimbo, L. W. Cook. Time Domain Analysis of Intrermodulation Effects caused by non linear Amplifiers. COMSAT Technical Review. Vol. 3 No.1, Spring 1972.
6. Choongeol Cho, Eisenstadt,F.R., Stengel,B , Ferrer,E. IIP3 Estimation from the Gain Compression Curve. IEEE Transactions on Microwave Theory and Techniques Vol. No.53,Issue No.4. 18 April 2005.

7. D. Staiman, J. Liston. Fidelity of Pulsed Microwave Transistor Amplifiers. Microwave Synopsium Digest. Vol. No. 74, Issue No.1. June 1974.
8. Miko Talonen, Saska Lindfors. Power Consumption Model for Linear RF Power Amplifiers with Rectangular MQAM Modulation. ISWCS 2007. Oct 2007.
9. A. Goldsmith, L. Greenstein. Effect of average power estimation error on adaptive MQAM modulation. IEEE International Conference on ‘Towards the Knowledge Millennium’ 1997. Vol. No 2. June 1997.
10. S. Williams. RF Channel Simulators enhance communication system quality and decrease costs. IEEE AUTOTESTCON 2009.
11. Hittite Electronics. http://www.hittite.com/products/view.html/view/HMC413QS16G. Data Sheets of HMC413QS16G / HMC413QS16GE.
12. R. D. Raut, K. D. Kulat. BER performance maintenance at High Data Rates in Cognitive Ratio. CONIELECOMP 2010. Feb 2010.
13. L. Jacobs, M. Moeneclaey. Exact BER analysis for QAM transmission on arbitrary fading channels with maximal-ratio combining and imperfect channel estimation.19th International Symposium on Personal, Indoor and Mobile Communications, 2008. Sept. 2008.
14. A. Bin Sediq, H. Yanikomeroglu. Performance Analysis of SNR-Based Selection Combining and BER-Based Selection Combining of Signals with Different Modulation Levels in Cooperative Communications. VTC 2009. Sept. 2009.
15. M. Valkama, A. Springer, G. Heuber. Digital signal processing for reducing the effects of RF imperfections in radio devices — An overview. ISCAS 2010. June 2010.
16. Wisell, David. Identification and Measurement of Transmitter Non-Linearities. 56th ARFTG Conference. Nov. 2000.