E 2 Ene 2015 ergy 5 y Trends Decemb ber - GOV.UK
84
E 2 Ene 2015 ergy 5 y Tre end ds D Dece emb 22 ber 2 Decem ber 2015 5
-
Upload
khangminh22 -
Category
Documents
-
view
0 -
download
0
Transcript of E 2 Ene 2015 ergy 5 y Trends Decemb ber - GOV.UK

E2
Ene2015
ergy5
y Treendds DDeceemb
22
ber
2 December 2015
5

This document is available in large print, audio and braille on request. Please e-mail [email protected] with the version you require.
This is a National Statistics publication
The United Kingdom Statistics Authority has designated these statistics as National Statistics, in accordance with the Statistics and Registration Service Act 2007 and signifying compliance with the UK Statistics Authority: Code of Practice for Official Statistics.
Designation can be broadly interpreted to mean that the statistics:
meet identified user needs are well explained and readily accessible are produced according to sound methods, and are managed impartially and objectively in the public interest
Once statistics have been designated as National Statistics it is a statutory requirement that the Code of Practice shall continue to be observed.
© Crown copyright 2015
You may re-use this information (not including logos) free of charge in any format or medium, under the terms of the Open Government Licence.
To view this licence, visit www.nationalarchives.gov.uk/doc/open-government-licence/ or write to the Information Policy Team, The National Archives, Kew, London TW9 4DU, or email: [email protected].
Any enquiries regarding this publication should be sent to us at [email protected]
This document is also available from our website at www.gov.uk/government/collections/energy-trends
Explanatory notes are to be found inside the back cover

December 2015 1
Contents Introduction 3
The main points for the third quarter of 2015 4
Section 1 - Total Energy 5
Tables 1.1: Indigenous production of primary fuels 91.2: Inland energy consumption: primary fuel input basis 101.3: Supply and use of fuels 11
Section 2 - Solid Fuels and Derived Gases 13
Tables 2.1: Supply and consumption of coal 162.2: Supply and consumption of coke oven coke, coke breeze and other manufactured solid fuels
17
2.3: Supply and consumption of coke oven gas, blast furnace gas, benzole and tars
18
Section 3 - Oil and Oil Products 19
Tables 3.1: Supply and use of crude oil, natural gas liquids and feedstocks 243.2: Supply and use of petroleum products 253.3: Supply and use of petroleum products - annual data 263.4: Supply and use of petroleum products - latest quarter 273.5: Demand for key petroleum products 283.6: Stocks of petroleum at end of period 293.7: Drilling activity on the UK Continental Shelf 30
Section 4 - Gas 31
Table 4.1: Natural gas supply and consumption 36
Section 5 - Electricity 37
Tables 5.1: Fuel used in electricity generation and electricity supplied 415.2: Supply and consumption of electricity 42
Section 6 - Renewables 43
Tables 6.1: Renewable electricity capacity and generation 476.2: Liquid biofuels for transport consumption 48

December 2015 2
Contents continued Special feature articles
Electricity generation and supply figures for Scotland, Wales, Northern Ireland and England, 2011 to 2014
49
Physical gas flows across Europe and diversity of gas supply in 2014 60Feed-in Tariff load factor analysis 69Recent and forthcoming publications of interest to users of energy statistics 76List of special feature articles published in Energy Trends between December 2014 and September 2015
78

December 2015 3
Introduction
Energy Trends and Energy Prices are produced by the Department of Energy and Climate Change (DECC) on a quarterly basis. Both periodicals are published concurrently in June, September, December and March. The December editions cover the third quarter of the current year.
Energy Trends includes information on energy as a whole and by individual fuels. The text and charts provide an analysis of the data in the tables. The tables are mainly in commodity balance format, as used in the annual Digest of UK Energy Statistics. The 2015 edition of the Digest was published on 30 July 2015. Printed and bound copies of the 2015 Digest can be obtained from The Stationery Office and an electronic version is available on the DECC section of the GOV.UK website at: www.gov.uk/government/collections/digest-of-uk-energy-statistics-dukes The balance format shows the flow of a commodity from its sources of supply, through to its final use. The articles provide in-depth information on current issues within the energy sector.
The text and tables included in this publication represent a snapshot of the information available at the time of publication. However, the data collection systems operated by DECC, which produce this information, are in constant operation. New data are continually received and revisions to historic data made. To ensure that those who use the statistics have access to the most up-to-date information, revised data will be made available as soon as possible, via the electronic versions of these tables. The electronic versions are available free of charge from the DECC section of the GOV.UK website. In addition to quarterly tables, the main monthly tables that were published in the period up to May 2001 when Energy Trends was produced monthly, continue to be updated and are also available on the DECC section of the GOV.UK website. Both sets of tables can be accessed at: www.gov.uk/government/organisations/department-of-energy-climate-change/about/statistics
Energy Trends does not contain information on Foreign Trade, Weather (temperature, wind speed, sun hours and rainfall) and Prices. Foreign Trade and Weather tables are, however, available on the DECC section of the GOV.UK website at: www.gov.uk/government/organisations/department-of-energy-climate-change/about/statistics Information on Prices can be found in the Energy Prices publication and on the DECC section of the GOV.UK website at: www.gov.uk/government/collections/quarterly-energy-prices If you have any comments on Energy Trends or Energy Prices publications please send them to:
Kevin Harris DECC Energy Statistics Team 6th Floor – Area B 3 Whitehall Place London SW1A 2AW E-mail: [email protected] Tel: 0300 068 5041

December 2015 4
The main points for the third quarter of 2015: Total energy production was 12 per cent higher than in the third quarter of 2014. This rise in
output was due to strong growth in oil, gas, nuclear and renewables production more than offsetting the continued decline in UK coal production.
Oil production rose by 27 per cent when compared with the third quarter of 2014. Refinery production in the third quarter of 2015 was up by 7½ per cent on the same quarter of last year, partially driven by low crude prices.
Natural gas production was 10 per cent higher than the third quarter of 2014. Gas imports and exports increased by 13 per cent and 29 per cent respectively. Gas consumption was down by ½ per cent, with an increase in stocks.
Coal production in the third quarter of 2015 was 52 per cent lower than the third quarter of 2014 due to mines closing and some other mines producing less coal as they are coming to the end of operation. Coal imports were 46 per cent lower with generators demand for coal down by 19 per cent.
Total primary energy consumption for energy uses rose by ½ per cent. However, when adjusted to take account of weather differences between the third quarter of 2014 and the third quarter of 2015, primary energy consumption fell by ½ per cent.
Temperatures in the quarter were on average 1.1 degrees cooler than a year earlier, with average temperatures in July and September 1.9 and 2.1 degrees cooler than a year earlier.
Final consumption rose by 2½ per cent compared to the third quarter of 2014. Domestic consumption rose by 6 per cent reflecting the cooler weather in the quarter, service consumption rose by 6 per cent, transport consumption rose by 1½ per cent, whilst industrial consumption fell by 2½ per cent. On a seasonally and temperature adjusted basis, final energy consumption rose by 1 per cent.
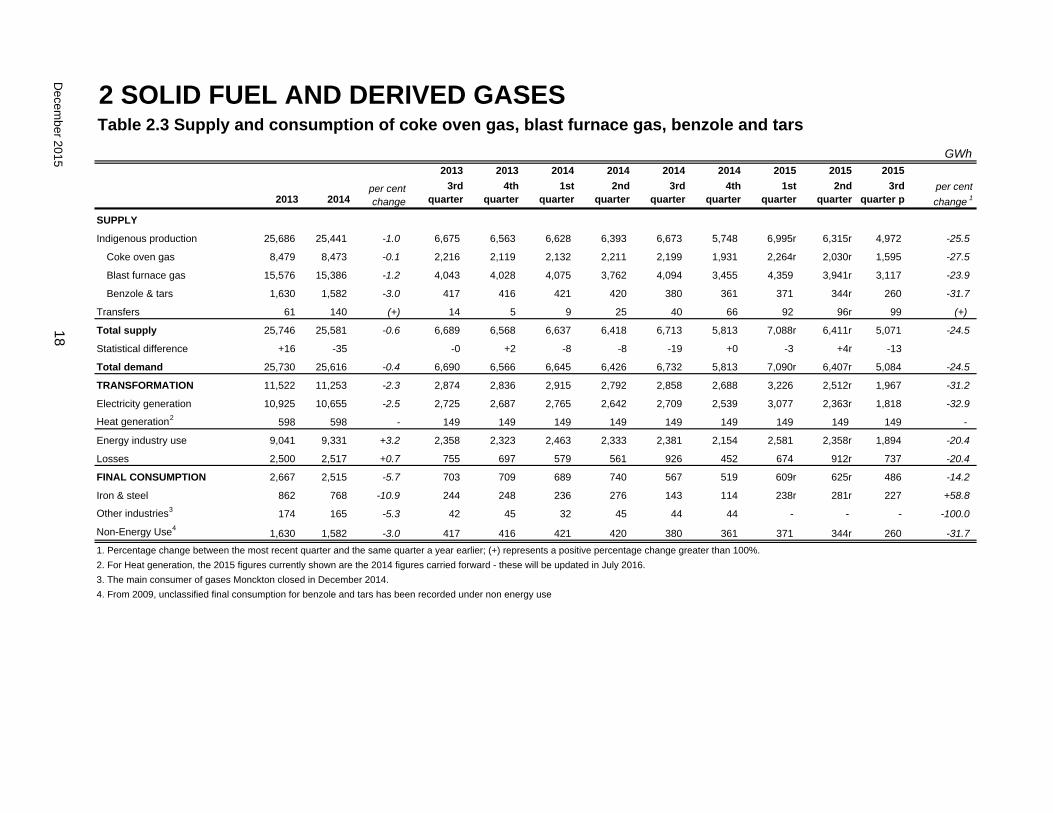
Electricity generated in the third quarter of 2015 fell by 0.5 per cent, from 76.4 TWh a year earlier to 75.9 TWh, with an increase in net imports leaving supply broadly unchanged.
Of electricity generated in the third quarter of 2015, gas accounted for 35 per cent, down from 38 per cent in the third quarter of 2014, whilst coal accounted for 17 per cent, down from 21 per cent in the third quarter of 2014. Nuclear generation accounted for 22 per cent of total electricity generated in the third quarter of 2015, an increase from the 20½ per cent share in the third quarter of 2014.
Renewables’ share of electricity generation increased to 23½ per cent, up from the 17½ per cent share in the third quarter of 2014. Offshore wind generation increased by 52 per cent, and onshore wind generation increased by 30 per cent, whilst solar PV generation increased by 73 per cent due to increased capacity. Generation from bioenergy was up by 16 per cent, mainly due to the conversion of Drax to biomass. Hydro generation increased by 34 per cent. Overall renewable electricity generation was up 33 per cent compared to the same quarter in 2014.
Low carbon electricity’s share of generation increased from 38 per cent in the third quarter of 2014 to 45½ per cent in the third quarter of 2015, with the fall in coal and gas generation offset by an increase in generation from renewables and nuclear.
In the third quarter of 2015, 197 MW of capacity joined the Feed in Tariff scheme, increasing the total to 4,160 MW, approximately 14 per cent of all renewable installed capacity.

Total Energy
December 2015
5
Section 1 - Total Energy ,
Chart 1.1 Production of indigenous primary fuels
Total production in the third quarter of 2015 at 27.5 million tonnes of oil equivalent was 11.9 per cent higher than in the third quarter of 2014.
Production of oil rose by 27 per cent compared to the third quarter of 2014, due to very low crude oil production in August 2014, which was largely the result of planned maintenance at Buzzard, the UK’s largest oil field. Production of gas rose by 9.9 per cent compared to the third quarter of 2014, when maintenance work affected production issues.
Primary electricity output in the third quarter of 2015 was 12.1 per cent higher than in the third quarter of 2014, within which nuclear electricity output was 5.8 per cent higher, whilst output from wind, solar and natural flow hydro was 46 per cent higher than the same period in 2014, due to higher wind speeds and increased wind and solar capacity, and a 18.4 per cent increase in rainfall levels (see sections 5&6).
In the third quarter of 2015 production of coal and other solid fuels was 52 per cent lower than the corresponding period of 2014. This was due to mines closing and some other mines producing less coal as they are coming to the end of operation.
Key results show: Total energy production was 11.9 per cent higher than in the third quarter of 2014. (Charts 1.1 & 1.2) Total primary energy consumption for energy uses rose by 0.5 per cent. However, when adjusted to take account of weather differences between the third quarter of 2014 and the third quarter of 2015, primary energy consumption fell by 0.6 per cent, largely due to decreased coal use in electricity generation. (Chart 1.3) Final consumption rose by 2.6 per cent compared to the third quarter of 2014. Domestic consumption rose by 6.2 per cent reflecting the cooler weather in the quarter, service consumption rose by 6.1 per cent, transport consumption rose by 1.5 per cent, whilst industrial consumption fell by 2.4 per cent. (Chart 1.4)
On a seasonally and temperature adjusted basis, final energy consumption rose by 1.1 per cent. (Chart 1.5) Net import dependency was 38.8 per cent, down 10.0 percentage points from the third quarter of 2014 reflecting increased indigenous production. (Chart 1.6) Fossil fuel dependency fell to 81.2 per cent in the third quarter of 2015, a record low level. (Chart 1.7)

Total Energy
December 2015 6
Chart 1.2 UK production (annual growth rate)
Chart 1.3 Total inland consumption (primary fuel input basis)(1)
(1) Seasonally adjusted and temperature corrected annual rates.
In the third quarter of 2015, the annual growth rate of UK production was +11.9 per cent, with the growth in oil and gas and primary electricity production more than offsetting the continuing decline of UK coal production.
Total inland consumption on a primary fuel input basis (temperature corrected, seasonally adjusted annualised rate), was 196.6 million tonnes of oil equivalent in the third quarter of 2015, 0.6 per cent lower than in the third quarter of 2014. The average temperature in the third quarter of 2015 was 1.1 degree Celsius cooler than the same period a year earlier.
Between the third quarter of 2014 and the third quarter of 2015 (on a seasonally adjusted and temperature corrected basis) coal consumption fell by 21 per cent driven by decreased coal use in electricity generation. On the same basis, oil consumption rose by 2.4 per cent, whilst gas consumption fell by 0.6 per cent.
Also on a seasonally adjusted and temperature corrected basis, there were rises in nuclear consumption of 4.7 per cent, and in bioenergy and waste consumption of 13.6 per cent.

Total Energy
December 2015 7
Chart 1.4 Final energy consumption by user
Chart 1.5 Seasonally adjusted and temperature corrected final energy consumption
Total final consumption rose by 2.6 per cent between the third quarter of 2014 and the third quarter of 2015.
Domestic sector energy consumption rose by 6.2 per cent, reflecting the cooler weather compared to a year earlier.
Service sector energy consumption rose by 6.1 per cent.
Transport sector energy consumption rose by 1.5 per cent. Industrial sector energy consumption fell by 2.4 per cent.
Total unadjusted final energy consumption (excluding non-energy use) rose by 2.1 per cent between the third quarter of 2014 and the third quarter of 2015.
On a seasonally and temperature adjusted basis final energy consumption (excluding non-energy use) rose by 1.1 per cent between the third quarter of 2014 and the third quarter of 2015.
Consumption data by fuel and sector is available in the table ET 1.3c on the DECC section of the GOV.UK website at: www.gov.uk/government/statistics/total-energy-section-1-energy-trends

Total Energy
December 2015 8
Chart 1.6 Net import dependency
Chart 1.7 Fossil fuel dependency
Relevant tables 1.1: Indigenous production of primary fuels……………………………………………………… Page 9 1.2: Inland energy consumption: primary fuel input basis………………………………………. Page 10 1.3: Supply and use of fuels……………………………………………………………………. Page 11-12 Contacts for further information:
Iain MacLeay Kevin Harris Total energy statistics Total energy statistics Tel: 0300 068 5048 Tel: 0300 068 5041 E-mail: [email protected] E-mail: [email protected]
In the third quarter of 2015 net import dependency was 38.8 per cent, down 10.0 percentage points from the third quarter of 2014, but up 4.6 percentage points from the second quarter of 2015.
In the third quarter of 2015 dependency on fossil fuels was 81.2 per cent, down 2.0 percentage points from the third quarter of 2014, and at a record low level.

1 TOTAL ENERGYTABLE 1.1. Indigenous production of primary fuels
Million tonnes of oil equivalent
Total Coal1 Petroleum2 Natural gas3 Bioenergy & waste4,5 Nuclear Wind, solar and hydro6
2010 158.6 11.4 69.0 57.2 5.9 13.9 1.19
2011 137.3 11.5 56.9 45.3 6.1 15.6 1.86
2012 122.6 10.6 48.8 38.9 6.8 15.2 2.28
2013 114.9 8.0 44.5 36.5 7.5 15.4 3.02
2014 112.9 7.3 43.7 36.6 7.9 13.9 3.61
Per cent change -1.7 -8.6 -1.7 +0.2 +5.3 -10.3 +19.5
2014 Quarter 3 24.5 1.9 9.0 8.0 1.6 3.4 0.64
Quarter 4 29.1 1.7 11.4 9.3 2.4 3.1 1.12
2015 Quarter 1 31.3r 1.9 11.5r 9.9 2.8r 3.9 1.27
Quarter 2 31.6r 1.5r 12.9r 10.4r 2.0r 3.7 1.12
Quarter 3 p 27.5r 0.9 11.4r 8.8 1.8r 3.6 0.94r
Per cent change 7 +11.9 -52.1 +27.3 +9.9 +10.7 +5.8 +45.8
1. Includes an estimate of slurry.
2. Crude oil, offshore and land, plus condensates and petroleum gases derived at onshore treatment plants.
3. Includes colliery methane, excludes gas flared or re-injected.
4. Includes solid renewable sources (wood, straw and waste), a small amount of renewable primary heat sources (solar, geothermal etc), liquid biofuels and
sewage gas and landfill gas.
5. Bioenergy & waste introduced as a separate category from March 2014 - see special feature article in the March 2014 edition of Energy Trends at:
www.gov.uk/government/collections/energy-trends-articles
6. Includes solar PV and natural flow hydro.
7. Percentage change between the most recent quarter and the same quarter a year earlier.
Primary electricity
9D
ecember 2015
1 TOTAL ENERGYTABLE 1.2 Inland energy consumption: primary fuel input basis Million tonnes of oil equivalent
Primary electricity Primary electricityNatural Bioenergy Wind, solar and Net Natural Bioenergy Wind, solar and Net
Total Coal1 Petroleum2 gas3 & waste4, 5 Nuclear hydro6 imports Total Coal Petroleum gas & waste Nuclear hydro imports
Unadjusted 7 Seasonally adjusted and temperature corrected 8,9 (annualised rates)
2010 219.4 32.6 70.2 93.6 7.6 13.9 1.19 0.23 213.4 31.1 70.2 89.2 7.6 13.9 1.19 0.23
2011 203.5 32.2 67.8 77.6 7.7 15.6 1.86 0.53 209.0 34.0 67.8 81.5 7.7 15.6 1.86 0.53
2012 208.0 40.9 67.0 73.3 8.3 15.2 2.28 1.02 207.9 40.9 67.0 73.3 8.3 15.2 2.28 1.02
2013 207.0 39.1 66.1 72.7 9.4 15.4 3.02 1.24 204.1 38.3 66.1 70.5 9.4 15.4 3.02 1.24
2014 193.4 31.7 65.8 65.9 10.7 13.9 3.61 1.76 198.7 33.4 65.8 69.6 10.7 13.9 3.61 1.76
Per cent change -6.6 -18.9 -0.3 -9.3 +13.4 -10.3 +19.5 +42.1 -2.6 -12.9 -0.3 -1.3 +13.4 -10.3 +19.5 +42.1
2014 Quarter 3 41.1 5.8 16.8 11.5 2.4 3.4 0.64 0.47 197.9 29.4 67.4 72.2 9.6 13.9 3.52 1.87
Quarter 4 52.6 8.5 16.8 19.7 3.1 3.1 1.12 0.44 201.3 31.7 67.0 71.8 12.4 12.9 3.67 1.76
2015 Quarter 1 58.3r 9.1r 16.2r 23.8 3.5r 3.9 1.27 0.42 200.3r 30.9r 64.8r 69.4 14.1r 15.0 4.23r 1.69r
Quarter 2 44.2r 5.7r 16.5r 13.9r 2.9r 3.7 1.12 0.48 193.6r 27.0r 65.8r 67.2r 11.6r 14.5 5.52r 1.91r
Quarter 3 p 41.3r 4.7r 17.2r 11.6 2.7r 3.6 0.94r 0.51 196.6r 23.3r 69.0r 71.8r 10.9r 14.5 5.11r 2.03
Per cent change 10 +0.5 -18.4 +2.4 +0.3 +13.6 +5.8 +45.8 +8.5 -0.6 -20.9 +2.4 -0.6 +13.6 +4.7 +45.0 +8.5 1. Includes net foreign trade and stock changes in other solid fuels.2. Inland deliveries for energy use, plus refinery fuel and losses, minus the differences between deliveries and actual consumption at power stations.
3. Includes gas used during production and colliery methane. Excludes gas flared or re-injected and non-energy use of gas.
4. Includes solid renewable sources (wood, straw and waste), a small amount of renewable primary heat sources (solar, geothermal, etc.), liquid biofuels, landfill gas and sewage gas.
5. Bioenergy & waste introduced as a separate category from March 2014 - see special feature article in the March 2014 edition of Energy Trends at:
www.gov.uk/government/collections/energy-trends-articles
6. Includes natural flow hydro, but excludes generation from pumped storage stations.
7. Not seasonally adjusted or temperature corrected.
8. Coal and natural gas are temperature corrected; petroleum, bioenergy and waste, and primary electricity are not temperature corrected.9. For details of temperature correction see the June and September 2011 editions of Energy Trends; Seasonal and temperature adjustment factors were reassessed in June 2013www.gov.uk/government/collections/energy-trends
10. Percentage change between the most recent quarter and the same quarter a year earlier.
10D
ecember 2015

1 TOTAL ENERGYTable 1.3a Supply and use of fuels
Thousand tonnes of oil equivalent
2013 2013 2014 2014 2014 2014 2015 2015 2015
2013 2014
per cent change 1
3rd quarter
4th quarter
1st quarter
2nd quarter
3rd quarter
4th quarter
1st quarter
2nd quarter
3rd quarter p
per cent change 1
SUPPLY
Indigenous production 114,908 112,910 -1.7 25,567 29,545 30,719 28,592 24,546 29,052 31,285r 31,609r 27,470 +11.9 Imports 178,596 164,770 -7.7 40,120 44,983 43,792 39,202 38,187 43,589 43,393r 35,621r 37,494 -1.8 Exports -76,129 -70,704 -7.1 -18,312 -17,903 -17,971 -18,289 -16,968 -17,476 -16,352r -19,585r -20,433 +20.4 Marine bunkers -2,691 -2,484 -7.7 -684 -629 -636 -599 -618 -630 -506r -659r -685 +10.8
Stock change2 +32 -3,525 -2,129 +467 +1,761 -2,998 -2,239 -49 2,519r -701r -531 Primary supply 214,716 200,967 -6.4 44,563 56,462 57,666 45,908 42,907 54,486 60,340r 46,285r 43,315 +1.0
Statistical difference3 -298 -448 -25 -33 -34 -161 -267 15 24r -39r 9
Primary demand 215,014 201,415 -6.3 44,588 56,495 57,700 46,069 43,174 54,471 60,316r 46,324r 43,306 +0.3 Transfers4 -5 -3 -7 7 -1 -5 6 -2 28r 0r 4
TRANSFORMATION -48,153 -43,689 -9.3 -11,000 -12,393 -12,144 -10,403 -9,948 -11,192 -12,041r -9,557r -9,114 -8.4 Electricity generation -44,071 -39,429 -10.5 -9,994 -11,272 -10,969 -9,358 -8,857 -10,244 -10,961r -8,603r -8,322 -6.0 Heat generation -1,153 -1,132 -1.8 -218 -302 -343 -251 -225 -313 -343 -251 -225 -0.0 Petroleum refineries -67 -349 (+) -33 -89 -86 -128 -137 3 -15r -10r -19 -86.2 Coke manufacture -446 -334 -25.1 -146 -113 -86 -77 -85 -86 -48r -24r -46 -46.3 Blast furnaces -2,376 -2,379 +0.1 -601 -606 -644 -573 -626 -537 -665r -647r -485 -22.5 Patent fuel manufacture -40 -66 +66.7 -9 -11 -17 -17 -18 -15 -10 -22r -17 -7.8 Energy industry use 12,539 11,619 -7.3 3,047 2,972 3,047 2,877 2,755 2,940 3,197r 3,097r 2,990 +8.5
Losses 3,242 3,262 +0.6 673 826 933 713 704 913 993r 651r 659 -6.3
FINAL CONSUMPTION 151,074 142,843 -5.4 29,872 40,331 41,552 32,088 29,784 39,419 44,089r 33,036r 30,557 +2.6 Iron & steel 1,348 1,357 +0.7 331 348 356 347 340 314 369r 354r 315 -7.5 Other industries 22,888 22,629 -1.1 5,084 5,926 6,185 5,265 5,150 6,029 6,342r 5,135r 5,045 -2.0 Transport 53,563 54,177 +1.1 13,832 13,669 12,692 13,646 14,176 13,663 12,738r 13,819r 14,382 +1.5 Domestic 44,578 38,162 -14.4 4,570 12,881 14,739 6,606 4,449 12,368 16,254r 7,367r 4,726 +6.2 Other Final Users 20,949 18,957 -9.5 4,028 5,733 5,721 4,234 3,838 5,164 6,306r 4,325r 4,073 +6.1 Non energy use 7,749 7,561 -2.4 2,027 1,775 1,860 1,989 1,830 1,882 2,079r 2,037r 2,016 +10.1
DEPENDENCY5
Net import dependency 47.1% 46.2% 48.2% 47.4% 44.3% 45.0% 48.7% 47.4% 44.4%r 34.2%r 38.8%
Fossil fuel dependency 85.9% 84.5% 83.5% 85.7% 85.8% 83.3% 83.2% 85.4% 84.3%r 81.5% 81.2%
Low carbon share 13.1% 14.2% 15.1% 13.5% 13.1% 15.3% 15.2% 13.5% 14.7%r 17.0%r 17.1%
1. Percentage change between the most recent quarter and the same quarter a year earlier; (+) represents a positive percentage change greater than 100%.
2. Stock change + = stock draw, - = stock build.
3. Primary supply minus primary demand.
4. Annual transfers should ideally be zero. For manufactured fuels differences occur in the rescreening of coke to breeze.
For oil and petroleum products differences arise due to small variations in the calorific values used.
5. See article in the December 2010 edition of Energy Trends at:
http://webarchive.nationalarchives.gov.uk/20130109092117/http://www.decc.gov.uk/en/content/cms/statistics/publications/trends/trends.aspx
11D
ecember 2015

1 TOTAL ENERGYTable 1.3b Supply and use of fuels Thousand tonnes of oil equivalent
Co
al
Man
ufa
ctu
red
fue
ls4
Pri
mar
y o
il
Pe
tro
leu
m
Pro
du
cts
Na
tura
l ga
s5
Bio
ener
gy
&
wa
ste
6
Pri
ma
ry
ele
ctr
icit
y
Ele
ctr
icit
y
He
at
so
ld
Co
al
Man
ufa
ctu
red
fue
ls4
Pri
mar
y o
il
Pe
tro
leu
m
Pro
du
cts
Na
tura
l ga
s5
Bio
ener
gy
&
wa
ste
6
Pri
ma
ry
ele
ctr
icit
y
Ele
ctr
icit
y
He
at
so
ld
SUPPLY Indigenous production 1,896 - 8,968 - 8,013 1,624 4,045 - - 907 - 11,418 - 8,810 1,798 4,537 - -
Imports 5,320 201 15,292 8,295 7,687 872 - 519 - 2,891 153 14,994 9,211 8,672 1,044 - 529 -
Exports -84 -20 -7,576 -5,688 -3,448 -100 - -52 - -78 -49 -9,017 -6,711 -4,435 -121 - -22 -
Marine bunkers - - - -618 - - - - - - - - -685 - - - - - Stock change1 -1,437 -54 +218 -360 -607 - - - - +908 +16 +598 -685 -1,369 - - - -
Primary supply 5,695 127 16,902 1,629 11,645 2,396 4,045 467 - 4,629 120 17,994 1,130 11,678 2,722 4,537 507 -
Statistical difference2 -58 -2 -36 -118 -59 +19 - -13 - -16 -1 -3 +1 +57 - - -28 -Primary demand 5,753 129 16,938 1,747 11,704 2,378 4,045 480 - 4,645 121 17,997 1,129 11,621 2,722 4,537 535 -
Transfers3 - 10 -357 +357 -3 - -643 +643 - - +9 -290 +294 -9 - -938 +938 -TRANSFORMATION -5,307 371 -16,581 16,286 -5,798 -1,708 -3,402 5,868 323 -4,210 274 -17,707 17,514 -5,170 -2,083 -3,598 5,543 323
Electricity generation -3,911 -233 - -123 -5,361 -1,695 -3,402 5,868 - -3,170 -156 - -138 -4,732 -2,071 -3,598 5,543 -
Heat generation -67 -13 - -18 -438 -13 - - 323 -67 -13 - -18 -438 -13 - - 323
Petroleum refineries - - -16,581 16,444 - - - - - - - -17,707 17,688 - - - - -
Coke manufacture -961 876 - - - - - - - -677 631 - - - - - - -
Blast furnaces -317 -309 - - - - - - - -251 -234 - - - - - - -
Patent fuel manufacture -51 50 - -17 - - - - - -45 46 - -18 - - - - -
Energy industry use 0 205 - 1,042 939 - - 498 71 - 163 - 1,192 1,065 - - 498 71 Losses - 80 - - 142 - - 482 - - 63 - - 162 - - 434 -
FINAL CONSUMPTION 446 226 - 17,347 4,821 670 - 6,011 263 435 178 - 17,745 5,215 638 - 6,083 263
Iron & steel 10 136 - 2 112 - - 81 - 10 109 - 4 113 - - 78 -
Other industries 338 11 - 1,044 1,470 140 - 1,925 224 327 4 - 955 1,490 142 - 1,902 224
Transport 2 - - 13,738 - 344 - 92 - 3 - - 14,027 - 261 - 92 -
Domestic 90 46 - 456 1,791 126 - 1,936 4 87 42 - 427 2,070 161 - 1,936 4
Other final users 6 - - 427 1,332 60 - 1,978 35 8 - - 454 1,425 75 - 2,075 35
Non energy use - 33 - 1,681 117 - - - - - 22 - 1,877 117 - - - -
1. Stock fall +, stock rise -.
2. Primary supply minus primary demand.
3. Annual transfers should ideally be zero. For manufactured fuels differences occur in the rescreening of coke to breeze.
For oil and petroleum products differences arise due to small variations in the calorific values used.
4. Includes all manufactured solid fuels, benzole, tars, coke oven gas and blast furnace gas.
5. Inludes colliery methane.
6. Includes geothermal, solar heat and biofuels for transport; wind and wave electricity included in primary electricity figures.
2015 Quarter 3 p2014 Quarter 3
12D
ecember 2015

Solid Fuels and Derived Gases
13 December 2015
Section 2 - Solid Fuels and Derived Gases Chart 2.1 Coal supply
0
2
4
6
8
10
12
14
16
18
Q12012
Q2 Q3 Q4 Q12013
Q2 Q3 Q4 Q12014
Q2 Q3 Q4 Q12015
Q2 Q3
Mil
lio
n T
on
nes
Deep-mined Surface mining Imports
Table 2A Coal imports by origin
Thousand Tonnes
2013 2014
2014 2015 Q3 Q3p
European Union 693 1,228 230 98
Russia 18,053 20,250 3,199 1,144Colombia 10,790 12,196 2,006 1,206USA 11,749 11,494 1,703 1,429Australia 2,360 2,147 430 141Other Countries 1,170 2,087 458 347
Total imports 44,815 49,402 8,026 4,366
Provisional figures for the third quarter of 2015 show that coal production at 1.5 million tonnes (a new record low) was 52 per cent lower than the third quarter of 2014. This was due to mines closing and some other mines producing less coal as they are coming to the end of operation. See tables 2B and 2C for a list of remaining operating mines.
Imports of coal in the third quarter of 2015 were 46 per cent lower than in the third quarter of 2014 at 4.4 million tonnes. This was the lowest value for over 17 years. The decrease reflects the fact that consumption by electricity generators was down. The decline was due to the temporary closure of some plants due to market conditions, along with an increase in the carbon price floor from April 2015, and a third unit of Drax being converted to biomass in July 2015.
In the third quarter of 2015, USA and Colombia overtook Russia as the largest suppliers of UK coal imports, providing 33 per cent and 28 per cent of total imports respectively. Steam coal imports at 3.4 million tonnes accounted for 77 per cent of total coal imports.
Coking coal imports at 1.0 million tonnes accounted for 22 per cent of total coal imports.
Key results show: Overall coal production of 1.5 million tonnes was down 52 per cent (-1.6 million tonnes) compared to the third quarter of 2014 with record lows in deep-mined (down 54 per cent, -0.5 million tonnes) and surface mining output (down 51 per cent, -1.1 million tonnes). (Chart 2.1) Coal imports were down 46 per cent (-3.7 million tonnes) on levels shown in the third quarter of 2014, as demand for coal fell. (Charts 2.1 and 2.2)
Demand for coal by electricity generators in the third quarter of 2015 fell to a new record low and was 18.9 per cent (-1.2 million tonnes) lower than demand in the third quarter of 2014. (Chart 2.3)
Total stock levels were 17.0 million tonnes, down 8.6 per cent (-1.6 million tonnes) compared to third quarter of 2014, and 1.4 million tonnes lower than in the second quarter of 2015. (Chart 2.4)

Solid Fuels and Derived Gases
December 2015 14
Chart 2.2 Steam coal imports by origin
Russia23%
Colombia42%
USA25%
EU3%
Other countries
7%
Q32015
Chart 2.3 Coal consumption
0
2
4
6
8
10
12
14
16
18
Q12012
Q2 Q3 Q4 Q12013
Q2 Q3 Q4 Q12014
Q2 Q3 Q4 Q12015
Q2 Q3
Mil
lio
n T
on
nes
Electricity Generators
Generators Trend (= average of 4 quarters ending)
Colleries, coke ovens and other conversion industries
Final Consumers
All but ten per cent of UK steam coal imports came from just three countries: Colombia (42 per cent), USA (25 per cent), and Russia (23 per cent). Imports of steam coal from Russia have fallen by 49 per cent since the second quarter of 2015 and 71 per cent since the third quarter of 2014.
Total demand for coal in the third quarter of 2015, fell to a new record low of 7.1 million tonnes and was 19.2 per cent lower than in the third quarter of 2014. Consumption by electricity generators was down by 18.9 per cent to 5.0 million tonnes (a new record low). Electricity generators accounted for 71 per cent of total coal use in the third quarter of 2015; unchanged from a year earlier. Coal used on coke manufacture fell 30 per cent in the third quarter of 2015 to 0.9 million tonnes (a new record low). This was due to Monckton (the sole dedicated coke plant) ceasing production on 16 December 2014, problems at Scunthorpe steelworks and SSI steelworks at Redcar ceasing production in mid-September. Sales to industrial users fell by 3.0 per cent in the third quarter of 2015 and sales to other final consumers (including domestic) decreased by 1.0 per cent to 0.1 million tonnes during the third quarter of 2015.

Solid Fuels and Derived Gases
15 December 2015
Chart 2.4 Coal stocks
0
2
4
6
8
10
12
14
16
18
20
22
Q12012
Q2 Q3 Q4 Q12013
Q2 Q3 Q4 Q12014
Q2 Q3 Q4 Q12015
Q2 Q3
Mil
lio
n T
on
nes
Electricity Generators Other Distributed Undistributed
Table 2B Remaining operating deep mines as at the end of September 2015
Name Ayle Colliery
Eckington Colliery
Hill Top Colliery
Nant Hir No.2 Colliery
Dan-y-Graig No.4 Colliery
Kellingley Colliery
Aberpergwm Colliery
Monument Colliery
In 2015 two deep mines closed (Hatfield Colliery and Thoresby Colliery) and four surface mines closed (Earlseat, Laigh Glenmuir Site, Butterwell Disposal and Lodge House).
Coal stocks showed a fall of 1.4 million tonnes during the third quarter of 2015 compared to the end of June 2015, and stood at 17.0 million tonnes. Coal stocks were 1.6 million tonnes lower than at the end of September 2014. The level of coal stocks at power stations at the end of the third quarter of 2015 was 14.1 million tonnes, 2.1 million tonnes lower than at the end of September 2014, as stocks were used for generation rather than imports. Stocks held by coke ovens were 0.8 million tonnes at the end of the third quarter of 2015, 0.02 million tonnes higher than stock levels at the end of the September 2014. Stocks held by coal producers (undistributed stocks) decreased during the third quarter of 2015 to 0.7 million tonnes and were 0.1 million tonnes lower than at the end of September 2014.
Table 2C Remaining operating surface mines as at the end of September 2015
Name Glan Lash
East Pit
Nant Helen
Selar
Brenkley Lane
Rusha Site
Shotton
Glenmuckloch Site
Greenburn Project
Comrie Colliery Site
Ffos-y-Fran Land Reclamation Scheme
Muir Dean Site
Netherton
Tower Colliery Surface Mining Site
Minorca
Potland Burn
Broken Cross Site
House of Water
Relevant tables 2.1: Supply and consumption of coal………………………………………………………...........Page 16 2.2: Supply and consumption of coke oven coke, coke breeze and other manufactured solid fuels…………………………………………………………...Page 17 2.3: Supply and consumption of coke oven gas, blast furnace gas, benzole and tars……….Page 18
Contact for further information:
Chris Michaels, Coal statistics, Tel: 0300 068 5050, E-mail: [email protected]

2 SOLID FUEL AND DERIVED GASESTable 2.1 Supply and consumption of coal
Thousand tonnes2013 2013 2014 2014 2014 2014 2015 2015 2015
2013 20143rd
quarter4th
quarter1st
quarter2nd
quarter3rd
quarter4th
quarter1st
quarter2nd
quarter3rd
quarter p
SUPPLY
Indigenous production 12,767 11,648 -8.8 2,858 2,731 2,833 3,009 3,030 2,776 3,040 2,410r 1,455 -52.0 Deep mined 4,089 3,685 -9.9 785 829 932 936 916 901 980 879 419 -54.3
Surface mining2 8,584 7,962 -7.2 2,011 1,902 1,902 2,072 2,113 1,875 2,060 1,532r 1,036 -51.0
Other sources3 95 - -100.0 62 - - - - - - - -
Imports4 49,402 41,765 -15.5 12,540 11,983 12,653 10,631 8,026 10,454 11,507 5,154r 4,366 -45.6
Exports5 593 425 -28.4 95 185 129 79 112 105 102 75r 103 -8.1
Stock change6 -1,328 -4,330 -2,383 +1,074 +536 -2,606 -2,175 -84 -661r +1,028r +1,363 Total supply 60,248 48,658 -19.2 12,920 15,603 15,894 10,955 8,768 13,041 13,785r 8,518r 7,081 -19.2 Statistical difference -177 +158 -58 -26 +35 +25 +33 +65 -16r -25r +10
Total demand 60,425 48,500 -19.7 12,977 15,630 15,859 10,930 8,735 12,976 13,800r 8,542r 7,071 -19.1 TRANSFORMATION 57,607 45,665 -20.7 12,335 14,889 15,137 10,292 8,084 12,153 13,090 7,833 6,436 -20.4 Electricity generation 50,041 38,400 -23.3 10,349 12,933 13,248 8,439 6,223 10,490 11,320 6,147 5,045 -18.9
Heat generation7 609 516 -15.2 129 157 151 117 107 140 151 117 107 - Coke manufacture 5,288 4,977 -5.9 1,404 1,331 1,270 1,287 1,264 1,156 1,165 1,053 890 -29.6 Blast furnaces 1,411 1,513 +7.3 393 399 411 377 416 309 423 447 330 -20.7 Patent fuel manufacture 259 259 +0.1 60 69 58 72 72 57 31 69 64 -11.5 Energy industry use 3 1 -78.0 0 0 0 0 - - - - -
FINAL CONSUMPTION 2,816 2,834 +0.6 642 740 722 638 652 823 710r 710r 635 -2.6 Iron & steel 53 54 +2.0 13 13 14 14 13 13 14 14 14 +2.8 Other industries 2,078 2,186 +5.2 481 546 558 485 507 636 516r 549r 491 -3.1 Domestic 636 547 -14.1 137 166 138 126 119 163 165r 131r 115 -3.9
Other final users 48 48 -1.0 11 15 13 13 12 10 15r 17r 15 +26.6 Stocks at end of periodDistributed stocks 13,591 17,944 +32.0 14,540 13,591 13,085 15,672 17,719 17,944 18,551 17,408r 16,266 -8.2 Of which:
Major power producers8 11,871 17,091 +44.0 12,336 11,871 11,350 13,858 16,275 17,091 16,573 15,264 14,137 -13.1 Coke ovens 518 795 +53.3 952 518 323 473 739 795 836 985 762 +3.1 Undistributed stocks 696 576 -17.2 867 696 712 731 860 576 829r 944r 722 -16.0
Total stocks914,287 18,520 +29.6 15,407 14,287 13,797 16,403 18,578 18,520 19,380r 18,351r 16,988 -8.6
1. Percentage change between the most recent quarter and the same quarter a year earlier.
2. The term 'surface mining' has now replaced opencast production. Opencast production is a surface mining technique.
3. Not produced since 2013 as the only mine producing slurry has ceased trading
4. For a detailed breakdown of UK Imports by country and grade of coal refer to Table 2.4 Coal imports (internet table only).
5. Trade is counted as an export under three conditions, when it is recorded as an import and is subsequently exported; it enters the UK port with the intention of being imported but due
to a change of ownership at the port it is exported without having cleared the port; and when items leave the warehouse and are exported. Trade is not classified as exports when it is
resting at a UK port and the UK is not the intended final destination.
6. Stock change + = stock draw, - = stock build.
7. Heat generation is based on an annual figure and is then split over a quarterly period. The 2015 heat generation will not be published until the end of July 2016. Therefore, the 2014 figure
is used as an estimate for 2015.
8. This includes stocks held at ports.
9. For some quarters, closing stocks may not be consistent with stock changes, due to additional stock adjustments
per cent change
per cent change 1
16D
ecember 2015

2 SOLID FUEL AND DERIVED GASESTable 2.2 Supply and consumption of coke oven coke, coke breeze and other manufactured solid fuels
Thousand tonnes2013 2013 2014 2014 2014 2014 2015 2015 2015
2013 2014
3rd quarter
4th quarter
1st quarter
2nd quarter
3rd quarter
4th quarter
1st quarter
2nd quarter
3rd quarter p
SUPPLY
Indigenous production 4,136 3,906 -5.6 1,053 1,047 994 1,025 990 897 895 868 727 -26.5 Coke Oven Coke 3,769 3,601 -4.4 969 949 919 940 912 830 854 800 658 -27.8
Coke Breeze 32 31 -2.6 8 8 8 8 8 7 5 5 4 -48.5 Other MSF 336 274 -18.4 76 90 67 77 70 60 36 64 65 -7.4
Imports 834 940 +12.7 235 167 204 202 283 251 302 290 215 -24.1 Exports 117 112 -4.3 20 26 40 30 29 13 23 74 69 (+)
Stock change1 -122r -211 +73.0 -111 -4 +42 -92 -75 -86 +73r +31r +23 Transfers 0 -5 0 -0 -1 -13 9 - -2 -1 - -100.0
Total supply 4,730 4,519 -4.5 1,157 1,184 1,199 1,093 1,177 1,049 1,246r 1,115r 896 -23.9
Statistical difference -1 -0 -0 -0 -0 - -0 0 -0 - -0
Total demand 4,732 4,519 -4.5 1,157 1,184 1,200 1,093 1,177 1,049 1,246r 1,115r 896 -23.9
TRANSFORMATION 3,713 3,585 -3.5 913 912 958 856r 929 842 1,009r 908r 705 -24.1 Coke manufacture - - - - - - - - - - -
Blast furnaces 3,713 3,585 -3.5 913 912 958 856r 929 842 1,009r 908r 705 -24.1
Energy industry use - - - - - - - - - - -
FINAL CONSUMPTION 1,019 934 -8.3 244 273 242 237 248 207 237 207 191 -23.3 Iron & steel 626 634 +1.3 159 169 165 161 174 134 165 151 125 -28.1 Other industries 83 45 -46.4 22 23 11 10 10 14 10 6 6 -33.7 Domestic 310 256 -17.5 63 81 66 66 64 59 62 50 59 -8.5 Stocks at end of period2
714 719 +0.8 599 714 465 525 624 719 543r 462r 399 -36.0 1. Stock change + = stock draw, - = stock build.2. For some quarters, closing stocks may not be consistent with stock changes, due to additional stock adjustments
3. Percentage change between the most recent quarter and the same quarter a year earlier; (+) represents a positive percentage change greater than 100%.
per cent change
per cent change 3
17
Decem
ber 2015
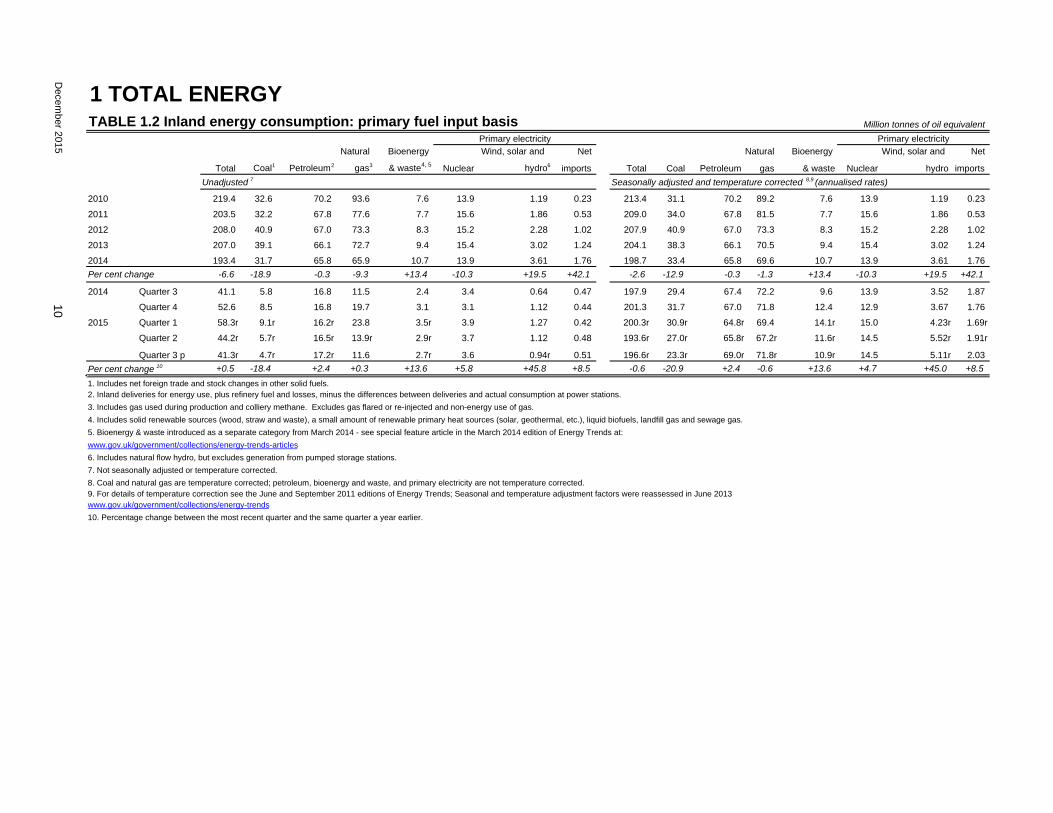
2 SOLID FUEL AND DERIVED GASESTable 2.3 Supply and consumption of coke oven gas, blast furnace gas, benzole and tars
GWh2013 2013 2014 2014 2014 2014 2015 2015 2015
2013 20143rd
quarter4th
quarter1st
quarter2nd
quarter3rd
quarter4th
quarter1st
quarter2nd
quarter3rd
quarter p
SUPPLY
Indigenous production 25,686 25,441 -1.0 6,675 6,563 6,628 6,393 6,673 5,748 6,995r 6,315r 4,972 -25.5
Coke oven gas 8,479 8,473 -0.1 2,216 2,119 2,132 2,211 2,199 1,931 2,264r 2,030r 1,595 -27.5
Blast furnace gas 15,576 15,386 -1.2 4,043 4,028 4,075 3,762 4,094 3,455 4,359 3,941r 3,117 -23.9
Benzole & tars 1,630 1,582 -3.0 417 416 421 420 380 361 371 344r 260 -31.7
Transfers 61 140 (+) 14 5 9 25 40 66 92 96r 99 (+)
Total supply 25,746 25,581 -0.6 6,689 6,568 6,637 6,418 6,713 5,813 7,088r 6,411r 5,071 -24.5
Statistical difference +16 -35 -0 +2 -8 -8 -19 +0 -3 +4r -13
Total demand 25,730 25,616 -0.4 6,690 6,566 6,645 6,426 6,732 5,813 7,090r 6,407r 5,084 -24.5
TRANSFORMATION 11,522 11,253 -2.3 2,874 2,836 2,915 2,792 2,858 2,688 3,226 2,512r 1,967 -31.2
Electricity generation 10,925 10,655 -2.5 2,725 2,687 2,765 2,642 2,709 2,539 3,077 2,363r 1,818 -32.9
Heat generation2 598 598 - 149 149 149 149 149 149 149 149 149 -
Energy industry use 9,041 9,331 +3.2 2,358 2,323 2,463 2,333 2,381 2,154 2,581 2,358r 1,894 -20.4
Losses 2,500 2,517 +0.7 755 697 579 561 926 452 674 912r 737 -20.4
FINAL CONSUMPTION 2,667 2,515 -5.7 703 709 689 740 567 519 609r 625r 486 -14.2
Iron & steel 862 768 -10.9 244 248 236 276 143 114 238r 281r 227 +58.8
Other industries3 174 165 -5.3 42 45 32 45 44 44 - - - -100.0
Non-Energy Use41,630 1,582 -3.0 417 416 421 420 380 361 371 344r 260 -31.7
1. Percentage change between the most recent quarter and the same quarter a year earlier; (+) represents a positive percentage change greater than 100%.
2. For Heat generation, the 2015 figures currently shown are the 2014 figures carried forward - these will be updated in July 2016.
3. The main consumer of gases Monckton closed in December 2014.
4. From 2009, unclassified final consumption for benzole and tars has been recorded under non energy use
per cent change
per cent change 1
18D
ece
mb
er 2
01
5

Oil and Oil Products
19 December 2015
Section 3 - Oil and Oil Products Chart 3.1 Production and trade of crude oil and NGLs
Indigenous UK crude oil production was 29 per cent higher in Q3 of 2015 compared with Q3 2014. Crude oil production in August last year was particularly low, largely because of planned maintenance at Buzzard, the UK’s largest oil field but also due to the Golden Eagle field coming online within the last 12 months. Production of NGLs was relatively stable, with a slight increase of 0.9 per cent on last year. Imports of crude oil and NGL's decreased by 5.6 per cent compared with the same quarter a year earlier as UK indigenous production accounted for a larger share of refinery demand. Net imports of primary oils (crude, NGLs and feedstocks) decreased to 5.5 million tonnes in Q3 2015.
Key results show:
Total indigenous UK production of crude oil and Natural Gas Liquids (NGL) in Q3 2015 was 27 per cent higher than a year ago. UK indigenous production of crude and NGLs reached the lowest level in Q3 2014 than in any other quarter since 1977 but has since stabilised. Production in the year to date is up 10.9 per cent on last year. (Chart 3.1)
Net imports of primary oils (crude oil, NGLs and process oils) in Q3 2015 were 5.5 million tonnes (down 23 per cent) due to higher indigenous production. These met around 34 per cent of the UK's refinery demand. (Chart 3.3)
Refinery production in Q3 2015 was up 7.3 per cent on the same quarter of last year. This increase is partially driven by low crude prices. Whilst domestic demand remains stable there is a strong market for exports, as evidenced by the notable increase in motor spirit exports in recent months. Production in the year to date has been fairly stable compared to last year (down 1.5 per cent in year to Q3). (Chart 3.2)
Imports of petroleum products increased by 10.7 per cent on last year and exports increased by 17.3 per cent due to higher refinery production. However, the UK was a net importer of petroleum products in Q3 2015, for the ninth consecutive quarter, by 2.3 million tonnes, following a long period where the UK was generally a net exporter of petroleum products. (Chart 3.2)
Total deliveries of the key transport fuels were up slightly on the same period last year (up 2.4 per cent). Diesel deliveries increased by 4.8 per cent in line with a long term trend, diesel share of road fuels is now 66 per cent, up 15 percentage points on 10 years ago. Deliveries of aviation turbine fuel were up by 1.5 per cent. (Chart 3.5)
Overall stocks of crude oil and petroleum products, at 15.0 million tonnes, were up 1.0 million tonnes on Q3 2014. (Chart 3.7)

Oil and Oil Products
December 2015 20
Chart 3.2 Production and trade of petroleum products
Indigenous production of petroleum products at refineries in Q3 2015 was 7.3 per cent higher compared with a year earlier. The substantial increase in refinery production is driven partially by low crude prices. Whilst domestic demand remains stable there is a strong market for exports, as evidenced by a sharp increase in motor spirit exports in recent months. Motor spirit production showed the largest absolute change, increasing by 0.6 million tonnes, 16.6 per cent, on Q3 2014. Imports of petroleum products were up on Q3 2014 by 10.7 per cent whilst exports were up by 17.3 per cent due to the increase in production. The UK remained a net importer of petroleum products in the third quarter of 2015 by 2.3 million tonnes. Imports of motor spirit and road diesel (DERV) showed the largest absolute increases, 0.3 million tonnes each, up by 41.2 per cent and 9.4 per cent. For exports, motor spirit showed the largest absolute increase, up by around 0.9 million tonnes (51.7 per cent).
Chart 3.3 Overall trade of crude oil and NGLs, and petroleum products
The UK’s overall net import dependence for primary oils (Crude, NGL’s and feedstocks) was 34 per cent in Q3 2015 and down 10 percentage points on Q3 2014.
Crude oil import dependence has decreased in 2015 as a new field has come online. In 2014 there were maintenance issues that dented UK indigenous production of crude, which have not affected this year’s production so adversely. Recent increased refinery activity has also helped push up demand for primary oils. In Q3 2015 the UK was a net importer of petroleum products, by 2.3 million tonnes, similar to levels Q3 2014. There have now been nine consecutive quarters where the UK has imported more petroleum products than it exported. In 2013 the UK was a net importer, the first year this has happened since 1984 when there was industrial action in the coal industry. Data for the year to date indicate that net import dependency is now normal. The UK remains structurally short in diesel road fuel and aviation fuel, with a net import dependence rate of 42 and 63 per cent respectively

Oil and Oil Products
21 December 2015
Chart 3.4 Final consumption of oil
Chart 3.5 Demand for key transport fuels
Final consumption in the oil sector is slightly seasonal with different products peaking at different times of the year. Consumption of domestic fuels for heating peaks in Q1 and Q4 each year, and consumption of aviation fuels is higher in Q2 and Q3. Overall, final consumption of petroleum products in Q3 2015 was up by 2.2 per cent compared to Q3 2014. Domestic consumption, primarily used for heating, was lower by 6.0 per cent, and for industry was down nearly 10 per cent. Non-energy use was up by 11.4 per cent and transport was up by 2.1 per cent. Transport accounts for just over three-quarters of UK final consumption. Transport fuels are examined in more detail below. Total deliveries of key hydrocarbon transport fuels in Q3 2015 were higher by 2.4 per cent than the same quarter of 2014. Consumption of motor spirit decreased by 1.0 per cent but road diesel consumption was up by 4.8 per cent. This is part of an on-going trend as more motorists switch from unleaded to diesel. Diesel’s share of road fuel stands at 66 per cent. Deliveries of aviation turbine fuel were up by 1.5 per cent on the same quarter last year and exceeded demand for motor spirit for the second time. (These figures are based on the hydrocarbon element; total deliveries of motor spirit including the blended bio-fuels are slightly higher).

Oil and Oil Products
December 2015 22
Chart 3.6 Hypermarket share of road fuel sales
Chart 3.7 UK oil stocks
On an overall basis, supermarket outlets accounted for 43.4 per cent of total retail sales. This is up slightly on the third quarter of 2014 where supermarkets accounted for 43.0 per cent of retail sales. Supermarkets accounted for 44 per cent of motor spirit (unleaded) and 43 per cent of DERV (diesel) in the third quarter of 2015, stable for motor spirit and up one percentage point for DERV. The Supermarket figures refer to Asda, Morrisons, Sainsbury’s and Tesco only.
At the end of Q3 2015, UK total oil stocks were up on the end of Q3 2014, by 6.8 per cent. Stocks of crude oil and process oils were down slightly by 0.9 per cent (0.1 million tonnes) than a year earlier, while stocks of oil products were up 14.3 per cent (1.0 million tonnes). Stocks of petroleum products held in the UK were higher by 5.3 per cent at the end of September 2015 than they were a year previously (by 0.4 million tonnes). There was also an increase of 10.2 per cent in petroleum product stocks held abroad for the UK (under bilateral agreements). Chart 3.7 combines stocks of products with the product equivalent of stocks of crude oil to give an overall level of UK stocks of key products. The UK is required to hold 61 days of stock for emergency purposes, and there is additional stock (in the region of 10 to 15 days) held by companies as part of their day to day operations

Oil and Oil Products
23 December 2015
Chart 3.8 Drilling activity on the UKCS
There were 8 exploration and appraisal wells started offshore in the third quarter of 2015, the same number as in the corresponding quarter of 2014. There were 42 development wells drilled offshore in the third quarter of 2015, compared to 33 in the corresponding quarter of 2014. There were no exploration and appraisal wells started onshore in the third quarter of 2015, compared to 2 in the corresponding quarter of 2014. There was 1 development well drilled onshore in the third quarter of 2015, compared to 4 in the corresponding quarter of 2014.
Relevant tables 3.1: Supply and use of crude oil, natural gas liquids and feedstocks…………………………. Page 24 3.2: Supply and use of petroleum products……………………………………………………… Page 25 3.3: Supply and use of petroleum products - annual data……………………………………… Page 26 3.4: Supply and use of petroleum products - latest quarter…………………………………… Page 27 3.5: Demand for key petroleum products………………………………………………………… Page 28 3.6: Stocks of petroleum at end of period………………………………………………………… Page 29 3.7: Drilling activity on the UK Continental Shelf………………………………………………… Page 30
Contacts for further information:
Shyam Lakhani Natalie Cartwright Upstream Oil (primary oils) Downstream Oil (petroleum products) Oil and Gas Statistics Team Oil and Gas Statistics Team Tel. 0300 068 6865 Tel. 0300 068 5260 E-mail: [email protected] E-mail: [email protected]

3 OIL AND OIL PRODUCTSTable 3.1 Supply and use of crude oil, natural gas liquids and feedstocks1
Thousand tonnes
2013 2013 2014 2014 2014 2014 2015 2015 2015
2013 2014
per cent change
3rd quarter
4th quarter
1st quarter
2nd quarter
3rd quarter
4th quarter
1st quarter
2nd quarter
3rd quarter p
per cent change 8
SUPPLY
Indigenous production2 40,646 39,928 -1.8 9,108 10,541 11,052 10,278 8,195 10,402 10,532 11,763r 10,441 +27.4 Crude oil 38,456 37,474 -2.6 8,647 10,074 10,369 9,634 7,692 9,779 9,954 11,077r 9,934 +29.1
NGLs3 2,190 2,453 +12.0 461 466 683 644 503 623 578r 686r 508 +0.9
Imports4 59,137 53,798 -9.0 15,195 13,056 13,118 12,521 13,984 14,174 11,534r 12,383r 13,699 -2.0 Crude oil & NGLs 52,470 48,890 -6.8 13,533 11,284 11,619 11,340 12,831 13,101 10,465r 11,245r 12,116 -5.6 Feedstocks 6,667 4,907 -26.4 1,662 1,773 1,499 1,182 1,153 1,074 1,069 1,137 1,583 +37.3
Exports4 33,105 30,946 -6.5 7,452 8,318 8,017 7,474 6,924 8,532 7,566r 9,384r 8,241 +19.0 Crude Oil & NGLs 31,670 29,887 -5.6 7,028 8,065 7,796 7,192 6,651 8,248 7,072r 8,892r 7,612 +14.4 Feedstocks 1,436 1,060 -26.2 424 253 221 282 273 284 494 493r 630 (+)
Stock change5 +724 -592 +615 -224 -288 +63 +199 -566 +88r -353r +547
Transfers6 -1,758 -1,361 -507 -132 -338 -296 -288 -438 -83r -381r -225
Total supply 65,644 60,826 -7.3 16,960 14,922 15,527 15,093 15,165 15,041 14,506r 14,027r 16,220 +7.0
Statistical difference7 -44 +3 +51 +20 +21 -2 -24 +8 -10r +13r +0
Total demand 65,687 60,823 -7.4 16,909 14,903 15,505 15,095 15,189 15,033 14,515r 14,014r 16,220 +6.8 TRANSFORMATION 65,687 60,823 -7.4 16,909 14,903 15,505 15,095 15,189 15,033 14,515r 14,014r 16,220 +6.8 Petroleum refineries 65,687 60,823 -7.4 16,909 14,903 15,505 15,095 15,189 15,033 14,515r 14,014r 16,220 +6.8
1. As there is no use made of primary oils and feedstocks by industries other than the oil and gas extraction and petroleum refining industries, other industry headings have not been included in this table. As such, this table is a summary of the activity of what is known as the Upstream oil industry.2. Includes offshore and onshore production.3. Natural Gas Liquids (NGLs) are condensate and petroleum gases derived at onshore treatment plants.4. Foreign trade as recorded by the Petroleum Industry which may differ from the figures published by HM Revenue and Customs in the Overseas Trade Statistics. Data are subject to further revision as revised information on imports and exports becomes available.5. Stock fall (+), stock rise (-). Stocks include stocks held at refineries, at oil terminals and also those held in tanks and partially loaded vessels at offshore facilities.6. Mostly direct disposals to petrochemical plants. 7. Total supply minus total demand.8. Percentage change between the most recent quarter and the same quarter a year earlier; (+) represents a positive percentage change greater than 100%.
24D
ecember 2015

3 OIL AND OIL PRODUCTSTable 3.2 Supply and use of petroleum products
Thousand tonnes2013 2013 2014 2014 2014 2014 2015 2015 2015
2013 20143rd
quarter 4th
quarter 1st
quarter2nd
quarter3rd
quarter4th
quarter1st
quarter2nd
quarter3rd
quarter p
SUPPLY
Indigenous production2 67,596 62,477 -7.6 17,370 15,280 15,943 15,507 15,472 15,556 15,048r 14,568r 16,603 +7.3 Imports3 28,769 29,055 +1.0 6,758 8,657 6,954 7,353 7,581 7,167 7,591r 8,195r 8,393 +10.7 Exports3 26,910 22,748 -15.5 6,718 6,157 6,353 5,796 5,212 5,387 5,026r 5,225r 6,116 +17.3 Marine bunkers 2,540 2,340 -7.9 645 591 600 563 582 595 472r 616r 642 +10.4 Stock change4 +106 +292 +63 -41 +204 +227 -324 +184 -142r -36r -624
Transfers5 -463 -817 -49 -371 -238 -272 -181 -125 -522r -253r -258
Total supply 66,559 65,920 -1.0 16,778 16,776 15,910 16,456 16,754 16,800 16,478r 16,633r 17,356 +3.6 Statistical difference6 -69 -180 -14 -29 -22 -10 -105 -43 +16r -13r -2
Total demand 66,628 66,100 -0.8 16,791 16,806 15,932 16,467 16,859 16,843 16,461r 16,647r 17,357 +3.0 TRANSFORMATION 722 630 -12.7 187 179 173 153 147 157 154 155r 167 +13.6 Electricity generation 546 471 -13.8 148 131 129 113 110 120 120r 116r 130 +17.8 Heat generation 65 68 +5.6 16 16 17 17 17 17 17 17 17 -0.5 Other Transformation 111 91 -17.8 24 32 27 24 20 20 16 22 21 +4.3 Energy industry use 4,378 3,892 -11.1 1,153 987 996 958 978 960 979 947r 1,112 +13.7 Petrolem Refineries 3,759 3,245 -13.7 999 832 834 796 816 798 817 786r 957 +17.3 Blast Furnaces - - - - - - - - - - -
Others 619 647 +4.4 155 155 162 162 162 162 162 162 155 -4.2 FINAL CONSUMPTION 61,528 61,578 +0.1 15,451 15,640 14,763 15,355 15,734 15,726 15,328r 15,544r 16,078 +2.2 Iron & steel 4 7 +80.3 1 1 1 2 2 2 2 2 4 (+) Other industries 4,013 4,026 +0.3 963 1,057 1,011 984 966 1,065 1,100r 798r 874 -9.6 Transport 47,222 47,648 +0.9 12,173 12,035 11,177 11,988 12,454 12,030 11,275r 12,229r 12,718 +2.1 Domestic 2,580 2,299 -10.9 301 770 764 403 411 721 851r 445r 386 -6.0 Other final users 1,365 1,379 +1.0 342 337 291 333 393 363 389r 385r 414 +5.3 Non energy use 6,344 6,220 -2.0 1,671 1,441 1,518 1,647 1,508 1,546 1,712r 1,685r 1,681 +11.4 1. Percentage change between the most recent quarter and the same quarter a year earlier; (+) represents a positive percentage change greater than 100%.2. Includes refinery production and petroleum gases extracted as products during the production of oil and gas.3. Foreign trade as recorded by the Petroleum Industry which may differ from the figures published by HM Revenue and Customs in the Overseas Trade Statistics. Data are subject for further revision as revised information on imports and exports becomes available.4. Stock fall (+), stock rise (-).5. Mainly transfers from product to feedstock.6. Total supply minus total demand.
per cent change
per cent change 1
25D
ecember 2015

3 OIL AND OIL PRODUCTSTable 3.3 Supply and use of petroleum products - annual data
Thousand tonnes
To
tal
Pet
role
um
P
rod
uct
s
Mo
tor
spir
it
DE
RV
9
Gas
oil1
Avi
atio
n
turb
ine
fuel
Fu
el o
ils
Pet
role
um
gas
es2
Bu
rnin
g o
il
Oth
er
pro
du
cts3
To
tal
Pet
role
um
P
rod
uct
s
Mo
tor
spir
it
DE
RV
9
Gas
oil1
Avi
atio
n
turb
ine
fuel
Fu
el o
ils
Pet
role
um
gas
es2
Bu
rnin
g o
il
Oth
er
pro
du
cts3
SUPPLY Indigenous production4
67,596 17,691 14,831 8,193 4,527 6,574 6,630 2,705 6,445 62,477 15,709 13,726 8,049 4,635 5,409 6,153 2,093 6,702 Imports5 28,769 4,442 10,115 1,208 8,219 620 431 678 3,057 29,055 3,482 11,460 1,423 8,157 1,004 422 619 2,489 Exports5
26,910 10,809 2,843 3,310 970 4,677 1,165 381 2,755 22,748 8,683 1,942 3,463 1,072 4,148 898 164 2,378 Marine bunkers 2,540 - - 1,248 - 1,292 0 - - 2,340 - - 1,280 - 1,059 - - - Stock change6
+106 -356 +46 +91 -20 +93 +11 +52 188 +292 +113 -61 +24 +123 +107 -30 -15 31 Transfers7
-463 +1,606 -253 +250 -519 -401 +23 +447 -1,617 -817 +1,610 -509 +489 -642 -616 +23 +621 -1,793 Total supply 66,559 12,575 21,896 5,185 11,238 916 5,930 3,501 5,318 65,920 12,232 22,674 5,241 11,201 696 5,669 3,154 5,052Statistical difference8 -69 1 -30 11 -4 5 3 -6 -51 -180 -94 -1 -0 -19 -32 -15 -26 5Total demand 66,628 12,574 21,926 5,174 11,242 911 5,926 3,507 5,369 66,100 12,326 22,675 5,241 11,220 728 5,684 3,179 5,046TRANSFORMATION 722 - - 93 - 237 229 - 162 630 - - 114 - 200 225 - 91 Electricity generation 546 - - 88 - 185 222 - 51 471 - - 109 - 147 214 - 0 Heat generation 65 - - 5 - 53 7 - - 68 - - 5 - 52 11 - - Petroleum refineries - - - - - - - - - - - - - - - - - - Coke manufacture - - - - - - - - - - - - - - - - - - Blast furnaces - - - - - - - - - - - - - - - - - - Patent fuel manufacture 111 - - - - - - - 111 91 - - - - - - - 91 Energy industry use 4,378 - - 619 - 344 2,112 - 1,303 3,892 - - 647 - 174 1,907 - 1,164 FINAL CONSUMPTION 61,528 12,574 21,926 4,461 11,242 330 3,585 3,507 3,903 61,578 12,326 22,675 4,480 11,220 355 3,552 3,179 3,791 Iron & steel 4 - - - - 3 1 - - 7 - - - - 4 3 - - Other industries 4,013 - - 1,833 - 147 203 1,383 - 4,026 - - 1,873 - 167 352 1,270 - Transport 47,222 12,574 21,926 1,282 11,242r 89 94 - 16 47,648 12,326 22,675 1,234 11,220 87 88 - 18 Domestic 2,580 - - 156 - - 300 2,125 - 2,299 - - 159 - - 231 1,909 - Other final users 1,365 - - 1,173 - 90 102 - - 1,379 - - 1,198 - 96 85 - - Non energy use 6,344 - - 17 - - 2,885 - 3,442 6,220 - - 17 - - 2,793 - 3,410 1. Includes: Middle distillate feedstock destined for use in the petrochemical industry and marine diesel o2. Includes ethane, propane, butane and other petroleum gases.3. Includes naphtha, industrial and white spirits, lubricants, bitumen, petroleum waxes, petroleum coke and other oil products.4. Includes refinery production and petroleum gases extracted as products during the production of oil and gas.5. Foreign trade as recorded by the Petroleum Industry which may differ from the figures published by HM Revenue and Customs in the Overseas Trade Statistics Data are subject to further revision as revised information on imports and exports becomes available.6. Stock fall (+), stock rise (-).7. Mainly transfers from product to feedstock.8. Total supply minus total demand.
9. See page 15 of the March 2011 edition of Energy Trends for a note concerning changes to this table.
2013 2014
26
De
cem
be
r 20
15

3 OIL AND OIL PRODUCTSTable 3.4 Supply and use of petroleum products - latest quarter
Thousand tonnes
To
tal
Pe
tro
leu
m
Pro
du
cts
Mo
tor
sp
irit
DE
RV
9
Ga
s o
il1
Av
iati
on
tu
rbin
e f
ue
l
Fu
el o
ils
Pe
tro
leu
m
ga
se
s2
Bu
rnin
g o
il
Oth
er
pro
du
cts
3
To
tal
Pe
tro
leu
m
Pro
du
cts
Mo
tor
sp
irit
DE
RV
9
Ga
s o
il1
Av
iati
on
tu
rbin
e f
ue
l
Fu
el o
ils
Pe
tro
leu
m
ga
se
s2
Bu
rnin
g o
il
Oth
er
pro
du
cts
3
SUPPLY Indigenous Production4
15,472 3,725 3,548 2,109 1,336 1,177 1,484 357 1,735 16,603 4,343 3,634 1,925 1,456 1,241 1,729 406 1,869 Imports5 7,581 782 2,797 479 2,516 278 44 100 584 8,393 1,104 3,061 505 2,461 317 146 137 661 Exports5 5,212 1,809 476 844 319 835 213 26 689 6,116 2,743 530 679 368 923 212 48 614 Marine bunkers 582 - - 338 - 244 - - - 642 - - 432 - 210 - - - Stock change6 -324 -63 -32 -43 -150 -62 +2 +5 +19 -624 -109 -118 -2 -187 +14 -110 -28 -85 Transfers7 -181 +400 -136 +123 -107 -144 +7 +99 -423 -258 +477 -71 +82 -35 -256 - +28 -483Total supply 16,754 3,036 5,702 1,485 3,275 169 1,326 535 1,226 17,356 3,072 5,977 1,398 3,327 184 1,554 495 1,348Statistical difference8 -105 -67 +1 -0 -5 -0 +11 -1 -43 -2 -0 - - -2 -10 +9 -3 +5 Total demand 16,859 3,103 5,701 1,485 3,280 169 1,315 536 1,269 17,357 3,072 5,976 1,398 3,330 194 1,545 499 1,344TRANSFORMATION 147 - - 26 - 45 56 - 20 167 - - 24 - 50 56 - 37 Electricity generation 110 - - 24 - 32 54 - - 130 - - 23 - 37 54 - - Heat generation 17 - - 1 - 13 3 - - 17 - - 1 - 13 3 - - Petroleum refineries - - - - - - - - - - - - - - - - - - Coke manufacture - - - - - - - - - - - - - - - - - - Blast furnaces - - - - - - - - - - - - - - - - - - Patent fuel manufacture 20 - - - - - - - 20 21 - - - - - - - 21Energy industry use 978 - - 162 - 33 504 - 279 1,112 - - 155 - 68 599 - 290FINAL CONSUMPTION 15,734 3,103 5,701 1,298 3,280 91 754 536 970 16,078 3,072 5,976 1,219 3,330 75 890 499 1,017 Iron & steel 2 - - - - 1 - - - 4 - - - - 4 - - - Other industries 966 - - 559 - 55 76 214 61 874 - - 524 - 51 74 180 45 Transport 12,454 3,103 5,701 327 3,280 16 22 - 4 12,718 3,072 5,976 308 3,330 8 20 - 4 Domestic 411 - - 48 - - 42 322 - 386 - - 45 - - 23 319 - Other final users 393 - - 359 - 19 16 - - 414 - - 337 - 12 65 - - Non energy use 1,508 - - 5 - - 598 - 905 1,681 - - 5 - - 707 - 969
1. Includes middle distillate feedstock destined for use in the petrochemical industry and marine diesel2. Includes ethane, propane, butane and other petroleum gases.3. Includes naphtha, industrial and white spirits, lubricants, bitumen, petroleum waxes, petroleum coke and other oil products.4. Includes refinery production and petroleum gases extracted as products during the production of oil and gas.5. Foreign trade as recorded by the Petroleum Industry which may differ from the figures published by HM Revenue and Customs in the Overseas Trade Statistics. Data are subject to further revision as revised information on imports and exports becomes available.6. Stock fall (+), stock rise (-).7. Mainly transfers from product to feedstock.8. Total supply minus total demand.
27
2014 3rd quarter 2015 3rd quarter p
Decem
ber 2015

3 OIL AND OIL PRODUCTS
Table 3.5 Demand for key petroleum products1
Thousand tonnes
2013 2013 2014 2014 2014 2014 2015 2015 2015
2013 20143rd
quarter 4th
quarter 1st
quarter 2nd
quarter 3rd
quarter 4th
quarter 1st
quarter 2nd
quarter3rd
quarter p
MOTOR SPIRIT
of which, Hydrocarbon 3 12,574 12,326 -2.0% 3,178 3,145 2,974 3,163 3,103 3,086 2,893 3,076 3,072 -1.0%
of which, Bio-ethanol 4 650 645 -0.9% 178 160 152 164 168 160 150 161 163 -3.3%
Total Motor Spirit including Bio-ethanol 13,224 12,971 -1.9% 3,355 3,305 3,126 3,327 3,271 3,247 3,043 3,237 3,235 -1.1%
of which, sold through Supermarkets 5 5,974 5,755 -3.7% 1,539 1,476 1,373 1,471 1,448 1,464 1,418 1,467 1,435 -0.9%
of which, sold through Refiners, and other traders 6 7,250 7,216 -0.5% 1,816 1,829 1,753 1,856 1,823 1,783 1,625 1,770 1,800 -1.3%
of which, sold via commercial sales 7 - - - - - - - - - - -
DIESEL ROAD FUEL
Hydrocarbon 8 21,926 22,675 3.4% 5,518 5,706 5,341 5,674 5,701 5,960 5,575 5,998 5,976 4.8%
Bio-diesel 9 682 850 24.7% 197 201 174 230 243 204 111 135 158 -35.2%
Total Diesel Road Fuel including Bio-diesel 22,607 23,525 4.1% 5,715 5,907 5,514 5,903 5,944 6,164 5,687 6,133 6,134 3.2%
of which, sold through Supermarkets 10 6,217 6,394 2.8% 1,607 1,562 1,508 1,602 1,625 1,658 1,605 1,648 1,706 5.0%
of which, sold through Refiners, and other traders 11 8,519 8,946 5.0% 2,118 2,289 2,087 2,247 2,252 2,360 2,103 2,351 2,293 1.8%
of which, sold via commercial sales 12 7,871 8,185 4.0% 1,989 2,056 1,919 2,054 2,067 2,146 1,979 2,134 2,135 3.3%
OTHER GAS DIESEL OIL 13 5,174 5,241 1.3% 1,313 1,321 1,183 1,288 1,485 1,286 1,115r 1,260r 1,398 -5.9%
AVIATION FUELS
Total sales 11,257 11,238 -0.2% 3,119 2,817 2,510 2,788 3,284 2,655 2,556r 2,823r 3,333 1.5% Aviation spirit 16 18 15.7% 5 3 7 5 4 3 2 4 4 -5.9% Aviation turbine fuel 11,242 11,220 -0.2% 3,113 2,814 2,504 2,784 3,280 2,652 2,554r 2,820r 3,330 1.5%FUEL OIL
Total Sales 569 554 -2.7% 133 120 150 136 136 132 159r 107r 125 -8.1% Light 219 175 -20.3% 65 19 29 74 68 3 50r 34r 40 -41.9% Medium 139 126 -10.0% 31 32 32 31 31 32 36r 24r 28 -7.9% Heavy 209 255 21.5% 37 69 89 32 37 97 73r 49r 58 55.9%1. Monthly data for inland deliveries of oil products are available - See DECC website: https://www.gov.uk/government/collections/oil-statistics2. Percentage change between the most recent quarter and the same quarter a year earlier
3. Demand excluding bioethanol. Based on HMRC data.
4. Bioethanol based on HMRC data and excludes other renewables
5. Data for sales by supermarkets collected by a monthly reporting system. Includes Asda, Morrisons, Sainsburys and Tesco only.
6. Equals total motor spirit sales minus supermarket and commercial sales.7. Commercial sales are estimated through returns provided by the UK’s refiners8. Demand excluding biodiesel. Based on HMRC data.
9. Biodiesel based on HMRC data and excludes other renewables.
10. Data for sales by supermarkets collected by a monthly reporting system. Includes Asda, Morrisons, Sainsburys and Tesco only.
11. Equals total diesel sales minus supermarket and commercial sales.
12. Commercial sales are estimated through returns provided by the UK’s refiners
13. This includes gas diesel oil used for other purposes such as heating and middle distillate feedstock destined for use in the petrochemical industry.
per cent change
per cent change 2
28
De
cem
be
r 20
15

3 OIL AND OIL PRODUCTSTable 3.6 Stocks of petroleum1 at end of period
Thousand tonnesCrude oil and refinery process oil Petroleum products Total stocks
Refineries2 Terminals3 Offshore4 Total5
2010 4,110 1,049 520 210 5,889 797 1,397 1,946 544 917 2,563 8,164 2,773 11,280 14,053
2011 3,889 694 540 151 5,274 696 1,454 1,949 525 845 2,100 7,569 2,251 10,592 12,843
2012 3,829 1,194 473 195 5,690 605 1,427 1,931 491 841 2,441 7,735 2,636 10,790 13,425
2013 3,592 1,102 513 1,469 6,677 1,041 1,419 1,539 404 693 2,432 7,528 3,901 10,304 14,205
2014 3,876 1,147 460 1,728 7,211 947 1,178 1,656 253 773 2,064 6,871 3,792 10,290 14,082
2013 3rd quarter 3,314 1,020 473 1,943 6,750 1,015 1,276 1,641 469 804 1,841 7,047 3,784 10,012 13,797
4th quarter 3,592 1,102 513 1,469 6,677 1,041 1,419 1,539 404 693 2,432 7,528 3,901 10,304 14,205
2014 1st quarter 3,538 1,216 452 1,946 7,152 1,066 1,210 1,477 368 710 1,769 6,600 3,715 10,037 13,752
2nd quarter 3,384 1,226 548 1,799 6,956 887 1,118 1,715 241 718 1,529 6,208 3,328 9,837 13,164
3rd quarter 3,248 1,309 512 1,863 6,932 914 1,259 1,681 330 684 2,215 7,083 4,078 9,938 14,016
4th quarter 3,876 1,147 460 1,728 7,211 947 1,178 1,656 253 773 2,064 6,871 3,792 10,290 14,082
2015 1st quarter 3,793 992r 485 1,871 7,141r 1,304 1,136 1,553 292 640 2,051 6,976 3,922 10,195r 14,116r
2nd quarter 3,590 1,515r 487r 1,862 7,454r 996 1,211 1,706 352 634 2,315 7,214 4,177 10,490r 14,668r
3rd quarter p 3,098 1,583 396 1,793 6,869 1,087 1,426 1,825 338 716 2,703 8,096 4,496 10,469 14,965
Per cent change 11 -4.6 +20.9 -22.6 -3.8 -0.9 +19.0 +13.2 +8.5 +2.5 +4.6 +22.1 +14.3 +10.2 +5.3 +6.8
2. Stocks of crude oil, NGLs and process oil at UK refineries.3. Stocks of crude oil and NGLs at UKCS pipeline terminals.4. Stocks of crude oil in tanks and partially loaded tankers at offshore fields (UKCS).
6.Motor spirit and aviation spirit.7. Aviation turbine fuel and burning oil.8. Gas oil, DERV fuel, middle distillate feedstock (mdf) and marine diesel oil.9. Ethane, propane, butane, other petroleum gases, naphtha (ldf), industrial and white spirits, bitumen, petroleum wax, lubricating oil, petroleum coke, and miscellaneous products.10. Stocks held in the national territory or elsewhere on the UKCS11. Percentage change between the most recent quarter and the same quarter a year earlier.
29
product stocks held under similar agreements.
Net bilaterals of Crude and
Process oil 5Motor
Spirit6 Kerosene7 Gas/Diesel Oil8
approved bilateral agreements also included.
2009/119/EC came into effect and this has lead to changes in how UK companies manage their stock-holding. The increase in crude stocks held abroad was at the expense of a decrease in
Fuel oils
Other
products9
5. The difference between stocks held abroad for UK use under approved bilateral agreements and the equivalent stocks held in the UK for foreign use. From 2013 onwards, EU Directive
Total products
Net bilaterals
of products 5Total Net
bilaterals 5Total Stocks
in UK10 Total
stocks
1. Stocks held at refineries, terminals and power stations. Stocks in the wholesale distribution system and certain stocks at offshore fields (UK Continental Shelf [UKCS]), and others held underare
Decem
ber 2015

3 OIL AND OIL PRODUCTSTable 3.7 Drilling activity1 on the UKCS
Number of wells started
Offshore Onshore
Exploration & Exploration &
Exploration Appraisal Appraisal Development2 Appraisal Development2
2010 28 34 62 130 9 12
2011 14 28 42 123 14 11
2012 22 31 53 122 4 13
2013 15 29 44 120 7 8
2014 14 18 32 126 8 11
Per cent change -6.7 -37.9 -27.3 +5.0 +14.3 +37.5
2013 3rd quarter 3 7 10 32 4 1
4th quarter 2 5 7 29 - 2
2014 1st quarter 3 2 5 30 3 2
2nd quarter 4 3 7 41 1 3
3rd quarter 3 5 8 33 2 4
4th quarter 4 8 12 22 2 2
2015 1st quarter 2 7 9 28 1 3
2nd quarter 5 2 7 37 - -
3rd quarter p 6 2 8 42 - 1
Per cent change 3 +100.0 -60.0 - +27.3 -100.0 -75.0
1. Including sidetracked wells
2. Development wells are production or injection wells drilled after development approval has been granted.
3. Percentage change between the most recent quarter and the same quarter a year earlier.
30
Decem
ber 2015

Gas
31 December 2015
Section 4 - Gas Chart 4.1 Production and imports and exports of natural gas
Total indigenous UK production of natural gas in Q3 2015 was 10.0 per cent higher than in the same quarter a year earlier, the largest increase since 2010. Whilst production last year was depressed through maintenance, the opening of the Juliet and Kew feels has contributed to stronger production this year. In general terms, UKCS production has been in decline year on year, and UKCS production has decreased by around 7.5 per cent on average since production peaked in 2000. However, 2014 saw the first annual increase in indigenous production since 2000, with a 0.2 per cent increase year-on-year. In Q3 2015, imports and exports of natural gas were 101 TWh and 52 TWh respectively, 12.8 and 29 per cent higher than a year ago. Overall, net imports are broadly similar to last year, down 0.1 per cent.
Key results show: Gross UK production of natural gas in Q3 2015 was 10.0 per cent higher than in the same period a year ago, continuing the trend of strong growth this year, due partially to the opening of new fields. (Chart 4.1). Imports of gas increased by 12.8 per cent in Q3 2015 compared with the same quarter in 2014, despite a decrease in shipped imports of LNG. Exports also increased, up 29 per cent on the same period as last year. The latest quarter marked the largest volume of gas exports to Belgium since 2011. (Chart 4.4). The strong supply to the UK also saw a large increase in gas stocks, with a build of nearly 16 TWh, more than double that seen last year. Overall UK gas demand decreased marginally (by 0.8 per cent) to around 135 TWh. Energy industry use is up 13.5 per cent, reflecting continued strong growth in oil and gas production. Gas used for electricity generation is down 11.7 per cent, as a result of power station outages during August, lower coal prices and an increased proportion of renewables used in generation. Final consumption of gas is up 8.2 per cent. Within this, consumption by domestic and other final users is up 15.6 and 7.0 per cent respectively, partly as a result of cooler temperatures, particularly in September. (Chart 4.6)

Gas
December 2015 32
Chart 4.2 Production of dry gas and associated gas
In Q3 2015 associated gas production (natural gas produced from oil fields) increased by 19 per cent from 55 TWh in Q3 2014 to 65 TWh in Q3 2015. The main driver behind this is less planned maintenance at associated gas terminals during Q3 2015. Compared to the same quarter a year ago dry gas production decreased by 2.2 per cent to 38 TWh.
Chart 4.3 Gas availability
Gas available at terminals is equal to the gross gas production minus producers own use plus net imports. Gas availability is seasonal, mirroring gas demand, and peaks during Q1 and Q4 each year. Gas availability in Q3 2015 increased by 5.3 per cent compared to Q3 2014 to 140 TWh. Within the latest quarter net imports comprised 35 per cent of gas available at terminals. For the same period last year this was 37 per cent. .

Gas
33 December 2015
Chart 4.4 Import and exports
Chart 4.5 Imports by origin
Total nominated imports in Q3 2015 increased by 12.8 per cent compared to the same quarter a year ago. The reason for the increase between Q3 2014 and Q3 2015 was an increase in pipeline imports which increased by 34 per cent to 63 TWh. Physical LNG imports were lower than the same period last year, both in absolute volume and proportion of total imports and accounted for 38 per cent of total imports in Q3 2015 compared with 46 per cent a year ago. Total exports also increased by 29 per cent in Q3 2015. Within this there are notable changes in volumes exported to Belgium which are up 58 per cent on last year and as a result these volumes accounted for just under two thirds of total exports. Quarter 3 marked the largest volume of gas exports to Belgium since 2011 and the year to date figure is 46 per cent higher than 2014.
The majority of LNG imports are sourced from Qatar, around 93 per cent in Q3 2015. There was a small decrease in the quantity of LNG imports from Qatar in Q3 2015, 8.2 per cent lower than the same quarter in 2014. Pipeline imports from the Netherlands were 97 per cent lower in the most recent quarter compared with the previous year, falling from 9.1 TWh in Q3 2014 to 0.3 TWh in Q3 2015. Imports from Netherlands made up under 0.3 per cent of total imports this quarter, the lowest share since the BBL pipeline commenced supply in 2006. In contrast, imports from Norway were 66 per cent higher than a year ago. A complete country breakdown for physical pipeline and LNG imports is provided in Energy Trends table 4.4 - Supplementary information on the origin of UK gas imports.

Gas
December 2015 34
Map: UK imports and exports of gas Q3 20151
1. Please note that imports and exports in this map uses nominated flows through the UK-Belgium Interconnector and BBL pipeline as in table 4.1. The figures here will differ from those in ET Table 4.3 which uses actual physical flows through the Interconnector.
34.3 TWh
Vesterled Pipeline
NTS
Imports
Exports
UK-Belgium
Interconnector
UK-Ireland
Interconnector
5.0 TWh
12.3 TWh
NTS - National Transmission
System for gas, including link
to N. Ireland
LNG
2.6 TWh
NominatedBBL export
and UK/Dutchmedian line
fields export.
0.0 TWh
5.9 TWh
BBL
0.3 TWh
Langeled Pipeline
36.2 TWh
Tampen Link & Gjoa/Vega 20.6 TWh
Blane (UK)Field
Ula Field (Norwegian)
0.00 TWh
LNG
35.2 TWh
LNG
0.0 TWh

Gas
35 December 2015
Chart 4.6 UK demand for natural gas
UK demand for natural gas in Q3 2015 was 0.8 per cent lower than in the same period a year ago. Within this: Energy industry use is up 13.5 per cent, reflecting continued strong growth in gas production. Gas used for electricity generation is down 11.7 per cent, as a result of power station outages during August, lower coal prices and an increased proportion of renewables used in generation. Final consumption of gas is up 8.2 per cent. Within this, consumption by domestic and other final users is up 15.6 and 7.0 per cent respectively, partly as a result of cooler temperatures, particularly in September. A complete breakdown for gas demand is provided in Energy Trends table 4.1 - Natural gas supply and consumption.
Relevant table 4.1: Natural gas supply and consumption...……………………………………........…………...Page 36
Contact for further information:
Shyam Lakhani Michael Williams Upstream Gas Downstream Gas Oil and Gas Statistics Team Oil and Gas Statistics Team Tel. 0300 068 6865 Tel. 0300 068 5052 E-mail: [email protected] E-mail: [email protected]

4 GASTable 4.1. Natural gas supply and consumption GWh
2013 2013 2014 2014 2014 2014 2015 2015 2015
2013 2014per cent change
3rd quarter
4th quarter
1st quarter
2nd quarter
3rd quarter
4th quarter
1st quarter
2nd quarter
3rd quarter p
per cent change 1
SUPPLY
Indigenous production 424,153 424,897 +0.2 90,047 108,142 115,395 107,923 93,050 108,529 114,776r 120,931r 102,315 +10.0
Imports 535,105 477,163 -10.8 77,546 143,520 143,212 105,078 89,405 139,468 155,644 91,781 100,853 +12.8 of which LNG 102,620 123,912 +20.7 19,428 22,771 12,911 43,973 40,151 26,877 34,556 35,518 37,825 -5.8
Exports 109,664 127,907 +16.6 30,106 20,443 22,862 41,063 40,102 23,880 27,059 38,741 51,581 +28.6
Stock change2+621 -2,383 -14,890 +327 +16,992 -18,072 -7,057 +5,754 +34,500 -11,042 -15,919
Transfers -61 -140 -14 -5 -9 -25 -40 -66 -92 -96r -99
Total supply 850,155 771,630 -9.2 122,583 231,541 252,728 153,841 135,256 229,806 277,768r 162,832r 135,569 +0.2
Statistical difference 1,888 -867 347 420 -270 -716 -683 803 979r 142r 661
Total demand 848,267 772,497 -8.9 122,236 231,121 252,998 154,557 135,939 229,003 276,789r 162,690r 134,908 -0.8
TRANSFORMATION 230,558 243,972 +5.8 49,819 57,246 55,833 56,467 67,323 64,349 58,223 55,028r 60,014 -10.9
Electricity generation 205,831 217,944 +5.9 45,222 50,715 47,866 50,742 62,230 57,106 50,256 49,303r 54,921 -11.7
Heat generation3 24,727 26,028 +5.3 4,597 6,530 7,967 5,725 5,093 7,243 7,967 5,725 5,093 -
Energy industry use 53,775 49,281 -8.4 11,853 12,783 13,167 12,316 10,895 12,903 14,843r 15,113r 12,364 +13.5
Losses 7,473 6,856 -8.3 1,614 1,828 1,959 1,573 1,656 1,668 1,650r 1,172r 1,881 +13.6
FINAL CONSUMPTION 556,460 472,387 -15.1 58,950 159,265 182,038 84,200 56,065 150,083 202,074 91,377r 60,649 +8.2
Iron & steel 5,338 5,448 +2.1 1,223 1,335 1,455 1,350 1,303 1,339 1,578 1,524r 1,317 +1.0
Other industries 87,652 87,032 -0.7 15,878 23,234 26,431 19,064 17,087 24,450 27,273 19,199r 17,329 +1.4
Domestic 342,501 278,101 -18.8 23,367 100,641 119,112 42,542 20,825 95,621 134,108 49,843r 24,071 +15.6
Other final users 115,372 96,377 -16.5 17,083 32,656 33,683 19,886 15,492 27,316 37,757 19,454r 16,575 +7.0 Non energy use3
5,598 5,430 -3.0 1,399 1,399 1,357 1,357 1,357 1,357 1,357 1,357 1,357 -
1. Percentage change between the most recent quarter and the same quarter a year earlier.
2. Stock change + = stock draw, - = stock build.
3. For heat generation and non energy use, the 2015 figures currently shown are the 2014 figures carried forward - these will be updated in July 2016.
36D
ece
mb
er 2
01
5
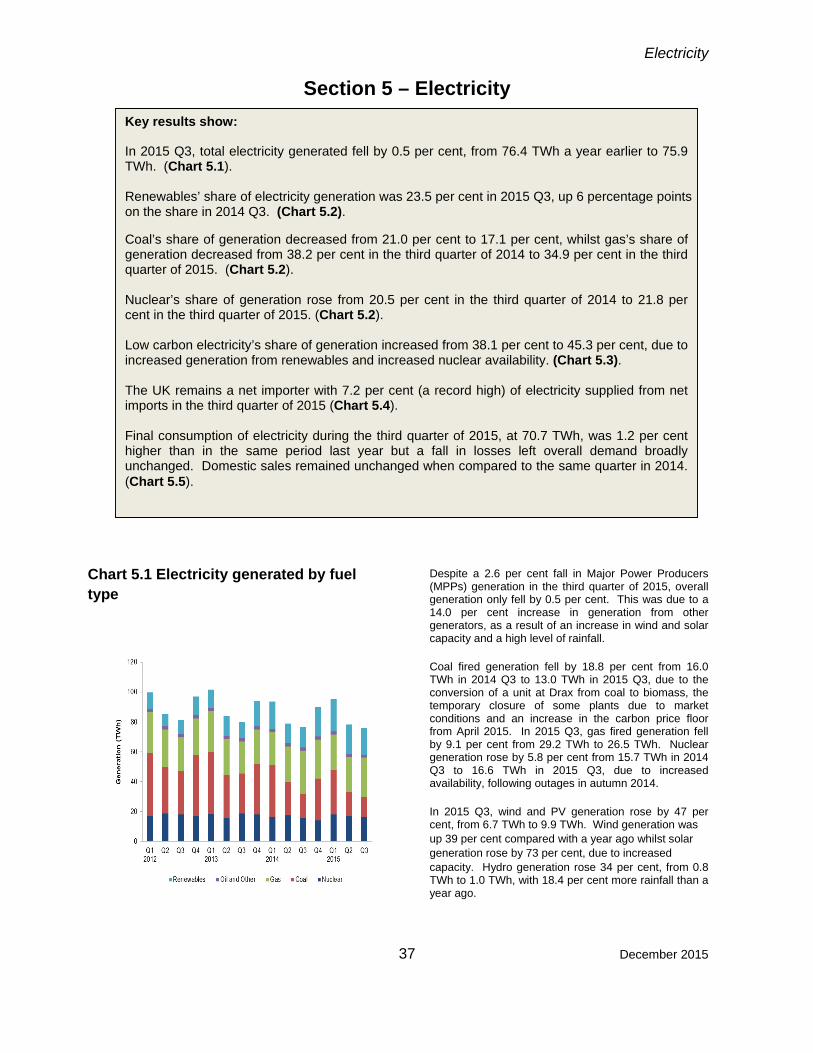
Electricity
37 December 2015
Section 5 – Electricity
Chart 5.1 Electricity generated by fuel type
Despite a 2.6 per cent fall in Major Power Producers (MPPs) generation in the third quarter of 2015, overall generation only fell by 0.5 per cent. This was due to a 14.0 per cent increase in generation from other generators, as a result of an increase in wind and solar capacity and a high level of rainfall. Coal fired generation fell by 18.8 per cent from 16.0 TWh in 2014 Q3 to 13.0 TWh in 2015 Q3, due to the conversion of a unit at Drax from coal to biomass, the temporary closure of some plants due to market conditions and an increase in the carbon price floor from April 2015. In 2015 Q3, gas fired generation fell by 9.1 per cent from 29.2 TWh to 26.5 TWh. Nuclear generation rose by 5.8 per cent from 15.7 TWh in 2014 Q3 to 16.6 TWh in 2015 Q3, due to increased availability, following outages in autumn 2014.
In 2015 Q3, wind and PV generation rose by 47 per cent, from 6.7 TWh to 9.9 TWh. Wind generation was up 39 per cent compared with a year ago whilst solar generation rose by 73 per cent, due to increased capacity. Hydro generation rose 34 per cent, from 0.8 TWh to 1.0 TWh, with 18.4 per cent more rainfall than a year ago.
Key results show:
In 2015 Q3, total electricity generated fell by 0.5 per cent, from 76.4 TWh a year earlier to 75.9 TWh. (Chart 5.1). Renewables’ share of electricity generation was 23.5 per cent in 2015 Q3, up 6 percentage points on the share in 2014 Q3. (Chart 5.2).
Coal’s share of generation decreased from 21.0 per cent to 17.1 per cent, whilst gas’s share of generation decreased from 38.2 per cent in the third quarter of 2014 to 34.9 per cent in the third quarter of 2015. (Chart 5.2). Nuclear’s share of generation rose from 20.5 per cent in the third quarter of 2014 to 21.8 per cent in the third quarter of 2015. (Chart 5.2). Low carbon electricity’s share of generation increased from 38.1 per cent to 45.3 per cent, due to increased generation from renewables and increased nuclear availability. (Chart 5.3). The UK remains a net importer with 7.2 per cent (a record high) of electricity supplied from net imports in the third quarter of 2015 (Chart 5.4). Final consumption of electricity during the third quarter of 2015, at 70.7 TWh, was 1.2 per cent higher than in the same period last year but a fall in losses left overall demand broadly unchanged. Domestic sales remained unchanged when compared to the same quarter in 2014. (Chart 5.5).

Electricity
December 2015 38
Chart 5.2 Shares of electricity generation
Chart 5.3 Low carbon electricity’s share of generation
The share of generation from coal decreased from 21.0 per cent in 2014 Q3 to 17.1 per cent in 2015 Q3. Gas’s share of generation decreased from 38.2 per cent in 2014 Q3 to 34.9 per cent in 2015 Q3. Nuclear’s share of generation increased from 20.5 per cent in 2014 Q3 to 21.8 per cent in 2015 Q3. The share of renewables (hydro, wind and other renewables) increased from 17.6 per cent in 2014 Q3 to 23.5 per cent in 2015 Q3. This was primarily due to an increase in wind and solar capacity, along with a rise in bioenergy generation, in part due to the conversion of a third unit at Drax from coal to biomass.
Low carbon electricity’s share of generation increased from 38.1 per cent in 2014 Q3 to 45.3 per cent in 2015 Q3, with the fall in coal and gas generation offset by an increase in generation from renewables and nuclear.

Electricity
39 December 2015
Chart 5.4 UK trade in electricity
Chart 5.5 Electricity final consumption
In 2015 Q3, compared with the same period in 2014, imports of electricity rose by 2.0 per cent (+0.1 TWh) to a record high 6.2 TWh, whilst exports fell by 57 per cent to 0.26 TWh, the lowest Q3 level since 2007. Following the net exports of electricity in 2009 Q4 and 2010 Q1, the UK has since remained a net importer of electricity. Net imports of electricity rose by 8.5 per cent from 5.4 TWh in 2014 Q3 to a record high 5.9 TWh in 2015 Q3, with increased imports from the Netherlands and Ireland more than offsetting a slight reduction in imports from France. Total imports from Ireland to Wales were around 5 times larger than Q3 2014 at 0.14 TWh while Wales to Ireland exports were down by 60 per cent to 0.24 TWh. At 0.26 TWh total exports were at the lowest Q3 level since 2010 (0.18 TWh). Net imports represented a record high 7.2 per cent of the electricity supplied in 2015 Q3. Final consumption of electricity rose by 1.2 per cent in 2015 Q3, from 69.9 TWh in 2014 Q3, to 70.7 TWh. Domestic use remained unchanged from Q3 2014 at 22.5 TWh. Industrial use of electricity, including iron and steel, fell by by 1.2 per cent from 23.3 TWh to 23.0 TWh, while consumption by commercial and other users1 increased by 4.7 per cent, from 24.1 TWh to 25.2 TWh. In 2015 Q3, temperatures were on average 1.1 degrees lower than in 2014 Q32.
1 Includes commercial, transport and other final users.
2 Temperature data comes from ET 7.1, at: www.gov.uk/government/publications/energy-trends-section-7-weather

Electricity
December 2015 40
Chart 5.6 Fuel used for electricity Generation
Chart 5.7 Generation by fuel in 2014 for England, Scotland, Wales and Northern Ireland
Fuel used by generators fell 1.7 per cent, from 16.0 mtoe in 2014 Q3 to 15.7 mtoe in 2015 Q3³. In 2015 Q3, gas use was 11.7 per cent lower than in 2014. Coal use during the quarter was 18.9 per cent lower than a year earlier, while nuclear sources rose by 5.8 per cent.
3 For wind (and other primary renewable sources), the fuel used is assumed the same as the electricity generated, unlike thermal generation where conversion losses are incurred.
In 2014, England had a share of 77.6 per cent of electricity generation in the UK with 260.9 TWh. Of England’s generation 34.3 per cent was from gas and 31.1 per cent was from coal. Scotland had a share of 14.3 per cent of electricity generation in the UK with 49.9 TWh. Of Scotland’s generation 33.3 per cent was from nuclear, 38.0 per cent from renewables, and 20.3 per cent was from coal. Wales had a share of 6.0 per cent of electricity generation in the UK with 20.9 TWh. Of Wales’s generation 24.1 per cent was from gas, with 35.7 per cent from coal. Northern Ireland had a share of 2.2 per cent of electricity generation in the UK with 7.2 TWh. Of Northern Ireland’s generation, 49.1 per cent came from gas and 28.3 per cent came from coal. Of electricity generated in the UK, 19.1 per cent came from renewables in 2014. The shares of electricity generated by renewables for each country are: Scotland 38.0 per cent, Northern Ireland 22.2 per cent, England 15.8 per cent and Wales 16.3 per cent. Data from special feature article “Electricity generation and supply figures for Scotland, Wales, Northern Ireland and England, 2010 to 2014” (page 49).
Relevant tables 5.1: Fuel used in electricity generation and electricity supplied ……………………………….Page 41 5.2: Supply and consumption of electricity……………………………………………………….Page 42
Contacts for further information: Stephen Ashcroft Anwar Annut Sophie Brough Electricity Statistics Electricity Statistics Electricity Statistics Tel: 0300 068 2928 Tel: 0300 068 5060 Tel: 0300 068 5046 E-mail: [email protected]

5 ELECTRICITYTable 5.1. Fuel used in electricity generation and electricity supplied
2013 2013 2014 2014 2014 2014 2015 2015 2015
2013 20143rd
quarter4th
quarter1st
quarter2nd
quarter3rd
quarter4th
quarter1st
quarter2nd
quarter3rd
quarter p
FUEL USED IN GENERATIONAll generating companies Million tonnes of oil equivalentCoal 31.43 24.11 -23.3 6.50 8.12 8.32 5.30 3.91 6.59 7.11 3.86 3.17 -18.9 Oil 0.59 0.53 -10.6 0.17 0.16 0.14 0.15 0.12 0.12 0.14 0.12 0.17 +34.8 Gas 17.74 18.78 +5.9 3.90 4.37 4.13 4.37 5.36 4.92 4.33 4.25 4.73 -11.7 Nuclear 15.44 13.85 -10.3 4.09 3.97 3.59 3.80 3.40 3.05 3.95 3.68 3.60 +5.8 Hydro 0.40 0.51 +25.2 0.06 0.15 0.19 0.10 0.07 0.15 0.17 0.12 0.09 +33.3
Wind and Solar 2 2.62 3.10 +18.5 0.48 0.92 0.99 0.57 0.58 0.97 1.10 0.99r 0.85 +47.2
Bioenergy 3 5.54 6.53 +17.9 1.37 1.37 1.38 1.59 1.70 1.87 1.90r 2.18r 2.26 +32.8 Other fuels 1.43 1.52 +6.3 0.35 0.35 0.38 0.35 0.39 0.40 0.34 0.30 0.35 -10.1 Net imports 1.24 1.76 +42.1 0.40 0.29 0.42 0.44 0.47 0.44 0.42 0.48r 0.51 +8.5 Total all generating companies 76.45 70.70 -7.5 17.32 19.71 19.54 16.66 15.99 18.51 19.46r 15.98r 15.72 -1.7
ELECTRICITY GENERATEDAll generating companies TWhCoal 130.77 100.71 -23.0 26.69 33.58 34.67 22.21 16.01 27.81 29.69r 16.12r 13.00 -18.8 Oil 2.09 1.88 -10.0 0.60 0.49 0.53 0.50 0.43 0.42 0.52 0.37 0.47 +8.5 Gas 96.03 100.93 +5.1 21.38 23.16 21.76 23.78 29.16 26.22 23.67r 23.38r 26.51 -9.1 Nuclear 70.61 63.75 -9.7 18.69 18.16 16.53 17.50 15.66 14.06 18.17 16.92 16.56 +5.8 Hydro (natural flow) 4.70 5.88 +25.2 0.74 1.74 2.24 1.11 0.78 1.75 2.02 1.44r 1.04 +33.8
Wind and Solar 2 30.42 36.07 +18.6 5.54 10.65 11.55 6.58 6.70 11.24 12.78r 11.54r 9.87 +47.2
- of which, Offshore6 11.47 13.40 +16.8 1.98 4.03 4.38 2.09 2.24 4.69 4.66r 3.57r 3.40 +51.7 Bioenergy 3 18.16 22.70 +25.0 4.46 4.44 4.59 5.48 5.94 6.68 6.87r 6.87r 6.95 +16.9 Pumped Storage 2.90 2.88 -0.7 0.71 0.76 0.79 0.67 0.63 0.79 0.64 0.59 0.56 -11.0 Other fuels 3.49 4.13 +18.1 0.87 0.86 1.04 1.00 1.03 1.06 1.05 1.01 0.98 -4.8 Total all generating companies 359.17 338.93 -5.6 79.67 93.85 93.71 78.84 76.35 90.03 95.41r 78.24r 75.94 -0.5
ELECTRICITY SUPPLIED 4
All generating companies TWhCoal 124.06 95.53 -23.0 25.32 31.86 32.89 21.07 15.19 26.39 28.16r 15.29r 12.33 -18.8 Oil 1.89 1.71 -9.8 0.54 0.45 0.48 0.46 0.39 0.38 0.47 0.33 0.43 +8.0 Gas 94.21 99.03 +5.1 20.99 22.72 21.33 23.34 28.63 25.73 23.17r 22.95r 26.01 -9.1 Nuclear 64.13 57.90 -9.7 16.97 16.50 15.01 15.90 14.22 12.77 16.51 15.37 15.04 +5.8 Hydro 4.67 5.83 +24.9 0.74 1.72 2.21 1.10 0.77 1.74 2.01 1.43r 1.04 +33.9
Wind and Solar 2 30.42 36.07 +18.6 5.54 10.65 11.55 6.58 6.70 11.24 12.78r 11.54r 9.87 +47.2
- of which, Offshore6 11.47 13.40 +16.8 1.98 4.03 4.38 2.09 2.24 4.69 4.66 3.57r 3.40 +51.7
Bioenergy 3 15.73 19.61 +24.6 3.86 3.83 3.94 4.73 5.14 5.80 5.96r 5.96r 6.02 +17.0
Pumped Storage (net supply) 5 -1.04 -1.01 -2.4 -0.26 -0.25 -0.26 -0.25 -0.24 -0.26 -0.25 -0.23 -0.24 +3.5 Other fuels 3.27 3.85 +17.9 0.81 0.81 0.97 0.93 0.96 0.99 0.98 0.94 0.92 -4.9 Net imports 14.43 20.51 +42.1 4.65 3.40 4.89 5.08 5.43 5.11 4.91r 5.54r 5.89 +8.5 Total all generating companies 351.78 339.03 -3.6 79.17 91.68 93.01 78.94 77.21 89.87 94.70r 79.12r 77.30 +0.1 1. Percentage change between the most recent quarter and the same quarter a year earlier.
2. Includes wave and tidal
3. Up to 2006 Q4, this includes non-biodegradable wastes. From 2007 Q1, this is included in 'Other fuels' (as it is not considered a renewable source).
4. Electricity supplied net of electricity used in generation
5. Net supply from pumped storage is usually negative, as electricity used in pumping is deducted.
6. This now includes a small amount of offshore wind generation from other generators
per cent change
per cent change 1
41
De
cem
ber 2
01
5

5 ELECTRICITYTable 5.2 Supply and consumption of electricity
GWh
2013 2013 2014 2014 2014 2014 2015 2015 2015
2013 2014Per cent change
3rd quarter
4th quarter
1st quarter
2nd quarter
3rd quarter
4th quarter
1st quarter
2nd quarter
3rd quarter p
Per cent change 1
SUPPLYIndigenous production 359,168 338,927 -5.6 79,670 93,848 93,705 78,843 76,350 90,028 95,405r 78,236r 75,937 -0.5
Major power producers2 3 321,821 297,939 -7.4 70,848 83,922 83,205 68,844 66,368 79,522 84,240r 66,579r 64,719 -2.5 Auto producers 34,443 38,104 +10.6 8,114 9,163 9,710 9,329 9,354 9,712 10,529r 11,068r 10,659 +14.0 Other sources 4 2,904 2,883 -0.7 708 763 791 671 628 793 637 588 559 -11.0
Imports 17,533 23,230 +32.5 5,402 4,436 5,701 5,771 6,031 5,726 5,462r 6,023r 6,152 +2.0 Exports 3,103 2,720 -12.4 751 1,038 807 695 602 616 555r 484r 259 -56.9 Transfers - - - - - - - - - - -
Total supply 373,598 359,437 -3.8 84,321 97,246 98,599 83,919 81,780 95,139 100,312r 83,775r 81,830 +0.1 Statistical difference -1,036 -561 -512 -326 -116 -265 -153 -27 -209r 27r -324
Total demand 374,634 359,998 -3.9 84,833 97,572 98,715 84,184 81,933 95,166 100,521r 83,748r 82,154 +0.3 TRANSFORMATION - - - - - - - - - - -
Energy industry use 5 29,932 28,027 -6.4 7,177 7,536 7,541 6,882 6,417 7,186 7,458r 6,563r 6,353 -1.0 Losses 27,725 28,562 +3.0 5,459 7,078 8,307 6,156 5,606 8,493 9,225r 5,488r 5,052 -9.9 FINAL CONSUMPTION 316,977 303,409 -4.3 72,197 82,958 82,867 71,146 69,910 79,486 83,839r 71,696r 70,749 +1.2 Iron & steel 3,804 3,786 -0.5 947 940 956 945 937 949 969 919 912 -2.6 Other industries 93,865 89,587 -4.6 23,105 23,620 23,415 21,556 22,388 22,228 23,253r 21,557r 22,124 -1.2 Transport 4,268 4,259 -0.2 1,067 1,067 1,065 1,065 1,065 1,065 1,065 1,065 1,065 - Domestic 113,445 108,881 -4.0 22,723 30,936 31,961 24,317 22,518 30,084 32,234r 24,557r 22,511 - Other final users 101,595 96,896 -4.6 24,355 26,395 25,470 23,263 23,003 25,161 26,317r 23,599r 24,136 +4.9 Non energy use - - - - - - - - - - -
1. Percentage change between the most recent quarter and the same quarter a year earlier.
AES Electric Ltd., Baglan Generation Ltd., British Energy plc., Centrica Energy, Coolkeeragh ESB Ltd., Corby Power Ltd., Coryton Energy Company Ltd.,
Dong Energy Burbo UK Ltd., Drax Power Ltd., EDF Energy plc., Eggborough Power Ltd., E.On UK plc., Energy Power Resources, Falck Renewables Ltd., Fred Olsen, Greencoat UK Wind plc.,
HG Capital, Immingham CHP, Infinis plc, International Power Mitsui, London Waste Ltd., Magnox North Ltd., Peel Energy Ltd., Premier Power Ltd., Renewable Energy Systems, Riverside Resource Recovery Ltd.,
Rocksavage Power Company Ltd., RWE Npower plc, Scottish Power plc, Scottish and Southern Energy plc., Seabank Power Ltd., SELCHP Ltd., Spalding Energy Company Ltd., Statkraft Energy Ltd.,
Third Energy Trading Ltd., Vattenfall Wind Power
4. Gross supply from pumped storage hydro
5. Includes electricity used in generation and for pumping
2. Companies that produce electricity from nuclear sources plus all companies whose prime purpose is the generation of electricity are included under the heading "Major Power Producers". At the end of December 2014 they were:
3. This table includes the change of definition of Major power producers (MPPs) to include major wind farm companies. Details of this change of definition were given in an article on pages 43 to 48 of the September 2008 edition of Energy Trends.
42D
ecember 2015

Renewables
43 December 2015
Section 6 – Renewables
Chart 6.1 Renewables’ share of electricity generation 2015 Q3
9.5%9.1%
3.5%
1.4%
0%
1%
2%
3%
4%
5%
6%
7%
8%
9%
10%
Wind Bioenergy Solar PV Hydro
Sh
are
of
gen
erat
ion
Onshore5.0%
Offshore4.5%
1 Total electricity generation figures (all generating companies) can be found in table ET 5.1, at: www.gov.uk/government/publications/electricity-section-5-energy-trends
Renewables’ share of electricity generation increased from 17.6 per cent in 2014 Q3 to 23.5 per cent in 2015 Q3.1Compared to 2015 Q2, renewables share was 1.9 percentage points lower. The increased share on a year earlier reflects the increase in renewables generation in addition to a slight decrease (0.5 per cent) in total electricity generation Total electricity generated from renewables in 2015 Q3 was 17.8 TWh, an increase of 4.4 TWh (33 per cent) compared to 2014 Q3. This is 3.9 TWh (18 per cent) lower than the record of 21.7 TWh in 2015 Q1. Overall electricity generation decreased by 0.5 per cent (0.4 TWh) from 76.4 TWh in 2014 Q3 to 75.9 TWh in 2015 Q3. This helped to increase the share of renewable generation by 0.1 per cent.
Key results show:
Renewables’ share of electricity generation was 23.5 per cent in 2015 Q3, up 5.9 percentage points on the share in 2014 Q3, due to increasing renewable capacity and generally more favourable weather conditions for renewable generation (higher wind speeds and rainfall, but lower sun hours). (Chart 6.1)
Renewable electricity generation was 17.8 TWh in 2015 Q3, an increase of 33 per cent on the 13.4 TWh in 2014 Q3, though 18 per cent lower than the peak quarterly generation of 2015 Q1 (21.7 TWh). (Chart 6.2)
Onshore wind generation increased by 30 per cent, from 2.9 TWh in 2014 Q3 to 3.8 TWh in 2015 Q3. Offshore wind increased from 2.2 TWh to 3.4 TWh, an increase of 52 per cent. Solar PV increased by 73 per cent, from 1.6 TWh to 2.7 TWh due to increased capacity (Chart 6.2)
Renewable electricity capacity was 29.7 GW at the end of 2015 Q3, a 26 per cent increase (6.1 GW) on a year earlier, and a 4.0 per cent (1.1 GW) increase on the previous quarter, with high growth in solar photovoltaics and bioenergy capacity (largely plant biomass). (Chart 6.3)
By the end of 2015 Q3, 4.2 GW of capacity had been installed, and eligible for, the Feed in Tariff scheme, an increase of 28 per cent on a year earlier, constituting approximately 14 per cent of all renewable installed capacity. (Chart 6.5)
Liquid biofuels consumption fell by 21 per cent, from 485 million litres in 2014 Q3 to 382 million litres in 2015 Q3, with a 35 per cent decrease in biodiesel. In 2015 Q3, liquid biofuels represented 3.3 per cent of petrol and diesel consumed in road transport, down from 4.2 per cent a year earlier. (Chart 6.6)

Renewables
December 2015 44
Chart 6.2 Renewable electricity generation
Chart 6.3 Renewable electricity capacity (as at end of quarter)
Electricity generated from onshore wind increased by 0.9 TWh (30 per cent) between 2014 Q3 and 2015 Q3, from 2.9 TWh to 3.8 TWh, while generation from offshore wind increased by 52 per cent on a year earlier, from 2.2 TWh to 3.4 TWh. This is due to a combination of higher wind speeds compared to last year and also increased capacity, particularly for offshore wind. Average wind speeds in 2015 Q3 were lower than the ten year mean (7.7 knots and 8.0 knots respectively), though wind speeds for 2014 Q3 were the lowest for Q3 since 2002.2 Generation from solar PV increased by 73 per cent (1.1 TWh) compared to 2014 Q3, from 1.6 TWh to 2.7 TWh. This was due to increased capacity, which was up 81 per cent. In 2015 Q3, hydro generation rose by 34 per cent on a year earlier, from 0.8 TWh to 1.0 TWh, with rainfall (in the main hydro areas) up 18.4 per cent on a year earlier, though the average rainfall for 2014 Q3 was the lowest since 2003. Generation from bioenergy3 in 2015 Q3 increased by 16.3 per cent on a year earlier, from 5.9 TWh to, a record, 6.9 TWh. The main contributor to this was plant biomass, which increased from 3.6 TWh to 4.5 TWh, largely due to the full conversion of a third unit at Drax from coal to biomass in July 2015. In 2015 Q3, bioenergy had a 39 per cent share of generation, with 21 per cent from onshore wind, 19 per cent from offshore wind, and 15 per cent from solar. Solar photovoltaics and offshore wind saw the largest increase in the share of renewable generation on 2014 Q3, at 3.5 and 2.4 percentage points respectively. At the end of 2015 Q3, the UK’s renewable electricity capacity totalled 29.7 GW, an increase of 4.0 per cent (1.1 GW) on that installed at the end of 2015 Q2, and 26 per cent (6.1 GW) on that installed a year earlier. Of the 1.1 GW increase in capacity during 2015 Q3, more than half came from increases in plant biomass capacity due to the conversion of a third unit at Drax. Solar photovoltaics (PV) capacity increased by 0.3 GW in 2015 Q3, with around 0.2 GW of this from Feed in Tariff eligible schemes, and 17 MW from small-scale Northern Irish schemes. At the end of 2015 Q3, solar PV, at 8.8 GW, was 29 per cent of all renewable capacity. At the end of 2015 Q3, onshore wind and solar had the largest share of capacity (both at 29 per cent), followed by bioenergy (18 per cent) and offshore wind (17 per cent).
2 Statistics on weather (temperature, wind speeds, rainfall and sun levels) can be found in tables ET 7.1 – 7.4, at: www.gov.uk/government/publications/energy-trends-section-7-weather 3 Bioenergy consists of: landfill gas, sewage gas, biodegradable municipal solid waste, plant biomass, animal biomass, anaerobic digestion and co-firing (generation only)
To note that the solar PV (and onshore wind) figures not only include installations confirmed on the FiTs scheme, but also any sub 50 kW installations commissioned, and registered on the Microgeneration Certification Scheme, that are awaiting confirmation on FiTs (as well as any capacity not supported by FiTs).
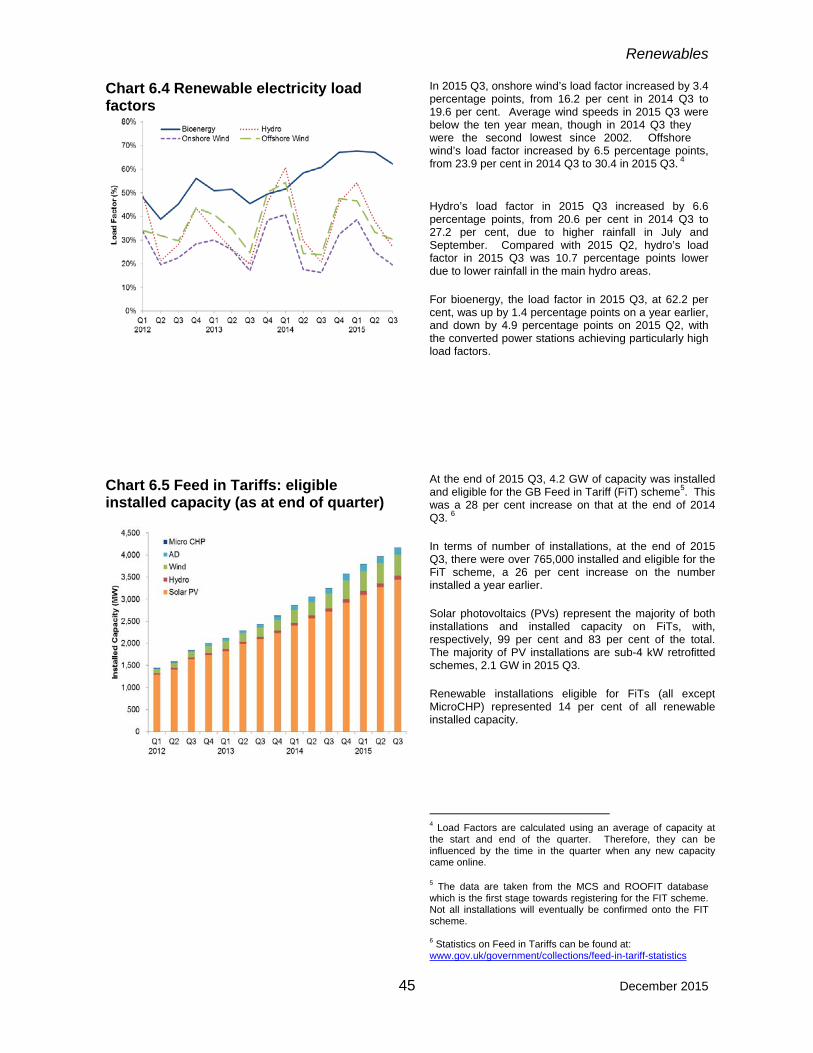
Renewables
45 December 2015
Chart 6.4 Renewable electricity load factors
Chart 6.5 Feed in Tariffs: eligible installed capacity (as at end of quarter)
In 2015 Q3, onshore wind’s load factor increased by 3.4 percentage points, from 16.2 per cent in 2014 Q3 to 19.6 per cent. Average wind speeds in 2015 Q3 were below the ten year mean, though in 2014 Q3 they were the second lowest since 2002. Offshore wind’s load factor increased by 6.5 percentage points, from 23.9 per cent in 2014 Q3 to 30.4 in 2015 Q3. 4 Hydro’s load factor in 2015 Q3 increased by 6.6 percentage points, from 20.6 per cent in 2014 Q3 to 27.2 per cent, due to higher rainfall in July and September. Compared with 2015 Q2, hydro’s load factor in 2015 Q3 was 10.7 percentage points lower due to lower rainfall in the main hydro areas. For bioenergy, the load factor in 2015 Q3, at 62.2 per cent, was up by 1.4 percentage points on a year earlier, and down by 4.9 percentage points on 2015 Q2, with the converted power stations achieving particularly high load factors. At the end of 2015 Q3, 4.2 GW of capacity was installed and eligible for the GB Feed in Tariff (FiT) scheme5. This was a 28 per cent increase on that at the end of 2014 Q3. 6 In terms of number of installations, at the end of 2015 Q3, there were over 765,000 installed and eligible for the FiT scheme, a 26 per cent increase on the number installed a year earlier. Solar photovoltaics (PVs) represent the majority of both installations and installed capacity on FiTs, with, respectively, 99 per cent and 83 per cent of the total. The majority of PV installations are sub-4 kW retrofitted schemes, 2.1 GW in 2015 Q3. Renewable installations eligible for FiTs (all except MicroCHP) represented 14 per cent of all renewable installed capacity.
4 Load Factors are calculated using an average of capacity at the start and end of the quarter. Therefore, they can be influenced by the time in the quarter when any new capacity came online. 5 The data are taken from the MCS and ROOFIT database which is the first stage towards registering for the FIT scheme. Not all installations will eventually be confirmed onto the FIT scheme. 6 Statistics on Feed in Tariffs can be found at: www.gov.uk/government/collections/feed-in-tariff-statistics

Renewables
December 2015 46
Chart 6.6 Liquid biofuels for transport consumption
In 2015 Q3, 382 million litres of liquid biofuels were consumed in transport, a fall of 21 per cent on the total in 2014 Q3 (485 million litres). This was mostly due to a fall in biodiesel. In 2015 Q3, biodiesel accounted for 2.4 per cent of diesel, and bioethanol 4.7 per cent of motor spirit. The combined contribution of the two fuels was 3.3 per cent, 0.9 percentage points lower than 2014 Q3’s share. Bioethanol consumption fell by 3.3 per cent, from 212 million litres in 2014 Q3 to 205 million litres in 2015 Q3. Biodiesel consumption fell by 96 million litres (35 per cent), to 177 million litres in the same period but actually increased from 2015 Q2 by 25 million litres (16 per cent). In 2015 Q3, bioethanol contributed the largest share of biofuels consumption, for the third successive quarter (following five successive quarters of biodiesel having the majority share), with 54 per cent. Biodiesel represented 46 per cent of biofuels consumption.
Relevant tables 6.1: Renewable electricity capacity and generation……………………………….........Page 47 6.2: Liquid biofuels for transport consumption……………………………….................Page 48
Contacts for further information: James Hemingway Liz Waters Renewables Statistics Renewables Statistics Tel: 0300 068 5042 Tel: 0300 068 5735 E-mail: [email protected]

6 RENEWABLESTable 6.1. Renewable electricity capacity and generation
2013 2013 2014 2014 2014 2014 2015 2015 2015
2013 2014 3rd quarter 4th quarter 1st quarter 2nd quarter 3rd quarter 4th quarter 1st quarter 2nd quarter 3rd quarter p
Cumulative Installed Capacity 1
Onshore Wind 7,519 8,486 +12.9 7,309 7,519 7,655 7,977 8,236 8,486 8,641r 8,719r 8,750 +6.2 Offshore Wind 3,696 4,501 +21.8 3,657 3,696 3,764 4,084 4,420 4,501 4,750 5,025 5,105 +15.5 Shoreline wave / tidal 7 9 +19.0 7 7 8 9 9 9 10 10 10 +11.5 Solar photovoltaics 2,851 5,378 +88.6 2,642 2,851 4,160 4,441 4,842 5,378 8,216r 8,468r 8,755 +80.8 Small scale Hydro 231 246 +6.7 224 231 239 240 242 246 257r 259r 260 +7.4 Large scale Hydro 1,477 1,477 - 1,477 1,477 1,477 1,477 1,477 1,477 1,477 1,477 1,477 - Landfill gas 1,043 1,051 +0.8 1,043 1,043 1,049 1,050 1,050 1,051 1,058r 1,058r 1,058 +0.7 Sewage sludge digestion 198 208 +5.3 198 198 204 205 205 208 216r 216r 216 +5.4 Energy from waste 550 696 +26.7 550 550 597 644 652 696 697 713 781 +19.9 Animal Biomass (non-AD) 2 111 111 - 111 111 111 111 111 111 111 111 111 - Anaerobic Digestion 164 216 +31.5 141 164 189 198 203 216 244r 245r 245 +20.5 Plant Biomass 3 1,955 2,244 +14.8 1,955 1,955 2,029 2,144 2,224 2,244 2,296r 2,297r 2,974 +33.8 Total 19,801 24,623 +24.4 19,313 19,801 21,481 22,578 23,670 24,623 27,972r 28,597r 29,741 +25.6 Co-firing 4
35 15 -56.8 35 35 15 15 15 15 11r 11r 11 -28.2
Generation 5 GWh
Onshore Wind 6 16,950 18,611 +9.8 2,705 6,309 6,690 3,003 2,909 6,010 7,162r 4,741r 3,781 +30.0 Offshore Wind 6, 7 11,472 13,404 +16.8 1,965 4,087 4,384 2,092 2,242 4,686 4,662 3,567r 3,401 +51.7 Shoreline wave / tidal 6 6 2 -62.3 1 1 0 1 0 1 1 1 1 (+) Solar photovoltaics 6 1,989 4,050 (+) 849 310 474 1,486 1,550 540 955r 3,227r 2,684 +73.2 Hydro 6 4,702 5,885 +25.2 744 1,734 2,240 1,114 782 1,748 2,025r 1,437r 1,044 +33.5 Landfill gas 6 5,160 5,045 -2.2 1,270 1,304 1,268 1,266 1,245 1,266 1,233r 1,192r 1,183 -5.0 Sewage sludge digestion 6 761 846 +11.1 184 196 195 228 212 211 219r 226r 206 -2.8 Energy from waste 8 1,649 1,950 +18.2 420 414 481 478 498 493 500 513 574 +15.4 Co-firing with fossil fuels 309 133 -56.8 39 50 25 37 37 34 35 13r 23 -36.0 Animal Biomass (non-AD) 2, 6 628 614 -2.3 144 151 159 161 132 162 169 169r 141 +6.9 Anaerobic Digestion 722 1,009 +39.7 183 205 233 247 256 273 304r 320r 322 +26.0 Plant Biomass 3, 6 8,930 13,105 +46.8 2,224 2,115 2,233 3,064 3,565 4,242 4,414r 4,442r 4,462 +25.2 Total 53,278 64,654 +21.4 10,729 16,876 18,384 13,177 13,426 19,667 21,678r 19,848r 17,823 +32.7 Non-biodegradable wastes 9
1,481 1,951 +31.7 377 372 482 478 498 493 501r 513 575 +15.4
Load Factors 10
Onshore Wind 28.8% 26.5% 17.1% 38.5% 40.8% 17.6% 16.2% 32.6% 38.7%r 25.0%r 19.6%
Offshore Wind 39.1% 37.3% 24.7% 50.3% 54.4% 24.4% 23.9% 47.6% 46.7% 33.4%r 30.4%
Solar photovoltaics 9.9% 11.2% 15.0% 5.1% 6.3% 15.8% 15.1% 4.8% 6.5%r 17.7%r 14.1%
Hydro 31.6% 39.2% 19.8% 46.1% 60.6% 29.7% 20.6% 46.0% 54.2%r 37.9%r 27.2%
Landfill gas 56.6% 55.0% 55.1% 56.6% 56.1% 55.2% 53.7% 54.6% 54.1%r 51.6%r 50.7%
Sewage sludge digestion 43.2% 47.5% 42.2% 44.7% 44.9% 51.1% 46.7% 46.2% 47.8%r 47.7%r 43.0%
Energy from waste 35.3% 35.8% 34.6% 34.1% 38.9% 35.3% 34.8% 33.1% 33.3% 33.3%r 34.8%
Animal Biomass (non-AD) 64.9% 63.4% 59.1% 61.9% 66.6% 66.7% 54.1% 66.4% 70.7% 70.1%r 57.8%
Anaerobic Digestion 58.3% 60.5% 60.6% 60.8% 60.9% 58.5% 57.8% 59.0% 61.1%r 60.0%r 59.7%
Plant Biomass 65.2% 71.2% 42.6% 49.0% 51.9% 67.3% 73.9% 86.0% 90.0%r 88.6%r 76.7%
Total (excluding co-firing and non-biodegradable wastes) 34.2% 33.2% 24.9% 39.0% 41.2% 27.3% 26.2% 36.8% 38.1%r 32.1%r 27.6%
1. Cumulative capacity at the end of the quarter/year2. Includes the use of poultry litter and meat and bone. 3. Includes the use of straw and energy crops. Also includes enhanced co-firing (>85% biomass). 4. This is the amount of fossil fuelled capacity used for co-firing of renewables based on the proportion of generation accountedfor by the renewable source over the course of the year.5. Generation figures for the latest quarter are highly provisional, particularly for the thermal renewable technologies (such as landfill gas) in the lower half of the table.6. Actual generation figures are given where available, but otherwise are estimated using a typical load factor or the designload factor, where known. All solar photovoltaic generation is estimated this way.
7. For 2009, shoreline wave and tidal are included in offshore wind.8. Biodegradable part only.9. Non-biodegradable part of municipal solid waste plus waste tyres, hosptal waste and general industrial waste.10. Load factors are calculated based on installed capacity at the beginning and the end of the quarter/year. These can be influenced by the time in the period when new capacity came online.
Load factors on an unchanged configuration basis, which consider just those sites operational throughout the year, are available annually in table DUKES 6.5, at:www.gov.uk/government/publications/renewable-sources-of-energy-chapter-6-digest-of-united-kingdom-energy-statistics-dukes11. Percentage change between the most recent quarter and the same quarter a year earlier; (+) represents a positive percentage change greater than 100%.
47
per cent change
per cent change 11
De
cem
be
r 20
15

6 RENEWABLESTable 6.2. Liquid biofuels for transport consumption
2013 2013 2014 2014 2014 2014 2015 2015 20152013 2014 3rd quarter 4th quarter 1st quarter 2nd quarter 3rd quarter 4th quarter 1st quarter 2nd quarter 3rd Quarter p
Volume (million litres) Million litresBioethanol 819 812 -0.9 224 202 192 206 212 202 189 203 205 -3.3%Biodiesel 766 955 +24.7 221 226 195 258 273 229 125 152 177 -35.2%Total biofuels for transport 1,585 1,767 +11.5 445 428 387 464 485 431 314 355 382 -21.2%
Energy (thousand toe)Bioethanol 462 458 -0.9 126 114 108 116 120 114 107 114 116 -3.3%Biodiesel 629 785 +24.7 182 186 160 212 224 188 103 125 145 -35.2%Total biofuels for transport 1,091 1,242 +13.9 308 300 268 328 344 302 209 239 261 -24.1%
Shares of road fuelsBioethanol as per cent of Motor Spirit 4.5% 4.6% 4.9% 4.5% 4.5% 4.5% 4.8% 4.6% 4.6% 4.6% 4.7%Biodiesel as per cent of DERV 2.8% 3.4% 3.2% 3.2% 3.0% 3.7% 3.9% 3.1% 1.8% 2.1% 2.4%Total biofuels as per cent of road fuels 3.5% 3.9% 3.9% 3.7% 3.6% 4.0% 4.2% 3.7% 2.9% 3.0% 3.3%
1. Percentage change between the most recent quarter and the same quarter a year earlier.Source: HM Revenue and Customs Hydrocarbon Oils Bulletin, available at
www.uktradeinfo.com/Statistics/Pages/TaxAndDutybulletins.aspx
per cent changeper cent change 1
De
cem
be
r 20
15
48

Special feature – Sub national electricity figures
49 December 2015
Electricity generation and supply figures for Scotland, Wales, Northern Ireland and England, 2011 to 2014
Introduction This article shows how generation and consumption of electricity varies across the four countries of the United Kingdom. It updates and extends that published in December 2014. The UK figures shown in the tables in this article are taken from the Digest of United Kingdom Energy Statistics (DUKES) 2015, Chapters 5 and 6 and so the definitions used are identical to those in the Digest. Tables 1 and 2 are shown in “landscape” format at the end of the main text and cover the last four years. Generation and trade Table 1 shows generation and supply of electricity in each of the UK countries. Because the mix of generating plant is not the same in each country, the overall percentage for each fuel type in individual years will change according to the fuels and stations that are available and the most advantageous to use. Between 2013 and 2014, England’s share of total generation increased from 76.4 per cent to 77.6 per cent, while Scotland’s share remained around the same at 14.3 per cent. For Wales, there was a decrease in the share from 7.1 per cent to 6.0 per cent, mainly due to a decline in nuclear and coal generation. Northern Ireland’s share of generation remained stable at 2.2 per cent. On average, over the last four years, 76.5 per cent of UK electricity generation has taken place in England, 14.3 per cent in Scotland, 7.0 per cent in Wales and 2.1 per cent in Northern Ireland. England is a net importer of electricity from Scotland and from continental Europe (via the France and Netherlands interconnectors), but was a net exporter to Wales for the first time in 2014. Net imports from France were a record high 15.0 TWh, while net imports from the Netherlands were 7.9 TWh, also a record high. In 2014, Scotland exported 23.7 per cent of the electricity generated there to consumers elsewhere in the UK; this has decreased from 28.0 per cent in 2013 due to a reduction in generation in Scotland (down 8.3 per cent) despite steady total consumption. Transfers from Scotland to England fell by 18.9 per cent between 2013 and 2014, following a record high in 2013. In 2014, Wales was a net importer from England for the first time. This was due to Wales experiencing a 21.8 per cent drop in generation but just a 4.5 per cent reduction in total consumption. Wales started trading with the Republic of Ireland in 2012 and has been a net exporter to them each year, with the equivalent of 11.5 per cent of Wales’ generation exported to the Republic of Ireland in 2014. Northern Ireland trades electricity with the Republic of Ireland and had been a net exporter for the previous three years; however it became a net importer from the Republic of Ireland for the first time in 2014. Northern Ireland also imports electricity from Scotland via the Moyle interconnector. Generation by fuel For each of the four UK countries, Table A1 shows the shares of the generation of electricity by the fuel categories used in Table 5.5 of the Digest of UK Energy Statistics 2015, for 2013 and 2014. The position in 2014 is shown in Chart 1, in terms of GWh. Due to planned and unplanned outages to nuclear stations, the nuclear share decreased slightly in 2014 after remaining steady from 2011 to 2013. In Scotland, the share of nuclear increased during 2011 to 2013 before falling slightly in 2014, while in Wales the share of nuclear generation saw a sharp fall in 2012 before rising slightly in 2013. This was succeeded by another large fall in 2014, down to 9.3 per cent of all generation in Wales, due to planned and unplanned outages.

Special feature – Sub national electricity figures
December 2015 50
Following a resurgence in 2012, coal’s share of UK generation rose has been falling, down to 29.8 per cent in 2014. The fall in coal generation in England is due to reduced capacity after the closure or partial closure of multiple coal plants that were opted out of the Large Combustion Plant Directive (LCPD)1. This includes the closure of one (of two) 980 MW unit at Ferrybridge C in April 2014 and the closure of Didcot A during 2013. Another factor in the reduction of coal generation in England was the conversion of two units of Drax from coal to biomass, one in 2013 and one in 2014. The decrease in the share of coal generation in Wales (from 44.4 per cent to 35.7 per cent) is due to the closure of Uskmouth in April 2014, as well as a reduction in generation at other plants due to market conditions. There was an increase in the share of gas generation between 2013 and 2014 in England (up from 30.3 per cent to 34.3 per cent), Wales (up from 17.3 per cent to 24.1 per cent) and Northern Ireland (45.8 per cent to 49.1 per cent). However, generation from gas fell from 10.3 per cent to 5.4 per cent in Scotland, mainly due to outages at Peterhead. Renewables’ share of generation has been continually increasing, reaching a record high of 19.1 per cent in 2014. The conversions at Drax have led to an increase in England’s renewables share of generation, up to 15.6 per cent in 2014. Of Scotland’s generation in 2014, 38 per cent was from renewables, up from 32 per cent in 2013, mainly due to the increase in the number of windfarms. Table A1: Shares of each country’s generation, by fuel type, 2013 and 2014 Scotland Wales Northern
Ireland England UK total
2013 Coal 20.4% 44.4% 34.0% 38.8% 36.4%
Gas 10.3% 17.3% 45.8% 30.3% 26.7%
Nuclear 34.9% 16.7% - 17.5% 19.7%
Renewables 32.0% 10.3% 19.5% 11.8% 14.8%
Oil and Other 2.4% 11.3% 0.7% 1.6% 2.4%
2014 Coal 20.3% 35.7% 28.3% 31.1% 29.7%
Gas 5.4% 24.1% 49.1% 34.3% 29.8%
Nuclear 33.3% 9.3% - 17.3% 18.8%
Renewables 38.0% 16.3% 22.2% 15.6% 19.1%
Oil and Other 2.9% 14.6% 0.3% 1.7% 2.6%
Combined heat and power (CHP) forms the bulk of “Other generators” generation, although some major power producers (MPPs) also operate generating plants that are partially CHP. CHP statistics for 2014 on a sub-national and regional basis were published in the September 2015 issue of Energy Trends2. The share of generation accounted for by generators other than major power producers varies across the UK. In Scotland, in 2014, other generators had a 14 per cent share (up from 12 per cent in 2013), while in England the share was 11 per cent (up from 9 per cent), in Wales 14 per cent (up from 11 per cent) and in Northern Ireland 14 per cent (unchanged from 2013). These larger shares were due to increases in smaller-scale renewables and reductions in larger-scale fossil fuel capacity.
1 Large Combustion Plant Directive (LCPD): Running hours during winter 2014/15 and capacity for 2015/16, page 71: www.gov.uk/government/statistics/energy-trends-september-2015-special-feature-articles 2 “Combined Heat and Power in Scotland, Wales, Northern Ireland and the regions of England in 2014” – Energy Trends September 2015, page 61: www.gov.uk/government/statistics/energy-trends-september-2015-special-feature-articles

Special feature – Sub national electricity figures
51 December 2015
Overall, the UK saw a decline in total generation due to reductions in capacity. The largest reduction in generation share was experienced by coal, with coal fired plants closing throughout 2013 and 2014 due to the LCPD along with conversions of coal units to biomass units at Drax. Adverse market conditions also led to a reduction in the use of coal for generation. Chart 1: Generation by country and fuel type in 2014 (all generating companies)
Revisions In the 2015 edition of DUKES, non-biodegradable waste was reclassified from ‘bioenergy’ to ‘other fuels’ for MPPs for 2013 and 2014. As a result, 522 GWh of ‘bioenergy’ was moved to ‘other fuels’ in 2013, but due to other revisions to the data since the 2014 edition of DUKES this has only resulted in a net fall of 119 GWh of bioenergy for 2013. Only England has been affected by this reclassification. In the article from last year some generation was incorrectly allocated to Wales for 2012 and 2013. As a result, 430.6 MWh has been reallocated from Wales to England for 2012 and 552.9 MWh has been reallocated for 2013. Renewables The share of renewables in electricity generation or sales is measured in two different ways in the UK3. First, there is the “headline” overall measure that shows the percentage of electricity generation accounted for by all renewables. Secondly, there is the measure that is based on the Renewables Obligation (RO) (and the analogous Renewables Obligation (Scotland) - ROS) which shows the percentage of electricity sales accounted for by renewables eligible under these
3 There is also a third method used by the EU – a Renewables Directive basis – see Chapter 6 of the Digest of UK Energy Statistics 2015, table 6.7 and paragraph 6.43.

Special feature – Sub national electricity figures
December 2015 52
obligations. The main differences are the exclusion from the RO of large-scale hydro and non-biodegradable wastes4. Table A2 shows the overall measure for 2011, 2012, 2013 and 2014.
Table A2: Renewables percentages
UK Scotland Wales Northern Ireland England Overall
renewables percentage
2011 9.4 26.7 8.4 12.6 6.2 2012 11.3 29.1 9.3 15.9 8.1 2013 14.8 32.0 10.3 19.5 11.8
2014 19.1 38.0 16.3 22.2 15.6 With its high proportion of natural flow hydro, as well as wind generation increasing over the last few years due to increased capacity, renewables’ share in Scotland under the headline measure increased by 6.0 percentage points to stand at 38.0 per cent in 2014. This increase was mainly due to a rise in hydro generation as a result of higher rainfall, up 15 per cent from 2013. In 2014, Scotland, Wales, Northern Ireland and England all had a record high percentage of electricity generated by renewables. On a RO basis, the percentage measure for the UK (9.8 per cent in 2011, 11.9 per cent in 2012, 16.1 per cent in 2013 and 19.1 per cent in 2014) is not meaningful at sub-national level because electricity generated in one part of the UK can be sold in a different part of the UK. In Scotland, the renewables target (which is to reach 100 per cent by 2020) is expressed as generation as a proportion of gross electricity consumption (defined as generation plus transfers into Scotland less transfers out of Scotland). In 2011, this percentage was 36.2 per cent, increasing to 39.0 per cent in 2012. In 2013, this rose to 44.4 per cent and has continued to rise to 49.7 per cent in 2014. The next interim target is to reach 50 per cent by 2015. The amount of electricity from renewable sources transferred from Scotland or Wales to England, or from Scotland to Northern Ireland, is not known. What is known from Table 2 is that the amount of ROS eligible electricity generated in Scotland in 2014 was 4.4 per cent more than in 2013, while the amount of RO eligible electricity generated in Wales in 2014 was 13.3 per cent more than in 2013. In England, the increase was 17.1 per cent. In Northern Ireland RO eligible electricity generated was 9.3 per cent more. In the UK as a whole, RO eligible electricity production increased by 12.9 per cent. Over the four years shown in Table 2, the increases in RO eligible electricity production have been substantial across all countries, namely 65 per cent for Northern Ireland, 43 per cent for Scotland, 31 per cent for Wales and 121 per cent for England. Renewables statistics for 2014 on a sub-national and regional basis were published in the September 2015 issue of Energy Trends5 (see references at the end of the article).
4 Specific exclusions from eligibility for the RO are existing hydro plant over 20 MW; all plant using renewable sources built before 1990 (unless re-furbished); and energy from mixed waste combustion unless the waste is first converted to fuel using advanced conversion technology. 5 “Renewable energy in Scotland, Wales, Northern Ireland and the regions of England in 2014” – Energy Trends September 2015, page 49: www.gov.uk/government/statistics/energy-trends-september-2015-special-feature-articles

Special feature – Sub national electricity figures
53 December 2015
Chart 2: Electricity consumption in 2014
Consumption and sales Transmission and distribution losses are not separately available for Scotland, Wales, Northern Ireland and England so estimates have been made using the UK proportions. Consumption figures have then been calculated by deducting net transfers and losses figures from the electricity supplied figures shown in Table 1. These show (Chart 2) that in 2014, 10.4 per cent of electricity consumption in the UK was in Scotland, 5.1 per cent in Wales, 2.5 per cent in Northern Ireland and 82.0 per cent in England. These are all of little variation from the average percentage shares for each country for the period 2011 to 2014, namely 82.1 per cent for England, 10.0 per cent for Scotland, 5.3 per cent for Wales and 2.6 per cent for Northern Ireland.
Separate data is collected for sales of electricity from the public supply system in Scotland, England and Wales, and Northern Ireland and published in monthly table ET 5.5 on DECC’s Energy Statistics website (see references at the end of the article), but for this article the breakdown between England and Wales has been estimated. Because of definitional and other differences set out in the technical notes to Chapter 5 of DUKES 2015, there is a statistical difference between the calculated consumption and the sales data in Table 1. The overall statistical difference for the UK equals that shown in Table 5.2 of DUKES for the UK as a whole for the public distribution system.
As part of its commitment to improving the quality of its statistics, DECC continues to examine this statistical difference and look further at the component series to see where the differences might be arising and thus where improvements to the data might be made. Chart 3 shows the relationship between generation and consumption of electricity in each of the countries by means of a flow diagram. Stephen Ashcroft Sophie Brough Electricity Statistics Electricity Statistics Tel: 0300 068 2928 Tel: 0300 068 5046 E-mail: [email protected] E-mail: [email protected]

Special feature – Sub national electricity figures
December 2015 54
References: Digest of UK Energy Statistics 2015 (DUKES); published for DECC by The Stationery Office. £75.00, but also available on DECC’s energy statistics website at: www.gov.uk/government/statistics/electricity-chapter-5-digest-of-united-kingdom-energy-statistics-dukes Energy Trends monthly table 5.5: www.gov.uk/government/statistics/electricity-section-5-energy-trends Large Combustion Plant Directive (LCPD): Running hours during winter 2014/15 and capacity for 2015/16, page 71: www.gov.uk/government/statistics/energy-trends-september-2015-special-feature-articles “Combined Heat and Power in Scotland, Wales, Northern Ireland and the regions of England in 2014” – Energy Trends September 2015, page 61: www.gov.uk/government/statistics/energy-trends-september-2015-special-feature-articles “Renewable energy in Scotland, Wales, Northern Ireland and the regions of England in 2014” – Energy Trends September 2015, page 49: www.gov.uk/government/statistics/energy-trends-september-2015-special-feature-articles
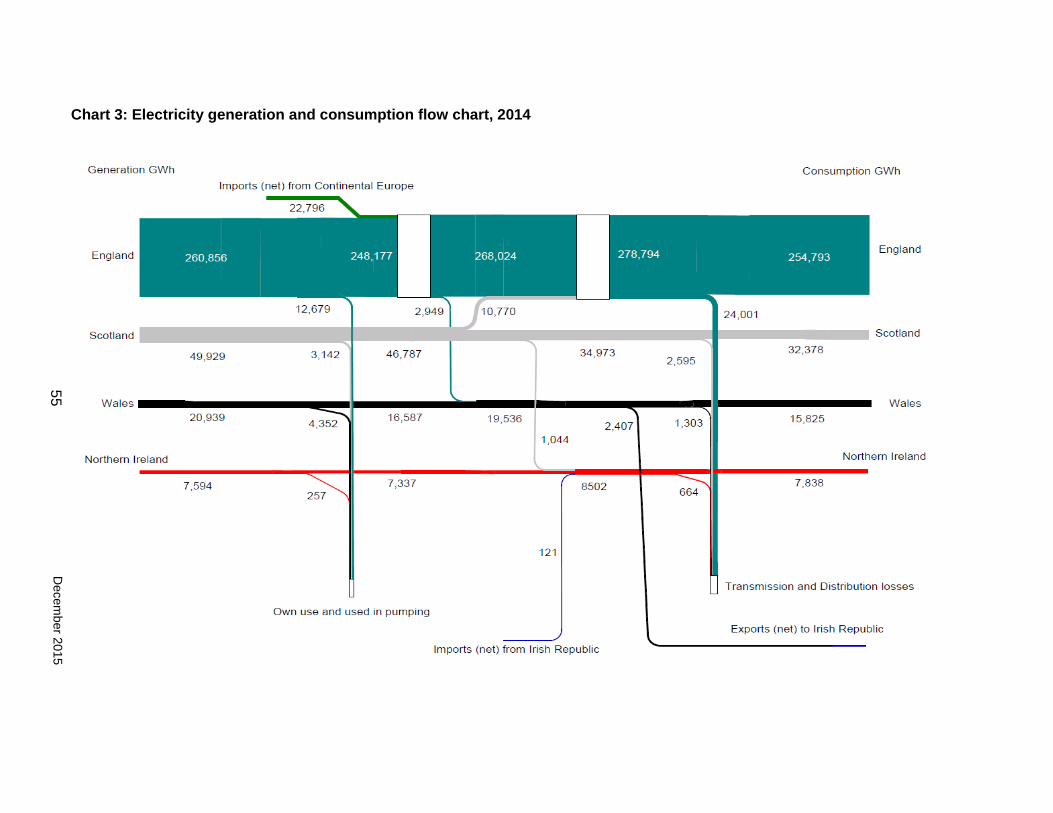
Chart 3: Electricity generation and consumption flow chart, 2014
Decem
ber 2015 55

Table 1: Generation and supply of electricity in Scotland, Wales, Northern Ireland and England, 2011 to 2014 GWh
2011 2012
UK total Scotland WalesNorthern
Ireland England UK total Scotland WalesNorthern
Ireland England
Generated by Major power producers 332,461 44,880 25,043 7,319 255,219 328,270 44,823 23,598 6,573 253,275
Other generators 34,960 6,290 2,559 618 25,494 35,309 5,697 2,529 822 26,260
Total generated 367,422 51,170 27,601 7,937 280,714 363,579 50,520 26,127 7,396 279,535
Own use by Other generators 1,951 351 143 34 1,423 2,108 340 151 49 1,568
Electricity supplied (net) by Other generators 33,009 5,939 2,416 583 24,071 33,200 5,357 2,378 773 24,692
Used in pumping at pumped storage and other own use by MPPs 18,322 2,924 4,149 179 11,070 19,837 2,995 4,332 196 12,314
Electricity supplied (net) by MPPs 314,140 41,956 20,893 7,140 244,149 308,433 41,828 19,267 6,377 240,961
Electricity transferred to England (net of receipts) - 11,597 3,652 - -15,250 - 10,717 2,157 - -12,874Electricity transferred to Northern Ireland (net of receipts) - 1,769 - -1,769 - - 2,162 - -2,162 -
Electricity transferred to Europe (net of receipts) -6,222 - - 245 -6,467 -11,871 - 104 160 -12,135
Transfers from other generators to public supply 14,931 2,976 1,005 449 10,501 15,882 2,895 901 618 11,468
Transmission losses 6,470 632 360 169 5,308 6,757 656 370 175 5,556
Distribution losses 21,658 1,810 1,091 548 18,210 22,148 1,880 1,104 544 18,620
Consumption from public supply [A] 307,175 29,126 16,796 8,396 252,857 307,297 29,311 16,433 8,279 253,274
Consumption by autogenerators 18,068 2,961 1,410 134 13,563 17,303 2,460 1,476 155 13,213
Total Electricity consumption 325,243 32,087 18,206 8,530 266,419 324,600 31,771 17,909 8,433 266,487
Electricity sales (public supply) [B] 308,033 29,783 17,241 8,209 252,801 308,408 28,749 17,109 7,942 254,608
Statistical difference -858 -657 -445 +188 +56 -1,111 +562 -677 +337 -1,334
between calculated consumption [A] and sales [B]
Decem
ber 20
15 56

Table 1 continued: Generation and supply of electricity in Scotland, Wales, Northern Ireland and England, 2011 to 2014 GWh
2013 2014
UK total Scotland WalesNorthern
Ireland England UK total Scotland WalesNorthern
Ireland England
Generated by Major power producers 324,725 46,778 23,024 6,706 248,217 300,823 42,876 17,997 6,520 233,430
Other generators 34,443 6,185 2,843 1,072 24,342 38,104 7,052 2,942 1,075 27,426
Total generated 359,168 52,963 25,867 7,778 272,560 338,927 49,929 20,939 7,594 260,856
Own use by Other generators 2,222 399 183 69 1,570 2,563 474 198 72 1,845
Electricity supplied (net) by Other generators 32,221 5,786 2,660 1,003 22,772 35,541 6,578 2,744 1,002 25,582
Used in pumping at pumped storage and other own use by MPPs 19,598 3,090 4,538 199 11,770 17,842 2,668 4,155 184 10,835
Electricity supplied (net) by MPPs 305,127 43,688 18,485 6,507 236,447 282,981 40,209 13,842 6,335 222,595
Electricity transferred to England (net of receipts) - 13,275 1,143 - -14,418 - 10,770 -2,949 - -7,821Electricity transferred to Northern Ireland (net of receipts) - 1,541 - -1,541 - - 1,044 - -1,044 -
Electricity transferred to Europe (net of receipts) -14,429 - 2,161 45 -16,636 -20,510 - 2,407 -121 -22,796
Transfers from other generators to public supply 13,998 3,424 1,178 877 8,520 14,916 4,059 1,423 989 8,445
Transmission losses 6,351 626 322 163 5,241 6,489 669 328 156 5,336
Distribution losses 21,374 1,810 952 501 18,111 22,073 1,925 975 508 18,665
Consumption from public supply [A] 305,851 29,864 15,087 8,216 252,685 289,862 29,862 14,505 7,826 237,668
Consumption by autogenerators 18,201 2,359 1,481 125 14,237 20,608 2,516 1,320 13 17,125
Total Electricity consumption 324,052 32,222 16,567 8,341 266,922 310,470 32,378 15,825 7,839 254,793
Electricity sales (public supply) [B] 306,640 28,879 17,342 7,714 252,706 291,100 27,421 16,791 7,436 239,453
Statistical difference -789 +985 -2,255 +502 -21 -1,239 +2,442 -2,286 +390 -1,785
between calculated consumption [A] and sales [B]
Figures in this table do not sum exactly to the UK totals shown because of rounding
Decem
ber 2015 57

Table 2: Generation of electricity by fuel in Scotland, Wales, Northern Ireland and England, 2011 to 2014 GWh 2011 2012
UK total Scotland WalesNorthern
Ireland England UK total Scotland WalesNorthern
Ireland EnglandMajor power Coal 104,797 10,728 6,170 1,414 86,485 140,164 11,867 10,824 2,367 115,105producers: Oil 1,074 160 - 52 862 1,132 155 - 44 933 Gas 132,753 6,227 9,880 5,301 111,346 86,229 3,680 4,737 3,609 74,204 Nuclear 68,980 16,892 5,364 - 46,725 70,405 17,050 4,141 - 49,214 Thermal renewables 4,518 274 76 - 4,167 6,067 422 104 - 5,542 Other thermal - - - - - - - - - - Hydro natural flow 4,594 4,362 210 - 21 4,169 3,859 287 - 24 Hydro pumped storage 2,906 604 2,301 - - 2,966 610 2,357 - - Non thermal renewables 12,840 5,632 1,041 553 5,614 17,137 7,181 1,149 553 8,253 Total 332,461 44,880 25,043 7,319 255,219 328,270 44,823 23,598 6,573 253,275
Other Coal 3,774 51 - 36 3,687 2,992 25 - 39 2,928Generators: Oil 2,043 780 121 36 1,106 1,439 449 56 36 899 Gas 13,767 2,028 926 96 10,717 13,931 1,959 1,125 124 10,724 Thermal renewables 8,435 984 540 82 6,828 8,581 1,063 466 109 6,943 Other thermal 1,714 - 508 - 1,207 1,767 27 454 - 1,286 Hydro natural flow 1,086 957 58 20 50 1,116 980 51 21 64 Non thermal renewables 3,056 1,476 404 348 828 4,054 1,181 377 494 2,002 Wastes 1,085 14 - - 1,071 1,429 14 - - 1,415 Total 34,960 6,290 2,559 618 25,494 35,309 5,697 2,529 822 26,260Total generation by fuel 367,422 51,170 27,601 7,937 280,714 363,579 50,520 26,127 7,396 279,535within which: Renewables Hydro 5,680 5,319 269 20 72 5,285 4,838 337 21 88 Wind, wave, solar 15,896 7,108 1,445 901 6,442 21,191 8,362 1,527 1,047 10,255 Other 12,953 1,259 617 82 10,995 14,648 1,485 570 109 12,484 Total 34,529 13,686 2,331 1003 17,509 41,124 14,685 2,434 1177 22,828Renewables eligible under the renewables obligation 28,919 10,634 2,016 1,056 15,213 33,406 11,457 1,966 1,123 18,860
Percentage Coal 29.5% 21.1% 22.4% 18.3% 32.1% 39.4% 23.5% 41.4% 32.5% 42.2%
shares of Oil 0.8% 1.8% 0.4% 1.1% 0.7% 0.7% 1.2% 0.2% 1.1% 0.7%generation: Gas 39.9% 16.1% 39.1% 68.0% 43.5% 27.5% 11.2% 22.4% 50.5% 30.4% Nuclear 18.8% 33.0% 19.4% - 16.6% 19.4% 33.7% 15.8% - 17.6% Hydro natural flow 1.5% 10.4% 1.0% 0.3% - 1.5% 9.6% 1.3% 0.3% - Other renewables 7.9% 16.4% 7.5% 12.4% 6.2% 9.9% 19.5% 8.0% 15.6% 8.1% Other 1.6% 1.2% 10.2% - 0.8% 1.7% 1.3% 10.8% - 1.0% Total 100% 100% 100% 100% 100% 100% 100% 100% 100% 100%
58 D
ecembe
r 2015
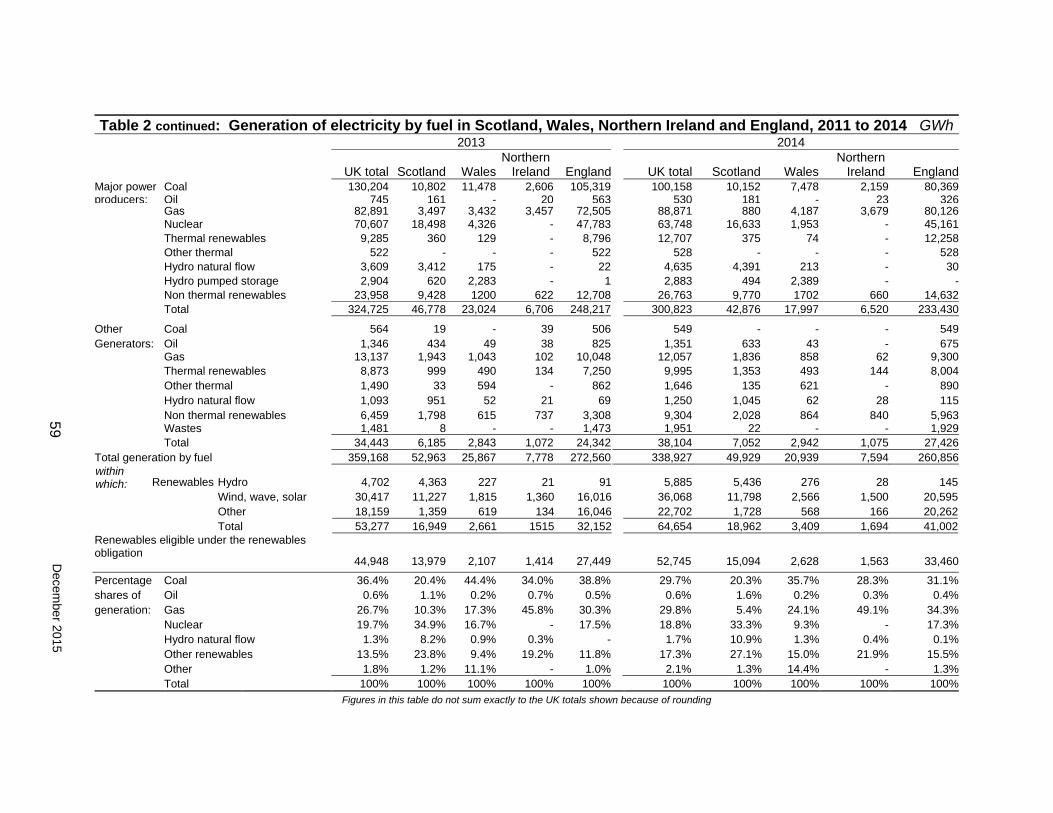
Table 2 continued: Generation of electricity by fuel in Scotland, Wales, Northern Ireland and England, 2011 to 2014 GWh
2013 2014
UK total Scotland WalesNorthern
Ireland England UK total Scotland WalesNorthern
Ireland EnglandMajor power Coal 130,204 10,802 11,478 2,606 105,319 100,158 10,152 7,478 2,159 80,369producers: Oil 745 161 - 20 563 530 181 - 23 326 Gas 82,891 3,497 3,432 3,457 72,505 88,871 880 4,187 3,679 80,126 Nuclear 70,607 18,498 4,326 - 47,783 63,748 16,633 1,953 - 45,161 Thermal renewables 9,285 360 129 - 8,796 12,707 375 74 - 12,258 Other thermal 522 - - - 522 528 - - - 528 Hydro natural flow 3,609 3,412 175 - 22 4,635 4,391 213 - 30 Hydro pumped storage 2,904 620 2,283 - 1 2,883 494 2,389 - - Non thermal renewables 23,958 9,428 1200 622 12,708 26,763 9,770 1702 660 14,632 Total 324,725 46,778 23,024 6,706 248,217 300,823 42,876 17,997 6,520 233,430
Other Coal 564 19 - 39 506 549 - - - 549Generators: Oil 1,346 434 49 38 825 1,351 633 43 - 675 Gas 13,137 1,943 1,043 102 10,048 12,057 1,836 858 62 9,300 Thermal renewables 8,873 999 490 134 7,250 9,995 1,353 493 144 8,004 Other thermal 1,490 33 594 - 862 1,646 135 621 - 890 Hydro natural flow 1,093 951 52 21 69 1,250 1,045 62 28 115 Non thermal renewables 6,459 1,798 615 737 3,308 9,304 2,028 864 840 5,963 Wastes 1,481 8 - - 1,473 1,951 22 - - 1,929 Total 34,443 6,185 2,843 1,072 24,342 38,104 7,052 2,942 1,075 27,426Total generation by fuel 359,168 52,963 25,867 7,778 272,560 338,927 49,929 20,939 7,594 260,856within which: Renewables Hydro 4,702 4,363 227 21 91 5,885 5,436 276 28 145 Wind, wave, solar 30,417 11,227 1,815 1,360 16,016 36,068 11,798 2,566 1,500 20,595 Other 18,159 1,359 619 134 16,046 22,702 1,728 568 166 20,262 Total 53,277 16,949 2,661 1515 32,152 64,654 18,962 3,409 1,694 41,002Renewables eligible under the renewables obligation
44,948 13,979 2,107 1,414 27,449 52,745 15,094 2,628 1,563 33,460
Percentage Coal 36.4% 20.4% 44.4% 34.0% 38.8% 29.7% 20.3% 35.7% 28.3% 31.1%shares of Oil 0.6% 1.1% 0.2% 0.7% 0.5% 0.6% 1.6% 0.2% 0.3% 0.4%generation: Gas 26.7% 10.3% 17.3% 45.8% 30.3% 29.8% 5.4% 24.1% 49.1% 34.3% Nuclear 19.7% 34.9% 16.7% - 17.5% 18.8% 33.3% 9.3% - 17.3% Hydro natural flow 1.3% 8.2% 0.9% 0.3% - 1.7% 10.9% 1.3% 0.4% 0.1% Other renewables 13.5% 23.8% 9.4% 19.2% 11.8% 17.3% 27.1% 15.0% 21.9% 15.5% Other 1.8% 1.2% 11.1% - 1.0% 2.1% 1.3% 14.4% - 1.3% Total 100% 100% 100% 100% 100% 100% 100% 100% 100% 100%
Figures in this table do not sum exactly to the UK totals shown because of rounding
Decem
ber 20
15 59

Special feature – European gas flows
December 2015 60
Physical gas flows across Europe and diversity of gas supply in 2014
Background This article has two main purposes. The first is to illustrate physical gas flows at the European level using 20141 data published by the International Energy Agency (IEA). The second is to attempt to compare the resilience of the UK’s supply infrastructure with that of other EU Member States. European Physical Gas Flows European Gas Production The total EU-28 gas production in 2014 was 152.9 billion cubic metres (bcm), with the Netherlands and the UK accounting for 46 per cent and 25 per cent of this total respectively. This is 11.3% lower than EU-28 production in 2013 which was 172.4 bcm, mainly since Netherlands production decreased by nearly a fifth. Out of all EU-28 countries, only the Netherlands and Denmark produced more gas than they consumed, demonstrating Europe’s reliance on gas imports from outside the EU. European Gas Consumption The largest demand among EU-28 countries came from Germany, the United Kingdom and Italy. Similar to 2013, these countries together accounted for over 50 per cent of EU-28 consumption. Germany remained the largest net importer in Europe in 2013 at 72 bcm, followed by Italy at 55 bcm and then France at 40 bcm2. Overall EU-28 net imports decreased by 7% compared to 2013. Natural gas consumption in the EU-28 decreased considerably in 2014 compared to 2013, from 481 bcm to 430 bcm. All EU countries saw a reduction in gas demand with the Netherlands, Germany, Italy, France and UK contributing most significantly to this decrease. This partially reflected warmer weather in 2014 along with some fuel switching. Sources of Gas There are four sources of gas supply available to EU Member States: indigenous production, gas storage facilities, imports via Liquefied Natural Gas (LNG) terminals and imports via pipeline (see Chart 1, overleaf). Many counties use all four routes to meet their needs. The largest single category of gas supply to the EU-28 was indigenous production, supplying 36 per cent of EU-28 consumption in 2014. A total of 14 countries have at least some indigenous gas production with the largest being from the Netherlands and UK which met 17 and 9 per cent of total EU demand respectively. Aside from indigenous production, the Russian Federation remained the single supplier of gas to the EU-28, delivering around 116 bcm in 2014 compared to 131 bcm in 2013. In both years this accounted for 27 per cent of total EU-28 gas demand. The European pipeline infrastructure means that Central and Eastern European countries receive almost all of their natural gas supply from Russia. It should be noted that the origin of all of this gas is not necessarily Russian, since Russia acts as a transit country for gas from Kazakhstan and Turkmenistan to reach European markets. Norwegian exports to the EU-28 increased between 2013 and 2014. In 2014 was around 108 bcm or 24 per cent of total EU-28 gas consumption compared to 22 per cent in 2013. This was due to an increase in exports to Germany; 23 per cent of Norwegian exports were directed to the UK in 2014.
1 January 1st 2014 to December 31st 2014 data 2 These numbers differ slightly from the IEA’s annual figures due to the adjustments necessary to balance supply. The supply for some countries may appear unbalanced as stock changes are not shown. Data were calculated primarily from 2014 monthly pipeline gas flows, with 2014 annual imports, exports, production and consumption used for quality assurance amendments.

Special feature – European gas flows
61 December 2015
Imports of LNG into the EU-28 were 42.3 bcm in 2014 versus 39.7 bcm in 2013. LNG met 10 per cent of EU-28 demand. The largest suppliers of LNG to the EU-28 were Qatar, Algeria and Nigeria, who supplied 40, 29 and 11 per cent of total EU-28 LNG imports respectively. North African pipelines via Spain and Italy provided 29 bcm, or 7 per cent, of EU-28 demand. Algerian gas, coming direct from Algeria as well as via Morocco and Tunisia, accounted for 78 per cent of North African gas delivered to the EU-28, with Libya supplying the remainder. Chart 1: Sources of EU-28 gas, 2014
UK Flows in 2014 UK consumption in 2014 was 70.2 bcm, down from 77.9 in 2013. Around 55% of this was met by indigenous production in 2014, an increase on the 50% reported in 2013. The remaining demand was met by LNG imports (27 per cent) and pipeline imports from Norway (57 per cent of the total), Netherlands (15 per cent) and Belgium (1 per cent). There are no direct imports of Russian gas, though small volumes may exist in the Dutch and Belgian flows. Despite the large volume of imports, the UK is also a major exporter to the rest of the EU, exporting 10.9 bcm to Ireland (37% of total exports), Belgium (40%) and the Netherlands (20%). UK imports of LNG increased by 21 per cent, from 9.4 bcm in 2013 to 11.3 bcm in 2014, keeping the UK as the second largest importer of LNG in 2014, behind Spain. 92 per cent of UK imports of LNG came from Qatar in 2014, down from 93 per cent in 2013 and 98 per cent in 2012. Note The map below uses pipeline data from the IEA to show entry and exit flows between countries and does not necessarily indicate that the gas actually passed through the domestic infrastructure of a country (for instance: Russian gas is transmitted to Turkey through Bulgaria but is separate to the Bulgarian domestic network).

NORWAY
SWEDEN
UK
IRELAND
DENMARK
NETHERLANDS
BELGIUM
FRANCE
SPAINPORTUGAL
ITALY
MOROCCO ALGERIA TUNISIALIBYA
LUXEMBOURG
GERMANY
SWITZERLAND
AUSTRIA
CZECH REP.
POLAND
SLOVENIA
CROATIA
BOS & HERZ
SERBIA
MACEDONIA
GREECE
HUNGARY
ROMANIA
BULGARIA
MOLDOVA
UKRAINE
BELARUS
LITHUANIA
LATVIA
ESTONIA
RUSSIA
FINLAND
SLOVAK REP.
TURKEY
GEORGIA
MONTENEGRO
ALBANIA
RUSSIA
NORD STR
EAM
2014 European Physical Gas Flows
0.0 PRODUCTION0.0 CONSUMPTION
Gas pipelines
LNG
Units: billion cubic metres
0.2 4.4
38.5 70.2 70.0 40.0
4.6 3.2
‐ 15.8
10.1 77.5
‐ 35.8
‐ 27.2‐ 4.0
‐ 3.3
‐ 1.0
112.6 6.1
‐ 0.9
‐ 3.1
‐ 0.5
‐ 1.3
1.2 7.8
0.2 7.5
6.1 17.9
7.1 61.9
1.9 8.3
0.1 4.0
11 11.8
0.2 2.9
‐ 2.8
0 0.8
0.5 2.41.7 2.4
‐ 0.2
‐ 2.9
‐ 0.20.5 48.5
‐ 1.9
0.2 20.3
‐ 2.6
643.6 461.5
‐ ‐
‐ ‐
LNG1.1
LNG9.9
LNG4.6
LNG0.6
LNG7.6
LNG6.0
LNG11.3
LNG1.2
LNG0.5
LNG0.0
LNG5.2
2.8
9.5
4.2
6.5
4.3
24.5
6.8
6.5
0.6
8.9
6.1
14.2
12.7
0.9
3.1
33.9
0.1
2.2
0.6
2.0
61.2
72.4
2.8
0.0
17.2
0.2
1.7
0.3
4.5
36.6
0.9
3.4
17.7
0.6
6.4
30.8
0.2
15.5
14.7
17.5
1.8
0.5
30.1
0.5
0.70.21.3
29.1 0.4
2.2
8.4
0.44.44.5
21.3
38.7
15.3
3.1
1.9
6.7
18.8 0.5
0.5
3.1
0.4
12.0
1.2
10.7
11.30.1
26.2
0.1
0.0
0.1
0.4
0.1
0.01.6
0.1
1.0
9.4
0.0 0.5
32.2 0.00.0
4.1
1.6
0.1
0.0 0.0
19.5
36.0
19.4 35.6
8.0
3.5
Decem
ber 2015 62
Special feature – European gas flows
63 December 2015
EU-28 Infrastructure peak daily gas supply in 2014 As noted above, there are four sources of gas supply available to EU Member States: indigenous production, gas storage facilities, imports via LNG terminals and imports via pipeline, with many countries making use of all of these routes to meet their demand. We have used the peak flow (i.e. the maximum gas deliverable in billion cubic metres per day) as a comparative measure of gas supply for each individual source for each country. For pipeline and LNG terminal, peak flow data were extracted from IEA physical gas flows data3. Similarly, peak outputs for storage facilities were extracted from the IEA Natural Gas Information 20154. Storage facilities are assumed to be capable of working at peak capacity during times of peak demand. Although this is susceptible to inaccuracies, as peak capacity from storage facilities may not indeed be achievable by the point of peak demand in EU member states, it does allow a consistent metric across all storage facilities. Data for peak outputs for production was estimated, by taking the maximum monthly production (bcm) in 2014 for each gas-producing member state and dividing this by the number of days in that month. Chart 2 shows peak gas supply for each individual country as a stacked bar chart, with different colours representing different categories of gas supply. Stacks were arranged with production and storage facilities stacked at the base of the chart and imports via LNG terminals and pipelines stacked above. Further, for these imports and storage sources, data were divided within categories by individual source (represented by horizontal lines within an individual bar colour). Please note these data were collected from a range of sources and we have not confirmed each of the data items with the countries who submit data to the IEA. Chart 2 includes all EU-28 member states in order of peak gas demand. The estimated peak gas demand data (bcm per day) are included within Chart 2 as a single line-and-cross plot running across the graph. Peak gas demand acts as a comparator for peak gas supply, and was estimated for each country by taking the maximum monthly demand in 2014 (bcm) divided by the number of days within that month. Whilst this is a conservative estimate, it does allow for a common metric for comparison. Data for peak flows are provided in the table in Annex 1. Chart 2 shows that in all EU countries for which data were available, maximum gas supply exceeded peak demand. According to the data, Germany had the highest peak demand in 2014, but also had the largest potential peak output from both indigenous storage facilities and import pipelines. The data indicated that only the Netherlands had sufficient indigenous production capacities to meet peak daily demand. The majority of countries had a peak supply more than double that of peak demand, with the exception of Finland and Sweden. The UK had the second largest peak demand of the EU member states.
3 www.iea.org/gtf/index.asp
4 Natural Gas Information 2015, International Energy Agency, ISBN 9789264238930

Special feature – European gas flows
December 2015 64
Chart 2: Estimated Peak outputs for gas supply sources versus estimated peak demand for EU-28 Member States
Source: DECC analysis of IEA data. *Cyprus and Malta have no consumption and are included for completeness only. For import data, stacks are further divided by number/volume of pipelines/terminals. Data are provided in Table in Annex 1.
Looking at the pipeline import data in Chart 2 (red stacks), it is clear that the five member states with the largest peak demand have a diverse range of import pipelines. Germany in particular has a large number of import pipelines, 26 in total. There are substantially fewer import pipelines in EU countries east of Germany. Of particular note, the Slovak Republic appeared to have a peak supply that far exceeded demand, where almost all of this came via a single pipeline from Russia, which has pipelines transiting through to several other member states.” Aside from Spain (six), the UK (four) and Italy and France (three), all other member states had at most a single LNG terminal. EU-28 Gas Infrastructure Resilience 2014 In order to given an indication of the resilience of the gas supply infrastructure, we have developed a simple methodology that takes the sum of all gas supplies coming into a country running at maximum capacity (PF, peak flow), removes the largest supply route, and looks at the remaining percentage supply relative to peak demand. The equation below indicates PF as
max
maxmaxmaxmaxmax%1D
ILNGSPEPPF
Equation 1
Where: PF = Peak Flow (bcm/day)
EPmax = Peak capacity of entry points (bcm/day) Pmax = Peak capacity for each indigenous production pipeline (bcm/day) Smax = Peak output for each storage facility (bcm/day) LNGmax = Peak output for each LNG terminal (bcm/day) Dmax = Average 2013 peak gas demand (bcm/day) Imax = Peak daily capacity of single largest supply route (bcm/day)

Special feature – European gas flows
65 December 2015
This formula is similar to a more widely used metric - the ‘N-1’ measure of supply outlined in the EU Regulation No. 994/2010 - but differs to that due to both the historical nature of the data used here and the definition of demand. In the EU regulation, peak demand (Dmax) is defined as the total daily gas demand of the country during a day of exceptionally high gas demand occurring with a statistical probability of once in 20 years. In this report, because we are calculating resilience for 2014, we use the estimated peak gas demand in each country for 2014 (January 1st 2014 to December 31st 2014), taking the maximum monthly demand in 2014 (bcm) and dividing this by the number of days within that month. Beyond PF-1, PF-2 was also calculated using the same methodology but removing the two largest supply routes as a more rigorous test of infrastructure resilience. As well as considering infrastructure resilience, it is also important to consider the extent to which each EU-28 country relies on gas to meet its primary energy demand. If the PF-1 score is less than 100 per cent, it could have considerable consequences for a country that relies on gas for a large proportion of its primary energy demand, compared to a lesser extent for a country that mainly uses other energy sources. We therefore plotted out PF-1 and PF-2 against the percentage of total primary energy demand met by gas for each EU Member State (Chart 3).
Chart 3: EU-28* gas infrastructure resilience versus percentage of primary energy consumption met by gas, 2014
*Data for Cyprus and Malta not available. Peak flow minus 1 = total gas supply capacity minus largest gas supply route (PF-1). Peak flow minus 2 = total gas supply capacity minus two largest gas supply routes (PF-2). For each member state, top circle represents PF-1 and bottom diamond represents PF-2. Red-amber-green are illustrative, and do not reflect any pre-defined or standard resilience metric. Chart 3 shows Czech Republic, Belgium, Germany, Austria, Hungary, Slovakia, Netherlands, Latvia, United Kingdom, Spain and France to have particularly resilient gas infrastructure. In all ten countries, the gas infrastructure was able to provide more than double the estimated –if conservative peak - gas demand in 2014, even with the loss of their two largest gas supply routes. Finland, Sweden, Ireland and Bulgaria appeared particularly vulnerable to infrastructure disruptions, with these four countries unable to meet peak daily demand after the loss of the largest gas supply route. Sweden and Finland use very little gas but it appears that Ireland was also vulnerable, given that gas accounts for nearly 30 per cent of primary energy demand.

Special feature – European gas flows
December 2015 66
The inclusion of both PF-1 and PF-2 scores in Chart 3 gives further insight into infrastructure resilience which would not be captured by the PF-1 score alone. For example, the data indicate that Romania clearly has two major import routes: although resilient to a single supply disruption (meeting 138 per cent of peak demand), Romania would be vulnerable after the loss of these two main routes. This is also the case for Slovenia, Greece, Croatia and Luxembourg. UK gas infrastructure resilience 2014 For the UK’s perspective, there are a diverse range of gas sources, including pipeline and LNG imports, storage and indigenous production, with consequent good resilience to disruption of major supply sources According to these data, in 2014 the UK would have met 228 and 201 per cent of the estimated peak demand with the loss of the largest and two largest gas supply routes respectively. Overall, according to the common peak flow metric and data used in this report, the UK was the tenth most resilient Member State to gas supply infrastructure disruptions, but it was the fourth most dependent on gas for primary energy demand in 2014. EU regulations, enforcing that all Member States must have an N-1 score of greater than 100 per cent (using the larger value of peak gas demand based on a statistical probability of once in 20 years) came into force from 3rd December 2014. Given the similarity between the EU N-1 methodology and the PF-1 methodology used here, the UK is well-placed to meet this requirement. Further data For readers wanting a greater level of detail, the IEA have made available an interactive gas map, based on entry and exit points throughout Europe. This map is available free of charge at: www.iea.org/gtf/index.asp For further information on European natural gas flows please contact: Shyam Lakhani David Stevens Oil and Gas Statistics Team Oil and Gas Statistics Team Tel. 0300 068 6865 Tel. 0300 068 5053 E-mail: [email protected] E-mail: [email protected]

Special feature – European gas flows
67 December 2015
Annex 1: Table of key data for gas use in the EU-28* countries, 2014
Peak daily [X] (Billion cubic metres per day)
EU-28 MS Dem-and **
Indig-enous prod-uction **
Import pipelines
Storage output
LNG out-put
PF-1 score
PF-2 score
Natural Gas Consum-ption (Mtoe)
Total Primary Energy Consumption (Mtoe)
Austria 0.034 0.004 0.213 0.091 0.000 465% 379% 32.1 6.4
Belgium 0.065 0.000 0.341 0.057 0.026 554% 469% 54.0 12.6
Bulgaria 0.012 0.002 0.078 0.004 0.000 45% 13% 17.9 2.4
Croatia 0.010 0.005 0.012 0.006 0.000 147% 91% 10.0 2.0
Cyprus* 0.000 0.000 0 0.000 0.000 0% 0% 3.1 0.0
Czech Republic
0.035 0.001 0.420 0.065 0.000 945% 650% 41.5 6.2
Denmark 0.015 0.015 0.019 0.020 0.000 268% 187% 16.4 2.8
Estonia 0.003 0.000 0.014 0.000 0.000 241% 102% 6.1 0.4
Finland 0.015 0.000 0.019 0.000 0.000 0% 0% 34.2 2.5
France 0.174 0.000 0.230 0.255 0.069 287% 256% 242.1 32.3
Germany 0.329 0.034 0.905 0.640 0.000 431% 401% 303.6 64.1
Greece 0.011 0.000 0.015 0.000 0.014 128% 40% 22.5 2.5
Hungary 0.040 0.005 0.085 0.080 0.000 284% 214% 22.6 7.0
Ireland 0.016 0.002 0.030 0.003 0.000 31% 14% 12.8 3.7
Italy 0.273 0.020 0.339 0.280 0.044 207% 168% 146.2 50.7
Latvia 0.006 0.000 0.0376 0.030 0.000 635% 314% 4.3 1.1
Lithuania 0.011 0.000 0.050 0.000 0.012 266% 159% 5.4 2.3
Luxembourg 0.004 0.000 0.011 0.000 0.000 150% 36% 3.8 0.8
Malta* 0.000 0.000 0 0.000 0.000 0% 0% 2.0 0.0
Netherlands 0.160 0.311 0.305 0.339 0.035 500% 437% 72.4 28.4
Poland 0.068 0.018 0.153 0.044 0.000 173% 138% 94.9 13.4
Portugal 0.015 0.000 0.015 0.023 0.022 252% 146% 21.1 3.5
Romania 0.050 0.027 0.110 0.028 0.000 138% 88% 33.7 10.6
Slovak Republic
0.023 0.000 0.310 0.045 0.000 601% 300% 15.4 3.3
Slovenia 0.003 0.000 0.011 0.000 0.000 143% 0% 6.8 0.6
Spain 0.093 0.000 0.092 0.032 0.173 265% 225% 113.9 23.7
Sweden 0.005 0.000 0.008 0.001 0.000 19% 0% 46.7 0.8
United Kingdom
0.276 0.115 0.277 0.154 0.155 228% 201% 177.8 59.7
Source: DECC analysis of IEA data. *No data available for Cyprus and Malta **Calculated by peak month divided by number of days in that month.

Special feature – European gas flows
December 2015 68
Annex 2: Table of PF-1 and PF-2 values for EU-28* countries, 2014
EU-28 MS PF (bcm/day)
PF-1 (bcm/day)
Nature of the largest supply
source
PF-2 (bcm/day) Nature of the second largest supply source
Austria 0.307 0.157 Import pipeline 0.128 Storage
Belgium 0.424 0.358 Import pipeline 0.303 Import pipeline
Bulgaria 0.084 0.006 Import pipeline 0.002 Storage
Croatia 0.022 0.015 Import pipeline 0.009 Storage
Cyprus 0 0.000 - 0.000 -
Czech Republic 0.486 0.330 Import pipeline 0.227 Import pipeline
Denmark 0.054 0.040 Import pipeline 0.028 Storage
Estonia 0.014 0.007 Import pipeline 0.003 Import pipeline
Finland 0.019 0.000 Import pipeline 0.000 -
France 0.554 0.499 Storage 0.445 Import pipeline
Germany 1.579 1.419 Import pipeline 1.318 Import pipeline
Greece 0.029 0.015 LNG 0.005 Import pipeline
Hungary 0.170 0.114 Import pipeline 0.090 Storage
Ireland 0.035 0.005 Import pipeline 0.002 Storage
Italy 0.683 0.563 Import pipeline 0.458 Import pipeline
Latvia 0.068 0.038 Storage 0.019 Import pipeline
Lithuania 0.061 0.030 Import pipeline 0.018 Import pipeline
Luxembourg 0.011 0.006 Import pipeline 0.001 Import pipeline
Malta 0 0.000 - 0.000 -
Netherlands 0.990 0.801
Indigenous production
0.701 Import pipeline
Poland 0.215 0.117 Import pipeline 0.093 Storage
Portugal 0.060 0.038 LNG 0.022 Storage
Romania 0.165 0.069 Import pipeline 0.044 Storage
Slovakia 0.355 0.139 Import pipeline 0.070 Import pipeline
Slovenia 0.011 0.004 Import pipeline 0.000 Import pipeline
Spain 0.297 0.248 LNG 0.210 Import pipeline
Sweden 0.010 0.001 Import pipeline 0.000 Storage
United Kingdom 0.701 0.627 Import pipeline 0.553 Import pipeline
Source: DECC analysis of IEA data. PF = peak flow (defined in Equation 1 in report). *No data available for Cyprus and Malta.

Special feature – Feed-in Tariff load factor analysis
69 December 2015
Feed-in Tariff load factor analysis
Introduction This article updates the. FIT load factor analysis presented in the December 2014 edition of Energy Trends1 with data for FIT year five (financial year 2014/15). We also present regional analysis of solar PV for the four years that data has been published (FIT years two to five) and for wind for year five. All the data in this article is also available in excel format at the following link, including quarterly load factors for solar PV: www.gov.uk/government/statistics/quarterly-and-annual-load-factors
Background The Feed-in Tariff (FIT) scheme was launched in April 2010. It is a financial support scheme for eligible low-carbon electricity technologies, aimed at small-scale installations. The following technologies are supported:
Solar photovoltaic (PV; Up to 5 MW capacity) Anaerobic digestion (AD; Up to 5 MW capacity) Hydro (Up to 5 MW capacity) Wind (Up to 5 MW capacity) Micro combined heat and power (MicroCHP; Up to 2 kW capacity)
Installers receive support through generation and export tariffs, paid directly from electricity suppliers. The generation tariff is based on the number of kilowatt hours (kWh) generated whereas the export tariff is based on electricity that is generated on site, not used and exported back to the grid.
Since the start of the scheme, DECC has provided regular updates on the number and capacity of installations installed under the scheme, currently publishing monthly updates on deployment levels with quarterly reports on geographical distribution, amongst other outputs2. From 2013, DECC obtained meter readings for each registered installation from Energy Suppliers and used this to produce quarterly and annual load factors for FIT years two to four (data from year one is not available as the number of installations running for the full year was very small).
Methodology The methodology used for the load factor analysis has been described in detail in an Energy Trends article from September 20143. One additional quality assurance (QA) step has been added for 2015, to remove any installations from the analysis where more than one generation meter is attached. This step has only been applied to FIT year five data; previously produced statistics have not been revised. Please note that full QA on data from all installations has not been possible.
Table 1 shows how many installations were registered on the Central Feed-in Tariff Register at the start of FIT year five and how many installations had meter readings in March 2014 and 2015. Extreme values were excluded as in previous year’s analysis, with just 0.9% of installations (1,739) removed. The column ‘Valid load factor’ in Table 1 indicates how many installations were included in the final analysis for each technology for the annual generation data. Anaerobic Digestion data has been included in the main results for the first time, but this data must be treated with caution as the number of installations remains low.
1 The article published in December 2014 can be found at: www.gov.uk/government/statistics/energy-trends-december-2014-special-feature-article-feed-in-tariff-load-factor-analysis 2 The full FIT statistics collection can be found at: www.gov.uk/government/collections/feed-in-tariff-statistics 3 The article published in September 2014 can be found at: www.gov.uk/government/statistics/energy-trends-september-2014-special-feature-article-analysis-of-feed-in-tariff-generation-data

Special feature – Feed-in Tariff load factor analysis
December 2015 70
Table 1: Installations included in analysis by Technology – FIT Year 5
Technology Commissioned
by 1st April 2014
Generation Data
Reported*
Valid load factor
% remaining in analysis
Anaerobic digestion 214 26 24 11Hydro 632 186 175 28Micro CHP 505 83 83 16Photovoltaic 615,550 195,413 193,708 31Wind 6,609 2,545 2,524 38
* Meter reading in March 2014 and March 2015.
Results Table 2 gives the weighted mean and median load factors as well as associated percentiles for each technology. Chart 1 presents this data across all available years (FITs years two to five), highlighting the large range present for Hydro compared to other technologies.
Table 2: FIT Year 4 (2014/2015) load factors by technology
Technology Count Mean Weighted
mean
Percentile 5th 25th 50th
(median) 75th 95th
Anaerobic Digestion 24 71.9 73.0 29.1 67.0 78.5 84.9 98.2Hydro 175 41.0 39.7 12.9 28.8 37.2 52.9 75.3MicroCHP 83 12.5 12.5 4.6 8.4 12.0 15.5 23.3Solar PV 193,708 10.2 10.2 7.3 9.3 10.4 11.3 12.7Wind 2,524 19.5 25.3 5.9 11.2 18.1 25.9 39.3 The median load factor for Solar PV in 2014/15 is the same as in 2013/14 (10.4%). This is expected, as the average daily sun hours are the same for both periods (4.5 hrs)4, see Table 3.
Table 3: Solar PV load factors and average sun index
Year Median load
factor Average daily sun
hours
2011/12 10.5 4.52012/13 9.6 3.72013/14 10.4 4.52014/15 10.4 4.5
4 Average daily sun hours taken from Energy Trends section 7: weather, table 7.3 "Average daily sun hours and deviations from the long term mean (ET 7.3)" www.gov.uk/government/statistics/energy-trends-section-7-weather. Note that data for 2015 is provisional and subject to revision.

Chart 1: percentile. indicated.
As in previand this dilarger windload factorTable 4). Solar PV aof the sam
Table 4: W
Year
2011/12 2012/13 2013/14 2014/15
5 Average winlong term meaprovisional an
Load fact Boxes ind
ious years, ifference had schemes r for wind inThe data f
analysis andples used f
Wind load
r Me
nd speed takenan (ET 7.2)" wwnd subject to re
tor range dicate range
the weighteas increase
in the ananstallations for wind insd therefore for each yea
d factors a
edian load factor
15.9 19.3 20.5 18.1
n from Energy Tww.gov.uk/gov
evision.
S
by technoe from lowe
ed mean load year on y
alysis. Theis less clea
stallations iit is not cle
ar.
and averag
Averagspeed
Trends sectionvernment/statis
Special fea
71
ology ander to upper
ad factor foyear. This e relationshar than betws based on
ear yet whe
ge wind sp
ge wind (knots)
9.28.19.38.6
7: weather, tastics/energy-tre
ature – Fee
d year. Linequartile (25
or Wind instreflects a reip betweenween sun hn a smaller ether the an
peed
able 7.2 " Averaends-section-7-
ed-in Tariff
es indicate 5th to 75th p
allations is elative incre
n average dhours and s
number ofnnual variati
age wind speed-weather. Note
ff load facto
Dec
range fromercentile) w
higher thanease in thedaily wind ssolar load faf installationion seen is
d and deviation that data for 2
or analysis
cember 2015
m 5th to 95th
with median
n the mean,e number ofspeed5 andactors (seens than thean artefact
ns from the 2015 is
s
5
h n
f
d e e t

Special feature – Feed-in Tariff load factor analysis
December 2015 72
Solar PV Load Factors The number of Solar PV installations continues to steadily increase but there is no evidence from our analysis here that the load factor of installations decreases over time. When schemes are installed, their productivity may vary across time since the solar panels may degrade, losing efficiency. Newly installed schemes can benefit from technological improvements, but there is also a potential concern that early solar adopters used the most favourable sites, making newer sites less efficient. Table 5 gives the data from all the installations in the FIT year five analysis, broken down by calendar year commissioned. The mean load factor for Solar PV installations does not appear to vary relative to year installed.
Table 5: Solar PV Load Factors in FIT Year 5 by year commissioned
Year Commissioned Count Load Factor 2010 and earlier 10,003 10.12011 4,960 10.32012 61,629 10.22013 29,909 10.12014 7,206 10.1
Quarterly load factors for Solar PV installations are available in the accompanying excel workbook and are presented graphically in Chart 2. These show an expected association between load factor and daily hours of sunshine, where the quarters mainly covering Autumn and Winter have the lowest load factors. This chart also highlights that the lower annual load factors seen in FIT year three (2012/13) for Solar PV are driven by lower load factors in all quarters except quarter three (Q3).
Chart 2: Quarterly PV load factors by FIT year
0.0
2.0
4.0
6.0
8.0
10.0
12.0
14.0
16.0
18.0
Q1 (Apr‐Jun) Q2 (Jul‐Sep) Q3 (Oct‐Dec) Q4 (Jan‐Mar)
Median load
factor (percent)
2011/12
2012/13
2013/14
2014/15

Special feature – Feed-in Tariff load factor analysis
73 December 2015
Regional Solar PV Load Factors Solar PV Factors for each Government Office Region have been published for FIT years two to four and are updated with data from year five in Table 4. Chart 3 highlights that the lowest load factors are seen in Scotland, while the highest are seen in the South West. Load factors in year three (2012/13) are lower than in other years, which are explained by the average daily sun hours also dropping for that year (see Table 3). London again has a lower load factor than the South East which may be due to pollution or particles settling on the panels or because panels are shaded by tall buildings nearby.
Chart 3: Regional Solar PV load factors for FITs years 2-5
8
9
10
11
12
England
East Midlands
8
9
10
11
12
London
8
9
10
11
12
South East
North East
East of England
North West
Wales
Scotland
2011/12
2012/13
2013/14
2014/15
West Midlands
8
9
10
11
12
2011/12
2012/13
2013/14
2014/15
Yorkshire and the Humber
2011/12
2012/13
2013/14
2014/15
South West

Table 4: Regional Solar PV load factors for FITs years 2-5
Region FIT Year 2 (2011/12) FIT Year 3 (2012/13) FIT Year 4 (2013/14) FIT Year 2 (2014/15)
Count Median Count Median Count Median Count Median East Midlands 855 10.7 7,520 9.6 12,936 10.6 18,735 10.3
East of England 1,465 11.0 10,521 10.0 16,306 10.9 21,247 10.8
London 523 9.9 3,283 9.0 4,117 9.7 4,996 9.8
North East 224 10.5 3,460 9.5 5,805 10.3 8,023 10.1
North West 718 9.6 8,867 9.1 13,024 9.8 17,360 9.5
South East 2,764 10.9 17,378 9.9 23,235 10.7 25,994 10.9
South West 2,649 10.8 24,445 10.2 31,965 11.2 36,938 11.4
West Midlands 974 10.4 7,139 9.3 11,118 10.2 15,312 10.2Yorkshire and the Humber
798 10.3 7,292 9.3 11,299 10.2 18,507 9.9
England 10,970 10.6 89,905 9.7 129,805 10.6 167,112 10.4
Scotland 508 9.3 7,722 9.0 11,531 9.2 11,363 8.9
Wales 645 10.2 9,882 9.6 13,643 10.4 15,100 10.5
Decem
ber 20
15
74

Special feature – Feed-in Tariff load factor analysis
75 December 2015
Regional Wind Load Factors This year we have also produced regional load factors for Wind schemes and these are presented in Table 5. Data from London and the South East has been aggregated as there was only installation within the London region with a valid load factor. Chart 4 summarises this data for England, Scotland and Wales, showing that the highest Wind load factors are found in Scotland.
Table 5: Regional Wind load factors for FITs year 5 Region Count MedianEast Midlands 134 14.4East of England 453 10.0London and South East 30 14.8North East 84 16.5North West 133 19.0South West 318 19.6West Midlands 63 13.6Yorkshire and the Humber 319 18.9England 1,534 14.8Scotland 743 24.8Wales 190 20.0
Chart 4: Wind regional load factors for FITs year 5 by country. Lines indicate range from 5th to 95th percentile. Boxes indicate range from lower to upper quartile (25th to 75th percentile) with median indicated.
Ellen Migo and James Hemingway FIT Statistics Tel: 0300 068 6718 E-mail: [email protected]
0
10
20
30
40
50
England Scotland Wales
Lo
ad F
acto
r (p
erce
nt)

Special feature – Recent and forthcoming publications
December 2015
76
Recent and forthcoming publications of interest to users of energy statistics
UK Energy Sector Indicators This annual publication aims to provide a headline overview of some of the key developments in the UK energy system: how energy is produced and used and the way in which energy use influence greenhouse gas emissions. The 2015 edition was published on Thursday 29 October 2015 at: www.gov.uk/government/collections/uk-energy-sector-indicators Household Energy Efficiency statistics DECC ran a user consultation on 20 August 2015 lasting for six weeks, to seek views on a number of proposals to the statistical series on Green Deal and Energy Company Obligation statistics. The consultation and DECC’s response (published on 19 November 2015) can be found at: www.gov.uk/government/consultations/decc-household-energy-efficiency-national-statistics-user-consultation Following the consultation this statistical series has made the following changes:
In response to concerns expressed by some respondents, DECC will not reduce the frequency of any ECO only related statistics.
Headline figures on Green Deal related statistics previously published monthly, will now be released on a quarterly basis, with the exception of Cashback (since this scheme has now closed).
Detailed figures on Green Deal related statistics, insulation levels and interactions between other schemes (e.g. Feed-in Tariffs) previously published quarterly, will now be released on an annual basis.
Improved design and accessibility of the tables (including detailed time series breakdowns) and accompanying commentary.
The first headline release in the new format following the user consultation was published on 17 December 2015 at: www.gov.uk/government/collections/household-energy-efficiency-national-statistics Greenhouse Gas Emissions quarterly statistics This publication provides provisional estimates of UK greenhouse gas emissions on a quarterly basis. The latest release covering emissions up to and including the 3rd quarter of 2015, will be published on 22 December 2015 at: www.gov.uk/government/collections/uk-greenhouse-gas-emissions-quarterly-official-statistics Future editions of this release will now coincide with the quarterly publication of Energy Trends in March, June, September and December, with the March release being combined with the provisional annual greenhouse gas emissions statistics (see below). Smart Meters quarterly statistics This quarterly publication provides estimates of the number of Smart Meters installed and operating in homes and businesses in Great Britain. The latest release, covering estimates of the number of Smart Meters deployed up to the end of December 2015, will be published on 22 December 2015 at: www.gov.uk/government/collections/smart-meters-statistics

Special feature – Recent and forthcoming publications
77 December 2015
Sub-national electricity consumption, 2014 This factsheet looks at electricity consumption by consuming sector for Great Britain, and Regional/devolved administration areas, together with some commentary relating to local authority trends. The data analysed in this factsheet are based on the aggregation of Meter Point Administration Number (MPAN) readings throughout Great Britain as part of DECC’s annual meter point electricity data exercise. The data cover the electricity year between 1 February 2014 and 31 January 2015. These data follow on from the results produced from similar exercises carried out for 2005 to 2013. The release will be published on 22 December 2015, at: www.gov.uk/government/collections/sub-national-electricity-consumption-data. Sub-national gas consumption, 2014 This factsheet looks at gas consumption by consuming sector for Great Britain, and Regional/devolved administration areas, together with some commentary relating to local authority trends. The data analysed in this factsheet are based on the aggregation of Meter Point Reference Number (MPRN) readings throughout Great Britain as part of DECC’s annual meter point gas data exercise. The data cover the gas year between 1 October 2013 and 30 September 2014 and are subject to a weather correction factor. In the domestic sector, gas consumption is predominately used for heating purposes and as a result usage is driven by external temperatures and weather conditions. The weather correction factor enables comparisons of gas use over time, controlling for weather changes. These data follow on from the results produced from similar exercises carried out for 2005 to 2013. The release will be published on 22 December 2015, at: www.gov.uk/government/collections/sub-national-gas-consumption-data. Sub-national electricity consumption in Northern Ireland, 2012 and 2013 This publication presents estimates of the latest analysis of electricity consumption in Northern Ireland at District Council level. Domestic electricity consumption data for 2012 and 2013 and non-domestic data for 2013 will be published on 22 December 2015 at: www.gov.uk/government/collections/sub-national-electricity-consumption-in-northern-ireland. Sub-national electricity and gas consumption at MSOA, IGZ and LSOA level, 2014 This publication comprising a series of Excel spreadsheets provides details of domestic and non-domestic electricity and gas consumption at Lower Super Output Area (LSOA), Middle Super Output Area (MSOA) and Intermediate Geography Zone (IGZ) for 2014. The data will be published on 28 January 2016 for electricity at: www.gov.uk/government/statistics/lower-and-middle-super-output-areas-electricity-consumption and gas at: www.gov.uk/government/statistics/lower-and-middle-super-output-areas-gas-consumption Greenhouse Gas Emissions final 2014 statistics This publication provides final estimates of UK greenhouse gas emissions going back to 1990. Estimates are presented by source in February of each year and are updated in March of each year to include estimates by end-user and fuel type. Final 2014 statistics will be published on 2 February 2016 at: www.gov.uk/government/collections/final-uk-greenhouse-gas-emissions-national-statistics Greenhouse Gas Emissions provisional 2015 statistics This publication provides the latest provisional estimates of UK greenhouse gas emissions based on provisional inland energy consumption statistics as published in Energy Trends. Provisional 2015 statistics will be published on 31 March 2016 at: www.gov.uk/government/collections/provisional-uk-greenhouse-gas-emissions-national-statistics

December 2015 78
List of special feature articles published in Energy Trends between December 2014 and September 2015
Energy December 2014 Estimates of heat use in the United Kingdom in 2013 Renewable Heat Premium Payment scheme DECC report on surveys of businesses, local authorities and households -
2013/14 March 2015 Non-domestic Renewable Heat Incentive September 2015 Large Combustion Plant Directive (LCPD): Running hours during winter
2014/15 and capacity for 2015/16
Coal December 2014 Global coal trade September 2015 Coal in 2014
Combined Heat and Power (CHP)September 2015 Combined Heat and Power in Scotland, Wales, Northern Ireland and the
regions of England in 2014 Electricity December 2014 Electricity generation and supply figures for Scotland, Wales, Northern Ireland
and England, 2010 to 2013 Energy efficiency December 2014 Energy usage in households with Solar PV installations Smart Meter Energy Demand Research Project: anonymised data release March 2015 International comparisons of energy efficiency indicators Non-domestic National Energy Efficiency Data Framework – new publication Energy prices March 2015 Domestic energy bills in 2014: The impact of variable consumption Variation in tariff types and energy bills Feed-in Tariffs December 2014 Feed-in Tariff load factor analysis Fuel Poverty June 2015 Fuel Poverty levels in England, 2013 Gas December 2014 Physical gas flows across the EU-28 and diversity of gas supply in 2013 Petroleum (oil and oil products) December 2014 Diversity of supply for oil and oil products in OECD countries September 2015 Diversity of supply for oil and oil products in OECD countries in 2014

79 December 2015
Renewables June 2015 Renewable energy in 2014 September 2015 Renewable electricity in Scotland, Wales, Northern Ireland and the regions of
England in 2014 UK and EU trade of wood pellets
Sub-national energy consumptionMarch 2015 Visualising non-gas grid households in Great Britain Sub-national consumption statistics: Data at postcode level June 2015 Energy Consumption in the United Kingdom: publication of data UK Continental Shelf (UKCS) March 2015 UKCS capital expenditure survey 2014 PDF versions of the special feature articles appearing in Energy Trends since 2012 can be accessed on the DECC section of the GOV.UK website at: www.gov.uk/government/collections/energy-trends-articles Articles published before 2012 can be accessed via the National Archives version of the DECC website at: http://webarchive.nationalarchives.gov.uk/20130109092117/http:/decc.gov.uk/en/content/cms/statistics/publications/trends/articles_issue/articles_issue.aspx

December 2015 80

Explanatory notes
General Symbols used in the tables More detailed notes on the methodology used to compile the figures and data sources are available on the DECC section of the gov.uk website.
.. - p r e
not available nil or not separately available provisional revised; where a column or row shows ‘r’ at the beginning, most, but not necessarily all, of the data have been revised. estimated; totals of which the figures form a constituent part are therefore partly estimated
Notes to tables Conversion factors Figures for the latest periods
and the corresponding averages (or totals) are provisional and are liable to subsequent revision.
1 tonne of crude oil = 1 tonne = 1 gallon (UK) = 1 kilowatt (kW) = 1 megawatt (MW) = 1 gigawatt (GW) = 1 terawatt (TW) =
7.55 barrels 1,000 kilograms 4.54609 litres 1,000 watts 1,000 kilowatts 1,000 megawatts 1,000 gigawatts
All conversion of fuels from original units to units of energy is carried out on the basis of the gross calorific value of the fuel. More detailed information on conversion factors and calorific values is given in Annex A of the Digest of United Kingdom Energy Statistics.
The figures have not been adjusted for temperature or seasonal factors except where noted.
Due to rounding the sum of the constituent items may not equal the totals.
Conversion matrices
Percentage changes relate to the corresponding period a year ago. They are calculated from unrounded figures but are shown only as (+) or (-) when the percentage change is very large.
To convert from the units on the left hand side to the units across the top multiply by the values in the table. To: From Thousand toe Terajoules (TJ) Gigawatt hours (GWh) Million therms To: From Tonnes of oil equivalent Gigajoules (GJ) Kilowatt hours (kWh) Therms
Thousand toe Multiply by 1 0.023885 0.085985 2.5200 Tonnes of oil equivalent Multiply by 1 0.023885 0.000085985 0.0025200
Terajoules 41.868 1 3.6000 105.51 Gigajoules 41.868 1 0.003600 0.105510
GWh 11.630 0.27778 1 29.307 kWh 11,630 277.78 1 29.307
Million therms 0.39683 0.0094778 0.034121 1 Therms 396.83 9.4778 0.034121 1
Quarterly figures relate to calendar quarters.
All figures relate to the United Kingdom unless otherwise indicated.
Further information on Oil and Gas is available at: www.gov.uk/browse/business/generating-energy/oil-and-gas-exploration-and-production
Note that all factors are quoted to 5 significant figures
Abbreviations Sectoral breakdowns ATF Aviation turbine
fuel The categories for final consumption by user are defined by the Standard Industrial Classification 2007, as follows:
CCGT Combined cycle gas turbine
Fuel producers Final consumers Iron and steel Other industry Transport Other final users Agriculture Commercial Public administration Other services Domestic
05-07, 09, 19, 24.46, 35 24 (excluding 24.4, 24.53 and 24.54) 08, 10-18, 20-23, 24.4 (excluding 24.46), 24.53, 24.54, 25-33, 36-39, 41-43 49-51 01-03 45-47, 52-53, 55-56, 58-66, 68-75, 77-82 84-88 90-99 Not covered by SIC 2007
DERV Diesel engined road vehicle
LNG Liquefied natural gas MSF Manufactured
solid fuels NGLs Natural gas liquids UKCS United Kingdom
continental shelf

©
De
3
Lo
ww
U
Crown c
epartmen
Whitehal
ondon SW
ww.gov.u
RN 15D/7
copyright
nt of Ener
ll Place
W1A 2AW
uk/decc
79D
2015
rgy & Clim
W
mate Cha
ange