2016 ber 2 January Volume 28 Number 1 - Journal of ...
180
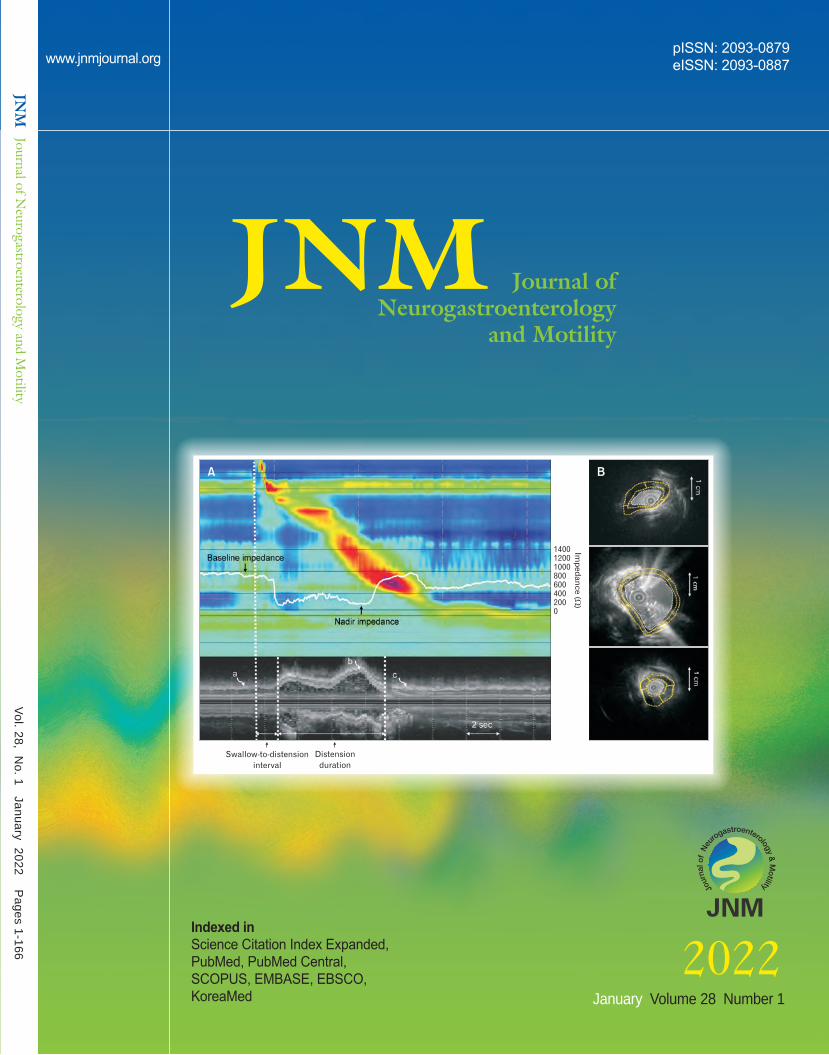
Vol. 28, No. 1 January 2022 Pages 1-166 January Volume 28 Number 1 2022 1400 1200 1000 800 600 400 200 0 A B Impedance ( ) W Swallow-to-distension interval Distension duration
-
Upload
khangminh22 -
Category
Documents
-
view
1 -
download
0
Transcript of 2016 ber 2 January Volume 28 Number 1 - Journal of ...
April 30, 2016Volume 22 Number 2
EditorialsEditorials1 Can a Health Checkup Record Predict the Onset of Reflux Esophagitis?
Kyoungwon Jung3 The Korean Self-evaluation Questionnaire for Functional Dyspepsia
Yang Won Min
Review and Meta-analysesReview and Meta-analyses5 On-demand Versus Continuous Maintenance Treatment of Gastroesophageal Reflux Disease With Proton Pump Inhibitors:
A Systematic Review and Meta-analysisSeung Joo Kang, Hye-Kyung Jung, Chung Hyun Tae, Seung Young Kim, and Kwang Jae Lee
15 Role of Peroral Endoscopic Myotomy in Advanced Achalasia Cardia With Sigmoid and/or Megaesophagus: A Systematic Review and MetanalysisHarshal S Mandavdhare, Praveen Kumar M, Jayendra Shukla, Antriksh Kumar, and Vishal Sharma
28 Clinical Practice Guidelines for Fecal Microbiota Transplantation in KoreaTae-Geun Gweon, Yoo Jin Lee, Kyeong Ok Kim, Sung Kyun Yim, Jae Seung Soh, Seung Young Kim, Jae Jun Park, Seung Yong Shin, Tae Hee Lee, Chang Hwan Choi, Young-Seok Cho, Dongeun Yong, Jin-Won Chung, Kwang Jae Lee, Oh Young Lee, Myung-Gyu Choi, and Miyoung Choi; Gut Microbiota and Therapy Research Group Under the Korean Society of Neurogastroenterology and Motility
Original ArticlesOriginal Articles43 Onigiri Esophagography as a Screening Test for Esophageal Motility Disorders
Shohei Hamada, Eikichi Ihara, Kazumasa Muta, Masafumi Wada, Yoshitaka Hata, Hiroko Ikeda, Yoshimasa Tanaka, Haruei Ogino, Takatoshi Chinen, and Yoshihiro Ogawa
53 Efficacy of Acotiamide on Postprandial Distress Syndrome and Epigastric Pain Syndrome Depending on the Estimated Gastric Acid Secretion LevelToshiaki Suzuki, Reina Ohba, Ei Kataoka, Yui Kudo, Akira Zeniya, Daisuke Segawa, Keisuke Oikawa, Masaru Odashima, Taiji Saga, Tomoyuki Kuramitsu, Hideaki Sasahara, Kazuo Yoneyama, Takashi Tomita, Yosuke Shimodaira, and Katsunori Iijima
62 Esophageal Bolus Domain Pressure and Peristalsis Associated With Experimental Induction of Esophagogastric Junction Outflow Obstruction Wei-Yi Lei, Taher Omari, Tso-Tsai Liu, Ming-Wun Wong, Jui-Sheng Hung, Chih-Hsun Yi, Shu-Wei Liang, Charles Cock, and Chien-Lin Chen
69 Reflux-related Extraesophageal Symptoms Until Proven Otherwise: A Direct Measurement of Abnormal Proximal Exposure Based on Hypopharyngeal Multichannel Intraluminal Impedance as a Reliable Indicator for Successful Treatment OutcomesTakeshi Suzuki, Yosuke Seki, Tomoaki Matsumura, Makoto Arai, Toyoyuki Hanazawa, Yoshitaka Okamoto, Haruhiko Suzuki, Kazunori Kasama, Akiko Umezawa, Yoshimoti Kurokawa, and Toshitaka Hoppo
78 Role of Glucose Breath Test for Small Intestinal Bacterial Overgrowth in Children and Adolescents With Functional Abdominal Pain Disorders in KoreaJin Lee, Chang-Nyol Paik, Dae Bum Kim, Ji Min Lee, Yeon-Ji Kim, Sik Kyung Choi, and Yeon Jong Cho
86 Predictive Factors for Future Onset of Reflux Esophagitis: A Longitudinal Case-control Study Using Health Checkup RecordsYuzuru Toki, Ryo Yamauchi, Eizo Kayashima, Kyoichi Adachi, Kiyohiko Kishi, Hiroshi Suetsugu, Tsuneya Wada, Hiroyoshi Endo, Hajime Yamada, Satoshi Osaga, Takeshi Kamiya, Koji Nakada, Katsuhiko Iwakiri, Ken Haruma, and Takashi Joh
95 Improving Clinician-Patient Communication Alleviates Stigma in Patients With Functional Dyspepsia Receiving Antidepressant TreatmentXiu-Juan Yan, Hong-Yi Qiu, Qing-Qing Luo, Bo Wang, Ping Xu, Chen-Feng Ji, and Sheng-Liang Chen
104 ACTG2 Variants in Pediatric Chronic Intestinal Pseudo-obstruction With MegacystisJong Woo Hahn, Soo Young Moon, Min Soo Kim, Min Hyung Woo, Min Ji Sohn, Hyun-Young Kim, Moon-Woo Seong, Sung Sup Park, Sung-Hye Park, Jin Soo Moon, and Jae Sung Ko
111 Development and Validity Assessment of a Self-evaluation Questionnaire for Functional Dyspepsia: A Multicenter Prospective Study in Korea Kyoungwon Jung, Hye-Kyung Jung, Joong Goo Kwon, Chung Hyun Tae, Ki Bae Bang, Jong Kyu Park, Ju Yup Lee, Cheol Min Shin, Jung Hwan Oh, Kyung Ho Song, Oh Young Lee, and Myung-Gyu Choi
121 Role of the Mean Nocturnal Baseline Impedance in Identifying Evidence Against Pathologic Reflux in Patients With Refractory Gastroesophageal Reflux Disease Symptoms as Classified by the Lyon ConsensusYanhong Wu, Zihao Guo, Chuan Zhang, and Yutao Zhan
131 Morphologic Changes in Esophageal Body Movement During Bolus Transport After Peroral Endoscopic Myotomy in Type III AchalasiaAlex Ju Sung Kim, Sungmoon Ong, Ji Hyun Kim, Hong Sub Lee, Jun Sik Yoon, and Dae Young Hur
145 Sex and Gender Differences in Overlap Syndrome of Functional Gastrointestinal Disorder and Effect of Genetic Polymorphisms in South Korea: A Long-term Follow-up StudyJu Yup Lee, Nayoung Kim, Ji Hyun Park, Jeong Eun Yu, Yun Jeong Song, Jung Won Yoon, and Dong Ho Lee
Letters to the EditorLetters to the Editor159 Missing the Distal-most [Z6] Impedance Channel? The Study Can Be Salvaged!
Frederick W Woodley 161 Peristaltic Recovery After Peroral Endoscopic Myotomy for Achalasia: Dream or Reality?
Akshay Kulkarni, Anshuman Elhence, and Uday C Ghoshal162 PeristalticRecoveryAfterPeroralEndoscopicMyotomyforAchalasia:DreamorReality?:AuthorʼsReply
Zuzana Vackova, Jan Mares, Jana Krajciova, Zuzana Rabekova, Lucie Zdrhova, Pavla Loudova, Julius Spicak, Petr Stirand, Tomas Hucl, and Jan Martinek
164 Combination Treatment With Proton Pump Inhibitor Plus Prokinetic for Gastroesophageal Reflux DiseaseMuhammad Ali Tariq and Bilal Ahmed
165 Superimposed Non-acid Reflux Event: An Example of When It May Be Important to Revisit the Impedance Analysis GuidelinesFrederick W Woodley
Vol. 28, No. 1 January 2022 P
ages 1-166
January Volume 28 Number 1
2022
1400120010008006004002000
A B
Imp
ed
an
ce
()
Swallow-to-distension
interval
Distension
duration

Journal of Neurogastroenterology and Motility
Editor-in-Chief
Ronnie Fass (USA)
Deputy Editor
Hyun Jin Kim (Korea) Kyung Ho Song (Korea)Yong Sung Kim (Korea)
Associate Editors
Young-Tae Bak (Korea)William D Chey (USA)Chang Hwan Choi (Korea)Myung-Gyu Choi (Korea)Andrew S B Chua (Malaysia)Shin Fukudo (Japan)
Uday C Ghoshal (India)Sutep Gonlachanvit (Thailand)Kok Ann Gwee (Singapore)Xiaohua Hou (China)Nayoung Kim (Korea)Sang Don Koh (USA)
Joon Seong Lee (Korea)Kwang Jae Lee (Korea)Oh Young Lee (Korea)Hiroto Miwa (Japan)Moo In Park (Korea)Eamonn M M Quigley (USA)
Poong-Lyul Rhee (Korea)Daniel Sifrim (UK)Yvette Taché (USA)Jan Tack (Belgium)
Editorial Board Members
Giovanni Barbara (Italy)Yu Kyung Cho (Korea)Suck Chei Choi (Korea)Anita Gasiorowska (Poland)Eun Jeong Gong (Korea)Su Jin Hong (Korea)Hye-Kyung Jung (Korea)Kee Wook Jung (Korea)Motoyori Kanazawa (Japan)
Young Woo Kang (Korea)Gwang Ha Kim (Korea)Hee Man Kim (Korea)Seong-Eun Kim (Korea)Rakesh Kochhar (India)Tae Hee Lee (Korea)Lin Lin (China)Ching-Liang Lu (Taiwan)Varocha Mahachai (Thailand)
Seung-Jae Myung (Korea)Akihito Nagahara (Japan)Tomas Navarro (Brazil)Jung Hwan Oh (Korea)Tadayuki Oshima (Japan)John E Pandolfino (USA)Chan Hyuk Park (Korea)Jung Ho Park (Korea)Shaman Rajindrajith (Sri Lanka)
Ali Rezaie (USA)Max J Schmulson (Mexico)Jeong Eun Shin (Korea)Chong-Il Sohn (Korea)Andreas Stengel (Germany)Xiaohong Sun (China)Hidekazu Suzuki (Japan)Justin C Y Wu (Hong Kong)Young Hoon Youn (Korea)
Statistical EditorBumhee Park (Korea)
Manuscript EditorEun Ju Ko (Korea)
Illustrator Jae Yeon Lee (Korea)
Journal of Neurogastroenterology and Motility (J Neurogastroenterol Motil) is a joint official journal of the Korean Society of Neurogastroenterology and Motility, the Thai Neurogastroenterology and Motility Society, the Japanese Society of Neurogastroenterology and Motility, the Indian Motility and Functional Disease Association, the Chinese Society of Gastrointestinal Motility, the South East Asia Gastro-Neuro Motility Association, the Taiwan Neurogastroenterology and Motility Society and the Asian Neurogastroenterology and Motility Association, launched in January 2010 after the title change from the Korean Journal of Neurogastroenterology and Motility, published from 1994 to 2009.The aim of the Journal is to foster and promote research activities in the area of the motor, sensory and functional disorders of the gastrointestinal tract. The Journal provides researchers with accessible rooms for publication of their research results in the field of neurogastroenterology and motility.It publishes quarterly peer-reviewed articles on the 30th of January, April, July, and October in English, in printed and electronic versions. Full text is accessible at: http://www.jnmjournal.org. All or part of the Journal is indexed/tracked/covered by Science Citation Index Expanded, SCOPUS, EMBASE, EBSCO, PubMed, PubMed Central, KoreaMed, KoreaMed Synapse, DOI/Crossref, and Google Scholar. The circulation number per issue is 2,000. For subscription, submission and all other information visit our website. To subscribe to this journal or renew your current subscription, please complete the subscription order form and send it to us by fax (+82-2-538-0672), mail, or e-mail ([email protected]). Annual subscription rates with postage (4 issues/year): for foreigners, 400 USD for institutions and 200 USD for individuals; and for Koreans, 100,000 Korean won for institutions and 40,000 Korean won for individuals. It is printed on acid free paper. Copyright 2022 The Korean Society of Neurogastroenterology and Motility
It is identical to Creative Commons Attribution License.This journal was supported by the Korean Federation of Science and Technology Societies (KOFST) Grant funded by the Korean Government. This journal was supported by the Korea Research Foundation of Internal Medicine. It is published by the Korean Society of Neurogastroenterology and Motility and printed by MEDrang Inc.
Please contact editorial office for further inquiry: Journal of Neurogastroenterology and Motility
Room 305, Lotte Gold Rose Vill II, 31 Seolleung-ro 86-gil, Gangnam-gu, Seoul 06193, Korea Tel: +82-2-538-0634, Fax: +82-2-538-0672 E-mail: [email protected], Website: http://www.jnmjournal.org
Printed by MEDrang Inc.
pISSN: 2093-0879 eISSN: 2093-0887
JNM

Journal of Neurogastroenterology and Motility
pISSN: 2093-0879 eISSN: 2093-0887
JNMCommittee of Asian Neurogastroenterology and Motility Association
Management CommitteePresidentSecretary General Vice Secretary GeneralTreasurer AuditorSteering Committee of ANMA
Hiroto Miwa (Japan)Kewin T H Siah (Singapore)Tadayuki Oshima (Japan)Tanisa Patcharatrakul (Thailand)Ching-Liang Lu (Taiwan)
Kee Wook Jung (Korea)
Philip Abraham (India) Chien-Lin Chen (Taiwan) Minhu Chen (China) Andrew S B Chua (Malaysia)Uday C Ghoshal (India)
Xiaohua Hou (China)Joon Seong Lee (Korea)Ching-Liang Lu (Taiwan)Hiroto Miwa (Japan) Hyojin Park (Korea)
Duc T Quach (Vietnam)M Masudur Rahman (Bangladesh)Sanjeev Sachdeva (India)
Andrew M L Ong (Singapore)Tadayuki Oshima (Japan)Tanisa Patcharatrakul (Thailand)
Nitesh Pratap (India)Ping-Huei Tseng (Taiwan)
Tanisa Patcharatrakul (Thailand)Kewin T H Siah (Singapore)Hidekazu Suzuki (Japan)Ari F Syam (Indonesia)Justin C Y Wu (Hong Kong)
Alex Y S Soh (Singapore)Yen-Po Wang (Taiwan)
Sanjeev Sachdeva (India)Ping-Huei Tseng (Taiwan)Yinglian Xiao (China)
Yinglian Xiao (China)Young Hoon Youn (Korea)
Personnel and Regulation CommitteeChairMembers
Scientific CommitteeChairMembers
Uday C Ghoshal (India)Yong Sung Kim (Korea)Yeong Yeh Lee (Malaysia)Tadayuki Oshima (Japan)
Justin C Y Wu (Hong Kong)Kee Wook Jung (Korea)Sanjiv Mahadeva (Malaysia)Arthur D P Mak (Hong Kong)
Information and Communication CommitteeChairMembers
Minhu Chen (China)Daphne S W Ang (Singapore)Hideki Mori (Japan)
Board Members of the Korean Society of Neurogastroenterology and MotilityCongress Chairman Dong Ho LeePresident Suck Chei ChoiPresident elect In Kyung Seong Secretary General Sang Kil Lee Vice Secretary General (Research Planning) Cheol Min Shin Vice Secretary General (Public Affairs) Han Seung Ryu Director of the Scientific Committee Hye-Kyung Jung Director of the Editorial and Publication Committee Hyun Jin Kim Director of the Finance Committee Kyung Sik Park Director of the Education Committee Kee Wook Jung Director of Diet, Obesity, and Metabolism Research Study Group Jeong Hwan Kim Director of the Clinical Practice Guidelines Committee Jeong Eun Shin Director of GERD Research Study Group Young Hoon Youn Director of Dyspepsia Research Study Group Tae Hee Lee Director of IBS Research Study Group Jung Ho Park Director of Constipation Research Study Group Seon-Young Park Director of Endoscopic Therapy and Instrument Research Study Group Do Hoon Kim Director of Dysphagia Research Study Group Yu Kyung Cho Director of Gut Microbiota and Therapy Research Study Group Chang Hwan Choi Director of the Insurance & Policy Committee Jung Hwan Oh Director of Brain Gut Axis Research Study Group Joong Goo Kwon Director of Information and External Affairs Yong Sung Kim Director of Public Relations Committee Moo In Park Director of Public Relations Committee Sam Ryong Jee Auditor Young-Seok Cho Auditor Su Jin Hong
Publication Committee of the Korean Society of Neurogastroenterology and Motility Myong Ki BaegKihong ChangYoung Sin ChoYu Kyung ChoYoon Jin ChoiEun Jeong GongCheal Wung HuhKee Wook JungKyoungwon Jung
Dae Sung KimHee Man KimMin Cheol KimSeong-Eun KimTae-Han KimSeung Han KimYong Hwan KwonHong Sub LeeJung Won Lee
Moon Young LeeTae Hee LeeChul-Hyun LimJung Hwan OhChan Hyuk ParkJung Ho ParkSeung-Bum RyooSung Kyun YimYoung Hoon Youn

Journal of Neurogastroenterology and Motility Volume 28 ∙ Number 1 ∙ January 30, 2022
January 2022Editorials
1 Can a Health Checkup Record Predict the Onset of Reflux Esophagitis?Kyoungwon Jung
3 The Korean Self-evaluation Questionnaire for Functional DyspepsiaYang Won Min
Review and Meta-analyses5 On-demand Versus Continuous Maintenance Treatment of Gastroesophageal Reflux Disease
With Proton Pump Inhibitors: A Systematic Review and Meta-analysisSeung Joo Kang, Hye-Kyung Jung, Chung Hyun Tae, Seung Young Kim, and Kwang Jae Lee
15 Role of Peroral Endoscopic Myotomy in Advanced Achalasia Cardia With Sigmoid and/or Megaesophagus: A Systematic Review and MetanalysisHarshal S Mandavdhare, Praveen Kumar M, Jayendra Shukla, Antriksh Kumar, and Vishal Sharma
28 Clinical Practice Guidelines for Fecal Microbiota Transplantation in KoreaTae-Geun Gweon, Yoo Jin Lee, Kyeong Ok Kim, Sung Kyun Yim, Jae Seung Soh, Seung Young Kim, Jae Jun Park, Seung Yong Shin, Tae Hee Lee, Chang Hwan Choi, Young-Seok Cho, Dongeun Yong, Jin-Won Chung, Kwang Jae Lee, Oh Young Lee, Myung-Gyu Choi, and Miyoung Choi; Gut Microbiota and Therapy Research Group Under the Korean Society of Neurogastroenterology and Motility
Original Articles43 Onigiri Esophagography as a Screening Test for Esophageal Motility Disorders
Shohei Hamada, Eikichi Ihara, Kazumasa Muta, Masafumi Wada, Yoshitaka Hata, Hiroko Ikeda, Yoshimasa Tanaka, Haruei Ogino, Takatoshi Chinen, and Yoshihiro Ogawa
53 Efficacy of Acotiamide on Postprandial Distress Syndrome and Epigastric Pain Syndrome Depending on the Estimated Gastric Acid Secretion LevelToshiaki Suzuki, Reina Ohba, Ei Kataoka, Yui Kudo, Akira Zeniya, Daisuke Segawa, Keisuke Oikawa, Masaru Odashima, Taiji Saga, Tomoyuki Kuramitsu, Hideaki Sasahara, Kazuo Yoneyama, Takashi Tomita, Yosuke Shimodaira, and Katsunori Iijima
62 Esophageal Bolus Domain Pressure and Peristalsis Associated With Experimental Induction of Esophagogastric Junction Outflow Obstruction Wei-Yi Lei, Taher Omari, Tso-Tsai Liu, Ming-Wun Wong, Jui-Sheng Hung, Chih-Hsun Yi, Shu-Wei Liang, Charles Cock, and Chien-Lin Chen
69 Reflux-related Extraesophageal Symptoms Until Proven Otherwise: A Direct Measurement of Abnormal Proximal Exposure Based on Hypopharyngeal Multichannel Intraluminal Impedance as a Reliable Indicator for Successful Treatment OutcomesTakeshi Suzuki, Yosuke Seki, Tomoaki Matsumura, Makoto Arai, Toyoyuki Hanazawa, Yoshitaka Okamoto, Haruhiko Suzuki, Kazunori Kasama, Akiko Umezawa, Yoshimoti Kurokawa, and Toshitaka Hoppo
78 Role of Glucose Breath Test for Small Intestinal Bacterial Overgrowth in Children and Adolescents With Functional Abdominal Pain Disorders in KoreaJin Lee, Chang-Nyol Paik, Dae Bum Kim, Ji Min Lee, Yeon-Ji Kim, Sik Kyung Choi, and Yeon Jong Cho
86 Predictive Factors for Future Onset of Reflux Esophagitis: A Longitudinal Case-control Study Using Health Checkup RecordsYuzuru Toki, Ryo Yamauchi, Eizo Kayashima, Kyoichi Adachi, Kiyohiko Kishi, Hiroshi Suetsugu, Tsuneya Wada, Hiroyoshi Endo, Hajime Yamada, Satoshi Osaga, Takeshi Kamiya, Koji Nakada, Katsuhiko Iwakiri, Ken Haruma, and Takashi Joh
95 Improving Clinician-Patient Communication Alleviates Stigma in Patients With Functional Dyspepsia Receiving Antidepressant TreatmentXiu-Juan Yan, Hong-Yi Qiu, Qing-Qing Luo, Bo Wang, Ping Xu, Chen-Feng Ji, and Sheng-Liang Chen
This journal was supported by the Korean Federation of Science and Technology Societies (KOFST) Grant funded by the Korean Government.

104 ACTG2 Variants in Pediatric Chronic Intestinal Pseudo-obstruction With MegacystisJong Woo Hahn, Soo Young Moon, Min Soo Kim, Min Hyung Woo, Min Ji Sohn, Hyun-Young Kim, Moon-Woo Seong, Sung Sup Park, Sung-Hye Park, Jin Soo Moon, and Jae Sung Ko
111 Development and Validity Assessment of a Self-evaluation Questionnaire for Functional Dyspepsia: A Multicenter Prospective Study in Korea Kyoungwon Jung, Hye-Kyung Jung, Joong Goo Kwon, Chung Hyun Tae, Ki Bae Bang, Jong Kyu Park, Ju Yup Lee, Cheol Min Shin, Jung Hwan Oh, Kyung Ho Song, Oh Young Lee, and Myung-Gyu Choi
121 Role of the Mean Nocturnal Baseline Impedance in Identifying Evidence Against Pathologic Reflux in Patients With Refractory Gastroesophageal Reflux Disease Symptoms as Classified by the Lyon ConsensusYanhong Wu, Zihao Guo, Chuan Zhang, and Yutao Zhan
131 Morphologic Changes in Esophageal Body Movement During Bolus Transport After Peroral Endoscopic Myotomy in Type III AchalasiaAlex Ju Sung Kim, Sungmoon Ong, Ji Hyun Kim, Hong Sub Lee, Jun Sik Yoon, and Dae Young Hur
145 Sex and Gender Differences in Overlap Syndrome of Functional Gastrointestinal Disorder and Effect of Genetic Polymorphisms in South Korea: A Long-term Follow-up StudyJu Yup Lee, Nayoung Kim, Ji Hyun Park, Jeong Eun Yu, Yun Jeong Song, Jung Won Yoon, and Dong Ho Lee
Letters to the Editor159 Missing the Distal-most [Z6] Impedance Channel? The Study Can Be Salvaged!
Frederick W Woodley
161 Peristaltic Recovery After Peroral Endoscopic Myotomy for Achalasia: Dream or Reality? Akshay Kulkarni, Anshuman Elhence, and Uday C Ghoshal
162 Peristaltic Recovery After Peroral Endoscopic Myotomy for Achalasia: Dream or Reality?: Author‘s ReplyZuzana Vackova, Jan Mares, Jana Krajciova, Zuzana Rabekova, Lucie Zdrhova, Pavla Loudova, Julius Spicak, Petr Stirand, Tomas Hucl, and Jan Martinek
164 Combination Treatment With Proton Pump Inhibitor Plus Prokinetic for Gastroesophageal Reflux DiseaseMuhammad Ali Tariq and Bilal Ahmed
165 Superimposed Non-acid Reflux Event: An Example of When It May Be Important to Revisit the Impedance Analysis GuidelinesFrederick W Woodley
ON THE COVERIntraluminal ultrasound (US) and impedance parameters in healthy subject. (A) The impedance value 5 cm above the lower esophageal sphincter and M-mode US images were temporally correlated to obtain baseline and nadir impedance values. (B) The baseline/contraction/distension muscle thickness, muscle cross-sectional area, and lumen cross-sectional area were analyzed using B-mode US images. See Kim et al on page 131.

1 2022 The Korean Society of Neurogastroenterology and Motility
J Neurogastroenterol Motil, Vol. 28 No. 1 January, 2022www.jnmjournal.org
Gastroesophageal reflux disease (GERD) presenting as heart-burn and acid regurgitation is one of the most common chronic gastrointestinal diseases, with a global prevalence of approximately 10-20%.1,2 The pathophysiology of GERD has been continuously studied, and while not fully understood, it is certain that multiple factors contribute to its development. Taking into account all ac-cepted concepts of pathophysiology, GERD is considered as a pathologic reflux that exceeds protective mechanisms, such as the esophagogastric junction barrier and esophageal acid clearance, both of which contribute to maintaining a physiologically balanced state.3 Dysfunction of such mechanisms eventually results in mu-cosal damage and reflux symptoms. Acid inhibitors, such as proton pump inhibitors, are the most vital component in GERD manage-ment. However, lifestyle modifications are considered to provide benefits similar to drug therapy.4 These include head elevation dur-ing bedtime, earlier dinnertimes, weight loss, smoking cessation, and avoidance of supine position at least 3 hours after meals.4
Lifestyle improvements are a vital part of GERD management, as several studies have associated the development of GERD with various demographic/environmental factors.2 Among these, obesity is most commonly reported and is considered a major risk factor for GERD. In a study reported by El-Serag et al,5 it was confirmed
that as individuals progressed toward being overweight and obese, the occurrence of GERD symptoms and erosive esophagitis (EE) increased 2.5-fold. In addition, a meta-analysis also proved the asso-ciation between obesity and GERD.6 In particular, it was confirmed that the risk of GERD symptoms increased with increasing body weight, with the risk being 1.43-fold for a body mass index (BMI) of 25-30 kg/m2 and 1.94-fold for a BMI of > 30 kg/m2.6 In the meta-analysis analyzing the effect of abdominal obesity, it was con-firmed that the odds ratio of EE increased to 1.87.7 Other factors, such as metabolic syndrome (MetS), may also be related to EE. A study conducted on 7078 patients who underwent screening endos-copy confirmed that risk of reflux esophagitis increased by 1.42-fold in those with MetS. This particular finding proved that MetS also plays an important role in the development of GERD.8 In addition, a cross-sectional study of 507 patients conducted by Loke et al9 not-ed that fasting blood sugar, triglyceride, aspartate aminotransferase, and alanine aminotransferase (ALT) levels were significantly higher in patients with EE. Other associated risk factors mentioned in epi-demiological studies include male sex, old age, smoking, drinking alcohol, and diabetes.2
A study conducted by Toki et al10 utilized health examination data to identify factors predicting the occurrence of reflux esophagi-
JNMJ Neurogastroenterol Motil, Vol. 28 No. 1 January, 2022pISSN: 2093-0879 eISSN: 2093-0887https://doi.org/10.5056/jnm21234
EditorialJournal of Neurogastroenterology and Motility
Received: December 1, 2021 Revised: None Accepted: December 8, 2021 This is an Open Access article distributed under the terms of the Creative Commons Attribution Non-Commercial License (http://creativecommons. org/licenses/by-nc/4.0) which permits unrestricted non-commercial use, distribution, and reproduction in any medium, provided the original work is properly cited.
*Correspondence: Kyoungwon Jung, MD Department of Internal Medicine, Kosin University College of Medicine, 262 Gamcheon-ro, Seo-gu, Busan 49267, Korea Tel: +82-51-990-6103, Fax: +82-51-990-5055, E-mail: [email protected]
Can a Health Checkup Record Predict the Onset of Reflux Esophagitis?
Kyoungwon Jung
Department of Internal Medicine, Kosin University College of Medicine, Busan, Korea
Article: Predictive factors for future onset of reflux esophagitis: a longitudinal case-control study using health checkup records Toki Y, Yamauchi R, Kayashima E, et al
(J Neurogastroenterol Motil 2022;28:86-94)

2
Kyoungwon Jung
Journal of Neurogastroenterology and Motility 2
tis (meaning of EE). In this study, matching analysis was performed on 2066 patients with endoscopy-confirmed EE and 4132 healthy controls. At the time of diagnosis, it was observed that BMI, ALT level, smoking history, acid reflux symptoms, hiatal hernia, and ab-sence of atrophic gastritis were independently associated with EE. In addition, significant differences in BMI, abdominal circumfer-ence, fasting blood sugar, triglyceride, aspartate aminotransferase and ALT levels, percentage of acid reflux symptoms, and atrophic gastritis findings were still identified between the 2 groups at 5 years before the base year on longitudinal comparisons. The authors be-lieve that these persistent differences may have had an effect on the occurrence of EE.
One advantage of the study is that it is able to overcome the limitations of cross-sectional studies. To date, most studies have compared the differences between patients with and without GERD through baseline characteristics.5,8,9 In addition, several studies have validated this correlation by reducing the effects of risk factors, such as weight loss and smoking cessation, while improv-ing symptoms and EE.11-13 However, direct determination of the effect of risk factors on the occurrence of GERD over time proved difficult because a majority of the studies were conducted over a short period of time or were only analyzed at the time of diagnosis or study. This longitudinal study was able to confirm that BMI, abdominal circumference, and blood test values, which are associ-ated with obesity, MetS, fatty liver, and diabetes, were observed to increase over time and were found to be significantly worse in the EE patient group compared with the control group.10
However, this study faced certain limitations. One is that the timing of EE diagnosis in relation to the study period could not be verified. Another is the possibility of selective bias in reflecting the entire population since the study mainly utilized health checkup data of company employees. In addition, data on drug history were not accurately confirmed; thus, a risk group for EE that did not occur due to proton pump inhibitor treatment may have been included in the control group. Lastly, since the presence of EE de-fined the division between the patient and control groups, cases of non-erosive reflux disease (NERD) were not considered; hence, all cases of GERD were not included.
Nevertheless, this study was able to identify risk factors in patients with a potential risk of EE through utilization of health checkup data. In addition, changes with respect to time were ana-lyzed. If long-term regional cohort studies are able to combine several validated questionnaires on GERD and health checkup data including the aforementioned risk factors, the influence of lifestyle
on the occurrence of GERD, including NERD, may be quanti-fied. Lastly, more studies are needed to determine whether these factors play a pathogenic role in the development of GERD.
Financial support: None.
Conflicts of interest: None.
References
1. Eusebi LH, Ratnakumaran R, Yuan Y, Solaymani-Dodaran M, Bazzoli F, Ford AC. Global prevalence of, and risk factors for, gastro-oesophageal reflux symptoms: a meta-analysis. Gut 2018;67:430-440.
2. Richter JE, Rubenstein JH. Presentation and epidemiology of gastro-esophageal reflux disease. Gastroenterology 2018;154:267-276.
3. Herregods TV, Bredenoord AJ, Smout AJ. Pathophysiology of gastro-esophageal reflux disease: new understanding in a new era. Neurogastro-enterol Motil 2015;27:1202-1213.
4. Gyawali CP, Fass R. Management of gastroesophageal reflux disease. Gastroenterology 2018;154:302-318.
5. El-Serag HB, Graham DY, Satia JA, Rabeneck L. Obesity is an inde-pendent risk factor for GERD symptoms and erosive esophagitis. Am J Gastroenterol 2005;100:1243-1250.
6. Hampel H, Abraham NS, El-Serag HB. Meta-analysis: obesity and the risk for gastroesophageal reflux disease and its complications. Ann Intern Med 2005;143:199-211.
7. Singh S, Sharma AN, Murad MH, et al. Central adiposity is associated with increased risk of esophageal inflammation, metaplasia, and adeno-carcinoma: a systematic review and meta-analysis. Clin Gastroenterol Hepatol 2013;11:1399-1412, e7.
8. Chung SJ, Kim D, Park MJ, et al. Metabolic syndrome and visceral obesity as risk factors for reflux oesophagitis: a cross-sectional case-control study of 7078 Koreans undergoing health check-ups. Gut 2008;57:1360-1365.
9. Loke SS, Yang KD, Chen KD, Chen JF. Erosive esophagitis associated with metabolic syndrome, impaired liver function, and dyslipidemia. World J Gastroenterol 2013;19:5883-5888.
10. Toki Y, Yamauchi R, Kayashima E, et al. Predictive factors for future onset of reflux esophagitis: a longitudinal case-control study using health checkup records. J Neurogastroenterol Motil 2022;28:86-94.
11. Ness-Jensen E, Hveem K, El-Serag H, Lagergren J. Lifestyle Interven-tion in Gastroesophageal Reflux Disease. Clin Gastroenterol Hepatol 2016;14:175-182, e1-e3.
12. Park SK, Lee T, Yang HJ, et al. Weight loss and waist reduction is associ-ated with improvement in gastroesophageal disease reflux symptoms: a longitudinal study of 15 295 subjects undergoing health checkups. Neu-rogastroenterol Motil 2017;29:e13009.
13. Kohata Y, Fujiwara Y, Watanabe T, et al. Long-term benefits of smoking cessation on gastroesophageal reflux disease and health-related quality of fife. PLoS One 2016;11:e0147860.

3 2022 The Korean Society of Neurogastroenterology and Motility
J Neurogastroenterol Motil, Vol. 28 No. 1 January, 2022www.jnmjournal.org
Functional dyspepsia (FD) is a prevalent gastrointestinal (GI) disorder in Korea.1 Although several symptom generating mecha-nisms have been discovered, the pathophysiology of FD remains to be elucidated. Clinical outcomes for FD are also not satisfactory. Accordingly, FD leads to a poor quality of life (QOL) and places a heavy medical burden on patients.2,3 Therefore, relevant clinical and experimental trials continue to be performed. As diagnosis of FD is symptom-based, accurate symptom evaluation is crucial for con-ducting research successively. Patients need to provide information regarding their feeling, symptoms, and any effects of treatment in a high-quality clinical practice.4 Thus, we have recognized the impor-tance of considering patient-reported outcomes (PROs).
Jung et al5 have published in this edition of the Journal of Neurogastroenterology and Motility their work that developed and validated a self-evaluation questionnaire for dyspepsia (SEQ-DYS-PEPSIA) that is written in Korean, and is easily applicable to Kore-an patients. The SEQ-DYSPEPSIA is composed of 11 questions mainly addressing the severity and frequency of FD and upper GI symptoms (UGISs) over a 2-week recall period, and is divided into the typical FD, major FD, and other UGISs. Other UGISs were included for the purpose of confirming the overlap or differential
diagnosis with other upper GI disorders mimicking FD. Validity was evaluated using the Patient Assessment of GI Symptom Sever-ity Index (PAGI-SYM), Nepean Dyspepsia Index-Korean version (NDI-K), and validated NDI-K QOL questionnaires.
The reliability and validity of the questionnaire was confirmed in a whole (SEQ-DYSPEPSIA) and in subscales with typical FD symptoms (SEQ-typical FD) and major FD symptoms (SEQ-ma-jor FD). All questionnaires were reliable and SEQ-DYSPEPSIA showed the highest reliability. In terms of validity, all also highly correlated with the PAGI-SYM postprandial fullness/early satiety subscale, and NDI-K total and dyspepsia subscales. In addition, SEQ-typical FD highly correlated with the PAGI-SYM upper abdominal pain subscale. Furthermore, modest correlation with NDI-K QOL was noticed in SEQ-DYSPEPIA and 2 subscales. In the treatment population, the score of SEQ-DYSPEPIA and 2 subscales was significantly decreased in the responder group than in the non-responder.
The SEQ-DYSPEPSIA seems to be a highly reliable and valid PRO instrument with a good medical responsiveness index in Korean patients with FD. This questionnaire also contains questions regarding not typical but often present symptoms in patients with
JNMJ Neurogastroenterol Motil, Vol. 28 No. 1 January, 2022pISSN: 2093-0879 eISSN: 2093-0887https://doi.org/10.5056/jnm21222
EditorialJournal of Neurogastroenterology and Motility
Received: November 16, 2021 Revised: None Accepted: November 29, 2021 This is an Open Access article distributed under the terms of the Creative Commons Attribution Non-Commercial License (http://creativecommons. org/licenses/by-nc/4.0) which permits unrestricted non-commercial use, distribution, and reproduction in any medium, provided the original work is properly cited.
*Correspondence: Yang Won Min, MD, PhD Department of Medicine, Samsung Medical Center, Sungkyunkwan University School of Medicine, 81 Irwon-ro, Gangnam-gu, Seoul 06351, Korea Tel: +82-2-3410-3409, Fax: +82-2-3410-6983, E-mail: [email protected]
The Korean Self-evaluation Questionnaire for Functional Dyspepsia
Yang Won Min
Department of Medicine, Samsung Medical Center, Sungkyunkwan University School of Medicine, Seoul, Korea
Article: Development and validity assessment of a self-evaluation questionnaire for functional dyspepsia: a multicenter prospective study in Korea Jung K, Jung HK, Kwon JG, et al
(J Neurogastroenterol Motil 2022;28:111-120)

4
Yang Won Min
Journal of Neurogastroenterology and Motility 4
FD, which may help the PRO obtain their response pertaining to the functional status as well as QOL. In fact, SEQ-DYSPEPSIA showed more statistically meaningful differences in the treatment response evaluation than the PAGI-SYM and NDI questionnaires. Taken all together, SEQ-DYSPEPSIA may be used as a high-quality PRO instrument for Korean patients with FD. It is hoped this tool will play a central role in the clinical practice and research and will lead us to overcome FD in the future.
Financial support: None.
Conflicts of interest: None.
References 1. Min BH, Huh KC, Jung HK, et al. Prevalence of uninvestigated dys-
pepsia and gastroesophageal reflux disease in Korea: a population-based study using the Rome III criteria. Dig Dis Sci 2014;59:2721-2729.
2. Miwa H, Ghoshal UC, Gonlachanvit S, et al. Asian consensus report on functional dyspepsia. J Neurogastroenterol Motil 2012;18:150-168.
3. Health related quality of life in functional gastrointestinal disorders in Asia. J Neurogastroenterol Motil 2011;17:245-251.
4. Weldring T, Smith SM. Patient-reported outcomes (PROs) and patient-reported outcome measures (PROMs). Health Serv Insights 2013;6:61-68.
5. Jung K, Jung HK, Kwon JG, et al. Development and validity assessment of a self-evaluation questionnaire for functional dyspepsia: a multicenter prospective study in Korea. J Neurogastroenterol Motil 2022;28:111-120.

5 2022 The Korean Society of Neurogastroenterology and Motility
J Neurogastroenterol Motil, Vol. 28 No. 1 January, 2022www.jnmjournal.org
JNMJ Neurogastroenterol Motil, Vol. 28 No. 1 January, 2022pISSN: 2093-0879 eISSN: 2093-0887https://doi.org/10.5056/jnm21095
Meta-analysisJournal of Neurogastroenterology and Motility
Received: May 14, 2021 Revised: July 30, 2021 Accepted: August 10, 2021 This is an Open Access article distributed under the terms of the Creative Commons Attribution Non-Commercial License (http://creativecommons. org/licenses/by-nc/4.0) which permits unrestricted non-commercial use, distribution, and reproduction in any medium, provided the original work is properly cited.
*Correspondence: Kwang Jae Lee, MD, PhD Department of Gastroenterology, Ajou University School of Medicine, 164 World Cup-ro, Yeongtong-gu, Suwon, Gyeonggi-do 16499, Korea Tel: +82-31-219-5119, Fax: +82-31-219-5999, E-mail: [email protected]
On-demand Versus Continuous Maintenance Treatment of Gastroesophageal Reflux Disease With Proton Pump Inhibitors: A Systematic Review and Meta-analysis
Seung Joo Kang,1 Hye-Kyung Jung,2 Chung Hyun Tae,2 Seung Young Kim,3 and Kwang Jae Lee4*1Department of Internal Medicine, Seoul National University Hospital Gangnam Center, Seoul, Korea; 2Department of Internal Medicine, Ewha Womans University College of Medicine, Seoul, Korea; 3Department of Internal Medicine, College of Medicine, Korea University, Seoul, Korea; and 4Department of Gastroenterology, Ajou University School of Medicine, Suwon, Gyeonggi-do, Korea
Background/AimsLong-term maintenance treatment of gastroesophageal reflux disease (GERD) is commonly used to prevent relapse of reflux symptoms; however, due to concerns about safety of long-term proton pump inhibitors (PPI) use, on-demand therapy is recommended as a long-term treatment modality. We compared the efficacy of on-demand and continuous PPI therapy for maintenance treatment of patients with GERD using meta-analysis.
MethodsCore electronic databases were searched for randomized controlled trials comparing on-demand and continuous therapy in GERD patients. The primary outcome was treatment failure of maintenance therapy, and the secondary outcomes included symptomatic relief, patient satisfaction, and amount of PPI use.
ResultsOverall, 11 studies were selected in the systematic review and meta-analysis. Compared with continuous PPI therapy, on-demand therapy showed similar outcomes for treatment failure (risk ratio, 1.26; 95% confidence interval [CI], 0.76-2.07), particularly in the non-erosive esophageal reflux disease and mild erosive reflux disease group (risk ratio, 1.48; 95% CI, 0.39-5.63). In studies including severe esophagitis patients, continuous PPI maintenance treatment was more effective (β, 0.127 [95% CI, 0.066-0.188]; P < 0.001). Severity of esophagitis was associated with higher efficacies of continuous maintenance therapy. The amount of daily PPI use was about half in the on-demand group compared to the continuous group (risk difference −0.52; 95% CI, −0.62-−0.42).
ConclusionsOn-demand PPI therapy shows comparable efficacy to the continuous maintenance treatment in the non-erosive esophageal reflux disease and mild erosive reflux disease group, and can remarkably reduce the amount of PPI use. Therefore, on-demand therapy may be preferentially recommended in the maintenance treatment of GERD unaccompanied by severe esophagitis.(J Neurogastroenterol Motil 2022;28:5-14)
Key WordsGastroesophageal reflux; Maintenance; Proton pump inhibitors

6
Seung Joo Kang, et al
Journal of Neurogastroenterology and Motility 6
Introduction
Gastroesophageal reflux disease (GERD) is a chronic diges-tive disorder resulting from the reflux of gastric contents into the esophagus that is often accompanied by troublesome symptoms of heartburn, acid regurgitation, or other extra-esophageal symptoms such as chest pain, chronic cough, hoarseness or globus.1 GERD imposes an important burden of illness worldwide with an esti-mated worldwide prevalence of between 8% and 33%.2 GERD is heterogeneous and presented with different phenotypes. Erosive re-flux disease (ERD) is defined as mucosal defect by endoscopy and occurs in approximately 25% of patients with GERD symptoms.3 Non-erosive reflux disease (NERD) is present in approximately 70% of patients and is characterized by the presence of typical GERD symptoms associated with pathological acid reflux but the absence of demonstrable esophageal mucosal injury on endoscopy.4
Currently, acid suppressive therapy with proton pump inhibi-tors (PPIs) has proved to be the most effective treatment strategy for GERD patients and is recommended as a first-line treatment.5 PPIs have shown superiority over histamine H2-receptor antago-nists for controlling symptoms as well as for healing erosions.6 Al-though symptomatic relief and acute healing of esophageal lesions can be achieved by short-term PPI treatments, up to 75% of pa-tients with NERD and up to 90% of patients with ERD experience relapse within 6 months to 1 year after termination of initial treat-ments.7 Therefore, long-term continuous maintenance treatment with PPIs is required for the majority of patients with GERD to adequately control symptoms and to heal mucosal lesions. However, recent studies suggest that long-term PPI treatment can increase the risk of Clostridium difficile or other enteric infection, kidney disease, bone fractures, or micronutrient deficiency.8 In addition to safety issues, continuous maintenance may have led to unneces-sary use of PPIs, increasing overall costs. In the United States, the total expenditure for PPI treatment was over $11 billion annu-ally.9 Therefore, maintenance therapy such as “on-demand” PPI therapy or “intermittent” PPI therapy have been used in clinical practice and their effectiveness has also been studied. On-demand PPI therapy means that patients take a daily dose of a PPI when symptoms recur and stop medication when symptoms resolve. Intermittent PPI therapy is when patients take a regular daily dose of a PPI upon symptom relapse and continue for a pre-specified duration, which is typically 1 or 2 weeks regardless of symptom response. To date, there have been 2 meta-analysis studies compar-ing on-demand and continuous PPI therapy. Boghossian et al10
performed a meta-analysis to compare the effects of continuous PPI therapy with stopping or on-demand PPI therapies in 2017.10 The authors concluded that on-demand PPI therapy may increase risk of “lack of symptom control” compared with continuous PPI use (risk ratio [RR], 1.71; 95% confidence interval [CI], 1.31-2.21), which means lower efficacy of on-demand therapy. However, Khan et al11 reported that on-demand PPI therapy was superior to con-tinuous PPI use in terms of treatment failure (RR, 1.71; 95% CI, 1.31-2.21) in patients with NERD and mild erosive esophagitis.11 These 2 meta-analysis results have drawn conflicting conclusions. Therefore, in this meta-analysis, we intended to comprehensively analyze the treatment failure rates, patient satisfaction, the amount of PPI usage, and symptom relief effects between on-demand PPI and continuous maintenance by synthesizing the studies for GERD patients. In addition, we preformed meta-regression to determine whether there is a difference in the effectiveness of 2 treatments ac-cording to the presence and severity of ERD and ethnicities.
Materials and Methods
This meta-analysis was conducted in accordance with the prin-ciples of the Preferred Reporting Items for Systematic Reviews and Meta-Analysis (PRISMA) statement.12 The need for approval from the institutional review board was waived since this study was performed by reviewing the literatures.
Literature Search StrategyWe searched all relevant studies that evaluated with efficacy of
on-demand PPI maintenance and continuous PPI maintenance in GERD patients using PubMed, EMBASE, the Cochrane library, and KoreaMed from inception to December 2020. The follow-ing search terms were used: ([gastroesophageal reflux] or [reflux esophagitis] or [erosive esophagitis] or [heartburn]) and ([proton pump inhibitors] or [PPIs]) and ([maintenance] or [on-demand] or [continuous]). The detailed search strategies in each database and the search results are shown in Supplementary Table 1. Cited references in published studies were manually searched to identify other relevant studies.
Study SelectionThe inclusion criteria in this study were as follows: (1) patients
with GERD including uninvestigated GERD, NERD, and ERD who need PPI maintenance therapy; (2) comparison of on-demand PPI maintenance treatment with continuous PPI maintenance treatment; (3) randomized controlled trials (RCTs) with parallel

77
On-demand Versus Continuous Maintenance Treatment
Vol. 28, No. 1 January, 2022 (5-14)
design; (4) adults aged over 18 years; and (5) studies available in full-text form. The exclusion criteria were as follows: (1) abstract-only publications or unpublished studies, (2) case reports and nar-rative reviews, (3) systematic review/meta-analysis, (4) proceedings or study protocols, and (5) studies with insufficient data regarding treatment outcomes. In the first stage of study selection, irrelevant articles were excluded by reviewing the titles and abstracts of the studies retrieved by keyword search. Thereafter, the full texts of selected studies were reviewed in accordance with our inclusion and exclusion criteria.
Quality AssessmentAll studies were assessed using Cochrane’s “Risk of Bias” tool,
which includes the following domains: random sequence generation (selection bias), allocation concealment (selection bias), blinding of participants and personnel (performance bias), blinding of outcome assessment (detection bias), incomplete outcome data addressed over the short and long terms (attrition bias), selective reporting (reporting bias), and other biases.13 Two authors (S.J.K. and C.H.T.) independently assessed the methodological quality of all included studies, and any disagreements between the 2 evaluators were resolved by discussion and consensus. If no agreement could be reached, a third investigator (H.K.J.) was consulted.
Data ExtractionThe primary outcome of this meta-analysis was treatment fail-
ure with maintenance therapy, which means that patients discontin-ued the allocated maintenance therapy prematurely. The secondary
endpoints were as follows: (1) proportion of patients who achieved successful symptom relief, (2) satisfaction with maintenance therapy, (3) amount of pill usage in each maintenance therapy, and (4) ad-verse events in both treatment groups. Using a data extraction form that had been developed in advance, 2 reviewers (S.J.K. and C.H.T.) independently extracted the following information: first author, year of publication, study design, country, study period, PPI mainte-nance dosage, symptom evaluation tools, rates of treatment failure, degree of satisfaction, pill usage during maintenance, and adverse events.
Statistical MethodsMeta-analyses were performed to calculate the pooled RRs
with a 95% CI. The Mantel-Haenszel random-effects model was used for binary outcomes, and the inverse variance method was used for continuous outcomes. In addition, we evaluated subgroup analyses according to symptomatic GERD patients who did not undergo endoscopic evaluation, patients with NERD and patients with ERD. Heterogeneity was assessed using the I2 test to calculate the percentage of total variation across the included articles. Nega-tive values for I2 were set to zero, and I2 ≥ 50% indicated the pres-ence of substantial heterogeneity. Meta-regression was performed to investigate sources of heterogeneity (presence and severity of esoph-agitis and ethnicity). Publication bias was assessed qualitatively by inspecting funnel plots of the logarithmic RR vs their standard er-rors and quantitatively by Egger’s linear regression method test and Begg’s rank correlation test when 7 or more studies were available. All P-value were 2-tailed, and P < 0.05 was considered statistically
Figure 1. Flow diagram of the studies included in the meta-analysis.
Inc
lud
ed
Eli
gib
ilit
yS
cre
en
ing
Ide
nti
fic
ati
on
Records after duplicates removed
(n = 277)
Records screened
(n = 277)
Full-text articles assessed for eligibility
(n = 31)
Studies included in meta-analysis
(n = 11)
Records excluded by title
and abstract screening
(n = 246)
Records identified through
database searching
Medline (n = 236) EMBASE (n = 393)
Cochrane library (n = 338)
Additional records identified
through Korean sources
KoreaMed (n = 17)
Full-text articles excluded, with
reasons (n = 20)
1) Not meeting the inclusion
criteria (n = 12)
2) Not reported appropriate
outcome (n = 5)
3) Full-text was not available
(n = 1)
4) Incomplete data (n = 2)

8
Seung Joo Kang, et al
Journal of Neurogastroenterology and Motility 8
significant in all tests. For meta-analysis, we used Review Manager version 5.3 (RevMan for Windows, the Nordic Cochrane Center, Copenhagen, Denmark) and “meta” packages in R version 3.6.3.
Results
Study SelectionThe flow diagram of the selection process, performed in ac-
cordance with PRISMA guidelines, is shown in Figure 1. The electronic database search identified a total of 630 records, of which 277 remained after removing duplicates. After screening the titles and abstracts, we excluded 246 irrelevant articles. The full texts of the 31 remaining articles were reviewed for eligibility. Of these, 11 studies met the inclusion criteria, and 20 studies were excluded from the final analysis.
Characteristics of Included StudiesThe characteristics of the 11 included studies are summarized
in Supplementary Table 1.14-24 The studies were RCTs published between 2004 and 2018, consisting of a total of 6138 GERD pa-tients. The study design was a randomized, open-label study except for 1 study by van der Velden et al,24 which was a randomized, dou-ble-blind study. Two studies16,20 were conducted in Asian countries, and all other studies were performed in Western countries. Three studies by Hansen et al,17 Morgan et al,19 and Szucs et al22 included patients with GERD symptoms. Two studies by Bayerdorffer et al14 and Tsai et al23 included patients with NERD. The remaining 6 studies were performed in patients with ERD proven by endos-copy. The detailed GERD definition in each study is described in Supplementary Table 1. Except for 2 studies,16,23 the PPI doses for on-demand and continuous maintenance treatment groups were
2.1.1 Symptomatic GERD
Subtotal (95% CI)
2.1.2 NERD only
Subtotal (95% CI)
2.1.3 NERD and mild ERD
Subtotal (95% CI)
2.1.4 All ERD
Subtotal (95% CI)
Total (95% CI)
Hansen 2005Morgan 2007Szucs 2009
Total eventsHeterogeneity: Tau = 0.04; Chi = 3.44, df = 2 ( = 0.18); I = 42%Test for overall effect: Z = 1.37 ( = 0.17)
Tsai 2004Bayerdorffer 2016
Total eventsHeterogeneity: Tau = 0.00; Chi = 0.73, df = 1 ( = 0.39); I = 0%Test for overall effect: Z = 3.16 ( = 0.002)
Janssen 2005van der Velden 2010
Total eventsHeterogeneity: Tau = 0.77; Chi = 5.62, df = 1 ( = 0.02); I = 82%Test for overall effect: Z = 0.57 ( = 0.57)
Sjostedt 2005
Total eventsHeterogeneity: not applicableTest for overall effect: Z = 4.68 ( < 0.00001)
Total eventsHeterogeneity: Tau = 0.40; Chi = 43.58, df = 7 ( < 0.00001); I = 84%Test for overall effect: Z = 0.90 ( = 0.37)Test for subgroup differences: Chi = 33.39, df = 3 ( < 0.00001); I = 91.0%
2 2 2
2 2 2
2 2 2
2 2 2
2 2
PP
PP
PP
P
PP
P
Study or subgroup
Risk ratio
M-H, random, 95% CIEvents Total YearWeight M-H, random, 95% CI
On-demand Continuous Risk ratio
Favours on-demand
0.05 0.2 1 205
Favours continuous
Events Total
696
60
135
1919
38
1334
47
49
49
269
634131991
311301
215141
234
1756
612
356
234
2958
463
55
104
4129
70
175
22
12
12
208
658137913
311297
21762
243
1708
608
279
243
2838
14.9%7.3%
14.9%37.0%
13.7%13.4%27.1%
12.2%10.6%22.9%
13.0%13.0%
100.0%
1.56 [1.09, 2.22]2.09 [0.53, 8.19]1.01 [0.70, 1.43]1.29 [0.89, 1.87]
0.46 [0.28, 0.78]0.65 [0.37, 1.13]0.54 [0.37, 0.79]
0.77 [0.38, 1.55]2.99 [1.23, 7.28]1.48 [0.39, 5.63]
4.24 [2.32, 7.77]4.24 [2.32, 7.77]
1.26 [0.76, 2.07]
200520072009
20042016
20052010
2005
Figure 2. Forest plot of the relative efficacy in terms of the treatment failure between on-demand therapy and continuous therapy. M-H, Mantel-Haenszel; GERD, gastroesophageal reflux disease; NERD, non-erosive esophageal reflux disease; ERD, erosive reflux disease.

99
On-demand Versus Continuous Maintenance Treatment
Vol. 28, No. 1 January, 2022 (5-14)
the same. In the study by Cho et al,16 40 mg esomeprazole was used in the on-demand group and 20 mg esomeprazole was used in the continuous group. In the study by Tsai et al,23 20 mg esomeprazole was used in the on-demand group and 15 mg lansoprazole was used in the continuous group. The duration of maintenance therapy in the 2 studies by Cho et al16 and van der Velden et al24 was 12 and 13 weeks, respectively, and the remaining studies were maintained for 6 months. The risk of bias graph and risk of bias summary of included studies are presented in Supplementary Figure 1 and Supplementary Figure 2, respectively.
Primary OutcomesA meta-analysis was performed on 8 RCTs that analyzed out-
comes for treatment failure. The detailed outcome measurements of each study are summarized in Supplementary Table 2. Treatment failure was observed in 269 of 2958 patients (9.1%) in the on-de-mand PPI group, and 208 of 2838 patients (7.3%) in the continu-ous PPI group (Fig. 2). The RR with 95% CI was 1.26 (0.76-2.07) (P = 0.372) which means no significant difference between 2 treat-ments in overall GERD patients. The heterogeneity of studies was 84%. Funnel plot of 8 studies was shown in Supplementary Figure 3 and showed no significant asymmetry. No significant publication bias was detected from Egger’s linear regression method test (P = 0.674) and Begg’s rank correlation test (P = 0.458). Subgroup analysis was performed according to the presence or absence of ero-sive esophagitis. We divided the entire patient group into the symp-tomatic GERD, NERD only, NERD and mild ERD, and all
ERD groups as shown in Figure 2. The mild ERD group includes patients with Los Angeles (LA) grade A or B or Savary-Miller grade 1 or 2. No significant difference in treatment failure between the on-demand and continuous groups was found upon meta-analysis in the symptomatic GERD group without endoscopy (RR, 1.29; 95% CI, 0.89-1.87), and the NERD and mild ERD group (RR, 1.48; 95% CI, 0.39-5.63). In the NERD only group, treat-ment failure was significantly lower in the on-demand group (RR, 0.54; 95% CI, 0.37-0.79). However, in a study including patients with severe erosive esophagitis, treatment failure was significantly lower in the continuous PPI group (RR, 4.24; 95% CI, 2.32-7.77). We performed meta-regression by presence and severity of esopha-gitis by endoscopy as shown in Figure 3. Severity of esophagitis was associated with higher efficacies of continuous maintenance therapy (β, 1.013 [95% CI, 0.466-1.561]; P < 0.001) (Supplementary Table 2). Considering the high heterogeneity of analysis results, subgroup analysis was performed according to PPI types. There was no difference in treatment failure between continuous and on-demand maintenance treatments in the esomeprazole group and other PPI groups (Supplementary Fig. 4 and 5). We also carried out a sensitivity analysis to determine if the omission of each study would undermine the results of meta-analysis. The results of the changes were not obtained after omitting each study, indicating the stability of our analysis (Supplementary Table 3).
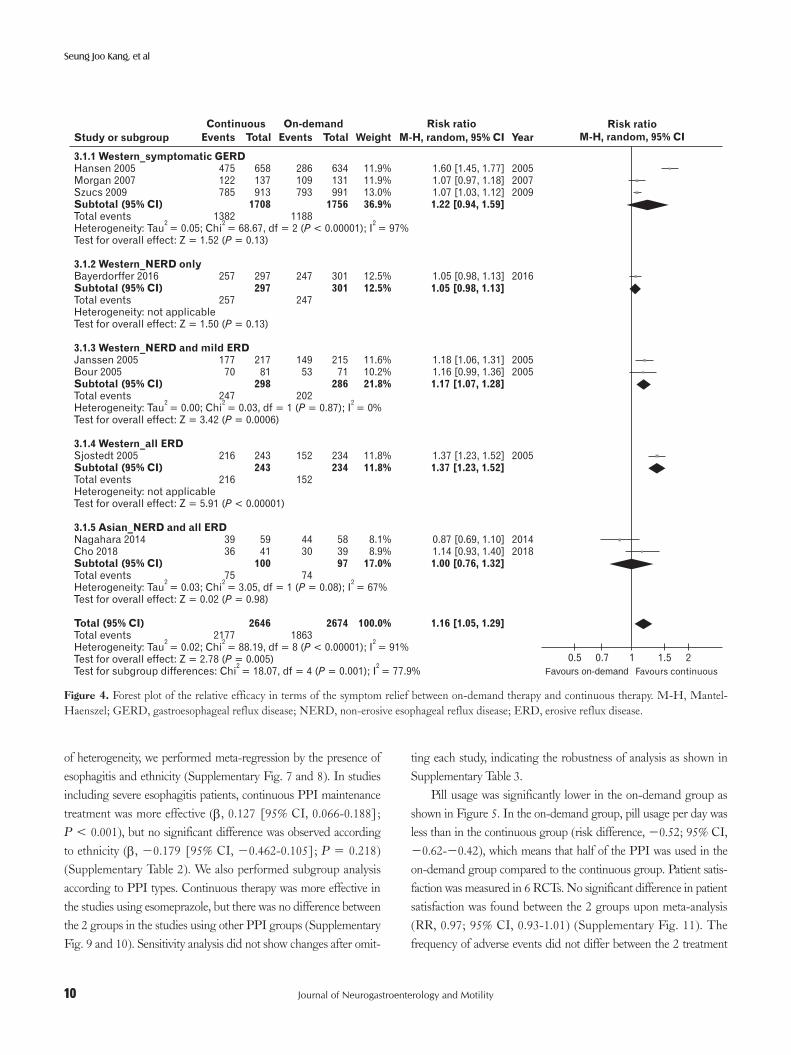
Secondary OutcomesThe proportion of patients who achieved successful symptom
relief was higher in the continuous PPI group (RR, 1.16; 95% CI, 1.05-1.29) (Fig. 4). Funnel plot of 9 studies is shown in Supple-mentary Figure 6. No significant publication bias was detected from Egger’s linear regression method test (P = 0.469) and Begg’s rank correlation test (P = 0.835). The heterogeneity among studies was significant (I2 = 91%). Therefore, we performed subgroup analysis according to ethnicity and the presence of esophagitis. There was no significant difference between therapies in the Western symptomatic GERD group (RR, 1.22; 95% CI, 0.94-1.59), in Western NERD only group (RR, 1.05; 95% CI, 0.98-1.13), and in Asian NERD and ERD groups (RR, 1.00; 95% CI, 0.76-1.32). However, con-tinuous PPI maintenance treatment showed more effectiveness in Western NERD and mild ERD group (RR, 1.17; 95% CI, 1.07-1.28) and Western ERD group (RR, 1.37; 95% CI, 1.23-1.52). When the study patient was limited to the NERD and the mild ERD group, continuous maintenance treatment showed a better effect (RR, 1.09; 95% CI, 1.01-1.18) and the number needed to treat (NNT) was 14.3 (95% CI, 7.7-20.9). To identify the sources
Figure 3. Random-effects univariate meta-regression between treat-ment failure and esophagitis severity. Each circle represents a study and the size of the circle reflects the influence of that study on the model. The regression prediction is presented by the solid line (1.013 [95% CI, 0.466-1.561], P < 0.001). NERD, non-erosive esophageal reflux disease; ERD, erosive reflux disease.
NERD only
Tsai 2004
Janssen 2005
van der Velden 2010
NERD and mild ERD All ERD
1.5
1.0
0.5
0
0.5
Tre
atm
en
te
ffe
ct
(lo
gri
sk
rati
o)
Esophagitis severity
Bayerdorffer 2016
Sjostedt 2005
10
Seung Joo Kang, et al
Journal of Neurogastroenterology and Motility 10
of heterogeneity, we performed meta-regression by the presence of esophagitis and ethnicity (Supplementary Fig. 7 and 8). In studies including severe esophagitis patients, continuous PPI maintenance treatment was more effective (β, 0.127 [95% CI, 0.066-0.188]; P < 0.001), but no significant difference was observed according to ethnicity (β, −0.179 [95% CI, −0.462-0.105]; P = 0.218) (Supplementary Table 2). We also performed subgroup analysis according to PPI types. Continuous therapy was more effective in the studies using esomeprazole, but there was no difference between the 2 groups in the studies using other PPI groups (Supplementary Fig. 9 and 10). Sensitivity analysis did not show changes after omit-
ting each study, indicating the robustness of analysis as shown in Supplementary Table 3.
Pill usage was significantly lower in the on-demand group as shown in Figure 5. In the on-demand group, pill usage per day was less than in the continuous group (risk difference, −0.52; 95% CI, −0.62-−0.42), which means that half of the PPI was used in the on-demand group compared to the continuous group. Patient satis-faction was measured in 6 RCTs. No significant difference in patient satisfaction was found between the 2 groups upon meta-analysis (RR, 0.97; 95% CI, 0.93-1.01) (Supplementary Fig. 11). The frequency of adverse events did not differ between the 2 treatment
Figure 4. Forest plot of the relative efficacy in terms of the symptom relief between on-demand therapy and continuous therapy. M-H, Mantel-Haenszel; GERD, gastroesophageal reflux disease; NERD, non-erosive esophageal reflux disease; ERD, erosive reflux disease.
3.1.1 Western_symptomatic GERD
Subtotal (95% CI)
3.1.2 Western_NERD only
Subtotal (95% CI)
3.1.3 Western_NERD and mild ERD
Subtotal (95% CI)
3.1.4 Western_all ERD
Subtotal (95% CI)
3.1.5 Asian_NERD and all ERD
Subtotal (95% CI)
Total (95% CI)
Hansen 2005Morgan 2007Szucs 2009
Total eventsHeterogeneity: Tau = 0.05; Chi = 68.67, df = 2 ( < 0.00001); I = 97%Test for overall effect: Z = 1.52 ( = 0.13)
Bayerdorffer 2016
Total eventsHeterogeneity: not applicableTest for overall effect: Z = 1.50 ( = 0.13)
Janssen 2005Bour 2005
Total eventsHeterogeneity: Tau = 0.00; Chi = 0.03, df = 1 ( = 0.87); I = 0%Test for overall effect: Z = 3.42 ( = 0.0006)
Sjostedt 2005
Total eventsHeterogeneity: not applicableTest for overall effect: Z = 5.91 ( < 0.00001)
Nagahara 2014Cho 2018
Total eventsHeterogeneity: Tau = 0.03; Chi = 3.05, df = 1 ( = 0.08); I = 67%Test for overall effect: Z = 0.02 ( = 0.98)
Total eventsHeterogeneity: Tau = 0.02; Chi = 88.19, df = 8 ( < 0.00001); I = 91%Test for overall effect: Z = 2.78 ( = 0.005)Test for subgroup differences: Chi = 18.07, df = 4 ( = 0.001); I = 77.9%
2 2 2
2 2 2
2 2 2
2 2 2
2 2
PP
P
PP
P
PP
PP
P
Study or subgroup
Risk ratio
M-H, random, 95% CIEvents Total YearWeight M-H, random, 95% CI
On-demandContinuous Risk ratio
Favours on-demand
0.5 0.7 1 21.5
Favours continuous
Events Total
475122785
1382
257
257
17770
247
216
216
3936
75
2177
658137913
297
21781
243
5941
1708
297
298
243
100
2646
286109793
1188
247
247
14953
202
152
152
4430
74
1863
634131991
301
21571
234
5839
1756
301
286
234
97
2674
11.9%11.9%13.0%
12.5%
11.6%10.2%
11.8%
8.1%8.9%
36.9%
12.5%
21.8%
11.8%
17.0%
100.0%
1.60 [1.45, 1.77]1.07 [0.97, 1.18]1.07 [1.03, 1.12]1.22 [0.94, 1.59]
1.05 [0.98, 1.13]1.05 [0.98, 1.13]
1.18 [1.06, 1.31]1.16 [0.99, 1.36]1.17 [1.07, 1.28]
1.37 [1.23, 1.52]1.37 [1.23, 1.52]
0.87 [0.69, 1.10]1.14 [0.93, 1.40]1.00 [0.76, 1.32]
1.16 [1.05, 1.29]
200520072009
2016
20052005
2005
20142018

1111
On-demand Versus Continuous Maintenance Treatment
Vol. 28, No. 1 January, 2022 (5-14)
groups (RR, 1.02; 95% CI, 0.90-1.14) (Supplementary Fig. 12).
Discussion
The meta-analysis of RCTs on maintenance treatment in GERD patients found no difference in treatment failure and satis-faction between the on-demand and continuous PPI maintenance groups. In terms of symptom relief, continuous therapy was more effective than on-demand therapy. However, meta-regression analysis demonstrated that the severity of esophagitis can affect the effectiveness of maintenance therapy. In NERD and mild ERD patients, treatment failure rate was similar in both therapies, and symptom relief was slightly higher in the continuous therapy group, although the clinical significance of this difference does not appear to be large (NNT = 14.3). In terms of treatment failure and symp-tom relief, continuous maintenance therapy was more effective in studies including severe ERD patients. However, in Asian patients where severe ERD patients are rare, there was no difference in the effect of symptom relief between both maintenance therapies. The amount of pill usage was significantly lower in the on-demand group. Therefore, in GERD patients with NERD and mild ERD patients or Asian patients, on-demand therapy may be preferentially recommended as an effective maintenance therapy.
Although many guidelines recommend on-demand therapy as a maintenance therapy for GERD, few meta-analysis articles have reported its effectiveness. Boghossian10 reviewed the efficacy of on-demand PPI therapy versus continuous PPI therapy in NERD or mild ERD (LA grade A or B). The authors concluded that on-demand PPI therapy may increase risk of “lack of symptom control” compared with continuous PPI use (RR, 1.71; 95% CI, 1.31-2.21), thereby favoring continuous PPI use. Khan et al11 also performed a meta-analysis comparing on-demand therapy with continuous PPI use in patients with NERD or mild ERD. Their conclusion that on-demand PPI was superior to continuous PPI
(OR, 0.50; 95% CI, 0.35-0.72) in terms of ‘discontinuation of maintenance treatment’ is contrary to the results of the former study. In our study, when limited to NERD and mild ERD patients as in the 2 studies above, continuous maintenance treatment was slightly more effective in symptom relief (RR, 1.09; 95% CI, 1.01-1.18), as in the study of Boghossian, and there was no difference between the 2 groups in treatment failure (RR, 0.85; 95% CI, 0.43-1.66). This result was different from that of Khan’s study.11 This is because van der Velden’s study24 was added to our study due to the difference in inclusion criteria, and the results of this study have an influence on the outcome. However, in studies including moderate to severe esophagitis, continuous therapy showed superior efficacies in terms of treatment failure (RR, 4.24; 95% CI, 2.32-7.70) and symptom relief (RR, 1.37; 95% CI, 1.23-1.52). The American Gastroentero-logical Association guideline also reports that the use of long-term PPI has a greater benefit than harm in GERD patients with severe esophagitis or complications such as strictures.25
In subgroup analysis, 3 studies included all grades of esophagi-tis. However, grade C and D esophagitis patients accounted for only 6.0% (7/117) in the Nagahara’s study20 and 2.5% (2/80) in Cho’s study.16 In the Sjöstedt’s study,21 patients with grade C and grade D esophagitis accounted for 17.0% (80/470) and 5.0% (24/470) of all patients, respectively. Therefore, to confirm the effect of mainte-nance therapy in severe esophagitis such as LA grade C and D, the results of Sjöstedt’s study21 should be referenced. Treatment failure was significantly higher (RR, 4.24; 95% CI, 2.32-7.77), and symp-tom relief was significantly lower (RR, 1.37; 95% CI, 1.23-1.52) in the on-demand PPI group compared to the continuous therapy group. Furthermore, the authors also investigated the cumulative healing rate of esophagitis for up to 6 months. The cumulative pro-portion of patients in remission on the continuous PPI group was 81.0% compared with only 58.0% in the on-demand PPI group (P < 0.01). In patients with grade C and D esophagitis, relapse rates during on-demand maintenance treatment were as high as 49.0%
Figure 5. Forest plot of the amount of pill usage between on-demand therapy and continuous therapy. IV, inverse variance.
Janssen 2005Bour 2005Bayerdorffer 2016Cho 2018
Heterogeneity: Tau = 0.01; Chi = 45.10, df = 3 ( < 0.00001); I = 93%Test for overall effect: Z = 9.85 ( < 0.00001)
Total (95% CI)2 2 2P
P
Study or subgroup
Mean difference
IV, random, 95% CIYearWeight IV, random, 95% CI
On-demand Continuous Mean difference
Favours on-demand
0.51 10 0.5
Favours continuous
0.930.960.911.02
0.170.120.160.36
21781
29741
636
27.2%27.1%28.0%17.6%
100.0%
2005200520162018
0.510.310.410.52
0.310.180.250.34
21571
30139
626
Mean TotalSD Mean TotalSD
0.42 [ 0.47, 0.37]0.65 [ 0.70, 0.60]0.50 [ 0.53, 0.47]0.50 [ 0.65, 0.35]
0.52 [ 0.62, 0.42]0.52 [ 0.62, 0.42]
12
Seung Joo Kang, et al
Journal of Neurogastroenterology and Motility 12
and 57.0%, respectively. Therefore, in the maintenance therapy of overall GERD patients, on-demand therapy showed a similar effect to continuous therapy. However, when limited to the patients with severe esophagitis of LA grade C or D, the continuous maintenance therapy could be a better option compared with the on-demand PPI therapy.
Among the 11 studies included in the analysis, 2 were conduct-ed in Asia. Nagahara’s study20 was conducted in Japan and Cho’s study16 was conducted in Korea. Both studies included all grades of erosive esophagitis, but the proportion of patients with grade C and D esophagitis were only 6.0% in Nagahara’s study20 and 2.5% in Cho’s study.16 According to the results of epidemiologic studies, the proportion of severe erosive esophagitis in Asia is very low com-pared to that in Western countries. From a multicenter prospective study from Korea, out of 354 erosive esophagitis patients, only 12 patients were grade C and 4 were grade D, and the proportion of grade C and D among all erosive esophagitis was 4.5%.26 This figure is similar to the proportion of grade C and D patients in the 2 Asian studies included in the analysis, and much lower than the proportion (22.0%) found in the Western study by Sjöstedt et al.21 The effect of maintenance therapy in the Asian studies also shows different results from Western studies. When symptom relief was an outcome, continuous maintenance therapy was more effective than on-demand therapy in the entire study. However, the results of 2 studies from Asia showed no difference in symptom relief between the on-demand and continuous groups. Therefore, on-demand PPI therapy can be an effective maintenance treatment option in Asian patients with GERD.
Recent studies suggest that long-term PPI use may be associ-ated with adverse events or complications, including enteric infec-tion, bone fracture, kidney diseases, and micronutrient deficiency.8 A meta-analysis of 36 case-control studies and 14 cohort studies showed that C. difficile infection is associated with PPI use (OR, 1.26; 95% CI, 1.12-1.39).27 An RCT that evaluated the long-term safety of PPIs over 2 years revealed increased events of C. difficile infection in PPI group (9 cases in 8791) compared to placebo group (4 cases in 8807), which did not reach statistical significance due to very few number of cases in either group (OR, 2.26, 95% CI, 0.70-7.34).28 According to available evidences, the Food and Drug Administration and Prevention announced that C. difficile diarrhea may be associated with PPI use. Other adverse events such as kidney diseases, community-acquired pneumonia, and bone fractures have been demonstrated in case-control studies or cohort studies.29-31 Therefore, many GERD guidelines recommend that PPIs should be administered at the lowest effective dose. In this
study, the amount of PPI used in the on-demand group was almost half that of the continuous group (−0.52 [−0.62-−0.42] pill use/day). Therefore, considering the various adverse effects associated with the use of long-term PPI, on-demand maintenance treatment is considered a safer and more cost-effective treatment modality than continuous maintenance treatment.
This study has several limitations. First, as described in the result section and Supplementary Table 1, 10 of the 11 studies in-cluded in analysis were open-label studies. On-demand therapy is expected to be difficult to conduct with a double-blind study. Only 1 study performed a double-blind study that showed that symptom control and quality of life were similar in the on-demand and con-tinuous therapies. Since the open-label study is very similar to the actual clinical situation, the interpretation of the results is unlikely to be different significantly. Second, as a result of meta-analysis, the heterogeneity among the studies was high. The inclusion of patients with varying degrees of symptoms and esophagitis may have an ef-fect on the heterogeneity as shown in the meta-regression analysis. Also, as a result of the subgroup analysis by the esophagitis grade, the heterogeneity within each group was significantly reduced. The diversity of outcome measurement also contribute to the high heterogeneity of this study. Third, no studies reported CYP2C19 polymorphism and their effect on PPI maintenance therapy. How-ever, 2 studies used rabeprazole, which is not affected by CYP2C19 polymorphism, reported no difference between the maintenance therapies in terms of “treatment failure” and “symptom relief.” Forth, only 2 Asian studies were included in this analysis, and the results between Asian and Western studies show slightly different trends as shown in the analysis. It may be difficult to apply the re-sults of this study to Asian patients. In this regard, more research is needed in the Asian region. Finally, intermittent therapy is another recommended maintenance therapy in some guidelines, and is also known to be an effective maintenance option. However, because of lack of RCTs on the intermittent therapy, its effect cannot be com-pared with the on-demand or continuous therapy.
In conclusion, the on-demand PPI therapy showed similar efficacies to continuous therapy in the outcome of treatment fail-ure, symptom relief, and patient satisfaction in GERD patients, especially in NERD and mild ERD patients, and Asian patients. The severity of esophagitis significantly influenced the effect of the 2 maintenance therapies. In particular, continuous maintenance treatment seems to be more effective in patients with severe ERD. However, on-demand therapy has the advantage of reducing the amount of PPI usage by half compared to the continuous therapy. Therefore, the on-demand PPI therapy is recommended as an

1313
On-demand Versus Continuous Maintenance Treatment
Vol. 28, No. 1 January, 2022 (5-14)
effective maintenance treatment modality in GERD patients unac-companied by severe esophagitis.
Supplementary Materials
Note: To access the supplementary tables and figures men-tioned in this article, visit the online version of Journal of Neurogas-troenterology and Motility at http://www.jnmjournal.org/, and at https://doi.org/10.5056/jnm21095.
Financial support: This research was supported by a grant of the Korea Health Technology R&D Project through the National Evidence-based Healthcare Collaborating Agency (NECA), fund-ed by the Ministry of Health & Welfare, Republic of Korea (Grant No. HI19C0481, HC19C0060).
Conflicts of interest: None.
Author contributions: Conceptualization: Hye-Kyung Jung and Kwang Jae Lee; data curation: Seung Joo Kang and Chung Hyun Tae; formal analysis: Seung Joo Kang, Chung Hyun Tae, and Seung Young Kim; fund acquisition: Hye-Kyung Jung and Kwang Jae Lee; methodology: Hye-Kyung Jung; supervision: Kwang Jae Lee; writing-original draft: Seung Joo Kang; and writ-ing-review and editing: Chung Hyun Tae and Seung Young Kim.
References 1. Locke GR 3rd. Natural history of nonerosive reflux disease. Is all gastro-
esophageal reflux disease the same? What is the evidence? Gastroenterol Clin North Am 2002;31(4 suppl):S59-S66.
2. El-Serag HB, Sweet S, Winchester CC, Dent J. Update on the epide-miology of gastro-oesophageal reflux disease: a systematic review. Gut 2014;63:871-880.
3. Zagari RM, Fuccio L, Wallander MA, et al. Gastro-oesophageal reflux symptoms, oesophagitis and barrett’s oesophagus in the general popula-tion: the Loiano-Monghidoro study. Gut 2008;57:1354-1359.
4. Vakil N, van Zanten SV, Kahrilas P, Dent J, Jones R. The Montreal definition and classification of gastroesophageal reflux disease: a global evidence-based consensus. Am J Gastroenterol 2006;101:1900-1920.
5. Katz PO, Gerson LB, Vela MF. Guidelines for the diagnosis and management of gastroesophageal reflux disease. Am J Gastroenterol 2013;108:308-328.
6. van Pinxteren B, Numans ME, Bonis PA, Lau J. Short-term treatment with proton pump inhibitors, H2-receptor antagonists and prokinetics for gastro-oesophageal reflux disease-like symptoms and endoscopy negative reflux disease. Cochrane Database Syst Rev 2006:CD002095.
7. Dean BB, Gano AD Jr, Knight K, Ofman JJ, Fass R. Effectiveness of proton pump inhibitors in nonerosive reflux disease. Clin Gastroenterol
Hepatol 2004;2:656-664.8. Maret-Ouda J, Markar SR, Lagergren J. Gastroesophageal reflux dis-
ease: a review. JAMA 2020;324:2536-2547.9. Shaheen NJ, Hansen RA, Morgan DR, et al. The burden of gastrointes-
tinal and liver diseases, 2006. Am J Gastroenterol 2006;101:2128-2138.10. Boghossian TA, Rashid FJ, Thompson W, et al. Deprescribing versus
continuation of chronic proton pump inhibitor use in adults. Cochrane Database Syst Rev 2017;3:CD011969.
11. Khan Z, Alastal Y, Khan MA, et al. On-demand therapy with proton pump inhibitors for maintenance treatment of nonerosive reflux disease or mild erosive esophagitis: a systematic review and meta-analysis. Gastroen-terol Res Pract 2018;2018:6417526.
12. Liberati A, Altman DG, Tetzlaff J, et al. The PRISMA statement for reporting systematic reviews and meta-analyses of studies that evaluate health care interventions: explanation and elaboration. Ann Intern Med 2009;151:W65-W94.
13. Higgins JP, Altman DG, Gøtzsche PC, et al. The cochrane col-laboration’s tool for assessing risk of bias in randomised trials. BMJ 2011;343:d5928.
14. Bayerdörffer E, Bigard MA, Weiss W, et al. Randomized, multicenter study: on-demand versus continuous maintenance treatment with esome-prazole in patients with non-erosive gastroesophageal reflux disease. BMC Gastroenterol 2016;16:48.
15. Bour B, Staub JL, Chousterman M, et al. Long-term treatment of gastro-oesophageal reflux disease patients with frequent symptomatic re-lapses using rabeprazole: on-demand treatment compared with continu-ous treatment. Aliment Pharmacol Ther 2005;21:805-812.
16. Cho JH, Koo JY, Kim KO, Lee SH, Jang BI, Kim TN. On-demand versus half-dose continuous therapy with esomeprazole for maintenance treatment of gastroesophageal reflux disease: a randomized comparative study. Medicine (Baltimore) 2018;97:e12732.
17. Hansen AN, Bergheim R, Fagertun H, Lund H, Wiklund I, Moum B. Long-term management of patients with symptoms of gastro-oesophageal reflux disease -- a Norwegian randomised prospective study comparing the effects of esomeprazole and ranitidine treatment strategies on health-related quality of life in a general practitioners setting. Int J Clin Pract 2006;60:15-22.
18. Janssen W, Meier E, Gatz G, Pfaffenberger B. Effects of pantoprazole 20 mg in mildgastroesophageal reflux disease: once-daily treatment in the acute phase, and comparison of on-demand versus continuous treatment in the long term. Curr Ther Res Clin Exp 2005;66:345-363.
19. Morgan DG, O’Mahony MF, O’Mahony WF, et al. Maintenance treatment of gastroesophageal reflux disease: an evaluation of continuous and on-demand therapy with rabeprazole 20 mg. Can J Gastroenterol 2007;21:820-826.
20. Nagahara A, Hojo M, Asaoka D, Sasaki H, Watanabe S. A random-ized prospective study comparing the efficacy of on-demand therapy versus continuous therapy for 6 months for long-term maintenance with omeprazole 20 mg in patients with gastroesophageal reflux disease in Ja-pan. Scand J Gastroenterol 2014;49:409-417.
21. Sjöstedt S, Befrits R, Sylvan A, et al. Daily treatment with esomeprazole is superior to that taken on-demand for maintenance of healed erosive

14
Seung Joo Kang, et al
Journal of Neurogastroenterology and Motility 14
oesophagitis. Aliment Pharmacol Ther 2005;22:183-191.22. Szucs T, Thalmann C, Michetti P, Beglinger C. Cost analysis of long-
term treatment of patients with symptomatic gastroesophageal reflux disease (GERD) with esomeprazole on-demand treatment or esomepra-zole continuous treatment: an open, randomized, multicenter study in Switzerland. Value Health 2009;12:273-281.
23. Tsai HH, Chapman R, Shepherd A, et al. Esomeprazole 20 mg on-de-mand is more acceptable to patients than continuous lansoprazole 15 mg in the long-term maintenance of endoscopy-negative gastro-oesophageal reflux patients: the COMMAND study. Aliment Pharmacol Ther 2004;20:657-665.
24. van der Velden AW, de Wit NJ, Quartero AO, Grobbee DE, Numans ME. Pharmacological dependency in chronic treatment of gastroesopha-geal reflux disease: a randomized controlled clinical trial. Digestion 2010;81:43-52.
25. Freedberg DE, Kim LS, Yang YX. The risks and benefits of long-term use of proton pump inhibitors: expert review and best practice advice from the American gastroenterological association. Gastroenterology 2017;152:706-715.
26. Seo GS, Jeon BJ, Chung JS, et al. The prevalence of erosive esophagitis is not significantly increased in a healthy Korean population - could it be explained?: a multi-center prospective study. J Neurogastroenterol Motil 2013;19:70-77.
27. Cao F, Chen CX, Wang M, et al. Updated meta-analysis of controlled observational studies: proton-pump inhibitors and risk of Clostridium difficile infection. J Hosp Infect 2018;98:4-13.
28. Moayyedi P, Eikelboom JW, Bosch J, et al. Safety of proton pump inhibi-tors based on a large, multi-year, randomized trial of patients receiving rivaroxaban or aspirin. Gastroenterology 2019;157:682-691, e2.
29. Hart E, Dunn TE, Feuerstein S, Jacobs DM. Proton pump inhibitors and risk of acute and chronic kidney disease: a retrospective cohort study. Pharmacotherapy 2019;39:443-453.
30. Nguyen PA, Islam M, Galvin CJ, et al. Meta-analysis of proton pump inhibitors induced risk of community-acquired pneumonia. Int J Qual Health Care 2020;32:292-299.
31. Brusselaers N, Lagergren J, Engstrand L. Duration of use of proton pump inhibitors and the risk of gastric and oesophageal cancer. Cancer Epidemiol 2019;62:101585.

15 2022 The Korean Society of Neurogastroenterology and Motility
J Neurogastroenterol Motil, Vol. 28 No. 1 January, 2022www.jnmjournal.org
JNMJ Neurogastroenterol Motil, Vol. 28 No. 1 January, 2022pISSN: 2093-0879 eISSN: 2093-0887https://doi.org/10.5056/jnm21122
Meta-analysisJournal of Neurogastroenterology and Motility
Received: June 10, 2021 Revised: September 1, 2021 Accepted: October 4, 2021 This is an Open Access article distributed under the terms of the Creative Commons Attribution Non-Commercial License (http://creativecommons. org/licenses/by-nc/4.0) which permits unrestricted non-commercial use, distribution, and reproduction in any medium, provided the original work is properly cited.
*Correspondence: Harshal S Mandavdhare, MD, DM Department of Gastroenterology, Postgraduate Institute of Medical Education and Research, F block, Nehru Hospital, PGIMER, Chandigarh 160012, India Tel: +91-9592814877, Fax: +91-9592814877, E-mail: [email protected]
Role of Peroral Endoscopic Myotomy in Advanced Achalasia Cardia With Sigmoid and/or Megaesophagus: A Systematic Review and Metanalysis
Harshal S Mandavdhare,1* Praveen Kumar M,2 Jayendra Shukla,1 Antriksh Kumar,1 and Vishal Sharma1
Departments of 1Gastroenterology and 2Pharmacology, Post Graduate Institute of Medical Education and Research, Chandigarh, India
Background/AimsSigmoid esophagus and/or megaesophagus are considered as an advanced stage in the natural history of achalasia cardia. The role of peroral endoscopic myotomy (POEM) in these subset of patients is emerging. We performed a systematic review and metanalysis to study the efficacy of POEM in advanced achalasia cardia with sigmoid and megaesophagus.
MethodsA literature search in PubMed and Embase was done from inception till August 3, 2021 to look for studies reporting exclusively on the role of POEM in advanced achalasia cardia with sigmoid and/or megaesophagus. The random effect method with inverse variance approach was used for the computation of pooled prevalence. For 2 groups’ analysis of continuous outcome standardized mean difference was used as the summary measure.
ResultsEleven studies with 428 patients were included for analysis. The pooled technical and clinical success was 98.27% (95% CI, 96.19-99.22; I2 = 0%) and 89.38% (95% CI, 84.49-92.86; I2 = 26%) and on subgroup analysis into sigmoid and megaesophagus it was (98.06% [95% CI, 95.41-99.19; I2 = 0%], 98.47% [95% CI, 92.72-99.69; I2 = 0%] and 87.92% [95% CI, 80.68-92.70; I2 = 37%], 88.36% [95% CI, 62.62-97.17; I2 = 77%]) respectively. The clinical success at < 1 year and 1-3 year follow-up was 89.37% (95% CI, 82.82-93.61; I2 = 0%) and 88.66% (95% CI, 81.65-91.22; I2 = 46%) respectively. There was a significant reduction in the post-POEM scores with standardized mean difference for Eckardt score (4.81), for integrated relaxation pressure at 4 seconds (1.93), and for lower esophageal sphincter pressure (2.06).
ConclusionsPOEM is an effective modality of treatment even in the subset of patients of advanced achalasia cardia with sigmoid and megae-sophagus.(J Neurogastroenterol Motil 2022;28:15-27)
Key WordsEsophageal achalasia; Follow-up studies; Myotomy
16
Harshal S Mandavdhare, et al
Journal of Neurogastroenterology and Motility 16
Introduction
With over a decade of experience and robust data showing ex-cellent safety and efficacy, peroral endoscopic myotomy (POEM) is now considered as the first line treatment for achalasia cardia.1 Around 10% of patients with prolonged duration of disease develop advanced achalasia cardia where there can be either excessive dilata-tion of the esophagus (megaesophagus with diameter > 6 cm) or the axis of the esophagus becomes tortuous taking shape of sigmoid (like sigmoid colon) or both.2,3 Traditionally, esophagectomy has been considered the treatment option for this patient cohort, how-ever, it is fraught with high morbidity and mortality.4 Due to the ex-treme tortuosity one would expect difficulty in performing POEM in this subset of patients. Over the years as more and more experi-ence has been gained with POEM for achalasia, we now have some data showing good efficacy even in this subset of advanced achalasia with sigmoid shape and megaesophagus.5 Hence, this systematic review and metanalysis was planned to study the efficacy and safety of POEM in the treatment of advanced achalasia cardia with sig-moid and/or megaesophagus.
Methodology for Systematic Review and Meta-analysis
The Preferred Reporting Items for Systematic Reviews and Meta-analysis (PRISMA) and Meta-analysis of Observational Studies in Epidemiology guidelines were followed for this system-atic review and meta-analysis.
We searched the literature for articles that reported exclusively on the role of peroral endoscopic myotomy in advanced achalasia cardia with sigmoid and/or megaesophagus on PUBMED and EMBASE. The search terms used for PUBMED were “advanced achalasia OR Sigmoid achalasia OR Sigmoid esophagus OR Megaesophagus) AND (Peroral myotomy OR Peroral endoscopic myotomy OR POEM)” while for EMBASE were (sigmoid esophagus OR Advanced achalasia OR sigmoid achalasia OR megaesophagus) AND Peroral endoscopic myotomy. The search was done from inception until August 3, 2021.
Two authors (H.S.M. and J.S.) independently searched for articles to be included for the analysis. After comparing the articles screened by both authors, the final list for full text reading was prepared. Any overlap or discrepancy about the data was discussed with and cleared by other co-authors (P.K.M. and V.S.).
We selected those studies published as full text/abstracts in
English language that included ≥ 5 cases reporting on the role of POEM in the treatment of advanced achalasia cardia with sigmoid and/or megaesophagus. We excluded those studies that included case reports with < 5 cases, review articles, letter to editor with-out original data, commentary, articles published in non-English language, and articles that did not exclusively report on the role of POEM in advanced achalasia cardia with sigmoid and/or mega-esophagus.
Outcome
The aim of this systematic review and meta-analysis is to assess the efficacy of POEM for advanced achalasia cardia with sigmoid and/or megaesophagus. The outcomes assessed were: technical success; clinical success; change in Eckardt score (ES), integrated relaxation pressure at 4 seconds (4s-IRP) and lower esophageal sphincter pressure (LESP) pre and post-POEM procedure.
The Outcome Definitions Used in the Study Are as Follows
(1) The technical success was defined as completion of all the steps of POEM including myotomy and (2) the clinical success was defined as a reduction in the ES ≤ 3 post-POEM. The ES is based on 4 symptoms each given score of 0 to 3 with maximum score of 12.6 The 4s-IRP and LESP are recorded from the stan-dard software of high-resolution manometry.7 In addition we also noted the adverse event rate and was defined as per the American Society of Gastrointestinal Endoscopy (ASGE) lexicon8 or In-ternational Per Oral Endoscopic Myotomy Survey Classification (IPOEMS)9 or Clinical practice guidelines for POEM and Japan Clinical Oncology Group post-operative complications (JCOG PC) criteria10,11 or noted as observational data. Apart from this, we looked for the following information: type of study (single/multi-centre), type of sigmoid esophagus (Type 1 and Type 2 as per the CT classification–where Type 1 has only single bend and a single lumen on axial cut of CT, while Type 2 is S shaped and 2 lumens can be seen on axial CT image;12 sigmoid and advanced sigmoid as per the descriptive rules of esophageal achalasia–where depending on the α angle [angle between 2 straight lines drawn along the long axis of the esophagus] it is defined a sigmoid when the α angle is < 135o and > 90o13 and advanced sigmoid when the α angle is < 90o and megaesophgus if diameter is > 6 cm14), type of achalasia cardia as per the Chicago classification version 3.0,7 duration of symptoms in months, average diameter of the esophagus, previous treatments
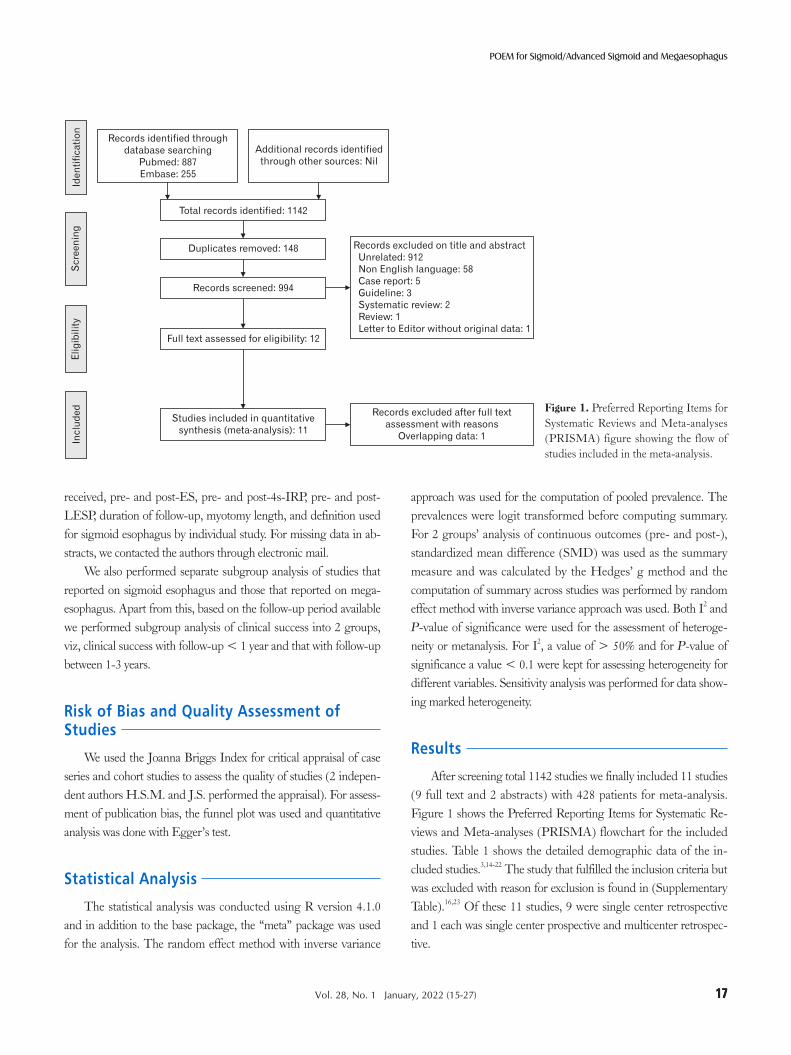
1717
POEM for Sigmoid/Advanced Sigmoid and Megaesophagus
Vol. 28, No. 1 January, 2022 (15-27)
received, pre- and post-ES, pre- and post-4s-IRP, pre- and post-LESP, duration of follow-up, myotomy length, and definition used for sigmoid esophagus by individual study. For missing data in ab-stracts, we contacted the authors through electronic mail.
We also performed separate subgroup analysis of studies that reported on sigmoid esophagus and those that reported on mega-esophagus. Apart from this, based on the follow-up period available we performed subgroup analysis of clinical success into 2 groups, viz, clinical success with follow-up < 1 year and that with follow-up between 1-3 years.
Risk of Bias and Quality Assessment of Studies
We used the Joanna Briggs Index for critical appraisal of case series and cohort studies to assess the quality of studies (2 indepen-dent authors H.S.M. and J.S. performed the appraisal). For assess-ment of publication bias, the funnel plot was used and quantitative analysis was done with Egger’s test.
Statistical Analysis
The statistical analysis was conducted using R version 4.1.0 and in addition to the base package, the “meta” package was used for the analysis. The random effect method with inverse variance
approach was used for the computation of pooled prevalence. The prevalences were logit transformed before computing summary. For 2 groups’ analysis of continuous outcomes (pre- and post-), standardized mean difference (SMD) was used as the summary measure and was calculated by the Hedges’ g method and the computation of summary across studies was performed by random effect method with inverse variance approach was used. Both I2 and P-value of significance were used for the assessment of heteroge-neity or metanalysis. For I2, a value of > 50% and for P-value of significance a value < 0.1 were kept for assessing heterogeneity for different variables. Sensitivity analysis was performed for data show-ing marked heterogeneity.
Results
After screening total 1142 studies we finally included 11 studies (9 full text and 2 abstracts) with 428 patients for meta-analysis. Figure 1 shows the Preferred Reporting Items for Systematic Re-views and Meta-analyses (PRISMA) flowchart for the included studies. Table 1 shows the detailed demographic data of the in-cluded studies.3,14-22 The study that fulfilled the inclusion criteria but was excluded with reason for exclusion is found in (Supplementary Table).16,23 Of these 11 studies, 9 were single center retrospective and 1 each was single center prospective and multicenter retrospec-tive.
Figure 1. Preferred Reporting Items for Systematic Reviews and Meta-analyses (PRISMA) figure showing the flow of studies included in the meta-analysis.
Inc
lud
ed
Eli
gib
ilit
yS
cre
en
ing
Ide
nti
fic
ati
on
Total records identified: 1142
Duplicates removed: 148
Records screened: 994
Full text assessed for eligibility: 12
Studies included in quantitative
synthesis (meta-analysis): 11
Records excluded on title and abstract
Unrelated: 912
Non English language: 58
Case report: 5
Guideline: 3
Systematic review: 2
Review: 1
Letter to Editor without original data: 1
Records identified through
database searching
Pubmed: 887
Embase: 255
Additional records identified
through other sources: Nil
Records excluded after full text
assessment with reasons
Overlapping data: 1

18
Harshal S Mandavdhare, et al
Journal of Neurogastroenterology and Motility 18
Tabl
e 1.
Det
aile
d D
emog
raph
ic C
hara
cter
istic
s of t
he I
nclu
ded
Stud
ies
Nam
e an
d ye
arTy
pe o
f stu
dy
Num
-be
r of
patie
nts
Type
of
sigm
oid
Type
of
AC
-I/I
I/II
I/
unid
enti-
fied
Dur
atio
n of
sym
p-to
ms
Eso
phag
eal
diam
eter
Prev
ious
tre
atm
enta
Pre/
Po
st-E
SPr
e/
Post-
4s-I
RP
Pre/
Po
st-L
ESP
Dur
atio
n of
fo
llow
-up
Clin
ical
su
cces
s
Tech
-ni
cal
succ
ess
Proc
edur
e tim
eM
yoto
my
leng
thb
Len
gth
of h
ospi
-ta
l sta
y
Orie
nta-
tion
of
myo
tom
y
Thi
ck-
ness
of
myo
tom
yAE
$D
efini
tion
of si
gmoid
/ad
vanc
ed A
C
Fujiy
oshi
et
al,19
202
0Si
ngle
cent
er re
t-ro
spec
tive
108
All
type
228
/8/1
/71
17.4
(7
.7-29
.0)
yr
48.1
±
17.5
mm
B
-49,
H-1
05.
0 ±
2.5
/ 1.1
± 1.
0
(2 m
o)
15.7
± 9
.9/
8.6
± 5
.519
.9 ±
13.
9/
14.6
± 7
.71
yrA
t 2 m
o:
82/9
2 (8
9.1)
, at
1 y
r:
43/4
9 (8
7.8)
107
95.9
±
32.1
min
E
-7 (5
-9),
G-3
(2-3
)4
(4-5
) da
y
NA
NA
6E
norm
ously
dila
ted
and
tortu
ous e
soph
-ag
us in
bar
ium
es
opha
gram
and
do
uble
eso
phag
eal
lum
en in
som
e C
T
slice
sU
eda
et
al,14
202
1Si
ngle
cent
er re
t-ro
spec
tive
11S1
-6, S
2-4,
ST
-110
/115
(2-4
1)
yr
B-4
6 (2
-10)
/ 2
(0-4
)23
(11-
34)/
9
(3
-21)
1 yr
7 (6
3.6)
1171
(39-
100)
9
(4-1
6)
NA
NA
2S1
, the
eso
phag
us
was
sign
ifica
ntly
di
late
d, to
rtuo
us
with
sing
le lu
men
on C
T; S
2, d
oubl
e lu
men
seen
on
CT
Sana
ka
et a
l,21 2
021
Sing
le ce
nter
ret-
rosp
ectiv
e
206/
10/0
/35.
0
(2.0,
13.0)
ye
ars
med
ian
IQR
4.5
(3.02
, 5.45
) B
O-6
, B-4
, H
-6, B
B-1
, C
R-5
7.0
(6
.0, 10
.0)/
0.0
(0
.0, 2
.0)
15.6
(1
0.5, 3
0.5)/
3.9
(1
.9, 1
0.3)
33.4
(8
.9, 5
3.3)
/ 14
.2
(10.
8, 1
6.5)
2 m
o17
(94.
4)20
89.5
(6
5.2, 1
03.7)
8.5
(8
.0, 9
.7)
1.0
(1
.0, 1
.0)
Ant
erio
r ex
cept
for
thos
e w
ith p
ost
LH
M
stat
us
Sele
ctiv
e ci
rcul
ar0
Sigm
oid
type
whe
n th
e an
gle
was
<
135°
and
adv
ance
d sig
moi
d w
hen
angl
e <
90
Qiu
et
al,22
202
1Si
ngle
cent
er re
t-ro
spec
tive
112
All
ad-
vanc
ed
AC
>
6 c
m
47/6
3/ 2
6.5
(3
.0, 13
.0)
yr
7.1
(6.4
, 8.3
) cm
B-2
0, B
O-7
, H
-4, S
-4,
P-4
8.0
(6
.0-9
.0)/
1.0
(0
.0-2
.0)
29.5
± 1
1.6/
14
.2 ±
11.
831
(21.0
, 47.0
) m
o
94/1
01
(93.
1)11
245
.5
(35.8
, 60.3
) m
in
7.0
(5
.0-8
.0)
cm
7.0
(7
.0-8
.0)
day
NA
Full th
ick-
ness
10A
dvan
ced
acha
lasia
de
fined
as m
ega-
esop
hagu
s with
m
ax d
iam
eter
≥ 6
cm
Liu
D
et a
l,5 202
1Si
ngle
cent
er re
t-ro
spec
tive
50M
egae
so-2
4, sig
-19,
sig
meg
a-7
NA
91 (6, 6
00)
B-8
, H-5
, B
H-1
7 (3
-11)
/ 1
(0-1
1)25
.3
(6-5
0)
mo
41 (82.
0)50
43 (16-
163)
m
in
8 (5
-14)
5.5 (3
-11)
NA
Full th
ick-
ness
9E
soph
agus
lum
en
with
a d
iam
eter
of
≥ 6
cm
and
/or
sigm
oid
in sh
ape
Tang
et
al,17
201
6Si
ngle
cent
er re
t-ro
spec
tive
11N
AN
A21
(18-
36)
mo
NA
NA
NA
NA
NA
23 (12.0
-37.5
) m
o
11 (100
.0)
1156
.8
(49-
70)
min
5.2
(5-6
) cm
NA
NA
NA
NA
NA
Yoon
HJ
et
al,15
202
0M
ult-i
-ce
nter
ret-
rosp
ectiv
e (2
cent
ers)
13Si
g-8,
A
Sig-
15N
A16
5.7
(228
)67
.6 ±
27.
5B
-57
(4-1
0)/
0.5
(0-2
)17
.5 ±
7.8
/ 8.
8 ±
8.2
NA
13 (100
.0)
13N
AN
A<
5 d
ayN
AN
A0
Ach
alas
ia w
as d
e-fin
ed a
s sig
moi
d ty
pe w
hen
the
angl
e w
as <
135
° and
ad
vanc
ed si
gmoi
d w
hen
angl
e <
90°
Nab
i et
al,16
202
1Si
ngle
cent
er re
t-ro
spec
tive
32Si
g-22
, A
Sig-
1021
/6/0
/511
1.25
±
41.7
5 (r
ange
48
-228
) m
o
B-1
3, H
-36.8
1 ± 1.
554/
0.97 ±
0.93
23.60
± 13
.42/
8.57
±5.
5834
.45 ±
13.24
/ 13
.99
± 5.
2534
.03
±
13.7
8 m
o27
(84.
0),
long
term
>
3 y
r:
8 (7
2.7)
3262
.69
±
32.7
1 m
in
9.78
± 3
.71
NA
NA
NA
2A
chal
asia
was
de-
fined
as s
igm
oid
type
whe
n th
e an
gle
was
< 1
35° a
nd
adva
nced
sigm
oid
whe
n an
gle
< 9
0°

1919
POEM for Sigmoid/Advanced Sigmoid and Megaesophagus
Vol. 28, No. 1 January, 2022 (15-27)
Tabl
e 1.
Con
tinue
d
Nam
e an
d ye
arTy
pe o
f stu
dy
Num
-be
r of
patie
nts
Type
of
sigm
oid
Type
of
AC
-I/I
I/II
I/
unid
enti-
fied
Dur
atio
n of
sym
p-to
ms
Eso
phag
eal
diam
eter
Prev
ious
tre
atm
enta
Pre/
Po
st-E
SPr
e/
Post-
4s-I
RP
Pre/
Po
st-L
ESP
Dur
atio
n of
fo
llow
-up
Clin
ical
su
cces
s
Tech
-ni
cal
succ
ess
Proc
edur
e tim
eM
yoto
my
leng
thb
Len
gth
of h
ospi
-ta
l sta
y
Orie
nta-
tion
of
myo
tom
y
Thi
ck-
ness
of
myo
tom
yAE
$D
efini
tion
of si
gmoid
/ad
vanc
ed A
C
Mar
uyam
a
et a
l,20 2
020
Sing
le ce
nter
ret-
rosp
ectiv
e
16Si
g-16
(A
Sig
-5)
4/3/
1N
AB
-54.
9 ±
2.1
/ 0.
4 ±
0.6
17.6
± 9
.2/
7.9
± 5
.519
.4 ±
10.
2/
9.2
± 6
.42
mo
16 (100
.0)
16SG
-94.
7 ±
31.
411
.7 ±
2.5
6.9
± 3
.4N
ASe
lect
ive
circ
ular
4A
chal
asia
was
de-
fined
as s
igm
oid
type
whe
n th
e an
gle
was
< 1
35° a
nd
adva
nced
sigm
oid
whe
n an
gle
< 9
0°L
v
et a
l,24 20
16Si
ngle
cent
er re
t-ro
spec
tive
23Ty
pe 1
-19,
Ty
pe 2
-43/
11/1
8 (2
-25)
yr
58.2
mm
B-6
, D-1
, B
O-1
, H
-1, S
-1
7 (4
-11)
/118
(12-
42)
mo
22 (95.
6)23
67.6
(4
5-12
0)
min
10 c
m5
(3-1
0)
day
Post
erio
rFu
ll thic
k-ne
ss
9S1
, the
eso
phag
us
was
sign
ifica
ntly
di
late
d, to
rtuo
us
with
sing
le lu
men
on C
T; S
2, d
oubl
e lu
men
seen
on
CT
Hu
et
al,18
201
5Si
ngle
cent
er
pros
pect
ive
32Ty
pe 1
-29,
Ty
pe 2
-3N
A13
.4 y
r (1
mo-
50 y
r)
B-1
4, B
O-3
, H
-3, S
-37.
8 (4
-12)
/ 1.
4 (0
-5)
37.9
(2
1.9-7
0.3)/
12.9
(7
.7-2
2.5)
30.0
(2
4-44
) m
ean
rang
e
30 (96.
8)32
63.7
(2
2-13
0)E
-8.0
(5
-11)
, G
-2.3
(2
-5),
T-10
.3
(7-1
4)
3.9
(1
-29)
Post
erio
rFu
ll thic
k-ne
ss
15S1
, the
eso
phag
us
was
sign
ifica
ntly
di
late
d, to
rtuo
us
with
sing
le lu
men
on C
T; S
2, d
oubl
e lu
men
seen
on
CT
a B, b
allo
on d
ilatio
n; H
, Hel
lers
; BO
, bot
ox; S
, sel
f exp
andi
ng m
etal
ste
nt; P
, per
oral
end
osco
pic
myo
tom
y; B
H, b
oth
dila
tatio
n an
d H
elle
rs; D
, dru
gs; B
B, b
otox
and
dila
tion;
CR
, con
trol
led
radi
al e
xpan
sion
and
dila
tatio
n by
Sav
ary
Gill
ard
dila
tor.
b E, e
soph
agus
; G, g
astr
ic; T
, tot
al.
AC
, ach
alas
ia c
ardi
a; E
S, E
ckar
dt s
core
; 4s-
IRP,
inte
grat
ed r
elax
atio
n pr
essu
re a
t 4 s
econ
ds; L
ESP
, low
er e
soph
agea
l sph
inct
er p
ress
ure;
NA
, not
ava
ilabl
e; A
E, a
dver
se e
vent
s; I
QR
, int
erqu
artil
e ra
nge;
SG
, Sa
vary
Gill
ard;
LH
M, l
apar
osco
pic
Hel
ler m
yoto
my.
Dat
a ar
e ex
pres
sed
as n
, n (%
), m
edia
n (r
ange
), m
ean
± S
D, o
r med
ian
(IQ
R 2
5th,
75t
h).

20
Harshal S Mandavdhare, et al
Journal of Neurogastroenterology and Motility 20
All the 11 studied reported on technical and clinical success of POEM for advanced achalasia cardia with sigmoid and/or megaesophagus. Eight studies reported on sigmoid esophagus, 2 studies on megaesophagus (Ueda et al14 and Qiu et al22 while 1 study by Liu et al5 reported on both sigmoid and megaesophagus. The pooled prevalence for technical success and clinical success was 98.27% (95% CI, 96.19-99.22; I2 = 0%) and 89.38% (95% CI, 84.49-92.86; I2 = 26%) respectively (Fig. 2 and 3). On subgroup analysis the pooled prevalence for technical success and clinical success for sigmoid and megaesophagus was 98.06% (95% CI, 95.41-99.19; I2 = 0%), 98.47% (95% CI, 92.72-99.69; I2 = 0%)
and 87.92% (95% CI, 80.68-92.70; I2 = 37%), 88.36% (95% CI, 62.62-97.17; I2 = 77%), respectively (Fig. 2 and 3). On further subgroup analysis, the pooled prevalence for clinical success for studies with follow-up < 1 year (4 studies) was 89.37% (95% CI, 82.82-93.61; I2 = 0%) and for those with follow-up between 1-3 years (7 studies) was 88.66% (95% CI, 81.65-91.22; I2 = 46%) re-spectively (Fig. 2 and 3). Only 1 study by Nabi et al16 had a follow-up of > 3 years with a clinical success of 72.7% (8/11). Three studies mentioned modified technique of POEM for advanced achalasia cardia, viz, (1) Lv et al24- described creation of a wider tunnel reaching up to half the esophageal circumference and start-
Hu W J et al 2014
Tang X et al 2015
Lv L et al 2015
Maruyama S et al 2019
Sanaka M et al 2020
Qiu S et al 2020
Liu D et al 2020
Yoon HJ et al 2020
Nabi Z et al 2020
Fujiyoshi Y et al 2021
Ueda C et al 2021
Heterogeneity: Tau = 0; Chi = 2.78, df = 10 ( = 0.99); I = 0%
Total (95% CI)2 2 2P
Study
31
11
23
16
20
112
50
13
32
107
11
Events Total Weight
100.00 [89.11; 100.00]
100.00 [71.51; 100.00]
100.00 [85.18; 100.00]
100.00 [79.41; 100.00]
100.00 [83.16; 100.00]
100.00 [96.76; 100.00]
100.00 [92.89; 100.00]
100.00 [75.29; 100.00]
100.00 [89.11; 100.00]
99.07 [94.95; 99.98]
100.00 [71.51; 100.00]
98.27 [96.19; 99.22]
IV, random, 95% CI
Events per 100 observations
32
11
23
16
20
112
50
13
32
108
11
428
8.4%
8.2%
8.3%
8.3%
8.3%
8.5%
8.4%
8.2%
8.4%
16.9%
8.2%
100.0%
IV, random, 95% CI
Events per 100 observations
10075 80 85 90 95
Technical success - Overall
byvar = Sigmoid
Total (95% CI)
byvar = Megaesophagus
Total (95% CI)
Heterogeneity: Tau = 0; Chi = 1.22, df = 8 ( = 1.00); I = 0%
Heterogeneity: Tau = 0; Chi = 1.32, df = 2 ( = 0.52); I = 0%
2 2 2
2 2 2
P
P
Hu W J et al 2014
Tang X et al 2015
Lv L et al 2015
Maruyama S et al 2019
Sanaka M et al 2020
Yoon HJ et al 2020
Nabi Z et al 2020
Liu D et al 2020
Fujiyoshi Y et al 2021
Qiu S et al 2020
Liu D et al 2020
Ueda C et al 2021
Heterogeneity: Tau = 0; Chi = 2.61, df = 11 ( = 0.99); I = 0%
Total (95% CI)2 2 2P
Study or subgroup Events Total Weight IV, random, 95% CI
Events per 100 observations
IV, random, 95% CI
Events per 100 observations
10075 80 85 90 95
Technical success - Sigmoid vs Megaesophagus
32
11
23
16
20
13
32
26
107
112
24
11
32
11
23
16
20
13
32
26
108
112
24
11
428
281
147
7.7%
7.5%
7.7%
7.6%
7.7%
7.6%
7.7%
7.7%
15.6%
7.8%
7.7%
7.5%
100.0%
76.9%
23.1%
100.00 [89.11; 100.00]
100.00 [71.51; 100.00]
100.00 [85.18; 100.00]
100.00 [79.41; 100.00]
100.00 [83.16; 100.00]
100.00 [75.29; 100.00]
100.00 [89.11; 100.00]
100.00 [86.77; 100.00]
99.07 [94.95; 99.98]
98.06 [95.41; 99.19]
100.00 [96.76; 100.00]
100.00 [85.75; 100.00]
100.00 [71.51; 100.00]
98.47 [92.72; 99.69]
98.16 [96.08; 99.15]
Figure 2. Technical success. The pooled prevalence of technical success for peroral endoscopic myotomy in advanced achalasia cardia (overall) with subgroup analysis and pooled prevalence for sigmoid and megaesophagus.

2121
POEM for Sigmoid/Advanced Sigmoid and Megaesophagus
Vol. 28, No. 1 January, 2022 (15-27)
ing myotomy 0-1 cm from the incision to shorten the tunnel; (2) Qiu et al22 described a reverse T incision for entry, a “short tunnel POEM”25 with a tunnel of 6-8 cm and a myotomy of 3-6 cm and simultaneous submucosal and muscle dissection in case of submu-cosal fibrosis;26 (3) Liu et al27 described modified POEM with tunnelling and myotomy into a single step.
For assessing the efficacy of the procedure, 10 studies (exclud-ing the study by Tang et al17) had pre- and post- values of ES for comparison. Seven studies had pre- and post-values of 4s-IRP and LESP for comparison. The SMD for ES, 4s-IRP, and LESP, when compared pre- and post-POEM were 4.81 ([95% CI, 3.09-
6.62; I2 = 97%] and for megaesophagus 5.8 [95% CI, −0.65-12.24; I2 = 99%]), for 4s-IRP of 1.93 (95% CI, 1.09-2.76; I2 = 83%) and for lower esophageal sphincter pressure of 2.06 (95% CI, 1.13-2.99; I2 = 88%), and all were significant (Fig. 4). For the clinical success parameter which is our main outcome parameter, there is no heterogeneity seen as assessed by I2 value of < 50%. But for the continuous outcome (ES, IRP, and LESP) compared pre- and post-, heterogeneity (I2 value of > 50%) is seen. We con-ducted sensitivity analyses on these analyses, to detect the source of heterogeneity. For the ES, the Qiu et al22 2021 study was the study with the maximum contribution to heterogeneity, and excluding the
Hu W J et al 2014
Tang X et al 2015
Lv L et al 2015
Maruyama S et al 2019
Sanaka M et al 2020
Qiu S et al 2020
Liu D et al 2020
Yoon HJ et al 2020
Nabi Z et al 2020
Fujiyoshi Y et al 2021
Ueda C et al 2021
Heterogeneity: Tau = 0.1261; Chi = 13.43, df = 10 ( = 0.20); I = 26%
Total (95% CI)2 2 2P
Study
30
11
22
16
17
94
41
13
27
82
7
Events Total Weight
96.77 [83.30; 99.92]
100.00 [71.51; 100.00]
95.65 [78.05; 99.89]
100.00 [79.41; 100.00]
85.00 [62.11; 96.79]
93.07 [86.24; 97.17]
89.13 [76.43; 96.38]
100.00 [75.29; 100.00]
84.38 [67.21; 94.72]
89.13 [80.92; 94.66]
63.64 [30.79; 89.07]
89.38 [84.49; 92.86]
IV, random, 95% CI
Events per 100 observations
31
11
23
16
20
101
46
13
32
92
11
396
4.2%
2.2%
4.2%
2.3%
9.5%
17.6%
14.0%
2.2%
13.6%
20.7%
9.5%
100.0%
IV, random, 95% CI
Events per 100 observationsClinical success - Overall
byvar = Sigmoid
Total (95% CI)
byvar = Megaesophagus
Total (95% CI)
Heterogeneity: Tau = 0; Chi = 6.93, df = 8 ( = 0.54); I = 0%
Heterogeneity: Tau = 1.3223; Chi = 8.67, df = 2 ( = 0.01); I = 77%
2 2 2
2 2 2
P
P
Hu W J et al 2014
Tang X et al 2015
Lv L et al 2015
Maruyama S et al 2019
Sanaka M et al 2020
Yoon HJ et al 2020
Nabi Z et al 2020
Liu D et al 2020
Fujiyoshi Y et al 2021
Qiu S et al 2020
Liu D et al 2020
Ueda C et al 2021
Heterogeneity: Tau = 0.1702; Chi = 15.63, df = 11 ( = 0.16); I = 30%
Total (95% CI)2 2 2P
Study or subgroup Events Total Weight IV, random, 95% CI
Events per 100 observations
IV, random, 95% CI
Events per 100 observationsClinical success - Sigmoid vs Megaesophagus
30
11
22
16
17
13
27
18
82
94
23
7
31
11
23
16
20
13
32
22
92
101
21
11
396
260
136
4.5%
2.4%
4.4%
2.4%
9.6%
2.4%
13.2%
11.3%
19.1%
16.6%
4.4%
9.6%
100.0%
69.3%
30.7%
96.77 [83.30; 99.92]
100.00 [71.51; 100.00]
95.65 [78.05; 99.89]
100.00 [79.41; 100.00]
85.00 [62.11; 96.79]
100.00 [75.29; 100.00]
84.38 [67.21; 94.72]
81.82 [59.72; 94.81]
89.13 [80.92; 94.66]
88.81 [83.98; 92.32]
93.07 [86.24; 97.17]
95.83 [78.88; 99.89]
63.64 [30.79; 89.07]
88.36 [62.62; 97.17]
89.23 [84.01; 92.89]
10040 50 60 70 80 90
10040 50 60 70 80 90
Figure 3. Clinical success. The pooled prevalence of clinical success for peroral endoscopic myotomy in advanced achalasia cardia (overall) with subgroup analysis and prevalence for sigmoid and megaesophagus and further subgroup analysis for follow-up < 1 year and between 1-3 years.

22
Harshal S Mandavdhare, et al
Journal of Neurogastroenterology and Motility 22
study changed the pooled effect size to 3.54 (2.62-4.46) with I2 = 90%. (Supplementary Fig. 1). For the 4s-IRP, the Lv et al24 2016 was the study with maximum contribution to heterogeneity, and excluding the study changed the heterogeneity to 7% with pooled effect size of 1.22 (0.89-1.54) (Supplementary Fig. 2). For the LESP, Lv et al24 2016 was the study with maximum contribution to heterogeneity, and excluding the study changed the heterogeneity to 80% with pooled effect size of 1.53 (0.83-2.24) (Supplementary Fig. 3).
Out of the 11 studies, 2 studies mentioned adverse events as per the ASGE lexicon (Qiu et al22 and Lv et al24) while 2 studies used other criteria (Ueda et al14 [IPOEMS] and Maruyama et al20 [Clinical practice guidelines for POEM and JCOG PC] criteria). Five studies mentioned the adverse events as observations without using any criteria (Nabi et al,16 Hu et al,18 Fujiyoshi et al,19 Sanaka et al,21 and Lv et al24). Two studies (Yoon et al15 and Tang et al17) did not mention adverse events in their results. We conducted analysis for adverse events, however, there was marked heterogeneity among the studies, hence, it was decided to exclude adverse event rate from analysis and to only mention the details of adverse events from indi-vidual studies in Tables 1 and 2 (Table 1 provides the adverse event rate of individual studies while Table 2 discusses in details the vari-ous adverse events that were encountered in each study). The ad-verse event rate was found between 0.0-46.8%. Of particular men-tion are the 2 studies by Hu et al18 and Lv et al24 which reported
very high rates of adverse events (Table 1). However, they included expected inconsequential intraoperative events like subcutaneous emphysema and capnoperitoneum/capnothorax as adverse event which lead to false impression of high adverse event rate.
Quality Assessment (See Table 3)
Nine of the 11 studies fulfilled all the criteria of the Joanna Briggs critical appraisal tool for case series and cohort stud-ies.5,14-16,18,20-22,24 Two of the abstracts that were included were un-clear regarding the statistical methods used for analysis17,19 while 1 abstract was unclear regarding demographics of the participants and did not report the outcomes and follow-up results clearly.5 The funnel plot for publication bias assessed for prevalence for clinical success showed no bias. Also, on quantitative analysis, Egger’s test performed on the clinical success data does not indicate the pres-ence of funnel plot asymmetry (intercept 0.835 [95% CI, –0.69 to –2.36; P = 0.311]) (Fig. 5).
Discussion
The present metanalysis shows that POEM is an effective modality of treatment for both groups of sigmoid and megaesopha-gus in advanced achalasia cardia with a pooled technical success of 98.27% and clinical success of 89.38%. The clinical success was
byvar = FU <1 yr
Total (95% CI)
byvar = FU 1-3 yr
Total (95% CI)
Heterogeneity: Tau = 0; Chi = 1.97, df = 3 ( = 0.58); I = 0%
Heterogeneity: Tau = 0.2472; Chi = 11.01, df = 6 ( = 0.09); I = 46%
2 2 2
2 2 2
P
P
Maruyama S et al 2019
Sanaka M et al 2020
Yoon HJ et al 2020
Fujiyoshi Y et al 2021
Hu W J et al 2014
Lv L et al 2015
Qiu S et al 2020
Liu D et al 2020
Nabi Z et al 2020
Fujiyoshi Y et al 2021
Ueda C et al 2021
Heterogeneity: Tau = 0.0943; Chi = 13.01, df = 10 ( = 0.22); I = 23%
Total (95% CI)2 2 2P
Study or subgroup Events Total Weight IV, random, 95% CI
Events per 100 observations
IV, random, 95% CI
Events per 100 observationsClinical success - Follow up: 1 year vs 1-3 years
16
17
13
82
30
22
94
41
27
43
7
16
20
13
92
31
23
101
46
32
49
11
434
141
293
1.8%
8.1%
1.8%
19.1%
3.5%
3.5%
15.9%
12.4%
11.9%
13.9%
100.0%
30.9%
8.1%
69.1%
100.00 [79.41; 100.00]
85.00 [62.11; 96.79]
100.00 [75.29; 100.00]
89.13 [80.92; 94.66]
89.37 [82.82; 93.61]
96.77 [83.30; 99.92]
95.65 [78.05; 99.89]
93.07 [86.24; 97.17]
89.13 [76.43; 96.38]
84.38 [67.21; 94.72]
87.76 [75.23; 95.37]
63.64 [30.79; 89.07]
88.66 [81.65; 93.22]
88.95 [84.51; 92.24]
10040 50 60 70 80 90
Figure 3. Continued.

2323
POEM for Sigmoid/Advanced Sigmoid and Megaesophagus
Vol. 28, No. 1 January, 2022 (15-27)
comparable between both the sigmoid (87.92%) and the mega-esophagus (88.36%) groups with sustained rate until 3 years of follow-up (88.66%). The post-POEM scores showed a significant reduction with SMD for ES of 4.81, for 4s-IRP of 1.93, and for
LESP of 2.06 respectively. Thus, not only subjective scores (ES) but also objective scores (4s-IRP and LESP) have shown signifi-cant improvement post-POEM in advanced achalasia cardia with sigmoid and/or megaesophagus.
Hu W J et al 2014
Lv L et al 2015
Maruyama S et al 2019
Sanaka M et al 2020
Qiu S et al 2020
Liu D et al 2020
Yoon HJ et al 2020
Nabi Z et al 2020
Fujiyoshi Y et al 2021
Ueda C et al 2021
Heterogeneity: Tau = 6.5325; Chi = 312.61, df = 8 ( < 0.01); I = 97%
Total (95% CI)2 2 2P
Study
Std. mean difference
IV, random, 95% CIWeightPre-ES Post-ES
7.84
7.13
4.90
7.29
7.95
7.00
7.00
6.81
5.00
6.00
Mean Total
1.9300
1.8100
2.1000
1.0700
0.5900
1.7800
1.7900
1.5500
2.5000
2.5100
31
23
16
20
101
46
13
32
92
11
385
SD
11.04%
0.0%
11.2%
10.1%
10.9%
11.6%
10.7%
11.3%
11.6%
11.2%
100.0%
15 10 5 150 5 10
Std. mean difference
IV, random, 95% CI
1.65
1.00
0.40
0.30
1.00
1.79
0.70
0.97
1.10
2.00
Mean Total
1.2090
0.0000
0.6000
0.5300
0.3900
2.4500
0.6270
0.9300
1.0000
1.2550
31
23
16
20
101
46
13
32
92
11
385
SD
3.80 [2.94; 4.65]
2.84 [1.82; 3.86]
8.12 [6.14; 10.09]
13.85 [12.45; 15.24]
2.41 [1.87; 2.96]
4.55 [3.00; 6.10]
4.51 [3.57; 5.46]
2.04 [1.68; 2.40]
1.94 [0.89; 2.99]
4.81 [3.09; 6.52]
Pre- vs Post-ES
Qiu S et al 2020
Liu D et al 2020
Ueda C et al 2021
Heterogeneity: Tau = 32.1440; Chi = 249.31, df = 2 ( < 0.01); I = 99%
Total (95% CI)2 2 2P
Study
Std. mean difference
IV, random, 95% CIWeightPre-ES (ME) Post-ES (ME)
7.95
7.00
6.00
Mean Total
0.5900
2.3200
2.5100
101
24
11
136
SD
33.1%
33.5%
33.3%
100.0%
15 10 5 150 5 10
Std. mean difference
IV, random, 95% CI
1.00
2.75
2.00
Mean Total
0.3900
2.6200
1.2600
SD
13.85 [12.45; 15.24]
1.69 [1.02; 2.36]
1.94 [0.89; 2.99]
5.80 [ 0.65; 12.24]5.80 [ 0.65; 12.24]
Pre- vs Post-ES - Megasophagus
101
24
11
136
Hu W J et al 2014
Lv L et al 2015
Maruyama S et al 2019
Sanaka M et al 2020
Qiu S et al 2020
Nabi Z et al 2020
Fujiyoshi Y et al 2021
Heterogeneity: Tau = 1.2720; Chi = 52.01, df = 6 ( < 0.01); I = 88%
Total (95% CI)2 2 2P
Study
Std. mean difference
IV, random, 95% CIWeightPre-LESP
39.77
34.78
19.40
32.72
29.50
34.45
19.90
11.7000
4.5100
10.2000
11.8800
11.6000
13.2400
13.9000
14
15
16
4
21
32
32
134
Mean TotalSD
14.1%
10.5%
15.8%
10.1%
16.2%
16.4%
16.8%
100.0%
5 0 5
Std. mean difference
IV, random, 95% CI
2.96 [1.84; 4.08]
6.18 [4.35; 8.00]
1.17 [0.41; 1.93]
1.92 [0.00; 3.83]
1.28 [0.61; 1.95]
2.01 [1.40; 2.61]
0.47 [ 0.03; 0.96]
2.06 [1.13; 2.99]
Pre- vs Post-LESPPost-LESP
13.40
11.50
9.20
14.04
14.20
13.99
14.60
3.5800
2.5600
6.4000
1.5250
11.8000
5.2500
7.7000
Mean TotalSD
14
15
16
4
21
32
32
134
Lv L et al 2015
Maruyama S et al 2019
Sanaka M et al 2020
Yoon HJ et al 2020
Nabi Z et al 2020
Fujiyoshi Y et al 2021
Ueda C et al 2021
Heterogeneity: Tau = 0.9015; Chi = 34.48, df = 6 ( < 0.01); I = 83%
Total (95% CI)2 2 2P
Study
Std. mean difference
IV, random, 95% CIWeightPre-IRP-4
29.52
17.60
17.05
17.50
23.60
15.70
22.80
3.6700
9.2000
5.3500
7.8000
13.4200
9.9000
7.2180
15
16
4
13
32
32
5
117
Mean TotalSD
9.8%
17.3%
8.1%
16.9%
18.6%
18.8%
10.5%
100.0%
5 0 5
Std. mean difference
IV, random, 95% CI
6.54 [4.62; 8.45]
1.25 [0.48; 2.01]
2.65 [0.36; 4.94]
1.05 [0.22; 1.88]
1.44 [0.89; 2.00]
0.88 [0.36; 1.39]
2.30 [0.51; 4.10]
1.93 [1.09; 2.76]
Pre- vs Post-IRP-4Post-IRP-4
10.61
7.90
4.55
8.80
8.57
8.60
8.60
1.5400
5.5000
2.2480
8.2000
5.5800
5.5000
3.1380
Mean TotalSD
15
16
4
13
32
32
5
117
Figure 4. Standardized mean difference of pre and post-peroral endoscopic myotomy-Eckardt score (ES), 4-second integrated relaxation pressure (4s-IRP) and lower esophageal sphincter pressure (LESP) are shown.
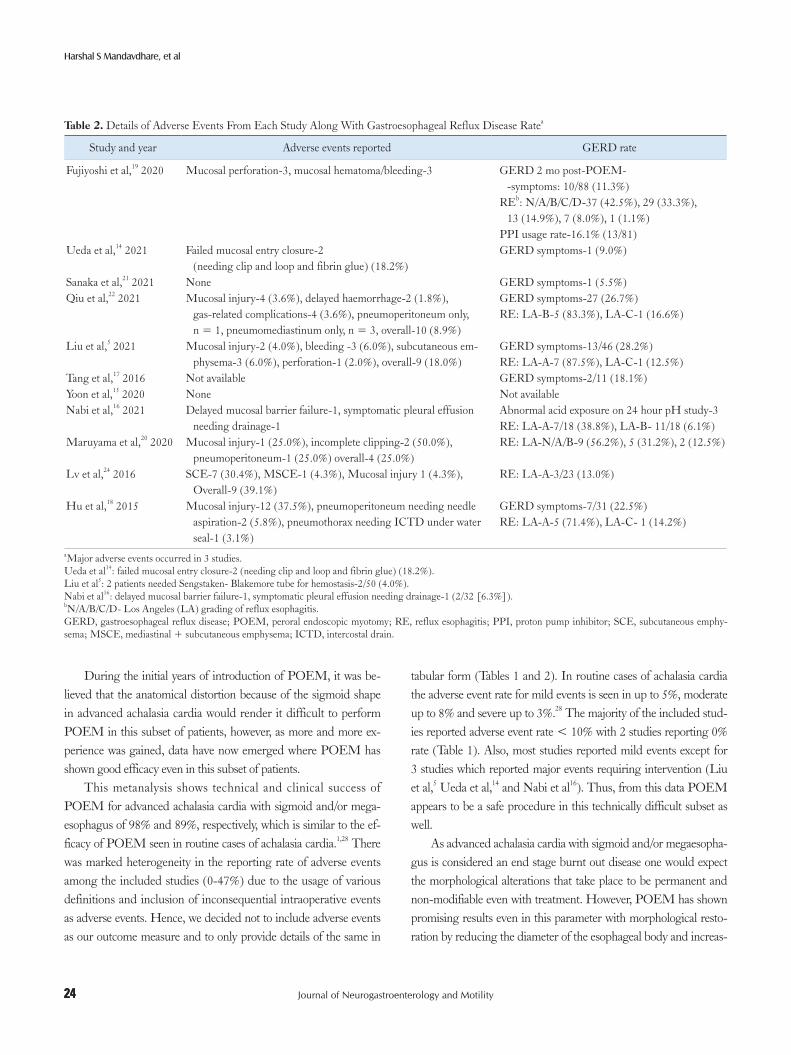
24
Harshal S Mandavdhare, et al
Journal of Neurogastroenterology and Motility 24
During the initial years of introduction of POEM, it was be-lieved that the anatomical distortion because of the sigmoid shape in advanced achalasia cardia would render it difficult to perform POEM in this subset of patients, however, as more and more ex-perience was gained, data have now emerged where POEM has shown good efficacy even in this subset of patients.
This metanalysis shows technical and clinical success of POEM for advanced achalasia cardia with sigmoid and/or mega-esophagus of 98% and 89%, respectively, which is similar to the ef-ficacy of POEM seen in routine cases of achalasia cardia.1,28 There was marked heterogeneity in the reporting rate of adverse events among the included studies (0-47%) due to the usage of various definitions and inclusion of inconsequential intraoperative events as adverse events. Hence, we decided not to include adverse events as our outcome measure and to only provide details of the same in
tabular form (Tables 1 and 2). In routine cases of achalasia cardia the adverse event rate for mild events is seen in up to 5%, moderate up to 8% and severe up to 3%.28 The majority of the included stud-ies reported adverse event rate < 10% with 2 studies reporting 0% rate (Table 1). Also, most studies reported mild events except for 3 studies which reported major events requiring intervention (Liu et al,5 Ueda et al,14 and Nabi et al16). Thus, from this data POEM appears to be a safe procedure in this technically difficult subset as well.
As advanced achalasia cardia with sigmoid and/or megaesopha-gus is considered an end stage burnt out disease one would expect the morphological alterations that take place to be permanent and non-modifiable even with treatment. However, POEM has shown promising results even in this parameter with morphological resto-ration by reducing the diameter of the esophageal body and increas-
Table 2. Details of Adverse Events From Each Study Along With Gastroesophageal Reflux Disease Ratea
Study and year Adverse events reported GERD rate
Fujiyoshi et al,19 2020 Mucosal perforation-3, mucosal hematoma/bleeding-3 GERD 2 mo post-POEM- -symptoms: 10/88 (11.3%)
REb: N/A/B/C/D-37 (42.5%), 29 (33.3%), 13 (14.9%), 7 (8.0%), 1 (1.1%)
PPI usage rate-16.1% (13/81)Ueda et al,14 2021 Failed mucosal entry closure-2
(needing clip and loop and fibrin glue) (18.2%)GERD symptoms-1 (9.0%)
Sanaka et al,21 2021 None GERD symptoms-1 (5.5%)Qiu et al,22 2021 Mucosal injury-4 (3.6%), delayed haemorrhage-2 (1.8%),
gas-related complications-4 (3.6%), pneumoperitoneum only, n = 1, pneumomediastinum only, n = 3, overall-10 (8.9%)
GERD symptoms-27 (26.7%)RE: LA-B-5 (83.3%), LA-C-1 (16.6%)
Liu et al,5 2021 Mucosal injury-2 (4.0%), bleeding -3 (6.0%), subcutaneous em-physema-3 (6.0%), perforation-1 (2.0%), overall-9 (18.0%)
GERD symptoms-13/46 (28.2%)RE: LA-A-7 (87.5%), LA-C-1 (12.5%)
Tang et al,17 2016 Not available GERD symptoms-2/11 (18.1%)Yoon et al,15 2020 None Not availableNabi et al,16 2021 Delayed mucosal barrier failure-1, symptomatic pleural effusion
needing drainage-1Abnormal acid exposure on 24 hour pH study-3RE: LA-A-7/18 (38.8%), LA-B- 11/18 (6.1%)
Maruyama et al,20 2020 Mucosal injury-1 (25.0%), incomplete clipping-2 (50.0%), pneumoperitoneum-1 (25.0%) overall-4 (25.0%)
RE: LA-N/A/B-9 (56.2%), 5 (31.2%), 2 (12.5%)
Lv et al,24 2016 SCE-7 (30.4%), MSCE-1 (4.3%), Mucosal injury 1 (4.3%), Overall-9 (39.1%)
RE: LA-A-3/23 (13.0%)
Hu et al,18 2015 Mucosal injury-12 (37.5%), pneumoperitoneum needing needle aspiration-2 (5.8%), pneumothorax needing ICTD under water seal-1 (3.1%)
GERD symptoms-7/31 (22.5%)RE: LA-A-5 (71.4%), LA-C- 1 (14.2%)
aMajor adverse events occurred in 3 studies.Ueda et al14: failed mucosal entry closure-2 (needing clip and loop and fibrin glue) (18.2%).Liu et al5: 2 patients needed Sengstaken- Blakemore tube for hemostasis-2/50 (4.0%).Nabi et al16: delayed mucosal barrier failure-1, symptomatic pleural effusion needing drainage-1 (2/32 [6.3%]).bN/A/B/C/D- Los Angeles (LA) grading of reflux esophagitis.GERD, gastroesophageal reflux disease; POEM, peroral endoscopic myotomy; RE, reflux esophagitis; PPI, proton pump inhibitor; SCE, subcutaneous emphy-sema; MSCE, mediastinal + subcutaneous emphysema; ICTD, intercostal drain.

2525
POEM for Sigmoid/Advanced Sigmoid and Megaesophagus
Vol. 28, No. 1 January, 2022 (15-27)
Tabl
e 3.
Qua
lity
Ass
essm
ent o
f Inc
lude
d St
udie
s by
Joan
na B
riggs
Crit
ical
App
raisa
l Too
lA
. Joa
nna
Brig
gs I
ndex
for C
ritic
al A
ppra
isal o
f Cas
e Se
ries
Crit
eria
H
u et
al,18
2015
Tang
X e
t al,20
2015
Lv
et a
l,24
2016
Qiu
et a
l,22
2021
Liu
et a
l,5
2021
Yoon
et a
l,15
2020
Nab
i et a
l,16
2021
Fujiy
oshi
et al
,19
2020
Wer
e th
ere
clea
r crit
eria
for i
nclu
sion
in th
e ca
se se
ries?
Yes
Yes
Yes
Yes
Yes
Yes
Yes
Yes
Was
the
cond
ition
mea
sure
d in
a st
anda
rd, r
elia
ble
way
fo
r all
part
icip
ants
incl
uded
in th
e ca
se se
ries?
Yes
Yes
Yes
Yes
Yes
Yes
Yes
Yes
Wer
e va
lid m
etho
ds u
sed
for i
dent
ifica
tion
of th
e co
ndi-
tion
for a
ll pa
rtic
ipan
ts in
clud
ed in
the
case
serie
s?Ye
sYe
sYe
sYe
sYe
sYe
sYe
sYe
s
Did
the
case
serie
s hav
e co
nsec
utiv
e in
clus
ion
of
part
icip
ants
?Ye
sYe
sYe
sYe
sYe
sYe
sYe
sYe
s
Did
the
case
serie
s hav
e co
mpl
ete
incl
usio
n of
par
ticip
ants
?Ye
sYe
sYe
sYe
sYe
sYe
sYe
sYe
sW
as th
ere
clea
r rep
ortin
g of
the
dem
ogra
phic
s of
the
part
icip
ants
in th
e st
udy?
Yes
Unc
lear
Yes
Yes
Yes
Yes
Yes
Yes
Was
ther
e cl
ear r
epor
ting
of c
linic
al in
form
atio
n of
th
e pa
rtic
ipan
ts?
Yes
Yes
Yes
Yes
Yes
Yes
Yes
Yes
Wer
e th
e ou
tcom
es o
r fol
low
-up
resu
lts o
f cas
es c
lear
ly
repo
rted
?Ye
sN
oYe
sYe
sYe
sYe
sYe
sYe
s
Was
ther
e cl
ear r
epor
ting
of th
e pr
esen
ting
site(
s)/
clin
ic(s
) dem
ogra
phic
info
rmat
ion?
Yes
Yes
Yes
Yes
Yes
Yes
Yes
Yes
Was
stat
istic
al a
naly
sis a
ppro
pria
te?
Yes
Unc
lear
Ye
sYe
sYe
sYe
sYe
sU
ncle
ar
B. J
oann
a B
riggs
Ind
ex fo
r Crit
ical
App
raisa
l of C
ohor
t Stu
dies
Crit
eria
Mar
uyam
a et
al20
Sana
ka e
t al21
Ued
a et
al14
Wer
e th
e 2
grou
ps si
mila
r and
recr
uite
d fr
om th
e sa
me
popu
latio
n?Ye
sYe
sYe
sW
ere
the
expo
sure
s mea
sure
d sim
ilarly
to a
ssig
n pe
ople
to b
oth
expo
sed
and
unex
pose
d gr
oups
?Ye
sYe
sYe
sW
as th
e ex
posu
re m
easu
red
in a
val
id a
nd re
liabl
e w
ay?
Yes
Yes
Yes
Wer
e co
nfou
ndin
g fa
ctor
s ide
ntifi
ed?
Yes
Yes
Yes
Wer
e st
rate
gies
to d
eal w
ith c
onfo
undi
ng fa
ctor
s sta
ted?
Yes
Yes
Yes
Wer
e th
e gr
oups
/par
ticip
ants
free
of t
he o
utco
me
at th
e st
art o
f the
stud
y (o
r at t
he m
omen
t of e
xpos
ure)
?Ye
sYe
sYe
sW
ere
the
outc
omes
mea
sure
d in
a v
alid
and
relia
ble
way
?Ye
sYe
sYe
sW
as th
e fo
llow
-up
time
repo
rted
and
suffi
cien
t to
be lo
ng e
noug
h fo
r out
com
es to
occ
ur?
Yes
Yes
Yes
Was
follo
w-u
p co
mpl
ete,
and
if n
ot, w
ere
the
reas
ons t
o lo
ss to
follo
w-u
p de
scrib
ed a
nd e
xplo
red?
Yes
Yes
Yes
Wer
e st
rate
gies
to a
ddre
ss in
com
plet
e fo
llow
-up
utili
zed?
Yes
Yes
Yes
Was
app
ropr
iate
stat
istic
al a
naly
sis u
sed?
Yes
Yes
Yes

26
Harshal S Mandavdhare, et al
Journal of Neurogastroenterology and Motility 26
ing the diameter of esophagogastric junction opening, and also wid-ening the angulations from acute to more obtuse angles as shown in 3 of the included studies.14,15,20 However, the study by Nabi et al16 involving 32 patients has shown that there is deterioration of both symptom score (ES) and free flow of barium at > 1 year of follow-up, suggesting the need of close watch in this subset of patients.
The strengths of this metanalysis are good number of studies (n = 11) and sample (n = 428) given the uncommon presentation of this subset. Also, the main outcomes, viz, clinical and techni-cal success did not show any heterogeneity. We also conducted subgroup analysis for sigmoid and megaesophagus along with the analysis of the clinical success with follow-up < 1 year and between 1-3 years, thereby reducing the heterogeneity. We also performed sensitivity analysis for data showing marked heterogeneity. The lim-itations of the metanalysis are retrospective study design of majority of the included studies with the associated confounding factors. The parameters (both subjective and objective) to assess the clinical ef-ficacy post-POEM showed significant heterogeneity. The possible reasons could be variation in the study design, outcome parameter measurement as well as sample size between the different included studies. Apart from these, the other important limitations include variation in definition of sigmoid achalasia in different studies, vari-ability in the reporting of adverse events, and variable follow-up periods as low as 2 months in some studies.
Conclusion
Based on the results of this metanalysis, POEM appears to be an effective modality of treatment for advanced achalasia cardia with
sigmoid and megaesophagus. We need appropriately powered ran-domized trials and long-term data to confirm the above findings.
Supplementary Materials
Note: To access the supplementary table and figures mentioned in this article, visit the online version of Journal of Neurogastroen-terology and Motility at http://www.jnmjournal.org/, and at https://doi.org/10.5056/jnm21122.
Financial support: None.
Conflicts of interest: None.
Author contributions: Concept and design of the study: Har-shal S Mandavdhare; collecting and interpreting the data: Harshal S Mandavdhare, Praveen Kumar M, Jayendra Shukla, Antriksh Kumar, and Vishal Sharma; statistical analysis: Praveen Kumar M; drafting the initial manuscript: Harshal S Mandavdhare and Praveen Kumar M; manuscript revision and important contribu-tion of intellectual content: Harshal S Mandavdhare, Praveen Ku-mar M, and Vishal Sharma; and final approval: all authors.
References
1. Mundre P, Black CJ, Mohammed N, ford AC. Efficacy of surgical or endoscopic treatment of idiopathic achalasia: a systematic review and net-work meta-analysis. Lancet Gastroenterol Hepatol 2021;6:30-38.
2. Shiino Y, Houghton SG, Filipi CJ, Award ZT, Tomonaga T, Marsh RE. Manometric and radiographic verification of esophageal body decompen-sation for patients with achalasia. J Am Coll Surg 1999;189:158-163.
3. Mattioli S, Di Simone MP, Bassi F, et al. Surgery for esophageal achala-sia. long-term results with three different techniques. Hepatogastroenter-ology 1996;43:492-500.
4. Aiolfi A, Asti E, Bonitta G, Bonavina L. Esophagectomy for end-stage achalasia: systematic review and meta-analysis. World J Surg 2018;42:1469-1476.
5. Liu D, Liu YY, Chen JX, et al. Influence of esophageal morphology on the clinical efficacy of peroral endoscopic myotomy in treating advanced achalasia cardia. Exp Ther Med 2021;21:196.
6. Eckardt VF, Aignherr C, Bernhard G. Predictors of outcome in pa-tients with achalasia treated by pneumatic dilation. Gastroenterology 1992;103:1732-1738.
7. Kahrilas PJ, Bredenoord AJ, Fox M, et al. The Chicago classifica-tion of esophageal motility disorders, v3.0. Neurogastroenterol Motil 2015;27:160-174.
8. Cotton PB, Eisen GM, Aabakken L, et al. A lexicon for endoscopic adverse events: report of an ASGE w orkshop. Gastrointest Endosc 2010;71:446-454.
0
0
0.5
1.0
1.55
Sta
nd
ard
err
or
Logit transformed proportion
Funnel plot based on clinical success (outcome)
1 2 3 41
Egger s testEgger s test
Intercept 0.835 (95% C.I. 0.69 to 2.36);
P-value 0.311
Figure 5. Funnel plot showing no publication bias with quantitative analysis by Egger’s test showing no asymmetry in the plot.

2727
POEM for Sigmoid/Advanced Sigmoid and Megaesophagus
Vol. 28, No. 1 January, 2022 (15-27)
9. Stavropoulos SN, Modayil RJ, Friedel D, Savides T. The international per oral endoscopic myotomy survey (IPOEMS): a snapshot of the global POEM experience. Surg Endosc 2013;27:3322-3338.
10. Inoue H, Shiwaku H, Iwakiri K, et al. Clinical practice guidelines for peroral endoscopic myotomy. Dig Endosc 2018;30:563-579.
11. Katayama H, Kurokawa Y, Nakamura K, et al. Extended Clavien-Dindo classification of surgical complications: Japan clinical oncology group postoperative complications criteria. Surg Today 2016;46:668-685.
12. Inoue H, Minami H, Kobayashi Y, et al. Peroral endoscopic myotomy (POEM) for esophageal achalasia. Endoscopy 2010;42:265-271.
13. Japan Esophageal Society. Descriptive rules for achalasia of the esopha-gus, june 2012: 4th Edition. Esophagus 2017;14:275-289.
14. Ueda C, Abe H, Tanaka S, et al. Peroral endoscopic myotomy for ad-vanced achalasia with megaesophagus. Esophagus 2021;18:922-931.
15. Yoon HJ, Lee JE, Jung DH, Park JC, Toun YH, Park H. Morphologic restoration after peroral endoscopic myotomy in sigmoid-type achalasia. J Neurogastroenterol Motil 2020;26:67-73.
16. Nabi Z, Ramchandani M, Basha J, Goud R, Darisetty S, Reddy DN. Outcomes of per-oral endoscopic myotomy in sigmoid and advanced sigmoid achalasia. J Gastrointest Surg 2021;25:530532.
17. Tang X, Ren Y, Huang S, Gao Q, Gong W. 24th UEG week 2016: Vi-enna, Austria, October 2016. United European Gastroenterol J 2016;4(5 suppl):i.
18. Hu JW, Li QL, Zhou PH, et al. Peroral endoscopic myotomy for ad-vanced achalasia with sigmoid-shaped esophagus: long-term outcomes from a prospective, single-center study. Surg Endosc 2015;29:28412850.
19. Fujiyoshi Y, Abad MRA, Nishikawa Y, et al. Sa1262 a large single-center study on the clinical outcomes of per-oral endoscopic myotomy for sig-
moid type 2 achalasia. Gastrointest Endosc 2020;91:AB138. 20. Maruyama S, Taniyama Y, Sakurai T, et al. Per-oral endoscopic myotomy
(POEM) for a sigmoid type of achalasia: short-term outcomes and changes in the esophageal angle. Surg Endosc 2020;34:41244130.
21. Sanaka MR, Garg R, Chadalavada P, et al. Peroral endoscopic myotomy is safe and highly effective treatment for advanced achalasia with sigmoid esophagus. J Clin Gastroenterol 2021;55:505-511.
22. Qiu S, Chai N, Zhai Y, Wang X, Wang Y, Linghu E. Advanced acha-lasia: good candidate for peroral endoscopic myotomy. Dis Esophagus 2021;34:doaa97.
23. Indian Society of Gastroenterology. Indian J Gastroenterol 2015;34(suppl 1):1-104.
24. Lv L, Liu J, Tan Y, Liu D. Peroral endoscopic full-thickness myotomy for the treatment of sigmoid-type achalasia: outcomes with a minimum follow-up of 12 months. Eur J Gastroenterol Hepatol 2016;28:30-36.
25. Li L, Chai N, Linghu E, et al. Safety and efficacy of using a short tunnel versus a standard tunnel for peroral endoscopic myotomy for Ling type IIc and III achalasia: a retrospective study. Surg Endosc 2019;33:1394-1402.
26. Li Y, LingHu E, Ding H, et al. Peroral endoscopic myotomy with si-multaneous submucosal and muscle dissection for achalasia with severe interlayer adhesions. Gastrointest Endosc 2016;83:651-652.
27. Liu BR, Song JT, Omar Jan M. Video of the month. Modified peroral endoscopic myotomy. Am J Gastroenterol 2015;110:499.
28. Mohan BP, Ofosu A, Chandan S, et al. Anterior versus posterior ap-proach in peroral endoscopic myotomy (POEM): a systematic review and meta-analysis. Endoscopy 2020;52:251-258.

28 2022 The Korean Society of Neurogastroenterology and Motility
J Neurogastroenterol Motil, Vol. 28 No. 1 January, 2022www.jnmjournal.org
JNMJ Neurogastroenterol Motil, Vol. 28 No. 1 January, 2022pISSN: 2093-0879 eISSN: 2093-0887https://doi.org/10.5056/jnm21221
ReviewJournal of Neurogastroenterology and Motility
Received: November 16, 2021 Revised: None Accepted: December 8, 2021 This is an Open Access article distributed under the terms of the Creative Commons Attribution Non-Commercial License (http://creativecommons. org/licenses/by-nc/4.0) which permits unrestricted non-commercial use, distribution, and reproduction in any medium, provided the original work is properly cited.
*Correspondence: Young-Seok Cho, MD, PhD Division of Gastroenterology, Department of Internal Medicine, The Catholic University of Korea, Seoul St. Mary’s Hospital, 222 Banpo-daero, Seocho-gu, Seoul 06591, Korea Tel: +82-2-2258-6021, Fax: +82-2-2258-2038, E-mail: [email protected]
Tae-Geun Gweon and Yoo Jin Lee equally contributed to this article.
Clinical Practice Guidelines for Fecal Microbiota Transplantation in Korea
Tae-Geun Gweon,1 Yoo Jin Lee,2 Kyeong Ok Kim,3 Sung Kyun Yim,4 Jae Seung Soh,5 Seung Young Kim,6 Jae Jun Park,7 Seung Yong Shin,8 Tae Hee Lee,9 Chang Hwan Choi,8 Young-Seok Cho,1* Dongeun Yong,10 Jin-Won Chung,11 Kwang Jae Lee,12 Oh Young Lee,13 Myung-Gyu Choi,1 and Miyoung Choi14; Gut Microbiota and Therapy Research Group Under the Korean Society of Neurogastroenterology and Motility1Department of Internal Medicine, College of Medicine, The Catholic University of Korea, Seoul, Korea; 2Department of Internal Medicine, Keimyung University School of Medicine, Daegu, Korea; 3Division of Gastroenterology and Hepatology, Department of Internal Medicine, Yeungnam University College of Medicine, Daegu, Korea; 4Division of Gastroenterology and Hepatology, Department of Internal Medicine, Jeonbuk National University Medical School and Hospital, Jeonju, Jeollabuk-do, Korea; 5Division of Gastroenterology and Hepatology, Department of Internal Medicine, University of Hallym College of Medicine, Hallym University, Anyang, Gyeonggi-do, Korea; 6Division of Gastroenterology and Hepatology, Department of Internal Medicine, Jeonbuk National University Medical School, Jeonju, Jeollabuk-do, Korea; 7Division of Gastroenterology and Hepatology, Department of Internal Medicine, Yonsei University College of Medicine, Seoul, Korea; 8Division of Gastroenterology and Hepatology, Department of Internal Medicine, Chung-Ang University College of Medicine, Seoul, Korea; 9Institute for Digestive Research, Digestive Disease Center, Soonchunhyang University College of Medicine, Seoul, Korea; 10Department of Laboratory Medicine and Research Institute of Bacterial Resistance, Yonsei University College of Medicine, Seoul, Korea; 11Division of Infectious Diseases, Department of Internal Medicine, Chung-Ang University College of Medicine, Seoul, Korea; 12Department of Internal Medicine, Ajou University School of Medicine, Suwon, Gyeonggi-do, Korea; 13Department of Internal Medicine, Hanyang University School of Medicine, Seoul, Korea; and 14Division of Healthcare Technology Assessment Research, National Evidence-Based Healthcare Collaboration Agency, Seoul, Korea
Fecal microbiota transplantation (FMT) is a highly efficacious and safe modality for the treatment of recurrent or refractory Clostridioides difficile infection (CDI), with overall success rates of 90%. Thus, FMT has been widely used for 10 years. The incidence and clinical characteristics of CDI, the main indication for FMT, differ between countries. To date, several guidelines have been published. However, most of them were published in Western countries and therefore cannot represent the Korean national healthcare systems. One of the barriers to performing FMT is a lack of national guidelines. Accordingly, multidisciplinary experts in this field have developed practical guidelines for FMT. The purpose of these guidelines is to aid physicians performing FMT, which can be adapted to treat CDI and other conditions.(J Neurogastroenterol Motil 2022;28:28-42)
Key WordsFecal microbiota transplantation; Guideline; Treatment

2929
Korean FMT Guidelines
Vol. 28, No. 1 January, 2022 (28-42)
Introduction
Fecal microbiota transplantation (FMT) is a highly effica-cious and safe modality for the treatment of recurrent or refractory Clostridioides difficile infection (CDI), with overall success rates of 90%.1 With the great success of FMT for CDI and the develop-ment of next-generation sequencing, FMT has been tested for a range of other diseases including metabolic and gastrointestinal (GI) diseases such as irritable bowel syndrome (IBS) and inflammatory bowel disease (IBD), and several guidelines have been published.2-6 Although FMT has been tried for non-CDI diseases, the methods and results are mixed. While previous guidelines focused on FMT for the treatment of CDI, both disease prevalence and healthcare systems are heterogenous across countries. Korean FMT guidelines are needed because the lack of national guidelines is one of the ma-jor hurdles for FMT. In the guidelines developed here, we focus on the practical aspects of FMT, rather than on indication and basis.
Methods
DirectionThe process of FMT includes donor screening, production of
stool material, and delivery. Therefore, multidisciplinary expertise is involved in the development of these guidelines. Members of the Gut Microbiota and Therapy Research Group of the Korean So-ciety of Neurogastroenterology and Motility (KSNM) are mainly involved in developing these guidelines. Multi-academic societies, including the Korean Society of Gastroenterology, the Korean So-ciety of Infectious Diseases, and the Korean Society for Laboratory Medicine, participated as well. The working group consisted of 11
gastroenterologists, 1 professor of infectious diseases, 1 professor of laboratory medicine, and 1 methodologist invited from the National Evidence-based Healthcare Collaborating Agency. Six workshops were held for all working participants. The first meeting took place on July 31, 2019. After the outbreak of the novel coronavirus dis-ease 2019 (COVID-19), 4 of the 6 meetings were held online.
Development ProcessThe working group decided to follow the adaptation method
for guidelines development. Seven guidelines were assessed for suitability for adaptation using the Korean Appraisal of Guidelines for Research and Evaluation II.7 After rigorous review, 5 guide-lines were included for adaptation (Table 1).2-6 For recent articles, MEDLINE, Embase, and Web of Science were searched for literature that were published after the reference guidelines between January 2017 and September 2020. Human clinical trials were mainly extracted. For quality assessment, the RoB 1.0 and Ro-BANS 2.0 tools were used for randomized controlled trials (RCTs) and observational studies, respectively.8 Efficacy and safety should be considered together for the practical aspects of FMT. Optimal FMT practice should be done to increase efficacy and minimize adverse events (AEs). For CDI, the efficacy of the first FMT was reported to be about 80%. The overall efficacy of FMT can be in-creased by the performance of multiple FMTs.9,10 However, this is accompanied by increased medical costs, inconvenience for the pa-tient, and the possibility of AEs. Therefore, physicians should try to enhance the success rate of the first FMT. Since FMT has become widespread for various indications, several fatal AEs have been reported to date regarding endoscopy-related complications and infectious complications. We emphasize the safety issue of FMT in these guidelines. Case reports or conference abstracts were included regarding fatalities in cases of FMT.
Table 1. Selected Guidelines for Adaptation
Author Title Country Journal Year
Cammarota et al2 European consensus conference on fecal microbiota transplantation in clinical practice Europe Gut 2017Mullish et al3 The use of fecal microbiota transplant as treatment for recurrent or refractory
Clostridium difficile infection and other potential indications: joint British Society of Gastroenterology and Healthcare Infection Society guidelines
United Kingdom Gut 2018
Cammarota et al4 International consensus conference on stool banking for fecal microbiota transplantation in clinical practice
International Gut 2019
Ng et al5 Scientific frontiers in fecal microbiota transplantation: joint document of Asia-Pacific Association of Gastroenterology and Asia-Pacific Society for Digestive Endoscopy
Asia-Pacific Gut 2020
Haifer et al6 Australian consensus statements for the regulation, production and use of fecal microbiota transplantation in clinical practice
Australia Gut 2020
30
Tae-Geun Gweon, et al
Journal of Neurogastroenterology and Motility 30
The guidelines and article assessments were performed by 2 independent members. In total, 103 articles were selected for the resulting guideline. The working group formulated 18 statements regarding methodology for FMT according to the quality of evi-dence and grade of recommendation (Table 2). Because there are few experts in this topic, the Delphi method was not adopted. In-stead, grade of recommendation was formulated through voting by members of the working group.
Fecal Microbiota Transplantation Indications
Guidelines from the American College of Gastroenterology in 2013 and Infectious Diseases Society of America and Society for Healthcare Epidemiology of America in 2018 recommend FMT for patients with second or subsequent recurrences of CDI who have failed appropriate antibiotic therapy.11,12 In Europe and Austra-lia, guidelines or consensus statements strongly recommend FMT for the treatment of multiple recurrent CDI, and recommend FMT for refractory or severe CDI not responding to conventional antibiotic treatment.2-4,6 We recommend FMT for recurrent CDI of at least 2 episodes. For refractory or severe CDI, FMT can be considered at the physician’s discretion. To date, reports of efficacy of FMT for non-CDI diseases are mixed. When FMT is con-ducted for non-CDI diseases, it should be performed under regula-tion or for the purposes of a clinical trial.
Inflammatory Bowel Disease
IBD is a chronic and intractable intestinal disorder. Although the causal relationship has yet to be determined, dysbiosis has been proved in patients with IBD. FMT has been tried in patients with IBD for the treatment of CDI or IBD itself.13-16 A recent population-based study reported that patients with underlying IBD had a 4.8-fold higher risk of developing CDI than individuals with-out IBD. The risk of CDI in IBD patients is especially increased among young patients and within the first year of diagnosis.17 A systematic review reported that the mortality of CDI was higher in IBD patients compared with non-IBD patients (odds ratio [OR], 4.39; 95% confidence interval [CI], 3.56-5.42; I2 = 93%).18 Stud-ies suggest that FMT is an effective option for the treatment of CDI in patients with underlying IBD. A recent systematic review of 9 cohort studies reported that the initial cure rate was 81%, and that the overall cure rate after repeated FMT infusions was 89%, suggesting that FMT is an effective treatment for recurrent CDI in individuals with underlying IBD.19 A cohort study including 272 patients undergoing FMT for recurrent CDI showed that FMT is less effective for treating recurrent CDI in IBD patients compared with those without IBD (74.4% vs 92.1%, P = 0.018).20
Some patients with IBD have been reported to have disease flare after FMT. A large retrospective cohort study, including 67 patients, showed that a minority of patients (13%) had worsening
Statement 1: Fecal microbiota transplantation is rec-ommended for patients with recurrent Clostridioides difficile infection who have had at least 2 recurrences and can be considered in patients with refractory or severe Clostridioides difficile infection.
(Strong recommendation, high quality of evidence)
Statement 2: When fecal microbiota transplantation is performed in patients with inflammatory bowel disease, either for Clostridioides difficile infection or IBD treatment, a warning of inflammatory bowel dis-ease flare should be issued.
(Strong recommendation, high quality of evidence)
Table 2. Strength of Recommendation and Quality of Evidence
Strength of recommendation Position Strong Most patients should receive the recommended course of action. Conditional Different choices would be appropriate for different patients.
Quality of evidence Definition High We are very confident that the true effect lies close to the estimate of the effect.
Moderate We are moderately confident in the effect estimate. The true effect is likely to be close to the estimate of effect, but there is a possibility that it is substantially different.
Low Our confidence in the estimate is limited. The true effect may be substantially different from the estimate of ef-fect.
Very low We have very little confidence in the effect estimate. The true effect is likely to be substantially different from the estimate of effect.

3131
Korean FMT Guidelines
Vol. 28, No. 1 January, 2022 (28-42)
of disease.21 A systematic review, including 29 studies of 514 IBD patients, reported a pooled rate of IBD flare after FMT of 14.9%.22 In subgroup analysis, the rate of FMT flare was 22.7% (95% CI, 13-36%) in patients with CDI together with IBD, and 11.1% (95% CI, 7-17%) in patients with IBD alone. The results of a prospective study may be different from those of retrospective studies. A recent prospective multicenter study including 50 patients reported that disease activity in IBD after FMT was improved in 33 (67%), no change in 15 (31%), and de novo flare in 1 (2%), suggesting that IBD outcomes after FMT are better than reported in retrospective studies.23 Physicians should be aware of a possibility of IBD flare after FMT, and patients should be informed of this risk.
Donor Screening
Donor screening is one of the most important steps for FMT. Stool can be obtained from a patient’s related donor or an unrelated donor (universal healthy donor). All donors should be approved for stool donation and this process should be done voluntarily. Donor candidates should be fully informed of the benefits and harms of the donation and complete a written consent form. Donor’s infec-tious, metabolic, and other pathologic conditions can be transferred to recipients. Therefore, a screening process including a clinical assessment, and serological and fecal tests should be carried out. Establishment of a non-profit stool bank has contributed to the standardization of donor screening. In 2019, international guideline regarding donor screening was published.4 It is important to note that endemic diseases differ among countries. Tests for endemic diseases that are specific to a region should be included along with common items for donor screening. High-risk countries include regions at high risk of communicable disease/traveler’s diarrhea (eg, South Asia, Africa, and the Middle East) and Creutzfeldt-Jakob disease (United Kingdom and Europe). In Korea, where the prevalence of gastric cancer is high, donors should be screened for Helicobacter pylori infection. Donors with a recent travel history
to a specific region should be screened for region-specific endemic diseases.
The first step toward donor screening is an interview for suit-ability for donation. Three key issues regarding the selection of potential donors are as follows: (1) known history or risk factors for infectious diseases, (2) disorders potentially associated with pertur-bation of gut microbiota, and (3) drugs that can alter gut microbi-ota. A questionnaire includes demographic characteristics, medical condition, and recent travel history. The donor screening process, which was carried out in a single Korean center showed that 74% of candidates were excluded based on this questionnaire,24 which was similar to data presented by other countries.25,26 The questionnaire should be administered during screening and on the day of stool donation.2,4 Even individuals who passed screening cannot donate their stool if newly developed conditions are revealed by the ques-tionnaire on the day of stool collection. The items for questionnaire and laboratory tests are summarized in Tables 3 and 4, respectively. Age is one of the most important risk factors for colorectal cancer. Therefore, stool donation is recommended from young individu-als aged < 45 years. For donors aged 45 years or above, absence of colorectal cancer should be confirmed by colonoscopy within 3 years of stool donation. Recently, young age onset colorectal cancer comprised up to 10% of total colorectal cancers in Korea. Colonos-copy might be done optionally for young donors aged < 45 years. Although colonoscopy can detect undetected colorectal diseases as well as colorectal cancer, medical cost for donor screening should be considered. To date, transmission of colorectal cancer from donor to FMT recipient was not reported worldwide. Tests for transmissible infectious diseases should be included in stool and blood tests. In stool tests, the United States (US) Food and Drug Administration (FDA) recommends additional screening against multidrug-resis-tant organisms (MDRO), because 2 previous case reports showed FMT-associated extended-spectrum beta-lactamases (ESBL)-producing Escherichia coli bacteremia.27 Therefore, screening for MDRO was added to other viral, parasitic, and bacterial tests. In a Korean study, only 19% of the initial donor candidate pool qualified as FMT donors after completion of overall screening.24 Although the sample size of this report is much smaller than that of other countries,25,26 the results for suitability were acceptable. OpenBiome (Boston, MA, USA) reported that the pass rate of stool donation was only 3% among 15 317 eligible candidates.25 In consideration of the extremely low rate of qualification for stool donation, interna-tional guidelines for stool banking have reported simplified general blood tests.4
Statement 3: Stool donors should be assessed for gen-eral health status and gastrointestinal conditions by clinical assessment, and serological and fecal tests.
(Strong recommendation, low quality of evidence)
Statement 4: Stool donors should repeatedly undergo the same clinical assessment, and serological and fecal tests every 2-3 months.
(Conditional recommendation, low quality of evidence)
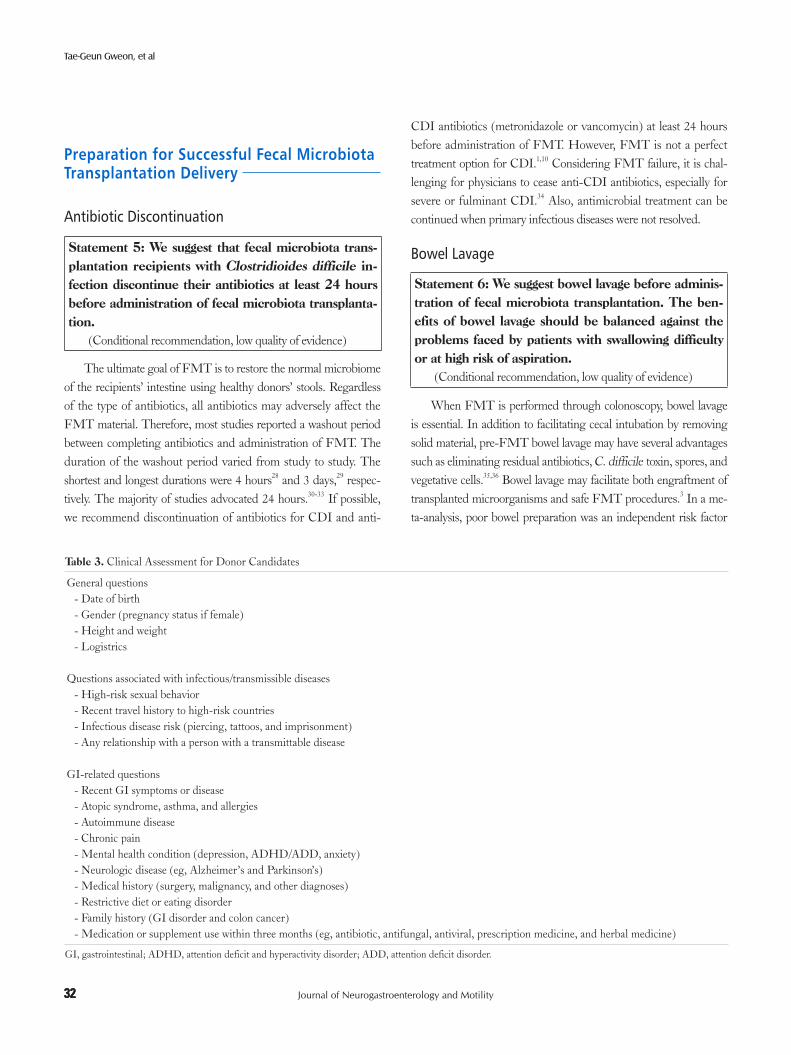
32
Tae-Geun Gweon, et al
Journal of Neurogastroenterology and Motility 32
Preparation for Successful Fecal Microbiota Transplantation Delivery
Antibiotic Discontinuation
The ultimate goal of FMT is to restore the normal microbiome of the recipients’ intestine using healthy donors’ stools. Regardless of the type of antibiotics, all antibiotics may adversely affect the FMT material. Therefore, most studies reported a washout period between completing antibiotics and administration of FMT. The duration of the washout period varied from study to study. The shortest and longest durations were 4 hours28 and 3 days,29 respec-tively. The majority of studies advocated 24 hours.30-33 If possible, we recommend discontinuation of antibiotics for CDI and anti-
CDI antibiotics (metronidazole or vancomycin) at least 24 hours before administration of FMT. However, FMT is not a perfect treatment option for CDI.1,10 Considering FMT failure, it is chal-lenging for physicians to cease anti-CDI antibiotics, especially for severe or fulminant CDI.34 Also, antimicrobial treatment can be continued when primary infectious diseases were not resolved.
Bowel Lavage
When FMT is performed through colonoscopy, bowel lavage is essential. In addition to facilitating cecal intubation by removing solid material, pre-FMT bowel lavage may have several advantages such as eliminating residual antibiotics, C. difficile toxin, spores, and vegetative cells.35,36 Bowel lavage may facilitate both engraftment of transplanted microorganisms and safe FMT procedures.3 In a me-ta-analysis, poor bowel preparation was an independent risk factor
Statement 5: We suggest that fecal microbiota trans-plantation recipients with Clostridioides difficile in-fection discontinue their antibiotics at least 24 hours before administration of fecal microbiota transplanta-tion.
(Conditional recommendation, low quality of evidence)
Statement 6: We suggest bowel lavage before adminis-tration of fecal microbiota transplantation. The ben-efits of bowel lavage should be balanced against the problems faced by patients with swallowing difficulty or at high risk of aspiration.
(Conditional recommendation, low quality of evidence)
Table 3. Clinical Assessment for Donor Candidates
General questions - Date of birth- Gender (pregnancy status if female)- Height and weight- Logistrics
Questions associated with infectious/transmissible diseases- High-risk sexual behavior- Recent travel history to high-risk countries- Infectious disease risk (piercing, tattoos, and imprisonment)- Any relationship with a person with a transmittable disease
GI-related questions- Recent GI symptoms or disease- Atopic syndrome, asthma, and allergies- Autoimmune disease- Chronic pain- Mental health condition (depression, ADHD/ADD, anxiety)- Neurologic disease (eg, Alzheimer’s and Parkinson’s)- Medical history (surgery, malignancy, and other diagnoses)- Restrictive diet or eating disorder- Family history (GI disorder and colon cancer)- Medication or supplement use within three months (eg, antibiotic, antifungal, antiviral, prescription medicine, and herbal medicine)
GI, gastrointestinal; ADHD, attention deficit and hyperactivity disorder; ADD, attention deficit disorder.

3333
Korean FMT Guidelines
Vol. 28, No. 1 January, 2022 (28-42)
Table 4. Serologic Screening and Stool Test for Donor Candidates
Serological screening
Viral tests- Hepatitis A virus IgM- Hepatitis B virus surface antigen- Hepatitis C virus antibody- HIV I and II- Epstein-Barr virus (IgG and IgM)- Cytomegalovirus (IgG and IgM)
Parasitic test: not applicableBacterial test
- Syphilis reagin testOther blood tests
- Routine chemistrya
- Amylase/lipase- C-reactive protein- LDL/HDL cholesterol- Triglyceride- Antinuclear antibody test- Erythrocyte sedimentation rate- Insulin- Complete blood count- Platelet count
Stool tests
Viral tests- Viruses associated with diarrhea (RT-PCR): Rotavirus, Norovirus, Adenovirus, Astrovirus
Parasitic tests- Parasites and ova (multiplex PCR): Ascaris lumbricoides, Cryptosporidium parvum/hominis, Ancylostoma duodenale, Necator americanus,
Strongyloides stercoralis, Giardia lamblia, Entamoeba histolytica, Trichuris trichiura, Clonorchis sinensis, Diphyllobothrium latum, Blastocystis hominis
Bacterial tests- Helicobacter pylori (nested PCR)- Bacteria associated with diarrhea (PCR): Salmonella spp., Shigella spp., Vibrio spp. Campylobacter spp. (C. jejuni, C. coli),
Yersinia enterocolitica, and Aeromonas spp.- Multidrug-resistant bacteria: MRSA (Cx), CRE (Cx + PCR), VRE (Cx + PCR), and ESBL-producing Enterobacteriaceae (Cx)
Additional fecal tests- Fecal white blood cell- Occult blood
Additional tests
Chest (posteroanterior) radiographyCOVID-19 tests (only for pandemic period)
- Nasopharyngeal swab- Serology for SARS-CoV-2- Stool testing for SARS-CoV-2
aRoutine chemistry tests include tests for calcium, inorganic phosphate, glucose, blood urea nitrogen, creatinine, uric acid, total cholesterol, total protein, albumin, alkaline phosphatase, aspartate transaminase, alanine aminotransferase, serum glutamate-pyruvate transaminase, and total bilirubin.HIV, human immunodeficiency virus; LDL, low density lipoprotein; HDL, high density lipoprotein; RT-PCR, reverse transcription polymerase chain reaction; PCR, polymerase chain reaction; MRSA, methicillin-resistant Staphylococcus aureus; Cx, culture; CRE, carbapenem-resistant Enterobacteriaceae; VRE, vancomy-cin-resistant enterococci; ESBL, extended spectrum β-lactamase; SARS-CoV-2, severe acute respiratory syndrome coronavirus 2; COVID-19, coronavirus disease 2019.

34
Tae-Geun Gweon, et al
Journal of Neurogastroenterology and Motility 34
for FMT failure.37 Therefore, bowel lavage was performed before FMT using the upper GI tract route, including oral capsules.30,38-40 Bowel lavage carries a risk of vomiting and aspiration and may be exempted for patients with high risk of aspiration.41 Adoption of bowel lavage should be conducted with caution for patients at high risk of aspiration such as those with (1) swallowing difficulty, (2) ileus, or (3) bedridden status. The benefits of bowel lavage should be weighed against the risks associated with high-risk groups. For safety, polyethylene glycol is recommended for bowel lavage before FMT.
Factors Related to Fecal Microbiota Trans-plantation Procedure
Stool Amount
There is limited information to determine the sufficient stool amount for FMT. In a recent systematic review including 168 studies, the infused stool mass ranged from 25 g to 300 g.9 The optimal amount of stool differs among guidelines: 50 g for the Brit-ish guideline;3 30 g for the European guideline.2 The most recently published guideline on stool banking recommends at least 25 g based on the experience of OpenBiome.4
The British guideline recommends using > 50 g of stool in each FMT preparation based on the finding that the relapse rate after FMT was 4-fold higher when less than 50 g of stool was ad-ministered (4% vs, 1% for ≥ 50 g).3,42 A recent meta-analysis also confirmed that a fecal amount ≤ 50 g was associated with lower efficacy rates after a single infusion in recurrent CDI.43 Therefore, it is important to provide a sufficient biomass to restore a healthy microbiota, either by increasing the stool amount in each session, or repeating infusion. In addition, there is wide variability in the microbial content of stool samples between individuals and between different donations, and the stool weight is an imperfect measure of microbiota quantity.44 The development of a more objective mea-sure of microbial richness and diversity could be more helpful than setting a specific amount. Regarding stool amount, only 1 study compared the efficacy of FMT between a higher amount and a lower amount of stool. For FMT in patients with IBS, 60 g of stool showed better efficacy compared with 30 g.45
With advancement of stool processing, the quantity of fecal
suspension may be decreased while preserving the same quantity of stool. The quantity of stool suspension differed among studies. In the first experience of frozen stool, the quantity of fecal suspen-sion presented was 220-240 mL, which contained 50 g of stool.46 In a Korean stool bank (Microbiotics, Seoul, Korea), 125 mL of fecal suspension contained 50 g of stool. In terms of efficacy, the required quantity of stool for FMT should be at least 30-50 g. The stool quantity and method of FMT were heterogenous in studies on FMT for non-CDI. Therefore, it is challenging to define the optimal quantity of stool for non-CDI FMT. The quantity of fecal suspension should be restricted, especially for FMT via the upper GI route. Infusion of a larger volume carries the risk of regurgita-tion or aspiration for upper GI tract infusions.47 The volume of fecal suspension should not exceed 250-300 mL for upper GI infu-sions. For lower GI tract infusions, a larger-volume infusion may not be related to AEs. Early evacuation of fecal suspension may cause FMT failure or unintended spillage, which is an unpleasant experience for recipients. Antiemetics for upper GI tract infusion and loperamide for colonoscopic infusion may be helpful.
Stool Formulation
In the developmental stage of FMT, fresh stool was used for FMT within 6-24 hours of evacuation. In 2012, Hamilton et al46 reported the process of manufacture and efficacy of frozen stool. In the US, frozen stool from a non-profit stool bank is the most com-monly used formulation at the moment.48 Recently some novel stool formulations have been developed and investigated.49 However, the methods to manufacture these novel formulations are mixed and the efficacy of different formulations should be better investigated. Therefore, we focused on comparing the efficacy between frozen
Statement 8: If available, we recommend use of fro-zen stool for fecal microbiota transplantation, which is manufactured from a stool bank or specialized insti-tute.
(Strong recommendation, high quality of evidence)
Statement 9: Fresh stool, which was rigorously screened, can be used for fecal microbiota transplantation.
(Strong recommendation, high quality of evidence)
Statement 10: A capsular product can be used for fecal microbiota transplantation for individuals without swallowing difficulties.
(Strong recommendation, high quality of evidence)
Statement 7: We recommend at least 30-50 g of stool for fecal microbiota transplantation.
(Conditional recommendation, low quality of evidence)

3535
Korean FMT Guidelines
Vol. 28, No. 1 January, 2022 (28-42)
stool and fresh stool for CDI. We included studies that compared frozen and fresh stool. Single-arm studies were not included for analysis. Two RCTs and 2 retrospective studies were included for meta-analysis.46,50-52 In total, 159 and 149 patients were included in the frozen and fresh stool group, respectively. The success rate of first FMT was 74.2% and 74.5% in the frozen and the fresh stool group, respectively (OR, 0.95; 95% CI, 0.56-1.63; Figure).
Considering the unsavory aspect of preparing fecal material, frozen stool provided by a certified stool bank is convenient for phy-sicians because it makes the process of recruitment, screening of do-nor stool, and preparation of a fecal suspension unnecessary. Fresh stool can also be used for FMT if the donor stool is rigorously screened, and stool processing is done in accordance with standard processing.
Capsule FMT is a promising formulation.40,53-55 Stool products can be concentrated and prepared as capsules. Initially, capsules contained concentrated liquid and were stored in a refrigerator. Subsequently, lyophilized capsules were developed. Lyophilized capsules can be stored at room temperature, which is more ad-vantageous compared with liquid capsules. The feces can be more concentrated after lyophilization. One capsule of 0.65 mL contains 1.6 g of stool.54,56 Currently, fresh, frozen, and capsular stool are under investigation for CDI and non-CDI diseases. The resolution of CDI with capsular FMT has been reported as 78-96%.40,51,56-58 One RCT showed a comparable rate of CDI resolution after single FMT between capsule FMT and colonoscopic infusion (capsule, 96% [51/53] vs colonoscopy, 96% [50/52]).40 FMT may be per-formed without the assistance of a physician using capsular stool. In terms of safety, no serious AEs has been reported, including
aspiration, to date. We recommend FMT capsules for those with-out swallowing difficulty. More studies are needed to evaluate the efficacy of FMT treatment using capsule products.
Choice of Infusion Route
Fecal delivery can be performed via upper and lower GI tract. Upper GI tract delivery is infusion of donor stools through a gas-troscope, nasogastric, nasojejunal, gastrostomy tube, or oral capsule. Lower GI tract delivery is used in the administration of donor stools via colonoscopy, sigmoidoscopy, or retention enema. Choice of infusion route is very important during the FMT procedure. Ef-ficacy and safety need to be considered together when adopting the
Jiang 2017
Lee 2016
Mathew 2012
Satokari 2015
Total events
Heterogeneity: Chi = 3.34, df = 3 ( = 0.34); I = 10%
Test for overall effect: Z = 0.18 ( = 0.86)
Total (95% CI)
2 2PP
Study or subgroup
20
57
19
22
118
Odds ratio
M-H, fixed, 95% CIEvents Total Weight M-H, fixed, 95% CI
0.09 [0.00,1.76]
1.02 [0.56, 1.88]
2.11 [0.34, 12.97]
1.57 [0.09, 27.21]
0.95 [0.56, 1.63]
Frozen Fresh Odds ratio
0.01 0.1 1 10010
FreshFrozen
Risk of bias
A B C D E F G
24
91
21
23
159
25
54
18
14
111
Events Total
25
87
22
15
149
16.3%
74.9%
6.1%
2.7%
100.0%
Risk of bias legend
( ) Random sequence generation (selection bias)A
( ) Allocation concealment (selection bias)B
( ) Blinding of participants and personnel (performance bias)C
( )D Blinding of outcome assessment (detection bias)
( )E Incomplete outcome data (attrition bias)
( )F Selective reporting (reporting bias)
( )G Other bias
Figure. Forest plot of studies comparing frozen stool with fresh stool for fecal microbiota transplantation. M-H, Mantel-Haenszel.
Statement 11: When possible, colonoscopic infusion of fecal suspension into the right colon (terminal il-eum or cecum) should be considered initially.
(Strong recommendation, high quality of evidence)
Statement 12: Fecal microbiota transplantation en-ema can be applied when fecal microbiota transplan-tation via colonoscopy is not clinically appropriate.
(Conditional recommendation, high quality of evidence)
Statement 13: Fecal microbiota transplantation via upper gastrointestinal tract delivery can also be used where clinically appropriate. Upper gastrointestinal tract should be avoided for patients with high risk of regurgitation or aspiration.
(Conditional recommendation, high quality of evidence)
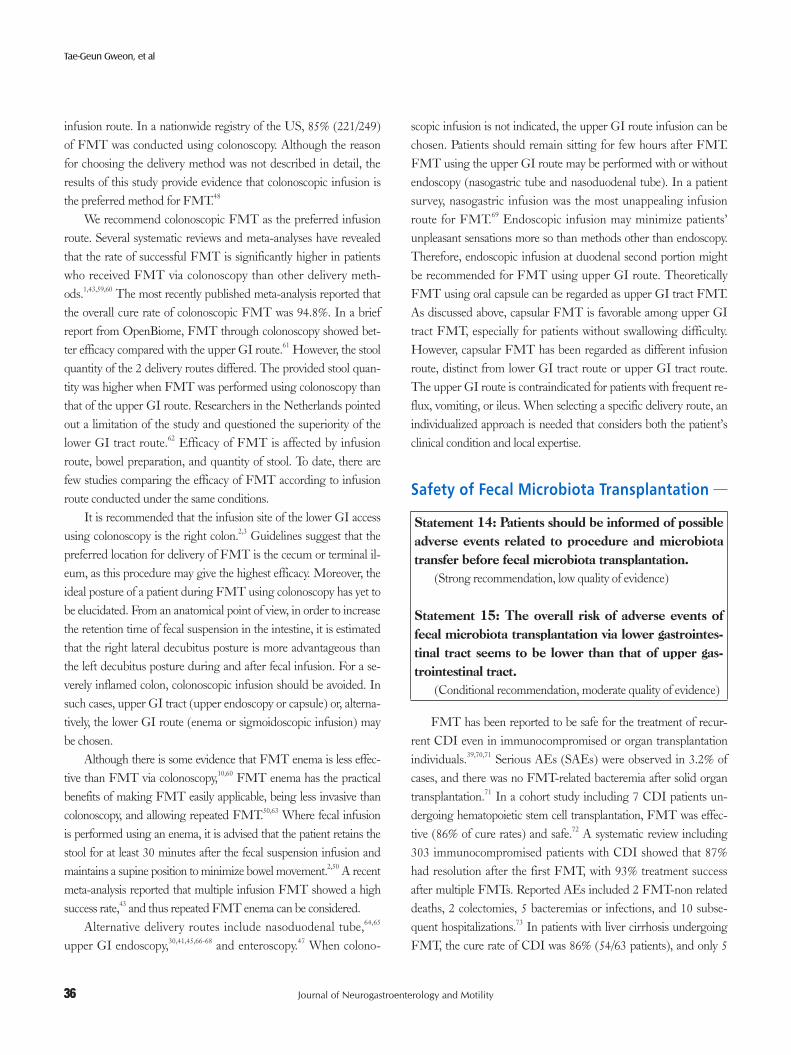
36
Tae-Geun Gweon, et al
Journal of Neurogastroenterology and Motility 36
infusion route. In a nationwide registry of the US, 85% (221/249) of FMT was conducted using colonoscopy. Although the reason for choosing the delivery method was not described in detail, the results of this study provide evidence that colonoscopic infusion is the preferred method for FMT.48
We recommend colonoscopic FMT as the preferred infusion route. Several systematic reviews and meta-analyses have revealed that the rate of successful FMT is significantly higher in patients who received FMT via colonoscopy than other delivery meth-ods.1,43,59,60 The most recently published meta-analysis reported that the overall cure rate of colonoscopic FMT was 94.8%. In a brief report from OpenBiome, FMT through colonoscopy showed bet-ter efficacy compared with the upper GI route.61 However, the stool quantity of the 2 delivery routes differed. The provided stool quan-tity was higher when FMT was performed using colonoscopy than that of the upper GI route. Researchers in the Netherlands pointed out a limitation of the study and questioned the superiority of the lower GI tract route.62 Efficacy of FMT is affected by infusion route, bowel preparation, and quantity of stool. To date, there are few studies comparing the efficacy of FMT according to infusion route conducted under the same conditions.
It is recommended that the infusion site of the lower GI access using colonoscopy is the right colon.2,3 Guidelines suggest that the preferred location for delivery of FMT is the cecum or terminal il-eum, as this procedure may give the highest efficacy. Moreover, the ideal posture of a patient during FMT using colonoscopy has yet to be elucidated. From an anatomical point of view, in order to increase the retention time of fecal suspension in the intestine, it is estimated that the right lateral decubitus posture is more advantageous than the left decubitus posture during and after fecal infusion. For a se-verely inflamed colon, colonoscopic infusion should be avoided. In such cases, upper GI tract (upper endoscopy or capsule) or, alterna-tively, the lower GI route (enema or sigmoidoscopic infusion) may be chosen.
Although there is some evidence that FMT enema is less effec-tive than FMT via colonoscopy,10,60 FMT enema has the practical benefits of making FMT easily applicable, being less invasive than colonoscopy, and allowing repeated FMT.50,63 Where fecal infusion is performed using an enema, it is advised that the patient retains the stool for at least 30 minutes after the fecal suspension infusion and maintains a supine position to minimize bowel movement.2,50 A recent meta-analysis reported that multiple infusion FMT showed a high success rate,43 and thus repeated FMT enema can be considered.
Alternative delivery routes include nasoduodenal tube,64,65 upper GI endoscopy,30,41,45,66-68 and enteroscopy.47 When colono-
scopic infusion is not indicated, the upper GI route infusion can be chosen. Patients should remain sitting for few hours after FMT. FMT using the upper GI route may be performed with or without endoscopy (nasogastric tube and nasoduodenal tube). In a patient survey, nasogastric infusion was the most unappealing infusion route for FMT.69 Endoscopic infusion may minimize patients’ unpleasant sensations more so than methods other than endoscopy. Therefore, endoscopic infusion at duodenal second portion might be recommended for FMT using upper GI route. Theoretically FMT using oral capsule can be regarded as upper GI tract FMT. As discussed above, capsular FMT is favorable among upper GI tract FMT, especially for patients without swallowing difficulty. However, capsular FMT has been regarded as different infusion route, distinct from lower GI tract route or upper GI tract route. The upper GI route is contraindicated for patients with frequent re-flux, vomiting, or ileus. When selecting a specific delivery route, an individualized approach is needed that considers both the patient’s clinical condition and local expertise.
Safety of Fecal Microbiota Transplantation
FMT has been reported to be safe for the treatment of recur-rent CDI even in immunocompromised or organ transplantation individuals.39,70,71 Serious AEs (SAEs) were observed in 3.2% of cases, and there was no FMT-related bacteremia after solid organ transplantation.71 In a cohort study including 7 CDI patients un-dergoing hematopoietic stem cell transplantation, FMT was effec-tive (86% of cure rates) and safe.72 A systematic review including 303 immunocompromised patients with CDI showed that 87% had resolution after the first FMT, with 93% treatment success after multiple FMTs. Reported AEs included 2 FMT-non related deaths, 2 colectomies, 5 bacteremias or infections, and 10 subse-quent hospitalizations.73 In patients with liver cirrhosis undergoing FMT, the cure rate of CDI was 86% (54/63 patients), and only 5
Statement 14: Patients should be informed of possible adverse events related to procedure and microbiota transfer before fecal microbiota transplantation.
(Strong recommendation, low quality of evidence)
Statement 15: The overall risk of adverse events of fecal microbiota transplantation via lower gastrointes-tinal tract seems to be lower than that of upper gas-trointestinal tract.
(Conditional recommendation, moderate quality of evidence)

3737
Korean FMT Guidelines
Vol. 28, No. 1 January, 2022 (28-42)
possibly related SAEs occurred.74 A retrospective study from Israel including 34 patients aged 60 years or older with at least 1 signifi-cant comorbidity showed a 90% clinical improvement with a few SAEs including suspected aspirations, suggesting that FMT is ef-ficacious and safe for elderly patients with underlying illness.75
Recently, some fatal AEs were reported and the safety of FMT was questioned.76-78 Before FMT, physicians should discuss with their patients or clinical trial participants the risks associated with the procedure. The choice of delivery route needs to be based on the specific clinical situation. AEs of FMT include procedure-related complications and factors related to microbiota transfer.
AEs can be classified as short- or long-term according to the interval between FMT and the occurrence of the AE. Short-term AEs include abdominal pain, diarrhea, flatulence, transient fever, and procedure-related AEs.78 A systematic review including 129 studies (4241 patients) from years 2000 to 2020 documented the incidence of FMT-related AEs. The results showed that FMT-related AEs were identified in 19% of FMT procedures. Com-monly reported immediate AEs after FMT were GI complications, including diarrhea (10%), abdominal discomfort/pain/cramping (7%), nausea/vomiting (3%), and flatulence (3%). Most of these symptoms were self-limiting and disappeared within a few days. FMT-related SAEs, such as infections and deaths, were reported in 59 patients (1.4%). Of 5 deaths, 4 were definitely FMT-procedure related, including 1 case of aspiration during sedation and 3 cases of aspiration of the fecal suspension. One was probably FMT-related.79
The human gut microenvironment is regarded as an ecosys-tem. Therefore, transfer of donor microbiota may cause donor–host reaction. Long-term safety or immunologic effects of FMT are relatively uncertain, including the occurrence of latent infections and diseases or conditions related to changes in gut microbiota. One study reported the occurrence of peripheral neuropathy, Sjogren’s disease, idiopathic thrombocytopenic purpura, and rheumatoid arthritis.29 However, the relationship between FMT and these con-ditions is not clear. One study found that IBS developed in 4% of patients after FMT.80 Observational studies have demonstrated that FMT is relatively safe during long-term follow up.48,80
Transfer of pathogens is one of the serious concerns of FMT. The FDA has reported 6 cases of transfer of E. coli from the donor. Of these, 2 patients expired after FMT because of Shigatoxin-pro-ducing E. coli.27 The donor’s stool was not tested for these bacteria at that time. The FDA has requested that testing for MDRO such as carbapenem-resistant Enterobacteriaceae, vancomycin-resistant enterococci, and ESBL producing Enterobacteriaceae should be included in donor screening.81 Vigorous donor screening can mini-
mize the possibility of transfer of donor’s enteric pathogens. Even so, all pathogens cannot be perfectly screened. Therefore, some studies have investigated the efficacy of mixtures of purified bacte-rial strains, bacterial debris, or novel formulations.82,83
In terms of infusion route, nasal stuffiness, sore throat, rhinor-rhea, and upper GI hemorrhage, were considered as definitely as-sociated with upper GI routes of administration.76,84,85 In addition, some of the common AEs after upper GI administration of FMT are nausea and reflux.65,66 When performing FMT via the upper GI tract, one of the main concerns is regurgitation of fecal suspen-sion, which can lead to aspiration pneumonia, which in some cases can be fatal.47,65,76,86 Abdominal discomfort, one of the most frequent AEs associated with FMT, was reported in 29.9% (61/204) of patients after FMT by the upper GI route. For the lower GI route, 13.0% (56/430) of patients developed abdominal discomfort after FMT. The upper GI route was more likely to develop abdominal discomfort compared with the lower GI route.87 The exact mecha-nism of higher incidence of abdominal discomfort for upper GI infusion was not described. The small bowel is the longest part of GI tract. Despite limited information of the ecosystem of the small bowel, the diversity and density of microbiota in the small bowel are lower than those of the colon.88 Large quantities of transferred donor’s microbiota may cause small intestinal bacterial overgrowth (SIBO) or adverse interactions between host and donor microbiota. Some cases of SIBO were reported after FMT to date.89 SAEs also have been reported regarding colonoscopic infusion. Bowel perfora-tion was reported after colonoscopic delivery.90 Deaths related to aspiration was also reported after FMT using colonoscopy.70 For patients with high risk of aspiration, the decision to perform FMT should be taken with caution.
Few studies have reported that both upper GI route and lower GI route were safe, with low incidence of AEs.66,91 However, in a system-atic review the rate of AEs was higher in the upper GI route than in the lower GI tract infusion.79 Death related to FMT was reported in 5 cases. Of these, there was 1 case of mortality after colonoscopic infusion.
Follow-up After Fecal Microbiota Transplan-tation
Statement 16: All fecal microbiota transplantation recipients are required to undergo follow-up in order to assess treatment efficacy, disease recurrence, and possible adverse events.
(Strong recommendation, high quality of evidence)
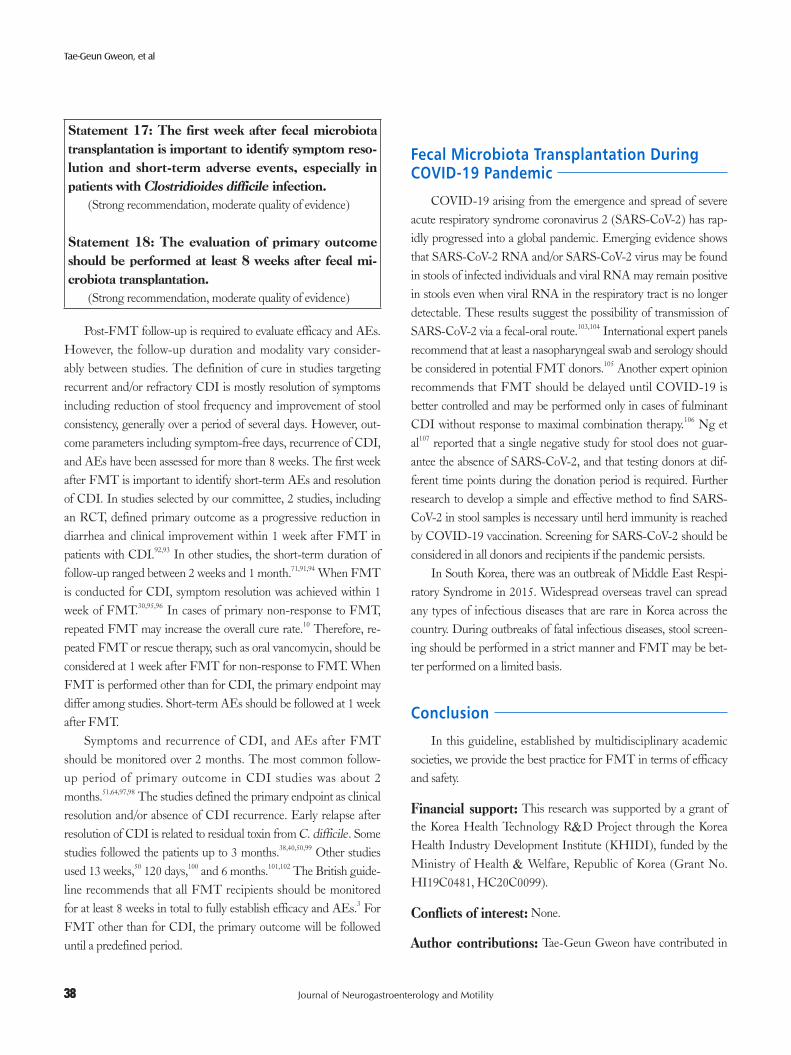
38
Tae-Geun Gweon, et al
Journal of Neurogastroenterology and Motility 38
Post-FMT follow-up is required to evaluate efficacy and AEs. However, the follow-up duration and modality vary consider-ably between studies. The definition of cure in studies targeting recurrent and/or refractory CDI is mostly resolution of symptoms including reduction of stool frequency and improvement of stool consistency, generally over a period of several days. However, out-come parameters including symptom-free days, recurrence of CDI, and AEs have been assessed for more than 8 weeks. The first week after FMT is important to identify short-term AEs and resolution of CDI. In studies selected by our committee, 2 studies, including an RCT, defined primary outcome as a progressive reduction in diarrhea and clinical improvement within 1 week after FMT in patients with CDI.92,93 In other studies, the short-term duration of follow-up ranged between 2 weeks and 1 month.71,91,94 When FMT is conducted for CDI, symptom resolution was achieved within 1 week of FMT.30,95,96 In cases of primary non-response to FMT, repeated FMT may increase the overall cure rate.10 Therefore, re-peated FMT or rescue therapy, such as oral vancomycin, should be considered at 1 week after FMT for non-response to FMT. When FMT is performed other than for CDI, the primary endpoint may differ among studies. Short-term AEs should be followed at 1 week after FMT.
Symptoms and recurrence of CDI, and AEs after FMT should be monitored over 2 months. The most common follow-up period of primary outcome in CDI studies was about 2 months.51,64,97,98 The studies defined the primary endpoint as clinical resolution and/or absence of CDI recurrence. Early relapse after resolution of CDI is related to residual toxin from C. difficile. Some studies followed the patients up to 3 months.38,40,50,99 Other studies used 13 weeks,50 120 days,100 and 6 months.101,102 The British guide-line recommends that all FMT recipients should be monitored for at least 8 weeks in total to fully establish efficacy and AEs.3 For FMT other than for CDI, the primary outcome will be followed until a predefined period.
Fecal Microbiota Transplantation During COVID-19 Pandemic
COVID-19 arising from the emergence and spread of severe acute respiratory syndrome coronavirus 2 (SARS-CoV-2) has rap-idly progressed into a global pandemic. Emerging evidence shows that SARS-CoV-2 RNA and/or SARS-CoV-2 virus may be found in stools of infected individuals and viral RNA may remain positive in stools even when viral RNA in the respiratory tract is no longer detectable. These results suggest the possibility of transmission of SARS-CoV-2 via a fecal-oral route.103,104 International expert panels recommend that at least a nasopharyngeal swab and serology should be considered in potential FMT donors.105 Another expert opinion recommends that FMT should be delayed until COVID-19 is better controlled and may be performed only in cases of fulminant CDI without response to maximal combination therapy.106 Ng et al107 reported that a single negative study for stool does not guar-antee the absence of SARS-CoV-2, and that testing donors at dif-ferent time points during the donation period is required. Further research to develop a simple and effective method to find SARS-CoV-2 in stool samples is necessary until herd immunity is reached by COVID-19 vaccination. Screening for SARS-CoV-2 should be considered in all donors and recipients if the pandemic persists.
In South Korea, there was an outbreak of Middle East Respi-ratory Syndrome in 2015. Widespread overseas travel can spread any types of infectious diseases that are rare in Korea across the country. During outbreaks of fatal infectious diseases, stool screen-ing should be performed in a strict manner and FMT may be bet-ter performed on a limited basis.
Conclusion
In this guideline, established by multidisciplinary academic societies, we provide the best practice for FMT in terms of efficacy and safety.
Financial support: This research was supported by a grant of the Korea Health Technology R&D Project through the Korea Health Industry Development Institute (KHIDI), funded by the Ministry of Health & Welfare, Republic of Korea (Grant No. HI19C0481, HC20C0099).
Conflicts of interest: None.
Author contributions: Tae-Geun Gweon have contributed in
Statement 17: The first week after fecal microbiota transplantation is important to identify symptom reso-lution and short-term adverse events, especially in patients with Clostridioides difficile infection.
(Strong recommendation, moderate quality of evidence)
Statement 18: The evaluation of primary outcome should be performed at least 8 weeks after fecal mi-crobiota transplantation.
(Strong recommendation, moderate quality of evidence)

3939
Korean FMT Guidelines
Vol. 28, No. 1 January, 2022 (28-42)
writing and editing the paper as the first authors; Miyoung Choi helped in formulating clinical key questions, conducting relevant literatures search, and mentoring for extensive meta-analyses; Yoo Jin Lee, Kyeong Ok Kim, Sung Kyun Yim, Jae Seung Soh, Seung Young Kim, Jae Jun Park, Seung Yong Shin, Tae Hee Lee, Chang Hwan Choi, Young-Seok Cho, Dongeun Yong, and Jin-Won Chung have contributed in the systematic review, the extraction of recommendations, and writing the paper; Kwang Jae Lee, Oh Young Lee, and Myung-Gyu Choi have contributed as expert pan-el; and Young-Seok Cho has designed the guideline development as chairman of the Gut Microbiota and Therapy Research Group of KSNM and have revised the manuscript critically.
References
1. Quraishi MN, Widlak M, Bhala N, et al. Systematic review with meta-analysis: the efficacy of faecal microbiota transplantation for the treat-ment of recurrent and refractory Clostridium difficile infection. Aliment Pharmacol Ther 2017;46:479-493.
2. Cammarota G, Ianiro G, Tilg H, et al. European consensus confer-ence on faecal microbiota transplantation in clinical practice. Gut 2017;66:569-580.
3. Mullish BH, Quraishi MN, Segal JP, et al. The use of faecal microbiota transplant as treatment for recurrent or refractory Clostridium difficile infection and other potential indications: joint British Society of Gastro-enterology (BSG) and Healthcare Infection Society (HIS) guidelines. Gut 2018;67:1920-1941.
4. Cammarota G, Ianiro G, Kelly CR, et al. International consensus con-ference on stool banking for faecal microbiota transplantation in clinical practice. Gut 2019;68:2111-2121.
5. Ng SC, Kamm MA, Yeoh YK, et al. Scientific frontiers in faecal mi-crobiota transplantation: joint document of Asia-Pacific Association of Gastroenterology (APAGE) and Asia-Pacific Society for Digestive En-doscopy (APSDE). Gut 2020;69:83-91.
6. Haifer C, Kelly CR, Paramsothy S, et al. Australian consensus state-ments for the regulation, production and use of faecal microbiota trans-plantation in clinical practice. Gut 2020;69:801-810.
7. Ministry of Health & Welfare. Korean Academy of Medical Science. Assessment of the quality of clinical practice guidelines in Korea us-ing AGREE 2.0 instrument. 2011. Available from URL: https://www.guideline.or.kr/evaluation/file/AGREE%202.0_01.pdf (accessed 20 Dec 2021).
8. Schünemann H, Brożek J, Guyatt G, Oxman A. Handbook for grad-ing the quality of evidence and the strength of recommendations us-ing the GRADE approach. 2013. Available from URL: https://gdt.gradepro.org/app/handbook/handbook.html (assessed 20 Dec 2021).
9. Lai CY, Sung J, Cheng F, et al. Systematic review with meta-analysis: review of donor features, procedures and outcomes in 168 clinical studies of faecal microbiota transplantation. Aliment Pharmacol Ther
2019;49:354-363.10. Tariq R, Pardi DS, Bartlett MG, Khanna S. Low cure rates in con-
trolled trials of fecal microbiota transplantation for recurrent Clostridium difficile infection: a systematic review and meta-analysis. Clin Infect Dis 2019;68:1351-1358.
11. Surawicz CM, Brandt LJ, Binion DG, et al. Guidelines for diagnosis, treatment, and prevention of Clostridium difficile infections. Am J Gas-troenterol 2013;108:478-498.
12. McDonald LC, Gerding DN, Johnson S, et al. Clinical practice guide-lines for Clostridium difficile infection in adults and children: 2017 update by the infectious diseases society of America (IDSA) and society for healthcare epidemiology of America (SHEA). Clin Infect Dis 2018;66:e1-e48.
13. Paramsothy S, Kamm MA, Kaakoush NO, et al. Multidonor intensive faecal microbiota transplantation for active ulcerative colitis: a ran-domised placebo-controlled trial. Lancet 2017;389:1218-1228.
14. Moayyedi P, Surette MG, Kim PT, et al. Fecal microbiota transplanta-tion induces remission in patients with active ulcerative colitis in a ran-domized controlled trial. Gastroenterology 2015;149:102-109, e6.
15. Rossen NG, Fuentes S, van der Spek MJ, et al. Findings from a ran-domized controlled trial of fecal transplantation for patients with ulcer-ative colitis. Gastroenterology 2015;149:110-118, e4.
16. Paramsothy S, Paramsothy R, Rubin DT, et al. Faecal microbiota trans-plantation for inflammatory bowel disease: a systematic review and meta-analysis. J Crohns Colitis 2017;11:1180-1199.
17. Singh H, Nugent Z, Yu BN, Lix LM, Targownik LE, Bernstenin CN. Higher incidence of Clostridium difficile infection among individuals with inflammatory bowel disease. Gastroenterology 2017;153:430-438, e2.
18. Tariq R, Law CCY, Khanna S, Murthy S, McCurdy JD. The impact of Clostridium difficile infection on mortality in patients with inflammatory bowel disease: a systematic review and meta-analysis. J Clin Gastroen-terol 2019;53:127-133.
19. Chen T, Zhou Q, Zhang D, et al. Effect of faecal microbiota transplan-tation for treatment of Clostridium difficile infection in patients with inflammatory bowel disease: a systematic review and meta-analysis of cohort studies. J Crohns Colitis 2018;12:710-717.
20. Khoruts A, Rank KM, Newman KM, et al. Inflammatory bowel disease affects the outcome of fecal microbiota transplantation for recurrent Clostridium difficile infection. Clin Gastroenterol Hepatol 2016;14:1433-1438.
21. Fischer M, Kao D, Kelly C, et al. Fecal microbiota transplantation is safe and efficacious for recurrent or refractory Clostridium difficile infec-tion in patients with inflammatory bowel disease. Inflamm Bowel Dis 2016;22:2402-2409.
22. Qazi T, Amaratunga T, Barnes EL, Fischer M, Kassam Z, Allegretti JR. The risk of inflammatory bowel disease flares after fecal microbiota transplantation: systematic review and meta-analysis. Gut Microbes 2017;8:574-588.
23. Allegretti JR, Kelly CR, Grinspan A, et al. Inflammatory bowel disease outcomes following fecal microbiota transplantation for recurrent C. dif-ficile infection. Inflamm Bowel Dis 2021;27:1371-1378.

40
Tae-Geun Gweon, et al
Journal of Neurogastroenterology and Motility 40
24. Seo HS, Chin HS, Kim YH, et al. Laboratory aspects of donor screen-ing for fecal microbiota transplantation at a Korean fecal microbiota bank. Ann Lab Med 2021;41:424-428.
25. Kassam Z, Dubois N, Ramakrishna B, et al. Donor screening for fecal microbiota transplantation. N Engl J Med 2019;381:2070-2072.
26. Rode AA, Bytzer P, Pedersen OB, Engberg J. Establishing a donor stool bank for faecal microbiota transplantation: methods and feasibility. Eur J Clin Microbiol Infect Dis 2019;38:1837-1847.
27. Food and Drug Administration. Fecal microbiota fortransplantation: safety alert - risk of serious adverse events likely due to transmission of pathogenic organisms. Available from URL: https://www.fda.gov/safety/medical-product-safety-information/fecal-microbiota-transplantation-safety-alert-risk-serious-adverse-events-likely-due-transmission (assessed 14 Dec 2021).
28. Patel NC, Griesbach CL, DiBaise JK, Orenstein R. Fecal microbiota transplant for recurrent Clostridium difficile infection: Mayo clinic in Arizona experience. Mayo Clin Proc 2013;88:799-805.
29. Brandt LJ, Aroniadis OC, Mellow M, et al. Long-term follow-up of colonoscopic fecal microbiota transplant for recurrent Clostridium dif-ficile infection. Am J Gastroenterol 2012;107:1079-1087.
30. van Nood E, Vrieze A, Nieuwdorp M, et al. Duodenal infusion of donor feces for recurrent Clostridium difficile. N Engl J Med 2013;368:407-415.
31. Zainah H, Hassan M, Shiekh-Sroujieh L, Hassan S, Alangaden G, Ramesh M. Intestinal microbiota transplantation, a simple and effective treatment for severe and refractory Clostridium difficile infection. Dig Dis Sci 2015;60:181-185.
32. Aas J, Gessert CE, Bakken JS. Recurrent Clostridium difficile colitis: case series involving 18 patients treated with donor stool administered via a nasogastric tube. Clin Infect Dis 2003;36:580-585.
33. Kassam Z, Lee CH, Yuan Y, Hunt RH. Fecal microbiota transplanta-tion for Clostridium difficile infection: systematic review and meta-analysis. Am J Gastroenterol 2013;108:500-508.
34. Fischer M, Sipe BW, Rogers NA, et al. Faecal microbiota transplanta-tion plus selected use of vancomycin for severe-complicated Clostridium difficile infection: description of a protocol with high success rate. Ali-ment Pharmacol Ther 2015;42:470-476.
35. O’Brien CL, Allison GE, Grimpen F, Pavli P. Impact of colonoscopy bowel preparation on intestinal microbiota. PLoS One 2013;8:e62815.
36. Jalanka J, Salonen A, Salojärvi J, et al. Effects of bowel cleansing on the intestinal microbiota. Gut 2015;64:1562-1568.
37. Tariq R, Hayat M, Pardi D, Khanna S. Predictors of failure after fecal microbiota transplantation for recurrent Clostridioides difficile infection: a systematic review and meta-analysis. Eur J Clin Microbiol Infect Dis 2021;40:1383-1392
38. Agrawal M, Aroniadis OC, Brandt LJ, et al. The long-term efficacy and safety of fecal microbiota transplant for recurrent, severe, and com-plicated Clostridium difficile infection in 146 elderly individuals. J Clin Gastroenterol 2016;50:403-407.
39. Alrabaa S, Jariwala R, Zeitler K, Montero J. Fecal microbiota trans-plantation outcomes in immunocompetent and immunocompromised patients: a single-center experience. Transpl Infect Dis 2017;19:e12726.
40. Kao D, Roach B, Silva M, et al. Effect of oral capsule– vs colonoscopy-delivered fecal microbiota transplantation on recurrent Clostridium dif-ficile infection: a randomized clinical trial. JAMA 2017;318:1985-1993.
41. Gweon TG, Kim J, Lim CH, et al. Fecal microbiota transplantation using upper gastrointestinal tract for the treatment of refractory or severe complicated Clostridium difficile infection in elderly patients in poor medical condition: the first study in an asian country. Gastroenterol Res Pract 2016;2016:2687605.
42. Gough E, Shaikh H, Manges AR. Systematic review of intestinal mi-crobiota transplantation (fecal bacteriotherapy) for recurrent Clostridium difficile infection. Clin Infect Dis 2011;53:994-1002.
43. Ianiro G, Maida M, Burisch J, et al. Efficacy of different faecal mi-crobiota transplantation protocols for Clostridium difficile infection: a systematic review and meta-analysis. United European Gastroenterol J 2018;6:1232-1244.
44. Nicco C, Paule A, Konturek P, Edeas M. From donor to patient: collec-tion, preparation and cryopreservation of fecal samples for fecal micro-biota transplantation. Diseases 2020;8:9.
45. El-Salhy M, Hatlebakk JG, Gilja OH, Kristoffersen AB, Hausken T. Efficacy of faecal microbiota transplantation for patients with irritable bowel syndrome in a randomised, double-blind, placebo-controlled study. Gut 2020;69:859-867.
46. Hamilton MJ, Weingarden AR, Sadowsky MJ, Khoruts A. Standard-ized frozen preparation for transplantation of fecal microbiota for recur-rent Clostridium difficile infection. Am J Gastroenterol 2012;107:761-767.
47. Link A, Lachmund T, Schulz C, Weigt J, Malfertheiner P. Endo-scopic peroral jejunal fecal microbiota transplantation. Dig Liver Dis 2016;48:1336-1339.
48. Kelly CR, Yen EF, Grinspan AM, et al. Fecal microbiota transplantation is highly effective in real-world practice: initial results from the FMT national registry. Gastroenterology 2021;160:183-192, e3.
49. Gweon TG, Na SY. Next generation fecal microbiota transplantation. Clin Endosc 2021;54:152-156.
50. Lee CH, Steiner T, Petrof EO, et al. Frozen vs fresh fecal microbiota transplantation and clinical resolution of diarrhea in patients with recur-rent Clostridium difficile infection: a randomized clinical trial. JAMA 2016;315:142-149.
51. Jiang ZD, Ajami NJ, Petrosino JF, et al. Randomised clinical trial: faecal microbiota transplantation for recurrent Clostridum difficile infection - fresh, or frozen, or lyophilised microbiota from a small pool of healthy donors delivered by colonoscopy. Aliment Pharmacol Ther 2017;45:899-908.
52. Satokari R, Mattila E, Kainulainen V, Arkkila PE. Simple faecal prepa-ration and efficacy of frozen inoculum in faecal microbiota transplanta-tion for recurrent Clostridium difficile infection--an observational cohort study. Aliment Pharmacol Ther 2015;41:46-53.
53. Du C, Luo Y, Walsh S, Grinspan A. Oral fecal microbiota transplant capsules are safe and effective for recurrent Clostridioides difficile infection: a systematic review and meta-analysis. J Clin Gastroenterol 2021;55:300-308.
54. Staley C, Hamilton MJ, Vaughn BP, et al. Successful resolution of recur-

4141
Korean FMT Guidelines
Vol. 28, No. 1 January, 2022 (28-42)
rent Clostridium difficile infection using freeze-dried, encapsulated fecal microbiota; pragmatic cohort study. Am J Gastroenterol 2017;112:940-947.
55. Bajaj JS, Fagan A, Gavis EA, Kassam Z, Sikaroodi M, Gillevet PM. Long-term outcomes of fecal microbiota transplantation in patients with cirrhosis. Gastroenterology 2019;156:1921-1923, e3.
56. Youngster I, Russell GH, Pindar C, Ziv-Baran T, Sauk J, Hohmann EL. Oral, capsulized, frozen fecal microbiota transplantation for relaps-ing Clostridium difficile infection. JAMA 2014;312:1772-1778.
57. Jiang ZD, Jenq RR, Ajami NJ, et al. Safety and preliminary efficacy of orally administered lyophilized fecal microbiota product compared with frozen product given by enema for recurrent Clostridium difficile infec-tion: a randomized clinical trial. PLoS One 2018;13:e0205064.
58. Reigadas E, Bouza E, Olmedo M, et al. Faecal microbiota transplan-tation for recurrent Clostridioides difficile infection: experience with lyophilized oral capsules. J Hosp Infect 2020;105:319-324.
59. Cammarota G, Ianiro G, Gasbarrini A. Fecal microbiota transplantation for the treatment of Clostridium difficile infection: a systematic review. J Clin Gastroenterol 2014;48:693-702.
60. Ramai D, Zakhia K, Fields PJ, et al. Fecal microbiota transplantation (FMT) with colonoscopy is superior to enema and nasogastric tube while comparable to capsule for the treatment of recurrent Clostridioides difficile infection: a systematic review and meta-analysis. Dig Dis Sci 2021;66:369-380.
61. Osman M, O’brien K, Stoltzner Z, et al. Safety and effiacy of fecal microbiota transplantation for recurrent Clostridium difficile infection from an international public stool bank: results from a 2050-patient mul-ticenter cohort. Open Forum Infect Dis 2016;3(suppl 1):2120.
62. Terveer EM, van Beurden YH, van Dorp S, Keller JJ, Kuijper EJ. Is the lower gastrointestinal route really preferred over the upper gas-trointestinal route for fecal microbiota transfer? J Clin Gastroenterol 2016;50:895.
63. Costello SP, Hughes PA, Waters O, et al. Effect of fecal microbiota transplantation on 8-week remission in patients with ulcerative colitis: a randomized clinical trial. JAMA 2019;321:156-164.
64. Youngster I, Sauk J, Pindar C, et al. Fecal microbiota transplant for relapsing Clostridium difficile infection using a frozen inoculum from unrelated donors: a randomized, open-label, controlled pilot study. Clin Infect Dis 2014;58:1515-1522.
65. van Beurden YH, de Groot PF, van Nood E, Nieuwdorp M, Keller JJ, Goorhuis A. Complications, effectiveness, and long term follow-up of fecal microbiota transfer by nasoduodenal tube for treatment of recur-rent Clostridium difficile infection. United European Gastroenterol J 2017;5:868-879.
66. Yang Z, Bu C, Yuan W, et al. Fecal microbiota transplant via endoscopic delivering through small intestine and colon: no difference for crohn’s disease. Dig Dis Sci 2020;65:150-157.
67. Craven L, Rahman A, Nair Parvathy S, et al. Allogenic fecal microbiota transplantation in patients with nonalcoholic fatty liver disease improves abnormal small intestinal permeability: a randomized control trial. Am J Gastroenterol 2020;115:1055-1065.
68. Camacho-Ortiz A, Gutiérrez-Delgado EM, Garcia-Mazcorro JF, et al.
Randomized clinical trial to evaluate the effect of fecal microbiota trans-plant for initial Clostridium difficile infection in intestinal microbiome. PLoS One 2017;12:e0189768.
69. Zipursky JS, Sidorsky TI, Freedman CA, Sidorsky MN, Kirkland KB. Patient attitudes toward the use of fecal microbiota transplantation in the treatment of recurrent Clostridium difficile infection. Clin Infect Dis 2012;55:1652-1658.
70. Kelly CR, Ihunnah C, Fischer M, et al. Fecal microbiota transplant for treatment of Clostridium difficile infection in immunocompromised pa-tients. Am J Gastroenterol 2014;109:1065-1071.
71. Cheng YW, Phelps E, Ganapini V, et al. Fecal microbiota transplanta-tion for the treatment of recurrent and severe Clostridium difficile infec-tion in solid organ transplant recipients: a multicenter experience. Am J Transplant 2019;19:501-511.
72. Webb BJ, Brunner A, Ford CD, Gazdik MA, Petersen FB, Hoda D. Fecal microbiota transplantation for recurrent Clostridium difficile infec-tion in hematopoietic stem cell transplant recipients. Transpl Infect Dis 2016;18:628-633.
73. Shogbesan O, Poudel DR, Victor S, et al. A systematic review of the ef-ficacy and safety of fecal microbiota transplant for Clostridium difficile infection in immunocompromised patients. Can J Gastroenterol Hepatol 2018;2018:1394379.
74. Cheng YW, Alhaffar D, Saha S, et al. Fecal microbiota transplantation is safe and effective in patients with Clostridioides difficile infection and cirrhosis. Clin Gastroenterol Hepatol 2021;19:1627-1634.
75. Friedman-Korn T, Livovsky DM, Maharshak N, et al. Fecal trans-plantation for treatment of Clostridium difficile infection in elderly and debilitated patients. Dig Dis Sci 2018;63:198-203.
76. Baxter M, Ahmad T, Colville A, Sheridan R. Fatal aspiration pneu-monia as a complication of fecal microbiota transplant. Clin Infect Dis 2015;61:136-137.
77. DeFilipp Z, Bloom PP, Torres Soto M, et al. Drug-resistant E. coli bacteremia transmitted by fecal microbiota transplant. N Engl J Med 2019;381:2043-2050.
78. Park SY, Seo GS. Fecal microbiota transplantation: is it safe? Clin En-dosc 2021;54:157-160.
79. Marcella C, Cui B, Kelly CR, Ianiro G, Cammarota G, Zhang F. Sys-tematic review: the global incidence of faecal microbiota transplantation-related adverse events from 2000 to 2020. Aliment Pharmacol Ther 2021;53:33-42.
80. Saha S, Mara K, Pardi DS, Khanna S. Long-term safety of fecal mi-crobiota transplantation for recurrent Clostridioides difficile infection. Gastroenterology 2021;160:1961-1969, e3.
81. Food and Drug Administration. Information pertaining to additional safety protections regarding use of fecal microbiota for transplantation – screening and testing of stool donors for multi-drug resistant organisms. Available from URL: https://www.fda.gov/vaccines-blood-biologics/safety-availability-biologics/information-pertaining-additional-safety-protections-regarding-use-fecal-microbiota-transplantation. (assessed 14 Dec 2021).
82. Petrof EO, Gloor GB, Vanner SJ, et al. Stool substitute transplant thera-py for the eradication of Clostridium difficile infection: ‘RePOOPulating’

42
Tae-Geun Gweon, et al
Journal of Neurogastroenterology and Motility 42
the gut. Microbiome 2013;1:3.83. Ott SJ, Waetzig GH, Rehman A, et al. Efficacy of sterile fecal filtrate
transfer for treating patients with Clostridium difficile infection. Gastro-enterology 2017;152:799-811, e7.
84. Vermeire S, Joossens M, Verbeke K, et al. Donor species richness deter-mines faecal microbiota transplantation success in inflammatory bowel disease. J Crohns Colitis 2016;10:387-394.
85. Suskind DL, Singh N, Nielson H, Wahbeh G. Fecal microbial trans-plant via nasogastric tube for active pediatric ulcerative colitis. J Pediatr Gastroenterol Nutr 2015;60:27-29.
86. Bang BW, Park JS, Kim HK, et al. Fecal microbiota ransplantation for refractory and recurrent Clostridium difficile infection: a case series of nine patients. Korean J Gastroenterol 2017;69:226-231.
87. Wang S, Xu M, Wang W, et al. Systematic review: adverse events of fe-cal microbiota transplantation. PLoS One 2016;11:e0161174.
88. Kastl AJ Jr, Terry NA, Wu GD, Albenberg LG. The structure and function of the human small intestinal microbiota: current understand-ing and future directions. Cell Mol Gastroenterol Hepatol 2020;9:33-45.
89. Perler BK, Chen B, Phelps E, et al. Long-term efficacy and safety of fecal microbiota transplantation for treatment of recurrent Clostridioides difficile infection. J Clin Gastroenterol 2020;54:701-706.
90. Obi O, Hampton D, Anderson T, et al. Fecal microbiota transplant for treatment of resistant C. difficile infection using a standardized protocol: a community hospital experience. Am J Gastroenterol 2014;109(suppl 2):S629.
91. Gundacker ND, Tamhane A, Walker JB, Morrow CD, Rodriguez JM. Comparative effectiveness of faecal microbiota transplant by route of administration. J Hosp Infect 2017;96:349-352.
92. Ianiro G, Masucci L, Quaranta G, et al. Randomised clinical trial: fae-cal microbiota transplantation by colonoscopy plus vancomycin for the treatment of severe refractory Clostridium difficile infection-single versus multiple infusions. Aliment Pharmacol Ther 2018;48:152-159.
93. Gallo A, Cancelli C, Ceron E, et al. Fecal calprotectin and need of mul-tiple microbiota trasplantation infusions in Clostridium difficile infection. J Gastroenterol Hepatol 2020;35:1909-1915.
94. Fischer M, Sipe B, Cheng YW, et al. Fecal microbiota transplant in se-vere and severe-complicated Clostridium difficile: a promising treatment approach. Gut Microbes 2017;8:289-302.
95. Aroniadis OC, Brandt LJ, Greenberg A, et al. Long-term follow-up study of fecal microbiota transplantation for severe and/or complicated Clostridium difficile infection: a multicenter experience. J Clin Gastro-
enterol 2016;50:398-402.96. Khan MA, Sofi AA, Ahmad U, et al. Efficacy and safety of, and patient
satisfaction with, colonoscopic-administered fecal microbiota transplanta-tion in relapsing and refractory community- and hospital-acquired Clos-tridium difficile infection. Can J Gastroenterol Hepatol 2014;28:434-438.
97. Pringle PL, Soto MT, Chung RT, Hohmann E. Patients with cir-rhosis require more fecal microbiota capsules to cure refractory and recurrent Clostridium difficile infections. Clin Gastroenterol Hepatol 2019;17:791-793.
98. Allegretti JR, Fischer M, Sagi SV, et al. Fecal microbiota transplantation capsules with targeted colonic versus gastric delivery in recurrent Clos-tridium difficile infection: a comparative cohort analysis of high and lose dose. Dig Dis Sci 2019;64:1672-1678.
99. Mattila E, Uusitalo-Seppälä R, Wuorela M, et al. Fecal transplantation, through colonoscopy, is effective therapy for recurrent Clostridium dif-ficile infection. Gastroenterology 2012;142:490-496.
100. Hota SS, Sales V, Tomlinson G, et al. Oral vancomycin followed by fecal transplantation versus tapering oral vancomycin treatment for recurrent Clostridium difficile infection: an open-label, randomized controlled trial. Clin Infect Dis 2017;64:265-271.
101. Hirten RP, Grinspan A, Fu SC, et al. Microbial engraftment and ef-ficacy of fecal microbiota transplant for Clostridium difficile in patients with and without inflammatory bowel disease. Inflamm Bowel Dis 2019;25:969-979.
102. Tariq R, Saha S, Solanky D, Pardi DS, Khanna S. Predictors and man-agement of failed fecal microbiota transplantation for recurrent Clostridi-oides difficile infection. J Clin Gastroenterol 2021;55:542-547.
103. Xiao F, Tang M, Zheng X, Liu Y, Li X, Shan H. Evidence for gastro-intestinal infection of SARS-CoV-2. Gastroenterology 2020;158:1831-1833, e3.
104. Wang W, Xu Y, Gao R, et al. Detection of SARS-CoV-2 in different types of clinical specimens. JAMA 2020;323:1843-1844.
105. Ianiro G, Mullish BH, Kelly CR, et al. Reorganisation of faecal mi-crobiota transplant services during the COVID-19 pandemic. Gut 2020;69:1555-1563.
106. Khanna S, Pardi D. Fecal microbiota transplantation for recurrent Clos-tridioides difficile infection: the COVID-19 era. Am J Gastroenterol 2020;115:971-974.
107. Ng SC, Chan FKL, Chan PKS. Screening FMT donors during the COVID-19 pandemic: a protocol for stool SARS-CoV-2 viral quantifi-cation. Lancet Gastroenterol Hepatol 2020;5:642-643.

43 2022 The Korean Society of Neurogastroenterology and Motility
J Neurogastroenterol Motil, Vol. 28 No. 1 January, 2022www.jnmjournal.org
JNMJ Neurogastroenterol Motil, Vol. 28 No. 1 January, 2022pISSN: 2093-0879 eISSN: 2093-0887https://doi.org/10.5056/jnm20138
Original ArticleJournal of Neurogastroenterology and Motility
Received: June 17, 2020 Revised: September 13, 2020 Accepted: November 10, 2020 This is an Open Access article distributed under the terms of the Creative Commons Attribution Non-Commercial License (http://creativecommons. org/licenses/by-nc/4.0) which permits unrestricted non-commercial use, distribution, and reproduction in any medium, provided the original work is properly cited.
*Correspondence: Eikichi Ihara, MD, PhD Department of Gastroenterology and Metabolism, Graduate School of Medical Sciences, Kyushu University, 3-1-1 Maidashi, Higashi-ku, Fukuoka 812-8582, Japan Tel: +81-92-642-5286, Fax: +81-92-642-5287, E-mail: [email protected]
Onigiri Esophagography as a Screening Test for Esophageal Motility Disorders
Shohei Hamada,1 Eikichi Ihara,1,2* Kazumasa Muta,1 Masafumi Wada,1 Yoshitaka Hata,1 Hiroko Ikeda,1 Yoshimasa Tanaka,1 Haruei Ogino,1 Takatoshi Chinen,1 and Yoshihiro Ogawa1
Departments of 1Medicine and Bioregulatory Science and 2Gastroenterology and Metabolism, Graduate School of Medical Sciences, Kyushu University, Maidashi, Higashi-ku, Fukuoka, Japan
Background/AimsNo screening test for esophageal motility disorder (EMD) has been established, the objective of this study is to examine the potential usefulness of our newly developed “Onigiri esophagography” combined with an obstruction level (OL) classification system in screening for EMD.
MethodsA total of 102 patients with suspected EMDs who underwent both high-resolution manometry (HRM) and Onigiri esophagography between April 2017 and January 2019 were examined. The EMD diagnosis was performed based on the Chicago classification version 3.0 by HRM. Onigiri esophagography was performed using a liquid medium (barium sulfate) followed by a solid medium, which consisted of an Onigiri (a Japanese rice ball) with barium powder. The extent of medium obstruction was assessed by the OL classification, which was defined in a stepwise fashion from OL0 (no obstruction) to OL4 (severe obstruction).
ResultsThe patients with OL0 (32.3%), OL1 (50.0%), OL2 (88.0%), OL3 (100.0%), and OL4 (100.0%) were diagnosed EMDs by HRM. The area under the curve, as determined by a receiver operating characteristic analysis, for the OL classification was 0.86. Using the cutoff value of OL1, the sensitivity and specificity were 87.3% and 61.3%, respectively, while using a cutoff value of OL2, the sensitivity and specificity were 73.2% and 90.3%, respectively.
ConclusionIn conclusion, Onigiri esophagography combined with the OL classification system can be used as a screening test for EMDs with a cutoff value of OL1.(J Neurogastroenterol Motil 2022;28:43-52)
Key WordsBarium sulfate; Esophageal motility disorders; Manometry

44
Shohei Hamada, et al
Journal of Neurogastroenterology and Motility 44
Introduction
Meal intake, which is initiated by the swallowing of food, is critical to life. Esophageal motility is responsible for the third phase of swallowing, and major dysfunction of esophageal motil-ity is referred to as esophageal motility disorder (EMD), which is characterized by difficulty in swallowing, chest pain, and reflux symptoms.1 The recent development of high-resolution manometry (HRM), together with the Chicago classification (CC) version 3.0 (v3.0), has allowed us to establish a diagnostic system for EMDs.2
Although it is clear that HRM together with CC v3.0 is the gold standard for the diagnosis of EMDs, it cannot be applied to patients widely or globally in general clinical practice, as HRM systems are costly to install and maintain.3,4 Thus, certain diagnostic tools for screening EMDs are required. It was reported that the conventionally-performed barium esophagography is useful for detecting EMDs by evaluating the extent of esophageal obstruction in relation to fluids.5,6 However, all the EMDs other than the most severe EMD, namely achalasia does not usually cause stagnation of liquid barium. The sensitivity and specificity of esophagography using liquid barium in screening for EMDs were not sufficient.7,8
In this study, we propose a new diagnostic method; “Onigiri esophagography” combined with an obstruction level (OL) clas-sification system as a screening test for EMD. Onigiri is a Japanese rice ball, which, when combined with barium powder, was used as a solid medium for esophagography. The OL classification system is our newly proposed index of liquid and solid obstruction. The objective of this study is to determine the usefulness of Onigiri esophagography combined with the OL classification system in screening for EMDs.
Materials and Methods
Patients and MethodsBoth HRM and Onigiri esophagography were applied to pa-
tients with suspected esophageal motility disorders due to the pres-ence of persistent symptoms, including heartburn, chest pain, chest discomfort, and dysphagia, which were refractory to proton pump inhibitors, despite normal esophagus esophagogastroduodenoscopy results at Kyushu University Hospital. Between April 2017 and January 2019, a total of 106 patients with suspected EMDs were enrolled in this study (Fig. 1A). Four cases with extramural com-pression to a level of ≤ 5 in the short axis of the esophagus were excluded. As a result, 102 patients were analyzed in this study. The Eckardt score9 was obtained for each patient using a questionnaire. This research complied with the guidelines for human studies and should include evidence that the research was conducted ethically in accordance with the World Medical Association Declaration of Helsinki. The subjects in this study gave their written informed consent and this study protocol was approved by Kyushu University Hospital’s committee on human research (29-35).
The Onigiri Esophagography ProtocolOnigiri esophagography was performed and the OL classifica-
tion was defined as follows, with the procedures performed without the use of any antispasmodic agents. The evaluation of passage through the esophagus was defined as complete esophageal empty-ing within 10 seconds after swallowing. The patients were asked to swallow 10 mL of barium sulfate (100 w/v%; Barytester A240; FUSHIMI Pharmaceutical Co, Kagawa, Japan) in an upright position. Esophagography was performed in the right anterior and posterior oblique view to visualize the passage of medium using a fluoroscope (DREX-ULT80/07; Toshiba, Tokyo, Japan). When liquid barium sulfate remained in the esophagus, forming the air
Esophageal symptom
(EGD normal)
n = 106
Extramural compression
n = 4
n = 102
Barium esophagography
Onigiri esophagography
+
High-resolusion manometry
A B
Figure 1. A flow chart of this study (A) and a 10 g Onigiri with barium powder (B). Barium powder was attached exclu-sively to the surface of the Onigiri. The bar indicates 2 cm. EGD, esophagogas-troduodenoscopy.

4545
Onigiri Esophagography for Esophageal Motility Disorders
Vol. 28, No. 1 January, 2022 (43-52)
fluid level, the condition was defined as OL4 (Fig. 2B). When the successful passage of barium medium was obtained (Fig. 2A), the patient underwent the next procedure using the solid contents of an Onigiri with barium powder. The patient was asked to chew a 10-g Onigiri with barium powder 15 times (Fig. 1B) and then swallow. When solid contents passed successfully into the stomach without any further action, it was defined as OL0 (Fig. 2C). When the solid contents remained in the esophagus, the patient was asked to first perform a dry swallow several times and, if required, to swallow 10 mL of barium. OL1 was defined as successful passage of the remaining solid contents obtained by the dry swallow (Fig. 2D), and OL2 was defined as successful passage obtained by swallowing 10 mL of liquid barium (Fig. 2E). Finally, OL3 was defined by the solid contents remaining in the esophagus after the swallowing of 10 mL of liquid barium (Fig. 2F). The abovementioned procedure
was decided by the agreement of 3 gastrointestinal (GI) experts. If their opinions differed, it was decided through discussion, and it was repeated 3 times to determine the final OL level of the patient to be more frequent results. If the final OL level was not deter-mined within 3 evaluations, further evaluations were added until the final OL level was determined (Fig. 3A).
The Onigiri Esophagography Video TestThe inter-observer agreement of Onigiri esophagography
among the examinees was determined by calculating Fleiss’ kappa coefficient (described later) using an Onigiri esophagography video test, which was created from videos of the cases enrolled in this study. Six examinees, including 3 GI experts who were Onigiri esophagography examiners and 3 GI trainees who had never been involved in Onigiri esophagography were enrolled. The Onigiri
Figure 2. Onigiri esophagography combined with the obstruction level (OL) classification system. (A, B) A representative esophagography series with 10 mL of liquid barium for OL0, 1, 2, and 3 (A) and for OL4 (B) is shown. White arrow indicates the upper level of the swallowed liquid barium. (C-F) A representative Onigiri esophagography series for OL0 (C), OL1 (D), OL2 (E), and OL3 (F) is shown. White arrows indicate the upper level of swallowed barium with an Onigiri. Black arrows indicate the lower level of swallowed barium with an Onigiri.
AA BB
CC DD
EE FF
Barium
Barium
Onigiri
Onigiri
Dryswallow
Bariumswallow
Bariumswallow
Onigiri
Onigiri

46
Shohei Hamada, et al
Journal of Neurogastroenterology and Motility 46
esophagography video test consisted of 4 patterns of video clips (n = 40), which were necessary and sufficient to determine each ob-struction level, including (1) swallowing 10 mL of liquid barium (n = 10), (2) swallowing 10 g of Onigiri (n = 10), (3) additional dry swallowing of the remaining Onigiri (n = 10), and (4) swallowing of an additional 10 mL of liquid barium (n = 10) for the remain-ing Onigiri. The examinees were asked to judge if liquid barium or Onigiri successfully passed through the esophagus.
The High-resolution Manometry ProtocolThe esophageal motility function was assessed by HRM using
a Manoscan Z (Given Imaging, Los Angeles, CA, USA). HRM was performed using a standardized protocol. In brief, the patients were asked to perform 10 swallows of 5 mL of water in the supine position.2 After the recording the basal condition without any swal-lows, the subjects were instructed to swallow as infrequently as pos-sible and to breathe quietly and regularly. HRM data based on 10 swallows were analyzed using ManoView ESO 3.0 (Given Imag-
ing). The HRM diagnosis was performed based on the CC v3.0.2 The parameters of HRM are shown as the mean of 10 swallows.
Statistical MethodsAll statistical analyses were performed using the JMP Pro
14.2.0 software program (SAS Institute, Cary, NC, USA). The data were expressed as the median (interquartile range). Pearson’s chi-squared test was used to analyze the categorical data, while Mann-Whitney’s U test was used to analyze the continuous and ordinal data. The relationship between different pairs was assessed using Spearman’s rank correlation. Receiver operating characteristic (ROC) analyses were conducted to identify a more accurate cutoff point that could help identify the probability of EMD. ROC curves were created by plotting the range of sensitivity and specificity pairs for each participant’s EMD rate. A global assessment of the perfor-mance of the test was given performed based on the area under the ROC curve. Fleiss’ kappa coefficient was calculated in the inter-observer reliability test. The kappa value was expressed as κ (95%
Figure 3. Onigiri esophagography combined with the obstruction level (OL) classification system as a screening test for esophageal motility dis-orders. (A) A flow chart of Onigiri esophagography to determine the OL classification score. (B) The proportion of esophageal motility disorders (EMDs) in each OL classification. (C) The receiver operating characteristic analyses for the OL classification. AUC, area under the curve.
B C
0.2 0.4 0.6 0.8 1.0
1.0
0.8
0.6
0.4
0.2
Se
nsit
ivit
y
1-Specificity
AUC = 0.86
(0.0968, 0.732)
(0.387, 0.873)
OL2
OL1
0OL0
(n = 28)
OL1
(n = 19)
OL2
(n = 25)
OL3
(n = 12)
OL4
(n = 18)
100
80
60
40
20
Th
ep
erc
en
tag
eo
f
no
rma
la
nd
EM
D(%
)
Obstruction level classification
0
EMD
33.3%EMD
52.6%
EMD
88.0% EMD
100.0%
Normal
66.7%
EMD
100.0%
Normal
47.4%
Normal
12.0%
A Swallow 5 mL barium
Transit failure
Swallow 10 g Onigiri
Transit failure
No
Adding swallowings Adding 10 mL barium
OL0
OL3
OL4
No
YesTransit failure
OL1
No
YesTransit failure
OL2
No
Yes
Yes

4747
Onigiri Esophagography for Esophageal Motility Disorders
Vol. 28, No. 1 January, 2022 (43-52)
confidence interval), which was interpreted using the Landis’s scale (values of 0.00-0.20 represent poor agreement, 0.21-0.40 represent slight agreement, 0.41-0.60 represent moderate agreement, 0.60-0.80 represent substantial agreement, and 0.81-1.00 represent almost perfect agreement).10 P-values of < 0.05 were considered to indicate statistical significance.
Results
Clinical Characteristics of the Patients Enrolled in This Study
The clinical characteristics of the patients enrolled in this study are shown in Table. The median age, body mass index, and Eckardt score were 61 (51.0-72.3) years, 21.8 (19.3-24.6) kg/m2, and 3 (2-5), respectively. The study population included 55 females and 47 males. Based on CC v3.0, the HRM studies indicated the follow-ing findings in the total study population of 102 patients: those with achalasia (n = 15; type I/type II/type III: 1/11/3), esophagogastric junction outflow obstruction (EGJOO; n = 22), absent contractil-ity (n = 11), distal esophageal spasm (DES; n = 2), jackhammer esophagus (n = 6), ineffective esophageal motility (IEM; n = 13), fragmented peristalsis (n = 2), and normal HRM study results (n = 31). No adverse events occurred in the 2 tests in this study.
The Proportion of Esophageal Motility Disorder Diagnosis in Patients With Each Obstruction Level Value
According to the results of Onigiri esophagography, the 102 patients were classified as follows OL0, n = 28; OL1, n = 19; OL2, n = 25; OL3, n = 12; and OL4, n = 18. The patients with OL0 (32.3%), OL1 (50.0%), OL2 (87.0%), OL3 (100.0%), and OL4 (100.0%) were diagnosed with EMDs by the HRM studies; that is, all the HRM diagnosis other than normal HRM study (Fig. 3B). The area under the curve, as determined by a ROC analysis, for the OL classification was 0.86. Using the cutoff value of OL1, the sensitivity and specificity were 87.3% and 61.3% while positive and negative predictive values were 83.8% and 67.9%, respectively. Using the cut off value of OL2, the sensitivity and specificity were 73.2% and 90.3% while positive and negative predictive values were 94.5% and 60.9%, respectively (Fig. 3C). The Eckardt scores for OL0, OL1, OL2, OL3, and OL4 were 2.0 (1.0-4.0), 3.0 (2.0-5.0), 3.0 (2.0-4.5), 3.0 (2.0-5.5), and 5.0 (2.0-7.3), respectively.
The Obstruction Level Value of the Obstruction Level Classification Correlated With the Eckardt Score and Each High-resolution Manometry Metrics
The Eckardt scores for OL0, OL1, OL2, OL3, and OL4 were 2.0 (1.0-4.0), 3.0 (2.0-5.0), 3.0 (2.0-4.5), 3.0 (2.0-5.5), and 5.0 (2.0-7.3), respectively. There was a significant positive correla-tion between the OL value of the OL classification and the Eckardt score (Spearman ρ = 0.24, P < 0.05) (Fig. 4A). As for HRM metrics, there was a significant positive correlation between the OL value of the OL classification and the integrated relaxation pressure (Spearman ρ = 0.35, P < 0.01) (Fig. 4B). In contrast, there was a negative correlation between the OL value of the OL classifica-tion and distal contractile integral (n = 91, Spearman ρ = −0.40, P < 0.01; Fig. 4C); patients with type 2 achalasia (n = 11) were excluded from this analysis since distal contractile integral could not be assessed in these patients. Furthermore, there was also a nega-tive correlation between the OL value of the OL classification and distal latency (n = 78, Spearman ρ = −0.30, P < 0.01; Fig. 4D); patients with type I achalasia (n = 1), type II achalasia (n = 11), or absent contractility (n = 11) were excluded from this analysis since distal latency could not be assessed in these patients.
Table. Summary of the 102 Patients Who Underwent High-resolu-tion Manometry
Clinical characteristics Median (IQR) or n
Age (yr) 61.0 (51.0-72.3)Sex (female/male) 55/47Body mass index (kg/m2) 21.8 (19.3-24.6)Eckardt score 3 (2-5)HRM diagnosis Type I achalasia 1 Type II achalasia 11 Type III achalasia 3 EGJ outflow obstruction 22 Absent contractility 11 Distal esophageal spasm 2 Jackhammer esophagus 6 Ineffective esophageal motility 13 Fragmented peristalsis 2 Normal 31
IQR, interquartile range; HRM, high-resolution manometry; EGJ, esopha-gogastric junction.

48
Shohei Hamada, et al
Journal of Neurogastroenterology and Motility 48
OL0 OL1 OL2 OL3 OL4
15
10
5Ec
ka
rdt
sc
ore
OL classification
Spearman = 0.24, < 0.05P
0
A B
C D
OL0 OL1 OL2 OL3 OL4
70
60
50
40
30
20
10
IRP
(mm
Hg
)
OL classification
0
Spearman = 0.35, < 0.01P
OL0 OL1 OL2 OL3 OL4
8000
6000
4000
2000DC
I(m
mH
gse
cc
m)
OL classification
Spearman = 0.40, < 0.01P
0OL0 OL1 OL2 OL3 OL4
20
15
10
5
DL
(se
c)
OL classification
0
Spearman = 0.30, < 0.01P
Figure 4. Correlations between the obstruction level (OL) value of the OL classification and Eckardt score/each high-resolution manometry (HRM) metrics. (A) A correlation between the OL value of the OL classification and the Eckardt score. (B-D) Correlations between the OL value of the OL classification and the HRM metrics including integrated relaxation pressure (IRP) (B), DCI (distal contractile integral) (C), and DL (distal latency) (D).
Normal
(n = 31)
100
80
60
40
20
OL
cla
ssif
ica
tio
n(%
)
0Jackhammer
(n = 6)
EGJOO
(n = 22)
IEM
(n = 13)
Absent C.
(n = 11)
Achalasia
(n = 15)
OL4
OL3
OL2
OL1
OL0
9.7%
29.0%
61.3%
16.7%
33.3%
4.6%
22.7%
31.8%
18.2%
22.7%
7.7%
15.4%
53.9%
15.4%
7.7%
27.3%
36.4%
9.1%
86.7%
6.7%
33.3%
16.7%
6.7%
27.3%
Figure 5. The proportion of obstruc-tion level (OL) classification scores in each esophageal motility disorder. EG-JOO, esophagogastric junction outflow obstruction; IEM, ineffective motility; Absent C., absent contractility.

4949
Onigiri Esophagography for Esophageal Motility Disorders
Vol. 28, No. 1 January, 2022 (43-52)
The Proportion of Obstruction Level Classifications in Patients With Each High-resolution Manometry Diagnosis
Next, we examined the proportion of OL classification in each HRM diagnosis (Fig. 5). Thirty-one patients with a normal HRM study were classified as follows: OL0 (n = 19 [61.3%]), OL1 (n = 9 [29.0%]), OL2 (n = 3 [9.7%]), OL3 (n = 0 [0.0%]), and OL4 (n = 0 [0.0%]). Six patients with jackham-mer esophagus were classified as follows: OL0 (n = 2 [33.3%]), OL1 (n = 2 [33.3%]), OL2 (n = 1 [16.7%]), OL3 (n = 1 [16.7%]), and OL4 (n = 0 [0.0%]). Twenty-two patients with EGJOO were classified as follows OL0 (n = 5 [22.7%]), OL1 (n = 4 [18.2%]), OL2 (n = 7 [31.8%]), OL3 (n = 5 [22.7%]), and OL4 (n = 1 [4.6%]). Thirteen patients with IEM were clas-sified as follows: OL0 (n = 1 [7.7%]), OL1 (n = 2 [15.4%]), OL2 (n = 7 [53.9%]), OL3 (n = 2 [15.4%]), and OL4 (n = 1 [7.7%]). Eleven patients with absent contractility were classified as follows: OL0 (n = 1 [9.1%]), OL1 (n = 0 [0.0%]), OL2 (n = 4 [36.4%]), OL3 (n = 3 [27.3%]), and OL4 (n = 3 [27.3%]). Finally, fifteen patients with achalasia were classified as follows; OL0 (n = 0 [0.0%]), OL1 (n = 1 [6.7%]), OL2 (n = 1 [6.7%]), OL3 (n = 0 [0.0%]), and OL4 (n = 13 [86.7%]), where both patients with OL1 and OL2 were diagnosed with type III acha-lasia. Although the number of the patients with DES (n = 2) and fragmented peristalsis (n = 2) was small, DES and fragmented peristalsis both included 1 patient each with OL2 and OL3.
Results of the Onigiri Esophagography Video TestSubstantial agreement (κ = 0.77, 0.73-0.81) was obtained in
a total of 6 examinees, where the κ values for the 3 GI experts and 3 GI trainees were 0.87 (0.77-0.96, almost perfect agreement) and 0.77 (0.67-0.86, substantial agreement), respectively.
At least 1 examinee made a different judgment from the oth-ers in 10 of 40 video clips, which included (1) swallowing 5 mL of liquid barium (n = 6), (2) swallowing 10 g of Onigiri (n = 0), (3) additional dry swallowing of the remaining Onigiri (n = 2), and (4) swallowing an additional 10 mL of liquid barium for the remain-ing Onigiri (n = 2). This means that complete agreement could be obtained in the remaining 30 video clips.
Discussion
EMDs have a significant impact on society, since they reduce not only quality of life and social labor productivity due to difficulty
in swallowing, chest pain and reflux symptoms,1,11-13 but can also lead to life-threatening diseases, such as aspiration pneumonia.14 It has been considerably difficult to detect and diagnose EMDs due to the functional nature of these diseases.15 More recently, however, based on HRM with CC v3.0, there have been major develop-ments in the medical practice for EMDs. The major EMDs are classified into achalasia, EGJOO, DES, jackhammer esophagus, and absent contractility, among which EGJOO is a newly estab-lished concept of disorder defined as impaired lower esophageal sphincter (LES) relaxation with intact esophageal body peristalsis, while achalasia is characterized by both impaired LES relaxation and esophageal body peristalsis.2,16 In addition to the major EMDs, IEM and fragmented peristalsis are defined as minor EMDs, and their real clinical significance and appropriate managements are still under investigation.17,18 Despite the drastic development in diag-nostic methods for EMD, in community healthcare, the medical practice in relation to EMDs is still challenging, since HRM is not usually available at local medical institutions. Thus, development of simple screening tests for EMDs is required to facilitate the referral of patients with suspected EMDs to specialists. For this purpose, we have proposed Onigiri esophagography combined with the OL classification system as a screening test for EMDs. There have been several studies to evaluate EMDs using solid meals, however, most of these were conducted in combination with HRM; they were rarely conducted with esophagography. It has been shown that the diagnostic sensitivity of HRM using a solid meal for EMDs was high, compared to HRM using a liquid meal,19-21 indicating that esophageal motility dysfunction was evoked by a solid meal more frequently than by a liquid meal. These findings support the valid-ity of Onigiri esophagography in the present study. As a result, in this study, we demonstrated that Onigiri esophagography combined with the OL classification system was a highly sensitive test with a cutoff value of OL1 and a highly specific test with a cutoff value of OL2. Importantly, the OL classification score of Onigiri esopha-gography was positively associated with esophageal symptoms.
One previous study examined the usefulness of liquid barium esophagography as a screening test for EMDs in comparison to HRM.7 The sensitivity and specificity of barium esophagography in the detection of EMDs was 69.0% and 50.0%, respectively, which was low.7 They concluded that barium esophagography was useful in the assessment of anatomic abnormalities but is a poor screening examination for the detection of EMDs. Another study which only recruited patients with achalasia reported that the sen-sitivity of barium esophagography in the diagnosis of achalasia was 78.3%, which was still not enough.6 We have thought of the pos-

50
Shohei Hamada, et al
Journal of Neurogastroenterology and Motility 50
sible usefulness of a solid meal, specifically the Onigiri. Recently, a number of studies have been carried out to examine the useful-ness of HRM using solid meals rather than a liquid medium, and the Onigiri has been shown to be one of the best candidate solid mediums.22-26 It seems that the viscosity and shape of the Onigiri is appropriate for examining the esophageal motility function. Fur-thermore, one advantage of using an Onigiri—which remains to be addressed—is that the viscosity and shape of the Onigiri can be adjusted by adding a certain amount of barium liquid. As a result, in comparison to previous studies using liquid barium esophagog-raphy, Onigiri esophagography with the OL classification system could achieve high sensitivity (87.3%) with a cutoff value of OL1, and high specificity (90.3%) with a cutoff value of OL2. There-fore, Onigiri esophagography with the OL classification system and a cutoff value of OL1 can be used as a screening test to detect EMDs in local medical institutions.
It is important to pursue the possibility of further improving the sensitivity of Onigiri esophagography with the OL classifica-tion system. One factor that reduced the sensitivity for OL1 in this study was that 33.3% of the patents with OL0 and 52.6% of the patients with OL1 still had EMDs. The esophageal motility func-tion consists of 2 major mechanisms: esophageal body peristalsis, which is responsible for esophageal clearance, and basal LES con-traction with transient relaxation during the swallowing action.27 Among the EMDs based on CC v3.0, esophageal body peristalsis is retained in patients with EGJOO and is also retained in most patients with jackhammer esophagus. Indeed, 40.9% of the patients with EGJOO and 66.6% of those with jackhammer esophagus ex-hibited OL0 or OL1 (Fig. 5). Therefore, Onigiri esophagography combined with the OL classification system is more suitable for the detection of disorders with impaired esophageal body clearance, in-cluding achalasia, absent contractility, and ineffective motility, as op-posed to those with intact esophageal body peristalsis, such as EG-JOO and jackhammer esophagus. High OL scores in IEM and absent contractility indicate that normal esophageal body peristalsis plays a role in transporting ingested solid food to the esophagus. Al-though the sensitivity of Onigiri esophagography may be improved by incorporating the time of esophageal clearance into this system, we did not adopt this parameter in the present study. In the present study, we focused on simplifying the diagnostic method as much as possible, to make it suitable for non-GI specialist doctors to judge. In contrast, the reduction in specificity may be partly because 47.4% of the patients with OL1 and 12.0% of the patients with OL2 had normal HRM results. Considering that the OL classification score of Onigiri esophagography was positively associated with esopha-
geal symptoms, it may be necessary to adjust the diagnostic criteria for a normal HRM study.
It has been reported that the specific X-ray findings of liquid barium esophagography, such as corkscrew appearance, beaklike narrowing of the distal esophagus, and failed peristalsis contributed to the detection of EMDs.28,29 We adopted Onigiri esophagography with OL classification from a viewpoint that it is a method that can be widely used by non-specialists to screen for EMDs at local medi-cal institutions. Indeed, substantial agreement (κ = 0.77, 0.73-0.81) was obtained among a total of 6 examinees including not only GI experts but also GI trainees. In this study, judgement of the success-ful passage in video clips with liquid barium showing “swallowing 5 mL of liquid barium” was low in comparison to that in video clips with Onigiri, which showed “swallowing 10 g of Onigiri,” “addi-tional dry swallowing of the remaining Onigiri,” and “swallowing an additional 10 mL of liquid barium for the remaining Onigiri.” This may be due to the fact that Onigiri migrated in a cluster while liquid barium tended to be dispersed in the esophagus. Solid Onigiri could contribute to an increase in inter-observer agreement in comparison to liquid barium. A further multicenter prospective study is required to determine whether Onigiri esophagography is useful for the detection of EMDs in other medical institutions.
This study was associated with several limitations. First, it was performed in a single center. Second, patients in whom EMD was suspected based on symptoms were enrolled in this study, while normal subjects without symptoms were not recruited. Third, we could not conduct a sub-analysis to compare the efficacy of Onigiri esophagography to that of liquid esophagography, since liquid barium esophagography was performed as a part of the Onigiri esophagography. Thus, liquid barium esophagography could not be performed independently of Onigiri esophagography. It would be desirable to conduct a multicenter prospective randomized com-parative study in the near future.
In conclusion, Onigiri esophagography combined with the OL classification system can be used as a screening test for EMD with a cutoff value of OL1. The patients with positive results could be referred to specialists to make a definite diagnosis of EMDs using HRM.
Financial support: This study was supported in part by the Ja-pan Society for the Promotion of Science KAKENHI (17K09351) and by Smoking Research Foundation (2017G026).
Conflicts of interest: Eikichi Ihara participates in the funded research of Takeda Pharmaceutical Co, Ltd and belongs to an endowed course supported by the companies including Ono Phar-

5151
Onigiri Esophagography for Esophageal Motility Disorders
Vol. 28, No. 1 January, 2022 (43-52)
maceutical Co, Ltd, Miyarisan Pharmaceutical Co, Ltd, Sanwa Kagaku Kenkyusho Co, Ltd, Otsuka Pharmaceutical Factory, Inc, Fujifilm Medical Co, Ltd, Terumo Corporation, Fancl Corpora-tion, and Ohga Pharmacy. The authors declare no other conflicts of interest in association with this study.
Author contributions: Shohei Hamada, Kazumasa Muta, and Eikichi Ihara designed this study; Shohei Hamada, Kazumasa Muta, Masafumi Wada, and Hiroko Ikeda performed HRM; Yoshitaka Hata and Yoshimasa Tanaka performed EGD; Shohei Hamada and Masafumi Wada collected the data and performed the statistical analysis; Haruei Ogino, Takatoshi Chinen, and Yoshi-hiro Ogawa provided the technical and material supports; Shohei Hamada and Eikichi Ihara mainly wrote the manuscript; and Takatoshi Chinen and Yoshihiro Ogawa supervised this study.
References
1. Katz PO, Dalton CB, Richter JE, Wu WC, Castell DO. Esopha-geal testing of patients with noncardiac chest pain or dysphagia. Re-sults of three years’ experience with 1161 patients. Ann Intern Med 1987;106:593-597.
2. Kahrilas PJ, Bredenoord AJ, Fox M, et al. The Chicago classifica-tion of esophageal motility disorders, v3.0. Neurogastroenterol Motil 2015;27:160-174.
3. Carroll TL, Werner A, Nahikian K, Dezube A, Roth DF. Rethinking the laryngopharyngeal reflux treatment algorithm: evaluating an alternate empiric dosing regimen and considering up-front, pH-impedance, and manometry testing to minimize cost in treating suspect laryngopharyngeal reflux disease. Laryngoscope 2017;127(suppl 6):S1-S13.
4. Kraft C, Kathpalia P, Baumgardner JM, Pandolfino JE, Sewell JL. How to incorporate esophageal manometry teaching in your fellowship pro-gram. Gastroenterology 2019;156:2120-2123.
5. de Oliveira JM, Birgisson S, Doinoff C, et al. Timed barium swallow: a simple technique for evaluating esophageal emptying in patients with achalasia. AJR Am J Roentgenol 1997;169:473-479.
6. Yamasaki T, Tomita T, Mori S, et al. Esophagography in patients with esophageal achalasia diagnosed with high-resolution esophageal manom-etry. J Neurogastroenterol Motil 2018;24:403-409.
7. O’Rourke AK, Lazar A, Murphy B, Castell DO, Martin-Harris B. Utility of esophagram versus high-resolution manometry in the detection of esophageal dysmotility. Otolaryngol Head Neck Surg 2016;154:888-891.
8. Schima W, Stacher G, Pokieser P, et al. Esophageal motor disorders: videofluoroscopic and manometric evaluation--prospective study in 88 symptomatic patients. Radiology 1992;185:487-491.
9. Eckardt VF, Aignherr C, Bernhard G. Predictors of outcome in pa-tients with achalasia treated by pneumatic dilation. Gastroenterology 1992;103:1732-1738.
10. Landis JR, Koch GG. The measurement of observer agreement for cat-egorical data. Biometrics 1977;33:159-174.
11. Schlottmann F, Neto RML, Herbella FAM, Patti MG. Esophageal achalasia: pathophysiology, clinical presentation, and diagnostic evalua-tion. Am Surg 2018;84:467-472.
12. van Hoeij FB, Ponds FA, Smout AJ, Bredenoord AJ. Incidence and costs of achalasia in The Netherlands. Neurogastroenterol Motil 2018;30:e13195.
13. Hamada S, Ihara E, Ikeda H, et al. Clinical characterization of vonopra-zan-refractory gastroesophageal reflux disease. Digestion 2021;102:197-204.
14. Gallegos C, Brito-de la Fuente E, Clavé P, Costa A, Assegehegn G. Nutritional aspects of dysphagia management. Adv Food Nutr Res 2017;81:271-318.
15. Frieling T. Non-cardiac chest pain. Visc Med 2018;34:92-96.16. Muta K, Ihara E, Fukaura K, Tsuchida O, Ochiai T, Nakamura K. Ef-
fects of acotiamide on the esophageal motility function in patients with esophageal motility disorders: a pilot study. Digestion 2016;94:9-16.
17. Schlottmann F, Herbella FA, Patti MG. Understanding the Chicago classification: from tracings to patients. J Neurogastroenterol Motil 2017;23:487-494.
18. Balko RA, Codipilly DC, Ravi K. Minor esophageal functional disor-ders: are they relevant? Curr Treat Options Gastroenterol 2020;18:82-96.
19. Sweis R, Anggiansah A, Wong T, Brady G, Fox M. Assessment of esophageal dysfunction and symptoms during and after a standard-ized test meal: development and clinical validation of a new methodol-ogy utilizing high-resolution manometry. Neurogastroenterol Motil 2014;26:215-228.
20. Ang D, Misselwitz B, Hollenstein M, et al. Diagnostic yield of high-resolution manometry with a solid test meal for clinically relevant, symp-tomatic oesophageal motility disorders: serial diagnostic study. Lancet Gastroenterol Hepatol 2017;2:654-661.
21. Xiang XL, Wang A, Tu L, et al. The motility of esophageal sphincters during liquid and solid bolus swallows: a multicenter normative value study of high-resolution manometry in China. Neurogastroenterol Motil 2017;29:e12914.
22. Hasan Y, Go J, Hashmi SM, Valestin J, Schey R. Influence of every-day bolus consistencies in different body positions on high-resolution esophageal pressure topography (HREPT) parameters. Dis Esophagus 2015;28:246-252.
23. Hollenstein M, Thwaites P, Bütikofer S, et al. Pharyngeal swallowing and oesophageal motility during a solid meal test: a prospective study in healthy volunteers and patients with major motility disorders. Lancet Gastroenterol Hepatol 2017;2:644-653.
24. Sweis R, Anggiansah A, Wong T, Kaufman E, Obrecht S, Fox M. Normative values and inter-observer agreement for liquid and solid bolus swallows in upright and supine positions as assessed by esophageal high-resolution manometry. Neurogastroenterol Motil 2011;23:509-e198.
25. Wang YT, Tai LF, Yazaki E, et al. Investigation of dysphagia after anti-reflux surgery by high-resolution manometry: impact of multiple water swallows and a solid test meal on diagnosis, management, and clinical outcome. Clin Gastroenterol Hepatol 2015;13:1575-1583.
52
Shohei Hamada, et al
Journal of Neurogastroenterology and Motility 52
26. Carlson DA, Roman S. Esophageal provocation tests: are they useful to improve diagnostic yield of high resolution manometry? Neurogastroen-terol Motil 2018;30:e13321.
27. Goyal RK, Chaudhury A. Physiology of normal esophageal motility. J Clin Gastroenterol 2008;42:610-619.
28. Fonseca EK, Yamauchi FI, Tridente CF, Baroni RH. Corkscrew esopha-
gus. Abdom Radiol (NY) 2017;42:985-986.29. Prabhakar A, Levine MS, Rubesin S, Laufer I, Katzka D. Relation-
ship between diffuse esophageal spasm and lower esophageal sphincter dysfunction on barium studies and manometry in 14 patients. AJR Am J Roentgenol 2004;183:409-413.

53 2022 The Korean Society of Neurogastroenterology and Motility
J Neurogastroenterol Motil, Vol. 28 No. 1 January, 2022www.jnmjournal.org
JNMJ Neurogastroenterol Motil, Vol. 28 No. 1 January, 2022pISSN: 2093-0879 eISSN: 2093-0887https://doi.org/10.5056/jnm20190
Original ArticleJournal of Neurogastroenterology and Motility
Received: August 21, 2020 Revised: October 14, 2020 Accepted: October 24, 2020 This is an Open Access article distributed under the terms of the Creative Commons Attribution Non-Commercial License (http://creativecommons. org/licenses/by-nc/4.0) which permits unrestricted non-commercial use, distribution, and reproduction in any medium, provided the original work is properly cited.
*Correspondence: Katsunori Iijima, MD, PhD Department of Gastroenterology, Akita University Graduate School of Medicine, 1-1-1 Hondo, Akita 010-8543, Akita, Japan Tel: +81-18-884-6573, Fax: +81-18-801-7501, E-mail: [email protected]
Efficacy of Acotiamide on Postprandial Distress Syndrome and Epigastric Pain Syndrome Depending on the Estimated Gastric Acid Secretion Level
Toshiaki Suzuki,1 Reina Ohba,1 Ei Kataoka,2 Yui Kudo,3 Akira Zeniya,4 Daisuke Segawa,5 Keisuke Oikawa,6 Masaru Odashima,7 Taiji Saga,8 Tomoyuki Kuramitsu,9 Hideaki Sasahara,10 Kazuo Yoneyama,11 Takashi Tomita,12 Yosuke Shimodaira,1 and Katsunori Iijima1*1Department of Gastroenterology, Akita University Graduate School of Medicine, Akita, Japan; 2Kataoka Internal Medicine Clinic, Akita, Japan; 3Kudo Gastroenterology Clinic, Akita, Japan; 4Zeniya Clinic, Akita, Japan; 5Segawa Clinic, Noshiro, Japan; 6Oikawa Clinic, Akita, Japan; 7Odashima Masaru Clinic, Yokote, Japan; 8Matsugasaki Clinic, Akita, Japan; 9Kuramitsu Clinic, Akita, Japan; 10Sasahara Internal Medicine Clinic, Akita, Japan; 11Yoneyama Gastroenterology Clinic, Akita, Japan; and 12Tomita Gastroenterology Clinic, Akita, Japan
Background/AimsGastric acid secretion is suspected to be a pivotal contributor to the pathogenesis of functional dyspepsia. The present study investigates the potential association of the gastric acid secretion estimated by measuring serum pepsinogen with therapeutic responsiveness to the prokinetic drug acotiamide.
MethodsDyspeptic patients consulting participating clinics from October 2017 to March 2019 were prospectively enrolled in the study. The dyspeptic symptoms were classified into postprandial distress syndrome (PDS) and epigastric pain syndrome (EPS). Gastric acid secretion levels were estimated by the Helicobacter pylori infection status and serum pepsinogen using established criteria and classified into hypo-, normo-, and hyper-secretion. Each patient was then administered 100 mg acotiamide thrice daily for 4 weeks, and the response rate to the treatment was evaluated using the overall treatment efficacy scale.
ResultsOf the 86 enrolled patients, 56 (65.1%) and 26 (30.2%) were classified into PDS and EPS, respectively. The estimated gastric acid secretion was not significantly different between PDS and EPS. The response rates were 66.0% for PDS and 73.1% for EPS, showing no significant difference. While the response rates were stable, ranging from 61.0% to 75.0% regardless of the estimated gastric acid secretion level among subjects with PDF, the rates were significantly lower in hyper-secretors than in non-hyper-secretors among subjects with EPS (42.0% vs 83.0%, P = 0.046).
ConclusionAlthough acotiamide is effective for treating EPS as well as PDS overall, the efficacy is somewhat limited in EPS with gastric acid hyper-secretion, with gastric acid suppressants, such as proton pump inhibitors, being more suitable.(J Neurogastroenterol Motil 2022;28:53-61)
Key WordsAcotiamide; Epigastric pain syndrome; Gastric acid secretion; Serum pepsinogen; Postprandial distress syndrome

54
Toshiaki Suzuki, et al
Journal of Neurogastroenterology and Motility 54
Introduction
Functional dyspepsia (FD) is defined as a condition chroni-cally presenting with upper abdominal symptoms in the absence of any organic disease that is likely to explain the symptoms, and a wide variety of factors is assumed to be involved in its pathophysi-ology.1 Based on the Rome IV,2 FD is sub-classified into 2 major subtypes: postprandial distress syndrome (PDS) and epigastric pain syndrome (EPS). PDS is characterized by postprandial full-ness and early satiety induced by ingestion of a meal, while EPS is characterized by epigastric pain and burning that occur during fast-ing. However, while a few studies have successfully demonstrated differences in the pathophysiology between the 2 subtypes of FD,3,4
others have failed to detect any marked differences.5-7 At present, gastric acid suppression with a proton pump inhibitor (PPI) and improvement of gut motility with prokinetic drugs are the 2 main treatment options for FD.1 Assuming that the symptom pattern (PDS or EPS) may aid in determining the most appropriate first-line therapy, it is proposed that patients with PDS be treated with prokinetic drugs, while those with EPS are considered more likely to respond to a PPI.8-10 However, the concept of treatment choice for FD depending on the symptom pattern is not yet validated.11
Acotiamide, a new prokinetic drug that has been shown to improve gastric motility and gastric emptying, has been available in Japan for the treatment of FD since 2013. The phase III trial of the drug proved its efficacy for the treatment of meal-related symptoms, so it has been used mainly for PDS-type FD.12 While a recent retrospective study reported the efficacy of acotiamide for not only PDS but also EPS,13 this finding needs to be confirmed in a pro-spective study. In addition, the identification of clinical parameters to predict the responsiveness of the drug is of clinical significance, but few studies have addressed this issue.13,14
Gastric acid is one of the most important pathogenic factors influencing the development of FD, a notion supported by the fact that acid suppression with PPI has some effect on relieving FD symptoms and is often applied to such patients as first-line thera-py.1,2 However, the involvement of gastric acid in the manifestation of FD symptoms is considered to be complicated. For example, strong acid externally administered to the stomach or the duode-nal bulb induced dyspeptic symptoms in healthy volunteers and patients with FD.15,16 However, hypochlorhydric patients is more likely to be associated dysmotility symptoms in patients with FD, as we previously reported.17 Furthermore, although subjects’ specific gastric acid secretion levels may be able to modulate the responsive-
ness of drugs used for FD treatment, no study has yet investigated the efficacy of such drugs depending on the gastric acid secretion level.
Pepsinogen I is secreted exclusively by the fundic glands, and pepsinogen II is secreted by the fundic glands, pyloric glands, and proximal duodenal mucosa.18 Many previous studies have shown that the serum pepsinogen (sPG) I level and/or I/II ratio reflect the gastric acid secretion level.19,20 Based on the accumulated data on gastric acid secretion and sPG from a total of 627 Japanese patients, we previously established reliable cutoff sPG values to predict the gastric acid secretion status.21 Furthermore, using these criteria, we showed that estimating the gastric acid secretion levels by simply measuring the sPG is useful for predicting the risks of various acid-related diseases of the upper gastrointestinal tract.22
We conducted this multi-clinic singe-arm prospective study as a pilot study, exploring the potential associations of the individual gastric acid secretion level estimated by measuring the sPG with the type of FD or efficacy of acotiamide treatment in patients with FD.
Materials and Methods
PatientsPatients ≥ 20 years old who consulted participating clinics
from October 2017 to March 2019 with complaints of chronic symptoms centered in the upper abdomen for more than 1 month in the absence of organic diseases likely to explain the symptoms were asked to answer a validated questionnaire using a global over-all symptom (GOS) score.23,24 In the questionnaire, patients rated 8 overall abdominal symptoms experienced in the previous week using a 7-point Likert scale ranging from a score of 1 for “not at all bothered” to 7 for “unbearably bothered.” The patients were then considered eligible and prospectively enrolled in the study if they had one or more specific upper gastrointestinal symptoms, such as postprandial distress (question 1), epigastric pain (question 4), early satiety and/or fullness (question 5), and epigastric burning (question 7) with at least moderate severity (score ≥ 4). The participating institutions were the following 11 clinics located in Akita prefecture, Japan: Kataoka Internal Medicine Clinic, Kudo Gastroenterology Clinic, Zeniya Clinic, Segawa Clinic, Oikawa Clinic, Odashima Masaru Clinic, Matsugasaki Clinic, Kuramitsu Clinic, Sasahara Internal Medicine Clinic, Yoneyama Gastroenterology Clinic, and Tomita Gastroenterology Clinic.
The exclusion criteria were as follows: those who had taken acid inhibitory drugs or prokinetic drugs within the past month; those

5555
Efficacy of Acotiamide by Gastric Acid Secretion
Vol. 28, No. 1 January, 2022 (53-61)
taking non-steroidal anti-inflammatory drugs or aspirin; those with predominant symptoms suggestive of gastroesophageal reflux dis-eases or irritable bowel syndrome, although concurrence with these symptoms was permitted; those with histories of operations for upper gastrointestinal tract; those who had received Helicobacter pylori eradication therapy within the past 6 months; and those with suspected psychological disorders or uncontrolled diabetes mellitus.
Study ProtocolThe enrolled patients were interviewed regarding their body
weight, height, smoking status, and history of H. pylori eradication therapy and were classified into 3 groups based on the predominant type of dyspeptic symptoms (PDS, EPS, and overlapping). The subgrouping of the symptoms was made based on each patient’s chief complaint, regardless of the reported GOS scoring. Next, a blood sample was collected from each patient under fasting condi-tions to measure the serum H. pylori antibody, sPG I, and sPG II levels.
Each patient was then administered a 100 mg tablet of aco-tiamide thrice a day for 4 weeks, and at the completion of the treat-ment, they revisited the clinic, answered the questionnaire concern-ing the GOS score, and reported on the efficacy of the treatment using an overall treatment efficacy (OTE) questionnaire.12,25 In the questionnaire, the patients made a global assessment of the change in their dyspeptic symptoms compared with the pretreatment base-line period using a 7-point Likert scale from “extremely improved” to “improved,” “slightly improved,” “not changed,” “slightly ag-gravated,” “aggravated,” and “extremely aggravated.” In the sub-sequent analysis, patients who reported “extremely improved” or “improved” on the OTE questionnaire were defined as responders, while other patients were defined as non-responders.
The study protocol was approved by the Akita University School of Medicine Ethics Committee (1779). All subjects pro-vided their written informed consent prior to enrollment. The study was registered at the University Hospital Medical Information (UMIN000036265).
Estimation of gastric acid secretion by Helicobacter py-lori infection and serum pepsinogen
The H. pylori infection status was determined by the titers of serum IgG antibodies against H. pylori using an enzyme immuno-assay kit (E Plate “Eiken” H. pylori antibody; Eiken Chemical Co. Ltd, Tokyo, Japan). The sPG I and sPG II levels were measured by a chemiluminescent enzyme immunoassay using commercial kits (Lumipulse PG I and II; Fujirebio Inc, Tokyo, Japan).
We previously demonstrated that the sPG I value correlated well with gastric acid secretion in H. pylori-negative subjects, while the sPG I/II ratio correlated well in H. pylori-positive subjects.19 We therefore defined gastric acid hypo-secretion as sPG I < 35 ng/mL in H. pylori-negative subjects (area under the curve [AUC]: 0.80) and an I/ II ratio < 2.7 in H. pylori-positive subjects (AUC: 0.87).21 Similarly, we defined gastric acid hyper-secretion as sPG I values > 50 ng/mL in H. pylori-negative subjects (AUC: 0.79) and as an I/II ratio > 3.3 in H. pylori-positive subjects (AUC: 0.87).21 All other subjects were defined as having gastric acid normo-secretion. In addition, since sPG I values were more well-correlated with gastric acid secretion than I/II ratios in H. pylori-eradicated subjects,26 the same criteria as in H. pylori-negative subjects was applied to the eradicated subjects.
Statistical MethodsResults were expressed as the mean (SD) for continuous vari-
ables, and ratios (percentages) for categorical variables. Compari-sons between PDS and EPS, or responders and non-responders were performed either by an unpaired t test for continuous variables or by a chi-square test for categorical variables. Response rates were calculated as percentages of responders among those who com-pleted a 4-week treatment protocol and were compared using the chi-square test among subgroups of estimated gastric acid secretion. In addition, using the GOS score before and after treatment in each patient, a PDS symptom severity score was calculated by summing postprandial fullness (question 1) and early satiety (question 5), and an EPS symptom severity score was calculated by summing epigas-tric pain (question 4) and epigastric burning (question 7). Those symptom severity scores were expressed as the median (interquartile range), with the values compared between patients with PDS and EPS by the Mann-Whitney U test and before and after treatment by Wilcoxon rank sum test. All analyses were performed using the JMP Pro 13 software program (SAS Institute Inc, Cary, NC, USA), and a P-value < 0.05 was considered to indicate a statisti-cally significant difference.
Regarding the sample size, since there have been no previous studies investigating the efficacy of prokinetic drugs by the gastric acid secretion level, we set a sample size of 200 for this pilot study considering the feasibility of subject enrollment in our area.
Results
Initially, 88 patients with FD symptoms consulting the partici-pating clinics agreed to participate in this study, but 2 were deemed

56
Toshiaki Suzuki, et al
Journal of Neurogastroenterology and Motility 56
ineligible for the study (PPI had already been administered in 1 case, and the intensity of the symptoms was insufficient for inclusion according to the GOS questionnaire in the other case). Consequent-ly, a total of 86 patients were enrolled in this study and subjected to the initial analysis for comparing the clinical parameters between PDS and EPS. Treatment with acotiamide was commenced in all of these patients, including 2 who were lost to follow-up and 1 who was administered a minor tranquilizer at another hospital. Ulti-mately, 83 patients completed the 4-week treatment course and were subjected to the analysis of the efficacy of acotiamide. No one had taken acotiamide previously.
Among the 86 enrolled patients, the majority (72.1%) were fe-male with a mean age of 54.8 (15.2) years old. The period of illness before consulting the clinic was 1-3 months in 60.5%, 3-6 months in 16.3%, and > 6 months in 23.2%. Concerning H. pylori infec-tion status, the vast majority (87.2%) were judged to be negative (naïve-negative in 75.6% and eradicated in 15.1%), while 12.8% were H. pylori-positive. In terms of the estimated gastric acid secre-tion level, 44 (51.2%), 27 (31.4%), and 15 (17.4%) were classified as hypo-secretors, normo-secretors, and hyper-secretors, respec-tively (Table 1).
Based on the predominant chief complaint of dyspeptic symp-toms, 56 (65.1%) and 26 (30.2%) were defined as having PDS
and EPS, respectively, while the remaining 4 (4.6%) were overlap-ping. It should be noted that, since subgrouping of the symptoms was made based on each patient’s chief complaint and not by the symptom score, although the PDS symptom severity score was sig-nificantly higher than the EPS score in patients with PDS (7.0 [2.0] vs 5.0 [2.0], P < 0.01), both scores were similarly high in patients with EPS (PDS score: 6.0 [3.0] vs EPS score 6.0 [2.0]) (Fig. 1).
On comparing the clinical parameters between PDS and EPS, there was no significant difference in any studied parameters be-tween the 2 groups (Table 1). Noticeably, there was no significant difference in the distribution of estimated gastric acid secretion be-tween the PDS and EPS groups, although the proportion of hyper-secretors (vs non-hyper-secretors) was greater in EPS that in PDS (27.0% vs 14.0%, P = 0.161) (Table 1 and Fig. 2).
Of the 83 patients who completed the study protocol of 4-week acotiamide treatment, 57 responded to the therapy, and the remain-ing 26 did not respond, resulting in an overall response rate of 68.7%. In the majority of patients (86.5%), good compliance (over 90.0%) was confirmed. The response rates were 66.0% for PDS and 73.1% for EPS, with no significant difference in the response rate being noted between the groups (Fig. 3). In addition, both the PDS and EPS symptom severity scores were significantly de-creased by treatment in patients with PDF and EPS (from 7.0 [2.0]
Table 1. Comparisons of Clinical Features According to the Type of Functional Dyspepsia
Type of FD Total (N = 86) PDS (n = 56) EPS (n = 26) Overlap (n = 4)P-value
(PDS vs EPS)
Age (yr) 54.8 (15.2) 54.2 (16.0) 56.8 (13.4) 50.0 (16.6) 0.481Age (≥ 60 yr) 27/86 (31.4%) 16/56 (28.5%) 10/26 (38.5%) 1/4 (25.0%) 0.371Gender (male) 24/86 (27.9%) 13/56 (23.2%) 8/26 (30.8%) 3/4 (75.0%) 0.473BMI (≥ 23.0 kg/m2) 27/86 (31.4%) 15/56 (26.8%) 9/26 (34.6%) 3/4 (75.0%) 0.475Current smoker 10/86 (11.6%) 4/56 (7.1%) 4/26 (15.4%) 2/4 (50.0%) 0.240Current drinker 49/86 (57.0%) 30/56 (53.6%) 16/26 (61.5%) 3/4 (75.0%) 0.505Illness period
(≥ 1 mo, < 3 mo/≥ 3 mo, < 6 mo/≥ 6 mo)
52/14/20 (60.5%/16.3%/23.2%)
35/8/13 (62.5%/14.3%/23.3%)
15/5/6 (57.7%/19.2%/23.1%)
2/1/1 (50.0%/25.0%/25.0%)
0.848
sPG I (ng/mL) 47.6 (55.9) 45.5 (33.0) 54.9 (89.9) 29.5 (11.2) 0.491sPG II (ng/mL) 10.6 (10.3) 10.1 (7.7) 11.7 (14.9) 10.1 (7.6) 0.516sPG I/II ratio 4.6 (1.5) 4.8 (1.5) 4.4 (1.3) 4.1 (2.3) 0.262H. pylori (neg./pos./era.) 62/11/13
(72.1%/12.8%/15.1%)42/7/7
(75.0%/12.5%/12.5%)18/5/3
(69.3%/19.2%/11.5%)2/1/1
(50.0%/25.0%/25.0%)0.727
Estimated gastric acid secretion (hypo/norm/hyper)
44/27/15 (51.2%/31.4%/17.4%)
27/21/8 (48.2%/37.5%/14.3%)
14/5/7 (53.8%/19.3%/26.9%)
3/1/0 (75.0%/25.0%/0.0%)
0.353
FD, functional dyspepsia; PDS, postprandial distress syndrome; EPS, epigastric pain syndrome; BMI, body mass index; sPG, serum pepsinogen; H. pylori, Heli-cobacter pylori; neg., negative; pos., positive; era., eradicated.Values are presented as mean (SD) or n (%).

5757
Efficacy of Acotiamide by Gastric Acid Secretion
Vol. 28, No. 1 January, 2022 (53-61)
to 4.0 [2.0] and from 5.0 [2.0] to 3.0 [1.0] for the PDS and EPS scores in patients with PDS, respectively, and from 6.0 [3.0] to 4.0 [3.0] and from 6.0 [2.0] to 3.0 [2.5] for the PDS and EPS scores in patients with EPS, respectively; P < 0.01 for all comparisons) (Fig. 1). On comparing the clinical parameters between respond-ers and non-responders, no parameters were significantly different between the 2 groups (Table 2).
Of note, the distribution of estimated gastric acid secretion in responders was hypo-secretors in 56.1%, normo-secretors in 28.1%, and hyper-secretors in 15.8%, showing no significant dif-ference from non-responders (hypo-secretors: 46.1%, normo-secretors: 30.8%, and hyper-secretors: 23.1%, P = 0.639) (Table 2). However, a slightly different distribution in the estimated gastric acid secretion in relation to responsiveness to the treatment emerged in the subgroup analysis by PDS or EPS, separately. In PDS, the
response rates were stable, ranging from 61.0% to 75.0%, regard-less of the estimated gastric acid secretion level. In contrast, in EPS, although the response rate was high in hypo-secretors (85.0%) and normo-secretors (80.0%), it was markedly lower in hyper-secretors (42.0%). Thus, although the response rate did not differ notably in any acid secretion group among patients with PDS, it was signifi-cantly lower in hyper-secretors than in non-hyper-secretors among patients with EPS (P = 0.046) (Fig. 4).
Discussion
In this study, using the combination of the H. pylori infection status and sPG as reliable parameters to predict the gastric acid secretion level, we found that the gastric acid secretion level did
Figure 1. Box-and-whisker plots representing changes in postprandial distress syndrome (PDS) and epigastric pain syndrome (EPS) symptom severity scores (PDSs and EPSs) prior to and after 4-week treatment with acotiamide in patients with PDS (A) and patients with EPS (B). *P < 0.01 compared with the pre-treatment value.
PDSs EPSs
12
10
8
6
4
2
Before treatment After treatment
0
A B
*
EPSsPDSs
*
PDSs EPSs
8
6
4
2
Before treatment After treatment
0
*
EPSsPDSs
12
10
*
Hypo
Norm
Hyper
PDS EPS
48.2%
37.5%
14.3%
53.9%
19.2%
26.9%
Figure 2. Distribution of estimated gastric acid secretion levels in postprandial distress syndrome (PDS) and epigastric pain syndrome (EPS). Individual gastric acid secretion levels were estimated by a combination of serum pepsinogen values and the Helicobacter pylori infection status. There were no significant differences in levels be-tween PDS and EPS.
Figure 3. Response rates to acotiamide treatment in the total cohort and for postprandial distress syndrome (PDS) and epigastric pain syndrome (EPS) separately.
Total PDS EPS
74
72
70
68
66
64
62
68.7
66.0
73.1%

58
Toshiaki Suzuki, et al
Journal of Neurogastroenterology and Motility 58
not markedly affect the phenotype of FD or responsiveness to aco-tiamide. Nonetheless, although treatment with acotiamide showed relatively high efficacy not only against PDS but also EPS, we found several differences in the therapeutic responsiveness between the 2 subtypes of FD, depending on the gastric acid secretion level. For example, while treatment with acotiamide was effective among PDS cases, irrespective of the gastric acid secretion level, the effica-cy may be limited in cases of EPS among hyper-secretors of gastric
acid.Since the sPG values correlate with the gastric physiological
function, the measurement of the parameters (I, II, or I/II ratio) has been used to predict the relative risk of various upper gastroin-testinal diseases.22 There have also been several attempts to connect these parameters to clinical aspects of FD in order to differentiate subtypes of the disease and predict the therapeutic responsiveness to anti-secretory drugs, although the results have been conflicting.27,28 In this multi-institutional prospective study with primary care clin-ics, by employing a reliable cutoff sPG value to predict the gastric acid secretion level, we investigated the influence of the estimated gastric acid secretion level on differentiating PDS and EPS and predicting the therapeutic responsiveness to the new prokinetic drug acotiamide.
FD is divided into 2 major symptomatic phenotypes—PDS and EPS—based on the assumption that different pathophysiologi-cal mechanisms underlie different dyspeptic symptoms. However, while a few studies successfully demonstrated significant differ-ences in the underlying pathogenesis between PDS and EPS,3,4 most other studies failed to show any marked difference in the pathophysiological mechanisms, such as gastric hypersensitivity, impaired gastric accommodation, and delayed gastric emptying.5-7 Likewise, although gastric acid is considered another important fac-tor involved in the pathogenesis of FD, the current study failed to show a significantly different distribution of estimated gastric secre-tion between PDS and EPS. This may be consistent with previous reports that the gastric acid secretion in cases of non-ulcer dyspep-
Table 2. Comparisons of Clinical Parameters Between Responders and Non-responders to Acotiamide Treatment
Responsiveness Responder (n = 57) Non-responder (n = 26) P-value
Age (yr) 52.7 (14.3) 58.3 (16.7) 0.120Age (≥ 60 yr) 15/57 (26.3%) 11/26 (42.3%) 0.156Gender (men) 18/57 (31.6%) 8/26 (23.1%) 0.432BMI (≥ 23.0 kg/m2) 19/57 (33.3%) 7/26 (26.9%) 0.344Current smoker 7/57 (12.3%) 3/26 (15.3%) 0.927Current drinker 36/57 (63.1%) 13/26 (50.0%) 0.268Illness period (≥1 mo, < 3 mo/≥ 3 mo, < 6 mo/≥ 6 mo) 34/9/14 (59.6%/15.8%/24.6%) 18/4/4 (69.2%/15.4%/15.4%) 0.961Type of FD (PDS/EPS/overlap) 35/19/3 (61.4%/33.3%/5.3%) 18/7/1 (69.2%/26.9%/3.9%) 0.402Compliance (≥ 90%) 48/57 (84.2%) 23/26 (88.5%) 0.616sPG I (ng/mL) 42.3 (31.8) 59.2 (90.3) 0.217sPG II (ng/mL) 9.7 (7.3) 12.0 (15.2) 0.363sPG I/II ratio 4.6 (1.6) 4.9 (1.4) 0.384H. pylori (neg./pos./era.) 45/6/6 (59.0%/10.5%/10.5%) 16/4/6 (61.5%/15.4%/23.1%) 0.226Estimated gastric acid secretion (hypo/norm/hyper) 32/16/9 (56.1%/28.1%/15.8%) 12/8/6 (46.1%/30.8%/23.1%) 0.639
BMI, body mass index; FD, functional dyspepsia; PDS, postprandial distress syndrome; EPS, epigastric pain syndrome; sPG, serum pepsinogen; H. pylori, Heli-cobacter pylori; neg., negative; pos., positive; era., eradicated.Values are presented as mean (SD) or n (%).
PDS EPS
90
80
70
60
50
40
30
20
10
0
66.661.1
75.0
85.080.0
42.8%
*Hypo
Norm
Hyper
Figure 4. Response rates to acotiamide treatment in postprandial dis-tress syndrome (PDS) and epigastric pain syndrome (EPS) according to the estimated gastric acid secretion levels. Individual gastric acid secretion levels were estimated by a combination of serum pepsino-gen values and the Helicobacter pylori infection status. In EPS, the response rate was significantly lower in gastric hyper-secretors than in non-hyper-secretors. *P < 0.05.

5959
Efficacy of Acotiamide by Gastric Acid Secretion
Vol. 28, No. 1 January, 2022 (53-61)
sia is similar to that in healthy controls, irrespective of the type of symptoms, although those studies were performed before the era in which FD was subdivided into the current classification (eg, PDS and EPS).29,30
Since a phase II trial showed that acotiamide has beneficial effects against FD, particularly PDS,31 a phase III trial was con-ducted in PDS alone, and successfully demonstrated beneficial effects in such subgroup of FD.12 However, the phase II study also demonstrated some beneficial effects on EPS symptoms, such as upper abdominal pain.31 Consistent with this, a recent single-center retrospective study reported a similarly high efficacy of acotiamide not only against PDS but also EPS (78.0% vs 70.0%).13 We re-inforced this finding through our multi-center prospective study and found a high drug efficacy for PDS as well as EPS (66.0% vs 73.1%). Such a broad effect of acotiamide may contrast with those of other prokinetic drugs, like itopride, which is effective against PDS alone.32 Previous studies on the pharmacological action of acotiamide in human and animal models demonstrated that, in ad-dition to local effects on gut motility, acotiamide may yield beneficial effects on dyspeptic symptoms indirectly through the brain-gut axis via the effects of ghrelin on the central nervous system.10 Such diverse pharmacological effects of acotiamide may explain the broad responsiveness in FD.
Two retrospective single-center studies reported clinical factors for predicting the responsiveness of acotiamide in FD treatment, showing conflicting results.13,14 Overall, the current study failed to show any significant difference in any clinical parameters, including the type of FD and estimated gastric acid secretion. Nonetheless, when examining the association of the estimated gastric acid secre-tion with the therapeutic responsiveness of acotiamide in PDS and EPS separately, we found different response profiles between the 2 types of FD. While the efficacy of acotiamide against PDS seemed to be independent of the gastric acid secretion level, the efficacy against EPS was significantly lower in gastric hyper-secretors than in non-hyper-secretors, suggesting that the efficacy of acotiamide in EPS may be affected by the secretion level. Thus, although aco-tiamide seems promising for the treatment of EPS as well as PDS overall, its efficacy for EPS may be limited in hyper-secretors, for whom acid suppression with a PPI is a reasonable alternative thera-peutic option. Therefore, estimating the gastric secretion level by sPG and the H. pylori status may be useful for selecting the first-line therapeutic approach for patients with EPS.
Our current finding of insufficient efficacy of acotiamide in EPS with gastric hyper-secretion is consistent with a previous finding from an animal model. In that study, while pentagastrin-
induced gastric acid hyper-secretion aggravated the pain response to gastric dilation by delaying gastric emptying, the histamine H2 blocker famotidine, but not the prokinetic drug mosapride, success-fully ameliorated the pain response.33
Several limitations associated with the present study warrant mention. First, regarding the illness period, we defined dyspep-tic symptoms lasting for more than 1 month as FD. Since the guideline of the Japanese Society of Gastroenterology defines just “chronic symptoms” of dyspepsia as FD,1 in many previous stud-ies conducted in Japan, FD was diagnosed with the same criteria as the current study.13,14,34 However, according to the international consensus guideline (Rome IV), persistent dyspeptic symptoms for at least 3 months are required to diagnose FD.2 Because of easy ac-cess to medical care through the national health insurance system in Japan, only a few Japanese patients wait for more than 3 months before consulting doctors,1,34,35 which held true in the current study subjects. Nonetheless, a previous study demonstrated that the qual-ity of life impairment by dyspeptic symptoms was similar between patients with an illness period of ≥ 1 month and those with a period of ≥ 6 months in Japanese patients with FD,34 implying the clini-cal relevance of dyspeptic symptoms irrespective of the duration of the disorders. In the current study, the illness periods were evenly distributed with regard to the type of symptoms or drug responsive-ness (Tables 1 and 2); we therefore believe that the illness period had little effect on the current outcomes. Second, the number of enrolled patients was relatively small. We initially planned a sample size of 200 considering feasibility, but we successfully enrolled only 86 patients. The small number of patients precluded a multivariate analysis for determining the clinical parameters predictive of thera-peutic responsiveness. In addition, since we found a trend toward an association between the type of FD and estimated gastric acid secretion, a type II error due to an insufficient number of subjects may have been responsible for the insignificant association. Third, subgrouping of the symptoms (eg, PDS, EPS, or overlapping) was performed based on each patient’s chief complaint, not by the symptom score, although the classification method of the subtype of FD symptoms was not consistent in previous studies.3-7 Then, the efficacy of the treatment was also evaluated by an OTE probably on the chief complaints, not by the individual symptom score. The advantage of subgrouping based on each patient’s chief complaint is that it closely resembles the way in which doctors see patients with a specific chief complaint in the clinical setting. Accordingly, the patients were classified into either PDS or EPS based on their chief complaint as much as possible in the current study; this minimized the proportion of overlapping to 4.6%, which is much

60
Toshiaki Suzuki, et al
Journal of Neurogastroenterology and Motility 60
lower than the value in previous studies using symptom scores to classify subgroup (16.0-25.0%)36,37 where PDS- and EPS-related symptoms are independently evaluated by the score in each patient. Furthermore, since our patients with EPS had similarly high PDS and EPS symptom severity scores, they may have included some EPS plus overlapping patients in addition to “pure EPS” patients, which may be partly responsible for the high response rate for EPS in the current study. Finally, regarding the study design, the lack of a placebo arm is another limitation of this study, as it is well recog-nized that placebo effects are not negligible, especially in the treat-ment of FD. However, a previous randomized control trial already demonstrated the significant efficacy of acotiamide over placebo,12 and we wished to focus on investigating predictive factors for the therapeutic responsiveness among drug users. Similarly, the lack of an observation period (eg, 1 or 2 weeks) between registration and treatment commencement may have been responsible for the overall high response rate in the current study, as FD symptoms may have disappeared spontaneously during the observation period.
In conclusion, although the prokinetic drug acotiamide is ef-fective for treating EPS as well as PDS, the efficacy is somewhat limited in EPS patients with gastric acid hyper-secretion, in whom gastric acid inhibitors such as PPI would be more suitable. Estima-tion of the gastric acid secretion level by a combination of sPG and the H. pylori status may be useful for selecting the appropriate first-line treatment for FD, especially EPS.
Financial support: None.
Conflicts of interest: None.
Author contributions: Toshiaki Suzuki collected and analyzed the data, and drafted the article; Reina Ohba and Yosuke Shi-modaira analyzed the data; Ei Kataoka, Yui Kudo, Akira Zeniya, Daisuke Segawa, Keisuke Oikawa, Masaru Odashima, Taiji Saga, Tomoyuki Kuramitsu, Hideaki Sasahara, Kazuo Yoneyama, and Takashi Tomita analyzed the data; and Katsunori Iijima designed the study, collected and analyzed the data, and drafted the article.
References 1. Miwa H, Kusano M, Arisawa T, et al. Evidence-based clinical practice
guidelines for functional dyspepsia. J Gastroenterol 2015;50:125-139. 2. Stanghellini V, Chan FK, Hasler WL, et al. Gastroduodenal disorders.
Gastroenterology 2016;150:1380-1392.3. Di Stefano M, Miceli E, Tana P, et al. Fasting and postprandial gastric
sensorimotor activity in functional dyspepsia: postprandial distress vs. epigastric pain syndrome. Am J Gastroenterol 2014;109:1631-1639.
4. Shindo T, Futagami S, Hiratsuka T, et al. Comparison of gastric empty-ing and plasma ghrelin levels in patients with functional dyspepsia and non-erosive reflux disease. Digestion 2009;79:65-72.
5. Haag S, Senf W, Tagay S, et al. Is there any association between disturbed gastrointestinal visceromotor and sensory function and impaired quality of life in functional dyspepsia? Neurogastroenterol Motil 2010;22:262-e79.
6. Ochi M, Tominaga K, Tanaka F, et al. Clinical classification of subgroups according to the Rome III criteria cannot be used to distinguish the as-sociated respective pathophysiology in Japanese patients with functional dyspepsia. Intern Med 2013;52:1289-1293.
7. Vanheel H, Carbone F, Valvekens L, et al. Pathophysiological abnormali-ties in functional dyspepsia subgroups according to the Rome III criteria. Am J Gastroenterol 2017;112:132-140.
8. Geeraerts B, Tack J. Functional dyspepsia: past, present, and future. J Gastroenterol 2008;43:251-255.
9. Camilleri M, Stanghellini V. Current management strategies and emerg-ing treatments for functional dyspepsia. Nat Rev Gastroenterol Hepatol 2013;10:187-194.
10. Yamawaki H, Futagami S, Wakabayashi M, et al. Management of functional dyspepsia: state of the art and emerging therapies. Ther Adv Chronic Dis 2018;9:23-32.
11. Hsu YC, Liou JM, Yang TH, et al. Proton pump inhibitor versus proki-netic therapy in patients with functional dyspepsia: is therapeutic response predicted by Rome III subgroups? J Gastroenterol 2011;46:183-190.
12. Matsueda K, Hongo M, Tack J, Saito Y, Kato H. A placebo-controlled trial of acotiamide for meal-related symptoms of functional dyspepsia. Gut 2012;61:821-828.
13. Shinozaki S, Osawa H, Sakamoto H, Hayashi Y, Kawarai Lefor A, Yamamoto H. The effect of acotiamide on epigastric pain syndrome and postprandial distress syndrome in patients with functional dyspepsia. J Med Invest 2016;63:230-235.
14. Miki A, Yamamoto T, Maruyama K, et al. Extensive gastric mucosal atrophy is a possible predictor of clinical effectiveness of acotiamide in pa-tients with functional dyspepsia. Int J Clin Pharmacol Ther 2017;55:901-904.
15. Miwa H, Nakajima K, Yamaguchi K, et al. Generation of dyspeptic symptoms by direct acid infusion into the stomach of healthy Japanese subjects. Aliment Pharmacol Ther 2007;26:257-264.
16. Lee KJ, Vos R, Janssens J, Tack J. Influence of duodenal acidification on the sensorimotor function of the proximal stomach in humans. Am J Physiol Gastrointest Liver Physiol 2004;286:G278-G284.
17. Iwai W, Abe Y, Iijima K, et al. Gastric hypochlorhydria is associated with an exacerbation of dyspeptic symptoms in female patients. J Gastroenterol 2013;48:214-221.
18. Iijima K, Abe Y, Kikuchi R, et al. Serum biomarker tests are useful in delineating between patients with gastric atrophy and normal, healthy stomach. World J Gastroenterol 2009;15:853-859.
19. Iijima K, Sekine H, Koike T, Imatani A, Ohara S, Shimosegawa T. Se-rum pepsinogen concentrations as a measure of gastric acid secretion in Helicobacter pylori-negative and -positive Japanese subjects. J Gastroen-terol 2005;40:938-944.

6161
Efficacy of Acotiamide by Gastric Acid Secretion
Vol. 28, No. 1 January, 2022 (53-61)
20. Feldman M, Richardson CT, Lam SK, Samloff IM. Comparison of gastric acid secretion rates and serum pepsinogen I and II concentra-tions in occidental and oriental duodenal ulcer patients. Gastroenterology 1998;95:630-635.
21. Iijima K, Koike T, Abe Y, Shimosegawa T. Cutoff serum pepsinogen values for predicting gastric acid secretion status. Tohoku J Exp Med 2014;232:293-300.
22. Iijima K, Koike T, Ara N, et al. Identification of a high-risk group for low-dose aspirin-induced gastropathy by measuring serum pepsinogen in H. pylori-infected subjects. J Gastroenterol 2015;50:305-312.
23. Junghard O, Lauritsen K, Talley NJ, Wiklund IK. Validation of seven graded diary cards for severity of dyspeptic symptoms in patients with non ulcer dyspepsia. Eur J Surg Suppl 1998:106-111.
24. Sakurai K, Nagahara A, Inoue K, et al. Efficacy of omeprazole, famoti-dine, mosapride and teprenone in patients with upper gastrointestinal symptoms: an omeprazole-controlled randomized study (J-FOCUS). BMC Gastroenterol 2012;12:42.
25. Ang D, Talley NJ, Simren M, Janssen P, Boeckxstaens G, Tack J. End-points used in functional dyspepsia drug therapy trials. Aliment Pharma-col Ther 2011;33:634-649.
26. Iijima K, Koike T, Abe Y, et al. Alteration of correlation between serum pepsinogen concentrations and gastric acid secretion after H. pylori eradi-cation. J Gastroenterol 2009;44:819-825.
27. Yoshikawa I, Murata I, Kume K, et al. Serum pepsinogen can predict response to H2-receptor antagonist in patients with functional dyspepsia. Aliment Pharmacol Ther 2002;16:1805-1809.
28. Tahara T, Shibata T, Okubo M, et al. Examination of serum pepsinogen in functional dyspepsia. Hepatogastroenterology 2012;59:2516-2522.
29. Talley NJ, Phillips SF. Non-ulcer dyspepsia: potential causes and patho-physiology. Ann Intern Med 1988;108:865-879.
30. O Nyrén, Adami HO, Gustavsson S, Lindgren PG, Lööf L, Nyberg A. The “epigastric distress syndrome”. A possible disease entity identified by history and endoscopy in patients with nonulcer dyspepsia. J Clin Gastro-enterol 1987;9:303-309.
31. Tack J, Masclee A, Heading R, et al. A dose-ranging, placebo-controlled, pilot trial of Acotiamide in patients with functional dyspepsia. Neurogas-troenterol Motil 2009;21:272-280.
32. Kamiya T, Shikano M, Kubota E, et al. A multicenter randomized trial comparing rabeprazole and itopride in patients with functional dyspepsia in Japan: the NAGOYA study. J Clin Biochem Nutr 2017;60:130-135.
33. Keto Y, Hirata T, Takemoto Y, Yamano M, Yokoyama T. Influence of gastric acid on gastric emptying and gastric distension-induced pain re-sponse in rats--effects of famotidine and mosapride. Neurogastroenterol Motil 2012;24:147-153, e88.
34. Kinoshita Y, Chiba T. Characteristics of Japanese patients with chronic gastritis and comparison with functional dyspepsia defined by Rome III criteria: based on the large-scale survey, FUTURE study. Intern Med 2011;50:2269-2276.
35. Manabe N, Haruma K, Hata J, et al. Clinical characteristics of Japanese dyspeptic patients: is the Rome III classification applicable? Scand J Gas-troenterol 2010;45:567-572.
36. Aziz I, Palsson OS, Törnblom H, Sperber AD, Whitehead WE, Simrén M. Epidemiology, clinical characteristics, and associations for symptom-based Rome IV functional dyspepsia in adults in the USA, Canada, and the UK: a cross-sectional population-based study. Lancet Gastroenterol Hepatol 2018;3:252-262.
37. Suzuki H. The application of the Rome IV criteria to functional esophagogastroduodenal disorders in Asia. J Neurogastroenterol Motil 2017;23:325-333.

62 2022 The Korean Society of Neurogastroenterology and Motility
J Neurogastroenterol Motil, Vol. 28 No. 1 January, 2022www.jnmjournal.org
JNMJ Neurogastroenterol Motil, Vol. 28 No. 1 January, 2022pISSN: 2093-0879 eISSN: 2093-0887https://doi.org/10.5056/jnm20224
Original ArticleJournal of Neurogastroenterology and Motility
Received: September 30, 2020 Revised: None Accepted: January 2, 2021 This is an Open Access article distributed under the terms of the Creative Commons Attribution Non-Commercial License (http://creativecommons. org/licenses/by-nc/4.0) which permits unrestricted non-commercial use, distribution, and reproduction in any medium, provided the original work is properly cited.
*Correspondence: Chien-Lin Chen, MD, PhD Department of Medicine, Hualien Tzu Chi Hospital, Buddhist Tzu Chi Medical Foundation and Tzu Chi University, 707, Section 3, Chung-Yang Road, Hualien 970, Taiwan Tel: +886-3-8561825, Fax: +886-3-8577161, E-mail: [email protected]
Esophageal Bolus Domain Pressure and Peristalsis Associated With Experimental Induction of Esophagogastric Junction Outflow Obstruction
Wei-Yi Lei,1 Taher Omari,2 Tso-Tsai Liu,1 Ming-Wun Wong,1 Jui-Sheng Hung,1 Chih-Hsun Yi,1 Shu-Wei Liang,1 Charles Cock,2 and Chien-Lin Chen1*1Department of Medicine, Hualien Tzu Chi Hospital, Buddhist Tzu Chi Medical Foundation and Tzu Chi University, Hualien, Taiwan; and 2College of Medicine & Public Health Flinders University, Adelaide, SA, Australia
Background/AimsIntrabolus pressures are important for esophageal bolus transport and may detect obstructed bolus flow. This study measured the effect esophageal outflow obstruction experimentally induce by a leg-lift protocol.
MethodsTwenty-five gastroesophageal reflux disease patients referred for esophageal manometry and a normal motility diagnosis were included. Supine liquid swallows were tested. Leg-lift protocol generated esophageal outflow obstruction by increasing abdominal pressure. Esophageal pressure topography and intrabolus pressure metrics were calculated. These included, (1) mid-domain bolus distension pressure during esophageal emptying (DPE, mmHg) and (2) ramp pressure (mmHg/sec), generated by compression of the bolus between the peristaltic contraction and esophagogastric junction (EGJ).
ResultsEGJ relaxation pressure was increased by leg-lift from 13 (11-17) to 19 (14-30) mmHg (P < 0.005) and distal contractile integral also increased from 1077 (883-1349) to 1620 (1268-2072) mmHg∙cm∙sec (P < 0.001) as a physiological response to obstruction. All bolus pressures were increased by leg lift; DPE increased from 17 (15-20) to 27 (19-32) mmHg (P < 0.001), and ramp pressure increased from 3 (1-4) to 5 (2-9) mmHg/sec (P < 0.05).
ConclusionMeasuring pressures within the intrabolus domain can quantify changes related to obstruction to outflow and may serve as adjunct measures for confirming a diagnosis EGJ outflow obstruction. (J Neurogastroenterol Motil 2022;28:62-68)
Key WordsEsophagogastric junction; Esophagus; Manometry; Peristalsis; Pressure

6363
Experimental Esophageal Outflow Obstruction
Vol. 28, No. 1 January, 2022 (62-68)
Introduction
High-resolution manometry (HRM) and the derivation of esophageal pressure topography (EPT) metrics1,2 has enhanced knowledge of esophageal physiology and enabled clinical translation for diagnosis of esophageal motor disorders via the Chicago classifi-cation (CC) algorithm (current version 3.0).3 The CC defines lower esophageal sphincter relaxation, with relaxation failure required to diagnose achalasia and esophagogastric junction outflow obstruc-tion (EGJOO). Four-second integrated relaxation pressure (4s-IRP) is, however, a complex metric influenced by both the intrinsic relaxation of the lower esophageal sphincter, extrinsic compression by the crural diaphragm and contact artefact generated by luminal impingement onto the catheter.4 In the case of EGJOO, concerns have been raised over the clinical significance of high values for 4s-IRP leading to a high rate of EGJOO diagnoses and the potential for misdiagnosis and in turn inappropriate treatment.5-9
Studies have shown that esophageal intraluminal impedance can determine the phases of luminal bolus distension and how they relate contraction during esophageal bolus transport. Directly link-ing bolus flow to pressure may reveal mechanisms of symptom generation.10-14 A range of adjunctive integrated pressure-flow metrics can be derived by combining impedance topography with manometry to better quantify the pressures generated within the intrabolus domain during esophageal bolus transport.15 It remains to be determined whether these novel integrated metrics may play a role as adjunct measures to confirm restricted esophageal emptying. In this study we measured the effect of vertical leg-lift, a protocol designed to induce an EGJOO-like experimental scenario by arti-ficially increasing the gastric pressure, thus creating a greater pres-sure differential against which the esophageal peristalsis must work to enable complete esophageal emptying of a swallow bolus into the stomach. We hypothesized that leg lift would increase bolus domain pressures and delay esophageal emptying with associated physi-ological changes such as augmentation of contractile forces.
Materials and Methods
Study SubjectsBetween August 2018 and July 2019, we prospectively enrolled
consecutive patients with gastroesophageal reflux disease (GERD) symptoms. Patients diagnosed with normal motility using CC ver-sion 3.0 criteria3 were included. The exclusion criteria consisted of:
nasolaryngeal esophageal stricture; history of thoracic, esophageal or gastric surgery; and musculoskeletal disorder that would limit the patients’ mobility. Patients with dysphagia symptoms were also excluded. The medical records of included patients were reviewed, and demographic information, medications, medical and surgi-cal history were extracted. Any medication that could affect upper gastrointestinal motility was discontinued 2 weeks prior to study. All subjects were asked to complete validated GERD questionnaires and receive endoscopic examination. The presence of mucosal in-jury in the lower esophagus and hiatal hernia was recorded.
The study protocol was approved by the Research Ethics Com-mittee of the Hualien Tzu Chi Hospital (IRB No. 107-180-A), confirming that the study was conducted in accordance with the ethical guidelines of the Declaration of Helsinki.
High-resolution Impedance Manometry EquipmentHRM was performed using solid state catheter incorporating
impedance (8F, 32 pressure sensors at 1 cm spacing and 17 imped-ance segments at 2 cm; Unisensor/Laborie, Attikon, Switzerland). Pressure and impedance data were acquired at 20 Hz (Solar GI ac-quisition system; Medical Measurement Systems, Enschede, The Netherlands).
Study ProtocolPatients fasted overnight. The HRM assembly was passed into
the esophagus through the anesthetized nostril (lignocaine spray). The catheter was zeroed to atmospheric pressure and placed with at least 3 distal sensors positioned in the stomach, to record the re-gion from the upper esophageal sphincter (UES) to the proximal stomach. While in the supine position, each patient was given 10 liquid swallows of 5 mL volume (Standardized Bolus Medium Kit for high-resolution impedance manometry [HRIM], Trisco
Patients with typical GERD symptoms (N = 30)
Sign informed consent
Data collection and GERD questionnaires
Upper gastrointestinal endoscopy and
high resolution manometry study
Uploaded to the Swallow Gateway web-
application for analysis (n = 25)
Patients with normal motility (n = 26)
Excluded patients with major
motility disorder and other
exclusion criteria (n = 4)
Excluded patients who failed
leg lift testing (n= 1)
Figure 1. The flowchart of patients enrolled into the study. GERD, gastroesophageal reflux disease.

64
Wei-Yi Lei, et al
Journal of Neurogastroenterology and Motility 64
B
A
Proximal
esophagus
1 2 3 4 5 6 7 8 9 11 12 13
604020
10Admittance and Pressure (EGJ margin level)
0
43210
Distension and Pressure distal esophagus
Peakdistension
wave Peakcontraction
wave
Max. Admittance Max. Pressure
Distal contractile velocity
Max. Admittance (at EGJ)
1 2 3 4 5 6 7 8 9 11 12 13
150
100
50
10Admittance and Pressure (Crural D. Level)
Flow
0
86420
Distension and Pressure EGJ Mean esophageal pressure
Crural D. Pressure
Stomach pressure
Flow Flow
Distal
esophagus
EGJ
Pressure-flow topography
Baseline
Proximal
esophagus
0
12010080604020
Admittance and Pressure (EGJ margin level)
43210
2 4 6 8 12 1410
Distension and Pressure distal esophagus
Max. Admittance Max. Pressure
Distal contractile velocity
Max. Admittance (at EGJ)
0
500400300200100
Admittance and Pressure (Crural D. Level)
Flow
1086420
Distension and Pressure EGJ Mean esophageal pressure
Crural D. Pressure
Stomach pressure
Distal
esophagus
EGJ
Leg-lift
2 4 6 8 12 1410
Integrated pressure-flow metrics
120
80
60
40
20
100
0
mm
Hg
Peak
distension
Fluid
distension
Pressure at
clearance
Ramp
pressure (RP)
P/ T
Distension
pressure
DCL Bolus clearance
(lumen occlusion)
4
3
2
50% baseline20 mmHg
0
-1
Pressure-Flow-Index =DPE* RP
DCL
Distension and Pressure distal esophagus
5 75 1505 75 150
Figure 2. Integrated pressure-flow analysis. (A) Example esophageal pressure topography plots under the 2 experimental conditions. Superim-posed lines indicate the time and position of peak bolus distension (thick purple line) and peak esophageal contraction (thick black line). Swallow to distension latency (SDL, sec) and distension to contraction latency (DCL, sec) indicate the time interval from swallow to peak distension and then to lumen occlusive distal contraction. Distension pressure during accommodation (DPA, mmHg), Compartmentalized transport (DPCT, mmHg), and esophageal emptying (DPE, mmHg) are mean of peak distension pressure values measured in the proximal esophagus, distal esoph-agus and esophagogastric junction (EGJ) regions. The plots below the topography show the separate distension (pink) and pressure (black) seg-ment profiles recorded during bolus passage at the distal margin of esophageal body peristalsis (upper plot) and at the EGJ midpoint (lower plot). “Flow” indicates the time intervals where the bolus is present above the EGJ and there is also a favorable esophagogastric pressure gradient. The sum of flow events determines the total bolus flow time (BFT, sec). (B) The intra-bolus ramp pressurization (RP, mmHg/sec) is determined as the mean gradient of pressure change over time measured from peak distension (star symbols) to bolus clearance (luminal closure; diamond symbol).

6565
Experimental Esophageal Outflow Obstruction
Vol. 28, No. 1 January, 2022 (62-68)
Foods, Pty Ltd, Queensland, Australia) at 30-second intervals. After completion of baseline recording, participants were asked to gently raise both legs by flexing the hip to 40 degrees with the knees in extension for at least 5 seconds. Five 5 mL single water swal-lows with leg lift were then administered during HRM through a syringe. Following data acquisition, each de-identified pressure-impedance file was exported as an American Standard Code for Information Interchange (ASCII)-file and uploaded to the Swallow Gateway web-application (Flinders University, Adelaide, Australia) for analysis.16 The flowchart of the study is shown in Figure 1.
Data AnalysisThe averages of liquid swallows at baseline and during leg-lift
were compared. EPT variables determined were: 4s-IRP (mmHg), proximal contractile integral (PCI, mmHg∙cm∙sec), distal contrac-tile integral (DCI, mmHg∙cm∙sec), contractile front velocity (CFV, cm/sec), distal latency (DL, sec), and largest break size (cm).3
The adjunct measures used to quantify the pressures and flow-timing within the intrabolus domain are illustrated in Figure 2. These included 3 mid-domain intrabolus distension pressures (DP) during phases of esophageal bolus transport;17 namely DP during accommodation (mean DP in mmHg from UES to transition zone), compartmentalized transport (mean DP in mmHg from transition zone to esophagogastric junction [EGJ] proximal mar-gin), and esophageal emptying (DPE, mean DP in mmHg from EGJ margin to crural diaphragm). Intrabolus ramp pressure (RP, mmHg/sec), was used to quantify pressure increase as the bolus is compressed between the esophageal contraction and the EGJ. Flow timing measures included the swallow to mid-bolus distension la-tency (sec), mid-bolus distension to contraction latency (DCL, sec). Impedance ratio is a parameter defining bolus clearance.15 Three of the measures (DPE, RP, and DCL) were combined to derive the Pressure-Flow Index, an experimental composite score of impeded esophageal transport.15 Finally, the period of trans-EGJ bolus emp-
tying was estimated based on the method of Lin et al18 by using the impedance, to detect bolus presence, and the pressure to detect flow-permissive pressure gradient intervals (ie, esophageal pressure > crural and gastric pressure) within to the overall period of bolus presence. Bolus flow time (BFT, sec) was defined by the sum of the flow permissive periods. Shorter BFT reduced esophageal empty-ing.18
Statistical MethodsStatistical tests were performed using IBM SPSS version 22
(IBM, Armonk, NY, USA). Data are presented as either mean (standard deviation) or median (interquartile range). Subject aver-age data for each experimental condition were derived compared using Wilcoxon signed rank test. Significance was accepted at a P-value < 0.05; however, P-values of 0.050-0.099 are also shown.
Results
Twenty-five patients were included (mean age: 42.0 years; 52% female), 5 had globus sensation with typical GERD symptoms and the remainder reported symptoms of heartburn and/or regur-gitation. None had evidence of esophagitis or hiatal hernia. The esophageal acid exposure time during diagnostic pH-monitoring ranged from 2.0-22.5% (mean: 3.0 ± 4.6%; n = 2, AET > 6%). All study participants successfully completed the protocol and no adverse events occurred. For 3 studies the 4s-IRP values were not calculable during leg lift protocol due to movement of the catheter leading to a poor intragastric pressure reading.
The effects of the leg lift protocol on EPT metrics are shown in Table 1. Leg lift caused a significant increase 4s-IRP. PCI and DCI also increased, consistent with augmented of peristaltic vigor as a physiological response to resistance. However, the effect on DCI was far more potent. There was no effect of leg lift on any of the remaining EPT variables.
Table 1. Effect of Leg-lift on Esophageal Pressure Topography Variables Generated During Liquid Swallows in Healthy Subjects
Esophageal pressure topography variables Before leg-lift During leg-lift Wilcoxon t
Proximal contractile integral (mmHg∙cm∙sec) 303 (160-383) 303 (245-453)a 2.193Distal contractile integral (mmHg∙cm∙sec) 1077 (883-1349) 1620 (1268-2072)b 4.345Distal latency (sec) 6.8 (6.1-7.3) 6.7 (6.3-7.2) -Contractile front velocity (cm/sec) 4.0 (3.4-4.7) 4.3 (3.4-4.6) -Largest break (cm) 0.0 (0.0-0.0) 0.0 (0.0-0.0) -4s-IRP (mmHg) 13 (11-17) 19 (14-30)c 3.165
4s-IRP, 4-second integrated relaxation pressure.a,b,cIndicate significantly different by Wilcoxon signed rank test (aP < 0.05, bP < 0.001, cP < 0.005); standardized t and P-values are shown when the P-value was < 0.1.Data are expressed as median (interquartile range).

66
Wei-Yi Lei, et al
Journal of Neurogastroenterology and Motility 66
The effects of the leg lift protocol on integrated pressure-flow metrics are shown in Table 2. The esophageal impedance ratio and BFT were not significantly altered by leg lift, suggesting that the experimentally induced obstruction did not lead to failure of bolus transport and/or esophageal emptying in these participants with normal motility and the ability to augment contractility in response to leg lift (increased DCI previously described). The mid-bolus distension pressures increased in response to leg lift with the effect being most significant in the distal esophagus during the esophageal emptying phase (DPE). RP in the distal esophagus was also signif-icantly increased. The DCL was reduced, suggesting that the mid bolus distension was shifted closure in time to the contraction front. Overall, the Pressure-Flow-Index score was significantly increased by leg lift (25 [12-49] to 54 [21-246], P < 0.001).
Discussion
In this study esophageal HRIM examined the response to leg lift, designed to induce esophageal outflow obstruction through an increase in intra-gastric pressure. The main finding was that, in participants with normal esophageal body motility, bolus swallows performed during leg lift showed an increase in the mid-bolus dis-tension pressure and an increase in contractile vigor. These effects were most potent in the distal esophageal body.
Classic research papers have described in detail the concept of there being 2 pressure domains, firstly, within the bolus and then, secondly, within the contractile segment devoid of bolus.19 However, the importance of measuring and understanding intrabolus forces
and flow timing characteristics for diagnostic purposes continues to be under-recognized, primary focus being the classification of contractility patterns. The current study examined the adjunct value of combined esophageal impedance and pressure measurement to quantify forces within the moving bolus that were only previously attainable via esophageal video-mano-fluorography and frame by frame analysis. Studies have now confirmed the veracity of the method of combing and analyzing intraluminal impedance with pressure to map the trajectory of the bolus domain over space and time and to measure the forces within. Using this pressure-flow-analysis approach it is possible to derive several novel measures of flow timing, luminal area, bolus presence, distension pressure, RPs, and clearance.
The leg lift protocol is an experimental provocative maneuver that we are trialing in conjunction with routine diagnostic esopha-geal HRM. Whilst we report data from GERD patients, rather than asymptomatic controls, the patients included had normal baseline motility, no hiatus hernia, or esophagitis. Therefore, it was felt that they would provide a suitable cohort to examine the bio-mechanical changes in the esophagus induced when bolus empty-ing into the stomach is artificially impeded. Past studies show that abdominal compression causes outflow resistance indicated by an increase in intrabolus pressure. In our hands, the simple to perform leg lift appears to have a larger impact on pressure-flow metrics than we observed using extrinsic abdominal compression utilizing a gastric binder.20 The effect of leg lift on contractile pressures mir-rors that seen with other paradigms and is the normal physiological response. As demonstrated by Dodds et al,21 passive distension by
Table 2. Effect of Leg Lift on Integrated Pressure-Flow Variables Generated During Liquid Swallows in Healthy Subjects
Integrated pressure-flow variables Before leg-lift During leg-lift Wilcoxon t
Bolus clearance Impedance ratio 0.34 (0.27-0.54) 0.33 (0.29-0.58) -Pressure-Flow-Index 25 (12-49) 54 (21-246)c 3.780Intrabolus DP DP during accommodation (mmHg) 10 (8-15) 11 (7-15) - DP compartmentalized transport (mmHg) 14 (11-16) 17 (13-21)b 3.296 DP esophageal emptying (mmHg) 17 (15-20) 27 (19-32)c 4.345 Ramp pressurization (mmHg/sec) 3 (1-4) 5 (2-9)a 2.301Flow timing Swallow to distension latency (sec) 4.6 (3.7-5.1) 4.6 (3.7-5.5)a 1.870 Distension to contraction latency (sec) 2.3 (1.9-3.0) 2.2 (1.3-2.5)a –2.247 Bolus flow time (sec) 2.9 (1.9-3.5) 2.8 (1.6-3.3) -
DP, distention pressure.a,b,cIndicate significantly different by Wilcoxon signed rank test (aP < 0.05, bP < 0.005, cP < 0.001); standardized t and P-values are shown when the P-value was < 0.1.Data are expressed as median (inter-quartile rang).

6767
Experimental Esophageal Outflow Obstruction
Vol. 28, No. 1 January, 2022 (62-68)
the moving bolus stimulates and augments contractility producing higher peak pressure and a longer contraction phase (both of which increase the DCI metric). Further supra-physiological increases in emptying resistance lead to greater passive distension of the esophageal lumen that further stimulates intrinsic neuro-mechanical responses via sensory afferents and polarized enteric nervous system circuits,22 and changes the pre-load, and after-load muscle tension.23 Together these factors drive the higher contractile pressures that are need to overcome obstruction, thus preventing transport failure associated with retrograde bolus escape due to the intrabolus pres-sure remaining below the capacity of the circular muscle to achieve lumen occlusion at the bolus tail.19 As these mechanisms were intact in the studied patients with normal motility, leg lift did not lead to failure of bolus transport (ie, IR and BFT were not altered). Fur-ther studies are needed to determine the rate of transport failure in patients with, for example, ineffective esophageal motility.
In conclusion, novel measurement and analysis methods allow comprehensive characterization of pressures within the intrabolus domain without the need for simultaneous radiology. These pres-sures were augmented along with the 4s-IRP during experimental outflow obstruction produced by leg lift. Further studies could explore the potential adjunct value of such measures for confirming clinically relevant EGJOO in symptomatic patients.
Financial support: This study was supported by a grant, TCRD108-28, from Hualien Tzu Chi Hospital, Buddhist Tzu Chi Medical Foundation, Hualien, Taiwan. Taher Omari holds a National Health and Medical Research Council Senior Research Fellowship. The development of the swallowgateway.com website was supported by grants from the College of Medicine and Public Health, Flinders University. The other authors report no external funding for this manuscript.
Conflicts of interest: Taher Omari holds inventorship of the patent family that covers some of the analytical methods described. The Swallow Gateway web application is owned by Flinders Uni-versity. All other authors report no conflict of interest.
Author contributions: Study concept and design, acquisition, analysis, or interpretation of data: Chien-Lin Chen and Taher Omari; acquisition, analysis, or interpretation of data, and drafting of the manuscript: Chien-Lin Chen, Taher Omari, Charles Cock, Wei-Yi Lei, Tso-Tsai Liu, Ming-Wun Wong, Jui-Sheng Hung, Chih-Hsun Yi, and Shu-Wei Liang; critical revision of the manu-script for important intellectual content: all authors; and administra-tive, technical, or material support, and study supervision: Chien-
Lin Chen.
References
1. Pandolfino JE, Kwiatek MA, Nealis T, Bulsiewicz W, Post J, Kahrilas PJ. Achalasia: a new clinically relevant classification by high-resolution manometry, Gastroenterology 2008;135:1526-1533.
2. Kahrilas PJ. Esophageal motor disorders in terms of high-resolution esophageal pressure topography: what has changed? Am J Gastroenterol 2010;105:981-987.
3. Kahrilas PJ, Bredenoord AJ, Fox M, et al. The Chicago Classifica-tion of esophageal motility disorders, v3.0. Neurogastroenterol Motil 2015;27:160-174.
4. Babaei A, Szabo A, Yorio SD, Massey BT. Pressure exposure and cath-eter impingement affect the recorded pressure in the Manoscan 360™ system. Neurogastroenterol Motil 2018;30:e13329.
5. van Hoeij FB, Smout AJ, Bredenoord AJ. Characterization of idiopathic esophagogastric junction outflow obstruction. Neurogastroenterol Motil 2015;27:1310-1316.
6. Liu A, Woo M, Nasser Y, et al. Esophagogastric junction outflow ob-struction on manometry: outcomes and lack of benefit from CT and EUS. Neurogastroenterol Motil 2019;31:e13712.
7. Schupack D, Katzka DA, Geno DM, Ravi K. The clinical significance of esophagogastric junction outflow obstruction and hypercontractile esophagus in high resolution esophageal manometry. Neurogastroenterol Motil 2017;29:1-9.
8. Okeke FC, Raja S, Lynch KL, et al. What is the clinical significance of esophagogastric junction outflow obstruction? evaluation of 60 patients at a tertiary referral center. Neurogastroenterol Motil 2017;29:e13061.
9. Beveridge CA, Falk GW, Ahuja NK, Yang YX, Metz DC, Lynch KL. Low yield of cross-sectional imaging in patients with esophagogastric junction outflow obstruction. Clin Gastroenterol Hepatol 2020;18:1643-1644.
10. Leibbrandt RE, Dinning PG, Costa M, et al. Characterization of esoph-ageal physiology using mechanical state analysis. Front Syst Neurosci 2016;10:10.
11. Kim JH, Mittal RK, Patel N, Ledgerwood M, Bhargava V. Esophageal distension during bolus transport: can it be detected by intraluminal im-pedance recordings? Neurogastroenterol Motil 2014;26:1122-1130.
12. Zifan A, Ledgerwood-Lee M, Mittal RK. Measurement of peak esoph-ageal luminal cross-sectional area utilizing nadir intraluminal impedance. Neurogastroenterol Motil 2015;27:971-980.
13. Zifan A, Song HJ, Youn YH, Qiu X, Ledgerwood-Lee M, Mittal RK. Topographical plots of esophageal distension and contraction: effects of posture on esophageal peristalsis and bolus transport. Am J Physiol Gas-trointest Liver Physiol 2019;316:G519-G526.
14. Mittal RK, Muta K, Ledgerwood-Lee M, Zifan A. Relationship be-tween distension-contraction waveforms during esophageal peristalsis: effect of bolus volume, viscosity, and posture. Am J Physiol Gastrointest Liver Physiol 2020;319:G454-G461.
15. Omari T, Tack J, Rommel N. Impedance as an adjunct to manometric
68
Wei-Yi Lei, et al
Journal of Neurogastroenterology and Motility 68
testing to investigate symptoms of dysphagia: what it has failed to do and what it may tell us in the future. United European Gastroenterol J 2014;2:355-366.
16. Swallow Gateway high resolution manometry. Available from URL: https://swallowgateway.com/ (accessed 21 Dec 2021).
17. Lin Z, Yim B, Gawron A, Imam H, Kahrilas PJ, Pandolfino JE. The four phases of esophageal bolus transit defined by high-resolution im-pedance manometry and fluoroscopy. Am J Physiol Gastrointest Liver Physiol 2014;307:G437-G444.
18. Lin Z, Imam H, Nicodème F, et al. Flow time through esophagogastric junction derived during high-resolution impedance-manometry studies: a novel parameter for assessing esophageal bolus transit. Am J Physiol Gastrointest Liver Physiol 2014;307:G158-G163.
19. Ren J, Massey BT, Dodds WJ, et al. Determinants of intrabolus pressure during esophageal peristaltic bolus transport. Am J Physiol 1993;264(3
pt 1):G407-G413.20. Brink GJ, Lei WY, Omari TI, et al. Physiological augmentation of
esophageal distension pressure and peristalsis during conditions of increased esophageal emptying resistance. Neurogastroenterol Motil 2018;30:e13225.
21. Dodds WJ, Hogan WJ, Reid DP, Stewart ET, Arndorfer RC. A com-parison between primary esophageal peristalsis following wet and dry swallows. J Appl Physiol 1973;35:851-857.
22. Goyal RK, Paterson WG. Esophageal motility. In: Wood JD, ed. Hand-book of physiology: the gastrointestinal system. Washington, DC: Ameri-can Physiological Society 1989:865-908.
23. Cohen S, Green F. The mechanics of esophageal muscle contraction. Evidence of an inotropic effect of gastrin. J Clin Invest 1973;52:2029-2040.

69 2022 The Korean Society of Neurogastroenterology and Motility
J Neurogastroenterol Motil, Vol. 28 No. 1 January, 2022www.jnmjournal.org
JNMJ Neurogastroenterol Motil, Vol. 28 No. 1 January, 2022pISSN: 2093-0879 eISSN: 2093-0887https://doi.org/10.5056/jnm20228
Original ArticleJournal of Neurogastroenterology and Motility
Reflux-related Extraesophageal Symptoms Until Proven Otherwise: A Direct Measurement of Abnormal Proximal Exposure Based on Hypopharyngeal Multichannel Intraluminal Impedance as a Reliable Indicator for Successful Treatment Outcomes
Takeshi Suzuki,1 Yosuke Seki,2 Tomoaki Matsumura,3 Makoto Arai,4 Toyoyuki Hanazawa,1 Yoshitaka Okamoto,5 Haruhiko Suzuki,6 Kazunori Kasama,2 Akiko Umezawa,2 Yoshimoti Kurokawa,2 and Toshitaka Hoppo7*1Department of Otolaryngology, Head and Neck Surgery, Graduate School of Medicine, Chiba University, Chiba, Chiba, Japan; 2Minimally Invasive Surgery Center, Yotsuya Medical Cube, Tokyo, Japan; 3Department of Gastroenterology, Graduate School of Medicine, Chiba University, Chiba, Chiba, Japan; 4Department of Medical Oncology, Graduate School of Medicine, Chiba University, Chiba, Chiba, Japan; 5Chiba Rosai Hospital, Ichihara, Chiba, Japan; 6Suzuki ENT Clinic, Narashino, Chiba, Japan; and 7Esophageal Institute, Allegheny Health Network, Pittsburgh, PA, USA
Background/AimsThe Lyon Consensus defined parameters based on upper endoscopy and 24-hour combined multichannel intraluminal impedance-pH (MII-pH), that conclusively establish the presence of gastroesophageal reflux disease (GERD). However, the true role of upper endoscopy and MII-pH to evaluate patients with extraesophageal symptoms (EES) has not been well established. Hypopharyngeal MII (HMII), which directly measures laryngopharyngeal reflux (LPR) events, has been utilized to evaluate patients with EES suggestive of LPR.
MethodsThis was a retrospective study involving patients with EES for > 12 weeks despite proton pump inhibitor therapy, and had no endoscopic confirmatory evidence for GERD and negative MII-pH. All patients were subsequently referred for further evaluation of EES with “unknown” etiology and underwent laryngoscopy and HMII. Based on HMII, abnormal proximal exposure (APE) was defined as LPR ≥ 1/day and/or full column reflux (reflux 2 cm distal to the upper esophageal sphincter) > 4/day. Patients with APE were offered antireflux surgery (ARS) and the outcome of ARS was objectively assessed using Reflux Symptom Index.
ResultsOf 21 patients with EES which was thought to be GERD-unrelated based on endoscopy and MII-pH, 17 patients (81%) had APE. Eight patients with APE who had undergone ARS had significant symptomatic improvement in the Reflux Symptom Index score (19.6 ± 4.9 pre-ARS to 5.8 ± 1.4 post-ARS, P = 0.008).
ConclusionsA conventional diagnostic approach using endoscopy and MII-pH may not be sufficient to evaluate patients with EES suggestive of LPR. HMII is essential to evaluate patients with EES, and APE could be a reliable indicator for successful treatment outcomes.(J Neurogastroenterol Motil 2022;28:69-77)
Key WordsHypopharynx; Laryngopharyngeal reflux; Treatment outcome

70
Takeshi Suzuki, et al
Journal of Neurogastroenterology and Motility 70
Introduction
Gastroesophageal reflux disease (GERD) is defined as a con-dition that develops when the reflux of gastric contents into the esophagus causes troublesome symptoms and/or complications, in the Montreal Consensus.1 GERD can cause esophageal (typical) and extraesophageal (atypical) symptoms (EES). Typical symptoms include heartburn and regurgitation, while EES are nonspecific,2 and includes various laryngeal symptoms such as chronic cough and hoarseness, as well as pulmonary and otolaryngological diseases such as laryngitis, asthma, dental erosion, pharyngitis, sinusitis, idiopathic pulmonary fibrosis, and recurrent otitis media.1 In par-ticular, laryngopharyngeal reflux (LPR) disease (LPRD) has been considered to be present if the patients have EES, and LPR symp-toms have been thought to be caused by direct exposure of gastric contents to the laryngopharynx. Although upper endoscopy is the first examination for GERD to assess the presence of esophageal mucosal injury such as esophagitis and Barrett’s esophagus, absence of esophageal mucosal injury cannot exclude GERD. More than half of the patients with GERD have non-erosive reflux disease (NERD). Therefore, it is crucial to objectively evaluate abnormal acid exposure to the distal esophagus, especially in the patients with NERD, and 24-hour esophageal multichannel intraluminal impedance-pH (MII-pH) monitoring is currently considered as the gold standard testing modality. Recently, gastroenterology experts have proposed the Lyon Consensus, which defined param-eters on esophageal testing such as upper endoscopy and MII-pH, that can conclusively establish the presence of pathological GERD.3 However, a diagnosis of LPRD is still challenging.1 Laryngoscopic findings such as hypopharyngeal inflammation are nonspecific,4,5 and may be often seen in healthy population without any LPR symptoms.6 Although MII-pH is also indicated for the evaluation of EES,7 a true role of upper endoscopy and MII-pH to evaluate EES was not well established in the Lyon Consensus.
Hypopharyngeal MII (HMII) uses a special impedance cath-eter to directly measure LPR, and has been utilized to evaluate pa-tients with EES and pulmonary diseases.8,9 Based on the normative
date established, abnormal proximal exposure (APE) was defined as LPR ≥ 1/day and/or full column reflux (FCR) (reflux 2 cm dis-tal to the upper esophageal sphincter [UES]) > 4/day.10 Although the efficacy of HMII to identify patients with LPR symptoms, who would benefit from antireflux surgery (ARS) has been shown,11 the use of HMII has been still limited. The objectives of this study are to investigate the benefit of HMII for the evaluation of the patients with persistent EES which was thought to be GERD-unrelated based on endoscopy and MII-pH, and to assess the outcome of ARS in patients with APE as measured by HMII.
Materials and Methods
Study DesignThis is a retrospective study which was conducted in accor-
dance with the Declaration of Helsinki under the approval of the institutional review board (No. 2356). The patient population in this study included those who presented with predominant or iso-lated EES (LPR symptoms) that lasted for longer than 12 weeks despite proton pump inhibitor (PPI) therapy, were considered to have EES with GERD-unrelated “unknown” etiology based on no confirmatory evidence for GERD such as Los Angeles (LA) grade C/D esophagitis or Barrett’s esophagus on the prior upper endoscopy, and negative MII-pH, and were referred for further evaluation of LPR from July 1, 2015 to April 30, 2018. All patients subsequently underwent laryngoscopy and HMII by a single expe-rienced laryngologist (T.S.). EES were defined as globus sensation, chronic cough, dysphonia, abnormal sensation in the mouth (hali-tosis, dry mouth, and bitter or acidic taste), and of the laryngophar-ynx. Patients with APE as measured by HMII were offered ARS, and subsequently underwent ARS by a single experienced surgeon (Y.S.). Detailed demographic data, subjective data (Reflux Symp-tom Index [RSI]), and objective data (endoscopic, MII-pH, and HMII findings) were obtained from the medical records. The out-come of ARS was objectively assessed using RSI before and after ARS. The following examination was similar to that in a recent our study;5 as such, the description of the methodology is abbreviated
Received: October 8, 2020 Revised: February 9, 2021 Accepted: March 8, 2021 This is an Open Access article distributed under the terms of the Creative Commons Attribution Non-Commercial License (http://creativecommons. org/licenses/by-nc/4.0) which permits unrestricted non-commercial use, distribution, and reproduction in any medium, provided the original work is properly cited.
*Correspondence: Toshitaka Hoppo, MD, PhD Esophageal Institute, Allegheny Health Network, 4815 Liberty Avenue, Mellon Pavilion, Suite 439, Pittsburgh PA 15224, USA Tel: +1-724-260-7300, Fax: +1-724-260-7310, E-mail: [email protected]
Takeshi Suzuki and Yosuke Seki equally contributed to this work.

7171
Diagnosis of Extraesophageal Symptoms of GERD
Vol. 28, No. 1 January, 2022 (69-77)
below.
Endoscopic EvaluationUpper endoscopy was performed by an experienced gastro-
enterologist. The severity of esophagitis was graded using the LA classification.12
Laryngoscopy was performed by an experienced otolaryngolo-gist to evaluate the laryngohypopharyngeal area and to rule out any known etiology of laryngopharyngeal symptoms.
Combined Multichannel Intraluminal Impedance-pH Testing
MII-pH used the catheter (ZAN-BG-44; Sandhill Scientific Inc, Highlands Ranch, CO, USA) (Fig. 1A), which was posi-tioned 5 cm above the manometrically defined upper margin of the
lower esophageal sphincter. HMII was performed using the specialized catheter (CAZI-
BL-55; Sandhill Scientific Inc), which has 2 pairs of impedance electrodes in the distal esophagus, proximal esophagus, and hy-popharynx (Fig. 1B).13 The top electrode in the hypopharynx was placed 0.5 cm proximal to the upper border of the UES under laryngoscopic guidance (Fig. 1C).
MII-pH was performed OFF PPI in patients without prior evidence of erosive esophagitis, while MII-pH was performed ON PPI when erosive esophagitis was evident prior to PPI therapy. On the other hand, all HMII were performed after at least 10-day discontinuation of PPI. The catheter was inserted through the nos-tril, and was connected to an ambulatory recording device (ZepHr Impedance/pH Reflux Monitoring System; Sandhill Scientific Inc). All measurements were recorded for 24 hours. Acid exposure
Top impedance electrodeMII-pHA C
Hypopharynx
Larynx
Trachea
Esophagus
EsophagealpH sensor
Diaphragma
Stomach
Proximal esophagealimpedance 15 cmand 17 cm above LES
Distal esophagealimpedance 3 cmand 5 cm above LES
HMIIB
Stomach
Diaphragma
Distal esophagealimpedance about3 cm and 5 cm above LES
Proximal esophagealimpedance 2 cmand 4 cm below UES
Hypopharyngeal impedance
Esophagus
Trachea
EsophagealpH sensor
HypopharyngealpH sensor
Figure 1. Location of the impedance electrode (A) A catheter for multichannel intraluminal impedance-pH (MII-pH) has impedance electrodes at 3, 5, 7, 9, 15, and 17 cm and pH probe at 5 cm above the upper border of lower esophageal sphincter (LES). (B) A catheter for hypopharyngeal MII (HMII) has 3 pairs of impedance electrodes (hypopharynx, proximal esophagus; 2 cm and 4 cm below upper esophageal sphincter [UES], and distal esophagus; 21 cm and 23 cm below UES). (C) The top impedance electrode in the hypopharynx indicated by arrows was placed 0.5 cm proximal to the upper border of the UES.
21 Subjects with EES refractory to PPI therapy
who had both MII-pH and HMII
8 Subjects (MII-pH ON PPI group)
LA grade A esophagitis (n = 1)
< 2 cm small hiatal hernia (n = 5)
LPR of 1 or more events per dayand/or
FCR of 5 or more events per day
13 Subjects (MII-pH OFF PPI group)
No esophagitis
< 2 cm small hiatal hernia (n = 3)
Positive for APE Negative for APE
9 Subjects with LPRD
4 Subjects underwent ARS
4 Subjects with
alternate diagnose
or functional disease
HMII
8 Subjects with LPRD
4 Subjects underwent ARS
HMII
Positive for APE
Figure 2. Flow chart of the study. EES, extraesophageal symptoms; PPI, proton pump inhibitor; MII-pH, multichannel intraluminal impedance-pH; HMII, hypopharyngeal multichannel intralumi-nal impedance; LA, Los Angeles; LPR, laryngopharyngeal reflux; FCR, full column reflux; APE, abnormal proximal exposure; LPRD, laryngopharyngeal reflux disease; ARS, antireflux surgery.

72
Takeshi Suzuki, et al
Journal of Neurogastroenterology and Motility 72
time (AET) was calculated automatically, and < 4% per day was defined normal.
Multichannel Intraluminal Impedance-pH and Hypopharyngeal Multichannel Intraluminal Impedance Data Interpretation
Impedance data were analyzed by the specific software (Bioview Analysis; Sandhill Scientific Inc). The software automatically iden-tified any possible reflux events; however each event was individu-ally reviewed to exclude false-positive events by experienced physi-cians (T.M., Y.S., and T.H.). On MII-pH, a distal and a proximal reflux event was considered present when retrograde bolus transit occurred and reached the 5 cm and 17 cm impedance electrodes above the lower esophageal sphincter respectively. On HMII, an LPR event was considered present when retrograde bolus transit occurred across all ring sets and reached the hypopharynx. FCR was defined as reflux that reached the impedance 2 cm distal to the UES but did not reach the hypopharyngeal ring set.
Symptom AssociationThe association between reflux events and clinical symptoms
was assessed based on the symptom index (SI) and the symptom-association probability (SAP). The SI was considered to be positive if the value was ≥ 50%. SAP values of 95% or greater were consid-ered statistically significant.14
Diagnostic Criteria Based on Multichannel Intraluminal Impedance-pH and Upper Endoscopy
Based on the Lyon Consensus, a pathological GERD was considered present when upper endoscopy demonstrated at least 1 of the following findings: LA grade C or D esophagitis, peptic stricture or long-segment Barrett’s mucosa, and/or MII-pH dem-onstrated AET > 6% per day. Endoscopic findings of LA grade A or B esophagitis and AET 4-6% were not adequate to confirm a pathological GERD, and additional evidence such as the total number of reflux events > 80 per day was therefore required to confirm a pathological GERD.
Diagnostic Criteria Based on Hypopharyngeal Multichannel Intraluminal Impedance
Based on the normative data established for LPR and FCR, APE was defined as LPR of 1 or more events per day and/or FCR of 5 or more events per day.10 LPRD was considered present when APE was positive on HMII (Fig. 2).
Antireflux Surgery and Symptom AssessmentLaparoscopic Nissen fundoplication was a choice of ARS for
the patients who had adequate esophageal motility based on high-resolution manometry. To objectively assess clinical symptoms, all patients completed the RSI to quantify the nature and severity of EES the day before HMII (off PPI) and after ARS. RSI is made up of 9-items which ranges from 0 (no problem) to 5 (severe prob-lem), with a maximum total score of 45. Any score of greater than 13 is considered abnormal for EES.15 The outcome of ARS was assessed using before and the most recent RSI.
Statistical MethodsValues are expressed as median (range or interquartile range)
except RSI score as mean ± SD. Statistical significance was deter-mined by Mann-Whitney test and Wilcoxon signed rank test using SPSS software program (version 22; IBM, Armonk, NY, USA). Statistical tests were 2-tailed, and a P-value < 0.05 was considered statistically significant.
Table 1. Demographics for Patients With Suspected Extraesophageal Symptoms
Characteristics Subjects (n = 21)
Sex Male 11/21 (52)Age (yr) 66.0 [21-82]BMI (kg/m2) 21.6 [15.8-32.7]Primary EES Abnormal sensation in the laryngopharynx 6/21 (29) Globus sensation 5/21 (24) Chronic cough 5/21 (24) Dysphonia 3/21 (14) Halitosis 1/21 (5) Sore throat 1/21 (5)Esophageal mucosal injury LA grade Normal 20/21 (95) A 1/21 (5)Hiatal hernia 8/21 (38)RSI 16.7 ± 10.2
EES, extraesophageal symptoms; BMI, body mass index; LA, Los Angeles; RSI, reflux symptom index.Values are expressed as n (%), median (range), or mean ± SD.

7373
Diagnosis of Extraesophageal Symptoms of GERD
Vol. 28, No. 1 January, 2022 (69-77)
Results
Patient DemographicsFrom July 1, 2015 to April 30, 2018, a total of 191 patients
with EES underwent HMII. Of these 191 patients, 21 patients with EES, who had both MII-pH and HMII, were included in this study. The rest of the patients who did not undergo MII-pH prior to referral for HMII and were excluded from the further analysis. Median age and body mass index were 66.0 years (range, 21-82 years) and 21.6 kg/m2 (range, 15.8-32.7 kg/m2), respectively (Table 1). Chief complaints included abnormal sensation in the laryngopharynx (n = 6; 29%), globus sensation (n = 5; 24%),
chronic cough (n = 5; 24%), dysphonia (n = 3; 14%), halitosis (n = 1; 5%), and sore throat (n = 1; 5%). Twelve patients (57%) presented with isolated EES. Nine patients (43%) had concomitant typical GERD symptoms, and all of them had complete resolution of concomitant typical GERD symptoms with PPI therapy but continued to have EES.
Upper Endoscopy and Multichannel Intraluminal Impedance-pH
Of 21 patients, 13 patients had MII-pH OFF PPI (MII-pH OFF PPI group), while 8 patients had MII-pH ON PPI (MII-pH ON PPI group). None of 13 patients in the MII-pH OFF PPI group had esophagitis on endoscopy and all of them had nega-tive MII-pH. Of 8 patients in the MII-pH ON PPI group, LA
Table 2. Multichannel Intraluminal Impedance-pH and Hypopharyngeal Multichannel Intraluminal Impedance Measurements
MII-pH measurements
Subjects
P-valueTotal (n = 21)
MII-pH ON PPI (n = 8)
MII-pH OFF PPI (n = 13)
Reflux events Distal reflux 55 (36-72) 64.5 (56-83) 51 (28-69) 0.166 Proximal reflux 23 (11-39) 31 (18-47) 15 (7-29) 0.057AET 0.7 (0.2-1.1) 0.8 (0.1-1.3) 0.7 (0.3-1.1) 0.986 AET > 6% 0/21 (0) 0/8 (0) 0/13 (0) AET 4-6% 1/21 (5) 1/8 (13) 0/13 (0) AET < 4% 20/21 (95) 7/8 (87) 13/13 (100)Symptom index Positive for EES 1/21 (5) 1/8 (13) 0/13 (0) Positive for typical symptom 4/21 (19) 1/8 (13) 3/13 (23)Symptom association probability Positive for EES 2/19 (11) 2/7 (29) 0/12 (0) Positive for typical symptom 2/19 (11) 1/7 (14) 1/12 (8)
HMII measurements
Reflux events Distal reflux 54.5 (46.5-66.5) 58.5 (45.5-73.5) 54.0 (47.0-65.0) 0.276 FCR 6.0 (5.5-17.0) 10.0 (6.0-17.5) 6.0 (2.0-13.5) 0.287 LPR 0.0 (0.0-1.5) 0.0 (0.0-2.5) 0.0 (0.0-1.5) 0.898Positive APE 17/21 (81) 8/8 (100) 9/13 (69) 0.131AET 6.0 (1.5-10.6) 6.1 (3.2-9.2) 3.9 (1.0-11.2) 0.683Symptom Index Positive for EES 5/21 (24) 3/8 (38) 2/13 (15) Positive for typical symptom 6/21 (29) 3/8 (38) 3/13 (23)Symptom association probability Positive for EES 3/21 (14) 2/8 (25) 1/13 (8) Positive for typical symptom 6/21 (29) 3/8 (38) 3/13 (23)
MII-pH, multichannel intraluminal impedance-pH; AET, acid exposure time; EES, extraesophageal symptoms; HMII, hypopharyngeal multichannel intraluminal impedance; FCR, full column reflux; LPR, laryngopharyngeal reflux; APE, abnormal proximal exposure.

74
Takeshi Suzuki, et al
Journal of Neurogastroenterology and Motility 74
grade A esophagitis was found in 1 (5%) patient even after PPI therapy; however the number of distal reflux was < 80 and AET was < 4%. There was 1 patient without esophagitis whose AET was 4-6%; however the number of distal reflux was < 80. Three patients in the MII-pH OFF PPI group and 5 patients in the MII-pH ON PPI group were found to have small hiatal hernia (< 2 cm). No patients had peptic stricture, histology proven eosino-philic esophagitis or long-segment Barrett’s esophagus. Based on this, 13 patients in the MII-pH OFF PPI group were considered to have persistent EES without presence of pathological GERD, while 8 patients in the MII-pH ON PPI group previously had a diagnosis of pathological GERD, but currently there was no more endoscopic confirmatory evidence for GERD or abnormal acid exposure to the distal esophagus due to PPI therapy. Therefore, all 21 patients were thought to have persistent EES with GERD-unrelated “unknown” etiology.
Laryngoscopy and Hypopharyngeal Multichannel Intraluminal Impedance
Laryngoscopy did not show any known etiology of laryngo-pharyngeal symptoms in the laryngopharynx. Of 21 patients, APE was found in 17 patients (81%) (Fig. 2); 8 patients (38%) and 17 patients (100%) had an abnormal number of LPR events (median, 2.5; range, 1.0-14.0) and events (median, 6.0; range, 5.0-26.0), re-spectively. MII-pH and HMII measurements are summarized in Table 2.
APE was identified in all 8 patients who had MII-pH ON PPI. On the other hand, APE was identified in 9 patients (69%) out of 13 patients who had MII-pH OFF PPI. The median AET on HMII OFF PPI, MII-pH OFF PPI, and ON PPI were 6.0 (1.5-10.6), 0.7 (0.3-1.1), and 0.8 (0.1-1.3) (median [interquartile range]). Good symptom correlation with EES (both SI and SAP) was not frequently seen both in MII-pH and HMII.
Antireflux Surgery Of 17 patients with APE, 8 patients with chronic cough (n =
3), globus sensation (n = 2), abnormal sensation of larynx (n = 2), and halitosis (n = 1) underwent laparoscopic Nissen fundoplica-tion. The remaining 9 patients stayed on PPI therapy. During a median follow-up of 9 months (range, 6-36 months) after ARS, 7 patients were able to discontinue PPI, although 1 patient had to re-sume PPI because of non-steroidal anti-inflammatory drugs use for Herpes zoster. All 8 patients had significant symptomatic improve-ment in the RSI scores after ARS compared to before ARS (19.6 ± 4.9 pre-ARS to 5.8 ± 1.4 post-ARS, P = 0.008). RSI
scores normalized after ARS in all patients. RSI scores changed from 15.2 ± 13.6 pre-ARS to 4.8 ± 2.1 post-ARS in patients in the MII-pH OFF PPI group (P = 0.125), and from 24.0 ± 14.6 pre-ARS to 6.8 ± 5.4 post-ARS in 4 patients in the MII-pH ON PPI group (P = 0.125). There was no difference in change values of RSI score between the groups (Fig. 3).
Discussion
This is the first study to investigate the prevalence of APE using HMII in patients with EES, who were not diagnosed with pathological GERD or were thought to have GERD-unrelated EES with “unknown” etiology based on endoscopy and MII-pH. In the present study, we demonstrated that 81% of patients with EES, who did not have objective evidence of pathological GERD or persistent GERD, had APE indicating LPRD. All patients with APE, who had undergone ARS, had significant symptomatic improvement, suggesting that endoscopy and MII-pH were not sufficient to evaluate the EES, and that the assessment of APE by HMII is essential to identify patients who could have LPRD-related EES and would benefit from ARS.
The Lyon Consensus proposed the definitive evidence of pathological GERD such as endoscopic findings of LA grade C/D esophagitis, esophageal stricture and long-segment Barrett’s esophagus, and abnormal acid exposure to the distal esophagus as evidenced by AET > 6% based on a conventional pH-metry. Additional evidence such as the number of distal reflux events >
Pre-ARS
40
30
20
10
Post-ARS
RS
I
MII-pH ON PPI group
0
*
NS
MII-pH OFF PPI group
Pre-ARSPost-ARS
*
Figure 3. Comparison of the reflux symptom index (RSI) between pre- and post-antireflux surgery (ARS) in multichannel intraluminal impedance-pH (MII-pH) ON proton pump inhibitor (PPI) group and MII-pH OFF PPI group. NS, not significant. *P < 0.05.

7575
Diagnosis of Extraesophageal Symptoms of GERD
Vol. 28, No. 1 January, 2022 (69-77)
80 is required when upper endoscopy demonstrates LA grade A/B esophagitis and AET is between 4% and 6%.3 As such, MII-pH is currently a gold standard to assess acid exposure to the distal esophagus (both AET and the number of reflux events) for a di-agnosis of pathological GERD, especially in patients with typical reflux symptoms such as heartburn and regurgitation. Malhotra et al16 performed MII-pH on 50 consecutive patients with EES refractory to acid suppressive therapy, and demonstrated that 16%, 22%, and 2% patients were found to have EES due to acid reflux, nonacid reflux or both, respectively. This suggested that the imped-ance technology such as MII-pH could increase a diagnostic yield by 36%, compared to a conventional pH-metry, in patients with EES. Therefore, MII-pH was also suggested to be performed in patients with GERD-related EES; however a true benefit of MII-pH to evaluate EES has not been well discussed, and the outcome of ARS in patients with EES selected based on MII-pH remains unpredictable.
There were 2 distinct patient phenotypes in this study. Patients in the MII-pH OFF PPI group were thought not to have patho-logical GERD, while patients in the MII-pH ON PPI group had a prior diagnosis of pathological GERD, but there was no more endoscopic confirmatory evidence for GERD or abnormal acid exposure to the distal esophagus due to PPI therapy. The common characteristics of 2 phenotypes included (1) absence of esophageal mucosal injury, (2) normal acid exposure to the distal esophagus based on MII-pH, even with persistent EES, and (3) scarce symptom correlation between reflux events and EES on MII-pH. Based on this, this population was thought not to have NERD, which accounts for approximately 60% of GERD patients,17 or hypersensitive esophagus. Therefore, all patients were thought to have EES with GERD-unrelated “unknown” etiology. However, 81% of these patients were found to have APE on HMII indicat-ing LPRD, and all patients with APE, who had undergone ARS, had significant symptomatic improvement. This highly suggest that LPRD may be pathophysiologically a different entity from GERD or NERD, and a conventional approach to diagnose GERD based on endoscopy and MII-pH may not be sufficient to evaluate pa-tients with EES suggestive of LPRD.
There appears to be several unique characteristics in patients with LPRD. First, esophageal mucosal injury is not common in patients with LPRD. The previous studies have demonstrated only up to 10% of patients with LPRD had erosive esophagitis, and a majority of patients with LPRD did not have any esophageal muco-sal injury.11,18 Second, patients with LPRD often have normal acid exposure to the distal esophagus. It was reported that only up to
14% of patients with EES showed an abnormal AET on MII-pH even with laryngoscopic findings of LPRD, suggesting that both acid and non-acid reflux could cause EES.18,19 This was further supported by our previous studies, which demonstrated that a large number of APE-positive patients with EES such as chronic cough and adult-onset asthma had negative DeMeester scores and the number of total reflux events were normal.8,9,11 Third, EES is often unresponsive to PPI therapy. Several meta-analyses have demon-strated no diagnostic or therapeutic benefit of PPI to manage pa-tients with LPRD.20-22 Lastly, a symptom correlation between reflux events and EES is often scarce. The previous study demonstrated that only 3 LPR events a week could induce severe inflammation in the hypopharynx, leading to persistent LPR symptoms,23 and this suggest that patients could be symptomatic even without actual LPR events. Because of these unique characteristics of LPRD, it is crucial to measure a direct exposure of gastric contents to the hypo-pharynx using HMII.
The larynx is a sensitive organ to protect lower airway from aspiration, and the network of sensory neurons is therefore abun-dantly distributed on laryngeal and pharyngeal epithelium.24 Any direct exposure of gastric contents to the hypopharynx regardless of whether it is acid or not, could cause EES. Since PPI therapy never reduces or stop reflux events, ARS could be theoretically an ideal treatment option for patients with EES refractory to medical therapy. ARS eliminates all types of reflux including LPR by ana-tomically reconstructing the antireflux barrier function at the gastro-esophageal junction. We have demonstrated promising outcomes of ARS for patients with EES selected based on HMII, suggesting a potential benefit of HMII to select patients with EES for ARS.8,9,11 Approximately 70% of patients with EES such as chronic cough (n = 49) and adult-onset asthma (n = 31) had APE, and 90% of patients with APE had symptomatic improvement after ARS.8,9 In the most recent study, we demonstrated that 73% of the patients with persistent EES despite PPI therapy (n = 52) had APE, and all 12 patients with APE had excellent symptomatic improvement after ARS.11 Carroll et al25 used the same HMII system to select 9 patients with EES for ARS, all of whom achieved significant symp-tomatic improvement after ARS based on RSI (31.7 pre-ARS to 10 post-ARS, P < 0.01). In the present study, all 8 patients with APE had a significant symptomatic improvement after ARS, although none of them had abnormal endoscopic findings or abnormal acid exposure to the distal esophagus on MII-pH. These results sug-gest that a conventional diagnostic approach using endoscopy and MII-pH may not be sufficient to evaluate patients with EES, and HMII may be a reliable diagnostic tool to achieve successful treat-

76
Takeshi Suzuki, et al
Journal of Neurogastroenterology and Motility 76
ment outcomes for LPRD.There are some limitations to this study. First, the AET based
on HMII OFF PPI was higher than that based on MII-pH. The impedance catheter for HMII was placed based on the location of hypopharyngeal impedance electrodes under laryngoscopic guid-ance, and the location of distal pH probe may not be exactly 5 cm proximal to the gastroesophageal junction. Therefore, the AET value may not be accurate. Depending on patients’ body habitus (eg, height and length of esophagus), the AET value could be higher or lower than accurately measured. However, the criteria of APE was constructed only based on the number of hypopharyngeal exposure such as FCR and LPR, and did not include the AET value. Ad-ditionally, the recording was for only 24 hours and the results of MII-pH and HMII may vary, depending on patient’s conditions. Second, we did not use some of other parameters described in the Lyon Consensus, such as gastroesophageal junction morphology, motility value of HRM test, mean nocturnal baseline impedance, and post-reflux swallow-induced peristaltic wave index in MII-pH in the present study, although all parameters need to be put together to obtain the whole picture of disease;26 however all of these param-eters could be supportive but not confirmatory for GERD. APE measured by HMII may be a promising confirmatory parameter to potentially establish the presence of LPR, causing EES. Last, the sample size was small. Further study involving a large sample size is required.
In conclusion, a conventional diagnostic approach using endos-copy and MII-pH may not be sufficient to evaluate patients with EES suggestive of LPRD, although endoscopy and MII-pH are currently the gold standard for the diagnosis of GERD. HMII is essential for diagnosing LPRD by direct measurements of abnor-mal proximal reflux events such as LPR that cause EES. APE as measure by HMII could be a reliable indicator for successful out-come of ARS in patients with EES.
Acknowledgements: We thank Tadanao Takeno for his techni-cal assistance.
Financial support: This work was supported by Japan Society for the Promotion of Science Grants-in-Aid for Scientific Research (Grant No. JP18K09367).
Conflicts of interest: None.
Author contributions: Takeshi Suzuki, Yosuke Seki, Tomoaki Matsumura, Makoto Arai, Toyoyuki Hanazawa, Yoshitaka Oka-moto, Haruhiko Suzuki, Kazunori Kasama, Akiko Umezawa, Yo-shimoti Kurokawa, and Toshitaka Hoppo conceived and designed
the experiments; Takeshi Suzuki, Yosuke Seki, and Tomoaki Mat-sumura performed the experiments and collected the data; Takeshi Suzuki, Yosuke Seki and Toshitaka Hoppo analyzed the data; Takeshi Suzuki and Toshitaka Hoppo wrote the manuscript; and all authors commented on previous versions of the manuscript.
References
1. Vakil N, van Zanten SV, Kahrilas P, Dent J, Jones R. The Montreal definition and classification of gastroesophageal reflux disease: a global evidence-based consensus. Am J Gastroenterol 2006;101:1900-1920.
2. Tauber S, Gross M, Issing WJ. Association of laryngopharyngeal symp-toms with gastroesophageal reflux disease. Laryngoscope 2002;112:879-886.
3. Gyawali CP, Kahrilas PJ, Savarino E, et al. Modern diagnosis of GERD: the Lyon consensus. Gut 2018;67:1351-1362.
4. Abou-Ismail A, Vaezi MF. Evaluation of patients with suspected la-ryngopharyngeal reflux: a practical approach. Curr Gastroenterol Rep 2011;13:213-218.
5. Vaezi MF. Gastroesophageal reflux-related chronic laryngitis: con. Arch Otolaryngol Head Neck Surg 2010;136:908-909.
6. Hicks DM, Ours TM, Abelson TI, Vaezi MF, Richter JE. The preva-lence of hypopharynx findings associated with gastroesophageal reflux in normal volunteers. J Voice 2002;16:564-579.
7. Roman S, Gyawali CP, Savarino E, et al. Ambulatory reflux monitor-ing for diagnosis of gastro-esophageal reflux disease: update of the porto consensus and recommendations from an international consensus group. Neurogastroent Motil 2017;29:1-15.
8. Komatsu Y, Hoppo T, Jobe BA. Proximal reflux as a cause of adult-onset asthma: the case for hypopharyngeal impedance testing to improve the sensitivity of diagnosis. JAMA Surg 2013;148:50-58.
9. Hoppo T, Komatsu Y, Jobe BA. Antireflux surgery in patients with chronic cough and abnormal proximal exposure as measured by hy-popharyngeal multichannel intraluminal impedance. JAMA Surg 2013;148:608-615.
10. Hoppo T, Sanz AF, Nason KS, et al. How much pharyngeal exposure is “normal”? normative data for laryngopharyngeal reflux events using hypopharyngeal multichannel intraluminal impedance (HMII). J Gas-trointest Surg 2012;16:16-24.
11. Suzuki T, Seki Y, Okamoto Y, Hoppo T. Hypopharyngeal multichan-nel intraluminal impedance leads to the promising outcome of antireflux surgery in Japanese population with laryngopharyngeal reflux symptoms. Surg Endosc 2017;32:2409-2419.
12. DiBaise JK. The LA classification for esophagitis: a call for standardiza-tion. Am J Gastroenterol 1999;94:3403-3404.
13. Hoppo T, Jarido V, Pennathur A, et al. Antireflux surgery preserves lung function in patients with gastroesophageal reflux disease and end-stage lung disease before and after lung transplantation. Arch Surg 2011;146:1041-1047.
14. Weusten BL, Roelofs JM, Akkermans LM, Van Berge-Henegouwen GP, Smout AJ. The symptom-association probability: an improved

7777
Diagnosis of Extraesophageal Symptoms of GERD
Vol. 28, No. 1 January, 2022 (69-77)
method for symptom analysis of 24-hour esophageal pH data. Gastroen-terology 1994;107:1741-1745.
15. Belafsky PC, Postma GN, Koufman JA. Validity and reliability of the reflux symptom index (RSI). J Voice 2002;16:274-277.
16. Malhotra A, Freston JW, Aziz K. Use of pH-impedance testing to evaluate patients with suspected extraesophageal manifestations of gastro-esophageal reflux disease. J Clin Gastroenterol 2008;42:271-278.
17. Fujiwara Y, Arakawa T. Epidemiology and clinical characteristics of GERD in the Japanese population. J Gastroenterol 2009;44:518-534.
18. de Bortoli N, Nacci A, Savarino E, et al. How many cases of laryngo-pharyngeal reflux suspected by laryngoscopy are gastroesophageal reflux disease-related? World J Gastroenterol 2012;18:4363-4370.
19. Ang D, Ang TL, Teo EK, et al. Is impedance pH monitoring superior to the conventional 24-h pH meter in the evaluation of patients with laryngorespiratory symptoms suspected to be due to gastroesophageal reflux disease? J Dig Dis 2011;12:341-348.
20. Wei C. A meta-analysis for the role of proton pump inhibitor therapy in patients with laryngopharyngeal reflux. Eur Arch Otorhinolaryngol 2016;273:3795-3801.
21. Liu C, Wang H, Liu K. Meta-analysis of the efficacy of proton pump in-
hibitors for the symptoms of laryngopharyngeal reflux. Braz J Med Biol Res 2016;49:e5149.
22. Sen P, Georgalas C, Bhattacharyya AK. A systematic review of the role of proton pump inhibitors for symptoms of laryngopharyngeal reflux. Clin Otolaryngol 2006;31:20-24.
23. Koufman JA. The otolaryngologic manifestations of gastroesophageal reflux disease (GERD): a clinical investigation of 225 patients using ambulatory 24-hour pH monitoring and an experimental investigation of the role of acid and pepsin in the development of laryngeal injury. Laryn-goscope 1991;101(4 pt 2 suppl 53):1-78.
24. Shiba K, Satoh I, Kobayashi N, Hayashi F. Multifunctional laryngeal motoneurons: an intracellular study in the cat. J Neurosci 1999;19:2717-2727.
25. Carroll TL, Nahikian K, Asban A, Wiener D. Nissen fundoplication for laryngopharyngeal reflux after patient selection using dual pH, full column impedance testing: a pilot study. Ann Oto Rhinol Laryngol 2016;125:722-728.
26. Ghisa M, Barberio B, Savarino V, et al. The Lyon consensus: does it differ from the previous ones? J Neurogastroenterol Motil 2020;26:311-321.

78 2022 The Korean Society of Neurogastroenterology and Motility
J Neurogastroenterol Motil, Vol. 28 No. 1 January, 2022www.jnmjournal.org
JNMJ Neurogastroenterol Motil, Vol. 28 No. 1 January, 2022pISSN: 2093-0879 eISSN: 2093-0887https://doi.org/10.5056/jnm20231
Original ArticleJournal of Neurogastroenterology and Motility
Received: October 11, 2020 Revised: January 15, 2021 Accepted: January 28, 2021 This is an Open Access article distributed under the terms of the Creative Commons Attribution Non-Commercial License (http://creativecommons. org/licenses/by-nc/4.0) which permits unrestricted non-commercial use, distribution, and reproduction in any medium, provided the original work is properly cited.
*Correspondence: Chang-Nyol Paik, MD, PhD Division of Gastroenterology, Department of Internal Medicine, St. Vincent’s Hospital, College of Medicine, The Catholic University of Korea, 93 Jungbu Daero, Paldal-gu, Suwon, Gyeonggi-do 16247, Korea Tel: +82-31-881-8582, Fax: +82-31-253-8898, E-mail: [email protected]
Role of Glucose Breath Test for Small Intestinal Bacterial Overgrowth in Children and Adolescents With Functional Abdominal Pain Disorders in Korea
Jin Lee,1 Chang-Nyol Paik,2* Dae Bum Kim,2 Ji Min Lee,2 Yeon-Ji Kim,2 Sik Kyung Choi,3 and Yeon Jong Cho3
1Department of Pediatrics, Incheon St. Mary’s Hospital, College of Medicine, The Catholic University of Korea, Seoul, Korea; 2Department of Internal Medicine, St. Vincent’s Hospital, College of Medicine, The Catholic University of Korea, Seoul, Korea; and 3Department of Pediatrics, Hanil General Hospital, Seoul, Korea
Background/AimsSmall intestinal bacterial overgrowth (SIBO) is expected in children and adolescents with functional abdominal pain disorders (FAPDs). This study is conducted to estimate the prevalence of SIBO and to investigate the role of SIBO in children and adolescents with FAPDs.
MethodsThis prospective study enrolled children with FAPDs fulfilling the Rome IV criteria. A hydrogen-methane glucose breath test was used to diagnose SIBO. A survey of bowel symptoms using questionnaires, birth history, types of feeding, and the presence of allergy was conducted.
ResultsSixty-eight children and adolescents (range, 6-17 years; median, 12.5 years) were enrolled. SIBO was detected in 14 patients (20.6%). Age (≥ 12 years) (P < 0.003) and loose stool (P = 0.048) were significantly more common in children with SIBO than in children without SIBO. However, the history of allergies (P = 0.031) was less common in children with SIBO than those without SIBO. No significant differences were observed in other demographic findings. In multivariate analysis, age (≥ 12 years) was the independent factor predicting SIBO in children with FAPDs.
ConclusionsSIBO is not uncommon in children and adolescents with FAPDs. Among children aged above 12 years and diagnosed with FAPDs, SIBO is a suspected clinical target for treatment to relieve intestinal symptoms. A further study to investigate the association between intestinal bacteria and history of allergy is needed.(J Neurogastroenterol Motil 2022;28:78-85)
Key WordsAdolescent; Child; Functional abdominal pain disorders; Glucose breath test; Small intestinal bacterial overgrowth

7979
Breath Test and Functional Abdominal Pain Disorders
Vol. 28, No. 1 January, 2022 (78-85)
Introduction
The symptoms of functional abdominal pain disorders (FAP-Ds) based on Rome IV criteria, previously referred to as abdominal pain-related functional gastrointestinal disorders, represent some of the most common gastrointestinal complaints, and affect up to 20% of children in Western countries.1,2 Although the pathophysi-ological mechanisms of FAPDs are still poorly understood and any definitive treatment has yet to be established, altered gastrointestinal motility, hypersensitivity to bowel distension, impaired brain-gut interaction, intestinal dysbiosis, psychosocial problem, and immune mechanism have been suggested as possible multifactorial mecha-nisms. Recently, small intestinal bacterial overgrowth (SIBO) has been cited as one of the etiologic factors for FAPDs, demonstrated by a breath test.3,4
SIBO is defined as an increase in the number of bacteria in the small intestine. Jejunal aspirate culture is considered a gold standard test for SIBO diagnosis. However, this diagnostic method is invasive, expensive, and uncomfortable. Thus recently, a non-invasive breath test has been preferred, because of its simplicity and lower expense. The increase in hydrogen (H2) excretion is gener-ally considered a diagnosis of SIBO in clinical practice. However, nearly 30% of the general population carries mostly intestinal methanogens and produces methane (CH4) as a major by-product of carbohydrate fermentation.5 Therefore, adding CH4 to H2 mea-surement may avoid false-negative results. Although the relatively high prevalence of SIBO in children with functional gastrointesti-nal disorder (FGID) was suggested, there is a paucity of evidence involving children with FAPDs based on concurrent H2 and CH4
breath tests. The study estimated the prevalence of SIBO using a glucose
H2-CH4 breath test and investigated the clinical role of SIBO in children with FAPDs.
Materials and Methods
The protocol was approved by the Institutional Review Boards of Hanil General Hospital of Korea (IRB No. HIRB-2017-003). The study was conducted in compliance with the tenets of the Declaration of Helsinki and International Committee on Harmo-nization Guidelines for Good Clinical Practice. A written Informed consent was obtained from all children or the authorized legal rep-resentatives prior to enrolling the subjects in the study.
Study Population The study was conducted at a secondary teaching hospital in
Seoul, Korea, from July 2017 to April 2020. We enrolled consecu-tive children who visited the institution, fulfilling the Rome IV criteria for FAPDs between 6 years to 18 years of age. The subjects voluntarily participated in the study and their guardians agreed to participate. Exclusion criteria were a history of diabetes, thyroid dis-ease, connective tissue disease, inflammatory bowel disease, or gas-trointestinal or gynecologic surgery. Children who were treated with antisecretory agents such as proton pump inhibitors or histamine H2 receptor blockers, antibiotics, probiotics, prokinetics, narcotics, laxatives, bulking agents, or antidiarrheal agents within the previous 4 weeks; and those with renal insufficiency, major psychiatric prob-lem, hearing disturbance, masticatory dysfunction, and incomplete data, or those who had underwent colonoscopy within the last 3 months, were also excluded.
Study DesignThe survey design encompassed the clinical demographics,
type of feeding (breast milk or formula) during infancy, type of de-livery (vaginal delivery or Cesarean section), and history of allergy of all the enrolled children. Bowel symptoms were surveyed using a questionnaire, and glucose H2-CH4 breath test was used for the diagnosis of SIBO. The children were presented to the pediatric clinic after a minimum of 12 hours of fasting before the test. Physi-cal exercises was not allowed during the test, starting 30 minutes before the test. The end expiratory breath samples were collected at baseline after ingestion of oral glucose solution in 2 g/kg (maximum 50 g) (DIASOL-S SOLN; Tae Joon Pharma, Seoul, Korea), and then for 120 minutes at every 10-minute intervals. Breath tests of the samples with breath test kit (The EasySampler Breath Test Kit; Quintron Instrument Company, Milwaukee, WI, USA) were performed each time by gas chromatography equipment (Quintron BreathTracker SC; Quintron Instrument Company).
Definition of Small Intestinal Bacterial Overgrowth and Assessment of Intestinal Symptom
A positive glucose breath test (GBT) indicating SIBO was defined and classified as follows6,7: (1) an increase in H2 concentra-tion of more than 12 ppm above baseline within 90 minutes (glucose H2 breath test [GHBT+] group) or (2) an increase in CH4 con-centration of more than 10 ppm above baseline within 90 minutes (glucose CH4 breath test [GMBT+] group). The GBT (mixed)+ group was defined when both conditions (GHBT and GMBT

80
Jin Lee, et al
Journal of Neurogastroenterology and Motility 80
groups) were met. All participants completed the bowel symptom questionnaire. The Korean version of the Irritable Bowel Syndrome Quality of Life questionnaire was based on the Rome criteria to-gether with additional questions about gastro intestinal symptoms, and has been verified and used in previous studies.8,9 Besides, 13 questions related to various gastrointestinal symptoms experienced in the last 4 weeks were included. Information on bowel symptoms of discomfort, pain, hard or lumpy stools, loose or watery stools, straining during bowel movements, bowel urgency, mucus passing during bowel movements, abdominal fullness/bloating or swelling, flatus, chest pain or heartburn, the feeling of being full soon after a meal, urinary frequency, and nausea was collected. The severity of symptoms was estimated by the total symptom score, defined by the cumulative scores of event frequency and intrusiveness. The fre-quency and intrusiveness of each symptom were evaluated by each patient using a 7-point scale from 0 to 6. Since the total symptom score was defined as the sum of the symptom frequency and intru-siveness scores, the range of a score by each symptom was 0-12.
Statistical Methods Clinical evaluations included age, sex, body mass index (BMI),
types of feeding or delivery, allergy history, intestinal symptoms, and presence of irritable bowel syndrome (IBS) according to the pres-
ence of SIBO. The profiles of breath H2 and CH4 in children with FAPDs were compared with those of historically healthy controls who were previously registered in the determination of normal GBT value at the Catholic University of Medicine.10 Continu-ous data were expressed as mean ± SD and were analyzed using independent-sample t tests, whereas the categorical variables were expressed as quantities and analyzed using χ2 tests. Multiple step-wise logistic regression was used to identify independent factors correlated with the existence of the SIBO. A P-value less than 0.05 was considered significant for all tests.
Results
Study Populations Seventy children enrolled in the study. Two subjects were ex-
cluded from the analysis due to a sampling error, and incompletion of demographic data or bowel symptom questionnaire. Baseline characteristics including demographics and type of feeding, delivery and allergy are shown in Table 1. Twenty children were allergic, and involved several types of allergy: atopic dermatitis (n = 5), al-lergic rhinitis (n = 4), pollen allergy (n = 2), food allergy involving mushroom (n = 1) or fruits such as apple, kiwi, and watermelon (n = 2), insect allergy (n = 1), dust allergy (n = 1), cold allergy (n = 1), urticaria (n = 1), asthma with allergic rhinitis (n = 1), allergic rhinitis with atopic dermatitis (n = 1), or cat allergy combined with allergy to nuts (n = 1).
Table 1. Baseline Characteristics of Children and Adolescents With Functional Gastrointestinal Disorders (N = 68)
Demographics
Age (yr) 12.24 ± 2.94 (range 6-17)Gender Male 25 (36.8) Female 43 (63.2)Height (cm) 152.35 ± 14.60Weight (kg) 46.00 ± 15.18BMI (kg/m2) 19.27 ± 3.56Types of feeding Breast milk 26 (38.2) Formula 46 (25.0) Mixed 25 (36.8)Types of delivery Vaginal delivery 42 (61.8) Cesarean section 26 (38.2)Allergy history 20 (29.4)Positive GBT 14 (20.6) H2 6 (8.8) H2 + CH4 8 (11.8)
BMI, body mass index; GBT, glucose breath test; H2, hydrogen; CH4, meth-ane. Data are expressed as mean ± SD or n (%).
Figure 1. Comparison of breath hydrogen and methane profiles (parts per million [ppm]) between historic controls and children with func-tional abdominal pain disorders (FAPDs).
18
16
14
12
10
8
6
4
2
120
(pp
m)
(min)
0 10 20 30 40 50 60 70 80 90 100 110
Hydrogen (control)
Hydrogen (children with FAPDs)
Methane (control)
Methane (children with FAPDs)

8181
Breath Test and Functional Abdominal Pain Disorders
Vol. 28, No. 1 January, 2022 (78-85)
Glucose Breath Test in Children With Functional Abdominal Pain Disorders and Healthy Controls
Fourteen of 68 children (20.6%) were positive in the GBT; 6 (8.8%) excreted H2, and 8 (11.8%) were combined excreters, whereas none was included in the CH4 excreters (Table 1). There were significant differences in the exhaled H2 at intervals of 0, 30, 50, 60, 70, 80, 100, 110, and 120 minutes, and in CH4 from 10 to 120 minutes intervals between the children with FAPDs and con-trols, respectively (Fig. 1).
Characteristics of Children With Functional Abdominal Pain Disorders According to Glucose Breath Test Positivity
No difference was found between GBT positive (GBT+) and negative (GBT−) children regarding gender, BMI, types of feed-ing, and types of delivery. In the GBT+ children with FAPDs, the age was significantly higher whereas the presence of allergy histories was significantly lower than those of GBT− children with FAPDs
(Table 2). In multivariable logistic regression, age ≥ 12 was the only significant independent factor predicting SIBO in children with FAPDs. A history of allergy inversely correlated with SIBO with statistically significant tendency (Table 3). The breath H2 pro-files at all the time points were significantly higher in children with a history of allergy compared with those without (Fig. 2).
Bowel Symptoms According to Glucose Breath Test Positivity in Children With Functional Abdominal Pain Disorders
Although GBT+ children with FAPDs had high individual total symptom scores regarding abdominal pain, hard stool, strain, urgency, bloating, flatus, satiety, frequent urination, and nausea (Fig. 3), the total frequency scores (32.50 ± 12.23 vs 28.76 ± 12.43, P = 0.321), total bothersome scores (24.86 ± 15.64 vs 21.43 ± 13.34, P = 0.411), and total sum scores (57.36 ± 27.16 vs 50.19 ± 24.77, P = 0.347) compared to those of GBT− children with
Table 2. The Characteristics of Children With Functional Gastroin-testinal Disorders to the Positivity to Glucose Breath Test
DemographicsGBT
P-valueNegative (n = 54) Positive (n = 14)
Age (yr) 11.91 ± 3.00 13.50 ± 2.38 0.070 < 12 32 (59.3) 2 (5.9) 0.003 ≥ 12 22 (40.7) 12 (85.7)Gender Male 20 (37.0) 5 (35.7) 0.927 Female 34 (63.0) 9 (64.3)BMI (kg/m2) 18.88 ± 3.27 20.75 ± 4.34 0.080Types of feeding Breast milk 24 (44.4) 2 (14.3) 0.079 Formula 11 (20.4) 6 (42.9) Mixed 19 (35.2) 6 (42.9)Types of delivery Vaginal delivery 32 (59.3) 10 (71.4) 0.404 Cesarean section 22 (40.7) 4 (28.6)Allergy history No 35 (64.8) 13 (92.9) 0.031 Yes 19 (35.2) 1 (7.1)IBS No 38 (70.4) 6 (42.9) 0.056 Yes 16 (29.6) 8 (57.1)
GBT, glucose breath test; BMI, body mass index; IBS, irritable bowel syn-drome. Data are expressed as mean ± SD or n (%).
Table 3. Multivariate Analysis for the Independent Factors of Posi-tive Glucose Breath Test
Demographics OR 95% CI P-value
Age ≥ 12 yr 11.364 1.621-76.923 0.014BMI (kg/m2) 1.023 0.819-1.276 0.844The presence of allergy 0.129 0.011-1.546 0.106IBS 3.390 0.691-16.667 0.133Types of feeding Breast milk 0.526 0.055-5.053 0.578 Powdered milk 3.540 0.572-21.914 0.174
GBT, glucose breath test; BMI, body mass index; IBS, irritable bowel syn-drome.
Figure 2. Profiles (parts per million [ppm]) of breath hydrogen in children with functional abdominal pain disorders (FAPDs) based on history of allergic disease.
20
18
16
14
12
10
8
6
4
2
120
(pp
m)
(min)
0 10 20 30 40 50 60 70 80 90 100 110
Allergy ( )
Allergy (+)

82
Jin Lee, et al
Journal of Neurogastroenterology and Motility 82
FAPDs, showed no significant differences between the 2 groups. In the GBT+ group, the total symptom scores of loose stool were significantly higher than those of the GBT− group (5.86 ± 3.03 vs 3.98 ± 3.13, P = 0.048) (Fig. 3).
Discussion
The current study showed that SIBO is not uncommon in chil-dren and adolescents with FAPDs. It appears to be closely related to worsening intestinal symptoms in children older than 12 years diagnosed with FAPDs, and represents a meaningful therapeutic target for amelioration of functional intestinal symptoms.
The causes of FGID include not only SIBO but also a number of factors including altered bowel motility, visceral hypersensitivity, abnormal brain-gut interaction, autonomic dysfunction, and activa-tion of the immune system.11 SIBO could induce functional gastro-intestinal symptoms in adults or children, such as chronic abdomi-nal pain, bloating, diarrhea, flatulence, and/or constipation.3,12-14
Direct jejunal aspirate culture is the gold standard method for diagnosing SIBO. However, this method has limitations such as difficulty in accessing the distal small bowel, possibility of contami-nation during sampling, low reproducibility, and potential for false negative results.15-17 It is also somewhat uncomfortable and invasive. Thus a breath test is a simple alternative and an acceptable diagnos-tic method for SIBO. Various factors including substrate types, cri-teria for test results, gas types measured (H2 or CH4), and research design could directly affect the results of breath test. Accordingly, a wide variety of prevalence of SIBO has been reported.18,19 There are still controversy to usefulness for breath tests to reflect SIBO in pa-tients with FGID.20,21 In addition, most proposed guidelines22,23 for
breath tests are based on research for adults, and thus it is unclear whether this proposal will also apply to children.
However, this non-invasive method may be more appropriate in children who are burdened with invasive tests. The first Rome H2-Breath Testing Consensus Conference Working Group (2009) rec-ommended the GBT instead of lactulose breath test for diagnostic accuracy.22 The advantage of breath test using glucose as a substrate over lactulose is low false positivity and superior diagnostic ability of proximal SIBO.24,25 In children who are expected to have a low BMI compared to that of adults, the intestinal transit time is also relatively short, and therefore, glucose was selected for breath tests. During lactulose breath tests, it is difficult to distinguish SIBO from colonic bacteria if intestinal transit is fast,26,27 and importantly lactulose itself induces rapid small intestine transit.28 The study demonstrated that the prevalence of SIBO in children with FAPDs was 20.6% (14/68) using the H2-CH4 GBT, which was consistent with other study results with a prevalence of 22.5% in children.6 Only a single study3 involving children with abdominal pain-related FGIDs according to the Rome III criteria demonstrated an SIBO prevalence of 14.3% in English literature, which measured only H2 produced by SIBO, and included baseline breath H2 ≥ 20 ppm testing positive to GHBT. Our study evaluates both breath H2 and CH4 to detect hydrogenic and methanogenic bacteria, respectively. It is known that about 15-27% of SIBO patients are CH4 produc-ers.5 The prevalence of SIBO can be underestimated without mea-suring breath CH4. Recently, the North American Consensus did not recommend the baseline breath profile as positivity to breath test due to the need for clarifying whether it was a result of improper test preparation or represented a SIBO variant.23 We excluded the fasting breath profiles as diagnostic criteria for SIBO, and only in-
Figure 3. Total symptom scores of indi-vidual bowel symptoms based on posi-tive glucose breath test (GBT) results in children with functional abdominal pain disorders.
Abdom
inal
pain
Har
dst
ool
Loss
est
ool
Strai
n
Urg
ency
Tenes
mus
Mucu
s
Blo
atin
g
Flatu
s
Ches
t disco
mfo
rt
Satie
ty
Freq
uent urin
atio
n
Nau
sea
8
7
6
5
4
3
2
1
0
GBT ( )
GBT (+)

8383
Breath Test and Functional Abdominal Pain Disorders
Vol. 28, No. 1 January, 2022 (78-85)
cluded positivity to GBT using a cutoff of increased breath profiles compared with participant baselines.23 However, these recommen-dations are based on studies of adults and extrapolation to children needs further investigation.
The other strength of this study is that it was conducted in Asia. The clinical use of breath test in Asia has occurred only in the last few years, being lagging in time compared to the West. The prevalence of SIBO is thought to be different between patients with Asian and Western countries due to main dietary habit, physi-cal status, or bowel transit time.29-31 This study provided evidence that SIBO using breath test play an important role in children with functional intestinal symptoms in Asia as well as in Western children. Future studies are needed to conduct additional compara-tive studies on the different targeting age groups, effects of dietary habits and lifestyles between those in Asia and Western countries, or research on immigrants in Korea.
The potential limitation relates to the use of fewer historical adult controls compared with the cases. However, the breath H2
profiles at most time points during the tests involving cases were increased compared with those of adult controls as shown in Figure 1. Because age itself is a known risk factor for SIBO, the profiles of breath tests in adult controls were expected to be higher than in controls with children.32 Nevertheless, the range of prevalence of SIBO in children is still very wide due to various diagnostic cutoff values and methodologies.4 Therefore, further research is needed to verify the diagnosis of bacterial overgrowth in children by GBT.
The age of 12 years and older equivalent to that of subjects in middle school and high school is a significant predicting factor for SIBO in children and adolescents with FAPDs. SIBO seems to be more prevalent among older individuals despite studies involv-ing adults,32 who are more likely to have reduced intestinal motility, small bowel diverticulosis, low gastric secretory function, or a strong history of medication usage. Although non-significant statistical differences in multivariate analysis were shown, a low level of BMI, the presence of IBS, or loose stool were associated with SIBO in this study. Still in debate, the prevalence of SIBO is reported to be high in patients with IBS, or chronic diarrhea.21 The prevalence of breast feeding and allergic history tended to be low in the pres-ence of SIBO. Representative factors predicting the status of gut microbiota during infancy include the types of delivery and feeding practices. A study suggested that dysbiosis was significantly related to lack of breastfeeding, but showed no evidence of association with mode of delivery,33 which is consistent with our results. However, the relationship between breastfeeding and gut microbiome is mostly evaluated using fecal samples. More studies are needed to
investigate the link between SIBO and breastfeeding using breath tests.
Evidence shows that intestinal microflora is a crucial factor in immune system maturation and tolerance.34,35 Interestingly, a history of allergy is inversely correlated with the GBT profiles in Figure 2, which is contrary to previous studies. A recent study has shown that SIBO was linked to allergic disease.36 However, the study design was retrospective and involved a small number of subjects. Very few studies correlating SIBO and allergy have been reported. In 1 study, the prevalence of SIBO in patients with chronic urticaria was higher than in the healthy population, but the eradication of SIBO was not related to clinical improvements in patients with chronic ur-ticaria.37 A well-designed prospective study with a larger number of patients is needed. The hygiene hypothesis in allergy suggests that exposure to enriched microbial environment improves the immune response in patients with allergic diseases.38 Although the breath test failed to detect the diversity of gut microbiota, the presence of bacteria demonstrated by breath test may indirectly reflect the beneficial status of allergic diseases. It is also possible that the SIBO negative results were caused by frequent overuse of antibiotics in patients with allergic diseases that manifested as upper respiratory tract infections. The antibiotic prescription rate is very high in Ko-rea, where the study was conducted. According to data presented by the Organisation for Economic Co-operation and Development (OECD) in 2014, the rate of antibiotic consumption in Korea was 31.7 defined daily doses per 1000 inhabitants/day (DID), which is higher than the average rate of 20.5 DID in OECD countries.39 A future study is needed to validate the diagnosis of bacterial over-growth based on breath tests and diversity of microbiota.
Loose stool can occur significantly in FAPD children with SIBO. We evaluated each gastrointestinal symptom using a vali-dated questionnaire. Although the symptom scores of abdominal pain, hard stool, strain, urgency, bloating, flatus, satiety, frequent urination, and nausea were higher in GBT+ compared with those of GBT− children, no significant differences were observed be-tween the 2 groups. The foregoing results are based on a small sample size. The symptoms of hard stool and strain related to slow intestinal transit may be associated with CH4.
5,40 However, no pure CH4 excretors were detected in our study, and the clinical charac-teristics of subjects with CH4 gas related symptoms could not be investigated. The prevalence of CH4 excretors with age is known to be high, ranging from 3% in the 6-10 years old group to 45% in the 46-50 years old group.41 Thus, children with SIBO excreting CH4 constituted a relatively low proportion in our study.
In conclusion, SIBO in children and adolescents with FAPD

84
Jin Lee, et al
Journal of Neurogastroenterology and Motility 84
was not uncommon. SIBO is a suspected therapeutic target for al-leviating bowel symptoms of children older than 12 years manifest-ing functional gastrointestinal symptom such as loose stool. Further studies are needed to elucidate the role of SIBO in children and adolescents diagnosed with FAPD by demonstrating the potential response to antibiotic treatment.
Acknowledgements: This study was supported by the Korean Society of Pediatric Infectious Diseases. The authors are solely re-sponsible for the content, which does not necessarily represent the official views of the Korean Society of Pediatric Infectious Diseases.
Financial support: None.
Conflicts of interest: None.
Author contributions: Jin Lee and Chang-Nyol Paik con-tributed to the study design, data interpretation, and writing of the manuscript; Jin Lee, Yeon-Ji Kim, Dae Bum Kim, Ji Min Lee, Sik Kyung Choi, Yeon Jong Cho, and Chang-Nyol Paik collected and interpreted the data; and Jin Lee, Chang-Nyol Paik, and Dae Bum Kim contributed to the study design and critically reviewed the manuscript. All authors approved the final draft.
References 1. Chitkara DK, Rawat DJ, Talley NJ. The epidemiology of childhood
recurrent abdominal pain in Western countries: a systematic review. Am J Gastroenterol 2005;100:1868-1875.
2. Koppen IJ, Nurko S, Saps M, Di Lorenzo C, Benninga MA. The pe-diatric Rome IV criteria: what’s new? Expert Rev Gastroenterol Hepatol 2017;11:193-201.
3. Korterink JJ, Benninga MA, van Wering HM Deckers-Kocken JM. Glucose hydrogen breath test for small intestinal bacterial overgrowth in children with abdominal pain-related functional gastrointestinal disorders. J Pediatr Gastroenterol Nutr 2015;60:498-502.
4. Avelar Rodriguez D, Ryan PM, Toro Monjaraz EM, Ramirez Mayans JA, Quigley EM. Small intestinal bacterial overgrowth in children: a state-of-the-art review. Front Pediatr 2019;7:363.
5. Lin HC. Small intestinal bacterial overgrowth: a framework for under-standing irritable bowel syndrome. JAMA 2004;292:852-858.
6. Sieczkowska A, Landowski P, Zagozdzon P, Kaminska B, Lifschitz C. Small bowel bacterial overgrowth associated with persistence of abdomi-nal symptoms in children treated with a proton pump inhibitor. J Pediatr 2015;166:1310-1312, e1.
7. Donowitz JR, Haque R, Kirkpatrick BD, et al. Small intestine bacterial overgrowth and environmental enteropathy in Bangladeshi children. mBio 2016;7:e02102-e02115.
8. Park JM, Choi MG, Oh JH, et al. Cross-cultural validation of irritable bowel syndrome quality of life in Korea. Dig Dis Sci 2006;51:1478-1484.
9. Park JM, Choi MG, Kim YS, et al. Quality of life of patients with irri-table bowel syndrome in Korea. Qual Life Res 2009;18:435-446.
10. Lee JM, Lee KM, Chung YY, et al. Clinical significance of the glucose breath test in patients with inflammatory bowel disease. J Gastroenterol Hepatol 2015;30:990-994.
11. Longstreth GF, Thompson WG, Chey WD, Houghton LA, Mea-rin F, Spiller RC. Functional bowel disorders. Gastroenterology 2006;130:1480-1491.
12. Collins BS, Lin HC. Double-blind, placebo-controlled antibiotic treat-ment study of small intestinal bacterial overgrowth in children with chronic abdominal pain. J Pediatr Gastroenterol Nutr 2011;52:382-386.
13. de Boissieu D, Chaussain M, Badoual J, Raymond J, Dupont C. Small-bowel bacterial overgrowth in children with chronic diarrhea, abdominal pain, or both. J Pediatr 1996;128:203-207.
14. Siniewicz-Luzeúczyk K, Bik-Gawin A, Zeman K, Bąk-Romaniszyn L. Small intestinal bacterial overgrowth syndrome in children. Prz Gastro-enterol 2015;1:28-32.
15. Ford AC, Spiegel BM, Talley NJ, Moayyedi P. Small intestinal bacterial overgrowth in irritable bowel syndrome: systematic review and meta-analysis. Clin Gastroenterol Hepatol 2009;7:1279-1286.
16. Sachdeva S, Rawat AK, Reddy RS, Puri AS. Small intestinal bacterial overgrowth (SIBO) in irritable bowel syndrome: frequency and predic-tors. J Gastroentero Hepatol 2011;26(suppl 3):135-138.
17. Pimentel M, Lin HC, Enayati P, et al. Methane, a gas produced by enteric bacteria, slows intestinal transit and augments small in-testinal contractile activity. Am J Physiol Gastrointest Liver Physiol 2006;290:G1089-G1095.
18. Collins BS, Lin HC. Chronic abdominal pain in children is associated with high prevalence of abnormal microbial fermentation. Dig Dis Sci 2010;55:124-130.
19. Ghoshal UC, Shukla R, Ghoshal U. Small intestinal bacterial over-growth and irritable bowel syndrome: a bridge between functional or-ganic dichotomy. Gut Liver 2017;11:196-208.
20. Shah ED, Basseri RJ, Chong K, Pimentel M. Abnormal breath testing in IBS: a meta analysis. Dig Dis Sci 2010;55:2441-2449.
21. Chen B, Kim JJ, Zhang Y, Du L, Dai N. Prevalence and predictors of small intestinal bacterial overgrowth in irritable bowel syndrome: a sys-tematic review and meta-analysis. J Gastroenterol 2018;53:807-818.
22. Gasbarrini A, Corazza GR, Gasbarrini G, et al. Methodology and indi-cations of H2-breath testing in GI diseases: the Rome Consensus Confer-ence.Aliment Pharmacol Ther 2009;29(suppl 1):1-49.
23. Rezaie A, Buresi M, Lembo A, et al. Hydrogen and methane-based breath testing in gastrointestinal disorders: the north American consensus. Am J Gastroenterol 2017;112:775-784.
24. Simrén M, Stotzer PO. Use and abuse of hydrogen breath tests. Gut 2006;55:297-303.
25. Sellin JH, Hart R. Glucose malabsorption associated with rapid intestinal transit. Am J Gastroenterol 1992;87:584-589.
26. Walters B, Vanner SJ. Detection of bacterial overgrowth in IBS using the lactulose H2 breath test: comparison with 14C-D-xylose and healthy controls. Am J Gastroenterol 2005;100:1566-1570.
27. Riordan SM, McIver CJ, Walker BM, Duncombe VM, Bolin TD,
8585
Breath Test and Functional Abdominal Pain Disorders
Vol. 28, No. 1 January, 2022 (78-85)
Thomas MC. The lactulose breath hydrogen test and small intestinal bacterial overgrowth. Am J Gastroenterol 1996;91:1795-1803.
28. Bond JH Jr, Levitt MD, Prentiss R. Investigation of small bowel transit time in man utilizing pulmonary hydrogen (H2) measurements. J Lab Clin Med 1975;85:546-555.
29. Nam KC, Jo C, Lee M. Meat products and consumption culture in the East. Meat Sci 2010;86:95-102.
30. Gwee KA, Bak YT, Ghoshal UC, et al. Asian consensus on irritable bowel syndrome. J Gastroenterol Hepatol 2010;25:1189-1205.
31. Yu D, Cheeseman F, Vanner S. Combined oro-caecal scintigraphy and lactulose hydrogen breath testing demonstrate that breath testing detects oro-caecal transit, not small intestinal bacterial overgrowth in patients with IBS. Gut 2011;60:334-340.
32. Choung RS, Ruff KC, Malhotra A, et al. Clinical predictors of small intestinal bacterial overgrowth by duodenal aspirate culture. Aliment Pharmacol Ther 2011;33:1059-1067.
33. Akagawa S, Tsuji S, Onuma C, et al. Effect of delivery mode and nutri-tion on gut microbiota in neonates. Ann Nutr Metab 2019;74:132-139.
34. Gourbeyre P, Denery S, Bodinier M. Probiotics, prebiotics, and synbiot-ics: impact on the gut immune system and allergic reactions. J Leukoc Biol 2011;89:685-695.
35. Nakayama J, Kobayashi T, Tanaka S, et al. Aberrant structures of fecal
bacterial community in allergic infants profiled by 16S rRNA gene pyro-sequencing. FEMS Immunol Med Microbiol 2011;63:397-406.
36. Peña-Vélez R, Toro-Monjaraz E, Avelar-Rodríguez D, et al. Small intestinal bacterial overgrowth: could it be associated with chronic ab-dominal pain in children with allergic diseases? Rev Esp Enferm Dig 2019;111:927-930.
37. Campanati A, Gesuita R, Giannoni M, et al. Role of small intestinal bacterial overgrowth and Helicobacter pylori infection in chronic sponta-neous urticaria: a prospective analysis. Acta Derm Venereol 2013;93:161-164.
38. Untersmayr E, Bax HJ, Bergmann C, et al. AllergoOncology: micro-biota in allergy and cancer-a European academy for allergy and clinical immunology position paper. Allergy 2019;74:1037-1051.
39. Organisation for Economic Co-operation and Development. Antibiotic consumption levels, Paris. Available from URL: https://www.oecd.org/health/antimicrobial-resistance.htm (accessed 22 Nov 2021).
40. Pimentel M, Chow EJ, Lin HC. Normalization of lactulose breath test-ing correlates with symptom improvement in irritable bowel syndrome. a double-blind, randomized, placebo-controlled study. Am J Gastroenterol 2003;98:412-419.
41. Polag D, Leiß O, Keppler F. Age dependent breath methane in the Ger-man population. Sci Total Environ 2014;481:582-587.
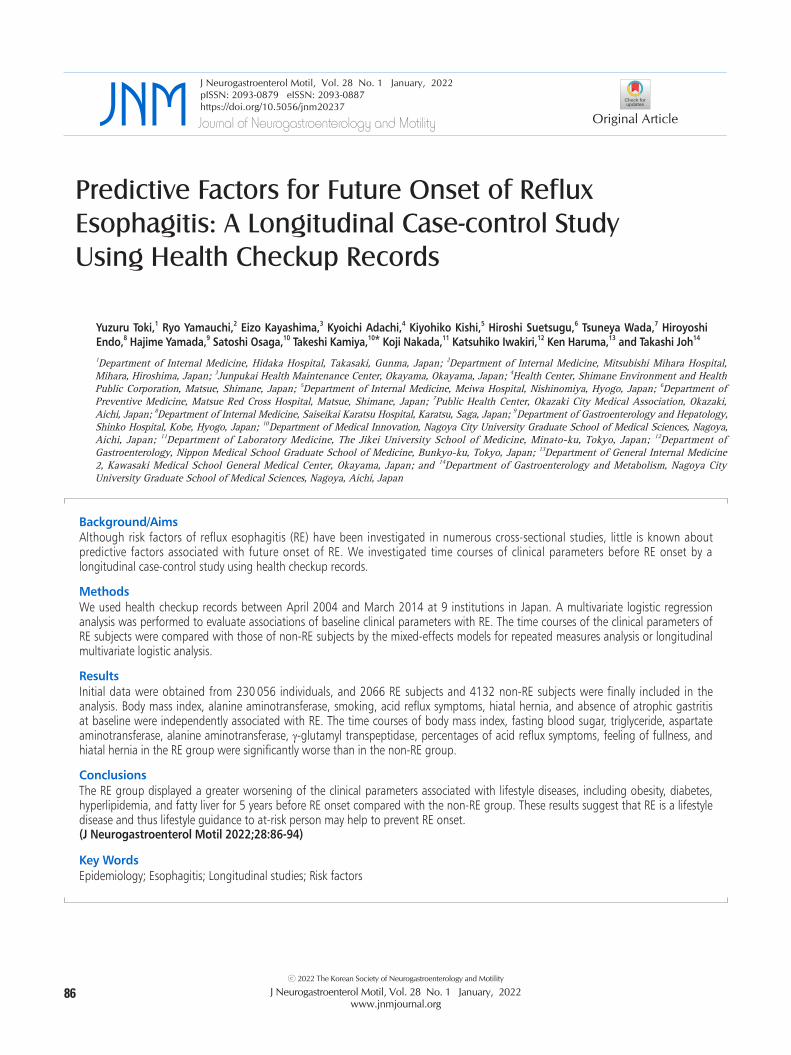
86 2022 The Korean Society of Neurogastroenterology and Motility
J Neurogastroenterol Motil, Vol. 28 No. 1 January, 2022www.jnmjournal.org
JNMJ Neurogastroenterol Motil, Vol. 28 No. 1 January, 2022pISSN: 2093-0879 eISSN: 2093-0887https://doi.org/10.5056/jnm20237
Original ArticleJournal of Neurogastroenterology and Motility
Predictive Factors for Future Onset of Reflux Esophagitis: A Longitudinal Case-control Study Using Health Checkup Records
Yuzuru Toki,1 Ryo Yamauchi,2 Eizo Kayashima,3 Kyoichi Adachi,4 Kiyohiko Kishi,5 Hiroshi Suetsugu,6 Tsuneya Wada,7 Hiroyoshi Endo,8 Hajime Yamada,9 Satoshi Osaga,10 Takeshi Kamiya,10* Koji Nakada,11 Katsuhiko Iwakiri,12 Ken Haruma,13 and Takashi Joh14
1Department of Internal Medicine, Hidaka Hospital, Takasaki, Gunma, Japan; 2Department of Internal Medicine, Mitsubishi Mihara Hospital, Mihara, Hiroshima, Japan; 3Junpukai Health Maintenance Center, Okayama, Okayama, Japan; 4Health Center, Shimane Environment and Health Public Corporation, Matsue, Shimane, Japan; 5Department of Internal Medicine, Meiwa Hospital, Nishinomiya, Hyogo, Japan; 6Department of Preventive Medicine, Matsue Red Cross Hospital, Matsue, Shimane, Japan; 7Public Health Center, Okazaki City Medical Association, Okazaki, Aichi, Japan; 8Department of Internal Medicine, Saiseikai Karatsu Hospital, Karatsu, Saga, Japan; 9Department of Gastroenterology and Hepatology, Shinko Hospital, Kobe, Hyogo, Japan; 10Department of Medical Innovation, Nagoya City University Graduate School of Medical Sciences, Nagoya, Aichi, Japan; 11Department of Laboratory Medicine, The Jikei University School of Medicine, Minato-ku, Tokyo, Japan; 12Department of Gastroenterology, Nippon Medical School Graduate School of Medicine, Bunkyo-ku, Tokyo, Japan; 13Department of General Internal Medicine 2, Kawasaki Medical School General Medical Center, Okayama, Japan; and 14Department of Gastroenterology and Metabolism, Nagoya City University Graduate School of Medical Sciences, Nagoya, Aichi, Japan
Background/AimsAlthough risk factors of reflux esophagitis (RE) have been investigated in numerous cross-sectional studies, little is known about predictive factors associated with future onset of RE. We investigated time courses of clinical parameters before RE onset by a longitudinal case-control study using health checkup records.
MethodsWe used health checkup records between April 2004 and March 2014 at 9 institutions in Japan. A multivariate logistic regression analysis was performed to evaluate associations of baseline clinical parameters with RE. The time courses of the clinical parameters of RE subjects were compared with those of non-RE subjects by the mixed-effects models for repeated measures analysis or longitudinal multivariate logistic analysis.
ResultsInitial data were obtained from 230 056 individuals, and 2066 RE subjects and 4132 non-RE subjects were finally included in the analysis. Body mass index, alanine aminotransferase, smoking, acid reflux symptoms, hiatal hernia, and absence of atrophic gastritis at baseline were independently associated with RE. The time courses of body mass index, fasting blood sugar, triglyceride, aspartate aminotransferase, alanine aminotransferase, γ-glutamyl transpeptidase, percentages of acid reflux symptoms, feeling of fullness, and hiatal hernia in the RE group were significantly worse than in the non-RE group.
ConclusionsThe RE group displayed a greater worsening of the clinical parameters associated with lifestyle diseases, including obesity, diabetes, hyperlipidemia, and fatty liver for 5 years before RE onset compared with the non-RE group. These results suggest that RE is a lifestyle disease and thus lifestyle guidance to at-risk person may help to prevent RE onset.(J Neurogastroenterol Motil 2022;28:86-94)
Key WordsEpidemiology; Esophagitis; Longitudinal studies; Risk factors

8787
Risk Factors for Onset of Reflux Esophagitis
Vol. 28, No. 1 January, 2022 (86-94)
Introduction
Reflux esophagitis (RE) is a disease in which the reflux of gastric contents into the esophagus causes superficial erosion of the mucosa of the lower esophagus, and its prevalence and burden have recently increased.1,2 Risk factors of RE proposed in previous studies included obesity,3-5 being male,4,6 hiatal hernia,7-9 absence of atrophic gastritis,10 advanced age,11 diabetes,12 drinking,4,9,12 smok-ing,4,9,12 metabolic syndrome,9,13,14 Helicobacter pylori negative,4,10 and high serum pepsinogen I/II ratio.4 However, these factors were found in cross-sectional studies and the systematic reviews based on them, and little is known about predictive factors associated with future RE onset because of a lack of longitudinal studies. Although 1 longitudinal study15 proposed that a > 1% increase in the body mass index (BMI) over 5 years, hiatal hernia, and drinking were risk factors of RE after 5 years, we cannot consider possible RE on-set risk factors based on this report, because Azumi et al15 focused mainly on changes in the prevalence of reflux symptoms and RE over 5 years rather than the associated factors of future RE onset and thus did not exclude patients already with RE at the start of the follow-up. A further longitudinal study16 showed that being male, BMI ≥ 27 kg/m2, smoking, drinking, hyperuricemia, and meta-bolic syndrome were risk factors of RE onset within 1 year. How-ever, it remains unclear whether long-term changes of these factors are associated with future RE onset.
Patients with RE frequently suffer from troublesome symp-toms,17 which also impair their health-related quality of life (HRQOL).18 While RE may also cause complications, including bleeding and stricture of the esophagus,19,20 and rarely esophageal adenocarcinoma following Barrett’s esophagus,21 it is generally con-sidered a chronic and non-life-threatening disease. Although it is difficult to conduct long-term cohort studies to focus on risk factors of future RE, retrospective studies can be implemented when con-secutive health information for multiple years is available for clinical studies. Fortunately, in Japan, an annual health checkup is routinely conducted mainly for company employees, and upper gastrointes-tinal endoscopy is commonly performed even in healthy examinees.
Therefore, we conducted a multicenter retrospective study to in-vestigate factors associated with future RE onset using long-term health checkup records in Japan.
Materials and Methods
This was a multicenter, retrospective, longitudinal study using health checkup records from 9 institutions in Japan. This study was conducted in accordance with the Declaration of Helsinki (7th revision, 2013), having been approved by the Central Eth-ics Committee of the Japanese Association for the Promotion of State-of-the-Art in Medicine, Nagoya, Aichi, Japan (Registra-tion No. JAPSAM-2011). This study was registered with the University Hospital Medical Information Network Center Clini-cal Trials Registry in Japan (UMIN-CTR Registration No. UMIN000014640).
PopulationNine Japanese institutions, which met following criteria,
participated in this study: (1) age, sex, body height, body weight, drinking, smoking, fasting blood sugar (FBS), hemoglobin A1c (HbA1c), and records of upper gastrointestinal endoscopy were available from health checkup records; and (2) health checkup records from at least 4 successive years were available. An initial dataset was obtained from individuals who participated in the health checkup and received at least 1 upper gastrointestinal endoscopy in 10 years (between April 2004 and March 2014) at the participating institutions. From individuals endoscopically diagnosed with RE, case candidates who met the following criteria were extracted: (1) participated in ≥ 4 health checkups at the participating institutions between April 2004 and March 2014, (2) was newly-diagnosed with RE after April 2009, (3) had upper gastrointestinal endoscopy during the 2 years prior to the first RE diagnosis, (4) participated in ≥ 3 health checkups in the 5 years before the first RE diagno-sis, and (5) was ≥ 30 years of age at the first RE diagnosis. From individuals without RE diagnosis, control candidates who met the following criteria were extracted: (1) participated in ≥ 4 health checkups between April 2004 and March 2014 and (2) had upper
Received: October 25, 2020 Revised: January 8, 2021 Accepted: January 19, 2021 This is an Open Access article distributed under the terms of the Creative Commons Attribution Non-Commercial License (http://creativecommons. org/licenses/by-nc/4.0) which permits unrestricted non-commercial use, distribution, and reproduction in any medium, provided the original work is properly cited.
*Correspondence: Takeshi Kamiya, MD, PhD Department of Medical Innovation, Nagoya City University Graduate School of Medical Sciences, 1 Kawasumi, Mizuho-cho, Mizuho-ku, Nagoya, Aichi 467-8601, Japan Tel: +81-52-858-7215, Fax: +81-52-853-8321, E-mail: [email protected]

88
Yuzuru Toki, et al
Journal of Neurogastroenterology and Motility 88
gastrointestinal endoscopy between April 2009 and March 2014. In case-control matching, 2 control candidates who were matched for age, sex, and participating institutions with the corresponding case and underwent upper gastrointestinal endoscopy at the year when the corresponding case was endoscopically diagnosed as having RE were extracted.
MeasuresFor case subjects, data obtained at the first year of RE diag-
nosis, referred to as the baseline year, and 5 years before this year were used for the analysis. For control subjects, data obtained at the baseline year of the corresponding case and 5 years prior to this year were used for the analysis. The presence of RE was defined as hav-ing grade A or more severe erosion according to the Los Angeles classification22 from endoscopic observation, or when the presence of RE was reported in the records if the Los Angeles grade was un-available. To investigate factors associated with future RE onset, the following clinical parameters were extracted from the records: age, sex, BMI, FBS, HbA1c, abdominal circumference (AC), systolic blood pressure (SBP), diastolic blood pressure (DBP), triglyceride (TG), high-density lipoprotein cholesterol (HDL-C), low-density lipoprotein cholesterol (LDL-C), total cholesterol, uric acid (UA),
aspartate aminotransferase (AST), alanine aminotransferase (ALT), γ-glutamyl transpeptidase (γ-GTP), drinking, smoking, gastro-intestinal symptoms (acid reflux symptoms, gastric pain, heavy stomach, feeling of fullness, belching, and abdominal pain), comor-bidities (diabetes, hypertension, and hyperlipidemia), findings of upper gastrointestinal endoscopy (hiatal hernia, atrophic gastritis, and Barrett’s esophagus), and H. pylori infection.
Statistical MethodsBaseline characteristics of the case group were compared with
those of the control group using Student’s t test or chi-square test, as appropriate. A multivariate logistic regression analysis was performed to evaluate the effects of the baseline characteristics on presence or absence of RE. The independent variables for the mul-tivariate logistic model were selected from the clinical parameters at baseline by stepwise forward-backward procedure, and multi-collinearity of them were assessed using variance inflation factor. Missing values in the independent variables were complemented by multiple imputation method with chained equations. For each year before the baseline year, a cross-sectional comparison of the factors in both groups was made as for the baseline characteristics. To com-pare time-courses of the factors expressed as continuous variables
Initial dataset
N = 230 056
With RE
diagnosis
n = 14 808
Without RE
diagnosis
n = 215 248
Excluded:
< 4 times of HC participations
n = 140 652
No UGE between April 2009
and March 2014
n = 50 689
Excluded:
< 4 times of HC participations
n = 4546
RE diagnosis before March 2009
n = 1733
No UGE in 2 years before first RE
diagnosis
n = 5564
< 3 times of HC participations in
5 years before first RE diagnosis
n = 804
< 30 years of age at RE diagnosis
n = 0
Case candidates
n = 2161
Case group
n = 2066
Control candidates
n = 23 907
Control group
n = 4132
Excluded:
< 2 control candidates who
matched sex, age, institution
n = 95
Excluded:
Not selected by case-control
matching
n = 19 775 Figure 1. Subject flow in this study. HC, health checkup; UGE, upper gastrointestinal endoscopy; RE, reflux esophagitis.

8989
Risk Factors for Onset of Reflux Esophagitis
Vol. 28, No. 1 January, 2022 (86-94)
between the case and control groups, the mixed-effect models for repeated measures with group, year, and the interaction effect of them as fixed effects and individual as a random effect were applied. In contrast, for the factors expressed as categorical variables, the multivariate logistic regression analysis with group, year, and the in-teraction effect of them as independent variables was applied. This analysis was also performed for dichotomized continuous variables between within and outside of normal ranges, where cut-off values of them were as follows: BMI ≥ 25 kg/m2, AC ≥ 85 cm in males and 90 cm in females, FBS ≥ 110 mg/dL, HbA1c ≥ 5.5%, SBP ≥ 140 mmHg, DBP ≥ 90 mmHg, TG ≥ 150 mg/dL, HDL-C < 40 mg/dL, LDL-C ≥ 120 mg/dL, UA > 7.0 mg/dL, AST > 30 IU/L, ALT > 30 IU/L, and γ-GTP > 50 IU/L. Addition-ally, analyses for subgroups aged < 55 years and ≥ 55 years at the baseline year were similarly performed as for the whole data. These statistical analyses were implemented using JMP 12.0.1 (SAS Institute, Cary, NC, USA) and R version 3.6.3 (R Foundation for Statistical Computing, Vienna, Austria) with mice package. Statisti-cal significance was determined by 2-sided manner and the signifi-cance level was set to 0.05.
Results
Baseline CharacteristicsIn the case-control matching, 2066 cases and 4132 control
subjects were finally included in the analysis (Fig. 1). Baseline characteristics in the case and control groups at the baseline year are presented in Tables 1 and 2. Age and sex, which were matching factors in this study, were similar between the groups. The follow-ing baseline characteristics were significantly different between the 2 groups: BMI, AC, FBS, SBP, TG, HDL-C, UA, AST, ALT, γ-GTP, drinking, smoking, percentage with symptoms (acid reflux symptoms and feeling of fullness), percentages of the presence of hiatal hernia and atrophic gastritis, and percentage of comorbidities (hypertension and hyperlipidemia). In the multivariate analysis for the baseline characteristics, higher BMI, higher ALT, smoking, presence of acid reflux symptoms, presence of hiatal hernia, and absence of atrophic gastritis were independently related to RE (Table 3). Variance inflation factors of all the independent variables were less than 1.2.
Table 1. Subject Characteristics of the Case and Control Groups at Baseline (Continuous Parameters)
CharacteristicsCase group Control group
P-valuea
N Mean ± SD N Mean ± SD
Age (yr) 2066 53.9 ± 9.3 4132 54.0 ± 9.4 0.963BMI (kg/m2) 2063 23.5 ± 3.3 4126 22.9 ± 3.0 < 0.001AC (cm) 2026 84.2 ± 9.1 4050 82.5 ± 8.6 < 0.001FBS (mg/dL) 2052 102.7 ± 18.1 4103 101.4 ± 16.9 0.006HbA1c (%) 1648 5.7 ± 0.6 3276 5.7 ± 0.5 0.321SBP (mmHg) 2026 112.4 ± 22.3 4052 110.9 ± 22.0 0.011DBP (mmHg) 2026 84.3 ± 22.0 4052 83.1 ± 21.9 0.052TG (mg/dL) 2022 126.7 ± 90.2 4039 115.5 ± 72.8 < 0.001HDL-C (mg/dL) 2025 60.4 ± 15.9 4052 61.5 ± 15.8 0.007LDL-C (mg/dL) 1453 122.5 ± 30.2 2909 122.9 ± 29.5 0.669TC (mg/dL) 1764 206.5 ± 32.6 3540 206.4 ± 32.9 0.889UA (mg/dL) 1779 5.69 ± 1.32 3555 5.57 ± 1.3 0.002AST (IU/L) 2025 24.1 ± 11.0 4052 23.0 ± 8.7 < 0.001ALT (IU/L) 2025 26.2 ± 18.2 4052 23.5 ± 14.7 < 0.001γ-GTP (IU/L) 2025 46.0 ± 49.4 4052 40.2 ± 44.1 < 0.001
aP-values were calculated using Student’s t test. N, total number of subjects in the group (except subjects whose characteristics were unknown); BMI, body mass index; AC, abdominal circumference; FBS, fasting blood sugar; HbA1c, hemoglobin A1c; SBP, systolic blood pressure; DBP, diastolic blood pressure; TG, triglyceride; HDL-C, high-density lipoprotein choles-terol; LDL-C, low-density lipoprotein cholesterol; TC, total cholesterol; UA, uric acid; AST, aspartate aminotransferase; ALT, alanine aminotransferase; γ-GTP, γ-glutamyl transpeptidase.
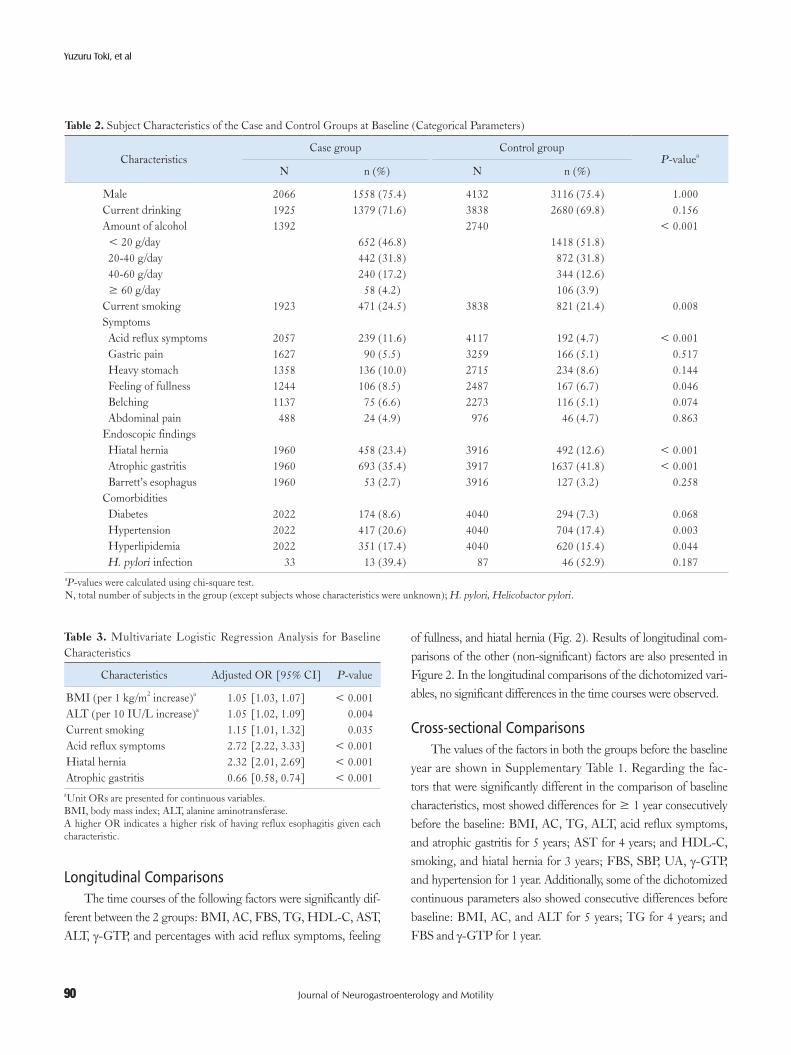
90
Yuzuru Toki, et al
Journal of Neurogastroenterology and Motility 90
Longitudinal ComparisonsThe time courses of the following factors were significantly dif-
ferent between the 2 groups: BMI, AC, FBS, TG, HDL-C, AST, ALT, γ-GTP, and percentages with acid reflux symptoms, feeling
of fullness, and hiatal hernia (Fig. 2). Results of longitudinal com-parisons of the other (non-significant) factors are also presented in Figure 2. In the longitudinal comparisons of the dichotomized vari-ables, no significant differences in the time courses were observed.
Cross-sectional ComparisonsThe values of the factors in both the groups before the baseline
year are shown in Supplementary Table 1. Regarding the fac-tors that were significantly different in the comparison of baseline characteristics, most showed differences for ≥ 1 year consecutively before the baseline: BMI, AC, TG, ALT, acid reflux symptoms, and atrophic gastritis for 5 years; AST for 4 years; and HDL-C, smoking, and hiatal hernia for 3 years; FBS, SBP, UA, γ-GTP, and hypertension for 1 year. Additionally, some of the dichotomized continuous parameters also showed consecutive differences before baseline: BMI, AC, and ALT for 5 years; TG for 4 years; and FBS and γ-GTP for 1 year.
Table 2. Subject Characteristics of the Case and Control Groups at Baseline (Categorical Parameters)
CharacteristicsCase group Control group
P-valuea
N n (%) N n (%)
Male 2066 1558 (75.4) 4132 3116 (75.4) 1.000Current drinking 1925 1379 (71.6) 3838 2680 (69.8) 0.156Amount of alcohol 1392 2740 < 0.001 < 20 g/day 652 (46.8) 1418 (51.8) 20-40 g/day 442 (31.8) 872 (31.8) 40-60 g/day 240 (17.2) 344 (12.6) ≥ 60 g/day 58 (4.2) 106 (3.9)Current smoking 1923 471 (24.5) 3838 821 (21.4) 0.008Symptoms Acid reflux symptoms 2057 239 (11.6) 4117 192 (4.7) < 0.001 Gastric pain 1627 90 (5.5) 3259 166 (5.1) 0.517 Heavy stomach 1358 136 (10.0) 2715 234 (8.6) 0.144 Feeling of fullness 1244 106 (8.5) 2487 167 (6.7) 0.046 Belching 1137 75 (6.6) 2273 116 (5.1) 0.074 Abdominal pain 488 24 (4.9) 976 46 (4.7) 0.863Endoscopic findings Hiatal hernia 1960 458 (23.4) 3916 492 (12.6) < 0.001 Atrophic gastritis 1960 693 (35.4) 3917 1637 (41.8) < 0.001 Barrett’s esophagus 1960 53 (2.7) 3916 127 (3.2) 0.258Comorbidities Diabetes 2022 174 (8.6) 4040 294 (7.3) 0.068 Hypertension 2022 417 (20.6) 4040 704 (17.4) 0.003 Hyperlipidemia 2022 351 (17.4) 4040 620 (15.4) 0.044 H. pylori infection 33 13 (39.4) 87 46 (52.9) 0.187
aP-values were calculated using chi-square test. N, total number of subjects in the group (except subjects whose characteristics were unknown); H. pylori, Helicobactor pylori.
Table 3. Multivariate Logistic Regression Analysis for Baseline Characteristics
Characteristics Adjusted OR [95% CI] P-value
BMI (per 1 kg/m2 increase)a 1.05 [1.03, 1.07] < 0.001ALT (per 10 IU/L increase)a 1.05 [1.02, 1.09] 0.004Current smoking 1.15 [1.01, 1.32] 0.035Acid reflux symptoms 2.72 [2.22, 3.33] < 0.001Hiatal hernia 2.32 [2.01, 2.69] < 0.001Atrophic gastritis 0.66 [0.58, 0.74] < 0.001
aUnit ORs are presented for continuous variables.BMI, body mass index; ALT, alanine aminotransferase.A higher OR indicates a higher risk of having reflux esophagitis given each characteristic.

9191
Risk Factors for Onset of Reflux Esophagitis
Vol. 28, No. 1 January, 2022 (86-94)
A
5 yr 4 yr 3 yr 2 yr 1 yr
23.8
23.4
23.0
22.6
(kg
/m)
2
Baseline
Body mass index B
(cm
)
Abdominal circumference
85
84
83
82
81
80Baseline
*** ******
******
***
#
P < 0.001
C
(mg
/dL
)
Fasting blood sugar
*
**
104
102
100
98Baseline
#
P = 0.039#
P < 0.001
****** *** ***
******
Case group
Control group
Case group
Control group
Case group
Control group
D
(mg
/dL
)
Triglyceride
130
125
120
115
110Baseline
#
P = 0.010
****
*
******
*
E(m
g/d
L)
HDL cholesterol
64
62
60
58
56Baseline
**
* ** ****
#
P = 0.045
Case group
Control group
Case group
Control group
F
(IU
/L)
AST
25
24
23
22Baseline
**
*** *
***
#
P = 0.044
Case group
Control group
H -GTP-GTP
48
46
44
42
40
38Baseline
**
***
#
P < 0.001
Case group
Control group
G
(IU
/L)
ALT
27
26
25
24
23
22Baseline
** *** ** ***
***
#
P = 0.005
Case group
Control group
***
(IU
/L)
Case group
Control group
I Acid reflux symptoms
***
#
P = 0.00420
10
0
%
Baseline
***************
Case group
Control group
J Feeling of fullness
*
#
P = 0.01912
8
4
0
%
Baseline
*****
Case group
Control group
K Hiatal hernia
***
#
P < 0.00130
20
10
0
%
Baseline
*********
5 yr 4 yr 3 yr 2 yr 1 yr 5 yr 4 yr 3 yr 2 yr 1 yr
5 yr 4 yr 3 yr 2 yr 1 yr 5 yr 5 yr4 yr 4 yr3 yr 3 yr2 yr 2 yr1 yr 1 yr
5 yr 4 yr 3 yr 2 yr 1 yr5 yr 4 yr 3 yr 2 yr 1 yr5 yr 4 yr 3 yr 2 yr 1 yr
5 yr 4 yr 3 yr 2 yr 1 yr 5 yr 4 yr 3 yr 2 yr 1 yr
Figure 2. Time courses of the factors that were significantly different between the case and control groups in the longitudinal comparison. For continuous variables, points and error bars denote least square means at each year and its standard errors, respectively. For categorical variables, boxes denote percentages at each year. HDL, high-density lipoprotein; AST, aspartate aminotransferase; ALT, alanine aminotransferase; γ-GTP, γ-glutamyl transpeptidase. *P < 0.05; **P < 0.01; ***P < 0.001 in the cross-sectional comparisons between the groups. #P-value in the longitu-dinal comparison between the groups.

92
Yuzuru Toki, et al
Journal of Neurogastroenterology and Motility 92
Subgroup AnalysisIn the subgroup analysis for younger (< 55 years of age) sub-
jects, the following baseline characteristics were significantly differ-ent between the groups: BMI, AC, FBS, SBP, DBP, TG, HDL-C, UA, AST, ALT, γ-GTP, drinking, amount of alcohol consumed, smoking, acid reflux symptoms, stomach heaviness, hiatal hernia, atrophic gastritis, hypertension, and hyperlipidemia (Supplementary Table 2). Most of these differed for ≥ 1 year consecutively before the baseline: BMI, AC, TG, ALT, γ-GTP, and acid reflux symp-toms for 5 years; FBS, HDL-C, drinking, smoking, and hiatal hernia for 3 years; UA for 2 years; SBP and DBP for 1 year. The time courses of BMI, ALT, γ-GTP, and hiatal hernia were signifi-cantly different between the groups (Supplementary Table 3).
In the subgroup analysis for older (≥ 55 years of age) subjects, the following baseline characteristics were significantly different between the groups: BMI, AC, TG, ALT, amount of alcohol consumed, acid reflux symptoms, hiatal hernia, atrophic gastritis, hypertension, and hyperlipidemia (Supplementary Table 4). Most of these differed for ≥ 1 year consecutively before the baseline: BMI, AC, and atrophic gastritis for 5 years; acid reflux symptoms and hiatal hernia for 3 years; TG and ALT for 1 year. The time courses of BMI, AC, and TG were significantly different between the groups (Supplementary Table 5).
Discussion
This study was implemented using health checkup records for 10 years to investigate factors associated with future RE onset. The multivariate analysis for the baseline characteristics showed that higher BMI, higher ALT, smoking, presence of acid reflux symp-toms, presence of hiatal hernia, and absence of atrophic gastritis were independent risk factors for RE, although the baseline char-acteristics mutually correlated and the unselected variables in this analysis may also be important risk factors. Significant differences in the time courses between the case and control groups were observed for BMI, the factors associated with metabolic syndrome, including AC, FBS, TG, and HDL-C,23-25 indices of hepatic function (AST, ALT, and γ-GTP), and the percentages with acid reflux symptoms, feeling of fullness, and hiatal hernia. In cross-sectional analysis, most of the factors displaying significant differences between the groups at the baseline year corresponded with the associated factors proposed by previous cross-sectional studies, with BMI, AC, TG, ALT, and the percentages with acid reflux symptoms and atrophic gastritis being constantly different throughout the 5 years before
the baseline. Although the means of BMI, AC, TG, and ALT remained within the normal ranges even in the case group, the rates of subjects who had them outside of the normal ranges were significantly higher in the case group. The analysis for the younger subgroup displayed greater differences between the groups than in the older subgroup, except for the percentage with atrophic gastritis, although the results in both these groups were similar to those in the whole data.
In the longitudinal comparisons, factors showing significant differences in the time course between the groups included labora-tory parameters related to lifestyle diseases. AC, FBS, TG, and HDL-C are considered criteria of metabolic syndrome while indices of hepatic function are applied as markers of hepatic dam-age caused mainly by excessive intake of fats, carbohydrates, and alcohol. Because these factors (except HDL-C, described below) increased in the case group more rapidly with time, this suggests a close association of worsening lifestyle with RE onset. A previous study16 also found high BMI, metabolic syndrome, and hyperuri-cemia to be significant risk factors of RE onset during the following year. Therefore, we suggest that RE is a lifestyle disease and lifestyle guidance to at-risk person could help prevent RE. Here, we should consider the contradictory result in that the HDL-C level, a higher value of which may counter lifestyle diseases,26 increased more rapidly in the case group. Although we cannot explain this result, we speculate that this was not a major result, because the P-value of 0.045 is only just significant, and the absolute HDL-C level in the case group at each year were consecutively lower than in the control group.
In the cross-sectional comparisons, most of factors displaying significant differences between the groups at baseline, including BMI, AC, FBS, SBP, TG, HDL-C, drinking, smoking, hiatal hernia, and atrophic gastritis, have previously been suggested to be associated with RE.8,11,16 We found that indices of hepatic function were also associated factors of RE, which have not been investigated in previous studies. Especially, it should be noted that higher ALT was identified as an independent risk factor also in the multivari-ate analysis for the baseline characteristics. Whereas our results of the cross-sectional comparison were similar to previous studies, we showed in the present study that BMI, AC, TG, ALT, and the percentages with acid reflux symptoms and atrophic gastritis had been significantly different between the groups for 5 years before the baseline year. Although we do not currently discuss how these factors are involved in the pathogenic process of RE, these results suggest that further investigation of the long-term influences of risk factors on RE onset should be made.

9393
Risk Factors for Onset of Reflux Esophagitis
Vol. 28, No. 1 January, 2022 (86-94)
The younger subgroup clearly displayed greater differences, except for atrophic gastritis, between the groups in both longitu-dinal and cross-sectional comparisons compared with the older subgroup. This may result from the impact of lifestyle on RE onset being more direct in younger subjects, whereas it may become less clear in older subjects, for example, by a loss of the preventative mechanism against acid reflux caused through reasons other than lifestyle. Achem and DeVault27 reviewed that aging may predispose to gastroesophageal reflux disease and increase its severity via physi-ological changes, including weakened esophageal motility, reduced lower esophageal sphincter pressure, and poor primary/secondary peristalsis.
We show that the percentage with atrophic gastritis was signifi-cantly lower in the case group. Although the results of H. pylori test were almost unavailable in the health checkup records, we can as-sume a lower percentage of H. pylori-positive subjects in this group because atrophic gastritis is mainly caused by H. pylori infection.28 Therefore, our result is consistent with previous studies in which H. pylori infection and the presence of atrophic gastritis were reported to be negatively associated with RE. The declining H. pylori infec-tion rate through expanded use of eradication therapy, particularly in developed countries,29 provides one possible contribution to the increasing number of RE patients.1 Considering the significant cost burden of RE and resulting poor HRQOL in patients, aggressive intervention in the lifestyle of those at risk of RE should be consid-ered even before RE onset.
Because RE is not a life-threatening disease, no long-term cohort studies have been conducted to investigate risk factors of future RE. By using long-term health checkup records, we were able to investigate potential associated factors of future RE. The methodology of this study is appropriate to investigate risk factors of other chronic non-fatal diseases. However, non-standardized data formats used in different institutions may disturb studies us-ing health checkup records. Indeed, our proposal of an association of lifestyle with RE onset was through “indirect” estimation based on the differences of the laboratory parameters between the groups, because lifestyle data could not be used in this study due to a lack of a common data format among the participating institutions. Should well-formatted lifestyle data be available, we could “directly” inves-tigate the association. To initiate studies based on “real world data,” including, for example, health checkup records and health insur-ance claims, standardization of the data format is essential.
The present study has limitations in addition to the non-unifor-mity of the data format. First, we defined the presence or absence of RE based solely on health checkup records between April 2004 and
March 2014, and were thus unable to determine whether subjects were diagnosed with RE before March 2004 or outside of health checkup. Therefore, non-newly diagnosed cases could be included in the case group, whereas subjects who had been diagnosed with RE before the examined records could be assigned to the control group. While this may have caused some bias, it was probably limited because the factors associated with RE in our study were consistent with those in previous studies. Secondly, we had planned to collect data regarding history of medications that could affect RE development, namely proton pump inhibitors, calcium block-ers, and aspirin, at first; however we had to abandon this because such information were not adequately obtained by self-administered questionnaires in health checkups. Thus we could not have included the effect of medications in the analysis, and some biases probably exist in the assessment of presence or absence of RE, acid reflux symptoms, and the association between them. Finally, because we used health checkup records in this study, the subjects were consid-ered to be relatively healthy compared with the general population of the same age. Therefore, our results cannot be generalized to a non-healthy population.
In conclusion, the factors thought to be related to lifestyle displayed significantly poorer values or larger worsening in RE patients than in non-RE subjects. Therefore, RE is thought to be a lifestyle disease, and lifestyle guidance should be given to health checkup participants with unhealthy lifestyle to prevent developing RE.
Supplementary Materials
Note: To access the supplementary tables mentioned in this article, visit the online version of Journal of Neurogastroenterol-ogy and Motility at http://www.jnmjournal.org/, and at https://doi.org/10.5056/jnm20237.
Acknowledgements: We are grateful to the GERD Society for administrative and clerical support of this study.
Financial support: This work was funded by the GERD Soci-ety Grant in 2014 supported by AstraZeneca K.K. (Osaka, Japan), based on a contract of clinical study support.
Conflicts of interest: None.
Author contributions: Koji Nakada, Katsuhiko Iwakiri, Ken Haruma, and Takashi Joh were involved in study conception and design; Yuzuru Toki, Ryo Yamauchi, Eizo Kayashima, Kyoichi Adachi, Kiyohiko Kishi, Hiroshi Suetsugu, Tsuneya Wada, Hi-
94
Yuzuru Toki, et al
Journal of Neurogastroenterology and Motility 94
royoshi Endo, and Hajime Yamada were involved in the acquisition of data; Satoshi Osaga, Takeshi Kamiya, Koji Nakada, Katsuhiko Iwakiri, Ken Haruma, and Takashi Joh were involved in the analysis and interpretation of data; and Satoshi Osaga and Takeshi Kamiya were involved in the drafting of the manuscript. All authors critically revised the draft and approved the final manuscript.
References
1. El-Serag HB, Sweet S, Winchester CC, Dent J. Update on the epide-miology of gastro-oesophageal reflux disease: a systematic review. Gut 2014;63:871-880.
2. Jung HK. Epidemiology of gastroesophageal reflux disease in Asia: a systematic review. J Neurogastroenterol Motil 2011;17:14-27.
3. Hampel H, Abraham NS, El-Serag HB. Meta-analysis: obesity and the risk for gastroesophageal reflux disease and its complications. Ann Intern Med 2005;143:199-211.
4. Minatsuki C, Yamamichi N, Shimamoto T, et al. Background factors of reflux esophagitis and non-erosive reflux disease: a cross-sectional study of 10,837 subjects in Japan. PLoS One 2013;8:e69891.
5. Adachi K, Mishiro T, Tanaka S, Hanada K, Kinoshita Y. Gender differ-ences in time-course changes of reflux esophagitis in Japanese patients. Intern Med 2015;54:869-873.
6. Cook MB, Wild CP, Forman D. A systematic review and meta-analysis of the sex ratio for Barrett’s esophagus, erosive reflux disease, and nonero-sive reflux disease. Am J Epidemiol 2005;162:1050-1061.
7. Avidan B, Sonnenberg A, Schnell TG, Sontag SJ. Risk factors for erosive reflux esophagitis: a case-control study. Am J Gastroenterol 2001;96:41-46.
8. Amano K, Adachi K, Katsube T, Watanabe M, Kinoshita Y. Role of hiatus hernia and gastric mucosal atrophy in the development of reflux esophagitis in the elderly. J Gastroenterol Hepatol 2001;16:132-126.
9. Gunji T, Sato H, Iijima K, et al. Risk factors for erosive esophagitis: a cross-sectional study of a large number of Japanese males. J Gastroenterol 2011;46:448-455.
10. Koike T, Ohara S, Sekine H, et al. Helicobacter pylori infection inhibits reflux esophagitis by inducing atrophic gastritis. Am J Gastroenterol 1999;94:3468-3472.
11. Lluch I, Ascaso JF, Mora F, et al. Gastroesophageal reflux in diabetes mellitus. Am J Gastroenterol 1999;94:919-924.
12. Labenz J, Jaspersen D, Kulig M, et al. Risk factors for erosive esophagi-tis: a multivariate analysis based on the ProGERD study initiative. Am J Gastroenterol 2004;99:1652-1656.
13. Chung SJ, Kim D, Park MJ, et al. Metabolic syndrome and visceral obe-sity as risk factors for reflux oesophagitis: a cross-sectional case–control study of 7078 Koreans undergoing health check-ups. Gut 2008;57:1360-1365.
14. Niigaki M, Adachi K, Hirakawa K, Furuta K, Kinoshita Y. Associa-
tion between metabolic syndrome and prevalence of gastroesophageal reflux disease in a health screening facility in Japan. J Gastroenterol 2013;48:463-472.
15. Azumi T, Adachi K, Arima N, et al. Five-year follow-up study of patients with reflux symptoms and reflux esophagitis in annual medical check-up field. Intern Med 2008;47:691-696.
16. Lee YC, Yen AM, Tai JJ, et al. The effect of metabolic risk factors on the natural course of gastro-oesophageal reflux disease. Gut 2009;58:174-181.
17. Vakil N, van Zanten SV, Kahrilas P, Dent J, Jones R; Global consensus group. The Montreal definition and classification of gastroesophageal reflux disease: a global evidence-based consensus. Am J Gastroenterol 2006;101:1900-1920.
18. McDougall NI, Johnston BT, Kee F, Collins JS, McFarland RJ, Love AH. Natural history of reflux oesophagitis: a 10 year follow up of its ef-fect on patient symptomatology and quality of life. Gut 1996;38:481-486.
19. Wienbeck M, Barnert J. Epidemiology of reflux disease and reflux esophagitis. Scand J Gastroenterol Suppl 1989;156:7-13.
20. Sakaguchi M, Manabe N, Ueki N, et al. Factors associated with com-plicated erosive esophagitis: a Japanese multicenter, prospective, cross-sectional study. World J Gastroenterol 2017;23:318-327.
21. Haggitt RC, Tryzelaar J, Ellis FH, Colcher H. Adenocarcinoma com-plicating columnar epithelium-lined (Barrett’s) esophagus. Am J Clin Pathol 1978;70:1-5.
22. Lundell LR, Dent J, Bennett JR, et al. Endoscopic assessment of oe-sophagitis: clinical and functional correlates and further validation of the Los Angeles classification. Gut 1999;45:172-180.
23. National cholesterol education program (NCEP) expert panel on detec-tion, evaluation, and treatment of high blood cholesterol in adults (adult treatment panel III). Third report of the national cholesterol education program (NCEP) expert panel on detection, evaluation, and treatment of high blood cholesterol in adults (adult treatment panel III) final report. Circulation 2002;106:3143-3421.
24. Alberti KG, Zimmet P, Shaw J; IDF Epidemiology task force consensus group. The metabolic syndrome--a new worldwide definition. Lancet 2005;366:1059-1062.
25. Matsuzawa Y. Metabolic syndrome--definition and diagnostic criteria in Japan. J Atheroscler Thromb 2005;12:301.
26. Wannamethee SG, Shaper AG, Ebrahim S. HDL-cholesterol, total cholesterol, and the risk of stroke in middle-aged British men. Stroke 2000;31:1882-1888.
27. Achem SR, DeVault KR. Gastroesophageal reflux disease and the elderly. Gastroenterol Clin North Am 2014;43:147-160.
28. Kuipers EJ, Klinkenberg-Knol EC, Vandenbroucke-Grauls CM, Ap-pelmelk BJ, Schenk BE, Meuwissen SG. Role of Helicobacter pylori in the pathogenesis of atrophic gastritis. Scand J Gastroenterol Suppl 1997;223:28-34.
29. Bruce MG, Maaroos HI. Epidemiology of Helicobacter pylori infec-tion. Helicobacter 2008;13(suppl 1):1-6.

95 2022 The Korean Society of Neurogastroenterology and Motility
J Neurogastroenterol Motil, Vol. 28 No. 1 January, 2022www.jnmjournal.org
JNMJ Neurogastroenterol Motil, Vol. 28 No. 1 January, 2022pISSN: 2093-0879 eISSN: 2093-0887https://doi.org/10.5056/jnm20239
Original ArticleJournal of Neurogastroenterology and Motility
Received: October 29, 2020 Revised: January 25, 2021 Accepted: March 21, 2021 This is an Open Access article distributed under the terms of the Creative Commons Attribution Non-Commercial License (http://creativecommons. org/licenses/by-nc/4.0) which permits unrestricted non-commercial use, distribution, and reproduction in any medium, provided the original work is properly cited.
*Correspondence: Sheng-Liang Chen, MD, PhD Division of Gastroenterology and Hepatology, Key Laboratory of Gastroenterology and Hepatology, Ministry of Health, Renji Hospital, School of Medicine, Shanghai Jiao Tong University, Shanghai Institute of Digestive Disease, 145 Middle Shandong Road, Shanghai 200001, China Tel: +86-21-63200784, Fax: +86-21-63266027, E-mail: [email protected]
Xiu-Juan Yan and Hong-Yi Qiu contributed equally to this work.
Improving Clinician-Patient Communication Alleviates Stigma in Patients With Functional Dyspepsia Receiving Antidepressant Treatment
Xiu-Juan Yan,1 Hong-Yi Qiu,1 Qing-Qing Luo,1 Bo Wang,1 Ping Xu,1 Chen-Feng Ji,2 and Sheng-Liang Chen1*1Division of Gastroenterology and Hepatology, Key Laboratory of Gastroenterology and Hepatology, Ministry of Health, Renji Hospital, School of Medicine, Shanghai Jiao Tong University, Shanghai Institute of Digestive Disease, Shanghai, China; and 2Department of Psychological Medicine, Renji Hospital, School of Medicine, Shanghai Jiao Tong University, Shanghai, China
Background/AimsAntidepressants are effective in patients with functional dyspepsia (FD). However, stigma associated with FD and antidepressants may affect treatment adherence. This study aims to explore possible communication strategies to alleviate stigma and improve adherence in patients with FD.
MethodsIn this randomized, single-center, and single-blind trial, 160 patients with FD initiating antidepressant treatment were recruited. Different communication strategies were performed when prescribing antidepressants. Participants in Group 1 were told that brain is the “headquarters” of gut, and that antidepressants could act as neuromodulators to relieve symptoms of FD through regulating the functions of gut and brain. Participants in Group 2 were told that antidepressants were empirically effective for FD. Stigma scores, medication-related stigma, treatment compliance, and efficacy were analyzed.
ResultsAfter 8-week antidepressant treatment, the proportion of patients with FD with decreased stigma scores in Group 1 was significantly higher than in Group 2 (internalized stigma: 64.10% vs 12.00%; perceived stigma: 55.13% vs 13.33%; P < 0.01). Medication-related stigma was lower in Group 1 than in Group 2 (P < 0.05 for 3 of 4 questions). Concurrently, patients in Group 1 had better treatment compliance (0.71 ± 0.25 vs 0.60 ± 0.25, P < 0.01) and efficacy. In Group 1, participants with decreased post-treatment stigma scores showed better treatment compliance and efficacy than those with non-decreased scores. Decrease in stigma scores positively correlated with treatment compliance.
ConclusionImproving knowledge of patients with FD of the disease and antidepressants via proper communication may be an effective way to alleviate stigma and promote adherence. (J Neurogastroenterol Motil 2022;28:95-103)
Key WordsAntidepressive agents; Clinician-patient communication; Dyspepsia; Patient compliance; Stigma

96
Xiu-Juan Yan, et al
Journal of Neurogastroenterology and Motility 96
Introduction
Functional dyspepsia (FD) is one of the most prevalent func-tional gastrointestinal disorders (FGIDs). It is characterized by symptoms including early satiation, postprandial fullness, epigas-tric pain and burning, which are unexplained after routine clinical examinations.1 The efficacy of regular first line treatment, such as antiacid and prokinetic agents, are currently unsatisfactory for re-fractory FD.2
In the Rome IV criteria, FGIDs have been redefined as disor-ders of the gut-brain axis.3 Psychological factors (such as depression and anxiety) have been demonstrated to be associated with FD.1 The American College of Gastroenterology and the Canadian As-sociation of Gastroenterology guidelines on dyspepsia recommend that patients with FD who are not responding to proton pump inhibitors (PPIs) or Helicobacter pylori eradication therapy should be offered tricyclic antidepressants or psychological therapies.4 Psy-chological medications, such as tricyclic antidepressants, and norad-renergic and specific serotonin antidepressants, have been shown to be effective in the treatment of FD.3,5-8 Recent studies reported that selective serotonin reuptake inhibitors, serotonin and noradrenaline reuptake inhibitors are also beneficial to patients with FD.3,8,9
However, compliance with antidepressant treatment is handi-capped due to stigma.10-13 Our recent research found that stigma associated with FD and antidepressant medications could interfere with treatment adherence.10 A large proportion of FD patients re-fuse to take antidepressants and report concerns such as “my family says these drugs are for insane people” or “these drugs will make me lose my mind.” These are typical expressions of stigma. Stigma is the negative stereotypes or discrimination toward a particular population.11 There are 2 types of stigma that may be an obstacle to adherence. Individuals’ endorsement of various stereotypes toward their condition is classified as internalized stigma. The negative ste-reotypes displayed by others is classified as perceived stigma.11 It is essential to explore possible strategies to alleviate stigma in patients with FD.
It has been reported that there is a “communication gap” be-tween patients with FGIDs and doctors.14 Many patients with FD hold the belief that their dyspepsia symptoms are caused by “some-thing wrong in the stomach” rather than a “functional” property. Collins et al found that most patients with FGIDs even do not ac-knowledge their diagnosis.14 The antidepressant medications carry more misunderstanding. It has been reported that patients with FGIDs hold negative attitudes toward psychological medications.15
These phenomena are worse in the Chinese population because many Chinese patients do not accept psychological diagnoses and treatment.16,17 The existence of communication gap could influence treatment adherence.14 Furthermore, insufficient communication or the callous attitude of doctors could also result in complaints of dissatisfaction.18 Based on the above reasons, clinician-patient com-munication may be an important interventional target to alleviate stigma and improve treatment adherence.
It has been reported that physicians’ attention to psychological barriers in antidepressant treatment, such as stigma, may improve medication compliance and affect the course of illness.12,19 There-fore, it is critical to find a way to fill the doctor-patient communi-cation gap and reduce stigma in patients with refractory FD. A previous systematic review suggested that clinician-patient com-munication may be important in increasing cooperation in mental health care.20 However, it is unclear whether clinician-patient com-munication affects stigma in patients with FD. Therefore, this study is designed to explore clinician-patient communication strategies that could alleviate stigma and improve compliance with antidepres-sant therapy in patients with refractory FD.
Materials and Methods
ParticipantsThis study was conducted in accordance with the ethical prin-
ciples of the Declaration of Helsinki and local regulations (Trial registration No. NCT03625674, ClinicalTrials.gov). Ethical ap-proval was obtained from the Ethics Committee of Renji Hospital (Approval No. 2018-082). Every enrolled participant signed the informed consent prior to the study.
Refractory FD patients who did not respond to 4-week regular first line treatment (such as antacids and prokinetics) and needed to initiate psychoactive medication treatment for the first time were enrolled from the outpatient department from January 2018 to February 2020. Symptom nonresponse was defined as less than half of symptom improvement after first line treatment. The inclusion criteria were as follows: age of 18-70 years; met the Rome IV FD criteria; Generalized Anxiety Disorder-7 (GAD-7) scale ≥ 5 or Patient Health Questionnaire-9 (PHQ-9) depression scale ≥ 5. The exclusion criteria included organic digestive diseases; presence of Helicobacter pylori infection; severe psychological symptoms or cognitive disorders; GAD-7 ≥ 15 or PHQ-9 ≥ 15; breastfeeding or pregnancy; history of gastric surgery; use of PPIs, prokinetic agents or other medications that might affect gastric function within

9797
Communication Alleviates Stigma
Vol. 28, No. 1 January, 2022 (95-103)
1 month; and previous use of psychoactive agents.
Study DesignWe performed a randomized, single-center, single-blind, con-
trolled study to explore possible ways to alleviate stigma and im-prove medication adherence through appropriate clinician-patient communication. Physicians from the gastrointestinal (GI) depart-ment and psychological department met the participants together and chose appropriate antidepressant agents for each patient. Strati-fied randomization was conducted according to the antidepressants they took. Thus, the enrolled patients who were prescribed with the same antidepressant were randomized into 2 groups based on random number lists generated from a computer. Two doctors were trained to communicate with the enrolled patients according to the following strategies every 2 weeks when the patient received their antidepressant agents. The patients in Group 1 were told: (1) Brain is the “headquarters” of GI tract; their FD symptoms are caused by dysfunction of brain and GI tract, rather than a sole GI or psycho-logical problem. (2) Psychoactive drugs act as neuromodulators to relieve FD symptoms through regulating functions of GI tract and brain. (3) The dose of antidepressants used in FD patients is lower than those used in patients with anxiety or depression. The patients in Group 2 were told that clinical evidence has shown antidepres-sants are useful in alleviating their symptoms. The information of dosage and possible adverse effects were provided to the partici-pants in both groups. The duration of doctor-patient communica-tion (about 20 minutes) were similar in the 2 groups. The allocation information was blind to data collectors.
The treatment period for the participants was 8 weeks. Demo-graphic data, dyspeptic and psychological symptom scales, and stig-ma scales were assessed at enrollment. Medications were prescribed every 2 weeks, with medication adherence, stigma scales, a 4-ques-tion survey,21 and symptom scales being assessed. The primary end-point for this study was medication adherence evaluated by medica-tion possession ratio (MPR). The secondary endpoints were stigma assessed by internalized stigma scale (IS) and perceived stigma scale (PSS) scores, and symptom relief assessed by the Leeds Dyspepsia Questionnaire (LDQ), GAD-7, and PHQ-9 scales.
Outcome MeasuresIS and PSS are widely used in assessing the degree of internal-
ized or perceived stigma.11 The term “mental illness” was replaced with “FD” in the scales. Each item in IS scale was ranked on a 4-point scale (1-4). The final IS score was calculated as the mean score of all the 24 items. Higher scores indicate worse internalized
stigma: scores ≤ 2 were labeled as “minimal stigma,” scores > 2 and ≤ 2.5 were “mild stigma,” scores > 2.5 and ≤ 3 were “mod-erate stigma,” and scores > 3 were “severe stigma.”22 The PSS had 10 items ranked on a 5-point scale (1-5). The final PSS score was calculated as the mean score of the 10 items. Higher scores indi-cated worse perceived stigma.
Because IS and PSS scores cannot distinguish disease-related stigma and medication-related stigma, antidepressant-related stig-ma was evaluated every 2 weeks using a 4-question survey adapted from a previous study.21 The following questions were answered with “yes” or “no” by the participants: when taking the antidepres-sant agents, (1) I feel ashamed; (2) I do not feel comfortable to tell friends or family; (3) I do not feel okay if people in community know; and (4) I do not want to tell people at job.21 The percentage of the answer “yes” for each question was calculated in each group.
The LDQ scale was used to assess dyspeptic symptoms.23 The scoring criteria were as follows: 0-4, very mild dyspepsia; 5-8, mild dyspepsia; 9-15, moderate dyspepsia; and > 15, severe or very se-vere dyspepsia.
The GAD-7 and PHQ-9 questionnaires were used to evalu-ate the psychological status of enrolled patients. The GAD-7 scale, which is used to screen generalized anxiety disorder,24 consists of 7 items on a 4-point questionnaire (0-3). The final GAD-7 scores were calculated as the sum of the 7 items. The scoring criteria were as follows: 0-4, no anxiety; 5-9, mild anxiety; 10-14, moderate anxiety; and ≥ 15, severe anxiety. The scores of PHQ-9, a 10-item scale used to screen for depression,25 was calculated as the sum of the 10 items. The scoring criteria were as follows: 0-4, none or min-imal depression; 5-9, mild depression; 10-14, moderate depression; 15-19, moderately severe depression; and ≥ 20, severe depression.
Medication adherence was evaluated with MPR. MPR is de-fined as the sum of the supplied medication divided by the number of days between the first and the last refill.26 Higher MPR scores indicate better compliance. The patients were asked to keep a medi-cation diary for calculating the MPR.
Statistical Methods All enrolled participants were included in the adherence analy-
ses. The MPR values of patients who were lost in the first follow-up were assigned as zero. Calculation of symptom improvement was based on the subjects who had at least 1 follow-up. The last ob-servation carried forward method was used in cases of pre-mature study termination.
Sample size calculation was based on the assumption that the MPR values after 8-week treatment would be 0.71 in Group 1

98
Xiu-Juan Yan, et al
Journal of Neurogastroenterology and Motility 98
and 0.60 in Group 2 with α = 0.05 (2-tailed) and β = 0.20. The estimated sample size was 79 patients per group. Therefore, a mini-mal of 158 participants were needed in order to prove that MPR in Group 1 was significantly different from that in Group 2.
SPSS version 22 software (IBM, Armonk, NY, USA) was
used to perform statistical analyses. Data from normally distribu-tions were presented as mean ± SD. Skewed distributed data were presented as medians and analyzed with nonparametric statistics. Differences between means before and after treatment were ana-lyzed using paired t test. Mann-Whitney test and t test were used to compare the differences between groups. Correlations were assessed with Spearman correlation analyses. P < 0.05 was considered sta-tistically significant.
Results
Participant CharacteristicsA total of 160 patients were enrolled from the GI outpatient
department. Demographic and baseline clinical characteristics were well balanced between the 2 groups (Table 1). Seven patients who were lost in the first follow-up (thus had no post-treatment data) were excluded from efficacy analyses (Fig. 1). Antidepressants taken in each group were listed in Table 2.
Stigma Scores Before and After TreatmentStigma scores before treatment were well balanced between
the 2 groups. After 8-week treatment, patients with FD in Group 1 showed lower stigma scores compared with those in Group 2
192 Patients were assessed
for eligibility
32 Ineligible
160 Patients were assigned
80 Assigned to group 1 and
included in compliance
analysis
80 Assigned to group 2 and
included in compliance
analysis
2 Lost in the
first follow-up
78 Included in
efficacy analysis
5 Lost in the
first follow-up
75 Included in
efficacy analysis
Figure 1. Flowchart of screening and recruitment of study subjects.
Table 1. Baseline Characteristics of the Enrolled Participants (n = 80)
Characteristics Group 1 Group 2
Age (yr) 45.64 ± 12.64 46.25 ± 11.04Male:female ratio 26:54 25:55LDQ 13.34 ± 3.14 13.68 ± 2.82GAD-7 6.62 ± 2.75 6.56 ± 2.01PHQ-9 5.80 ± 2.92 5.91 ± 2.70IS 1.60 ± 0.39 1.64 ± 0.40PSS 1.61 ± 0.46 1.61 ± 0.38
LDQ, leeds dyspepsia questionnaire; GAD-7, generalized anxiety disorder-7 scale; PHQ-9, patient health questionnaire-9 depression scale; IS, internalized stigma scale; PSS, perceived stigma scale. Data are presented as mean ± SD.
Table 2. Antidepressants Taken in Each Group
Drugs Group 1 Group 2
Mirtazapine 21 21Fluoxetine 16 15Sertraline 15 16Paroxetine 13 13Citalopram 9 10Venlafaxine 6 5Total 80 80
Before treatment
After treatmentA B
**
Group 1 Group 2
3
2
1ISsc
ore
s
0Group 1 Group 2
3
2
1PS
Ssc
ore
s
0
ns
**
Before treatment
After treatment
**ns
**
Figure 2. Effect of different communi-cation strategies on internalized stigma scale (IS) and perceived stigma scale (PSS) scores in patients with functional dyspepsia (FD). (A) IS and (B) PSS scores before and after treatment in Group 1 (n = 78) and Group 2 (n = 75). **P < 0.01.

9999
Communication Alleviates Stigma
Vol. 28, No. 1 January, 2022 (95-103)
(P < 0.01; Fig. 2). In Group 1, 50 participants (64.10%) showed decreased post-treatment IS scores, 7 participants (8.97%) showed unaltered scores and 21 participants (26.92%) showed elevated IS scores after treatment. As for PSS scores, 43 participants (55.13%) showed decreased, 5 participants (6.41%) showed unaltered, and 30 participants (38.46%) showed elevated scores after treatment. However, in Group 2, 9 participants (12.00%, P < 0.01 vs Group 1) showed decreased post-treatment IS scores, 5 participants (6.67%) showed unaltered, and 61 participants (81.33%, P < 0.01 vs Group 1) showed elevated IS scores after treatment. Ten par-ticipants (13.33%, P < 0.01 vs Group 1) showed decreased post-treatment PSS scores, 4 participants (5.33%) showed unaltered scores, and 61 participants (81.33%, P < 0.01 vs Group 1) showed elevated PSS scores after treatment (Table 3). IS and PSS scores were elevated in Group 2 (increased by 18.38% and 23.57%, re-spectively; P < 0.01 vs baseline), while the mean scores in Group 1 showed no obvious change after treatment (Fig. 2).
Assessment of medication-associated stigma with the 4-ques-tion survey revealed that patients in the 2 groups had different levels of antidepressant medication-related stigma after treatment. The percentage of patients answering “yes” for question 1 (feel ashamed:
21.79% vs 42.67%), question 3 (do not feel okay if people in com-munity know: 66.67% vs 92.00%), and question 4 (do not want to tell people at job: 58.97% vs 80.00%) in Group 1 were significantly lower than in Group 2 (P < 0.05; Table 4). The percentage of pa-tients answering “yes” for question 2 (do not feel comfortable to tell friends or family) showed no significant difference between the 2 groups (Table 4).
Medication AdherenceAfter 8-week treatment, MPR values of the participants in
Group 1 were significantly higher than in Group 2 (0.71 ± 0.25 vs 0.60 ± 0.25, P < 0.01; Fig. 3). These results suggested that patients’ adherence to antidepressants in Group 1 was better than in Group 2. We then analyzed the participants in Group 1 according to the changes in IS scores after treatment. We found that MPR values of participants with decreased IS scores after treatment was significantly higher than those with unaltered or elevated IS scores
Table 3. Number of Patients With Functional Dyspepsia With Al-tered Stigma Scores After Treatment
Stigma scores
Change of scoresGroup 1 (n = 78)
Group 2 (n = 75)
IS Decreased 50 (64.10)a 9 (12.00)Unaltered 7 (8.97) 5 (6.67)Elevated 21 (26.92)a 61 (81.33)
PSS Decreased 43 (55.13)a 10 (13.33)Unaltered 5 (6.41) 4 (5.33)Elevated 30 (38.46)a 61 (81.33)
IS, internalized stigma scale; PSS, perceived stigma scale.aP < 0.01 (χ2 test).Data are presented as n (%).
Table 4. Medicine-associated Stigma After Treatment
QuestionsGroup 1 (n = 78)
Group 2 (n = 75)
P-value(χ2 test)
Feel ashamed 17 (21.79) 32 (42.67) 0.010Do not feel comfortable to tell
friends or family24 (30.77) 35 (46.67) 0.064
Do not feel okay if people in community know
52 (66.67) 69 (92.00) < 0.001
Do not want to tell people at job 46 (58.97) 60 (80.00) 0.008
Data are presented as n (%).
Group 1 Group 2
1.0
0.8
0.6
0.4
0.2
MP
R
0
**
Figure 3. Medication possession ratio (MPR) values of all enrolled patients after 8-week antidepressant treatment (n = 80). **P < 0.01.
IS decreased IS increased or unaltered
Subgroups
1.0
0.8
0.6
0.4
0.2
MP
R
0
**
Figure 4. Subgroup analysis of medication possession ratio (MPR) in Group 1 according to changes in internalized stigma scale (IS) scores. **P < 0.01 (Mann-Whitney test).

100
Xiu-Juan Yan, et al
Journal of Neurogastroenterology and Motility 100
after treatment (P < 0.01; Fig. 4).In the correlation analyses, we found that the decrease of IS and
PSS scores after treatment were positively associated with MPR values (P < 0.001; Table 5).
Treatment EfficacyThe mean LDQ, GAD-7, and PHQ-9 scores of both groups
were reduced compared with baseline after the 8-week treatment (P < 0.05; paired t test). Moreover, patients in Group 1 showed a greater decrease in LDQ, GAD-7, and PHQ-9 scores than in Group 2 (LDQ: P < 0.01, GAD-7 and PHQ-9: P < 0.05; Fig. 5). Sixty-nine patients (88.46%) in Group 1 and 45 patients (60.00%) in Group 2 showed improvement in LDQ scores.
Subgroup analyses of symptom scores in Group 1 showed that the scores of dyspeptic, anxiety, and depressive symptoms in partici-pants with decreased post-treatment IS scores displayed a greater decrease than those of participants with unaltered or elevated post-treatment IS scores (P < 0.01 for LDQ and PHQ-9, P < 0.05 for GAD-7; Fig. 6).
Safety AnalysesSeven patients in Group 1 (7/78, 8.97%) and 9 patients in
Group 2 (9/75, 12.00%) complained of discomforts including insomnia, sleepiness, dizziness, and skin rash during treatment (P >
0.05; Supplementary Table). All these adverse effects were mild. No severe adverse events occurred during the treatment.
Discussion
Stigma is present in many GI disorders such as FD, irritable bowel syndrome, and inflammatory bowel disease.10,27,28 Treatment adherence and efficacy of antidepressants are greatly hindered by stigma associated with diseases and antidepressants.10,12 In this study, we demonstrated that proper physician-patient communica-tion strategies may alleviate stigma and improve adherence to anti-depressant treatment in patients with refractory FD.
We first explored whether different physician-patient commu-nication strategies could affect stigma in refractory FD patients re-ceiving antidepressant treatment. Our previous observational study showed that stigma scores increased significantly after initiating antidepressants in FD patients from our outpatient department.10 Besides, we found that the types of antidepressants showed no sig-
Table 5. Correlation Between the Decrease of Stigma Scores and Medication Possession Ratio Values
Decrease of stigma scores
Group 1 (n = 78) Group 2 (n = 75)
r P r P
Decrease of IS 0.601 < 0.001 0.659 < 0.001Decrease of PSS 0.503 < 0.001 0.575 < 0.001
Spearman correlation analysis. IS, internalized stigma scale; PSS, perceived stigma scale.
LDQ GAD-7 PHQ-9
2
0
2
4
6
Ch
an
ge
of
sym
pto
msc
ore
s
IS elevated or unaltered (n = 28)
IS decreased (n = 50)
**
* **
Figure 6. Subgroup analysis of symptom scores in Group 1 based on change of internalized stigma scale (IS) scores. LDQ, leeds dyspepsia questionnaire; GAD-7, generalized anxiety disorder scale; PHQ-9, patient health questionnaire depression scale. *P < 0.05, **P < 0.01.
0
2
4
6
Ch
an
ge
sin
LD
Qsc
ore
Group 1 Group 2A B C
***
0
4Ch
an
ge
sin
PH
Q-9
sc
ore
Group 1 Group 20
4Ch
an
ge
sin
GA
D-7
sc
ore
Group 1 Group 2
1
3
2
1
3
2
*
Figure 5. Mean changes from baseline symptom scores of patients with functional dyspepsia (FD) in Group 1 (n = 78) and Group 2 (n = 75). Changes in the (A) Leeds Dyspepsia Questionnaire (LDQ), (B) Generalized Anxiety Disorder-7 (GAD-7) scale, and (C) Patient Health Ques-tionnaire-9 (PHQ-9) depression scale scores. *P < 0.05, **P < 0.01.

101101
Communication Alleviates Stigma
Vol. 28, No. 1 January, 2022 (95-103)
nificant correlation with stigma, perhaps because patients with FD classify them all as psychological drugs.10 Thus in this study we per-formed different communication strategies with patients with FD who needed to initiate antidepressants. We found that 64.10% of patients in Group 1 had decreased post-treatment IS scores, while this proportion was only 12.00% in Group 2. As it is hard to distin-guish the disease-related stigma and antidepressant-related stigma in IS and PSS scores, we used the 4-question survey and found that the percentage of patients with antidepressant-related stigma (except for question 2) in Group 1 was significantly lower than in Group 2. These results suggest that proper communication could relieve stigma attached to FD and antidepressant.
Because many patients may be unfamiliar with FGIDs and psychological diagnosis, a previous study on depression suggested that physicians should understand the meanings of illness from the patients’ perspective and communicate with them using a language that the patients can understand.16 In this study, the mechanisms of antidepressants were interpreted to patients as relieving symptoms by “restoring balance to the nervous system,” or by “tonifying or strengthening the energy of the brain.”16 Thus, in our study we tried to explain “gut-brain axis” in plain language to patients with FD, and the results showed a promising effect in reducing stigma. Our communication strategy included 3 parts. The first and second parts were focused on explanation of the symptoms and antidepres-sant agents, which helped patients with FD to understand their di-agnosis and treatment. The last part was explanation of the different doses adopted in GI and in the psychological department, which is also important because it could make the patients with FD feel that doctors did not classify them roughly as being “mentally ill.” We noticed that no patient clearly expressed his or her opposition to our communication methods. However, the patients may accept the ex-planation differently due to the different demographic and baseline characteristics (such as gender, education level, GI symptoms, and psychological status). Although not every patient understood and accepted the explanation thoroughly, the feeling of care and atten-tion from doctors during the communication may also relieve their psychological burden and improve treatment satisfaction.
This study also showed that proper communication may im-prove treatment adherence. Treatment adherence correlated with the decrease of IS and PSS scores (r values were relatively low because a small portion of patients with very mild pre-treatment stigma showed limited decrease in stigma scores and high compli-ance). Furthermore, communication may improve treatment ef-ficacy of antidepressants in refractory FD patients. Nearly 90% of FD patients showed improvement in LDQ scores after antidepres-
sant treatment in Group 1. Those with decreased post-treatment stigma scores had even better treatment efficacy. On the contrary, more than one-third of patients with FD in Group 2 had no im-provement in symptoms scores. In this study, antidepressants were prescribed to each patient according to their symptoms. Although the mechanisms were not fully illustrated, studies have shown that antidepressants exert actions both in the central nervous system and GI tract.3 Antidepressants may have an analgesic effect by interfer-ing with pain-related brain circuits and pain transmission at the level of spinal cord.29,30 Furthermore, they could also exert a direct effect on GI function independent of their anxiolytic effects.3 The Rome Foundation Working Team suggested that agents acting in both the brain and gut should be relabeled as “gut-brain neuromodulators” to reduce stigma and improve the understanding of neuromodula-tors.3
Besides improving communications regarding the mechanisms of the disease and medications, previous studies have explored other possible strategies to alleviate stigma in patients with mental illness, such as cognitive therapy aimed at altering the stigmatizing beliefs and attitudes of the individual, or enhancing skills for coping with self-stigma.31,32 A study in FD patients found that intensified medi-cal management plus cognitive behavior therapy may be effective in alleviating symptoms of depression or anxiety.33 However, it is dif-ficult for GI doctors to perform the time-consuming psychological therapy in non-psychological settings. Compared to psychological therapy, proper physician-patient communication may be an easy, efficient, and effective method to prevent and reduce stigma in patients with refractory FD. A number of clinical trials have sug-gested that reassurance is an important non-pharmacological ap-proach for FD treatment.34-37 Reassurance incorporates explanation of the etiology of FD and assurance of the unlikelihood of cancer, which helps to alleviate patients’ anxiety and symptoms.34 In our study, reassurance was also partly integrated into the communica-tion strategies in Group 1 (explanation of the mechanisms of FD and antidepressants). Assurance of the unlikelihood of cancer and good prognosis of FD should also be added when communicating with FD patients.
There is a limitation in our study. Although we found that FD patients subjected to a proper physician-patient communication had fewer stigmatized attitudes and better treatment compliance after antidepressant treatment, it is still difficult to establish the causality of stigma and treatment compliance.
In conclusion, our results suggest that physicians should pay attention to patients’ stigma toward FD and antidepressant medica-tions and reduce stigma by using proper doctor-patient communi-

102
Xiu-Juan Yan, et al
Journal of Neurogastroenterology and Motility 102
cation strategies. This study provides an easy and effective way that could benefit in the treatment of refractory FD via reducing stigma. Improving patients’ knowledge of the disease and antidepressant medications through proper physician-patient communication may relieve stigma, improve treatment adherence, and ultimately lead to better treatment efficacy.
Supplementary Material
Note: To access the supplementary table mentioned in this article, visit the online version of Journal of Neurogastroenterol-ogy and Motility at http://www.jnmjournal.org/, and at https://doi.org/10.5056/jnm20239.
Financial support: This work was supported by National Natural Science Foundation of China (Grant No. 81970472 and 81500412 to Xiu-Juan Yan and 81970473, 82170554, 81670484, and 81470812 to Sheng-Liang Chen); and Pujiang Outstand-ing Youth Project of Renji Hospital South Campus (Grant No. RJPJYQ [2018]).
Conflicts of interest: None.
Author contributions: Qing-Qing Luo, Bo Wang, Ping Xu, and Chen-Feng Ji enrolled participants and performed the com-munication; Xiu-Juan Yan and Hong-Yi Qiu analyzed data and prepared manuscript; and Sheng-Liang Chen designed study and reviewed the manuscript.
References
1. Stanghellini V, Chan FK, Hasler WL, et al. Gastroduodenal Disorders. Gastroenterology 2016;150:1380-1392.
2. Saad RJ, Chey WD. Review article: current and emerging therapies for functional dyspepsia. Aliment Pharmacol Ther 2006;24:475-492.
3. Drossman DA, Tack J, Ford AC, Szigethy E, Törnblom H, Van Oudenhove L. Neuromodulators for functional gastrointestinal disorders (disorders of gut-brain interaction): a rome foundation working team report. Gastroenterology 2018;154:1140-1171, e1.
4. Moayyedi P, Lacy BE, Andrews CN, Enns RA, Howden CW, Vakil N. ACG and CAG clinical guideline: management of dyspepsia. Am J Gastroenterol 2017;112:988-1013.
5. Ford AC, Luthra P, Tack J, Boeckxstaens GE, Moayyedi P, Talley NJ. Efficacy of psychotropic drugs in functional dyspepsia: systematic review and meta-analysis. Gut 2017;66:411-420.
6. Talley NJ, Locke GR, Saito YA, et al. Effect of amitriptyline and escitalo-pram on functional dyspepsia: a multicenter, randomized controlled study. Gastroenterology 2015;149:340-349, e2.
7. Tack J, Ly HG, Carbone F, et al. Efficacy of mirtazapine in patients with functional dyspepsia and weight loss. Clin Gastroenterol Hepatol 2016;14:385-392, e4.
8. Johnson AC, Greenwood-Van Meerveld B. The pharmacology of vis-ceral pain. Adv Pharmacol 2016;75:273-301.
9. Luo L, Du L, Shen J, Cen M, Dai N. Benefit of small dose antidepres-sants for functional dyspepsia: experience from a tertiary center in eastern China. Medicine (Baltimore) 2019;98:e17501.
10. Yan XJ, Luo QQ, Qiu HY, Ji CF, Chen SL. The impact of stigma on medication adherence in patients with functional dyspepsia. Neurogastro-enterol Motil 2021;33:e13956.
11. Taft TH, Riehl ME, Dowjotas KL, Keefer L. Moving beyond percep-tions: internalized stigma in the irritable bowel syndrome. Neurogastro-enterol Motil 2014;26:1026-1035.
12. Sirey JA, Bruce ML, Alexopoulos GS, Perlick DA, Friedman SJ, Mey-ers BS. Stigma as a barrier to recovery: perceived stigma and patient-rated severity of illness as predictors of antidepressant drug adherence. Psychiatr Serv 2001;52:1615-1620.
13. Sirey JA, Bruce ML, Alexopoulos GS, et al. Perceived stigma as a pre-dictor of treatment discontinuation in young and older outpatients with depression. Am J Psychiatry 2001;158:479-481.
14. Collins J, Farrall E, Turnbull DA, Hetzel DJ, Holtmann G, Andrews JM. Do we know what patients want? The doctor-patient communication gap in functional gastrointestinal disorders. Clin Gastroenterol Hepatol 2009;7:1252-1254, 1254, e1-e2.
15. Cassell B, Gyawali CP, Kushnir VM, Gott BM, Nix BD, Sayuk GS. Beliefs about GI medications and adherence to pharmacotherapy in func-tional GI disorder outpatients. Am J Gastroenterol 2015;110:1382-1387.
16. Yeung A, Trinh NH, Chang TE, Fava M. The engagement interview protocol (EIP): improving the acceptance of mental health treatment among Chinese immigrants. Int J Cult Ment Health 2011;4:91-105.
17. Yan XJ, Li WT, Chen X, et al. Effect of clinician-patient communica-tion on compliance with flupentixol-melitracen in functional dyspepsia patients. World J Gastroenterol 2015;21:4652-4659.
18. Singh M. Communication as a bridge to build a sound doctor-patient/parent relationship. Indian J Pediatr 2016;83:33-37.
19. Shen MJ, Hamann HA, Thomas AJ, Ostroff JS. Association between patient-provider communication and lung cancer stigma. Support Care Cancer 2016;24:2093-2099.
20. Thompson L, McCabe R. The effect of clinician-patient alliance and communication on treatment adherence in mental health care: a system-atic review. BMC Psychiatry 2012;12:87.
21. Givens JL, Katz IR, Bellamy S, Holmes WC. Stigma and the acceptabil-ity of depression treatments among African Americans and whites. J Gen Intern Med 2007;22:1292-1297.
22. Lysaker PH, Roe D, Yanos PT. Toward understanding the insight para-dox: internalized stigma moderates the association between insight and social functioning, hope, and self-esteem among people with schizophre-nia spectrum disorders. Schizophr Bull 2007;33:192-199.
23. Moayyedi P, Duffett S, Braunholtz D, et al. The leeds dyspepsia ques-tionnaire: a valid tool for measuring the presence and severity of dyspep-sia. Aliment Pharmacol Ther 1998;12:1257-1262.

103103
Communication Alleviates Stigma
Vol. 28, No. 1 January, 2022 (95-103)
24. Herr NR, Williams JW Jr, Benjamin S, McDuffie J. Does this patient have generalized anxiety or panic disorder?: the eational clinical examina-tion systematic review. JAMA 2014;312:78-84.
25. Wang W, Bian Q, Zhao Y, et al. Reliability and validity of the Chinese version of the patient health questionnaire (PHQ-9) in the general popu-lation. Gen Hosp Psychiatry 2014;36:539-544.
26. Boskovic J, Leppée M, Culig J, et al. Comparison of two different meth-ods (patient questionnaire and medication possession ratio - MPR) for measuring the chronic patient’s behavior. Psychiatr Danub 2014;26(suppl 3):498-508.
27. Looper KJ, Kirmayer LJ. Perceived stigma in functional somatic syndromes and comparable medical conditions. J Psychosom Res 2004;57:373-378.
28. Qin HY, Cheng CW, Tang XD, Bian ZX. Impact of psychological stress on irritable bowel syndrome. World J Gastroenterol 2014;20:14126-14131.
29. Atkinson JH, Slater MA, Wahlgren DR, et al. Effects of noradrenergic and serotonergic antidepressants on chronic low back pain intensity. Pain 1999;83:137-145.
30. Jackson JL, Shimeall W, Sessums L, et al. Tricyclic antidepressants and headaches: systematic review and meta-analysis. BMJ 2010;341:c5222.
31. Mittal D, Sullivan G, Chekuri L, Allee E, Corrigan PW. Empirical
studies of self-stigma reduction strategies: a critical review of the literature. Psychiatr Serv 2012;63:974-981.
32. Hansson L, Lexén A, Holmén J. The effectiveness of narrative enhance-ment and cognitive therapy: a randomized controlled study of a self-stigma intervention. Soc Psychiatry Psychiatr Epidemiol 2017;52:1415-1423.
33. Haag S, Senf W, Tagay S, et al. Is there a benefit from intensified medi-cal and psychological interventions in patients with functional dyspepsia not responding to conventional therapy? Aliment Pharmacol Ther 2007;25:973-986.
34. Wang YP, Herndon CC, Lu CL. Non-pharmacological approach in the management of functional dyspepsia. J Neurogastroenterol Motil 2020;26:6-15.
35. Vanheel H, Tack J. Therapeutic options for functional dyspepsia. Dig Dis 2014;32:230-234.
36. Enck P, Klosterhalfen S. The placebo response in functional bowel disor-ders: perspectives and putative mechanisms. Neurogastroenterol Motil 2005;17:325-331.
37. Moayyedi P, Soo S, Deeks J, Delaney B, Innes M, Forman D. Pharma-cological interventions for non-ulcer dyspepsia. Cochrane Database Syst Rev 2006:CD001960.
104 2022 The Korean Society of Neurogastroenterology and Motility
J Neurogastroenterol Motil, Vol. 28 No. 1 January, 2022www.jnmjournal.org
JNMJ Neurogastroenterol Motil, Vol. 28 No. 1 January, 2022pISSN: 2093-0879 eISSN: 2093-0887https://doi.org/10.5056/jnm20243
Original ArticleJournal of Neurogastroenterology and Motility
Received: October 30, 2020 Revised: February 23, 2021 Accepted: March 8, 2021 This is an Open Access article distributed under the terms of the Creative Commons Attribution Non-Commercial License (http://creativecommons. org/licenses/by-nc/4.0) which permits unrestricted non-commercial use, distribution, and reproduction in any medium, provided the original work is properly cited.
*Correspondence: Jae Sung Ko, MD, PhD Division of Pediatric Gastroenterology, Hepatology and Nutrition, Department of Pediatrics, Seoul National University College of Medicine, Seoul National University Children’s Hospital, 101 Daehak-ro, Jongno-gu, Seoul 03080, Korea Tel: +82-2-2072-2197, Fax: +82-2-743-3455, E-mail: [email protected]
ACTG2 Variants in Pediatric Chronic Intestinal Pseudo-obstruction With Megacystis
Jong Woo Hahn,1 Soo Young Moon,1 Min Soo Kim,1 Min Hyung Woo,1 Min Ji Sohn,1 Hyun-Young Kim,2 Moon-Woo Seong,3 Sung Sup Park,3 Sung-Hye Park,4 Jin Soo Moon,1 and Jae Sung Ko1*
Departments of 1Pediatrics, 2Surgery, 3Laboratory Medicine, and 4Pathology, Seoul National University College of Medicine, Seoul, Korea
Background/AimsChronic intestinal pseudo-obstruction (CIPO) is a clinically heterogeneous syndrome characterized by compromised peristalsis and intestinal obstruction. Variants of actin gamma 2 (ACTG2), a protein crucial for correct enteric muscle contraction, have been found in CIPO patients. The aim of this study is to examine the clinical features and ACTG2 variants in Korean patients with CIPO.
MethodsFrom January 1995 to August 2020, 12 patients diagnosed with CIPO were included and genetic analysis testing of ACTG2 was performed.
ResultsHeterozygous ACTG2 missense variants were found in 6 patients (50.0%). The p.Arg257Cys variant was found in 3 patients, and p.Arg63Gln and p.Arg178His variants were found in 1 patient each. A novel variant, p.Ile193Phe, was found in 1 patient. Three patients were diagnosed at birth, 2 at the age of 1 year, and 1 at 3 years of age. Abnormal prenatal genitourinary ultrasonographic findings were found in all 6 patients; microcolon was found in 4 patients (66.7%), and megacystis in all 6 patients. The pathology showed abnormal ganglion cells as well as myopathic findings. All patients are dependent on total parenteral nutrition and are to date alive.
ConclusionsACTG2 variants are commonly found in Korean patients with CIPO. In CIPO patients with megacystis and abnormal prenatal ultrasonography, genetic testing of ACTG2 should be considered. Molecular diagnosis of CIPO is more important than pathologic diagnosis.(J Neurogastroenterol Motil 2022;28:104-110)
Key WordsACTG2; Intestinal pseudo-obstruction; Megacystis; Visceral myopathy

105105
ACTG2 Variants in Chronic Intestinal Pseudo-obstruction
Vol. 28, No. 1 January, 2022 (104-110)
Introduction
Chronic intestinal pseudo-obstruction (CIPO) is a disease with a wide variety of clinical and histological features, characterized by a decrease in intestinal peristalsis and symptoms of intestinal obstruc-tion.1 A nationwide survey in the United States reported that there were 100 CIPO patients each year, and another nationwide survey in Japan reported an estimated pediatric prevalence of 3.7 per 1 million individuals.2,3 CIPO can involve any segment of the gastro-intestinal and genitourinary tracts, and gastrointestinal symptoms, such as abdominal distention, abdominal pain and vomiting, and urinary symptoms, such as urination disorder, may occur.1,4 Patients with CIPO often undergo ileostomy and colostomy repeatedly.4-7
CIPO is classified as either a myopathy or a neuropathy, de-pending on histopathology. The genetic basis of CIPO was first re-ported by Lehtonen et al8 in 2012. Since then, several genes related to CIPO have been discovered, of which actin gamma 2 (ACTG2) is the most common.4,6,7,9 The ACTG2 is located in the short arm of chromosome 2, encoding gamma 2 enteric actin, which is found in the smooth muscle cells of the urinary and intestinal tracts. ACTG2 is crucial for intestinal smooth muscle contraction,9,10 and variants of ACTG2 are associated with visceral myopathy and megacystis-microcolon-intestinal hypoperistalsis syndrome (MMIHS).6,7,10,11 However, there are no studies on ACTG2 variants in Asia.
The purpose of this study is to investigate the clinical features and ACTG2 variants in Korean patients with CIPO.
Materials and Methods
Study Population and Data CollectionIn patients with suspected intestinal obstruction, abdominal
radiography is performed to determine if there is bowel dilation and air-fluid levels. If there is no fixed lesion or mechanical obstruction, it can be diagnosed as a pseudo-obstruction. If the symptoms per-
sist for more than 6 months or postnatally for more than 2 months, CIPO may be diagnosed.11 A total of 12 patients diagnosed with CIPO at National University Hospital from January 1995 to Au-gust 2020 were included. Twelve patients were examined, and their medical records were retrospectively analyzed. Medical records included age, sex, age at onset, presenting symptoms, imaging stud-ies, laboratory findings, and growth curves.
This study was approved by the Institutional Review Board (No. 1910-065-1070) at the performing institution. IBM SPSS Statistics 25 software was used to complete the statistical analysis. Fisher’s exact test was performed to compare the clinical features between patients with and without ACTG2 variants. A P-value < 0.05 was considered statistically significant.
Genetic Testing of ACTG2Among the 12 patients, 11 underwent direct sequencing of
ACTG2 and 1 was tested for the CIPO gene panel. The CIPO gene panel contained the following genes: ACTA2, ACTG2, CLMP, FLNA, L1CAM, LMOD1, MYH11, MYLK, POLG, RAD21, SGOL1, SOX10, and TYMP. Genomic DNA from peripheral leukocytes was extracted. All 8 coding exons and flanking introns of ACTG2 were amplified using polymerase chain reaction. Genomic DNA targeted regions were sequenced using the Sanger sequencing system. The common variants were filtered using gnomAD (http://gnomad.broadinstitute.org) and KRG (http://coda.nih.go.kr/coda/KRGDB) databases. The Hu-man Gene Mutation Database and ClinVar were used to search for known pathogenic variants. The sequence variants were evaluated by computational (in silico) predictive programs using PolyPhen-2, SIFT, and MutationTaster. The effect of sequence variants was de-termined at the nucleotide and amino acid levels, and the potential impact of the variants on the protein could be seen. In addition, the pathogenicity of sequence variants was evaluated using the 2015 American College of Medical Genetics ad Genomics (ACMG) guidelines.12
Table 1. Variants of ACTG2 Gene Among Patients With Chronic Intestinal Pseudo-obstruction
DNA change Amino acid change Variant type Allele frequency ACMG classification
769C>T p.Arg257Cys Missense 3/6 (50.0%) PM1, PM2, PP2, PP3, PP5 Likely pathogenic188G>A p.Arg63Gln Missense 1/6 (16.7%) PM1, PM2, PP2, PP3 Likely pathogenic577A>T p.Ile193Phe Missense 1/6 (16.7%) PM1, PM2, PP2, PP3 Likely pathogenic533G>A p.Arg178His Missense 1/6 (16.7%) PM1, PM2, PP2, PP3, PP5 Likely pathogenic
ACTG2, actin gamma 2; CIPO, chronic intestinal pseudo-obstruction; ACMG, American College of Medical Genetics and Genomics; PM, pathogenic moderate; PP, pathogenic supporting.

106
Jong Woo Hahn, et al
Journal of Neurogastroenterology and Motility 106
Results
ACTG2 Variant AnalysisTwelve patients were analyzed, and 6 were identified with
ACTG2 variants. All 6 cases were sporadic and without a family history. All variants were heterozygous missense variants, of which 5 were arginine substitutions. The variants c.769C>T, p.Arg257Cys (50.0%) was found in 3 patients; c.188G>A, p.Arg63Gln (16.7%) in 1 patient; c.533G>A, p.Arg178His (16.7%) in 1 patient; and c.577A>T, p.Ile193Phe (16.7%) in 1 patient (Table 1). p.Arg257Cys, p.Arg178His, and p.Arg63Gln are previously re-ported variants and p.Arg257Cys is the most common. p.Ile193Phe is a novel variant that is not observed among the normal population and is located at highly conserved loci in various species. All vari-ants were considered likely pathogenic by the ACMG classifica-tion.12
Comparison of Clinical Features Between Patients With and Without ACTG2 Variants
Table 2 compares patients with and without ACTG2 variants. The presence of megacystis and abnormal prenatal ultrasonography showed a statistically significant difference between the 2 groups, but others, including age of diagnosis, microcolon, malrotation, hydronephrosis, neurogenic bladder, long-term clean intermittent catheterization (CIC), and long-term home parenteral nutrition (PN), were not statistically significant.
Clinical Features of Patients With ACTG2 VariantsThe clinical characteristics of the 6 patients with ACTG2 vari-
ants are summarized in Table 3. Four patients were female, and 2 were male. Their current ages range from 44 months to 27 years with a median value of 8.5 years. Three patients were diagnosed at birth: 2 at age 1 year, and 1 at age 3 years, with the median age at diagnosis being 7 months. The initial clinical symptoms were constipation in 5 patients, abdominal distention in 3, and vomiting in 2. On prenatal ultrasonography, all patients showed abnormal genitourinary findings, such as enlarged bladder, ovarian cyst, and hydronephrosis. Megacystis was observed in all 6 patients. Micro-colon was found in 4 patients (66.7%), and they were diagnosed with MMIHS. Malrotation was observed in 3 patients (50.0%), hydronephrosis in 4 (66.7%), and neurogenic bladder in 2 (33.3%). Pathological studies in all patients showed abnormalities of the muscle layer and ganglion cells. Thinning of the muscle layer and vacuolar changes of the muscle layer were found in 3 patients each. Nuclear palisading and acidophilic globular bodies were found in 1 patient each (Figure). All patients had hypoganglionosis and im-mature ganglion cells, and ganglion cell shapes were smaller than normal.
Long-term Outcomes in Patients With ACTG2 Variants
The follow-up period of patients ranged from 44 months to 24 years with a median value of 62 months. All patients underwent abdominal surgeries. Jejunostomy was performed in 2 patients, ileostomy in all 6 patients, and colostomy in 1 patient. Cholecystec-tomy, gastrectomy, and colectomy were performed in Case 3. None of the patients received an intestinal transplant and all patients are still alive. Long-term CIC was performed in 2 patients (33.3%), and Case 6 underwent vesicotomy 5 months immediately after diagnosis. All patients remain dependent on PN with oral feeding. Among them, Case 4 recently discontinued PN, whereas Case 5 recently initiated PN. Central line-associated bloodstream infection (CLABSI) was observed in 3 patients, and fatty liver was observed in 2 patients. One patient suffered recurrent small intestinal bacteri-al overgrowth and currently takes cyclic antibiotics. Pyridostigmine, an acetylcholinesterase inhibitor that stimulates gastrointestinal mo-tility, was administered to 3 patients, and symptoms improved in 2 of them.
Discussion
In this study, we investigated the spectrum of clinical features and ACTG2 variants in Korean patients with CIPO. Among the 12 CIPO patients, ACTG2 variants were found in 6 patients
Table 2. Comparison of Clinical Feature Between Patients With and Without ACTG2 Mutations
Clinical featureACTG2(+)
(n = 6)ACTG2(−)
(n = 6)P-value
Age at diagnosis 7 months Birth > 0.05Prenatal ultrasonography 6/6 (100%) 1/6 (16.7%) 0.015Microcolon 4/6 (66.7%) 0/6 (0.0%) 0.061Malrotation 3/6 (50%) 0/6 (0.0%) > 0.05Megacystis 6/6 (100%) 0/6 (0.0%) 0.002Hydronephrosis 4/6 (66.7%) 1/6 (16.7%) > 0.05Neurogenic bladder 2/6 (33.3%) 0/6 (0.0%) > 0.05Long-term CIC 2/6 (33.3%) 0/6 (0.0%) > 0.05Long-term home PN 6/6 (100%) 6/6 (100.0%) > 0.05
CIC, clean intermittent catheterization; PN, parenteral nutrition.
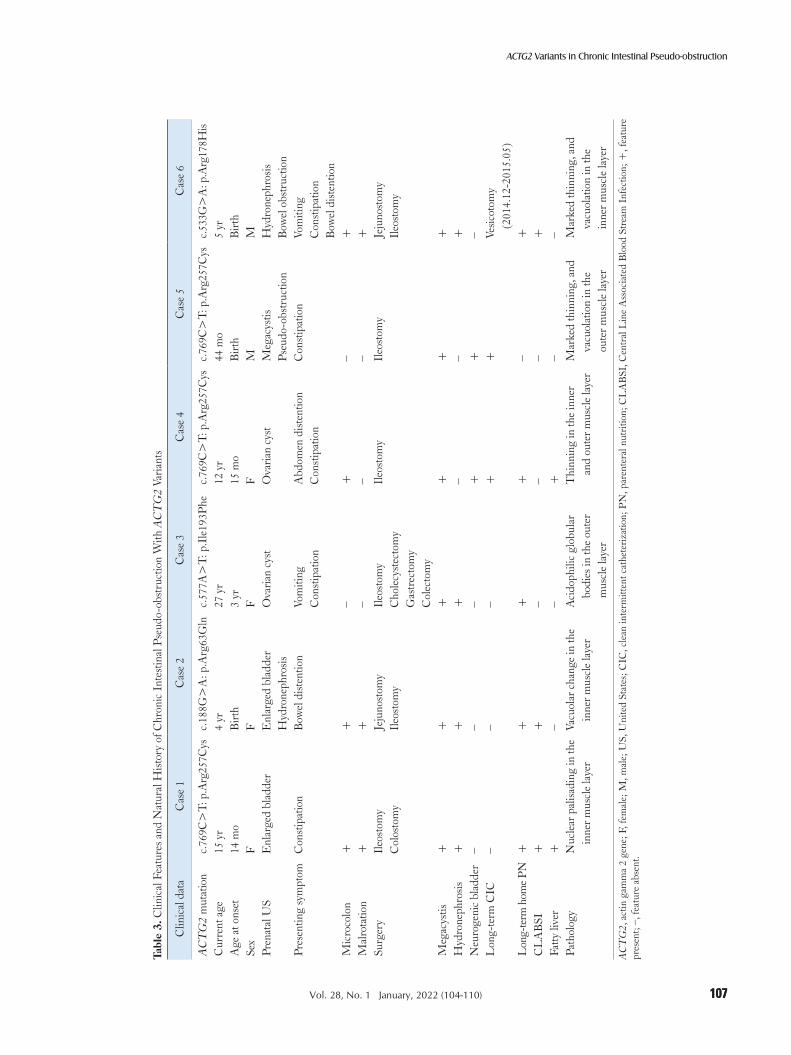
107107
ACTG2 Variants in Chronic Intestinal Pseudo-obstruction
Vol. 28, No. 1 January, 2022 (104-110)
Tabl
e 3.
Clin
ical
Fea
ture
s and
Nat
ural
Hist
ory
of C
hron
ic I
ntes
tinal
Pse
udo-
obst
ruct
ion
With
AC
TG
2 Va
riant
s
Clin
ical
dat
aC
ase
1C
ase
2C
ase
3C
ase
4C
ase
5C
ase
6
AC
TG
2 m
utat
ion
c.76
9C>
T: p
.Arg
257C
ysc.
188G
>A
: p.A
rg63
Gln
c.57
7A>
T: p
.Ile
193P
hec.
769C
>T:
p.A
rg25
7Cys
c.76
9C>
T: p
.Arg
257C
ysc.
533G
>A
: p.A
rg17
8His
Cur
rent
age
15 y
r4
yr27
yr
12 y
r44
mo
5 yr
Age
at o
nset
14 m
oB
irth
3 yr
15 m
oB
irth
Birt
hSe
xF
FF
FM
MPr
enat
al U
SE
nlar
ged
blad
der
Enl
arge
d bl
adde
r H
ydro
neph
rosis
Ova
rian
cyst
Ova
rian
cyst
Meg
acys
tis
Pseu
do-o
bstr
uctio
nH
ydro
neph
rosis
B
owel
obs
truc
tion
Pres
entin
g sy
mpt
omC
onst
ipat
ion
Bow
el d
isten
tion
Vom
iting
Con
stip
atio
nA
bdom
en d
isten
tion
Con
stip
atio
nC
onst
ipat
ion
Vom
iting
Con
stip
atio
nB
owel
dist
entio
nM
icro
colo
n+
+–
+–
+M
alro
tatio
n+
+–
––
+Su
rger
yIl
eost
omy
Col
osto
my
Jeju
nost
omy
Ileo
stom
yIl
eost
omy
Cho
lecy
stec
tom
y G
astr
ecto
my
Col
ecto
my
Ileo
stom
yIl
eost
omy
Jeju
nost
omy
Ileo
stom
y
Meg
acys
tis+
++
++
+H
ydro
neph
rosis
++
+–
–+
Neu
roge
nic
blad
der
––
–+
+–
Lon
g-te
rm C
IC–
––
++
Vesic
otom
y
(201
4.12
-201
5.05
)L
ong-
term
hom
e PN
++
++
–+
CL
AB
SI+
+–
––
+Fa
tty li
ver
+–
–+
––
Path
olog
yN
ucle
ar p
alisa
ding
in th
e in
ner m
uscl
e la
yer
Vacu
olar
cha
nge
in th
e in
ner m
uscl
e la
yer
Aci
doph
ilic
glob
ular
bo
dies
in th
e ou
ter
mus
cle
laye
r
Thi
nnin
g in
the
inne
r an
d ou
ter m
uscl
e la
yer
Mar
k ed
thin
ning
, and
va
cuol
atio
n in
the
ou
ter m
uscl
e la
yer
Mar
k ed
thin
ning
, and
va
cuol
atio
n in
the
in
ner m
uscl
e la
yer
AC
TG
2, a
ctin
gam
ma
2 ge
ne; F
, fem
ale;
M, m
ale;
US,
Uni
ted
Stat
es; C
IC, c
lean
inte
rmitt
ent c
athe
teriz
atio
n; P
N, p
aren
tera
l nut
ritio
n; C
LA
BSI
, Cen
tral
Lin
e A
ssoc
iate
d B
lood
Str
eam
Inf
ectio
n; +
, fea
ture
pr
esen
t; – ,
feat
ure
abse
nt.

108
Jong Woo Hahn, et al
Journal of Neurogastroenterology and Motility 108
(50.0%), with p.Arg257Cys being the most common. All cases were sporadic, and we reported a novel ACTG2 variant. All pa-tients with ACTG2 variants showed megacystis, abnormal prenatal ultrasonography, and had pathological abnormalities in the muscle layer and ganglion cells. All patients were dependent on PN and are alive to date. We showed the indication and importance of ACTG2 genetic testing in patients with CIPO.
In this study, 4 ACTG2 variants were identified in 6 children, and 3 of the 4 variants had arginine substitutions. In previous studies, 44.0-62.0% of CIPO patients were positive for ACTG2 variants, and arginine substitutions accounted for 49.0% of total variants.13,14 All variants in this study are heterozygous missense variants, which is consistent with findings of other studies.15 p.Arg257Cys, p.Arg63Gln, and p.Arg178His have has been pre-viously reported and are recurrent pathogenic variants,7,10 while p.Ile193Phe is novel. All variants including a novel variant were considered likely pathogenic by the ACMG classification. These known missense variants are reported to affect protein function, impair ACTG2 polymerization, and reduce smooth muscle cell contractility.15 Previous studies have shown that arginine substitu-tion at several different sites affects the function of actin filament, contributing to poor contractility of smooth muscle in COS7, CRL-1776 and U2OS cells.8,9 In this study, p.Arg257Cys was the most common variant, and p.Arg178Cys and p.Arg257Cys were mutation hot spots in other studies.6,10,13 All patients in this study
were sporadic, and these variants may have occurred de novo. Cases 1, 4, and 5 had the same variant as p.Arg257Cys, but the clinical features were different. Cases 1 and 4 were diagnosed with MMI-HS. However, Case 5 did not have MMIHS because microcolon was not present. In previous studies, microcolon was reported in 5 out of 20 (25.0%) patients with p.Arg257Cys.13 These findings suggest that visceral myopathy and MMIHS are one entity with a continuum of various symptoms. Some studies have shown a genotype-phenotype correlation. Arginine missense substitutions in ACTG2 had a 63.8% chance of requiring intestinal transplant, total PN dependence, or disease-related mortality.13 In this study, all patients were dependent on total PN, regardless of arginine sub-stitutions. In addition, all variants in this study may occur de novo, which may present with a more severe phenotype than when inher-ited.6 All patients in this study showed a severe phenotype, and the number of patients was small; therefore, it was difficult to evaluate a genotype-phenotype correlation. Also, there was no racial difference between Asian and Caucasian patients in ACTG2 variants, because p.Arg257Cys, frequently found in Caucasians, was the most com-mon in this study.6,7,10 Out of 12 patients, 1 patient was examined with the CIPO gene panel and an ACTG2 variant was identified.
We found that in the patient group with ACTG2 variants, there were 4 female and 2 male patients, which is consistent with previous studies showing a female preponderance.13,16 In this study, megacystis was found in all 6 patients. In previous studies, 85.0-
0.1 mm
A B
C D
0.1 mm
0.1 mm
0.1 mm
Figure. Pathologic findings of patients with ACTG2 variants. (A) [Case 1] The inner circular muscle layer shows nuclear palisading (arrows). (B) [Case 2] The inner circular muscle layer shows vacuolar change (arrow). (C) [Case 3] The outer layer of the muscle shows acidophilic globular bodies (ar-rows). (D) [Case 5] The outer muscle layer shows marked thinning (arrows) (H&E, bar = 0.1 mm).

109109
ACTG2 Variants in Chronic Intestinal Pseudo-obstruction
Vol. 28, No. 1 January, 2022 (104-110)
100.0% of patients with ACTG2 variants had megacystis.6,13 On prenatal ultrasonography, all patients with ACTG2 variants had genitourinary abnormalities. All MMIHS patients with ACTG2 variants had prenatally evident fetal megacystis.17 Taken together, if patients with CIPO have genitourinary abnormalities on prenatal ultrasonography or presence of megacystis, the evaluation of visceral myopathy with ACTG2 variants should be considered.
Thinning and vacuolar changes of the muscle layer found in this study are key features of visceral myopathy. Nuclear palisad-ing is a nonspecific histopathologic findings of myopathy, which is occasionally observed in other studies.18,19 Acidophilic globular body is a novel and pathologic finding, which is not observed in normal intestinal muscle proper, and appears to be related with muscular degenerative changes. Also, ganglion cell abnormalities such as hypoganglionosis and immature ganglia were found in all 6 patients with ACTG2 variants. In previous studies, ganglion cell abnormalities were observed in patients with visceral myopathy or MMIHS.2,10,17,20-24 Ganglion cell abnormalities may be secondary changes in myopathy due to ACTG2 variants.10 Because hypogan-glionosis or dysmorphic ganglion cells may be seen in CIPO with ACTG2 variants, it is difficult to diagnose by histopathology alone, and molecular diagnosis is more accurate than histologic diagnosis.
In this study, different abdominal surgeries were performed. Six patients received 26 surgeries and a mean of 4.3 surgeries per patient, with the most common operation being ostomy, which is similar to the results of other studies.7,13,22,25 In this study, all patients were dependent on PN, which is similar to the results of other stud-ies.13,25,26 Long-term home PN causes several complications.27,28 CLABSI was observed in 3 patients (50.0%), and fatty liver was observed in 2 patients (33.3%) in this study. To reduce the com-plications of long-term PN, fish oil-based lipid emulsions are used and enteral feeding is maintained.11,16 Thus, cirrhosis may not de-velop in this study. Previous studies have reported that the survival rate was 12.6-19.7%, and the oldest survivor was 25 years old.7,16,22 Mortality was associated with a short small intestine, involvement of the urinary system, < 1 year of age of onset, and myopathy on his-tology.29 In this study, the survival rate of CIPO was 100.0%, and the oldest survivor was 27 years old. The remarkable improvement in prognosis in this study may have resulted from improvements in nutritional management and supportive care with intestinal rehabili-tation programs.7,26,30,31 In this study, pyridostigmine was adminis-tered to 3 patients, and was effective in 2 of them. Pyridostigmine has been demonstrated to be effective in colonic decompression in pediatric CIPO patients.32,33
The limitation of this study is that the number of CIPO pa-
tients was small, and the study was conducted at a single center. A multicenter study involving a large number of Korean patients with CIPO is needed.
In conclusion, ACTG2 variants are commonly found among CIPO patients in Korea. In CIPO patients with megacystis and ab-normal prenatal ultrasonography, genetic testing of ACTG2 should be considered. Molecular diagnosis of CIPO is important because it is difficult to differentiate myopathy from neuropathy by patho-logical findings alone. ACTG2 genetic analysis can help avoid inva-sive diagnostic interventions such as full-thickness bowel biopsy.
Financial support: This study was supported by grant (No. 0420203090) from Seoul National University Hospital.
Conflicts of interest: None.
Author contributions: Jong Woo Hahn: collecting, interpret-ing data, and drafting the manuscript; Soo Young Moon, Min Soo Kim, Min Hyung Woo, and Min Ji Sohn: interpreting data; Hyun-Young Kim: conducting the study; Moon-Woo Seong, Sung Sup Park, and Sung-Hye Park: conducting the study and inter-preting data; Jin Soo Moon: conducting the study, interpreting the data, and revising the manuscript; and Jae Sung Ko: planning and conducting the study, interpreting the data, and revising the manu-script.
References
1. Collins RRJ, Barth B, Megison S, et al. ACTG2-associated visceral myopathy with chronic intestinal pseudoobstruction, intestinal malrota-tion, hypertrophic pyloric stenosis, choledochal cyst, and a novel missense mutation. Int J Surg Pathol 2019;27:77-83.
2. Muto M, Matsufuji H, Tomomasa T, et al. Pediatric chronic intestinal pseudo-obstruction is a rare, serious, and intractable disease: a report of a nationwide survey in Japan. J Pediatr Surg 2014;49:1799-1803.
3. Di Lorenzo C. Pseudo-obstruction: current approaches. Gastroenterol-ogy 1999;116:980-987.
4. Di Nardo G, Di Lorenzo C, Lauro A, et al. Chronic intestinal pseudo-obstruction in children and adults: diagnosis and therapeutic options. Neurogastroenterol Motil 2017;29:e12945.
5. Yamataka A, Ohshiro K, Kobayashi H, et al. Abnormal distribution of intestinal pacemaker (C-KIT-positive) cells in an infant with chronic idio-pathic intestinal pseudoobstruction. J Pediatr Surg 1998;33:859-862.
6. Milunsky A, Baldwin C, Zhang X, Primack D, Curnow A, Milunsky J. Diagnosis of chronic intestinal pseudo-obstruction and megacystis by se-quencing the ACTG2 gene. J Pediatr Gastroenterol Nutr 2017;65:384-387.
7. Wangler MF, Gonzaga-Jauregui C, Gambin T, et al. Heterozygous de novo and inherited mutations in the smooth muscle actin (ACTG2)
110
Jong Woo Hahn, et al
Journal of Neurogastroenterology and Motility 110
gene underlie megacystis-microcolon-intestinal hypoperistalsis syndrome. PLoS Genet 2014;10:e1004258.
8. Lehtonen HJ, Sipponen T, Tojkander S, et al. Segregation of a missense variant in enteric smooth muscle actin gamma-2 with autosomal domi-nant familial visceral myopathy. Gastroenterology 2012;143:1482-1491, e3.
9. Thorson W, Diaz-Horta O, Foster J 2nd, et al. De novo ACTG2 muta-tions cause congenital distended bladder, microcolon, and intestinal hypo-peristalsis. Hum Genet 2014;133:737-742.
10. Matera I, Rusmini M, Guo Y, et al. Variants of the ACTG2 gene cor-relate with degree of severity and presence of megacystis in chronic intes-tinal pseudo-obstruction. Eur J Hum Genet 2016;24:1211-1215.
11. Rudolph CD, Hyman PE, Altschuler SM, et al. Diagnosis and treat-ment of chronic intestinal pseudo-obstruction in children: report of con-sensus workshop. J Pediatr Gastroenterol Nutr 1997;24:102-112.
12. Richards S, Aziz N, Bale S, et al. Standards and guidelines for the inter-pretation of sequence variants: a joint consensus recommendation of the American College of Medical Genetics and Genomics and the Associa-tion for Molecular Pathology. Genet Met 2015;17:405-424.
13. Assia Batzir N, Kishor Bhagwat P, Larson A, et al. Recurrent arginine substitutions in the ACTG2 gene are the primary driver of disease bur-den and severity in visceral myopathy. Hum Mutat 2020;41:641-654.
14. Milunsky A, Lazier J, Baldwin C, Young C, Primack D, Milunsky JM. Prenatal diagnosis of chronic intestinal pseudo-obstruction and paternal somatic mosaicism for the ACTG2 pathogenic variant. Prenat Diagn 2017;37:1254-1256.
15. Halim D, Hofstra RM, Signorile L, et al. ACTG2 variants impair actin polymerization in sporadic megacystis microcolon intestinal hypoperistal-sis syndrome. Hum Mol Genet 2016;25:571-583.
16. Gosemann JH, Puri P. Megacystis microcolon intestinal hypoperistalsis syndrome: systematic review of outcome. Pediatr Surg Int 2011;27:1041-1046.
17. Tuzovic L, Tang S, Miller RS, et al. New insights into the genetics of fetal megacystis: ACTG2 mutations, encoding gamma-2 smooth muscle actin in megacystis microcolon intestinal hypoperistalsis syndrome (berdon syndrome). Fetal Diagn Ther 2015;38:296-306.
18. Miyata M, Watanabe K, Suzuki T, et al. Chronic intestinal pseudoob-struction ileus in a patient with rheumatoid arthritis: outcome of a stoma construction and its histopathological features. J Gastroenterol 2002;37:653-657.
19. Rohrmann CA Jr, Ricci MT, Krishnamurthy S, Schuffler MD. Ra-diologic and histologic differentiation of neuromuscular disorders of the gastrointestinal tract: visceral myopathies, visceral neuropathies, and pro-gressive systemic sclerosis. AJR Am J Roentgenol 1984;143:933-941.
20. Puri P, Lake BD, Gorman F, O’Donnell B, Nixon HH. Megacystis-microcolon-intestinal hypoperistalsis syndrome: a visceral myopathy. J Pediatr Surg 1983;18:64-69.
21. Rolle U, O’Briain S, Pearl RH, Puri P. Megacystis-microcolon-intestinal hypoperistalsis syndrome: evidence of intestinal myopathy. Pediatr Surg Int 2002;18:2-5.
22. Puri P, Shinkai M. Megacystis microcolon intestinal hypoperistalsis syn-drome. Semin Pediatr Surg 2005;14:58-63.
23. Kirtane J, Talwalker V, Dastur DK. Megacystis, microcolon, intesti-nal hypoperistalsis syndrome: possible pathogenesis. J Pediatr Surg 1984;19:206-208.
24. Piotrowska AP, Rolle U, Chertin B, De Caluwé D, Bianchi A, Puri P. Alterations in smooth muscle contractile and cytoskeleton proteins and interstitial cells of Cajal in megacystis microcolon intestinal hypoperistalsis syndrome. J Pediatr Surg 2003;38:749-755.
25. Faure C, Goulet O, Ategbo S, et al. Chronic intestinal pseudoobstruc-tion syndrome: clinical analysis, outcome, and prognosis in 105 children. French-speaking group of pediatric gastroenterology. Dig Dis Sci 1999;44:953-959.
26. Stanghellini V, Cogliandro RF, De Giorgio R, et al. Natural history of chronic idiopathic intestinal pseudo-obstruction in adults: a single center study. Clin Gastroenterol Hepatol 2005;3:449-458.
27. Knafelz D, Gambarara M, Diamanti A, et al. Complications of home parenteral nutrition in a large pediatric series. Transplant Proc 2003;35:3050-3051.
28. Diamanti A, Gambarara M, Knafelz D, et al. Prevalence of liver com-plications in pediatric patients on home parenteral nutrition: indications for intestinal or combined liver-intestinal transplantation. Transplant Proc 2003;35:3047-3049.
29. Cucchiara S, Borrelli O. Nutritional challenge in pseudo-obstruction: the bridge between motility and nutrition. J Pediatr Gastroenterol Nutr 2009;48(suppl 2):S83-S85.
30. Lapointe SP, Rivet C, Goulet O, Fékété CN, Lortat-Jacob S. Urological manifestations associated with chronic intestinal pseudo-obstructions in children. J Urol 2002;168(4 pt 2):1768-1770.
31. Fullerton BS, Hong CR, Jaksic T. Long-term outcomes of pediatric in-testinal failure. Semin Pediatr Surg 2017;26:328-335.
32. Choudhury A, Rahyead A, Kammermeier J, Mutalib M. The use of pyridostigmine in a child with chronic intestinal pseudo-obstruction. Pe-diatrics 2018;141(suppl 5):S404-S407.
33. Lee H, Park S, Oh JT, Kim HM, Kim S, Lee JS. Oral pyridostigmine-responsive visceral myopathy with ACTG2 mutations: a case series. J Pediatr Gastroenterol Nutr 2019;68:e16-e17.

111 2022 The Korean Society of Neurogastroenterology and Motility
J Neurogastroenterol Motil, Vol. 28 No. 1 January, 2022www.jnmjournal.org
JNMJ Neurogastroenterol Motil, Vol. 28 No. 1 January, 2022pISSN: 2093-0879 eISSN: 2093-0887https://doi.org/10.5056/jnm20250
Original ArticleJournal of Neurogastroenterology and Motility
Received: November 13, 2020 Revised: December 18, 2020 Accepted: December 28, 2020 This is an Open Access article distributed under the terms of the Creative Commons Attribution Non-Commercial License (http://creativecommons. org/licenses/by-nc/4.0) which permits unrestricted non-commercial use, distribution, and reproduction in any medium, provided the original work is properly cited.
*Correspondence: Hye-Kyung Jung and Joong Goo Kwon are equally responsible for this study. Hye-Kyung Jung, MD, PhD Department of Internal Medicine, College of Medicine, Ewha Womans University, 1071 Anyangcheon-ro, Yangcheon-gu, Seoul 07985, Korea Tel: +82-2-2650-2874, Fax: +82-2-2655-2874, E-mail: [email protected] Joong Goo Kwon, MD, PhD Department of Internal Medicine, Daegu Catholic University School of Medicine, 33 Duryugongwon-ro 17-gil, Nam-gu, Daegu 42472, Korea Tel: +82-53-650-4215, Fax: +82-53-621-4487, E-mail: [email protected]
Development and Validity Assessment of a Self-evaluation Questionnaire for Functional Dyspepsia: A Multicenter Prospective Study in Korea
Kyoungwon Jung,1 Hye-Kyung Jung,2* Joong Goo Kwon,3* Chung Hyun Tae,2 Ki Bae Bang,4 Jong Kyu Park,5 Ju Yup Lee,6 Cheol Min Shin,7 Jung Hwan Oh,8 Kyung Ho Song,9 Oh Young Lee,10 and Myung-Gyu Choi8
1Department of Internal Medicine, Kosin University College of Medicine, Busan, Korea; 2College of Medicine, Ewha Womans University, Seoul, Korea; 3Daegu Catholic University School of Medicine, Daegu, Korea; 4Dankook University College of Medicine, Cheonan, Chungcheongnam-do, Korea; 5Gangneung Asan Hospital, University of Ulsan College of Medicine, Gangneung, Gangwon-do, Korea; 6Keimyung University School of Medicine, Daegu, Korea; 7Seoul National University Bundang Hospital, Seongnam, Gyeonggi-do, Korea; 8College of Medicine, The Catholic University of Korea, Seoul, Korea; 9CHA University, Ilsan Medical Center, Ilsan, Gyeonggi-do, Korea; and 10Hanyang University College of Medicine, Seoul, Korea
Background/AimsPatient-reported outcomes (PROs) are essential for clinical decision making, conduction of clinical research, and drug application acquisition in functional gastrointestinal disorders. The aim of this study is to develop a PRO instrument and to determine the respondents’ perception of the efficacy of therapeutic agents for functional dyspepsia (FD).
MethodsA self-evaluation questionnaire for dyspepsia (SEQ-DYSPEPSIA) was developed and validated through a structured process. The 2-week reproducibility was evaluated, and the construct validity was assessed by correlating the scores of SEQ-DYSPEPSIA (including typical and major FD symptom subscales). Finally, the response to medication was assessed by comparing the changes after 4 weeks of treatment.
ResultsA total of 193 Korean patients (age 48.5 ± 13.6 years, 69.4% women) completed the questionnaire. SEQ-DYSPEPSIA with 11 items had a good internal consistency (alpha = 0.770-0.905) and an acceptable test-retest reliability (intraclass correlation coefficient = 0.733-0.859). The self-evaluation questionnaire (SEQ)-major FD score highly correlated with the postprandial fullness/early satiety domain of the Patient Assessment of Gastrointestinal Symptom Severity Index (correlation coefficient r = 0.741, P < 0.001), Nepean Dyspepsia Index-Korean version (NDI-K) (r = 0.839, P < 0.001), and NDI-K quality of life (r = −0.275 to −0.344, P < 0.001). After medical treatment, decrease in the SEQ-typical FD and SEQ-major FD was significantly greater in the responder group than in non-responder group (P = 0.019 and P = 0.009, respectively).
ConclusionThis study suggests that the Korean version of SEQ-DYSPEPSIA has good reliability and validity, and can be a useful PRO measurement tool in patients with FD.(J Neurogastroenterol Motil 2022;28:111-120)
Key WordsDyspepsia; Patient outcome assessment; Surveys and questionnaires; Validation study

112
Kyoungwon Jung, et al
Journal of Neurogastroenterology and Motility 112
Introduction
Functional dyspepsia (FD) is a symptom complex affecting the upper gastrointestinal (GI) tract, including chronic and recur-rent epigastric pain or soreness, postprandial fullness, early satiety, bloating, and nausea, which does not show organic lesions such as peptic ulcers, benign or malignant neoplasms, or pancreato-biliary lesions.1 The Rome IV criteria define FD as the presence of one or more symptoms among postprandial fullness, early satiety, and up-per abdominal pain or soreness, which start at least 6 months before diagnosis and last for > 3 months without any organic disease.1 FD is classified into 2 subtypes according to the main symptoms: post-prandial distress syndrome (PDS) and epigastric pain syndrome (EPS).1,2 The prevalence of FD has been reported to be approxi-mately 15.0-40.0% worldwide.3,4 In an epidemiological survey of comprehensive medical examinations in Korea, the prevalence of FD according to the Rome III criteria was found to be 8.1% (EPS, 4.6% and PDS, 6.5%).5 In addition, among patients who visited a tertiary medical center for GI symptoms, FD had the highest prevalence at approximately 37.0%.6
FD is not a life-threatening disorder; however, it leads to a poor quality of life (QOL) and places a heavy medical burden on patients.7,8 The pathophysiology of FD has not yet been fully char-acterized, although it is known to be caused by a complex of disease processes including delayed gastric emptying, visceral hypersensitiv-ity, impaired gastric accommodation, dysfunction of the duodenum and jejunum, and dysfunction of the brain-gut interaction.3 There-fore, it is difficult to develop effective drugs for FD that exceed high placebo effects while acting on such diverse mechanisms. The representative drugs for FD are anti-secretory agents including proton pump inhibitors (PPIs) and histamine 2 blockers, as well as prokinetic drugs. In some patients, tricyclic antidepressants or selec-tive serotonin reuptake inhibitors are used to modulate the enteric nervous system and manage psychological comorbidities.3,9,10
The Food and Drug Administration provides guidelines for re-viewing and evaluating existing or newly developed patient-reported outcomes (PROs) used to support claims in the labeling of medical products.11 With the establishment of the Rome criteria, clinical tri-als on the treatment of functional GI diseases are continuously be-ing performed, and recommendations based on clinical trial results are periodically published.12 To conduct clinical trials, it is essential to develop verified evaluation tools that focus on specific symptoms of FD. In addition, in many countries, a questionnaire for patients with FD written in the local language is developed and verified,
and the drug response of FD is measured using a verified symptom assessment questionnaire.13
We aim to develop and validate a self-evaluation questionnaire for dyspepsia (SEQ-DYSPEPSIA) that is easily applicable to Ko-rean patients, and can be used in regulated clinical trials for assess-ing treatment efficacy claims intended for product labeling in FD treatment.
Materials and Methods
From October 2017 to September 2019, this study was con-ducted to develop and verify a questionnaire for patients with FD between the ages of 19 and 75 years who first visited the hospital or re-visited the hospital within 6 months. The study protocol was approved by the ethical review committee of each hospital (KUGH 2017-11-037, EUMC 2017-09-037-007, CR-17-146, DKUH 2017-11-007-001, GNAH 2018-01-015-005, DSMC 2017-11-068, and B-1801/442-303). Written informed consent was obtained from all participants.
Patient SelectionParticipants for the validation study were enrolled from outpa-
tient clinics in 7 tertiary medical centers in Korea. FD was defined as the Rome IV criteria. Symptoms with a score of at least 2 points (on a scale of 1 to 5 points) in discomfort in daily life are defined as “bothersome” in the Rome criteria.1 All patients underwent upper GI endoscopy within 6 months before enrollment, which confirmed the absence of an organic cause for upper GI symptoms (UGISs). Patients aged 19-75 years who had the minimum understanding needed to complete the questionnaire were selected as study par-ticipants. The following patients were excluded from the study: (1) patients who had undergone GI surgery except appendectomy; (2) patients who were pregnant or lactating; (3) patients with a seri-ous systemic or mental illness; (4) patients requiring continuous treatment for the liver, biliary tract, small intestine, and colon; (5) patients with uncontrolled diabetes mellitus or thyroid disease; and (6) patients who had taken acid secretion inhibitors, including PPIs or GI motility drugs, in the last 2 weeks. The global severity of FD assessed using a five-point Likert scale was evaluated at the first enrollment.
Development of a Self-evaluation Questionnaire for Upper Gastrointestinal Symptoms
First, through a systematic review, published questionnaires and scripted items related to FD were identified and reviewed by

113113
A Self-evaluation Questionnaire for FD
Vol. 28, No. 1 January, 2022 (111-120)
experts (M.G.C. and H.K.J.).12 By using candidate items including typical and atypical FD symptoms, the SEQ-DYSPEPSIA ques-tionnaire was first developed in English and subsequently translated into Korean. On the basis of a structured translation process, the reverse translation of the translated draft showed that the target ver-sion was functionally identical to the original English version. The draft questionnaire was produced at the 6th grade reading level and used words as specifically pronounced by the patients.
The final and validated SEQ-DYSPEPSIA is composed of 11 questions mainly addressing the severity and frequency of FD and UGISs over a 2-week recall period, and is divided into the typical FD, major FD, and other UGISs. The self-evaluation questionnaire (SEQ)-typical FD includes 4 typical FD symptoms (epigastric pain, epigastric soreness, postprandial fullness, and early satiety) corresponding to the Rome IV criteria. The SEQ-major FD includes typical FD symptoms and other frequent dyspeptic symptoms (bloating, belching, and nausea). Other UGISs such as gastroesophageal reflux disease (GERD) symptoms and vomiting were included for the purpose of confirming the overlap or differen-tial diagnosis with other upper GI disorders mimicking FD. This questionnaire required responses based on 5 levels of the Likert scale for frequency (no symptoms to daily symptoms) and severity (not at all or very weak to extremely severe). The scores of SEQ-DYSPEPSIA were calculated into a sum score for each symptom frequency and severity, with higher scores indicating greater severity of symptoms. All 11 items were given equal weight.
Because pictorial expression in the communication of symp-toms is known to improve patient understanding and memory, cartoon-style images of the patients’ symptoms were added to the SEQ-DYSPEPSIA questionnaire (Supplementary Figure).14
Reliability and Validity of the Self-evaluation Questionnaire for Upper Gastrointestinal Symptoms
Test-retest reliability was assessed to determine the stability of SEQ-DYSPEPSIA. The participants were instructed to complete the questionnaire 2 times with a 2-week interval before starting treatment with medication. Quantitative psychometric analyses of SEQ-DYSPEPSIA were conducted together with the Patient As-sessment of GI Symptom Severity Index (PAGI-SYM),15 Nepean Dyspepsia Index-Korean version (NDI-K), and validated NDI-K QOL questionnaires.16,17
Evaluation of Therapeutic Response With Self-evaluation Questionnaire for Dyspepsia
The degree of symptom improvement was measured using
SEQ-DYSPEPSIA before and after treatment with 4 weeks of a PPI (lansoprazole 30 mg, once a day) and a prokinetic agent (mosapride 5 mg, three times a day). In addition, patients with FD were asked to fill out other questionnaires including PAGI-SYM, NDI-K, and NDI-K QOL, before and after medical treatment. The Overall Treatment Evaluation (OTE) scale was a 5-point Lik-ert scale defined as follows: 1 point, disappearance of symptoms; 2 points, greatly improved symptoms more than 50%; 3 points, ≤ 50% disappearance of symptoms; 4 points, no change in symptoms; and 5 points, worsening of symptoms. Patients who showed more than “greatly improved symptoms” (1 or 2 points) after medi-cal treatment were defined as the response group. According to the therapeutic response, the change of the composite score of the SEQ-typical and SEQ-major FD was measured, and the score changes in the PAGI-SYM, NDI-K, and NDI-K QOL question-naires were also compared.
Statistical MethodsThe number of test-retest samples was calculated as 50 by refer-
ring to the study in which Park et al18 conducted cultural validation on GI symptoms questionnaire for functional GI disease. To mea-sure the number of samples to evaluate the treatment response, we referred to the PAGI-SYM survey study through 7-Likert OTE. In the PAGI-SYM study, mean symptom scores between respond-ers and non-responders of satiety and early satiety were found to be −0.10 and −0.91, respectively.19 Therefore, we estimated a sample size of at least 54 in order to achieve a statistical power of 80.0% at a 5.0% significance level on a 2-sided test. Considering a 20.0% dropout rate or loss to follow-up during the study period, it was es-timated that a target enrollment of 68 subjects was needed.20
Internal consistency was assessed using Cronbach’s alpha, with a value of ≥ 0.7 considered to indicate a high degree of internal consistency. Test-retest reliability was evaluated using intraclass cor-relation coefficients (ICCs) and Pearson correlation coefficients. An ICC of ≥ 0.7 was considered sufficient to demonstrate reliability.21 Construct validity was assessed by comparing Pearson’s correlation coefficients between the SEQ-typical FD/SEQ-major FD scores and the dyspepsia subscale scores of PAGI-SYM, NDI-K, and NDI-K QOL. Among the valid constructs, discriminant validity was evaluated by comparing the Pearson’s correlation coefficients between SEQ-DYSPEPSIA and the PAGI-SYM subscales other than FD symptoms. In contrast, known-group validity was evalu-ated using an analysis of variance test to compare groups of patients in terms of the scores of SEQ-DYSPEPSIA and FD global sever-ity. The independent t test or Mann-Whitney U test was used to

114
Kyoungwon Jung, et al
Journal of Neurogastroenterology and Motility 114
compare the differences in changes in the mean SEQ-typical and major FD scores from baseline to 4 weeks according to the OTE scale. The responsiveness index was calculated using effect size (ES) and standardized response mean (SRM) values.22 ES was calcu-lated by dividing the mean change score by the standard deviation (SD) of the before-treatment scores, and SRM was calculated as the mean change score divided by the SD of the changed scores. The calculated ES or SRM value was categorized as small (0.2), medium (0.5), or large (0.8) (Cohen’s thresholds). All statistical analyses were performed using SPSS version 26.0 (IBM Corp, Armonk, NY, USA), and P-values < 0.05 were considered statisti-cally significant.
Results
Study Patients and Clinical CharacteristicsAmong 220 patients with FD, 193 completed the question-
naires and were finally included in the present study. The mean age of the participants was 48.5 years (SD 13.6 years, range 19-75 years), and 69.4% of the patients were women. The proportion of patients with an FD symptom duration of < 1 year was 51.8% (Table 1). For the assessment of test-retest stability, 102 patients completed the SEQ-DYSPEPSIA questionnaire again 2 weeks after their first evaluation. A total of 121 patients underwent treat-ment with lansoprazole (30 mg, once a day) and mosapride (5 mg, three times a day) for 4 weeks. Finally, 94 patients completed the SEQ-DYSPEPSIA questionnaire for the third time.
The mean SEQ-DYSPEPSIA score for 193 subjects on first questionnaires was 41.51 ± 14.06 (median score 40, range 22-99, maximal score 110). According to the global severity of the patients, 57 (29.5%) reported no or mild symptoms, 79 (40.9%) reported moderate symptoms, and 57 (29.5%) reported severe or very severe symptoms.
ReliabilityInternal consistency was calculated using Cronbach’s alpha,
which ranged from 0.770 (for SEQ-typical FD) to 0.905 (for SEQ-DYSPEPSIA) (Supplementary Table 1). The Cronbach’s alpha coefficient of the 4 typical FD symptoms (epigastric pain, soreness, postprandial fullness, and early satiety) was 0.770, and that of the 7 major FD symptoms (epigastric pain, soreness, post-prandial fullness, early satiety, bloating, belching, and nausea) was 0.865. SEQ-DYSPEPSIA showed a high test-retest reliability, as confirmed by the ICCs of the different SEQ-DYSPEPSIA sub-
groups. The ICC of the GERD symptom subgroup (heartburn, retrosternal chest pain, acid regurgitation, and nonacid regurgita-tion) was 0.841, and that of the bloating and belching subgroup was 0.733 (Table 2).
ValidityThe construct validity of SEQ-DYSPEPSIA was evaluated
according to its correlation with the PAGI-SYM postprandial full-ness/early satiety subscale, NDI-K total and dyspepsia subscale, and NDI-K QOL scores (Table 3). The SEQ-typical FD symptoms highly correlated with the PAGI-SYM postprandial fullness/early satiety subscale (r = 0.648, P < 0.001), and the SEQ-major FD symptoms showed an even higher correlation with the PAGI-SYM postprandial fullness/early satiety subscale (r = 0.741, P < 0.001). The SEQ-typical and major FD symptoms also significantly cor-related with the NDI-K total scores (SEQ-typical FD, r = 0.784, P < 0.001; SEQ-major FD, r = 0.851, P < 0.001) or NDI-K
Table 1. Study Participants and Clinical Characteristics
Variables N = 193
Female sex 134 (69.4)Age (yr) 48.5 ± 13.6 (19-75)BMI (kg/m2) 23.29 ± 3.59 (16.04-36.85)Smoking/drinking habits Current smoker 22 (11.4) Alcohol usera 32 (16.6) Coffee userb 19 (9.8)Comorbidities Diabetes mellitus 13 (6.7) Hypertension 26 (13.5) Chronic lung/heart disease 9 (4.7) Osteoporosis 12 (6.2) Other chronic diseasec 17 (8.8)Symptom onset < 6 mo 73 (37.8) 7 mo-1 yr 27 (14.0) 1-2 yr 21 (10.9) 2-5 yr 28 (14.5) > 5 yr 44 (22.8)Global severity grade No or mild 57 (29.5) Moderate 79 (40.9) Severe or very severe 57 (29.5)
aAlcohol user: intake of ≥ 24 g alcohol at least 2 times per week or more.bCoffee user: intake of ≥ 3 cups of coffee per day.cChronic disease: thyroid disease, hepatitis, Behcet’s disease, or hyperlipidemia.BMI, body mass index.Data are presented as n (%) or mean ± SD (range).

115115
A Self-evaluation Questionnaire for FD
Vol. 28, No. 1 January, 2022 (111-120)
dyspepsia subscale scores (SEQ-typical FD, r = 0.814, P < 0.001; SEQ-major FD, r = 0.839, P < 0.001) (Table 3). Moreover, the SEQ-typical FD/SEQ-major FD symptoms also correlated with NDI-K QOL. As symptom severity increased, the patient-reported NDI-K QOL significantly decreased. The strongest correlations were observed for the SEQ-major FD symptoms and the work/study quality domain of NDI-K QOL (r = −0.385, P < 0.001).
To confirm discriminant validity for differentiation from other GI symptoms, the results of the SEQ-DYSPEPSIA question-naire and the association with each subscale of PAGI-SYM other
than postprandial fullness/early satiety were analyzed. It showed a high correlation with the postprandial fullness/early satiety subscale (correlation coefficient ≥ 0.6), but a low correlation with nausea/vomiting, and lower abdominal pain (Table 3). In particular, SEQ-typical FD showed poor correlation with nausea/vomiting, lower abdominal pain, and heartburn/regurgitation subscales of PAGI-SYM. In addition, to confirm the degree of discrimination in the questionnaire, the relationship between the SEQ-typical/major FD symptoms and symptoms other than typical FD was also con-firmed. Among the various detailed symptoms, acid regurgitation
Table 2. Test-Retest Reliability of Self-evaluation Questionnaire for Dyspepsia
Subscale No. ICC P-value Pearson’s r P-value
Epigastric pain or soreness 1 0.777 < 0.001 0.659 < 0.001Postprandial distress (early satiation and postprandial fullness) 2-3 0.736 < 0.001 0.606 < 0.001SEQ-typical FD (Q1-3) 1-3 0.794 < 0.001 0.679 < 0.001SEQ-major FD (Q1-6) 1-6 0.831 < 0.001 0.736 < 0.001Bloating/belching 4-5 0.733 < 0.001 0.599 < 0.001Nausea/vomiting 6, 11 0.817 < 0.001 0.726 < 0.001GERD 4 symptoms 7-10 0.841 < 0.001 0.729 < 0.001SEQ-DYSPEPSIA 1-11 0.859 < 0.001 0.766 < 0.001
ICC, intraclass correlation coefficient; SEQ, self-evaluation questionnaire; FD, functional dyspepsia; GERD, gastroesophageal reflux disease; SEQ-DYSPEPSIA, SEQ for dyspepsia.Each symptom score is calculated as the sum of the frequency and severity of each subscale.
Table 3. Construct and Discriminant Validity of Self-evaluation Questionnaire for Dyspepsia Evaluated by Comparing With Patient Assessment of Gastrointestinal Symptom Severity Index, Nepean Dyspepsia Index-Korean Dyspepsia, Nepean Dyspepsia Index-Korean Total, and Nepean Dyspepsia Index-Korean Quality of Life
VariablesSEQ-typical FD (Q1-3) SEQ-major FD (Q1-6) SEQ-DYSPEPSIA
Pearson’s r P-value Pearson’s r P-value Pearson’s r P-value
PAGI-SYM nausea/vomiting 0.289 < 0.001 0.440 < 0.001 0.518 < 0.001PAGI-SYM postprandial fullness/early satiety 0.648 < 0.001 0.741 < 0.001 0.678 < 0.001PAGI-SYM bloating 0.489 < 0.001 0.588 < 0.001 0.579 < 0.001PAGI-SYM upper abdominal pain 0.649 < 0.001 0.598 < 0.001 0.588 < 0.001PAGI-SYM lower abdominal pain 0.288 < 0.001 0.329 < 0.001 0.338 < 0.001PAGI-SYM heartburn/regurgitation 0.487 < 0.001 0.568 < 0.001 0.711 < 0.001NDI-K dyspepsia 0.814 < 0.001 0.839 < 0.001 0.781 < 0.001NDI-K total 0.784 < 0.001 0.851 < 0.001 0.862 < 0.001NDI-K QOL Tension/sleep −0.316 < 0.001 −0.351 < 0.001 −0.397 < 0.001 Interference with daily activities −0.275 < 0.001 −0.295 < 0.001 −0.353 < 0.001 Eating/drinking −0.336 < 0.001 −0.304 < 0.001 −0.333 < 0.001 Knowledge/control −0.327 < 0.001 −0.348 < 0.001 −0.350 < 0.001 Work/study −0.344 < 0.001 −0.385 < 0.001 −0.452 < 0.001
SEQ, self-evaluation questionnaire; FD, functional dyspepsia; SEQ-DYSPEPSIA, SEQ for dyspepsia; PAGI-SYM, Patient Assessment of Gastrointestinal Symp-tom Severity Index; NDI-K, Nepean Dyspepsia Index-Korean; QOL, quality of life.Each symptom score is calculated as the sum of the frequency and severity of each subscale.Data are presented as correlation coefficients and P-values.

116
Kyoungwon Jung, et al
Journal of Neurogastroenterology and Motility 116
and nonacid regurgitation modestly correlated with SEQ-typical FD (r = 0.380, P < 0.001; r = 0.271, P < 0.001), and vomiting showed the lowest correlation with both the SEQ-typical FD (r = 0.220, P = 0.002) and SEQ-major FD (r = 0.310, P < 0.001) composite scores (Supplementary Table 2).
In addition, known-group validity according to the severity of symptoms was also confirmed by examining whether differences in SEQ-typical/SEQ-major FD scores were significantly different according to self-reported global severity. The mean scores of SEQ-typical FD significantly increased according to the global severity of FD (9.42 ± 3.93, no or mild group [n = 57]; 13.20 ± 4.91, moderate group [n = 79]; 14.75 ± 5.65, severe group [n = 57]) (P < 0.001). Similarly, the mean scores of the PAGI-SYM postprandial fullness/early satiety subscale (0.93 ± 1.13, no or mild group [n = 57]; 1.65 ± 1.20, moderate group [n = 79]; 2.17 ± 1.25, severe group [n = 57]) (P < 0.001), NDI-K dyspepsia subscale (15.53 ± 16.47, no or mild group [n = 57]; 30.81 ± 19.81, moderate group [n = 79]; 39.82 ± 22.26, severe group [n = 57]) (P < 0.001), and NDI-K total (26.35 ± 24.88, no or mild group [n = 57]; 44.44 ± 27.47, moderate group [n = 79]; 61.00 ± 36.29, severe group [n = 57]) (P < 0.001) were significantly different according to the self-reported global severity (Figure).
Therapeutic Response Analysis With Self-evaluation Questionnaire for Dyspepsia
Treatment response was evaluated in 94 patients. When the patients were classified according to the definition of therapeutic re-sponse, 45 patients were determined to show a favorable treatment response. The posttreatment mean score and the different scores of both SEQ-typical FD and SEQ-major FD significantly decreased in the responder group compared with the non-responder group, and decrease in the SEQ-typical FD and SEQ-major FD was significantly greater in the responder group than in non-responder group (P = 0.019 and P = 0.009, respectively, Mann-Whitney U test) (Table 4).
Subsequently, the responsiveness index was measured using the ES and SRM values for mean changes in the PAGI-SYM postprandial fullness/early satiety subscale, NDI-K dyspepsia sub-scale, and NDI-K total scores. After 4 weeks of treatment, it was confirmed that the SEQ-typical/SEQ-major FD domains showed a noninferior responsiveness index compared with other, already validated questionnaires (PAGI or NDI-K) (Supplementary Table 3).
Discussion
SEQ-DYSPEPSIA consists of FD symptoms identified in the Rome criteria as well as additional symptoms identified from the literature.1,12 It is a highly reliable and valid PRO instrument with a good medication responsiveness index in patients with FD. It is im-portant to develop an accurate diagnostic tool for determining treat-ment responsiveness that exceeds the high placebo effect in patients with FD.23
Currently, a variety of questionnaires are available for measuring outcomes in patients with functional GI disorders, including FD; however, many questionnaires do not meet the Rome criteria or are too complex, resulting in limitations and heterogeneity in evaluat-ing the patients’ symptoms and treatment responses.11 In 2004, the National Institute of Health actively developed patient-generated reports, starting with a system called the PRO Measurement In-formation System.24 These patient-generated reports, also known as PROs, are known to be useful for efficiently expressing functional GI disorders and symptoms and for evaluating treatment responses in the viewpoint of patients, rather than evaluating the disease from the viewpoint of physicians.25 On the basis of important PROs, this study is a patient self-evaluation questionnaire survey that summa-rizes other symptoms necessary for differential diagnoses, including
Figure. Results of known-group validity according to the severity of symptoms. The mean scores of the self-evaluation questionnaire (SEQ)-typical functional dyspepsia (FD), Nepean Dyspepsia Index-Korean (NDI-K) dyspepsia subscale, NDI-K total, and Patient As-sessment of Gastrointestinal Symptom Severity Index (PAGI-SYM) postprandial fullness/early satiety subscale were significantly different according to the self-reported global severity.
No to mild Moderate Severe
60
50
40
30
20
109.42
15.53
26.350.93
13.20
30.81
44.441.65
14.75
39.82
61.00
2.17
0
SEQ-typical FD
NDI-K dyspepsia subscale
NDI-K total
PAGI-SYM postprandial fullness/early satiety subscale
2.5
2.0
1.5
1.0
0.5
0
According to global severity

117117
A Self-evaluation Questionnaire for FD
Vol. 28, No. 1 January, 2022 (111-120)
typical FD symptoms highlighted in Rome IV. For patient-reported questionnaires on FD, several indices (Dyspepsia Symptom Sever-ity Index, GI symptom score, and NDI) have been validated in previous studies.26-28 However, although a Korean version of a ques-tionnaire that records the patients’ symptoms in an intuitive manner, other than being a QOL assessment questionnaire, has been devel-oped in patients with GERD, very limited instruments are available for patients with FD.29-31 In the case of FD, 4 distinct symptoms are mentioned in the Rome IV criteria;1 however, other additional symptoms (belching, nausea, and bloating) may be present in pa-tients with FD. In a factor and cluster analysis study conducted by Piessevaux et al32 in the general population, symptoms of bloating, belching, nausea, and vomiting, in addition to the main symptoms of epigastric discomfort, pain, fullness, and early satiety in patients with FD, were also analyzed. In a total of 378 participants, mild to severe symptoms were accompanied by bloating in 68.0%, belching in 50.0%, nausea in 38.9%, and vomiting in 23.3% of patients. In
addition to the 4 typical symptoms mentioned in the Rome IV cri-teria, additional symptoms such as bloating, nausea, belching, and vomiting were confirmed in patients with FD. In a study analyzing the heterogeneity of symptom patterns, Fischler et al33 observed similar results among the types of symptoms, except for heteroge-neity that did not show vomiting symptoms in 71.2% (311/438) of patients. On the basis of the results of previous studies,1,32-34 the present study identified bloating, belching, and nausea as the main symptoms of FD along with the 4 typical symptoms (epigastric pain, epigastric soreness, postprandial fullness, and early satiety). In the full questionnaire, vomiting was also included to discriminate against other diseases and to confirm validity, as well as to discrimi-nate GERD. GERD is difficult to clearly distinguish from FD, especially because it frequently overlaps with FD (approximately 9.0-30.0%),35 and the present study showed that the correlation between FD and reflux symptom was low to moderate (Pearson’s correlation coefficient 0.271-0.507). Therefore, each item in SEQ-
Table 4. Changes in the Mean Scores of Self-evaluation Questionnaire for Dyspepsia, Patient Assessment of Gastrointestinal Symptom Severity Index Postprandial Fullness/Early Satiety, and Nepean Dyspepsia Index-Korean According to Overall Treatment Effect
Variables Responders (n = 45) Non-responders (n = 49) P-value
SEQ-typical FD (Q1-3) Baseline 13.36 ± 4.23 13.98 ± 5.56 0.889 At 4 weeks 8.69 ± 2.97 11.63 ± 5.02 0.001 Difference −4.67 ± 4.84 −2.35 ± 4.59 0.019SEQ-major FD (Q1-6) Baseline 26.49 ± 7.88 27.31 ± 8.44 0.629 At 4 weeks 17.00 ± 5.09 22.78 ± 8.61 < 0.001 Difference −9.49 ± 8.28 −4.53 ± 7.50 0.009SEQ-DYSPEPSIA Baseline 43.27 ± 11.15 44.37 ± 13.21 0.840 At 4 weeks 29.33 ± 7.15 37.29 ± 12.61 < 0.001 Difference −13.93 ± 11.44 −7.08 ± 10.94 0.001PAGI-SYM postprandial fullness/early satiety Baseline 1.64 ± 1.32 2.04 ± 1.33 0.177 At 4 weeks 0.76 ± 0.89 1.41 ± 1.37 0.016 Difference −0.89 ± 1.33 −0.62 ± 1.35 0.320NDI-K dyspepsia Baseline 30.42 ± 19.79 34.22 ± 20.80 0.322 At 4 weeks 12.07 ± 13.61 23.73 ± 21.03 0.002 Difference −18.36 ± 19.08 −10.49 ± 15.66 0.031NDI-K total Baseline 45.24 ± 27.04 50.55 ± 31.41 0.356 At 4 weeks 17.62 ± 20.38 36.04 ± 34.05 0.001 Difference −27.62 ± 27.23 −14.51 ± 21.89 0.017
SEQ, self-evaluation questionnaire; FD, functional dyspepsia; SEQ-DYSPEPSIA, SEQ for dyspepsia; PAGI-SYM, Patient Assessment of Gastrointestinal Symp-tom Severity Index; NDI-K, Nepean Dyspepsia Index-Korean. P-values were calculated using the independent t test or Mann-Whitney U test.

118
Kyoungwon Jung, et al
Journal of Neurogastroenterology and Motility 118
DYSPEPSIA can be used for research purposes.The reliability and reproducibility of the questionnaire was
confirmed by dividing it into typical FD symptoms, major FD symptoms, and other atypical symptoms among the symptoms of FD, with a total of 11 questions. In particular, Cronbach’s alpha was high at 0.865 when evaluating the major FD symptoms com-pared with the typical FD symptoms. The correlation coefficients with other, already validated subscales (PAGI-SYM postprandial fullness/early satiety, NDI-K dyspepsia, and NDI-K total) were very high (0.648-0.851), and the correlation coefficient was higher in SEQ-major FD than in SEQ-typical FD.
In studies assessing the treatment response of FD, various drugs such as rabeprazole, lansoprazole, mosapride, acotiamide, itopride, and rikkunshito were used, and various questionnaires such as the Leuven Postprandial Distress Scale,36 Leeds Dyspepsia Questionnaire,37 8-symptom dyspepsia questionnaire,38 Hong Kong index questionnaire,39 NDI,40 and PAGI-SYM41 were also used. Among these, in the validation study of the Leuven Postprandial Distress Scale conducted by Carbone et al,36 a comparative analysis using the PAGI-SYM and NDI questionnaires was conducted to evaluate the treatment response to itopride, which showed a significant change in the PDS type of FD. Similarly, in this study, to evaluate the treatment response using SEQ-DYSPEPSIA, the NDI and PAGI-SYM questionnaires were also evaluated. After 4 weeks of treatment, the SEQ-DYSPEPSIA questionnaire sur-vey was conducted again to evaluate the treatment response, and it was confirmed that the FD symptoms significantly improved in the treatment response group. Similar findings were found for the NDI-K dyspepsia subscale, but not for the PAGI-SYM postpran-dial fullness/early satiety subscale.
The PAGI-SYM postprandial fullness/early satiety subscale is primarily limited to symptoms of postprandial fullness and early satiety, and epigastric pain or discomfort is divided into different measures of the upper abdominal pain subscale. These epigastric pain or discomfort items showed a significant difference from the NDI-K and SEQ-DYSPEPSIA questionnaires used in this study, and it was judged that the PAGI-SYM postprandial fullness/early satiety subscale did not show statistically meaningful results in the treatment response evaluation.
The NDI-K dyspepsia subscale is similar to the SEQ-major FD subscale; however, in NDI, items that are difficult to distin-guish, such as epigastric pain, discomfort, or soreness, are divided, and similar items exist including a sense of epigastric pressure and bloating. In addition, the NDI questionnaire confirmed the level of discomfort along with frequency and intensity. However, with
respect to the level of discomfort expressed by the actual patients, many overall global evaluations are available and some components are difficult to objectively express. In consideration of these points, in the questionnaire in this study, except for the level of discomfort, epigastric pain, discomfort, and soreness symptoms were combined into 1 question, and each symptom was simply investigated on the basis of frequency and intensity. Owing to these differences, SEQ-DYSPEPSIA in this study showed more statistically meaningful differences in the treatment response evaluation than the PAGI-SYM and NDI questionnaires, and was confirmed to be useful in evaluating the treatment response.
To confirm the degree of treatment response, the ES and SRM values were checked, and when patients with a much improved condition (> 50.0%) was used as the response group, the response index was confirmed to be > 0.8 for both ES and SRM, and the ratio was “large.”22 In the case of the non-response group, the responsiveness index was 0.4-0.5 (ES), which was categorized as “small to medium.” When the PAGI-SYM postprandial fullness/early satiety, NDI-K dyspepsia, and NDI-K total scores were also considered, a better responsiveness index (0.67-1.02) was obtained in the responder than in the non-responder group, and all items of the typical FD and major FD symptoms in SEQ-DYSPEPSIA well reflected the subjective symptoms and treatment response of patients with FD.
This study had some limitations. First, it is possible that the response to symptom evaluation was low because many patients with severe FD were not included. In addition, because this study did not use placebo as a double-blind comparator for the evaluation of treatment response, the response index could be compared only between the treatment response group and the non-response group. As the placebo effect is high in pharmaceutical research in patients with dyspepsia, further studies on symptom changes that include a placebo group can be helpful.
In conclusion, this study suggests that SEQ-DYSPEPSIA, including typical FD and seven major FD symptoms, has a high degree of reliability and validity, compared with the PAGI-SYM postprandial fullness/early satiety subscale, NDI-K dyspepsia subscale, and NDI-K total score. Moreover, this verified questionnaire was also found to be useful and accurate for treatment response evaluation.
Supplementary Materials
Note: To access the supplementary tables and figure mentioned in this article, visit the online version of Journal of Neurogastroen-

119119
A Self-evaluation Questionnaire for FD
Vol. 28, No. 1 January, 2022 (111-120)
terology and Motility at http://www.jnmjournal.org/, and at https://doi.org/10.5056/jnm20250.
Financial support: This research was supported by a grant of the Korea Society of Neurogastroenterology and Motility (2017).
Conflicts of interest: None.
Author contributions: Kyoungwon Jung, Hye-Kyung Jung, and Joong Goo Kwon contributed to patient recruitment, data analysis and interpretation, and writing and editing of the paper as the first author and corresponding authors; Chung Hyun Tae, Ki Bae Bang, Jong Kyu Park, Ju Yup Lee, and Cheol Min Shin con-tributed to patient recruitment and data collection; Jung Hwan Oh, Kyung Ho Song, Oh Young Lee, and Myung-Gyu Choi super-vised the study; and all authors were involved in the critical revision of the paper.
References 1. Stanghellini V, Chan FK, Hasler WL, et al. Gastroduodenal disorders.
Gastroenterology 2016;150:1380-1392.2. Talley NJ, Ford AC. Functional dyspepsia. N Engl J Med
2015;373:1853-1863.3. Talley NJ. Functional dyspepsia: new insights into pathogenesis and
therapy. Korean J Intern Med 2016;31:444-456.4. Ford AC, Marwaha A, Sood R, Moayyedi P. Global prevalence of,
and risk factors for, uninvestigated dyspepsia: a meta-analysis. Gut 2015;64:1049-1057.
5. Min BH, Huh KC, Jung HK, et al. Prevalence of uninvestigated dys-pepsia and gastroesophageal reflux disease in Korea: a population-based study using the rome III criteria. Dig Dis Sci 2014;59:2721-2729.
6. Kim JS, Lee KJ, Kim JH, Hahm KB, Cho SW. Functional gastroin-testinal disorders in patients referred to specialist gastroenterologists in a tertiary hospital. Kor J Neurogastroenterol Motil 2004;10:111-117.
7. Miwa H, Ghoshal UC, Gonlachanvit S, et al. Asian consensus report on functional dyspepsia. J Neurogastroenterol Motil 2012;18:150-168.
8. Choi MG, Jung HK. Health related quality of life in functional gastroin-testinal disorders in asia. J Neurogastroenterol Motil 2011;17:245-251.
9. Oh JH, Kwon JG, Jung HK, et al. Clinical practice guidelines for func-tional dyspepsia in Korea. J Neurogastroenterol Motil 2020;26:29-50.
10. Moayyedi P, Lacy BE, Andrews CN, Enns RA, Howden CW, Vakil N. ACG and CAG clinical guideline: management of dyspepsia. Am J Gastroenterol 2017;112:988-1013.
11. Ang D, Talley NJ, Simren M, Janssen P, Boeckxstaens G, Tack J. Re-view article: endpoints used in functional dyspepsia drug therapy trials. Aliment Pharmacol Ther 2011;33:634-649.
12. Lee HH, Jung HK, Choi MG. [Guideline recommendation for end-points used in clinical trials for functional dyspepsia.] Korean J Gastroen-terol 2018;72:170-178.[Korean]
13. Ghoshal UC, Gwee KA, Chen M, et al. Development, translation and validation of enhanced asian rome III questionnaires for diagnosis of functional bowel diseases in major asian languages: a rome foundation-asian Neurogastroenterology and Motility association working team report. J Neurogastroenterol Motil 2015;21:83-92.
14. Michielutte R, Bahnson J, Dignan MB, Schroeder EM. The use of illustrations and narrative text style to improve readability of a health edu-cation brochure. J Cancer Educ 1992;7:251-260.
15. Rentz A, Kahrilas P, Stanghellini V, et al. Development and psychometric evaluation of the patient assessment of upper gastrointestinal symptom severity index (PAGI-SYM) in patients with upper gastrointestinal disor-ders. Qual Life Res 2004;13:1737-1749.
16. Cho YK, Choi MG, Kim SH, et al. [The effect of mosapride on quality of life in functional dyspepsia.] Korean J Gastroenterol 2004;43:160-167.[Korean]
17. Talley NJ, Haque M, Wyeth JW, et al. Development of a new dyspepsia impact scale: the Nepean dyspepsia index. Aliment Pharmacol Ther 1999;13:225-235.
18. Park JM, Choi MG, Oh JH, et al. Cross-cultural validation of irritable bowel syndrome quality of life in Korea. Dig Dis Sci 2006;51:1478-1484.
19. Revicki DA, Rentz AM, Tack J, et al. Responsiveness and interpretation of a symptom severity index specific to upper gastrointestinal disorders. Clin Gastroenterol Hepatol 2004;2:769-777.
20. Chow SC, Wang H, Shao J. Comparing means. In: Chow SC, eds. Sample size calculations in clinical research. Newyork: Taylor & Francis Group 2008.
21. Shieh G. Choosing the best index for the average score intraclass correla-tion coefficient. Behav Res Methods 2016;48:994-1003.
22. Terwee CB, Dekker FW, Wiersinga WM, Prummel MF, Bossuyt PM. On assessing responsiveness of health-related quality of life instruments: guidelines for instrument evaluation. Qual Life Res 2003;12:349-362.
23. Talley NJ, Phillips SF, Melton J 3rd, Wiltgen C, Zinsmeister AR. A patient questionnaire to identify bowel disease. Ann Intern Med 1989;111:671-674.
24. Cella D, Yount S, Rothrock N, et al. The patient-reported outcomes mea-surement information system (PROMIS): progress of an NIH roadmap cooperative group during its first two years. Med Care 2007;45(5 suppl q):S3-S11.
25. Spiegel BM, Hays RD, Bolus R, et al. Development of the NIH patient-reported outcomes measurement information system (PROMIS) gastrointestinal symptom scales. Am J Gastroenterol 2014;109:1804-1814.
26. Talley NJ, Verlinden M, Jones M. Validity of a new quality of life scale for functional dyspepsia: a United States multicenter trial of the Nepean dyspepsia index. Am J Gastroenterol 1999;94:2390-2397.
27. Leidy NK, Farup C, Rentz AM, Ganoczy D, Koch KL. Patient-based assessment in dyspepsia: development and validation of dyspepsia symptom severity index (DSSI). Dig Dis Sci 2000;45:1172-1179.
28. Adam B, Liebregts T, Saadat-Gilani K, Vinson B, Holtmann G. Valida-tion of the gastrointestinal symptom score for the assessment of symp-toms in patients with functional dyspepsia. Aliment Pharmacol Ther 2005;22:357-363.

120
Kyoungwon Jung, et al
Journal of Neurogastroenterology and Motility 120
29. Lee EH, Hahm KB, Lee JH, et al. Development and validation of a functional dyspepsia-related quality of life (FD-QOL) scale in South Korea. J Gastroenterol Hepatol 2006;21(1 pt 2):268-274.
30. Jung HK, Choi MG, Baek MK, Wu JCY. Development and psycho-metric assessment of a self-evaluation questionnaire for gastroesophageal reflux disease. J Neurogastroenterol Motil 2018;24:584-592.
31. Gong EJ, Jung KW, Min YW, et al. Validation of the Korean version of the gastroesophageal reflux disease questionnaire for the diagnosis of gas-troesophageal reflux disease. J Neurogastroenterol Motil 2019;25:91-99.
32. Piessevaux H, De Winter B, Louis E, et al. Dyspeptic symptoms in the general population: a factor and cluster analysis of symptom groupings. Neurogastroenterol Motil 2009;21:378-388.
33. Fischler B, Tack J, De Gucht V, et al. Heterogeneity of symptom pattern, psychosocial factors, and pathophysiological mechanisms in severe func-tional dyspepsia. Gastroenterology 2003;124:903-910.
34. Karamanolis G, Caenepeel P, Arts J, Tack J. Association of the predomi-nant symptom with clinical characteristics and pathophysiological mecha-nisms in functional dyspepsia. Gastroenterology 2006;130:296-303.
35. Fujiwara Y, Arakawa T. Overlap in patients with dyspepsia/functional dyspepsia. J Neurogastroenterol Motil 2014;20:447-457.
36. Carbone F, Vandenberghe A, Holvoet L, et al. Validation of the Leuven
postprandial distress scale, a questionnaire for symptom assessment in the functional dyspepsia/postprandial distress syndrome. Aliment Pharmacol Ther 2016;44:989-1001.
37. Talley NJ, Tack J, Ptak T, Gupta R, Giguère M. Itopride in functional dyspepsia: results of two phase III multicentre, randomised, double-blind, placebo-controlled trials. Gut 2008;57:740-746.
38. Iwakiri R, Tominaga K, Furuta K, et al. Randomised clinical trial: ra-beprazole improves symptoms in patients with functional dyspepsia in Japan. Aliment Pharmacol Ther 2013;38:729-740.
39. Hsu YC, Liou JM, Yang TH, et al. Proton pump inhibitor versus proki-netic therapy in patients with functional dyspepsia: is therapeutic response predicted by rome III subgroups? J Gastroenterol 2011;46:183-190.
40. Tack J, Pokrotnieks J, Urbonas G, et al. Long-term safety and efficacy of acotiamide in functional dyspepsia (postprandial distress syndrome)-results from the European phase 3 open-label safety trial. Neurogastroen-terol Motil 2018;30:e13284.
41. Masuy I, Carbone F, Holvoet L, Vandenberghe A, Vanuytsel T, Tack J. The effect of rikkunshito on gastrointestinal symptoms and gastric mo-tor function: the first study in a Belgian functional dyspepsia population. Neurogastroenterol Motil 2020;32:e13739.

121 2022 The Korean Society of Neurogastroenterology and Motility
J Neurogastroenterol Motil, Vol. 28 No. 1 January, 2022www.jnmjournal.org
JNMJ Neurogastroenterol Motil, Vol. 28 No. 1 January, 2022pISSN: 2093-0879 eISSN: 2093-0887https://doi.org/10.5056/jnm20277
Original ArticleJournal of Neurogastroenterology and Motility
Role of the Mean Nocturnal Baseline Impedance in Identifying Evidence Against Pathologic Reflux in Patients With Refractory Gastroesophageal Reflux Disease Symptoms as Classified by the Lyon Consensus
Yanhong Wu, Zihao Guo, Chuan Zhang,* and Yutao Zhan*
Department of Gastroenterology, Beijing Tong Ren Hospital, Capital Medical University, Beijing, China
Background/AimsMean nocturnal baseline impedance (MNBI) is a new reflux metric for mucosal integrity. It remains unclear whether MNBI can help identify evidence against pathological reflux by the Lyon Consensus in patients with refractory gastroesophageal reflux disease (GERD) symptoms.
MethodsThree hundred and forty-nine patients with refractory GERD symptoms enrolled in this study were subjected to high-resolution manometry, 24-hour multichannel intraluminal impedance-pH (MII-pH) monitoring, and endoscopy. Conventional indexes (ie, reflux events and acid exposure time) and the novel index (MNBI) of MII-pH monitoring were extracted and analyzed. The value of MNBI in diagnosing patients with evidence against pathologic reflux was evaluated by receiver-operating-characteristic analysis.
ResultsThere were 102 (29.2%) patients with evidence against pathologic reflux, 149 (42.7%) with inconclusive or borderline evidence and 98 (28.1%) with conclusive evidence for pathologic reflux. The MNBI was significantly higher while the proportion of pathological MNBI was significantly lower in subjects with evidence against pathologic reflux than in patients with inconclusive or borderline evidence and in patients with conclusive evidence for pathologic reflux (2444.3 [1977.9-2997.4] vs 1992.8 [1615.5-2253.6] and vs 1772.3 [758.6-2161.3], both P < 0.001; 42.2% vs 79.7% and vs 80.0%, both P < 0.05). When identifying evidence against pathologic reflux in patients with refractory GERD symptoms, the MNBI yielded an area under the curve of 0.749 (P < 0.001) at a cut-off value of 1941.8 Ω.
ConclusionsThe MNBI has a good diagnostic value for evidence against pathological reflux in patients with refractory GERD symptoms. For its simplicity and reproducibility, we believe that MNBI should be referred to in reports of impedance-pH tracings by physicians.(J Neurogastroenterol Motil 2022;28:121-130)
Key WordsElectric impedance; Esophageal pH monitoring; Gastroesophageal reflux

122
Yanhong Wu, et al
Journal of Neurogastroenterology and Motility 122
Introduction
Gastroesophageal reflux disease (GERD) is becoming increas-ingly prevalent worldwide. Refractory GERD, which is considered to be the persistence of typical reflux symptoms that are unrespon-sive to proton pump inhibitor (PPI) treatment, is challenging in clinical practice.1 However, not all patients with refractory reflux symptoms are GERD patients.2 Given current concerns about the safety3 and financial burden4 of PPI treatment, it is becoming in-creasingly important to identify these non-GERD patients to avoid unnecessary PPI therapy and determine proper subsequent treat-ments.
The reflux evidence for refractory GERD symptoms is clas-sified as evidence against pathological reflux, inconclusive or borderline evidence for pathological reflux, or conclusive evidence for pathological reflux as per the Lyon Consensus.5 The evidence against pathological reflux is drawn from normal endoscopic mani-festations as well as the percentage of acid exposure time (AET) < 4% and reflux episodes < 40 in multichannel intraluminal imped-ance and pH (MII-pH) monitoring off PPIs. However, normal endoscopic manifestations exist widely in patients with heartburn,6,7 and traditional reflux parameters of MII-pH monitoring also have many shortcomings. For example, although AET could reflect the cross-sectional acid burden, it is subject to day-to-day variation.8 In addition, identification of reflux events has to be confirmed manu-ally, and sometimes there are discrepancies on what constitutes a reflux event even among experts.9-11
Mean nocturnal baseline impedance (MNBI) based on MII-pH monitoring is a novel metric that can be obtained manually in a few minutes using a simple formula and has a very high inter-observer reproducibility rate.6,12 It is considered to be a potential objective reflux metric and a marker that reflects longitudinal reflux burden, mucosal integrity,13 and the severity of esophageal mucosal
damage, which has proved to be useful in both separating reflux-unrelated (functional heartburn [FH]) patients from reflux-related (GERD14-17 and reflux hypersensitivity [RH]18,19) patients and as an independent potential predictor of symptoms responding to anti-reflux therapy.20-23 Low MNBI is adjunctive evidence for incon-clusive or borderline evidence for pathologic reflux (AET 4-6%, reflux episodes 40-80, or Los Angeles [LA] A or B), and can in-crease the impression of conclusive evidence for pathologic reflux.5 However, to the best of our knowledge, the contribution of MNBI towards evidence against pathological reflux for patients with refrac-tory GERD symptoms as classified by the Lyon Consensus has not been explored. In this study, we aim to evaluate the role of MNBI in identifying evidence against pathological reflux in patients with refractory GERD symptoms.
Materials and Methods
SubjectsAdult patients (age > 18 years) who underwent endoscopy,
high-resolution manometry (HRM), and MII-pH monitoring over a 4-year period (between October 2015 and January 2020) were enrolled consecutively in this retrospective study. The inclusion criteria consisted of patients with reflux symptoms (regurgitation and heartburn) refractory to PPIs. Patients with reflux symptoms improvement < 50% in the context of the use of a standard dose of PPI treatment for at least 8 weeks were referred to have refrac-tory GERD symptoms.1 The exclusion criteria were inadequate or incomplete studies and studies on patients who were pregnant or had poor treatment adherence, tumors, presence of eosinophilic or infectious esophagitis, prior thoracic, esophageal, gastric or foregut surgery, or major motor disorders (jackhammer esophagus, absent contractility, distal esophageal spasm, esophagogastric junction out-flow obstruction, and achalasia), as determined by HRM based on
Received: December 14, 2020 Revised: March 24, 2021 Accepted: April 15, 2021 This is an Open Access article distributed under the terms of the Creative Commons Attribution Non-Commercial License (http://creativecommons. org/licenses/by-nc/4.0) which permits unrestricted non-commercial use, distribution, and reproduction in any medium, provided the original work is properly cited.
*Correspondence: Chuan Zhang and Yutao Zhan are equally responsible for this study. Chuan Zhang, MD Department of Gastroenterology, Beijing Tong Ren Hospital, Capital Medical University, No.1, Dongjiaominxiang, Dongcheng District, Beijing 100730, PR China Tel: +86-010-58268473, Fax: +86-010-58268473, E-mail: [email protected] Yutao Zhan, MD Department of Gastroenterology, Beijing Tong Ren Hospital, Capital Medical University, No.1, Dongjiaominxiang, Dongcheng District, Beijing 100730, PR China Tel: +86-010-58268474, Fax: +86-010-58268474, E-mail: [email protected]
Yanhong Wu and Zihao Guo contributed equally to this study.

123123
Diagnostic Value of the MNBI for Non-GERD
Vol. 28, No. 1 January, 2022 (121-130)
the Chicago classification version 3.0 criteria.24
The Beijing Tong Ren Hospital Medical Ethics Committee approved the study (trxhzcfa01). All patients had signed informed consent (trxhzczp01).
Endoscopic Examination Upper gastrointestinal (GI) endoscopic examination was
performed for all patients using a GIF-260 upper GI endoscope (Olympus, Hamburg, Germany). Esophagitis was graded from LA A to LA D.7
Esophageal High-resolution Manometry HRM was performed after an overnight fast using a 22-chan-
nel transnasal multi-lumen polyvinyl catheter (diameter, 3.6 mm; Medical Measurement Systems Inc [MMS], Williston, VT, USA), which was perfused continuously with distilled water at a rate of 0.15 mL/min by a low-compliance pneumohydraulic capil-lary infusion system (Solar GI; MMS). Esophageal motility was assessed by using 5 mL of ambient temperature water at 30-second intervals for at least 10 water swallows as previously described.25
Multichannel Intraluminal Impedance and pH Monitoring
Immediately after HRM, the pH-impedance catheter (8 impedance rings and 1 pH ring, Ref. No 261A; Given Imaging, Los Angeles, CA, USA) was placed in the nose such that the distal esophageal pH sensor was 5 cm proximal to the lower esophageal sphincter (LES) as located by HRM, and 6 impedance sensors were positioned 3, 5, 7, 9, 15, and 17 cm above the LES. MII-pH was monitored after PPI withdrawal for at least 2 weeks and recorded continuously for at least 23 hours. The number of reflux events, the AET, the symptom index (SI)/symptom association probability (SAP), and the MNBI were recorded.
Physiological reflux episodes and physiological AET were defined as < 40 and < 4%, respectively. Pathological reflux events and pathological AET were defined as > 80 and > 6%, respec-tively. When reflux episodes were between 40 and 80, or the AET was at 4-6%, they were considered to be inconclusive or borderline evidence.5 The SAP and SI were defined as positive when ≥ 95% and ≥ 50% respectively and positive reflux-symptom association was defined as the SI ≥ 50% and/or SAP ≥ 95%.26-28
The MNBI was evaluated when the patient was in a supine po-sition at night. The 3 stable 10-minute time periods (around 1 AM, 2 AM, and 3 AM) avoiding reflux episodes, swallows, artifacts, or pH-drops were manually selected by 2 observers (Y.W. and Z.G.)
in a blinded fashion as previously described.6,12 If disagreement oc-curred, a senior expert (C.Z.) would participate in making the final decision. The baseline impedance of each impedance channel was the mean baseline impedance of the 3 stable 10-minute periods.6,12 The MNBI values were considered to be the average baseline impedance of 3, 5, 7, and 9 cm above the LES.22 MNBI less than 2292 Ω was defined as abnormal.6 Data from pH-impedance monitoring were extracted from a special digital datalogger-MMS (Ohmega, Medical Measurement Systems, Enschede, the Nether-lands).
Group DefinitionPatients were classified into 3 groups as per the Lyon Consen-
sus.5 Group 1 or the evidence against pathological reflux (evidence against GERD) group included patients with normal endoscopic findings as well as AET < 4% and reflux episodes < 40 on pH-impedance monitoring off PPIs. Of these, patients with normal en-doscopic findings, normal AET, negative reflux-symptom associa-tion in the setting of esophageal symptoms were considered as FH, and patients with normal endoscopic findings, normal AET, but positive reflux-symptom association were classified as RH by the Rome IV.29 Group 2 or the inconclusive or borderline evidence for pathologic reflux (inconclusive or borderline evidence of GERD) group included patients with LA grades A or B esophagitis, AET 4-6%, or reflux episodes 40-80. In addition, adjunctive evidence (ie, reflux-symptom association, reflux episodes > 80, and low MNBI) could add confidence for a GERD diagnosis. Group 3 or the conclusive evidence for pathologic reflux (conclusive evidence of GERD) group included patients with LA grades C or D, long-segment Barrett’s mucosa, or peptic strictures based on endoscopy or AET > 6% on ambulatory pH or pH impedance monitoring, any one of which was adequate for diagnosing GERD.
Statistical MethodsContinuous data were expressed as mean ± standard deviation
and compared using the one-way ANOVA among 3 groups if the data followed a normal distribution. If the value of P was less than 0.05, post hoc comparisons were made using the Bonferroni correc-tion. Otherwise, they were reported as median (interquartile range) and compared using the Kruskal-Wallis H test among the 3 groups. The pairwise comparison was performed if P < 0.05. Qualitative data were reported as numbers (percentages), and categorical data were compared by the chi-squared test using the Bonferroni cor-rection. The applicability of MNBI in diagnosing evidence against GERD in patients with refractory GERD symptoms was evaluated

124
Yanhong Wu, et al
Journal of Neurogastroenterology and Motility 124
Patients with refractory GERD symptoms
(N = 349)
AET > 6%, or LA C or D esophagitis,
or long-segment Barrett s mucosa,
or peptic strictures
Normal endoscopy, AET < 4%,
and reflux episodes < 40
LA A or B esophagitis, or AET 4-6%,
or reflux episodes 40-80
Conclusive evidence for
pathologic reflux (n = 98)
Evidence against
pathologic reflux (n = 102)
Borderline or inconclusive evidence
for pathologic reflux (n = 149)
Negative
SAP and SI
FH
(n = 87)
Positive
SAP or SI
RH
(n = 15)
Figure 1. Flow chart of 349 patients with refractory gastroesophageal reflux disease (GERD) symptoms as classi-fied by the Lyon Consensus and Rome IV. AET, acid exposure time; LA, Los Angeles; SAP, symptom association probability; SI, symptom index; FH, functional heartburn; RH, reflux hyper-sensitivity.
Table 1. Baseline Characteristics, Reflux Parameters of Multichannel Intraluminal Impedance and pH Monitoring and Endoscopy Results for Evidence Against Gastroesophageal Reflux Disease, Inconclusive or Borderline Evidence of Gastroesophageal Reflux Disease, and Conclusive Evidence of Gastroesophageal Reflux Disease in 349 Patients With Refractory Gastroesophageal Reflux Disease Symptoms
ItemsEvidence against GERD
(Group 1, n = 102)Inconclusive evidence of GERD
(Group 2, n = 149)Conclusive evidence of GERD
(Group 3, n = 98)P-value
Age (yr) 55.9 ± 13.0 58.7 ± 12.9 60.4 ± 11.4 0.036 P = 0.034 for Group 1 vs Group 3; P = 0.237 for Group 1 vs Group 2; P = 0.910 for Group 3 vs Group 2
Male gender 27 (26.5%) 58 (38.9%) 45 (45.9%) 0.015 P < 0.05 for Group 1 vs Group 3; P > 0.05 for Group 1 vs Group 2, Group 3 vs Group 2
BMI (kg/m2) 23.5 ± 3.7 23.8 ± 3.7 24.4 ± 3.2 0.159 P = 0.193 for Group 1 vs Group 3; P > 0.999 for Group 1 vs Group 2; P = 0.447 for Group 3 vs Group 2
AET (%) 0.6 (0.1-1.3) 2.5 (0.9-4.3) 8.6 (6.4-15.8) < 0.001 P < 0.001 for all pairwise comparisons
Reflux events (n) 24.5 (17.0-36.0) 42.0 (24.0-73.0) 37.5 (19.0-70.5) < 0.001 P = 0.001 for Group 1 vs Group 3; P < 0.001 for Group 1 vs Group 2; P > 0.999 for Group 3 vs Group 2
Acidic refluxes (n) 1.0 (0.0-3.0) 5.0 (1.0-8.8) 19.0 (7.0-33.3) < 0.001 P < 0.001 for all pairwise comparisons
Weakly acidic refluxes (n) 15.0 (9.0-23.3) 22.5 (12.0-41.8) 12.0 (5.0-24.0) 0.001 P = 0.987 for Group 1 vs Group 3; P = 0.002 for Group 1 vs Group 2; P = 0.065 for Group 3 vs Group 2
Weakly alkaline refluxes (n) 4.0 (1.0-11.3) 8.0 (3.0-17.0) 2.0 (0.0-9.0) < 0.001 P = 0.142 for Group 1 vs Group 3; P = 0.015 for Group 1 vs Group 2; P < 0.001 for Group 3 vs Group 2
MNBI (Ω) 2444.3 (1977.9-2997.4) 1992.8 (1615.5-2253.6) 1772.3 (758.6-2161.3) < 0.001 P < 0.001 for Group 1 vs Group 3, Group 1 vs Group 2; P = 0.025 for Group 3 vs Group 2
Pathological MNBI 43 (42.2%) 118 (79.7%) 78 (80.0%) < 0.001 P < 0.05 for Group 1 vs Group 3, Group 1 vs Group 2; P > 0.05 for Group 3 vs Group 2
Endoscopy results < 0.001Normal 102 (100.0%) 40 (26.8%) 20 (20.4%)LA-A or B 0 109 (73.2%) 45 (45.9%)LA-C or D or BE 0 0 33 (33.7%)
GERD, gastroesophageal reflux disease; BMI, body mass index; AET, acid exposure time; MNBI, mean nocturnal baseline impedance; LA, Los Angeles; BE, Barrett’s esophagus.Values are presented as mean± SD, median (interquartile range), or n (%).Differences were significant when P < 0.05.

125125
Diagnostic Value of the MNBI for Non-GERD
Vol. 28, No. 1 January, 2022 (121-130)
by receiver operating characteristic analysis with calculation of the area under the curve (AUC) and the cutoff value. The diagnostic agreement was evaluated by using the interclass correlation coef-ficient. P < 0.05 was required for statistical significance. SPSS 22.0 software (IBM, Armonk, NY, USA) was used to perform statisti-cal analysis.
Results
Demographic, Clinical Characteristics and Distribution of Evidence Against Gastroesophageal Reflux Disease, Inconclusive or Borderline Evidence of Gastroesophageal Reflux Disease, and Conclusive Evidence of Gastroesophageal Reflux Disease in Patients With Refractory Gastroesophageal Reflux Disease Symptoms
A total of 376 patients with refractory GERD symptoms were screened. Twenty-seven patients affected by reflux episodes, swal-lowing, or artifact were excluded from the study. Finally, a total of 349 patients with refractory GERD symptoms were enrolled in the study. Their mean age was 58.3 ± 12.6 years and their mean body mass index was 23.9 ± 3.6 kg/m2. Among them, 219 (62.8%) were females.
There were 102 (29.2%) patients with evidence against GERD, 149 (42.7%) with inconclusive or borderline evidence of GERD, and 98 (28.1%) with conclusive evidence of GERD. Among those with evidence against GERD, 87 (85.3%) patients were FH, and 15 (14.7%) patients were RH (Fig. 1). In addi-tion, as shown in Table 1, the mean age and the proportion of male
patients were significantly lower in patients with evidence against GERD than in patients with conclusive evidence of GERD (55.9 ± 13.0 vs 60.4 ± 11.4, P = 0.034; 26.5% vs 45.9%, P < 0.05; respectively). There were no significant differences in body mass index among these 3 groups.
Comparison of Acid Exposure Time, Reflux Events by Multichannel Intraluminal Impedance and pH Monitoring and Endoscopic Findings Among These 3 Groups
As shown in Table 1, patients with evidence against GERD showed significantly lower AET than patients with inconclusive or borderline evidence of GERD and patients with conclusive evi-dence of GERD (0.6 [0.1-1.3] vs 2.5 [0.9-4.3] and vs 8.6 [6.4-15.8], respectively, both P < 0.001).
Patients with evidence against GERD had significantly lower total number of reflux events than patients with inconclusive or bor-derline evidence and patients with conclusive evidence of GERD (24.5 [17.0-36.0] vs 42.0 [24.0-73.0] and vs 37.5 [19.0-70.5]; P < 0.001 and P = 0.001, respectively). Although the total number of reflux events was also lower in patients with conclusive evidence of GERD than in patients with inconclusive or borderline evidence of GERD, the difference was not statistically significant (P > 0.999). When further classifying refluxes into acidic refluxes, weakly acidic refluxes, and weakly alkaline refluxes, the number of acidic reflux events was significantly higher in patients with conclusive evidence of GERD than in patients with inconclusive or borderline evidence of GERD and in patients with evidence against GERD (19.0 [7.0-33.3] vs 5.0 [1.0-8.8] and 1.0 [0.0-3.0], respectively; both P < 0.001). It was also significantly higher in
Against Inconclusive Conclusive
3000
2000
1000
MN
BI
()
GERD
0
A B
*
Against Inconclusive Conclusive
100
80
60
40
20
Pa
tho
log
ica
lM
NB
I(%
)
GERD
NS
0
*
GERD GERD GERD GERD
****
***
Figure 2. The values of mean nocturnal baseline impedance (MNBI) (A) and the proportion of pathological MNBI (B) in patients with evidence against gastroesophageal reflux disease (GERD), in patients with inconclusive or borderline evidence of GERD, and in patients with conclusive evidence of GERD. NS, not significant. *P < 0.05, ***P < 0.001.
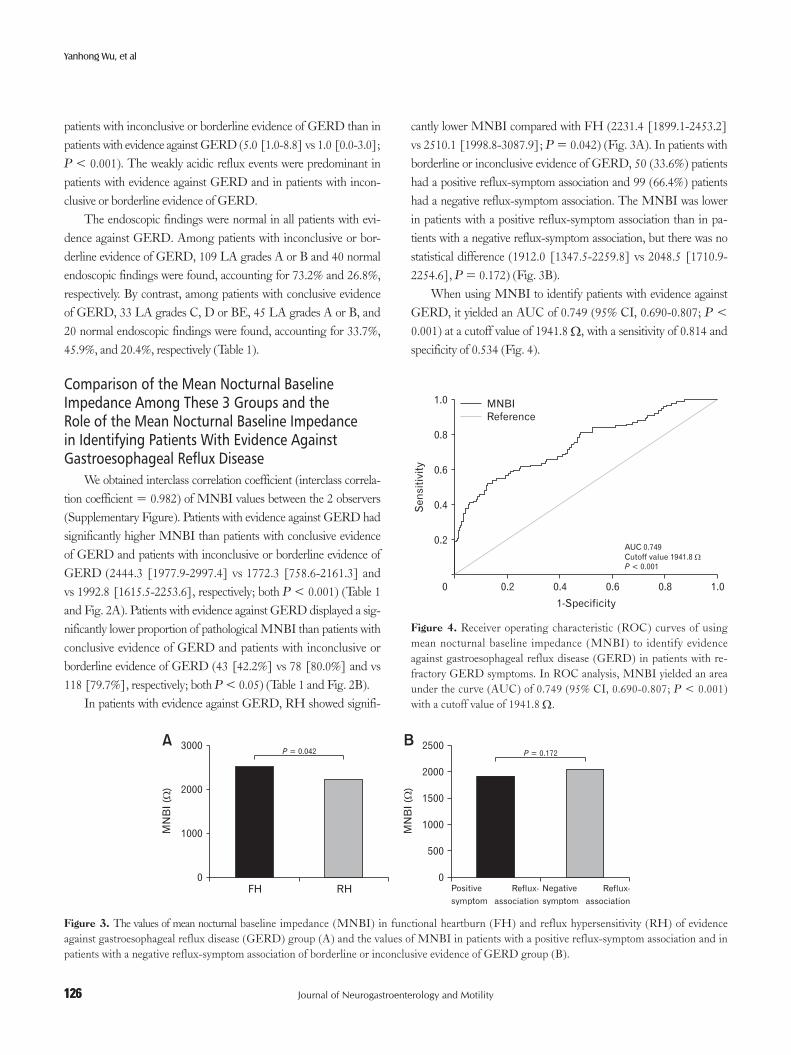
126
Yanhong Wu, et al
Journal of Neurogastroenterology and Motility 126
patients with inconclusive or borderline evidence of GERD than in patients with evidence against GERD (5.0 [1.0-8.8] vs 1.0 [0.0-3.0]; P < 0.001). The weakly acidic reflux events were predominant in patients with evidence against GERD and in patients with incon-clusive or borderline evidence of GERD.
The endoscopic findings were normal in all patients with evi-dence against GERD. Among patients with inconclusive or bor-derline evidence of GERD, 109 LA grades A or B and 40 normal endoscopic findings were found, accounting for 73.2% and 26.8%, respectively. By contrast, among patients with conclusive evidence of GERD, 33 LA grades C, D or BE, 45 LA grades A or B, and 20 normal endoscopic findings were found, accounting for 33.7%, 45.9%, and 20.4%, respectively (Table 1).
Comparison of the Mean Nocturnal Baseline Impedance Among These 3 Groups and the Role of the Mean Nocturnal Baseline Impedance in Identifying Patients With Evidence Against Gastroesophageal Reflux Disease
We obtained interclass correlation coefficient (interclass correla-tion coefficient = 0.982) of MNBI values between the 2 observers (Supplementary Figure). Patients with evidence against GERD had significantly higher MNBI than patients with conclusive evidence of GERD and patients with inconclusive or borderline evidence of GERD (2444.3 [1977.9-2997.4] vs 1772.3 [758.6-2161.3] and vs 1992.8 [1615.5-2253.6], respectively; both P < 0.001) (Table 1 and Fig. 2A). Patients with evidence against GERD displayed a sig-nificantly lower proportion of pathological MNBI than patients with conclusive evidence of GERD and patients with inconclusive or borderline evidence of GERD (43 [42.2%] vs 78 [80.0%] and vs 118 [79.7%], respectively; both P < 0.05) (Table 1 and Fig. 2B).
In patients with evidence against GERD, RH showed signifi-
cantly lower MNBI compared with FH (2231.4 [1899.1-2453.2] vs 2510.1 [1998.8-3087.9]; P = 0.042) (Fig. 3A). In patients with borderline or inconclusive evidence of GERD, 50 (33.6%) patients had a positive reflux-symptom association and 99 (66.4%) patients had a negative reflux-symptom association. The MNBI was lower in patients with a positive reflux-symptom association than in pa-tients with a negative reflux-symptom association, but there was no statistical difference (1912.0 [1347.5-2259.8] vs 2048.5 [1710.9-2254.6], P = 0.172) (Fig. 3B).
When using MNBI to identify patients with evidence against GERD, it yielded an AUC of 0.749 (95% CI, 0.690-0.807; P < 0.001) at a cutoff value of 1941.8 Ω, with a sensitivity of 0.814 and specificity of 0.534 (Fig. 4).
FH RH
3000
2000
1000MN
BI
()
0
A B
Positive
symptom
P = 0.172
Reflux-
association
2500
2000
1500
1000
500
MN
BI
()
0
P = 0.042
Negative
symptom
Reflux-
association
Figure 3. The values of mean nocturnal baseline impedance (MNBI) in functional heartburn (FH) and reflux hypersensitivity (RH) of evidence against gastroesophageal reflux disease (GERD) group (A) and the values of MNBI in patients with a positive reflux-symptom association and in patients with a negative reflux-symptom association of borderline or inconclusive evidence of GERD group (B).
0.2 0.4 0.6 0.8
1.0
0.8
0.6
0.4
0.2
1.0
Se
nsit
ivit
y
1-Specificity
AUC 0.749
Cutoff value 1941.8
< 0.001
P
0
MNBI
Reference
Figure 4. Receiver operating characteristic (ROC) curves of using mean nocturnal baseline impedance (MNBI) to identify evidence against gastroesophageal reflux disease (GERD) in patients with re-fractory GERD symptoms. In ROC analysis, MNBI yielded an area under the curve (AUC) of 0.749 (95% CI, 0.690-0.807; P < 0.001) with a cutoff value of 1941.8 Ω.

127127
Diagnostic Value of the MNBI for Non-GERD
Vol. 28, No. 1 January, 2022 (121-130)
Tabl
e 2.
The
Val
ue o
f the
Mea
n N
octu
rnal
Bas
elin
e Im
peda
nce
in S
epar
atin
g Fu
nctio
nal H
eart
burn
Fro
m G
astr
oeso
phag
eal R
eflu
x D
iseas
e or
Ref
lux
Hyp
erse
nsiti
vity
of P
revi
ous S
tudi
es
Aut
hor
(yea
r)O
ff or
On
PP
I M
II-p
HSu
bjec
t gro
ups
Gro
up c
lass
ifica
tion
crite
ria
Ass
essm
ent o
f th
e M
NB
IM
NB
I ( Ω
)R
ole
of M
NB
I
Fraz
zoni
et a
l14
(201
7)
On
PP
I th
erap
yR
RE
(n =
39)
HR
E (n
= 4
1)N
ER
D (n
= 6
8)
FH
(n =
41)
Pers
isten
ce o
f muc
osal
bre
aks
Reg
ress
ions
of m
ucos
al b
reak
sN
egat
ive
endo
scop
y fin
ding
s, bu
t AE
T
> 3
.2%
, and
/or n
umbe
r of r
eflu
x ev
ents
< 4
8, a
nd/o
r pos
itive
SA
P/S
Ia
Neg
ativ
e en
dosc
opy
findi
ngs,
AE
T
< 3
.2%
, num
ber o
f ref
lux
even
ts <
48
, and
neg
ativ
e SA
P/S
Ib
3 cm
abo
ve th
e L
ES
1145
(662
-187
9)17
41 (1
273-
2951
)23
74 (1
755-
2835
)
3488
(296
5-40
69)
Dist
ingu
ishin
g P
PI-
refr
acto
ry N
ER
D
from
FH
(with
an
AU
C 0
.677
[0
.605
-0.7
48])
Tenc
a et
al15
(201
7)O
ff P
PI
at le
ast
10-1
4 da
ysN
ER
D (n
= 2
5)
FH
(n =
25)
Nor
mal
end
osco
py fi
ndin
gs a
nd
AE
T >
4.2
%A
ET
< 4
.2%
, nor
mal
tota
l num
ber o
f re
flux
even
ts, a
nd n
egat
ive
SAP
/SIb
5 cm
abo
ve th
e L
ES
971
± 1
80
3889
± 7
28
Dist
ingu
ishin
g G
ER
D fr
om F
H
(with
an
AU
C 0
.960
and
a c
utof
f va
lue
of 2
934
Ω)
Y osh
imin
e et
al16
(201
9)N
ot m
entio
ned
EN
RD
(n =
59)
FH
(n =
32)
AE
T >
4.2
% o
r pos
itive
SI/
SAPa
AE
T <
4.2
% a
nd n
egat
ive
SI/S
AP
b5
cm a
bove
the
LE
S22
29.9
± 1
042.
930
61.2
± 7
62.1
Dist
ingu
ishin
g F
H fr
om P
PI-
refr
acto
ry
NE
RD
(with
an A
UC
0.7
3 [0
.63-
0.84
] an
d a
cuto
ff va
lue
of 2
874.
1 Ω
)Su
n et
al17
(201
9)O
ff P
PI
for
a w
eek
EE
(n =
24)
NE
RD
(n =
46)
RH
(n =
52)
FH
(n =
78)
With
muc
osal
bre
aks a
t end
osco
pyN
orm
al e
ndos
copy
, AE
T >
6%
an
d/or
reflu
x ep
isode
s > 8
0N
orm
al e
ndos
copy
and
AE
T ,
but p
ositi
ve S
AP
/SIa
With
out o
bjec
tive
evid
ence
of r
eflu
x,
nega
tive
SAP
/SIb
The
ave
rage
of
dist
al 4
ch
anne
ls
1243
.4 (9
08.5
-168
6.6)
1506
.5 (1
104.
4-20
85.6
)
2451
.2 (1
911.
6-27
64.5
)
2477
.3 (2
010.
6-29
86.2
)
Dist
ingu
ishin
g F
H fr
om E
E, N
ER
D,
and
RH
(with
an
AU
C 0
.721
and
a
cuto
ff va
lue
of 1
890.
6 Ω
)
Fraz
zoni
et a
l18
(201
6)
Off
PP
I fo
r 2
wee
ksN
ER
D (n
= 1
25)
RH
(n =
108
)
FH
(n =
70)
PP
I-re
spon
sive
hear
tbur
n, e
ndos
copy
-ne
gativ
e, a
nd a
bnor
mal
AE
TN
egat
ive
uppe
r end
osco
py, n
orm
al
AE
T, a
nd p
ositi
ve S
AP
/SIa
End
osco
py-n
egat
ive
hear
burn
un
affe
cted
by
PP
I th
erap
y, no
rmal
A
ET ,
and
neg
ativ
e SA
P/S
Ib
3 cm
abo
ve th
e L
ES
1378
± 6
99
2274
± 7
74
3443
± 8
73
Dist
ingu
ishin
g R
H fr
om F
H
(with
an
AU
C 0
.864
[0.
809-
0.91
9])
Gao
et a
l19 (2
017)
Off
PP
I fo
r a
wee
kF
H (n
= 1
47)
RH
(n =
91)
HC
(n =
36)
Nor
mal
end
osco
py, n
orm
al A
ET,
ne
gativ
e SA
P/S
Ib
Nor
mal
end
osco
py a
nd A
ET,
bu
t pos
itive
SA
P/S
Ia
3 cm
abo
ve th
e L
ES
2972
.0 ±
775
.6
2485
.3 ±
939
.2
3290
.1 ±
613
.5
Dist
ingu
ishin
g F
H fr
om R
H (w
ith a
n A
UC
0.6
43 [
95%
CI,
0.5
70-0
.716
])
a SAP
≥ 9
5% a
nd/o
r SI
≥ 5
0%.
b SAP
< 9
5% a
nd S
I <
50%
.P
PI,
pro
ton
pum
p in
hibi
tor;
MII
-pH
, mul
ticha
nnel
intr
alum
inal
impe
danc
e an
d pH
; M
NB
I, m
ean
noct
urna
l bas
elin
e im
peda
nce;
RR
E, r
efra
ctor
y re
flux
esop
hagi
tis;
HR
E, h
eale
d re
flux
esop
hagi
tis;
NE
RD
, non
-ero
sive
reflu
x di
seas
e; F
H, f
unct
iona
l hea
rtbu
rn; A
ET,
aci
d ex
posu
re ti
me;
SA
P, sy
mpt
om a
ssoc
iatio
n pr
obab
ility
; SI,
sym
ptom
inde
x; L
ES,
low
er e
soph
agea
l sph
inct
er; G
ER
D, g
astr
oeso
phag
eal
reflu
x di
seas
e; A
UC
, are
a un
der t
he c
urve
; EN
RD
, End
osco
pic-
nega
tive
reflu
x di
seas
e; E
E, e
rosiv
e es
opha
gitis
; RH
, ref
lux
hype
rsen
sitiv
ity; H
C, h
ealth
y co
ntro
ls.

128
Yanhong Wu, et al
Journal of Neurogastroenterology and Motility 128
Discussion
In this retrospective study, we evaluated the value of the MNBI in differentiating evidence against pathological reflux from incon-clusive or borderline evidence of GERD and conclusive evidence of GERD in patients with refractory GERD symptoms. The present study showed that up to 29.2% of patients with refractory GERD symptoms showed evidence against GERD. The MNBI value was significantly higher while the proportion of pathological MNBI was significantly lower in patients with evidence against GERD than in patients with inconclusive or borderline evidence of GERD and in patients with conclusive evidence of GERD. When using MNBI to identify patients with evidence against GERD, it yielded an AUC of 0.749 (P < 0.001) at a cutoff value of 1941.8 Ω with a sensitivity of 0.814 and specificity of 0.534. Accordingly, we concluded that MNBI may help identify evidence against GERD in patients with refractory GERD symptoms. In addition to conventional reflux parameters, MNBI should be also reported by physicians in MII-pH monitoring.
In the present study, females accounted for the majority of the large cohort, consistent with a previous study showing that being fe-male was a predictive factor of PPI-refractory GERD symptoms.30 In addition, patients with conclusive evidence of GERD were sig-nificantly older than patients with evidence against GERD, which may attribute to the mechanical impairment of the esophagogastric junction of elder patients, resulting in pathological reflux and its ac-companying syndromes.31 Also, patients with conclusive evidence of GERD had a significantly higher proportion of males than patients with evidence against GERD, which was in line with a previous study showing that the proportion of males was higher in patients with GERD than in patients with FH.14 Evidence against patho-logical reflux was found in 29.2% of the total enrolled patients in this study. Among these patients, FH (85.3%) was more predomi-nant than RH (14.7%). Therefore, not all patients with refractory GERD symptoms were true GERD patients, which could be the reason that many patients failed to respond to PPI treatments.2
Endoscopy and conventional impedance-pH monitoring are imperfect in identifying patients with evidence against pathologic reflux. Up to 70% of patients with heartburn showed negative find-ings in upper endoscopic examinations in clinics.6,7 Accordingly, the proportion of patients with evidence against GERD may be overes-timated. Therefore, impedance-pH monitoring is often performed and traditional reflux parameters (ie, AET and reflux events) and SAP are routinely evaluated. AET, which can be reliably extracted
from automatic analysis, is the most reproducible among all tra-ditional reflux parameters,32,33 but it is subjected to day-to-day variation.8 Moreover, previous studies have shown that automatic software analysis of reflux episodes could lead to false positive reflux episodes and overestimation of reflux episodes, which may influ-ence the results of the symptom association analysis.34,35 Therefore, a time-consuming manual review of the tracing is needed although there may be inter-observer and intra-observer variability on what constitutes a reflux event.9-11
Low esophageal baseline impedance reflects the severity of acid reflux and epithelial structural abnormalities of the esophageal mucosa.36 Subsequently, the standardized measurement of baseline impedance, namely MNBI, was proposed.6,12 As a novel metric, MNBI is based on MII-pH monitoring. Thus, it requires no ad-ditional testing. In addition, it can be obtained manually in a few minutes and has a very high inter-observer repeatability rate6 and resistance to circadian variations.37
It is crucial to differentiate non-GERD (ie, FH) patients from GERD (ie, erosive esophagitis and non-erosive reflux disease) pa-tients for prescribing different treatments. The MNBI has proven to be useful in distinguishing FH from GERD14-17 and FH from RH,18,19 with a high diagnostic accuracy off- as well as on-PPI therapy (Table 2), and in predicting symptomatic responses to anti-reflux therapy.20-23 However, no study has explored its role in iden-tifying evidence against GERD in patients with refractory GERD symptoms as classified by the Lyon Consensus, which includes evi-dence against GERD group, conclusive evidence of GERD group, and inconclusive or borderline evidence of GERD group.5
Given that, we evaluated the value of MNBI used for differ-entiating evidence against GERD from inconclusive or borderline evidence of GERD and conclusive evidence of GERD in patients with refractory GERD symptoms. We found that MNBI was sig-nificantly higher while the proportion of pathological MNBI was significantly lower in patients with evidence against GERD than in other patients. Because patients with evidence against GERD often have a physiological reflux burden, the degree of their mucosal in-tegrity damage is lighter than that of other patients, thus leading to a higher MNBI.
Unexpectedly, the proportion of patients with pathological MNBI (42.2%) was very high in patients with evidence against GERD. According to the Lyon Consensus, pathological MNBI was defined as less than 2292 Ω.5 Frazzoni et al6 performed a pro-spective study with 289 GERD patients and 50 healthy controls in Italy, which showed that 2292 Ω may be used as the cutoff imped-ance values to distinguish GERD patients from healthy controls.

129129
Diagnostic Value of the MNBI for Non-GERD
Vol. 28, No. 1 January, 2022 (121-130)
However, normative MNBI cutoff values may vary between regions and ethnicities. A single-center study from China showed that 1764 Ω could be used as the cutoff impedance values to dis-criminate patients from healthy controls, which included 92 patients with typical reflux symptoms and 10 healthy controls.38 Given this, we speculate that abnormal MNBI cutoff values may be lower than 2292 Ω in Asian populations, which may explain the high propor-tion of pathological MNBI (< 2292 Ω) in patients with evidence against GERD in our study. Studies involving a larger sample size of healthy controls will be needed in Asia.
In line with previous studies,18,19 our study also showed the MNBI was significantly lower in RH than in FH, which may be associated with impairment of mucosal integrity resulting from dilated intercellular spaces in RH.18 Patients with positive reflux-symptom association had similar MNBI to those with negative reflux-symptom association in borderline or inconclusive evidence of GERD group. That may be because the group of borderline or inconclusive evidence of GERD is very heterogeneous,5 so there may be no direct relationship between the reflux-symptom associa-tion and MNBI in borderline or inconclusive evidence of GERD group.
In addition, we found that MNBI showed a good diagnostic value to differentiate patients with evidence against GERD from other patients, with an AUC of 0.749 (P < 0.001) at a cutoff value of 1941.8 Ω. The value of MNBI in identifying evidence against pathological reflux in patients with refractory GERD symptoms as classified by the Lyon Consensus was first found in our study, which was crucial for prescribing different treatments.
Our study has certain strengths. Firstly, it includes a large cohort of patients with refractory GERD symptoms. Secondly, it is the first study to evaluate the value of MNBI in differentiating evidence against GERD from conclusive evidence of GERD and inconclusive or borderline evidence of GERD in patients with re-fractory GERD symptoms as classified by the Lyon Consensus.
However, some limitations are associated with this study. Pri-marily, it was a retrospective analysis of a single-center institution. Given this, there may be potential selection bias although patients were enrolled consecutively between 2015 and 2020. Secondarily, the study did not include healthy volunteers. The study aimed to investigate the role of MNBI in identifying evidence against patho-logical reflux in patients with refractory GERD symptoms, which was crucial for prescribing different treatments. Consequently, pa-tients with refractory GERD symptoms were enrolled in the study without including healthy controls. Healthy controls may be good subjects if the study aimed to evaluate the role of MNBI in differ-
entiating GERD patients from healthy controls.Overall, we found that MNBI has a good diagnostic value
for evidence against pathological reflux in patients with refractory GERD symptoms. For its simplicity and reproducibility, we believe that MNBI should be referred to in reports of MII-pH tracings by physicians.
Supplementary Material
Note: To access the supplementary figure mentioned in this article, visit the online version of Journal of Neurogastroenterol-ogy and Motility at http://www.jnmjournal.org/, and at https://doi.org/10.5056/jnm20277.
Financial support: This study was supported by the Digestive Medical Coordinated Development Center of Beijing Hospitals Authority (Grant No. XXT09).
Conflicts of interest: None.
Author contributions: Yanhong Wu and Zihao Guo performed the data collection, analyzed and interpreted the data, and drafted the manuscript, and both are to be considered as first authors; and Chuan Zhang and Yutao Zhan were responsible for designing, edit-ing, and revising the draft.
References
1. Fock KM, Talley N, Goh KL, et al. Asia-Pacific consensus on the man-agement of gastro-oesophageal reflux disease: an update focusing on refractory reflux disease and Barrett’s oesophagus. Gut 2016;65:1402-1415.
2. Herregods TV, Troelstra M, Weijenborg PW, Bredenoord AJ, Smout AJ. Patients with refractory reflux symptoms often do not have GERD. Neurogastroenterol Motil 2015;27:1267-1273.
3. Savarino V, Dulbecco P, Savarino E. Are proton pump inhibitors really so dangerous? Dig Liver Dis 2016;48:851-859.
4. Shaheen NJ, Hansen RA, Morgan DR, et al. The burden of gastrointes-tinal and liver diseases, 2006. Am J Gastroenterol 2006;101:2128-2138.
5. Gyawali CP, Kahrilas PJ, Savarino E, et al. Modern diagnosis of GERD: the Lyon Consensus. Gut 2018;67:1351-1362.
6. Frazzoni M, Savarino E, de Bortoli N, et al. Analyses of the post-reflux swallow-induced peristaltic wave index and nocturnal baseline impedance parameters increase the diagnostic yield of impedance-pH monitoring of patients with reflux disease. Clin Gastroenterol Hepatol 2016;14:40-46.
7. Lundell LR, Dent J, Bennett JR, et al. Endoscopic assessment of oe-sophagitis: clinical and functional correlates and further validation of the Los Angeles classification. Gut 1999;45:172-180.
8. Penagini R, Sweis R, Mauro A, Domingues G, Vales A, Sifrim D.

130
Yanhong Wu, et al
Journal of Neurogastroenterology and Motility 130
Inconsistency in the diagnosis of functional heartburn: usefulness of pro-longed wireless pH monitoring in patients with proton pump inhibitor refractory gastroesophageal reflux disease. J Neurogastroenterol Motil 2015; 21:265-272.
9. Ciecierega T, Gordon BL, Aronova A, Crawford CV, Zarnegar R. More art than science: impedance analysis prone to interpretation error. J Gas-trointest Surg 2015;19:987-992.
10. Loots CM, van Wijk MP, Blondeau K, et al. Interobserver and intrao-bserver variability in pH-impedance analysis between 10 experts and automated analysis. J Pediatr 2012;160:441-446, e441.
11. Ravi K, DeVault KR, Murray JA, Bouras EP, Francis DL. Inter-observ-er agreement for multichannel intraluminal impedance-pH testing. Dis Esophagus 2010;23:540-544.
12. Martinucci I, de Bortoli N, Savarino E, et al. Esophageal baseline imped-ance levels in patients with pathophysiological characteristics of functional heartburn. Neurogastroenterol Motil 2014;26:546-555.
13. Ribolsi M, Gyawali CP, Savarino E, et al. Correlation between reflux burden, peristaltic function, and mucosal integrity in GERD patients. Neurogastroenterol Motil 2020;32:e13752.
14. Frazzoni M, de Bortoli N, Frazzoni L, et al. The added diagnostic value of postreflux swallow-induced peristaltic wave index and nocturnal baseline impedance in refractory reflux disease studied with on-therapy impedance-pH monitoring. Neurogastroenterol Motil 2017;29:e12947.
15. Tenca A, de Bortoli N, Mauro A, et al. Esophageal chemical clearance and baseline impedance values in patients with chronic autoimmune atrophic gastritis and gastro-esophageal reflux disease. Dig Liver Dis 2017;49:978-983.
16. Yoshimine T, Funaki Y, Kawamura Y, et al. Convenient method of mea-suring baseline impedance for distinguishing patients with functional heartburn from those with proton pump inhibitor-resistant endoscopic negative reflux disease. Digestion 2019;99:157-165.
17. Sun YM, Gao Y, Gao F. Role of esophageal mean nocturnal baseline impedance and post-reflux swallow-induced peristaltic wave index in dis-criminating Chinese patients with heartburn. J Neurogastroenterol Motil 2019;25:515-520.
18. Frazzoni M, de Bortoli N, Frazzoni L, et al. Impairment of chemical clearance and mucosal integrity distinguishes hypersensitive esophagus from functional heartburn. J Gastroenterol 2016;52:444-451.
19. Gao F, Gao Y, Chen X, Qian J, Zhang J. Comparison of esophageal function tests in Chinese patients with functional heartburn and reflux hypersensitivity. Gastroenterol Res Pract 2017;2017:3596148.
20. Frazzoni L, Frazzoni M, de Bortoli N, et al. Postreflux swallow-induced peristaltic wave index and nocturnal baseline impedance can link PPI-responsive heartburn to reflux better than acid exposure time. Neurogas-troenterol Motil 2017;29:e13116.
21. Ribolsi M, Guarino MPL, Tullio A, Cicala M. Post-reflux swallow-induced peristaltic wave index and mean nocturnal baseline impedance predict PPI response in GERD patients with extra esophageal symp-toms. Dig Liver Dis 2020;52:173-177.
22. Patel A, Wang D, Sainani N, Sayuk GS, Gyawali CP. Distal mean noc-turnal baseline impedance on pH-impedance monitoring predicts reflux burden and symptomatic outcome in gastro-oesophageal reflux disease.
Aliment Pharmacol Ther 2016;44:890-898.23. Rengarajan A, Savarino E, Della Coletta M, Ghisa M, Patel A, Gyawali
CP. Mean nocturnal baseline impedance correlates with symptom out-come when acid exposure time is inconclusive on esophageal reflux moni-toring. Clin Gastroenterol Hepatol 2020;18:589-595.
24. Kahrilas PJ, Bredenoord AJ, Fox M, et al. The Chicago Classifica-tion of esophageal motility disorders, v3.0. Neurogastroenterol Motil 2015;27:160-174.
25. Savarino E, de Bortoli N, Bellini M, et al. Practice guidelines on the use of esophageal manometry-A GISMAD-SIGE-AIGO medical position statement. Dig Liver Dis 2016;48:1124-1135.
26. Bredenoord AJ, Weustern BL, Sout AJ. Symptom association analysis in ambulatory gastro-oesophageal reflux monitoring. Gut 2005;54:1810-1817.
27. Kushnir VM, Sathyamurthy A, Drapekin J, Gaddam S, Sayuk GS, Gyawali CP. Assessment of concordance of symptom reflux associa-tion tests in ambulatory pH monitoring. Aliment Pharmacol Ther 2012;35:1080-1087.
28. Patel A, Sayuk GS, Gyawali CP. Parameters on esophageal pH-imped-ance monitoring that predict outcomes of patients with gastroesophageal reflux disease. Clin Gastroenterol Hepatol 2015;13:884-891.
29. Aziz Q, Fass R, Gyawali CP, Miwa H, Pandolfino JE, Zerbib F. Func-tional esophageal disorers. Gastroenterology 2016;150:1368-1379.
30. Delshad SD, Almario CV, Chey WD, Spiegel BMR. Prevalence of gastroesophageal reflux disease and proton pump inhibitor-refractory symptoms. Gastroenterology 2020;158:1250-1261, e2.
31. Boeckxstaens G, El-Serag HB, Smout AJ, Kahrilas PJ. Symptomatic reflux disease: the present, the past and the future. Gut 2014;63:1185-1193.
32. Wiener GJ, Morgan TM, Copper JB, et al. Ambulatory 24-hour esoph-ageal pH monitoring. Reproducibility and variability of pH parameters. Dig Dis Sci 1988;33:1127-1133.
33. Horton AJ, Clayton SB. Optimization of impedance-measured reflux events in GORD utilizing acid exposure time. BMC Gastroenterol 2020;20:179.
34. Roman S, Bruley des Varannes S, Pouderoux P, et al. Ambulatory 24-h oesophageal impedance-pH recordings: reliability of automatic analysis for gastro-oesophageal reflux assessment. Neurogastroenterol Motil 2006;18:978-986.
35. Hemmink GJ, Bredenoord AJ, Aanen MC, Weusten BL, Timmer R, Smout AJ. Computer analysis of 24-h esophageal impedance signals. Scand J Gastroenterol 2011;46:271-276.
36. Zhong C, Duan L, Wang K, et al. Esophageal intraluminal baseline im-pedance is associated with severity of acid reflux and epithelial structural abnormalities in patients with gastroesophageal reflux disease. J Gastroen-terol 2013;48:601-610.
37. Kessing BF, Bredenoord AJ, Weijenborg PW, Hemmink GJ, Loots CM, Smout AJ. Esophageal acid exposure decreases intraluminal base-line impedance levels. Am J Gastroenterol 2011;106:2093-2097.
38. Xie C, Sifrim D, Li Y, Chen M, Xiao Y. Esophageal baseline impedance reflects mucosal integrity and predicts symptomatic outcome with proton pump inhibitor treatment. J Neurogastroenterol Motil 2018;24:43-50.

131 2022 The Korean Society of Neurogastroenterology and Motility
J Neurogastroenterol Motil, Vol. 28 No. 1 January, 2022www.jnmjournal.org
JNMJ Neurogastroenterol Motil, Vol. 28 No. 1 January, 2022pISSN: 2093-0879 eISSN: 2093-0887https://doi.org/10.5056/jnm21020
Original ArticleJournal of Neurogastroenterology and Motility
Received: January 24, 2021 Revised: February 28, 2021 Accepted: March 21, 2021 This is an Open Access article distributed under the terms of the Creative Commons Attribution Non-Commercial License (http://creativecommons. org/licenses/by-nc/4.0) which permits unrestricted non-commercial use, distribution, and reproduction in any medium, provided the original work is properly cited.
*Correspondence: Ji Hyun Kim, MD, PhD Department of Internal Medicine, Good Gangan Hospital, 493 Suyeong-ro, Suyeong-Gu, Busan 48265, Korea Tel: +82-51-610-9017, Fax: +82-51-955-2774, E-mail: [email protected]
Morphologic Changes in Esophageal Body Movement During Bolus Transport After Peroral Endoscopic Myotomy in Type III Achalasia
Alex Ju Sung Kim,1 Sungmoon Ong,2 Ji Hyun Kim,2,3* Hong Sub Lee,2 Jun Sik Yoon,2 and Dae Young Hur1
1Department of Anatomy and Tumor Immunology, Inje University College of Medicine, Busan, Korea; 2Department of Internal Medicine, Busan Paik Hospital, Inje University College of Medicine, Busan, Korea; and 3Department of Internal Medicine, Good Gangan Hospital, Busan, Korea
Background/AimsThe effect of peroral endoscopic myotomy (POEM) on esophageal body movement in achalasia is poorly understood. This study aims to evaluate morphological changes in esophageal body movement after POEM in type III achalasia by analyzing intraluminal ultrasound (US) images in comparison to type I and II achalasia.
MethodsIntraluminal US images and impedance values of the distal esophagus from 47 achalasia patients who underwent POEM or pneumatic dilatation (PD) (30 patients in the POEM group and 17 patients in the PD group) with pre- and post-procedural high-resolution impedance manometry and intraluminal US examinations were analyzed. The muscle thickness (MT), muscle cross-sectional area, lumen cross-sectional area (LCSA), contractility and distensibility indices, swallow-to-distension interval, and distension duration during each bolus transport were analyzed.
ResultsThe MT increased and LCSA decreased significantly (P < 0.001), but the contractility index was not improved after POEM or PD in type I achalasia. Baseline MT increased and LCSA decreased significantly after POEM and PD in type II achalasia (P < 0.001). In contrast, MT and the swallow-to-distension interval decreased and the distension LCSA/duration and contractility index increased after POEM in type III achalasia (P < 0.001). In contrast to type I and II achalasia, in type III achalasia, these effects were unique to the POEM group.
ConclusionsPOEM decreased the esophageal LCSA by decreasing intrabolus pressure without improving contractility in type I and II achalasia. In contrast, POEM increased esophageal body distension and contractility and improved the inhibitory process during bolus transport in type III achalasia.(J Neurogastroenterol Motil 2022;28:131-144)
Key WordsBody movement; Esophageal achalasia; Myotomy; Ultrasonography

132
Alex Ju Sung Kim, et al
Journal of Neurogastroenterology and Motility 132
Introduction
Due to the development of diagnostic modalities for esophageal motility disorders, achalasia can now be subclassified into 3 subtypes according to the pattern of esophageal body pressurization.1 Recent histologic reports also support the conceptual model explaining dif-ferent morphologic phenotypes of achalasia, ie, that the pathophysi-ology of type I and II achalasia is basically loss of inhibitory neurons but that of type III achalasia is distinguished by imbalance between postganglionic inhibitory and excitatory neurons.2,3 In fact, type III achalasia was reported to be associated with poor treatment response to pneumatic dilatation (PD) and Heller myotomy,4-6 and this may be due to inhibitory function disorders involving the distal esopha-geal body as well as the lower esophageal sphincter (LES).
Peroral endoscopic myotomy (POEM), which has advantages over PD, exact myotomy of the LES in a tailored manner under direct visualization, and long distal esophageal myotomy was in-troduced as an effective alternative treatment option for achalasia. Most recent comparative clinical studies have also reported superior long-term outcomes of POEM over PD.7,8 Additionally, POEM has been reported to be especially effective for type III achalasia and cases of failure or recurrence after PD or Heller myotomy.9,10
Based on previous studies, we can hypothesize that in addition to decreasing LES pressure, POEM can also modify esophageal body movement in achalasia, and the effect may be distinguishable in type III achalasia compared to type I and II achalasia. The an-swer to this hypothesis will provide useful information for deciding the treatment strategy for achalasia, such as the length of myotomy, as well as for providing essential evidence for applying POEM in spastic esophageal motility disorders other than type III achalasia, such as jackhammer esophagus and distal esophageal spasm, in which LES relaxation during primary peristalsis is intact and the main pathophysiology is confined to the esophageal body.11 Howev-er, studies on changes in esophageal body movement after POEM are limited12 and based on timed barium esophagography, which provides indirect information about esophageal bolus transit.13 The recently introduced functional imaging probe was reported to provide clinically useful information about esophageal distensibility after POEM, but it has limitations in providing primary peristalsis data.14
Although it is labor intensive, intraluminal ultrasound (US) examination has strong advantages in terms of providing detailed information on cross-sectional esophageal body movement and inhibitory function during primary peristalsis by directly measuring
changes in esophageal body muscle thickness and muscle/lumen cross-sectional area (CSA).15,16
Therefore, we performed this study to evaluate the morpholog-ic changes in cross-sectional movement in the esophageal body after POEM in type III achalasia in comparison to type I and II acha-lasia and to those after PD by analyzing intraluminal US images temporally correlated with high-resolution impedance manometry (HRIM) data.
Materials and Methods
Patients and Healthy ControlsThe medical records of consecutive achalasia patients aged 18
to 80 who underwent POEM or PD at a tertiary referral center from March 2014 to December 2019 were retrospectively re-viewed.
The inclusion criteria were as follows: (1) confirmed primary achalasia based on HRIM according to the Chicago classification, version 3.0;1 (2) intraluminal US performed with a 20-MHz mini-probe catheter simultaneously with HRIM; (3) POEM or PD performed as the initial therapeutic modality within 3 months of the initial diagnosis; and (4) follow-up HRIM and intraluminal US performed simultaneously within 3-6 months after the procedure.
The exclusion criteria were as follows: (1) clinical outcome data not available at least 1 year after POEM or PD; (2) treatment fail-ure, which was defined as no improvement or relapse of symptoms, with an increase in the Eckart score to 4 or higher within a month.; and (3) US images that were too poor for parameter analysis.
To validate the intraluminal US and impedance parameters, 8 healthy controls were also included in the study.
Simultaneous High-resolution Impedance Manometry and Intraluminal Ultrasound Image Recording
All studies were conducted using a solid-state HRIM catheter equipped with 36 pressure sensors and 18 impedance channels (MSC-3890-Z, Given Imaging, Los Angeles, CA, USA). Sub-jects were positioned in the 20° low Fowler’s position, and data were acquired during swallows of 10 mL of 0.5 N saline spaced at 30-second intervals. Swallows were repeated at least 10 times. Dedi-cated software (ManoView, Given Imaging, CA, USA) was used to visualize the plots and calculate the metrics. Achalasia was classi-fied into 3 subtypes according to the Chicago classification, version 3.0.

133133
Esophageal Movement After POEM in Type III Achalasia
Vol. 28, No. 1 January, 2022 (131-144)
Intraluminal US examination was performed simultaneously with HRIM examination using a 20-MHz miniprobe catheter (UM3D-DP20-25R, Olympus, Tokyo, Japan), which was in-terfaced with an EU-ME2 system (Olympus), and simultaneous esophageal pressures, US images and intraluminal impedance signals were acquired. The HRIM and US catheters were intro-duced separately through each nostril, and the US transducer was positioned to acquire images at the distal esophagus, 5 cm proximal to the LES.
Simultaneous HRIM and intraluminal US examinations were performed initially and repeated between 3 and 6 months after POEM or PD.
Data Extraction and AnalysisUS images of 3 to 5 analyzable swallows from each examina-
tion were captured from the DVD files with Adobe Premier CS 3.0 (Adobe Systems, Mountain View, CA, USA) and then converted to BMP tomographic B-mode images at 30 frames per second. The B-mode US images were converted into 16 equispaced M-mode images (every 22.5° apart).17
To evaluate the cross-sectional contractility and distensibility of the esophageal body during bolus transit, muscle thickness (MT), muscle CSA (MCSA), and lumen CSA (LCSA) were calculated using B-mode US images. The contractility index (defined as [dis-tension LCSA - contraction LCSA]/distension LCSA) and disten-sibility index (defined as distension LCSA/baseline LCSA) of each bolus transport cycle were also analyzed.
To evaluate deglutitive inhibitory function as well as distensi-bility, the swallow-to-distension interval (which was defined as the time between swallowing and the onset of esophageal distension) and distension duration (which was defined as the time between the onset of esophageal distension and closure of the esophageal lumen) were analyzed using M-mode US images in type III achalasia.
The B-mode US images of each swallow used to analyze the baseline/contraction/distension MT, MCSA, and LCSA were selected using M-mode US images. Image analysis was performed using Sigma Scan Pro 5 (Jandel Scientific, San Rafael, CA, USA).
Baseline MT/MCSA/LCSA values were calculated from B-mode images captured 0.5-1 seconds before swallowing. Distension MT/MCSA/LCSA values were obtained from the B-mode im-ages captured at peak luminal distension during bolus transit. Con-traction MT/MCSA/LCSA values were obtained from B-mode images showing the point at which the muscle layer became thickest with accompanying lumen occlusion/decrease during bolus transit.
The average distance of the 4 points, including the thinnest and
the thickest points, parallel to the US beam between the outer longi-tudinal muscle edge and inner margin of the inner circular muscle represents the MT. The MCSA was measured by subtracting the CSA from the inner rings of the esophageal muscle from the total esophageal CSA.
The LCSA was obtained by marking the interface between the liquid and the inner margin of the esophageal mucosa. The imped-ance value of the distal esophagus 5 cm proximal to the LES and M-mode US images were temporally correlated to obtain baseline and nadir impedance values. To doublecheck the change in the LCSA before and after the procedure, the baseline luminal imped-ance value, defined as the average value 1 second before the onset of swallowing, was calculated in all subjects. The nadir luminal imped-ance value, which corresponded to the peak distension point, was also obtained using temporally correlated impedance values and M-mode US images in type III achalasia patients and healthy controls (Fig. 1).
Along with cross-sectional image analysis, pre- and post-pro-cedural changes in esophageal peristalsis parameters, such as com-pleteness and sequentiality of bolus transport and panesophageal pressurization (PEP), and HRIM parameters, such as 4-second integrated relaxation pressure (4s-IRP) and basal LES pressure, were also analyzed.
The pattern of bolus transport and completion of bolus clear-ance was defined based on the analysis of the impedance waveform. For bolus transport to be defined as sequential, the impedance waveform was required to meet the following 2 criteria: (1) the onset of the decrease in the impedance waves progressed in the aboral direction and (2) the velocity of onset of the decrease in im-pedance wave from the mid-esophagus to the distal esophagus just above LES was less than 8 cm/second. Complete bolus clearance was defined as the return of esophageal impedance to 50% of its baseline value.18 PEP was defined as uniform pressurization of > 30 mmHg extending from the upper esophageal sphincter to the esophagogastric junction.
Peroral Endoscopic Myotomy and Pneumatic Dilatation Technique
POEM was performed under general anesthesia. The orienta-tion of the mucosal incision and subsequent submucosal tunneling and myotomy were performed in a posterior fashion. A submucosal tunnel was established 2-3 cm beyond the LES. Subsequent myot-omy in a selected inner circular muscle was performed starting 2 cm caudally from the mid-esophageal incision up to 1-2 cm beyond the LES. The length of myotomy was 7-10 cm. All procedures were

134
Alex Ju Sung Kim, et al
Journal of Neurogastroenterology and Motility 134
performed using a hook knife (Olympus) and the spray coagulation mode at 60 W on effect 2 (ERBE, Tübingen, Germany).
Pneumatic dilation was performed under fluoroscopic guidance with the use of a 20-30-mm Rigiflex dilater (Boston Scientific, Bos-ton, MA, USA). The dilater was inflated with a maximum of 15 psi for 60 seconds and repeated 2 times.
All examinations and procedures were performed by a single experienced investigator (J.H.K.).
Statistical MethodsData are reported as the mean (± standard deviation) or medi-
an (interquartile range 25-75) when appropriate. The baseline char-acteristics and US images and luminal impedance parameters of the healthy controls and patients were compared by chi-square test, independent t test and one-way ANOVA. A paired t test was em-ployed to compare US images and luminal impedance parameters (MT, MCSA, LCSA, contractility/distensibility index, swallow-to-
distension interval, distension duration, and baseline/nadir imped-ance value) before and after POEM or PD. A multivariate analysis was conducted with a binary logistic regression test. A P-value < 0.05 was considered statistically significant.
Ethical ApprovalThis study was approved by the Institutional Review Board
of Inje University Busan Paik Hospital (Approval No. 19-0106), which confirmed that the study was performed in accordance with the ethical guidelines of the Helsinki Declaration.
All authors had access to the study data and reviewed and ap-proved the final manuscript.
1400120010008006004002000
A B
Imp
ed
an
ce
()
Swallow-to-distension
interval
Distension
duration
Figure 1. Intraluminal ultrasound (US) and impedance parameters in a healthy subject. (A) The impedance value 5 cm proximal to the lower esophageal sphincter and M-mode US images temporally correlated to obtain baseline and nadir impedance values. The swallow-to-distension interval and distension duration were calculated using M-mode images. The B-mode images for analyzing US parameters were selected using M-mode images (curved arrows a, b, and c). (B) The baseline/contraction/distension muscle thickness, muscle cross-sectional area, and lumen cross-sectional area were analyzed using the corresponding B-mode US images.

135135
Esophageal Movement After POEM in Type III Achalasia
Vol. 28, No. 1 January, 2022 (131-144)
Results
Baseline Characteristics: Peroral Endoscopic Myotomy Versus Pneumatic Dilatation Group
Among 83 patients who were diagnosed with achalasia, 68 un-derwent POEM or PD as an initial therapeutic modality and had pre- and post-procedural intraluminal US performed simultane-ously with HRIM. Among them, 3 patients who underwent PD were excluded because of treatment failure, 6 patients (2 underwent POEM and 4 underwent PD) were excluded because of loss to follow-up for clinical outcomes within a year, and 12 patients were excluded because the US images were too poor to analyze. Finally, 47 patients (30 and 17 patients in the POEM and PD groups, respectively, with a mean age of 50.11 [22-76] years and mean follow-up period of 22.34 [12-38] months), fulfilled the inclusion criteria. There was no significant difference between the POEM and PD groups in terms of sex, age, BMI, follow-up period, type of achalasia, Eckardt score, pre- and post-procedural 4s-IRP, or basal LES pressure. The frequency of PEP was also not different between the POEM and PD groups (40 in type II, 3 in type I vs 32 in type II, 3 in type I).
The symptom relapse rate during the follow-up period was
higher in the PD group (2 and 4 cases in type II and III achalasia, respectively) than in the POEM group (1 case in type II and 1 case in type III achalasia, respectively) (35.26% vs 6.67%, P = 0.041) (Table 1).
The US images and impedance parameters of 40 swallow samples from healthy controls and 218 swallow samples from 47 achalasia patients (53 swallows from type I, 82 from type II, and 83 from type III) were analyzed. No significant differences were found among type I, II, and III achalasia patients in terms of age or fol-low-up duration. BMI was significantly higher in type III achalasia patients than in type I and II achalasia patients. Bolus transport was complete in 96.36% and sequential in 73.49% of analyzed swallows from type III achalasia patients (Table 2).
Post-procedural US images and the impedance parameters of 218 swallows were obtained from the 47 achalasia patients.
Baseline High-resolution Impedance Manometry, Ultrasound Images, and Impedance Parameters According to Subtype of Achalasia
The baseline, distension, and contraction MT values were largest in type III achalasia, followed by type II and type I achalasia (P < 0.001). Distension MT was smaller than baseline MT in healthy controls and type I and III achalasia patients (P < 0.001). In contrast, distension MT was larger than baseline MT in type II
Table 1. Clinical and Manometric Parameters of Patients Who Underwent Peroral Endoscopic Myotomy and Pneumatic Dilatation
Parameters POEM (n = 30) PD (n = 17) P-value
Sex (male/female) 15/15 7/10 0.564Age (yr) 51.03 ± 15.13 48.47 ± 16.36 0.591BMI (kg/m2) 21.90 ± 3.22 22.05 ± 4.08 0.892Follow-up period (mo) 20.67 ± 7.95 25.29 ± 8.96 0.074Type of achalasia 0.948 Type I 8 (26.7) 4 (23.5) Type II 10 (33.3) 7 (41.2) Type III 12 (40.0) 6 (35.3)Pre-procedural parameters Eckardt score 6.90 ± 1.67 6.82 ± 0.81 0.834 4s-IRP (mmHg) 33.68 ± 13.35 33.02 ± 14.59 0.875 Basal LES pressure (mmHg) 45.85 ± 11.46 40.16 ± 12.8 0.124 PEP (n/total swallows [%]) 43/133 (32.3) 35/85 (41.18) 0.365Post-procedural parameters 4s-IRP (mmHg) 10.53 ± 3.84 12.71 ± 4.27 0.079 Basal LES pressure (mmHg) 11.98 ± 4.19 12.58 ± 4.83 0.652 PEP (n/total swallows [%]) 3/133 (2.26) 6/85 (7.06) 0.098Symptom relapse 2 (6.67) 6 (35.26) 0.041
POEM, peroral endoscopic myotomy; PD, pneumatic dilatation; BMI, body mass index; 4s-IRP, 4-second integrated relaxation pressure; LES, lower esophageal sphincter; PEP, panesophageal pressurization.Data are expressed as n/n, mean ± SD, or n (%).

136
Alex Ju Sung Kim, et al
Journal of Neurogastroenterology and Motility 136
achalasia (P < 0.001).In regard to the MCSA, the baseline, distension, and contrac-
tion MCSA values were significantly increased in type II and type III achalasia compared to the healthy controls and type I achalasia, but no significant difference was found between type II and type III achalasia (P < 0.001).
The baseline, distension, and contraction LCSA values sig-nificantly increased in type I and type II achalasia compared to the normal control. In type III achalasia, the baseline and contraction LCSA values were not significantly different from those in the healthy controls, but the distension LCSA was significantly de-creased compared to the healthy controls (P < 0.001).
The contractility index was largest in healthy controls, followed by type III, type II, and type I achalasia. The distensibility index in type I, II and III achalasia was significantly smaller than that in the healthy controls. Both indices were significantly larger in type III
achalasia than in type I and II achalasia, and no significant differ-ence was found between type I and II achalasia.
The baseline luminal impedance level significantly decreased in type I and type II achalasia compared to the healthy controls, which is concordant with the baseline LCSA results. In contrast, the base-line luminal impedance was significantly greater in type III achala-sia than in type I and II achalasia and in the healthy controls (P < 0.001). The nadir luminal impedance level in type III achalasia also increased compared with that in the healthy controls (P < 0.001).
The swallow-to-distension interval was significantly prolonged and the distension duration was significantly decreased in type III achalasia patients compared to healthy controls (Table 2).
Type I Achalasia: Post-peroral Endoscopic Myotomy and Pneumatic Dilatation
The nadir impedance value was not identified, and bolus clear-
Table 2. Baseline Clinical, Manometric, and Intraluminal Ultrasound Parameters of Healthy Controls and Achalasia Patients
Parameters Healthy control (n = 8) Type I (n = 12) Type II (n = 17) Type III (n = 18) P-value
Sex (male/female) 3/5 6/6 8/9 8/10 0.889Age (yr) 45.13 ± 10.56 46.17 ± 17.92 47.12 ± 15.39 55.56 ± 12.83 0.195BMI (kg/m2) 23.66 ± 1.88 20.12 ± 1.82 20.56 ± 2.02 24.50 ± 4.04 < 0.001Eckardt score 6.83 ± 1.19 7.00 ± 1.54 6.78 ± 1.48 0.896Followup period (month) 24.50 ± 8.99 19.59 ± 7.66 23.50 ± 8.79 0.242IRP (mmHg) 32.15 ± 13.97 30.28 ± 13.05 37.30 ± 13.82 0.299Basal LES pressure (mmHg) 39.27 ± 11.10 38.84 ± 10.16 51.49 ± 10.97 0.002Complete bolus transport (n/total swallows [%]) 0/53 (0) 0/82 (0) 80/83 (96.39) < 0.001Sequential bolus transport (n/total swallows [%]) 0/53 (0) 0/82 (0) 61/83 (73.49) < 0.001Muscle thickness (mm) Baseline 1.75 ± 0.22 1.49 ± 0.33 2.08 ± 0.31 4.62 ± 1.21 < 0.001 Distension 1.45 ± 0.11 1.37 ± 0.21 2.42 ± 0.53 4.08 ± 1.35 < 0.001 Contraction 2.38 ± 0.41 1.51 ± 0.32 2.77 ± 0.63 4.77 ± 1.20 < 0.001Muscle CSA (mm2) Baseline 124.37 ± 14.51 113.84 ± 4.00 230.95 ± 54.99 249.28 ± 115.48 < 0.001 Distension 153.07 ± 10.10 139.63 ± 10.92 342.87 ± 70.73 369.19 ± 184.53 < 0.001 Contraction 85.52 ± 8.04 118.18 ± 17.81 226.66 ± 79.96 282.41 ± 109.63 < 0.001Lumen CSA (mm2) Baseline 75.93 ± 7.30 625.86 ± 145.97 597.31 ± 129.40 59.93 ± 1.99 < 0.001 Distension 321.00 ± 47.97 700.37 ± 106.27 683.90 ± 109.51 147.38 ± 6.12 < 0.001 Contraction 48.89 ± 5.77 620.03 ± 77.91 428.26 ± 95.52 51.05 ± 5.51 < 0.001Contractility index 0.84 ± 0.32 0.091 ± 0.063 0.43 ± 0.10 0.65 ± 0.33 < 0.001Distensibility index 4.24 ± 0.62 1.14 ± 0.11 1.16 ± 0.15 2.17 ± 0.68 < 0.001Baseline impedance (Ω) 921.75 ± 118.82 168.68 ± 33.14 211.07 ± 88.10 1747.19 ± 461.58 < 0.001Nadir impedance (Ω) 180.50 ± 47.18 573.78 ± 196.84 < 0.001Swallow-to-distension interval (sec) 1.39 ± 0.14 2.25 ± 0.35 < 0.001Distension duration (sec) 6.24 ± 0.53 3.25 ± 0.67 < 0.001
BMI, body mass index; IRP, integrated relaxation pressure; LES, lower esophageal sphincter; CSA, cross-sectional area.Data are expressed as n/n or mean ± SD.

137137
Esophageal Movement After POEM in Type III Achalasia
Vol. 28, No. 1 January, 2022 (131-144)
ance was incomplete in 100% of swallows after POEM and PD.The baseline, distension, and contraction MT values signifi-
cantly increased after POEM and PD (P < 0.001). The baseline and contraction MCSA values also significantly increased (P < 0.001), but the distension MCSA did not significantly changed after POEM and PD compared with pre-POEM and PD (P = 0.608 and P = 0.347, respectively).
In regard to the LCSA, the baseline, distension, and contrac-
tion LCSA values significantly decreased in both the POEM and PD groups (P < 0.001). The baseline impedance level also signifi-cantly increased after POEM and PD (P < 0.001) (Fig. 2A and 3A).
The distensibility index significantly increased after POEM (1.14 ± 0.10 vs 1.20 ± 0.15, P < 0.001) and PD (1.15 ± 0.13 vs 1.23 ± 0.19, P < 0.001). However, the contractility index was not significantly changed in either the POEM or PD group (P = 0.880
A
B
Pre-POEM Post-POEM
600
400
200
0Pre-POEM Post-POEM
4
3
2
1
0Pre-POEM Post-POEM
1000
750
500
250
0Pre-POEM Post-POEM
1500
500
1000
0
P < 0.001
P < 0.001
P < 0.001
P < 0.001
P = 0.140
P = 0.007
P = 0.800
P < 0.001
P = 0.277
P = 0.101
Pre-POEM Post-POEM
300
200
100
MCSA (mm )2
0Pre-POEM Post-POEM
4
3
2
1
MT (mm)
0Pre-POEM Post-POEM
1000
750
500
250
LCSA (mm )2
0Pre-POEM Post-POEM
1500
500
1000
Impedance value ( )
0
P < 0.001
P < 0.001
P < 0.001
P < 0.001
P = 0.608
P < 0.001
P < 0.001
P < 0.001
P < 0.001
P < 0.001
Baseline Nadir
Pre-POEM Post-POEM
3000
2000
1000
0
C
Pre-POEM Post-POEM
600
400
200
0Pre-POEM Post-POEM
6
4
2
0Pre-POEM Post-POEM
400
300
200
100
0
P < 0.001
P < 0.001
P < 0.001P < 0.001
P < 0.001
P < 0.001
P < 0.001
P < 0.001
P < 0.001
Baseline Distension Contraction
P < 0.001
P < 0.001
Figure 2. Changes in the muscle thickness (MT), muscle cross-sectional area (MCSA), lumen cross-sectional area (LCSA), and impedance val-ues after peroral endoscopic myotomy (POEM) in type I (A), type II (B), and type III achalasia (C). The MT, baseline/contraction MCSA, and baseline impedance significantly increased in type I achalasia. Baseline MT and baseline impedance significantly increased in type II achalasia. LCSA significantly decreased in type I and II achalasia. In contrast, the MT, MCSA, and baseline/nadir impedance significantly decreased, and the LCSA significantly increased in type III achalasia.

138
Alex Ju Sung Kim, et al
Journal of Neurogastroenterology and Motility 138
and P = 0.141, respectively) (Fig. 4A and 4B).
Type II Achalasia: Post-peroral Endoscopic Myotomy and Pneumatic Dilatation
Simultaneous bolus transport with complete bolus clearance was observed in 7 swallows of 47 analyzed swallows (14.9%) in the POEM group. Complete bolus clearance was found in 6 swallows of 35 analyzed swallows (17.1%) (4 simultaneous and 2 sequential) in the PD group. PEP was observed in 3 and 6 swallows in the
POEM and PD groups, respectively.The baseline MT values significantly increased after POEM
and PD (P < 0.001). However, there was no significant change in the distension MT in either the POEM or PD group (P = 0.277 and P = 0.230, respectively). The contraction MT values signifi-cantly increased in the PD group (P < 0.001) but unchanged in the POEM group (P = 0.101). Distension MT decreased than the baseline MT post-procedure in both the POEM and PD groups (P < 0.001 for each).
Pre-PD
300
200
100
0Pre-PD
4
3
2
1
0Pre-PD
1000
750
500
250
0Pre-PDPost-PDPost-PD Post-PD Post-PD
1500
500
1000
0
P < 0.001
P < 0.001
P < 0.001
A
P < 0.001
P = 0.374
P < 0.001
P < 0.001
P < 0.001
P < 0.001
P < 0.001
Pre-PD
600
400
200
0Pre-PD
4
3
2
1
0Pre-PD
1000
750
500
250
0Pre-PD
1500
500
1000
0
B
P < 0.001
P < 0.001
P < 0.001
P < 0.001
P = 0.371
P < 0.001
P = 0.231
P < 0.001
P = 0.230
P < 0.001
Post-PDPost-PD Post-PD Post-PD
Pre-PD
600
400
200
0Pre-PD
6
4
2
0Pre-PD
400
300
200
100
0Pre-PD
3000
2000
1000
0
C
P < 0.001
P = 0.313
P = 0.677
P = 0.706
P = 0.931
P = 0.068
P = 0.191
P = 0.053
P = 0.318
P < 0.001
P = 0.527
Post-PDPost-PD Post-PD Post-PD
MCSA (mm )2
MT (mm) LCSA (mm )2
Impedance value ( )
Baseline NadirBaseline Distension Contraction
Figure 3. Changes in the muscle thickness (MT), muscle cross-sectional area (MCSA), lumen cross-sectional area (LCSA), and impedance values after pneumatic dilatation (PD) in type I (A), type II (B), and type III achalasia (C). As with the peroral endoscopic myotomy (POEM) group, the MT, baseline/contraction MCSA, and baseline impedance significantly increased in type I achalasia, and the LCSA significantly decreased in type I and II achalasia. The baseline LCSA and impedance significantly increased and decreased, respectively, in type III achalasia. However, the MT, MCSA, distension/contraction LCSA, and nadir impedance did not change significantly in type III achalasia.

139139
Esophageal Movement After POEM in Type III Achalasia
Vol. 28, No. 1 January, 2022 (131-144)
There was no significant difference in the baseline or contrac-tion MCSA in either the POEM or PD group. However, the distension MCSA significantly decreased in both the POEM and PD groups (P = 0.007 and P < 0.001, respectively).
The baseline, distension, and contraction LCSA values signifi-cantly decreased after POEM and PD (P < 0.001). The baseline impedance level significantly increased in both groups (P < 0.001) (Fig. 2B and 3B).
The contraction index was not changed significantly in the POEM group (P = 0.231), but it significantly increased in the PD group (0.37 ± 0.12 vs 0.42 ± 0.15, P = 0.004). The distensi-bility index significantly increased in both the POEM (1.16 ± 0.15 vs 1.48 ± 0.47, P < 0.001) and PD groups (1.17 ± 0.17 vs 1.39 ± 0.41, P = 0.001) (Fig. 4C and 4D).
Type III Achalasia: Post-peroral Endoscopic Myotomy and Pneumatic Dilatation
Bolus clearance was complete in 47 of 53 analyzed swallows (88.7%), and bolus transport was sequential in 44 swallows (83.0%) in the POEM group and complete in 28 of 30 analyzed swallows (93.3%) and sequential in 23 swallows (76.7%) in the PD group.
The baseline, distension, and contraction MT/MCSA values significantly decreased after POEM (P < 0.001) but did not change significantly in the PD group.
The baseline, distension, and contraction LCSA values signifi-cantly increased, and the baseline/nadir impedance values signifi-cantly decreased after POEM (P < 0.001) (Fig. 2C). The baseline LCSA and impedance values significantly increased and decreased, respectively, in the PD group (P < 0.001), but the distension/con-
A
Pre-POEM Post-POEM
3
2
1
0
P = 0.880
P < 0.001
B
Pre-PD Post-PD
3
2
1
0
P = 0.141
P < 0.001
C
Pre-POEM Post-POEM
3
2
1
0
P = 0.231
P < 0.001
D
Pre-PD Post-PD
3
2
1
0
P = 0.004
P = 0.001
E
Pre-POEM Post-POEM
3
2
1
0
P < 0.001
P < 0.001
F
Pre-PD Post-PD
3
2
1
0
P = 0.927
P < 0.001
Contractility index Distensibility index
Figure 4. Changes in the contractility index and the distensibility index after peroral endoscopic myotomy (POEM) and pneumatic dilatation (PD) in type I (A, B), type II (C, D), and type III achalasia (E, F). The contractility index increased significantly after PD in type II achalasia and after POEM in type III achalasia. The distensibility index sig-nificantly increased after POEM in type I, II, and III achalasia and after PD in type I and II achalasia.

140
Alex Ju Sung Kim, et al
Journal of Neurogastroenterology and Motility 140
traction LCSA and nadir impedance values did not change signifi-cantly (Fig. 2C and 3C).
The contraction index significantly increased (0.65 ± 0.30 vs 0.72 ± 0.79, P < 0.001), and the distensibility index also signifi-cantly increased (2.09 ± 0.80 vs 2.47 ± 0.89, P < 0.001) in the POEM group. However, the distensibility index decreased signifi-cantly (2.46 ± 0.66 vs 1.89 ± 0.23, P < 0.001), and the contractil-ity index did not change significantly (P = 0.927) in the PD group (Fig. 4E and 4F).
The swallow-to-distension interval significantly decreased (2.25 ± 0.36 vs 1.58 ± 0.47, P < 0.001), and the distension dura-tion significantly increased (3.20 ± 0.47 vs 6.04 ± 1.39, P < 0.001) after POEM. In contrast, there was no significant difference in either parameter in the PD group (P = 0.181 and 0.241, respec-tively) (Fig. 5A, 5B, and 6).
Symptom Relapse After the Procedure in Type III Achalasia
Four patients who underwent PD (66.7%) and 1 patient who underwent POEM (8.3%) experienced a relapse in symptoms during the follow-up period. Univariate analysis revealed that the post-procedural 4s-IRP, distension MT, distension MCSA, con-traction MCSA, baseline/nadir impedance values, and swallow-to-distension interval were significantly larger in relapsed patients than in non-relapsed patients. In contrast, the distension LCSA, disten-sion duration, and contractility/distensibility index were significantly smaller in relapsed patients than in non-relapsed patients. Among those parameters, post-procedural distension LCSA (P = 0.002; OR, 0.84; 95% CI, 0.67-0.94) and distension duration (P = 0.041; OR, 0.93; 95% CI, 0.54-0.98) remained significant factors for pre-
dicting relapse in the multivariate analysis.
Discussion
In our study, type III achalasia was characterized by intact com-pleteness and sequentiality in bolus transport, a markedly increased baseline and distension MT, and an insufficient distension LCSA, which are totally different characteristics from those in type I and II achalasia. Additionally, muscle thinning during the distension pe-riod of bolus transport, which is an important feature of the normal inhibitory process of primary peristalsis,15,19 was found to be insuf-ficient in type III achalasia (Fig. 1 and 6). These findings are con-cordant with those of previous studies reporting inhibitory function abnormalities in esophageal body motility in type III achalasia.18,20
The morphological changes after POEM in type III achalasia can be summarized as decreases in the MT and MCSA and in-creases in the baseline and distension LCSA, which are distinctive changes from those in type I and II achalasia. POEM also im-proved the distensibility index despite the baseline LCSA increase. In other words, POEM physically improved esophageal body distensibility during bolus transit in type III achalasia. Addition-ally, we revealed that PD could not improve the intraluminal US parameters (except baseline LCSA) or the contractility/distensibility index in type III achalasia. These results may account for the supe-rior effect of POEM compared with PD in type III achalasia.7,8
One of the unique findings of this study was that the prolonged swallow-to-distension interval and shortened distension duration, which are indicators of the inhibitory dysfunction of esophageal body peristalsis and assumed to be a cause of premature contrac-tion,20 also improved after POEM but not after PD in type III
A
Pre-POEM Post-POEM
8
6
4
2
0
B
Pre-PD Post-PD
8
6
4
2
0
P < 0.001
P < 0.001
P = 0.241
P = 0.181
Swallow-to-distension interval Distension duration
se
c
se
c
Figure 5. Changes in swallow-to-distension interval and distension duration after peroral endoscopic myotomy (POEM) and pneumatic dilatation (PD) in type III achalasia. The swallow-to-distension interval decreased, and the distension duration increased significantly after POEM. How-ever, there was no significant change in either parameter after PD.

141141
Esophageal Movement After POEM in Type III Achalasia
Vol. 28, No. 1 January, 2022 (131-144)
achalasia. Additionally, along the distension LCSA, post-procedural distension duration was revealed as a significant predicting factor for symptom relapse in type III achalasia. This also suggests that improving esophageal body compliance by long myotomy can im-prove the deglutitive inhibitory process during primary peristalsis and provides important clues regarding the mechanisms of symp-tom improvement after POEM in type III achalasia. As a result, our findings suggest that long myotomy is an essential component
of POEM for type III achalasia management.Our results also provide evidence supporting the application
of POEM in other spastic esophageal motility disorders, such as jackhammer esophagus and distal esophageal spasm, in which in-hibitory abnormalities in body peristalsis are prominent and LES relaxation is intact.11,21-24 Although additional controlled studies will be needed for verification, POEM may be a rational treatment strategy for these disorders.
21001800150012009006003000
Imp
ed
an
ce
()
10009008007006005004003002001000
Imp
ed
an
ce
()
2 sec
2 sec
Figure 6. Changes in cross-sectional movement in the distal esophageal body after peroral endoscopic myotomy in type III achalasia at baseline, peak distension, and contraction points (curved arrows a, b, and c). The muscle thickness de-creased, the lumen cross-sectional area, distension duration increased, and the swallow-to-distension interval decreased.

142
Alex Ju Sung Kim, et al
Journal of Neurogastroenterology and Motility 142
Along with esophageal body aperistalsis, increased muscle layer thickness is a well-known phenomenon in achalasia patients,25,26 and this is supposedly due to the sustained increase in intrabolus pressure with underlying esophageal myopathy.27,28 In addition, paradoxical muscle thickening during distension, which may be the cause of PEP, was found in most cases of type II achalasia (Supple-mentary Fig. 1).
Studies reporting changes in the muscle layer after normalizing the LES pressure are scarce. Sinn et al29 performed research to evaluate changes in the esophageal MCSA after PD and showed inconsistent results and no relationship with symptom recurrence. However, 2 points should be considered when interpreting the results: because the diagnosis of achalasia was made based on con-ventional manometry in that study, achalasia subtyping was not available, and data other than those for MCSA were not analyzed. Considering that the MCSA in achalasia is affected by the lumen CSA as well as the MT,25,30 the study lacks evidence estimating morphological changes in the esophageal body after LES decom-pression.
Our results showed that the baseline esophageal body MT increased in both type I and type II achalasia after POEM or PD. Especially in type I achalasia, the body MT became thicker than that of the normal controls, though it was thinner than that of the normal control before POEM or PD (Supplementary Fig. 2). These results may be explained by the pathologically thickened body muscle layer becoming prominent after POEM and PD, which effectively decreased the intrabolus pressure.
Our study shows that the distended LCSA dramatically de-creased after POEM in type I and II achalasia due to an effective decrease in LES pressure, and these results were also observed in the PD group.
However, our results showed that POEM could not effectively improve lumen-reducing esophageal contractility in type I and II achalasia, and the contractility index was increased after PD in type II achalasia. Long myotomy resulting in a decrease in esophageal body contractility may be an explanation for these results.31,32 These findings also suggest that esophageal contractility abnormalities in type I achalasia may be irreversible even after effective LES decom-pression.33
Interestingly, our study shows that PEP, which was a charac-teristic finding of type II achalasia and accompanied by paradoxical muscle thickening during distension, disappeared in most cases of type II achalasia not only in the POEM group (Supplemen-tary Fig. 1), but also in the PD group. Although it is still debated whether the unique esophageal body motility pattern is caused by
primary myopathy of the esophageal body or is secondary to in-creased intrabolus pressure, our results suggest that effective LES decompression alone can normalize the PEP in type II achalasia.12
Based on our results in type I and II achalasia, we cautiously propose that long myotomy is not necessarily essential in type I and II achalasia and that POEM with short myotomy, which ensures complete LES myotomy, can be as effective as POEM with long myotomy.34
Our study has several inevitable methodologic limitations. Certain patients with type I and II achalasia (8 with type I acha-
lasia and 4 with type II achalasia) who fulfilled the inclusion criteria were excluded because of unsuitable intraluminal US images (eg, the baseline and distension LCSAs were too large [more than 1000 mm2] to obtain whole images for analyzing the LCSA, or a large amount of remnant food was present in the esophageal lumen dur-ing the examination), which may have caused selection bias.
Principally, an intravascular US catheter and HRIM catheter should be assembled by taping the US transducer to the HRIM catheter before insertion into the patient to maintain the US trans-ducer 5 cm proximal to the LES and the exact same level as the pressure/impedance senor of the HRIM catheter during the ex-amination.35 However, we used an EUS catheter because (1) the in-travascular US system was not available in our institute and (2) the US image defect induced by interference of the adjacent HRIM catheter was minimized. Instead, we located the US transducer by fixing the US catheter to the HRIM catheter outside the body of the subject using the positioning function of the HRIM program.
Our results may not represent the long-term morphologic changes in esophageal body movement because follow-up intralu-minal US examination was performed 3-6 months after the proce-dure.
In conclusion, this study demonstrates that POEM decreased the esophageal LCSA by LES and intrabolus pressure decom-pression in type I and II achalasia. In contrast, POEM improved esophageal body distension and inhibitory processes during primary peristalsis in type III achalasia.
Supplementary Materials
Note: To access the supplementary figures mentioned in this article, visit the online version of Journal of Neurogastroenterol-ogy and Motility at http://www.jnmjournal.org/, and at https://doi.org/10.5056/jnm21020.
Acknowledgements: None.

143143
Esophageal Movement After POEM in Type III Achalasia
Vol. 28, No. 1 January, 2022 (131-144)
Financial support: None.
Conflicts of interest: None.
Author contributions: Ji Hyun Kim: proposal of study idea and development of study protocol, subjects enrollment, performing examination and procedure, data analysis, and making manuscript; Alex Ju Sung Kim: development of image-analyzing software, data acquisition, statistical analysis, and making manuscript; Sungmoon Ong: data acquisition, statistical analysis, and making manuscript; Hong Sub Lee and Jun Sik Yoon: patient selection and data analy-sis; and Dae Young Hur: data analysis, review the study protocol, and data acquisition.
References
1. Kahrilas PJ, Bredenoord AJ, Fox M, et al. The Chicago classifica-tion of esophageal motility disorders, v3.0. Neurogastroenterol Motil 2015;27:160-174.
2. Pandolfino JE, Gawron AJ. Achalasia: a systematic review. JAMA 2015;313:1841-1852.
3. Sodikoff JB, Lo AA, Shetuni BB, Kahrilas PJ, Yang GY, Pandolfino JE. Histopathologic patterns among achalasia subtypes. Neurogastroenterol Motil 2016;28:139-145.
4. Salvador R, Costantini M, Zaninotto G, et al. The preoperative mano-metric pattern predicts the outcome of surgical treatment for esophageal achalasia. J Gastrointest Surg 2010;14:1635-1645.
5. Pratap N, Kalapala R, Darisetty S, et al. Achalasia cardia subtyping by high-resolution manometry predicts the therapeutic outcome of pneu-matic balloon dilatation. J Neurogastroenterol Motil 2011;17:48-53.
6. Rohof WO, Salvador R, Annese V, et al. Outcomes of treatment for acha-lasia depend on manometric subtype. Gastroenterology 2013;144:718-725.
7. Ponds FA, Fockens P, Lei A, et al. Effect of peroral endoscopic myotomy vs pneumatic dilation on symptom severity and treatment outcomes among treatment-naive patients with achalasia: a randomized clinical trial. JAMA 2019;322:134-144.
8. Kim GH, Jung KW, Jung HY, et al. Superior clinical outcomes of per-oral endoscopic myotomy compared with balloon dilation in all achalasia subtypes. J Gastroenterol Hepatol 2019;34:659-665.
9. Ngamruengphong S, Inoue H, Ujiki MB, et al. Efficacy and safety of peroral endoscopic myotomy for treatment of achalasia after failed Heller myotomy. Clin Gastroenterol Hepatol 2017;15:1531-1537, e3.
10. Bechara R, Woo M, Hookey L, et al. Peroral endoscopic myotomy (POEM) for complex achalasia and the POEM difficulty score. Dig Endosc 2019;31:148-155.
11. Filicori F, Dunst CM, Sharata A, et al. Long-term outcomes following POEM for non-achalasia motility disorders of the esophagus. Surg En-dosc 2019;33:1632-1639.
12. Roman S, Kahrilas PJ, Mion F, et al. Partial recovery of peristalsis after
myotomy for achalasia: more the rule than the exception. JAMA Surg 2013;148:157-164.
13. Sanagapalli S, Plumb A, Maynard J, Leong RW, Sweis R. The timed barium swallow and its relationship to symptoms in achalasia: analysis of surface area and emptying rate. Neurogastroenterol Motil 2020;32:e13928.
14. Yoo IK, Choi SA, Kim WH, Hong SP, Cakir OO, Cho JY. Assessment of clinical outcomes after peroral endoscopic myotomy via esophageal dis-tensibility measurements with the endoluminal functional lumen imaging probe. Gut Liver 2019;13:32-39.
15. Mittal RK, Liu J, Puckett JL, et al. Sensory and motor function of the esophagus: lessons from ultrasound imaging. Gastroenterology 2005;128:487-497.
16. Krishnan K, Lin CY, Keswani R, Pandolfino JE, Kahrilas PJ, Koman-duri S. Endoscopic ultrasound as an adjunctive evaluation in patients with esophageal motor disorders subtyped by high-resolution manometry. Neurogastroenterol Motil 2014;26:1172-1178.
17. Kim JH, Mittal RK, Patel N, Ledgerwood M, Bhargava V. Esophageal distension during bolus transport: can it be detected by intraluminal im-pedance recordings? Neurogastroenterol Motil 2014;26:1122-1130.
18. Kim TH, Patel N, Ledgerwood-Lee M, Mittal RK. Esophageal con-tractions in type 3 achalasia esophagus: simultaneous or peristaltic? Am J Physiol Gastrointest Liver Physiol 2016;310:G689-G695.
19. Yamamoto Y, Liu J, Smith TK, Mittal RK. Distension-related responses in circular and longitudinal muscle of the human esophagus: an ultraso-nographic study. Am J Physiol 1998;275:G805-G811.
20. Park S, Zifan A, Kumar D, Mittal RK. Genesis of esophageal pressuriza-tion and bolus flow patterns in patients qith achalasia esophagus. Gastro-enterology 2018;155:327-336.
21. Quader F, Mauro A, Savarino E, et al. Jackhammer esophagus with and without esophagogastric junction outflow obstruction demonstrates altered neural control resembling type 3 achalasia. Neurogastroenterol Motil 2019;31:e13678.
22. Wahba G, Bouin M. Jackhammer esophagus: a meta-analysis of patient demographics, disease presentation, high-resolution manometry data, and treatment outcomes. Neurogastroenterol Motil 2020;32:e13870.
23. Philonenko S, Roman S, Zerbib F, et al. Jackhammer esophagus: clinical presentation, manometric diagnosis, and therapeutic results-results from a multicenter French cohort. Neurogastroenterol Motil 2020;32:e13918.
24. Hernandez PV, Valdovinos LR, Horsley-Silva JL, Valdovinos MA, Crowell MD, Vela MF. Response to multiple rapid swallows shows im-paired inhibitory pathways in distal esophageal spasm patients with and without concomitant esophagogastric junction outflow obstruction. Dis Esophagus 2020;33:1-6.
25. Mittal RK, Kassab G, Puckett JL, Liu J. Hypertrophy of the muscularis propria of the lower esophageal sphincter and the body of the esophagus in patients with primary motility disorders of the esophagus. Am J Gas-troenterol 2003;98:1705-1712.
26. Dogan I, Puckett JL, Padda BS, Mittal RK. Prevalence of increased esophageal muscle thickness in patients with esophageal symptoms. Am J Gastroenterol 2007;102:137-145.
27. Gockel I, Bohl JR, Doostkam S, Eckardt VF, Junginger T. Spectrum of

144
Alex Ju Sung Kim, et al
Journal of Neurogastroenterology and Motility 144
histopathologic findings in patients with achalasia reflects different etiolo-gies. J Gastroenterol Hepatol 2006;21:727-733.
28. Puckett JL, Bhalla V, Liu J, Kassab G, Mittal RK. Oesophageal wall stress and muscle hypertrophy in high amplitude oesophageal contrac-tions. Neurogastroenterol Motil 2005;17:791-799.
29. Sinn DH, Choi YS, Kim JH, et al. Change in cross-sectional area of esophageal muscle does not correlate with the outcome of achalasia after pneumatic balloon dilatation. J Gastroenterol Hepatol 2010;25:539-543.
30. Takeda T, Kassab G, Liu J, Puckett JL, Mittal RR, Mittal RK. A novel ultrasound technique to study the biomechanics of the human esophagus in vivo. Am J Physiol Gastrointest Liver Physiol 2002;282:G785-G793.
31. Ren Y, Tang X, Chen F, et al. Myotomy of Distal esophagus influences proximal esophageal contraction and upper esophageal sphincter relax-ation in patients with achalasia after peroral endoscopic myotomy. J Neu-
rogastroenterol Motil 2016;22:78-85.32. Hu Y, Li M, Lu B, Meng L, Fan Y, Bao H. Esophageal motility after
peroral endoscopic myotomy for achalasia. J Gastroenterol 2016;51:458-464.
33. Hong SJ, Bhargava V, Jiang Y, Denboer D, Mittal RK. A unique esoph-ageal motor pattern that involves longitudinal muscles is responsible for emptying in achalasia esophagus. Gastroenterology 2010;139:102-111.
34. Nabi Z, Ramchandani M, Sayyed M, et al. Comparison of short versus long esophageal myotomy in cases with idiopathic achalasia: a random-ized controlled trial. J Neurogastroenterol Motil 2021;27:63-70.
35. Leslie E, Bhargava V, Mittal RK. A novel pattern of longitudinal muscle contraction with subthreshold pharyngeal stimulus: a possible mechanism of lower esophageal sphincter relaxation. Am J Physiol Gastrointest Liver Physiol 2012;302:G542-G547.

145 2022 The Korean Society of Neurogastroenterology and Motility
J Neurogastroenterol Motil, Vol. 28 No. 1 January, 2022www.jnmjournal.org
JNMJ Neurogastroenterol Motil, Vol. 28 No. 1 January, 2022pISSN: 2093-0879 eISSN: 2093-0887https://doi.org/10.5056/jnm21047
Original ArticleJournal of Neurogastroenterology and Motility
Received: February 23, 2021 Revised: October 2, 2021 Accepted: October 11, 2021 This is an Open Access article distributed under the terms of the Creative Commons Attribution Non-Commercial License (http://creativecommons. org/licenses/by-nc/4.0) which permits unrestricted non-commercial use, distribution, and reproduction in any medium, provided the original work is properly cited.
*Correspondence: Nayoung Kim, MD, PhD Department of Internal Medicine, Seoul National University Bundang Hospital, 82, Gumi-ro 173beon-gil, Bundang-gu, Seongnam, Gyeonggi-do 13620, Korea Tel: +82-31-787-7008, Fax: +82-31-787-4051, E-mail: [email protected], [email protected]
Sex and Gender Differences in Overlap Syndrome of Functional Gastrointestinal Disorder and Effect of Genetic Polymorphisms in South Korea: A Long-term Follow-up Study
Ju Yup Lee,1,2 Nayoung Kim,1,3* Ji Hyun Park,3 Jeong Eun Yu,1 Yun Jeong Song,1 Jung Won Yoon,1 and Dong Ho Lee1,3
1Department of Internal Medicine, Seoul National University Bundang Hospital, Seoungnam, Gyeonggi-do, Korea; 2Department of Internal Medicine, Keimyung University School of Medicine, Daegu, Korea; and 3Department of Internal Medicine and Liver Research Institute, Seoul National University College of Medicine, Seoul, Korea
Background/AimsOverlap functional gastrointestinal disorder (FGID) is associated with more severe gastrointestinal symptoms and lower quality of life. The aim of this study is to evaluate clinical features of non-erosive reflux disease (NERD), functional dyspepsia, irritable bowel syndrome, their overlap in terms of sex and gender, and to assess the risk factors, including genetic polymorphisms.
MethodsA total of 494 FGIDs and 239 controls were prospectively enrolled between 2004 and 2020. FGIDs were diagnosed based on the Rome III criteria and symptoms were evaluated using a questionnaire. Follow-up questionnaires were conducted to determine the change of symptoms during the 75.8-month mean observation period. Risk factors including genetic polymorphisms in neurotransmitter receptor (SLC6A4 5-HTTLPR, GNB3, ADRA2A, CCKAR, and TRPV1) and cytokine (TNFA and IL10) genes.
ResultsNERD was more prevalent in men, and functional dyspepsia in women. Overlap FGIDs (n = 239) were more prevalent than non-overlap FGIDs (n = 255) in women (P = 0.019). Anxiety and depression scores were higher in the overlaps (P = 0.012 and P < 0.001, respectively). Symptoms were more frequent and severe in the overlap FGIDs than in the non-overlaps (P < 0.001). During follow-up, symptoms progressed more frequently in the overlap FGIDs, especially in patients with the L/S genotype of SLC6A4 5-HTTLPR and anxiety/depression.
ConclusionsOverlap FGID patients need attention given their association with anxiety/depression and more severe symptoms, especially in women. Genetic polymorphisms also may be associated with certain symptoms of overlap FGIDs.(J Neurogastroenterol Motil 2022;28:145-158)
Key WordsDyspepsia; Female; Male; Irritable bowel syndrome; Polymorphism

146
Ju Yup Lee, et al
Journal of Neurogastroenterology and Motility 146
Introduction
Non-erosive reflux disease (NERD), functional dyspepsia (FD), and irritable bowel syndrome (IBS) are representative functional gastrointestinal disorders (FGIDs) without clinically detectable anatomical abnormalities, but elicit chronic and recur-rent gastrointestinal (GI) symptoms.1 Although these FGIDs may manifest alone, 2 or more overlapping cases are common and de-fined as an overlap syndrome.2 Locke et al3 found that 1-8% of the general population have reported 2 to 3 FGIDs, whereas Choung et al4 found that 17% of the general population have reported more than 1 FGID. According to a systematic review and meta-analysis, the prevalence of IBS among FD patients was 37%, which was significantly higher than that among those without FD (7%).5 In addition, the prevalence of FD in patients with IBS was 29-87%.3,6,7
FGID patients have a higher proportion of overlap syndrome than patients with other types of disorders which are not FGID,8-10 suggesting that patients with overlap syndrome visit the hospital more frequently than those with FD or IBS alone. Patients with overlap syndrome also reported more frequent and severe GI symp-toms, more severe depressive symptoms, and lower quality of life (QoL) than those with single FGID.11 In actual clinical practice, overlap FGID can be frequently encountered, and it is important to know the clinical course of overlap FGID because these patients have severe symptoms and are highly likely to be related to psycho-social factors without responding to conservative treatment. How-ever, there have been only few studies on the overlap syndrome12-15 and on follow-up16,17; therefore, studies on the characteristics of patients with overlap syndrome and their associated risk factors are insufficient.
The various causes of FGIDs include changes in the motor and sensory nerves of the intestine, psycho-neurological factors, and changes in the immune system due to infection and allergy. Recently, gene polymorphisms affecting the pathogenesis of FGIDs in families or twins were discovered.18 Previously, we suggested that genetic polymorphisms in the serotonin transporter gene-linked long polymorphic region (SLC6A4 5-HTTLPR) and the alpha 2A adrenergic receptor (ADRA2A) 1291C>G polymorphism are pathological factors of IBS.19 We also identified SLC6A4 5-HT-TLPR and the 945G>C polymorphism in transient receptor po-tential ion channel of the vanilloid type 1 (TRPV1) among Korean FD patients, particularly those positive for Helicobacter pylori in-fection.20 In addition, 5-HTTLPR L/L has been found to be a risk factor for the co-occurrence of IBS with constipation and FD.21
Moreover, in NERD patients, sensitivity to stress often deter-mines the expression of symptoms; thus, NERD has been classified as an FGID and hypothesized to have an etiology different from that of reflux esophagitis. NERD represents the more common phenotypic presentation of GERD and comprises of patients who have typical symptoms without any mucosal breaks at endoscopy. However, these patients are markedly heterogeneous from a patho-physiological point of view.22 These groups consist of patients with esophageal acid exposure (true NERD), normal esophageal acid exposure but a positive symptom association probability for acid reflux (acid hypersensitive esophagus), or with normal esophageal acid exposure and a negative symptom association probability for any type of reflux (functional heartburn).22,23 Recently, the Rome criteria (Rome IV) for functional esophageal disorders, in which acid hypersensitive esophagus and non-acid hypersensitive esopha-gus groups have been combined into a new category of reflux hypersensitivity (RH) that would appear to fit somewhere between NERD and functional heartburn, has been defined.23,24 NERD, FD, and IBS often develop together in siblings, especially in fami-lies that carry a common genetic polymorphism. However, as the diagnosis of FGID depends on the patient’s subjective symptoms rather than clinical objective findings, and its etiology is often com-plex, studies focusing on the genes mentioned above are few, and investigation of genes in combination is rare.
Based on this background information, we hypothesized that the symptoms in overlap FGIDs may be severe and more progres-sive, and polymorphisms in genes involved in neurotransmission and cytokines may contribute to this overlap in FGIDs compared with non-overlap FGIDs. The aim of this study is to analyze the prevalence of overlap syndromes among NERD, FD, and IBS pa-tients, to elucidate the differences in their characteristics and symp-toms, and to determine their risk factors according to their sex and gender. In addition, we aim to analyze the effect of genetic polymor-phisms and anxiety/depression on FGIDs depending on whether they are non-overlap or overlap over a long follow-up period.
Materials and Methods
Study SubjectsKorean subjects were prospectively enrolled at the gastroenter-
ology outpatient clinic of the Seoul National University Bundang Hospital (SNUBH) between July 2004 and August 2020. The inclusion criteria were as follows: provision of consent to participate in the study, aged 18-80 years, and scheduled upper endoscopy

147147
Overlap FGIDs and Genetic Polymorphisms
Vol. 28, No. 1 January, 2022 (145-158)
procedure. Colonoscopy and abdominal imaging studies (eg, ab-dominal ultrasound or abdominopelvic computed tomography) were performed with upper endoscopy in the presence of clinical indications. Healthy control subjects and patients with FGID were collected as follows: subjects who underwent GI evaluations as a health check-up or for other problems based on a family history of gastric or colon cancer were categorized as healthy controls, whereas those who visited the GI clinic for the evaluation of upper or lower GI symptoms were classified as cases upon consenting to partici-pate in this study. This classification of healthy controls and cases was finally revised in the analysis step of the questionnaire survey. Exclusion criteria were as follows: history of GI surgery except appendectomy, inflammatory bowel disease, any malignancy, or sys-temic diseases requiring chronic medication except for hypertension and diabetes mellitus; pregnant or lactating women; and patients with hepatic, biliary, or psychiatric disorders requiring medication. Subjects were excluded from the study if organic diseases were found during follow-up endoscopy. The Institutional Review Board of SNUBH approved this study (B-2006-616-128), and written informed consent was obtained from all participants. This study protocol has been registered at ClinicalTrials.gov (NCT04712617).
Diagnostic Questionnaire of Functional Gastrointestinal Disorders and Demographic Data
After enrollment, the subjects received GI endoscopy regularly and were requested to fill up the Korean Bowel Disease Question-naire (K-BDQ)19,20 and gastroesophageal reflux questionnaire25-28 which included 7 reflux symptom such as heartburn, acid regurgita-tion, chest pain, hoarseness, globus sensation, cough, and epigastric soreness whenever they undertook GI endoscopy.
NERD was defined as a typical heartburn occurring at least once a week without visible esophageal mucosal break, detected us-ing endoscopy.29 Subjects with minimal changes on endoscopy and with typical reflux symptoms were also classified as NERD.30 A Korean Rome III criteria-based questionnaire translated from the original K-BDQ containing questions on 56 GI-related symptoms, sociodemographic status, medical history, smoking, alcohol habits, marital status, educational level, and employment status was pre-pared and validated.19,20,31
FD was diagnosed based on at least 1 of the following symp-toms: bothersome postprandial fullness, early satiation, epigastric pain, and epigastric burning.32 Absence of any structural diseases (including on upper endoscopy) that are likely to explain the symp-toms was required. FD was categorized as postprandial distress syndrome, epigastric pain syndrome, or mixed subtype based on
the Rome III criteria.32,33 Postprandial distress syndrome was de-fined as the presence of meal-induced dyspeptic symptoms such as postprandial fullness and early satiation. Epigastric pain syndrome was diagnosed based on the presence of epigastric pain or burning sensations.32,33
IBS was defined by recurrent abdominal pain or discomfort with at least 2 of the following characteristics: relief with defeca-tion, onset associated with a change in frequency of stool, and onset associated with a change in form (appearance) of stool.34 IBS was subclassified into IBS with constipation, IBS with diarrhea, mixed IBS, or unsubtyped IBS, as described previously.21
Assessment of Functional Gastrointestinal Disorders Symptoms, Anxiety, Depression, and Quality of Life
Representative GI symptoms were classified according to fre-quency and severity. Symptom severity was calculated by adding the severity scores (from 0 to 4: 0, none; 1, mild; 2, moderate; 3, severe; and 4, very severe) using the K-BDQ.35 Stool consistency based on the Bristol Stool Form Scale36 and number of bowel habits were also evaluated.
Anxiety and depression were assessed using the Hospital Anxiety and Depression Scale (HADS).37 They were subdivided into anxiety and depression subscales, both containing 7 items each. Each response is ranked on a scale from 0 to 3. A higher HADS score indicates that the subject is more depressive or anxious. A total score of 8 or more for each subscale indicates potential anxiety disorder or depression.38
GenotypingGenomic DNA from blood samples was isolated using
QIAamp DNA blood mini kit (QIAGEN Inc, Valencia, CA, USA) following the manufacturer’s instructions, as reported previ-ously.19 To detect the presence of the long (L) or short (S) allele of the SLC6A4 gene (5-HTTLPR), polymerase chain reaction (PCR)-based restriction fragment length polymorphism (RFLP) assay was performed on a Perkin Elmer real time PCR machine model 9600 (Perkin Elmer, Norwalk, CT, USA) with the forward primer 5’-TCCTCCGCTTTGGCGCCTCTTCC-3’ and re-verse primer 5’-TGGGGGTTGCAGGGGAGATCCTG-3’. The 469-bp fragment of the 5-HTTLPR polymorphism was designated “S,” and the 512-bp fragment was designated “L.” The genotyping of the CCK1R intron-779T>C polymorphism was also performed using the PCR-RFLP assay with the forward primer 5’-CTGTTCACTTGAGGAGCTTTG-3’ and the reverse primer 5’-TTAGAAGCTGACCTCCAACATGG-3’.

148
Ju Yup Lee, et al
Journal of Neurogastroenterology and Motility 148
The PCR product was digested using PstI; the T allele yielded DNA fragments of 264/480 bp, whereas the C allele, 744 bp. The G-protein β3 (GNB3) 825C>T, ADRA2A−1291C>G, cholecystokinin receptor 1 (CCK1R) intron 779T>C, TRPV1
945G>C, tumor necrosis factor-α (TNFA) 308 G>A, and in-terleukin (IL) 10 592C>A single nucleotide polymorphisms were determined using 5-exonuclease TaqMan genotyping assays on an ABI StepOnePlus Real-Time PCR System, according to the
Table 1. Demographic and Baseline Characteristics
VariablesHealthy control
(n = 239)
NERD only(n = 116)
FD only(n = 90)
IBS only(n = 49)
NERD-FD(n = 108)
NERD-IBS(n = 21)
FD-IBS(n = 51)
NERD- FD-IBS(n = 59)
Age (yr) 55.1 ± 11.7 57.0 ± 12.2 52.5 ± 12.7 46.8 ± 15.2a 51.3 ± 13.1 50.5 ± 10.7 50.9 ± 13.6 44.0 ± 13.2a
Women 146 (61.1) 44 (37.9)a 68 (75.6)a 20 (40.8) 68 (63.0) 11 (52.4) 35 (68.8) 38 (64.4)Body mass index (kg/m2) 23.4 ± 3.4 24.1 ± 3.1 22.2 ± 3.3 22.7 ± 2.9 22.7 ± 3.1 23.3 ± 2.8 22.6 ± 3.6 23.0 ± 3.4Marriage Single/divorced/widowed 32 (13.7) 15 (12.9) 8 (8.9) 6 (14.0) 18 (16.7) 2 (9.5) 13 (25.5)a 21 (35.6)a
Married 201 (86.3) 101 (87.1) 82 (91.1) 37 (86.0) 90 (83.3) 19 (90.5) 38 (74.5) 38 (64.4)Education Elementary/middle school 34 (16.3) 16 (17.6) 13 (16.7) 1 (2.9) 13 (14.1) 4 (20.0) 9 (23.7) 10 (19.2) High school 44 (21.2) 25 (27.5) 30 (38.5) 4 (11.4) 36 (39.2) 4 (20.0) 9 (23.7) 14 (26.9) University 130 (62.5) 50 (54.9) 35 (44.9) 30 (85.7) 43 (46.7) 12 (60.0) 20 (52.6) 28 (53.8)Job Employed 109 (52.9) 60 (67.4) 31 (39.7) 23 (65.7) 46 (50.5) 15 (75.0) 24 (57.2) 27 (54.0) Unemployed 22 (10.7) 10 (11.3) 6 (7.7) 3 (8.6) 7 (7.7) 0 (0.0) 3 (7.1) 4 (8.0) Housewives 75 (36.4) 19 (21.3) 41 (52.6) 9 (25.7) 38 (41.8) 5 (25.0) 15 (35.7) 19 (38.0)Alcohol (> 35 g/wk) 29 (12.4) 21 (18.1) 4 (4.4) 6 (24.0) 10 (9.3) 1 (4.8) 12 (23.5) 9 (15.3)Current smoker 11 (4.7) 19 (16.4) 9 (10.0) 6 (24.0) 15 (13.9) 3 (14.3) 7 (13.7) 10 (16.9)Daily spicy food ingestion 160 (77.7) 73 (73.0) 55 (69.6) 27 (75.0) 73 (75.3) 15 (78.9) 26 (65.0) 40 (76.9)Anxiety HADS score 5.1 ± 3.5 4.6 ± 2.7 7.9 ± 5.6 6.0 ± 3.3 6.1 ± 3.6 6.7 ± 3.1 8.0 ± 3.6 9.0 ± 3.7b
Depression HADS score 5.3 ± 3.5 5.3 ± 3.2 6.9 ± 2.9 6.0 ± 3.3 7.3 ± 3.4 9.7 ± 1.2 10.0 ± 3.6 10.2 ± 3.6a
aP < 0.05 compared to control.bP < 0.05 compared to NERD only group and control.NERD, non-erosive reflux disease; FD, functional dyspepsia; IBS, irritable bowel syndrome; HADS, hospital anxiety and depression scale.Data are expressed as mean ± SD or n (%).
A
FD12.3%
FD-IBS7.0%
NERD-FD-IBS8.0%
NERD-IBS2.9%
IBS6.9%
NERD-FD14.7%
NERD15.8%
B *
NERD FD IBS NERD+FD NERD+IBS FD+IBS NERD+FD+IBS
25
20
15
10
5
Fre
qu
en
cy
(%)
0
Men (n = 210)
Women (n = 284)
23.8
10.2
7.3
15.8
9.6
4.7
13.2
15.8
3.32.6
5.3
8.16.9
8.8
#
Figure 1. Proportions of subjects with functional gastrointestinal disorders (FGIDs) (A) and distribution of FGIDs according to sex (B). The prevalence of non-erosive reflux disease (NERD) was significantly higher in men and that of functional dyspepsia (FD) was significantly higher in women. IBS, irritable bowel syndrome. *P < 0.001 compared with women NERD, #P < 0.001 compared with men FD. FGID (n = 494), NERD (n = 304), FD (n = 308), irritable bowel syndrome (IBS) (n = 180), and non-overlap FGIDs (n = 255), overlap FGIDs (n = 239).

149149
Overlap FGIDs and Genetic Polymorphisms
Vol. 28, No. 1 January, 2022 (145-158)
manufacturer’s instructions (Applied Biosystems, Foster City, CA, USA).20,21 The predesigned primer and probe sets were ordered at http://www. appliedbiosystems.com (GNB3 825C>T assay ID number: C___2184734_10; ADRA2A−1291C>G assay ID number: C___7611979_10; TRPV1 945G>C assay ID number: C___1093688_20) and used according to their protocols. The genotyping results of SLC6A4 5-HTTLPR, GNB3 825C>T, ADRA2A−1291C>G, CCK1R intron 779T>C, TRPV1 945G>C, TNFA308 G>A, and IL10 592C>A were confirmed using direct sequencing, with the ABI version 3.1 Sequence Analy-sis software (Applied Biosystems).
Statistical MethodsData are expressed as mean (standard deviation or standard
error), geometric mean (95% CI), or percentage. Comparisons among 3 or more groups were performed using the chi-square test in categorical variables or analysis of variance (ANOVA) followed by Bonferroni correction in continuous variables. Two-way repeated
measures ANOVA was performed to determine whether the symp-tom scores were different within a group and between groups at baseline, and at first and second follow-up time points. A post-hoc Tukey’s test was used to identify the group that showed a difference when ANOVA showed a significant interaction. Variables with P < 0.05 in univariate analyses or clinical importance were sub-jected to multivariate analyses. All statistical tests were 2-tailed. P < 0.05 was considered statistically significant. Statistical analysis was performed using the SPSS 21.0 statistical package (version 21.0, IBM, Armonk, NY, USA).
Results
Demographic and Baseline CharacteristicsA total of 733 subjects participated in this study (Table 1). The
mean age was 52.7 ± 13.1 years, and 430 (58.7%) subjects were women. A total of 494 subjects were diagnosed with NERD, FD,
Table 2. Clinical Characteristics of Non-overlap and Overlap Functional Gastrointestinal Disorders
VariablesHealthy control (a)
(n = 239)Non-overlap FGID (b)
(n = 255)Overlap FGID (c)
(n = 239)P-value Post-hoc
Age (yr) 55.1 ± 11.7 53.5 ± 13.5 49.4 ± 13.3 < 0.001 a > b, a > cFemales 146 (61.1) 132 (51.8) 152 (63.6) 0.019 a > b, b < cBody mass index (kg/m2) 23.4 ± 3.4 23.2 ± 3.2 22.8 ± 3.2 0.139Marriage 0.002 a < c, b < c Single/divorced/widowed 32 (13.7) 29 (11.6) 54 (22.6) Married 201 (86.3) 220 (88.4) 185 (77.4)Education 0.125 Elementary/middle school 34 (16.3) 30 (14.7) 59 (28.9) High school 44 (21.2) 115 (56.4) 35 (17.8) University 130 (62.5) 63 (31.2) 103 (51.0)Job 0.677 Employed 109 (52.9) 114 (56.4) 19 (9.4) Unemployed 22 (10.7) 69 (34.2) 112 (55.2) Housewives 75 (36.4) 14 (6.9) 77 (37.9)Alcohol (> 35 g/wk) 29 (12.4) 31 (13.4) 32 (13.4) 0.939Current smoker 11 (4.7) 34 (14.7) 35 (14.6) < 0.001 a < b, a < cDaily spicy food ingestion 160 (77.7) 155 (72.1) 154 (74.0) 0.413Anxiety HADS score 5.1 ± 3.5 5.2 ± 3.3 6.2 ± 3.7 0.012 a < c, b < c Men 5.2 ± 3.0 5.1 ± 2.9 5.7 ± 2.9 0.614 Women 5.0 ± 3.9 5.3 ± 4.2 8.3 ± 4.1a 0.011 a < c, b < cDepression HADS score 5.3 ± 3.5 5.5 ± 3.2 8.2 ± 3.6 < 0.001 a < c, b < c Men 4.9 ± 2.7 5.5 ± 3.2 7.4 ± 3.2 0.007 a < c, b < c Women 5.7 ± 4.1 5.6 ± 3.3 9.2 ± 3.9b 0.001 a < c, b < c
aP = 0.007 compared to men.bP = 0.056 compared to men.FGID, functional gastrointestinal disorder; HADS, hospital anxiety and depression scale.Data are expressed as mean ± SD or n (%).

150
Ju Yup Lee, et al
Journal of Neurogastroenterology and Motility 150
and/or IBS, including 14.7% NERD-FD, 2.9% NERD-IBS, 7.0% IBS-FD, and 8.0% NERD-FD-IBS 3 overlap; 239 subjects were identified as healthy controls (Fig. 1A). The prevalence of NERD was significantly higher in men, whereas that of FD was significantly higher in women (Fig. 1B). The age of occurrence in the NERD-FD-IBS group was significantly lower than that in the control group (P < 0.05) (Table 1). The proportions of single, di-vorced, and widowed patients were significantly higher in the FD-IBS (P < 0.05) and NERD-FD-IBS (P < 0.05) groups than in the control group. Anxiety and depression (HADS) scores were also significantly higher in the NERD-FD-IBS group (P < 0.05) than those in the control group (Table 1).
Clinical Characteristics of Non-overlap and Overlap Functional Gastrointestinal Disorders
The number of non-overlap and overlap FGID subjects was 255 and 239, respectively. The average age of the patients in the overlap FGID group was lower than that of the non-overlap group (P < 0.001). The percentage of women in the overlap FGID group was higher than that in the non-overlap FGID group (P = 0.019), and the percentages of single, divorced, and widowed pa-tients were higher than those in the healthy controls (P = 0.018)
and non-overlap FGID group (P = 0.002) (Table 2). Anxiety and depression scores were also higher in the overlap FGID group than in the healthy control and non-overlap FGID groups (P = 0.012 in anxiety score and P < 0.001, respectively). Anxiety and depres-sion scores were higher in women in the FGID group (P = 0.007 for anxiety and P = 0.056 for depression) (Table 2).
Frequency and Severity of Gastrointestinal Symptoms Between Non-overlap and Overlap Functional Gastrointestinal Disorders
All upper and lower GI symptoms were significantly more fre-quent in the overlap FGID group than in the non-overlap FGID group and healthy control group. The severity of upper GI symp-toms was significantly higher in the overlap FGID group than in the non-overlap FGID group (P < 0.001) (Table 3).
Genetic PolymorphismsThe G allele and G/G genotype of ADRA2A were signifi-
cantly associated with NERD-FD in both sexes (P = 0.038 in total, P = 0.048 in men, and P = 0.046 in women). The T allele of GNB3 825C>T was significantly associated with IBS (P = 0.035), but there were no gender-based differences. The T allele of
Table 3. Frequency and Severity of Gastrointestinal Symptoms Between Non-overlap and Overlap Functional Gastrointestinal Disorders
VariablesHealthy
control (a) (n = 239)
Non-overlap FGID (b) (n = 255)
Overlap FGID (c) (n = 239)
P-value Post-hoc
Upper GI symptoms frequency Early satiation 26 (11.2) 51 (20.6) 136 (57.1) < 0.001 a < b < c Postprandial fullness 30 (12.9) 83 (33.6) 185 (77.4) < 0.001 a < b < c Epigastric pain/burning 40 (17.3) 88 (35.5) 169 (71.3) < 0.001 a < b < c Bloating 31 (13.7) 65 (26.9) 146 (63.2) < 0.001 a < b < c Nausea 19 (8.3) 31 (13.1) 101 (43.2) < 0.001 a < b < c Vomiting 7 (3.1) 10 (4.2) 37 (15.7) < 0.001 a < b < cUpper GI symptoms severity (5 Likert score [0-4]) Early satiation symptom severity 0.0 ± 0.1 0.5 ± 0.1 1.8 ± 0.1 < 0.001 a < b < c Postprandial fullness symptom severity 0.0 ± 0.1 0.8 ± 0.1 2.5 ± 0.1 < 0.001 a < b < c Epigastric pain symptom severity 0.3 ± 0.1 1.0 ± 0.1 2.2 ± 0.1 < 0.001 a < b < c Bloating pain symptom severity 0.3 ± 0.1 0.7 ± 0.1 2.0 ± 0.1 < 0.001 a < b < cLower GI symptoms frequency Less than 3 bowel movements/wk 18 (8.0) 21 (8.8) 23 (9.8) 0.803 Hard or lumpy stools 70 (30.0) 93 (37.5) 146 (61.1) < 0.001 a < b < c Loose or watery stools 54 (23.6) 92 (37.2) 137 (57.6) < 0.001 a < b < c Defecation straining 53 (23.3) 91 (37.4) 144 (60.3) < 0.001 a < b < c A feeling of incomplete bowel movement 51 (43.2) 99 (84.6) 158 (94.6) < 0.001 a < b < c Urgency 8 (3.5) 23 (9.6) 26 (11.1) 0.007 a < b < c
GI, gastrointestinal; FGID, functional gastrointestinal disorder.Data are expressed as n (%) or mean ± SE.

151151
Overlap FGIDs and Genetic Polymorphisms
Vol. 28, No. 1 January, 2022 (145-158)
GNB3 825C>T was also significantly associated with increased susceptibility to NERD-FD-IBS overlap in both men (P = 0.031) and women (P = 0.044). The SLC6A4 5-HTTLPR L/L geno-type and S allele (P = 0.049) and the SCL6A4 3609A>G G allele (P = 0.001) were associated with NERD-FD-IBS overlap,
especially in women. The A allele of IL10 592C>A was associated with IBS in men (P = 0.009) (Table 4).
Table 4. Distribution of Genetic Polymorphisms Between Control and Functional Gastrointestinal Disorders
Genotypes ControlsFGID
Total P-value Men P-valuea Women P-valueb
SLC6A4 5-HTTLPR NERD-FD-IBS S/S 92 (70.2) 27 (54.0) 0.049 12 (63.2) 0.681 15 (48.4) 0.024 L/S 35 (26.7) 18 (36.0) 7 (36.8) 11 (35.5) L/L 4 (3.1) 5 (10.0) 0 (0.0) 5 (16.1)SLC6A4 3609A>G NERD-FD-IBS A/A 187 (89.5) 41 (75.9) 0.001 15 (75.0) 0.147 26 (76.5) 0.028 A/G 22 (10.5) 12 (22.2) 5 (25.0) 7 (20.6) G/G 0 (0.0) 1 (1.9) 0 (0.0) 1 (2.9)GNB3 825C>T IBS only C/C 50 (23.8) 5 (12.8) 0.035 2 (9.5) 0.269 3 (16.7) 0.181 C/T 98 (46.7) 27 (69.3) 15 (71.4) 12 (66.7) T/T 62 (29.5) 7 (17.9) 4 (19.0) 3 (16.7)GNB3 825C>T NERD-FD-IBS C/C 50 (23.8) 21 (38.9) 0.043 9 (45.0) 0.031 12 (35.3) 0.044 C/T 98 (46.7) 24 (44.4) 5 (25.0) 19 (55.9) T/T 62 (29.5) 9 (16.7) 6 (30.0) 3 (8.8)ADRA2A 1291C>G NERD-FD C/C 21 (9.9) 19 (18.6) 0.038 9 (24.3) 0.048 10 (15.4) 0.046 C/G 98 (46.0) 35 (34.3) 16 (43.2) 19 (29.2) G/G 94 (44.1) 48 (47.1) 12 (32.4) 36 (55.4)CCKAR intron 779T>C NERD-FD-IBS T/T 113 (51.9) 24 (44.4) 0.429 11 (55.0) 0.234 13 (38.2) 0.456 T/C 84 (38.5) 26 (48.1) 9 (45.0) 17 (50.0) C/C 21 (9.6) 4 (7.4) 0 (0.0) 4 (11.8)TRPV1 945G>C NERD-FD-IBS G/G 52 (24.9) 13 (24.5) 0.295 4 (20.0) 0.577 9 (27.3) 0.393 G/C 97 (46.4) 30 (56.6) 11 (55.0) 19 (57.6) C/C 60 (28.7) 10 (18.9) 5 (25.0) 5 (15.2)TNFA 308G>A NERD-FD-IBS G/G 194 (93.3) 24 (80.0) 0.032 11 (78.6) 0.254 13 (81.3) 0.144 G/A 13 (6.3) 6 (20.0) 3 (21.4) 3 (18.8) A/A 1 (0.4) 0 (0.0) 0 (0.0) 0 (0.0)IL10 592C>A IBS only C/C 29 (13.9) 0 (0.0) 0.047 0 (0.0) 0.009 0 (0.0) 0.653 C/A 86 (41.1) 8 (80.0) 7 (100.0) 1 (33.3) A/A 94 (45.0) 2 (20.0) 0 (0.0) 2 (66.7)
aP-values compared to men controls.bP-values compared to women controls.FGID, functional gastrointestinal disorder; NERD, non-erosive reflux disease; FD, functional dyspepsia; IBS, irritable bowel syndrome; 5-HTTLPR, serotonin transporter long polymorphic region; GNB3, G-protein β3 gene; ADRA2A, alpha 2A adrenergic receptor gene; TRPV1, transient receptor potential ion channel of the vanilloid type 1; CCK1R, cholecystokinin receptor 1 gene; TNFA, tumor necrosis factor-α gene; IL, interleukin gene. Data are expressed as n (%).

152
Ju Yup Lee, et al
Journal of Neurogastroenterology and Motility 152
Changes in Functional Gastrointestinal Disorder Symptoms From Baseline to Long-term Follow-up
After the initial baseline questionnaire, a follow-up question-naire (n = 106) was used to determine the occurrence of 4 upper and 5 lower GI symptoms during the observation period. The mean period from baseline to the first follow-up (f/u1) was 38.7
± 22.1 months, and that from the first follow-up to the second follow-up (f/u2) was 37.1 ± 21.0 months (Fig. 2J). Except for stool urgency, the intensity of all GI symptoms was more severe in the overlap FGID group than in the non-overlap FGID group, even during the follow-up period. During follow-up of the overlap FGID group, most FGID symptoms improved, such as epigastric pain (Fig. 2C), bloating (Fig. 2D), loose or watery stools (Fig. 2F),
A
Time
P = 0.002
P = 0.001
Early satiation3.0
2.0
1.0
0
Sym
pto
mse
ve
rity
Non-overlap (n = 60)
Overlap (n = 46)
P = 0.002
Time
P < 0.001
Postprandial fullness3.0
2.0
1.0
0
Sym
pto
mse
ve
rity
Non-overlap (n = 60)
Overlap (n = 46)
P < 0.001
Time
P < 0.001
Epigastric pain3.0
2.0
1.0
0
Sym
pto
mse
ve
rity
Non-overlap (n = 60)
Overlap (n = 46)
P < 0.001
P < 0.001
P < 0.001
B C
D E F
G H I
J
Time
P = 0.001
P = 0.009
Bloating3.0
2.0
1.0
0
Sym
pto
mse
ve
rity
Non-overlap (n = 60)
Overlap (n = 46)
Time
P = 0.022
Hard or lump stool
0
Sym
pto
mse
ve
rity
Non-overlap (n = 60)
Overlap (n = 46)
P = 0.003
Time
P = 0.074
Loose or watery stools
0
1.5
1.0
0.5
Sym
pto
mse
ve
rity
Non-overlap (n = 60)
Overlap (n = 46)
P = 0.018
P = 0.037
1.5
1.0
0.5
Initial f/u1 f/u2
Time
P < 0.001
P = 0.001
Defecation straining
0
Sym
pto
mse
ve
rity
Non-overlap (n = 60)
Overlap (n = 46)
Time
P < 0.001
Incomplete bowel movement
0
Sym
pto
mse
ve
rity
Non-overlap (n = 60)
Overlap (n = 46)
P < 0.001
Time
Urgency
0
1.5
1.0
0.5
Sym
pto
mse
ve
rity
Non-overlap (n = 60)
Overlap (n = 46)
P = 0.410
P = 0.001
1.5
1.0
0.5
1.5
1.0
0.5
Initial f/u2f/u1 Initial f/u2f/u1
Initial f/u1 f/u2 Initial f/u2f/u1 Initial f/u2f/u1
Initial f/u1 f/u2 Initial f/u2f/u1 Initial f/u2f/u1
P < 0.001
Initial f/u1 f/u2
38.7 + 22.1 months 37.1 + 21.0 months
P < 0.001
P < 0.001
Figure 2. Changes in functional gastrointestinal disorder (FGID) symptoms during the follow-up period. Most FGID symptoms such as epigas-tric pain (C), bloating (D), loose or watery stool (F), incomplete defecation (H) and urgency (I) improved; however, symptoms of early satiation (A), postprandial fullness (B), hard or lump stool (E), and defecation straining (G) were aggravated in the overlap FGID group in the second follow-up visit. Symptoms were analyzed in the follow-up 1 (f/u1) (38.7 ± 22.1 months) and follow-up 2 (f/u2) 37.1 ± 21.0 months (J) periods.

153153
Overlap FGIDs and Genetic Polymorphisms
Vol. 28, No. 1 January, 2022 (145-158)
3.0
2.0
1.0
Sym
pto
mse
ve
rity
Time
0
A B
C D
Epigastric pain in anxiety ( ) patients
Non-overlap (n = 60)
Overlap (n = 46)
P = 0.009
P = 0.253
P < 0.001
Initial f/u1 f/u2
3.0
2.0
1.0
Sym
pto
mse
ve
rity
Time
0
Epigastric pain in anxiety (+) patients
Non-overlap (n = 60)
Overlap (n = 46)
P = 0.009
P = 0.195
P = 0.910
Initial f/u1 f/u2
3.0
2.0
1.0
Sym
pto
mse
ve
rity
Time
0
Epigastric pain in depression ( ) patients
Non-overlap (n = 60)
Overlap (n = 46)
P = 0.005
P = 0.256
P = 0.001
Initial f/u1 f/u2
3.0
2.0
1.0
Sym
pto
mse
ve
rity
Time
0
Epigastric pain in depression (+) patients
Non-overlap (n = 60)
Overlap (n = 46)
P = 0.038
P = 0.012
P = 0.012
Initial f/u1 f/u2
Figure 3. Changes in epigastric pain symptom severity according to anxiety and depression during the follow-up period. There were no differences in symptoms between the non-overlap and overlap functional gastrointestinal disorder (FGID) in anxiety (–) and depression (–) groups (A and C), however, differences between the non-overlap and overlap FGID were revealed during the follow-up period in anxiety (+) and depression (+) groups (B and D). There was no change in symptom severity in both non-overlap and overlap FGIDs during the follow-up period in the anxiety group (B). (+), patients has anxiety or depression; (–), patients has no anxiety or depression; f/u, follow-up.
A
Time
Early satiation
3.0
2.0
1.0
0
Sym
pto
mse
ve
rity
P = 0.012
Time
Postprandial fullness
3.0
2.0
1.0
0
Sym
pto
mse
ve
rity
P = 0.019
Time
Epigastric pain
3.0
2.0
1.0
0
Sym
pto
mse
ve
rity
P = 0.093
B C
Initial f/u1 f/u2 Initial f/u2f/u1 Initial f/u2f/u1
S/S vs L/S, = 0.009PS/S vs L/L, = 0.743P
S/S (n = 70)
L/S (n = 9)
L/L (n = 4)
S/S (n = 70)
L/S (n = 9)
L/L (n = 4)
S/S (n = 70)
L/S (n = 9)
L/L (n = 4)
S/S vs L/S, = 0.019PS/S vs L/L, = 0.554P
Figure 4. Changes in severity of upper gastrointestinal symptoms during the follow-up period according to the serotonin transporter gene-linked long polymorphic region (SLC6A4 5-HTTLPR) gene polymorphism. Early satiation (A) and postprandial fullness (C) were most severe in pa-tients with the SLC6A4 5-HTTLPR L/S genotype and were found to worsen. Epigastric pain symptoms (B) in patients with the SLC6A4 5-HT-TLPR L/L genotype were maintained and did not deteriorate or improve. L, long allele of the SLC6A4 5-HTTLPR gene; S, short allele of the SLC6A4 5-HTTLPR gene; f/u, follow-up.

154
Ju Yup Lee, et al
Journal of Neurogastroenterology and Motility 154
incomplete defecation (Fig. 2H), and urgency (Fig. 2I); however, symptoms of early satiation (Fig. 2A), postprandial fullness (Fig. 2B), hard or lump stool (Fig. 2E), and defecation straining (Fig. 2G) were aggravated.
Among the various symptoms of FGID, epigastric pain was associated with anxiety and depression (Fig. 3). For patients with anxiety and depression, differences in symptoms severity between the non-overlap and overlap FGID groups were clearly revealed at initial, follow-up 1, and follow-up 2 (P = 0.009 for anxiety and P = 0.038 for depression) (Fig. 3B and 3D). In addition, there was no change in symptom severity in both non-overlap and overlap FGIDs during the follow-up period in the anxiety group (Fig. 3B).
A multivariate analysis was performed to determine whether genetic polymorphisms affect the development of symptoms. Early satiation (Fig. 4A) and postprandial fullness (Fig. 4C) were most severe in patients with the SLC6A4 5-HTTLPR L/S genotype and worsened during follow-up. In addition, the epigastric pain
symptoms in patients with the SLC6A4 5-HTTLPR L/L geno-type were maintained and did not deteriorate or improve during the follow-up period (Fig 4B). Multivariate analysis was performed to determine the relationship between the genetic polymorphism and overlap syndrome. Early satiation and epigastric pain symptoms in the non-overlap FGID group were not related to the SLC6A4 5-HTTLPR genotype. However, in the overlap FGID group, the L/L and L/S genotypes showed more severe symptoms than the S/S genotype (Fig. 5).
Discussion
In this study, we found sex/gender differences in FGID, espe-cially in the overlap group. NERD was significantly more prevalent in men and FD was more prevalent in women. Overlap FGIDs were more prevalent than non-overlap FGIDs in women. Anxi-ety and depression scores were higher in the overlap FGIDs and
Sym
pto
mse
ve
rity
Time
0
A B
C D
Early satiation in non-overlap
P = 0.820
Initial f/u1 f/u2
Sym
pto
mse
ve
rity
Time
0
Early satiation in overlap
P = 0.045
Initial f/u1 f/u2
Sym
pto
mse
ve
rity
Time
0
P = 0.640
Initial f/u1 f/u2
Sym
pto
mse
ve
rity
Time
0
Epigastric pain in overlap
P = 0.055
Initial f/u1 f/u2
S/S vs L/S, = 0.055
S/S vs L/L, = 0.439
PP
S/S (n = 38)
L/S (n = 2)
L/L (n = 2)
S/S vs L/S, = 0.045
S/S vs L/L, = 0.827
PP
S/S (n = 32)
L/S (n = 7)
L/L (n = 2)
S/S (n = 38)
L/S (n = 2)
L/L (n = 2)
S/S (n = 32)
L/S (n = 7)
L/L (n = 2)
Epigastric pain in non-overlap
2.5
2.0
1.5
1.0
0.5
4.0
3.5
3.0
2.5
2.0
1.5
1.0
0.5
2.5
2.0
1.5
1.0
0.5
3.5
3.0
2.5
2.0
1.5
1.0
0.5
Figure 5. Effect of the serotonin transporter gene-linked long polymorphic region (SLC6A4 5-HTTLPR) gene polymorphism on the severity of epigastric pain in patients with overlap syndrome. Early satiation and epigastric pain symptoms in the non-overlap functional gastrointestinal disor-der (FGID) group were not related to the SLC6A4 5-HTTLPR genotype (A, C). In the overlap FGID group, L/L and L/S genotypes elicited more severe symptoms than the S/S genotype (B, D). L, long allele of the SLC6A4 5-HTTLPR gene; S, short allele of the SLC6A4 5-HTTLPR gene; f/u, follow-up.

155155
Overlap FGIDs and Genetic Polymorphisms
Vol. 28, No. 1 January, 2022 (145-158)
FGID symptoms (early satiation, postprandial fullness, and epigas-tric pain) were more frequent and severe in the overlap FGIDs than in the non-overlap groups. Symptom progress during long-term follow-up was more frequently observed in the overlap FGIDs, especially the L/S genotype of SLC6A4 5-HTTLPR. Polymor-phism of IL10 592C>A was associated with the occurrence of IBS in men, and SLC6A4 5-HTTLPR was associated with female NERD-FD-IBS.
In a previous study on the general Korean population, the dyspepsia-IBS overlap was the most common and overlap FGID developed at a younger age and was more prevalent in women than non-overlapping FGIDs.39 In another study that analyzed the rela-tionship between FD, IBS, and reflux esophagitis patients, the odds ratio of having both FD and IBS was estimated to be 4.4 (95% CI, 1.21-15.71). However, there was no significant association between age, gender in patients with overlap syndrome.40 Lee et al11 found that, in psychiatric patients, the NERD-FD overlap was the most common among NERD, FD, IBS, and functional constipation.
Moreover, in our study, anxiety and depression scores were higher in the overlap FGID group. The frequency and severity score of various symptoms of FGIDs were higher in the overlap FGID group than in the control and non-overlapping FGID groups. Patients with both FD and IBS have been shown to ex-perience more severe symptoms and worse QoL.41-43 In another study, Korean patients with FD-IBS overlap were frequently found to be depressed and had a poor QoL.43 Therefore, the authors of that study suggested that patients with FD-IBS overlap should be treated for their gastrointestinal symptoms and receive psychiatric support to improve their QoL and psychological distress.43
Psychosocial factors, including stress, play an important role in the expression of FGID.44 In addition, when FGID is associated with mental illness such as depression or anxiety, the symptoms will be much worse.45 In a previous study, the prevalence of depressive symptoms and anxiety in IBS patients were very high, at 22% and 30%, respectively.46 Pinto-Sanchez et al47 reported that, within the FGID group, a greater number of FGIDs was associated with a proportional increase in depression and anxiety. Recent animal studies have proposed a brain-gut-microbiome axis, in which stress changes the composition of the microbiome, and the microbiota, in turn, alter metabolism and transmission of brain-derived neuro-trophic factor, gamma aminobutyric acid, and serotonin, and this influences depression and anxiety.48 Vanuytel et al49 reported that increased corticotrophin-releasing factor in the event of acute emo-tional stress alters intestinal permeability via the action of mast cells, and that corticotrophin-releasing factor and mast cells also affect
visceral sensitivity.50
Very few studies have been conducted on the long-term follow-up of the overlap syndrome. Similar to our results, as in most obser-vational studies, FGID symptoms improved during the follow-up period.51,52 This may be related to treatment in any form (medication or education, etc) or reassurance when visiting a hospital for FGID symptoms. However, as has already been found, FGID symptoms are often associated with other factors, especially psychological fac-tors such as anxiety and depression,53,54 so that symptoms may not improve or rather worsen during the follow-up period. In a Belgian study in which FD patients were followed- up for 5 years, symp-toms improved or disappeared in about half of FD patients, and FD symptoms were associated with anxiety.52 In an Australian study that followed FGID patients for 12 years, FGID symptoms peri-odically appeared and disappeared and were closely related to anxi-ety.17 Aro et al16 performed a 10-year follow-up of Swedish FGID patients and reported that patients with anxiety at baseline, but not depression, had a 7.6 fold higher risk of developing FD after 10 years. In the present study, the relationship between anxiety and FGID was confirmed. In overlap FGID, especially in women, and in the overlap of NERD-FD-IBS, the anxiety score was high. In addition, anxiety was associated with epigastric pain, and FGID pa-tients with anxiety did not show significant symptom improvement during the follow-up period, indicating that patients with anxiety did not respond to general FGID treatment, especially in the non-overlap group.
Genetic studies have suggested that polymorphisms in the se-rotonin transporter (SERT) gene and the G-protein β3 (GNB3) C825T gene are associated with FD or IBS. The GNB3 825C>T polymorphism has been widely evaluated in FD patients.55,56 In IBS patients, the SLC6A4 5-HTTLPR polymorphism has been well-studied.57,58 In the present study, the genetic polymorphisms of SERT and GNB3 were observed in NERD-FD-IBS overlap patients and that of the adrenergic receptor gene in NERD-FD patients. The SERT gene plays a role in serotonin reuptake by the presynaptic terminal. In the presence of genetic polymorphism, serotonin concentration may rise or fall, thus affecting FGID symp-toms. The SERT gene was particularly associated with upper GI symptoms such as early satiation and epigastric pain. Among the SLC6A4 5-HTTLPR gene polymorphism patients, these symp-toms were the most severe in the L/S genotype. In particular, the symptoms of epigastric pain in patients with the SLC6A4 5-HT-TLPR L/L genotype did not improve during the follow-up period, suggesting that some symptoms affected by genetic polymorphism may not improve even with appropriate treatment. However, chang-

156
Ju Yup Lee, et al
Journal of Neurogastroenterology and Motility 156
es in FGID clinical symptoms during the follow-up period cannot be explained by genetic polymorphism alone. FGID mechanisms are diverse, and genetic polymorphism comprises only a small part. The patients used various drugs during the follow-up period, and various lifestyle modifications were performed in parallel. How-ever, in some patients, symptoms improved, while in some patients, symptoms worsened. In some patients who did not respond to treat-ment, polymorphism such as the SERT gene may be related with this prognosis, especially in patients with overlap FGID. However, it is not easy to determine the role of genetic polymorphism by ex-cluding a wide variety of influencing factors. Additional research is needed in the future to clarify this issue.
Our study has several limitations, such as the number of enrolled patients being relatively small especially for the genetic polymorphism study. However, among many neurotransmission-related and cytokine genes, we found that in the presence of the SLC6A4 5-HTTLPR L/L genotype alone, the symptoms did not improve during the mean follow-up period of 75.8 months. In addition, SLC6A4 5-HTTLPR was found to be associated with female NERD-FD-IBS (P = 0.024) patients. This implies that even if this cohort was small, SLC6A4 5-HTTLPR L/L seemed to contribute to female patients with overlap FGIDs. The second limitation concerns the definition of NERD. Theoretically, NERD is diagnosed if the 24-hour esophageal pH monitoring is positive without esophageal damage. However, most enrolled patients did not undertake this examination mainly because they refused a 24-hour esophageal pH monitoring. Therefore, clinically, it was dif-ficult to completely differentiate between NERD and RH. This implies that the patients with reflux symptoms were a heterogeneous group.22
Actually, RH describe the cases between NERD and func-tional heartburn.23,24 However, if the patient visited with GERD symptoms and upper endoscopy ruled out ERD, usually the patient is categorized as NERD simply because we do not know if this patient is NERD or RH or FH without pH-metry or impedance study. Thus we followed this concept in the present study.
Third, there were many patients with follow-up loss. For practi-cal reasons, we received the questionnaire in the endoscopy room whenever patients underwent endoscopy. In Korea, people aged > 40 years are recommended to undergo biannual endoscopy at the National Cancer Control Policy, free of charge. Our hospital is a tertiary institute where endoscopy is not free of charge; thus, if the patients’ symptoms disappear, they are less likely to visit the hospital for endoscopy. However, following these examinations, pa-tients with organic diseases were excluded from this study, and only
FGID patients were enrolled. Despite these limitations, our study is comprehensive regarding FGIDs related to genetic polymor-phisms and questionnaires over long-term follow-up. Fourth, we could not analyze the effects of drugs such as PPI, prokinetics, and anti-spasmotics, which are basically used for FGID, and various neuromodulators that can affect not only FGID symptoms, but also anxiety and depression.
Lastly, since there is no questionnaire to evaluate esophageal symptoms in K-BDQ, the gastroesophageal reflux questionnaire was used to and evaluate the follow-up symptoms of GERD. However, since it is a questionnaire used in some studies and is not officially validated, it is thought that there are some limitations in drawing conclusions from the derived results. However, since it is a questionnaire used in the previous nationwide multi-center study,25 there may not be a significant difference in the interpretation of the results. In conclusion, patients with overlap FGIDs should be a fo-cus of attention because they are associated with anxiety/depression and more severe symptoms, especially women. Genetic polymor-phisms could also be associated with certain symptoms of overlap FGIDs. In overlap FGIDs with certain genetic factors, it may sug-gest reasons why some symptoms are refractory to lifestyle changes or pharmacological treatment.
Financial support: This research was supported by Support Program for Women in Science, Engineering and Technology through the National Research Foundation of Korea (NRF) funded by the Ministry of Science and ICT (No. 2019H1C3A1032224).
Conflicts of interest: None.
Author contributions: Ju Yup Lee analyzed data and prepared the manuscript drafted; Nayoung Kim designed the study, col-lected data, and supervised the writing of this manuscript; Ji Hyun Park and Jeong Eun Yu performed genotyping of genetic poly-morphisms; Yun Jeong Song and Jung Won Yoon managed and collected the questionnaire data; and Dong Ho Lee supervised the writing of the manuscript. All authors have read and approved the final draft of this article.
References 1. Drossman DA. Functional gastrointestinal disorders: history, pathophysi-
ology, clinical features and Rome IV. Gastroenterology 2016;150:1262-1279.
2. Suzuki H, Hibi T. Overlap syndrome of functional dyspepsia and irri-table bowel syndrome - are both diseases mutually exclusive? J Neurogas-troenterol Motil 2011;17:360-365.

157157
Overlap FGIDs and Genetic Polymorphisms
Vol. 28, No. 1 January, 2022 (145-158)
3. Locke GR 3rd, Zinsmeister AR, Fett SL, Melton LJ 3rd, Talley NJ. Overlap of gastrointestinal symptom complexes in a US community. Neurogastroenterol Motil 2005;17:29-34.
4. Choung RS, Chang JY, Locke GR, Schleck CD, Zinsmeister AR, Tal-ley NJ. Is having multiple functional gastrointestinal disorders distinct from having a single FGID? A population based study. Gastroenterology 2011;140:S708.
5. Ford AC, Marwaha A, Lim A, Moayyedi P. Systematic review and meta-analysis of the prevalence of irritable bowel syndrome in individuals with dyspepsia. Clin Gastroenterol Hepatol 2010;8:401-409.
6. Choung RS, Locke GR, Schleck CD, Zinsmeister AR, Talley NJ. Do distinct dyspepsia subgroups exist in the community? A population-based study. Am J Gastroenterol 2007;102:1983-1989.
7. Agréus L, Svärdsudd K, Nyrén O, Tibblin G. Irritable bowel syndrome and dyspepsia in the general population: overlap and lack of stability over time. Gastroenterology 1995;109:671-680.
8. Perri F, Clemente R, Festa V, et al. Patterns of symptoms in functional dyspepsia: role of Helicobacter pylori infection and delayed gastric emp-tying. Am J Gastroenterol 1998;93:2082-2088.
9. Stanghellini V, Tosetti C, Paternicò A, et al. Predominant symptoms identify different subgroups in functional dyspepsia. Am J Gastroenterol 1999;94:2080-2085.
10. Talley NJ, Dennis EH, Schettler-Duncan VA, Lacy BE, Olden KW, Crowell MD. Overlapping upper and lower gastrointestinal symptoms in irritable bowel syndrome patients with constipation or diarrhea. Am J Gastroenterol 2003;98:2454-2459.
11. Lee SY, Ryu HS, Choi SC, Jang SH. Psychological factors influence the overlap syndrome in functional gastrointestinal disorder and quality of life among psychiatric patients in South Korea. Psychiatry Investig 2020;17:262-267.
12. Yao X, Yang Y, Zhang S, Shi Y, Zhang Q, Wang Y. The impact of over-lapping functional dyspepsia, belching disorders and functional heartburn on anxiety, depression and quality of life of Chinese patients with irritable bowel syndrome. BMC Gastroenterol 2020;20:209.
13. von Wulffen M, Talley NJ, Hammer J, et al. Overlap of irritable bowel syndrome and functional dyspepsia in the clinical setting: prevalence and risk factors. Dig Dis Sci 2019;64:480-486.
14. Aziz I, Palsson OS, Törnblom H, Sperber AD, Whitehead WE, Sim-rén M. The Prevalence and impact of overlapping Rome IV-diagnosed functional gastrointestinal disorders on somatization, quality of life, and healthcare utilization: a cross-sectional general population study in three countries. Am J Gastroenterol 2018;113:86-96.
15. Berens S, Engel F, Gauss A, et al. Patients with multiple functional gas-trointestinal disorders (FGIDs) show increased illness severity: a cross-sectional study in a tertiary care FGID specialty clinic. Gastroenterol Res Pract 2020;2020:9086340.
16. Aro P, Talley NJ, Johansson SE, Agréus L, Ronkainen J. Anxiety is linked to new-onset dyspepsia in the Swedish population: a 10-year follow-up study. Gastroenterology 2015;148:928-937.
17. Koloski NA, Jones M, Kalantar J, Weltman M, Zaguirre J, Talley NJ. The brain--gut pathway in functional gastrointestinal disorders is bidirec-tional: a 12-year prospective population-based study. Gut 2012;61:1284-
1290.18. Adam B, Liebregts T, Holtmann G. Mechanisms of disease: genetics of
functional gastrointestinal disorders--searching the genes that matter. Nat Clin Pract Gastroenterol Hepatol 2007;4:102-110.
19. Choi YJ, Hwang SW, Kim N, Park JH, Oh JC, Lee DH. Association between SLC6A4 serotonin transporter gene lainked polymorphic region and ADRA2A -1291C>G and irritable bowel syndrome in Korea. J Neurogastroenterol Motil 2014;20:388-399.
20. Hwang SW, Kim N, Jung HK, et al. Association of SLC6A4 5-HT-TLPR and TRPV1 945G>C with functional dyspepsia in Korea. J Gastroenterol Hepatol 2014;29:1770-1777.
21. Choi YJ, Kim N, Yoon H, et al. Overlap between irritable bowel syn-drome and functional dyspepsia including subtype analyses. J Gastroen-terol Hepatol 2017;32:1553-1561.
22. Savarino E, Zentilin P, Savarino V. NERD: an umbrella term includ-ing heterogeneous subpopulations. Nat Rev Gastroenterol Hepatol 2013;10:371-380.
23. Hungin APS, Molloy-Bland M, Scarpignato C. Revisiting Montreal: new insights into symptoms and their causes, and implications for the future of GERD. Am J Gastroenterol 2019;114:414-421.
24. Aziz Q, Fass R, Gyawali CP, Miwa H, Pandolfino JE, Zerbib F. Func-tional esophageal disorders. Gastroenterology 2016;150:1368-1379.
25. Lee JH, Kim N, Chung IK, et al. Clinical significance of minimal change lesions of the esophagus in a healthy Korean population: a nationwide multi-center prospective study. J Gastroenterol Hepatol 2008;23:1153-1157.
26. Kim N, Lee SW, Cho SI, et al. The prevalence of and risk factors for ero-sive oesophagitis and non-erosive reflux disease: a nationwide multicentre prospective study in Korea. Aliment Pharmacol Ther 2008;27:173-185.
27. Park JJ, Kim JW, Kim HJ, et al. The prevalence of and risk factors for Barrett’s esophagus in a Korean population: a nationwide multicenter prospective study. J Clin Gastroenterol 2009;43:907-914.
28. Shim KN, Hong SJ, Sung JK, et al. Clinical spectrum of reflux esopha-gitis among 25,536 Koreans who underwent a health check-up: a nation-wide multicenter prospective, endoscopy-based study. J Clin Gastroen-terol 2009;43:632-638.
29. Lee ES, Kim N, Lee SH, et al. Comparison of risk factors and clinical responses to proton pump inhibitors in patients with erosive oesophagitis and non-erosive reflux disease. Aliment Pharmacol Ther 2009;30:154-164.
30. Fass R, Fennerty MB, Vakil N. Nonerosive reflux disease--current con-cepts and dilemmas. Am J Gastroenterol 2001;96:303-314.
31. Noh YW, Jung HK, Kim SE, Jung SA. Overlap of erosive and non-erosive reflux dseases with functional gastrointestinal disorders according to Rome III criteria. J Neurogastroenterol Motil 2010;16:148-156.
32. Tack J, Talley NJ, Camilleri M, et al. Functional gastroduodenal disor-ders. Gastroenterology 2006;130:1466-1479.
33. Vakil N, Halling K, Ohlsson L, Wernersson B. Symptom overlap be-tween postprandial distress and epigastric pain syndromes of the Rome III dyspepsia classification. Am J Gastroenterol 2013;108:767-774.
34. Longstreth GF, Thompson WG, Chey WD, Houghton LA, Mea-rin F, Spiller RC. Functional bowel disorders. Gastroenterology

158
Ju Yup Lee, et al
Journal of Neurogastroenterology and Motility 158
2006;130:1480-1491.35. Song KH, Jung HK, Min BH, et al. Development and validation of the
Korean Rome III questionnaire for diagnosis of functional gastrointestinal disorders. J Neurogastroenterol Motil 2013;19:509-515.
36. Lewis SJ, Heaton KW. Stool form scale as a useful guide to intestinal transit time. Scand J Gastroenterol 1997;32:920-924.
37. Kim JY, Kim N, Seo PJ, et al. Association of sleep dysfunction and emo-tional status with gastroesophageal reflux disease in Korea. J Neurogas-troenterol Motil 2013;19:344-354.
38. Bjelland I, Dahl AA, Haug TT, Neckelmann D. The validity of the Hospital Anxiety and Depression Scale. An updated literature review. J Psychosom Res 2002;52:69-77.
39. Lee SY, Lee KJ, Kim SJ, Cho SW. Prevalence and risk factors for over-laps between gastroesophageal reflux disease, dyspepsia, and irritable bowel syndrome: a population-based study. Digestion 2009;79:196-201.
40. Park H. Functional gastrointestinal disorders and overlap syndrome in Korea. J Gastroenterol Hepatol 2011;26(suppl 3):12-14.
41. Corsetti M, Caenepeel P, Fischler B, Janssens J, Tack J. Impact of co-existing irritable bowel syndrome on symptoms and pathophysiological mechanisms in functional dyspepsia. Am J Gastroenterol 2004;99:1152-1159.
42. Wang A, Liao X, Xiong L, et al. The clinical overlap between functional dyspepsia and irritable bowel syndrome based on Rome III criteria. BMC Gastroenterol 2008;8:43.
43. Lee HJ, Lee SY, Kim JH, et al. Depressive mood and quality of life in functional gastrointestinal disorders: differences between functional dyspepsia, irritable bowel syndrome and overlap syndrome. Gen Hosp Psychiatry 2010;32:499-502.
44. Bennett EJ, Piesse C, Palmer K, Badcock CA, Tennant CC, Kellow JE. Functional gastrointestinal disorders: psychological, social, and somatic features. Gut 1998;42:414-420.
45. Lee SP, Sung IK, Kim JH, Lee SY, Park HS, Shim CS. The effect of emotional stress and depression on the prevalence of digestive diseases. J Neurogastroenterol Motil 2015;21:273-282.
46. Thijssen AY, Jonkers DM, Leue C, et al. Dysfunctional cognitions, anxiety and depression in irritable bowel syndrome. J Clin Gastroenterol 2010;44:e236-e241.
47. Pinto-Sanchez MI, Ford AC, Avila CA, et al. Anxiety and depression
increase in a stepwise manner in parallel with multiple FGIDs and symp-tom severity and frequency. Am J Gastroenterol 2015;110:1038-1048.
48. Foster JA, McVey Neufeld KA. Gut-brain axis: how the microbiome influences anxiety and depression. Trends Neurosci 2013;36:305-312.
49. Vanuytsel T, van Wanrooy S, Vanheel H, et al. Psychological stress and corticotropin-releasing hormone increase intestinal permeability in hu-mans by a mast cell-dependent mechanism. Gut 2014;63:1293-1299.
50. Larauche M. Novel insights in the role of peripheral corticotropin-releasing factor and mast cells in stress-induced visceral hypersensitivity. Neurogastroenterol Motil 2012;24:201-205.
51. Ivashkin VT, Poluektova EA, Glazunov AB, Putilovskiy MA, Epstein OI. Pathogenetic approach to the treatment of functional disorders of the gastrointestinal tract and their intersection: results of the Russian observation retrospective program COMFORT. BMC Gastroenterol 2019;20:2.
52. Kindt S, Van Oudenhove L, Mispelon L, Caenepeel P, Arts J, Tack J. Longitudinal and cross-sectional factors associated with long-term clinical course in functional dyspepsia: a 5-year follow-up study. Am J Gastroen-terol 2011;106:340-348.
53. Koloski NA, Talley NJ, Boyce PM. Does psychological distress modu-late functional gastrointestinal symptoms and health care seeking? A prospective, community Cohort study. Am J Gastroenterol 2003;98:789-797.
54. Alander T, Svärdsudd K, Johansson SE, Agréus L. Psychological illness is commonly associated with functional gastrointestinal disorders and is important to consider during patient consultation: a population-based study. BMC Med 2005;3:8.
55. Saito YA, Mitra N, Mayer EA. Genetic approaches to functional gastro-intestinal disorders. Gastroenterology 2010;138:1276-1285.
56. Oshima T, Toyoshima F, Nakajima S, Fukui H, Watari J, Miwa H. Genetic factors for functional dyspepsia. J Gastroenterol Hepatol 2011;26(suppl 3):83-87.
57. Saito YA. The role of genetics in IBS. Gastroenterol Clin North Am 2011;40:45-67.
58. Camilleri M, Katzka DA. Irritable bowel syndrome: methods, mecha-nisms, and pathophysiology. Genetic epidemiology and pharmacogenetics in irritable bowel syndrome. Am J Physiol Gastrointest Liver Physiol 2012;302:G1075-G1084.

159 2022 The Korean Society of Neurogastroenterology and Motility
J Neurogastroenterol Motil, Vol. 28 No. 1 January, 2022www.jnmjournal.org
TO THE EDITOR: Combined multichannel intraluminal imped-ance and pH monitoring (MII-pH) is the preferred method for assessing gastroesophageal reflux (GER) in infants, children, and adults because it permits identification and examination of both acid (pH < 4.0) and non-acid (pH ≥ 4.0) (including weakly acidic and weakly alkaline) GER events.1 Occasionally, the trac-ing of a completed 24-hour impedance-pH study will be defective. For example, one or more impedance channels may be irreparably defective or missing completely (flat line). It is particularly prob-lematic when the distal-most channel (Z6) is affected because (1) the extent of reflux bolus exposure (duration) is assessed in chan-nel Z6, and (2) the autoscan of Medical Measurement System (MMS)/Laborie (Amsterdam, The Netherlands) will not work if Z6 is missing. Even if one were to go into the channel settings and de-select channel Z6, the autoscan would not use the Z5 channel to mark impedance-detectable reflux events. Consequently, assess-ment of temporal relationships cannot not be made until the tracing is manually scanned and edited to allow impedance-detected GER events to be recognized.
Figure 1A shows an impedance waveform pattern (Z1-Z5) that illustrates a classic reflux event. In the absence of the distal channel (Z6), the MMS software algorithm will not capture any portions of the event by autoscan. However, the event can be captured manual-ly (Fig. 1B) by executing the manufacturer recommended protocol of holding down the control key (Ctrl) and then left clicking at the bottom left (1), then the top left (2), and then the bottom right (3). Release of the Ctrl key then results in a partial capture (Fig. 1C) that can be completed using standard methods (Fig. 1D). Analyses in this manner allows the software algorithm to test the temporal associations between GER events and reported symptoms (Fig. 2). Assessments of bolus exposure can be estimated based on duration of channel (Z5).
Our rescue approach allows the clinician to derive meaningful
information from the tracing without the need to subject the patient to further invasive testing. With the defective tracing featured in this article, we found (in a 4-month-old baby boy) that while the acid reflux index and total number pH probe-detected acid events (pH < 4) were in the normal range for infants (1.5% and 41, re-spectively),2 impedance data showed that greater than 80% of both acid (pH < 4, 20/24) and non-acid (pH ≥ 4, 28/33) reflux events reached the proximal esophagus (Z1 and/or Z2) and symptoms of cough were positively associated with both acid (pH < 4) (symptom association probability = 96.5%) and non-acid (pH ≥ 4) (symptom association probability = 100%) GER.
Technically imperfect studies can most often (in hindsight) be linked to difficulties with inserting the catheter; twists and bends in the catheter during placement can cause breakages in the thin wires that run the length of the catheter. Technical errors can affect just parts of the study (that can be disregarded using artefact mark-ers) or they can affect the entire study. Failure of the pH probe, for example, always requires retesting because assessment of the acid burden is a critical component of the impedance-pH report.
Frederick W Woodley1,2,3 1Center for Motility Disorders, Nationwide Children’s Hospital,
Columbus, OH, USA; 2Division of Gastroenterology, Hepatology and Nutrition, Nationwide Children’s Hospital, Columbus, OH, USA; and 3Department of Pediatrics, The Ohio State University College of
Medicine, Columbus, OH, USA
1. Tutuian R, Castell DO. Review article: complete gastro-oesophageal reflux monitoring - combined pH and impedance. Aliment Pharmacol Ther 2006;24 (suppl 2):27-37.
2. Vandenplas Y, Goyvaerts H, Helven R, Sacre L. Gastroesophageal reflux, as measured by 24-hour pH monitoring, in 509 healthy infants screened for risk of sudden infant death syndrome. Pediatrics 1991;88:834-840.
Financial support: None.
Conflicts of interest: None.
Missing the Distal-most [Z6] Impedance Channel? The Study Can Be Salvaged!
JNMJ Neurogastroenterol Motil, Vol. 28 No. 1 January, 2022pISSN: 2093-0879 eISSN: 2093-0887https://doi.org/10.5056/jnm21069
Letter to the EditorJournal of Neurogastroenterology and Motility

160
Letter to the Editor
Journal of Neurogastroenterology and Motility 160
1
2
3
A B
C D
Figure 1. Tagging an impedance-detect-ed GER event when the distal imped-ance channel (Z6) has malfunctioned. (A) Red arrow highlights the defective Z6 waveform which is evidenced by a flat-line. The black arrows indicate di-rectional intraluminal flow of reflux within the esophagus. Green arrow highlights empty Z6 channel. (B) Numbers and short blue arrows mark the execution points (left clicks) in the protocol for manually tag-ging an impedance-detected event using the MMS system. (C, D) Panels illus-trate the partial and completed tagging, respectively, of Z6-less impedance event. (C) The dotted-line arrows graphically illustrate the direction in which the trac-ing editor would right click and pull the appropriate lollipop; the left lollipop in channel Z1 would be pulled to the left and the right lollipops in Z3 and Z5 would be pulled to the right.
7:32:20
7:34:03
A
B
Figure 2. Non-acid reflux event is temporally associated with cough. (A) Graphically illustrates a non-acid reflux event that occurred (at 7:32:20) (blue arrow) just prior to a downstream cough (at 7:34:03) (red arrows). (B) Shows that the reflux event that occurred at 7: 32:20 is temporally associated (black ar-row) with a cough episode that occurred at 7:34:03, following an editing event described herein.

161 2022 The Korean Society of Neurogastroenterology and Motility
J Neurogastroenterol Motil, Vol. 28 No. 1 January, 2022www.jnmjournal.org
TO THE EDITOR: We read with interest the article on esophageal motility patterns after peroral endoscopic myotomy (POEM) in achalasia.1 We appreciate the authors’ effort to maintain such a large database and a concise presentation. However, we like to draw atten-tion to certain points that we believe might help the readers to un-derstand how much recovery of peristalsis does occur after POEM in these patients more truthfully. The authors have taken the liberty of using the term “recovery of peristalsis,” by defining a mere 3-cm long isobaric contour integrity of 20 mmHg. The Chicago clas-sification versions 3.0 and 4.02,3 define peristalsis as a coordinated contraction with normal distal latency (DL; ie, ≥ 4.5 seconds) and normal distal contractile integral (ie, ≥ 450 mmHg∙sec∙cm). Any contraction not fulfilling these criteria, particularly the DL criteria, cannot be labeled as peristalsis; hence, the term “peristaltic recov-ery” is misleading as even a simultaneous contraction of adequate amplitude may be misunderstood as peristaltic. It would also be overtly reassuring to an interventionist as well as to the patients.
A significant proportion of patients were labeled as esopha-gogastric junction outflow obstruction (EGJOO) after POEM, especially for achalasia types 2 and 3. It is also essential to ensure whether a normal peristalsis was seen in these patients or simultane-ous contractions fulfilling the arbitrary criteria were labeled as nor-mal peristalsis to diagnose EGJOO. In fact, diagnosis of EGJOO as per standard Chicago classification requires presence of normal peristalsis, which needs to have a DL of ≥ 4.5 seconds. Similar is-sue can be raised about the finding of “fragmented peristalsis” after POEM in these patients. The authors have rightly conceded that impedance data showing a post-POEM improvement in esopha-geal emptying would have been critical in the interpretation of these findings. The standard of care suggests the need for documenting adequate esophageal emptying on timed barium esophagogram as an evidence of adequacy of treatment for achalasia.
Moreover, some studies quoted by the authors are either feline
studies4 or have used conventional manometry to look for peri-stalsis,5,6 which is not as accurate as high-resolution manometry in analyzing esophageal motility, especially after an intervention.
In conclusion, it is well known that a proportion of patients have altered peristalsis after intervention in achalasia; however, the data provided by the authors are not adequately convincing to sug-gest that normal esophageal peristalsis returns after POEM for achalasia.
Akshay Kulkarni, Anshuman Elhence, and Uday C Ghoshal*Department of Gastroenterology, Sanjay Gandhi Post Graduate Institute
of Medical Sciences, Lucknow, India
1. Vackova Z, Mares J, Krajciova J, et al. Esophageal motility patterns after peroral endoscopic myotomy in patients with achalasia. J Neurogastroen-terol Motil 2021;27:205-214.
2. Kahrilas PJ, Bredenoord AJ, Fox M, et al. The Chicago classifica-tion of esophageal motility disorders, v3.0. Neurogastroenterol Motil 2015;27:160-174.
3. DeLay K, Yadlapati R, Pandolfino JE. Chicago classification of esopha-geal motility disorders: past, present, and future. Indian J Gastroenterol 2021;40:120-130.
4. Schneider JH, Peters JH, Kirkman E, Bremner CG, DeMeester TR. Are the motility abnormalities of achalasia reversible? An experimental outflow obstruction in the feline model. Surgery 1999;125:498-503.
5. Zaninotto G, Costantini M, Anselmino M, BoccùC, Ancona E. Onset of oesophageal peristalsis after surgery for idiopathic achalasia. Br J Surg 1995;82:1532-1534.
6. Patti MG, Galvani C, Gorodner MV, Tedesco P. Timing of surgical in-tervention does not influence return of esophageal peristalsis or outcome for patients with achalasia. Surg Endosc 2005;19:1188-1192.
Financial support: None.
Conflicts of interest: None.
Author contributions: Akshay Kulkarni, Anshuman Elhence, and
Uday C Ghoshal conceptualized the letter, wrote and edited it, and
approved the final version.
Peristaltic Recovery After Peroral Endoscopic Myotomy for Achalasia: Dream or Reality?
JNMJ Neurogastroenterol Motil, Vol. 28 No. 1 January, 2022pISSN: 2093-0879 eISSN: 2093-0887https://doi.org/10.5056/jnm21136
Letter to the EditorJournal of Neurogastroenterology and Motility
162 2022 The Korean Society of Neurogastroenterology and Motility
J Neurogastroenterol Motil, Vol. 28 No. 1 January, 2022www.jnmjournal.org
TO THE EDITOR: We would like to thank the authors of the Let-ter to the Editor1 for constructive comments and important issues raised regarding our analysis of post-peroral endoscopic myotomy (POEM) esophageal motility.2 We were aware that the term “partial peristaltic recovery” used in the article to describe the re-appeared contractile activity in the esophagus after POEM in patients with achalasia is not precisely accurate in terms of fulfilling the functional criteria of peristalsis. That was the reason for the use of the term “partial.” However, it must be said, that the “partial peristaltic re-covery” should have been used more consistently instead of replac-ing it with just “peristaltic recovery”; maybe the term “contractile activity” would have been more appropriate. Anyhow, we decided to use this term because it seemed to better express to the reader the character of the significant change observed in the esophageal mo-tility after the intervention, but we also conceded this as a limitation of the study in the discussion.
Although the Chicago classification (CC) has a specific defini-tion for normal peristalsis requiring the distal latency of at least 4.5 seconds, we were often unable to accurately measure this parameter, as the post-POEM contraction is in most of the cases situated in the mid esophagus and does not reach all the way to the 3 cm above the lower esophageal sphincter (where the contractile deceleration point is placed) after the myotomy, also in some cases the contrac-tion were partially peristaltic and partially simultaneous. Regarding the distal contractile integral, we used the cutoff 100 mmHg∙sec∙cm for absent or present contraction.3 For the esophagogastric junction outflow obstruction (EGJOO), we did review the patients with EGJOO after POEM again and we would like to correct that 6/18 did indeed have the distal contractile integral less than 450
mmHg∙sec∙cm (so not fulfilling the newest criteria of EGJOO in CC version 4.0),4 the rest was over this threshold. Nevertheless, some motility patterns after POEM were difficult to classify within the CC for obvious reasons, which was also stated in out manuscript as limitation.
Regarding other functional testing after POEM, we do per-form timed barium esophagogram routinely after POEM. Al-though helpful, neither the timed barium esophagogram is a perfect method for assessment of the role of peristalsis on esophageal emp-tying, because even patients with complete symptomatic relief after treatment may present with some level of stagnation of the contrast solution, most probably due to the impaired peristalsis and the solu-tion clinging to the esophageal wall of the deviated lumen.
To clear our intent, the term “partial peristaltic recovery” should have expressed more comprehensively of what we see on the post-POEM high-resolution manometry tracings––and that is a partial contraction that was not seen or visible before the treatment within the pressurizations due to the esophagogastric junction obstruction, even though the rigorous criteria of peristalsis might not have been fulfilled completely in all cases. From our personal experience, we are not convinced that normal or intact peristalsis per se can return or re-appear in the esophagus in patients with developed achalasia irrespective of treatment used. What we see is most probably just remnants of the previous peristaltic contraction, that are not fully functionally sufficient to propel the bolus. And thus, we fully agree with the authors of the letter, that the true peristaltic recovery is rather a dream than a reality and the term peristalsis should have been used more cautiously.
Peristaltic Recovery After Peroral Endoscopic Myotomy for Achalasia: Dream or Reality?: Author‘s Reply
JNMJ Neurogastroenterol Motil, Vol. 28 No. 1 January, 2022pISSN: 2093-0879 eISSN: 2093-0887https://doi.org/10.5056/jnm21157
Letter to the EditorJournal of Neurogastroenterology and Motility

163
Letter to the Editor
Vol. 28, No. 1 January, 2022 (162-163) 163
Zuzana Vackova,1* Jan Mares,1 Jana Krajciova,1 Zuzana Rabekova,1 Lucie Zdrhova,2 Pavla Loudova,3 Julius Spicak,1 Petr Stirand,1
Tomas Hucl,1 and Jan Martinek1
1Department of Hepatogastroenterology, Institute for Clinical and Experimental Medicine, Prague, Czech Republic; 2Department of Internal
Medicine, University Hospital Plzen, Pilsen, Czech Republic; and 3Department of Gastroenterology, Hospital Kolin, Kolin, Czech Republic
1. Kulkarni A, Elhence A, Ghoshal UC. Peristaltic recovery after peroral endoscopic myotomy for achalasia: dream or reality? J Neurogastroenterol Motil 2022;28:161.
2. Vackova Z, Mares J, Krajciova J, et al. Esophageal motility patterns after peroral endoscopic myotomy in patients with achalasia. J Neurogastroen-
terol Motil 2021:27:205-214.3. Kahrilas PJ, Bredenoord AJ, Fox M, et al. The Chicago classifica-
tion of esophageal motility disorders, v3.0. Neurogastroenterol Motil 2015;27:160-174.
4. Yadlapati R, Kahrilas PJ, Fox MR, et al. Esophageal motility disorders on high-resolution manometry: Chicago classification version 4.0. Neu-rogastroenterol Motil 2021;33:e14058.
Financial support: None.
Conflicts of interest: None.
164 2022 The Korean Society of Neurogastroenterology and Motility
J Neurogastroenterol Motil, Vol. 28 No. 1 January, 2022www.jnmjournal.org
TO THE EDITOR: We read with great interest the recent study by Jung et al1 entitled “A systematic review and meta-analysis of randomized control trials: combination treatment with proton pump inhibitor plus prokinetic for gastroesophageal reflux disease.” The authors are commended for a well-written paper involving 16 randomized control trials with 1446 participants. The authors con-cluded that in patients with gastroesophageal reflux disease a com-bination therapy of prokinetic with proton pump inhibitor is better than proton pump inhibitor alone. While we have great appreciation for the work conducted by the authors there some methodological aspects of this study that we feel need to be pointed out.
Firstly, the authors mentioned that this study was performed in accordance with the Preferred Reporting Items for Systematic reviews and Meta-Analyses (PRISMA) guidelines, however a protocol was not registered in the International Prospective Register of Systematic Reviews (PROSPERO) or any other similar registry such as Cochrane Library and International Platform of Registered Systematic Review and Meta-analysis Protocols (INPLASY).2 Registration promotes transparency in the review process, it helps in minimizing the risk of outcome and reporting bias and prevents identical systematic reviews from being performed.3
Secondly, the authors mentioned that EMBASE, Cochrane Li-brary, PubMed databases were searched for this study, but they are not enough. For a more comprehensive search the authors should have included other databases such as BIOSIS preview, NLM Gateway, clinicaltrails.gov, and grey literature in their search strat-egy. Furthermore, the authors failed to provide the search string for this study thus affecting the reproducibility of the search methods.
Thirdly, the authors failed to evaluate the risk of publication bias. Recognition of publication bias is an important step when con-ducting a meta-analysis, publication bias also referred to as the “file-drawer problem” is often attributed to unpublished or unreported clinical studies which have not been published since they report negative or not significant results leading to a higher proportion of studies with significant results being published.4 Publication bias overestimates the potential benefits of an interventions and leads to
misrepresentation of adverse effects of a therapeutic modality. Pres-ence of publication bias in systematic review and meta-analysis is problematic as such a bias may invalidate the conclusions reached.5 Some commonly utilized tools to assess this bias are funnel plot, Egger’s Regression test, and Duval and Tweedie’s trim and fill.6,7 In the present study an evaluation for publication bias would have significantly improved the credibility of findings.
We hope that the authors will address the concerns raised which will only serve to benefit the research community at large. We once again would like to congratulate the authors on their findings.
Muhammad Ali Tariq* and Bilal Ahmed Department of Internal Medicine, Dow University Hospital, Dow
International Medical College, Karachi, Pakistan
1. Jung DH, Huh CW, Lee SK, Park JC, Shin SK, Lee YC. A Systematic review and meta-analysis of randomized control trials: combination treat-ment with proton pump inhibitor plus prokinetic for gastroesophageal reflux disease. J Neurogastroenterol Motil 2021;27:165-175.
2. Liberati A, Altman DG, Tetzlaff J, et al. The PRISMA statement for reporting systematic reviews and meta-analyses of studies that evaluate healthcare interventions: explanation and elaboration. BMJ 2009;339:b2700.
3. Moher D, Booth A, Stewart L. How to reduce unnecessary duplication: use PROSPERO. BJOG 2014;121:784-786.
4. Lin L, Chu H. Quantifying publication bias in meta-analysis. Biometrics 2018;74:785-794.
5. Sutton AJ, Song F, Gilbody SM, Abrams KR. Modelling publication bias in meta-analysis: a review. Stat Methods Med Res 2000;9:421-445.
6. Shi L, Lin L. The trim-and-fill method for publication bias: practical guidelines and recommendations based on a large database of meta-analyses. Medicine (Baltimore) 2019;98:e15987.
7. Egger M, Smith GD, Schneider M, Minder C. Bias in meta-analysis detected by a simple, graphical test. BMJ 1997;315:629-634.
Financial support: None.
Conflicts of interest: None.
Author contributions: Muhammad Ali Tariq and Bilal Ahmed
equally contributed in writing the manuscript. Both authors approve
the final draft of the manuscript.
Combination Treatment With Proton Pump Inhibitor Plus Prokinetic for Gastroesophageal Reflux Disease
JNMJ Neurogastroenterol Motil, Vol. 28 No. 1 January, 2022pISSN: 2093-0879 eISSN: 2093-0887https://doi.org/10.5056/jnm21134
Letter to the EditorJournal of Neurogastroenterology and Motility

165 2022 The Korean Society of Neurogastroenterology and Motility
J Neurogastroenterol Motil, Vol. 28 No. 1 January, 2022www.jnmjournal.org
TO THE EDITOR: Combined multichannel intraluminal imped-ance and esophageal pH (MII-pH) monitoring is the preferred method for assessing gastroesophageal reflux (GER) because it permits (1) detection and analysis of both acid (pH < 4.0) and non-acid (pH ≥ 4.0) GER, and (2) monitoring of proximal extent of individual GER events.1 The duration of a GER episode is al-ways assessed in the distal-most impedance channel (Z6) because total bolus exposure is greatest nearest the lower esophageal sphinc-ter. By definition, a GER episode begins when impedance drops to 50% of baseline (Z6) and is cleared when impedance again ascends to ≥ 50% of baseline (Z6). By convention, an impedance-detected event is not counted if the duration is not ≥ 5 seconds.2,3 MII-pH software uses these guidelines to run preliminary GER autoscans to reduce observer burden. Due to low autoscan specificity, expert opinion has recommended against analysis of MII-pH tracings using only the autoscan feature for infants and children.4 They also suggest that automated GER detection needs to be refined by con-sensus in order to derive meaningful autoscan results.4 It is impor-tant to note that automated analysis overestimates the frequency of reflux events, in particular, non-acid GER events.4-7
Occasionally, the MII-pH autoscan will mark an event that, on first glance, appears to be a legitimate single reflux event (for example, Figure A) but upon further inspection, it becomes clear that the software algorithm actually combined 2 events. This hap-pens when the impedance waveform in the distal channel of the first event does not reach 50% of baseline before the overlapping second event enters the esophagus (Figure B). In this particular example, separation results in 2 GER events with durations that are both less than 5 seconds (3.9 seconds and 4.3 seconds). Figure C depicts a contour plot that confirms the conjoined/superimposed event. This image was captured as part of an assessment of a 3-week-old male who was referred to our facility for symptoms suggestive of GER.
Loots and colleagues4 reported that the majority of MII-pH observers in their inter- and intra-observer study indicated that they tag GER events that fail to meet accepted guidelines because they felt that the guidelines were inadequate. While the specific guidelines that were ignored were not detailed, it is likely that these would include (1) minimum duration of 5 seconds, and (2) the re-quirement for the impedance waveform in the Z6 channel to reach 50% of baseline to signal the end of bolus clearance. There are likely many instances wherein an observer who frequently assesses MII-pH tracings will encounter a GER episode during which the duration in the distal channel is less than 5 seconds, and/or the base-line impedance is low and the 50% baseline target is not achieved. Because determining the frequency of GER is an important com-ponent of the MII-pH report, the event described here provides an example of where revisiting the impedance tracing analysis guidelines to include GER events wherein (1) bolus duration is < 5 seconds, and (2) the end of bolus clearance is not 50% of baseline.
Our experience has been that when one of these conjoined/superimposed events is encountered in a tracing, the observer can usually expect to see others. To our knowledge, this is the first time that a non-acid re-reflux/superimposed event has ever been report-ed. Previous reports have described re-reflux/superimposed events as being associated only with acid reflux.2,8-10 Additional investiga-tion is needed to further examine the potential clinical value of these events as they may relate to the pathogenesis of GER disease in in-fants, in particular, who experience large numbers of non-acid GER events and have underdeveloped reflux barriers.
Frederick W Woodley1,2,3
1Center for Motility Disorders, Nationwide Children’s Hospital, Columbus, OH, USA; 2Division of Gastroenterology, Hepatology
and Nutrition, Nationwide Children’s Hospital, Columbus, OH, USA; and 3Department of Pediatrics, The Ohio State University College of
Medicine, Columbus, OH, USA
Superimposed Non-acid Reflux Event: An Example of When It May Be Important to Revisit the Impedance Analysis Guidelines
JNMJ Neurogastroenterol Motil, Vol. 28 No. 1 January, 2022pISSN: 2093-0879 eISSN: 2093-0887https://doi.org/10.5056/jnm21172
Letter to the EditorJournal of Neurogastroenterology and Motility

166
Letter to the Editor
Journal of Neurogastroenterology and Motility 166
1. Safe M, Cho J, Krishnan U. Combined multichannel intraluminal impedance and pH measurement in detecting gastroesophageal reflux disease in children. J Pediatr Gastroenterol Nutr 2016;63:e98-e106.
2. Shay S, Tutuian R, Sifrim D, et al. Twenty-four hour ambulatory simul-taneous impedance and pH monitoring: a multicenter report of normal values from 60 healthy volunteers. Am J Gastroenterol 2004;99:1037-1043.
3. Skopnik H, Silny J, Heiber O, Schulz J, Rau G, Heimann G. Gastro-esophageal reflux in infants: evaluation of a new intraluminal impedance technique. J Pediatr Gastroenterol Nutr 1996;23:591-598.
4. Loots CM, van Wijk MP, Blondeau K, et al. Interobserver and intrao-bserver variability in pH-impedance analysis between 10 experts and automated analysis. J Pediatr 2012;160:441-446, e1.
5. Wenzl TG, Benninga MA, Loots CM, Salvatore S, Vandenplas Y; ESPGHAN EURO_PIG Working Group. Indications, methodology, and interpretation of combined esophageal impedance-pH monitoring in children: ESPGHAN EURO-PIG standard protocol. J Pediatr Gas-troenterol Nutr 2012;55:230-234.
6. Ravi K, DeVault KR, Murray JA, Bouras EP, Francis DL. Inter-observ-er agreement for multichannel intraluminal impedance-pH testing. Dis Esophagus 2010;23:540-544.
7. Roman S, Bruley des Varannes S, Pouderoux P, et al. Ambulatory 24-h oesophageal impedance-pH recordings: reliability of automatic analysis for gastro-oesophageal reflux assessment. Neurogastroenterol Motil 2006;18:978-986.
8. Shay SS, Johnson LF, Richter JE. Acid rereflux: a review, emphasizing detection by impedance, manometry, and scintigraphy, and the impact on acid clearing pathophysiology as well as interpreting the pH record. Dig Dis Sci 2003;48:1-9.
9. Sifrim D, Castell D, Dent J, Kahrilas PJ. Gastro-oesophageal reflux monitoring: review and consensus report on detection and definitions of acid, non-acid, and gas reflux. Gut 2004;53:1024-1031.
10. Shin MS. Esophageal pH and combined impedance-pH monitoring in children. Pediatr Gastroenterol Hepatol Nutr 2014;17:13-22.
Acknowledgements: The author would like to thank Jason
Schmidt and Peter Lu MD at Nationwide Children’s Hospital for
technical assistance and review of the manuscript, respectively, and
to Rodrigo Strehl Machado MD-PhD at the Universidad de Sao Paulo
for review of the manuscript.
Financial support: None.
Conflicts of interest: None.
A B
C
3.9sec
4.3sec
8.2sec
Figure. Superimposed non-acid gastroesophageal reflux event se-parated during the manual analysis. (A) It shows the suboptimal autoscan marking that combined 2 non-acid gastroesophageal reflux (GER) events. (B) It shows the manual separation to produce 2 non-acid GER events with durations below the 5 second guideline. (C) It is a contour plot supporting the “re-reflux/conjoined/superimposed” relationship of the 2 events.

Journal of Neurogastroenterology and Motility
Ethical Policies of the Journal of Neurogastroenterology and Motility
JNM
Article 1 (Purpose)
Article 2 (Researcher Ethics)
Article 3 (Research Ethics Council)
The purpose of these regulations is to establish and observe research ethics for research papers submitted to the Journal of
Neurogastroenterology and Motility.
1. For consideration of research ethics and related issues, the Journal operates a Research Ethics Council (the Council hereafter).
2. Chairperson of the Publication Committee of Korean So-ciety of Neurogastroenterology and Motility (KSNM) is
the Chair of the Council. The constitution of the Council is decided by the Publication Committee of KSNM.
3. Operation of the Council follows separate regulations de-cided by the Council.
1. Researchers should be honest about their research. Re-searchers need to have a high ethical standard at all times during the research, in areas such as receiving funds for research, publishing research results, and fairly compensat-ing participants. More specifically, research papers that are forged, altered, plagiarized, overlapped, and/or dishonest cannot be published either online or in journals and are not eligible for research funds.1) Forgery, Alteration, Plagiarism
(1) Forgery: making up data or research results that do not exist.
(2) Alteration: fabricating research materials, equipment, or processes, or changing/deleting research results intentionally to distort research contents or results.
(3) Plagiarism: using others’ ideas, research (process and contents), and/or results without proper authorization or citation.
2) Overlap Publication and Dishonest Research(1) Publishing research papers that contain the same or
similar contents to that which were/are published in other journals or books, or publishing research papers that are/were published in other journals or books.
(2) Multiple or duplicate publication can be allowed after a review from the Publication Council, if it is qualified under the Uniform Requirements for Manuscripts Submitted to Biomedical Journals (http://www.icmje. org).
(3) Wrongful Research Paper Author Indication: either refusing to grant a qualification to publish (without proper reasons) to a person who contributed to science and/or technology with his/her research contents or results, or granting qualification to publish to a person who did not contribute to science and/or technology because of a wish to express appreciation or honor.
2. If a research object is human, researchers should follow the Declaration of Helsinki (http://www.wma.net). Details are as follows:
(1) Researchers should fully explain the purpose and methods of research as well as any possible mental and physical harm that could occur during research par-ticipation. If he/she is to publish the research results, he/she has to indicate that on the paper.
(2) Researchers cannot write down participants’ names or initials. In case of possible disclosure of participants’ identification through pictures of face or anything similar, researchers should receive written informed consent from the participants or their guardians.
(3) Researchers should receive an approval from Institu-tional Review Board and indicate it on the paper if one wishes to publish the research results.
(4) Any research that deals with clinical trials should be registered to the primary national clinical trial regis-tration site such as http://ncrc.cdc.go.kr/cris, or other sites accredited by the WHO or the International Committee of Medical Journal Editors.
3. If a research object is animal, researchers should follow these general rules:
(1) Researchers should indicate what he/she did to mini-mize the pain or discomfort that experiment subjects went through.
(2) Researchers should indicate that he/she did not violate NIH guideline (NIH Guide for the Care and Use of Laboratory Animals).
(3) When necessary, the Society can ask for a written con-sent and an approval letter issued by Animal Ethics Committee.
4. Conflict of interests or financial support should be indicated on the paper.

JNMArticle 4 (Role of the Council)
Article 5 (Administration of Research Ethics Violation)
Article 6
The roles of the Research Ethics Council are as follows.1. The Council reviews research ethics issued from the pub-
lication of the Journal and related papers (original articles, review articles, and others).
2. The Council reviews any forgery, alteration, plagiarism, wrongful research paper author indication, or multiple or duplicate publication allegations for published papers and brings the results to the Executive Committee of KSNM.
1. When research ethics violations occur, the chair of the Council should call a meeting immediately to review the situation, and report the results to the executive committee.
2. The Council should keep any investigation of ethics viola-tions confidential, and should not oppose the interests of the Journal.
3. Upon completion of the investigation, the Council decides the level of punishment appropriate for the violator (author or corresponding author) based on the level of violation - the Council can prohibit publication to the Journal for a speci-
fied time or exclude the violator permanently.4. The Council keeps a record of the investigation and the re-
sults of ethical misconduct.5. If the Council confirms ethical misconduct in a paper, the
executive committee announces the case and disapproves the publication of the paper in the Journal. If the paper is already published in the Journal, the paper will be deleted from the paper list of the Journal and this will be announced to the members of the Journal, as well as to related academic institutions.
Any other cases that are not indicated in this regulation should follow the Uniform Requirements for Manuscripts Submitted
to Biomedical Journals: Writing and Editing for Biomedical Publication (http://www.icmje.org).
Measurements and Units of Measure
ACTH adrenocorticotropic hormone (adrenocorticotropin)ADP adenosine diphosphateADPase adenosine diphosphataseALT alanine aminotransferaseAMP adenosine monophosphateanti-HAV antibody to hepatitis A virusanti-HBc antibody to hepatitis B core antigenanti-HBe antibody to hepatitis B e antigenanti-HBs antibody to hepatitis B surface antigenanti-HDV antibody to hepatitis D (delta) virusAST aspartate aminotransferaseATP adenosine triphosphateATPase adenosine triphosphataseBUN blood urea nitrogencAMP adenosine 3’,5’-cyclic monophosphatecDNA complementary DNAcGMP guanosine 3’,5’-cyclic monophosphateCNS central nervous systemCT computed tomographyDNA deoxyribonucleic acid (deoxyribonucleate)EDTA ethylenediaminetetraacetic acidHAV hepatitis A virusHBcAg hepatitis B core antigenHBeAg hepatitis B e antigenHBsAg hepatitis B surface antigenHBV hepatitis B virus
HCV hepatitis C virusHDV hepatitis D (delta) virusH&E hematoxylin and eosinHIV human immunodeficiency virusHLA human leukocyte antigenIg immunoglobulinIL interleukinIFN interferonKm Michaelis constantMHC major histocompatibility complexMRI magnetic resonance imagingmRNA messenger RNANANB non-A, non-B (hepatitis)NSAID nonsteroidal anti-inflammatory drugPG prostaglandinPGI prostacyclinPNS peripheral nervous systemRNA ribonucleic acidTGF transforming growth factorTNF tumor necrosis factorTXA2 thromboxane A2UDCA ursodeoxycholic acidVIP vasoactive intestinal polypeptidevol volumevs versuswt weight
Combining Prefixes T tera- (1012) G giga- (109) M mega- (106) k kilo- (103) h hecto- (102) da deca- (101) d deci- (10-1) c centi- (10-2) m milli- (10-3) m micro- (10-6) n nano- (10-9) p pico- (10-12) f femto- (10-15) a atto- (10-18)
Units A ampere(s) Å angstrom(s)
cal calorie(s) CFU colony-forming unit(s) C coulomb(s) cpm counts per minute cps counts per second cm3 cubic centimeter(s) (not cc) Ci Curie(s) cycle/min cycles per minute cycle/sec cycles per second Da dalton(s) day(s) day(s) (do not abbreviate) dL deciliter oC degree(s) Celsius d density dpm disintegrations per minute dps disintegrations per second eV electron volt(s) Eq equivalent(s) oF degree(s) Fahrenheit
Journal of Neurogastroenterology and Motility
Abbreviation, Acronyms and Short NamesJNMJournal of Neurogastroenterology and Motility provides a list of the official abbreviations. Otherwise, any unofficial abbreviation should be used where they appear in the text at least three times, and be explained in parentheses at the first time in the text. Do not use abbreviation(s) in the title.

F farad ft foot G gauss g gram(s) t1/2 half-life H henry(ies) Hz hertz hr hour(s) in inch(es) IU international unit(s) J joule(s) K kelvin kcal kilocalorie(s) kDa kilodalton(s) kg kilogram(s) L liter(s) × magnification m meter(s) mg microgram(s) mL microliter(s) mm micrometers (do not use microns) msec microsecond(s) mL milliliter(s) mmHg millimeter(s) of mercury min minute(s) mo month(s) mol/L molar mol mole(s) msec millisecond(s)
Ω ohm(s) osm osmole(s) oz ounces(s) Pa pascal(s) lb pound(s) psi pound-force per square inch rpm revolutions per minute rps revolutions per second sec second(s) U unit(s) V volts(s) W watt(s) wk week(s) yr year(s)
Statistical Terms ANOVA analysis of variance CI confidence interval r correlation coefficient df degrees of freedom x mean NS not significant n number of observations OR odds ratio p probability SD standard deviation SE standard error SEM standard error of the mean F variance ratio
General Information
Drug names. Please use generic names wherever possible. If a trade name drug was used in the study being reported, please cite the trade name in parentheses, along with the manufacturer’s name and location.Chemical names. Chemical names should be spelled and styled according to the Merck Index, 10th edition.Manufacturers. When the use of specific scientific equipment or other products is cited in the manuscript, the manufacturer’s full name, city, and state (or country) should be given in parentheses immediately after the citation. If other equipment or products from the same manufacturer are cited later in the paper, the manufacturer’s name only should be given in parentheses.

Journal of Neurogastroenterology and Motility
Instructions to AuthorsJNM
Journal of Neurogastroenterology and Motility is a joint official journal of the Korean Society of Neurogastroenterology and Motility, the Thai Neurogastroenterology and Motility Soci-ety, the Japanese Society of Neurogastroenterology and Motil-ity, the Indian Motility and Functional Disease Association, the Chinese Society of Gastrointestinal Motility, the South East Asia Gastro-Neuro Motility Association, the Taiwan Neurogastroenterology and Motility Society and the Asian Neurogastroenterology and Motility Association. The Journal publishes Editorials, Reviews, Technique Review, Original Articles, and Letters to the Editor in the field of neurogastro-enterology and motility. Submissions are accepted only on the understanding that they have not been submitted elsewhere and have not been and will not be published elsewhere. All submitted papers are peer-reviewed before it is decided wheth-er they could be accepted, rejected, or returned for revision. The Journal reserves the right to edit the language of papers accepted for publication for clarity and correctness, and to make formal changes to ensure compliance with this journal.
Journal of Neurogastroenterology and Motility publishes quarterly peer-reviewed articles on the 30th of January, April, July, and October in English, in printed and electronic versions. Manu-scripts should be submitted via online through website (http://www.jnmjournal.org). Authors can also find the Copyright Assignment Form and Author’s Checklist at website. The Journal follows the Uniform Requirements for Manuscripts Submitted to Biomedical Journals: Writing and Editing for Biomedical Publication (http://www.icmje.org/) and Good Publication Practice Guidelines for Medical Journals (http://kamje.or.kr/data/guidelines.pdf). Authors are recommended to consult the Medical Terminology Book (http://term.kma.org/). So far there is no article processing charge. However, this policy could be changed in the future.
The Editorial OfficeJournal of Neurogastroenterology and Motility, Room 305, Lotte Gold Rose Vill II, 31 Seolleung-ro 86-gil, Gangnam-gu, Seoul 06193, Korea
1. Researchers should be honest about their research. Resear-chers need to have a high ethical standard at all times during the research, in areas such as receiving funds for research, publishing research results, and fairly compensating par-ticipants. More specifically, research papers that are forged, altered, plagiarized, overlapped, and/or dishonest cannot be published either online or in journals and are not eligible for research funds.1) Forgery, Alteration, Plagiarism
(1) Forgery: making up data or research results that do not exist.
(2) Alteration: fabricating research materials, equipment, or processes, or changing/deleting research results intentionally to distort research contents or results.
(3) Plagiarism: using others’ ideas, research (process and contents), and/or results without proper authorization or citation.
2) Overlap Publication and Dishonest Research(1) Publishing research papers that contain the same or
similar contents to that which were/are published in other journals or books in the Society’s memoir, or publishing research papers that are/were published in the Society’s memoir in other journals or books.
(2) Multiple or duplicate publication can be allowed after a review from the Publication Council, if it is qualified under the Uniform Requirements for Manuscripts Sub-mitted to Biomedical Journals (http://www.icmje.org).
(3) Wrongful Research Paper Author Indication: either refusing to grant a qualification to publish (without proper reasons) to a person who contributed to science and/or technology with his/her research contents or results, or granting qualification to publish to a person who did not contribute to science and/or technology because of a wish to express appreciation or honor.
2. If a research object is human, researchers should follow the Declaration of Helsinki (http://www.wma.net). Details are as follows:
(1) Researchers should fully explain the purpose and methods of research as well as any possible mental and physical harm that could occur during research par-ticipation. If he/she is to publish the research results, he/she has to indicate that on the paper.
(2) Researchers cannot write down participants’ names or initials. In case of possible disclosure of participants’ identification through pictures of face or anything similar, researchers should receive written informed consent from the participants or their guardians.
(3) Researchers should receive an approval from Institu-tional Review Board and indicate it on the paper if one wishes to publish the research results.
(4) Any research that deals with clinical trials should be registered to the primary national clinical trial regis-tration site such as http://ncrc.cdc.go.kr/cris, or other sites accredited by the WHO or the International Committee of Medical Journal Editors.
3. If a research object is animal, researchers should follow these general rules:
(1) Researchers should indicate what he/she did to mini-mize the pain or discomfort that experiment subjects went through.
(2) Researchers should indicate that he/she did not violate NIH guideline (NIH Guide for the Care and Use of Laboratory Animals).
(3) When necessary, the Society can ask for a written con-sent and an approval letter issued by Animal Ethics Committee.
4. Conflicts of interest or financial support should be indicated on the paper.
5. Corrections of Errors The Journal will publish corrections when errors could
affect the interpretation of data or information. When the error is made by the author, the term “Corrigendum” will be used; when the error is made by the Publisher, the term “Erratum” will be used.
Research Ethics Regulations

COVER LETTERThe corresponding author must give written assurance that neither the submitted material nor its portions thereof have been published previously or are under consideration for pub-lication by this or other journals.
AUTHORSHIPAll authors must have made a significant intellectual contribu-tion to the manuscript according to the criteria formulated by the International Committee of Medical Journal Editors. Each author should have participated sufficiently in the work to take public responsibility for the content. Authorship credits should be based only on substantial contributions to: (a) conception and design, or analysis and interpretation of data; (b) drafting the article or revising it critically for important intellectual con-tent; and (c) final approval of the version to be published. Participation solely in the acquisition of funds or the collection of data does not justify authorship. General supervision of the research group is not sufficient for authorship. The role played by each author should be described on the cover page (eg, in planning and/or conducting the study, collecting and/or inter-preting data, and/or drafting the manuscript). The correspond-ing author is responsible for all aspects of the manuscript.All authors (necessarily first author and corresponding au-thor) are required to provide his/her “Open Researcher and Contributor ID (ORCID),” when submitting a manuscript to Journal of Neurogastroenterology and Motility. During the sub-mission process, authors will have the option to either create an ORCID ID or associate an existing ORCID ID to their ac-count. To learn more about ORCID, please visit https://orcid.org/about.Any changes to the list of authors after submission, such as a change in the order of the authors or the deletion or addition of authors, need to be approved, following the submission of a letter requesting the change signed by all listed authors and from the author(s) to be removed or added. Such changes should be explained in writing to the editor in a letter or email from the corresponding author.It is the responsibility of the authors to determine the order of authorship. Journal of Neurogastroenterology and Motility will not and cannot take any part in adjudicating authorship disputes.
COPYRIGHTIn view of copyright laws, accepted papers must be accompa-nied by completed assignment forms. These forms are avail-able on the website http://www.jnmjournal.org/file/Copyright_form.pdf. Papers will only be published once the copyright is completed. The authors grant the Korean Society of Neuro-gastroenterology and Motility to own the full copyright of the final version of the paper by copyright transfer with sign of all authors.
PEER REVIEW AND ACCEPTANCEAcceptance of a manuscript in the Journal of Neurogastroenterol-ogy and Motility is determined through a rigorous peer-review-ing process. After the Editor-in-Chief and Executive editors assign an editor, the assigned editor sends the manuscript to 2 or more referees (except Editorials and Letters to the Editor)
for peer-review. The assigned referees review the manuscript and their review results are reported to the Editor-in-Chief. Finally, the Editor-in-Chief notifies the review results to the corresponding author(s). If there is any objection to the review results, corresponding author(s) can appeal within 60 days after being notified. The Editor-in-Chief has the obligation to notify the results after one more review.
PREPARATION OF THE MANUSCRIPTSubmissions should be uploaded as Word or rich text format (rtf) documents. The entire article (including tables) should be supplied as a single file; only the electronic figures should be supplied as separate files. The manuscript must be written with double-line spacing and 3 cm margins on A4 sized format consecutively, beginning from the title page. Please include line numbers in your MS word manuscript to help reviewers refer to specific lines of the paper when they make their comments. All measurements should be in metric units.
Manuscripts should be in the following order:1) Editorials: Editorials will be paired with the most impor-
tant articles of each issue and will be solicited at the pro-visional acceptance of an article. They should not exceed 1000 words excluding references and not be divided into sections and limited to 20 references and 2 or less tables/figures.
2) Reviews and Meta-analyses: Reviews and meta-analyses should contain an abstract of not more than 250 words. Manuscript length must not exceed 6000 words excluding references, figure legends or tables. The reviews and meta-analyses should contain at least 2 and not more than 8 figures or tables with 150 or less references. If the length and number of references exceed the limit allowed, then consent from the Editor-in-Chief is required.
3) Mini-Reviews: Mini-reviews should contain an abstract of not more than 250 words. Manuscript length must not exceed 4000 words excluding references, figure legends or tables. The mini-reviews should contain at least 2 and not more than 6 figures or tables with 100 or less references.
4) Technique Reviews: It highlights a practical approach to perform and interpret tests, both current and advanced, in the area of neurogastroenterology and motility. It can be a review or mini-review.
5) Original Articles: ① Abstract, ② a list of key words (5 or less) using MeSH terms from Index Medicus, ③ Introduction, ④ Materials and Methods, ⑤ Results, ⑥ Discussion, ⑦ Acknowledgements, ⑧ References, ⑨ Tables (each table completed with title and footnotes), ⑩ Figure legends.
6) Letters to the Editor: A letter containing comment(s) on an article in the Journal must be submitted within 6 months of its publication, should not exceed 400 words, must cite the subject article as a reference and should include no more than 10 references. The letter will be sent to the corresponding author of the article for a re-sponse. The author’s reply to the posed letter also follows the same format. If a letter contains a brief case report, it
Submission Checklists
JNM

should contain no more than 600 words, 2 figures and 10 or less references. The Editorial Board has the right to accept or reject any letter and may edit the accepted letters as long as the writers’ views are not misrepresented.
Title pageThe title page should contain the title of the paper, the full names of the authors, the addresses of the institutions at which the work was carried out together, and the full postal address, e-mail address, facsimile, and telephone number of the corresponding author.The title should be short and informative. A running title (not to exceed 45 characters and spaces) should be added if the complete title exceeds 12 words.
AbstractAbstract should be described continuously under subhead-ings of Background/Aims, Methods, Results, and Con-clusions within 250 words or less. The abstract should not contain abbreviations or references. Five, or at least three, key words should be supplied below the abstract and should be taken from those recommended by the Index Medicus (MeSH) browser list (http://www.nlm.nih. gov/mesh/meshhome.html).
Text1) Original Articles
All original manuscripts should be divided into Abstract, Introduction, Materials and Methods, Results, Discus-sion, Acknowledgments and References.
(1) IntroductionThe rationale for the study should be summarized and pertinent background material should be outlined. The introduction should not contain either results or conclusions.
(2) Materials and MethodsMaterials and Methods should be described in suf-ficient detail so that another investigator could repeat the work. The location of a manufacturer (manufacture name, city, state, country) listed in the text should be included. Statistical methods used should be outlined.Ethical guidelines for human or animal study should be described and approval of institutional human research review committee or animal welfare committee should be cited. Describe in detail hazardous procedures or chemicals involved, including precautions observed.
(3) ResultsResults should be presented in logical sequence in the text, tables and illustrations, and repetitive presentation of the same data in different forms should be avoided. The results should not include material appropriate for the discussion.
(4) DiscussionDiscussion considers the results in relation to any hypotheses advanced in the introduction. This may include an evaluation of the methodology and of the relationship of new information to the existing corpus of knowledge in that field. Data given in the results section should not be reiterated here.
2) Reviews and Meta-analysesSubstantive systematic reviews in basic and clinical topics of neurogastroenterology and motility will be considered for publication. They will be evaluated by peer review of the manuscript prior to consideration of publication. An abstract must be included. Meta-analyses of genetic studies are required to follow the Human Genome Epi-demiology Network (HuGENet) guidelines, available at http://www.cdc. gov/genomics/hugenet.
3) Mini-Reviews and Technique Reviews Mini-reviews are invited articles that inform the point of view about basic and clinical topics of neurogastroenter-ology and motility in which there have been recent and important advances. They bring to a focus on one spe-cific subject, and can be controversial, briefly discussing opposing viewpoints. Technique reviews are a review or mini-review that inform the recent knowledge and details about functional or motility tests.
AcknowledgementsThe source of financial grants and other funding should be acknowledged, including a frank declaration of the authors’ industrial links and affiliations. The contribution of colleagues or institutions should also be acknowledged. Thanks to anonymous reviewers are not allowed.
ReferencesThe Journal style of referencing should be used. In the text, references should be cited using superscript Arabic numerals in the order in which they appear. If cited only in tables or figure legends, number them according to the first identification of the table or figure in the text.In the reference list, the references should be numbered and listed in order of appearance in the text. List all au-thors if the number of authors is less than 7. List first 3 authors followed by et al., if the number of authors is 7 or more. Names of journals should be abbreviated in the style used in Index Medicus. Reference to unpublished data and personal communica-tions should appear in the text only.
References should be listed in the following forms: • Journal articles
1. Shim SG, Rhee JC, Rhee PL, et al. Mechanism of mo-tilin action on smooth muscle of the human stomach. Korean J Gastroenterol 2002;39:4-12.
2. Meltzer SJ, Abnen DJ, Battifour A, Yokokota J, Cline MJ. Protooncogene abnormalities in colon cancer and ad-enomatous polyps. Gastroenterology 1987;92:1174-1180.
• BooksDay RA. How to write and publish a scientific paper. 3rd ed. Phoenix: Oryx 1988:163-196.
• Book chapterCosta M, Furness JB, Llewellyn-Smith IF. Histochem-istry of the enteric nervous system. In: Johnson LR, ed. Physiology of the gastrointestinal tract. Volume 1. 2nd ed. New York: Raven 1987:1-40.
• Abstract/supplementRoxburgh J, Cooke RA, Deverall P, et al. Haemodynamic
JNM

function of the carbomedics bileaflet prosthesis [abstract]. Br Heart J 1995;73(suppl 2):37.
• Electronic citationsBasically, websites are referenced with their URL and access date, and as much other information is given as is available. Access date is important, as websites can be up-dated and URLs change. The “date accessed” can be later than the acceptance date of the paper, and it can be just the month accessed.
• Electronic journal articlesMorse SS. Factors in the emergency of infectious diseases. Emerg Infect Dis 1995 Jan-Mar;1(1). www.cdc.gov/nciod/ EID/vol 1 no 1morse.htm (accessed 5 Jun 1998).
• Online firstBefore the article has appeared in an issueUse the citation format:Sabin MA, Ford AL, Holly JMP, Hunt LP, Crowne EC, Shield JPH. Characterization of morbidity in a UK, hospital based, obesity clinic. Arch Dis Child Published Online First: 24 Oct 2005. doi:10.1136/adc.2005.083485.
Tables Each table must be simple and typed on a separate page with its heading above it. Explanatory matter is placed in footnotes below the tabular matter and not included in the heading. All non-standard abbreviations are explained in the footnotes.Footnotes should be indicated by superscripts a, b and c etc. The word “number” should be abbreviated as “n” to express the number of samples or subjects. For example, it should be written as (n=24). Statistical measures such as SD or SE(M) should be identified. Vertical rules and horizontal rules between entries should be omitted. Each table is referred in the text consecutively and numbered according to order of citation. The tables and its legend/footnotes should be understandable without reference to the text. The order of footnotes is as follows; after it is in-dicated by superscript a, b and c etc, then the abbreviation is explained. For example, IBS, irritable bowel syndrome; CNSD, chronic non-specific diarrhea. The last one is used for statistics.
Figure legendsFigure legends should be typed double-spaced on a separate sheet following Figure 1 or Figure 2. Symbols, arrows and letters indicating parts of illustrations should be explained in the legend. Each figure should be referred in the text consecutively as Fig. 1 or Fig. 2 in parenthesis and should be numbered according to order of citation. If figure is indicated in the sentence without the parenthesis, then it should be described as Figure 1.
FiguresIf a figure consisted of at least 2 sections, each figure should be listed as A, B or C in the upper left corner of each figure. The statistical difference (P-value) should be expressed as three digits below zero. If direct indica-tion is difficult to express in the figure, then *, **, ***
may be used. Theses asterisks should be explained in the figure legend. Figure format is individualized as follows: photographic images should be submitted in TIFF, JPG (JPEG), PNG, and GIF format with the original high-resolution. It should have a minimum width of 100 mm and a minimum resolution of 300 dpi. Neither compres-sion nor change of the color mode should be made. Line-arts (graphs and illustrations) should be submitted in native PPT (preferred) including editable figure elements, vector files, or TIFF files (at least 300 dpi with a mini-mum width of 100 mm).
Supplementary materialsSupplementary material is peer reviewed material directly relevant to the conclusion of an article that is not included in the printed version owing to space or format constraints. It is posted on the journal’s website and linked to the ar-ticle when the article is published, and may consist of data files, figures, videos or extensive tables. The printed article must be complete and self-explanatory without the supple-mentary information. Supplementary material enhances a reader’s understanding of the paper but may not be essen-tial to the reader’s understanding.When submitting supplementary material, ensure that you upload them using the “Supplemental File Upload.” Supplementary material should be cited in the article text as “Supplementary Fig. 1, Supplementary Table 1 or Supplementary Materials and Methods etc.” A legend for each figure, table, video, or other data should be included within the submitted file. All video files submitted must be of the highest quality possible. Any editing of the video is the responsibility of the author(s). Acceptable video file formats are: MPEG-1 or MPEG-2 (.mpg), Quicktime (.mov), Microsoft (.avi), or CompuServe GIF (.gif). Maximum video length is 5 minutes, and maximum file size is 160 MB. Concise legends must accompany each video in the text file.
Photographs of patients If photographs of patients are used, they should not be identifiable and should be accompanied by written permis-sion to use them.
Units of measurementAuthors should express all measurements in conventional units, with Système International (SI) units given in pa-rentheses throughout the text. Figures and tables should use conventional units, with conversion factors given in legends or footnotes.
AbbreviationsThe Journal provides a list of the official abbreviations. It appears in the Journal and its website. Otherwise, any un-official abbreviation should be used where they appear in the text at least three times, and be explained in parenthe-ses at the first time in the text. Do not use abbreviation(s) in the title.
JNM

April 30, 2016Volume 22 Number 2
EditorialsEditorials1 Can a Health Checkup Record Predict the Onset of Reflux Esophagitis?
Kyoungwon Jung3 The Korean Self-evaluation Questionnaire for Functional Dyspepsia
Yang Won Min
Review and Meta-analysesReview and Meta-analyses5 On-demand Versus Continuous Maintenance Treatment of Gastroesophageal Reflux Disease With Proton Pump Inhibitors:
A Systematic Review and Meta-analysisSeung Joo Kang, Hye-Kyung Jung, Chung Hyun Tae, Seung Young Kim, and Kwang Jae Lee
15 Role of Peroral Endoscopic Myotomy in Advanced Achalasia Cardia With Sigmoid and/or Megaesophagus: A Systematic Review and MetanalysisHarshal S Mandavdhare, Praveen Kumar M, Jayendra Shukla, Antriksh Kumar, and Vishal Sharma
28 Clinical Practice Guidelines for Fecal Microbiota Transplantation in KoreaTae-Geun Gweon, Yoo Jin Lee, Kyeong Ok Kim, Sung Kyun Yim, Jae Seung Soh, Seung Young Kim, Jae Jun Park, Seung Yong Shin, Tae Hee Lee, Chang Hwan Choi, Young-Seok Cho, Dongeun Yong, Jin-Won Chung, Kwang Jae Lee, Oh Young Lee, Myung-Gyu Choi, and Miyoung Choi; Gut Microbiota and Therapy Research Group Under the Korean Society of Neurogastroenterology and Motility
Original ArticlesOriginal Articles43 Onigiri Esophagography as a Screening Test for Esophageal Motility Disorders
Shohei Hamada, Eikichi Ihara, Kazumasa Muta, Masafumi Wada, Yoshitaka Hata, Hiroko Ikeda, Yoshimasa Tanaka, Haruei Ogino, Takatoshi Chinen, and Yoshihiro Ogawa
53 Efficacy of Acotiamide on Postprandial Distress Syndrome and Epigastric Pain Syndrome Depending on the Estimated Gastric Acid Secretion LevelToshiaki Suzuki, Reina Ohba, Ei Kataoka, Yui Kudo, Akira Zeniya, Daisuke Segawa, Keisuke Oikawa, Masaru Odashima, Taiji Saga, Tomoyuki Kuramitsu, Hideaki Sasahara, Kazuo Yoneyama, Takashi Tomita, Yosuke Shimodaira, and Katsunori Iijima
62 Esophageal Bolus Domain Pressure and Peristalsis Associated With Experimental Induction of Esophagogastric Junction Outflow Obstruction Wei-Yi Lei, Taher Omari, Tso-Tsai Liu, Ming-Wun Wong, Jui-Sheng Hung, Chih-Hsun Yi, Shu-Wei Liang, Charles Cock, and Chien-Lin Chen
69 Reflux-related Extraesophageal Symptoms Until Proven Otherwise: A Direct Measurement of Abnormal Proximal Exposure Based on Hypopharyngeal Multichannel Intraluminal Impedance as a Reliable Indicator for Successful Treatment OutcomesTakeshi Suzuki, Yosuke Seki, Tomoaki Matsumura, Makoto Arai, Toyoyuki Hanazawa, Yoshitaka Okamoto, Haruhiko Suzuki, Kazunori Kasama, Akiko Umezawa, Yoshimoti Kurokawa, and Toshitaka Hoppo
78 Role of Glucose Breath Test for Small Intestinal Bacterial Overgrowth in Children and Adolescents With Functional Abdominal Pain Disorders in KoreaJin Lee, Chang-Nyol Paik, Dae Bum Kim, Ji Min Lee, Yeon-Ji Kim, Sik Kyung Choi, and Yeon Jong Cho
86 Predictive Factors for Future Onset of Reflux Esophagitis: A Longitudinal Case-control Study Using Health Checkup RecordsYuzuru Toki, Ryo Yamauchi, Eizo Kayashima, Kyoichi Adachi, Kiyohiko Kishi, Hiroshi Suetsugu, Tsuneya Wada, Hiroyoshi Endo, Hajime Yamada, Satoshi Osaga, Takeshi Kamiya, Koji Nakada, Katsuhiko Iwakiri, Ken Haruma, and Takashi Joh
95 Improving Clinician-Patient Communication Alleviates Stigma in Patients With Functional Dyspepsia Receiving Antidepressant TreatmentXiu-Juan Yan, Hong-Yi Qiu, Qing-Qing Luo, Bo Wang, Ping Xu, Chen-Feng Ji, and Sheng-Liang Chen
104 ACTG2 Variants in Pediatric Chronic Intestinal Pseudo-obstruction With MegacystisJong Woo Hahn, Soo Young Moon, Min Soo Kim, Min Hyung Woo, Min Ji Sohn, Hyun-Young Kim, Moon-Woo Seong, Sung Sup Park, Sung-Hye Park, Jin Soo Moon, and Jae Sung Ko
111 Development and Validity Assessment of a Self-evaluation Questionnaire for Functional Dyspepsia: A Multicenter Prospective Study in Korea Kyoungwon Jung, Hye-Kyung Jung, Joong Goo Kwon, Chung Hyun Tae, Ki Bae Bang, Jong Kyu Park, Ju Yup Lee, Cheol Min Shin, Jung Hwan Oh, Kyung Ho Song, Oh Young Lee, and Myung-Gyu Choi
121 Role of the Mean Nocturnal Baseline Impedance in Identifying Evidence Against Pathologic Reflux in Patients With Refractory Gastroesophageal Reflux Disease Symptoms as Classified by the Lyon ConsensusYanhong Wu, Zihao Guo, Chuan Zhang, and Yutao Zhan
131 Morphologic Changes in Esophageal Body Movement During Bolus Transport After Peroral Endoscopic Myotomy in Type III AchalasiaAlex Ju Sung Kim, Sungmoon Ong, Ji Hyun Kim, Hong Sub Lee, Jun Sik Yoon, and Dae Young Hur
145 Sex and Gender Differences in Overlap Syndrome of Functional Gastrointestinal Disorder and Effect of Genetic Polymorphisms in South Korea: A Long-term Follow-up StudyJu Yup Lee, Nayoung Kim, Ji Hyun Park, Jeong Eun Yu, Yun Jeong Song, Jung Won Yoon, and Dong Ho Lee
Letters to the EditorLetters to the Editor159 Missing the Distal-most [Z6] Impedance Channel? The Study Can Be Salvaged!
Frederick W Woodley 161 Peristaltic Recovery After Peroral Endoscopic Myotomy for Achalasia: Dream or Reality?
Akshay Kulkarni, Anshuman Elhence, and Uday C Ghoshal162 PeristalticRecoveryAfterPeroralEndoscopicMyotomyforAchalasia:DreamorReality?:AuthorʼsReply
Zuzana Vackova, Jan Mares, Jana Krajciova, Zuzana Rabekova, Lucie Zdrhova, Pavla Loudova, Julius Spicak, Petr Stirand, Tomas Hucl, and Jan Martinek
164 Combination Treatment With Proton Pump Inhibitor Plus Prokinetic for Gastroesophageal Reflux DiseaseMuhammad Ali Tariq and Bilal Ahmed
165 Superimposed Non-acid Reflux Event: An Example of When It May Be Important to Revisit the Impedance Analysis GuidelinesFrederick W Woodley
Vol. 28, No. 1 January 2022 P
ages 1-166
January Volume 28 Number 1
2022
1400120010008006004002000
A B
Imp
ed
an
ce
()
Swallow-to-distension
interval
Distension
duration