BER: Vol. 4, No.1, June 2014, published
380
-
Upload
macrothink -
Category
Documents
-
view
0 -
download
0
Transcript of BER: Vol. 4, No.1, June 2014, published

Business and Economic Research ISSN 2162-4860
2014, Vol.4, No. 1
http://ber.macrothink.org
Editorial Team
Editor-in-Chief
Dr. Sahar Bahmani, University of Wisconsin at Parkside, United States
Editorial Assistant
Daisy Young, Macrothink Institute, United States
Associate Editors
Dr Angela Wright, CIT, Ireland
Dr. Manuel Alejandro Cardenete, University Loyola Andalusia, Spain
Dr. Judy Li, Lincoln University, New Zealand
Editorial Board
Ajmer Singh, Kurukshetra University, India
Alunica V. MORARIU, Faculty of Economics and Public Administration, "Stefan cel Mare" University of Suceava, ROMANIA
Angel Espiniella-Menendez, University of Oviedo, Spain
Annamaria Fiore, Regional Innovation and Technology Agency (ARTI), Italy
Antonio Ruiz-Porras, University of Guadalajara, CUCEA, Mexico
Dr. Armin J. Kammel, Danube University Krems, Austria
Bilal Khalaf Sakarneh, Isra University, Jordan
Bratu (Simionescu) Mihaela, Faculty of Cybernetics, Statistics and Economic Informatics, Romania
Cosimo Magazzino, Roma Tre University/LUSPIO University, Italy
Prof Dr Eddie John Fisher, Universidad de Oriente, Santiago de Cuba, Cuba Univerzita Palackeho, Olomouc, Czech Republic, United Kingdom
Dr. Ewa J. Kleczyk, TargetRx, Inc, United States
Eyup Dogan, Clemson University, United States

Business and Economic Research ISSN 2162-4860
2014, Vol.4, No. 1
http://ber.macrothink.org
Fahmi Shaaban Fararah, Malaysia
Frantisek Svoboda, Masaryk University, Czech Republic
Grigorios L Kyriakopoulos, National Technical University of Athens (NTUA), Greece
Hazem Ali Marashdeh, Alhosn University, Jordan
Associate Professor Hengky Sumisto Halim, Universiti Utara Malaysia, Malaysia
Dr Mohd Rizal Muwazir, University of Malaya, Malaysia
Dr. Mohammad Nurul Huda Mazumder, Multimedia University, Malaysia
Mohammad Reza Noruzi, Tarbiat Modarres University, Policy Making in Public Sector Management, Iran
DR Motsomi Marobela, Department of Management, University of Botswana, Botswana
Dr Olubukunola Ranti Uwuigbe, Dept of Accounting, School of Business, Covenant University, Nigeria
Dr. Piotr Siemiątkowski, Nicolaus Copernicus University, Poland
Professor Pacha Malyadri, Principal Government Degree College, Osmania University INDIA, India
Dr. Ramil Maano Perez, Eastern Visayas State University, Philippines
Dr. Said Jaouadi, College of business and administration, Jazan University, Saudi Arabia
Mr. Sandip Sarker, MBA candidate, Management & Business Administration School, Khulna University, Bangladesh
Dr Santosh Banadahally Manjegowda, Chinmayi Research and Consulting, India
Prof. Shyamkumar D. Kalpande, MET's Institute of Engineering, BKC- Nashik, Pune University, India
Dr. Socrates Ogalesco Ballais, Eastern Visayas State University, Philippines
Dr Uwalomwa Uwuigbe, Dept of Accounting, Covenant University
Business and Economic Research ISSN 2162-4860
2014, Vol. 4, No. 1
http://ber.macrothink.org I
Contents
Strategy and Structure: A Learning Perspective and Analysis
Eric W. Ford, Rebecca Wells, Terrie C. Reeves 1-13
A Quantitative and Theoretical Analysis of Ghana’s Internal Migration, Economic Growth and poverty Reduction: A Disaggregated Approach, from 1980 to 2012*
Nicholas Awuse, Patrick Tandoh Offin 14-22
What factors Influence Internal migration and Wage Growth? an Empirical Analysis of Private Formal Sector in Bolgatanga-Ghana
Nicholas Awuse, Patrick Tandoh Offin 23-31
Assessment of Internal Migration Policies in Developing Countries: Evidence from Tanzania
Robert Ebihart Msigwa, Kembo M. Bwana 32-47
The Business Competitiveness of Thailand in the ASEAN Region
Abdullah Kaid Al-Swidi, Arfan Shahzad 48-69
Performance Evaluation of the Banking Sector in Bangladesh: A Comparative Analysis
Md. Ariful Islam, Mahmudul Hasan Siddiqui, Kh. Fahim Hossain, Luthful Karim 70-107
Convertibility of Capital Account: A Comparative Analysis
Md. Ariful Islam, Md. Rayhan Islam, Mahmudul Hasan Siddiqui, Luthful Karim 108-132
Analysis of Quality Leadership in Reviving Economies and Politics in Muslim Countries
Mahfuzur Rahman, Md. Arphan Ali, Hasanul Banna, Md. Saifur Rahman 133-146
Personal Attributes and Motivation of Female Micro-Entrepreneurs in Ghana: A Case of Fishmongers in Central Region
CHRISTINA BOATENG 147-160
Theory and Empirical Evidence on Corporate Governance from Banking Sector of Pakistan
Waqas Tariq, Imran Ali, Muhammad Ibrahim, Muhammad Asim, Naeem Ur Rehman 161-172
Globalization to a Developing Economy: a Pain or a Gain
Roseline Oluwatoyin Oluitan 173-187
The Theory of Justice and Profit Maximization
Gennady Bilych 188-210
Enhancing International Performance of Exporting Firms through E-Business Integration
Mehmet Ali Ekemen, Pelin Bayram 211-229
Do Corporate Social Responsibility Initiatives Favorable for Banks? Customer’s Perceptions
Shahbaz Khan, Nida Baig, Aon Waqas Awan, Muhammad Imdad Ullah 230-247
The Impact of Economic Crisis in Greece: Key Facts and an Overview of the Banking Sector
Fotios V. Mitsakis 248-265
Cultural Awareness, a Form of Risk Management in International Business: Case Study of China
Fadun Solomon Olajide 266-288

Business and Economic Research ISSN 2162-4860
2014, Vol. 4, No. 1
http://ber.macrothink.org II
Welfare Effects of Social Cash Transfers in Chipata and Kazungula Districts of Zambia
Gelson Tembo, Bernadette Chimai, Nicholas Freeland, Brian P. Mulenga 289-298
Effectiveness of Loan Portfolio Management in Rural SACCOS: Evidence from Tanzania
Joseph John Magali 299-318
Factors that Determines the Success of Business Demon Value Added Management
Albert Irawan 319-350
Remittances and Economic Growth in Mexico: An Empirical Study with Structural Breaks, 1970-2010
Miguel D. Ramirez 351-373
Reviewer Acknowledgements
Daisy Young 374

Business and Economic Research ISSN 2162-4860
2014, Vol. 4, No. 1
1
Strategy and Structure: A Learning Perspective and
Analysis
Eric W. Ford, Ph.D., MPH (Corresponding Author)
Chief Science Officer
Complex Task Assessment Solutions and Information Technology, LLC
& Pedagogue, University of North Carolina Greensboro
12 Winterberry Ct. Greensboro, NC 27455; USA
Tel: 806-787-3267 E-mail: [email protected]
Rebecca Wells, Ph.D.
Professor, Texas A&M University, College Station, TX
Tel: 979-458-2246 E-mail: [email protected]
Terrie C. Reeves, MBA, Ph.D.
Research Advisor, Digital Frontiers Consulting, Columbus, OH
E-mail: [email protected]
Received: November 23, 2013 Accepted: December 14, 2013
doi:10.5296/ber.v4i1.4602 URL: http://dx.doi.org/10.5296/ber.v4i1.4602
Abstract This paper integrates the strategy and structure constructs using organizational learning theory. Learning theory is refined by arraying strategic and structure constructs along a path dependent, concatenated, continuum that is congruent with the original model of strategy and structure originally proposed by Chandler. The model also enhances methodological rigor by increasing congruence between theory and statistic application. Findings indicate that a single construct of strategy and structure can be employed effectively in management research.
1. Introduction The management literature has not used great precision in defining many common terms-particularly with respect to ‘strategic management’ (Ford, Ginter, & Duncan, 2000; Leontiades, 1982; Ronda-Pupo & Guerras-Martin, 2012). Often, strategic management is considered to have two parts-strategy and structure. Strategy is the activities that surround the determination of “basic long-term goals…and the allocation of resources necessary for carrying out these goals” (Chandler, 1962, p. 13). Structure variables encompass organizational
Business and Economic Research ISSN 2162-4860
2014, Vol. 4, No. 1
2
design characteristics that are critical to pursuing different strategies. Therefore, strategy and structure measures are both integral to a common latent construct. Further, there is empirical evidence they should be treated as a single metric because: 1) there is their relationship is reciprocal or interdependent in nature (Fredrickson, 1986) and 2) although the concepts are intellectually distinct, they behave as a single construct with variables describing each aspect intermingled.
The current study models learning in a path dependent continuum using Miller’s typology of six learning modes and learning theory. Specific variables were drawn from Miller and Friesen’s (1984) previous work on organizational configurations, later reflected in his(1996) learning typology. Item response theory (IRT) is used to analyze data from seventy-seven organizations’ performance on the configuration variables. Both the organizations and the variables are arrayed along a common single dimension that reflects a learning continuum.
The study makes a unique contribution to strategy literature by putting both strategy and structure variables onto a continuous array that indicates a capability path. Capability development is inherently a learning exercise and is consistent with the organizational learning perspective (Schiller, 2014). Therefore, for strategy researchers, the ability to array strategy and structure measures along a single continuum is important as it simplifies many analyses. For practitioners, the results provide a defined path to assess and develop strategic capabilities in a learning fashion.
2. Organizational Learning: Methodical and Emergent Constructs Organizational learning theory has been popular in management research because of the intuitive appeal of the concept that organizations, like people, can use information to change their behavior, and by so doing, may enjoy a longer, more productive existence. The analogies of organizational to individual learning may include the necessity of mastering one set of competencies before progressing to others that build on the foundation skills (Kusunoki, Nonaka, & Nagata, 1998). Thus, learning is posited to be a combinative achievement (Kogut & Zander, 1992), in which organizations master capabilities that are more fundamental before acquiring more complex strategic capacity.. Further, learning is the developmental process of modifying an organization’s “cognitive map” (Friedlander, 1983: 194) using organizational capabilities, thereby expanding the range of potential strategic responses to an ever-changing environment (Fiol, 1996; Huber, 1991).
It is important to note that in order for learning to take place in organizations elements of both strategy and structure are required. First, organizations need structures and processes to consolidate knowledge that would otherwise remain inside the minds of individuals (Argote, 1999). Second, organizations rely upon shared norms, ideally a shared strategic vision, that facilitates the exchange of information and its incorporation into collective strategies. Popper and Lipshitz (2000: 183) describe both structural and cultural factors as organizational learning mechanisms, which they define as “institutionalized structural and procedural arrangements that allow organizations to systematically collect, analyze, store, disseminate, and use information relevant to the performance of the organization and its members.” Sorensen (2002: 73) emphasizes the impact of learned organizational culture on organizational routines, but admits the possibility “that strong-culture firms may be better (or worse) at choosing appropriate strategies” (original parentheses). In contrast, this paper explores the organizational learning associated with successful strategizing. Although both culture and routines may be components of some strategic capabilities, the development of higher-level strategic capacity requires learning far beyond both. Understanding strategic capacity as a learning phenomenon allows us to probe its path dependent evolution based on previous work

Business and Economic Research ISSN 2162-4860
2014, Vol. 4, No. 1
3
in both the organizational strategy and individual development fields.
Strategic capacity in term of organizational learning theory has been characterized as either “methodical” or “emergent” (Miller, 1996). Formalized strategy mechanisms and structures for focusing on specific goals and objectives within existing paradigms are methodical in nature (Steiner, 1997), while incremental approaches to strategy, like emergent learning, rely on more subtle normative considerations (Miller, 1996). Despite the proliferation of conceptual, theoretical, and empirical studies on strategy-environmental fit, debate continues to surround a key question: how do firms learn the strategic capabilities they need to succeed financially in their prevailing environments (Chan, Yung, & Burns, 2000; Morgan & Hunt, 2002)?
2.1 Methodical Learning Modes Methodical learning employs rational analysis of data to make performance-optimizing decisions-an example being TQM. This is the model assumed by scientific management theory (Taylor, 1911) and is akin to “single loop” learning (Argyris & Schon, 1996; Ashby, 1960).
2.1.1 Structural Learning-Consciousness of Analysis and Adaptive Behaviour
The first, most constrained mode of methodical learning Miller (1996: 494) identified was Structural, which he described as being “one of the most pervasive forms of methodical learning.” Routines codify processes, enabling organizations to repeat sequences with a minimum of errors or effort. Such routines also encode values that guide how organizations learn. Thus, structural learning shapes both what organizations absorb and what is filtered out.
Two capabilities from Miller and Friesen’s (1984) previous work best reflect structural learning-Consciousness of Analysis and Adaptation. Consciousness of Analysis is the beginning of all planning and entails reflection on both problems and arrays of potential solutions. In this sense, it is the precursor of all other strategic actions, even incremental adaptations. Adaptive behavior may then be build on analysis by responding appropriately to environmental conditions whose implications have been considered. In turn, appropriate patterns of adaptation may precede the ability to conduct and learn from experiments.
2.1.2 Experimental Learning-Scanning and Control
The second mode of methodical thought and action Miller (1996) described was Experimental, portrayed as learning through problem-driven searches for better solutions. Experimentation is central to Total Quality Improvement, which assumes that organizations increase their efficiencies through a continuous cycle of incremental, data-driven trials (Deming, 1982). Like Structural Learning, Experimental Learning builds on assumptions of rationality and planned change. However, in this mode there is more action as new ideas are provisionally implemented.
The two activities that best illustrate experimental learning are Scanning, or the exploration of the firm’s environment for problems and opportunities, and Control, the mechanisms through which organizations learn about how well their existing routines are working (Miller & Friesen, 1984). Methodical use of Scanning and Control reduces the “cognitive burdens of top managers” (Miller, 1996: 493) and does not require long-term planning in the way more complex forms of organizational learning do. In fact, learning how to experiment on a small scale may be a precondition for predicting future consequences of larger decisions.
2.1.3 Analytic Learning-Futurity of Planning The third and least restrictive mode of methodical learning is Analytic, the deliberate, systematic assessment of current decisions on the future of the organization. Miller (1996)

Business and Economic Research ISSN 2162-4860
2014, Vol. 4, No. 1
4
specifically pointed to the type of strategic, ‘long-range,’ planning promulgated by Allison, Ansoff, and Steiner (1971; 1965; 1997, respectively) as characterizing this mode. According to Steiner, (1997: 14), Futurity is “the essence of strategic planning.” Miller (1996) portrays the Analytic mode as the highest in voluntarism. Another implication is that this mode is the most challenging among the methodical modes, and builds upon Structural and Experimental competencies. Moreover, all three methodical modes set the stage for the more spontaneous, creative emergent strategy development. Such a progression would be consistent with Brews and Hunt’s (1999: 903) findings that “formal specific planning may be a necessary precursor to successful…emergent strategy (Kusunoki et al.).”
2.2 Emergent Learning Modes Emergent or “double loop” learning, in contrast to methodical learning, is more intuitive, unstructured, and global in nature, and entails questioning underlying assumptions (Argyris & Schon, 1996).
2.2.1 Institutional Learning-Technocratization and Innovation
The most constrained emergent mode, Institutional, is a form of organizational learning in which members respond to the normative and symbolic logics of their contexts (DiMaggio & Powell, 1983). Such influences may become more powerful within organizations when higher proportions of members have professional identities and thus a common, profession-based ethos for action. As a critical mass of professional employees coalesces to shape strategic decisions, the process is described as Technocratization (Miller & Friesen, 1984). Technocratization can facilitate Innovation as professionals look to their peers at other organizations for guidance about emerging strategic options.
2.2.2 Interactive Learning-Integration and Risk taking
The second emergent thinking mode, Interactive, occurs when organizations discover new opportunities from the conflicting objectives of their members (Miller, 1996). Two factors indicate Interactive Learning capabilities. The first is Integration of Decisions, which occurs when units across the organization complement and support other units. The second is the Risk Taking necessary to effect larger changes in organizational strategy implied by paradigm shifts. Together, these complementary factors make it possible for organizations to learn from new perspectives, even when they conflict with the existing patterns of voluntary behavior. Further, when Interactive Learning becomes the norm it may facilitate the mode posited to be the most challenging of all, Synthetic Learning.
2.2.3 Synthetic Learning-Communication, Strategic Reappraisal, and Decentralization of Strategy-Making Authority The final, least restrictive mode of emergent thinking, Synthetic, is the intuitive, holistic incorporation of new elements into models for action (Nonaka, 1995). Synthetic Learning is the hardest learning mode because it requires the ability to discern patterns among seemingly unrelated phenomena. Although Miller (1996: 492) asserts that “synthesis is normally the product of a single creative mind,” in fact, the complexity of organizations’ internal and external contexts is arguably too great for even a small group to understand fully. The first element of Synthesis is the Communication flow throughout the organization necessary to transcend individual understanding and develop collective intelligence. At its highest level, this reaches the level of dialogue, a deeply attentive exchange “all but lost to the modern world” (Senge, 1990: 239). Dialogue may take the participants in completely unplanned directions as each voice builds on and responds to previous voices (Bakhtin, 1986). The purpose is to go beyond any one individual so that members can find new, shared meanings,

Business and Economic Research ISSN 2162-4860
2014, Vol. 4, No. 1
5
rather than simply defend their initial positions. Senge (1990: 239) describes the benefit of such dialogue: “collectively, we can be more insightful, more intelligent than we can possibly be individually.”
The second dimension of Synthesis is the Strategic Reappraisal necessary to engage in “double-loop” learning. Unless organizational members are willing to rethink both their strategies and the means of attaining them, they will be limited to improving performance within old paradigms like strong culture organizations who perform routines reliably, but cannot easily change routines (Sorensen, 2002). Synthesis-developing new meanings out of information-requires the ability to rethink old frameworks.
The final dimension posited to indicate Synthetic capacities is Decentralization of Strategy-Making Power. Once relevant information is disseminated throughout the organization and members become accustomed to questioning existing strategies, the highest level of learning can be attained. In decentralized organizations, strategic decision-making power is distributed throughout the organization rather than reserved for top management.
The developmental logic of methodical and emergent strategic capabilities in this framework suggests that a model of organizational learning should have path dependent characteristics. Therefore, the following hypothesis is made about the model’s constructs:
Hypothesis 1: Methodical and emergent strategic capabilities fall along a single, unidimensional pathway.
3. Research Design Concomitant with the development of a new strategy-environment fit model is the need for a method to empirically test its propositions while maintaining congruency between methods and vocabulary (Venkatraman, 1989). In trying to meet this need, this study employed two distinct steps and an appropriate empirical analysis was matched to each step. First was an examination of the developmental pathways of health service organizations’ strategic capacities, using a set of latent trait analysis algorithms called Rasch analysis.
3.1 Sample and Data Health care organizations were studied for three reasons. First, researchers studying the U.S. health system are beginning to call for and apply learning theory in studying both markets and management practices (Committee on Quality of Health Care in America, 2001; Kohn, Corrigan, & Donaldson, 2000). This study answers those calls. Second, because the healthcare industry’s environment is unstable due to rapid technological change, dramatic government interventions, and increasing competition (Gould, 1988), strategies and structures are under significant pressure to learn. Therefore, any learning pathway identified across organizations is indicative of the larger learning paradigm taking place. Finally, Ketchen et al., (1997) found that single industry studies produced greater effect sizes on variables related to strategy.
Study data were obtained from two types of sources: (a) Forms 10-K, prospectuses, and other forms filed with the Securities and Exchange Commission (SEC) and annual reports in the case of for-profit health services organizations, and (b) strategic management cases about health services organizations found in the following textbooks, Case Research Journal for the years 1990 through mid-1995; Harvard Business School 1994-1995 Catalog of Teaching Materials; Preferred Individualized Case (PIC) Catalog; the European Clearinghouse Catalog of cases; the Western Ontario Business School Teaching Materials Catalog; and finally the Darden Graduate School of Business Catalog of cases. All cases contained reference to most of the study’s variables of interest. Organizations to be studied using SEC documents were chosen in
Business and Economic Research ISSN 2162-4860
2014, Vol. 4, No. 1
6
the following manner. Based on the Standard Industrial Classification (SIC) codes for publicly traded health services organizations obtained from a national broker, a list of all other health services organizations with the same SIC codes was compiled. SEC documentation was gathered for those organizations about whom information was available in Standard and Poor’s Corporate and Municipal Ratings, in Moody’s Bond Record, or in Value Line, and whose major source of revenue appeared to be direct patient care. Raters were directed to pay special attention to descriptive sections about the external environment and strategies intended to deal with the environment. Raters looked for organizational responses to competitors, regulations, reimbursement mechanisms, or other external factors, and for internal mechanism that might facilitate responses. They were also instructed to read auditors notes to financial statements for clues about operating system such as new technological or computer systems, quality program, human resource practices. Fifty-seven usable sets of SEC documents were obtained. The others were unsuitable because the major source of revenue was not patient care related or data on all variables was unavailable. The final sample consisted of 20 cases and 57 sets of SEC documentation.
3.2 Measures and Scoring Three sets of measures were developed to test the hypothesized relationship. First, a single measure of each organization’s position on the strategic capacity continuum was calculated. Using variables operationalized in previous research (Miller & Friesen, 1984), the strategic capacity measures used herein are based on the methodical and emergent organizational learning paradigms suggested by Miller (1996). Variables that failed to differentiate organizations in previous research or that did not have a direct counterpart in the learning paradigm descriptions were eliminated (See Appendix 1 for variable descriptions). In addition, the cues to scorers were modified for this study to reflect the health service context.
The variables were scored on a Likert scale with values ranging from one to seven. A value of one indicated that an organization lacked, or possessed very low amounts of a characteristic and a value of seven indicated that the organization had a significant amount of the capability. After extensive training sessions, multiple raters scored each organization’s documents. All raters rated 43 percent of organizations studied. On 99.4 percent of those organizations’ scores, evaluations varied by less than 2 between raters. Given this high level of agreement, scores were recorded as the average of the raters’ scores in the few instances when the raters’ scores differed.
Using a Rasch algorithm, a strategic capacity measure that Venkatraman (1989) would classify as using the ‘fit as profile deviation’ (p. 433) approach was developed. Here, differing levels of strategic capacity have been hypothesized as better suited for particular environmental conditions when better organizational performance is to be expected. Further, the concept of fit as profile deviation suggests that the degree of adherence to such a one-dimensional profile is related positively to performance. However, this study extended this analytical approach by using ipsative-scaling techniques to measure strategic capacity constructs. Ipsative scales’ (similar to Guttman scaling) major characteristics are as follows: they are hierarchically cumulative (i.e., firms posses all of the strategic capabilities scoring at and below their score); they can detect small shifts in value; the scores are ordinal; they measure one dimension; and items are ordered in difficulty or complexity so that getting to one item implies success with the preceding item. In demanding an ordered array of items, ipsative scales are more rigorous than mere point estimates of associations because they define the entire range of ability not merely one level. As Brews and Hunt (1999, p. 890) describe, “These more sophisticated methodologies (see for example Fredrickson, 1984; Wood & LaForge, 1979, 1981) have in
Business and Economic Research ISSN 2162-4860
2014, Vol. 4, No. 1
7
general produced stronger planning/performance relationships than earlier work (Priem, Rasheed, & Kotulic, 1995).” Further, by profiling all of the organizations together, rather than using a hold-out sample of successful organizations as Venktraman and Prescott (1990) did, the measure has more generalizability. The derived strategic capacity measure for each organization was then incorporated into interaction variables used in the second phase of the analyses related to hypotheses three through eight (a more detailed description of the algorithm is provided in the Analytic Approaches section).
3.3 Analytic Approaches The analytic approaches used in this study contributed to theoretical and statistical correspondence in two ways. First, using expert raters to score variables on a Likert-like scale helps to overcome possible unequal scalar qualities among the concepts being rated. Second, Latent Trait Analysis (LTA) including Rasch models, is a family of procedures used to estimate a measure’s dimensionality and the interval of ordinal-scaled items along a single dimension. First developed in the early 1960s for use in education and psychology, Rasch analysis models have been used to infer a person’s position along a series of hierarchical items.
Rasch analysis can also identify items, such as strategy and structure measures, that are redundant and those that do not fit the model. In order to create an interval scale, Rasch analysis estimates both abilities (an organization’s level of successful performance on a variable or capability) and item difficulty (level of resistance to successful performance) for a set of variables. The basic assumption is that the probability of an individual’s or organization’s success or failure on a particular item depends on both ability and the difficulty of the item.
The Rasch algorithm estimates item difficulty on a logistic scale in ‘logits’ (the log odds transformation of the probability of a correct response) and creates an interval scale. This technique can also identify characteristics or strategic capabilities that are redundant or that do not fit the presumed organizational learning pathway. The standardized infit (a weighted fit statistic) and outfit (an outlier sensitive fit statistic) statistics identify redundant items, noise, and outliers. Rasch users “routinely pay more attention to infit scores than outfit scores” (Bond & Fox, 2001, p. 43). Items with very low infit scores may be redundant. Items with unusually high infit scores indicate an unusual response pattern across items. For example, organizations with very high strategic capacity may lack an “easy,” lower level capability. Such items can either be removed, if they are captured by another measure, or be retained if they are theoretically essential.
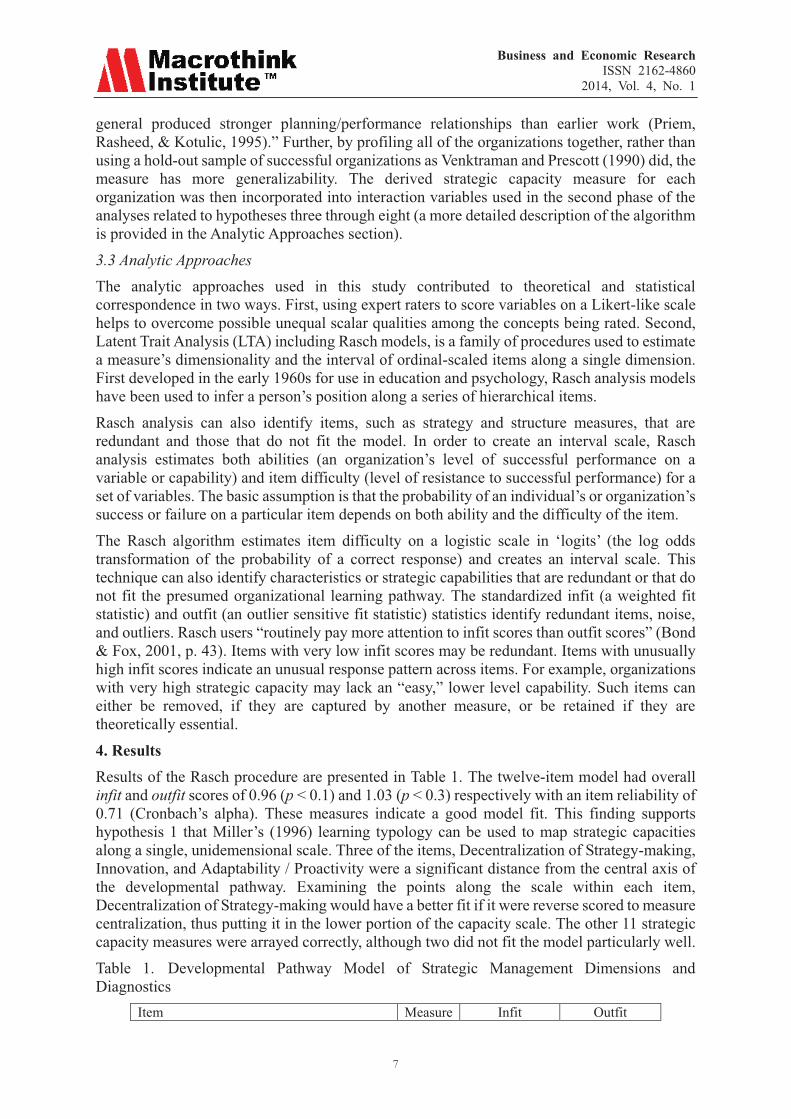
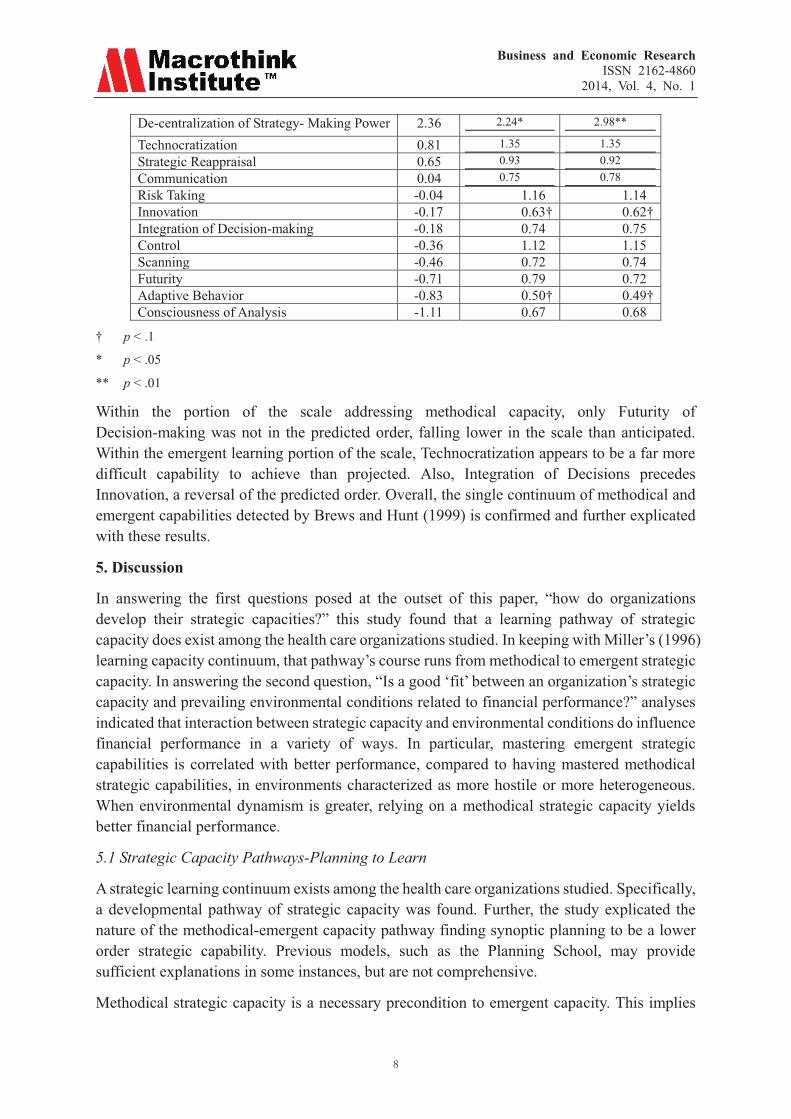
4. Results Results of the Rasch procedure are presented in Table 1. The twelve-item model had overall infit and outfit scores of 0.96 (p < 0.1) and 1.03 (p < 0.3) respectively with an item reliability of 0.71 (Cronbach’s alpha). These measures indicate a good model fit. This finding supports hypothesis 1 that Miller’s (1996) learning typology can be used to map strategic capacities along a single, unidemensional scale. Three of the items, Decentralization of Strategy-making, Innovation, and Adaptability / Proactivity were a significant distance from the central axis of the developmental pathway. Examining the points along the scale within each item, Decentralization of Strategy-making would have a better fit if it were reverse scored to measure centralization, thus putting it in the lower portion of the capacity scale. The other 11 strategic capacity measures were arrayed correctly, although two did not fit the model particularly well.
Table 1. Developmental Pathway Model of Strategic Management Dimensions and Diagnostics
Item Measure Infit Outfit
Business and Economic Research ISSN 2162-4860
2014, Vol. 4, No. 1
8
De-centralization of Strategy- Making Power 2.36 2.24* 2.98**
Technocratization 0.81 1.35 1.35 Strategic Reappraisal 0.65 0.93 0.92 Communication 0.04 0.75 0.78 Risk Taking -0.04 1.16 1.14 Innovation -0.17 0.63† 0.62† Integration of Decision-making -0.18 0.74 0.75 Control -0.36 1.12 1.15 Scanning -0.46 0.72 0.74 Futurity -0.71 0.79 0.72 Adaptive Behavior -0.83 0.50† 0.49† Consciousness of Analysis -1.11 0.67 0.68
† p < .1
* p < .05
** p < .01
Within the portion of the scale addressing methodical capacity, only Futurity of Decision-making was not in the predicted order, falling lower in the scale than anticipated. Within the emergent learning portion of the scale, Technocratization appears to be a far more difficult capability to achieve than projected. Also, Integration of Decisions precedes Innovation, a reversal of the predicted order. Overall, the single continuum of methodical and emergent capabilities detected by Brews and Hunt (1999) is confirmed and further explicated with these results.
5. Discussion
In answering the first questions posed at the outset of this paper, “how do organizations develop their strategic capacities?” this study found that a learning pathway of strategic capacity does exist among the health care organizations studied. In keeping with Miller’s (1996) learning capacity continuum, that pathway’s course runs from methodical to emergent strategic capacity. In answering the second question, “Is a good ‘fit’ between an organization’s strategic capacity and prevailing environmental conditions related to financial performance?” analyses indicated that interaction between strategic capacity and environmental conditions do influence financial performance in a variety of ways. In particular, mastering emergent strategic capabilities is correlated with better performance, compared to having mastered methodical strategic capabilities, in environments characterized as more hostile or more heterogeneous. When environmental dynamism is greater, relying on a methodical strategic capacity yields better financial performance.
5.1 Strategic Capacity Pathways-Planning to Learn
A strategic learning continuum exists among the health care organizations studied. Specifically, a developmental pathway of strategic capacity was found. Further, the study explicated the nature of the methodical-emergent capacity pathway finding synoptic planning to be a lower order strategic capability. Previous models, such as the Planning School, may provide sufficient explanations in some instances, but are not comprehensive.
Methodical strategic capacity is a necessary precondition to emergent capacity. This implies

Business and Economic Research ISSN 2162-4860
2013, Vol. 3, No. 2
www.macrothink.org/ber 9
that firms must learn methodical capabilities before they can learn emergent capabilities, and that methodical capacity is the more easily acquired. A further implication is that organizations, having mastered all capabilities, may then be able to draw upon appropriate ones depending upon the situation. However, not every methodical or emergent capability fell as closely along the pathway as anticipated. Decentralization of Strategic Planning, Adaptive Behavior, and Innovation did not fit the model well. One possible explanation for this anomaly relates to a firm’s place in the organizational life cycle. Constructs that are characteristic of entrepreneurial behaviors like these are found in young firms. Firms just starting out may not have had the time to develop methodical skills nor the history to engage in the sensemaking indicative of emergent strategies. Alternatively, it may be that entrepreneurial organizations must develop capacity all along the continuum quickly in order to survive; or perhaps entrepreneurial organizations must develop some strategic capabilities simultaneously with others. Another possible explanation is that these misfit capabilities are characteristics of prospector organizations. While Shortell and Zajac (1990) have shown that not all health services organizations are prospectors, due to rapid changes in the health services sector in recent years, more rapid acquisition of strategic capacities may be required for all health services organizations that survive. Forced into rapid strategic capacity acquisition, health services organizations have haphazardly acquired strategic capabilities, or for prospector firms, a separate pathway may exist that has innovation and adaptive behaviors as key stepping-stones. Nevertheless, even considering these deviations, the pathway described by the Rasch analysis closely matched the hypothesized ordering.
5.2 Limitations
Although the study strongly suggests both a path-dependent continuum of strategic capacity and significant implications of such capacity for financial performance in different environmental conditions, the cross-sectional nature of these data did not capture potential long-term financial performance benefits of adopting either more methodical or more emergent strategies under various environmental conditions. For instance, although greater emergent strategic capacity was negatively associated with financial performance, this begs the question of what the lagged effects might be. Does dynamism generally punish more innovative and organic strategic learning?-or are emergent learners rewarded later for investments that have negative affects now.? Similar issues arise relative to the other environmental dimensions examined. What are the long-term implications of investing in and learning more or fewer emergent capabilities in more and less heterogeneous and hostile environments over the long run? Longitudinal data will be necessary to determine how effects of different strategic learning levels relate to organizational performance over time. In addition, although health service providers constitute a diverse industry, the sample in this study included only direct service providers. There may be differences both in the progression of strategic capacity and its performance implications for firms in other service industries and for manufacturers.
5.3 Areas of Future Research
Based on this study, there appears to be a strong possibility that strategic capacity and environmental conditions interact in a variety of ways that affect financial performance. In

Business and Economic Research ISSN 2162-4860
2013, Vol. 3, No. 2
www.macrothink.org/ber 10
particular, the relationship of environmental dynamism, strategic capacity level, and organizational financial performance. However, using longitudinal data, the dynamic developmental effects of increasing strategic capacity could be examined. This study sets the stage for such future work.
A second avenue for future research is an examination of the relative importance of each of the six modes of strategic capacity in organizational performance under varying environmental conditions. Based on this study, it appears that strategic capacities must be developed in a distinct order. For example, scanning the environment might be less valuable to organizations that have a marginally developed consciousness of analyses capability. It is analogous to being in a conversation where you can hear the other person, but do not speak the language. Equally interesting would be analysis of the importance of the strategic capacity level for different types of organizations: it may be that differences exist among organizations of different ages or of different sizes. Determining those differences would be of great benefit for practitioners.
Finally, this study looked at health care organizations whose major business is in the United States. Health services organizations doing business in other parts of the world may find that strategic capacity must be developed in a different order for better performance, or that a certain capacity interacts with environmental conditions differently. A study of differences between U.S. organizations and organizations from other countries would advance over-all understanding of strategic capacity’s interaction with the environment around the world.
References
Allison, Graham T. (1971). Essence of Decision: Explaining the Cuban Missile Crisis. Boston: Brown Little.
Ansoff, H. Igor. (1965). Corporate Strategy: An Analytic Approach to Business Policy for Growth and Expansion. New York: McGraw-Hill.
Argote, Linda. (1999). Organizational learning: Creating, retaining and transferring knowledge. Boston: Kluwer Academic Publishers.
Argyris, Chris, & Schon, Donald A. (1996). Organizational Learning II. New York: Addison-Wesley Publishing Company.
Arthur, Michael B. (1996). Careers in City Politics: The Case for Urban Democracy. Administrative Science Quarterly, 41(4), 726-728. http://dx.doi.org/10.2307/2393875
Ashby, William Ross. (1960). Design for a brain : The origin of adaptive behavior. New York: Wiley.
Bakhtin, M. M. (1986). Speech Genres and Other Late Essays (V. W. McGee, Trans.). Austin, TX: University of Texas Press.
Bond, Trevor G., & Fox, Christine M. (2001). Applying the Rasch Model: Fundamental Measurement in the Human Sciences. Mahwah, N.J.: Lawrence Erlbaum Associates.
Chan, Joseph W.K., Yung, K.L., & Burns, N.D. (2000). Environment-strategy fit: a study of

Business and Economic Research ISSN 2162-4860
2013, Vol. 3, No. 2
www.macrothink.org/ber 11
Hong Kong manufacturing logistics. Logistics Information Management, 13(5), 286. http://dx.doi.org/10.1108/09576050010378513
Chandler, Alfred D., Jr. (1962). Strategy and structure: Chapters in the history of the American industrial enterprise. Cambridge, MA: MIT Press.
Committee on Quality of Health Care in America. (2001). Crossing the Quality Chasm: A New Health System for the 21st Century. Washington, D.C.: National Academy Press.
Covin, J. G., & Slevin, D. P. (1989). Strategic management of small firms in hostile and benign environments. Strategic Management Journal, 10(1), 75-87. http://dx.doi.org/10.1002/smj.4250100107
Deming, W. Edwards. (1982). Out of the crisis. Cambridge, MA: MIT Center for Advanced Educational Services.
Dess, Gregory G., & Beard, Donald W. (1984). Dimensions of organizational task environments. Administrative Science Quarterly, 29, 52-73. http://dx.doi.org/10.2307/2393080
DiMaggio, Paul J., & Powell, Walter W. (1983). The iron cage revisited: Institutional isomorphism and collective rationality in organizational fields. American Sociology Review, 48(2), 147-160. http://dx.doi.org/10.2307/2095101
Fiegenbaum, A., & Thomas, H. (1990). Strategic groups and performance - the United States insurance industry, 1970-84. Strategic Management Journal, 11(3), 197-215. http://dx.doi.org/10.1002/smj.4250110303
Fiol, C. Marlene. (1996). Consensus, Diversity, and Learning in Organizations. In J. R. Meindl, C. Stubbart & J. F. Porac (Eds.), Cognition within and Between Organizations (pp. 173-206). Thousand Oaks, CA: Sage.
Ford, Eric W., Ginter, Peter, M., & Duncan, W. Jack. (2000). The confusing words of strategy: Improving teaching and research. Paper presented at the Southwest Academy of Management, San Antonio, TX.
Fredrickson, J. W. (1984). The comprehensiveness of strategic decision processes: Extensions, observations, future directions. Academy of Management Journal, 27(3), 445-466. http://dx.doi.org/10.2307/256039
Fredrickson, J. W. (1986). The strategic decision process and organizational structure. Academy of Management Review, 11(2), 280-298.
Friedlander, F. (1983). Patterns of Individual and Organizational Learning. In S. Srivastva (Ed.), The Executive Mind. San Francisco: Jossey-Bass.
Goll, I., & Rasheed, A. M. A. (1997). Rational decision-making and firm performance: The moderating role of environment. Strategic Management Journal, 18(7), 583-591. http://dx.doi.org/10.1002/(SICI)1097-0266(199708)18:7<583::AID-SMJ907>3.0.CO;2-Z
Gould, Stephen J. (1988). Macrodynamic Trends in Health Care: A Distribution and Retailing

Business and Economic Research ISSN 2162-4860
2013, Vol. 3, No. 2
www.macrothink.org/ber 12
Perspective. Health Care Management Review, 13(2), 15.
Huber, George P. (1991). Organizational learning: An examination of thecontributing processes and the literatures. Organizational Science, 2, 88-115. http://dx.doi.org/10.1287/orsc.2.1.88
Kogut, Bruce, & Zander, Udo. (1992). Knowledge of the firm, combinative capabilities, and the replication of technology. Organization Science, 3(3), 383-397. http://dx.doi.org/10.1287/orsc.3.3.383
Kohn, Linda T., Corrigan, Janet M., & Donaldson, Molla S (Eds.). (2000). To Err is Human: Building a Safer Health System. Washington, D.C.: National Academy Press.
Kusunoki, Ken, Nonaka, Ikujiro, & Nagata, Akiya. (1998). Organizational capabilities in product development of Japanese firms: A conceptual framework and empirical findings. Organization Science, 9(6), 699-718. http://dx.doi.org/10.1287/orsc.9.6.699
Leontiades, Milton. (1982). The confusing words of business policy. Academy of Management Review, 7, 45-48.
Miller, Danny, & Friesen, Peter H. (1984). Organizations: A quantum view. Englewood Cliffs, NJ: Prentice-Hall.
Miller, Danny. (1996). A preliminary typology of organizational learning: Synthesizing the literature. Journal of Management, 22(3), 485-505. http://dx.doi.org/10.1287/orsc.9.6.699
Morgan, Robert E, & Hunt, Shelby D. (2002). Determining marketing strategy: A cybernetic systems approach to scenario planning. European Journal of Marketing, 36(4), 450. http://dx.doi.org/10.1108/03090560210417264
Nonaka, Ikujiro. (1995). The knowledge-creating company: How Japanese companies create dynamic of innovation. New York: Oxford University Press.
Popper, M., & Lipshitz, R. (2000). Organizational learning: Mechanisms, culture, and feasibility. Management Learning, 31(2), 181-196. http://dx.doi.org/10.1177/1350507600312003
Priem, Richard L., Rasheed, Abdul M., & Kotulic, A. G. (1995). Rationality in strategic decision processes, environmental dynamism and firm performance. Journal of Management, 21(5), 913-929. http://dx.doi.org/10.1177/014920639502100506
Ronda-Pupo, Guillermo Armando, & Guerras-Martin, Luis Ángel. (2012). Dynamics of the evolution of the strategy concept 1962–2008: a co-word analysis. Strategic Management Journal, 33(2), 162-188. http://dx.doi.org/10.1002/smj.948
Schiller, Stefan. (2014). Financial Information Related to Dynamic Capabilities: The Corporate Innovation Platform. Research in Business and Management, 1(1), 2-27. http://dx.doi.org/10.5296/rbm.v1i1.4496
Senge, Peter M. (1990). The Fifth Discipline: The Art and Practice of the Learning

Business and Economic Research ISSN 2162-4860
2013, Vol. 3, No. 2
www.macrothink.org/ber 13
Organization. New York: Doubleday Currency.
Sorensen, Jesper B. (2002). The strength if corporate culture and the reliability of firm performance. Administrative Science Quarterly, 47, 70-91. http://dx.doi.org/10.2307/3094891
Steiner, George A. (1997). Strategic Planning: What Every Manager Must Know. New York: Free Press.
Taylor, Frederick Winslow. (1911). The principles of scientific management (3rd ed.). New York: Harper and Brothers.
Venkatraman, N. (1989). The concept of fit in strategy research: Toward verbal and statistical correspondence. Academy of Management Review, 14(3), 423-444.
Wood, D. R. Jr., & LaForge, R. L. (1979). The impact of comprehensive planning on financial performance. Academy of Management Journal, 22(3), 516-526. http://dx.doi.org/10.2307/255741
Wood, D. R. Jr., & LaForge, R. L. (1981). Toward the development of a planning scale: An example from the banking industry. Strategic Management Journal, 2(2), 209-216. http://dx.doi.org/10.1002/smj.4250020209
Copyright Disclaimer
Copyright reserved by the author(s).
This article is an open-access article distributed under the terms and conditions of the Creative Commons Attribution license (http://creativecommons.org/licenses/by/3.0/).

Business and Economic Research ISSN 2162-4860
2014, Vol. 4, No. 1
www.macrothink.org/ber 14
A Quantitative and Theoretical Analysis of Ghana’s Internal Migration, Economic Growth and poverty
Reduction: A Disaggregated Approach, from 1980 to 2012*
Nicholas Awuse (Corresponding author)
Bolgatanga Polytechnic
P. O. Box 767, Sumbrungu, Bolgatanga, Ghana
Tel: 233-243-924-839 E-mail: [email protected]
Patrick Tandoh-Offin (PhD)
Ghana Institute of Management and Public Administration (GIMPA)
P. O. Box AH-50, Achimota-Accra, Ghana
Tel: 233-247-450-433 E-mail: [email protected]
Received: October 10, 2013 Accepted: November 1, 2013
doi:10.5296/ber.v4i1.4972 URL: http://dx.doi.org/10.5296/ber.v4i1.4972
Abstract
The study here was meant to examine the consequence of Ghana’s government spending on economic growth, internal migration and poverty reduction in Ghana using a disaggregated approach. It reveals that intensifying government outflow has not yielded any meaningful development in Ghana. Many researches had been conducted on the actual link connecting government expenditure, internal migration, economic growth and poverty reduction. Many of the studies until today have used the aggregate approach which has not yielded the desired results hence there is the need to vary the methodology.
This study made use of the data for the period (1980 - 2012). The findings from the study shows that Government total capital expenses (GTE), total recurrent outflows (GOF), Government cost on education (GCE) and power (POW) on the contrary, impacts negatively on economic growth and was significant. On the other hand, increasing Government spending on transport and communication (GCTC), and health (GDH) leads to an increase in economic

Business and Economic Research ISSN 2162-4860
2014, Vol. 4, No. 1
www.macrothink.org/ber 15
growth. From the results above, the authors advised that there should be public private participation in critical sectors of the Ghanaian economy in the areas of power and transport in order to accelerate the rate of development in Ghana. In addition to this recommendation, government should be more transparent and accountable in her spending.
Keywords: Government expenditure, Economic growth, Poverty reduction, Power, Health, Transport, Communication
1. Introduction
There is a serious argument among scholars around the world about the relationship between government spending, internal migration and its influence on economic growth. Governments over the world have two basic functions namely, protection (security) and provision of certain essential public goods, Nurudeen and Usman (2010). The protection function consists of the maintenance of rule of law and the enforcement of property rights. These have the potential to reduce the risks of criminality; protect life, property, and defend the nation from foreign attacks. The provisions of public goods such as defense, roads, education, health, and power, to mention a few are very important for any nation’s development.
Development specialists are of the view that if government spending on socio-economic and physical infrastructure equally across the country increases, it will encourage economic growth; reduce internal migration, and reduce (add) poverty. A typical example is government expenditure on health and education which are vital, and increases the productivity of labour which raises the growth of national output. In the same vein, expenditure on infrastructure such as roads, communications, power, etc, reduces production costs, increases private sector investment and profitability of firms, thus nurturing economic growth. Low educational attainment is known to be a major factor underlying the exclusion of the poor from the opportunities that come with economic growth ( Awuse et al 2014) Ravallion and Datt, 2003).
On the other hand, a number of experts hold a different view and maintain that mounting government spending supports economic growth and ultimately reduces poverty. As an alternative, they call attention to higher government expenditure may contract the overall performance of the economy. For instance, in an effort to increase expenditure, government may raise taxes and/or borrow and crowds out private investment. If there are superior income taxes, it discourages individuals from working for long hours, applying for promotions in the case of regressive tax or even searching for jobs which have the potential to reduce income and aggregate demand. Nevertheless, more profit tax tends to add to production costs and reduce investment expenditure as well as profitability of firms. In Ghana, government disbursement has continued to rise as a result of massive receipts from production and sales of crude oil, and better demand for public goods like roads, communication, and power, Education, Health and Water. Moreover, there is a need to make available both interior and external safety measures for the people and the nation.
Available figures show that government machinery and total spending have continued to go up in the last three decades. In a similar manner, the total government continuous expenditure shows that expenditure on defense, internal security, education, health, agriculture,

Business and Economic Research ISSN 2162-4860
2014, Vol. 4, No. 1
www.macrothink.org/ber 16
construction, transport and communication increased during the period under review. In addition, the various components of capital expenditure that is, defense, agriculture, transport and communication, education, power, and health also show a rising development between 1980 and 2012.
2. Problem Statement
In Ghana, public outflow has a tremendous role to play in reducing regional inequalities, developing social overheads, establishing infrastructure for economic growth in the form of transport and communication conveniences, education and training, growth of capital goods, industries, research and development, were fundamental (Sinha, 2007). A public cost on infrastructure plays a basic role in this economy. According to Dickey and Fuller (1979), the appliance in which government expenses on public infrastructure was anticipated to affect the efficiency of economic growth and minimize poverty depends largely upon the accurate form and size of total public expenditure billed to economic and social development projects in the economy (Guest, 2003). When communal expenditure was incurred, by itself it may be directed to meticulous investments or to bring about re-allocation of the investible resources in the private sector of the economy.
This effect, therefore, was principally in the nature of rearrangement of resources from less to more desirable lines of investment. A vital way in which public expenditure can speed up the pace of economic growth was by tightening down the difference between social and private marginal productivity of confident investment. At this juncture, public expenditure on social and economic infrastructure like education, health, transport, communication, waste disposal, electricity, water and sanitation can make a payment to the show of the economy and hence reducing poverty and internal migration in Ghana. Murphy (2002) notes that internal migration has made major contributions to development, by accelerating economic growth, building up cities and establishing rural–urban linkages and return flows.
3. Literature Review
According to Laudau (2003), the share of government consumption to GDP reduces economic growth was consistent with the pro-market view that the growth in government constrains overall economic growth. These findings were significant to varying the sample periods, weighing them by population and a mix of both developed and developing countries (104 countries). Also Ram (1986) makes a rigorous attempt to incorporate a theoretical basis for tracing the impacts of government expenditure to growth through the use of production functions specified for both public and private sectors. The data spanned 115 countries to derive broad generalizations for the market economic investigated. It was discovered that government expenditure has significant positive externality effects on growth particular in the less developed countries (LDC) sample, but total government spending had a negative effect on growth. Lin (1994) uses a sample of 62 countries (1960 – 1985) and found that non- productive spending had no effect in growth in the advance countries but a positive impact in LDCs. In Ghana, government expenditure does not necessarily lead to economic growth; reduce internal migration and promote development.

Business and Economic Research ISSN 2162-4860
2014, Vol. 4, No. 1
www.macrothink.org/ber 17
Again, many Ghanaians are still experiencing poverty and more than 50 percent of them cannot make ends meet as defined by the United Nation. More so, poor infrastructure generally in Ghana has contributed partly to the falling down of many industries, thus increasing the rate of unemployment. Apart from the above, macroeconomic indicators have not also perform well over the years. It does well only in theory but in practice, it does reflect in the lives of Ghanaian. Therefore, the primary aim of this study is to explore the consequence of government expenditure on economic growth in Ghana. The study concerns itself with some fundamental questions below.
Firstly, does government expenditure have a significant influence on economic growth, internal migration and poverty reduction in Ghana? Secondly what policy measures must be adopted to improve management of government expenditure? Hence, the following hypotheses were formulated to guide the study.
H01: Government total capital expenditure does not have significant influence on economic growth and poverty reduction in Ghana.
H02: Government total capital expenditure has significant influence on economic growth and poverty reduction in Ghana.
H03: Government expenditure on transport and communication does not have significant influence on economic growth and poverty reduction.
H04: Government expenditure on transport and communication has significant influence on economic growth and poverty reduction.
4. Research Method
This lesson adopts graphic research design. As a result, the investigative tool used was the single equation, concerning the use of the ordinary least squares (OLS) multiple regression techniques. The government expenditure and the agencies work well to determining economic growth and poverty reduction. The model of this study therefore expresses economic growth (GRY) as a function of various levels and components of government expenditure which include Total Capital Expenditure (GTE), Poverty Reduction (PR) as a function of education and health, Total Recurrent Expenditure (GRE), Expenditures on Defense (ED), Agriculture (AGRE), Transport and Communication (ETC), Education (GEED), Power (POW) and Health (GEH). Thus, the growth model and poverty reduction is specified as follows and all the variables are equally well defined for clarity and analytical purposes:
GRY= β0 + β1 GTE + β2 GRE + β3 ED + β4 AGRE + β5 GEED + β6 GEH + β7 GETC +
β8POW + μ
GRY= - 0.745 + 0.004 + 0.030 - 0.767 – 0.052 + 0.112 + 0.121 + 0.420 + 0.056
Economic growth refers to the changes in real GDP. Real GDP in turn is obtained by dividing GDP at current market price by the consumer Price Index (CPI). According to experts, poverty reduction was to have access to essential needs as Education, Health and food, GRE was measured as total recurrent expenditure divided by the CPI. GTE is captured by the total capital
Business and Economic Research ISSN 2162-4860
2014, Vol. 4, No. 1
www.macrothink.org/ber 18
expenditure divided by CPI. AGRE is captured by government expenditure on agriculture divided by CPI. GEH is measured as government expenditure on health divided by CPI. GEED is captured by government expenditure on education divided by CPI. GETC is measured as government expenditure on transport and communication divided by CPI. POW is captured by government expenditure on power divided by CPI. Thus, we assumed the expenditure items to be actual expenditures. Prior estimation of the growth model above, standard econometric tests like stationary test and co-integration test was conducted in order to avoid the generation of spurious regression results.
5. Results and Discussion
In this equation we regressed all the explanatory variables on growth and poverty reduction model. The regression results showed that the explanatory variables jointly account for approximately 55 percentage changes in economic growth. The results showed that only health (GEH) and transport and communication (GETC) were correctly signed in support of the prior expectation, the other explanatory variables were negatively signed against a priori expectation.
The constant term which was the autonomous expenditure, that is government expenditure when all other explanatory variables were fixed was 15.9 percent. The estimation results also show that-total capital expenditure (GET), recurrent expenditure (GRE), expenditures on transport and communication (GETC), education (GEED), and health (GEH), were statistically significant in explaining the changes in economic growth. However, expenditures on defense (ED), power (POW) and agriculture (AGRE) were not significant in explaining economic growth. The Durbin Watson Statistic (2.10) shows the absence of auto correlation. The results also showed that 1 percentage increase in total capital expenditure in the previous two years causes economic growth to decline by 0.004 percentages.
On the other hand, a 1 percentage increase in total recurrent expenditure in the previous one year leads to 0.004 percentage decrease in economic growth. These findings were consistent with the research reported by Laudau (2003), that government expenditure may slowdown economic growth. The misallocation, mismanagement and diversion of public funds may have accounted for the negative impact of total capital and recurrent expenditures by government officials and political appointees. Also, one (1) percent increase on government expenditure on transport and communication in the previous one year results to an increased in economic growth by approximately 0.420 percentage. Thus, higher government expenditure on transport and communication creates an enabling environment for businesses to strive through reduced cost of production. Besides, the estimation shows that a one percentage increase in government expenditure on education in the previous one year causes economic growth to decline by approximately 0.112 percent. This was not surprising because funds meant for the development of the education sector have not been properly utilized and in most cases embezzled, thus precipitating the incessant strike by University Teachers Association of Ghana (UTAG), Polytechnic Teachers Association of Ghana (POTAG), Colleges of Education Teachers Association of Ghana (CETAG), Ghana National Association of Teachers (GNAT). Moreover, the estimated results indicated that a 1 percent increase in expenditure on health in the previous

Business and Economic Research ISSN 2162-4860
2014, Vol. 4, No. 1
www.macrothink.org/ber 19
one year leads to approximately 0.121percent increase in economic growth.
The government expenditure on health improves the health status and productivity of people, thereby promoting economic growth. The regression results also illustrated that a 1percentage change in expenditure on power in the previous year results to approximately 0.56 percentage decreases in economic growth. This is not surprising given the fact that in the last twenty decades before 1999, the power sector lacked gross neglect.
Also the billions of dollars spent between 1990s and 2010 by the administration of Presidents Mobutu Sese Seko of then Zaire, and Sani Abacha and Olusegun Obasanjo of Nigeria could not be accounted for. This has resulted in the poor performance of the power industry and the economy at large given the critical role of the power sector in economic development.
5.1 Data Discussion
Data availability is a major problem confronting African Countries including Ghana. Two major factors account for the scarcity of data on government expenditure and economic growth. The first is the unwillingness of governments to be open about the true cost of their expenditure on the various sectors of their economies. Some governments generally regard this information as an official state secret and are wary of revealing it. For African states, as for many other developing countries, withholding information on defense for example has three main attractions. One is to avoid criticism from within the country about the extent of the resources committed to defense in relation to other sectors, especially health and education. This is particularly true of states whose resources are meager. A second is the belief that making such information available will be tantamount to opening up the defenses of the state to others, especially neighboring countries - that knowledge of a country’s strength will make it vulnerable. The third is that defense, with all the secrecy associated with it, and is a fertile source of corruption for those directly in charge of the portfolio.
It follows that, unless they were compelled to do so or unless there were reasons beyond their control, many African states were not willing to make such information available. The second reason for lack of information in the defense sector was the lack of capacity to report exact expenditure on the military. Over the years this capacity has diminished in many African states because they have lost highly qualified professionals from the government service to the better-paid private sector, including several donor projects.
Other professionals have migrated abroad within the context of the widely reported brain drain, leaving less qualified and usually less competent officers behind. Where highly qualified individuals are still left they are often too few and far between to make any appreciable impact on the budget process. In such states, the political leaders can then exploit this weakness to siphon off resources by diverting significant amounts of state money to defense, knowing full well that they will not be obliged to account for it.
5.1.1 The Reliability of the Data
Not only are expenditure data on defense, power, health and education scarce, but the quality of the data that are available is also very low. The problem of the reliability of the available data
Business and Economic Research ISSN 2162-4860
2014, Vol. 4, No. 1
www.macrothink.org/ber 20
emanates from three factors. The first is the unwillingness of governments to be open about the true cost of their expenditure establishments; in particular, they hide the actual cost of their investment in arms procurement. Such information is regarded as a state secret. The second is the dearth of qualified staff mentioned above, and the third was the reasons for which data are collected and provided.
This study argues that the nature of the reason that motivates a state to provide military expenditure data largely dictates the quality of the data, and hence their reliability. If Ghana Government is compelled by external actors to provide information will be more inclined to give misleading data than one which provides the data as part of routine government work. A large number of African states are now compelled to publish their expenditure, either as a result of demands by donors who provide budget support and want evidence of proper accounting or as a result of strong local demand by critical segments of their societies. Others publish the data purely as part of a routine government accounting procedure, and such data are likely to be of better quality, although reduced state capacity may still take its toll.
Reliability alone does not guarantee the validity of data if valid data are taken to be data that truly capture the whole of a country’s spending. A piece of data may be reliable without being valid. The fact that data emanate from government cannot guarantee their validity, since a government could doctor the data to suit its purposes. The problem of constant changes to the heading under which defense, power, health expenditures are budgeted or reported also arises here. A particular item might be listed in one budget under the ministry of defense or otherwise, in another under a ministry for the health, education and in yet another under the ministry for security. Sometimes the change will amount to no more than a change in nomenclature; at other times it could involve a significant impact on the composition of the budget.
This can greatly affect the validity of data, especially in longitudinal studies. If the composition of data changes repeatedly during the period being studied, a study may not be able to measure adequately what it purports to measure.
Data were derived from secondary sources. Pools of data were extracted from publications of the State of the Ghanaian Economy, Ghana Government Budget and Economic Policy Statement for Various Years, Ghana Statistical Service Yearly Report, The world Economic out Look 2006-2009, ISSER and CEPA annual reports. The sample data contain all the six sectors in which government carried out expenditure. The sample data used cover the period 1980 to 2012; and the sectors covered are six in number namely: defense (ED), agriculture (AGRE), transport and communication (GETC), education (GEED), power (POW) and health (GEH). The Regression Analysis was run by Econometric Stata.
5.1.2 Policy Direction
Facilitating government expenditure and economic growth in Ghana can minimize the level of internal migration and encourage even development in every aspect of Ghana. This will reduce inequalities in resource allocation and views every sector as important contributing to overall development of Ghana. Ghana government can make it a policy for every sector to submit data to the statistical service as a quarterly or monthly requirements, this will make the data more

Business and Economic Research ISSN 2162-4860
2014, Vol. 4, No. 1
www.macrothink.org/ber 21
reliable than to wait for donor agencies to demand data from them before they start generating fake data for them. But managing government expenditure to promote economic growth and reduce internal movement of people to seek for greener pastures will minimize in order to maximise the benefits economic growth while reducing costs and risks requires effective partnerships between governments, civil society, private sector organisations and donors.
6. Conclusion and Recommendations
The study aims at examining the consequence of government spending on economic growth, discouraging internal migration by ensuring even distribution of resources to all the regions and reduces poverty in Ghana using a disaggregated approach. The experimental results revealed that the negative total current expenditure significantly influences economic growth in Ghana. Although, the negative total capital expenditure significantly influences the economic growth in Ghana, yet the impact of government expenditure on transport and communication on economic growth was positive and significant. On these foundations, the following recommendations are proffered:
(1) Government should not play politics with expenditure on public goods just to win cheap popularity.
(2) The capital expenditure of government which spurs economic growth is presently at about 30 percent of total government expenditure, against recurrent expenditure of 0.004 percent. This trend, if reversed quickly would guarantee economic growth and reduce poverty.
(3) Government should keep an eye on the contract awarding process of capital projects closely, to prevent over estimation of implementation cost. This will bring about significant impact of public investment spending on economic growth.
(4) There should be successful channeling of public funds to productive activities, which will have a significant collision on economic growth.
(5) Government utilization spending should be well harmonized by all arms of government to prevent “Crowding out” effect on government investment.
References
Central Bank of Ghana (2007). Annual Report and Statement of Account. December 31, pp.23
Central Bank of Ghana (2008). Annual Report and Statement of Account. December 31, pp. 28
Central Bank of Ghana (2009). Annual Report and Statement of Account. December 31, pp. 35
Deloitte (2010). National Health Insurance Authority: Revenue and Expenditure Account for the Year Ended December 31, 2008, Accra.
Dickey, D. A., & Fuller, W. A. (1979). Distributions of the Estimators for Autoregressive Time Series with a Unit Root, Journal of the American Statistical Association, 74, 427-431.
Ecorys Macro Group (2010). Republic of Ghana Public Expenditure and Financial Accountability 2009. Public Financial Management Performance Assessment Report, Volume

Business and Economic Research ISSN 2162-4860
2014, Vol. 4, No. 1
www.macrothink.org/ber 22
I: Central Government, Accra.
Global Partnership for Education (2010). Mid-Term Evaluation of the EFA Fast Track Initiative, Washington D.C.
Guest, P. (2003). Bridging the Gap: Internal Migration in Asia, Population Council Thailand, paper prepared for the Conference on African Migration in Comparative Perspective, Johannesburg, South Africa, 4-7 June.
International Monetary Fund (2011). Ghana: Financial System Stability Assessment Update, Country Report 11/31, June, Washington D.C.
Laudau D. (2003). Testing Wagner’s Law for Turkey, 1960-2000. Review of Middle East Economics and Finance, 1(12), 129-140.
Lin, W. (1994). A Re-examination of Wager’s Law for Ten Countries Based on Co-integration and Error Correction Modeling Technique. Applied Financial Economics, 14, 577-589.
Murphy, R. (2002) How Migrant Labour is Changing Rural China, Cambridge: Cambridge
Nigerian Stock Exchange Fact Book (2001). 2005 and 2010 Editions, Published by Pathways Communications Ltd, Lagos State.
Nurudeen A. & A. Usman (2010). Government Expenditure and Economic Growth in Nigeria, 1979-2008: A Disaggregated analysis. Business and Economics Journal, 4, 1-11.
Ram, A. (1986). Causality between Income and Public Expenditure: A Broad International Perspective. Public Finance, 41(1), 393-414.
Ravallion, M., & Datt, G. (2003). Is India’s Economic Growth Leaving the Poor Behind? World Bank Policy Research Working Paper No 2846, Washington, DC: World Bank.
Sinha, D. (2007). Does the Wagner’s Law Hold for Thailand? A Time Series Study, Available online at http://mpra.ub.uni-muenchen.de/2560/
World Bank (2010b). Republic of Ghana: Improving the Targeting of Social Programs, Washington D.C.
World Bank (2011a). Republic of Ghana: Tackling Poverty in Northern Ghana, Washington D.C.
World Bank (2011b). Republic of Ghana: Improving Equity, Efficiency and Accountability of Education Service Delivery, Washington D.C.
Copyright Disclaimer
Copyright reserved by the author(s).
This article is an open-access article distributed under the terms and conditions of the Creative Commons Attribution license (http://creativecommons.org/licenses/by/3.0/).

Business and Economic Research ISSN 2162-4860
2014, Vol. 4, No. 1
www.macrothink.org/ber 23
What factors Influence Internal migration and Wage Growth? an Empirical Analysis of Private Formal
Sector in Bolgatanga-Ghana
Nicholas Awuse (Corresponding author)
Bolgatanga Polytechnic
P. O. Box 767, Sumbrungu, Bolgatanga, Ghana
Tel: 233-243-924-839 E-mail: [email protected]
Patrick Tandoh-Offin (PhD)
Ghana Institute of Management and Public Administration (GIMPA)
P. O. Box AH-50, Achimota-Accra, Ghana
Tel: 233-247-450-433 E-mail: [email protected]
Received: November 3, 2013 Accepted: November 25, 2013
doi:10.5296/ber.v4i1.4973 URL: http://dx.doi.org/10.5296/ber.v4i1.4973
Abstract
The primary aim of this study is to explore the determinants of wage growth velocity in personal formal sector of Bolgatanga Municipality. A primary data collection technique was used and sample size of 345 individuals interviewed using a well structured interview schedule and questionnaire by convenient sampling. Ordinary least square method was applied to study the dependency of growth rate of wage on different variables in Bolgatanga Municipality. Findings reveal that education, gender, experience, household area and marital status of the respondents absolutely affect growth of wages at less than 1% level of significance.
Keywords: Wage Growth, Private Formal, Bolgatanga, Education, Gender, Experience, internal migration, Household area, Marital Status, Ghana.
1. Introduction
Conventionally high wages were linked to high education. According to the theorists of human capital wages were intended to reward workers in progress and future revenues, graduates with advanced levels of education should be paid more than graduates with lower levels of

Business and Economic Research ISSN 2162-4860
2014, Vol. 4, No. 1
www.macrothink.org/ber 24
education. As a result, savings in education graduates may look forward to be paid with certain “superfluous” financial return (Becker, 1964). Spence (1973) came out with alternative theory to explain the salary bonus paid to academic degree holders. He argued that graduates may acquire some natural skills compulsory to get the educational credential; accordingly, despite the consequences the potential human capital gains obtained in the university, the degree would act as a signal of such natural superior ability. It was estimated that in 2001, close to 120 million people were estimated to migrate internally in China, compared to the mere 458,000 people migrating internationally for work (Ping 2003). In India too, internal migration numbers run into millions while international migration was only a fraction of this (Srivastava and Sasikumar 2003). In Ghana it was estimated that more than 70% of the total population migrated internally over the years.
Becker (1962) and Mincer (1974) have long-established that education and schooling were the core determinants of human resources buildup and in turn, positively and frankly related with individuals lifetime wage earning. Proceeds to education in Mincerian earning function denoted with coefficient of school years that was, how much extra wage earning was taking place with an extra year of schooling. There was enough literature availability to examine the return to education for various countries including Ghana. In Bolgatanga, most household surveys made available sufficient information about many variables such as, completed years of schooling, starting school age, school quality and teaching related to technical education.
As a result of variables like lost data on school years completed, researcher can neither estimate probable experience nor compute the impact of one extra year of schooling on respondent’s wage earnings. Consequently, the existing literature in Ghana was missing in functioning out total returns to education presented by Mincerian earning function.
In this study, we would scrutinize the determinants of wage growth of persons. For measuring wage growth of individuals we have taken a case study of Bolgatanga. Ghana has ten administrative regions: These regions are; Greater Accra; Ashanti, Northern, Western, Eastern, Volta, Brong Ahafo, Central, Upper East and West Regions.
Bolgatanga municipality is located at the North Eastern part of Ghana. Bolgatanga Municipality has three zonal districts, namely Sumbrungu-Sirigu, Bolgatanga Central and Zuarungu.
The main objective (s) of this study was among other thing to estimate the factors that determine the wage growth of individuals in Bolgatanga Municipality. Series of research has been conducted in this area nevertheless there was no study that touched on wage growth of private ceremonial sector in Bolga, that calls for supplementary research work. The conclusion of this work would be very supportive for the determinants of Wage growth of private formal sector in Bolga.
2. Literature Review
According to the literature review on determinants of wage of individuals; Hawke, Anne (1998); explored the impact of computer skills on wage for males and females in Australia. Applying OLS method on the data taken from 1993 Survey of Training and education

Business and Economic Research ISSN 2162-4860
2014, Vol. 4, No. 1
www.macrothink.org/ber 25
experience, it was disclosed that the effect of usage of computer on wage earning differs with respect to different types of uses. Computer skills itself do not determine the labour market returns, nevertheless, returns to computer skills were depend upon the type of used.
According to Faridi et. al., (2010); investigated the effect of different level of education on students’ earnings. Applying OLS method on data collected from ground inspection about different levels of education of students it was found that years of completed education & experience are positively interrelated to income of students.
In addition, the above; Ekstrom and Erika (2003); examined the impact of obligatory and upper secondary level of education on earning of individuals using longitudinal individual data. Applying OLS technique on longitudinal individual data she concluded that adult secondary education caused reduction in earnings in case of Swedish males. However, no evidence was found for Swedish females.
Soto (2009); investigated the causality between education and aggregate level of income. By using panel regression, he found that there is a link between completed years of schooling and Gross Domestic Product (GDP). Most important conclusion of this study was that an important determinant of income disparity was quality of schooling.
It was also revealed that Shah (2007); conducted research and concluded determinants of women’s earnings. Model was based on Mincerian equation. Applying Mincerian model on data gather on experience, level of education and monthly salary of female teachers from public educational institutions and conclude that there was positive consequence of higher education on earning of female teachers.
It was revealed Moheyuddin (2005); explored connection between gender discrepancy in level of education, income, growth & development. He has completed and that there is positive relationship between improvements in gender equality and per capita income, and for economic growth gender inequality was not good.
Comi and Brunello (2000); explored the relationship between education and the effects of education on growth of earnings. They collected the Cohort data from eleven European countries and they found differences in growth of earnings at different levels of education.
Tinbergen (1971); explored the effects of education on distribution of income. He used cross sectional data and concluded that dispersion in years of education while these dispersions are higher or smaller would reduce level of inequality in USA, Neither land & Canada moderately only.
According to Asadullah and Niaz (2005); investigated the total labour market returns in Bangladesh. Using Mincer-Beckerian approach revealed that there is much heterogeneity in returns. Estimates of earning returns were higher for urban sample than rural, and also higher for female than male sample. Method applied on the model was OLS method.
Dah et. al., (2006); explored the determinants of male and female earnings in Urban Lebanon. Applying multiple Regression analysis on cross-sectional data of labor force they found that there is gender differential in earnings in Lebanon.

Business and Economic Research ISSN 2162-4860
2014, Vol. 4, No. 1
www.macrothink.org/ber 26
Aslam and Munazza (2002); investigated the determinants of private return to education for male and female wage earner in Pakistan. Applying OLS, Heckman Correction, 2SLS and Household fixed effects on Pakistan Integrated Household Survey (2002) they found that total labor market returns are higher for males but the returns to education are higher for females.
As a result of the above conclusion, it was recommended that there is likelihood that parents may have an encouragement to assign more possessions in boys than to girls within the same household.
3. Research Methodology
The methodology looks at a model specification, data requirements and source of data. The study was based on primary data taken from Bolgatanga. The data was collected to see how growth of earning of individuals was pretentious by many explanatory variables like education, gender, experience, household locality, age and marital status.
In Ghana for example, about 40% of the total population moved within the country, and out of these number, about 70% of migrants came mostly from the three northern regions (Northern, Upper East and Upper West) and Volta regions towards the cocoa growing and mineral deposits areas in the southern parts of the country especially Ashanti and Western Regions. However, the remaining regions moved within urban centres and outside the country for better living conditions.
Bolgatanga is the area of our research. The complete population related to formal and private sector in Bolgatanga were considered world of our study. The relevant data for the study was collected from primary sources. A random sampling method was adopted in order to categorize a sample, where each working person in private sector was discovered and interviewed. During the interview, we asked some questions to the People related to their educations, age, experiences. Our sample size was 345 respondents in Bolgatanga. The interview schedule was used because this was the best tool to gather maximum first hand information. The interview schedule was prepared on the bases of a questionnaire. Each respondent was interviewed through structured questionnaire, as structured question were more reliable and they reduced the error of question wording. For the duration of the preparation of the interview schedule, care was taken not to include, ambiguous, vague and misleading questions, so, that the questions could be communicated accurately resulting in accurate responses. In this study, both open and closed ended question were used. To be sure about the achievability of the interview schedule and to ensure that all questions were being communicated accurately, a pre-testing was conducted in Zaire. After pre-testing, some of the questions which were not found appropriate were dropped and some of the questions were customized and added. The interview was completed in 3 weeks. Respondents were asked to express their true personal attitudes and experiences about this particular issue. After interviewing, all the respondents data was edited.
3.1 Logs-Linear Regression
Log Linear regression was an approach to modeling the association between a dependent and independent variable in which regressand (dependent variable) was Logarithmic because it

Business and Economic Research ISSN 2162-4860
2014, Vol. 4, No. 1
www.macrothink.org/ber 27
measures growth of dependent variable.
3.2 Model Specification and Operational Definitions of Variables
According to our research requirement we have to analyze the impact of variables like education, gender, marital status, household area and experience on log wage. Our model was log-linear model.
The relationship between the dependent and independent variable is;
Log wage = f (education, gender, experience, household area, marital status, age)
Log wage = loge wage measured as log of cedis earned per month.
Education = education measured as Intermediate = 0, Graduation = 1, Masters = 2
Gender = Define gender as Male = 1, Female = 0
Age = 0-15 =0, 16-25 =1, 26 -35 = 2, 36 – 45 = 3
Household = Define household locality as Urban = 1, Rural = 0
Marital status= Define marital status Married = 1, Single = 0, divorced = 2, separated = 3
4. Results and Discussion
Analysis of data was done using ordinary least square method in stata. Factors of internal migration and growth rate of wage of private formal sector was explored using log-lin model. Log wage was regressed on gender, age, education, experience, household area and marital status.
Table 1. Model Summary
Model R R-Square Adjusted R Square Standard Error Estim Durbin Watson 1 0.0173 0,030 0.013 1.26805 1.565
Source: Field Work 2013
Table 1 explains various measures of model fitness as R2, Adjusted R2 and Durbin Watson d statistic for the detection of model specification error and autocorrelation. The co-efficient of determination R2 was an important measure of goodness of fit of fitted regression model that was found out how “well” the sample regression line fits the data.
More simply, it shows the proportion of variations in dependent variable due to all explanatory variables included in the model. Its value always lie between 0 and 1, greater the value of R2 larger (closer to 1) the evidence of goodness of fits. In our study R2 = 0.030 which shows total variations in log wage was due to all the explanatory variables like gender, education, Experience, Household area and marital status.
Predictors: (Constant), gender, education, Experience, Household area, marital status
We increased the number of explanatory variables than R2 increases, to control this effect we adjust the degrees of freedom in R2 and obtain adjusted R2. The value of Adjusted R2 shows

Business and Economic Research ISSN 2162-4860
2014, Vol. 4, No. 1
www.macrothink.org/ber 28
that variations in log wage due adjusted fluctuations in all explanatory variables included in our model.
We used Durbin Watson d statistic to detect autocorrelation and any type of specification error in our regression model. A rule of thumb, if the value of Durbin-Watson is 2 in an application, than it can be believed that there is no autocorrelation, either positive or negative. Table 1shows that in our model DW is 1.555 so, using table values of DW it is observed that there is no autocorrelation or any type of model specification error.
Predictors: (Constant), gender, education, Experience, Households area, Marital Status
Table 2. ANOVA Model Sum of Squares Df Mean Square F. Sig Regression 16.765 6 2.793 1.737 0.112 Residuals 543.490 338 1.608 Total 560.249 344
Source: Field Work 2013
Table 2 gives ANOVA that explains total variations (TSS) in explained (ESS) and unexplained or residual (RSS) variations. In our study ESS is 16.765 which are 0.030% of total variations and this is variations in log wage due to fluctuations in all explanatory variables.
The residual sum of square shows the variations in dependent variable that were not due to explanatory variables included in our model. RSS in our study was 543.490 indicates that there was 543.490 variations in log wage due to residuals which was total variations. The use of F-test statistic is made in order to examine the overall significance of the model. Value of F-test statistic is 1.737 which shows that model was not significant at 100 percent confidence level.
Table 3. Shows regression coefficients
Model Substandard Coefficients
Standard Error t. Signif Collinearity
B Standard Error Beta T Si Tolerance VIF(variance
inflation factor) constant 2.968 1.425 6.988 0.000 gender 0.021 1.138 0.008 -0.0152 0.88 .997 1.003
education 0.006 0.042 0.008 0.143 0.0886 .980 1.020 experience -0.072 0.046 0.085 -1.580 0.115 .981 1.020 Household
area 0.009 0.011 0.045 0.0822 0.0412 .971 1.030
Marital status 0.050 0.025 0.105 1.958 0.051 .988 1.012
age 0.256 0.134 0.104 1.911 0.057 .977 1.023
Source: Field Work, 2013
All explanatory variables are given in table 3 with their coefficients, level of significance and collinearity statistics as Tolerance and Variance Inflating Factor (VIF). The coefficient of ‘Education’ is 0.021 which shows that after controlling the effect of all the variables, wage will increase 0.006% due to every higher level of education and this result was highly statistically significant at zero percent significance level.

Business and Economic Research ISSN 2162-4860
2014, Vol. 4, No. 1
www.macrothink.org/ber 29
A person having high level of education earns more wages in Ghana than a person having low level of education. Therefore, education has a significant role in determining the wages of respondents.
The coefficient of ‘Experience’ shows that after controlling for all the variables, wage will increase 7.2% due to one year increase in experience. And t value is -1.58 that is not significant value which is clear from level of significance. Coefficient of household area which is 0.009 is also significant at 0.000% level of significance. Wage will increase 0.009% due to change in household area (Rural to Urban). And t value is 0.082 that is also highly not statistically significant value. From evidence it is clear that a person located in urban area earns 0.009 percent more than a person located in rural area. Coefficient of marital status is 1.95 which means wages will increase 0.050% as a person gets married. All of these factors significantly and positively affect the wage growth of individuals in Bolgatanga.
In our study to check multicollinearity we use Tolerance and Variance inflation factor (VIF) shows in Table 3. The larger was the value of VIF the Higher collinear in the variable Xj. In the limit VIF can be finite in case of perfect collinearity. A rule of thumb, if the VIF of a variable was greater than 10, which will happen if R2 was higher than 0.90, that variable was said to be highly collinear. In our study result shows that the value of VIF of variables Gender, Education, Experience, Household locality and marital status are 1.001, 1.019, 1.017, 1.012, and 1.012 respectively. That shows our explanatory variables were not collinear with each other. And multicollinearity doesn’t exist in our results among these variables such as Gender, education, experience, household locality and marital status. Another statistic that was inverse of VIF is Tolerance (TOL) is use to check the multicollinearity in our results show in table 3. The value of TOL is b/w 0-1. The closer is the value of TOL of a variable to 0, the larger the degree of collinearity of that variable with other Independent variable. On the other hand, the closer TOL of a variable to 1, the greater the evidence that variable was not collinear with the other regressors.
Our result shows that the value of TOL of variables is closer to 1, which shows no collinearity of a variable with other regressors. The value of TOL of variables gender, education, experience, household locality and marital status are .999, .981, .983, .988, and .989 respectively. Which was evidence that no variable collinear with other regressors in our results.
5. Conclusion and Recommendations
This study considers the most important determinants of persons wage development in Bolgatanga Municipality. The results of this study concludes that education; experience, gender; marital status and household area were some major factors that influence individual’s earning growth in Bolgatanga-Ghana. As a result of these findings, we cannot object to conclude that level of education, experience, gender; household area and marital status have significant positive collision on wage growth. Marital status of a personality has constructive impact on his/her wage growth as 1 is given to married and 0 otherwise, so, married persons get higher wages in private formal sector as allowances for spouse and children for education and health are added in wages, which consequently increases wages.

Business and Economic Research ISSN 2162-4860
2014, Vol. 4, No. 1
www.macrothink.org/ber 30
The variable household locality has optimistic shock on wage growth which means that someone living in urban locality has higher wage growth as seen in others for antagonism among employers and higher employment avenues and continuation of well apparent employers in urban centres and also having big city stipend as proportion of primary salary. In the same way, gender has positive impact as males wage growth is superior to females for the difference in output in many jobs particularly in sales and promotion.
As revelations from this study indicated, it was recommended that education should be improved at all levels to enable individuals obtain upper wages in formal private sector. Also, if individuals migrate internally from rural to urban areas, subsequently they get increase in their wages in the form of some allowances or any other way in the cities.
Experience variable should be the overriding principles guiding an increase in wage rather than mere marriage, household size, gender and many other variables.
References
Anh, D. N. (2003). Migration and Poverty in Asia: With Reference to Bangladesh, China, the Philippines and Viet Nam, Ad Hoc Expert Group Meeting on Migration and Development, organised by the Economic and Social Commission for Asia and the Pacific, Bangkok, 27–29 August.
Asadullah, Niaz. (2005). Returns to education in Bangladesh QEH Working Paper Series – QEHWPS130, Working Paper, p. 130.
Aslam, Monazza. (2002). Rates of Return to Education by Gender in Pakistan Global Poverty Research Group (GPRG-WPS-064).
Barone, C., Werfhorst, H. (2008). Education, Cognitive Skills and Earnings in Comparative Perspective, 1-48.
Brunello, G., & Comi, S. (2000). Education and Earnings Growth: Evidence from 11 European Countries, Economics of Education Review, 23(1), 75-83. http://dx.doi.org/10.1016/S0272-7757 (03)00048-7
Card, D. (1999). The Causal Effect of Education on Earnings, Handbook of Labour Economics, 3, 1802-1859. http://dx.doi.org/10.1016/S1573-4463(99)03011-4
Ekstrom, Erika. (2003). Earnings effects of adult secondary education in Sweden. IFAU- Institute for Labour Market Policy Evaluation, Working Paper, 2003, 16
Faridi, Z., M, Hussain, & S. Bashir. F. (2010). Impact of Education on Students, Earning, International Research Journal of Finance and Economics, 171-175.
Hawke, Anne. (1998). Gender Differences in Wage Returns to Computes- Skills in Australia, Prometheus, 16(1), 1998. http://dx.doi.org/10.1080/08109029808629249
International Economics Institute, University of Valencia in its series Working Papers with number 0605.

Business and Economic Research ISSN 2162-4860
2014, Vol. 4, No. 1
www.macrothink.org/ber 31
Lemieuxh, T. (2001). The Causal Effect of Education on Earnings in Canada, 2-16.
M. Dah, Abdallah, & C. Hammami, Salwa. (2006). Returns to education in Lebanon Lebanese American Uviversity.
Messinis, G. Cheng, E. (2009). Earnings, Education and Training in China: The Migali, G., Walker, I. (2009). Estimates of the Causal Effects of Education on Earnings over the Lifecycle: UK Evidence from a Non-separable Specification with Cohort Effects and Endogenous Education, pp 1-34.
Migrant Worker Experience, Centre for Strategic Economic Studies Working Paper No. 42.
Moheyuddin, G. (2005). Gender inequality in education: Impact on Income, Growth and Development, MPRA Paper No. 685, 01-12.
Pasqua, Silvia. (2005). Gender Bias in Parental Investments in Children’s Education: A research Economist at PIDE.
Salles, Mary, A. (2006). Personality, Education and Earnings, Center for Applied Micro econometrics, (CAM), 01-11.
Schultz, T. W. (1961). Investment in Human Capital, the American Economic Review (1).
Soto, M. (2009). The causal effect of education on aggregate income, Paper provided by Springer Science + Business Media, Inc. Manufactured in the Netherlands
Srivastava, R. (2005). India Internal Migration Links with Poverty and Development, country paper regional conference on Migration and Development in Asia, Lanzhou, China, 14– 16 March 2005.
Theoretical Analysis Review of Economics of the Household 3, 291–314, 2005, ©2005
Walker, I., Zhu, Y. (2003). Education, earnings and productivity: recent UK, 145-152.
Zafar Mueen Nasir and Hina Nazli Education and earnings in Pakistan Report 177, Senior.
Copyright Disclaimer
Copyright reserved by the author(s).
This article is an open-access article distributed under the terms and conditions of the Creative Commons Attribution license (http://creativecommons.org/licenses/by/3.0/).

Business and Economic Research ISSN 2162-4860
2014, Vol. 4, No. 1
www.macrothink.org/ber 32
Assessment of Internal Migration Policies in Developing Countries: Evidence from Tanzania
Robert Ebihart Msigwa
School of Mathematical Sciences, Dalian University of Technology
PO box 116024, Linggong Road, Dalian, P. R. China
E-mail: [email protected]
Kembo M. Bwana
School of Accounting, Dongbei University of Finance and Economics
No.217, Jianshang Street, Dalian, P. R. China
E-mail: [email protected]
Received: November 3, 2013 Accepted: November 23, 2013
doi:10.5296/ber.v4i1.5077 URL: http://dx.doi.org/10.5296/ber.v4i1.5077
Abstract
The objective of this study was to determine the relationship of national policy and internal migration with the aim to provide some useful determinants in developing migration policies in Tanzania. The study used the multinomial logistic regression model to examine the internal migration factors which are very important in developing migration policies. Secondary data extracted from the National Bureau of Statistics was used for analysis. The study found out that gender, wage differentials, level of education, marital status and age are significant factors in developing migration policy in Tanzania. The study also revealed that more single male with less education make more movements than female. The study suggests that the government and policy makers to review some laws and regulations governing migration. In addition, it suggests that before imposing any restrictive policy, the government authorities are recommended to develop policies that reflect opportunities available in the country with the aim to reduce the negative effects of migration.
Keywords: Internal migration, Policies assessment, Developing countries, Tanzania

Business and Economic Research ISSN 2162-4860
2014, Vol. 4, No. 1
www.macrothink.org/ber 33
1. Introduction
For the past three decades, both developed and developing countries have witnessed unparalleled human migration within and across political and geographical boundaries. Several reasons have been contributing people to migrate, they include; poor socio-economic conditions, low wages, and high growth rate of unemployment and poverty. Apart from these reasons, other factors such as a mismatch between the population growth and availability of resources, poor advanced technology and capacity of governments to create jobs at the place of origin has played great role to influence migration decisions. In some regions, poor governance, patronage, corruptions, political instability and civil wars have facilitated the out-migration of skilled and unskilled workers. The low cost of migration, improved communication and information, the need to join relatives, spouses, families and friends have fuelled the out-migration in the world. The opportunities for a better life, high income and security, better quality of education and health care facilities at the destinations, for a long time has influenced people to decide to migrate even if they don’t have clear information about the place of destination. In urban area unemployment rate and labour deficits can be observed seasonally while in rural areas there are under-utilization of labour resources which contributes to uneven distribution of income. Globalization process itself, has facilitated the movements of people within and across the boundaries of the African continent. With this in mind, it is clear that migration will continue to bring challenges to politicians, economists and pressure will be stiffer to policy makers about the future management of the migrants for the betterment of the African societies. In developing countries, income from internal migrants is recognized to be one of the sources of remittances for long time have been used for development in rural areas in terms of education and production when applied directly or indirectly via higher consumption levels. On the other side, internal migration from rural to urban areas has created a lot of pressure in the place of destinations because municipalities and councils may not be able to accommodate the large population inflows and provide adequate social services to satisfy the demand of the society. Inadequacy of governments to render services to satisfy the demand has facilitated to the formation of slums, has caused extreme cases of internal crimes and unrest by striking. The pressure caused by migrants has forced many governments to develop policies to restrict the movement of people from the place of origins. Some of these policies have shown to be effective to handle the pressure of migrants while others are fruitless. For example, Latin America and Kenya introduced the policies and programs of farms through land reformation and other mechanisms in order to redirect the flow of migrants to intermediate urban growth poles (industrialized areas) and new cities. Malaysia, Philippines and India also adapted resettlement scheme in attempting to reduce the population flow to urban areas (Simkins & Wernstedt, 1971). The government of Ghana in 1970-1971 developed two major projects around Volta Dam (road construction and hydroelectric project) and Niger River (fishing project) with similar intentions. In Zambia between 1963-1969 and 1972-1976, the policy for rural road construction, schools and clinics building and other facilities were planned and invested by government in rural areas so as to reduce the outflows from rural area. Tanzania focused heavily on resettlement of rural residents in its program. The five year program of (1969-1974) introduced the resettlements of the landless ‘wachagga’ families from Moshi to Mwesi highlands. This program was followed by another in other regions which included

Business and Economic Research ISSN 2162-4860
2014, Vol. 4, No. 1
www.macrothink.org/ber 34
obligatory movements of thousands of scattered farmers into nearby villages and new settlement area (Ujamaa villages). Villagisation and new settlements programs simplified the provision of services in rural areas such as the agricultural extension activities, hospitals and clinics; schools etc., at the same time reduced the outflows. However, the trade liberation, free labor market, downfall of food and cash crop prices, land degradation, deforestation, soil erosion, income differentials, poor education and health facilities and services, and unreliable rainfall in early 1980s forced the government to shut down all projects and programs leading to unemployment and economic crisis in the country. The collapse of public industry and parastatal organizations influenced people to migrate to urban areas seeking for better life and employment in private companies. The increase of migration in urban areas brought attentions to government of Tanzania to take some measures to reduce the outflows from rural areas. The government authorities decided to induce some policies to restrict massive migration from rural areas. Unfortunately the development of these policies based on adapting models with success in developing countries rather than considering the economy and reasons for migration within the country. The experiences show that policies to handle migrants in the country have big holes to reduce the negative effect caused by migrants and migration process.. As mentioned earlier some of these policies have shown fruitful results but otherS have caused some problems. Although, reasons for failure and success are not known to majority but strength of the country in terms of economy, resources and geographical environment can be used as a benchmark to develop suitable policies for managing migrants and migration process. . It is also important for a country experiencing high rates of migration to extend the scope of using models and policies that aim to answer the question of how and to what extend should the migration be tolerated or restricted in order to balance the effect of migrants in the country. Apart from that decision to use particular model must reflect the opportunities that influence migrants to migrate rather than applying the models and techniques which have shown success in other countries which might not be suitable to a country like Tanzania. Therefore, the objective of this paper is to utilize the simple multinomial logistic model to show some useful determinants which are very important for the development of migration policies in the country.
The remaining part of this paper is organized as follows. In section 2, a review of the literatures is given. In the next section, the methodology and data are presented. In the section 4, results and discussion are provided. Finally, concluding and recommendations are given in section 5.
2. Review of the Literatures
2.1 Theoretical Literature Review
Migration is a fundamental component of human rights policy which provides opportunity for freedom of movements and rights of residence. This component has been filed and accepted in the human right concepts which asserts a nation of state where the resident is present to leave the country or region, travel whenever the country or region is welcomed with proper documentation(if the movement is international) but sometime without proper documents when the movement occur within the country; return to the place of origin any time with equal and greater importance to travel to, reside in and/or work in any part of the country without

Business and Economic Research ISSN 2162-4860
2014, Vol. 4, No. 1
www.macrothink.org/ber 35
violating the policies and regulations of the country and is respected in the constitution of several developed and developing countries (Africa-Europe Summit, 2000). The theoretical models relating rural-urban migration and policies are classified into three parts including; the dual economy models which appeared in the 1950s and 1960s, the Harris-Todaro model developed in the 1970s and 1980s and finally, models covers the microeconomics where much of the research has focused over past of 25 years (also known as New economics of labor migration) Lucas (1997). The first model presented by Lewis (1954) gives some description about the transition of stagnated economy on a tradition sectors to a growing economy driven by the development of the modern urban sectors. However, in the real world the application of the model is weak because the growth of the economy of any country does not depend only on the accumulation of the capital in modern industry but there are other factors contributing to the growth. The policy implication of this model encourages government experiencing transition of labor from a labor intensive agricultural economy to significant industries and service sectors economy to allow migration of labours. Harris-Todaro (1971) model attempted to link internal migration and existence of unemployment in urban areas. This model leads to paradox with the fact that policies targeting to increase number of jobs in a particular city are likely to decrease employment due to induced migration. The development of this model was based only on the expected income differentials and leaving other elements influencing migration untouched (Katz & Stark, 1986a). The empirical evidence of this statement is based on the fact that the migration can occur even when the urban expected income is below the rural income. The policy implication of the model encouraged government authorities to develop policies that restrict rural-urban migration and it is from this model where many developing countries have developed policies governing migration process. The extension of Lewis and Harris-Todaro models is the new economic models of labor migration which allow the inclusion of the rural sectors in the analysis. This model appears in the study conducted by Khandler & Rashid (1994) which argued that since there are surplus of labor in agriculture; workers should be paid according to the average product. Fields (1975) made some modification of the existing models by including the urban job search from the rural area workers which were overlooked in the previous estimation of unemployment rate. The policy implication of this model recommends government to allow migrants in a job search framework so that migrants can make suboptimal choices rather than leaving them with imperfect information about the labour market. This programs more important in matching urban jobs and rural migration as appeared in the Qumbu mountain project in China. The policy implication of this model also suggests that the focus of countries should be to invest in rural areas where the population and migration to urban is very high(Ping & Pieke, 2003). However, in doing so it is important to develop policies which target to rescue poor families living in rural areas because some of these families have no migrant members who can send remittances to them. Unless these families will not be able to escape from poverty and win whatever opportunity appeared in the labour market.
2.2 Empirical Literature Review
Apart from the theoretical literatures, there are a wide range of empirical studies relating rural-urban migration and policies in the developing countries. Widjojo (1970) studied a very
Business and Economic Research ISSN 2162-4860
2014, Vol. 4, No. 1
www.macrothink.org/ber 36
long standing project among the Indonesian which aimed to direct the Javanese to the outer Islands. The project of resettlement scheme started in 1930s, failed miserably to attract people because the plan to investigate soil conditions and land use plan were not considered with the government authorities which led to grave misfortune to incoming settlers. The project resumed 20 years later with another vision to create employment to Java’s landless peasants. The second project also failed, reasons for failure are several including; poor organizations, shortage of irrigation schemes and poor transportation facilities (Wertheim, 1964). Malaysian resettlement project of emergency appeared in the report of Sandhu (1964) noted that the project displaced thousands of rural settlers and those enclosed behind the barbed wire for the duration of rebellion reduced the guerrilla’s peasant base. The successes of this project create another problem of urbanization in the region. Lee (1970) provided some useful information about the situation occurred in Sarawak area where the government decided to resettle Dayaks into viable economic units. Similar programs were introduced in Thailand; the project was fruitful but the problems of uneven distribution and rapid population growth emerged in the area. Ng (1968) explained that state-sponsored land settlement projects were necessary in bringing relief to the congested area and in averting the danger of massive migration to the cities. Such a projected initiated in Philippines started in Mindanao area bared no fruits while similar project implemented in Sri-Lanka were very successful (Zachariah, 1969). Lavell (1972) studied the indirect effects of hydroelectric power generated at the sites in Philippine noticed the attraction of large dynamic industries in the areas. Author also found that attract of large industries influenced inflow of migrants from a perennial source of Philippine manpower. Burke (1970) presented evidence indicating that the Bolivian population has increased from 50 to 100% since the land reform program begin in 1953. He noted that in spite of natural increase in population in this ex-estate, there has been a substantial migration to these lands from the indigenous communities, villages and cities. Cuba in 1964 focused to slow population growth from the migration by building more cities, scattered rural people were settled in towns with a broader range of improved services and urban areas throughout the nation and the outfitted areas were to serve as ports or manufacturing locations (Acosta & Hardoy, 1972). Housing construction started in Venezuela was among the successful project (MacDonald, 1968). A report from this study found that about 50000 of dwellers houses were constructed in 1965 which shifted the mind of rural migrants not to migrate by 45% and 9% of people stated to benefit directly from the rural housing plan. Urzua (1975) attempted to investigate the contribution of colonization schemes in the rural-urban migration in the territories of colonization. The aim of the study intended to see whether colonization schemes were successful in retaining the settlers or slowed migration to the large urban centers. He found that the migration rate depends on the amount of technical and financial support they received. For example in Bolivia, a major colonization program operated in the country since 1962 increased the agricultural production and prevented outflow of migrants because in some zones colonialists provided some temporary homes, livestock, and tools, limited amount of credit, schools and health and clinical services. However, unforeseen problems emerged after harvest in which inadequate marketing mechanism for the bumper crops production and poor roads to cities forced people to seek another alternative to get income to sustain life. In 1970, Jakarta government imposed policies to migrants that demanded them to register and deposit their

Business and Economic Research ISSN 2162-4860
2014, Vol. 4, No. 1
www.macrothink.org/ber 37
return fare; the policy was unsuccessful because of vagrancies and unlicensed hawkers who were transported out of the city returned to the city (Simmons, 1981). In South Africa job permits, settlement restrictions and curfews used to restrict movements of the black population reach designated areas for whites. Despite the willingness of the South African government and police to use extreme measures including destruction of unapproved housing and forcible relocation to the homelands, migration has persisted even without this context. Communist introduced in China demanded the movement certificates from place of origin, proper documentation of job offers, check points in the transport systems and other mechanisms to restrict rural-urban migration.
Oberai (1983) stated that during the period of 1969 and 1973, 10 to 15 million urban secondary school leavers were resettled in rural areas in developing countries. Henderson (1986) noted higher urban earnings significantly attract more migrants. He noted that effective mechanisms affecting take home pay depends upon the source of downward wage rigidity because reducing the real minimum wage or public sector pay in any context is difficult due to the increase nominal levels in the face of inflation. On the other hand, it is not clear whether the minimum wage laws are the effective technique in preventing wage flexibility and enforcement from uniform to the extent that urban migration is based especially for skilled workers. In addition, the minimum wage may not be binding migrants where collective bargaining is the major source of the rural-urban wage gap but regulating the collective bargaining process may prove effective in restraining urban wage pressures (Becker, Mills, & Williamson, 1986). Findley (1981) used two sets to distinguish rural development strategies. The first set comprised many elements which proved to reduce the demand for agricultural laborers, subsidized, mechanization, research and development of labor, displacing crop type pricing policies and favoring each cash crop, commercial farming and irrigation schemes which favoured larger farmers and ignoring the small scale farmers. Findley also stated that some of these elements have stimulated the out-migration either to town or to other rural areas. Author suggested that it is important to consider the employment creation, human resources and integration of the rural development scheme upon out-migration in order to overcome the outflow of laborers. A similar study conducted by Varayana, Darikh, & Srinivas (1988), aimed to investigated whether rural development schemes should be integrated or judge only by their effects to out-migration. The study noted that rise in rural men’s income may principally serve to finance more migration to urban areas. Wheaton & Shishido (1981) examined the cross-country population concentration (measured by the square of the city relative to total population) patterns in the city against non-agricultural GNP per capita (interpreted as a proxy for market size). The authors found that concentration at first rise, then declines as income increases which becomes difficult to interpret the findings in terms of agglomeration externalities because the actual concentration failed to be optimized with respect to these effects at every level of development and the question about whether per capita or absolute incomes should be used as proxies for market size or domestic market alone is relevant to the open economies. Henderson (1986) presented the evidence of estimated cost functions for several manufacturing industries in Brazil, the result indicated that the costs decline to the level of employment in the same industries in the same location, but never declined with respect to local population. This implies that economies are driven by within industry production

Business and Economic Research ISSN 2162-4860
2014, Vol. 4, No. 1
www.macrothink.org/ber 38
externalities rather than by the size of local market or other benefits of urban size. Results from this study were consistent with those obtained by Modi (1982) in the study conducted in low developed countries (LDCs).
Hugo (1981b) used the case study of Indonesia to examine the effect of improved road and concluded that transportation probably has increased the circular migration and the extent of population mobility while discouraging the long distance permanent movements. Recent analysis of the interaction between the migration and infrastructure in the developing country context is that of Rosenzweig & Wolpin (1988) which pointed the benefits of subsidizing local public programs. A program of subsidizing tends to attract families with high propensities to spend on children, but this may be either in the form of higher fertility or expenditure per child. Moreover, subsidizing family with ‘public’ good inputs also have a tendency to attract families with higher propensities to spend but in this case, the benefits are not diluted by lower family size, larger families and those tending to spend more per person are attracted. The effects of rural education upon departure focus upon quantity rather than quality or context of education, whereas the important decision at the margin may be to invest in upgrading the quality (Behrmars & Birdsall, 1983). Indeed, in response to the induced rural-urban migration, a number of developing countries have designed rural vocational curricular in the hope of raising productivity in agriculture relative town production, as well as changing notions regarding life in rural. Some authors argued that even conventional primary schooling can raise productivity in agriculture (Lockheed, Janison, & Lau, 1980a; Findley, 1981). Speare & Harris (1986) noted that in Indonesia rural-urban migration among post-primary education were very high and stated that it wrong to interpret the results based on relative earnings alone. The authors suggested that this may simply reflect the skill mix of jobs created in town, resulting in migration of better educated without necessary raising their rural-urban earnings differentials. Although, literatures mentioned above covers all angles of migration process, yet there are some weaknesses in linking internal migration and development of migration policies. In Tanzania, there have been several attempts to reduce the rural-urban migration through the development initiatives in the intermediate town (Mbonile, 1994b). The history of the villagisation program introduced in the country during the Arusha declaration (1967) and after the declaration, twisted the mind policy makers to believe that development and provision of good social services in rural area were the only solution to intervene rural-urban migration. At the beginning programs were successful in agriculture and education sector, however, the economic liberation and free trade in 1980s forced people to move from rural to urban. This movement reduced the tendency of sending remittance to their origin places rather they opted to invest nearby town. The negative effects of migration has forced government authorities to introduce some strong policies to reduce rural-urban migration but challenge remain in looking the livelihood strategy in the area of public policy. The scope of the policy makers is to reduce the inflow to urban areas rather than considering the volume and effect of restricting migrants in relation to the economy of the country. For example, in Tanzania poverty reduction strategy paper (PRSP) never mentioned anything about migration process and migrants welfare. It is known that well managed migration has significant benefits in the origin and destination regions. Despite of several studies about migration process in the country, there are some unfilled gaps in literatures linking internal migration and development of policies governing

Business and Economic Research ISSN 2162-4860
2014, Vol. 4, No. 1
www.macrothink.org/ber 39
migration process and migrants welfare. Therefore, understanding and developing appropriate policy about migration are of great importance in the country because the mismanagement or unmanaged migration has serious consequences (such as regional security and jeopardizing inter-regional relations) in the country and well-being of migrants. Mismanagement of migration is known to cause unnecessary conflict between the host communities and migrants such as xenophobia, discrimination and other social pathologies. This study gives important information to policy makers and stakeholders to understand the magnitude and determinants of migration to be considered during the development of policies, programs and projects which aim to reduce rural-urban migration. Therefore, the aim of this paper is to examine determinants of internal migration necessary for linking migration and development of migration policies in Tanzania.
3. Methodology and Data
The objective of this paper is to assess the internal migration policy framework in Tanzania. This paper uses the multinomial logistic regression (MNL) to show the relationships between non-metric dependent variables and metric or dichotomous independent variables. Multinomial logistic regression compares multiple groups through a combination of binary logistic regressions. The groups of comparisons are equivalent to the comparisons for a dummy-coded dependent variable, in which the group with the highest numerical scores are used as the reference group. Multinomial logistic regression analysis requires the dependent variable to be non-metric such as dichotomous, nominal and ordinal variables which satisfy the level of measurement required. Multinomial logistic analysis requires independent variables to be metric or dichotomous. The overall test of the relationship between the independent variables and the group defined by dependent variable is based on the reduction of likelihood values for a model which does not contain any independent variables and the model that contains the independent variables. Therefore, the relationship between the dependent variable and the combination of the independent variables is based on the statistical significance of the final model of Chi-squire(Model Fitting Information). A multinomial logistic regression does not compute the correlations to estimate the strength of the relationship (Pseudo R, square measure such as Nagelkerke’s R2) appeared in the analysis usually do not give significant information about the accuracy or errors associated with the model. In that case, the classification accuracy is used to compare the predicted group membership based on the logistic model to the actual known group membership which is the value for the dependent variable. The multicolonearity in the multinomial logistic regressions solution is detected by examining the standard errors for the regression coefficients. A standard error larger than 2.0 indicates numerical problems and should not be interpreted after analysis. This model is appropriate for this study because there are more than two categorical independent variables and the dependent variable of nominal/categorical falls under the dependent variable of a given set of the categorization which cannot be ordered in a meaningful way (Greene, 2003). The multinomial regression is a good example to illustrate an internal migration framework. The general multinomial logistic model is presented as follows;

Business and Economic Research ISSN 2162-4860
2014, Vol. 4, No. 1
www.macrothink.org/ber 40
1
Pr( )k i
k i
x
i Kx
k
ez ke
�
�
�
� �
�
zi; presents the dependent variables over which the probability distribution is defined, xi
indicates the set of explanatory variables of the model (gender, age, wage differentials, marital status and level of education), α denotes the regression coefficient and k is the possible number of outcomes. The dependent variable of the model is the migration status in Tanzania. According to the integrated labor force survey (2006) conducted in the country migrants are classified into two namely migrants and non-migrants. The possible outcomes from the model represent the probability of the individuals to stay or move under several demographic and household characteristics. The migrant status in the country is categorized into the rural-rural, rural-urban, town-city and international migration. The first three represent the internal migration whereas the last component represents the international migration. For the purpose of this study the first three categories were extracted from the data set of the Integrated Labour force survey of 2006, in order to obtain the data needed to determine the internal migration policies. Only rural-urban and town-city migration were used for analysis and rural-rural migration was not included in this study. The main reasons for not including rural-rural migration is small proportional of the movements within the country and this movement involves farmers and animal keepers whose data are not found in the database of the National Bureau of Statistics. This study has adopted the International Labor organization definition of migration which states that migrants are people moved (voluntarily or forced) from their original areas to other places either temporarily or permanently. The explanatory variables of the model include; gender, wage, age, marital status and level of education. All data used in this study were extracted from the Integrated Labor Force Survey (ILFS, 2006) which is the current labor force survey available as the 2011 survey was not conducted. The population that participated in this study are those economically active aged 15 years and above and it is estimated that in 2001 there were 19.2% living in urban areas while in 2006 the number increased to 25.9% reflecting that the migration within the country has been increasing unforeseeable. Although, the number of males in some region has declined, the overall of females aged 10 years and above has remained stable over the period 2001 and 2006 which is estimated to be 50.9%, 51.3% respectively.
Table 1. Summary of Statistics of Individual Decision of Migration
Case Processing Summary N Marginal Percentage
Individual status Migrants 39426.38 49.0% Non-migrants 41080.36 51.0%
Gender Male 56385.67 70.0% Female 24121.07 30.0%
Age Group 15-24 13982.47 17.4% 25-34 24689.92 30.7% 35-64 41483.72 51.5%

Business and Economic Research ISSN 2162-4860
2014, Vol. 4, No. 1
www.macrothink.org/ber 41
65+ 350.63 .4% Marital status Single 19463.15 24.2%
Married 51796.92 64.3% Widowed 3524.04 4.4% Divorced/Separated 5722.62 7.1%
EDUCATION LEVEL Never Attended 3828.60 4.8% Primary Not Complete 9445.08 11.7% Primary Complete 42242.69 52.5% Secondary above 24990.37 31.0%
Valid 80506.74 100.0% Missing 38371320.75 Total 38451827.49 Subpopulation 175a
Source (NBS-ILFS, 2006)
4. Results and Discussion
The analysis to assess the internal migration policy framework in this study was conducted based on the definition of the migration in order to make some comparisons and benchmark with similar studies in other countries applying the multinomial logistic model (MNL). Non-migrants are set as a reference and the estimation of the probability of migrants with particular characteristics are compared to non-migrants. First, the independent variable is tested to show whether there is a significant relationship to the dependent variable. This is quite important for determining the ability of the model to predict accurately the dependent variables from the initial model without including independent variables. Second five independent variables are added (gender, age, marital status, level of education and wage differentials between rural and urban) to the model in order to test whether the addition of independent variables shows some improvement in Chi-square. The results revealed that it is statistically significant between the dependent variables and the set of independent variables with Chi-square of 12228.418 with 12 degrees of freedom at the 5 % level of significance (see, table 2). The tested result implied that the independent variables added to the model have strong relationship to the depend variable, which reduce the error contributed in the model and very accurately predict dependent variable of the model which reflect the migration status.
Table 2. Model testing
Model Fitting Information
Model Model Fitting Criteria Likelihood Ratio Tests
-2 Log Likelihood Chi-Square df Sig.
Intercept Only 110330.93
Final 98102.511 12228.418 12 0.000
Source (NBS-ILFS, 2006)
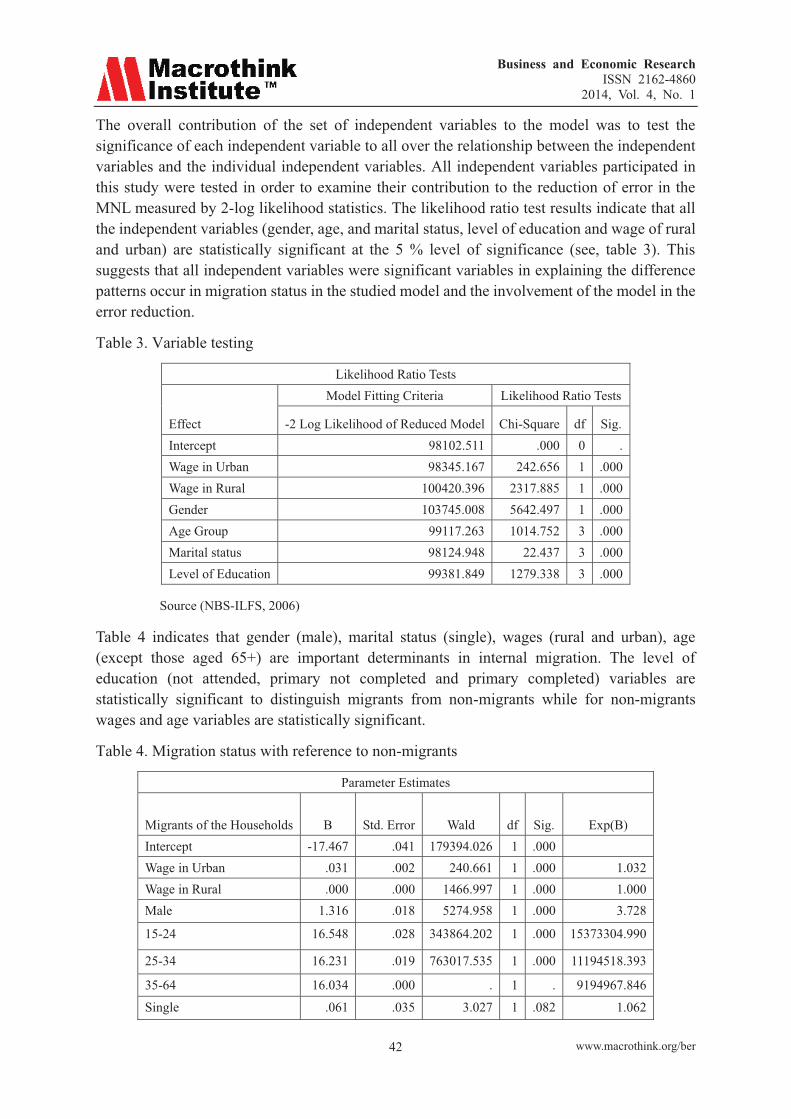
Business and Economic Research ISSN 2162-4860
2014, Vol. 4, No. 1
www.macrothink.org/ber 42
The overall contribution of the set of independent variables to the model was to test the significance of each independent variable to all over the relationship between the independent variables and the individual independent variables. All independent variables participated in this study were tested in order to examine their contribution to the reduction of error in the MNL measured by 2-log likelihood statistics. The likelihood ratio test results indicate that all the independent variables (gender, age, and marital status, level of education and wage of rural and urban) are statistically significant at the 5 % level of significance (see, table 3). This suggests that all independent variables were significant variables in explaining the difference patterns occur in migration status in the studied model and the involvement of the model in the error reduction.
Table 3. Variable testing
Likelihood Ratio Tests
Effect
Model Fitting Criteria Likelihood Ratio Tests
-2 Log Likelihood of Reduced Model Chi-Square df Sig. Intercept 98102.511 .000 0 . Wage in Urban 98345.167 242.656 1 .000 Wage in Rural 100420.396 2317.885 1 .000 Gender 103745.008 5642.497 1 .000 Age Group 99117.263 1014.752 3 .000 Marital status 98124.948 22.437 3 .000 Level of Education 99381.849 1279.338 3 .000
Source (NBS-ILFS, 2006)
Table 4 indicates that gender (male), marital status (single), wages (rural and urban), age (except those aged 65+) are important determinants in internal migration. The level of education (not attended, primary not completed and primary completed) variables are statistically significant to distinguish migrants from non-migrants while for non-migrants wages and age variables are statistically significant.
Table 4. Migration status with reference to non-migrants
Parameter Estimates
Migrants of the Households B Std. Error Wald df Sig. Exp(B) Intercept -17.467 .041 179394.026 1 .000 Wage in Urban .031 .002 240.661 1 .000 1.032 Wage in Rural .000 .000 1466.997 1 .000 1.000 Male 1.316 .018 5274.958 1 .000 3.728
15-24 16.548 .028 343864.202 1 .000 15373304.990
25-34 16.231 .019 763017.535 1 .000 11194518.393
35-64 16.034 .000 . 1 . 9194967.846
Single .061 .035 3.027 1 .082 1.062
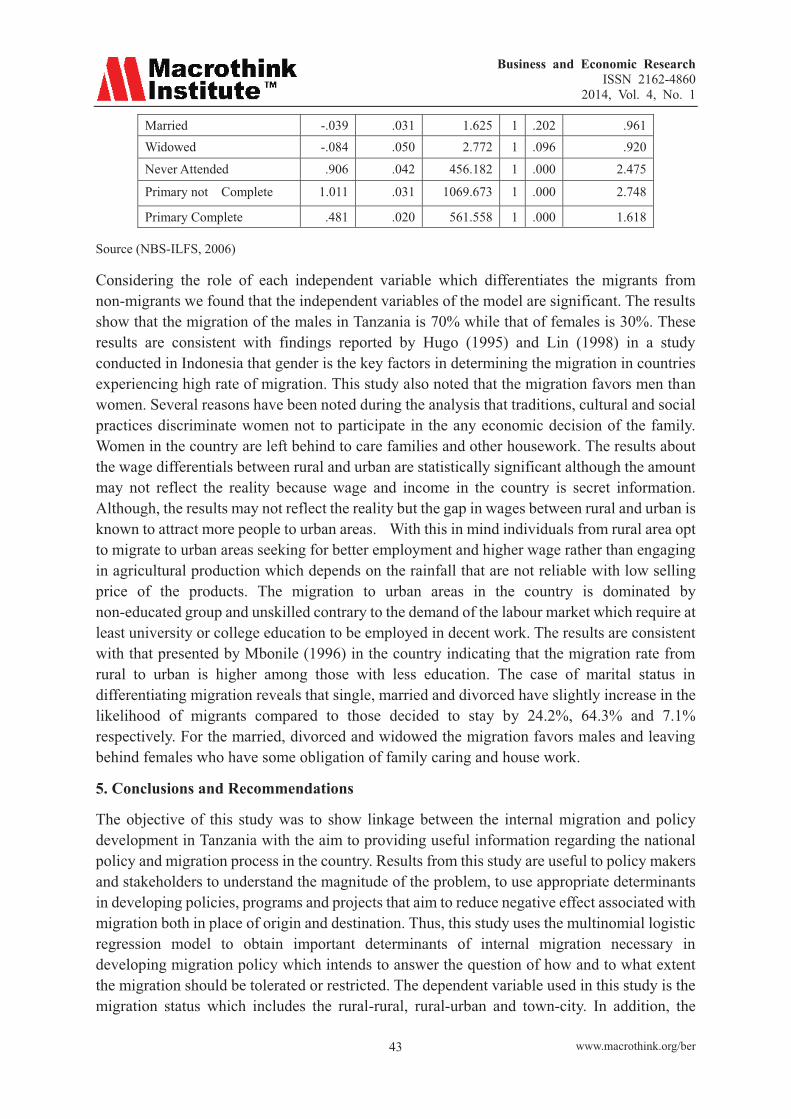
Business and Economic Research ISSN 2162-4860
2014, Vol. 4, No. 1
www.macrothink.org/ber 43
Married -.039 .031 1.625 1 .202 .961 Widowed -.084 .050 2.772 1 .096 .920
Never Attended .906 .042 456.182 1 .000 2.475
Primary not Complete 1.011 .031 1069.673 1 .000 2.748
Primary Complete .481 .020 561.558 1 .000 1.618
Source (NBS-ILFS, 2006)
Considering the role of each independent variable which differentiates the migrants from non-migrants we found that the independent variables of the model are significant. The results show that the migration of the males in Tanzania is 70% while that of females is 30%. These results are consistent with findings reported by Hugo (1995) and Lin (1998) in a study conducted in Indonesia that gender is the key factors in determining the migration in countries experiencing high rate of migration. This study also noted that the migration favors men than women. Several reasons have been noted during the analysis that traditions, cultural and social practices discriminate women not to participate in the any economic decision of the family. Women in the country are left behind to care families and other housework. The results about the wage differentials between rural and urban are statistically significant although the amount may not reflect the reality because wage and income in the country is secret information. Although, the results may not reflect the reality but the gap in wages between rural and urban is known to attract more people to urban areas. With this in mind individuals from rural area opt to migrate to urban areas seeking for better employment and higher wage rather than engaging in agricultural production which depends on the rainfall that are not reliable with low selling price of the products. The migration to urban areas in the country is dominated by non-educated group and unskilled contrary to the demand of the labour market which require at least university or college education to be employed in decent work. The results are consistent with that presented by Mbonile (1996) in the country indicating that the migration rate from rural to urban is higher among those with less education. The case of marital status in differentiating migration reveals that single, married and divorced have slightly increase in the likelihood of migrants compared to those decided to stay by 24.2%, 64.3% and 7.1% respectively. For the married, divorced and widowed the migration favors males and leaving behind females who have some obligation of family caring and house work.
5. Conclusions and Recommendations
The objective of this study was to show linkage between the internal migration and policy development in Tanzania with the aim to providing useful information regarding the national policy and migration process in the country. Results from this study are useful to policy makers and stakeholders to understand the magnitude of the problem, to use appropriate determinants in developing policies, programs and projects that aim to reduce negative effect associated with migration both in place of origin and destination. Thus, this study uses the multinomial logistic regression model to obtain important determinants of internal migration necessary in developing migration policy which intends to answer the question of how and to what extent the migration should be tolerated or restricted. The dependent variable used in this study is the migration status which includes the rural-rural, rural-urban and town-city. In addition, the

Business and Economic Research ISSN 2162-4860
2014, Vol. 4, No. 1
www.macrothink.org/ber 44
analysis carried in this study utilized secondary data extracted from the National Bureau of Statistics in the integrated labor force survey of 2006 which is the current survey in the country. Findings from the study conclude that the wage differentials between rural and urban, gender (male) and age are statistically significant to influence internal migration. The study recommends the the government of Tanzania develop policies and regulations that reflect the economy and migrants welfare in the country. In addition, the fundamental strategy suggested by this study is to make some amend of the laws governing the migration process and focus of the projects and programs must aim to favors non-migrants. The development of policies must aim to grab whatever the opportunities available in the region rather than adopting policies that seek to overcome the problem of the whole country because the nature of the regions and the reasons for movement differ from one individual to another within/across the regions. Furthermore, wage differentials can be managed by investing in rural areas and controlling the price of agricultural products which may help to discourage migrants to migrate. The experience shows that earnings from agriculture are enough to cover all expenses of basic needs perhaps with a surplus is a good technique to reduce the outflow to urban areas. It is also time for manpower agencies to be fair enough when dealing with job seekers who have graduated at different levels of education in terms of salary to pay them according to their professionalism. It is wise to include other employment incentive rather than taking advantage of the scarcity of jobs in the country by paying peanuts. The role of the trade union organizations is important to create a good environment for employed workers but in the country organizations are inefficient in the country to address the potential labor conflicts of migrants. It is difficult for migrants with low education and less experience to understand the benefits and regulations protecting them from employers. Therefore, effective management to control migration is needed to help the vulnerable migrants to protect their rights responding to those who have decided to stay in their origin place. This study recommends the government to review some of the policies of the urban employment. If the objective is to promote, there must be enough evidence to do so simply by protecting and promoting the rights of the migrants in the destinations. It is important to address the following in the policy; the level of welfare of the workers before departure, effective information about the migration and the negative effects involved in the whole process of migration and the responsibility of the administration to minimize the migration must be clearly stated in the law .The integration of the community development plan with the migration process is necessary to handle the pressure caused by migrants. The intervention policy must reflect the manpower established to present the context. The incentive of free tax to those who have decided to stay in rural areas is a significant strategy to reduce the outflow, so whenever possible the government should opt to use such a strategy. Cooperating with social pattern as well as the migrants themselves is particularly important to develop appropriate policies and programs which in turn will help to reduce the cost of implementation. It is also desirable to form strong structures responsible to organize the formulation of the migration policy.
References
Africa-Europe Summit (2000). The migration policy framework for African, North Ordinary Session, June 25-29, Banjul, Gambia

Business and Economic Research ISSN 2162-4860
2014, Vol. 4, No. 1
www.macrothink.org/ber 45
Becker, G. M., Mills, E. S., & Williamson, J. G. (1986). Modeling India migration and city growth 1960-2000: Economic Development and Cultural Change. 35, 1-33. http://dx.doi.org/10.1086/451571
Behrman, J. R., & Birdsall, N. (1983). The quality of schooling: quantity alone is misleading: American Economic Review, 73, 928-946
Burke, M. (1970). Land reform and its effect upon production and productivity with Lake Titicaca region, Economic Development and Cultural Change, 18(3), Apr, 410-450. http://dx.doi.org/10.1086/450441
Byerlee, D., & Eicher, C. K. (1974). Rural employment, migration and economic development: theoretical issue and empirical evidence from Africa: The place of Agriculture in the Development of the Developing Countries, Ed., By E.A.G. Robinson (London: Macmillan)
Fields, G. S. (1975). Rural-urban migration, urban unemployment and underemployment and job search activity in LDC’s, Journal of Development Economies. 2, 165-187. http://dx.doi.org/10.1016/0304-3878(75)90014-0
Findley, S. E. (1981). Rural development programs: planned versus actual migration outcomes in population distribution policies in development planning studies, No.75 Department of International Economic and Social Affairs, United Nations, New York
Greene, W. H. (2003). Economic analysis, 3rd Edition, Prentice Hall Internal EditionHarris, J and Todaro, M (1970). Migration, unemployment and development: a two sector analysis, American Economic Review, 60,126-142
Henderson, J. V. (1986). Urbanization in a developing country: city size and population composition, Journal of Development Economics, 22, 269-293. http://dx.doi.org/10.1016/0304-3878(86)90132-X
Hugo, G. J. (1981b). Road transport, population mobility and development in Indonesia, in G.W. Jones and H. V. Richter, Eds, population mobility and development: Southern Asia and the Specific Development Studies Monograph, No.27 (Australian National University Canberra)
Hugo, G. (1995). International labor migration and the family: some observations from Indonesia, Asia Pacific Migration Journal, 4(2/3), 273-301
Katz, E., & Stark, O. (1986a). Labor migration and risk aversion in less developed countries, Journal of Labor Economics, 4,134-49. http://dx.doi.org/10.1086/298097
Khandher, A., & Rashid, A. (1995). Wage subsidy and full-employment in a dual economy with open employment and dual labor, Journal of Development Economics, 48(1), 205-23. http://dx.doi.org/10.1016/0304-3878(95)00035-6
Lavell, A. M. (1972). Regional industrialization in Mexico: some policy considerations, Regional Studies, 6, Sep, 343-362. http://dx.doi.org/10.1080/09595237200185291
Lee, Y. L. (1970). Population and settlement in Sarawak, Singapore, Asia Pacific Press

Business and Economic Research ISSN 2162-4860
2014, Vol. 4, No. 1
www.macrothink.org/ber 46
Lewis, W. (1954). Economic development with unlimited supplies for labor, Manchester School of Economics and Social Studies, 22,139-91
Lin, J. (1998). Reconstructing, Chinatown ethnic enclave, global change. Minneapolis: University of Minnesota Press.
Lockheed, M. E., Janison, D. R., & Lau, L. J. (1980). Farmer education and farm efficiency: a survey, Economic Development and Cultural Change, 29, 37-76. http://dx.doi.org/10.1086/451231
Lucas, R. (1997). Internal migration in developing countries, In Rosenzweig & Stark Eds.; Handbook of Population and Family Economics, Northland, Elsevier, Vol. 1B, Chapter 13, pp. 721-98. http://dx.doi.org/10.1016/S1574-003X(97)80005-0
Mbonile, M. J. (1994b). Trading center and development of a remote rural district of Tanzania, Review of African Political Economy, 59, 7-20. http://dx.doi.org/10.1080/03056249408704033
Mbonile, M. J. (1996). The determinants of migration in Tanzania: the case of Makete district, University of Dar es Salaam Institute of Resources Assessment, New Series Paper 1996
McDonald, L., & McDonald, J. S. (1968). Motives and objectives of migration: selective migration and preferences toward rural and urban life, Social and Economic Studies, 17, Dec, 417-434
Modi, J. R. (1982). Narrowing regional disparities by fiscal incentives, Finance and Development, 19, 34-37
Narayana, N. S, Darikh, K. S., & Srinivas, T. N.(1988). Rural works programs in India: costs and benefits, Journal of Development Economics, 29,131-151. http://dx.doi.org/10.1016/0304-3878(88)90032-6
Ng, R. (1968). Land settlement projects in Thailand, Geography, 53, 1979-182
Oberai, A. S. (1983). State policies and internal migration: Studies in Market and Planned Economies, London: Croom Helm
Ping, H., & Pieke, F. (2003). China migration country study, Paper Prepared for the Regional Conference on Migration, Development and Pro-Poor Policy Choices in Asia, June 22-24
Rosenzweign, M. R., & Wolpin, K. I. (1988). Migration selectivity and the effects of public programs, Journal of Public Economics, 37. 265-289. http://dx.doi.org/10.1016/0047-2727(88)90042-4
Sandhu, K. S. (1964). Emergency settlement in Malaya, Journal of Tropical Geography, 18, 157-183
Simkins, P., & Wernstedt, F. (1971). Philippine migration: the settlement of the Digos- Padada Valley, Davao Province. New Haven, Yale University of Southeast Asia Studies, Monograph Series No.16
Simmons, A. B. (1981). A review and evaluation of attempts to constrain migration to select

Business and Economic Research ISSN 2162-4860
2014, Vol. 4, No. 1
www.macrothink.org/ber 47
urban centres and regions in population distribution policies in development planning: population studies, No.75. Department of International Economic and Social Affairs, United Nations, New York
Skeldon, R. (2003a). Migration and poverty, Paper Prepared for the Conference on African Migration and Urbanization in Comparative Perspective, Johannesburg, South Africa, June 4-7.
Skeldon, R. (2003b). Migration and migration policy in Asia: A Synthesis of Selected Cases Paper Prepared for the Regional Conference on Migration, Development and Pro-Poor Choices in Asia, June 22-24. http://dx.doi.org/10.1002/psp.385
Skeldon, R. (2007). Interlinkages between internal and international migration in the Asia region, Population, Space and Place, 12(1), 15-30
Speare Jr. A., & Harris, J. (1986). Education, earnings and migration in Indonesia, Economic Development and Cultural Change, 34, 223-244. http://dx.doi.org/10.1086/451525
Waddington, C. (2003). National policy and internal migration, Paper presented at the Regional Conference on Migration, Development and Pro-Poor Policy Choices in Asia, June 22-24, 2003.
Wertheim, W. F. (1964). Inter-island migration in Indonesia: In East-West Parallels, Sociological Approaches to Modern Asia, The Hague Van Hoeye
Wheaton, W., & Shishido, H. (1981). Urban concentration, agglomeration economies and the level of economic development. Economic Development and Cultural Change, 30, 17-30. http://dx.doi.org/10.1086/452537
Widjojo, N. (1970). Population trends in Indonesia. Ithaca, Cornell University Press
Zachariah, K. C. (1969). Internal migration and urbanization, In Barrie, W.E, and Cameron, M., ed; Population Change: Asia and Oceania. Proceeding of Sydney Conference Australia, 21-25, August, 1967, International Union for the Scientific Study of Population Canberra, Australia, Australian National University, Department of Demography, 98-112.
Copyright Disclaimer
Copyright reserved by the author(s).
This article is an open-access article distributed under the terms and conditions of the Creative Commons Attribution license (http://creativecommons.org/licenses/by/3.0/).
Business and Economic Research ISSN 2162-4860
2014, Vol. 4, No. 1
www.macrothink.org/ber 48
The Business Competitiveness of Thailand in the ASEAN Region
Abdullah Al-Swidi (Corresponding author)
Othman Yeop Abdullah Graduate School of Business
University Utara Malaysia
Tel: 60-124-662-754 Email: [email protected]
Arfan Shahzad
Othman Yeop Abdullah Graduate School of Business
University Utara Malaysia
Received: December 7, 2013 Accepted: December 24, 2013
doi:10.5296/ber.v4i1.4667 URL: http://dx.doi.org/10.5296/ber.v4i1.4667
Abstract
Thailand is playing a vital role in the ASEAN region as a developing nation. The World Bank also reported that in 2011Thailand had the 17th rank globally in terms of ease of doing business. This present study attempted to investigate the major factors which influence the overall national competitiveness of Thailand. Moreover, due to the considerable improvement of the business environment, Thailand has been an attractive destination for foreign investors, therefore, mobilized by many multinational companies (MNCs) from all over the world. This study sought to analyze the economic environment of the country and to detect what factors influence most Thailand’s national competitiveness, thus, to explain how Thailand becomes an attractive destination for global FDI inflows and can contribute to the global prosperity.
Keywords: Competitive Advantage, ASEAN, Thailand, Competitive disadvantage, Economic indicators.
1. Introduction
The beginning years of the 21st century has witnessed that the Asian region has started growing dramatically and becoming the most attractive spot for international business in the global arena. The national competitiveness is assumed to be the most important factor that indicates the country’s ability to create and maintain a compatible environment in which enterprises and

Business and Economic Research ISSN 2162-4860
2014, Vol. 4, No. 1
www.macrothink.org/ber 49
organizations can compete and survive by achieving a high level of growth and success (Kao et al., 2007). The present study sought to analyze the national advantages and disadvantages which affect creating the strategic competitiveness of Thailand, as a promising nation in the Asian region, when the people’s current outlook is to consider Asia as a new engine of sustainable global growth and development.
Kao et al., (2007) tried to measure the national competitiveness of Southeast Asian countries and observed that Singapore, Malaysia, and Thailand have the highest national competitiveness while Myanmar, Cambodia, and Laos are the least competitive countries. The focus of the present study, therefore, tend to examining Thailand’s potentials and position in Asia’s global race in today’s business arena.
Over the new millennium years, Thailand has waded through a remarkable revival program since 1997 crises and achieved one of the highest growth rates in the ASEAN region. Currently, Thailand is intentionally trying to exploit its natural resources, intense labor force, and fertility of the soil and other competitive factors as far as possible to remain at the competitive edge in the rapidly changing world.
2. Economic Scenario of Thailand
Investors are usually more interested in perceiving the economic features of the country in global settings. Many economic elements of Thailand are analyzed in this section:
2.1 Economic Sectors
In the past, the economy of Thailand was purely based on agricultural activities where the major part of the population was occupationally confined to Agriculture. With the transformation of the economy towards growing Industry-based economy, and then Service-based economy, the contribution of each sector to the total GDP have structurally changed and the occupational composition distribution of the workforce tended to keep changing. In the modern era of IT and communication, the Thai economy has also tended to move towards becoming Knowledge-based economy. Consequently the demand of IT-trained workforce and the distribution of the labor force have a tendency to shift gradually in this direction. Thailand is dynamically expanding in its entire major economic sector in the new millennium years.
To perceive the current scenario, based on the data for the period 2003-2011 the contribution of major economic sectors to the total GDP of Thailand is captured in Table 1.
Table 1. Sectorial Contribution to the GDP of Thailand (2003-2011)
Years Agriculture Industry Services 2003 10.4% 43.6% 46% 2004 10.3% 43.4% 46.3% 2005 10.3% 44.0% 45.7% 2006 10.7% 44.4% 44.8% 2007 11.4% 43.9% 44.7% 2008 11.4% 44.5% 44.1%

Business and Economic Research ISSN 2162-4860
2014, Vol. 4, No. 1
www.macrothink.org/ber 50
2009 9.0% 39.0% 52.4% 2010 8.6% 39.0% 52.4% 2011 13.3% 34.0% 52.7%
Source: Foreign Direct Investment Inflows: UNCTAD; Country Profile, 2012
Figure 1 reflects that the contributions of Agriculture, Industry, and Services to the GDP of Thailand over the period 2003-2011 has remained almost constant and no much difference from year to year can be noticed.
Figure 1. Sectorial contribution to the GDP of Thailand
Source: Foreign Direct Investment Inflows: UNCTAD; Country Profile, 2011
Based on the data of 2007 the following pie chart indicates that industry and service sectors accounts for almost 90% of the total GDP of the country. This eventually reflects how fast the transformation of the economy of this country has taken place against the agrarian characteristics.
13%
34%53%
2011
Figure 2. Sectorial contribution to the GDP in Thailand
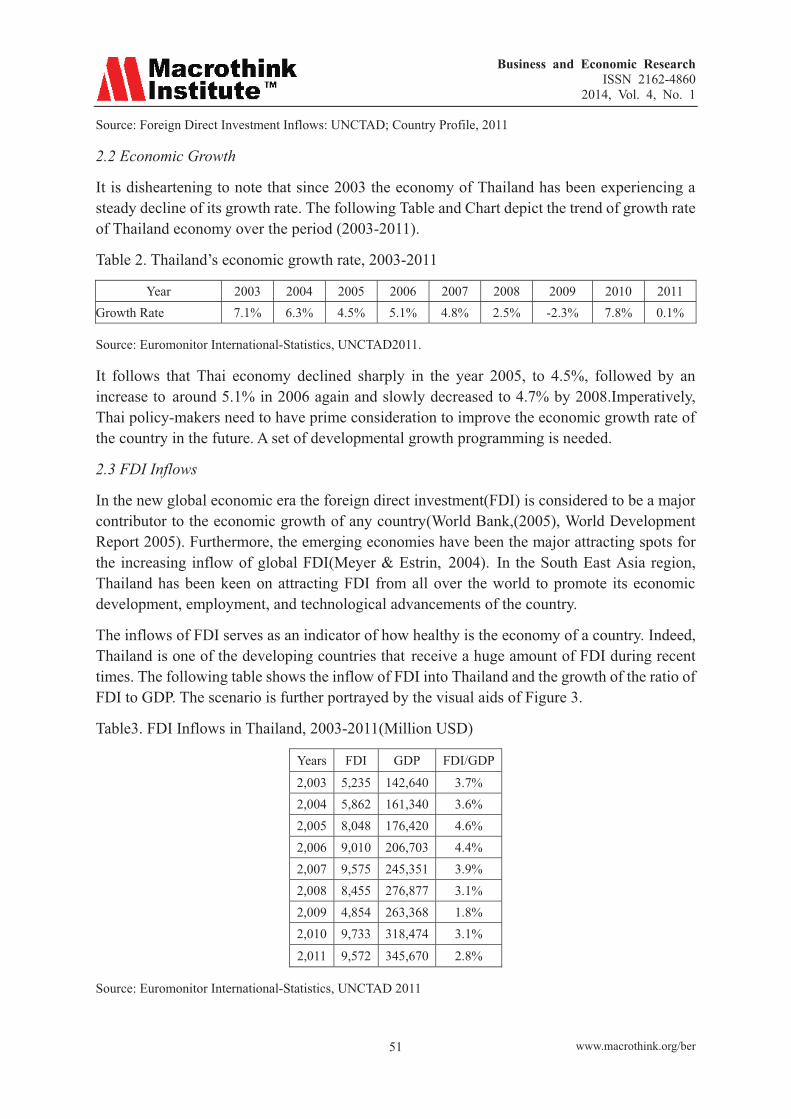
Business and Economic Research ISSN 2162-4860
2014, Vol. 4, No. 1
www.macrothink.org/ber 51
Source: Foreign Direct Investment Inflows: UNCTAD; Country Profile, 2011
2.2 Economic Growth
It is disheartening to note that since 2003 the economy of Thailand has been experiencing a steady decline of its growth rate. The following Table and Chart depict the trend of growth rate of Thailand economy over the period (2003-2011).
Table 2. Thailand’s economic growth rate, 2003-2011
Year 2003 2004 2005 2006 2007 2008 2009 2010 2011 Growth Rate 7.1% 6.3% 4.5% 5.1% 4.8% 2.5% -2.3% 7.8% 0.1%
Source: Euromonitor International-Statistics, UNCTAD2011.
It follows that Thai economy declined sharply in the year 2005, to 4.5%, followed by an increase to around 5.1% in 2006 again and slowly decreased to 4.7% by 2008.Imperatively, Thai policy-makers need to have prime consideration to improve the economic growth rate of the country in the future. A set of developmental growth programming is needed.
2.3 FDI Inflows
In the new global economic era the foreign direct investment(FDI) is considered to be a major contributor to the economic growth of any country(World Bank,(2005), World Development Report 2005). Furthermore, the emerging economies have been the major attracting spots for the increasing inflow of global FDI(Meyer & Estrin, 2004). In the South East Asia region, Thailand has been keen on attracting FDI from all over the world to promote its economic development, employment, and technological advancements of the country.
The inflows of FDI serves as an indicator of how healthy is the economy of a country. Indeed, Thailand is one of the developing countries that receive a huge amount of FDI during recent times. The following table shows the inflow of FDI into Thailand and the growth of the ratio of FDI to GDP. The scenario is further portrayed by the visual aids of Figure 3.
Table3. FDI Inflows in Thailand, 2003-2011(Million USD)
Years FDI GDP FDI/GDP
2,003 5,235 142,640 3.7% 2,004 5,862 161,340 3.6% 2,005 8,048 176,420 4.6% 2,006 9,010 206,703 4.4% 2,007 9,575 245,351 3.9% 2,008 8,455 276,877 3.1% 2,009 4,854 263,368 1.8% 2,010 9,733 318,474 3.1%
2,011 9,572 345,670 2.8%
Source: Euromonitor International-Statistics, UNCTAD 2011

Business and Economic Research ISSN 2162-4860
2014, Vol. 4, No. 1
www.macrothink.org/ber 52
1.0%
2.0%
3.0%
4.0%
5.0%
Figure 3. FDI Inflows in Thailand
Source: Euromonitor International-Statistics, UNCTAD 2011
2.4 Degree of Openness
The degree of openness is an indicator of the level of global integration of a nation. It is measured in terms of the trade ratio:
DOO = ((X+M)/GDP) * 100
Where, X is the annual export value, M is the annual import value, and GDP is the Gross Domestic Products.
Thai economy maintained more than 100% as Trade Ratios or degrees of Openness (DOO) during the period 2003-2011.
Table 4. Thai DOO, 2003-2011
Years Degree of Openness 2003 109% 2004 118% 2005 129% 2006 126% 2007 120% 2008 132% 2009 102% 2010 112% 2011 124%
Source: Euromonitor International-Statistics, UNCTAD 2011
It follows that these has been a rising trend in the degree of openness of the country. In 2008, the trade ratio is estimated to be around 132%.
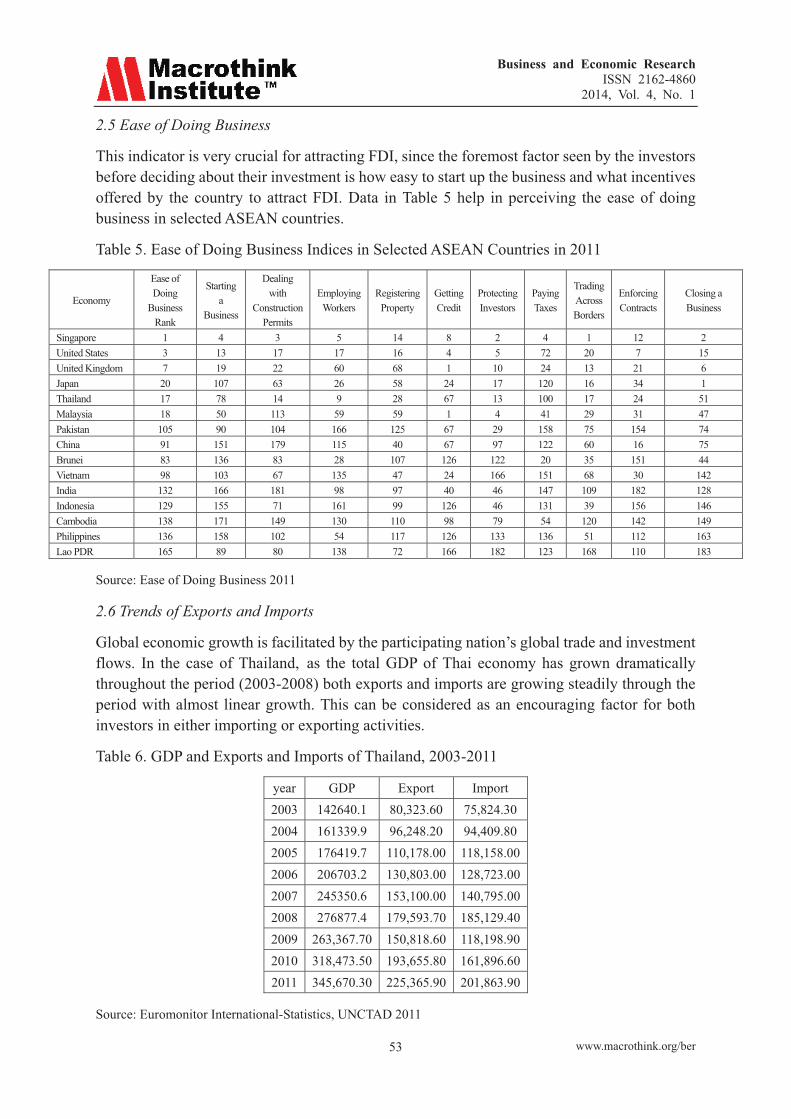
Business and Economic Research ISSN 2162-4860
2014, Vol. 4, No. 1
www.macrothink.org/ber 53
2.5 Ease of Doing Business
This indicator is very crucial for attracting FDI, since the foremost factor seen by the investors before deciding about their investment is how easy to start up the business and what incentives offered by the country to attract FDI. Data in Table 5 help in perceiving the ease of doing business in selected ASEAN countries.
Table 5. Ease of Doing Business Indices in Selected ASEAN Countries in 2011
Economy
Ease of Doing
Business Rank
Starting a
Business
Dealing with
Construction Permits
Employing Workers
Registering Property
Getting Credit
Protecting Investors
Paying Taxes
Trading Across Borders
Enforcing Contracts
Closing a Business
Singapore 1 4 3 5 14 8 2 4 1 12 2 United States 3 13 17 17 16 4 5 72 20 7 15 United Kingdom 7 19 22 60 68 1 10 24 13 21 6 Japan 20 107 63 26 58 24 17 120 16 34 1 Thailand 17 78 14 9 28 67 13 100 17 24 51 Malaysia 18 50 113 59 59 1 4 41 29 31 47 Pakistan 105 90 104 166 125 67 29 158 75 154 74 China 91 151 179 115 40 67 97 122 60 16 75 Brunei 83 136 83 28 107 126 122 20 35 151 44 Vietnam 98 103 67 135 47 24 166 151 68 30 142 India 132 166 181 98 97 40 46 147 109 182 128 Indonesia 129 155 71 161 99 126 46 131 39 156 146 Cambodia 138 171 149 130 110 98 79 54 120 142 149 Philippines 136 158 102 54 117 126 133 136 51 112 163 Lao PDR 165 89 80 138 72 166 182 123 168 110 183
Source: Ease of Doing Business 2011
2.6 Trends of Exports and Imports
Global economic growth is facilitated by the participating nation’s global trade and investment flows. In the case of Thailand, as the total GDP of Thai economy has grown dramatically throughout the period (2003-2008) both exports and imports are growing steadily through the period with almost linear growth. This can be considered as an encouraging factor for both investors in either importing or exporting activities.
Table 6. GDP and Exports and Imports of Thailand, 2003-2011
year GDP Export Import 2003 142640.1 80,323.60 75,824.30 2004 161339.9 96,248.20 94,409.80 2005 176419.7 110,178.00 118,158.00 2006 206703.2 130,803.00 128,723.00 2007 245350.6 153,100.00 140,795.00 2008 276877.4 179,593.70 185,129.40 2009 263,367.70 150,818.60 118,198.90 2010 318,473.50 193,655.80 161,896.60 2011 345,670.30 225,365.90 201,863.90
Source: Euromonitor International-Statistics, UNCTAD 2011
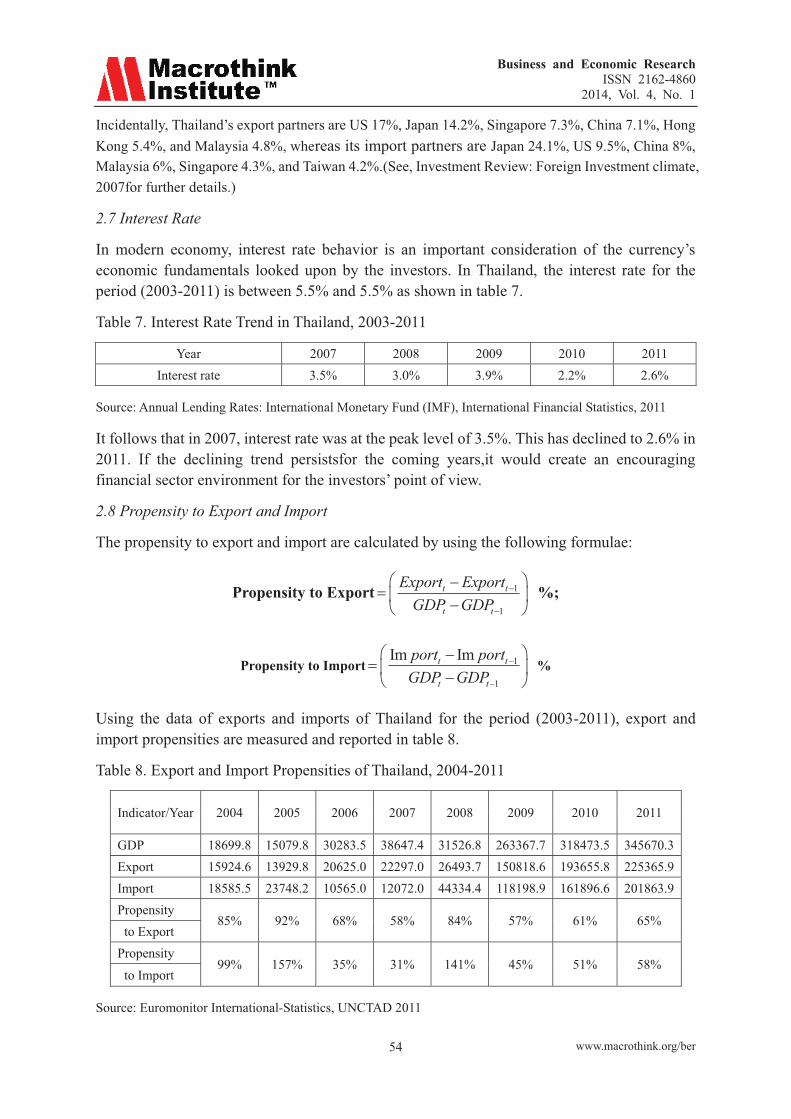
Business and Economic Research ISSN 2162-4860
2014, Vol. 4, No. 1
www.macrothink.org/ber 54
Incidentally, Thailand’s export partners are US 17%, Japan 14.2%, Singapore 7.3%, China 7.1%, Hong Kong 5.4%, and Malaysia 4.8%, whereas its import partners are Japan 24.1%, US 9.5%, China 8%, Malaysia 6%, Singapore 4.3%, and Taiwan 4.2%.(See, Investment Review: Foreign Investment climate, 2007for further details.)
2.7 Interest Rate
In modern economy, interest rate behavior is an important consideration of the currency’s economic fundamentals looked upon by the investors. In Thailand, the interest rate for the period (2003-2011) is between 5.5% and 5.5% as shown in table 7.
Table 7. Interest Rate Trend in Thailand, 2003-2011
Year 2007 2008 2009 2010 2011 Interest rate 3.5% 3.0% 3.9% 2.2% 2.6%
Source: Annual Lending Rates: International Monetary Fund (IMF), International Financial Statistics, 2011
It follows that in 2007, interest rate was at the peak level of 3.5%. This has declined to 2.6% in 2011. If the declining trend persistsfor the coming years,it would create an encouraging financial sector environment for the investors’ point of view.
2.8 Propensity to Export and Import
The propensity to export and import are calculated by using the following formulae:
Propensity to Export 1
1
t t
t t
Export ExportGDP GDP
�
�
� ��� � � �
%;
Propensity to Import 1
1
Im Imt t
t t
port portGDP GDP
�
�
� ��� � � �
%
Using the data of exports and imports of Thailand for the period (2003-2011), export and import propensities are measured and reported in table 8.
Table 8. Export and Import Propensities of Thailand, 2004-2011
Indicator/Year 2004 2005 2006 2007 2008 2009 2010 2011
GDP 18699.8 15079.8 30283.5 38647.4 31526.8 263367.7 318473.5 345670.3 Export 15924.6 13929.8 20625.0 22297.0 26493.7 150818.6 193655.8 225365.9 Import 18585.5 23748.2 10565.0 12072.0 44334.4 118198.9 161896.6 201863.9 Propensity
85% 92% 68% 58% 84% 57% 61% 65% to Export Propensity
99% 157% 35% 31% 141% 45% 51% 58% to Import
Source: Euromonitor International-Statistics, UNCTAD 2011

Business and Economic Research ISSN 2162-4860
2014, Vol. 4, No. 1
www.macrothink.org/ber 55
It appears that Thailand propensity to import is dominant for the period (2004-2008) except for 2006, 2007 where the export propensity was more than that of import propensity.
2.9 Inflation Rate
Inflation rate is an important aspect of a country’s good economic fundamentals. Theinflation rates for the period of (2003-2011) are shown in the following table:
Table 9. Inflation Rate in Thailand, 2003-2011
Year Inflation Rate 2003 1.8 2004 2.8 2005 4.5 2006 4.6 2007 2.2 2008 5.5 2009 -0.9 2010 3.3 2011 3.8
Source: Annual rates of inflation: Euromonitor International from International Monetary Fund (IMF), International Financial Statistics and World Economic Outlook/UN/national statistics.
The inflation rate has increasing trend over the period even though it shows a sudden fall to around 2.2% by 2007.
2.10 Corruption Index
Smooth international business conduct is possible in a country where its administration and legal set-up is corruption free. However, corruption in Thailand is one of the major barriers to doing business. Corruption level in Thailand is as much as in Mexico, but less than that of China, India, or Vietnam.(See, Thailand Telecommunications Report Q2 2009).
The corruption indexes of Thailand for the period (2003-2008) are stated in the table10.
Table 10. The Control of Corruption Indexes Thailand, 2002-2011
Year Control of Corruption Index 2002 47.8 2003 52.7 2004 51.7 2005 52.7 2006 44.4 2007 43.2 2008 42.2 2009 47.8 2010 46.4 2011 44.5
Source: Worldwide Governance Indicators (WGI), 2012

Business and Economic Research ISSN 2162-4860
2014, Vol. 4, No. 1
www.macrothink.org/ber 56
3. Thailand’s National Competitive Advantages
Thailand’s determinant factors of national competitive advantages have been developed and strengthened over a long period of time. A perception of this is reviewed in the following sections.
3.1 Population (Human Resources)
The population in Thailand is nearly 66.8 million as in April 2009 (Thailand National Statistics Office, 2009). Demographically, most of the population is aged between 15-59 years, and the population growth rate has been moderate at 0.7% in 2007(Country profile, 2008). The country’s workforce distribution in different economic sectors reported to be49% in agriculture; %14 in industry; and37 % in service. (See, "Investment Review: Foreign Investment climate," 2007 for further details). In relative term, among the South-east Asian countries, Thailand has a big number of populations and low cost labor force that has made the country as an attractive business environment in the region. Furthermore, the literacy rate among the population over 6 years is quite high at 91%.
In today’s world, the objective of any organization is not confined to only how much the performance of employees or labors (quantity)! But also about how good and innovative their performance (quality)! In modern time, the work operation has become more knowledge-based so the employees can improve the job performance through their ability to generate new ideas and implement them to provide new services and work processes (Jong & Hartog, 2007). As such, there is a noticeable great attention is being paid by Thailand’s public and private organizations towards capitalizing in training and improving qualification of labors and employees to achieve successfully the local and international goals of the organization.
The government of Thailand has planned an effective set of measures for promoting Research and Development (R&D) in the country. For instance, the Board of Investment (BOI) has granted full incentives for the promotion of R&D investment instead of labor intensive projects since 2006. It has approved 33 projects with a combined investment of $133.9 million (See, Thailand: Country Analysis Report, 2009).
3.2 Thai Economy’s Potential
The economy of Thailand had grown rapidly for the last forty years, but during the late 1990s it experienced economic problems with a rapid decline in their real estate market, stock market, and a severe decline in the value of their currency, the Thai baht. The economy of Thailand started to recover soon after the crises and many consequent problems were being planned to be solved by the end of 1999. So, looking back to the position of the economy of Thailand 25 years ago, and how the crises hit the whole growing economy, it is impressive to see how fast Thailand’s economy is going to resume its growing trend (Thailand Country Profile, 2008).
In economic term one main factor which influences Thailand’s competitive advantage is its major natural resources like fluorite, gypsum, lead, lignite, natural gas, rubber, tantalum, tin, tungsten, and renewable resources include fish and timber(Thailand Country Profile, 2007).

Business and Economic Research ISSN 2162-4860
2014, Vol. 4, No. 1
www.macrothink.org/ber 57
3.3 Climate
Climatic natural environment of Thailand contains varieties of different climates for different regions: the Northeast, North, and Central regions have a savannah-type climate, the Central and upper Southern regions have a tropical monsoon climate, and the lower Southern region has a tropical rainforest climate. Of course, these varieties of different climate are providing the country with a solid ground to become an attractive destination for tourists and agriculture-driven investors(Bangkok Companies website,2009).
3.4 Agriculture and Agro-Industry
In the agrarian landscape of Thailand, it has very good quality soil which is promising for high productive agricultural activities. Therefore, Thailand is regarded as a destination for those who want to invest in Agricultural enterprises to benefit from its natural resources as productive land, water availability, and cheap labours.
Agriculture and Food-based Industry has grown dramatically and its performance was encouraging for local and global investors. Rice, for example, is the first most important exportable commodity. Its production occupies more than half of all farmland. Rice surplus beyond domestic consumption is exported and represents one-third of the agricultural export value. Fishery exports, both from wild catching and aquaculture, especially shrimp, have been the number one export activity.
The second most important export commodity is the rubber. Therefore, many MNCs which are focusing on these products as their main raw material could find in Thailand their best place to establish their factories or organizations. Over the past few decades, Thailand has successfully utilized innovations in agricultural research and technology to develop a dynamic agricultural sector.
The productivity of farms in Thailand has been increasing comparatively and the quality of corps and food agricultural products have been enhanced. The investment in agricultural research resulted in increasing of yields and land productivity, and this in turn enabled the Thai food and agricultural products to enter in global markets. Nowadays, Thailand is a giant exporter of varieties of foods and agricultural products. After the Asian financial crises and its consequences on Thai economy as a whole, Thai agricultural exports has increased significantly such as: rice, rubber, shrimp, poultry, cassava, and corn. This indicated that the strengths of Thai’s economy lies in its agricultural sector. Its expanding growth need to be sustained in the Thai policy agenda.
Globally Thailand is the world’s top exporter of rice, canned pineapples and pineapple juice and concentrates, and is among the top ten exporters of seafood, frozen shrimp and frozen chicken, with agricultural exports accounting for roughly 15% of total exports, and also it produces one third of the global production of rubber (Board of Investment website).
It is heartening to note that Thailand’s ninth five-year plan (2002-2006) was the first plan that proposed a framework for the development of food industry to enhance the competitiveness of the country. The objective of this plan was to lead the country to the position of being a major

Business and Economic Research ISSN 2162-4860
2014, Vol. 4, No. 1
www.macrothink.org/ber 58
world processed food producer and exporter, the tenth plan (2007-2011) shared the same objective as same as the previous plan.
3.5 Manufacturing and Industry Potential
To encourage the industry and manufacturing processes, Thailand has developed ten free trade zones. These zones are for exports only, through which raw materials and finished products can move free of duties. These zones are located within industrial estates, and many have customs facilities to speed processing. In addition, there is forward linkage that many factories can establish their warehouse to which their raw materials which will be used for manufacturing the for-export products can be imported duty free.
The Industrial Estate Authority of Thailand (IEAT), which is under the Ministry of Industry as well as the private sector, established many industrial estates. The IEAT operates twelve estates, plus 22 more in conjunction with the private sector in 14 provinces nationwide. Private sector businesses operate over 50 industrial estates, most of which have received promotional incentives from the Board of Investment(See, Thailand Country Conditions Climate for Investment & Trade( Jan,2008)
3.5.1 Automobile Industry
These days, automobile industry has become a king-pin of the Thai industrial progress. Thailand is fast making a name for itself as the 'Detroit of the East'. In the past few years, the auto industry has seen substantial growth, and all indicators suggest that this upward trend will continue, and not just through fast-paced domestic consumption. In early 2005, the Thailand Automotive Institute proposed its ambitious 'Detroit of Asia' development plan to increase revenue from automobiles and auto parts to 1.3 trillion baht by 2010, with a view to make Thailand the ninth largest vehicle manufacturer in the world. The plan is an extensive one aimed at boosting both quality and quantity. The multi-faceted strategy in this context involved a human-resources development programme, the dispatch of highly trained experts to upgrade the technology used in making auto parts, the establishment of research-and-development centers, an IT headquarters to analyze the industry's trends, and an export promotion office(See,"Thailand Industry Forecast December 2005," for further details).
In fact, these days most of the world's major automobile companies have assembly lines and auto parts manufacturing plants in Thailand. All the big brands of the Japanese auto industry - Toyota, Isuzu, Nissan, Honda and Mitsubishi - have major investments in the Kingdom. Other bigname investors include BMW and Volvo. The big three auto companies of the United States namely, Ford, Daimler-Chrysler and General Motors have undertaken joint ventures with local Thai companies. Moreover, high-end luxury car makers such as Alfa Romeo and Porsche have established their footholds in the up-and-coming regional capital of the auto industry(Thailand Industry Forecast December 2005).
In Thai economy, thus, auto’s production has been expected to continue to grow strongly in 2005-2009 due to the growing level of investment in automobile sector, and due to the rising of domestic and international demand. Thai Automotive Industry Association are expecting high level of investment and the number of output was expected to exceed 1.5 million units a year by

Business and Economic Research ISSN 2162-4860
2014, Vol. 4, No. 1
www.macrothink.org/ber 59
2009(See, Thailand Industry Forecast December, 2005).
3.5.2 Industrial Machinery, Electrical and Electronics
The electronics sector has recorded strong growth in 2003-2006, with an average growth of 25% a year, before slowing in 2007. Companies which are manufacturing integrated circuits and hard disk drives (HDDs) have gained impressively. Since many global companies were behind the expansion of production of HDD, Thailand has become an increasingly attractive destination for HDD producers. In fact, this expansion is due to the promotional incentives offered by the Board of Investment (BOI), which made HDD production one of its main priorities (Thailand Country Profile, 2007).
Furthermore, the electrical appliances manufacturing sector has been regarded as one of the attracting manufacturing sectors. Some of the essential features which attract greater investment to Thailand is that foreign firms can benefit from low tariff privileges under ASEAN free-trade areas(Thailand Country Profile, 2007).
3.5.3 Information Technology and Technology Management
Thai policy-makers are well aware of the need for expanding IT sector, therefore, since 1992, the Thai government started to promote the information technology by appointing different committees to take care of planning and implementing the improvement of this sector. Two major policies are worth mentioning in this regard, the first national policy (IT-2000) covered the period 1996-2000 and focused on the following:
Investment in information technology infrastructure.
Investment in people to make them technological literate.
To spread the informational knowledge to reduce the societal and economic gap.
The second national policy (IT-2010) which covered the period 2001-2010 extended the objectives of the first policy and incorporate 5 other field which are the foundation for modern Thailand such as: e-government; e-industry; e-commerce; e-education; e-society (Winley, Arjpru, & Wongwuttiwat, 2007). These policies were expected to lead to sustainable development of knowledge-based economy of Thailand.
In their study, Intarakumnerd & Panthawi (2003), have analyzed the results of the two policies and noticed that there is a remarkable progress in the development of: information infrastructure as could be seen by the increasing number of communication organizations established in Thailand providing fiber optic cable and the number of telephones; Furthermore, the legal acts for online transactions, data privacy, computer crime, and data protection; the computer professional employees in schools, schools networks, and universities’ networks. Despite all these, the IT manpower demand in the country is not yet satisfied. The policy-makers have to take suitable measures in this direction.
3.6 Infrastructures and Transportation
The government of Thailand has planned to spend around THB1.6tn-1.8tn over the period

Business and Economic Research ISSN 2162-4860
2014, Vol. 4, No. 1
www.macrothink.org/ber 60
(2008- 2011). The planned projects include Bangkok’s mass transit system, as well as public housing, energy, roads, railways, bridges, water management system, and airport development(Thailand Infrastructure Report Q2, 2009). Other aspects of infrastructure are discussed in the following sections:
3.6.1 Electricity Supply
The geography of Thailand serves transforming Thailand to become the energy hub in the region. The electrical authorities in Thailand are tirelessly developing the country’s electric power system to ensure that its electricity supply remains at the satisfactory level. They are also exerting all its possible efforts that can ensure that the power supply has a secure and reliable infrastructure service to contribute significantly to the betterment of the quality of life and the environment, and drives the country’s economic and social growth in the future and to attract FDI to the country. Moreover, Thailand has a stable and dependable electricity generating system that is meant to provide power at reasonable price(For details, see, Thailand Board of Investment (BOI), 2009).
3.6.2 Water Supply
Water is the source of life, water management is a crucial factor for survival and growth, the Thai government is working seriously at maintaining Thailand's water at international standards.
The population growth, industrial growth, and the rising incomes have led to an increased demand for water. Water Demand is projected to be growing 20 % a year, but the investment program of the Provincial Waterworks Authority (PWA) has increased supplies about 12 % a year. The PWA has the capacity to serve about 60 % of the 10 million people living in the 220 cities and towns under its jurisdiction with about 1.2 million cubic meters a day(Thailand Board of Investment (BOI) website).
In statistical term, demand for water is about 53 billion cubic meters annually. The water supply is distributed such as: almost 90 % is allocated for agriculture, 6 % for consumption, and the rest for industrial use. Water Demand in the country is estimated at 70 billion cubic meters annually in the next 10 years. The annual rainfall of Thailand is between 1,200 and 2,700 millimetres and there are 25 river basins in Thailand. The amount of average annual runoff is 200 billion cubic meters, but only 38 million cubic meters, or 19 %, can be stored in reservoirs("Thailand Board of Investment (BOI),2009 ").
3.6.3 Roads and Highways
A good infrastructure is essential for the growth of trade, nationally and internationally alike.Thailand has a good road network of more than 250,000 kms, of which 51,466 kms is national highways. All major cities in Thailand are accessible by land, with all-weather highways and intercity roads linking them to the road network covering the whole country, as well as the Asian Highway and the road networks of neighbouring countries over the border crossings(See, Thailand Country Conditions Climate for Investment & Trade( Jan,2008). Therefore, the transportation of goods and raw material is very easy between different areas. This, in turn,

Business and Economic Research ISSN 2162-4860
2014, Vol. 4, No. 1
www.macrothink.org/ber 61
encourages establishments of businesses in every part of the country and at the same time the products and services can reach all other parts easily.
3.6.4 Railways
Thailand has an extensive network of rail system spanning 4,070 km of railways that constitute a vital link in the transportation chain. Twenty-seven countries in an intergovernmental meeting here are preparing to link 80,000km of railway lines to form a Trans-Asian Railway (TAR) network. At present, export and import of goods can be conveniently transported by train through the Thai-Malaysian border without further unloading.
The traffic is made via Sungai Kolok and Badang Besar Stations on the eastern and western borders of Malaysia respectively. Frequent shippers with a high volume of goods transported do enjoy train services through and from Singapore. In short, highway and railway systems provide exporters and importers with good facilities to make successful and promising businesses(State Railway of Thailand website 2009).
3.6.5 Airports and Seaports
Thailand has a coastline of 3,219 km with over 4,000 km of waterways, and has 122 ports, wharves, and jetties including eight deep-sea international ports, to facilitate the movement of all vessels engaged in the international trade. Ports include Bangkok, Laem Chabang, Pattani, Phuket, Sattahip, Si Racha, and Songkhla with very big capacity. It follows that the sea transportation in the country is very easy and convenient locally and internationally. Incidentally, Thailand also has 28 commercial airports, 5 of which are international airports with very big capacity (Thailand Country Conditions Climate for Investment & Trade Jan,2008).
3.6.6 Telephone and Mobile Services
Thailand's telecommunications services are on par with the international standards, especially in urban areas such as Bangkok. There is an abundance of fixed lines for offices and residences. There are an increasing number of mobile phone subscribers and internet throughout Thailand and this number is sharply increasing over years. Thailand has competitive networks of fixed telephone lines 6.6 Mn (2007), mobile telephones 16.117 Mn (2007) (Investment Review: Foreign Investment climate, 2007), dial-up Internet and ADSL broadband which are getting more advanced over years and many new investors are establishing new projects. The Thailand Internet Service Provider Association stated that, at the end of 2007, there were 600,000 broadband subscribers, and it expected to rise to just under 1Mn by the end of 2008. Within 2009, the number is projected to reach to a high range between 5 Mn and 10 Mn subscribers(Thailand Telecommunications Report Q2 2009).
3.7 Service Industry
Like other countries in the south eastern Asia, the service industries have been one of the fast growing sectors in Thailand. Services are offered in transportation, construction,retailing/wholesale, finance, and tourism (Kasikorn Research Centre, 2006). For thecompanies belonging to this sector in Thailand, many of them were considered to be part of
Business and Economic Research ISSN 2162-4860
2014, Vol. 4, No. 1
www.macrothink.org/ber 62
small and medium enterprises (SMEs).
As a matter of fact, the service-related employment accounted for more than two-thirds of the total SME employments. According to (Manasserian, 2005), the service sector accounted for 45% of the country GPD.
In addition, based on the SWOT analysis (strength-weakness-opportunity-threat), it appears that there is a clear urgency on improving the competitiveness in the service sector of the country. This relates to prepare service providers for globalization as well as their long-term ability to support manufacturing firms.
3.7.1 Health, Beauty and Wellness
This sector is crucial for the Thai economy, interestingly enough, foreign patients are becoming significant sources of income for Thailand’s private and public hospitals because their purchasing power is considerably higher than the average domestic patients. On the other hand, Thailand’s cost of living is much lower than in Japan, the U.S. and Europe, making the cost of medical care in Thailand much lower than what foreign patients have to pay in their own countries. This is one of the main reasons why private hospitals in Thailand are becoming more and more popular to foreigners seeking medical care overseas. According to figures released by the Private Hospital Association, Thailand, a total of 970,000 foreign patients sought medical diagnosis and treatment in private hospitals in Thailand during 2003, generating a total income of about Baht 19,000 million. By 2010 the total number of foreign patients is expected to reach the two-million mark and the total income generated will be about Baht 80,000 million. This bright forecast has prompted Thai private hospitals to adjust marketing and product strategies to meet the growth of medical care requirements as well as capitalize on the new opportunities on its relative competitive advantage.
3.7.2 Tourism Industry
The tourism sector is the king-pin of the Thai economy. The international tourism industry in Thailand has established an impressive record of growth over the last decades. Breathtaking scenery, local culture, historical sites, landmarks and architecture, hospitality, and politeness of the people remain strong points for Thailand’s tourism. Accepted worldwide as the destination for best cuisine, best value destination, best beach to swim and most exciting outdoor market, Thailand is a gateway to Indochina: Vietnam, Lao, China and Cambodia.
Under the new slogan “Thailand Unforgettable”, marketing activities will seek to accentuate Thailand’s key strengths as an ideal tourist destination: sun, sand and sea; modernity and heritage; and shopping, dining and golfing, and warmth of friendliness.
Thailand's national development plans call for meeting the challenge of simultaneously attracting both large spending tourists as well as those who are willing to extend the length of their visits. Tourism is a major economic factor in the Kingdom of Thailand, contributing an estimated 6.7% to Thailand's GDP in 2007. Tourist numbers have grown from 336,000 foreign visitors and 54,000 R&R soldiers in 1967(OUYYANONT, September 2001) to over 14 million international guests visiting Thailand in 2007. The average duration of their stay in 2007 was

Business and Economic Research ISSN 2162-4860
2014, Vol. 4, No. 1
www.macrothink.org/ber 63
9.19 days, generating an estimated 547,782 million Thai baht (11 billion Euros)("Tourism Authority of Thailand (TAT) retrieved on 9/5/2009 from http://www2.tat.or.th/stat/web/static_index.php,"). In 2006, Thailand was the 18th most visited country in the World Tourism rankings ("UNWTO World Tourism Barometer (June 2007),")with 13.9 million visitors. Even though the global financial crisis and the political problems in Thailand were main reasons in the drop of tourist arrivals during 2008, it was expected that around 17 Mn tourists would arrive during 2009(Thailand Tourist Report Q1 2009).
There is new but growing phenomenon called medical tourism. Nowadays, it is common that a patient travels from the United States to a high-quality hospital in New Delhi or Bangkok for heart surgery- the surgery might be performed by a doctor who got qualified in the US – with very less price comparing to that in The US. (Innovation Abroad, 2008).
The Spa industry in Thailand is fast growing and promising since many international tourist arrivals to Thailand intend to enjoy Thai physical treatments and Spa. The International Spa Association has reported that 63% of Americans tourists are likely to visit a spa while travelling. Some tourists arrivals decide to visit Thailand to improve their health through spa treatments as part of Thai therapies.
Spa services in Thailand are categorized into: day spa; hotel, resort spa; destination spa; medical spa, mineral spring spa; and spa cuisine. Visitors have an access to a wide choices of treatments and therapies including: hydrotherapy and supplementary massages, physical stretching and therapy such as body massage, facial massage, traditional Thai massage, yoga, medical nutritional control and beauty care(" 05 HEALTH AND WELLNESS. Travel Agent, 9/15/2008 Thailand Supplement,"). These new and growing kind of branded products attract tourists from all around the world and this creates many business opportunities for locals and international entrepreneurs in the country.
3.7.3 Banking Industry and Finance
Thailand is a major financial centre with an integrated banking networks (Thailand: Country Analysis Report – In-depth PESTLE Insights, 2009). It has a good banking network consists of many commercial banks local and foreigners, which are playing a significant role in the financial sector of the economy. This facilitates the process for investors to financing their projects. Further, the government is developing different plans and considering various reforms agendas, including establishing an integrated financial regulatory agency that would free up the Bank of Thailand to focus on monetary policy(Thailand: Country Analysis Report – In-depth PESTLE Insights, 2009).
In addition, the Thai government is attempting to strengthen the financial sector through the consolidation of commercial, state-owned, and foreign-owned institutions. It may be mentioned that the government’s Financial Sector Reform Master Plan, which was first introduced in early 2004, provides tax breaks to financial institutions that engage in mergers and acquisitions. Thai reform programs have been deemed successful by outside experts. As of 2007, there were three state-owned commercial banks and five state-owned specialized banks,
Business and Economic Research ISSN 2162-4860
2014, Vol. 4, No. 1
www.macrothink.org/ber 64
15 Thai commercial banks, and 17 foreign banks in Thailand (Thailand Country Profile, July 2006).
3.8 Foreign Economic Relations
Thailand participates actively in regional and international organizations. Thailand is moreover keen on expanding its international trade channels through free-trade agreements and multilateral cooperation within such organizations as the Asian Development Bank (ADB), Asia-Pacific Economic Cooperation, Association of Southeast Asian Nations (ASEAN), and World Trade Organization (WTO)(Thailand: Country Analysis Report – In-depth PESTLE Insights,2009).
Thai government has developed increasingly close eco-political ties with other ASEAN members—Indonesia, Malaysia, the Philippines, Singapore, Brunei, Laos, Cambodia, Burma, and Vietnam. Regional cooperation of the country is progressing well in economic, trade, banking, political, and cultural matters. These regional relationships have served for the stability of the peace in the region and enhancement of the economic integrity(Thailand Country Conditions Climate for Investment & TradeJan,2008).
Furthermore, Thailand developed good longitude relationships with Japan and the United States which are the top two trading partners and sources of direct investment of the nation. Thailand has granted the United States preferential treatment for investment under the Thai-U.S. Treaty of Amity and Economic Relations of 1966. Despite close economic ties between Thailand and the United States, however, there has been unending disputes over agricultural trade, intellectual property rights, and customs procedures.
In July 2005, Thailand had concluded bilateral free-trade agreements with key trading partners, such as Australia, New Zealand, China, India, and Bahrain. China is gaining its importance as a trading partner of the country in spite being a hard competitor for foreign direct investment and export markets, particularly in the areas of agriculture, computer hardware, and textiles (Thailand Country Profile, July 2007).
As developing countries need to define their measurements of Total Quality Management (TQM) principles to enhance their global competitiveness, the Thai manufacturing and service sectors are keen to adopt the international quality standards such as ISO 9000, ISO 14000, and others to increase their demands and improve their performance. TQM processes would enable Thailand’s products and services to penetrate to the global markets confidentially and kept continuously improving and becoming more innovative(Das, Paul, Swierczek & Laosirihongthong, 2006).
4. Thailand Competitive Disadvantages
The country’s policy-makers should work hard to surmount some of the hard corners of its competitive disadvantages, such as
4.1 Political Instability
Thailand has been suffering from the instability of the political system, this in turn; may

Business and Economic Research ISSN 2162-4860
2014, Vol. 4, No. 1
www.macrothink.org/ber 65
adversely affect the inflow of FDI into Thailand and discourages the flow of international tourists to the country. This coupled with the negative effect of the global financial crises which caused the FDI to scale down due to the high level of uncertainties. The ever changing political system and the unstable government can cause political risks which, in turn; will adversely affect the level of foreign and domestic investment in the country.
In today’s world there are many features that are considered to be significantly important for investors to establish their business at any environment, one of these is the degree of the political stability of the country in which they are planning to enter for business. This is the more significant factor in determining the flow of FDI into any country(Lambsdorff, November 1999).
Determinants of political risks such as change of regime, government intervention in the economic situations, property rights legislation, and red tape may adversely affect the decision process of foreign investments (Frey & Schneider, 1979). However, the international investors and the international organizations give high importance for their FDI decision process on how good is the governance index of each country such as: fighting corruption; transparency of the administration processes; and violence free environment("World Bank, 2006).
4.2 Lack of Technical Training
One of the disadvantages that can be identified in Thailand is the lack of scientifically and technologically skilled human resources or well- structured vocational training programs. Thailand, in fact, is in severe and increasing need for technically skilled workers. In its ninth National Social and Economic Development Plan (2002–2006) the government Thailand had stressed in the development of Human Resources in order to meet the development processes needs as well as the increasing economic challenges(Hawley & Paek, 2005).
The slow progress of human resource development can be an obstacle to the process of the economy transition towards knowledge- Based economy and to achieve a sustainable competitiveness. The Asian Development Bank’s (ADB) country operational strategy (COS) in 1993 rightly concluded that Thailand economy was in transition, and there are structural balances caused by the economic rapid growth will cause difficulties in the economic performance in the long run.
The main constraints were the weaknesses in human resources, technical training, and technology to support and meet the needs of fast-paced development processes. One of COS studies in 1999, prepared after the Asian economic crisis, emphasized that the Thai economy needed to move away from labor-intensive production because Thailand was no longer competitive. The COS insisted on that the human resources should be reoriented towards science and technology especially in higher education institutions, as a primary requirement for Thai continued growth and sustainable development (Asian Development Bank Completion report, 2006).
4.3 The In competitiveness of Thai Educational System
The Thai education system and training plans, particularly the higher education, is not

Business and Economic Research ISSN 2162-4860
2014, Vol. 4, No. 1
www.macrothink.org/ber 66
qualified to lead the country’s development. Although a shortage of skilled labor is emerging, the future growth has to be led by the industry sector with higher levels of technology.Technology and job-oriented educational programs are essential in the country, however, the enrollments in higher education had been mainly skewed towards the humanities at the expense of Science and technology education. For example, in 2002only 6% of the enrolled students in the higher education system were in engineering, with similar number enrolled in mathematics and computer science, while 20% enrolled in business administration programs (Thailand Country Profile, 2007).Secondly, English as a medium of education is least emphasized in the country. This needs to be taken care of by the policy-makers to enhance the competitive advantage of the country.
4.4 Corruption
One of the major issues of Thailand is that, the country has been suffering from high levels of corruption. This spread level of corruption in the country’s political and bureaucratic machinery has been a serious problem, and can adversely affect the investment flows in the country. As a matter of fact, Transparency International's corruption perceptions index for 2008, which measures the perceived levels of public sector corruption, ranked Thailand 80th out of 179 countries ranked under this category (Thailand: Country Analysis Report – In-depth PESTLE Insights).
5. Summing Up
This paper endeavoured to examine the attributes of Thailand’s national competitiveness. Thailand has a potential to achieve a competitive edge not only because its natural resources, but also because of Human efforts exerted to organize, utilize, and improve the available competitive activities. However, The Thai financial and economic sectors were hit by the financial crisis 1997 and jolted further by the financial global crises 2008 that scaled down the FDI inflows to the country and shrank its overall economic growth performance.
Indeed, a agricultural sector is the king-pin of Thai competitiveness, moreover, the quality of the Thai soil provides a good environment ground for those who want to invest in agriculture and Agriculture-based industry. Secondly, tourism in Thailand is very active and promising sector. The availability and low cost labor force may be one of the main factors which attract the inflows of FDI to the country.
On the other hand, the lack of skilled labor forces, uncompetitive educational system, and most importantly the instability of political system are on the minus side of the competitive edge of the country. Therefore, it is very important that policy makers of the country should maintain an overall favourable business and investment climate (including for FDI) and refrain from protectionist tendencies.
References
Asian Development Bank, (2006). Competition Report September,
Bangkok Companies website. (2009). Retrieved May 10, 2009, from http://www.bangkokcompanies.com/thailandoverview.htm.

Business and Economic Research ISSN 2162-4860
2014, Vol. 4, No. 1
www.macrothink.org/ber 67
Das, A., Paul, H., Swierczek, F. W., & Laosirihongthong, T. (2006). A Measurement Instrument For TQM Implementation in the Thai Manufacturing Industry. International Journal of Innovation and Technology Management 3(4), 361-377. http://dx.doi.org/10.1142/S0219877006000879
Euromonitor International Statistics website(2009). Retrieved April 26, 2009, from http://www.portal.euromonitor.com.eserv.uum.edu.my/passport/Statistics.aspx
Frey, B., & Schneider, F. (1979). An econometric model with an endogenous government sector. Puplic choice, 34, 29-43. http://dx.doi.org/10.1007/BF00125750
Hashim, F., & Jedin, M. H. (2007). International Business: An Asian Perspective. Shah Alam: Oxford FAJAR Sdn. Bhd.
Hawley, J. D., & Paek, J. (2005). Developing human resources for the technical workforce: a comparative study of Korea and Thailand. International Journal of Training and Development, 9(1), 79-94. http://dx.doi.org/10.1111/j.1360-3736.2005.00223.x
Hodgetts, R. M. (1993), Porter’s Diamond Framework in a Mexican Context, Management International Review, 33(2), 41-54.
Innovation Abroad. (2008). Health Affairs, 27(5).
Intarakumnerd, P., & Panthawi, P. (Eds.). (2003). Science and Technology Development Toward a Knowledge-based Economy.
Investment Review: Foreign Investment climate. (2007). Thailand Review.
Jasimuddin, S. M. (2001) Analyzing the competitive advantages of Saudi Arabia with porter’s model. Journal of Business & Industrial Marketing, 16(1), 59-68. http://dx.doi.org/10.1108/08858620110365007
Jong, J. P. J. d., & Hartog, D. N. D. (2007). How leaders influence employees' innovative behaviour. European Journal of Innovation, 10(1), 41-64. http://dx.doi.org/10.1108/14601060710720546
Kao et al., (2008). Measuring the national competitiveness of the Southeast countries. European Journal of operation research, 187 ,613-628
Kasikorn Research Centre (2006), Thai service sector: adjustment and liberalization. Retrieved May 23, 2009, from www.kasikornresearch.com/kr/eng/econ_analysis.jsp
Lambsdorff, J. (November 1999). Corruption in empirical research-A review. Quarterly Journal of Economic, 110(3), 681-712.
Lukuthai, S. (2007). The importance of the food industry to the Thai Economy:An Input-Output perspective, ASEAN Economic Bulletin; 24(2)
Manasserian, T. (2005), New realities in global markets and Thailand’s economy today. Retrieved May 20, 2009, from http://webh01.ua.ac.be/cas/PDF/CAS48.pdf .

Business and Economic Research ISSN 2162-4860
2014, Vol. 4, No. 1
www.macrothink.org/ber 68
Meyer, K., & Estrin, S. (October 4, 2004). Investment Strategies in Emerging Markets. Edward Elgar Publishing.
Ouyyanont, P. (September 2001). The Vietnam War and Tourism in Bangkok's Development, 1960-70. Southeast Asian Studies, 39(2), 157-187.
Phusavat, K., & Kanchana, R. (2007),Industrial Management & Data Systems Vol. 108 No. 1, 2008 pp. 5-21
Porter,M. (1990), The Competitive Advantage of Nations, The free Press, New York,NY.
State Railway of Thailand website (2009). Retrieved May 10, 2009, from http:www.railway.co.th/English/pro15_masterplan.asp
Thai Board of Investment website. (2009). http://www.tceb.or.th
Thailand Board of Investment (BOI) website accessed on 10/5/2009 from http://www.boi.go.th/english/how/water_supply.asp.
Thailand Board of Investment (BOI) website. accessed on 10/5/2009 from http://www.boi.go.th/english/how/electricity.asp.
Thailand Country Conditions Climate for Investment & Trade( Jan,2008) Political Risk Services Retreived May7, 2009, from http:///web.ebscohost.com
Thailand Country Profile (2007). The Economist Intelleigence Unit Limited. Retrieved May 7, 2009, from www.eiu.com.
Thailand Country Profile (2008). The Economist Intelleigence Unit Limited. Retrieved May 9, 2009, from www.eiu.com.
Thailand Country Profile. (2007). Library of Congress-Federal Research Division. Retrieved May 1, 2009, from http://lcweb2.loc.gov
Thailand Industry Forecast December 2005. The Economist Intelligence Unit Limited Retrieved on 8/5/2009 from www.eiu.com.
Thailand Infrastructure Report Q2 2009. BUSINESS MONITOR INTERNATIONAL LTD Retrieved on 8/5/2009 from http://www.businessmonitor.com.
Thailand National Statistics Office website (2009). Retrieved April 26, 2009, from http://web.nso.go.th/index.htm
Thailand Telecommunications Report Q2 2009. BUSINESS MONITOR INTERNATIONAL LTD.
Thailand Tourist Report Q1 2009. Business Monitor International Ltd.
Thailand: Country Analysis Report – In-depth PESTLE Insights January.(2009). Retrieved May 20, 2009, from http://web.ebscohost.com
Thailand: Country Analysis Report – In-depth PESTLE Insights (2009). Datamonitor.

Business and Economic Research ISSN 2162-4860
2014, Vol. 4, No. 1
www.macrothink.org/ber 69
The Free Encyclopedia ( 2009). http://en.wikipedia.org/wiki/Tourism_in_Thailand
Tourism Authority of Thailand (TAT) retreived on 9/5/2009 from http://www2.tat.or.th/stat/web/static_index.php
UNWTO World Tourism Barometer (June 2007). www.unwto.org, 5(2).
Winley, G., Arjpru, C., & Wongwuttiwat, J. (2007). The Electronic Journal on Information Systems in Developing Countries [Electronic Version], 31, 1-28.
Copyright Disclaimer
Copyright reserved by the author(s).
This article is an open-access article distributed under the terms and conditions of the Creative Commons Attribution license (http://creativecommons.org/licenses/by/3.0/).

Business and Economic Research ISSN 2162-4860
2014, Vol. 4, No. 1
www.macrothink.org/ber 70
Performance Evaluation of the Banking Sector in Bangladesh: A Comparative Analysis
Md. Ariful Islam (Corresponding author)
Deputy Manager, BASIC Bank Limited
Khulna Branch, 107 Sir Iqbal Road, Khulna, Bangladesh
Tel: 880-171-752-9503 E-mail: [email protected]
Mahmudul Hasan Siddiqui
Senior Territory Manager, Unilever Bangladesh Limited
M.N. Trading & Co, Modina Tower, Habibpur, Narayanganj, Bangladesh
Tel: 880-171-168-8592 E-mail: [email protected]
Kh. Fahim Hossain
Accountant, Chevron Bangladesh Ltd.
57 Gulshan Avenue (4th Floor), Gulshan-1, Dhaka-1212, Bangladesh
Tel: 880-192-666-2131 E-mail: [email protected]
Luthful Karim
Assistant Manager, BASIC Bank Limited
Khulna Branch, 107 Sir Iqbal Road, Khulna, Bangladesh
Tel: 880-191-212-5098 E-mail: [email protected]
Received: December 7, 2013 Accepted: December 31, 2013
doi:10.5296/ber.v4i1.4672 URL: http://dx.doi.org/10.5296/ber.v4i1.4672
Abstract
Banking sector plays an important role in the economic development of a country especially

Business and Economic Research ISSN 2162-4860
2014, Vol. 4, No. 1
www.macrothink.org/ber 71
for Bangladesh, a sound and efficient banking system is one of the most important preconditions to achieve economic development. At present, a total of 47 banks (4 SCBs, 4 DFIs, 30 PCBs and 9 FCBs) having 7246 branches are operating in Bangladesh with Tk. 4411.98billion total assets and Tk. 3329.08 billion deposits. The performance of 4types of banks needs to be compared with each other as well as the overall performance of banking sector needs to be compared with other countries. Quantitative comparison can be done on the basis of CAMEL ratio. CAMEL ratios mainly indicate the adequacy of the risk based capital, non-performing loan position, expenditure-income ratio, return on assets (ROA), return on equity (ROE), net interest income (NII), writing of debt, liquid assets, excess liquidity, etc. The study compares the 4 types of bank's time series performance on the basis of selected CAMEL ratios. This thesis paper is divided into five chapters. Chapter one comprises introduction. Chapter two includes overview of banking sector of Bangladesh. Performance of banking sector is contained in chapter three. Chapter four covers analysis and interpretation. The last chapter is about findings and conclusion.
Keywords: Banking System, ROI, CAMEL, Liquidity, Performance
1. Introduction
1.1 Background of the Study
The banking industry of Bangladesh is a mixed one comprising nationalized, private and foreign commercial banks. Many efforts have been made to explain the performance of these banks. Understanding the performance of bank requires knowledge about the profitability and the relationships between variables like market size, bank’s risk and bank’s market size with profitability. Indeed, the performance evaluation of commercial banks is especially important today because of the fierce competition. The banking industry is experiencing major transition for the last two decades. It is becoming an imperative for banks to endure the pressure coming from both domestic and external factors and prove to be profitable. Until the early 1985, Bangladesh had a highly repressed financial sector. Banks and other financial institutions were fully owned by the government. In the early of 1980, Bangladesh entered into the IMF/ World Bank adjustment programs and the process of privatization and liberalization gained momentum under the influence of the World Bank and The IMF. Since then the banking industry of Bangladesh has become an attractive ground for both domestic and foreign investors to take part in the game. It is of the utmost important of these players to prove themselves profitable and work on those pillars of the same.
1.2 Objectives of the Studies
The broader objectives of the study are as under:
a. To known the banking sector and its current trends. b. To study the category wise performance of all banks operating in Bangladesh on the
basis of selected CAMEL ratio. c. To examine the profitability of banks. d. To analyze how the correlation of different ratios affects the net interest income of
banks.
Business and Economic Research ISSN 2162-4860
2014, Vol. 4, No. 1
www.macrothink.org/ber 72
1.3 Methodology of the Study
The research methodology of the selected topic follows in these dimensions:
1.3.1 Population of the Study
All the banks in Bangladeshi banking sector are divided in following groups from the year 2004 to 2011:
i) State-Owned Commercial Banks ( SCB’s) ii) Development Financial Institutions (DFI’s) iii) Private Commercial Banks (PCB’s) iv) Nine Foreign Commercial Banks (FCB’s)
1.3.2 The Period of the Study
The study is covered for eight years from the year 2004 to 2011.
1.3.3 Data Collection
This study is based on secondary data. For this purpose, the researcher has used the data published in Annual reports of Bangladesh Bank and other related websites. Moreover, the journals, articles, reports and surveys have been referred.
1.3.4 Data Analysis
For the comparison between the groups, some statistical tests have been used according to the nature and objectives of the study. The collected information is analyzed by Anova test. The conclusions have been drawn on the basis of 5% level of significance. Another statistical technique 'Correlation' is used to find out the impact of different ratios. Anova test is done with the help of SPSS software and correlation is done with the help of http://ncalculators.com/statistics/correlation-coefficient-calculator.htm website.
1.4 Variables
To analyze the financial performance of banking sector different variables are included in this study, they are as follow:
a. Deposits
Deposits are considered as banks’ main source of funding and are the lowest cost of funds. The more deposits are transformed into loans, the higher the interest margin and profit. Hence, deposits generally have positive impact on profitability of the banks. But if a bank can’t transform its deposits into loans efficiently it may bring negative impact on profitability also.
b. Capital Adequacy (C)
Capital adequacy is a measure of the financial strength of a bank, usually express as a ratio of its shareholders‟ fund to total assets. The ratio reflects the ability of a bank to withstand the unanticipated losses. This ratio has a positive relationship with the financial soundness of the bank.

Business and Economic Research ISSN 2162-4860
2014, Vol. 4, No. 1
www.macrothink.org/ber 73
c. Asset Quality (A)
Asset quality is an important measure of the strength of banks. The ratio of non-performing loans and advances as a share of total and advances is considered for the purpose of analysis. In addition, the ratio of total loans and advances to total assets is utilized to measure the extent of deployment of assets in earning assets.
d. Management Quality (M)
The capacity/efficiency of the management of a bank can be measured with the help of certain ratios. To capture the possible dynamics of management efficiency, the following ratios are considered: total loans and advances to total deposits, interest expenses to total deposits, and operating expenses to total assets.
e) Earnings Ability (E)
Two ratios are used to assess the earnings ability of the banks under study. The first ratio is the net income to total assets or “ROA”. The second ratio used is interest income to total assets. The two ratios have positive relationship with the financial performance of the bank and negative relationship the risk of bank failure.
f) Liquidity (L)
Two ratios are employed in this study to assess the liquidity level of the banks. The first one is total liquid assets to total assets. The second ratio is liquid assets to customers‟ deposits.
1.5 Hypothesis
The broader hypotheses are as under
A) Ho= There is no significant difference in total deposits among all the banking groups. H1= There is significant difference in total deposits among all the banking groups.
B) Ho= There is no significant difference in Capital adequacy ratio among all the banking groups. H1= There is significant difference in Capital adequacy ratio among all the banking groups.
C) Ho= There is no significant different in Non Performing Loans to total loans ratios among all the four banking groups during 2004 to 2011. H1= There is significant different in Non Performing Loans to total loans ratios among all the four banking groups during 2004 to 2011.
D) Ho= There is no significant different in Ratio of net Non Performing Loans to total loans ratios among all the four banking groups. H1= There is significant different in Ratio of net Non Performing Loans to total loans ratios among all the four banking groups.
E) Ho= There is no significant different regarding Bad debts among all the four banking groups. H1= There is significant different regarding Bad debts among all the four banking groups.
Business and Economic Research ISSN 2162-4860
2014, Vol. 4, No. 1
www.macrothink.org/ber 74
F) Ho= There is no significant different regarding Expenditure-income among all the four banking groups. H1= There is significant different regarding Expenditure-income among all the four banking groups.
G) Ho= There is no significant difference regarding Return on Assets in % among all the four banking groups. H1= There is significant difference regarding Return on Assets in % among all the four banking groups.
H) Ho= There is no significant difference regarding Return on equity among all the four banking groups. H1= There is significant difference regarding Return on equity among all the four banking groups.
I) Ho= There is no significant difference regarding net interest income ratio among all the four banking groups during 2004 to 2011. H1= There is significant difference regarding net interest income ratio among all the four banking groups during 2004 to 2011.
J) Ho= There is no significant difference regarding liquid assets ratio among all the four banking groups during 2004 to 2011. H1= There is significant difference regarding liquid assets ratio among all the four banking groups during 2004 to 2011.
K) Ho= There is no significant difference regarding Excess Liquidity ratio among all the four banking groups during 2004 to 2011.
H1= There is significant difference regarding Excess Liquidity ratio among all the four banking groups during 2004 to 2011.
1.6 Limitation of the Study
The study of this kind is generally encountered with some limitations. Unavailability of data is a major problem. Data accuracy cannot be ensured as mainly secondary data collected from Annual Report, Various Financial Stability reports, Economic trends is used in this study. However, repeated and sincere efforts have been given to ensure the accuracy of the data used in this study.
1.7 Literature Review
With respect to the Performances of Bangladeshi Banking sector, foreign and national experts undertook number of studies.
Pandey (2006) stated that the easiest way to evaluate the performance of a firm is to compare its present ratio with the past ratio. It gives an indicator of the direction of change and reflects whether the firm’s financial performance has improved, deteriorated or remained constant over time.
Chowdhury and Ahmed (2009) observed that all the selected private commercial banks are able to achieve a stable growth of branches, employee, deposit, loans and advances, net income, earning per share during the period of 2002-2006. They indicate that the prospect of private

Business and Economic Research ISSN 2162-4860
2014, Vol. 4, No. 1
www.macrothink.org/ber 75
commercial banks in Bangladesh is very bright.
Chowdhury (2002) observed that the banking industry of Bangladesh is a mixed one comprising nationalized, Private and foreign banks. Many efforts have been made to explain the performance of these banks. Understanding the performance of the bank requires knowledge about the profitability and the relationship between variables like market size, banks risk and banks market size with the profitability.
Chowdhury and Islam (2007) stated that deposit and loan advances of nationalized commercial banks (NCBs) are less sensitive to interest changes than those of Specialized Banks (SBs). So, SBs should not make abrupt change in lending or deposit by following the NCBs. If NCBs change their lending rate, their deposit or loan and advances will be affected less than those of CBs. Moreover, deposits of NCBs have higher volume and higher volatility than those of SBs. However SBs offer higher deposit rates and charge higher lending rate than NCBs, which is why the interest rate spread of SBs was higher than that of NCBs.
Siddique and Islam (2001) pointed out that the commercial banks, as a whole are performing well and contributing to the economic development of the country. The average profitability of all Bangladeshi Banks collectively was 0.09% during 1980 to 1995 which means that a profit of Tk.0.09 was earned by utilizing assets of Tk.100 in every aspect of profit; banking sector contributes the national economy as well as the individual organization. Despite overall growth of the banking sector positive the performance of different categories of banks were not equally attractive.
Mujeri & Younus (2009) stated that the higher the non interest income as a ratio of total assets of banks the lower interest rate spread. Similarly market share of deposit of a bank, statutory reserve requirement and NSD certificate interest rate affects the IRS. The analysis in terms of banks group shows that IRS is significantly influenced by operating cost and classified loan of state owned commercial bank and specialized banks while inflation, operating cost market share of deposit, statutory reserve requirement and taxes are important for the private commercial banks. On the other hand non interest income, inflation, market share and taxes matter for the foreign Commercial banks.
Khan (2008) stated that bank is evaluated based on profit and loss as the same way for other business. If the shareholders of the bank get more profit then the bank is identified as successful. Banks can attain success if relevant risks are effectively controlled.
Van Horne & Wachowicz (2005) stated that to evaluate a firm’s financial condition and performance the financial analyst need to perform “checkups” on various aspects of a firm’s financial health. A tool frequently used these checkup is a financial ratio.
2. Overview of Banking Sector in Bangladesh
2.1 Financial System in Bangladesh
Financial System is the set of well organized institutional set up which helps to transfer excess funds from surplus unit to deficit unit. The financial system in Bangladesh includes Bangladesh Bank (the Central Bank), scheduled banks, and non-bank financial institutions like
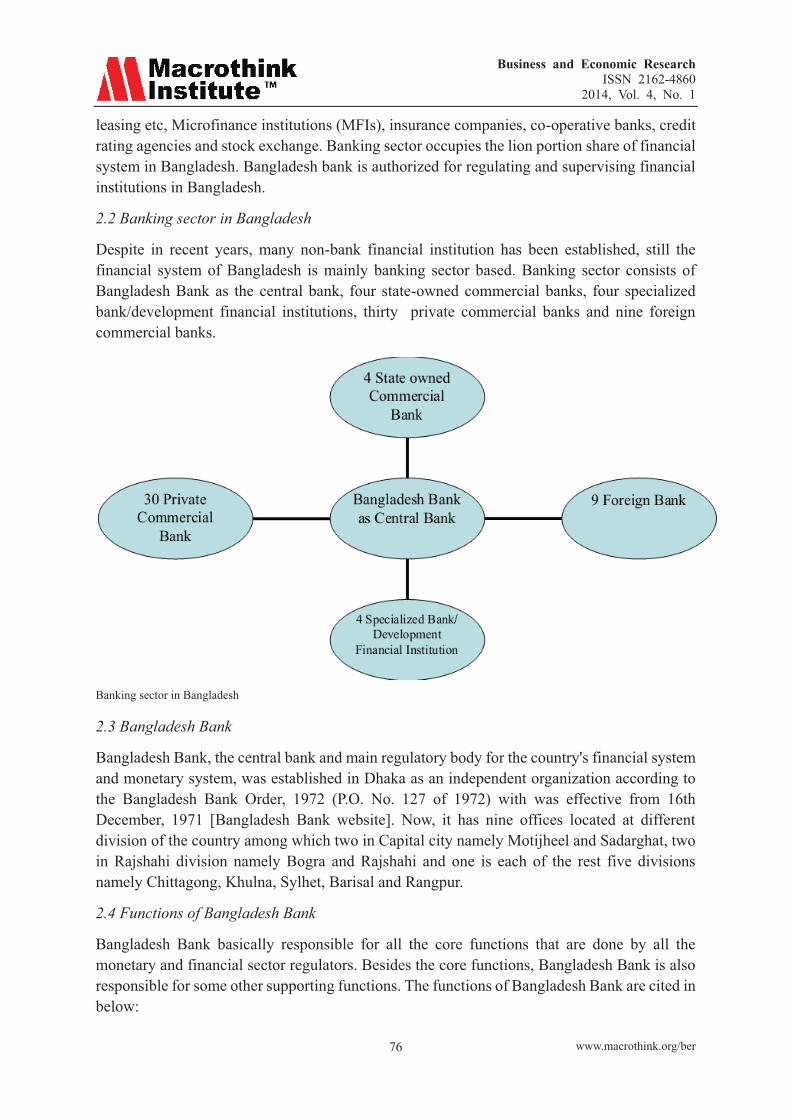
Business and Economic Research ISSN 2162-4860
2014, Vol. 4, No. 1
www.macrothink.org/ber 76
leasing etc, Microfinance institutions (MFIs), insurance companies, co-operative banks, credit rating agencies and stock exchange. Banking sector occupies the lion portion share of financial system in Bangladesh. Bangladesh bank is authorized for regulating and supervising financial institutions in Bangladesh.
2.2 Banking sector in Bangladesh
Despite in recent years, many non-bank financial institution has been established, still the financial system of Bangladesh is mainly banking sector based. Banking sector consists of Bangladesh Bank as the central bank, four state-owned commercial banks, four specialized bank/development financial institutions, thirty private commercial banks and nine foreign commercial banks.
Banking sector in Bangladesh
2.3 Bangladesh Bank
Bangladesh Bank, the central bank and main regulatory body for the country's financial system and monetary system, was established in Dhaka as an independent organization according to the Bangladesh Bank Order, 1972 (P.O. No. 127 of 1972) with was effective from 16th December, 1971 [Bangladesh Bank website]. Now, it has nine offices located at different division of the country among which two in Capital city namely Motijheel and Sadarghat, two in Rajshahi division namely Bogra and Rajshahi and one is each of the rest five divisions namely Chittagong, Khulna, Sylhet, Barisal and Rangpur.
2.4 Functions of Bangladesh Bank
Bangladesh Bank basically responsible for all the core functions that are done by all the monetary and financial sector regulators. Besides the core functions, Bangladesh Bank is also responsible for some other supporting functions. The functions of Bangladesh Bank are cited in below:
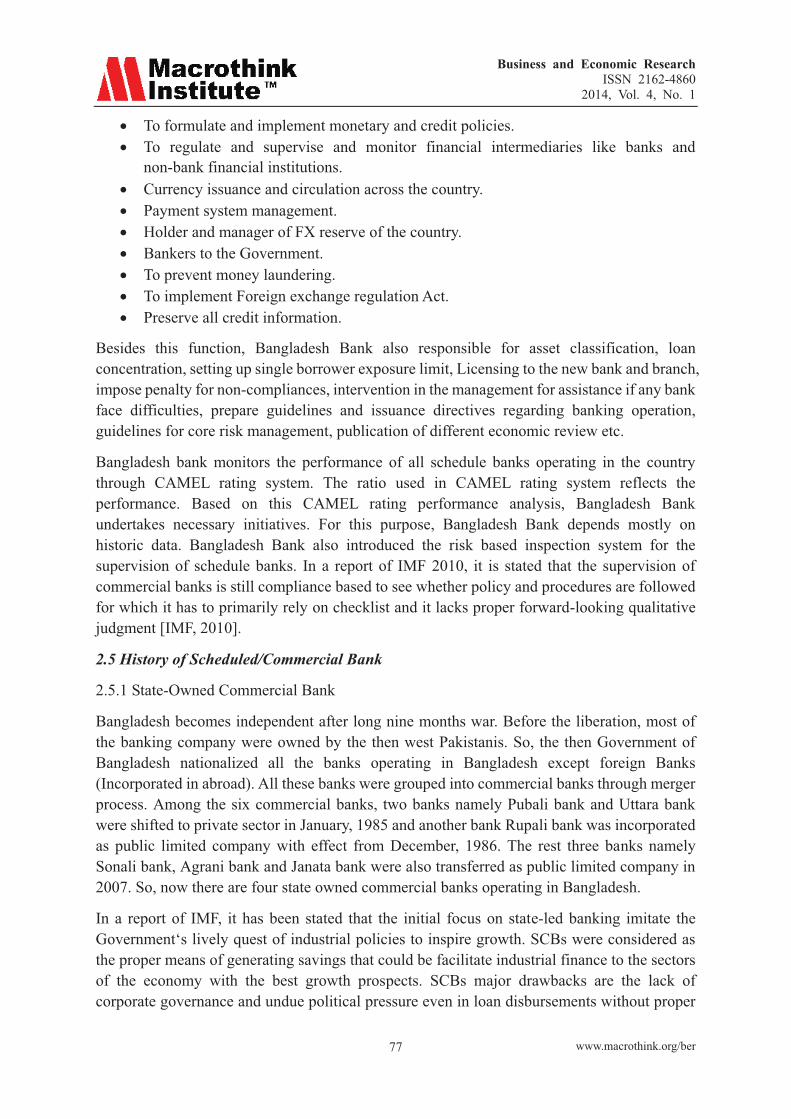
Business and Economic Research ISSN 2162-4860
2014, Vol. 4, No. 1
www.macrothink.org/ber 77
� To formulate and implement monetary and credit policies. � To regulate and supervise and monitor financial intermediaries like banks and
non-bank financial institutions. � Currency issuance and circulation across the country. � Payment system management. � Holder and manager of FX reserve of the country. � Bankers to the Government. � To prevent money laundering. � To implement Foreign exchange regulation Act. � Preserve all credit information.
Besides this function, Bangladesh Bank also responsible for asset classification, loan concentration, setting up single borrower exposure limit, Licensing to the new bank and branch, impose penalty for non-compliances, intervention in the management for assistance if any bank face difficulties, prepare guidelines and issuance directives regarding banking operation, guidelines for core risk management, publication of different economic review etc.
Bangladesh bank monitors the performance of all schedule banks operating in the country through CAMEL rating system. The ratio used in CAMEL rating system reflects the performance. Based on this CAMEL rating performance analysis, Bangladesh Bank undertakes necessary initiatives. For this purpose, Bangladesh Bank depends mostly on historic data. Bangladesh Bank also introduced the risk based inspection system for the supervision of schedule banks. In a report of IMF 2010, it is stated that the supervision of commercial banks is still compliance based to see whether policy and procedures are followed for which it has to primarily rely on checklist and it lacks proper forward-looking qualitative judgment [IMF, 2010].
2.5 History of Scheduled/Commercial Bank
2.5.1 State-Owned Commercial Bank
Bangladesh becomes independent after long nine months war. Before the liberation, most of the banking company were owned by the then west Pakistanis. So, the then Government of Bangladesh nationalized all the banks operating in Bangladesh except foreign Banks (Incorporated in abroad). All these banks were grouped into commercial banks through merger process. Among the six commercial banks, two banks namely Pubali bank and Uttara bank were shifted to private sector in January, 1985 and another bank Rupali bank was incorporated as public limited company with effect from December, 1986. The rest three banks namely Sonali bank, Agrani bank and Janata bank were also transferred as public limited company in 2007. So, now there are four state owned commercial banks operating in Bangladesh.
In a report of IMF, it has been stated that the initial focus on state-led banking imitate the Government‘s lively quest of industrial policies to inspire growth. SCBs were considered as the proper means of generating savings that could be facilitate industrial finance to the sectors of the economy with the best growth prospects. SCBs major drawbacks are the lack of corporate governance and undue political pressure even in loan disbursements without proper

Business and Economic Research ISSN 2162-4860
2014, Vol. 4, No. 1
www.macrothink.org/ber 78
analyzing the prospects of the borrower. Despite recently some measures have been undertaken but this legacy is still visible in high NPL ratios and frail solvency. The Government of Bangladesh has indicated its desire to divest of the state owned banks, and took an initiative in late 2008 to make them limited liability companies. The Ministry of Finance, in consultation with the SEC and BB allowed the banks to move their accumulated losses into capital surpluses based on the notion of Goodwill. The accumulated losses were converted in a Goodwill asset that will be amortized out of future profits. This accounting treatment is questionable and concerns remain regarding the true financial condition of these banks [IMF, 2010].
2.5.2 Specialized Bank/Development Financial Institutions (DFIs)
After liberation, two specialized bank operating in Bangladesh were also nationalized and renamed as Bangladesh Krishi Bank and Bangladesh Shilpa Bank. But Bangladesh Krishi bank was divided in 1987 and renamed as Rajshahi Krishi Unnayan Bank (RAKUB) for Rajshahi Division to promote agricultural development in that region and Bangladesh Krishi bank for the rest of part of the country. In 1988, another specialized bank name Bank of Small Industries and Commerce Bangladesh Ltd. (BASIC) was established as private bank to promote small and medium entrepreneurship. In 1993, the then Government of Bangladesh took the control of BASIC and was declared it as a specialized bank. Bangladesh Shilpa Bank was merged with Bangladesh Shilpa Rin Sangsta (BSRS) in 2010 and renamed as Bangladesh Development Bank Limited (BDBL).
So, currently there are four specialized banks which are termed as Development Financial Institutions (DFIs) operating in Bangladesh.
2.5.3 Private Commercial Bank
Local private commercial bank started operation in the decades of 1980's. We can categorize local private bank in the following manner:
� First generation bank: Those established in the decades of 1980s. � Second generation bank: These banks started operation in 1990 to 1995. � Third generation bank: After 1998, these banks are established.
At present, there are thirty local private commercial banks operating in Bangladesh. PCBs dominate the banking sector of Bangladesh. More than fifty percent of total deposits and assets are covered by the PCBs. The performance of PCBs is much better than SCBs and DFIs in all respects. Client service innovation and banking service automation is one of the major reasons for their domination over the SCBs and PCBs. among the three generation of PCBs, third generation banks are more innovative and provide better client services through automation whereas first generation banks are little bit in backward position though they continuously improving their condition to compete in the market.
Bangladesh‘s PCBs have quickly occupy market share at the expense of the state-owned commercial banks (SCB) and presently grasp more than 59 percent of total deposits whereas it is only 28 percent for the SCBs and PCBs assets coverage is 58% whereas it is only 29% in SCBs.

Business and Economic Research ISSN 2162-4860
2014, Vol. 4, No. 1
www.macrothink.org/ber 79
2.5.4 Foreign Commercial Banks (FCBs)
Before liberation, there were few FCBs operating in the country which was incorporated in abroad. Among those foreign banks, Standard chartered Grindlays Bank was merged with Standard Chartered Bank in 2003 and then American Express Bank further merged with Standard Chartered Bank in 2005. Credit Agricole Indosuez bank was renamed as Commercial Bank of Ceylon Ltd. in 2003. Currently, there are nine foreign commercial banks operating in Bangladesh. Foreign Commercial Banks suffered for lack of wide spread branch network. Their operation is basically limited to capital city and some other municipal city corporation area.
2.6 Scheduled Bank According to the Law
According to Bank Company Act, 2007, "All such banks operating in Bangladesh with different paid-up capital and reserves having a minimum of an aggregate value of Tk. 50 lacs and conducting their affairs to the satisfaction of the Bangladesh Bank have been declared as scheduled banks in terms of section 37(2) of Bangladesh Bank Order 1972. In terms of section 13 of Bank Company Act, 1991, the minimum aggregate value was Tk. 20 crores. From 30th March, 2003, it was tk. 100 crores and from the 8th October 13, 2007, it has been raised at the minimum of Tk. 200 crores" [Bank Company Act, 2007].
3. Performance Evaluation of Banking Sector
The concept of financial performance and research into its measurement is well advanced within finance and management fields. Recently a well-judged technique named CAMEL rating is widely used for evaluating performance of financial institutions, especially to banks. In Bangladesh bank as a Central bank, which is regulatory body has been calculating this rating till now. Performance of the banking sector under CAMEL frame work, which involves analysis and evaluation of the five crucial dimensions of banking operations.
We now evaluate the performance of banks on the basis of CAMEL framework. This evaluation is done for the four categories of banks, namely “state-owned commercial banks (SCBs), government-owned development financial institutions (DFIs), domestic private commercial banks (PCBs), and foreign commercial banks (FCBs)".
a) Capital Adequacy (C)
Capital adequacy is a measure of the financial strength of a bank, usually express as a ratio of its shareholders' fund to total assets. The ratio reflects the ability of a bank to withstand the unanticipated losses. This ratio has a positive relationship with the financial soundness of the bank.
b) Asset Quality (A)
Asset quality is an important measure of the strength of banks. The ratio of non-performing loans and advances as a share of total and advances is considered for the purpose of analysis. In addition, the ratio of total loans and advances to total assets is utilized to measure the extent of deployment of assets in earning assets.

Business and Economic Research ISSN 2162-4860
2014, Vol. 4, No. 1
www.macrothink.org/ber 80
c) Management Quality (M)
The capacity/efficiency of the management of a bank can be measured with the help of certain ratios. To capture the possible dynamics of management efficiency, the following ratios are considered: total loans and advances to total deposits, interest expenses to total deposits, and operating expenses to total assets.
d) Earnings Ability (E)
Two ratios are used to assess the earnings ability of the banks under study. The first ratio is the net income to total assets or “ROA”. The second ratio used is interest income to total assets. The two ratios have positive relationship with the financial performance of the bank and negative relationship the risk of bank failure.
e) Liquidity (L)
Two ratios are employed in this study to assess the liquidity level of the banks. The first one is total liquid assets to total assets. The second ratio is liquid assets to customers‟ deposits.
3.1 Banking System Structure
Source: Bangladesh Bank Annual Reports
The banking sector of Bangladesh comprises four categories of scheduled banks. These are the state owned commercial banks (SCBs), the state owned development financial institutions (DFIs), the private commercial banks (PCBs), and the foreign commercial banks (FCBs). While the number of banks remained unchanged at 47 in 2011, the number of bank branches increased from 7658 in 2010 to 7961 in 2011 reflecting the opening of new branches by the PCBs. At the end of June 2012, the total number of bank branches increased further to 8059, with total number of banks remaining unchanged at 47. The structure of the banking sector with breakdown by type of banks is shown in the Table above.
3.2 Deposits
Deposits are considered as banks’ main source of funding and are the lowest cost of funds. The more deposits are transformed into loans, the higher the interest margin and profit. Hence, deposits generally have positive impact on profitability of the banks. But if a bank can’t

Business and Economic Research ISSN 2162-4860
2014, Vol. 4, No. 1
www.macrothink.org/ber 81
transform its deposits into loans efficiently it may bring negative impact on profitability also.
Table 1. Total Deposits by Types of Banks (Taka in Billion)
Banks Types 2004 2005 2006 2007 2008 2009 2010 2011 SCB’s 544.56 608.36 641.16 686.76 745.86 869.19 1044.96 1235.65DFI’s 75.10 89.50 100.20 115.60 137.80 161.10 183.4 214.40 PCB’s 588.00 731.30 955.50 1150.20 1450.70 1792.40 2266.50 2787.5 FCB’s 108.44 125.54 163.74 196.34 226.70 227.6 239.7 284.8 Total 1326.1 1554.7 1860.6 2148.90 2561.06 3050.29 3734.56 4522.35
Source: Bangladesh Bank Annual Reports (2004-2011)
Source: Bangladesh Bank Annual Reports (2004-2011)
Table 2. Market Share of Deposits by Types of Banks (percent)
Banks Types 2004 2005 2006 2007 2008 2009 2010 2011 SCB’s 41.38% 39.13% 34.46% 31.96% 29.12% 28.49% 28.08% 27.40% DFI’s 5.71% 5.76% 5.39% 5.38% 5.38% 5.28% 4.93% 4.75% PCB’s 44.68% 47.04% 51.35% 53.53% 56.64% 58.76% 60.90% 61.81% FCB’s 8.24% 8.07% 8.80% 9.14% 8.86% 7.47% 6.10% 6.03% Total 100% 100% 100% 100% 100% 100% 100% 100%
Source: Bangladesh Bank Annual Reports(2004-2011)

Business and Economic Research ISSN 2162-4860
2014, Vol. 4, No. 1
www.macrothink.org/ber 82
Source: Bangladesh Bank Annual Reports(2004-2011)
Total deposits of the banks in 2011 rose to Taka 4509.7 billion from Taka 3721.9 billion in 2010 showing an overall increase of 21.2 percent. The SCBs' (comprising the largest 4 banks) share in deposits decreased from 28.1 percent in 2010 to 27.4 percent in 2011. The PCBs' deposits in 2011 amounted to Taka 2787.5 billion or 61.8 percent of the total industry deposits against Taka 2266.5 billion or 60.9 percent in 2010. The FCBs' deposits in 2011 rose by Taka 45.1 billion over the year. The DFIs' deposits in 2011 were Taka 214.4 billion against Taka 183.4 billion in 2010 showing an increase of 16.9 percent over the year.
Table 3. Growth of Deposits by Types of Banks (percent
Banks Types
2005 2006 2007 2008 2009 2010 2011 Average rate of Growth
SCB’s 11.72% 5.39% 7.11% 8.61% 16.54% 20.22% 18.25% 12.55% DFI’s 19.17% 11.96% 15.37% 19.20% 16.91% 13.84% 16.90% 16.19% PCB’s 24.37% 30.66% 20.38% 26.13% 23.55% 26.45% 22.99% 24.93% FCB’s 15.77% 30.43% 19.91% 15.46% 0.40% 5.32% 18.82% 15.16%
Source: Bangladesh Bank Annual Reports(2004-2011)
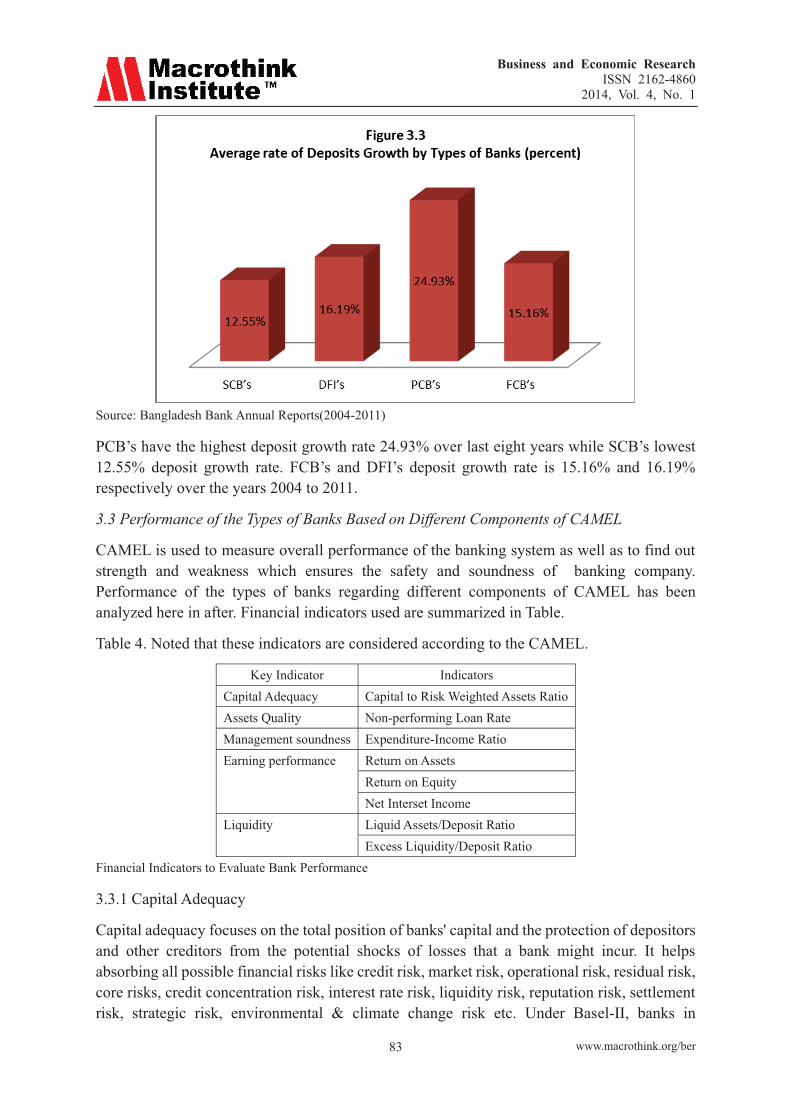
Business and Economic Research ISSN 2162-4860
2014, Vol. 4, No. 1
www.macrothink.org/ber 83
Source: Bangladesh Bank Annual Reports(2004-2011)
PCB’s have the highest deposit growth rate 24.93% over last eight years while SCB’s lowest 12.55% deposit growth rate. FCB’s and DFI’s deposit growth rate is 15.16% and 16.19% respectively over the years 2004 to 2011.
3.3 Performance of the Types of Banks Based on Different Components of CAMEL
CAMEL is used to measure overall performance of the banking system as well as to find out strength and weakness which ensures the safety and soundness of banking company. Performance of the types of banks regarding different components of CAMEL has been analyzed here in after. Financial indicators used are summarized in Table.
Table 4. Noted that these indicators are considered according to the CAMEL.
Key Indicator Indicators Capital Adequacy Capital to Risk Weighted Assets Ratio Assets Quality Non-performing Loan Rate Management soundness Expenditure-Income Ratio Earning performance Return on Assets
Return on EquityNet Interset Income
Liquidity Liquid Assets/Deposit Ratio Excess Liquidity/Deposit Ratio
Financial Indicators to Evaluate Bank Performance
3.3.1 Capital Adequacy
Capital adequacy focuses on the total position of banks' capital and the protection of depositors and other creditors from the potential shocks of losses that a bank might incur. It helps absorbing all possible financial risks like credit risk, market risk, operational risk, residual risk, core risks, credit concentration risk, interest rate risk, liquidity risk, reputation risk, settlement risk, strategic risk, environmental & climate change risk etc. Under Basel-II, banks in

Business and Economic Research ISSN 2162-4860
2014, Vol. 4, No. 1
www.macrothink.org/ber 84
Bangladesh were instructed to maintain the Minimum Capital Requirement (MCR) at 10.0 percent of the Risk Weighted Assets (RWA) or Taka 4.0 billion as capital, whichever is higher, with effect from July-September quarter in 2011. MCR was revised to increase the shock resilient capacity of the bank. However, for the fourth quarter of 2011 MCR was lowered to 9.0 percent of RWA or Taka 2.0 billion, whichever is higher.
Under the Supervisory Review Process (SRP), banks are directed to maintain a level of "adequate" capital which is higher than the minimum required capital and sufficient to cover for all possible risks in their business. This higher level of capital for the banks is usually determined and finalized through SRP-SREP dialogue.
3.3.1.1 Capital to risk weighted assets ratio
Table 5. Capital to risk weighted assets ratio by Types of Banks (percent)
Banks Types 2004 2005 2006 2007 2008 2009 2010 2011 SCB’s 4.1 -0.4 1.1 7.96 6.9 9.0 8.9 11.7 DFI’s 9.1 -7.5 -6.7 -5.5 -5.3 0.4 -7.3 -4.5 PCB’s 10.3 9.1 9.8 10.6 11.4 12.1 10.1 11.5 FCB’s 24.2 26.0 22.7 22.7 24.0 28.1 15.6 21.0 Total 8.7 5.6 6.7 9.6 10.1 11.6 9.3 11.4
Source: Bangladesh Bank Annual Reports (2004-2011)
Source: Bangladesh Bank Annual Reports (2004-2011)
Table 5 shows that on 31 December 2011 in aggregate the SCBs, DFIs, PCBs and FCBs maintained CAR of 11.7, -4.5, 11.5 and 21.0 percent respectively. But individually, 3 PCBs and 2 DFIs did not maintain the minimum required CAR. Whereas, all PCBs and FCBs complied with the minimum required capital. The CAR for the banking industry as a whole was 11.4 percent at end of 2011 as against 9.3 percent at end of 2010.

Business and Economic Research ISSN 2162-4860
2014, Vol. 4, No. 1
www.macrothink.org/ber 85
3.3.2 Assets Quality
The most important indicator of bank asset quality in the loan portfolio is the ratio of gross non-performing loans (NPLs) to total loans and the ratio of net NPLs to net total loans.
3.3.2.1 NPL to Total Loans Ratio
Table 6. NPLs to total loans ratios by Types of Banks (percent)
Banks Types 2004 2005 2006 2007 2008 2009 2010 2011 SCB’s 25.3 21.4 22.9 29.9 25.4 21.4 15.7 11.3 DFI’s 42.9 34.9 33.7 28.6 25.5 25.9 24.2 24.6 PCB’s 8.5 5.6 5.5 5.0 4.4 3.9 3.2 2.9 FCB’s 1.5 1.3 0.8 1.4 1.9 2.3 3.0 2.9 Total 17.6 13.6 13.2 13.2 10.8 9.2 7.3 6.1
Source: Bangladesh Bank Annual Reports (2004-2011)
In 2011, the FCBs and the PCBs had the lowest and the DFIs had the highest ratio of gross NPLs to total loans. The SCBs had a gross NPLs ratio of 11.3 percent whereas in case of the PCBs, the FCBs and the DFIs, the ratios were 2.9, 2.9 and 24.6 percent respectively, at the end of December 2011. The trend is shown in below:
Source: Bangladesh Bank Annual Reports (2004-2011)
3.3.2.2 Ratio of net NPL to total loans
Table 7. Ratio of net NPL to total loans by Types of Banks (percent)
Banks Types 2004 2995 2006 2007 2008 2009 2010 2011 SCB’s 17.6 13.2 14.5 12.9 5.9 1.9 1.9 -0.34 DFI’s 23.0 22.6 23.6 19.0 17.0 18.3 16.0 16.9 PCB’s 3.4 1.8 1.8 1.4 .9 .5 0.0 -0.20 FCB’s -1.5 -2.2 -2.6 -1.9 -2.0 -2.3 -1.7 -1.8 Total 9.8 7.2 7.1 5.1 2.8 1.7 1.3 0.70

Business and Economic Research ISSN 2162-4860
2014, Vol. 4, No. 1
www.macrothink.org/ber 86
Source: Bangladesh Bank Annual Reports (2004-2011)
Source: Bangladesh Bank Annual Reports (2004-2011)
Table 7 and Figure 3.6 present the ratio of the net NPLs (net of provisions and interest suspense) to net total loans (net of provisions and interest suspense). It reveals from the table that the DFIs' non-performing portfolios were still high after adjustment of actual provision and interest suspense, whereas the SCBs, the FCBs and the PCBs had excess provision against their NPLs in December 2011.
3.3.3 Writing-of Bad Debts
To wipe out unnecessarily and artificially inflated size of balance sheet, uniform guidelines of write-off have been introduced in 2003. According to the policy, banks may, at any time, classify write-off loans as bad/loss. Those loans, which have been classified as bad/loss for the last 5 years and above and loans for which 100 percent provisions have been kept, should be written-off immediately. The total amounts of written-off bad debts from June 2004 to June 2012 in different categories of bank are presented in Table 3.7.\
Table 8. Writing-of bad debts in different bank categories (billion Taka)
Banks Types
30 June 2004
30 June 2005
30 June 2006
30 June 2007
30 June 2008
30 June 2009
30 June 2010
30 June 2011
30 June 2012
SCB’s 26.3 29.7 35.7 42.8 48.4 64.5 70.5 82.4 92.3 DFI’s 17.4 27.6 28.6 30.4 31.0 31.8 31.8 32.0 32.3 PCB’s 21.2 32.9 40.7 45.5 49.4 54.7 69.6 77.1 85.5 FCB’s 0.9 1.1 1.5 1.6 1.7 2.0 2.1 2.4 2.9 Total 65.8 91.3 106.5 120.3 130.5 153.0 174.0 193.9 213.0
Source: Bangladesh Bank Annual Reports (2004-2011)

Business and Economic Research ISSN 2162-4860
2014, Vol. 4, No. 1
www.macrothink.org/ber 87
Source: Bangladesh Bank Annual Reports (2004-2011)
3.3.4 Management Soundness
Sound management is the most important and inevitable pre-requisite for the strength and concrete growth of any financial institution. Since indicators of management quality are primarily specific to individual institution, these cannot be easily aggregated across the sector. In addition, it is difficult to draw any conclusion regarding management soundness based on quantitative indicators, as characteristics of a good management are rather qualitative in nature. Nevertheless, the total expenditure to total income, operating expenses to total expenses, earnings and operating expenses per employee, and interest rate spread are generally used to portray management soundness. Technical competence & leadership of mid and senior level management, compliance with banking laws and regulations, adequacy, compliance of sound internal policies, ability to plan and respond to changing circumstances etc. are also taken into consideration to illustrate the quality of management.
3.3.4.1 Expenditure-Income Ratio
Table 9. Expenditure-income ratio by type of banks (percent)
Banks Types 2004 2005 2006 2007 2008 2009 2010 2011 SCB’s 102.3 101.9 100.0 100.0 89.6 75.6 80.7 62.7 DFI’s 104.0 103.9 103.5 107.7 103.7 112.1 87.8 88.6 PCB’s 87.1 89.3 90.2 88.8 88.4 72.6 67.6 71.7 FCB’s 76.3 70.8 71.1 72.9 75.8 59.0 64.7 47.3 Total 90.9 92.2 91.4 90.4 87.9 72.6 70.8 68.6
Source: Bangladesh Bank Annual Reports (2004-2011)

Business and Economic Research ISSN 2162-4860
2014, Vol. 4, No. 1
www.macrothink.org/ber 88
Source: Bangladesh Bank Annual Reports (2004-2011)
As evident from Table 9 and Figure 3.8, in 2011, the expenditure-income (EI) ratio of the DFIs was the highest among the shown bank clusters due to poor non-interest income and higher operating expenses. The EI ratio of the PCBs was 71.7, the second highest, which could mainly be attributable to high administrative and operating expenses. The EI ratio of the SCBs fell from 80.7 in 2010 to 62.7 in 2011 mainly due to significant increase (Taka 60.5 billion to Taka 91.7 billion) in interest income.
3.3.5 Earning Performance
Strong earnings and profitability profile of a bank reflect its ability to support present and future sound operation, absorb future contingent shocks and strengthen resilience capacity. More specifically, this determines the capacity to absorb losses by building an adequate capital base, finance its expansion and pay adequate dividends to its shareholders. Although there are various indicators of earning and profitability, the most representative and widely used indicator is Return on Assets (ROA), which is supplemented by Return on Equity (ROE) and Net Interest Margin (NIM).
3.3.5.1 Return on Assets (ROA)
Return on Assets (ROA) indicates the productivity of assets i.e. how much income is earned from per unit of assets. According to Basel-ІІ accord, ROA should be more than 1%.
Table 10. Return on assets (ROA) (Percent)
Banks Types 2004 2005 2006 2007 2008 2009 2010 2011 SCB’s -0.1 -0.1 0.0 0.0 0.7 1.0 1.1 1.3 DFI’s -0.2 -0.1 -0.2 -0.3 -0.6 0.4 0.2 .1 PCB’s 1.2 1.1 1.1 1.3 1.4 1.6 2.1 1.6 FCB’s 3.2 3.1 2.2 3.1 2.9 3.2 2.9 3.2 Total 0.7 0.6 0.8 0.9 1.2 1.4 1.8 1.5
Source: Bangladesh Bank Annual Reports (2004-2011)
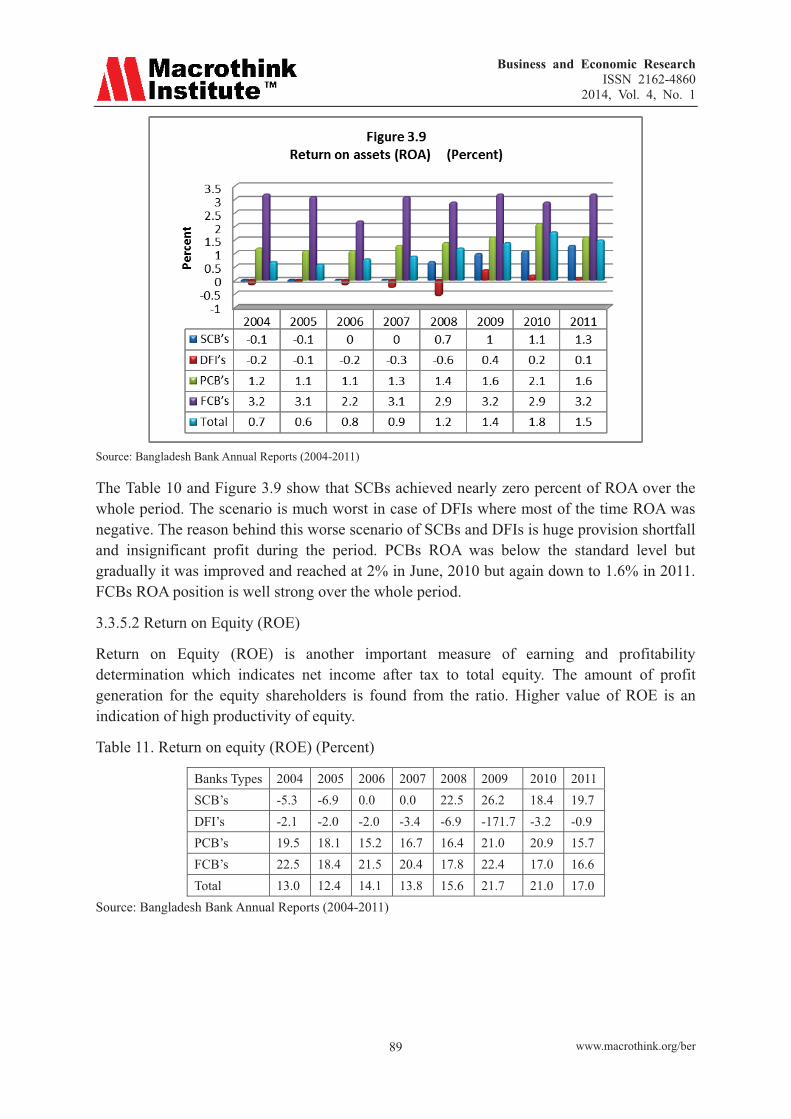
Business and Economic Research ISSN 2162-4860
2014, Vol. 4, No. 1
www.macrothink.org/ber 89
Source: Bangladesh Bank Annual Reports (2004-2011)
The Table 10 and Figure 3.9 show that SCBs achieved nearly zero percent of ROA over the whole period. The scenario is much worst in case of DFIs where most of the time ROA was negative. The reason behind this worse scenario of SCBs and DFIs is huge provision shortfall and insignificant profit during the period. PCBs ROA was below the standard level but gradually it was improved and reached at 2% in June, 2010 but again down to 1.6% in 2011. FCBs ROA position is well strong over the whole period.
3.3.5.2 Return on Equity (ROE)
Return on Equity (ROE) is another important measure of earning and profitability determination which indicates net income after tax to total equity. The amount of profit generation for the equity shareholders is found from the ratio. Higher value of ROE is an indication of high productivity of equity.
Table 11. Return on equity (ROE) (Percent)
Banks Types 2004 2005 2006 2007 2008 2009 2010 2011 SCB’s -5.3 -6.9 0.0 0.0 22.5 26.2 18.4 19.7 DFI’s -2.1 -2.0 -2.0 -3.4 -6.9 -171.7 -3.2 -0.9 PCB’s 19.5 18.1 15.2 16.7 16.4 21.0 20.9 15.7 FCB’s 22.5 18.4 21.5 20.4 17.8 22.4 17.0 16.6 Total 13.0 12.4 14.1 13.8 15.6 21.7 21.0 17.0
Source: Bangladesh Bank Annual Reports (2004-2011)

Business and Economic Research ISSN 2162-4860
2014, Vol. 4, No. 1
www.macrothink.org/ber 90
Source: Bangladesh Bank Annual Reports (2004-2011) The Table 11 and Figure 3.10 show that the SCBs' ROE was 26.2 percent in 2009, but dropped down to 18.4 percent in 2010 as owners' equity had increased comparatively at a higher rate than after tax profit. However, it increased to 19.7 percent in 2011. In case of the DFIs, the ROE was still negative in 2011. The ROE of the PCBs was diverse but satisfactory (except the year 2011) during the last five years. The ROE of the FCBs has been showing gradual decline from 2009 due to increase in equity. The ROE of the FCBs in 2009 stood at 22.4 percent, which declined to 16.6 percent in 2011.
3.3.5.2 Net Interest Income (NII)
Another important tool to indicate the earning and profitability is Net Interest Income (NII). Net interest income is the spread between interest receipts from loans and advances and interest paid to the depositors. The high NII means the spread between interest receipts and paid is high.
Table 12. Net interest income by type of banks (billion Taka)
Banks Types 2004 2005 2006 2007 2008 2009 2010 2011 SCB’s -1.1 7.7 9.0 7.4 7.9 12.1 19.8 34.3DFI’s 1.8 1.0 1.7 1.4 1.9 1.9 6.2 4.9 PCB’s 13.7 21.0 25.4 36.1 48.5 56.7 82.8 91.4FCB’s 4.2 5.6 8.2 9.9 12.6 10.7 13.0 16.1Total 18.3 35.3 44.3 54.8 70.9 81.5 121.9 146.7
Source: Bangladesh Bank Annual Reports (2004-2011)
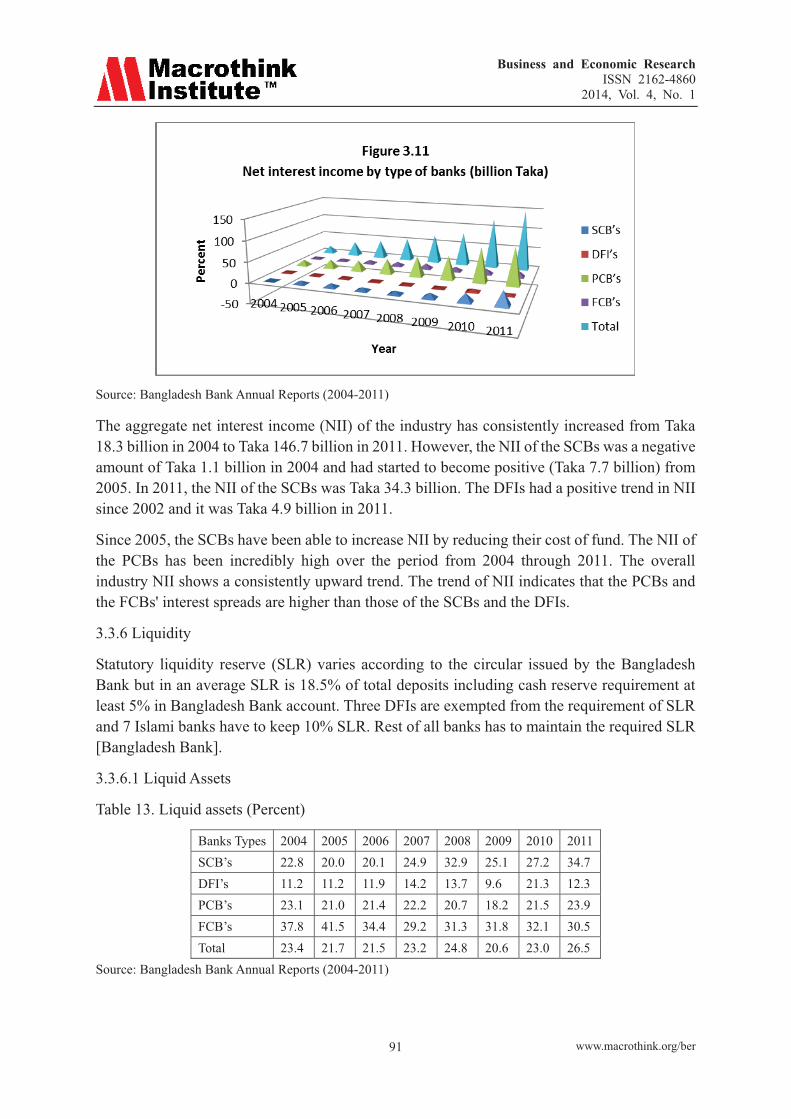
Business and Economic Research ISSN 2162-4860
2014, Vol. 4, No. 1
www.macrothink.org/ber 91
Source: Bangladesh Bank Annual Reports (2004-2011)
The aggregate net interest income (NII) of the industry has consistently increased from Taka 18.3 billion in 2004 to Taka 146.7 billion in 2011. However, the NII of the SCBs was a negative amount of Taka 1.1 billion in 2004 and had started to become positive (Taka 7.7 billion) from 2005. In 2011, the NII of the SCBs was Taka 34.3 billion. The DFIs had a positive trend in NII since 2002 and it was Taka 4.9 billion in 2011.
Since 2005, the SCBs have been able to increase NII by reducing their cost of fund. The NII of the PCBs has been incredibly high over the period from 2004 through 2011. The overall industry NII shows a consistently upward trend. The trend of NII indicates that the PCBs and the FCBs' interest spreads are higher than those of the SCBs and the DFIs.
3.3.6 Liquidity
Statutory liquidity reserve (SLR) varies according to the circular issued by the Bangladesh Bank but in an average SLR is 18.5% of total deposits including cash reserve requirement at least 5% in Bangladesh Bank account. Three DFIs are exempted from the requirement of SLR and 7 Islami banks have to keep 10% SLR. Rest of all banks has to maintain the required SLR [Bangladesh Bank].
3.3.6.1 Liquid Assets
Table 13. Liquid assets (Percent)
Banks Types 2004 2005 2006 2007 2008 2009 2010 2011 SCB’s 22.8 20.0 20.1 24.9 32.9 25.1 27.2 34.7 DFI’s 11.2 11.2 11.9 14.2 13.7 9.6 21.3 12.3 PCB’s 23.1 21.0 21.4 22.2 20.7 18.2 21.5 23.9 FCB’s 37.8 41.5 34.4 29.2 31.3 31.8 32.1 30.5 Total 23.4 21.7 21.5 23.2 24.8 20.6 23.0 26.5
Source: Bangladesh Bank Annual Reports (2004-2011)

Business and Economic Research ISSN 2162-4860
2014, Vol. 4, No. 1
www.macrothink.org/ber 92
Source: Bangladesh Bank Annual Reports (2004-2011) From the Table 13 & Figure 3.12, we find that all the banks have liquid assets. In 2011, SCBs possessed highest liquid assets which are more than six times higher than that of PCBs in 2011. FCBs had highest liquid assets over the whole period except in 2008 & 2011. PCBs & DFIs liquid assets are lower than industry liquid assets over last eight years.
3.3.6.2 Excess Liquidity
Table 14. Excess liquidity (Percent)
Banks Types 2004 2005 2006 2007 2008 2009 2010 2011 SCB’s 6.8 2.0 2.1 6.9 14.9 17.6 8.2 15.7 DFI’s 4.7 6.2 3.8 5.6 4.9 7.1 2.3 2.5 PCB’s 8.8 5.1 5.6 6.4 4.7 5.3 4.6 7.0 FCB’s 21.9 23.6 16.4 11.2 13.3 21.8 13.2 11.8 Total 8.7 5.3 5.1 6.9 8.4 9.0 6.0 9.3
Source: Bangladesh Bank Annual Reports (2004-2011)
Source: Bangladesh Bank Annual Reports (2004-2011)

Business and Economic Research ISSN 2162-4860
2014, Vol. 4, No. 1
www.macrothink.org/ber 93
From the Table 14 & Figure 3.13, we find that all the banks had excess liquidity. In 2011, SCBs possessed highest excess liquidity which is more than six times higher than that of PCBs in 2011. FCBs had highest excess liquidity over the whole period except in 2008 & 2011. PCBs & DFIs excess liquidity is lower than industry excess liquidity over last five years. Excess liquidity indicates available loan able fund at low cost.
3.3.7 CAMEL Rating of All Banks
CAMEL rating is expressed on a scale of 1 to 5 in ascending order of supervisory concern, 1 representing the best rating, while 5 indicating the worst. Any bank rated 4 or 5 i.e. Marginal or Unsatisfactory under composite CAMEL rating is generally identified as a problem bank. Activities of these banks are closely monitored by the BB.
On the basis of five components of CAMEL banks are rated from 2004 to 2011.
Table 15. CAMEL rating of all Banks in Bangladesh
Rating 2004 2005 2006 2007 2008 2009 2010 2011 1 or Strong 12 13 3 6 2 3 5 2 2 or Satisfactory 15 16 31 29 28 32 32 33 3 or Fair 10 8 7 5 10 7 7 9 4 or Marginal 8 6 5 6 4 4 2 2 5 or Unsatisfactory 4 5 2 2 4 1 1 1 Total 49 48 48 48 48 48 47 47
Source: Bangladesh Bank Annual Reports (2004-2011)
As of end 2011, CAMEL rating of 2 banks was 1 or Strong; 33 banks were rated 2 or Satisfactory; 9 banks were rated 3 or Fair; 2 were rated 4 or Marginal and 1 bank got 5 or Unsatisfactory rating.
4. Analysis & Interpretation
4.1 Deposits
Hypothesis Testing
The researcher wanted to find out that if there is any significant difference regarding the performance related to deposits among all the four banking groups during 2004 to 2011 or not. This was tested as under
Null Hypothesis
There is no significant difference in total deposits among all the banking groups during 2004 to 2011.
H0 = μ1 = μ2 = μ3 = μ4 H1 = μ1 ≠ μ2 ≠ μ3 ≠ μ4

Business and Economic Research ISSN 2162-4860
2014, Vol. 4, No. 1
www.macrothink.org/ber 94
Descriptive
N Mean Std.
Deviation Std. Error
95% Confidence Interval for Mean
Minimum Maximum
Lower Bound Upper Bound
SCB's 8 797.0625 238.28992 84.24821 597.8471 996.2779 544.56 1235.65 DFI's 8 134.6375 48.66882 17.20703 93.9493 175.3257 75.10 214.40 PCB's 8 1465.2625 771.35661 272.71575 820.3922 2110.1328 588.00 2787.50 FCB's 8 196.6075 60.24405 21.29949 146.2422 246.9728 108.44 284.80
Total 32 648.3925 668.74615 118.21873 407.2838 889.5012 75.10 2787.50
ANOVA Table
Sum of Squares df Mean Square F Sig. 5% F Limit (From table F)
Between Groups 9259466.016 3 3086488.672 18.769 .000 F (3,28) 2.93 Within Groups 4604397.788 28 164442.778
Total 13863863.805 31
The above ANOVA table indicates that the calculated value of F is 18.77, which is more than the table value of 2.93 at 5% level of significance. Hence, the null hypothesis is rejected. It means that there is a significant difference in total deposits among all the four banking groups.
4.2 Capital Adequacy Ratio (CAR)
Hypothesis Testing
The researcher wanted to find out that if there is any significant difference regarding the performance related to capital Adequacy Ratio among all the four banking groups during 2004 to 2011 or not. This was tested as under.
Null Hypothesis
There is no significant different in capital adequacy ratio among all the four banking groups during 2004 to 2011.
H0 = μ1 = μ2 = μ3 = μ4 H1 = μ1 ≠ μ2 ≠ μ3 ≠ μ4
Descriptives
N Mean Std. Deviation
Std. Error
95% Confidence Interval for Mean Minimum Maximum
Lower Bound Upper Bound SCB's 8 6.1575 4.19069 1.48163 2.6540 9.6610 -.40 11.70 DFI's 8 -3.4125 5.64205 1.99476 -8.1294 1.3044 -7.50 9.10 PCB's 8 10.6125 0.99490 .35175 9.7807 11.4443 9.10 12.10 FCB's 8 23.0375 3.71058 1.31189 19.9354 26.1396 15.60 28.10 Total 32 9.0988 10.38481 1.83579 5.3546 12.8429 -7.50 28.10

Business and Economic Research ISSN 2162-4860
2014, Vol. 4, No. 1
www.macrothink.org/ber 95
ANOVA Table
Source of Variable SS DF MS F Ratio Sig. 5% F Limit (From table F) Between Sample 2894 3 964.7 60.15 .000 F (3,28) 2.93 Within Sample 449.1 28 16.04
Total 3343 31
The above ANOVA table indicates that the calculated value of F is 60.15, which is more than the table value of 2.93 at 5% level of significance. Hence, the null hypothesis is rejected. It means that there is a significant difference in capital adequacy ratio between all the four banking groups.
4.3 Assets Quality
4.3.1 NPLs to Total Loans Ratios
Hypothesis Testing
The researcher wanted to find out that if there is any significant difference regarding the performance related to Non Performing Loans to total loans ratios among all the four banking groups during 2004 to 2011 or not. This was tested as under.
Null Hypothesis:
There is no significant different in Non Performing Loans to total loans ratios among all the four banking groups during 2004 to 2011.
H0 = μ1 = μ2 = μ3 = μ4 H1 = μ1 ≠ μ2 ≠ μ3 ≠ μ4
Descriptives
N Mean Std.
Deviation Std.
Error 95% Confidence Interval for
Mean Minimum Maximum
Lower Bound Upper Bound
SCB's 8 21.6625 5.85124 2.06872 16.7707 26.5543 11.30 29.90 DFI's 8 30.0375 6.61080 2.33727 24.5107 35.5643 24.20 42.90 PCB's 8 4.8750 1.77100 .62614 3.3944 6.3556 2.90 8.50 FCB's 8 1.8875 .78819 .27867 1.2286 2.5464 .80 3.00 Total 32 14.6156 12.60684 2.22859 10.0704 19.1609 .80 42.90
ANOVA Table
Sum of Squares df Mean Square F Sig. 5% F Limit (From table F)
Between Groups 4355.021 3 1451.674 71.07
6 0.000 F (3,28) 2.93
Within Groups 571.881 28 20.424 Total 4926.902 31

Business and Economic Research ISSN 2162-4860
2014, Vol. 4, No. 1
www.macrothink.org/ber 96
The above ANOVA table indicates that the calculated value of F is 71.08, which is more than the table value of 2.93 at 5% level of significance. Hence, the null hypothesis is rejected. It means that there is a significant difference in Non Performing Loans to total loans ratios among all the four banking groups.
4.3.2 Ratio of net NPL to Total Loans
Hypothesis Testing
The researcher wanted to find out that if there is any significant difference regarding the performance related to Ratio of net Non Performing Loans to total loans among all the four banking groups during 2004 to 2011 or not. This was tested as under.
Null Hypothesis:
There is no significant different in Ratio of net Non Performing Loans to total loans ratios among all the four banking groups during 2004 to 2011.
H0 = μ1 = μ2 = μ3 = μ4 H1 = μ1 ≠ μ2 ≠ μ3 ≠ μ4
Descriptives
N Mean Std.
Deviation Std.
Error 95% Confidence Interval for
Mean Minimum Maximum
Lower Bound Upper Bound
SCB's 8 8.4450 6.88955 2.43582 2.6852 14.2048 -.34 17.60 DFI's 8 19.5500 3.06128 1.08233 16.9907 22.1093 16.00 23.60 PCB's 8 1.2000 1.16986 .41361 .2220 2.1780 -.20 3.40 FCB's 8 -2.0000 .35456 .12536 -2.2964 -1.7036 -2.60 -1.50 Total 32 6.7988 9.15964 1.61921 3.4963 10.1012 -2.60 23.60
ANOVA Table
Sum of Squares df Mean Square F Sig. 5% F Limit (From table F)
Between Groups 2192.548 3 730.849 50.117 .000 F (3,28) 2.93 Within Groups 408.321 28 14.583
Total 2600.870 31
The above ANOVA table indicates that the calculated value of F is 50.12, which is more than the table value of 2.93 at 5% level of significance. Hence, the null hypothesis is rejected. It means that there is a significant difference in Ratio of net Non Performing Loans to total loans among all the four banking groups. The performance of all the banking groups regarding this ratio is different.
4.4 Writing-Of Bad Debts
Hypothesis Testing

Business and Economic Research ISSN 2162-4860
2014, Vol. 4, No. 1
www.macrothink.org/ber 97
The researcher wanted to find out that if there is any significant difference regarding Bad debts among all the four banking groups during 2004 to 2011 or not. This was tested as under.
Null Hypothesis
There is no significant different regarding Bad debts among all the four banking groups during 2004 to 2011.
H0 = μ1 = μ2 = μ3 = μ4 H1 = μ1 ≠ μ2 ≠ μ3 ≠ μ4
Descriptives
N
Mean
Std. Deviation
Std. Error
95% Confidence Interval for Mean
Minimum Maximum
Lower Bound Upper Bound
SCB's 9 54.7333 23.71861 7.90620 36.5016 72.9651 26.30 92.30 DFI's 9 29.2111 4.71446 1.57149 25.5873 32.8350 17.40 32.30 PCB's 9 52.9556 21.06906 7.02302 36.7604 69.1507 21.20 85.50 FCB's 9 1.8000 .62650 .20883 1.3184 2.2816 .90 2.90 Total 36 34.6750 26.64957 4.44160 25.6581 43.6919 .90 92.30
ANOVA Table
Sum of Squares df Mean Square F Sig. 5% F Limit (From table F)
Between Groups 16624.216 3 5541.405 21.539 .000 F (3,28) 2.85 Within Groups 8232.771 32 257.274
Total 24856.988 35
The above ANOVA table indicates that the calculated value of F is 21.54, which is more than the table value of 2.93 at 5% level of significance. Hence, the null hypothesis is rejected again. It means that there is a significant difference in Bad debts among all the four banking groups. The performance of all the banking groups regarding this ratio is different.
4.5 Management Soundness
4.5.1 Expenditure-income Ratio
Hypothesis Testing
The researcher wanted to find out that if there is any significant difference regarding Expenditure-income among all the four banking groups during 2004 to 2011 or not. This was tested as under.
Null Hypothesis:
There is no significant different regarding Expenditure-income among all the four banking groups during 2004 to 2011.
H0 = μ1 = μ2 = μ3 = μ4

Business and Economic Research ISSN 2162-4860
2014, Vol. 4, No. 1
www.macrothink.org/ber 98
H1 = μ1 ≠ μ2 ≠ μ3 ≠ μ4
Descriptives
N
Mean
Std. Deviation
Std. Error
95% Confidence Interval for Mean Minimum Maximum
Lower Bound Upper Bound SCB's 8 89.1000 14.76347 5.21967 76.7574 101.4426 62.70 102.30 DFI's 8 101.4125 8.66593 3.06387 94.1676 108.6574 87.80 112.10 PCB's 8 81.9625 9.52844 3.36881 73.9965 89.9285 67.60 90.20 FCB's 8 67.2375 9.90612 3.50234 58.9558 75.5192 47.30 76.30 Total 32 84.9281 16.32434 2.88576 79.0426 90.8137 47.30 112.10
ANOVA Table
Sum of Squares df Mean Square F Sig. 5% F Limit (From table F)
Between Groups 4887.138 3 1629.046 13.520 .000 F (3,28) 2.93 Within Groups 3373.866 28 120.495 Total 8261.005 31
The above ANOVA table indicates that the calculated value of F is 13.52, which is more than the table value of 2.93 at 5% level of significance. Hence, the null hypothesis is rejected again. It means that there is a significant difference in expenditure-income ratio among all the four banking groups. The performance of all the banking groups regarding this ratio is different.
4.6 Earning Performance
4.6.1 Return on Assets
Hypothesis Testing
The researcher wanted to find out that if there is any significant difference regarding Return On Assets in % among all the four banking groups during 2004 to 2011 or not. This was tested as under.
Null Hypothesis:
There is no significant difference regarding Return on Assets in % among all the four banking groups during 2004 to 2011.
H0 = μ1 = μ2 = μ3 = μ4
H1 = μ1 ≠ μ2 ≠ μ3 ≠ μ4
Descriptives
N
Mean
Std. Deviation
Std. Error
95% Confidence Interval for Mean
Minimum Maximum
Lower Bound Upper Bound

Business and Economic Research ISSN 2162-4860
2014, Vol. 4, No. 1
www.macrothink.org/ber 99
SCB's 8 0.4875 0.59866 0.21166 -0.0130 0.9880 -0.10 1.30 DFI's 8 -0.0875 0.31368 0.11090 -0.3497 0.1747 -0.60 .40 PCB's 8 1.4250 0.33700 0.11915 1.1433 1.7067 1.10 2.10 FCB's 8 2.9750 0.33700 0.11915 2.6933 3.2567 2.20 3.20 Total 32 1.2000 1.24071 0.21933 0.7527 1.6473 -0.60 3.20
ANOVA Table
Sum of Squares df Mean Square F Sig. 5% F Limit (From table F)
Between Groups 42.932 3 14.311 83.698 .000 F (3,28) 2.93 Within Groups 4.788 28 .171
Total 47.720 31
The above ANOVA table indicates that the calculated value of F is 83.70, which is more than the table value of 2.93 at 5% level of significance. Hence, the null hypothesis is rejected again. It means that there is a significant difference in Return on Assets in % among all the four banking groups. The performance of all the banking groups regarding this ratio is different.
4.6.2 Return on Equity
Hypothesis Testing
The researcher wanted to find out that if there is any significant difference regarding Return On equity among all the four banking groups during 2004 to 2011 or not. This was tested as under.
Null Hypothesis:
There is no significant difference regarding Return on equity among all the four banking groups during 2004 to 2011.
H0 = μ1 = μ2 = μ3 = μ4
H1 = μ1 ≠ μ2 ≠ μ3 ≠ μ4
Descriptives
N
Mean
Std. Deviation
Std. Error
95% Confidence Interval for Mean
Minimum Maximum
Lower Bound Upper Bound
SCB's 8 9.3250 13.62453 4.81700 -2.0654 20.7154 -6.90 26.20 DFI's 8 -24.0250 59.69675 21.10599 -73.9327 25.8827 -171.70 -.90 PCB's 8 17.9375 2.29965 0.81305 16.0149 19.8601 15.20 21.00 FCB's 8 19.5750 2.41823 0.85497 17.5533 21.5967 16.60 22.50 Total 32 5.7031 34.18884 6.04379 -6.6233 18.0295 -171.70 26.20
ANOVA Table
Sum of Squares df Mean Square F Sig. 5% F Limit (From table F)

Business and Economic Research ISSN 2162-4860
2014, Vol. 4, No. 1
www.macrothink.org/ber 100
Between Groups 9911.906 3 3303.969 3.514 0.028 F (3,28) 2.93 Within Groups 26323.264 28 940.117
Total 36235.170 31
The above ANOVA table indicates that the calculated value of F is 3.514, which is more than the table value of 2.93 at 5% level of significance. Hence, the null hypothesis is rejected again. It means that there is a significant difference in Return on equity among all the four banking groups. The performance of all the banking groups regarding this ratio is different.
4.6.3 Net Interest Income
Hypothesis Testing
The researcher wanted to find out that if there is any significant difference regarding net interest income ratio among all the four banking groups during 2004 to 2011 or not. This was tested as under.
Null Hypothesis:
There is no significant difference regarding net interest income ratio among all the four banking groups during 2004 to 2011.
H0 = μ1 = μ2 = μ3 = μ4
H1 = μ1 ≠ μ2 ≠ μ3 ≠ μ4
Descriptives
N
Mean
Std. Deviation
Std. Error
95% Confidence Interval for Mean
Minimum Maximum
Lower Bound Upper Bound
SCB's 8 12.1375 10.65738 3.76795 3.2277 21.0473 -1.10 34.30 DFI's 8 2.6000 1.87769 .66386 1.0302 4.1698 1.00 6.20 PCB's 8 46.9500 28.58466 10.10620 23.0526 70.8474 13.70 91.40 FCB's 8 10.0375 3.95869 1.39961 6.7279 13.3471 4.20 16.10 Total 32 17.9313 22.74198 4.02025 9.7319 26.1306 -1.10 91.40
ANOVA Table
Sum of Squares df Mean Square F Sig. 5% F Limit (From table F)
Between Groups 9384.111 3 3128.037 13.173 .000 F (3,28) 2.93 Within Groups 6649.018 28 237.465
Total 16033.129 31
The above ANOVA table indicates that the calculated value of F is 13.17, which is more than the table value of 2.93 at 5% level of significance. Hence, the null hypothesis is rejected again. It means that there is a significant difference in net interest income ratio among all the four banking groups. The performance of all the banking groups regarding this ratio is different.

Business and Economic Research ISSN 2162-4860
2014, Vol. 4, No. 1
www.macrothink.org/ber 101
4.7 Liquidity
4.7.1 Liquid Assets
Hypothesis Testing
The researcher wanted to find out that if there is any significant difference regarding liquid assets ratio among all the four banking groups during 2004 to 2011 or not. This was tested as under.
Null Hypothesis:
There is no significant difference regarding liquid assets ratio among all the four banking groups during 2004 to 2011.
H0 = μ1 = μ2 = μ3 = μ4
H1 = μ1 ≠ μ2 ≠ μ3 ≠ μ4
Descriptives
N Mean Std.
Deviation Std.
Error 95% Confidence Interval for
Mean Minimum Maximum
Lower Bound Upper Bound
SCB's 8 25.9625 5.44844 1.92632 21.4075 30.5175 20.00 34.70 DFI's 8 13.1750 3.59196 1.26995 10.1721 16.1779 9.60 21.30 PCB's 8 21.5000 1.71548 0.60651 20.0658 22.9342 18.20 23.90 FCB's 8 33.5750 4.14789 1.46650 30.1073 37.0427 29.20 41.50 Total 32 23.5531 8.39443 1.48394 20.5266 26.5796 9.60 41.50
ANOVA Table
Sum of Squares df Mean Square F Sig. 5% F Limit (From table F)
Between Groups 1745.311 3 581.770 37.094 .000 F (3,28) 2.93 Within Groups 439.149 28 15.684
Total 2184.460 31
The above ANOVA table indicates that the calculated value of F is 9.554, which is more than the table value of 2.93 at 5% level of significance. Hence, the null hypothesis is rejected again. It means that there is a significant difference in liquid assets ratio among all the four banking groups. The performance of all the banking groups regarding this ratio is different.
4.7.1 Excess Liquidity
Hypothesis Testing
The researcher wanted to find out that if there is any significant difference regarding Excess Liquidity ratio among all the four banking groups during 2004 to 2011 or not. This was tested as under.

Business and Economic Research ISSN 2162-4860
2014, Vol. 4, No. 1
www.macrothink.org/ber 102
Null Hypothesis:
There is no significant difference regarding Excess Liquidity ratio among all the four banking groups during 2004 to 2011.
H0 = μ1 = μ2 = μ3 = μ4
H1 = μ1 ≠ μ2 ≠ μ3 ≠ μ4
Descriptives
N
Mean
Std. Deviation
Std. Error
95% Confidence Interval for Mean
Minimum Maximum
Lower Bound Upper Bound
SCB's 8 9.2750 6.08928 2.15288 4.1842 14.3658 2.00 17.60 DFI's 8 4.6375 1.70037 .60117 3.2160 6.0590 2.30 7.10 PCB's 8 5.9375 1.41819 .50140 4.7519 7.1231 4.60 8.80 FCB's 8 16.6500 5.05399 1.78686 12.4248 20.8752 11.20 23.60 Total 32 9.1250 6.13882 1.08520 6.9117 11.3383 2.00 23.60
ANOVA Table
Sum of Squares df Mean Square F Sig. 5% F Limit (From table F)
Between Groups 695.567 3 231.856 13.735 .000 F (3,28) 2.93 Within Groups 472.673 28 16.881
Total 1168.240 31
The above ANOVA table indicates that the calculated value of F is 13.73, which is more than the table value of 2.93 at 5% level of significance. Hence, the null hypothesis is rejected again. It means that there is a significant difference in Excess Liquidity ratio among all the four banking groups. The performance of all the banking groups regarding this ratio is different.
4.8 Correlation Analysis
4.8.1 Correlation between CRAR and Interest Income
CRAR will increase if capital increase at a rate higher than that of risk weighted assets increase. Here, it is seen that industry CRAR increased gradually and reach a satisfactory level of 11.4% in 2011 which is contributed by all type of banks except DFIs. Interest income also increased over the period. The correlation between CRAR and interest income shows a positive result which implies that increased capital base contributes to the interest income growth. The correlation between CRAR and interest income is highest in PCBs and lowest in DFIs over the period from 2004 to 2011.

Business and Economic Research ISSN 2162-4860
2014, Vol. 4, No. 1
www.macrothink.org/ber 103
The industry correlation is 0.6385 which is significantly positive though DFI’s correlation is negative. So, we can say that as increased CRAR positively correlated with interest income and it is possible for increasing the capital base which reduces the interest expenses to the depositors.
4.8.2 Correlation between NPL to Loans Ratio and Interest income
NPL adversely affects interest income. NPL reduces bank's profit in two ways-first interest suspense and second provision for NPL. Decreasing trend in NPL to loan ratio adversely correlated with the increasing trend of interest income (See Figure 4.2).
Figure 5.19 show that there exists negative correlation between NPL to loan and interest income. As NPL to loan ratio decreases, interest income increases and the correlation between this two criteria is -.9622 for the industry as a whole over the period. So, we can say that Banks should emphasize on reducing the NPL.
5.1 Findings
The performance of types of banks is not equal and there are some banks which are in need of

Business and Economic Research ISSN 2162-4860
2014, Vol. 4, No. 1
www.macrothink.org/ber 104
monitoring closely to enhance sound banking. It is expected that the overall performance will be improved in near future provided that appropriate actions are taken in some lagged areas.
5.1.1 Deposits
The ANOVA table indicates that the calculated value of F is 18.77, which is more than the table value of 2.93 at 5% level of significance. Hence, the null hypothesis is rejected. It means that there is a significant difference in total deposits among all the four banking groups.
5.1.2 Capital Adequacy Ratio (Car)
The ANOVA table indicates that the calculated value of F is 60.15, which is more than the table value of 2.93 at 5% level of significance. Hence, the null hypothesis is rejected. It means that there is a significant difference in capital adequacy ratio between all the four banking groups.
5.1.3 Npls to Total Loans Ratios
The ANOVA table indicates that the calculated value of F is 71.08, which is more than the table value of 2.93 at 5% level of significance. Hence, the null hypothesis is rejected. It means that there is a significant difference in Non Performing Loans to total loans ratios among all the four banking groups.
5.1.4 Ratio of Net NPL to Total Loans
The ANOVA table indicates that the calculated value of F is 50.12, which is more than the table value of 2.93 at 5% level of significance. Hence, the null hypothesis is rejected. It means that there is a significant difference in Ratio of net Non Performing Loans to total loans among all the four banking groups. The performance of all the banking groups regarding this ratio is different.
5.1.5 Writing-of Bad Debts
The ANOVA table indicates that the calculated value of F is 21.54, which is more than the table value of 2.93 at 5% level of significance. Hence, the null hypothesis is rejected again. It means that there is a significant difference in Bad debts among all the four banking groups. The performance of all the banking groups regarding this ratio is different.
5.1.6 Expenditure-income Ratio
The ANOVA table indicates that the calculated value of F is 13.52, which is more than the table value of 2.93 at 5% level of significance. Hence, the null hypothesis is rejected again. It means that there is a significant difference in expenditure-income ratio among all the four banking groups. The performance of all the banking groups regarding this ratio is different.
5.1.7 Return on Assets
The ANOVA table indicates that the calculated value of F is 83.70, which is more than the table value of 2.93 at 5% level of significance. Hence, the null hypothesis is rejected again. It means that there is a significant difference in Return on Assets in % among all the four banking groups. The performance of all the banking groups regarding this ratio is different.
Business and Economic Research ISSN 2162-4860
2014, Vol. 4, No. 1
www.macrothink.org/ber 105
5.1.8 Return on Equity
The ANOVA table indicates that the calculated value of F is 3.514, which is more than the table value of 2.93 at 5% level of significance. Hence, the null hypothesis is rejected again. It means that there is a significant difference in Return on equity among all the four banking groups. The performance of all the banking groups regarding this ratio is different.
5.1.9 Net Interest Income
The ANOVA table indicates that the calculated value of F is 13.17, which is more than the table value of 2.93 at 5% level of significance. Hence, the null hypothesis is rejected again. It means that there is a significant difference in net interest income ratio among all the four banking groups. The performance of all the banking groups regarding this ratio is different.
5.1.10 Liquid Assets
The ANOVA table indicates that the calculated value of F is 9.554, which is more than the table value of 2.93 at 5% level of significance. Hence, the null hypothesis is rejected again. It means that there is a significant difference in liquid assets ratio among all the four banking groups. The performance of all the banking groups regarding this ratio is different.
5.1.11 Excess Liquidity
The ANOVA table indicates that the calculated value of F is 13.73, which is more than the table value of 2.93 at 5% level of significance. Hence, the null hypothesis is rejected again. It means that there is a significant difference in Excess Liquidity ratio among all the four banking groups. The performance of all the banking groups regarding this ratio is different.
Correlation Analysis
Correlation between CRAR and Interest Income
The industry correlation is 0.6385 which is significantly positive though DFI’s correlation is negative. So, we can say that as increased CRAR positively correlated with interest income and it is possible for increasing the capital base which reduces the interest expenses to the depositors.
Correlation between NPL to Loans Ratio and Interest income
Figure 5.19 show that there exists negative correlation between NPL to loan and interest income. As NPL to loan ratio decreases, interest income increases and the correlation between this two criteria is -.9622 for the industry as a whole over the period. So, we can say that Banks should emphasize on reducing the NPL.
5.2 Conclusion
An efficient operation of banking sector enables the smooth financial resources intermediation of an economy. Economic growth is contributed greatly by the efficiency of banking sector in resources generation and its proper allocation. The smooth and efficient operation of banking sector also helps to reduce risk of failure of an economy. Therefore, the performance of
Business and Economic Research ISSN 2162-4860
2014, Vol. 4, No. 1
www.macrothink.org/ber 106
banking sector is always been a source of interest for researchers to judge the economic condition of a country. Regulators of the banking sector always monitors the performance of the banks to ensure efficient financial system based on CAMEL ratio.
Among the entire CAMEL ratio, some important ratios which are most significant are analyzed to judge the performance of the banking industry in Bangladesh. Among the four categories of banks operating in Bangladesh, DFIs has been found more vulnerable compared to the rest of three categories. CRAR, NPL to total loan, EIR all are too high and provision maintenance ratio, ROA, ROE, liquidity ratio is too low in DFIs and this scenario also reflects negatively in overall banking industry performance of Bangladesh. FCBs shows and PCBs show all the positive signal of well functioning whereas SCBs also shows a trend of improving performance.
References
Ahmed, F. (1995) Performance of Commercial Banks in Bangladesh-A Note on Current trends. Journal of the Institute of Bankers, Bangladesh. Vol. 36 -41, December 1992-June 1995.
Bangladesh Bank Annual Report, (2004-2011), (www.bangladesh-bank.org)
Bangladesh Bank Manual for Ratio Analysis and CAMEL Rating System (2006), http://ncalculators.com/statistics/correlation-coefficient-calculator.htm
C, D, Parimal. K, G, Badal. Hasan Tuhin, Mehedi Financial Performance in Banking Sector in Bangladesh: A Comparative Study of Some Selected Private Commercial Banks. Journal of Banking & Financial Services, Department of Banking Faculty of Business Studies University of Dhaka. Vol. 5 Number 1 July 2011
Chowdhury, A. (2002), “Politics, Society and Financial Sector Reform in Bangladesh”, International Journal of Social Economics, 29(12), 963-988.
Chowdhury, H. A., & Islam, M. S. (2007), “Interest sensitivity of loans and advances: A competitive study between nationalized commercial banks and specialized commercial banks”, ASA University review, 1(1), 124-141.
Chowdhury, T. A., & Ahmed, K. (2009), “Performance Evaluation of Selected Commercial Banks in Bangladesh”, International Journal of Business and Management, 4(4), 86-97.
Khan, A. R. (2009), “Sources and uses of funds, performance evaluation and bank failure”, Bank Management: A fund Emphasis, (2nd edition), Dhaka: Decent Book House, pp. 51-68.
Mujeri, M. K., & Younus, S. (2009), “An analysis of interest rate spread in banking sector in Bangladesh”, The Bangladesh Development Studies, 32(4), 65-89
Pandey I. M. (2004), “Financial statement analysis”, Financial Management, (9th edition). New Delhi, India: Vikas, pp. 517-558.
Van Horne J. C. & Wachowicz Jr. J. M. (2005), “Financial statement analysis”, Fundamentals of Financial Management, (11th edition). India, Pearson, pp. 125-168.

Business and Economic Research ISSN 2162-4860
2014, Vol. 4, No. 1
www.macrothink.org/ber 107
Copyright Disclaimer
Copyright reserved by the author(s).
This article is an open-access article distributed under the terms and conditions of the Creative Commons Attribution license (http://creativecommons.org/licenses/by/3.0/).

Business and Economic Research ISSN 2162-4860
2014, Vol. 4, No. 1
www.macrothink.org/ber 108
Convertibility of Capital Account: A Comparative Analysis
Md. Ariful Islam (Corresponding author)
Deputy Manager, BASIC Bank Limited
Khulna Branch, 107 Sir Iqbal Road, Khulna, Bangladesh
Tel: 880-171-752-9503 E-mail: [email protected]
Md. Rayhan Islam
Business Administration Discipline
Khulna University, Khulna, Bangladesh
Tel: 880-171-333-1982 E-mail: [email protected]
Mahmudul Hasan Siddiqui
Senior Territory Manager, Unilever Bangladesh Limited
M.N. Trading & Co, Modina Tower, Habibpur, Narayanganj, Bangladesh
Tel: 880-171-168-8592 E-mail: [email protected]
Luthful Karim
Assistant Manager, BASIC Bank Limited
Khulna Branch, 107 Sir Iqbal Road, Khulna, Bangladesh
Tel: 880-191-212-5098 E-mail: [email protected]
Received: December 14, 2013 Accepted: December 28, 2013
doi:10.5296/ber.v4i1.4711 URL: http://dx.doi.org/10.5296/ber.v4i1.4711
Abstract
Convertibility of capital account – the complete elimination of all capital controls – was often treated in the 1990s as an integral element of the market liberalization that was being urged on emerging markets. In the middle of the decade there was even talk of making it an objective of
Business and Economic Research ISSN 2162-4860
2014, Vol. 4, No. 1
www.macrothink.org/ber 109
international policy that would be embodied (as a long-term target) in the IMF Articles. This study attempts to focus on issues and experiences of other countries regarding capital account convertibility and figures out lessons for Bangladesh. Fischer (1998, p.2) wrote, “capital account liberalization is an inevitable step on the path of international development, which cannot be avoided and should be embraced. After all, the most advanced economies have open capital accounts.” Until the Asian Crisis, discussion of capital account convertibility focused on sequencing issues, and speed. In the aftermath of the crisis, the emphasis has shifted to caution regarding capital account convertibility. In our country Capital Account is not convertible. However, experiences from Latin America (Mexico, Chile etc.) and very recently from Asia (Indonesia, South Korea, Malaysia, Thailand, Philippine etc.) showed that financial opening involves substantial risks and can be ended in financial crash. A lot of improvement and precautionary measures are required before going for Capital Account convertibility. Bangladesh Taka has been declared convertible on current account transaction since 20th October, 1993 and accordingly on the 11th April, 1994 Bangladesh has been awarded with Article VIII status of International Monetary Fund (IMF) Articles of Agreement. Convertibility of Taka in Current Account has a lot of impacts on Balance of Payment position. Right after the reform measures, exports show an increasing trend at an increasing rate from the year 1994-95 to 1997-98. After the convertibility of Bangladesh Taka in different currencies, the export volume takes a rising trend due to flexibility in exchange rate regulation.
Keywords: Convertibility, Capital account, IMF, Currencies, Export, Import
1. Introduction
1.1 Background of the Study
The flows of capital – debt, equity, and direct and real estate investment - between one country and others are recorded in the capital account of a country’s balance of payment. Outflows include resident’s purchases of foreign assets and repayment of foreign loans; inflows include foreigner’s investments in home-country residents. Freeing transactions like these from restrictions – that is, allowing capital to flow freely in or out of a country without controls or restrictions – is known as capital account liberalization.
The explosive growth of international financial transactions, capital flows and globalization are the most far reaching economic developments of the late twentieth century. Powerful forces have driven the rapid growth of international capital flows, globalization of trade, and encouraged countries toward economic liberalization. Revolutionary changes in information and communication technologies have transformed the financial services industry worldwide.
Convertibility of currency is heavily related to the globalization process because without making our currency convertible to other foreign currencies, one can not make international trade transaction easily and timely.. Convertibility may be either ‘partial’ or ‘full’. Partial convertibility denotes that the transactions related to current account are to make freely. On the other hand, Full convertibility implies free transaction in both current account and capital account of Balance of Payment (BOP) of a country. Capital account liberalization has contributed to higher investment, faster growth and rising living standards in many countries.

Business and Economic Research ISSN 2162-4860
2014, Vol. 4, No. 1
www.macrothink.org/ber 110
But it has also been associated with costly financial crises in several cases. This means that liberalization carries risks as well as benefits and has major implications for the policies that governments will find it feasible and desirable to follow.
Bangladesh Taka has been declared convertible on current account transaction since 20th October, 1993 and accordingly on the 11th April, 1994 Bangladesh has been awarded with Article VIII status of International Monetary Fund (IMF) Articles of Agreement. The main reasons behind this step are:
� To attract higher foreign investment;
� To promote export;
� To reduce trade deficit;
� To improve the BOP position, especially the Current Account Balance (CAB)
� To create confidence in the strength of Taka.
1.2 Objectives of the Study
The objectives of the study are,
� To analyze and understand the issues and experiences of other countries after implementing capital account convertibility.
� To examine the impact of convertibility of capital account on external sector.
� To examine the feasibility of making the Taka convertible on capital account.
� To put forward some suggestions on the way to country’s capital account convertibility.
1.3 Hypothesis of the Study
For the purpose of study, the research identifies the following hypothesis:
The rules and policies related to convertibility of Taka have significant impact on capital account convertibility.
1.4 Methodology of the Study
The research methodology of the study has been enumerated below:
A. Data Collection: For the purpose of this study, the data that are collected is more or less processed data or secondary data. The data have collected from the various sources like research works of individuals, different publications, journals of IMF, World bank, Bangladesh bank, library sources, web pages of World Bank, IMF, WTO, Bangladesh Bank, etc.
B. Treatment of the Data: For understanding the effect of capital account convertibility in different countries, data have been analyzed to compare the financial condition of the countries before convertibility and after convertibility. To understand the

Business and Economic Research ISSN 2162-4860
2014, Vol. 4, No. 1
www.macrothink.org/ber 111
feasibility of introducing capital account convertibility of taka in our economy, data have been analyzed to realize recent economic trends and prospects of our economy. The balance of payment has been analyzed on the basis of Bangladesh Bank data. All the data have manipulated by standard computer packages like Excel.
1.5 Limitations of the Study:
Any research work needs high degree of involvement regarding collection of information, creation of database, literature review and analysis of data. In this study, I tried my best to collect the related information within the time constraint and then analyzed and compared the data. I faced the following limitations of the study:
� This study did not cover primary and unpublished data.
� It has considered data only from Bangladesh Bank, Bangladesh Statistical Bureau, IMF and World Bank publications.
� Data is taken upto 2004 due to some technical error for getting data.
2. Conceptual framework of Capital Account Convertibility
2.1 Convertibility of Capital Account
Allowing capital to flow freely in or out of a country without controls or restrictions – is known as capital account Convertibility. The flows of capital – debt, equity, and direct and real estate investment - between one country and others are recorded in the capital account of a country’s balance of payment. Outflows include resident’s purchases of foreign assets and repayment of foreign loans; inflows include foreigner’s investments in home-country residents.
Capital market liberalization is considered as an integral component of the overall liberalization process in developing countries. . In a number of studies (King and Levine 1993) capital account openness is found to have positive impact on the depth and efficiency of the domestic financial system. Today, External private capital has become a very important source of funds for investors even in the developing economies. According to Fisher (1998), financial integration and free capital mobility facilitate a more efficient global allocation of savings and help channel resources into the most productive uses, and thus increasing economic growth and welfare.
2.2 Reasons for Capital Account Convertibility
Different countries made their capital account convertible for the following reasons.
a) To make the economy internationally competitive.
b) To integrate the economy with global monetary and fiscal system.
c) To increase investment and economic growth. In form of FDI and portfolio investment.
d) To achieve more stable economic growth.

Business and Economic Research ISSN 2162-4860
2014, Vol. 4, No. 1
www.macrothink.org/ber 112
e) To gain confidence on local currency.
2.3 Preconditions of Capital Account Convertibility
To implement convertibility of capital account successfully, the country should check weather her economic and financial conditions are sound enough to safeguard any unpredicted shock. The following conditions should be fulfilled before going for convertibility in order to achieve benefits from convertibility.
a) Internal financial balance must be established through sound fiscal and monetary policies to avoid excessive inflationary pressures.
b) Monetary policy must be managed in such a way that interest rates and exchange rates are broadly consistent with market conditions.
c) External financial balance must be achieved by setting the exchange rate at a level that would clear the Demand for and supply of foreign exchange.
d) Adequate level of reserves should be maintained to allow a country to absorb domestic and exogenous shocks.
e) Incentives system must be liberalized to allow positive effect on resource allocation.
f) Country should have a sound macro-economic policy framework; in particular monetary and fiscal policies that are consistent with the choice of exchange rate regimes.
g) There should be timely, accurate and comprehensive data disclosure, including information on central bank reserves and forward operations.
In general countries which initiated the move to capital account convertibility on the basis of strong fundamentals were able to modulate the pace of capital account convertibility without dramatic changes in macro-economic policy stance. Those who went for drastic changes had to rethink, back track or in extreme case face a crisis.
2.4 Benefits of Capital Account Liberalization
A large number of different arguments have been advanced for capital account liberalization. Among those the important arguments are as follows:
a) Allocation arguments – “maximizing efficiency in the world’s use of capital, a scarce resource” (Cooper, 1998, p.12). Capital account liberalization reduces interest rate differentials across currencies and countries, and thereby reduces international differences in the cost of capital. As a consequence, investment becomes more efficient. This argument is identical to standard arguments on the gains from free trade in goods and services.
b) Individual freedom – “individuals should be free to dispose of their income and wealth as they see fit” (Cooper, 1998, p.12). In a liberal democracy, property owners should be free to dispose of their assets as and where they wish, provided that this

Business and Economic Research ISSN 2162-4860
2014, Vol. 4, No. 1
www.macrothink.org/ber 113
does to involve illegal activities or tax avoidance or evasion. In particular, capital market controls prevent individuals from diversifying their asset portfolios. Abolition of controls facilitates risk reduction.
c) Macroeconomic discipline – “countries stand to gain by establishing the capital markets in support of good policies” (Dornbusch, 1998, p.20). Because capital markets are forward looking, the possibility of large inward or outward capital flows imposes an element of constraint on government policies, requiring that these be feasible over the longer term. This discipline is a means for obtaining commitment to sound policies from governments which may be subject to short term electoral or other political pressures.
d) Financial market discipline – “intense capital mobility puts greater burdens on a country to ensure that its financial system is well supervised and regulated” (Dornbusch, 1998, p.20). If countries are to compete in free international capital markets, they will be required to conform to international standards with regard to reporting and to financial regulation.
e) Infeasibility - “the scope for discretionary action has become extremely limited” (Dornbusch, 1998, p.20). Capital market controls may be evaded through exploitation of special provisions and loopholes or by black or grey market operations. The net effect of controls is therefore only to increase costs. This argument contradicts those that precede it – for example, if controls are ineffective, they cannot discipline government policy and is an attempt to finesse the entire issue. We shall take it that controls are sufficiently effective for governments to wish to maintain them, since otherwise there is no point any discussion. Furthermore, the evidence from Chile and Malaysia, among other countries, demonstrates that controls can have significant effects.
f) Costs of capital account liberalization:
g) Capital account liberalization also imposes costs on developing countries - The following are among the most frequently articulated arguments against liberalization:
h) Macroeconomic Policy - Capital account liberalization complicates the conduct of macroeconomic policy, essentially by constraining the level of the domestic interest rate. This is just the counterpart of the macroeconomic discipline argument advanced as a benefit from liberalization.
i) Exchange Rate Management - Many developing countries are committed to pegged exchange rate regimes. The viability of this type of regime is underpinned by capital account controls. The Asian Crisis has shifted the majority view in the Economics profession towards a strong preference for floating rate regimes, but that transition requires a degree of central bank independence which can currently only be an aspiration in many developing countries.
j) Taxation - A characteristic of many poor developing countries is that they have a
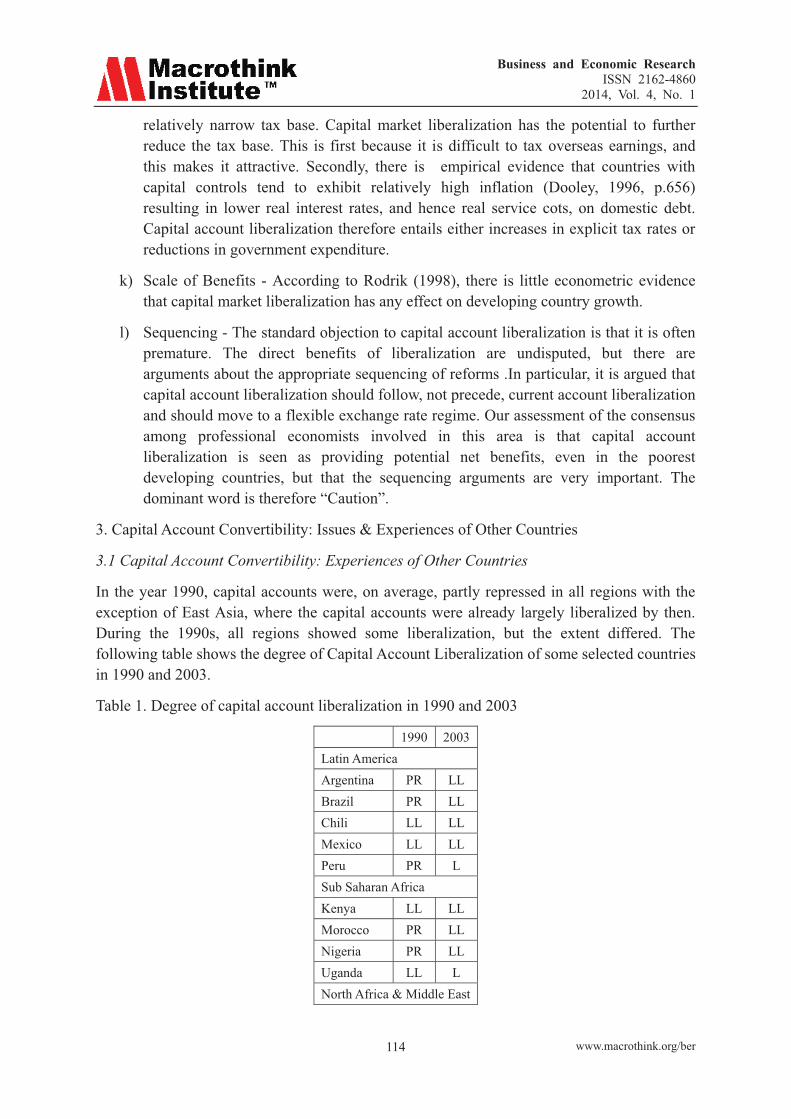
Business and Economic Research ISSN 2162-4860
2014, Vol. 4, No. 1
www.macrothink.org/ber 114
relatively narrow tax base. Capital market liberalization has the potential to further reduce the tax base. This is first because it is difficult to tax overseas earnings, and this makes it attractive. Secondly, there is empirical evidence that countries with capital controls tend to exhibit relatively high inflation (Dooley, 1996, p.656) resulting in lower real interest rates, and hence real service cots, on domestic debt. Capital account liberalization therefore entails either increases in explicit tax rates or reductions in government expenditure.
k) Scale of Benefits - According to Rodrik (1998), there is little econometric evidence that capital market liberalization has any effect on developing country growth.
l) Sequencing - The standard objection to capital account liberalization is that it is often premature. The direct benefits of liberalization are undisputed, but there are arguments about the appropriate sequencing of reforms .In particular, it is argued that capital account liberalization should follow, not precede, current account liberalization and should move to a flexible exchange rate regime. Our assessment of the consensus among professional economists involved in this area is that capital account liberalization is seen as providing potential net benefits, even in the poorest developing countries, but that the sequencing arguments are very important. The dominant word is therefore “Caution”.
3. Capital Account Convertibility: Issues & Experiences of Other Countries
3.1 Capital Account Convertibility: Experiences of Other Countries
In the year 1990, capital accounts were, on average, partly repressed in all regions with the exception of East Asia, where the capital accounts were already largely liberalized by then. During the 1990s, all regions showed some liberalization, but the extent differed. The following table shows the degree of Capital Account Liberalization of some selected countries in 1990 and 2003.
Table 1. Degree of capital account liberalization in 1990 and 2003
1990 2003 Latin America Argentina PR LL Brazil PR LL Chili LL LL Mexico LL LL Peru PR L Sub Saharan Africa Kenya LL LL Morocco PR LL Nigeria PR LL Uganda LL L North Africa & Middle East

Business and Economic Research ISSN 2162-4860
2014, Vol. 4, No. 1
www.macrothink.org/ber 115
Egypt PR L Turkey LL LL South Asia Bangladesh PR PR India PR LL Pakistan PR LL Sri-Lanka PR PR East Asia China R PR Hong Kong L L Indonesia LL LL Korea PR LL Malaysia LL LL Singapore L L Thailand LL LL
Note: Here PR: Partly repressed, R: Repressed, LL: Largely liberalized, L: Liberalized. Source: IMF annual report on exchange arrangements and exchange restrictions, 1991 and 2003
According to IMF scores (which, of course, should be treated with caution), Latin America went the furthest towards full capital account convertibility. Sub-Saharan Africa and North Africa & Middle-East also undertook major liberalization steps. The smallest change was observed in South Asia, a region that in 2003 was still classified as partly repressed. East Asia, while already fairly liberalized by the early 1990s, undertook modest additional liberalization.
3.1.1 Latin American Countries
In Latin America, Chile, Mexico and Venezuela were already largely liberalized at the beginning of the 1990s, but that contrasted strongly with all other countries, which were partly repressed, with Argentina and Peru being the most heavily repressed. This reflected the historical tradition of closed capital accounts and the debt crisis of the 1980s.
a) Argentina: Argentina adopted capital account liberalization strategy in 1991. It liberalized its capital account quite rapidly and intensively. In 1991 the adoption of the convertibility plan created a currency board. This adoption of currency board was followed by a marked increase in capital inflows in 1991-94. Foreign direct investment and portfolio inflows reached 11% of GDP in 1993, compared with less than 1% in 1990. Argentina’s access to capital market was substantially curtailed in early 1995 and there was a large outflow of short-term capital. During the first half of 1995 the central bank lost about one-third of its international reserves. The policy response to these developments did not include an imposition of capital controls. Instead the authorities adjusted macroeconomic policies including a marked tightening of fiscal policy under an IMF program adopted in March 1995. By the end of August 1995, more than half of the deposit outflows had been revised; and by December 1996 deposits had reached their precise level.

Business and Economic Research ISSN 2162-4860
2014, Vol. 4, No. 1
www.macrothink.org/ber 116
b) Peru: Like Argentina, Peru adopted deep and fast liberalization of the capital account, from an initial position of very restrictive controls. The exchange rate was unified and a free-floating regime adopted, FDI received equivalent treatment to domestic investment, capital could be freely repatriated, non-residents could acquire domestic securities, and residents and non-residents could open foreign-currency denominated accounts, although with high reserve requirements against such accounts (Ariyoshi et al., 2000).
c) Chile: Chile (which had already largely liberalized by 1990) has been a paradigmatic case in the use of restrictions to reduce the volume of capital inflows and to influence their composition. In the early 1990s, the country experienced excessive capital inflows. To avoid excessive currency appreciation and other undesirable macroeconomic imbalances, in June 1991 the country's authorities adopted an unremunerated reserve requirement (URR) to reduce the volume of capital inflows and change their composition towards flows with longer maturity. This created a simple, non-discretionary and prudential mechanism, which penalized short-term foreign currency liabilities more heavily.
3.1.2 East Asian Countries
East Asian countries experienced extensive liberalization in the 1990s. However, the standard deviation in the region – IMF indicator of the degree of heterogeneity, or dispersion – both for 1990 and 2001 is the largest among all regions. This means that the regional average conceals sharp differences among the countries of the region. Four types of countries can be found in East Asia.
a) China: During 1994-97, China’s international reserves increased sharply from 5.8 to 11 months of import, owing to a strong balance of payments and maintained stable exchange rate of the currency against U.S dollar. China accepted the obligations of the IMF’s Article VIII in December 1996. While China was able to maintain the stability of the currency throughout the Asian crisis, capital outflows became an increasing problem in late 1997 and early 1998, driven by concerns of a devaluation of the renminbi, the falling differential between domestic and foreign interest rates, and increasing circumvention. The current account remained in surplus and foreign direct investment remained strong, but the capital account deteriorated sharply. As a result overall balance of payments surplus fell sharply, from $36 billion in 1997 to $6 billion in 1998. In response to these developments, the authorities significantly intensified enforcement of exchange and capital controls and moved to reduce circumvention. These measures involved enhanced screening of capital account transactions and increased documentation and verification requirements on current transactions. The measures were implemented with a view to safeguard illegal capital outflows and ultimately maintaining a stable exchange rate. These steps improved the BOP situation of China. Now in China FDI allowed but volume above $1 million requires signing contract with government. There are ceilings and minimum holding periods. Effective from April 2001, all controls on outward FDI were abolished. Nonresident

Business and Economic Research ISSN 2162-4860
2014, Vol. 4, No. 1
www.macrothink.org/ber 117
may freely purchase local shares subject to a minimum holding period. Residents are also permitted to purchase portfolio securities from abroad. Credit operations are controlled.
b) South Korea: Korea is the country that, started from an initial fairly restrictive position, undertook the largest capital account liberalization during the decade to reach a fairly open stance by 2001. The country started out gradually, with residents being permitted to issue securities in abroad and foreigners being allowed to invest directly in the Korean stock market (though limits existed on the latter). From 1993 until 1997, the process was accelerated with the lifting of barriers on short-term borrowing to different sorts of domestic activities previously restricted, investment by non-residents in public bonds, and permission to issue equity-linked bonds and non-guaranteed bonds by small and medium-sized firms, and non-guaranteed long-term bonds by large firms.
Some restrictions were maintained, however, particularly on some forms of capital inflows, due to concerns about surge of capital inflows, caused by interest rate differentials. These were mainly in the form of ceilings on foreign investment in domestic equity securities and borrowing from abroad by non-banks. However, the exceptions to these, which proved harmful, included the liberalization of trade related short-term financing to domestic firms and short-term foreign currency borrowing by domestic banks (Shin and Wang, 1999).
c) Malaysia: Malaysia has been relatively open for years, and experienced a massive surge of capital inflows in the early 1990s. Until then, the limits on capital inflows consisted mainly of ceilings on foreign currency borrowing, beyond which approval was required. To further limit such flows, especially short-term ones, in 1994 the authorities prohibited the selling by residents to non-residents of money market securities, and commercial banks were forbidden to engage in swap and forward contracts with non-residents. Ceilings were imposed on banks’ net foreign exchange open positions, and reserve requirements were decreed for foreign currency liabilities of commercial banks. Most of these controls were subsequently lifted, with only the prudential ones remaining in place. The assessment of Ariyoshi et al. (2000) is that such controls were effective both in reducing the volume and changing the maturity of flows. During 1997 and early 1998 Malaysia suffered massive capital outflows. In response to that, in September 1998 the country’s authorities adopted a number of restrictions on capital outflows. These included: prohibition of using domestic currency in trade payments and offshore trading, prohibition of credit facilities between residents and non-residents, and repatriation of non-resident portfolio capital, which was blocked for 12 months (Ariyoshi et al. 2000). Controls were later relaxed and then totally eliminated. Residents are now permitted to obtain financial credit facilities in foreign currency up to the equivalent of RM 5 million. But investment abroad exceeding RM 10000 in any form requires approval.
d) Thailand: Thailand’s liberalization was the most aggressive during the 1990s,

Business and Economic Research ISSN 2162-4860
2014, Vol. 4, No. 1
www.macrothink.org/ber 118
particularly in the early 1990s with the creation of the Bangkok International Banking Facility (BIBF), which through tax privileges greatly encouraged external flows, especially short-term ones (Johnston et al., 1997). Outflow of capital exceeding $10 million a year required approval. Foreign capital may be brought into the country without restriction. Because of rapid capital account liberalization Thai baht came under severe speculative pressure in May 1995. So, in 1995, restrictions were imposed to reduce the volume of (mainly short-term) capital inflows, which became excessive in the first half of the 1990s. These restrictions included a 7 percent reserve requirement on non-resident accounts with a maturity of less than one year and on short-term borrowing of finance companies; limits for open short and long foreign currency positions (with lower limits for short positions); and reporting requirements by banks on risk control measures regarding foreign exchange and derivatives (Ariyoshi et al., 2000). However, capital continued to flow in large amounts by taking different forms (Siamwalla, Vajragupta and Vichyanond, 2003). In response to that, in 1996 the reserve requirements were extended to short-term borrowing by commercial and BIBF banks. According to Ariyoshi et al. (2000), such controls on capital inflows succeeded in reducing the volume of inflows, lengthening their maturity, reducing the short-term debt to total debt ratio, and reducing the growth of non-resident baht accounts. However, these developments were not sufficient to avoid the reversal of capital flows the country experienced in 1997. Now in Thailand non-residents are allowed to purchase portfolio capital locally, but purchase or issue abroad requires approval. Same rule apply for money market instruments. Authorized banks are allowed to grant loans up to $10 million.
e) Indonesia: Indonesia greatly encouraged capital flows, especially FDI, from the start of the decade. Bank lending to the domestic corporate sector also became prominent in the 1990s. In the mid-1990s, there was an effort to prioritize FDI over other types of flows, with ceilings on foreign lending being used as an instrument, but with poor effectiveness (Gottschalk and Griffith-Jones, 2003).
Finally, Hong Kong and Singapore are among the few developing countries with almost totally liberalized capital accounts as early as 1990. Both countries remained open, though a few restrictions are in place. For example, in Hong Kong, the disclosure and position limits on derivative products are required, in addition to prudential limits on open foreign exchange positions and on certain forms of capital outflows. In the case of Singapore, there are upper limits for foreign lending from residents to non-residents in Singapore dollars, and an obligation for non-residents to convert proceeds in Singapore dollars into foreign currency. These measures are aimed at discouraging the international use of the domestic currency. Also, there are certain prudential limits and restrictions on capital outflows.
3.1.3 South Asian Countries
South Asian countries have adopted a cautious approach to capital account liberalization. Liberalization of capital account transaction should be undertaken from a relatively strong
Business and Economic Research ISSN 2162-4860
2014, Vol. 4, No. 1
www.macrothink.org/ber 119
balance of payments position. As the balance of payment position of south Asian countries are not so good, so they have taken cautious approach to capital account liberalization.
� India: Since the external crisis of 1991, India has undertaken economic reforms, including partial capital account liberalization, to begin reversing several decades of inward-looking and interventionist policies. FDI was liberalized first in India. Portfolio equity flows were selectively liberalized during the 1990s, and the liberalization of external borrowing was very limited. The country relied extensively on quantitative and other controls. These included overall quantitative ceilings, approvals on a case-by-case basis, different degrees of restrictions according to the maturity of foreign liabilities, and end-use restrictions. Strong limits were imposed on short-term debt. In June 1997 – thus just before the East Asian crisis broke out – the Tarapore Committee recommended a timetable for further capital account liberalization in India (Reserve Bank of India, 2000). The proposed liberalization included both capital inflows and outflows; liberalization was to be progressive, in three phases, over three years. However, these liberalization steps were conditional on the country meeting certain pre-conditions. By 2001, India’s capital account was still only partially liberalized, with strong restrictions remaining in place, particularly on capital outflows by residents. Apparently due to this more cautious approach, and to its high level of foreign reserves, the country managed to escape the financial crises of the 1990s and even to avoid contagion effects during the East Asian crisis. With the reorientation of capital account policy toward non-debt-creating inflows and foreign direct investment external indebtedness has declined markedly. However, there are indications that India’s wide-ranging capital and other economic controls may have reduced economic growth compared with other Asian economies with a more open economic system.
� Pakistan: Alongside India, Pakistan is the other South Asian country that pursued significant liberalization steps during the 1990s. In fact it went further than India, with most types of capital inflow liberalized. Most of the remaining restrictions are on capital outflows by residents, though lately some initial steps have been taken to liberalize outflows.
� Sri Lanka: Although having undertaken some liberalization steps, the capital account in Sri Lanka remains quite repressed. These two countries have maintained capital restrictions in the form of outright prohibitions (for example in the case of money market instruments and derivatives) and central bank approval (for example for long-term borrowing). Capital outflows by residents are still strongly restricted.
3.1.4 Sub Saharan Africa
a) Kenya: Kenya was another fast liberalizing country in the region. In a context of shortage of foreign reserves and large fiscal deficit, in 1991 the country embarked on a program of reforms that included rapid current and capital account liberalization. The Capital Account liberalization included permission to hold foreign currency certificates of deposit, which could be traded by residents and non-residents, used for
Business and Economic Research ISSN 2162-4860
2014, Vol. 4, No. 1
www.macrothink.org/ber 120
any foreign exchange transaction, and reclaimed at the Central Bank at face value. In addition, some companies could hold foreign currency denominated bank accounts abroad and domestically (Ayiroshyi et al, 2000). In 1994, the domestic currency became fully convertible, and in 1995 most of the remaining controls on foreign exchange transactions were removed (including access by foreigners to shares and government securities). Among the few exceptions, foreigners could hold portfolio equities up to 5% individually and 40% in aggregate. The overall result of capital account liberalization in Kenya in the context of broader reforms was macroeconomic volatility and increased capital flight (Ayiroshyi et al., 2000).
4. Current Account Convertibility in Bangladesh
4.1 Convertibility of Taka
Convertibility is the ability of the owner of the asset (foreign currency and foreign exchange) to exchange it from one currency to another. Convertibility assures that every holder of the currency is able to obtain at the margin an equal satisfaction from it as he could obtain from other currencies. A currency is said to be convertible when it may be fully convertible for another currency. Convertibility of currency is not for domestic transactions, it is only required for international transactions.
On 20th October, 1993 Bangladesh Taka has been declared convertible on current account transactions and on the 11th April, 1994 Bangladesh government has been awarded with the Article VIII status of International Monetary Fund (IMF) Articles of Agreement. The declaration means a commitment on the part of Bangladesh to allow her citizens to convert the Taka into foreign exchange to meet obligations falling into the category of current account. The declaration did not come about all on a sudden. Preparations for convertibility started a long time back in the seventies. Since 1976, a lot of economic reform measures were under taken in Bangladesh. These reform measures include: denationalization and privatizations of industries and bank, improvement of fiscal management, tariff rationalization, opening of trade regime etc. these has paved the road of convertibility.
Sequencing of reform measures is very important for the matter of achieving desired result for an economy. Real sector reform and financial sector reform should go hand in hand. Internal financial liberalization should be accomplished before external financial liberalization is undertaken. Some east European countries could not achieve desired results due to improper sequencing of reform measures. Bangladesh has followed the correct path in terms of sequencing the various reform measures. Foreign exchange reform or Taka convertibility on current account has been implemented as the last in the chain of various reform measures. We have not made our currency convertible on capital account yet.
Convertibility of Taka has produced mixed results. Foreign investment both direct and portfolio types have risen. Relaxation of exchange controls by Bangladesh bank on remittance of profit and dividends to foreign investors have provided incentives to the foreign direct and portfolio investors to invest more funds. It may be expected that as Taka is getting international status and currency management system has improved the foreign private investment as well as

Business and Economic Research ISSN 2162-4860
2014, Vol. 4, No. 1
www.macrothink.org/ber 121
the overall investment level will improve soon. Another great advantage that has been visible after Taka convertibility is the removal of “chilling effect” arises out of unnecessary delay in making a transaction. Now people can complete their transactions within shortest possible time. On the other hand convertibility of Taka coupled with low interest rates push the rate of growth of imports upward.
Convertibility is not the only engine of growth. It just creates a positive environment to foreign investment, greater flexibility to recognize production techniques with easy access to advanced technology. Other economic and non-economic should also be considered for determining the impact of convertibility. For a rapid and balanced development of the economy we need to do much more than conversation. We need to formulate appropriate fiscal, monetary and other policies having being on the country’s productive capabilities. We must improve our managerial and entrepreneurial capabilities, produce good labor force and remove bureaucratic bottlenecks; otherwise expected results cannot be achieved.
4.2 Foreign Exchange Regulation Act, 1947 and Deregulatory Measures
Bangladesh Bank issues licenses to deal in foreign exchange empowered by the foreign exchange regulation act 1947. Central bank may issue general licenses or licenses with authority to perform limited functions only. The authorized dealers must maintain adequate and proper records of all foreign exchange transactions and furnish such particulars in the prescribed returns for submission to the Bangladesh Bank. They should report to Bangladesh bank in regard to any attempt of the provisions of the Act.
Since 1976 a lot of reform measures have been undertaken in Bangladesh. The major deregulatory measures and changes taken place during last few years have been pointed out in the following paragraphs.
� Bangladesh bank in exercise of the powers conferred by the Foreign Exchange Regulations Act, 47 issues licenses to commercial banks to deal in foreign exchanges. The central bank has also permitted a number of Moneychangers to exchange cash foreign currency notes, coins or foreign currency instruments such as traveler’s cheques.
� With the exceptions of few reform sectors, foreign investors are free to make investments in Bangladesh in industrial enterprises Local residents are free to invest in shares/securities, with foreign exchange sent or brought in to Bangladesh. Foreign investors are free to remit their post-tax profits and dividend on their own countries.
� Foreign owned as well as joint venture industrial units located in Bangladesh may freely borrow funds in foreign currency from aboard. Local banks may extend working capital loans or term loans in local currency to foreign controlled or foreign owned firms operating in Bangladesh.
� Annual foreign exchange quota for business travel aboard for the new exporters has been set as US $ 6000. Merchandise exporters may retain 25% of realized FOB value of their exports in foreign currency accounts.

Business and Economic Research ISSN 2162-4860
2014, Vol. 4, No. 1
www.macrothink.org/ber 122
� Incoming passengers may be in any amount of foreign exchange with declaration in FMJ form at the time of arrival. No declaration is necessary for amount up to US$ 5000.
� Non-resident foreign currency deposit (NFCD) accounts may now be maintaining as long as the account holder desire.
� Persons ordinarily in Bangladesh may maintain foreign currency accounts with foreign exchange brought in at the time of their return to Bangladesh from visits aboard. These accounts are termed as Resident Foreign Currency Deposit (RFCD) accounts.
� Bangladesh nationals having bank accounts aboard which were opened while working there may now maintain such accounts even after their return to Bangladesh.
� Travel quota entitlement of Bangladesh nationals is set at US$ 3000 per year for visits to countries other than SAARC member countries and Myanmar. For SAARC member countries and Myanmar it is US$ 1000 for travel by air and US$ 500 for travel by land route.
� A Bangladeshi national returning from aboard may bring in to Bangladesh up to 10 kilograms of gold or 20 kilograms of silver in bullion/ingot from subject to payment duties and taxes as levied by the government.
� Education sector was declared fully convertible. Prior permission of Bangladesh bank is not required for releasing foreign in favor of Bangladesh students studying aboard or willing to proceed aboard for studies.
� Authorized dealers may release foreign exchange up to US$ 10,000 for medical treatment aboard on the basis of recommendation of Medical Board constituted by the Health directorate and cost estimate from the foreign medical institutions.
� Remittance of moderate amounts of foreign exchange of family maintenance aboard of Bangladesh nationals are allowed by Bangladesh bank on written request supported by certificate from the Bangladesh mission in the concerned country.
� Bangladesh bank has stopped sales and purchases with Authorized Dealers of any currency other than the US Dollar; to encourage the Authorized Dealers to buy and sell other currencies in the inter bank market.
� To encourage authorized dealers to avoid frequent transactions with central bank and instead to resort to inter bank deals, Bangladesh bank has raised its transaction there hold to US$ 50,000. Bangladesh bank has also left the Authorized Dealers free to quote their own rates for inter-bank transactions and transactions with non-bank customers.
� Bangladesh Foreign Exchange Dealers Association (BAFEDA) has been formed and a “Code of Conduct” for treasury operations and interbank foreign exchange market has been formulated.

Business and Economic Research ISSN 2162-4860
2014, Vol. 4, No. 1
www.macrothink.org/ber 123
5. External Financial Integration of Bangladesh
5.1 Balance of Payment Analysis
International business is facilitated by markets that allow for the flow of funds between countries. The transactions that arise from international business cause money flow from one country to another. The balance of payments represents a measure of international money flows. Balance of payment account records the international economic transactions of a country with the rest of the world during a particular period of time.
Table 2. Presentation of Balance of Payment (BOP), 2000-2004 (millions of us dollars)
ITEMS 2000 2001 2002 2003 2004*
Trade balance Export fob(including EPZ) Of which RMG Import fob (including EPZ)
-1865 5701 4352
-7566
-2011 6419 4860
-8430
-1768 5929 4584
-7697
-2215 6492 4912
-8707
-2319 7521 5686
-9840 Services Receipts Payments
-645 849
-1494
-914 759
-1673
-499 865
-1364
-691 887
-1578
-874 924
-1798 Income Receipts Payments Of which, official interest payments
-302 97
-399 -160
-344 97
-441 -168
-402 50
-452 -161
-358 64
-422 -167
-374 63
-437 -175
Current Transfers Official Private Of, which workers Remittances
2394 165
2229 1949
2171 72
2099 1882
2826 69
2757 2501
3440 82
3358 3062
3743 61
3682 3372
Current Account Balance -418 -1098 157 176 176 Capital Account Capital Transfers
561 561
432 432
410 410
428 428
196 196
Financial Account Foreign direct investment Portfolio investment Other investment MLT loans MLT amortization payments Other long term loans (net) Other short term loans (net) Other capital Trade credit (net) Commercial Bank Assets
-116
383 0
-499 806
-396 127 71
-190 -641 -276 -161
682
550 0
132 790
-416 -13 31
-114 -260 114
1478
391
391 -6 6
733 -435 -42 63
-87 -253
27 -90
413
376 2
35 918
-452 -20 142
-125 -499
71 217
78
385 6
-313 544
-397 -41 13
-125 -321
14 86
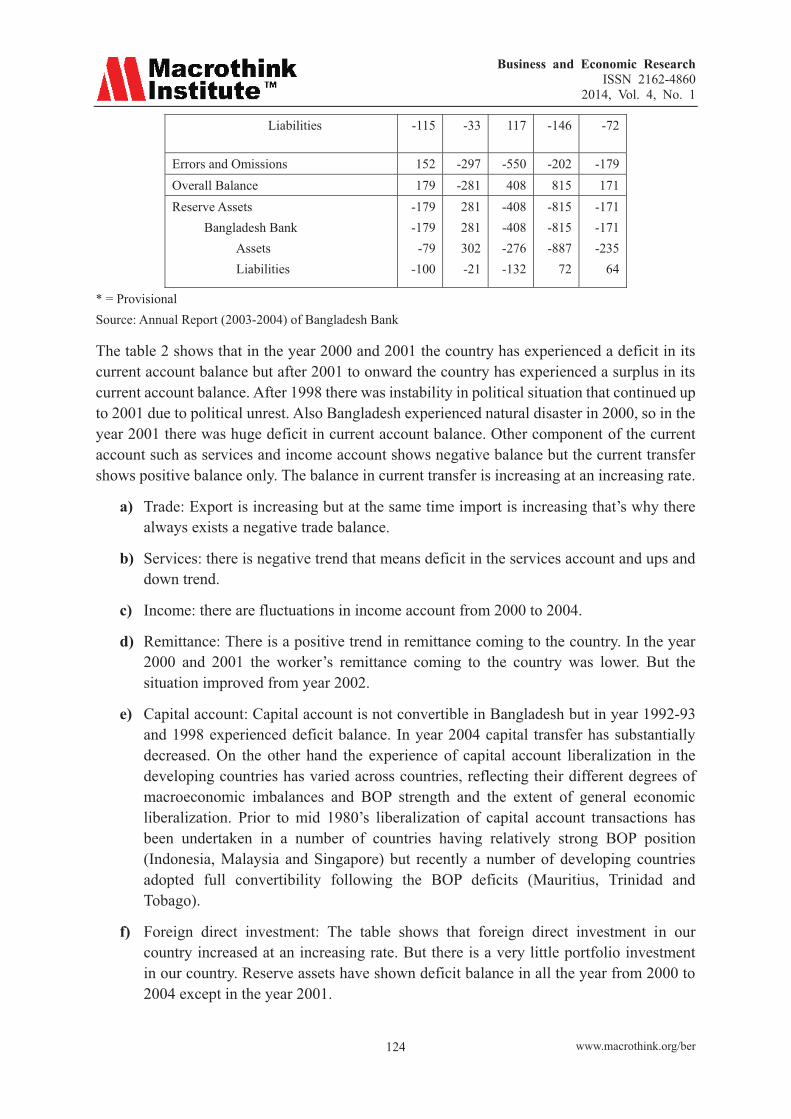
Business and Economic Research ISSN 2162-4860
2014, Vol. 4, No. 1
www.macrothink.org/ber 124
Liabilities -115 -33 117 -146 -72
Errors and Omissions 152 -297 -550 -202 -179 Overall Balance 179 -281 408 815 171 Reserve Assets Bangladesh Bank Assets Liabilities
-179 -179 -79
-100
281 281 302 -21
-408 -408 -276 -132
-815 -815 -887
72
-171 -171 -235
64
* = Provisional Source: Annual Report (2003-2004) of Bangladesh Bank
The table 2 shows that in the year 2000 and 2001 the country has experienced a deficit in its current account balance but after 2001 to onward the country has experienced a surplus in its current account balance. After 1998 there was instability in political situation that continued up to 2001 due to political unrest. Also Bangladesh experienced natural disaster in 2000, so in the year 2001 there was huge deficit in current account balance. Other component of the current account such as services and income account shows negative balance but the current transfer shows positive balance only. The balance in current transfer is increasing at an increasing rate.
a) Trade: Export is increasing but at the same time import is increasing that’s why there always exists a negative trade balance.
b) Services: there is negative trend that means deficit in the services account and ups and down trend.
c) Income: there are fluctuations in income account from 2000 to 2004.
d) Remittance: There is a positive trend in remittance coming to the country. In the year 2000 and 2001 the worker’s remittance coming to the country was lower. But the situation improved from year 2002.
e) Capital account: Capital account is not convertible in Bangladesh but in year 1992-93 and 1998 experienced deficit balance. In year 2004 capital transfer has substantially decreased. On the other hand the experience of capital account liberalization in the developing countries has varied across countries, reflecting their different degrees of macroeconomic imbalances and BOP strength and the extent of general economic liberalization. Prior to mid 1980’s liberalization of capital account transactions has been undertaken in a number of countries having relatively strong BOP position (Indonesia, Malaysia and Singapore) but recently a number of developing countries adopted full convertibility following the BOP deficits (Mauritius, Trinidad and Tobago).
f) Foreign direct investment: The table shows that foreign direct investment in our country increased at an increasing rate. But there is a very little portfolio investment in our country. Reserve assets have shown deficit balance in all the year from 2000 to 2004 except in the year 2001.

Business and Economic Research ISSN 2162-4860
2014, Vol. 4, No. 1
www.macrothink.org/ber 125
5.2 External Financial Integration and Economic Growth
It is obvious that the relationship of financial integration and economic growth is not so direct and simple. Financial integration and external capital flows are said to be typically associated with some features of the economy like investments, savings, productivity, and financial development that contribute in economic growth.
Based on theoretical review, some macroeconomic variables are compared in pre (1991-1996) and post openness period (1997-2002). To have a distinctive picture between pre-openness and post-openness period, a dummy variable model (y = д0 + д1 Di + U, Where D=0 for pre openness period and D=1 for post openness period), and growth model (in Y = β0 + βt + U) are estimated using Bangladesh data (Ahsan Habib, 2004, p.14). For estimating growth model the period 1991-1997 and 1997-2003 are used as pre and post openness period to have greater degree of freedom.
As the estimated results (table-5.2) show, there were positive changes in the level of GDP growth rate and per capita GDP rate (annual average) in the post openness period as compared to pre openness period. Annual average level of real GDP and per capita GDP increased from 4.77% and TK. 12416 respectively during 1991-96 to about 5.20% and TK. 19130 during 1997-03. In both the periods, per capita GDP registered annual average growth of about 7% (Appendix-5). There was however negative annual average change in the GDP growth (%) in the post openness period (Table-5.3).
Table 3. Mean differences in the selected indicators during pre-openness (1991-96) and post-openness (1997-03) period.
Variables д0 д1 t GDP Growth (%) 4.77 .400 1.47 PCGDP (TK.) 12416.33 6714.2 5.76 GDS to GDP (%) 13.83 4.06 7.45 GDI to GDP (%) 18.90 3.80 6.45 GFCF to GDP (%) 16.83 3.64 6.08 Broad money to GDP 26.55 6.03 3.56 Private credit to GDP (%) 17.00 5.67 4.52 Ratio of GDP to Total investment 5.30 -0.90 -5.80
Note: Abbreviations used: PCGDP- Per capita GDP; GFCF- Gross fixed capital formation at market price; GDS- Gross domestic savings; GDI- Gross domestic investment. Source: Estimations are based on Bangladesh bank and GOB data.
Table 4. Average growth of the selected indicators in Pre and Post openness period
Indicators 1991-1996 1997- 2003 GDP Growth (%) .0964 -0.053 GDS to GDP (%) .6893 0.3143 GDI to GDP (%) .7179 0.4070 GFCF to GDP (%) .4994 0.5288

Business and Economic Research ISSN 2162-4860
2014, Vol. 4, No. 1
www.macrothink.org/ber 126
Broad money to GDP .6571 1.730 Private credit to GDP (%) .9690 1.089 Ratio of GDP to Total investment -0.1926 -0.0832
Source: Estimations are based on Bangladesh Bank and GOB data.
Both savings and investment rates (to the GDP) attained statistically significant improvement in the post openness period as compared to the pre openness period (Table-3). However, the level of savings and investment rates of Bangladesh remained low ( were only 18.2% and 23.2% of GDP in 2002 respectively) in global perspective. It can be observed (from table-5.3) that the rate of change of the variables (savings and investment as % of GDP) decelerated during 1997-2003, and total investment of the country increased (%) at slower pace in the period compared to the pre openness period (Appendix-1). Though marginally, it is a positive sign that domestic long term investments (GFCF to GDP) registered better rate of change in the post openness period (table-5.3).
Both the financial deepening indicators (broad money to GDP and private credit to GDP) attained statistically significant changes between pre and post openness period. Broad money and private credit (to GDP) increased from 26% and 17% to about 32% and 22% respectively (Table-5.2). Especially, growth rates of broad money registered significant improvement over the period 1997-03 and the level reached to about 37% (of GDP) in the year 2003 (BB data). As the Appendix-5 indicates, except broad money, other variables (private credit, total investment, and gross fixed capital formation) experienced lower annual average percentage growth during the post openness period.
5.3 Absorption of External Capital Inflows and Growth
The evidences (Appendix-2) suggest that there were notable differences in the composition of absorption of capital inflows in the selected countries. The countries like Chile, Indonesia, Malaysia, and Thailand reduced share of consumption in GDP during the inflow period (Appendix-2). Positive development has taken place in Bangladesh in connection with the composition of absorption of capital flows. The country registered slow improvement in the average level of investment to GDP ratio during the inflow period as compared to the immediately preceding period of equal length. Consumption to GDP ratio decreased and current account of the economy found improvement during the inflow period 1997-2003 (Appendix-3). However, investment level of the country remained low, and consumption remained at considerably higher level in global context (Appendix-3).
5.4 Current Account, Export Growth and Foreign Exchange Reserve
The levels of current account deficits of Bangladesh were clustering around 1% of GDP toward the end of 1990s that became positive in 2001 and improved in the following year. Bangladesh’s balance of payment (BOP) stability and international reserve largely depend on export earnings. The country’s exports of goods and services (to the GDP) increased by about 9% over 1990s, but it remained in the category of low exporting countries (Appendix-4). Though capital account appeared to be the main force in pulling up foreign exchange reserves in many economies (as in India), the impact of increase in FDI flows to Bangladesh’s reserves

Business and Economic Research ISSN 2162-4860
2014, Vol. 4, No. 1
www.macrothink.org/ber 127
has been limited.
In this age of financial globalization, it is much more popular to assess reserves position in terms of short term capital. In this regard Bangladesh is clearly out of danger having restrictions on short term debt and with its limited portfolio capital flows. However, still it was lower than 3 months of imports of the country as of June 2003.
6. Conclusion and Recommendation
6.1 Conclusions
Opening of the trade and financial sector is becoming a compelling reality for the developing countries. Opening of external sector is necessary for the countries that wish to take benefit of the open world economic system by raising investment and foster economic growth. Empirical study (Klein and Olivie, 99) shows that opening of financial sector increases the growth and financial depth of a country. Convertibility of Taka in current account is a necessary step in this openness process.
New reform measures have already been taken to boost export and attract foreign investment. Foreign investors in Bangladesh are already got a package of facilities including tax holiday, profit remittance, EPZ and other facilities. This reform resulted in higher foreign investment and international trade. But the growth of foreign investment is not significant yet comparing to the neighboring countries.
Bangladesh Taka is already awarded IMF Status of Article VIII in 1994. This is one of the major financial reform measures country has taken so far. It effected positively to the international trade also. Deregulation of exchange rate determination is another significant reform measure taken by Bangladesh. Now the market forces determine the exchange rate of Taka. This step is vital for improving the foreign exchange market in Bangladesh, especially when the country is lagged behind the terms of well functioning money and capital market. By deregulating the exchange rate, the country moved further towards financial liberalization.
Balance of payment (BOP) situation is one of the vital factors regarding a country’s involvement in international trade. The BOP of Bangladesh showed, generally, a deficit tendency in its trade and current account balances. A relatively weaker BOP may create financial crisis if the country opens up its capital account. The Asian crisis in 1996 also suggests that countries with BOP problems suffered most at that time. Thus before opening the capital account, Bangladesh first is required to improve its macro economic accounts especially BOP position.
Now a day’s one country cannot open its trade sector without going for convertibility. Convertibility is positively related with country’s international trade and the financial deepness (Klein and Olivei, 1999). So, Bangladesh has to integrate trade and financial liberalization measures effectively and orderly to achieve benefits from it.
The overall economy of Bangladesh suggested that the country has to improve its macro-economic accounts further in order to make Taka convertible on capital account transactions. Today FDI has contributed significantly less to net resource flow to Bangladesh

Business and Economic Research ISSN 2162-4860
2014, Vol. 4, No. 1
www.macrothink.org/ber 128
than that of the most of the developing countries of Asia and there is still substantial scope to improve the sustainability of external financing in Bangladesh. It is very important in the context of Bangladesh as its capital market is underdeveloped. FDI provides far more than just capital, it provides benefits in the form of managerial know how and modern technology. Moreover, at the current economic condition in Bangladesh, higher growth rate can be achieved by supplementing the countries lower domestic saving by foreign capital inflows. FDI has typically proven to be least volatile item and a strong resilience of FDI reduces the risk of contagion. Therefore, the country should aim at higher level of FDI in external financing which is clearly very low in Bangladesh.
However, experience suggests that capital outflow has to be permitted to increase the net inflows in the long run, because controls on outflows effectively reduce inflows also. Moreover, high inflow of capital has not always proved to be a positive factor in the economic growth. Its destabilizing side effects in the form of rise in inflation, adverse effect on the competitiveness of the export industries must be minimized by effective stabilization policy to get the positive contribution of higher level of inflows. Thus, relaxing control on capital outflows (permitting local institutions to make investments aboard, allowing on domestic entity to issue local currency bonds in domestic market etc.) would be necessary to stabilize capital inflows in near future in Bangladesh. However, the most important point to be noted that, only removal of restrictions from outflow of capital would rather make the situation worse if supportive measures are not ensured. Steps must be taken with regard to the weakness of financial institutions, inadequate infrastructural facilities, and corruption in the bureaucratic system, inadequate legal system and political confrontation that are very important factors for the confidence of foreign investors.
6.2 Recommendations
For the strategies to harmonize the liberalization of external sector and financial system and also keeping in mind the present economic performance of Bangladesh, the following issues may be considered:
1. There is no alternative way for Bangladesh but to open up the trade and financial sector. So, before liberalizing the country must prepare her for the associated opportunities and risks of openness. The authority should cross-examined, thoroughly, the liberalization issues before taking further steps.
2. In moving towards capital account convertibility financial sector vulnerability is probably the most serious concern for Bangladesh. Some prudential measures have been adopted in recent days; however, only strict execution and application of the adopted policies would provide accepted result.
3. Bangladesh’s tiny stock market and government bond market need a big push for effective monetary policy operation. Moreover, it is crucial to have cooperation from fiscal authorities in adopting effective monetary policy.
4. Based on experiences of other countries, it is now widely accepted that external financial liberalization should follow internal financial liberalization (Choudhury and

Business and Economic Research ISSN 2162-4860
2014, Vol. 4, No. 1
www.macrothink.org/ber 129
Raihan, 1999) and Bangladesh is no exception to it.
5. The aim of internal liberalization of Bangladesh is to attain higher growth and stability on its macro-economic factors. The already fragile banking sector should need further attention regarding solvency and non-performing assets.
6. Steps must be taken to attract more foreign investment by taking the appropriate measures with regard to the weakness of financial institutions, inadequate infrastructure facilities, corruption and red-tapism in the bureaucratic systems, inadequate legal system and political unrest in the country.
7. At present Bangladesh needs the type of FDI that will have significant impact on incremental exports in order to offset rising payment liabilities overtime and to pull up foreign exchange reserves.
8. Macroeconomic conditions of the country need to be improved to safeguard the economy from plunging in to instability. Sufficient foreign exchange reserve should be ensured, fiscal deficit should be brought down to a reasonable level, lower rate of inflation should be maintained and ensuring political stability are required with regard to the non-performing advances of banks. The contractionary policy, (very high level of statutory reserve requirements to limit the credit) may not be a good option in the presence of a number of problem banks in the economy. With regard to the recovery drive of the defaulted loan the result is impressive, but the speed is slower. More emphasis should be given with regard to the recovery of the defaulted loan and the screening procedure should be strengthened to sanction new loans.
9. Some sort of control over the capital mobility is necessary to safeguard financial crisis. In this regard the country could manage the asset, liability and duration management accordingly.
10. Making Taka convertible on capital account transactions does not necessarily mean full removal of restrictions on capital mobility. The country should have some control over capital mobility to protect the crisis.
If the government in able to develop their policies and implement them properly then the real investors will come to Bangladesh, with capital and technology, and then actual financial development will take place that will lead to overall economic growth.
References
Alam, Khorshed. (1995). Convertibility of Taka for Current Transactions in Bangladesh. Bangladesh Bank, Dhaka.
Ariyoshi, A. et al. (2000). Capital Controls: Country Experiences with Their Use and Liberalization. IMF Occasional Paper No. 190.
Bangladesh Bank. (1996-2003). Bangladesh Bank Bulletin, Dhaka.
Bangladesh Bank. (2004). Annual Report 2003-2004 . Dhaka.

Business and Economic Research ISSN 2162-4860
2014, Vol. 4, No. 1
www.macrothink.org/ber 130
Bangladesh Bank. (2005). Economic Trends . Dhaka.
Bangladesh Bureau of Statistics, Foreign Trade Statistics . Dhaka, 1994-95 to 1998-99.
Bangladesh Bureau of Statistics. Statistical Yearbook of Bangladesh, Dhaka . 1991-92 to 1999-2000.
Chaudhuri, B. K. (1988). Finance of Foreign Trade And Foreign Exchange . Himalaya Publishing House, Bombay.
Choudhury, T. A. (2002). Reading Materials on International Finance (Compiled). BIBM, Dhaka.
Choudhury, T. A., & A. Raihan. June, (1999). Implications of WTO on the Banking and Financial Sector in Bangladesh. Bank Parikrama, BIBM, Volume XVIV, No. 1.
Choudhury, T. A., & Mahmudul A. Masud. (2002). Reading Materials on International Trade And Finance (Compiled). BIBM, Dhaka, 2002.
Choudhury, T. A. (1993). Convertibility of Currency: Conceptual Framework and Requirements. A Paper Presented in a Workshop Organized by Independent University, Dhaka.
Choudhury, Toufic Ahmad, & Ananya Raihan. Globalization and Finance for Development. Published in Bangladesh Facing the Challenges of Globalization: A Review of Bangladesh’s Development 2001, The Centre for Policy Dialogue and The University Press Limited, Dhaka, 2002.
Cooper, R. (1998). Should Capital-Account Convertibility be a World Objective?, in Should the IMF Pursue Capital-Account Convertibility, Essays in International Finance, 207, Princeton University.
Cooper, R. (1999). Should Capital Controls be Banished? . in Brookings Papers on Economic Activity, 1, pp. 89-141. http://dx.doi.org/10.2307/2534663
Dooley, M. P. (1996). A Survey of the Literature on Controls on International Capital Transactions, IMF Staff Papers, 43, 639-87. http://dx.doi.org/10.2307/3867365
Dornbusch, R. (1998). Capital Controls: An Idea Whose Time is Past’, in Should the IMF Pursue Capital-Account Convertibility, Essays in International Finance, 207, Princeton University.
Eichengreen, Barry, & Michael Mussa. (1998). Capital Account Liberalization and the IMF’. in Capital Account Liberalization: Theoretical and Practical Aspects . IMF Occasional Paper 172, Washington DC, December.
Fischer, S. (1998). Capital Account Liberalization and the Role of the IMF’ in Should the IMF Pursue Capital-Account Convertibility?, Essays in International Finance, 207, Princeton University.
Griffith-Jones, S., Gottschalk, R., & Cirera, X. (2003). The OECD Experience with Capital Account Liberalisation. UNCTAD. forthcoming.

Business and Economic Research ISSN 2162-4860
2014, Vol. 4, No. 1
www.macrothink.org/ber 131
Habib, Shah, Md. Ahsan, Dr. Khondakar G. Moazzem. (2004). Implications of Financial Globalization for Bangladesh . BIBM. Dhaka.
Hassan, M. Kabir. (1998). The Asian Financial Crisis and the Bangladesh Economy. Bank Parikrama, BIBM, Vol. XXIII, March & June.
IMF. (2002). IMF-Supported Programs in Capital Account Crisis . Washington DC.
International Monetary Fund. (2002). Exchange Arrangements And Exchange Restrictions. Annual Report, Washington DC.
International Monitory Fund. (2003). Liberalization of Capital Account- Experiences and issues . Occasional Paper, Washington D C.
International Monitory Fund. (2005). International Financial Statistics Yearbook . Washington D C.
Islam Muinul, et al. Bank Loan Default Problem in Bangladesh: A Dialogue Between Borrowers and Lenders. Bank Parikrama, BIBM, Vol. XXIV, No. 2, June, 1999.
Johnston, B., Darbar. S., & Echeverria, C. (1997). Sequencing capital account liberalisation : lessons from the experiences in Chile, Indonesia, Korea and Thailand, IMF Working Paper, WP/97/157, November.
King, R. G., & R. Levine. (1993). Finance, Entrepreneurship and Growth, Journal of Monetary Economics, 32, 523-42. http://dx.doi.org/10.1016/0304-3932(93)90028-E
Klein M., & G. Olivei. (1999). Capital Account Liberalization, Financial Depth, and Economic Growth . NBER, Cambridge.
Lall. Sanjana. (1993). Foreign Direct Investment In South Asia. Asian Development Review, Voll-II.No. 1, ADB, Manila.
Mahmud, Kalam. (1999). Convertibility and Globalization: A Case Study of Bangladesh . MBM Dissertation, BIBM.
Mahmud, W. (1998). Macroeconomic Management And Reforms: Issues In Governance. Crisis in Governance- A Review of Bangladesh Development 1997, Dhaka. CPD & UPL.
Mckinnon, Ronald I. (1979). Money in International Exchange: The Convertible Currency System . Oxford University Press, Oxford.
Ministry of Finance. Bangladesh Economic Review. Dhaka, 1996-2002.
Rao, M. J. Manohor. (1997). Macroeconomics of Capital Account Convertibility. Economic And Political Weekly, India.
Rodrik, D. (1998). Who Needs Capital-Account Convertibility? in Should the IMF Pursue Capital-Account Convertibility, Essays in International Finance, 207, Princeton University.
Shin, I., &Wang, Y. (1999). How to Sequence Capital Market Liberalisation: Lessons from the Korean Experience . KIEP Working Paper 99-30, Seoul.

Business and Economic Research ISSN 2162-4860
2014, Vol. 4, No. 1
www.macrothink.org/ber 132
Siamwalla, A., Vajragupta, Y., & Vichyanond, P. (2003). Foreign Capital Flows to Thailand: Determinants and Impact, University of Michigan Press, Ann Arbor.
Siddiqui, Ziaul H. (1993). Impact of Convertibility. A Paper Presented in a Workshop Organized by Independent University . Dhaka.
World Bank. (2005). World Development Indicators . Washington D C.
Copyright Disclaimer
Copyright reserved by the author(s).
This article is an open-access article distributed under the terms and conditions of the Creative Commons Attribution license (http://creativecommons.org/licenses/by/3.0/).

Business and Economic Research ISSN 2162-4860
2014, Vol. 4, No. 1
www.macrothink.org/ber 133
Analysis of Quality Leadership in Reviving Economies and Politics in Muslim Countries
Mahfuzur Rahman (Corresponding author)
Faculty of Business and Accountancy
University of Malaya, 50603 Kuala Lumpur, Malaysia
Tel: 60-132-227-095 E-mail: [email protected]
Hasanul Banna
Faculty of Business and Accountancy
University of Malaya, 50603 Kuala Lumpur, Malaysia
Md. Arphan Ali & Md. Saifur Rahman
Faculty of Economics and Administration
University Of Malaya Kuala Lumpur, Malaysia
Received: January 12, 2014 Accepted: January 27, 2013
doi:10.5296/ber.v4i1.4899 URL: http://dx.doi.org/10.5296/ber.v4i1.4899
Abstract
It has been observed that there is a crisis of quality leadership in Muslim world for decades. Erosion of moral values among leaders contributes to the instability and poor economic performance for many Muslim countries. This study investigates factors that contribute to the deterioration of quality leadership in Muslim world. The study also investigates the role of quality leadership for unifying the Muslim Ummah. Descriptive and analytical research methods have been applied in this study to analyze the interviews as well as prior studies. The findings indicate that lack of sufficient education, dishonesty, lack of knowledge and dedication for country’s development, absence of trustworthiness and responsibility, lack of moral values and avoidance of teaching of Al-Qur'an and As-Sunnah are the main factors that cause the deterioration of quality leadership in Muslim world. The study also concludes that honest and responsible leadership can contribute significantly to the economic development, political stability, peace and harmony of the Muslim world. This study recommends possible
Business and Economic Research ISSN 2162-4860
2014, Vol. 4, No. 1
www.macrothink.org/ber 134
initiatives in order to produce quality leadership skills in society, government and NGOs citizens.
Keywords: Quality Leadership, Economic & Political development, Challenges, Muslim World
1. Introduction
The importance of quality leadership is undeniable for the sustainable economic growth and political stability in a country. It is considered as a significant tool to revive the economic development of a country. According to Jones & Olken (2005), leadership matters for economic growth as individual leaders play significant role in accelerating overall economic growth of a nation. In the same context, Jones (2009) further argued that leadership selection also has large impacts on the economic growth of a nation. The quality leadership is developed thorough education, honesty, responsibility, dedication and others. There is a strong relationship between education and quality leadership. Most of the developed countries are economically strong and financially solvent due to their powerful political leadership and perhaps because their leaders are highly educated. On the other hand, most of the developing countries, particularly Muslim countries are far behind the developed nations in terms of economic growth and political stability, perhaps because their leaders are not highly educated. Prior studies suggest, countries that frequently experience dramatic reversal in growth, usually fail to carry forward their economic growth (Easterly, 1993 and Hausmann, 2005). Reversal of economic growth become a common phenomenon for many countries, particularly among the Muslim countries. Probably, this is because there are many political parties exist in developing countries like Bangladesh where mostly one party cannot be re-elected more than one time. As a result, when new party comes into power, they change the policy of previous rulings party which create barrier for economic growth. There are many examples that represent, changes in national leaders are systematically associated with changes in economic growth. For example, there is an evidence in the United States that incumbents are much more likely to be reelected during economic booms than during recessions (Fair & Ray, 1978; Wolfers, 2002). Other research has found in cross-country settings that high growth rates inhibit coups (Londregan and Poole, 1990).
Leaders are important in every organization. A world without leaders is like a ship without lighthouse. Anyone can be leader by possessing strong leadership qualities. Everyone can be leaders by leading our inner self and leading others by example. But above all that a good or quality leadership depend on the qualification of a leader possess. The Islamic model of leadership emphasizes khuluq or behaving ethically towards all. It has been unanimously agreed upon Muslims and non-Muslims. Firmly grounded by the faith in God and mindful of the role as a trustee, as expected to be just, behave righteously, strive towards self-improvement and never breaks his/her word. The leader needs to consult with others, especially in areas where he/she is not competent. A leader is expected to bear adversity patiently and remain forever humble. Such exemplary Muslim leaders are rare. A Muslim leader should be humble and must never let his/her ego get the better of him/her. Umar (ra), the second Caliph, lived in a simple house. He had no bodyguards for his personal security,

Business and Economic Research ISSN 2162-4860
2014, Vol. 4, No. 1
www.macrothink.org/ber 135
and walked in the streets of Madinah without any escort. Ali (ra), in his letter to Malik Al-Ashtar an-Nukhai, strongly encourages him to remain humble in his new position as Governor of Egypt and explained to him why pride and arrogance are to be avoided:
Never say to yourself, ‘I am their Lord, their ruler, and I must be obeyed submissively and humbly.’ Such a thought will unbalance your mind, will make you vain and arrogant, will weaken your faith in religion and will make you seek the support of any power other than God’s.
The following story demonstrates how the Prophet (saw) exhibited patience and humility when a ban was imposed on the Muslims by others:
When we complained to God's Messenger (saw) of hunger and raised our clothes to show we were each carrying a stone over the belly, God's Messenger (saw) raised his clothes and showed that he had two stones on his belly.
This paper focuses on causes of the deterioration of quality leadership and its impact on country’s economy and political development. Quality leadership is chosen because it is the key factor of a country to accelerate its economic development. No matter how the other sector of the economy grow if leaders are corrupted then it would create a barrier for the economic growth of country in the long run. The findings of our study specify some factors such as lack of sufficient education, honesty, lack of knowledge and dedication for country’s development, absence of trustworthiness and responsibility, lack of moral values and avoidance of teaching of Al-Qur'an and As-Sunnah are the main factors that cause the deterioration of quality leadership in Muslim world. The study also concludes that honest and responsible leadership can contribute significantly to the economic development, political stability, peace and harmony of the Muslim world. The analysis also shows that lack of unity among the Muslim countries’ leaders became barrier for unifying the Muslim Ummah.
The rest of this paper is organized as follows: An in-depth literature is discussed in section two following the research method in section three. Section 4 analyses the interviews to find out causes of deterioration of quality leadership and its impact on country’s economic and political development. Section 5 provides several recommendations to produce the quality leadership, while the concluding remarks are presented in section-6.
2. A Review of the Literature
2.1 Quality Leadership
Quality leadership can be simply defined as focusing on people, social responsibility and quality of work. Feigenbaum (2007) stated that “quality today has become the foundation for constant management innovation and leadership” (p. 38). It is an intricate process as the persons in power influence their followers, civil society and wider public to accomplish societal goals. Perhaps the leadership style that most relates to quality leadership is the transformational leadership which “searches for ways to help motivate followers by satisfying high order needs and fully engaging them in the process of the work.” (Horner, 1997, p. 275) .The essence of quality leadership is an undeniable fact for economic

Business and Economic Research ISSN 2162-4860
2014, Vol. 4, No. 1
www.macrothink.org/ber 136
development. It is considered as one of the significant tools for accelerating economic growth of a country. For example, the economic success of East Asia is largely attributable to the adoption of developmentalism, i.e., the ideology that places highest priority on economic development (Watanabe, 1995). On the other hand, World Bank experts Kaufmann et al. (2002) have studied the association between governance and growth in developing countries. They identified voice and accountability, political stability, government’s effectiveness, regulatory quality, rule of law and control of corruption as the main indicators of good governance. They found strong correlation between quality of governance and level of growth in a majority of the countries studies. Political leadership does influence to a large extent to these indicators of governance. The most imperative mechanism of quality leadership choose suitable policies and programmes, implementing them effectively and by reviving the required institutions for stepping up the rate of development.
2.2 Quality Leadership and Edification
There is a famous saying that Education is a Backbone of a nation. It is considered a shine light for society as well as nation as whole. As Leu & Price-Rom (2006) have suggested: ‘Educational quality in developing countries has become a topic of intense interest, primarily because of countries’ efforts to maintain quality…in the context of quantitative expansion of educational provision…Whether explicit or implicit, a vision of educational quality is always embedded within countries’ policies and programs’ (p. 2). Beside that education is a lifelong process beginning at birth. Humans have a creative force which should be nurtured and allowed to grow in a fertile environment whether at home or at school. Similarly, Oduro & MacBeath (2003), in talking of school leadership research, argue that ‘much of this work is premised on competences or individual qualities of leaders which, it is assumed travel not only across institutional boundaries but also traverse national and cultural borders’ (p. 441) .In addition to that education should be an ongoing preparation for life and with a goal for achieving the greater good. The detailed study of school leaders within (Brown & Conrad, 2007) indicates a thoughtful avenue for future research explorations. This study examined ‘principals’ and other senior educational leaders’ perspectives on school leadership and highlights approaches adopted by principals as they attempted to effectively meet the learning needs of students in a system characterized by an overly centralized bureaucracy in a time of continuous educational reform’. From the empirical evidence we can find that most of the developing countries leaders are not highly qualified. This might be due to the tradition of inherited power. This is really very common among the Muslim countries. As a result, most of the leaders become corrupted which undermines economic growth of a country. The fruits of an economic growth are concentrated only in the hands of few people.
2.3 Quality Leadership and Inherited Leadership
Inherited leadership refers to the leadership that passes among the family members. To some extent some leadership can be obtained by using money. Baldrige defines a Leadership System as an effective leadership system includes mechanisms for the leaders to conduct self-examination, receive feedback and improve (Baldrige National Quality Program, 2003). Leaders from that background as mentioned above try to prepare their sons or daughters to

Business and Economic Research ISSN 2162-4860
2014, Vol. 4, No. 1
www.macrothink.org/ber 137
become leaders to accomplish something. This is common in traditional societies and this type of leadership is very obvious in many countries particularly in the Muslims countries. However, this leadership whether it is blessed or cursed is also currently debated in the many countries. But it is not common to traditional societies. It is also practiced in most of developed and stable democracies like the USA where Bush family has shown the characteristics of dynastic leadership. There are also many other example like in India, Rajiv Gandhi succeeded her slain mother; in Indonesia Meghawati Sukarnoputri became president partly because of her father’s name; in Pakistan, Benezir Bhuttu; and in Bangladesh, shekh Hasina, the daughters of Shekh Mujib, and Khaled Zia, wife of President Zia (ex-political leaders) succeeded them on sympathy wave (G. Thimmaiah,n.a.). Now, the big question is whether they are able to uphold the inherited leadership or not to accumulate the economic growth of a country. According to Kirkpatrick and Locke (1996), the study of leader traits has a long and controversial history. While research shows that the possession of certain traits alone does not guarantee leadership success, there is evidence that effective leaders are different from other people in certain key respects.
2.4 Quality Leadership and Situational Leadership
There are so many unexpected political or economic incidents that may occur in a society or country which lead to bring out extraordinary leadership qualities in ordinary persons. The leadership of Mahatma Gandhi, Jawaharlal Nehru and Vallabhai Patel are brought out by the freedom movement (Thimmaiah & Aziz, 1984).The researchers found that leaders emerged as a result of different situations. Therefore, the researchers assumed that leadership qualities were developed depending on the situation. However, there are people who believe that there are different styles of leadership which changes the situation. There are three basic things in a situational leadership; the foremost thing is that the relationship between the followers and the leader must be healthy. The followers must like the leader and support him/her in his goals. The second thing is that the task which is to be accomplished must be known, and the leader should set the goals as per the task to be done. Along with the tasks to be accomplished, the methods and standards to accomplish the task must also be specified in details, as this will make an impact on the followers. The third thing that is important is that the organization must confer the responsibilities of the task upon the leader, as this will strengthen the position of the leader.
2.5 Leadership in Islam
Muslims behave as leader and/or as follower depending on the Word of God as revealed in their holy book, the Qur’an. The Prophet Muhammad (saw) has emphasized a second major role of the Muslim leader: to protect his community against tyranny and oppression, to encourage God-consciousness and taqwa, and to promote justice. A commander (of the Muslims) is a shield for them. Whether as servant or as guardian, a Muslim leader may make use of certain bases of power to be effective. Islam recognizes the existence of power, but suggests etiquette for its use. They believe that the Prophet of Islam, Muhammad (saw), has modeled the way for Muslim leaders and followers for all times. This belief is supported when God says the following about Muhammad (saw):

Business and Economic Research ISSN 2162-4860
2014, Vol. 4, No. 1
www.macrothink.org/ber 138
And you stand an exalted standard of character.
Muhammad’s (saw) example, then, is what both Muslim leaders and followers seek to emulate. According to the Prophet Muhammad (saw), leadership in Islam is not reserved for small elite. Rather, depending upon the situation, every person is the “shepherd” of a flock, and occupies a position of leadership. Muhammad (saw) is reported to have said:
Each of you is a guardian, and each of you will be asked about his subjects.
In most circumstances in life, Muslims are urged to appoint a leader and follow him. According to the Prophet Muhammad (saw), Muslims must appoint a leader during a trip, select a leader to lead the prayer, and choose a leader for other group activities. Leadership, then, can be depicted as a process by which the leader seeks the voluntary participation of followers in an effort to reach certain objectives. This definition suggests that leadership is essentially a process whereby the leader guides willing followers. At all times, a leader must remember that he cannot compel others to do things against their will. According to Islam, the two primary roles of a leader are those of servant-leader and guardian- leader. First, the leader is the servant of his followers (sayyid al qawn khadimuhum). He is to seek their welfare and guide them towards good. The idea of a leader as a servant has been part of Islam since its beginning, and has only recently been developed by Robert Greenleaf: The servant-leader is servant first. It begins with the natural feeling that one wants to serve, to serve first. The best test, and the most difficult to administer, is: Do those serve grow as persons?
3. Research Method
This study uses qualitative research method to generate high quality data to fulfill our research objectives. This research selects 150 respondents from various part of the Muslim world using online interview. We have chosen various types of respondents to represent all classes of people who help us in explaining the causes of the deterioration of quality leadership. Over the years, number of leaders are increasing while number of good leaders are decreasing. In addition, normal people are the one who suffer the consequences of electing the unqualified leaders. Therefore it is very important for us to understand ordinary people views regarding significance of quality leadership to revive the Muslim countries’ economy and politics, in order to implement appropriate solutions. To understand the causes of the deterioration of quality leadership online interview were conducted which helped to investigate the factors of the deterioration of quality leadership. However, the interviews were analyzed to find a pattern of the factors that were divided into 6 groups. Each group represents number of interviewees who have the same opinions regarding the causes of the deterioration of quality leadership and significance of quality leadership to revive the Muslim countries’ economy and politics. A set of interview questions ware sent randomly among the various age group people to know their opinion. The responses were analyzed using content analysis method (qualitative method). Then, the results of content analysis were then coded into several categories. To make sure that the interviewees are the suitable target group to know about quality leadership, they were first asked how often they read newspaper and do they have in-depth idea about quality leadership. The sample included 60 per cent male and

Business and Economic Research ISSN 2162-4860
2014, Vol. 4, No. 1
www.macrothink.org/ber 139
40 per cent female.
4. Findings and Analysis
Based on online interviews, in this section, we present several group of interviewees’ opinions regarding causes of the deterioration of quality leadership and significance of quality leadership to revive the Muslim countries’ economy and politics. Subsequently, the causes of the deterioration of quality leadership can be identified and from there on, several recommendations can be suggested to produce qualified leaders among the citizens.
4.1 Interview Group 1
This group believes that education is the most important tool whose lacking causes in producing unqualified leaders in the most of the country, particularly among Muslim countries. In many instances, leaders are not having necessary education. This results in tendency of being elected unqualified leaders. For example, the possibility of contribution in economic and social development by a person who never goes to school is less than who has basic education. If the candidate is educated he should have the good and better ideas to develop a country. Most of the interviewees think that, there should be a minimum qualification to enter politics. The politicians are the ones who can act like a brain for the country. Even for basic jobs, the companies are checking if the candidate has knowledge and capabilities to perform his responsibilities. Therefore, it should be mandatory to should have knowledge and graduation in specific domain since that person will represent the country/state/constituency and in a position to plan, take reasonable and intelligent decisions. There are many leaders who have no proper educational background but still occupies powerful position. Education is certainly the backbone of anyone who is interested to serve the country and holds the most important position in running the government. Due to the lack of education, corruption is deep rooted in most of the system which stop development of the country. It’s not that ones who are educated are not corrupted but still educational background helps one to speak against corruption. The multi party system is certainly a curse for the democracy which has helped in increasing corruption and inclusion of leader who do not have proper educational background. This group emphasized the importance of educational qualification to avoid the unqualified leaders for other reasons than what has been agreed upon. They believe that most of the Muslim countries are economically backward and politically unstable due to lack of quality leaders. They also mentioned that Muslim world’s downturns are also caused by the unskilled leaders.
4.2 Interview Group 2
The second interview group believes that a leader must be honest. Although they have mentioned about necessity of basic educational qualification but they think that the main traits that a political leader should have is honesty to face challenging situations for the welfare of the society. They claim that most of the leaders mainly work for their own development rather than country’s development. In addition, they also think that education play only 30% role in producing highly qualified leaders and rest 70% are contributed by sincerity, honesty, dedication towards the work, understanding the situations, facing the

Business and Economic Research ISSN 2162-4860
2014, Vol. 4, No. 1
www.macrothink.org/ber 140
situations. These are very important qualities a leader should have. Furthermore, they think that, the people should be honest too to choose the right leader to rule the country. This group thinks that the cause of deterioration of quality leadership is dishonesty. Most of the leaders are running for power and to serve their personal interest. Due to lack of honesty they become bias in decision making. In addition, many of the leaders are highly qualified but still corrupted. They are facing more problems related to scams, black money-hoarding, illegal sexual relationship and many more. If the leader has ability to read, understand and have strong leadership qualities along with honesty it is more than enough. As a leader, one should not be greedy. Each and every politician must strive hard to be honest throughout his life.
4.3 Interview Group 3
A group of interviewees think that a true leader need not to be educated but should be honest, full of zeal and enthusiasm and willingness to serve in true spirit. For instance, Akbar, the greatest and powerful Muslim emperor was illiterate. So there is a difference between education and knowledge. A leader must have knowledge which can be possible without acquiring education. Since a leader represents the people so he/she should have the basic knowledge about the society and some good moral values to be able to do justice for everyone. There is a huge difference between the education and the knowledge or wisdom. As we see everywhere that all successful people are not necessarily good at their education. But they are doing better than others due to their in-depth knowledge. Similarly it’s not important for the leaders to have a high education too but must possess ability to face the challenges with his/her knowledge. This group of people thinks that lack of knowledge among the leaders causes the poor performance among the Muslim countries economy.
4.4 Interview Group 4
This group thinks that most of the leaders in the Muslim worlds are not trustworthy which causes the existing problems. Most of the leaders, today, is concern about their source of income and not for development of country because they are not trustworthy. A leader must be very responsible for the country’s development. Most of the Muslim countries’ leaders are not very responsible and trustworthy which causes many several problem problems like poverty, political instability and others.
4.5 Interview group 5
This group of interviewees thinks that erosion of moral values among leaders is contributing to the instability and poor economic performance for many Muslim countries. They also think that lack of family education causes for unqualified leaders. Erosion of moral values among youth (future leader) is contributing to lack of discipline, poor performance in school, general lack of respect to authority, poor self-esteem and others. Many strategies have failed to effectively foster moral growth of youths in educational institutions, including use of literature, art, operationally defining good character, building a universal set of morals and values, and many others. This group believes that “Islamic education in family” can be a fundamental powerful institution to produce future leaders so called youth. They think the main reasons for unqualified leader are lack of Islamic education in family. They also believe

Business and Economic Research ISSN 2162-4860
2014, Vol. 4, No. 1
www.macrothink.org/ber 141
that Islamic education can be a powerful tool for inspiring youth to work for their countries’ economic and societal development.
4.6 Interview Group 6
This group of interviewees believes the deterioration of quality leadership in today’s Muslim world is due to avoidance of Al-Qur'an and As-Sunnah. A leader with good knowledge about Al-Qur'an and As-Sunnah consider himself and all his possessions as belonging to God. He bows his ego, ideas, passions and thinking to God. A leader with a firm believe does not dodge responsibility for his actions, rather continuously emphasize good deeds. To reinforce this idea, the Qur’an emphasizes on believe in God several times. Most of the Muslim countries’ leaders do not possess the characteristics mentioned by the Al-Qur'an and As-Sunnah. Therefore, these countries are not really benefited by them in economically and socially.
4.7 Causes of Deterioration of Quality Leadership
Based on the information of various interviews above, the causes of deterioration of quality leadership are: (i) lack of basic education, (ii) dishonesty, (iii) lack of knowledge and dedication for country’s development, (iv) absence of trustworthiness and responsibility, (v) lack of moral values, and (vi) avoidance of Al-Qur'an and As-Sunnah. These weaknesses exist among leaders, particularly among the developing countries which became obstacle for their development. The following issues contribute to increases the possibility of having unqualified leaders in most of the country.
i. Lack of education: in the absence of basic education, leaders tend to use the power for other reasons than the original purpose that the power were given for.
ii. Dishonesty: lack of honesty is the main source of corruption for a country which creates barriers for the development of a country.
iii. Lack of knowledge and dedication: lack of knowledge which may not necessarily related with education and personal gains are also a source of problem for the countries development.
iv. Absence of trustworthiness and responsibility: irresponsible and lack of accountability of a leader causes political instability for the country. It also creates poverty and increases the gap between reach and poor.
v. Lack of moral values: since the moral values among the young generation (the future leaders) have reduces dramatically, therefore the quality leadership particularly among the Muslims countries are deteriorated.
vi. Avoidance of Al-Qur'an and As-Sunnah: avoidance of Al-Qur'an and As-Sunnah making the leaders dishonest, selfish and injustice which are the main for any country development.

Business and Economic Research ISSN 2162-4860
2014, Vol. 4, No. 1
www.macrothink.org/ber 142
5. Recommendations
5.1 Mandatory Basic Education
To reduce the unqualified leaders, there should be a rule in maintaining a minimum level of academic qualification in order to hold a leading position. Since education enhances knowledge and knowledge is wisdom, educated politician can think smart and work more efficiently for the betterment of the country. Educated leaders are important for the prosperity of a country. They have the ability to think clearly and can face the problems of a country. Educated leaders know the meaning of word (Democracy) so they can make a Democratic country. Education cannot guarantee that an educated leader can do everything but a person administrating such a diversely populated country should have some reasonable educational background as education helps in developing attitudes and manner in life which helps a person( in this case a politician) to adapt to this fast changing world and serve the society in a more appropriate way. Education is certainly the backbone of anyone who is interested to serve the country and holds most of the major jobs of running the government. And because of lack in education corruption is deep rooted in most of the countries’ political system. Some of the educated persons are corrupted as well but still ethical education helps to speak against corruption. The multi-party system is certainly a curse for the democracy which has helped in increasing corruption and inclusion of man who do not have proper educational background. It is not only that the politician should be educated but also the people should be educated. Then only the people can choose the right person to rule the country.
5.2 Introduction of Islamic Family Education
People generally learn the basic knowledge from their family. Now-a-day, in most of the Muslim countries even do not have Islamic family education. Most of the families even in Muslim countries produce unqualified and moral values less young generation. People become more materialistic and only focuses on the instant gain, therefore parents do not bother to teach moral values. Young generation is adopting wrong culture and habits in the name of modernization. As a result, young generations through the world are in danger compare to the couple of decades ago. Since today’s young generation is the leaders for the future so it is very important to introduce Islamic family education to produce good leader. In Islam to serve God, a Muslim leader is to act in accordance with the injunctions of God and His Prophet (saw), and must develop a strong Islamic moral character. This moral character will be reflected by his increasingly strong belief in God as he progresses through 4 stages of spiritual development: Iman, Islam, Taqwa and Ihsan. Usually, a child become good if the family is good without some exceptions. And a family can only be good and happy if there are Islamic values. Therefore, introduction of Islamic family education contributes to produce morally good and skilled leaders.
5.3 Mandatory Depth Knowledge about Al-Qur'an and As-Sunnah
In order to reduce the unqualified leaders it is necessary to make a rule that if anyone one want to be leader he/she must possess in-depth knowledge about Al-Qur'an and As-Sunnah. Since Al-Qur'an and As-Sunnah give knowledge and wisdom. A leader with good knowledge

Business and Economic Research ISSN 2162-4860
2014, Vol. 4, No. 1
www.macrothink.org/ber 143
about Al-Qur'an and As-Sunnah consider himself and all his possessions as belonging to God. Most of the Muslim countries leaders do even not possess the characteristics mentioned by the Al-Qur'an and As-Sunnah. Therefore, we must make sure that the leaders have adequate knowledge about Al-Qur'an and As-Sunnah which help to produce quality leadership.
5.4 Leadership Training
The training is very important to produce a quality leader. It can be done through camp, campaign, conferences and others. Current education system has less application of subjects where there is a very minimum opportunity of developing leadership skills. Therefore, proper Islamic leadership training can be a good source to produce quality leaders who have basic education with in-depth knowledge about Al-Qur'an and good family background.
5.5 Establishment Islamic Institutions
One of the major sources of quality leaders can be the Islamic institutions. These institutions provide both if Islamic knowledge and conventional knowledge. The former helps to produce morality and ethics of leaders and the later equip with modern knowledge to lead and develop the country by competing others countries of the world. In the recent world knowledge is the most powerful weapon to fight and survive. Therefore a leader must be knowledgeable to carry forward the country in which the Islamic institutions can play the key contributions.
5.6 Improvement of Followers’ Characteristics
Follower characteristics are also important factors in producing quality leadership. Just as in the case of their leader, the characteristics of Muslim followers affect their behavior. Therefore, the followers must possess good qualities which help to produce good leaders. Although some people think that if the leader is good then people would be good which is true but if most of the people are not good then how the good leaders would be elected, for instance in a demotic country. Therefore, a good follower is very important element to produce quality leader.
6. Conclusion
A leader is not only defined as a president, or, prime minister, or religious leaders rather this term represents many matters in leading. For example, every individual is a leader for himself or herself, a parent is the leader for their families, and a teacher is the leader for their students, an imam is the leader for certain community and others. All these leaders have their own role, obligation and responsibilities. If they fulfill their task honestly and perfectly, then the country will be developed and will prevail peace and harmony. A leader has difficult and broad responsibilities towards the people. Erosion of moral values among leaders in all over the world became a great concern among the people. Lack of basic education, honesty, knowledge and dedication for country’s development, absence of trustworthiness and responsibility, lack of moral values, and avoidance of Al-Qur'an and As-Sunnah are the causes of deterioration of quality leadership.These weaknesses are existing among leaders, particularly among the developing countries leaders and its became obstacle for their development. The lack of unity among the Muslim countries leaders became the barrier for

Business and Economic Research ISSN 2162-4860
2014, Vol. 4, No. 1
www.macrothink.org/ber 144
unifying the Muslim Ummah. Therefore, each individual, family, society, government, Islamic Institution and NGOs should contribute in producing quality leadership skills among the citizens.
References
Al-Buraey, M. (1985). Administrative Development: An Islamic Perspective. London, UK: KPI.
Blondel, J. (1987). Political leadership: towards a general analysis. London: Sage Publications.
Brown, L., & Conrad, D. A. (2007). School leadership in Trinidad and Tobago: The challenge of context. Comparative Education Review, 51(2), 181-201. http://dx.doi.org/10.1086/512021
Butterfield, H. (1931). The Whig Interpretation of History. London: G. Bell and Sons. Computers
Easterly, W., Kremer, M., Pritchett, L., & Summers, L. H. (1993). Good policy or good luck?. Journal of Monetary Economics, 32(3), 459-483. http://dx.doi.org/10.1016/0304-3932(93)90026-C
Fair, R. C. (1978). The effect of economic events on votes for president. The Review of Economics and Statistics, 60(2), 159-173. http://dx.doi.org/10.2307/1924969
Faqih, I. (1988). Glimpses of Islamic History. Delhi, India: Adam Publishers and Distributors.
Feigenbaum, A.V. (2007). The international growth of quality. Quality Progress, 40(2), 36-40.
French Jr, J. R., & Raven, B. (1959). The bases of social power.
Greenleaf, R. K. (1973). The servant as leader. Center for Applied Studies.
Hamilton, B. A. (2003). Assessment of Leadership Attitudes about the Baldrige National Quality Program. Malcolm Baldrige National Quality Program, National Institute of Standards and Technology, Gaithersburg, MD.
Hausmann, R., Pritchett, L., & Rodrik, D. (2005). Growth accelerations. Journal of Economic Growth, 10(4), 303-329. http://dx.doi.org/10.1007/s10887-005-4712-0
Haykal, M. H. (1976). The Life of Muhammad (saw). Indianapolis: IN, American Trust Publications.
Hollander, E. P. (1978). Leadership Dynamics. New York: Free Press.
Horner, M. (1997). Leadership theory: past, present and future. Team Performance Management, 3(4), 270-287. http://dx.doi.org/10.1108/13527599710195402
ISEC. (2005). Karnataka Development Report, Bangalore.
Islamic Scholar Software. Mishkat Al-Masabih. (1996) South Africa: Johannesburg: Par Excellence.
Islamic Scholar Software. Sahih Bukhari. (1996) South Africa: Johannesburg: Par Excellence
Business and Economic Research ISSN 2162-4860
2014, Vol. 4, No. 1
www.macrothink.org/ber 145
Computers.
Islamic Scholar Software. Sahih Muslim. (1996) South Africa: Johannesburg: Par Excellence Computers.
Jones, B. F. (2009). National leadership and economic growth. The New Palgrave Dictionary of Economics.
Jones, B. F., & Olken, B. A. (2005). Do leaders matter? National leadership and growth since World War II. The Quarterly Journal of Economics, 120(3), 835-864.
Kaufmann, D., Kraay, A., & Lobaton, P. Z. (2002). Governance matters II: updated indicators for 2000-01 (Vol. 2772). World Bank-free PDF.
Kirkpatrick, S. A., & Locke, E. A. (1996). Direct and indirect effects of three core charismatic leadership components on performance and attitudes. Journal of Applied Psychology, 81(1), 36. http://dx.doi.org/10.1037/0021-9010.81.1.36
Leu, E., & Price-Rom, A. (2006). Quality of education and teacher learning: A review of the literature. Washington, DC: USAID Educational Quality Improvement Project, 1.
Londregan, J. B., & Poole, K. T. (1990). Poverty, the coup trap, and the seizure of executive power. World politics, 42(2), 151-183. http://dx.doi.org/10.2307/2010462
Muganda, A. (2004, May). Tanzania’s Economic Reforms and Lessons Learned. In Scaling Up Poverty Reduction: A Global Learning Process and Conference. Shanghai.
Ngowi H. P. (2002). The Role of Foreign Direct Investments (FDIs) I Host Economies: A Focus on Tanzania. Unpublished, All But DissertationThesis. Norwegian School of Economics and Business Administration
Oduro, G. K., & MacBeath, J. (2003). Traditions and tensions in leadership: the Ghanaian experience. Cambridge Journal of Education, 33(3), 441-455. http://dx.doi.org/10.1080/0305764032000122050
Randa, J. (1999). Economic Reform and the Stability of the Demand for Money in Tanzania. Journal of African Economies, 8(3), 307-344. http://dx.doi.org/10.1093/jae/8.3.307
Samoff J, Graham JD. (1975). Tanzania: Local Politics and the Structure of Power. Int. J. Afr. Hist. Stud. Book Review. 8(3), 483-483. http://dx.doi.org/10.2307/217168
Soanes, C. & Stevenson, A. (2003). Eds. Oxford Dictionary of English Guruswamy.Social Power. Ann Arbor, Mich.: University of Michigan, 150-167.
Thimmaiah, G., & Aziz, A. (1983). The political economy of land reforms. Ashish Publishing House.
Watanabe, T. (2004). I Prologue. Japanese Views on Economic Development: Diverse Paths to the Market, 186.
Wolfers, J. (2002). Are voters rational? Evidence from gubernatorial elections. Graduate

Business and Economic Research ISSN 2162-4860
2014, Vol. 4, No. 1
www.macrothink.org/ber 146
School of Business, Stanford University.
Copyright Disclaimer
Copyright reserved by the author(s).
This article is an open-access article distributed under the terms and conditions of the Creative Commons Attribution license (http://creativecommons.org/licenses/by/3.0/).
Business and Economic Research ISSN 2162-4860
2014, Vol. 4, No. 1
www.macrothink.org/ber 147
Personal Attributes and Motivation of Female Micro-Entrepreneurs in Ghana: A Case of Fishmongers
in Central Region
Christina Boateng
Department of Vocational Technical Education and Training
University of Cape Coast, Cape Coast, Ghana
Tel: 233-262-838-004 E-mail: [email protected]
Received: August 14, 2013 Accepted: August 30, 2013
doi:10.5296/ber.v4i1.4114 URL: http://dx.doi.org/10.5296/ber.v4i1.4114
Abstract
The research was carried out among women micro entrepreneurs who engage in fish mongering, one of the well known entrepreneurial activities of women in Ghana. The purpose of the study was to explore the personal and business characteristics as well as the motives behind the women’s entrepreneurial activities to provide a baseline data based on which policy and support programs could be devised to aid women’s economic development. The study revealed that majority of women fishmongers had an average age of 42 years old, were married with large families; had no formal education but had acquired training for their businesses through apprenticeship. The study also revealed that majority of the women had received start –up capital from family members as gift and have been able to build up sizable businesses through which they are able to employ other people, cater for their families and reinvest. They do have a positive attitude for their businesses and therefore employ several strategies to maximize their profits. The study further identified family circumstances and economic pressure, economic independence, and need for social recognition as the motives for their entrepreneurial activities. The study therefore concludes that the women’s participation and performance in entrepreneurial activities are stimulated and shaped by socio-cultural, and socio- economic factors. As such, any intervention programs and policies for the entrepreneurial development of these particular women should take into consideration their identified characteristics and the unique impart they have on women’s entrepreneurial behaviors.
Keywords: Entrepreneurship, Micro entrepreneurs, Women entrepreneurs, Micro-enterprise, Fishmongers, Fish mongering
Business and Economic Research ISSN 2162-4860
2014, Vol. 4, No. 1
www.macrothink.org/ber 148
1. Introduction
Entrepreneurship is a major catalyst for economic growth, productivity, and development in both industrialized and developing countries. History has shown that entrepreneurs establish new businesses that create employment and provide services and products to increase the wealth of their local and national economies. Nevertheless, a significant number of enterprises were owned by men; and the idea and practice of women entrepreneurship is a recent phenomenon. The International Labor Organization, ILO (2006) reported that women entrepreneurship and women owned and run organizations was the development of the 1980s when recognition that women’s economic empowerment is one avenue for reducing poverty and spurring economic growth and development occurred.
Female entrepreneurship and women entrepreneurs have since the 1980s been on the rise. There are a number of women entrepreneurs in business now. However, studies have shown that most of them are found in Small and Medium Enterprises (Global Entrepreneurship Monitor (GEM), 2003). The case of Africa is no different where women play a more limited role as owners and managers in the formal sector (Acs, 2007). In sub- Saharan African economies, it is reported that women are highly represented in the micro and small enterprises sub-sector where they engage in small income generating self-employment in agriculture and non-agricultural activities. About 84% of women are informally employed, as compared to 63 % of men in these countries (Spring, 2009). In Ghana, in particular, women are holding their own in entrepreneurship and economic participation. They constitute about half of the entire labor force operating mostly in the informal economy where they outnumber men, and are particularly involved in various micro-enterprises and retail trade and are contributing to national output growth even though this is often not measured (International Financial Corporation , 2007).
With the realization of the importance of Ghanaian women’s involvement in the micro enterprise sector and their contribution to the growth of the economy, government, donor agencies, non-governmental agencies and other women organization have put in place programs and projects to help women realize their full potential. For example in 2012, Hunger Project – Ghana through its Microfinance Program disbursed over $300,000 to women micro entrepreneurs in the Eastern Region of Ghana (The Hunger Project - Ghana, 2013). In 2007, the (IFC) reported that in Ghana there is limited information and empirical evidence on the informal sector and those subsectors of the economy in which women predominate. However, without information, there cannot be better focused, more effective or relevant policy and program development that will enable women take advantage of entrepreneurial opportunities to expand and achieve their fullest economic potential. This study was directed towards finding out about the personal characteristics and motivation of the women who operate as micro entrepreneurs in the informal sector of the Ghanaian economy and how these characteristics affect their entrepreneurial activities and behaviors. It is expected that the result of the study will inform the design and development of appropriate assistance programs and policies geared towards enhancing women’s entrepreneurial activities and economic empowerment.

Business and Economic Research ISSN 2162-4860
2014, Vol. 4, No. 1
www.macrothink.org/ber 149
2. Women in Entrepreneurship
There is empirical evidence suggesting that entrepreneurship generally, and women entrepreneurship specifically, contributes in various ways to economic development and poverty reduction of nations as they help to reduce unemployment and create wealth. This has raised the profile and the importance of entrepreneurship especially in developing countries. In spite of this, entrepreneurship has been described as a complex and multifaceted phenomenon affected by culture and social traditions (Minniti and Arenius, 2003). This means that cultural and social factors play a large role in determining who within a society becomes an entrepreneur. For example, social conditions in some societies inhibit women from starting their own businesses.
Minniti and Arenius (2003) also reported that women entrepreneurship is a cross-cultural phenomenon with culture specific aspects including two different components. The first component is that there are variables (i.e. age, education, perceived skills, and social network) that influence entrepreneurial behavior across countries and across gender. Thus, there are universal variables, which affect both sexes but not necessarily in the same way or with the same intensity. This implies that women and men are influenced by many of the same variables when making entrepreneurial decisions. However, the fact that male entrepreneurship rates are systematically and significantly higher than female entrepreneurship rates all over the world indicates an unevenness of universal factors across the sexes that may cause men and women to behave differently with respect to entrepreneurship.
There have been several studies supporting this view. OECD (1998) reported that women entrepreneurs are overrepresented in the retail- and service sectors, in particular, in personal services while male entrepreneurs are overrepresented in manufacturing, wholesale trade and financial services. Again, Van Uxem and Bais (1996) had found that even within sectors, women entrepreneurs are often found in supporting jobs or occupations. Moreover, they found that women value their own entrepreneurial characteristics lower than men although the difference with respect to entrepreneurial characteristics was rather small. Thus men put a higher value on perseverance and risk and a lower value on autonomy and change than women do. This is the case especially with regard to taking risk, industry knowledge and technological knowledge. This lack of confidence of women entrepreneurs in their own entrepreneurial capabilities has been attributed to a relatively negative self-perception, which has resulted largely from social and cultural factors (Hofstedein 1991). Also, in 2001, Verheul and Thurik reported that men and women entrepreneurs are very prevalent in two distinct sectors: the formal or traditional mainstream sector, and the informal or marginalized sector respectively. They further concluded that men and women may differ with respect to the sector they work in, their background and experience, the size of their enterprises, etc. because their societal opportunities are unevenly distributed or because of differences in heir upbringing.
Differences in the entrepreneurship behavior of men and women have also been observed on the bases of how much time they devote to entrepreneurial activities. Men have been reported to work more often on a full-time basis when compared to women (OECD, 1998). More than half of enterprising women carry out other activities besides running their own businesses,

Business and Economic Research ISSN 2162-4860
2014, Vol. 4, No. 1
www.macrothink.org/ber 150
such as taking care of families and doing other household activities (Stigter, 1999) Thus, women entrepreneurs are said to have “double assignments”; i.e. they are running enterprises and households at the same time. These “double assignments” may limit the time women entrepreneurs spend on their businesses, thus, affecting their output as entrepreneurs.
The second component of entrepreneurial inclinations outline by Minniti and Arenius (2003) is the idea that entrepreneurial behavior is country - specific. From a comparative study of female Total Entrepreneurial Activity (TEA) index conducted in 37 countries in 2002, participation of women in entrepreneurship varies significantly across the 37 countries, ranging from 0.6 percent (6 per 1,000) in Japan to 18.5 percent (185 per 1,000) in Thailand (Reynolds, Hay, Camp, and Autio, 2002). It is country-specific characteristics that determine the differences in prevalence rates for women entrepreneurship across countries.
2.1 Profile of African Women Entrepreneurs
There have been several studies associating African women business owners with informal and part-time operations. African women have not been considered “real” entrepreneurs but “pushed into” business as a “no choice” option for escaping from poverty (Zewde& Associates, 2002). They have therefore been referred to as “lifestyle” entrepreneurs (OECD, 2004; Hall, 2003).This has consequently become the de facto profile of women entrepreneurs in Africa. Secondary research in three countries of Ethiopia, Tanzania andZambia, conducted by Richardson, Howarth& Finnegan in 2004 identified African women entrepreneurs as follows;
a) Women who are poor, have few if any of their own assets, and have limited means of accessing such resources from others.
b) Women who have low levels of formal education at best, but are more likely to have had no formal education, to be illiterate and in general have limited human assets.
c) Women who have limited or no experience of formal employment and business. d) Women who have limited business and managerial experience prior to start-up. e) Women who have limited networks especially business-related networks. f) Women who are not highly or positively motivated towards business ownership.
Whilst these characteristics define women entrepreneurs in Africa, there is the need to examine the prevalence of this profile in the face of the assertion that women entrepreneurship is affected by socio-cultural factors ; so that a better understanding of women entrepreneurship in specific countries could be developed.
2.2 Why Women Start Businesses
Some researches have labeled women as having inappropriate attitudes towards business (ODEC, 2002). However, the field research conducted in Ethiopia, Tanzania and Zambia revealed that most of the women are very committed to their businesses, and have clear plans for further developing their businesses (Richardson, Howarth and Finnegan, 2004). In all three countries, the majority of the women entrepreneurs interviewed had been the sole or primary drivers for starting their businesses. In terms of motivation for start-up, the women entrepreneurs reported having a range of reasons for choosing to start their own businesses. The study revealed the desire to be self-employed and independent and the need for income as

Business and Economic Research ISSN 2162-4860
2014, Vol. 4, No. 1
www.macrothink.org/ber 151
the main drivers for Ethiopian and Tanzanian women. In Zambia, there was greater emphasis on income generation. Another study by Jalbert (2000) revealed that women’s motivations for starting businesses are related to their need to be independent, achieve job satisfaction, attain personal accomplishment and fulfillment, and be creative and economically self-sufficient. Again, Moore and Buttner (1997) had earlier suggested that women started their own businesses from a desire for self-determination and for career challenge, and that they expect the corresponding respect, recognition, and self-esteem that both self-determination and challenge provide.
The preceding presentation confirms the need to construct a very comprehensive profile of women entrepreneurs by any agency interested in providing an environment in which women entrepreneurship is to flourish.
3. Methodology
This study employed a case study approach to explore, identify and generate as much knowledge as possible about the population as a social group. The population was made up of fishmongers from the Central Region of Ghana. One Hundred and twenty women were purposively selected from ten villages and communities where fishing expedition is done commercially and fish mongering is more brisk and perennial. The criterion for inclusion in the sample was business ownership. The sampling was done with the help and assistance of the Community Development Units in the fishing communities. Data was collected by a team of four using in-depth face-to- face interview method over a period of two months from mid -January to mid- March 2013. The interview schedule constructed for the data collection had three main sections. The first section had items to gather information on the socio-economic characteristics of the entrepreneurs, the second section had items on their business characteristics and the third had items covering the motive behind their entrepreneurial behavior. The data collected was analyzed using Microsoft Excel and interpreted using descriptive statistics such as percentages and frequencies. Conclusions were drawn based on the results.
4. Results and Discussion
4.1 Demographic Characteristics
The women entrepreneurs interviewed came from varying age groups. Their ages ranged between 29 and 79 years with an average age of 42 years. This does not suggest that younger women are not involved in fishing processing and distribution. It was realized that younger women are very much interested in fish mongering and are involved as apprentices or helps in the business operations of their mothers or other female relatives and would establish their own businesses when they get the resources. Considering the average age of the respondents and the fact that many of them had been involved in the business as helps and apprentices before owning their own operations suggest they have had enough time to acquire some entrepreneurial skills and business acumen they need in operating their own businesses.
The study established that majority of the respondents (90%) were married and had large families. The 10% who had no husbands were made up of widows and divorcees who

Business and Economic Research ISSN 2162-4860
2014, Vol. 4, No. 1
www.macrothink.org/ber 152
considered themselves too old to re-marry. There are two main reasons for the high representation of married women among the respondents. The first reason is that they live in a society where high status is attached to marriage and having children. Again, by the socialization process of women in this society, they are expected to adopt and conform to the socio-cultural systems and therefore tend to be married and have children. A second reason that explains the finding is that the women tend to marry hoping that their husbands will support them in the upbringing and upkeep of their children, or hoping that through their husbands, they can get access to resources and the right socio-economic linkages that could enable them make a viable career as fishmongers.
The implication of their marital and parental on their businesses is that they have to combine their roles as business owners with those as mothers and wives , and this can affect their business operations. For example, this may restrict their scale of operation since they have to spend time catering for their families.
The women in the study had an average of seven children. This exceeds the national average number of children per woman in Ghana, which was reported as 4.17(Ghana Statistical Services, 2012). In addition to their own children, all the women interviewed lived with and catered for other people ( dependents) within their households. These dependents included grandchildren, younger siblings, nieces, nephew, in-laws, house helps as well as parents. The dependents and the biological children al , shared the same house – keeping arrangement and are catered for as one unit by the entrepreneur. They may in one way or the other be involved in the business but are not paid wages. In return, they are dependent on the entrepreneur for their livelihood. The study also showed that the number of dependents they support ranges from 1-18 persons with a mean range of 7-10 people. The study also showed that about 77% of the entrepreneurs were the sole financial supporters for the members of their households. The other 23% of the entrepreneurs receive assistance from other members of the family such as husbands and older children especially sons to take care of the household. The financial responsibilities of the entrepreneurs enumerated included feeding, clothing, housing and utility, medical bills and school fees.
The large number of children and other dependents has some repercussions on the businesses run by the women. On one hand, the fact that the women contributed immensely to the household expenditure suggest that with the large family size, much of their income from their businesses is used to cater for the needs of their households rather than for reinvestment. They also have to spend time and energy fulfilling their reproductive roles. This may constrain their finances, time and mobility. On the other hand, the children and other family members provide practical support for the business. In many cases, large family size means large labor force for the women and thus a large scale of operation and turn over. Therefore, large family sizes are social assets and valuable resources for the entrepreneurial activities of the women but could also affect the growth of their businesses.
4.2 Human Capital
Lack of formal education is often quoted as a factor limiting the development of women as entrepreneurs and contributing to their lack of access to resources. The study found that 89% of

Business and Economic Research ISSN 2162-4860
2014, Vol. 4, No. 1
www.macrothink.org/ber 153
the women had no formal education. The 11% who had formal education were made up of 4% who had completed primary school and 7% who had up to middle school level (elementary school) education. This is far lower than the national literacy rate of 65% among females in Ghana. However, all of them have had full time apprenticeship training in the business. The women had explained that their parents had considered it very important for daughters to understudy their mothers and other female relatives in their vocations rather than spending years in the formal school system trying to acquire skills for work. One could think of one reason why fisher folks keep their daughters out of formal schooling. It is their way of ensuring that their indigenous system of skills transmission from generation to generation - apprenticeship- does not loose grounds. This is because it is their belief that when girls participate in formal education, they spend more time in school and less time working with their mothers in their businesses, which inevitably disrupt the system of transmission of skills from mothers to daughters. Furthermore, keeping girls out of formal schooling is their way of ensuring that they stay and work with their mothers as fishmongers when they grow up because their knowledge and experience is restricted to that business alone. This confirms an earlier finding by Coquery-Vidrovitch (1997) that uneducated daughters often have limited job opportunities options; and are restricted to stay in the same businesses as their mothers.
In spite of the benefit of full-time apprenticeship, which is essential for self-employment, it was observed that lack of formal education might pose a problem to the operation of the women as entrepreneurs. For example, it was found out that the women did not keep any written records of their business operations and transactions mostly because they cannot write. Again, they do not use any modern instruments such as calculators or weighing scales. They tend to do all calculations mentally. This is usually not possible especially where large sums of money or quantities of fish are involved. It was not surprising that some respondents intimated that they do not know how much money is involved in their businesses or what their turnovers were. The implication of this status on the women as entrepreneurs is that they would have to stay within a certain turnover where they could keep every bit of their transaction in their memory, something that affects the growth and expansion of their businesses.
The research also dealt with the occupational history of the women. It was found out that 67% of them had never engaged in any other type of occupation before. The 33% who had tried other occupations before were actually involved in other entrepreneurial activities. Such activities included petty trading, baking, sale of foodstuff, sale of firewood, sale of cooked food and preparation of oil. The research further revealed that out of the 33%, only 8 % were still operating the other businesses together with fish mongering. The rest had stopped and were solely in fish processing for various reasons. Some of the reasons they enumerated were: their perception that fish mongering was more lucrative than any other business in the study area; all other businesses are dependent on the prospects of fishing in the study area; the seasonal demand for the wares of other businesses and relocation into the study area where fish mongering is prevalent. Those who still combine fish mongering with other businesses sell cooked food, foodstuff and firewood. They added that they maintain them as secondary or subsidiary to fish mongering.

Business and Economic Research ISSN 2162-4860
2014, Vol. 4, No. 1
www.macrothink.org/ber 154
4.3 Business Characteristics
Issues such as how women start and operate their enterprises, sources of their start –up capital, how and the extent of capital accumulation, profit, investment behavior and others need to be considered if women operating micro-enterprises are to be considered as entrepreneurs so that aid programs to owner - managers of firms could be extended to cover them.
4.3.1 Source and Size of Start- Up Capital
Surveys that have been carried out among women micro entrepreneurs demonstrate that they tap several sources of start-up capital. This study established that the fishmongers generated their start-up capital from varied sources with gifts from mothers and grandmothers as the most popular. Majority of them (61%) received their start-up capital as gift from their mothers and grandmothers as gifts. They intimated that they had worked as apprentices with their mothers and grandmothers when they were young without being paid. As they approached adulthood, the mothers and grandmothers would save some amount of money at the end of every fishing season towards building up an initial capital for the daughters and granddaughters. It was found out that if a young woman worked faithfully until this stage, the mother becomes obliged to provide her with initial capital to start and operate her own business. Apart from mothers and grandmothers, a smaller number of the women (10%) also obtained start-up capital from other relatives such as aunts, in-laws, husbands and brothers.
The study also revealed that a good number of the women (29%) had started their businesses without any capital. It was found out that it was common practice for the fishing vessels to operate continuously for three to four months before the crewmembers take stock of their operation. It is at this time that financial accounts are rendered to the crew and the owner of the vessel; and any remuneration made to the crew. Therefore, within this period, the fishmongers can buy the fish on credit, process, sell and reinvest the money until it is time for stock to be taken. The women are then served notices to settle their debts. The problem the women who started without capital encountered according to them was that they mostly had to buy the fish at a price higher than those who buy with cash.
None of the women in the study had started their business with a loan from either relatives or institutional bank. Even though some of the women admitted having benefitted from institutional credit, they had enjoyed that facility only after the start-up period.
There were varying responses as to the size of their initial capital. The most experienced fishmonger interviewed (over forty years as a fishmonger) started her business with an initial amount equivalent to about $0.10 US while the least experienced (two years as a fishmonger) started with an amount equivalent to $ 100.00 US. The women mentioned that even though the modest amount of initial capital sometimes affected their scale of operation and turnover at the onset of their operation, it does not restrict their success in the business.
4.3.2 Employment Creation and Remuneration
All the women said they employed other people to help with the business. They use both family and hired labor. None of them relied on communal labor. The study revealed labor could be

Business and Economic Research ISSN 2162-4860
2014, Vol. 4, No. 1
www.macrothink.org/ber 155
engaged either temporary or permanently; temporary labor, mostly hired, is used to carrying the fish from the landing beaches to the processing sheds for processing and for loading processed fish unto trucks bound for the market. Permanent labor however, is used for the actual processing of the fish and for marketing. This could be hired or family labor. The women studied employed between four and twenty persons depending on the size of their operation. This means that the women’s business activities creates gainful employment for other people and contributes to the economic growth and development of their communities.
The mode of remuneration as gathered by the study depends on whether the employee is permanent or temporary. Temporary employees, mainly males, are paid wages on daily bases or on completion of a contract job. For permanent employees, who are mostly females, it again depends on whether the person provides family or hired labor. Remuneration for family labor is based on the profit or loss sharing system. In this system, what the employee receives is dependent on how much profit the employer makes. That is, the employer, usually a female relative provides the financial needs of the employee depending on how much they earn from the business until the employee reaches adulthood and ready to be independent. At this stage the employer now fulfills her obligation of providing her with “eguatsir” (start -up capital) to start her own business. Remuneration for hired labor on the other hand is fixed through negotiation between the employer and the employee before the start of work. However, it generally consist of pieces of cloths, head gears, cooking utensils, toiletries, sandals and an amount of money; and its payable on a yearly basis.
4.3.3 Scale of Turnover and Profits
The information gathered from the study could not be used to estimate how much profit the women made for the following reasons:
� The women do not keep written records of their business transactions � They keep their personal accounts and business account together � They do not account for the portion of income from the business that is spent on
meeting their financial needs and the needs of their families � They do not cost the large quantities of fish that is used off their stock for home
consumption throughout the year. � Some of the women were hesitant discussing finances and financial aspect of their
business.
However, there was no doubt that that women made profit from their businesses considering the extent of growth and investment they have made and their declaration that they depend solely on their business to satisfy all their financial obligations. They shared that one can achieve great turnover and a good profit margin by applying the following strategies:
� Processing the fish before disposing of it rather selling it fresh to other women � Smoking the fish very dry and storing it till the lean season( March – May) when
prices are at their peak � Buying and storing large quantities of fish during the bumper season (June-
October/September).

Business and Economic Research ISSN 2162-4860
2014, Vol. 4, No. 1
www.macrothink.org/ber 156
� Sending the processed fish to the inland market centers for sale � Establishing good social networks that help in getting access to the right to buy fish
from canoes or crews and short- term credit sales. � Offering short- term loans to fishing crews and negotiating to receive payment in the
form of fish until the loan is repaid.
4.3.4 Business Growth, Expansion and Re-Investments
All the women had been able to increase the size of their capital and their operation since its inception. The women who started with gift money had added to their initial capital and those who had started on credit had managed to build up a sizable working capital. As at the beginning of the 2012 bumper season, 53 % of the women had working capital ranging from GHS 200.00 to GHS 4,000.00 ($ 100. 00 - $2000. 00 US). The study revealed that it was common practice for fishmongers to allocate a portion of their yearly “profit” for re-investment. The researcher saw the “profit” as described by the women as the extra money on their circulating capital at the time of taking stock of their business, which usually occur during the lean season. This is irrespective of how much of their income has been spent on the financial needs of themselves and their families. Aside of operating capital, the women had also invested in ovens, smokers, trays, enamel head pans and basins, firewood, processing shed, processed fish and storage baskets and other structures.
The study further showed that fishmongers who are more successful had come to penetrate other segments of the fishing industry as a means of expanding their operations. Information gathered showed that about 15 % of the respondents owned fishing boats, canoes and nets. By so doing they assure themselves of a steady supply of fresh fish all year round. Again 22% of the respondent had sales representatives and agents in the major market centers of the country who receive and distribute processed fish on their behalf for commission, while they concentrate on the actual processing of the fish. There were also respondents who had purchased trucks used in travelling to other fishing towns to purchase fresh fish for processing and to transport processed fish to the markets. These suggest that the micro entrepreneurs are able to broaden their range of operations. They attributed the growth to the business itself, thus, they had acquired all that with money from the fish mongering business.
The study also showed that after the women had accumulated sufficient capital, they would normally withdraw a portion of their earnings from the business and invest elsewhere. The study showed that 20% of the respondents had put up completed houses out of their earnings from their fish processing business and 37% have uncompleted houses. The respondents said they see shelter as a natural need for themselves and their families. At the same time, the houses are status symbol in their communities. Apart from that, it was observed that the houses served as the workshops for their businesses. It is in these same houses that they had built ovens, smokers and storage facilities for their operations and it is from here that they organize their employees to do the work of washing, smoking, packaging, storing, and distributing their products.
It was realized that there had been a substantial increase in the value of their businesses considering the size of their start-up capital. The revelation the women have a system in place

Business and Economic Research ISSN 2162-4860
2014, Vol. 4, No. 1
www.macrothink.org/ber 157
to plough back profit means they have a positive attitude towards the growth of their business. However, it was obvious that the amount of money the women allocate for investment in the business is highly dependent on the financial obligations of the women towards their families. This implies that more money is invested in the business if financial obligations of the women towards her family are lower and vice versa.
4.4 Motivating Factors
The study identified four main motivational factors reasons for the women’s involvement in fish mongering business. About 65% of the respondents were motivated by family circumstances and economic pressures to engage in fish mongering as a business. They shared that their children had been the driving force behind their businesses. They have to work to be able to meet the financial needs of the families. They had participated as apprentices in fish mongering when they were growing up. This was part of their upbringing and general preparation for adulthood and motherhood. Through this, they had acquired the technical and business skills, which they had readily put into practice when it came time for them to fulfill their social expectation of contributing to their households’ expenditure.
Another 20% of the women had started their businesses because they wanted to be economically independent and not be a financial burden on other people. They said even though they had started by working with relatives, it became obvious as they grew up that they could not depend on these relatives for everything they needed. They therefore initiated their own businesses to be able to meet their financial needs. They see their businesses as a source of financial security and as a means by which they can establish themselves in the society and earn the opportunity to manage their own affairs. They therefore attach very high value to it.
Additional 11.6 % of the women explained they had entered the business to improve their socio- economic status in their societies. They explained that fish mongering is one of the lucrative businesses in their communities. All other businesses were dependent on the fishing industry so the women who owned and operated businesses within this industry usually are able to earn higher income than women in other trades. Therefore, fishmongers have a higher social class, and many people went to them for advice and assistance.
A smaller percentage (4.4 %) of the respondents had taken to the business due to certain changes that had occurred in their lives. These life-changing events were enumerated as divorce, death of relatives and relocation into a fishing community. They mentioned that it was the easiest business one could do if you had no capital to start a business, because, one could buy the fresh fish from fishermen on credit.
In fact, the above confirms the finding s by Burke A.E., Fitzroy F.R., Nolan M.A., (2002); Minniti (2003) that women tend to be more sensitive to a variety of non-monetary incentives in their choice to start one business or the other and their choices are often linked to necessity or to time and
location flexibility; for example, to the type of independence that can accommodate family needs and child rearing.
Business and Economic Research ISSN 2162-4860
2014, Vol. 4, No. 1
www.macrothink.org/ber 158
5. Conclusion
The socio-economic characteristics such as age, level of education, marital status, number of children and dependants stimulate and shape the involvement and performance of women in fish mongering as a business. The way they organize to start, and operate their businesses, how they accumulate capital, their investment behavior, their profit making strategies and the facts that by their activities, they are able to offer employment and training to other people suggest that their entrepreneurial activities contribute to the social and economic development of their communities. The fishmongers have started their businesses out of family circumstances, need for economic development, social status and life changing circumstances suggesting that they are necessity entrepreneurs. However, they could be supported to turn into opportunity entrepreneurs through training and interventions. Based on the above, it is recommended that the fishmongers should be educated on the importance of formal education for their daughters. They should be convinced to encourage their daughters to combine formal education and their traditional system of skill acquisition. This will be of some benefit to them and their businesses. The Ministry of Food and Agriculture as well as other agencies who work with the fishmongers should assist them in acquiring basic numeracy and literacy skills since this will enable them operate their businesses more efficiently. There is also the need for the fishmongers to acquire some business skills such as record keeping, bookkeeping and stock taking to protect themselves and their businesses. This could be done through the Non-formal Education Division or the Integrated Community Centers for Employable Skills (ICCES). The District Assemblies could support and encourage the fishmongers to grow and expand their businesses by providing storage facilities in the various fishing communities.
Reference
Acs, Z. J., (2007). How Is Entrepreneurship Good for Economic Growth? Innovations, 1(1), 97-107. http://dx.doi.org/10.1162/itgg.2006.1.1.97
Burke A. E., Fitzroy F. R., & Nolan M. A. (2002). Self-employment wealth and job creation: the roles of gender, non-pecuniary motivation and entrepreneurial ability, Small Business Economics, 19(3), 255-270. http://dx.doi.org/10.1023/A:1019698607772
Buttner, E. H., & Moore, D. P. (1997). Women's organizational exodus to entrepreneurship: Self-reported motivations and correlates with success. Journal of small business management, 35(l), 34-36.
Coquery-Vidrovitch, C. (1997). African women: A modern history. Boulder, CO: Westview Press.
Ghana Statistical Service (2012). 2010 Population & Housing Census. Summary Report of Final Results. Ghana Statistical Service, Accra.
Global Entrepreneurship Monitor (GEM), 2003. Worldwide, One in 11 Women Involved in Entrepreneurial Activity – NWBC Analysis Summarizes Global Entrepreneurship Monitor Findings. Washington, DC.
Hall, Chris (2003): Fostering Entrepreneurship and Firm Creation as a Driver of Growth in a

Business and Economic Research ISSN 2162-4860
2014, Vol. 4, No. 1
www.macrothink.org/ber 159
Global Economy, Background paper commissioned by OECD for the Budapest Workshop on “Entrepreneurship in a Global Economy: Strategic Issues and Policies”, 8-10 September, Budapest, Hungary.
Hofstede, G. (1991). Cultures and Organizations, London: Harper Collins Publishers.
IFC (2007).Voices of Women Entrepreneurs in Ghana. A report prepared by the IFC/World Bank Investment Climate Team for Africa in collaboration with IFC Gender Entrepreneurship Markets (GEM). Johannesburg, South Africa.
ILO (2006). Vulnerability and Young Women Entrepreneurs: A case study of Ethiopian Informal Economy. Geneva: International Labor Organization.
Jalbert, S. E. (2000). Women Enterprise in the Economy. Washington, DC: Centre for International Private Enterprise.
Minniti, M &Arenuis, P. (2003).Women in Entrepreneurship: The Entrepreneurial Advantage of Nations. First Annual Global Entrepreneurship Symposium at United Nations Headquarters, April 29, 2003
OECD (1998).Women Entrepreneurs in Small and Medium Enterprises, Proceedings of OECD Conference 1997, Paris.
OECD (2002). Employment Outlook. OECD, Paris.
OECD (2004).Women’s Entrepreneurship: Issues and Policies (SMEs). OECD, Paris.
Reynolds, P. D., Hay, M., Camp, M. S., & Autio, E. (2002).Global Entrepreneurship Monitor: Executive Report. Kauffman Centre for Entrepreneurial Leadership, Kansas City, MO.
Richardson, P. Howarth, R., & Finnegan (2004). The Challenges of Growing Small Businesses: Insights from Women Entrepreneurs in Africa, SEED Working Paper No. 47
Spring, A. (2009).Empowering women in the African entrepreneurial landscape. In M. Ndulo (Ed.) Power, gender, and social change in Africa and the African Diaspora. Newcastle upon Tyne: Cambridge Scholars.
Stigter, H. W. (1999). VrouwelijkOndernemerschap in Nederland 1994–1997, Zoetermeer: EIM.
THP (2013).Ghana Country Report to the Global Board. The Hunger Project. Retrieved December 17, 2013.
Van Uxem, F. W., & J. Bais (1996). Het starten van eenbedrijf: ervaringen van 2000 Starters, Zoetermeer: EIM.
Verheul, I., & Thurik, R. (2001). Start-Up Capital: Does Gender Matter? Small Business Economics, 16(4), 329-45. http://dx.doi.org/10.1023/A:1011178629240
Zewde & Associates (2002), Jobs, Gender and Small Enterprises in Africa: Women Entrepreneurs in Ethiopia. A Preliminary Report, Geneva: ILO, IFP/SEED-WEDGE

Business and Economic Research ISSN 2162-4860
2014, Vol. 4, No. 1
www.macrothink.org/ber 160
Copyright Disclaimer
Copyright reserved by the author(s).
This article is an open-access article distributed under the terms and conditions of the Creative Commons Attribution license (http://creativecommons.org/licenses/by/3.0/).

Business and Economic Research ISSN 2162-4860
2014, Vol. 4, No. 1
www.macrothink.org/ber 161
Theory and Empirical Evidence on Corporate Governance from Banking Sector of Pakistan
Waqas Tariq (Corresponding Author)
Hailey College of Commerce, University of the Punjab, Lahore, Pakistan
Tel: 92-322-734-0263 E-mail: [email protected]
Imran Ali
Hailey College of Commerce, University of the Punjab, Lahore, Pakistan
Tel: 92-345-443-6600 E-mail: [email protected]
Muhammad Ibrahim
Hailey College of Commerce, University of the Punjab, Lahore, Pakistan
E-mail: [email protected]
Muhammad Asim
Virtual University of Pakistan, Lahore, Pakistan
E-mail: [email protected]
Naeem Ur Rehman
Comsats Institute of Information Technology, Lahore, Pakistan
E-mail: [email protected]
Received: January 21, 2014 Accepted: February 3, 2014
doi:10.5296/ber.v4i1.5180 URL: http://dx.doi.org/10.5296/ber.v4i1.5180
Abstract
Economic system appears to be best if they provide according to what people want. The

Business and Economic Research ISSN 2162-4860
2014, Vol. 4, No. 1
www.macrothink.org/ber 162
purpose of this study is to investigate the effectiveness of corporate governance on financial efficiency of banks in Pakistan. The time period of this study is 2007 to 2012, and sample of 17 listed banks are selected and data is taken from their financial reports from their websites and Lahore Stock Exchange. Financial efficiency is measured by fix& random effects model techniques, for the measurement of dependent variable financial efficiency two proxies return on asset (ROA) and return on equity (ROE) are used. The independent variable includes Board size, Board meeting, Non-Executive directors, Bank size and leverage. The result of this research is consistent with the research conducted on corporate governance that shows significant positive impact on the financial efficiency of the bank. This study is contributed to the literature towards the corporate governance effect on financial performance of banks. Corporate governance provides rules & regulations to monitor and manage bank affairs, and it provide guidelines to board of directors how to run the affairs and how to increase shareholder values and increase bank efficiency. For the calculation of results STATA is used.
Keywords: Financial Efficiency, Corporate Governance, Board of Directors, Banking Sector
1. Introduction
Development of financial sector is necessary for the progress of the economy. It is inter-related with economy growth. It is difficult to attain economic development without efficiently working of financial sector. Banks are the integral part of the financial sector, in order to attain economic prosperity it is essential to develop well organized banking sector. Bank is an institution which deals with deposits, advances and other services. Bank accepts deposits at low rate of interest and lends it at high rate to those who need it. It performs its function efficiently and effectively at every sphere of life, so we cannot deny the importance of banking sector in the progress of the economy. Research on banking sector finds that it enhances economy growth (Levine, 2006).
Banks have important role in growth and development of an economy where it ensures prudent allocation of capital resources and their efficient utilization; whereas it is implausible to work smoothly in modern time without robust banking system (Haque and Tariq, 2012).Pakistan banking had experienced turmoil since the time of independence. At the time of independence it had faced difficulties in the area of resources and funds, trained human resource, uncertain political and economic environments. It faced challenges of nationalization and reforms of The State Bank of Pakistan. The main objective of these operations is to increase the efficiency of banking sector, to improve the governance of banks and to provide services efficiently to all areas of the economy.
The word corporate governance explains the connection among management, board of directors, shareholders and other stakeholder in the company. Corporate governance is basically some rules inspiring the persons to participate actively in the functioning of the corporation provides its full intention to safe organization interests and promotes the net-worth of shareholders.
Corporate governance is defined “as the shareholder whom they invested in the organizations they rely on that they get the greater profit from their investment in the organization” (Shleifer

Business and Economic Research ISSN 2162-4860
2014, Vol. 4, No. 1
www.macrothink.org/ber 163
and Vishny, 1997).
Corporate governance is defined “the organization of rules, regulations and components that prepare actions of the corporations” (Gillan and Starks, 1998).
Corporate governance is defined “the manner through organizations are organized and provide the environment of answer ability to the managers in front of the controller of the organization” (Hussey, 1999).
Importance of corporate governance has increased in the literature and business field after decay of leading corporations like World call, Enron, Lehman Brothers, Merrill Lynch, Barings Bank, ABN Amro and many others. An accurate administration of corporate governance method helps a corporation to pursue opportunities, increases shareholder value and result of these operations improves bank financial efficiency.
Board is the heart of the corporation and its effectiveness is very important for the governance of the corporation. Board that does well and shows effectiveness in monitoring, produces good governance and creates shareholder value. Bank board must evaluate their performance according to the rule of governance. Choe and Lee (2003) argue that composition of board is an essential part of the management to monitor the managers in a better way and lessen the agency cost.
1.1 Significance of the Study
The banking sector role in the progress of the economy cannot overlook. Banking sector financial efficiency has importance for the growth of bank itself, if banking sector performs well than it participates in the growth of the economy. Its failure brings harmful consequences to the progress of the economy. So governance of banking sector has much importance, Board of director plays main role towards the improvement of the governance in the bank.
1.2 Objective of the Study
The objective of study is to know how corporate governance effects financial efficiency of banking sector for the period of 2007-2012. The purpose of this research is to fill the gap which is presented in the literature.
2. Literature Review
Economic system appears to be the best because they provide according to what the people want (Galbraith, 1975). In economic system banking sector is the main stakeholder, in other words backbone of the economy. The governance of banking sector has a focal point for developing countries. In Pakistan corporate governance has become main issue of research. Cheema(2003) states that corporate governance for the development of economy pursue foreign direct investment and mobilize savings through revenue contributed by the corporate governance structure is well matched to the intention of increasing external capital by capital markets. A large number of researchers believe that poor handling of corporate sector becomes the cause of 1997/1998 economic crises (Spremann, 2002; Clarke, 2004; Connelly and Limpaphayom, 2004; Mueller, 2006). Financial crises of East Asian countries become the

Business and Economic Research ISSN 2162-4860
2014, Vol. 4, No. 1
www.macrothink.org/ber 164
significant point for evaluating the corporate governance in developing countries.
Financial efficiency is the main issue for banking sector, if bank performs well than it has financial resources to obtain the corporate goal and to alive the hope of survival in the competitive market. Researchers on the basis of results of empirical findings find the mixed relationship between corporate governance and firm performance (Yermack, 1996; Claessens et al., 2000; Klapper and Love, 2002; Gompers et al., 2003; Black et al., 2003; Anda et al., 2005).Weir et al. (1999) and Bhagat et al. (2000)find a positive relationship between corporate governance and firm performance on the other hand, Albeit et al. (1998) find a negative relationship between corporate governance and firm performance.
Board is the heart of corporate governance because it takes the decision and is responsible for actions which decide the future of corporation (Fama and Jensen, 1983; Finkelstein and Hambrick, 1996; Donaldson, 2003;Gillan, 2006; Yawson, 2006;Adjaoud et al., 2007; Clarke, 2007; Guerra et al., 2009).Ong and Wan (2008) argue that corporate financial performance is the consequenceof practicality presented by the boards. Board of directors is the main body which regulates the internal governace of the corporation. Gillian (2006) found that board is one of the main effective part of inside governance mechanism of the corporation. In the corporation, ownership and control is separate, board has a part of intermediary in the corporation that confines and govern the link between the managers and shareholders (John and Senbet, 1998; Stiles and Taylor, 2001).
Board under the guideline of corporate governance has solved the conflict between manager and shareholder, also improved the bank financial performance and reduced the agency cost. Agency theory examines the role of boards toward the financial performance of corporation which they control (Jackling and Johl, 2009).Size of board has much importance in the corporation because it supervises the management and takes more human capital to advise management (Caprio, Laeven, & Levine, 2007; Andres &Vallelado, 2008). Javid and Iqbal (2008) and Yasser. Enterbang, and Mansor, (2011) find positive relationship between board size and firm efficiency. The findings of Yermack (1996); Eisenberg et al. (1998); Mak and Kusnadi (2004); and Andres et al. (2005) specify that there is negative relationship between board size and firm efficiency.
Board meeting is another variable source used in this study. Conger et al. (1998) describes that to arrange meetings on proper time will increase the accuracy and efficiency of the board. Board has adequate number of meetings in a year to improve the financial efficiency and to increase the value of shareholder. In the US, six meetings in a year in substitute month appear to be good practice for a number of organizations and also contain special meetings (Moore, 2002).Board must meet 4 times in a year; also include executive committee attended by CEO, chairman directors, managers and directors (Ward, 1991).Vefeas (1999) found in his empirical result that numbers of board meetings show a positive link between the board meetings and firm efficiency. Yasser (2011) finds the negative link between board meetings and firm efficiency.
Non-executive director participation in the board increases the efficiency of the decision and it also monitors the affair of corporation in a better way. The purpose of involvement in the board
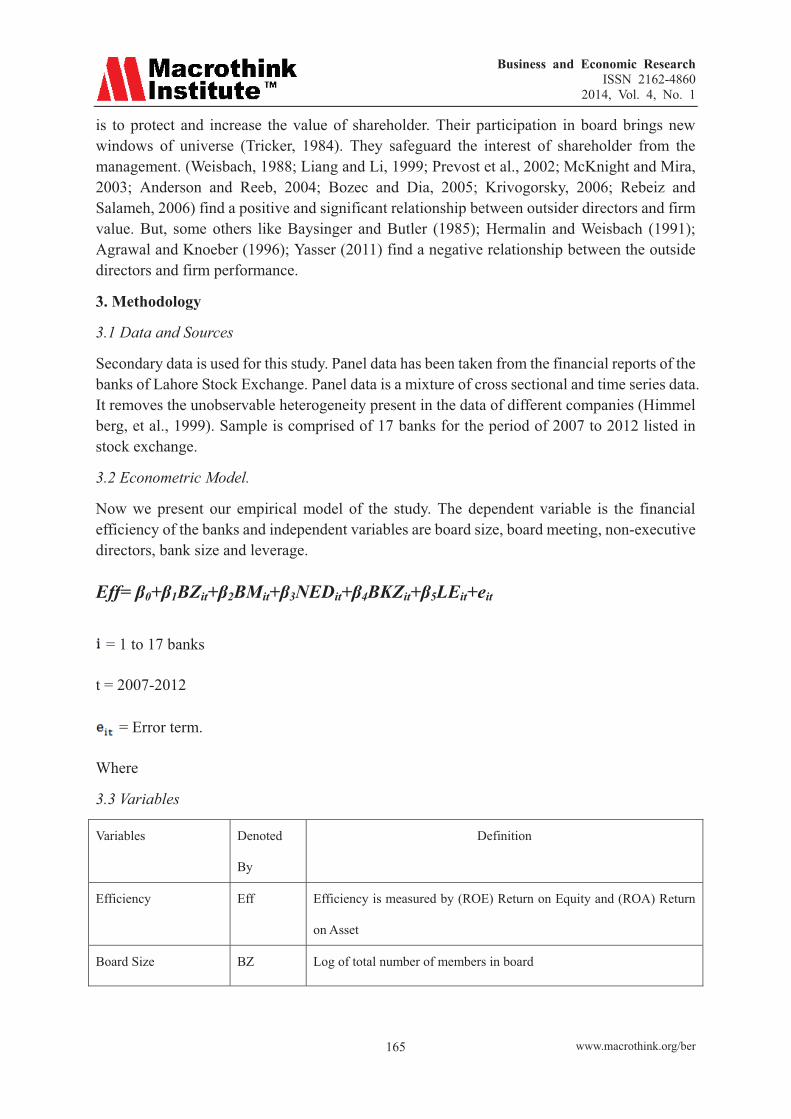
Business and Economic Research ISSN 2162-4860
2014, Vol. 4, No. 1
www.macrothink.org/ber 165
is to protect and increase the value of shareholder. Their participation in board brings new windows of universe (Tricker, 1984). They safeguard the interest of shareholder from the management. (Weisbach, 1988; Liang and Li, 1999; Prevost et al., 2002; McKnight and Mira, 2003; Anderson and Reeb, 2004; Bozec and Dia, 2005; Krivogorsky, 2006; Rebeiz and Salameh, 2006) find a positive and significant relationship between outsider directors and firm value. But, some others like Baysinger and Butler (1985); Hermalin and Weisbach (1991); Agrawal and Knoeber (1996); Yasser (2011) find a negative relationship between the outside directors and firm performance.
3. Methodology
3.1 Data and Sources
Secondary data is used for this study. Panel data has been taken from the financial reports of the banks of Lahore Stock Exchange. Panel data is a mixture of cross sectional and time series data. It removes the unobservable heterogeneity present in the data of different companies (Himmel berg, et al., 1999). Sample is comprised of 17 banks for the period of 2007 to 2012 listed in stock exchange.
3.2 Econometric Model.
Now we present our empirical model of the study. The dependent variable is the financial efficiency of the banks and independent variables are board size, board meeting, non-executive directors, bank size and leverage.
Eff= β0+β1BZit+β2BMit+β3NEDit+β4BKZit+β5LEit+eit
= 1 to 17 banks
t = 2007-2012
= Error term.
Where
3.3 Variables
Variables Denoted
By
Definition
Efficiency Eff Efficiency is measured by (ROE) Return on Equity and (ROA) Return
on Asset
Board Size BZ Log of total number of members in board

Business and Economic Research ISSN 2162-4860
2014, Vol. 4, No. 1
www.macrothink.org/ber 166
Board Meeting BM Meetings held by the board in the year
Non-Executive
Directors
NED Total non-executive directors divided by total member in boards
Bank Size BKZ Calculated by log of Total Assets
Leverage LE Calculated by Total debts over Total equity
3.4 Hypothesis Development
Hypothesis development of the study: is it nulls or alternates hypothesis
H1: Board size has significant relationship with bank financial efficiency.
H2: Board meeting has significant relationship with bank financial efficiency.
H3: Non-Executive directs has significant relationship with bank financial efficiency.
H4: Bank size has significant relationship with bank financial efficiency.
H5: Leverage has significant relationship with bank financial efficiency.
4. Results and Discussions
Table 1. Descriptive Statistics Results
Variables Mean Std. Dev Max. Min.
BZ 8.68 1.64 13 4 BM 6.63 2.58 16 4
NED 6.32 2.07 12 2 BKZ 5.34 0.46 6.18 4.22 LE 13.77 9.77 76.53 1.62
ROE 0.09 0.06 0.33 0.01 ROA 0.004 0.02 0.04 -0.07
Table 1 shows the descriptive statistics result of the variables. Board size means value is 8.68 that shows the reasonable size of board. Brown and Caylor (2004) find that organization having board members between 6 and 15, have greater return on margins and return on equity as contrast to other board sizes in organization. Board meeting mean value is 6.63 that shows board has conducted reasonable meetings in a year. Kama and Chuku (2009) find that board having more than six meetings in a year contributes toward effectiveness of organizations. Non-Executive direcotrs mean value is 6.32 that show great representation in board. Pfeffer and Salancick (1978) find that existence of non-executive directors in board helps to play the efficiency of board as well as financial performance of organization. The mean value of bank size is 5.34 and Leverage is 13.77. The mean value of dependent variable return on equity is 0.09 and return on asset is 0.004.

Business and Economic Research ISSN 2162-4860
2014, Vol. 4, No. 1
www.macrothink.org/ber 167
Table 2. Correlation Matrix
Variables BZ BM NED BKZ LE ROE ROA BZ 1.00 BM -0.32 1.00
NED -0.09 -0.16 1.00 BKZ -0.09 0.24 0.17 1.00 LE 0.09 0.31 -0.09 0.15 1.00
ROE -0.04 -0.19 -0.13 -0.56 -0.64 1.00 ROA 0.10 -0.13 0.09 0.54 -0.24 -0.21 1.00
VIF Mean = 1.39 which is less than 5 indicating that is causes no problem to multicollineraity.
Table 3. Multicollinearity
Tolerance VIF BZ 0.83 1.19 BM 0.72 1.39
NED 0.91 1.10 BKZ 0.89 1.12 LE 0.86 1.17
Table 2 and 3 show that there is no correlation and multicollinearity among variables.
Table 4. Result of Pooled Regression
ROA ROE
Coefficient P-Value Coefficient P-Value BZ 0.031 0.13 -0.001 0.99 BM -0.001 0.07*** 0.002 0.19 NED -0.007 0.44 -0.030 0.19 BKZ 0.029 0.00* -0.066 0.00*
LE -0.001 0.00* -0.044 0.00*
Const -0.157 0.00* 0.508 0.00*
Durbin Watson 1.95 2.02 F-statistics 16.01 33.88 R2 0.45 0.63
Level of significance
0.01 at *, 0.05 at **, 0.10 at ***
Table 4 shows the result of pooled regression for return on asset. Board Meetings show the negative and significant (p<0.10) relationship. Yasser (2011) finds the negative link between board meeting and firm performance. The Board size and Non-executive director show insignificant impact on bank financial performance. The Bank size shows positive and significant relationship and Leverage shows negative and significant relationship. The

Business and Economic Research ISSN 2162-4860
2014, Vol. 4, No. 1
www.macrothink.org/ber 168
F-statistics value shows that overall model is significant.
Table 4 shows the result of pooled regression for return on equity. The Board size, Board meeting and Non-Executive director show insignificant impact on bank financial performance. The Bank size show negative and significant relationship. The F-statistics value show overall model is significant.
Table 5. Result of Fixed and Rendom effect model for ROE and ROA
ROE ROA
Fixed Effect Rendom Effect Fixed Effect Rendom Effect
Coefficient P-Value Coeffcient Z-Value Coefficient P-Value Coeffcient Z-Value
BZ 0.015 0.80 0.007 0.90 -0.010 0.77 0.008 0.73
BM -0.001 0.50 -0.001 0.66 -0.002 0.03** -0.001 0.02**
NED -0.003 0.89 -0.010 0.62 -0.030 0.02** -0.017 0.09***
BKZ -0.061 0.01* -0.066 0.00* 0.014 0.25 0.028 0.00*
LE -0.002 0.00* -0.002 0.00* -0.001 0.02** -0.001 0.00*
Const 0.445 0.00* 0.483 0.00* -0.014 0.84 -0.121 0.00*
Durbin Watson 1.79 1.71
F-statistics 8.62 71.24 3.24 39.04
R2 0.58 0.60 0.25 0.44
Level of significance
0.01 at *, 0.05 at **, 0.10 at ***
According to table 5 the hausman’s test recommends that random effect model is most appropriate. The Board size, Board meeting and Non-Executive director show insignificant impact on bank financial performance. The Bank size shows the negative and significant relationship. The F-statistics value shows that overall model is significant.
According to table 5 the hausman test recommends the rendom effect model for return on asset. The Board meeting shows negative and significant relationship at (p<0.005). Yasser (2011) finds the negative link between board meeting and firm performance. The Non-Executive director shows negative and significant relationship at (p< 0.10). The F-statistics value shows that overall model is significant.
5. Conclusion& Recommendations
Financial sector is playing main role towards the development of economic system of the country. Banking sector progress is essential if we want economy on the path of success. This study is focused on financial efficiency of banking sector; Governance is the main problem for many corporations, so we analyze the impact of corporate governance on financial efficiency

Business and Economic Research ISSN 2162-4860
2014, Vol. 4, No. 1
www.macrothink.org/ber 169
of banking sector of Pakistan. This study examines the financial efficiency for the period of 2007-2012 includes 17 listed banks, Board size, Board meeting, non-Executive directors, bank size and Leverage take as an independent variables and used Return on equity (ROE) and return on asset (ROA) as a proxy variable for dependent variable Financial efficiency.
This study recommends that if we use accurate measures of corporate governance then we can improve the financial efficiency of banks. Corporate governance provides rules & regulations to monitors and manages banks affairs, and it provides guidelines to the board of directors how to run the affairs and how to increase shareholder values and bank efficiency. Participation of Non-Executive directors in board increases board efficiency and protects the rights of shareholders. Adequate number of meetings in a year handles corporate affairs better and increases bank efficiency. The findings of this research show that corporate governance has significant impact on financial efficiency of banks.
Limitations
This study includes only 17 listed banks not all banks which are listed in Stock Exchange
This study covered the time period of 2007-2012
This study comprises few variables which are used in the past studies.
References
Andres, P., & Vallelado, E. (2008). Corporate governance in banking: The role of the board of directors. Journal of banking & finance, 32(12), 2570-2580. http://dx.doi.org/10.1016/j.jbankfin.2008.05.008
Andres, P., Azofra, V., & Lopez, F. (2005). Corporate Boards in OECD Countries: Size, Composition, functioning and effectiveness corporate governance, 13(2), 197-210.
Bhagat, S., & Bolton, B. (2008).Corporate governance and firm performance. Journal of Corporate Finance, 14(3), 257-273. http://dx.doi.org/10.1016/j.jcorpfin.2008.03.006
Caprio, G., Laeven, L., & Levine, R. (2007). Governance and bank valuation. Journal of Financial Intermediation, 16(4), 584-617. http://dx.doi.org/10.1016/j.jfi.2006.10.003
Cheema, A. (2003). Corporate governance in Pakistan: issues and concerns. The Journal, 8(2), 7-19.
Cheema, A., Bari, F., et al. (2003). Corporate Governance in Pakistan: Ownership, Control and the Law. Lahore University of Management Sciences, Lahore.
Choe, H., & Lee, B.S. (2003). Korean Bank Governance reform after the Asian Financial crises. Pacific- Basin Finance Journal, 11(4), 483-508. http://dx.doi.org/10.1016/S0927-538X(03)00051-9
Claessens, S., Djankov, S., et al. (2000). The separation of ownership and control in East Asian corporations. Journal of Financial Economics, 58(1), 81-112. http://dx.doi.org/10.1016/S0304-405X(00)00067-2

Business and Economic Research ISSN 2162-4860
2014, Vol. 4, No. 1
www.macrothink.org/ber 170
Conger, J. A., Finegold, D., et al. (1998). Appraising boardroom performance. Harvard Business Review, 76, 136-164.
Connely, J. T., & Limpaphayom, P. (2004). Corporate Governance in Thialand. Review of Corporate Governace in Aisa, 1-53.
Co-Operation, O. f. E., & Development (2004). OECD Principles of Corporate Governance.
Eisenberg, T., Sundgren, S., et al. (1998). Larger board size and decreasing firm value in small firms. Journal of Financial Economics, 48(1), 35-54. http://dx.doi.org/10.1016/S0304-405X(98)00003-8
Fama, E. F., & Jensen, M. C. (1983). Separation of ownership and control. JL & Econ, 26, 301. http://dx.doi.org/10.1086/467037
Gillan, L. S., & Starks, T. L. (1998). Corporate Governance propsals and shareholders activism: the role of institutional activism. Journal of Financial Economics, 275-305.
Haque, A., & Tariq, A. (2012). Efficiency of Banks in Pakistan: A Non Parametric Approach. Business & Economic Research (BER), 2(1). 1-12. http://dx.doi.org/10.5296/ber.v2i1.1711
Jackling, B., & Johl, S. (2009). Board structure and firm performance: Evidence from India's top companies. Corporate Governance: An International Review, 17(4), 492-509. http://dx.doi.org/10.1111/j.1467-8683.2009.00760.x
Javid, A. Y., & Iqbal, R. (2008). Ownership Concentration, Corporate Governance and Firm Performance: Evidence from Pakistan. The Pakistan Development Review, 47(4), 643-659.
Javid, A. Y., & Iqbal, R. (2008).Does Corporate Governance Affect a Firm's Performance? A Case Study Pakistani Market. Journal of business and economics, 1(1), 11-23.
Klapper, L. F., & Love, I. (2004). Corporate governance, investor protection, and performance in emerging markets. Journal of Corporate Finance, 10(5), 703-728. http://dx.doi.org/10.1016/S0929-1199(03)00046-4
Krivogorsky, V. (2006). Ownership, board structure, and performance in continental Europe. The International Journal of Accounting, 41(2), 176-197. http://dx.doi.org/10.1016/j.intacc.2006.04.002
Levine, R. (2005). Finance and growth: Theory and evidence. Handbook of economic growth, 1, 865-934. http://dx.doi.org/10.1016/S1574-0684(05)01012-9
Liang, N., & Li, J. (1999). Board structure and firm performance: New evidence from China’s private firms.
Lipton, M., & Lorsch, J. W. (1992). Modest Proposal for Improved Corporate Governance, A.Bus. Law, 48, 59-77.
Mak, Y. T., & Kusnadi, Y. (2004). Size really matters: Further evidence on the negative relationship between board size and firm value. Pacific-Basin Finance Journal, 12(1), 1-18.

Business and Economic Research ISSN 2162-4860
2014, Vol. 4, No. 1
www.macrothink.org/ber 171
Moore, M. T. (2002). Corporate governance: An experienced model. Director’s Monthly. 26(3), 1-9.
Ong, C., & Wan, D. (2008). Three conceptual models of board role performance. Corporate Governance, 8(3), 317-329. http://dx.doi.org/10.1108/14720700810879196
Prevost, A. K., Rao, & R. P., et al. (2002). Determinants of board composition in New Zealand: a simultaneous equations approach. Journal of Empirical Finance, 9(4), 373-397. http://dx.doi.org/10.1016/S0927-5398(02)00002-6
Rebeiz, K. S., & Salameh, Z. (2006). Relationship between governance structure and financial performance in construction. Journal of Management in Engineering, 22(1), 20-26. http://dx.doi.org/10.1061/(ASCE)0742-597X(2006)22:1(20)
Tricker, R. I. (1984). Corporate Governance: Practices, procedures and powers in British companies and their boards of directors, Gower.
Vafeas, N. (1999). Board meeting frequency and firm performance. Journal of Financial Economics, 53(1), 113-142. http://dx.doi.org/10.1016/S0304-405X(99)00018-5
Ward, J. L. (1991). Creating effective boards for private enterprises: Meeting the challenges of continuity and competition, Jossey-Bass.
Ward, J. L., & Handy, J. L., (1988). A survey of board practices. Family Business Review, 1(3), 289-308. http://dx.doi.org/10.1111/j.1741-6248.1988.00289.x
Weir, C. (1997). Corporate Governance, performance and take-over: An empirical analysis of UK merger. Applied Economics, 29(11), 1465-1475. http://dx.doi.org/10.1080/000368497326291
Yasser, Q. R. (2011). Corporate governance and performance: An Analysis of Pakistani listed firms. Global Journal of Management and Business Research, 11(10).
Yasser, Q. R., & Entebang,H., et al. (2011). Corporate governance and firm performance in Pakistan: The case of Karachi Stock Exchange (KSE)-30. Journal of Economics and International Finance, 3(8), 482-491.
Yermack, D. (1996). Higher market valuation of companies with a small board of directors.
Appendix:
Table 6
List of Banks
Bank ID Name of Banks Number of Observations 1 Askari Bank 6 2 Allied Bank 6 3 Bank Al Habib 6

Business and Economic Research ISSN 2162-4860
2014, Vol. 4, No. 1
www.macrothink.org/ber 172
4 Bank Alfalah Limited 6 5 Bank of Punjab 6 6 Faysal Bank 6 7 Habib Bank Limited 6 8 Habib Metro Bank 6 9 JS Bank 6
10 KASB Bank 6 11 MCB 6 12 Meezan Bank 6 13 National Bank of Pakistan 6 14 NIB Bank 6 15 Samba Bank Limited 6 16 Soneri Bank Limited 6 17 United Bank Limited 6
Copyright Disclaimer
Copyright reserved by the author(s).
This article is an open-access article distributed under the terms and conditions of the Creative Commons Attribution license (http://creativecommons.org/licenses/by/3.0/).

Business and Economic Research ISSN 2162-4860
2014, Vol. 4, No. 1
www.macrothink.org/ber 173
Globalization to a Developing Economy: a Pain or a Gain
Roseline Oluitan PhD
Department of Accounting & Finance Lagos State University, Ojoo, Lagos
Tel: 234-818-482- 3668 E-mail: [email protected]
Received: November 23, 2013 Accepted: December 8, 2013
doi:10.5296/ber.v4i1.4603 URL: http://dx.doi.org/10.5296/ber.v4i1.4603
Abstract
This paper examines the concept of globalization and analyse the effect on both developed and developing economies to ascertain the actual impact on both economies. Arguments of supporters and opponents of the concept were discussed and empirical data discussed to arrive at who is actually benefitting from the concept. It observes that the principles on which the concept is based is not favourable to the developing countries for obvious reasons.
The study supports the view that there are loopholes in the processes which is being abused by mostly the multinationals to exploit the developing countries. It concludes that the concept is capable of positive impact, but will need to be modified by promoting institutions to turn the pain of the developing countries to gain.
1. Introduction
Globalization is one of the topical issues in the world today. It entails the growing integration of economies and societies around the world. To a lot of people, it has been a vital means to sustainable development mostly for third world economies hence one of the good things that has ever happened in the past few centuries. Some people vehemently oppose this view. They rather see it as a window dressing of the erstwhile slave trade by the developed countries. This school of thought is of the opinion that nothing good has ever happened to the developing countries through globalization, and if anything, it is largely insignificant to the gains that are reaped by the developed countries.
One thing is very clear about globalization and that is what it is impinged upon, put in other words, what it is targeted at in any economy. These according to Yusuf (2001) are:
- Growth of trade - Capital flows and financial capability - Easy migration
Business and Economic Research ISSN 2162-4860
2014, Vol. 4, No. 1
www.macrothink.org/ber 174
- Information Technology and the Web - Diffusion of Technology
According to him, all parts of the world are affected by globalization though these channels, but it is important to remember that the full force of change is felt by a relatively small number of upper and middle income countries due mainly to the level of integration into the global system
The key institutions promoting globalization are the World bank, International Monetary Fund (IMF) and World Trade Organization (WTO) who are interested in enhancing the standard of living of the world populace (eradicating poverty), improving bilateral trade and free movement towards enhanced knowledge and information flow. According to Rosenana (1997), globalization can be defined as “a label that is presently in vogue to account for peoples: Activities, Norms, Areas, Goods, services and Currencies that are decreasingly confined to a particular geographic space with local and established practices”. It is imperative to state that the concept of globalization entails both microeconomic which refers to the technological revolution and its impact on the firm’s leverage and macroeconomic aspect which focuses on the integration of markets for goods and services
In the course of this paper we shall look into arguments of the two groups, evidences that abound and take a position on the role of globalization to the developing economies, whether it has been a pain that further plunges them into further problems/ crises or that it has been a gain that has strived to improve the populace in this areas of focus.
2. Effect of Globalization on the Development Countries
In order to harness the effect of globalization on the developing countries, we shall consider critically three of the five key policy areas earlier enumerated which has direct relevance to finance and upon which globalization is impugned upon. The choice of the policy area is based on available data to justify the argument. These are.
a) Growth of Trade and Capital flows
One of the primary objectives of globalization is the promotion of free trade and open market which enhances global free competition amongst industries. It allows companies and firms to undertake voluntary economic transaction through cross border activities covering International Trade, Direct Foreign Investment and International Capital Flows. Thus De-Soysa & Vadlamannati (2011) observes positive effects of the various forms of globalization and government respect for basic human rights for a sample of 118 countries and a sub-sample of developing countries thereby suggesting that globalization predicts better human rights. Similarly, Dreher et al (2010) postulates that physical integrity and rights significantly and robustly increase with globalization and economic freedom while employment rights are not robustly affected.
It is believed that based on the law of Comparative advantage, each region will now focus on areas or products they are best suited both naturally, physically, eonomically etc to produce/manufacture. It is assumed that free trade will enlarge the markets for domestic

Business and Economic Research ISSN 2162-4860
2014, Vol. 4, No. 1
www.macrothink.org/ber 175
producers, allow them to benefit from the principle of economies of scale, make room for free competition and reward for hard work, provide opportunities and incentives for creativity as well as develop new technologies
One major setback in this principle, relative to developing countries and based on the law of Comparative advantages is that third world economies may end up only trading in primary products. No doubt, developed economies will have comparative edge in the production of secondary / intermediate goods. A typical example can be described with the Nigerian scenario which has low level of infrastructure, unstable interest rate and unstable prices of factors of production. This implies that planning and production of goods and services will attract higher costs than in the developed economy. So far, the only cheap factor of production in Nigeria is labour. The outcome is that highly priced industrial goods are exchanged for lowly priced primary goods/products. This postulation lends credence to the study of Bergh and Nilson (2010a) that freedom to trade internationally is robustly related to inequality and that social globalization along with deregulation is equally linked to inequality.
Baker and Nordin (2004) opined that dirty money binds the poor. They opine that the World Bank is narrowing its focus on corruption, rather than major problem of cross-border dirty money. This comprises of money that is illegally earned, illegally used or transferred and has three main facets namely: Criminal proceeds from trafficking and racketeering: commercial proceeds from trade and shady business transactions, often hidden in tax haven, and proceeds from greedy government officials. They revealed that about $50billion in aid goes to developing and transitional economies from richer nations. At the same time, roughly about $500billion in dirty money flows in the opposite direction out of poorer countries. In essence for every $1 the World Bank distributes in assistance across the top of the table, $10 is lost in illegal proceeds under the table. The above has a lot of implications for developing countries and may possibly account for the startling revelation discussed below.
Table 1: The Role of Developing Countries In Trade And Capital Flows.
1980-82 1987-90 1996-97 Exports (%) 32.7 27.2 34.0 Imports(Billions of &) 30.4 25.4 34.3 1856 2864 5459 Direct Investment(%) Portfolio Investment(%) 32.7 14.3 43.2 Total (Billion of $) 7.7 3.1 13.3 107 355 3119
TABLE 2. Regional Differences Among Developing Countries In Trade & Capital Flow
Trade Flow 1980 1990 1997 Asia 28.3 51.4 52.3 Europe 16.0 11.1 16.8
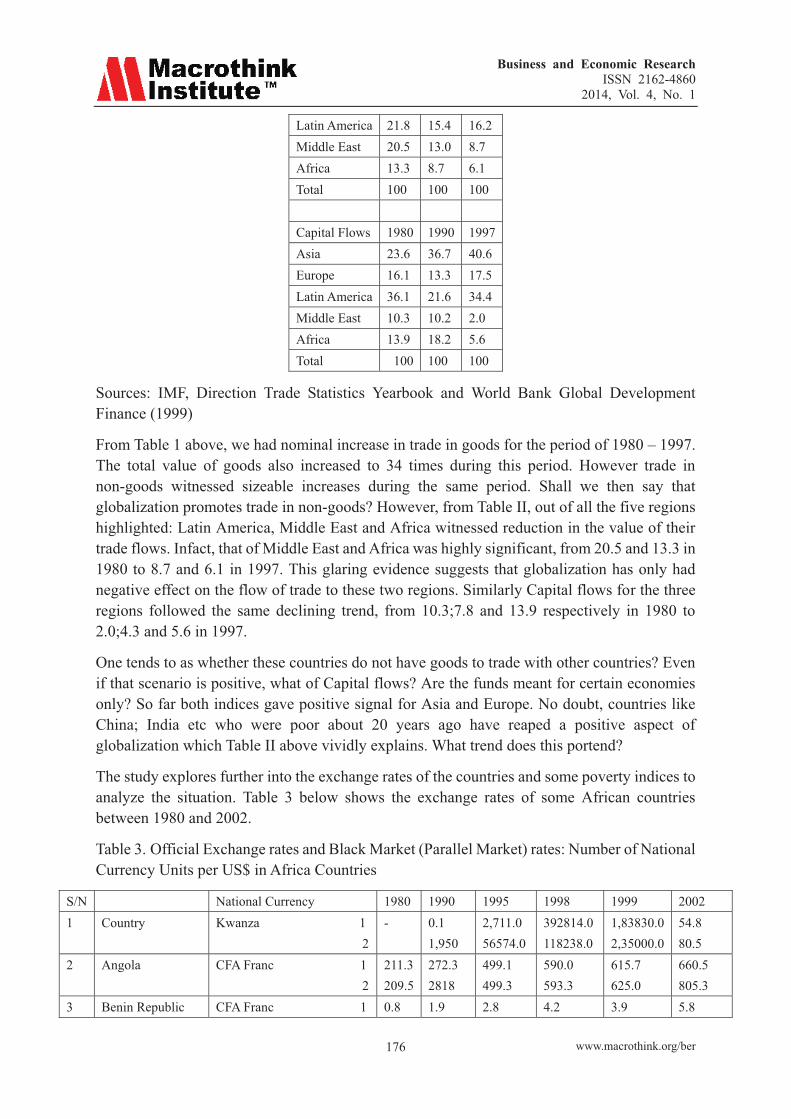
Business and Economic Research ISSN 2162-4860
2014, Vol. 4, No. 1
www.macrothink.org/ber 176
Latin America 21.8 15.4 16.2 Middle East 20.5 13.0 8.7 Africa 13.3 8.7 6.1 Total 100 100 100 Capital Flows 1980 1990 1997 Asia 23.6 36.7 40.6 Europe 16.1 13.3 17.5 Latin America 36.1 21.6 34.4 Middle East 10.3 10.2 2.0 Africa 13.9 18.2 5.6 Total 100 100 100
Sources: IMF, Direction Trade Statistics Yearbook and World Bank Global Development Finance (1999)
From Table 1 above, we had nominal increase in trade in goods for the period of 1980 – 1997. The total value of goods also increased to 34 times during this period. However trade in non-goods witnessed sizeable increases during the same period. Shall we then say that globalization promotes trade in non-goods? However, from Table II, out of all the five regions highlighted: Latin America, Middle East and Africa witnessed reduction in the value of their trade flows. Infact, that of Middle East and Africa was highly significant, from 20.5 and 13.3 in 1980 to 8.7 and 6.1 in 1997. This glaring evidence suggests that globalization has only had negative effect on the flow of trade to these two regions. Similarly Capital flows for the three regions followed the same declining trend, from 10.3;7.8 and 13.9 respectively in 1980 to 2.0;4.3 and 5.6 in 1997.
One tends to as whether these countries do not have goods to trade with other countries? Even if that scenario is positive, what of Capital flows? Are the funds meant for certain economies only? So far both indices gave positive signal for Asia and Europe. No doubt, countries like China; India etc who were poor about 20 years ago have reaped a positive aspect of globalization which Table II above vividly explains. What trend does this portend?
The study explores further into the exchange rates of the countries and some poverty indices to analyze the situation. Table 3 below shows the exchange rates of some African countries between 1980 and 2002.
Table 3. Official Exchange rates and Black Market (Parallel Market) rates: Number of National Currency Units per US$ in Africa Countries
S/N National Currency 1980 1990 1995 1998 1999 2002 1 Country Kwanza 1
2 - 0.1
1,950 2,711.0 56574.0
392814.0 118238.0
1,83830.0 2,35000.0
54.8 80.5
2 Angola CFA Franc 1 2
211.3 209.5
272.3 2818
499.1 499.3
590.0 593.3
615.7 625.0
660.5 805.3
3 Benin Republic CFA Franc 1 0.8 1.9 2.8 4.2 3.9 5.8

Business and Economic Research ISSN 2162-4860
2014, Vol. 4, No. 1
www.macrothink.org/ber 177
2 0.8 1.9 2.9 4.5 4.5 8.5 4 Botswana Pula 1
2 211.3 209.5
2723 281.8
499.1 499.3
590.0 593.3
615.7 620.8
660.5 780.0
5 Burkina Faso CFA Franc 1 2
90.0 106.0
171.3 186.1
249.8 340.8
447.8 605.8
563.6 7150
1027.0 950.0
6 Cameroom Franc 1 2
209.2 209.5
70.0 00.7
518.5 499.3
602.1 605.8
588.4 625.0
660.5 805.0
7 Capeverde CFA Franc 1 2
Nill 209.5
Nill 281.8
76.9 85.6
98.2 105.0
102.7 110.0
121.3 1325
8 Central Africa Republic
Escudo 1 2
40.2 211.3
272.3 281.8
499.1 499.3
590.0 605.8
615.7 625.0
660.5 805.0
9 Chad CFA Franc 1 2
209.5 211.3
272.3 28.18
374.4 390.6
590.0 605.8
615.7 625.7
660.5 805.0
10 Comoros Republic CFA Franc 1 2
209.5 211.3
0.1 738.1
6254.0 7452.0
422.5 475.0
461.8 505.0
495.4 610.0
11 Democratic Republic of Congo
CFA Franc 1 2
209.5 0.1
272.3 281.8
499.1 409.3
129,101.0 160500.0
140,286.0 170,550.0
409.4 805.0
12 Congo Republic (Brazzaville)
Congolese 1 2
6.4 211.3 209.5
2723 499.1 605.8 608.8
625.7 625.7
660.5 680.00
13 Coted’Ivoire (Ivory Coast)
CFA Franc 1 2
211.3 209.5
281.8 499.3 590.0 605.8
61.7 625.7
660.5 805.0
14 Djibouti Djibouti Franc 1 2
1980 177.7
1990 177.7
177.7 198.5
177.7 183.9
177.7 183.9
175.0 195.0
15 Equatorial Guinea (Fernando Island)
CFA Franc 1 2
Nill 110.6 209.5
191.8 272.3
499.1 586.4 68 10.5
590.0 593.3
615.7 625.7
660.5 805.0
16 Eritrea Birr 1 2
- -
281.8 -
5.9 10.4 499.1
7.4 10.8
625.7 8.5
8.5 11.9
17 Ethiopia Birr 1 2
211.3 209.5
- 2.6
499.3 9.5 10.4
6.9 11.8
11.5 7.5
12.7 66.05
18 Gabon CFA Franc 1 2
211.3 209.5
60 272.3
1,200.4 991.4
590.0 593.3
12.5 615.7
805.0 23.0
19 Gambia Dalasi 1 2
1.7 1.7
281.8 7.9
499.1 499.3
10.6 11.0
625.7 11.4
30.6 8,231.4
20 Ghana Code 1 2
9.6 15.9
8.3 326.3
9.5 10.4
2,314.1 2,500.0
12.5 2,647.3
9,100.1 971.0
21 Guinea Franc 1 19.0 360.8 1,200.4 1,236.8 2,700.0 1,850.0
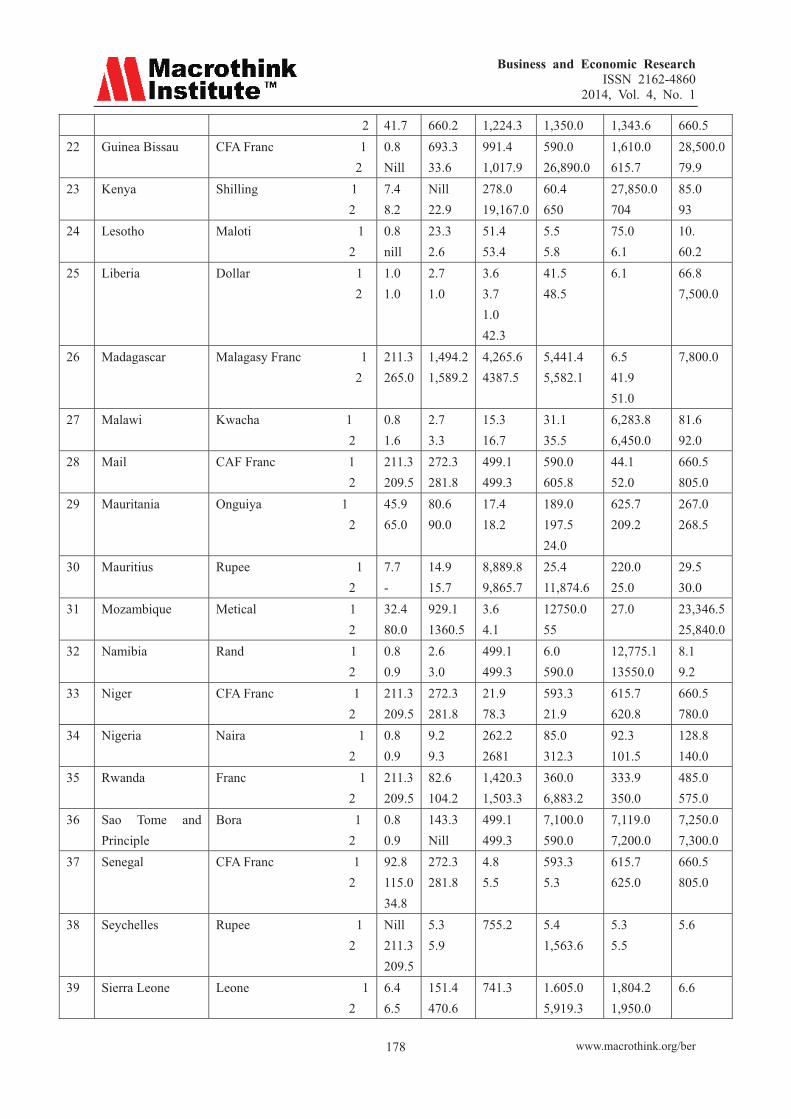
Business and Economic Research ISSN 2162-4860
2014, Vol. 4, No. 1
www.macrothink.org/ber 178
2 41.7 660.2 1,224.3 1,350.0 1,343.6 660.5 22 Guinea Bissau CFA Franc 1
2 0.8 Nill
693.3 33.6
991.4 1,017.9
590.0 26,890.0
1,610.0 615.7
28,500.0 79.9
23 Kenya Shilling 1 2
7.4 8.2
Nill 22.9
278.0 19,167.0
60.4 650
27,850.0 704
85.0 93
24 Lesotho Maloti 1 2
0.8 nill
23.3 2.6
51.4 53.4
5.5 5.8
75.0 6.1
10. 60.2
25 Liberia Dollar 1 2
1.0 1.0
2.7 1.0
3.6 3.7 1.0 42.3
41.5 48.5
6.1 66.8 7,500.0
26 Madagascar Malagasy Franc 1 2
211.3 265.0
1,494.2 1,589.2
4,265.6 4387.5
5,441.4 5,582.1
6.5 41.9 51.0
7,800.0
27 Malawi Kwacha 1 2
0.8 1.6
2.7 3.3
15.3 16.7
31.1 35.5
6,283.8 6,450.0
81.6 92.0
28 Mail CAF Franc 1 2
211.3 209.5
272.3 281.8
499.1 499.3
590.0 605.8
44.1 52.0
660.5 805.0
29 Mauritania Onguiya 1 2
45.9 65.0
80.6 90.0
17.4 18.2
189.0 197.5 24.0
625.7 209.2
267.0 268.5
30 Mauritius Rupee 1 2
7.7 -
14.9 15.7
8,889.8 9,865.7
25.4 11,874.6
220.0 25.0
29.5 30.0
31 Mozambique Metical 1 2
32.4 80.0
929.1 1360.5
3.6 4.1
12750.0 55
27.0 23,346.5 25,840.0
32 Namibia Rand 1 2
0.8 0.9
2.6 3.0
499.1 499.3
6.0 590.0
12,775.1 13550.0
8.1 9.2
33 Niger CFA Franc 1 2
211.3 209.5
272.3 281.8
21.9 78.3
593.3 21.9
615.7 620.8
660.5 780.0
34 Nigeria Naira 1 2
0.8 0.9
9.2 9.3
262.2 2681
85.0 312.3
92.3 101.5
128.8 140.0
35 Rwanda Franc 1 2
211.3 209.5
82.6 104.2
1,420.3 1,503.3
360.0 6,883.2
333.9 350.0
485.0 575.0
36 Sao Tome and Principle
Bora 1 2
0.8 0.9
143.3 Nill
499.1 499.3
7,100.0 590.0
7,119.0 7,200.0
7,250.0 7,300.0
37 Senegal CFA Franc 1 2
92.8 115.0 34.8
272.3 281.8
4.8 5.5
593.3 5.3
615.7 625.0
660.5 805.0
38 Seychelles Rupee 1 2
Nill 211.3 209.5
5.3 5.9
755.2 5.4 1,563.6
5.3 5.5
5.6
39 Sierra Leone Leone 1 2
6.4 6.5
151.4 470.6
741.3 1.605.0 5,919.3
1,804.2 1,950.0
6.6

Business and Economic Research ISSN 2162-4860
2014, Vol. 4, No. 1
www.macrothink.org/ber 179
1.0 1.4
40 Somalia Shilling 1 2
6.3 9.9
1,896.1 1,982.1
1,949.2 6,549.2
5.5 6.0
2,200.0 6,155.0
1,700.0 2,120.0
41 South Africa Rand 1 2
28.8 0.9
2.6 2.7
3.6 3.7
2.008.0 250.0
6.1 7.4
2,620.0 7,250.0
42 Sudan Dinar 1 2
0.6 1.0
12.2 23.6
580.9 77.5
5.5 6.0
2525.5 9.3 9.8
43 Swaziland Lilangeni 1 2
0.8 2.6 2.7
3.6 3.9
664.7 730.0
6.1 7.4
2,587.0 3,750.0
44 Tanzania Shilling 1 2
0.9 195.1 292.4
574.8 587.3
590.0 593.3
744.8 950.8
9.6 10.8
45 Togo CFA Franc 1 2
8.2 21.0
272.3 291.8
499.1 499.3
590.0 593.3
615.7 620.8
985.0 1,100.0
46 Uganda Shilling 1 2
1.0 75.7
319.6 685.8
932.5 1,076.2
1,149.7 1,305.0
1,362.1 1,710.0
1,843.0 1,920.0
47 Zimbabwe Dollar 1 2
0.6 1.9
2.4 4.5
8.7 9.2
21.4 39.2 58.7
38.3 57.5 66.6
55.1 60.9 79.9
48 Algeria Dinar 1 2
3.8 10.9
9.0 29.8
47.7 131.9
58.7 129.8
138.0 3.4
150.0 4.8
49 Egypt Pound 1 2
0.7 0.8
2.2 2.6
3.4 3.4
3.4 34
3.7 5.9
50 Libya Dinar 1 2
0.3 0.5
0.3 1.0
0.3 1.3
0.6 2.2
0.8 2.4
1.2 2.6
51 Morocco Dinar 1 2
3.9 4.1
8.2 9.3
8.5 8.6
9.6 11.1
9.8 11.2
10.6 11.5
52 Tunisia Dinar 1 2
0.4 0.4
0.9 0.9
0.9 0.9
1.1 1.1
1.2 1.4
1.4 1.6
Notes: 1 after the currency means the Official exchange rate while 2. denotes Black market (parallel) rate.
Sources: I.Africa Development indicators 2003: The World Bank Washington, D.C. 2003
II. West Africa International Magazine, London, 13-19 and
III. World Almanac and Book of Facts 2003, New York USA, 2003, pages 756-855.
From Table III above only South Africa’s exchange rate improved from Rand 28.8 to $1in 1980 to Rand 9.3to $1in 2002. Nigeria naira moved from No. 8 to $1 in 1980 to N128.8 to $1 in 2002. The scenario is pathetic because prices of goods have increased, yet they have a poorly valued currency to pay from them. As earlier stated, the paper examines some poverty indices such as gross national product and gross domestic product for the countries covered in Table 3 above. This is to examine the level of correlation in the data and whether it actually tells a story.

Business and Economic Research ISSN 2162-4860
2014, Vol. 4, No. 1
www.macrothink.org/ber 180
Table 4. Per Capital National Product of Africa Countries, in Selected Years, 1980-2002 in US$
S/N Country 1980 1990 1992 1995 2002 2002 as % of 1980 1 Angola 1,350 840 960 940 1,100 81.48 2 Benin Republic 1,110 1,360 1,370 1,350 1,030 92,7 3 Botswana 2,505 4,730 483 5360 6,600 263.4 4 Burkina Faso 960 990 990 920 1,000 92.3 5 Burundi 1,120 920 910 750 720 54.5 6 Cameroon 1,850 1,970 1,920 1,1660 1,700 92.3 7 Cape Verde 1,620 1,980 1,900 1,810 1,700 1118.8 8 Central Africa Republic 1,840 1,470 1,460 1,350 1,700 82.3 9 Chad 1,140 1,280 1,250 1,210 1000 875 10 Comoros Republic 760 540 620 640 720 94.6 11 Democratic Republic of
Congo 670 620 600 575 600 89.7
12 Congo Republic (Brazzaville)
1,600 980 920 910 1,000 62.5
13 Cote d’ Ivoire (Ivory Cost) 2,540 2,800 2,800 1,670 1,600 62.3 14 Djibouti 1,054 1,050 910 850 574 54.5 15 Equatorial Guinea
(Fernando Island) 2,860 2,350 1980 2,100 2,000 70.9
16 Eritrea 2,100 1,110 1,110 1,110 600 28.6 17 Ethiopia 2,100 1,110 5,050 5,8506 6,300 69.5 18 Gabon 9,050 5,050 1,350 1,350 1,110 86.8 19 Gambia 1,280 1,350 1,430 1,370 1,900 90.7 20 Ghana 2,090 1,430 1,520 1,560 1,300 68.0 21 Guinea 1,910 1,520 1,240 1,220 850 106.7 22 Guinea Bissau 802 1,240 1,330 1,260 1500 80.0 23 Kenya 1,875 1,330 1,650 1,690 2,400 112.2 24 Lesotho 2,140 1,650 1,310 1,270 1,100 56.2 25 liberia 1,90 1,310 1,230 740 800 55.6 26 Madagascar 1,440 1,230 820 860 900 94.7 27 Malawi 950 820 920 850 850 88.9 28 Mauritania 910 920 2,540 2,450 2,000 84.8 29 Mauritus 2,355 2,540 8,960 8,420 10,400 270.2 30 Mozambique 3,850 8,960 1,140 1,140 1,000 46.8 31 Namibia 2,140 1,140 4030 4,160 4300 145.4 32 Niger 2,960 4030 1,290 1,190 1,090 43.2 33 Nigeria 2,100 1,290 1,310 1,190 900 100 34 Rwanda 2,400 1,290 1,390 1,340 1,100 42.9 35 Sao Tome and Principle 900 1,310 1,310 1,190 900 100 36 Senegal 2,560 1,390 1,,390 1,340 1,100 42.9 37 Seychelles 1,660 1,780 1,780 1,550 1,600 96.2

Business and Economic Research ISSN 2162-4860
2014, Vol. 4, No. 1
www.macrothink.org/ber 181
38 Seychells 2,480 5,930 5,930 6,630 7,700 311.4 39 Sierra Leone 1,420 950 950 680 510 36.1 40 Somalia 610 710 710 600 600 90.9 41 South Africa 7,725 8,320 8,320 8,740 8,500 124.8 42 Sudan 1,455 1,350 1,350 1,320 1000 68.8 43 Swaziland 2,860 3,290 3,290 3,380 4,000 140.2 44 Tanzania 1,120 1,170 1,170 1,160 710 63.4 45 Togo 2,130 2,440 2,440 2,310 1,500 70.5 46 Uganda 1,560 1,200 1,200 1,250 1,100 74.4 47 Zambia 1,680 1,360 1,360 1,340 880 52.4 48 Zimbabwe 4,480 3,750 3,750 2,630 2,500 55.3 49 Algeria 7,380 6,980 6,980 5,530 5,500 74.5 50 Egypt 1,120 2,900 2,900 2,990 3,600 267.3 51 Libya 6,495 8,050 8,050 8,250 8,900 137.8 52 Morocco 2,850 3,100 3,100 3,120 3,500 122.7 53 Tunisia 4,780 5,700 5,700 5,820 6,500 153.7 All African per capita income
2,180 1,910 1,910 1,895 1,920 88.0
The Per capital Gross National Product of these Africa countries in Table IV over the same period (22 years) did not show any encouraging signal. This suggests that little or no improvement can be expected with the living standard of the populace over this period. The outcome of the rate of development cannot be compared to that of the developed countries as detailed in Table V below.
Table 5. Per Capita Gross Domestic Product In Selected Major Creditor Countries (Paris Club And Other), 1980-2002 In Us$
S/N Country 1980 2002 2002 AS % OF 1980 1 Australia 11550 23,200 200.5% 2 Austria 14,500 25,000 172.4% 3 Belgium 13,950 25,300 181. % 4 Canada 15,950 24,800 155.5% 5 Demark 16,850 25,500 151.4% 6 Finland 13,650 22,900 135.9% 7 France 19.750 24,400 174.4% 8 Germany 10,720 23,400 118.5% 9 Greece 5,180 17,200 160% 10 Ireland 6,850 21,600 417.0% 11 Israel 13,050 18,900 275. % 12 Italy 18,450 22,100 169.4%
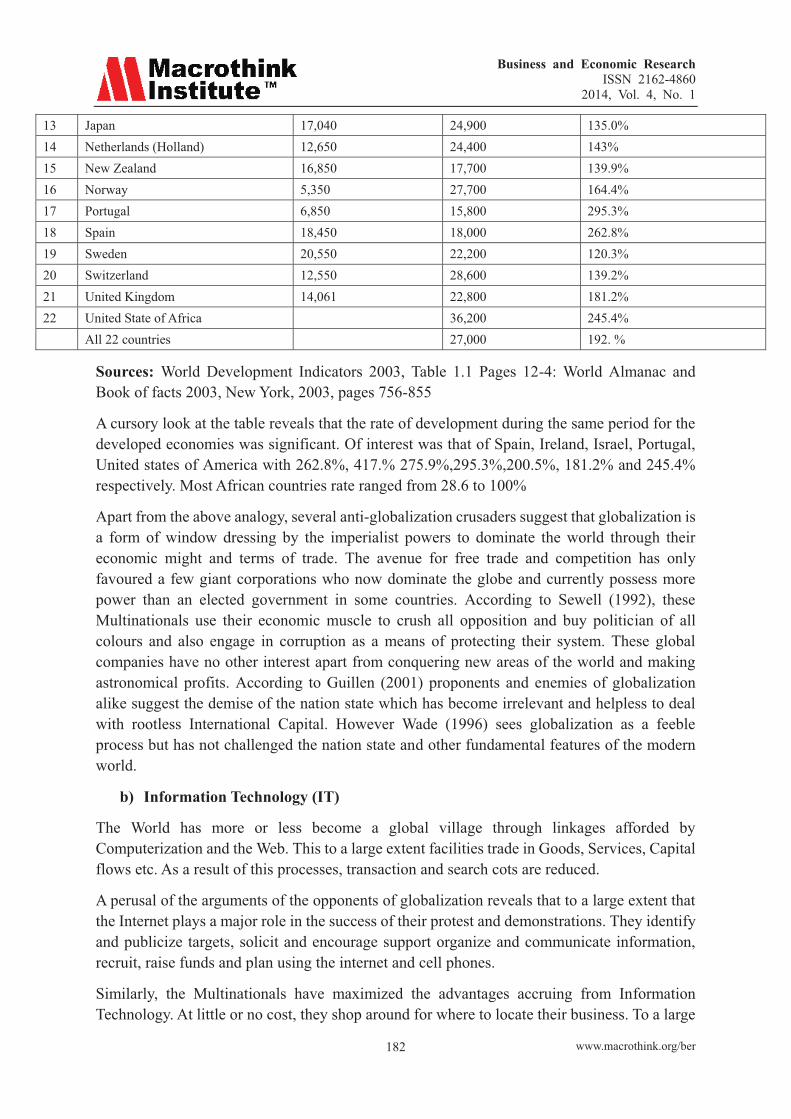
Business and Economic Research ISSN 2162-4860
2014, Vol. 4, No. 1
www.macrothink.org/ber 182
13 Japan 17,040 24,900 135.0% 14 Netherlands (Holland) 12,650 24,400 143% 15 New Zealand 16,850 17,700 139.9% 16 Norway 5,350 27,700 164.4% 17 Portugal 6,850 15,800 295.3% 18 Spain 18,450 18,000 262.8% 19 Sweden 20,550 22,200 120.3% 20 Switzerland 12,550 28,600 139.2% 21 United Kingdom 14,061 22,800 181.2% 22 United State of Africa 36,200 245.4% All 22 countries 27,000 192. %
Sources: World Development Indicators 2003, Table 1.1 Pages 12-4: World Almanac and Book of facts 2003, New York, 2003, pages 756-855
A cursory look at the table reveals that the rate of development during the same period for the developed economies was significant. Of interest was that of Spain, Ireland, Israel, Portugal, United states of America with 262.8%, 417.% 275.9%,295.3%,200.5%, 181.2% and 245.4% respectively. Most African countries rate ranged from 28.6 to 100%
Apart from the above analogy, several anti-globalization crusaders suggest that globalization is a form of window dressing by the imperialist powers to dominate the world through their economic might and terms of trade. The avenue for free trade and competition has only favoured a few giant corporations who now dominate the globe and currently possess more power than an elected government in some countries. According to Sewell (1992), these Multinationals use their economic muscle to crush all opposition and buy politician of all colours and also engage in corruption as a means of protecting their system. These global companies have no other interest apart from conquering new areas of the world and making astronomical profits. According to Guillen (2001) proponents and enemies of globalization alike suggest the demise of the nation state which has become irrelevant and helpless to deal with rootless International Capital. However Wade (1996) sees globalization as a feeble process but has not challenged the nation state and other fundamental features of the modern world.
b) Information Technology (IT)
The World has more or less become a global village through linkages afforded by Computerization and the Web. This to a large extent facilities trade in Goods, Services, Capital flows etc. As a result of this processes, transaction and search cots are reduced.
A perusal of the arguments of the opponents of globalization reveals that to a large extent that the Internet plays a major role in the success of their protest and demonstrations. They identify and publicize targets, solicit and encourage support organize and communicate information, recruit, raise funds and plan using the internet and cell phones.
Similarly, the Multinationals have maximized the advantages accruing from Information Technology. At little or no cost, they shop around for where to locate their business. To a large

Business and Economic Research ISSN 2162-4860
2014, Vol. 4, No. 1
www.macrothink.org/ber 183
extent, developing economies have received four considerations, but not without its lamentations. Places like China where they are happy to work a whole 14 hours day’s job for as little as 50p have received fair consideration. In essence, they search for cheap wage locations, yet they don’t want to pay for it.
This situation has led to accusation of abuse of corporate power by protesters. They claim that their activities are tantamount to Social Injustice, Unfair labour practices, poor working and living conditions, lack of concern for the environment, mismanagement of natural resources and ecological damage. The third World is not only treated as an area for exploitation, but for dumping and experimentation. The Miami herald was stated to have reported the death of a 15year old farm worker due to poison by a highly toxic America Cyanamid product. These are legal Pesticides imported into the country only to account for death toll of about 220,000 a year by the World Health Organization and 25Million incidents of illness including Chronic neurological damage
This situation can best be likened to that in which the Multinationals reap super-profits worldwide while their workers and the environment are subjected to super exploitation and killings. According to Sewell (2001), Ezequiel Tinajero, was 16 years old when he went to work at the Auto Trim plant in Matamoros on Mexico’s northern border with United States of America. For 12 hours a day, Monday to Saturday, he glued leather trim to the steering wheels for luxury cars. For most of that time till he reached his 20’s, he was suffering from chronic nausea, headaches and breathing problems, and his hair began to fall out. In 1995, his wife gave birth to a daughter with anencephaly, a rare condition in which the Child has no brain. The baby died two hours after birth. How many Tinajero’s have lost their lives in the hands of these giant corporations?
While it is often argued that the Institutions responsible for globalization notably World Bank, IMF and WTO, are equally guilty because they are mere servants of the Corporate giants, this can be viewed differently. This is because this paper has highlighted the gains and pains of globalization; it has effect on the developing countries and even the opposers of globalization through the magnitude of gain or pain being witnessed. In view of this, this paper submits that the corporate giants merely accepted the concepts of globalization from the proposing institutions after they observed the inherent loopholes which they have tapped to their maximum advantage and disadvantages of the developing countries.
Inferences
� A large number of the world populace estimated at about 4billion people have suddenly entered the world economy through access to internet and the web.
� Sequel to the WTO negotiations in Seattle, old barriers are now coming down, resulting in transfer of Technology and Innovations to developing countries
� Even with globalization, a proportion of countries in the world estimated at about 25% are suffering from increased poverty. This is expected to reduce if inherent loopholes in the processes are dealt with.

Business and Economic Research ISSN 2162-4860
2014, Vol. 4, No. 1
www.macrothink.org/ber 184
� Giant corporations’ call for competitiveness is a disguised monopoly as they are mere self serving organizations that violate human rights, environmental degradation and pollution in search of cheap labour
� The squeeze by multinationals grinds the working masses to deeper poverty and squalor including child labour
� As long as multinationals’ rule the earth, many will continue to experience deeper poverty amidst world’s plenty in the hands of the minority
� Capital flows between advanced countries and developing nations do not get reasonable share.
� Gap between the rich and poor nations widened � Developing counties that are primary producers with poor infrastructural developing
count their losses with globalization. Consider the under listed staggering figures since the emergence of globalization according to the United Nations Annual Development report.
� 54 Countries saw a decline of average incomes throughout the 1990’s � 21 Countries deteriorated in terms of human Capital development as measured by
Income, Life expectancy and Literacy � 30,000 Children die daily from illnesses that are totally preventable � 500,000 Women die yearly during Pregnancy or Children birth number of people
killed in armed conflicts since World War II � In Zimbabwe, the average life expectancy declined from 56 in 1970’s to 33 in 1990’s
while that of UK rose from 72 to 78 during the same period. � In Sierras Leone, 363 Children out of every 1000 do not spend up to 5 years before
they die, just as only 4 out of every 1000 in Norway do not survive
3. Recommendation/Conclusion
This paper has highlighted both the advantages and disadvantages of globalization. It has also become crystal clear that countries that are majorly primary producers only exchange their goods for highly priced products by the developed countries. No doubt, countries like China, India etc have positive result from globalization because they are not majorly primary producers. It therefore means that other developing countries should do internal integration. The major concept of economies of scale or law of comparative advantage upon which globalization is hinged upon may not work positively for the developing countries. The sincerity relative to pricing by the developed countries has totally failed. Developing countries must learn how to turn their raw materials to semi- products or finished products of very good standard so that they can compete effectively with other countries. If China and India can change the fortunes of their economy, other developing countries can. This has to be handled with care due to possible labour market induced effects. According to Hillman (2008) there could be significant consequences for perceived social justice and efficiency emanating from globalization induced labour market effects. Likewise there is a possibility of negative impact of democracy on ethnic conflict as a result of globalization more so that robust evuidence was found in the developing countries (Bezemer & Jong-A-Pin; 2013).
To achieve the above goal, the level of infrastructural facilities must be improved, so also
Business and Economic Research ISSN 2162-4860
2014, Vol. 4, No. 1
www.macrothink.org/ber 185
communication and literacy levels. This will assist the populace to maximize the gains of globalization. They will not make do with what get, rather search globally for the best place to effect their transaction. Of importance is the political upheaval pervading the developing nations. Where there is no stability, not only is planning difficult, investors will be scared of coming to that environment. I am sure that has largely accounted for the poor consideration they get from the giant corporations. Closely related are some economies that are still being ruled by military or politicians that perpetuate themselves in office. Developing countries should desist from actions that draw them backwards.
It is easy to destroy than to build. The WTO negotiations in Seattle for removal of trade barriers currently may not work for all economies. Certain countries still need to protect their infant industries so that the elephant corporations do not scuffle them to death. I am sure a mother will never throw the same challenges before a 3month old baby and a ten year old child. Eliminating trade barriers totally and opening borders for free movement of goods and services is a policy that developing countries need to view technically and with caution
The G8 summit held in June 2004 considered reducing remittances by the migrants which had risen to $75billion, far in excess of the $52billion of Oversea Development Assistance (ODA). This fund should be monitored to ensure proper targeting for those in dire need. The study by Bjornskov (2010) suggests that aid to democratic countries may benefit only the political elite which may result in ineffective funding for the desired purpose. In the same vein, developing economies should formulate policies that will:
� Stipulate minimum amount payable to each worker � Adopt profit sharing formula for staff mostly in giant corporations � Peg amount to be remitted back by these corporation while the remaining should
be ploughed back to the economy where the money was generated from or where the corporation is located
� Engage employers in welfare packages that will assist the workers in case of any fallout.
Lastly, the globalization institutions should go back to the drawing board and examine majorly the inherent loopholes currently being utilized with a view to addressing them. It is possible to find robust and positive effect of economic globalization on life expectancy as postulated by Bergh & Nilson (2010b); only if the loopholes are properly addressed. The current trend of the rich becoming richer and while the poor becoming poorer is a major setback to globalization. If it continues, it will generate outcries more than the present opponents. Remember, a hungry man is an angry man. To have just about 500 companies ruling the world is absurd. Let us change our orientation to how we can improve the lots of the fellow human beings than see profit making as a religion that has to be pursued.
Having stated the aforementioned, the study opines that globalization to the developing economies so far has been a pain, but can be harnessed to be a gain just like China and India. The world is large enough and the resources abundant for a better living standard by all the occupants.

Business and Economic Research ISSN 2162-4860
2014, Vol. 4, No. 1
www.macrothink.org/ber 186
References
Aluko Sam (2003). Background and Africa’s Economic development, Selected Papers for the 2003 Annual Conference – The Nigeria Economic Society.
Avi-Yonah, R. (2000). Globalization, Tax Competition and the Fiscal Crisis of the Welfare State. Harvard Law Review, 13, 1573. http://dx.doi.org/10.2307/1342445
Avi-Yonah, R. (2003). Globalization and Tax Competition: Implication for Developing Countries. being
Baker R. & Nodin, J. (2004). How Dirty Money Binds The Poor. Financial Times, 13th October.
BBC News (2001). What is Anti-Globalization. U.K, May.
Bergh, Andreas & Nilsson, Therese, (2010a). Do liberalization and globalization increase income inequality?, European Journal of Political Economy, Elsevier, vol. 26(4), 488-505. http://dx.doi.org/10.1016/j.ejpoleco.2010.03.002
Bergh, Andreas & Nilsson, Therese, (2010b). Good for Living? On the Relationship between Globalization and Life Expectancy World Development, Elsevier, vol. 38(9), 1191-1203.
Bezemer, D., & Jong-A-Pin, R. (2013). Democracy, Globalization and Ethnic Violence; Journal of Comparative Economics, 41(1), 108-125. http://dx.doi.org/10.1016/j.jce.2012.06.003
Bjornskov, C (2010). On globalization and human rights: the importance of types of globalization-University of Aarhus Working Paper
Conference Paper presented to the 11th Meeting of United Nations Ad Hoc Group of Experts on International Cooperation in Tax Matters, Geneva, 15-19, December
CSIS (2000). Anti-globalization-A Spreading Phenonmenon. Canadian Security Intelligence Service, August.
De Soysa, I, & Vadlamannati, K (2011). Does being bound together suffocate or liberate? The effects of economic, social and political globalization on Human Rights 1981-2005; Kyklos 64(1), 20-53. http://dx.doi.org/10.1111/j.1467-6435.2010.00493.x
Dreher, A.; Gassebner, M., & Siemers, L. (2010). Globalization, Economic Freedom and Human Rights; CEGE Discussion Papers, No 115
Guillen Mauro F (2001). Is Globalization Civilizing, Destructive or Feeble? A critique of five keys debates in the Social Science Literature. October
Haus de Vreiji (2001). Dialogue with Anti-Globalization Activists. Radio Nether, Tuesday 21 August
Hillman, A (2008). Globalization and Social Justice, Singapore Economic Review, 53(2), 173-189. http://dx.doi.org/10.1142/S0217590808002896
Business and Economic Research ISSN 2162-4860
2014, Vol. 4, No. 1
www.macrothink.org/ber 187
Mitchell David (2003). Growing World Poverty and Conflict shows the Barbarity of Capitalism, July
Potrafke, N. (2013). Globalization and Labour Market Institutions: International Empirical Evidence; IFO Working Paper, No 154.
Prasad, E; Kose, M; Rogoff K., & Wei, S (2003). Effects of Financial Globalization on Developing Countries: Some Empirical Evidence. IMF
Roseanna, M. (1997). Modernity and Globalization.
Sewell Rob (2001). Imperialism, Globalization and the Way Forward, May
Sewell W. H. (1992). A Theory of Structure, Duality, Agency and Transformation. American Journal of Sociology, Vol. 98, No 1, pp1-29.Imperialism, Globalization and the Way Forward, May. http://dx.doi.org/10.1086/229967
Singh Ajit & Dhumole Rahule (1999). The Global Merger Wave: Consequences for Developing Countries-Global Policy Forum, November.
Stallings Barbara (2001). Globalization and Liberalization: A view from the developing Countries United Nations Economic Commission for Latin America & the Caribbean, February
Stiglitz, J. E. (2003). Globalization and its Discontents. W. W. Norton and Company Inc., New York.
Wade R. (1996), Globalization and Its Limits: Reports of the Death of the National Economy are exaggerated in Berger S. And Dore R. (eds), National Diversity and Global Capitalism, Cornell University Press.
Wolfensohn James (2001). Globalization Growth and Poverty: Building an inclusive World Economy. World Bank, December.
Yusuf S. (2001). Globalization and the Challenge for Developing Countries”, World Bank, June
Copyright Disclaimer
Copyright reserved by the author(s).
This article is an open-access article distributed under the terms and conditions of the Creative Commons Attribution license (http://creativecommons.org/licenses/by/3.0/).

Business and Economic Research ISSN 2162-4860
2014, Vol. 4, No. 1
www.macrothink.org/ber 188
The Theory of Justice and Profit Maximization
Gennady Bilych
Dept. of Management, UPEC Corporation
Belgorod 20 Popova str., 308000, Belgorod, Russia
Tel: 7-472-220-2033 E-mail: [email protected]
Received: February 18, 2014 Accepted: March 8, 2014
doi:10.5296/ber.v4i1.5139 URL: http://dx.doi.org/10.5296/ber.v4i1.5139
Abstract
At present, all existing so-called theories of justice, except only for utilitarianism, divide the history of humanity into long years of hopeless night and a few minutes of long-awaited dawn. Any theory must be disregarded if it assumes that for centuries people have come to terms with their lack of freedom only because of mental limitations or an unusual strictness of the ruling elite. Of course, 500 or 1000 years ago, as is the case today, many people were dissatisfied with their position in society, but nevertheless the majority of the population of Ancient Egypt, for example, or the Roman Empire considered the established order to be entirely justified. Therefore any theories that are not able to explain historical changes to people’s perceptions of justice must undoubtedly be deemed unrealistic and incorrect. Utilitarianism does not have this disadvantage, but it does have another well-known defect which has to do with the use of the strange and immeasurable concept of utility. It is rather difficult to give a logical explanation of how a concept that is so actively criticized and despised by many economists can continue to be the foundation of all economic science. In my opinion, to this day there have never been any significant barriers preventing the use of personal profit as the primary motive for human behaviour. This will not only restore the position of utilitarianism so undeservedly lost, but also provide an opportunity to solve a number of theoretical issues and will also fill with optimism the conclusions that follow from Arrow’s Impossibility Theorem.
Keywords: Theory of justice, Profit Maximization, Arrow’s Impossibility Theorem
1. Introduction. Is the Theory of Justice Part of Economic Science?
I beg to differ with the opinion of Rothbard (1977) and many other respected economists that economic theory cannot be a source of ethical evaluations and recommendations. Rothbard believed that economists are obliged to maintain a position of ethical neutrality and under no circumstances should they be guided by value judgements. They should be interested only in economic processes; they should give recommendations and warn of the possible

Business and Economic Research ISSN 2162-4860
2014, Vol. 4, No. 1
www.macrothink.org/ber 189
consequences of certain practical steps taken by governments and individual economic agents. Ethical assessments and questions of justice are areas of interest for specialists of other sciences. However, in my opinion, these arguments are wrong. Allow me to explain. If we assume that when taking economic decisions people seek to not only maximize their profit or utility, but are also guided by certain ethical principles that have nothing at all to do with maximization, this means that these principles have an effect on their level of wellbeing. If, when purchasing a particular item, a person does not choose the item that will provide more profit or utility, but which the person prefers due to ethical reasons, their level of economic wellbeing will, most likely, decrease. Furthermore, a decision such as this could provide an additional market advantage to a producer that is far from being the most economically efficient. As a result, the level of output of goods and services may be lower than it could have been. This means that the ethics and morals that the members of a certain society are guided by will be inextricably linked to the wellbeing of that society. The level of income of citizens of a country will depend on, for example, the principles of justice in effect in that country. Consequently, there can be no talk of ethical neutrality among economists. An economist can and must be concerned with issues of ethics, morals and justice, he or she can and must study them and he or she can and must give ethical recommendations and advice.
2. Literature Survey. Discrepancies with Existing Theories of Justice
In the latter half of the 20th century there was a dramatic increase in interest among academicians and ordinary citizens towards problems associated with the occurrence and the spread of ethical norms, and moral principles and ideals in society. Theories of justice began to appear and spread like mushrooms after the rain. Quick success and global recognition lay in wait for their creators. This interest did not appear out of nowhere and was connected with the major political, social and economic changes that took place in virtually all four corners of the world. The world changed rapidly. Many countries became independent, the movement against racial discrimination grew, women began to play a larger role in politics and the economy, family values were reviewed, various youth movements and cultures were formed, and the attitude to sexual minorities changed. Major changes always cause people to seek out certain moral pillars and foundations, which do not allow society to be divided into sections and provide an opportunity to achieve some kind of social stability. Urgent answers to a great deal of questions were needed. What was happening? How should we react to this? What were the limits of freedoms? What is a fair society?
2.1 Imaginary and Real Disadvantages of Utilitarianism
At that time, utilitarianism, as a theory explaining human behaviour which gave entirely definitive answers to society’s questions and completely dominated for more than a century, was under constant criticism. It must be admitted that much of the criticism was unfounded and was rather easily brushed aside by supporters of utilitarianism. The main claims of Rawls (1971) and other critics of utilitarianism (Frey, 1984; Harsany, 1982; Gordon, 1980; Hare, 1981) usually stated that in their opinion the theory allows the happiness of certain individuals to be sacrificed in the name of the happiness of the majority. Consequently, utilitarianism allows clear cases of injustice to exist in a society. For example, the profit obtained by slave owners

Business and Economic Research ISSN 2162-4860
2014, Vol. 4, No. 1
www.macrothink.org/ber 190
may be rather high; therefore the overall amount of benefit may be higher in a slave-owning society. It would be this society that would be preferable according to the criteria of the maximization of utility. In the opinion of Rawls, this result makes utilitarianism absolutely unacceptable to any rational person. But this is a shot off target. In actual fact, I believe that it is a wonderful example in defence of utilitarianism. It finally convinced me of the superiority of utilitarianism over other theories because only utilitarianism is able to clearly indicate the causes of the long period of the life of hierarchical states and answer the question why the majority of people living at that time were completely satisfied with this. No other theory in the 1970s or today gives any logical explanation for the existence of slave-owning and feudal states in the past and also modern non-democratic countries, the majority of the population of which took and still takes the established order to be entirely just. It is naïve to assume that these countries existed and exist simply because of the utter weakness of the public and the unbelievable tyranny of rulers. In my opinion, the idea of North and Thomas (1973) is much more convincing. According to this idea, feudal institutions, such as serfdom are an effective contract between serfs and landowners providing protection in exchange for the labour of serfs on the landowner’s land. Today, we may endlessly discuss the shortcomings of slavery and feudalism, but it must be recognised that they gave humanity the opportunity to reach a significantly higher level of goods production than in any preceding periods. In those times the choice was not between slavery and the freedom of today, but between slavery and a meagre existence in a primitive society.
Hundreds of pages of various books and articles are filled with such dubious accusations. Here is another similar example demonstrating, in the opinion of Hayry (1994), the absolute indifference of utilitarianism towards the fate and rights of individuals. The sheriff of a small town in which a terrible crime has taken place, after unsuccessful attempts to find the criminal, is forced to commit a clearly unjust act. In order to appease the outraged and frightened residents of the town, the sheriff charges a person who has nothing to do with the crime. By sacrificing one person, the sheriff makes everybody else happy. Hayry believes that this is what utilitarian theory demands. Is this correct? No, the utilitarian theory demands nothing of the sort. The case described would not contradict the arguments of the utilitarian theory if in the town there were only irrational, brainless and completely isolated animals. Thankfully, however, people are different to animals in the fact that they are highly rational, have brains, exchange information and constantly interact with one another. Every rational resident will be concerned with how the sheriff adheres to the law when carrying out his duties because anybody could be the person that is wrongfully accused of the crime. This means that everybody has a very definite chance of spending the rest of their life in the town jail, if the sheriff is allowed to break the law. In evaluating what happened, people will take into consideration all the possible outcomes for themselves. Utilitarianism does not require that the sheriff break the law, but rather that he strictly follows existing legislation. Furthermore, the very fact that events such as these do sometimes happen in real life is further supporting evidence in favour of utilitarianism. Utilitarianism readily allows the existence of dishonourable sheriffs in the event of limited access to information in the town, for example, disunity of the town’s residents, a lack of political activity or a lack of control in the judicial system.

Business and Economic Research ISSN 2162-4860
2014, Vol. 4, No. 1
www.macrothink.org/ber 191
Such attacks on utilitarianism are quite easy to fend off, but this theory does still have an Achilles heel. It is a social contract that allows a large and a small number of citizens to avoid serious conflicts, live together in the same area and pursue their own personal objectives. This type of contract is not put down on paper and nobody signs it, but it undoubtedly exists and has existed at all times and in all societies. No tribe, town or country can exist and develop stably without it. A social contract involves rules of human behaviour that people follow or try to follow on a daily basis when performing certain acts. The problem of utilitarian theory is that in a society of individuals seeking to maximize their utility, a contract such as this is not possible. The process of public voting will inevitably arrive at a dead end, and only a dictator will be able to provide a way out. The voting of free individuals will continually generate cycles (Arrow, 1951; Kramer, 1973), therefore in a democracy it is not possible to have a vote that will satisfy everybody. These rather unfortunate conclusions of the utilitarian theory were no secret even in the 19th century. Mill ([1861], 1979) was aware of the obvious weaknesses of the principle of “maximum happiness” proposed by Bentham ([1789], 2005), and attempted, albeit unsuccessfully, to save utilitarianism. His proposal to maximize happiness not from case to case, but in the long term, and his division of pleasures into higher and lower look unconvincing and will not pass the reality test (Sandel, 2009). The arrival of Arrow’s famous work (1951) revived the interest in this problem, the essence of which lies in the irregularity of human desires, which causes an inability to compensate for the losses of some members of society at the expense of the benefits of others. If the utility obtained by a certain individual was measurable and comparable to the utility of other individuals, it would not be very difficult to reach an agreement and conclude a social contract. Rules and norms of behaviour would be established whereby the total level of utility would reach a maximum point. Individuals who increased the utility obtained as a result of the adoption of a new law, for example, could easily compensate for the losses suffered. As a result of the exchange of utility, the situation for everybody would improve and the law would be adopted. However, the immeasurability of utility very often leads to a situation similar to that described by Sen (1970), when Prude, a virtuous citizen, and Lewd, a libertine, are unable to agree on reading the book Lady Chatterley’s Lover.
2.2 Disadvantages of Other Theories of Justice
For other theories of justice, the problem of the social contract is, in my view, more serious and less easily solvable. Not only do absolutely all theories suffer from hidden utilitarianism and inherit its well-known defect, but their own mistakes also cause a number of additional problems.
Dworkin (1977) was absolutely correct when stating that Rawls’ initial contract under the conditions of a veil of ignorance (Rawls, 1971) is not only a weak type of contract, but not a contract at all. For the stability of society, it is of critical importance that each and every one of us is prepared to consider the contract fair, not only under conditions when we know nothing about our own talents and capabilities, but also under real conditions when everybody knows everything. Otherwise, many educated, successful and talented people will believe that their rights are being violated and they will try to change the established order. It is clear that we all, on a daily basis, when performing various actions and participating in a number of acts of
Business and Economic Research ISSN 2162-4860
2014, Vol. 4, No. 1
www.macrothink.org/ber 192
exchange, evaluate the laws, rules and regulations in effect in society. These evaluations are carried out not under a veil of ignorance, which is essential for concluding a social contract in Rawls’ theory, but under conditions when every individual knows their place in society, their talents and what their future capabilities may be. Whether or not the established laws, rules and regulations are kept depends on these daily evaluations. If the majority of citizens believe that the established laws, rules and regulations are not just, then sooner or later they will be changed. This is exactly why Rawls’ theory, based on the extremely dubious idea of the hypothetical initial contract, does not pass tests at a micro level. Just try and imagine, as Nozick (1974) suggests, a workforce in which the abilities of individuals, as Rawls recommends, are placed under common patrimony! This is clear exploitation of certain people by others! Rawls’ doubts of the capability of people to conclude a social contract under real conditions and not only under a veil of ignorance are completely unfounded. It is quite clear that there are many examples in real life when mature individuals with life experience are in a condition to establish fully functioning laws and regulations that satisfy everybody. Pirates had their own set of laws, each member of the crew performed specific functions for which they were responsible (Leeson, 2009). For breaking the law or failing to perform their duties, all pirates faced severe punishment. This helped to create a formidable and efficient team adept at robbery. Throughout most of human history there has been a continual process of development and settlement on new lands. People from opposite ends of the planet formed societies large and small, created laws and observed accepted rules of behaviour. Despite Rawls’ assertion, in order to do so they did not require an initial contract under a veil of ignorance. Rational people need nothing more than common sense in order to establish rules and regulations that suit everybody or the vast majority of society.
With Nozick (1974), matters regarding the social contract are no better than with Rawls. I indeed strongly support his desire to minimize state functions, but it must be understood that a limited state was not always and not in all cases the best form of social contract. Nozick’s ideas would never have received support from ancient tribes of hunters and gatherers. If his cries of “Down with the leader! Long live freedom!” were heard and supported by the members of a tribe, they would most likely not live for a long time at all. They would not only die at the hands of members of hostile tribes, but they would also starve. Life as part of a tribe was not only much safer, but also more nourishing. Morally justifying the existence of a minimal state is reasonable in modern times, with the current level of economic development, but it was not at all reasonable to do so in the distant past. Nozick’s moral rights are no better than believing in God (Gauthier, 1985) because it remains completely unclear what his boundless faith in the minimal state is based on.
Gauthier (1985) does not hide the connection between his theory of justice and utilitarianism. Gauthier assumes there are rational motives in all individuals, but for some reason in his concept they must seek to maximize common utility. Gauthier does not believe in the free market and proposes supplementing it with cooperation because, in his opinion, cooperative behaviour enables more to be achieved. This is by no means always the case and furthermore, very often, cooperation causes much more harm than good. One only has to recall the actions of Soviet cooperative enterprises and collective farms, which nobody would think of calling a
Business and Economic Research ISSN 2162-4860
2014, Vol. 4, No. 1
www.macrothink.org/ber 193
success. Even Gauthier himself would most likely prefer several independent sellers, rather than a single trading monopoly. His belief in cooperation, as with Nozick’s belief in a minimal state, is no better than belief in God.
Communitarianism copes rather well with the explanation of the existence of different perceptions of ethical norms and moral principles in different societies (for example: MacIntyre, 1984), but is utterly helpless when it comes to explaining how such societies can successfully cooperate with one another. Walzer (1983) is certainly correct in asserting that the rules of justice in any country are connected to its history and culture. However, giving this exclusive attention is not only unwise, but also dangerous. The theory of justice, based on the ideas of a common beginning, cultural traditions and shared history, is not as harmless as it may seem at first glance. The theory can be used to quite easily justify the undesirability of any changes in a society, including national, cultural and religious changes. At the present time, with increasing migration processes and as ethnic compositions, religious beliefs and cultural traditions are changing rapidly in many countries and regions, this theory may seem rather appealing and attractive in the eyes of radical nationalists or extremely conservative citizens and could become a major weapon in their hands. One can only hope that communitarianism will never be able to gain a significant number of followers and the life span of such theories will be very brief.
It must be recognised that all theories of justice existing today, including those which have not been talked about, cannot be thought of as significantly credible for two reasons. Firstly, it remains entirely unclear how a social contract is concluded. What is it based on? What wishes and desires of individuals allow this to be done? How do people ethically assess different events? Why do these assessments usually coincide? Secondly, all theories, except for utilitarianism, exclude any changes in the time of people’s perceptions of justice. But such changes do take place. This is clear. Many laws, rules and regulations, which used to be thought of as good, are now seen as extremely negative and vice versa. Much of what is thought to be fair today, will no longer be so in the future. Consequently, all theories of justice must be rejected because they are not able to explain the existence of a social contract and historical changes to laws, rules and regulations. However, I do not believe that everything is so dismal. I am certain that utilitarianism, which is based on the human desire for profit, may provide clear answers to any questions and I will attempt to prove this.
3. Theory of Justice
3.1 Which Questions Must a Theory of Justice Answer?
Any theory is only worth attention and discussion if it does not contradict clear facts and gives correct answers to events that have happened in the past and are happening today. Therefore, for further discussion it will be useful and rather easy to formulate a number of simple criteria of realism which a theory of justice must demonstrate. In my opinion, these criteria are as follows.
The theory must explain changes in people’s perception of justice that take place and have taken place throughout the entire period of human existence. Only a few centuries ago, people
Business and Economic Research ISSN 2162-4860
2014, Vol. 4, No. 1
www.macrothink.org/ber 194
acquiesced to the ruling of a king, czar, feudal lord or emperor and believed the established order to be fully just. According to Aristotle, a fair society is a hierarchical society where equality is only possible for equals and those not equal should be satisfied with inequality. If a superior hits you, you should not hit back. However, if a superior is hit then the perpetrator should not only be hit back, but severely punished. A man should rule and a woman should unquestioningly obey him. Usury is evil; it is not fair to demand interest, money should not create money. The majority of Aristotle’s contemporaries would have agreed with these words and this should not come as a surprise to anybody. This is what people believed justice to be. But then everything rapidly changed. Suddenly people were no longer satisfied with the laws and regulations that had ensured order and stability for centuries. People began to demand change; people began to demand new laws and regulations that were completely different to those of the past. A theory of justice must certainly be in a condition to explain such changes. Otherwise it is infinitely far from the truth.
Freedom does not have to be an unconditional sign of justice. This is closely related to the previous criterion, but, in my opinion, it must still be highlighted. There is a good reason for this. For some reason, many people consider freedom to be a natural and unconditional human right. Almost no one would argue with the fact that the desire for freedom in each and every one of us is laid down by nature itself, we are born free and value freedom above all else. As expressed by Rawls (1971), human rights can neither be subject to political bartering, nor be a bargaining chip in the calculation of public interests. We will never agree to be happy slaves or gracious subjects of a feudal lord (Sen, 1999). However, what is this certainty based on? Not too long ago most people living in Europe were subjects of feudal lords; they did not protest against this and perhaps many of them were even quite happy. Why is it so that many countries have not yet become developed democracies? Why do we often consciously seek to limit our freedom, by entering into marriage for example? What causes us to be subordinated to a manager at work or follow the orders of a commander in the army? I believe that our attitude towards freedom is like this simply because we happen to live today and not 500, 1000 or 3000 years ago, when achieving freedom usually meant immediate death by starvation or murder at the hands of the enemy. Today freedom certainly allows one to achieve a great deal; democracies demonstrate impressive economic results. But this was not always so. In the past it was often the case that not societies with the most freedom, but societies with the strongest rulers occupied the top positions. And this power was praised, glorified and supported by the majority of the population.
A theory of justice must predict the future, in any case it should be able to point to possible changes in laws, rules and regulations that will most likely happen in the future. Will the market really continue to force out more and more non-market rules, as feared by Sandel (2012)? Will child trafficking and the sale of human organs become a normal and everyday occurrence? Will governments start to recruit more foreign citizens in order to carry out military action? How reasonable will it be to offer and purchase citizenship and what will the attitude be towards this in the near future? Will copyrights continue to be observed? Of course, a theory of justice is not able to give a definite answer to all questions, but it must be able to express certain assumptions and justify them.

Business and Economic Research ISSN 2162-4860
2014, Vol. 4, No. 1
www.macrothink.org/ber 195
A theory of justice must explain the existence of different laws, rules and regulations in different societies. Why are there countries that are not free? Will they become free? Why in such countries does religion have such a strong influence? Should the laws be the same in all countries? Following the logic of Rawls (1971), Nozick (1974), Sen (1999) or Shapiro (2012), one must assume that when a social contract was concluded in certain countries, something went wrong. Rules and regulations were established that in no way served the interests of the majority. Perhaps MacIntyre (1984) was right in saying that laws are very closely linked to the history and culture of a society. However, in this case it remains unclear how changes occur in these laws and why they occur. For what reason do the laws, rules and regulations in modern Japan differ so greatly from the laws and regulations of modern China? If this has to do with the difference in history and culture in these countries, then why is freedom valued in South Korea and not in North Korea? We are entitled to demand answers to these questions from a theory of justice and if there are no answers, then there is no theory.
A theory of justice must be based on the desire of individuals to meet a certain objective. In my opinion, the idea sounds very strange that individuals, when creating institutions and laws, seek to minimize risk and uncertainty (North, 2005), when establishing a fair society they try to be honest (Rawls, 1971), when they purchase goods they maximize utility and when selling products they maximize profit. If people’s desires are so diverse, then it remains completely unclear as to why, when creating institutions, they do not take into consideration the possibility of obtaining a certain profit and when selling a product they do not always strive to be honest. It would be far more logical to assume that when solving all the various issues they face, people attempt to pursue all goals simultaneously. However, if this is the case, we will have to admit that they will not be able to resolve any of the issues they face. Solving any problem will become an intricate puzzle. As I already noted (Bilych, 2012), an individual such as this would most likely require urgent psychological care if they attempted to purchase a computer which they intend to use both for pleasure and for work. In attempting to pursue multiple goals at the same time, the individual will not be in a position to perform a task that is this simple. What should the individual maximize in this case? Profit or utility? If they are looking for entertainment, they should maximise utility. However if they wish to use the computer for work, they must maximize profit. Therefore every trip to the shopping centre would simply lead to a nervous breakdown and a split personality. But what will happen with the individual if they try to minimize risk, avoid uncertainty and act honestly? It is most likely that this individual will suffer immediate clouding of judgement and a quick death. Therefore, in order to give humanity the opportunity to continue its existence, we have to determine the one goal that humans strive for. Naturally humans must pursue this goal when solving ethical problems, and when attempting to create institutes, and when at work, or when going shopping. It should also be remembered that this goal must enable individuals to conclude a social contract that all citizens are prepared to support, or the majority of them at any rate. What kind of goal is this? What do individuals strive for? Let us attempt to provide an answer.
3.2 Do Consumers and Producers Exist? How Can Goods Be Divided into Consumer Products and Factors of Production?
Modern economic science argues that there is no link between the processes of production and

Business and Economic Research ISSN 2162-4860
2014, Vol. 4, No. 1
www.macrothink.org/ber 196
consumption; in textbooks, the chapters on the behaviour of producers and consumers are at a respectable distance from one another and in no way linked to each other. Economists believe that an average person, when purchasing apples or a car, attempts to maximize their utility. However, if tomorrow this person opens a restaurant and becomes an entrepreneur, all their goals and desires instantly change in the most unexpected manner. This person, and it might come as a surprise even to them, will all of a sudden discover that now, when purchasing apples or a car, they are obliged to obtain a profit. Such changes in human consciousness surprise not only ordinary citizens, but also some economists. As noted by Machlup (1971), if we assume that consumers maximize utility, then there can be no grounds to believe that firms managing such consumers must seek to maximise profit. However, these doubts have only been expressed by a few economists; the majority confidently insist that consumers and producers are completely different people. Therefore, in order for each of us to feel comfortable and confidently maximize what we need, it is extremely important to identify the main differences between consumers and producers.
In the view of authors of textbooks on microeconomics (for example: Samuelson & Nordhaus, 2004), the main differences between consumers and producers is that consumers buy finished goods and sell factors of production, whilst producers sell goods and buy factors of production. However, I believe there are at least two reasons to doubt that this statement is true. Firstly, producers may sell not only goods, but also factors of production, to other producers for example. They may buy not only factors of production, but also finished goods. Consumers may sell not only factors of production and buy not only goods. Secondly, I am always amazed at the very persistent attempts to divide all benefits into consumer goods and factors of production, which very often is virtually impossible to do. Try to name at least ten exclusive goods or exclusive factors of production. This is no easy task and will most likely be impossible. Is land always a means of production? What are cars, petrol, electricity, computers, tables, books or spanner? In one case they are goods and in the other they are factors of production. A natural question arises: why divide them at all? What is the reason for dividing products into final and intermediate products? What is the point? Yes there are intermediate and final goods and the same product can in one case be a final product and in another case an intermediate product. I believe that these grounds are not sufficient to divide people into certain groups and give them different objectives.
Since economic textbooks cannot clearly indicate the goal which I must pursue, I will try to do it myself. Who am I, a consumer or a producer? For many of us it will be rather difficult to give a definitive answer to this simple question. We are all consumers, and in all likelihood nobody would dispute this. However, few people would agree that we are all producers. This is strange because in order to consume something, we have to produce it first, otherwise there will be no means to purchase goods or services. Consequently, any person is always both a consumer and a producer. We are still producers even when we are employees. We only agree to become employees at a company when the salary offered is greater than the income we could earn working independently. This means that when working in a firm, we produce more. This measure also spares us the risks and uncertainty, which are inherent in entrepreneurial activity. As a reward for their labour, an employee receives the product they produce, in the form of

Business and Economic Research ISSN 2162-4860
2014, Vol. 4, No. 1
www.macrothink.org/ber 197
money of course. The entrepreneur also receives a reward in the form a produced product. They then go on to exchange their produced products for goods, services, capital goods, or resources. In other words, people voluntarily come together for joint production activity, some of them take on risks and manage the production process, the others are directly involved in production and after a product has been produced, they all go down to the market where they meet with other producers and carry out a mutually beneficial exchange. What are the main differences between consumers and producers? Why do some of them maximize profit and others maximize something unknown, a certain immeasurable and vague utility?
All the above inclines me to believe that I am both a consumer and a producer. In order to avoid splitting my mind in two and becoming a regular client at a mental institution, I will still need to define the single goal that I must pursue.
3.3 Maximization of Utility or Maximization of Profit?
The concept of utility first appeared approximately 300 years ago when the fundamentals of the theory of probability were being established and it is deservedly associated with the mathematician Bernoulli ([1738], 1954). Later, thanks to the efforts of the English philosopher Bentham, the economist Jevons and their numerous followers, utility became firmly and successfully rooted in economic science. How could it be so that a member of such a high-standing family of Swiss mathematicians could need such a vague concept to explain human behaviour? Bernoulli believed that people associate the value of any object with the benefit they can gain from it. It seems that it would be logical for the mathematician to use a concept such as profit as a benefit. However, for some reason, Bernoulli preferred to use utility. In my view, there are two reasons for this. Firstly, in the early 18th century in Europe and other parts of the world, barter was still the most popular form of exchange and the money economy was only just beginning to win its right to life (Braudel, 2011). At a time when large-scale production did not yet exist, when the use of hired labour was rare and irregular and steam engines had only just begun to appear, the meaning of the word profit raised no fewer questions than the meaning of the word utility. Secondly, Bernoulli discovered what later became known as the law of diminishing marginal utility. An income of a one thousand ducats means more to a poor person than to a rich person, although the monetary value is the same for them both. The benefit or utility gained from earnings are inversely proportional to current wealth. Somebody has a capital of 100,000 ducats and somebody else has the same quantity of half-ducats. If the former earns 5,000 ducats and the latter the same amount of half-ducats, it is quite clear that for the former a whole ducat will be the same as a half-ducat is to the latter. This means that different people value different profits in the same way. However, if you think about it, this in no way rejects the possibility of using profit rather than some kind of utility as a motive by which humans make decisions. Both the poor person and the rich person will value their earnings in the abovementioned example in the same way because the profit rates in these cases are equal – 5%. In other words, the effectiveness of their cash investment is the same. Obviously, in order to evaluate any economic activity the key criterion for any individual is the effectiveness of decisions made, therefore it is the profit rate that is most important, not the absolute value of profit. A person acts rationally because having determined the most effective method of investing money, they will have the opportunity to invest additional funds.

Business and Economic Research ISSN 2162-4860
2014, Vol. 4, No. 1
www.macrothink.org/ber 198
Therefore, after having invested a considerable sum of money in the most profitable project, the individual will be able to obtain maximum profit.
Using the principle of maximization of utility to explain human behaviour has never caused much excitement among economists. Utilitarianism, according to Payne (2006), is both despised and widely used. The reasons for this are well known. Utilitarianism is a relatively consistent theory based on a simple measurement of preferences, which is what makes it attractive. A moral evaluation of any event arises from an arithmetic calculation, however in order to obtain an overall result, we have to measure the preferences of a single criterion (Sandel, 2009), which, in the opinion of many is virtually impossible. The overwhelming majority of economists currently doubt the measurability of utility and this is no surprise. How can you measure something that nobody can clearly define? How can you calculate happiness, satisfaction or a lack of suffering? These same issues at one time were of great concern to Moore (1922) who attempted to create a conceptual revolution in utilitarianism. He proposed using the word benefit instead of utility and the expression “maximum net sum” instead of “greatest happiness for the greatest number of people”. Unfortunately, however, people did not listen to Moore. But if you do listen to him and take the next logical step and replace the word benefit, which no economist can give a clear definition of, with profit, then everything immediately falls into place. Profit can be measured and compared, it is able to compensate for losses incurred and therefore allows the existence of a social contract.
Today, very few would object to the fact that consumers fairly often seek to maximize profit and not utility. It is impossible not to agree with Simon (1971) who argues that consumers gather certain information until the point when gathering additional information becomes equal to the marginal profit that may be obtained as a result of possessing that additional portion of information. I believe that the ideas of Becker (2003) seem so clear and convincing for the very reason that in order to explain human behaviour, he normally uses the words profit and benefit and only very rarely the word utility. A person will obtain further education to the point where their marginal costs are equal to the profit they will obtain in the form of a higher salary. A criminal will stop committing crimes if their marginal costs are greater than the amount of criminal proceeds or profit. Discrimination against ethnic minorities only exists because many representatives of the majority obtain an economic benefit from discrimination.
Under what circumstances does a person maximize only utility? Perhaps this occurs when a person buys food, goes to the theatre, looks after children or trains in the gym. Perhaps it applies to those cases where a person is simply trying to live normally. However, in order to function normally, a firm or company also needs water, electricity, stocks and raw materials on a daily basis. Furthermore, companies very often take care of their employees, holding sports competitions and social events. On these grounds, nobody would think of arguing that companies and firms sometimes attempt to maximize utility. Of course, a person may prefer to consume green apples, rather than red apples, they may love music and spend all their spare time playing golf. But what does this change? We are not going to accuse producers of being irrational and challenge their desire for profit only based on the fact that they conduct charity events, paint the workshops in a different colour, or plant fir trees around the production plant.

Business and Economic Research ISSN 2162-4860
2014, Vol. 4, No. 1
www.macrothink.org/ber 199
3.4 Utilitarianism Based on Maximization of Profit. A Market Triumph
What should our attitude be towards violations of intellectual property rights? Should the law protect the observance of such rights on the Internet and how necessary is it? Should a person who uses another person’s ideas without the permission of the author always be subjected to moral condemnation? It is not too difficult to answer these questions if we consider people’s desire for profit, but it is completely impossible if we believe that people maximize utility. Many years ago, Coase (1988) very clearly demonstrated the way in which people solve the problem of the effective distribution of rights. Rights to something are normally granted to the individual who can obtain the maximum benefit from such rights. In this case, Coase deliberately preferred to use the word benefit and not utility. Benefit is something more real and material than utility. Coase hoped that the benefit of one individual would be able to be compared with the benefit of another individual and, most importantly in terms of the effective distribution of rights, benefit allows compensation to be paid. And in Coase’s examples compensation of individuals can only be paid from profit obtained. Of course, in this case the benefit is nothing other than profit. If a certain person or group of people can obtain a higher profit by introducing a new device, for example, than the owner of the invention, then this person or group of people will offer the owner sufficient compensation in exchange for the opportunity to use the invention. If the creator of the invention is independently able to make better use of their property than others, they will continue to own it alone. The refusal of a creator, for certain reasons, to agree to conclude a profitable deal has no effect on the final distribution of rights. An inefficient inventor will have less funds to protect an idea from the encroachments of third parties than those individuals seeking, lawfully or unlawfully, to acquire it. Therefore, however much we try today to defend copyright and increase liability for its violation, in the future these rights will to a certain extent be increasingly violated, which will lead to the adoption of more liberal laws. Many people already have a rather tolerant attitude towards violations of copyright law in the field of medical drugs, and scientific books and journals are increasingly appearing in the public domain. Very soon society will support more liberal laws governing intellectual property rights and will consider them fair because more efficient owners can offer society higher profits and higher economic growth. In this example we can easily see that utilitarianism based on maximization of profit explains the historical changes in people’s perception of justice, does not consider economic rights and freedoms to be an unconditional sign of justice, predicts the future and is based on well-defined desires of individuals.
The most obvious and important conclusion that follows from the above is that in countries with a market economy, absolutely all market solutions should be considered fair. A free market is fair because it is effective and its decisions lead to the maximization of personal and common profit. Of course this statement is only true when a market exists, when decisions in it are made freely and when there is no disruption to its function. The last observation is very often forgotten by numerous critics of a market accusing it of immorality and injustice. When Sandel (2012) doubts the fairness of market decisions in cases of making profits on medical care vouchers in China or the trading of free tickets to see Shakespeare plays in New York’s Central Park, he overlooks the circumstance that these examples are in no way connected to the

Business and Economic Research ISSN 2162-4860
2014, Vol. 4, No. 1
www.macrothink.org/ber 200
function of a free market. In these cases there is no market and the people are outraged not so much at the trading of vouchers and tickets, but rather at the fact that the government was not in a position to provide them with the required amount of public goods. Having paid once via taxes for the services of a doctor or to see a show, people are forced to pay again for the provision of public goods.
People most often have two main complaints against the market. Namely the violation of the principle of equality and the inaccessibility of certain goods for poor people. However, in my opinion, these charges are not being addressed to where they should be. I very much doubt that a queue facilitates equality and distributes goods in a fairer manner than a market. If a person is willing to pay a certain amount of money and move forwards, this means that they place a higher value on the goods offered than others. The quantity of the goods does not decrease and the same number of citizens can still purchase them. Furthermore, if we give the market the opportunity to function freely, the quantity of goods increases and their prices decrease. They will be purchased by a greater number of citizens and they will become more affordable for the poor. The inaccessibility of goods for the poor is associated not with the function of the market, but primarily with the lack of a market and also an insufficient level of development of the economy and labour productivity.
If the owner of a hardware store listens to the advice of Kahneman, Knetsch & Thaler (1986) and does not increase prices on snow shovels after a snowstorm from $15 to $20, this could mean that a shovel would go to a person who needs it to clear a garden path and not to a person who urgently needs to clear snow from their car and take their child to hospital. Considering such a scenario, accusing the market of injustice will no longer seem so fair to many people. It is fair when a limited number of shovels are obtained by the people who need them most of all and not simply those who were first in the queue. A rational hardware store owner will not raise prices on shovels, if there is a sufficient amount in the warehouse, as the owner will primarily be interested in selling as many shovels as possible. The owner will certainly raise prices if there are not enough shovels to satisfy the demand. This means the store owner will receive the maximum possible profit, the sick child will be taken to hospital and the garden path may remain covered in snow.
However, one question remains unanswered. What if the parents of the sick child do not have $20 for a snow shovel or enough money to pay for the services of a doctor? Can people who seek to maximize their profits solve such problems? Yes they can and they do. As surprising as it may sound, people only have this ability due to their eternal and irresistible desire to make profit. The next section will examine these unexpected qualities of rational people.
3.5 Arrow’s Theorem
What goal does Robinson Crusoe pursue on the desert island? Of course, he primarily tries to survive and return home as soon as he can. However, what is interesting is what does he maximize in this case? I do not know about anybody else, but I have no doubts in this regard. Robinson undoubtedly seeks to obtain the maximum possible profit. Every day he exerts a certain amount of effort and spends a certain amount of time on providing food, clothes and shelter for himself. His main aim is to increase the quantity and quality of goods consumed. In
Business and Economic Research ISSN 2162-4860
2014, Vol. 4, No. 1
www.macrothink.org/ber 201
other words, Robinson strives towards the highest possible value for the goods he consumes. This means that his aim is to achieve a higher value for the goods he obtained and produced today than the goods that he consumed yesterday. In the language of economists, the difference between the value of products produced and the value of resources expended is called profit. Therefore, Robinson is seeking to maximize the profit obtained. The amount of profit depends solely on his skill, effort, luck and the weather conditions. Robinson Crusoe is not burdened by any ethical norms or moral principles at all. He has no need for them and there is no point in them. He always acts fairly because his actions have no effect on other people. To build a home, he can use rare and valuable types of trees, for food he can consume endangered species of fish and animals and he can make clothes from the fur of pandas which are listed in the International Red Book.
A great deal changes for Robinson Crusoe with the arrival of Friday on the island because this could have both a positive and negative effect on his profit. If Friday starts to hunt and fish in the same areas where Robinson normally hunts and fishes, the situation will clearly become worse for Robinson. His profit will decrease or he will even start to incur losses. However, if Friday goes to gather nuts and starts to exchange them for meat or fish obtained by Robinson, the situation will considerably improve for them both. Their profits will increase and the relations between them will become more peaceful and may even develop into a real friendship. It is for this reason that ethics, morals and justice come into play when there are two people who have to work together. Laws, rules and norms of behaviour are established which should help to increase the profits of both Robinson and Friday. Of course, there are absolutely no grounds to assume that these laws, rules and regulations will necessarily provide freedom to individuals. The laws, rules and regulations themselves limit freedom; there is no absolute freedom in the society. Only Robinson alone on the desert island has absolute freedom. Furthermore, if we assume that on the island there are few animals and plants and Friday is physically weak and does not have useful skills or abilities, the relations between him and Robinson will most likely not be equal. A hierarchical society may appear on the island. It may well be the case that Friday will not object to this, as a loss of freedom will enable him to survive and his profit will increase. Robinson and Friday will consider this to be a fair society, which naturally does not rule out occasional disagreements and conflicts between them. There could be far less disagreements and conflicts if Robinson and Friday begin to worship the same god. The emergence and spread of religion is very likely in a hierarchical society because it promotes the peaceful resolution of conflicts and the stability of a society based on inequality.
After some time, the hierarchical society on the island may be replaced by a democracy. If Friday becomes stronger and more resilient and acquires new skills and abilities, then his achieving freedom could be of benefit not only to himself, but also to Robinson. Robinson will no longer need to constantly control Friday, force him to work hard and continuously look for hiding places where Friday conceals the fish and nuts he has found. It will be of far greater benefit to him if they work independently during the day and meet in the evening at the edge of the forest to exchange nuts and fish for meat and milk. Democracy on the island will not completely eliminate disputes and conflicts, but it will help to reduce their scale to an acceptable level.
Business and Economic Research ISSN 2162-4860
2014, Vol. 4, No. 1
www.macrothink.org/ber 202
If Robinson wants to cut down some nut trees and plant wheat on the plot of land cleared, he will have to pay compensation to Friday for possible losses incurred. If the loss of a few trees brings profit to all members of the society, the wheat field will be created. If the nuts bring Friday a greater profit than the wheat brings Robinson, the trees will continue to stand in their place. Friday will be able to compensate Robinson for the benefits lost and there will be no wheat field on the island. Any conflicts on the island could, of course, be resolved in this manner. Any conflicts not only on the island, but also in a society, country or vast region could be resolved in this manner.
Arrow (1951) was wrong when he claimed that a social contract is not possible in a democracy. Such a contract is quite possible and no dictator is required. People seeking to make profit are in a condition to conclude a social contract and this contract will establish the laws, rules and regulations that enable the maximum total profit to be obtained. This means the people choose the most effective method of economic management. Consequently, the level of output of goods and services in the society reaches its maximum levels. It is important to note that there are absolutely no obstacles preventing a social contract from being unanimously adopted. If a contract proposes not only compensation for all the losses incurred by it, but also a certain level of profit for individuals affected, everybody will vote for it. In the real world, however, everything is slightly more complicated than in theory. People do not always establish laws that bring profit to all members of society. It is often very difficult to calculate all of the possible outcomes of decisions made. For example, laws in the US, England, France and Russia establish completely different levels of taxation. Which of these levels is fair? Not only ordinary citizens of these countries, but also numerous specialists are unable to provide a plausible answer to this question. The formation of public institutions is a lengthy and complicated process. As noted by Schneider (1963), the overall scheme of institutions does not develop in somebody’s mind, institutes cannot be planned, people create them by method of trial and error. The ideal is, of course, unattainable, but it must be noted that it is in fact possible to get very close to it.
It is now time to return to the problems of the father of the sick child who does not have $20 to purchase a snow shovel. Why does society feel obliged to help parents in such a situation? What profit do people maximize in doing so? At first glance, society gains no benefit offering help to parents. But this is not the case, people certainly do obtain a profit. I acknowledge that a neighbour who gives his shovel to the father of the child is acting out of unselfish and noble motives. The same is true for a hero fighting for and defending the interests of his country. They commit such acts and we admire them because these acts comply with the norms and rules approved by society. However, society itself does not act as unselfishly as it may seem when supporting the actions of the neighbour and praising the hero. People who are members of that society will certainly profit from such acts. They will receive their profit in the same way as Robinson does when he looks after Friday, who received an injury, for example, when climbing a tree. Friday’s recovery will enable Robinson to continue to conduct the mutually beneficial exchange that brought them both profit. Furthermore, Robinson cannot rule out the fact that he too may become sick or injured in the future. Therefore his help is not selfless and he hopes that in the future Friday will act in the same way. All members of a large society also

Business and Economic Research ISSN 2162-4860
2014, Vol. 4, No. 1
www.macrothink.org/ber 203
receive a very definite benefit from helping the parents of a sick child. They are saving a child who in the future may very well bring profit to the society as a whole and to each individual one of them. In saving the child, they hope that society will do the same if something similar happens to them.
4. Issues of Justice in Real and Imaginary Examples
How can we fairly resolve the dispute between Prude and Lewd about reading the novel Lady Chatterley’s Lover, as described by Sen (1970)? On whose side should the laws, rules and regulations be? The real story of the publication of Lady Chatterley’s Lover was in fact very similar to a heated and long dispute between two irreconcilable parties. This racy novel was first published in 1928 in Italy and later in France, however it was banned in Britain for a long time as it was thought to be a threat to public morality. It was only in 1960, when the sexual revolution had begun to gain momentum, that the publisher Penguin, after winning a high-profile lawsuit, was able to print the book in London. All copies of the book were completely sold out within 15 minutes and in order to satisfy the demand, the printing press had to be operated at full capacity. There is nothing unusual about this story. Changes in public taste such as these are quite easy to understand, if we proceed from the assumption that established laws, rules and regulations provide individuals with the maximum possible profit. Strong family ties and limited rights of women at the beginning of the 20th century were needed for both men and women. Long working hours and hard physical labour meant that men could not do ordinary household chores. Looking after the home, preparing meals and bringing up children also required a great deal of time and considerable effort, which is why a man so needed a faithful and devoted wife. Women were in no less need of a strong family. They devoted almost all of their time to family affairs and they did not usually have any spare time to earn any money. For this reason, the man was often her only source of income. This meant that having a strong family was of benefit to everybody. This is why society paid close attention to the behaviour of married women and was not interested in giving them greater freedom. Society had a rather tolerant attitude towards a husband’s infidelity, however, as this enabled many women, who for a number of different reasons did not have family ties, to receive an income. However, by 1960 much had changed. Many new appliances were developed to look after the home and prepare meals, state and private schools and nurseries assumed partial responsibility for the upbringing and care of children. Women began to no longer depend on their husbands, they now had the opportunity to receive a full education and go out to earn money. A new army of additional workers flooded the economies of many countries, which helped to increase the output of goods and services. Every member of society drew a certain amount of benefit from all of these changes; therefore society supported new laws, rules and regulations for the expansion of the economic and political rights of women. Women gained freedom and society stopped monitoring their behaviour so closely. Given all the above, I can, without a shadow of a doubt, fairly resolve the dispute between Prude and Lewd described by Sen (1970). Today they should both be allowed to read the book. It will not be of any threat to public morality. Reading books, magazines and newspapers contributes to the comprehensive development of an individual, raises their level of knowledge and helps to obtain a variety of information, which enables people to act more efficiently and therefore contribute to the

Business and Economic Research ISSN 2162-4860
2014, Vol. 4, No. 1
www.macrothink.org/ber 204
economic prosperity of a society. I do not believe that Lady Chatterley’s Lover should have been banned in 1928. However, 200 or 300 years ago this novel would have certainly been a threat to society and it would need to be banned, although it is unlikely that in those times anybody would have even thought of writing such a novel.
Following on from this, in order to assess the capabilities of my proposed approach based on the maximization of profit, I will attempt to choose examples and situations from the vast amount of literature available that have always caused the most difficulties in discussions and continue to do so. Let us begin with a real story described by Sandel (2009). In the summer 1884, four English seamen: a captain, a first mate, a sailor and a 17-year-old cabin boy, survived severe weather conditions, but were left without food or water in a lifeboat in the South Atlantic. Their vessel had capsized during the storm and there were virtually no chances of being rescued. On the 19th day of starvation and torment, the captain suggested drawing lots to determine who should die so that the others could live. But the sailor refused and no lots were drawn. By that time, the cabin boy had become seriously ill and it seemed as if he would die at any moment. The following day the captain suggested killing the dying cabin boy, which he immediately did with the silent agreement of the first mate and the sailor. For the next four days they fed on the flesh and blood of the cabin boy and on the 24th day help arrived unexpectedly. They were picked up by a ship that was passing by and brought back to England. In England they were arrested and tried. The sailor turned state’s witness. Imagine if you were the judge examining this case. How would you rule? How would you act fairly? Should the captain’s actions be justified or severely punished? At first glance it seems impossible, or at least very difficult to give an answer to these questions. However, for me, if I follow the logic of utilitarianism based on the maximization of profit, these questions pose no difficulty. My answer is as follows. The captain should not be arrested, punished or justified. There should be no trial at all. The crew involved in a disaster far beyond the borders of England could not and did not have any influence on the citizens of their country. Their actions could neither increase, nor reduce people’s profit, or have any effect on the distribution of income in the society. The crew created their own small, isolated society, which had no interaction with the outside world. Therefore, it is the crew themselves who should decide which actions should be considered fair or not. It is also the crew themselves who should have established laws, rules and regulations by which their society should live. Citizens of England could have expressed their opinion on this story, but they had no right to judge them.
As I already mentioned in the discussion of the example of the dishonest sheriff, critics of utilitarianism very often forget that society maximizes benefits not because somebody sits down and calculates the total benefit, but simply because each and every individual strives towards this. If Sandel (2009) had taken this into consideration, he would have had much less difficulty with the discussion of the hypothetical example of the trolley car. Sandel proposes that each of us imagine we are the driver of a trolley car hurtling down a mountain with no brakes. On the tracks ahead you see five workers who do not notice the trolley car. Their death is unavoidable. Suddenly you notice a side track where there is only one worker. What should you do? Most people would prefer to turn onto the side track because in this case only one person will die. Although killing one innocent person is a tragedy, killing five people is even

Business and Economic Research ISSN 2162-4860
2014, Vol. 4, No. 1
www.macrothink.org/ber 205
worse. When put like this, it is not too difficult for most people to make a choice. However, if we make things a little more complicated, we, for some reason, arrive at an entirely different decision. Imagine that you are standing on a bridge, under which a trolley car will pass. A trolley car with no brakes is racing along the tracks and at the end of the tracks there are five workers. You realise that these workers will certainly die, but suddenly you notice a very fat man beside you. You could push him off the bridge onto the track as the trolley car approaches. This man will die, but the five workers will be saved. You could throw yourself onto the tracks, but your body mass is clearly not sufficient to stop the trolley car. In this example, as in the previous example, you can sacrifice one person to save five. However, if you sacrifice one person in these slightly altered circumstances, public morality will clearly not be on your side. This comes as a surprise to many people. Why in the first case do social rules and regulations allow one person to be sacrificed, but in the second case they do not? What is the difference between these two examples? We can answer this if we do not forget that society consists of individuals seeking to maximize their profit. Together these individuals try to establish rules and regulations that enable each of them to achieve their own objectives. Therefore they will never agree to throw somebody off a bridge to save five workers. Any person will realise that if they approve such an act, tomorrow they could be the unfortunate victim being sacrificed. We all understand, of course, that we could also end up in the position of the workers. However, we believe the likelihood that we will be so careless, that we will work under such dangerous conditions and that we will be placed in mortal danger is far lower than the likelihood of simply walking around in a public place. We note that society will have nothing against a person who voluntarily throws themselves onto the tracks because a heroic act such as this does not oblige other citizens to jump onto a train track when somebody else is in danger. We do, of course, honour heroes and praise their actions, but nobody would ever blame a person who refuses to sacrifice themselves in order to save others. Why does public morality allow the death of one completely innocent person in the first example? Because the death of this person, or of the five workers is inevitable. Five workers will bring more benefits to society than one worker. Furthermore, the probability that any one of us could ever be in the place of the five workers is five times higher than the probability that we would be on the tracks alone. After all of these considerations, we can now easily alter the second example so that society not only approves the throwing of a person off the bridge, but also considers the citizen throwing the person onto the tracks to be a hero. In this case, we need the victim to be a person who is seeking to cause us harm and reduce our profits. To ensure that we do not incidentally become this person on the bridge, let the person be a member of a different and hostile rival society. And now let us imagine that we are in our hometown occupied by enemies. On the bridge stands our enemy. Society will support us even if we throw this enemy off the bridge onto the tracks when there is no trolley car. And if, in doing so, we save the life of five workers, we will be deemed a national hero.
Many respected authors who study issues of justice very often attempt to convince everyone, on the basis of examples that are both implausible and far removed from reality, that rational individuals are not capable of achieving an economically effective result. They argue that rational individuals must have certain ethical norms and moral principles in order for an economy to function effectively. In the standard version of a well-known experiment, people

Business and Economic Research ISSN 2162-4860
2014, Vol. 4, No. 1
www.macrothink.org/ber 206
are asked to place a certain amount of money together into a single capsule, the contents of which increases by a certain factor, and then share out the money equally among all participants of the group. When everybody works together, each participant has a certain amount of profit. But this profit can be increased for one of the participants if they do not place money in the capsule and the others continue to do so. Normally, at the beginning of the game everybody tries to work together, but after a while certain players stop playing fairly and in the end everybody starts to cheat. This pattern of behaviour is often observed in monkeys (Chen & Hauser, 2005). In my opinion, this sad result simply proves that the terms of the experiment were very far from real market conditions, where it is rather difficult to hide the profits of participants, where people have the ability to refuse to work with a fraud and where dishonesty can be punished. This is confirmed by studies conducted by Fehr & Gachter (2000), which made a slight addition to the rules of the game. Participants were given the opportunity to punish those who refused to cooperate and acted dishonestly. In order to do so, they had to pay out of their own pockets, which they gladly did. The game players pay these temporary expenses in the knowledge that such a measure will help them earn profit in the future. After a while, the players began to behave fairly and even after a number of rounds they continued to place money in the capsule, which meant that each of them earned a stable profit for a long time.
The conditions proposed in the well-known game Prisoner’s Dilemma are also far from real market conditions. When the game does not resemble the real market, its participants demonstrate non-cooperative behaviour. In a single-round game, when every player can make one single decision, after which the game immediately ends, the players very rarely attempt to cooperate with one another. This result is natural and is not surprising. Casual relations and unprepared deals often end in disappointment and deceit. They end up in deceit and even more often if every participant of the deal firmly believes that they will see their partner for the first and last time. However, if the conditions of Prisoner’s Dilemma are made slightly more realistic and the players are invited to participate in a repeated multi-round game, they will definitely start to cooperate and maximize the total profit (Rapoport, 1991).
5. Conclusion
If we assume the main motives of human activity to be happiness, prosperity, satisfaction and lack of suffering, we have to admit that a science such as economics does not exist. Feelings, emotions, subconscious motives, internal stimuli and beliefs are in the realm of psychology. Psychology is therefore much more equipped to deal with the tasks placed upon economics, which confirms the constantly growing interest in recent years of economists towards the theories and methods of psychologists. There are, however, doubts regarding the prospects and capabilities of psychology, as today there is no clarity as to whether psychology is in itself a science (Hergenhahn, 2009).
Marx would call people who insist on such strange assumptions of economic theory complete idealists. In Marx’s opinion, if a person believes that people’s feelings create the material world around them and not the other way around, this person is an idealist. I agree with him on this point. We are all idealists if we believe that consciousness is primary and the material world is
Business and Economic Research ISSN 2162-4860
2014, Vol. 4, No. 1
www.macrothink.org/ber 207
secondary. Idealists reject the primacy of existence and the material world and insist that only our consciousness and our feelings form the world around us. Idealists do not need science, there is no point in it. They need God. If we are not satisfied with this way of understanding the world, we will have to become materialists. Of course, the attempt made in the 19th century to present the maximization of utility as the main motive for human behaviour did not change anything and did not make us become materialists. Utility is as immaterial and immeasurable as happiness. Today, the majority of economists would agree with this statement. The foundations of science cannot rest on such a dubious and uncertain concept. Therefore, we need to take one more step in the direction of materialism. If Marx was entirely logical, he would have undoubtedly come to the conclusion that our main aim is a desire for material benefit and material well-being. However, he never said anything like this (Fromm, 1961), despite the fact that it inevitably follows from his dialectical materialism. He could not allow himself to do so because such a move would destroy all of his own accusations of immorality in the free market and no theory of exploitation would be able to fix this. Marx himself was a complete idealist. However nothing is preventing us; we are able to make such a move and, moreover, we must make this move. To do this, we need most of all to get rid of the strange and entirely inexplicable division of people into producers and consumers, which for some reason, in the opinion of economists, should strive towards absolutely different goals. Undoubtedly, psychologists, who have now become our close friends, will serve as an invaluable aid as they explain why for such a long time economists have suffered from a split personality disorder. Seriously speaking, at present I see no reason to reject the statement that the main motive for human actions is their material benefit or, to put it simpler, profit. I have never come across, read or heard of any clear argument able to contradict this assumption. But this assumption changes a lot. The profit of an individual is completely material, measurable and comparable with the profit of another individual. This means that individuals can pay each other compensation, negotiate and enter into a social contract. Individuals can set an acceptable price for goods, based of course on the marginal profit from their use. Incidentally, this last point finally saved me from endless reflections and torment as to how consumers and producers, using the same product, determine the most effective method of using it.
Any person will be inclined to believe that anything that brings them profit is fair. We can easily see this for ourselves. Promotion at work, winning a contest, success, an opportunity to avoid a queue, an unexpected increase in price on something we have to sell and a reduction in price of something we have to buy – all of these are examples of events that we believe to be fair if they happen to us. However, people do not believe that everything that brings them profit is fair. For example, nobody will consider murdering a rival or setting their house on fire to be fair because if society supports such norms, next time we ourselves could become the target of violence. We support rules and norms of behaviour that not only allow us to receive profit, but also do not allow others to cause us harm. And if we are harmed, we justly seek to claim compensation. This is how ethics, morals and justice are established in a society.
We do not need a dictator to conclude a social contract in a democracy. Society is able to conclude a contract that enables the maximum total profit to be obtained and, as a result, the output of goods and services in that society will be maximized. If a certain law or norm offers

Business and Economic Research ISSN 2162-4860
2014, Vol. 4, No. 1
www.macrothink.org/ber 208
an opportunity to obtain a total profit that is greater than the total losses, then it is likely that this law or norm will receive society’s support. People who profit will be able to pay compensation to people who lose out and this level of compensation will exceed their losses and therefore the members of the society will unanimously vote for such laws and norms. If tomorrow there appears a new law which allows a higher total profit to be obtained and which requires the cancellation of the old law, society will cancel the old law and adopt the new law. The new law will, of course, be voted for unanimously. In this way, people’s desire for profit will enable them to not only achieve an economic result, but also form fair institutions. People’s desire for profit will enable us to not only build solid microfoundations for economic science, but also reinstate utilitarianism, which was so undeservedly cast aside.
The limit on the length of this paper does not allow me to fully address certain important issues of ethics, morality and justice, and many examples have remained unexamined. We could, for example, explain why in developed countries children care for elderly parents far less than in less developed countries, or why distant relations are stronger in poorer countries than in rich countries. We could prove that a fair society has to strive towards poor people becoming richer and not rich people becoming poorer. We could answer the question: how fair are citizens of developed countries when they ask migrants to observe the ethical norms in these countries and why is observing these norms of benefit to migrants themselves? However, without all of this I very much hope that the idea that justice prevails not when we embrace the greatest happiness or greatest felicity principle (Bentham [1789], 2005), but when we seek to maximize profit, does not seem so senseless to the reader. This is what I believe the main aim of the paper to be. And of course, in pursuing this goal, I never for a moment forget about my own personal profit.
References
Arrow, K. J. (1951). Social Choice and Individual Values. New York: Wiley.
Barro, R. J., & Sala-i-Martin, X. (2004). Economic Growth. Second Edition. The MIT Press. Cambridge. London, England.
Becker, G. S. (2003). Human Behavior. Economic Approach. Selected Works on Economic Theory. Moscow. SU HSE. Rus. Trans.
Bentham, J. (2005). An Introduction to the Principles of Morals and Legislation. 1789. Latest Edition: Adamant Media Corporation.
Bernoulli, D. (1954). Exposition of a New Theory on the Measurement Risk. Eng. Trans. 1738. Econometrica. 22(1), 23-36. http://dx.doi.org/10.2307/1909829
Bilych, G. (2012). The Futility of Utility. Business and Economic Research. 2(2), 192-208. http://dx.doi.org/10.5296/ber.v2i2.2696
Braudel, F. (2011). Civilisation Materielle, Economie et capitalisme, XV-XVIII Siecle. Tome 1. Les Structures du Quotidien: le Possible et L`impossible. Armand Colin. Trans. Rus.
Chen, K., & Hauser, M. (2005). Modeling Reciprocation and Cooperation in Primates: Evidence for a Punishing Strategy. Journal of Theoretical Biology. 235, 5-12.

Business and Economic Research ISSN 2162-4860
2014, Vol. 4, No. 1
www.macrothink.org/ber 209
http://dx.doi.org/10.1016/j.jtbi.2004.12.015
Coase, R. (1988). The Firm, the Market and the Law. The University of Chicago Press.
Demsetz, H. (1967). Toward a Theory of Property Rights. American Economic Review. 57, 61-70.
Dworkin, R. (1977). Taking Rights Seriously. Cambridge. Mass.: Harvard University Press. 151.
Fehr, E., & Gachter, S. (2000). Cooperation and Punishment in Public Goods Experiments. American Economic Review. 90(4), 980-994. http://dx.doi.org/10.1257/aer.90.4.980
Frey, R. (1984). Introduction: Utilitarianism and Persons. Utility and Rights. Ed. by R.G. Frey. Minneapolis: University of Minnesota Press. 15-20.
Fromm, E. (1961). Marx`s Concept of Man. Frederic Ungar Publishing: New York. 1-85.
Gauthier, D. (1985). Morals by Agreement. Oxford: Clarendon Press.
Gordon, S. (1980). Welfare, Justice, and Freedom. New York: Columbia University Press. 40.
Hare, R. (1981). Moral Thinking: Its Levels, Method and Point. Oxford: Oxford University Press. http://dx.doi.org/10.1093/0198246609.001.0001
Harsany, J. C. (1982). Morality and the Theory of Rational Behavior. Utilitarianism and Beyond. Ed. by A. Sen and B. Williams. Cambridge: Cambridge University Press. 39-62.
Hayek, F. A. (1993). Social or Distributive Justice. Justice. Ed. by A. Ryan. Oxford: Oxford University Press. 124.
Hayry, M. (1994). Liberal Utilitarianism and Applied Ethics. London and New York: Routledge. 79.
Hergenhahn, B. R. (2009). An Introduction to the History of Psychology. 6th Edition. Wadsworth Publishing.
Kahneman, D., Knetsch, J. & Thaler, R.H. (1986). Fairness as a Constraint on Profit-Seeking: Entitlements in the Market. American Economic Review. 76(4), 728-741.
Kramer, G.H. (1973). On a Class of Equilibrium Conditions for Majority Rule. Econometrica. 41, 285-297. http://dx.doi.org/10.2307/1913490
Leeson, P. T. (2009). The Invisible Hook: The Hidden Economics of Pirates. Princeton. Princeton University Press.
Machlup F. (1971). Theory of the Firm: Marginalist, Behavioral, Managerial. Microeconomics: Selected Readings. (Ed. By E. Mansfield). New York.
MacIntyre, A. (1984). After Virtue. Second Ed. Notre Dame: University of Notre Dame Press.
Mill, D. S. (1979). Utilitarianism. 1861. Indianapolis. Cambridge: Hacket Publishing Company.

Business and Economic Research ISSN 2162-4860
2014, Vol. 4, No. 1
www.macrothink.org/ber 210
Moore, G. E. (1922). Principia Ethica. London: Cambridge University Press.
North, D. & Thomas, R.P. (1973). The Rise of Western World: A New Economic History. Cambridge. Cambridge University Press. http://dx.doi.org/10.1017/CBO9780511819438
North, D. (2005). Understanding the Process of Economic Change. Princeton University Press.
Nozick, R. (1974). Anarchy, State and Utopia. New York: Basic Books. Inc. Publishers.
Payne, S.T. (2006). Utilitarianism as Secondary Ethic. Yale Divinity School. December 30. http://www.sethpayne.com/?page_id=145)
Rapoport, A. (1991). Prisoner`s Dilemma. In: The World of Economics. The New Palgrave. Ed. by J. Eatwell, M. Milgate, P. Newman. The Macmillan Press Limited.
Rawls, J. (1971). A Theory of Justice. Cambridge. Mass.: The Belknap Press of Harvard University Press.
Rothbard, M. N. (1977). Power and Market. Government and Economy. Institute for Humane Studies. Inc. Second Edition.
Samuelson, P. A., & Nordhaus, W. D. (2004). Microeconomics. Eighteenth Edition. Irwin, McGraw-Hill.
Sandel, M. (2009). Justice: What’s the Right Thing to Do? Farrar, Straus and Giroux.
Sandel, M. (2012). What Money Can’t Buy. The Moral Limits of Markets. Farrar, Straus and Giroux.
Schneider, L. (1963). Preface to: K. Menger. Problems of Economics and Sociology. Urbana: University of Illinois Press. P. 16.
Sen, A. K. (1970). The Impossibility of a Paretian Liberal. Journal of Political Economy. 78, 152-157. http://dx.doi.org/10.1086/259614
Sen, A. K. (1999). Development as Freedom. New York: Knopf.
Shapiro, I. (2012). On Non-Domination. University of Toronto Law Journal. 62, 293-336.
Simon, H. A. (1971). Theories of Decision – Making in Economics and Behavioral Science. Microeconomics: Selected Readings. (Ed. By E. Mansfield). New York.
Walzer, M. (1983). Spheres of Justice: A Defense of Pluralism and Equality. New York: Basic Books. 314.
Copyright Disclaimer
Copyright reserved by the author(s).
This article is an open-access article distributed under the terms and conditions of the Creative Commons Attribution license (http://creativecommons.org/licenses/by/3.0/).

Business and Economic Research ISSN 2162-4860
2014, Vol. 4, No. 1
www.macrothink.org/ber 211
Enhancing International Performance of Exporting Firms through E-Business Integration
Dr. Mehmet Ali Ekemen (Corresponding author)
Dept. of Business Administration, European University of Lefke
PO Box 99728, Lefke, Cyprus
Tel: 90-392-660-2000 E-mail: [email protected]
Pelin Bayram
Dept. of Business Management, Girne American University
PO Box 99428, Kyrenia, Cyprus
Tel: 90-392-650-2000 E-mail: [email protected]
Received: March 12, 2014 Accepted: March 30, 2014
doi:10.5296/ber.v4i1.5273 URL: http://dx.doi.org/10.5296/ber.v4i1.5273
Abstract
The growth of information and communication technologies over the past decade has radically transformed the way we communicate, learn and do business. The Internet and e-business solutions have brought many benefits to businesses, especially lowering information and communication costs, gathering intelligence on target market and maintaining collaboration among their internal and external business processes to meet the demands of competition in today's dynamic business environment. Despite the rapidly growing literature on e-business, research on the impact of e-business in the internationalization process of exporting firms is comparatively limited. This study investigates the relationship between organizational use of e-business technologies, composed of communication, intelligence, and collaboration, and international performance of exporting firms by using partial-least squares (PLS) modelling, a second-generation technique in structural equation modelling (SEM), on data drawn from a survey of 70 exporting firms in North Cyprus. The findings show an existing relationship between e-business adoption and international performance of exporting firms.
Keywords: E-Business adoption, International performance, Exporting firms, Internationalization, North Cyprus.

Business and Economic Research ISSN 2162-4860
2014, Vol. 4, No. 1
www.macrothink.org/ber 212
1. Introduction
Globalization made the world smaller because it connects people as if they are right next to each other. The use of today’s information technologies has minimized the distance between people as well as markets. With the commencement of globalization in the 21st century, companies now have the chance of going international. Companies are very enthusiastic about investigating new markets and generating profits by charming the customers of foreign markets. Companies are obliged to follow a process if they have the will to explore new markets and seek internationalization (Calof, 1995).
New challenges and opportunities are introduced to firms by globalization. These opportunities include accessing new markets that were previously not accessible due to several reasons including cost, regulation, or indirect barriers, the capability to provide resources such as capital, labor, and knowledge on an international basis as well as and the possibility of taking part in global production networks that are becoming widespread in several major industries such as automotive, electronics, toys and textiles. On the other hand, globalization introduces several challenges such as foreign competitors launching in the local market of a firm as well as the local competitors cutting down cost due to outsourcing, offshore manufacturing and entering new markets. Globalization strengthens firms in order to both streamline and increase their efficiency as well as geographically expand their operations.
In order to respond to the mentioned opportunities and challenges, it is necessary for firms to restructure their organizational strategy and processes (Bradley et al., 1993). Firms expand their products and operations in global marketplaces by using latest technologies to overcome the pressure of competition (Snow et al., 1996). Furthermore the used technology helps firms to succeed in attaining new innovative transnational organizational forms (Sturgeon, 2002).
Elevated amounts of information, knowledge, labor, products, and capital exchange exists between markets. Hence, there is also a high level of interdependency among the related countries. Companies which have seized the chance of expanding business activities into these markets need to keep up their efforts to become internationalized.
The Internet is often accepted as one of the most transforming technological inventions which can fundamentally change the business paradigm by affecting every link in a firm's value chain. Porter (2001) suggests that information technology such as the Internet enables improvements in value chain of firm by increasing speed and ease of real-time information exchange.
The use of the Internet provides the opportunity of reaching both international and local markets by removing barriers of geographic distance. According to Kotler (2000) "clearly, marketers are adding on-line channels to find, reach, communicate, and sell" and that "companies small and large are taking advantages of cyberspace's vanishing national boundaries". Based on the statement of Quelch and Klein (1996), the Internet will increase the speed of the internationalization process for small and medium-size enterprises.
The Internet gives smaller firms the same competitive advantage as larger firms by allowing smaller firms to expand into international markets and providing the opportunity to affordably promote products and services in global markets (Kotler, 2000). Although the Internet provides

Business and Economic Research ISSN 2162-4860
2014, Vol. 4, No. 1
www.macrothink.org/ber 213
essential opportunities both for domestic and international marketing, there is insufficient scholarly research to the area. (Hoffman & Novak, 1996).
The aim of this study is to enhance knowledge on the usage of e-business by exporting firms from the perspective of communication, intelligence and collaboration, and to investigate the effect of e-business adoption on international performance of exporting firms, specifically international commitment and export performance. We propose and test a model of the relationship between e-business adoption and international performance, which are as follows:
Hypothesis 1: Adoption of e-business for communication purpose has a positive significant effect on international performance of exporting firm.
Hypothesis 2: Adoption of e-business for intelligence purpose has a positive significant effect on international performance of exporting firm.
Hypothesis 3: Adoption of e-business for collaboration purpose has a positive significant effect on international performance of exporting firm.
The model and constructs used in our study are directly derived from literature. Our findings show that the use of e-business adoption positively impacts international performance of exporting firms.
2. Theoretical Background
2.1 Internationalization of Firm
A chain of steps need to be taken for internationalization. Companies go through a progressive learning process with internationalization (Johanson & Vahlne, 2009). These companies obtain expertise of doing business in international markets. The chain begins with the intention of entering geographically and culturally different markets, and follows with the elevation of the company’s degree of commitment to these markets one step at a time depending on the market knowledge. The first level of commitment is through a representative sales agent (importer) in the foreign market and it is followed by the launch of a sales office and finally a manufacturing facility in the foreign country.
Buckley and Ghauri (1988) put forward that the fruit of an enhanced level of international involvement is internationalization. It is assumed that expanding operations to international markets increases a company’s profitability. Becoming international gives the company potential benefit as it builds more knowledge and expertise in the internationalization process.
The knowledge-based theory explains the growth of a company undertaking the internationalization process as: Despite the risk involvement of utilizing the company’s resources in international activities, these operations give the opportunity of gaining specific knowledge about foreign markets via experience. Consequently, risk will be minimized with growing knowledge of the market and the company will be inspired to dedicate more resources into the experienced market (Cuervo-Cazurra & Genc, 2008; Eriksson, 2000).
The internationalization process theory inhibits four assumptions (Andersen, 1993). The first assumption is that maximizing the return on resources allocated to markets will be realized if

Business and Economic Research ISSN 2162-4860
2014, Vol. 4, No. 1
www.macrothink.org/ber 214
firm allocates these resources into least risky markets. The second assumption is that improved market knowledge reduces the risk of the market. The third assumption is that experience generates learning which results in market knowledge. The final assumption is that learning through experiences is an efficient process.
Literature highlights two crucial concepts as elements of the internationalization process: market knowledge and market commitment. Johanson and Vahlne (2009) considering the part of knowledge for the company as the firm makes decisions based on knowledge of opportunities and problems as well as uses knowledge for the evaluation of alternatives in responding to these opportunities or problems.
Eriksson (1997) considers market knowledge in two categories. The first category concentrates on business related issues which are knowledge of customer, market and rivalries. The second category involves the institutional issues such as knowledge of government, rules and regulations, and the culture.
Market commitment also has two categories. The quantity of resources committed by the company is acknowledged as the first and explained as the economic factors dedicated to the market. The allocation of more resources into foreign operations increases market commitment of the firm. The second category is the level of difficulty in spotting alternative uses for these resources and is identified as the degree of commitment to the market (Johanson & Vahlne, 2009).
Experimental learning theory divides the internationalization process into five stages; company focuses on domestic market only, searches for the possibility of exporting, starts to experience exporting activity, exporting is a regular activity of the company and represents important percentage in total sales and company has high degree of commitment in foreign market and has dependency on exporting.
2.2 E-Business Adoption in Internationalization of Firm
All businesses around the world have been greatly influenced by new technologies such as the Internet and the World Wide Web. Organizations can use e-business to reduce costs, increase demand and build new business models. It reduces prices and improves products and information flows therefore making it possible for all consumers to benefit (Dunt & Harper, 2002). Both small and large businesses can use the Internet to take advantage of practically-zero marginal costs of distribution for their products (Dunt & Harper, 2002). Small and medium sized businesses, in addition to large businesses, may also create value through marketing and providing their goods and services online (Dublish, 2000). Each business is bound by the same amount of graphics and design potential that the Internet can offer, therefore each business begins at the same point with regard to their websites.
Businesses take up e-business models to increase market share, offer better customer service and to expand their target markets to other countries (Singh, 2000). According to Chaffey (2004) and Turban et al (2004) the advantages of e-business are: amplified revenue from improved sales; lowered marketing costs due to online advertising, less time spent in customer service and online sales; decreased supply chain costs due to minimized inventory levels,

Business and Economic Research ISSN 2162-4860
2014, Vol. 4, No. 1
www.macrothink.org/ber 215
elevated competition from suppliers and contracted cycle time in ordering; diminished administrative costs from automated routine business processes, order confirmation, data precision and a more advantageous competitive standing. Further non-measurable improvements obtained from e-business include a better corporate image, enhanced communication with customers and business affiliates through electronic channels, shortened product development times allowing shortened responding times to market demands, enhanced customer service, improved information and knowledge management, the chance to utilize positive feedback from customers to improve sales, implementation of intelligent software for data gathering and forecasting trends and demands (Singh, 2000; Chaffey, 2004; Turban et al, 2004).
A study considers that the 21st century, with its dynamic, quickly growing and ever competitive features will ensure new methods of wealth creation (Amit & Zott, 2001). Each industry and organization adapts its own e-business model, approach and degree of digitization, in accordance with its size, type of business, technology capability and technical expertise. Despite the fact that the importance of employing e-business has been recognized, the definite benefits are yet to be brought to light. A study states that not only improvements in technological infrastructure but business and organizational makeovers are factors steaming much of the value connected with e-business (Grey et al., 2003). The same study also puts forward that a crucial component of constructing business value is determining the relative methods of transformation and choosing the right schemes to permit the transformation. The factors affecting the IT infrastructure capacity, such as speed, flexibility, capacity, efficiency, resilience and security, define both the types of applications that can be run and their performance. The total business performance which is accuracy, speed and productivity of business processes of the entity will be affected by the individual business units using these applications.
E-business benefits are usually evaluated as IT benefits under the topics of metrics, environment, technology and processes (Kohli et al., 2003). A study has shown that success in e-business requires functionality, integration and scalability and also that an evaluation of e-business applications is necessary for further development, management strategies and the utilization of technological developments (Shi & Daniels, 2003).
Deciding on the strategic role of IT as compared to other aspects in an organization is necessary to obtain the overall economic picture (Devaraj & Kohli, 2002). The same study also states that IT projects have less perceptible and longer payoff times. Furthermore, IT metrics incorporates profitability, productivity and customer value whilst e-commerce payoff evaluation considers efficiency, effectiveness and innovation strategy measured along five dimensions of time, distance or geography, relationships, interactions, and product or service. Ashburton and Doherty (2003) put forward that IT appraisal is similar to benefits realization and it should be clearly attentive of the on-going management and course of the project and managing the reaping of payoffs. They also emphasize that appraisal should focus on the assessment of the process of systems development together with its product so that the systems development process can be upgraded over time; additionally evaluation should be an on-going process.

Business and Economic Research ISSN 2162-4860
2014, Vol. 4, No. 1
www.macrothink.org/ber 216
Cronholm and Goldkuhl (2003) categorize the strategies for information systems evaluation as goal-based, goal-free and criteria-based evaluations. Goal-based evaluation assesses the IT system based on clear goals from the organizational context. Goal-free evaluation is an inductive and situational driven strategy, whereas criteria based evaluation focuses on clear and general criteria used as an evaluation benchmark. Another study states that e-business performance evaluation systems should include components on the performance of the website, business processes, customers and the link between e-business performance and business strategy.
3. Methodology
3.1 Conceptual Framework
The internationalization process of a firm is logically a powerful driver for the firm to adopt specific Information and Computer Technologies (ICT) such as the Internet and e-business. There is also empirical evidence supporting the relationship. Researches indicate that countries with more globally oriented economies have higher levels of ICT investment (OECD, 1999). It is reasonable to expect that international firms would be more likely to adopt technologies such as e-business. Other empirical study at the country level supports the argument that the opening of markets to trade and foreign investment leads domestic firms to invest in ICTs to remain competitive (Dedrick et al., 2001). Thus, the process of internationalization is logically and empirically shown to be a driver for firms to adopt e-business.
The analysis in this article is based on a conceptual framework that relates e-business adoption of a firm and its international performance, as shown in Figure 1. The framework argues that the extent and nature of firm’s e-business adoption will influence its performance at international level. The key variables in the framework are defined below in the measures section.
We constitute a conceptual model, shown in Figure 1, of the relationship between organizational use of e-business technologies which is composed of communication, intelligence and collaboration, and international performance of the exporting firm.

Business and Economic Research ISSN 2162-4860
2014, Vol. 4, No. 1
www.macrothink.org/ber 217
Figure 1. The conceptual model of the study.
3.2 Measures
3.2.1 E-Business Adoption
We define e-business broadly as use of the Internet to buy, sell, or support products and services. We conceptualize adoption of e-business in three dimensions as communication, intelligence and collaboration. These dimensions are widely used in IT and e-business literature, and refer to the scope of e-business use rather than type of IT adopted (Gibbs & Kraemer, 2004). We define scope of use as the extent of e-business use for a number of different activities in the value chain, from advertising and marketing to sales, procurement, service and support, data exchange with customers and suppliers, and integration of business processes. The measures of e-business use were adapted from Wade and Hulland (2004).
Communication dimension represents the use of e-business in establishing efficient flow of information among functional departments as well as stakeholders outside the firm. This dimension was assessed using four items that examined the extent to which the firm uses e-business in promoting the firm and its products, and in sharing information among departments, customers, suppliers and distributors by using 5 point Likert scale ranging from “very low” to “very high”.
Intelligence dimension involves both the collection of information from sources external to the firm as well as the dissemination of a firm's market intelligence across departments through
E-Business Adoption
Communication
International
Performance
International
Commitment
Export
Performance
Intelligence
Collaboration
H1
H2
H3

Business and Economic Research ISSN 2162-4860
2014, Vol. 4, No. 1
www.macrothink.org/ber 218
e-business. Four items were used to measure intelligence dimension of e-business adoption which focus on the degree of e-business use in collecting information on customers, distributors, competitors as well as laws and regulations of host country by using 5 point Likert scale ranging from “very low” to “very high”.
We operationalized the collaboration dimension as the ability of integrating and aligning the processes between firm and stakeholders along supply chain by e-business adoption. We used three items to assess the collaboration dimension of e-business. These items aim to evaluate the extent to which firm uses e-business in selling products or services to customers and in interacting with distributors and suppliers by using 5 point Likert scale ranging from “very low” to “very high”.
3.2.2 International Performance
International performance has been measured in prior researches by both objective and self-reported perceptual measures, and generally defined as the outcomes of a firm's activities in export markets. In this study, we operationalized the international performance measure as a multi-item construct that combines two primary indicators that have been used in prior research (Shoham, 1998). These indicators are international commitment which is the percentage of the firm's total sales contributed by export operations and export performance as perceived performance of firm in export sales compared to competitors by using a 5-point Likert scale ranging from ‘‘very low” to ‘‘very high’’ performance.
A summary of the indicators used, together with their scales and labels, is provided in Table 1.
Table 1. The items, scales, labels and constructs of the model
Constructs and Indicators N Mean Std.
Communication (COM) - Using e-business;
To promote the firm (COM1) 70 3.63 0.951
To promote the firm’s products (COM2) 70 3.84 0.773
To share information within the firm (COM3) 70 3.87 0.797
To share information with stakeholders (COM4) 70 3.53 0.829
Intelligence (INL) - Using e-business;
To identify potential customers (INL1) 70 3.73 0.563
To identify potential distribution channels (INL2) 70 4.13 0.779
To collect information about laws and regulations of host country (INL3) 70 3.73 0.741
To collect information about competitors (INL4) 70 3.73 0.679
Collaboration (COL) - Using e-business;
To sell products and services (COL1) 70 3.69 0.733

Business and Economic Research ISSN 2162-4860
2014, Vol. 4, No. 1
www.macrothink.org/ber 219
To interact with suppliers for coordination of operations (COL2) 70 4.19 0.572
To interact with distributors for coordination of operations (COL3) 70 3.79 0.700
International Performance (IP)
Export / total sales of the firm in percentage (IC) 70 2.20 0.910
Perceived export performance compared to competitors (EP) 70 3.16 0.862
3.3 Sampling and Data Collection
We obtained the list of registered exporters in North Cyprus from KOBIGEM, which is a center that aims to improve the performance of small and medium sized firms under the supervision of the Ministry of Economy. 70 companies were identified as the total number of exporters in North Cyprus who had exporting activities in the year 2011. All of these 70 companies were reached by telephone and were found eligible to answer the questionnaire. Eligibility and the identity of the most suitable key informants were obtained during the telephone conversation.
Our study relies on the primary data collected by interviewing a respondent, single key informant, from each one the 70 exporting firms separately. We followed Huber and Power’s (1985) guidelines on how to get quality data from a single informant to maximize accuracy and reliability. E-business adoption and international performance of firm are operationalized from the perspective of the top managers who are typically the most knowledgeable persons regarding their companies’ strategies and overall business situations. Most of our respondents had titles such as managing director, general manager and export manager, indicating a senior position in the firm.
The questionnaire was designed as undisguised -respondents were informed about the purpose of the study - and structured - the same questions are administered to every respondent, and developed by using five-point Likert scales to minimize response time and effort (Knight & Cavusgil, 2004). Pretests regarding the clarity of the survey items were conducted with ten exporting companies. The survey was conducted by filling the questionnaires in face to face interviews in the summer of 2012. We had asked our respondents to indicate if they had adopted e-business in their business operations while performing export activities. This was important as our research goal is to understand how the international performance of exporting firms will be affected as a result of e-business adoption. At the end of interviews, 70 valid responses were received. Therefore, this research analysis is based on a response rate of 100%, which is fully representing the population of exporters in North Cyprus.
3.4 Data Analysis
We used partial-least squares (PLS) approach, a second-generation technique in structural equation modeling, to analyze the data and examine the hypotheses. PLS follows a component based strategy, makes no prior distributional assumptions about the data, and can work well with small sample sizes. PLS allows researchers to integrate and simultaneously assess both measurement and structural models. The measurement model investigates how well the latent constructs are captured by the mapped set of indicator items. The structural

Business and Economic Research ISSN 2162-4860
2014, Vol. 4, No. 1
www.macrothink.org/ber 220
model estimates the strengths of hypothesized relationships among lateral constructs.
While the main focus of techniques like LISREL is to test a given model and examine the fit between the data and the model, PLS seeks to explain relationships within a model (Fornell & Bookstein, 1982). Therefore, PLS is more suitable for assessing predictive models where explaining relationships among a set of constructs is desired (Chin, 1998).
3.5 Measurement Model
Measurement model is assessed with regard to its reliability and validity. We measured internal consistency by using reliability coefficient of Cronbach’s Alpha (Cronbach, 1951) and Composite Reliability (Werts, Linn & Joreskog, 1974). While Cronbach’s Alpha provides an estimate for the reliability based on the indicator inter-correlations, the composite reliability takes into account that indicators have different loadings, and can be interpreted in the same way as Cronbach’s Alpha. No matter which particular reliability coefficient is used, an internal consistency reliability value above 0.7 is regarded as satisfactory, whereas a value below 0.6 indicates a lack of reliability (Nunnally & Bernstein, 1994). The reliability coefficients given in Table 2 demonstrate that all constructs have acceptable levels of internal consistency reliability.
As the reliability of indicators varies, the reliability of each indicator should be assessed. Researchers argue that a latent variable should explain at least 50% of each indicator’s variance and the indicators which have smaller outer standardized loading than 0.4 - the absolute correlations between a construct and each of its manifest variables - recommended to be eliminated from the measurement model (Churchill, 1979). The indicators of our model provide satisfactory level of reliability (see Table 2).
In this study, we examined both convergent and discriminant validity for the assessment of constructs validity. The average variance extracted (AVE) value of at least 0.5 shows sufficient convergent validity which indicates that the latent variable explain more than half of the variance of its indicators on average (Fornell & Larcker, 1981; Gotz et al., 2009).
Table 2. Reliability and Average Variance Extracted (AVE) Measures
Constructs and Indicators
Loadings t-values Composite Reliability
Cronbach’s Alpha
Average Variance Extracted (AVE)
COM 0.7766 0.6184 0.5652
COM1 0.6801 2.830
COM2 0.7168 3.670
COM3 0.6567 3.771
COM4 0.6733 4.025
INL 0.7939 0.6549 0.5911
INL1 0.6716 4.129
INL2 0.6716 3.639
INL3 0.7405 5.235
INL4 0.7168 4.835

Business and Economic Research ISSN 2162-4860
2014, Vol. 4, No. 1
www.macrothink.org/ber 221
COL 0.8170 0.6608 0.5999
COL1 0.7939 5.505
COL2 0.8405 7.383
COL3 0.6805 4.486
IP 0.9572 0.9107 0.9180
IC 0.9600 41.836
PE 0.9562 31.843
Discriminant validity assesses if two conceptually different concepts exhibit sufficient difference and measured by the Fornell-Larcker criterion and the cross-loadings. The Fornell-Larcker criterion (Fornell & Larcker, 1981) examines if a latent variable shares more variance with its assigned indicators than with any other latent variable. Therefore, the AVE of each latent variable should be greater than the latent variable’s highest squared correlation with any other latent variable. This notion is identical to comparing the square root of the AVE with the correlations between the latent constructs. The cross-loadings as second criteria ensure that the loading of each indicator is greater than all of its cross-loadings (Gotz et al., 2009). Although the Fornell-Larcker criterion focuses on the construct level, the cross-loadings evaluate the discriminant validity on the indicator level. The construct validity measures are given in Table 3 and 4.
Table 3. Latent Variables Correlation
COL COM INL IP
COL 0.7745*
COM 0.1644 0.6821*
INL 0.1832 0.3132 0.7008*
IP 0.4266 0.4417 0.4709 0.9581*
* Square root of construct’s AVE value.
Table 4. Cross-loadings of Indicators
COM INL COL IP
COM1 0.6801 0.5064 -0.0005 0.2531
COM2 0.7168 0.4607 0.1022 0.3527
COM3 0.6567 0.6168 0.1748 0.2620
COM4 0.6733 0.5697 0.1624 0.3183
INL1 0.4441 0.6716 0.0685 0.3280
INL2 0.6136 0.6716 -0.0069 0.3280
INL3 0.5813 0.7405 0.2648 0.3804
INL4 0.6567 0.7168 0.1748 0.2620
COL1 0.0868 0.0439 0.7939 0.3061
COL2 0.1144 0.1371 0.8405 0.3370
COL3 0.1747 0.2325 0.6805 0.3409

Business and Economic Research ISSN 2162-4860
2014, Vol. 4, No. 1
www.macrothink.org/ber 222
IC 0.4109 0.4840 0.4090 0.9600
PE 0.4361 0.4168 0.4086 0.9562
4. Results
The research hypotheses are tested by examining the direction, strength and level of significance of the path coefficients calculated by the PLS method.
The structural model presents information on the path coefficients (β) and the squared R (R2). The strength of the relationship is indicated by β. The R2 highlights the percentage of variance in the model to give an indication of its predictive power. The SmartPLS 2.0 (Ringleet al., 2005) results for the βs and R2 are shown in Figure 2. The path significance levels (t-values) are estimated by the bootstrapping method.
Chin (1998) notes that R2 values of 0.67, 0.33, and 0.19 for the percentage of variance in a model are substantial, moderate, and weak, respectively. Thus, the obtained R2 in this study with a value of 0.35 suggests that the percentage of variance in the research model is above moderate levels.
Additionally, Cohen (1988) suggests that the PLS structural model can be assessed by effect sizes, f2. Also, Tenenhaus et al. (2005) note that tests for predictive relevance of a model can be gauged from the Stone-Geiser q-square (q2) indicators.
Effect sizes of single predictors (f2) are obtained by comparing the explained amount of variance when a predictor is either included or not included in the model. According to Cohen (1988), f2 values of 0.02, 0.15, and 0.35 signify small, medium, and large effects, respectively.
The q2 statistic measures the predictive relevance of the model. A q2 greater than 0 means that the model has predictive relevance, and values less than 0 indicate a lack of predictive relevance (Fornell & Cha, 1994). In SmartPLS 2.0, cross-validated redundancy is obtained from the blindfolding procedure from which the q2 is obtained. The cross-validated redundancy indicator measures the capacity of the path model to predict the endogenous MVs indirectly from their own LV using the related structural relation. Table 5 presents the data’s βs, R2, f2, t-values, and q2. The results obtained in this study indicate that the research model is structurally sound as it possesses adequate predictive relevance and performance.
Table 5. Relevant Indicators for the Structural Model
Path R2 Q2 β t-Value f2
Model 0.35 0.29
COM → IP 0.16 1.977 0.01
INL → IP 0.28 2.780 0.04
COL → IP 0.35 3.069 0.18
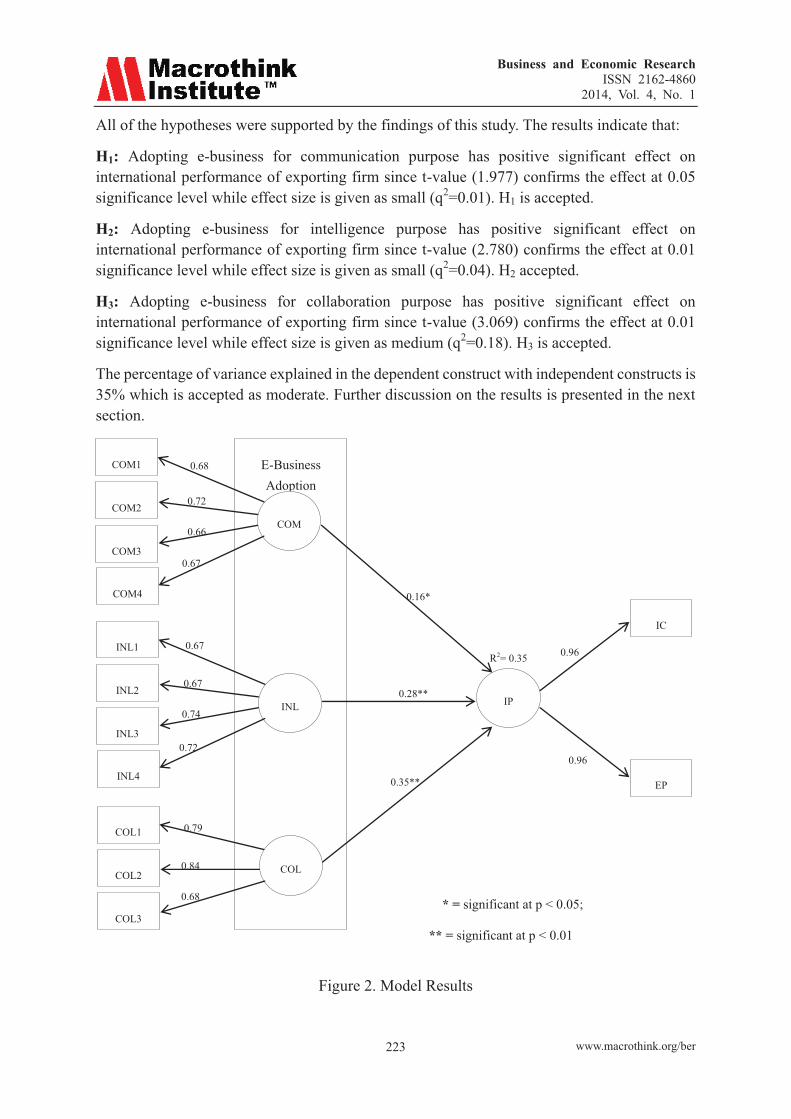
Business and Economic Research ISSN 2162-4860
2014, Vol. 4, No. 1
www.macrothink.org/ber 223
All of the hypotheses were supported by the findings of this study. The results indicate that:
H1: Adopting e-business for communication purpose has positive significant effect on international performance of exporting firm since t-value (1.977) confirms the effect at 0.05 significance level while effect size is given as small (q2=0.01). H1 is accepted.
H2: Adopting e-business for intelligence purpose has positive significant effect on international performance of exporting firm since t-value (2.780) confirms the effect at 0.01 significance level while effect size is given as small (q2=0.04). H2 accepted.
H3: Adopting e-business for collaboration purpose has positive significant effect on international performance of exporting firm since t-value (3.069) confirms the effect at 0.01 significance level while effect size is given as medium (q2=0.18). H3 is accepted.
The percentage of variance explained in the dependent construct with independent constructs is 35% which is accepted as moderate. Further discussion on the results is presented in the next section.
Figure 2. Model Results
E-Business Adoption
IP
IC
EP
COM
COM1
COM2
COM3
COM4
INL
INL1
INL2
INL3
INL4
COL
COL1
COL2
COL3
0.68
0.72
0.66
0.67
0.67
0.67
0.74
0.72
0.79
0.84
0.68
0.96
0.96
0.16*
0.28**
0.35**
R2= 0.35
* = significant at p < 0.05;
** = significant at p < 0.01

Business and Economic Research ISSN 2162-4860
2014, Vol. 4, No. 1
www.macrothink.org/ber 224
5. Discussions and Implications
With the beginning of the twenty-first century, businesses executed over the Internet, also known as ‘e-business’, opens up new possibilities for internationalization of the firm based on its characteristics such as a dynamic, rapidly growing and competitive environment. The Internet allows existing firms to create new online businesses, while giving the opportunity to entrepreneurs to take full advantage of the Internet.
Firms are leaning towards the Internet-based environment due to the advances of information technologies with its respective decrease of communication expenses and as a result, significant productivity gains in the process of internationalization are obtained. As stated in literature, advancements in technology such as the Internet have been the key tool for globalization. Adoption of electronic based business (e-business) which carries out the value chain activities such as sales, customer services, procurement, information sharing and coordination with suppliers together with the combination of the Internet platform and its influences on the international performances of exporting firms is the main focus of this study. Improving e-business capability is a significant task because it incorporates both sell and buy-side as well as internal business processes.
The results of this study has shown that e-business has a positive influence on international performance of the firm as well as providing other possibilities such as to advance customer services, re-organize internal operations and advance coordination within the firm. The detailed findings of the research are discussed below.
� The Internet is a platform with open standards that supports the collaboration of firms along the value chain as well as the appearance of online communities and commercial agreements. Firms from different industries can share business processes even without the knowledge of the end users. Today’s customers can directly receive instant and continuous information flow over the Internet on products and services, thereby removing the need of traditional intermediary businesses and information brokers.
� Differentiation strategies along the value chain create value that will allow buyers to obtain products and services at a lower cost or increase performance. Products can be differentiated through decisions on how to carry out their activities, interconnection with suppliers and channels, scheduling of the activities, location, distribution of activities among business divisions, and learning and integration.
� Using e-business provides companies with competitive advantage where those companies with the best technology and innovation are able to keep and grow their customer base. Although a creative website can attract many people and provide awareness and knowledge regarding products and services as well as creating positive word-of-mouth, this most often does not result in purchase.
� Advantages of e-business include a smaller number of sales force, decrease in paperwork, less data errors, and more efficient transactional processes. This results in companies to gain profit and decrease cost. Online selling allows companies to satisfy customer needs in a time and cost efficient manner. In addition, e-business allows small businesses to compete with larger ones which were not previously possible.

Business and Economic Research ISSN 2162-4860
2014, Vol. 4, No. 1
www.macrothink.org/ber 225
� Productivity of the firm has also improved drastically due to the effects of information technology. Two of the strategies are commonly used by exporting firm are just in time (JIT) and total quality management (TQM). In addition distribution process has become more simplified for large firms due to developments in tracking large stock of goods. The computer system tracks stock levels and automatically sends an order to the warehouse when stock levels are low as well as tracks the distribution of goods between warehouses and retail stores. For this reason many businesses today can completely rely on computer system.
� Furthermore decision making has been greatly affected by information technology on business. In our daily life people are being bombarded by high level of information that can be a nuisance, however for decision makers of company same condition can be beneficial as complete information is obtained from all departments prior to a decision. Management Information System (MIS) is the system used to collect information within a company. MIS is one of the most essential tools for decision making in an organization where a manager is able to collect information in a short amount of time and make immediate decision and this results in saving money. Collection of information also ensures correct decision making.
� Applying e-business provides the opportunity for firms to obtain a high amount of needed and valuable data. Processing internal information allows companies to gain business intelligence with the use of database analysis such as data mining, and data marts. Manufacturers and suppliers can obtain market information from statistical aggregation of data by using e-business. This information is crucial for several decisions made by the company including planning and new product development.
6. Conclusions and Limitations
The rapid development in technology as well as growth of e-businesses provides enormous opportunities for the firms which look forward to expand their operations in host countries. In this study, we have attempted to contribute to the international business literature by investigating the foundations of e-business adoption into international firms.
The focus of this paper is on international performance of exporting firms, which has shown to be affected by e-business assimilation. We draw on a wide body of literature in e-business and internationalization, and use partial least square modelling in order to identify common patterns of technology diffusion in international firms. The analysis led to the development of e-business integration model, which is composed of three functions that enhance international performance of exporting firms: communication, intelligence and collaboration.
This study attempts to bridge the e-business and the international business literatures, and make an important contribution by empirically testing the relationship between assimilation of e-business in exporting firm and its performance in internationalization process. The results show that there is an existing relationship between e-business adoption and international performance. Among firms using the Internet to conduct business, international firms could gain benefit of improved performance by using the technology such as e-business in their value chains. However, it is also important to emphasize that adopting e-business into the process of firm’s collaboration with customers, suppliers and distributors have higher significant effect

Business and Economic Research ISSN 2162-4860
2014, Vol. 4, No. 1
www.macrothink.org/ber 226
than using technology in gathering intelligence information and establishing communication.
Despite this paper is an important step in attempting to understand the strategic role of e-business adoption faced by international firms, it is limited in several ways. First, the results are based on a cross-sectional survey conducted at one point in time. As such, they cannot establish causality. We rely on the logical argument that the process of internationalization has been occurring longer than the adoption of e-business on firm’s operations, so use of information technology such as e-business improves this process. However, we could argue that higher level of internationalization in turn leads to greater assimilation of e-business for more efficient use of information and enhanced knowledge management. Second, due to the methodology used, the model in our study explains a moderate amount of variance. We chose to focus on the effect of e-business use on international performance of exporting firms rather than being explicitly interested in a range of factors explaining different types of impacts. The results indicate that the scope of e-business adopted does have an effect on international performance of exporting firms. Third, our study used a subjective measure of firm’s export performance. Although this was a necessity due to firms’ resistance in providing their total number of exports, the results would be stronger if objective export performance measures could have been included, especially if both types of measures could have been used in order to examine the correspondence between such measures.
References
Amit, R., & Zott, C. (2001). Value creation in e-business. Strategic Management Journal, 22, 493-520. http://dx.doi.org/10.1002/smj.187
Andersen, O. (1993). On the Internationalization Process of the Firm: A Critical Analysis. Journal of International Business Studies. http://dx.doi.org/10.1057/palgrave.jibs.8490230
Ashburton, C., & Doherty, N. F. (2003). Towards the Formulation of a “Best Practice” Framework for Benefits Realisation in IT Projects. Electronic Journal of Information Systems Evaluation, 6(2), 1-10.
Bradley, S. P., Hausman, J. A., & Nolan, R. L. (1993). Globalization, technology, and competition. Boston: Harvard Business School Press.
Buckley, & Ghauri (1988). Internationalisation of the firm - a theoretical review with implications for business network research. 18th Annual IMP Conference, Lyon. Competitive Paper.
Calof, J. (1995). Adapting to foreign markets: explaining internationalization. International Business Review. http://dx.doi.org/10.1016/0969-5931(95)00001-G
Chaffey, D. (2004). E-Business and E-Commerce Management. (2nd ed.). London: Prentice Hall.
Chin, W. W. (1998). The partial least squares approach to structural equation modeling. In: G. A. Marcoulides (Ed.), Modern Methods for Business Research (pp. 295-358). Mahwah, NJ: Lawrence Erlbaum Associates.
Business and Economic Research ISSN 2162-4860
2014, Vol. 4, No. 1
www.macrothink.org/ber 227
Churchill, G. A. (1979). A paradigm for developing better measures of marketing constructs. Journal of Marketing Research, 16(1), 64-73. http://dx.doi.org/10.2307/3150876
Cohen, J. (1988). Statistical power analysis for the behavioral sciences. (2nd ed.). Hillsdale, NJ: Lawrence Erlbaum Associates.
Cronbach, L. (1951). Coefficient alpha and the internal structure of tests. Psychometrica, 16(3), 297-334. http://dx.doi.org/10.1007/BF02310555
Cronholm, S., & Goldkuhl, G. (2003). Strategies for Information Systems Evaluation - Six Generic Types. Electronic Journal of Information Systems Evaluation, 6(2), 65-74.
Cuervo-Cazurra, A., & Genc, M. (2008). Transforming disadvantages into advantages: Developing-countryMNEs in the least developed countries. Journal of InternationalBusiness Studies, 39, 957-979.http://dx.doi.org/10.1057/palgrave.jibs.8400390
Dedrick, J., Kraemer, K. L., & Palacios, J. J. (2001). Impacts of liberalization and economic integration on Mexico’s computer sector. The Information Society, 17(2), 119-132.
Devaraj, S., & Kohli, R. (2003). Measuring information technology payoff: a meta-analysis of structural variables in firm-level empirical research. Information Systems Research, 14(2), 127-145.
Dublish, S. (2000). Retailing and the Internet. Proceedings of the First World Congress on the Management of Electronic Commerce, McMaster University, Hamilton, Canada.
Dunt, E. S., & Harper, I. R. (2002). E-Commerce and the Australian Economy. The Economic Record, 78 (242), 327-342. http://dx.doi.org/10.1111/1475-4932.00061
Eriksson, K. (1997). Experiential Knowledge and Cost in the Internationalization Process. International Studies of Management and Organization.
Eriksson, K. (2000). Path Dependence and Knowledge Development in the Internationalization Process. Management of International Review.
Fornell, C., & Cha, J. (1994). Partial Least Squares. In: R. P. Bagozzi (Ed.), Advanced Methods of Marketing Research (pp. 52-78). Cambridge, MA: Basil Blackwell.
Fornell, C., & Larcker, D. F. (1981). Structural equation models with unobservable variables and measurement error: Algebra and statistics. Journal of Marketing Research, 18 (3), 328-388. http://dx.doi.org/10.2307/3150980
Fornell, C., & Bookstein, F. (1982). A comparative analysis of two structural equation models: LISREL and PLS applied to market data. In: C. Fornell (Ed.), A second generation of multivariate analysis (Vol. 1, pp.289-323). New York, NY: Praeger.
Gibbs, J. L., & Kraemer, K. L. (2004). A cross-country investigation of the determinants of scope of e-commerce use: An institutional approach. Electronic Markets, 14 (2), 124-137. http://dx.doi.org/10.1080/10196780410001675077
Gotz, O., Liehr-Gobbers, K., & Krafft, M. (2009). Evaluation of structural equation models

Business and Economic Research ISSN 2162-4860
2014, Vol. 4, No. 1
www.macrothink.org/ber 228
using the partial least squares (PLS) approach. In: V. Esposito Vinzi, W. W. Chin, J. Henseler & H. Wang (Eds), Handbook of partial least squares: Concepts, methods, and applications. Berlin: Springer. http://dx.doi.org/10.1007/978-3-540-32827-8_30
Grey, W., Katircioglu, K., Bagchi, S., Shi, D., Gallego, G., Seybold, D. & Stefanis, S., (2003). An analytic approach for quantifying the value of e-business initiatives. IBM Systems Journal, 42(3), 484-497. http://dx.doi.org/10.1147/sj.423.0484
Hoffman, L. D., & Novak, P. T. (1996). Marketing in Hypermedia Computer-Mediated Environments: Conceptual Foundations. Journal of Marketing, 60(3), 50-68. http://dx.doi.org/10.2307/1251841
Huber, G. P., & Power, D. J. (1985). Retrospective Reports of Strategic-Level Managers: Guidelines for Increasing Their Accuracy. Strategic Management Journal, 6(2), 171-180. http://dx.doi.org/10.1002/smj.4250060206
Johanson, J. and Vahlne, J. E. (2009). ‘The Uppsala internationalization process model revisited - from liability of foreignness to liability of outsidership’. Journal of International Business Studies, 40, Anniversary Issue, 1411-31.http://dx.doi.org/10.1057/jibs.2009.24
Knight, G. A., & Cavusgil, S. T. (2004). Innovation, organizational capabilities, and the born-global firm. Journal of International Business Studies, 35, 124-141. http://dx.doi.org/10.1057/palgrave.jibs.8400071
Kohli, R., Sherer, S. A., & Baron, A. (2003). IT investment payoff in e-business environments: research issues. Information Systems Frontiers, 5 (3), 239-247.
Kotler, P. (2000). Marketing Management. (10th ed.). Englewood Cliffs, NJ: Prentice Hall.
Nunnally, J. C., & Bernstein, I. H. (1994). Psychometric theory. (3rd ed.). New York, NY: McGraw-Hill.
Organization for Economic Cooperation and Development (1999). The economic and social impact of electronic commerce. Paris: OECD.
Porter, M. (2001). Strategy and the Internet. Harvard Business Review, 79(3), 62-78.
Quelch, A. J., & Klein, R. L. (1996). The Internet and International Marketing. Sloan Management Review, 38(3), 60-75.
Ringle, C. M., Wende, S., & Will, S. (2005). SmartPLS 2.0 (M3) Beta. Hamburg: http://www.smartpls.de.
Shi, D., & Daniels, L. (2003). A survey of manufacturing flexibility: implications for e-business flexibility. IBM Systems Journal, 42(3), 414-427. http://dx.doi.org/10.1147/sj.423.0414
Shoham, A. (1998). Export performance: a conceptualization and empirical assessment. Journal of International Marketing, 63, 59 - 81.
Singh, M. (2000). Electronic Commerce in Australia: Opportunities and Factors Critical for

Business and Economic Research ISSN 2162-4860
2014, Vol. 4, No. 1
www.macrothink.org/ber 229
Success. Proceedings of the 1st World Congress on the Management of Electronic Commerce, Hamilton, Ontario, Canada.
Snow, C. C., Snell, S. A., Davison, S. C., & Hambrick, D. C. (1996). Use transnational teams to globalize your company. Organizational Dynamics, 24, 50-66. http://dx.doi.org/10.1016/S0090-2616(96)90013-3
Sturgeon, T. J. (2002). Modular production networks: A new American model of industrial organization. Industrial and Corporate Change, 11(3), 451-496. http://dx.doi.org/10.1093/icc/11.3.451
Tenenhaus, M., Esposito Vinzi, V., Chatelin, Y.-M., & Lauro, C. (2005). PLS path modeling. Computational Statistics & Data Analysis, 48(1), 159-205. http://dx.doi.org/10.1016/j.csda.2004.03.005
Turban, E., King, D., Lee, J., & Viehland, D. (2004). Electronic Commerce: A managerial Perspective. New Jersey: Prentice Hall.
Wade, M., & Hulland, J. (2004). The Resource-Based View and Information Systems Research: Review, Extension, and Suggestions for Future Research. MIS Quarterly, 28(1), 107-142.
Werts, C. E., Linn, R. L., & Joreskog, K. G. (1974). Intra class reliability estimates: Testing structural assumptions. Educational and Psychological Measurement, 34(1), 25-33.
Copyright Disclaimer
Copyright reserved by the author(s).
This article is an open-access article distributed under the terms and conditions of the Creative Commons Attribution license (http://creativecommons.org/licenses/by/3.0/).
Business and Economic Research ISSN 2162-4860
2014, Vol. 4, No. 1
www.macrothink.org/ber 230
Do Corporate Social Responsibility Initiatives Favorable for Banks? Customer’s Perceptions
Shahbaz Khan
Research Scholar, Shaheed Zulfikar Ali Bhutto
Institute of Science and Technology, Islamabad, Pakistan
Tel: 92-334-793-1215 E-mail: [email protected] [email protected]
Nida Baig
International Institute of Islamic Economics
International Islamic University, Islamabad, Pakistan
E-mail: [email protected]
Aon Waqas Awan
PhD Scholar, Environmental Economics & Tourism
Universitat de les Illes Balears, Spain
Tel: 34-695-718-268 E-mail: [email protected]
Muhammad Imdad Ullah
Research Scholar, Shaheed Zulfikar Ali Bhutto
Institute of Science and Technology, Islamabad, Pakistan
Tel: 92-300-635-0086 Email:[email protected]
Received: March 12, 2014 Accepted: March 25, 2014
doi:10.5296/ber.v4i1.5266 URL: http://dx.doi.org/10.5296/ber.v4i1.5266
Business and Economic Research ISSN 2162-4860
2014, Vol. 4, No. 1
www.macrothink.org/ber 231
Abstract
The main purpose of this research is to investigate the response of Pakistani banking customers towards corporate social responsibility initiatives. This study also seeks to investigate the importance level of each initiative as per the customers’ perceptions. The sample includes 300 banking customers of Rawalpindi and Islamabad in Pakistan. The data has been collected by survey methodology from banking customers of Habib Bank Limited and United Bank Limited through the use of a structured questionnaire. Regression and correlation have been employed as data analysis techniques. After the data analysis, it has been concluded that banking customers are entirely in the favor of taking CSR initiatives in the banking industry. The results also show that banking customers have given the highest priority to customer centric initiatives, with the philanthropic initiatives at the 2nd and, environmental initiatives at the last.
Keywords: Corporate social responsibility, Customer-centric Initiative, Philanthropic Initiative, Environmental Initiative, Stakeholder Theory
1. Introduction
Banks operate as financial intermediaries in the economy. The banks supervise borrowers and handle the financial risks. Banks systemize the payment system in the society. As these functions have a huge impact on society; that’s why banks have a massive impact on society (Scholtens, 2009). In the mid 1980’s a new kind of bank comes out that has changed the market trend and has a strategy to quantify its profitability both financially as well as socially (Relano, 2011).
Internationally Banks are transferring millions of dollars into many different types of corporate social responsibility initiatives in order to fortify their reputation and get healthy associations with stakeholders (McDonald & Rundle-Thiele, 2008). So, they are including social and environmental added value to their business operations and actions (Relano, 2011). Banks and financial organizations from every part of the world are directing their efforts to adopt corporate social responsibility practices and take on such policies which are not only beneficial for already established sections of society but also to upgrade economically marginalized classes.
Global overview of the banking industry reveals that their microfinance, microcredit schemes, ethical practices at workplaces, investment in the construction of social infrastructure are improving day by day. For instance, in India, the banking business gives attention to its corporate social responsibility actions, especially in the education sector, fair growth, physical health, and green marketing, and also takes into view the satisfaction of customers as a corporate social responsibility initiative (Narwal, 2007). Banking Industry of Taiwan has efficiently made use of CSR strategies for the improvement of the environment and to get the best customers outcome (McDonald & Lai, 2011).
Word CSR firstly used by Bowen in 1953 in his book “Social Responsibility of the Businessman" Flack &Heblich (2007). Flack &Heblich (2007) argue that, within a decade, after the work of Bowen on CSR, many other researchers like Frederik (1960) and Davis (1960)

Business and Economic Research ISSN 2162-4860
2014, Vol. 4, No. 1
www.macrothink.org/ber 232
broadly discussed the idea of CSR in their different debates. From that time, corporate social responsibility has taken an important place in debates of researchers and become the main subject for practitioners (Rahim et al., 2011). The key theme of corporate social responsibility is that, companies are restricted to do work for betterment of public (Safi, 2013).
The advantages of corporate social responsibility for banks are growing strongly and putting their positive impacts on earnings, faith, trust and customer retention (Brown & Dacin, 1997; Sen & Bhatachara, 2001). Due to these positive impacts, the banking sector has moved its attention towards adopting corporate social responsibility strategies.
For the last two decades, in Pakistan, the need of corporate social responsibility has been increased in the business community as well as for the satisfaction of their customers (Safi, 2013). Now the Pakistani banks too, are deeply involved in improving CSR activities by improving their workplaces, reducing the paperwork to avoid garbage by adopting the electronic banking techniques and investing in various social NGO’s and institutions those are working for the betterment of human beings. In the recent disasters of flood and earthquake; banks play their prominent role in the reconstruction of infrastructure and giving social services to people in the form of food, money and other things fulfilling the basic needs of life.
1.1 Contextual Analysis
1.1.1 Corporate Social Responsibility in Pakistan: General Idea
In some parts of Asia, including Pakistan, corporate social responsibility is steadily creating its space in the multinational and private sectors (Khan & Nomani, 2002). There is a huge importance and effect of CSR initiatives on the reputation of organizations, as well as it provides a constructive framework for using the stakeholders efficiently and effectively (Ahmad, 2006). In a research of 568 listed and unlisted companies regarding donation giving activities, published by Pakistan Centre for Philanthropy, the researcher uses annual reports and many arrangements of interviews to get the results which showed that 64% of the PLCs reports have several social development initiatives. Even though, companies give generally for reasons of trust and humanity, tax profit, make better public relations and marketing benefits are known as a cause to some degree (PCP 2005: v).
Many Pakistani firms connected with corporate social responsibility actions approaching to standards of developed countries in order to distribute information about their efforts, using different types of media such as literature in printed form (e.g., PSO), the commercial website e.g. (www.crescent.com.pk, Crescent Steel and Allied Products). Company profiles that are published in the Pakistan’s Economic Review are as follows:
� Mark passing references to environmental policies, a national business publication (National Refinery Limited, Economic Review 2005a)
� Corporate citizenship (Pakistan Petroleum Limited, Economic Review 2005c; Askari Bank, Economic Review 2005b)
� Health, environment and safety (English Biscuit Manufacturers, Economic Review 2002).

Business and Economic Research ISSN 2162-4860
2014, Vol. 4, No. 1
www.macrothink.org/ber 233
In Pakistan, CSR started when it made partnerships with international NGOs (Khan & Nomani, 2002), and because of international organizations reacted to alarms increased in urban countries in relation to the issues such as working circumstances in supply chain partners and child labor. The affairs of child stitches and football industry have been known very well (Khaliq, 2004) along with its unintentional consequences and effects for the local employees (Huselbe 2000; Bendel, 2005). More business in Pakistan, for example the industry that makes surgical apparatus and leather tanneries, have been the important point of non government organization (NGO) academic studies and action (summarized in Lund Thomsen et al., 2006). In the majority of cases, force for exercising the Corporate Social Responsibility activities emerge from worldwide customers who are not willing to bear any more unethical practices of child labour (Safi, 2013).
The Pakistani managers while implementing various CSR initiatives in banks mix the interests of various stakeholder groups. This is a big hindrance for implementation of CSR initiatives in the better way which leads them to the loss of strategic focus. Among the various stakeholder groups; customers are the most important one and managers don’t take into account the attitude and behaviour of customers while implementing CSR initiatives. Also, they ignore the important aspect, which CSR initiatives contain the highest importance in the mind of customers, which one holds the lesser and, which one is at the bottom level. Such real time problems need to readdress the following questions:
1. How banking customers respond to various CSR initiatives?
2. How banking customers perceive customer-centric initiatives?
3. How banking customers perceive environmental initiatives?
4. How banking customers perceive philanthropic initiatives?
This paper attempts to investigate the impact of various corporate socially responsible initiatives on Pakistani banking customers and answer these questions.
2. Literature Review
2.1 Concepts and Definitions (Corporate Social Responsibility)
Corporate social responsibility arises from societal responsibilities, no matter what is the nature of these responsibilities (Craig, 2003). A concept of corporate social responsibilities varies from author to author, e.g. according to Craig (2003), the CSR is only fulfilling the responsibilities of organization’s stakeholders and, on the other hand Brown & Dacin (1997) explained CSR as the responsibility of whole society. Corporate social responsibility indicates working a business in a socially responsible way whereby the business:
� Undertakes labor by improving workplaces and ethical practices in employment;
� Is concerned in building local communities and communicates with apprehensive communities regarding the effects of its products and policies;
� Spends on building social infrastructure;

Business and Economic Research ISSN 2162-4860
2014, Vol. 4, No. 1
www.macrothink.org/ber 234
� Donates to a cleaner environment, its sustainability and protection; and
� Contributes by the manner of its corporate governance to economic progress at large.
Corporate social responsibility has been explained from different points of view. It has confined to a narrow financial thinking which define CSR as a source to make the most profits to shareholders (Zenisek, 1979). A complete societal view of CSR presented as “the company’s position and actions with respect to its perceived societal or, at least, stakeholder obligations” (Brown & Dacin, 1997). CSR is illustrated with the intention to level up the focus of the enterprise on the numerous benefits of those who, on one side are affected by the result of its activity and on the other hand can control the overall performance of the enterprise (Zappi, 2007). Achua (2008) defines CSR as the social responsibility of a business which it has to fulfil due to its numerous interactions with environment and society. And according to Stuebs & Sun (2011), it is the corporate objective of an organization in which a business organization has to include the interests of the society as well in their routine operations.
According to Nwankwo (1991) a bank’s CSR obligations comprises of a corporate social duty to several stakeholders: to meet the demand of depositors one must maintain best possible liquidity, satisfy the reasonable deficits area demand for credits, to maximize profit for shareholders, conform with s of regulators to go on in business, economy and also satisfy its area population.
A significant effort to identify the positive effects of corporate social responsibility initiative has been done by many researches.
2.2 Various CSR Initiatives and Measures
There are following three types of CSR initiatives (McDonald & Lai, 2011).
2.2.1 Environmental-Protection Initiatives
These include following type of measures:
� Reduce electricity and power consumption
� Use of environmental pleasant products
� Use of eco-friendly materials
Pakistani banking customers is now aware of the fact that it is the core responsibility of the banks to include also environmental protection measures while achieving their organizational goals (Safi, 2013). Also the managers in all around the world are progressively hopeful to be focused on the performance of environmental and social responsible issues. In various countries corporate social responsibility initiatives are implying by the initiative authoritarians, and also growing up by IMF, World Bank and OECD (Jenkins, 2005; Hafsi & Farashahi, 2005).
2.2.2 Customer-Centric initiatives
� The workforce is competent and trustworthy

Business and Economic Research ISSN 2162-4860
2014, Vol. 4, No. 1
www.macrothink.org/ber 235
� Staff has ability to solve the complaints.
� Positive and quick response of employee towards customer’s queries.
� Staff is proficient and elegant.
� Extending the branch network as well as new stuff.
� ATM connectivity
� Faster internal processing
� A higher return and lower fees
� Internet and mobile banking
� Convenient and better branch environment
Rashid (2010) stated that overall strategies of an organization are specifically related to customer’s satisfaction, so investors try to invest in those companies where they can earn not only the profit but also concerned with the company’s worth related to customer satisfaction. Carrol (1979) defined the core object of business operations that is economic stability, which can be also obtained by customer centric initiatives.
According to Rashid (2010) there are four aspects of the customer centric initiative involved in corporate social responsibility activities of banks. The focus of these corporate social responsibility initiatives is on the following main points:
1. Spending more and more for quality improvement and innovation.
2. Setting up ethics in daily operations.
3. Contribute for a fruitful social change.
4. Following up legal regulations.
It is clear from the above mentioned four points that, corporate social responsibility is much more than its traditional concept i.e. to perform only philanthropic activities.
2.2.3 Philanthropic Initiatives
� Granting shows and concerts
� Giving funds an art exhibition
� To give awareness about financial planning to the common man by organizing different free workshops.
� Charity to orphanages.
� Funding for the building of schools in order to provide free education to poor children in remote areas.
Caroll (1991) suggested that for employees and managers, it is imperative to donate in

Business and Economic Research ISSN 2162-4860
2014, Vol. 4, No. 1
www.macrothink.org/ber 236
charitable actions at their national level, especially in activities which have done for increasing the standards of society’s lifestyle. Philanthropic obligations are not as like ethical responsibilities as they are just an option, depends on the consent of managers of organizations, it does not relate to the organization’s profit (Farell, 2004). In fact, the purpose of philanthropic responsibilities in an organization is to advertise the corporate social responsibility demonstration in developing parts of the world (Ahmed, 2006; Amaeshi et al., 2006; Arora & Puranik, 2004). Organizations are not liable to fulfil their philanthropic aims, but it is best for their interest to accomplish their philanthropic responsibilities because of the pressure from society. Customers have a desire from organizations to donate their services, money and time in some volunteer activities (Caroll, 1991). Philanthropic responsibilities do not give any benefit in monetary terms for the short run, but it is very beneficial for a sustainable growth (Fombrun et al., 2000).
2.3 Reaction of Banking Customers towards CSR Initiatives
A lot of time and resources have been allocated by researchers and top executives to corporate social responsibility strategies in the recent decades (Cheng et al., 2014) but it is a viable methodology to keep out the financial companies from any type of comparative study and analysis due to different financial structure of these organizations and same practice of exclusion has been adopted by the researchers while applying corporate social responsibility initiatives to banking sector (Crowther & Aras, 2010). No doubt, a lot of importance and stress is being given on CSR initiatives but still there is a gap lying for the studies based on customer’s attitude and behaviour towards CSR initiatives (McDonald & Rundle-Thiele, 2008). Not enough, researchers have thought about the reaction of banking customers towards the different CSR strategies (McDonald & Lai, 2011).
2.4 Stakeholder’s Attitude towards CSR
Theory of stakeholder supports strongly the companies to adopt a corporate social responsibility strategy (Safi, 2013). According to Reverte’s (2009) “theory of stakeholder”, every stakeholder group has its own point of view about the operations of an organization to be conducted; that’s why organization should deal each group of stakeholder independently. Stakeholder perspective urges the managers and theorists to think about the new ways and policies which enable them to deal properly with stakeholders in such a balanced way that may benefit both the sides equally (Bhattacharya, 2009). So, Bhattacharya (2009) has a view that, if a company wants to get good returns through corporate social responsibility practices, it should have to provide a particular return to individual stakeholders. Turnover and policies of an organization are interdependent (Rashid, 2010). So, to earn better profits ethical, legal and social structure of the organization should be developed in accordance with the interests of the relevant stakeholders (Rashid, 2010).
According to Rashid (2010), there should be one central stakeholder in focus because targeting the satisfaction of multiple stakeholders will cause in loss of corporate strategic focus and will create dissatisfaction. Actually, it’s rather critical to choose a central stakeholder in the sense that his satisfaction should also result in satisfaction of other stakeholders as well (Rashid, 2010). In the majority of cases customers are the central stakeholders and main point of focus

Business and Economic Research ISSN 2162-4860
2014, Vol. 4, No. 1
www.macrothink.org/ber 237
due to their presence as major citizens of society (Rashid, 2010). Consequently, the strategy which is customer oriented will obviously satisfy the overall social demand of the stakeholders involved (Rashid, 2010).
2.5 CSR Initiatives Impact Customer Approach and Attitude
There are few studies available to investigate the relationship between the customer behaviour and corporate social responsibility; many research analysts suggested that organizations should properly advertise corporate social responsibility sequentially to get a positive effect on the customer’s attitude (Maignan & Ferrel, 2001). Opposing consequences were discovered about the effects of social corporate responsibility on the customer’s attitude (Ali et al., 2010). It has been revealed by some researchers that corporate social responsibility initiatives are directly related to intentions of consumers to buy something (Ellen, Webb, 2000; Creyer & Rose, 1997).
A little bit of literature found in the banking sector which shows the effect of corporate social responsibility initiatives on the customer’s attitude and behaviour attentions. McDonald & Lai (2011) have investigated that customer oriented initiatives have a stronger positive impact on the attitude of customers as compared to other CSR initiatives. Also in their findings, they concluded that customer oriented initiatives have a great positive impact on the customer’s behaviour as compared to other initiatives. Some literature has defined the behaviour effectiveness in corporate social responsibility fields (Sen et al., 2006). Sen et al. (2006) discovered that, people who have a good awareness about a real business philanthropy initiative are more intent to invest and purchase. It is discovered that, “Massachusetts Bank” has been successful in getting new accounts, approximately 138 accounts having worth $11 million, by helping out the animal class which are in danger of extinction with providing funds to World Wildlife Fund (Lamke, 1987).
Studies, which may have an impact on the attitudes and behaviours of customers, are very few; but a lot of studies have ranked the customer’s preferences towards different corporate social responsibility initiatives (McDonald & Lai, 2011). McDonald & Lai (2011) studied the responses of customers of Taiwanese retail banking towards different CSR initiatives and concluded that, customers prefer customer oriented initiatives more as compared to environmental and community related initiatives. Customers have a point of view if they are satisfied; this should lead to the satisfaction of all the relevant stakeholders as well (Rashid, 2010). So, customers prefer the initiatives such as ATM connectivity, faster internal processing, higher return and lower fees, internet and mobile banking, excellent dealing with employees with them and of course the convenient and better branch environment (Rashid, 2010). McDonald & Rundle-Thiele (2008) also concluded that customer centric initiatives provide more satisfaction to bank customers as compared to philanthropic and environmental protection initiatives.
Maginan & Ferel (2004) identified many studies about the positive effects of corporate responsibility initiative on customers by reviewing the literature. It is noted by Handlman & Arnold (1999), that the actions which are committed by customers, and related to institutional standards, have been taken by customers positively. Consumers prefer the companies who are

Business and Economic Research ISSN 2162-4860
2014, Vol. 4, No. 1
www.macrothink.org/ber 238
related to commit actions of friendly environment ethics (Brone et al, 2000).
According to Murry & Vogel (1997), various socially responsibility programs effects on customers like cause support (a latchkey program for children), friendly environment, customer centric initiative, and also includes customer security (a program of consumer board).
2.6 CSR Initiatives in Banking
Mcdonald & Lai (2011) conducted a study on two forms of social marketing in banking sector in Taiwan and concluded that consumers encourage the concept of social marketing. A study conducted in the retail banking sector of Spain by taking a sample of 800 customers, De los Salmones et al., (2009) inspected that both ethical & philanthropic initiatives have a positive impact on customer loyalty.
Previous literature and studies recommended that customer oriented initiatives can encourage the positive approach of the customers. So, the banks may get the competitive edge by giving more preference to customer oriented initiatives (McDonald & Rundle-Thiele, 2008).
In the light of previous studies and the discussion about how customers rank various CSR initiatives, it may be suggested that customer centric initiatives contain higher importance for enhancing the attitudes and behaviour of customers as compared to philanthropic and environmental initiatives.
3. Hypotheses and Theoretical Framework
3.1 Hypotheses
H1: CSR initiatives impact positively on the attitude and behaviour of customers
H2: Banking customers give the highest priority to customer centric initiatives
H3: Banking Customers give the lesser priority to philanthropic initiatives
H4: Banking Customers give the least priority to environmental initiatives
3.2 Theoretical Model

Business and Economic Research ISSN 2162-4860
2014, Vol. 4, No. 1
www.macrothink.org/ber 239
4. Methodology
4.1 Sample Size
The decision of the sample size is very necessary for getting best statistical analysis. So the sample size used consists of 300 questionnaire responses. However, it can vary between100 to 300. The more the responses the more efficient statistical analysis will be. The data thus gathered should be examined without any delay in order to prove our hypotheses.
4.2 Population Frame
It is highly confidential to get the list of a bank’s customers. My actual population frame was the bank statement which consists of the list of all customers; however, it was not possible to get that statement. So, I personally visit both the banks and filled my questionnaires on a random basis from the customers entering into the branches.
4.3 Pilot Testing
Collection of data is being done via an adapted questionnaire. So, it is mandatory to check its validity in the real banking environment of Pakistan. In order to have a glimpse, whether banking customers are aware of the corporate social responsibility’s concept or not; I have visited personally to various banks of Rawalpindi & Islamabad and routed a set of 50 questionnaires. I had asked each and every respondent whether he is able to under the questions or not. Are they satisfied with the language, wording and number of options in each question? The feedback from most of the respondents was positive. 48 out of 50 respondents were satisfied with the questionnaire which was enough for my questionnaire to be proved as valid.
4.4 Survey Methodology
Questionnaire surveys have been broadly recognized as competent tools for evaluating the perception of persons over and above of the company on an exacting subject. This does not denote, on the other hand, that the limitations of this tool are to be ignored. In societal research, one of the middle issues of the reviewers of the questionnaire is how it is able to be assured that the respondent interpret in such a way that the researcher needs. These problems can be
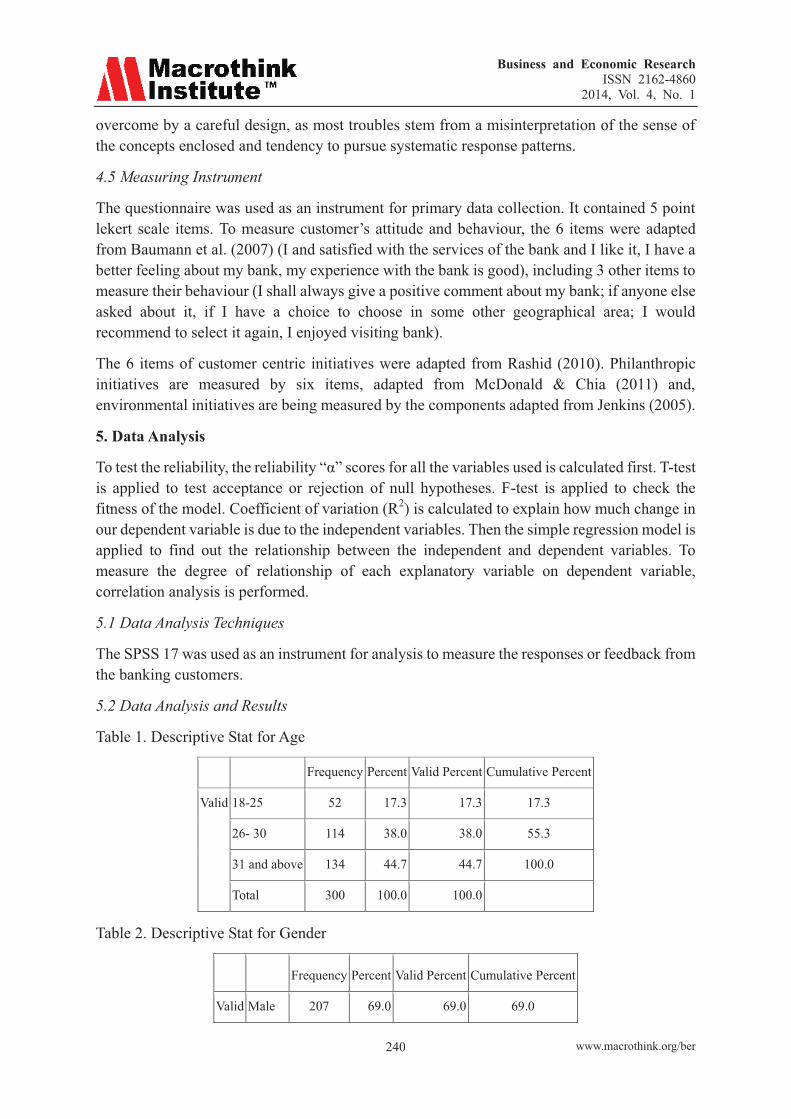
Business and Economic Research ISSN 2162-4860
2014, Vol. 4, No. 1
www.macrothink.org/ber 240
overcome by a careful design, as most troubles stem from a misinterpretation of the sense of the concepts enclosed and tendency to pursue systematic response patterns.
4.5 Measuring Instrument
The questionnaire was used as an instrument for primary data collection. It contained 5 point lekert scale items. To measure customer’s attitude and behaviour, the 6 items were adapted from Baumann et al. (2007) (I and satisfied with the services of the bank and I like it, I have a better feeling about my bank, my experience with the bank is good), including 3 other items to measure their behaviour (I shall always give a positive comment about my bank; if anyone else asked about it, if I have a choice to choose in some other geographical area; I would recommend to select it again, I enjoyed visiting bank).
The 6 items of customer centric initiatives were adapted from Rashid (2010). Philanthropic initiatives are measured by six items, adapted from McDonald & Chia (2011) and, environmental initiatives are being measured by the components adapted from Jenkins (2005).
5. Data Analysis
To test the reliability, the reliability “α” scores for all the variables used is calculated first. T-test is applied to test acceptance or rejection of null hypotheses. F-test is applied to check the fitness of the model. Coefficient of variation (R2) is calculated to explain how much change in our dependent variable is due to the independent variables. Then the simple regression model is applied to find out the relationship between the independent and dependent variables. To measure the degree of relationship of each explanatory variable on dependent variable, correlation analysis is performed.
5.1 Data Analysis Techniques
The SPSS 17 was used as an instrument for analysis to measure the responses or feedback from the banking customers.
5.2 Data Analysis and Results
Table 1. Descriptive Stat for Age
Frequency Percent Valid Percent Cumulative Percent
Valid 18-25 52 17.3 17.3 17.3
26- 30 114 38.0 38.0 55.3
31 and above 134 44.7 44.7 100.0
Total 300 100.0 100.0
Table 2. Descriptive Stat for Gender
Frequency Percent Valid Percent Cumulative Percent
Valid Male 207 69.0 69.0 69.0

Business and Economic Research ISSN 2162-4860
2014, Vol. 4, No. 1
www.macrothink.org/ber 241
Female 93 31.0 31.0 100.0
Total 300 100.0 100.0
Table 1 & 2 shows the descriptive stat for the gender and age of the total respondents. Among the 300 respondents, 69% were males and remaining, 31% were females. And 45% of the respondents were of age 31 and above, 38 % were aged between 26 and 30 while 17% were aged between 18 and 25.
Table 3. Reliability of the Variables
Construct Cronbach Alpha No. of Items
Customer’s Attitude and Behavior .74 6
Customer Centric Initiatives .71 6
Philanthropic Initiatives .78 6
Environmental Initiatives .68 6
All Items(Questionnaire) 0.77 4
Table 3 shows the reliability of the generated scale. It is clear from the table that, the chronbach alpha values for all the variables are more than 0.7 except environmental initiatives which is slightly less. And according to Nunnally (1978), 0.7 is the acceptable reliability coefficient for a scale to be considered as reliable. Also, chronbach alpha value for whole questionnaire is 0.77 which is an evident that questionnaire is reliable and can be distributed for survey among banking customers.
Table 4. Coefficient of Determination
Model R R Square Adjusted R Square Std. Error of the Estimate
1 .650a .422 .417 .45558
Table 4 shows the value of R-square (Coefficient of Determination). And the value of co-efficient of determination tells us that how much explanatory variables are explaining the dependent variable of the study. Here our R-square value is 42.2%; it shows that 1% change in the independent variables (CCI, PI and EI) will cause a 42.2% change in the dependent variable (CAB).
Table 5. ANOVA
Model Sum of Squares df Mean Square F Sig.
1
Regression 44.932 3 14.977 72.162 .000a
Residual 61.435 296 .208
Total 106.367 299

Business and Economic Research ISSN 2162-4860
2014, Vol. 4, No. 1
www.macrothink.org/ber 242
a. Predictors: (Constant), EI, CCI, PI
b. Dependent Variable: CAB
Table 5 shows the fitness of model. If the calculated value of F is greater than the tabulated value at a significance level of 0.05. Then we say that our model fits and the null hypothesis is rejected. The calculated value of F for this study is 72.16 and tabulated values for F at the above mentioned significance level are 8.55 with degree of freedom 3. That’s why model of this study is fit.
Table 6. Results of Regression
Model Unstandardized Coefficients Standardized Coefficients
t Sig. B Std. Error Beta
1
(Constant) .289 .248 1.165 .245
CCI .371 .055 .334 6.798 .000
PI .276 .049 .291 5.622 .000
EI .242 .062 .209 3.902 .000
a. Dependent Variable: CAB
Table 6 shows the regression relationship between the variables. It is visible from the beta values that explanatory and dependant variables have a positive relationship. As per above mentioned values of betas, the regression equitation will be as follows:
CAB= .289+ .371CCI+.276PI+.242EI
Above equation shows that all the independent variables have put a positive impact on the customer’s attitude and behaviour. Hence, 1st Hypothesis is accepted.
Table 7. Results of Correlations
CAB CCI PI EI
CAB Pearson Correlation 1
CCI Pearson Correlation .517** 1
PI Pearson Correlation .507** .335** 1
EI Pearson Correlation .491** .410** .501** 1
**. Correlation is significant at the 0.01 level (2-tailed)
Table 7 shows that banking customers have given the highest priority to customer centric initiatives than other two initiatives as having the highest correlation coefficient of 0.517. Customers have kept the philanthropic and environmental initiatives at the 2nd and 3rd priorities
Business and Economic Research ISSN 2162-4860
2014, Vol. 4, No. 1
www.macrothink.org/ber 243
respectively. It is an evident that 2nd, 3rd and 4th hypotheses for this study are also accepted.
6. Results and Discussion
The contribution of this research regarding the response of Pakistani banking customers towards the corporate social responsibility initiatives is as follows:
H1 predicted that, CSR initiatives will create a significant positive impact on the attitude and behaviour of banking customers. It is visible from the regression equation that, the independent variables, i.e. CCI, PI and EI are impacting positively on customer’s attitude and behaviour. Also, the impact is significant at 0.01 level.
According to the prediction of H2, banking customers should give the highest priority to customer-centric initiatives as compared to other two. And the correlation table showed that customer centric initiatives have the highest correlation coefficient i.e. 0.517 as compared to the other two initiatives which is the evidence of banking customer’s highest priority and interest towards customer-centric initiatives; proving our 2nd hypothesis as well.
H3 and H4 suggested that, banking customers will give 2nd and 3rd priority to philanthropic and environmental initiatives respectively. The correlation coefficients for these initiatives (PI: r = 0.507; EI: r = 0.491) demonstrated that customers gave a 2nd ranking to philanthropic initiatives and 3rd ranking to environmental initiatives. This verified our 3rd and 4th hypotheses as well.
The results of this study are similar to the study of McDonald & Chia (2011) who have investigated the “impact of CSR initiatives on Taiwanese banking customers. So, the same results are applicable for Pakistani banking customers as well.
7. Conclusion
The foremost objective of this research was to investigate the impact of CSR initiatives on attitude and behaviour of banking customers. Therefore, the findings of this study are especially beneficial for the banking sector of Pakistan. It is apparent from the results that, all our Hypotheses are true which means that CSR initiatives have a positive and significant impact on the attitude and behaviour of Pakistani banking customers. The second objective of this study was to determine the priority of banking customers towards various CSR initiatives. For this, we have to check that up to what extent there is a change in dependent variable, i.e. in attitude and behaviour of banking customers due to each independent variable. As correlation is the way to determine the degree or extent of relationship between explanatory and dependent variables. The results of the correlation indicated that due to customer centric initiatives, there occurred a more significant change as compared to other two initiatives. Therefore, we can conclude that banking customers are very much interested in those initiatives which are in their own favor. Psyche of human beings always shows flexibility towards its own benefits. And the same type of attitude and psyche of customers can be observed in this study.
From results, it can also be inferred that customers are keeping philanthropic initiatives at the 2nd priority and, environmental initiatives at the last. Although there is a difference between, the correlation coefficient of all the three initiatives, but the difference is slight. This slight

Business and Economic Research ISSN 2162-4860
2014, Vol. 4, No. 1
www.macrothink.org/ber 244
difference is also indicating that, banking customers want an improvement in the customer service, but at the same time don’t want to ignore the discretionary societal concerns i.e. philanthropy and environmental.
8. Policy Implications for Banks
Researchers and bankers can use this study to understand the mindset of banking customers at the time of taking CSR initiatives in banking sector of Pakistan. Pakistani banks should ensure of stake holder’s CSR needs and preferences as there is a difference between stakeholder’s view and needs of CSR. And, to fulfil this need of stakeholders; banks should commence a more holistic stakeholder approach towards the improvement of CSR strategies. An organization must pay attention towards stakeholder approach because history reveals that the companies who realize the priority concerns of stakeholders are performing better than the organizations that don’t care of these interests. Also, the role of customers should outweigh other stakeholder groups. So, the banks should construct such policies for implementation of CSR strategies in which customer should be on the top of list as compared to other stakeholders. And when customers are happy, they will prioritize to use that banking products. As a result, this will help in improving both the financial and economic performance of banks.
9. Limitations and Future Recommendations
In both of the banks, i.e. UBL and HBL, more customers are males and above 26 years of age. So, young banking customer’s (18-25) response is much less and consists of only 17% of the total respondents. Similarly, there are only 31% of female banking customers in the sample due to the less number of female account holders in both of the banks. These are the main limitations from both of the banks, which resist the finding to be applicable to a wider community.
I have delimited my research only to banking customers; however the research may be done by taking into consideration the other stakeholder groups. Moreover, I have taken only two banks in my sample size located in Islamabad and Rawalpindi and, collected my data at one point of time. So, a cross sectional study is recommended by including all of the Pakistani banks for a better understanding of customer’s mind and behaviour.
References
Achua, J. K. (2008). Corporate social responsibility in Nigerian banking system. Society and Business Review. 3(1), 57-71.http://dx.doi.org/10.1108/17465680810852748
Ahmad, S. J. (2006). From Principles to Practice: Exploring Corporate Social Responsibility in Pakistan. Journal of Corporate Citizenship. 2006(24), 115-129. http://dx.doi.org/10.9774/GLEAF.4700.2006.wi.00011
Ali, I. et al. (2010). Effects of corporate social responsibility on consumer retention in cellular industry of Pakistan. African Journal of Business Management, 4(4), 475-485.
Arora, B., & Puranik, R. (2004). A Review of Corporate Social Responsibility in India.Development. 47(3), 93-100. http://dx.doi.org/10.1057/palgrave.development.1100057
Business and Economic Research ISSN 2162-4860
2014, Vol. 4, No. 1
www.macrothink.org/ber 245
Baumann, C. et al. (2007).Prediction of attitude and behaviourial intentions in retail banking. International Journal of Bank Marketing. 25(2), 102-116. http://dx.doi.org/10.1108/02652320710728438
Bhattacharya, C.B. et al. (2009). Strengthening stakeholder company relationships through mutually beneficial corporate social responsibility initiatives. Journal of Business Ethics. 85(2). 257-72. http://dx.doi.org/10.1007/s10551-008-9730-3
Brone, M. J. et al. (2000). The influence of cause related marketing on consumer choice: does one good turn deserve another? Journal of Academy of Marketing Science. 28(20), 248-62. http://dx.doi.org/10.1177/0092070300282006
Brown, T. J., & Dacin, P. A. (1997), The Company and the product: corporate associations and consumer product responses. Journal of Marketing. 61(1), 68-84. http://dx.doi.org/10.2307/1252190
Carroll, A. B. (1991). The pyramid of corporate social responsibility: toward the moral management of organizational stakeholders. Business Horizons. 34(4), 39-48. http://dx.doi.org/10.1016/0007-6813(91)90005-G
Chang, H-S.et al. (2009). How public-issue-promoted and revenue related types of social marketing influence customer perceived value in Taiwan's banking industry. Journal of International Consumer Marketing. 21(1), 35-49, http://dx.doi.org/10.1080/08961530802125308
Cheng, et al. (2014). Corporate social responsibility and access to finance. Strategic Management Journal. 35(1), 1-23. http://dx.doi.org/10.1002/smj.2131
Creyer, E. H., & Ross, W. T. (1997). The influence of firm behavior on purchase intention: Do consumers really care about business ethics? Journal of Consumer Marketing.14(6), 421-432. http://dx.doi.org/10.1108/07363769710185999
De los Salmones, M. M. G. et al. The social role of Financial Companies as a Determinant of Consumer Behaviour. International Journal of Bank Marketing. 27(6), 467-85. http://dx.doi.org/10.1108/02652320910988339
Ellen, P. S. et al. (2000). Charitable programs and the retailer: Do they mix? Journal of Retailing. 76(3), 393-406. http://dx.doi.org/10.1016/S0022-4359(00)00032-4
Ferrell, O. C. (2004). Business ethics and customer stakeholders. The Academy of Management Executive. 18(2), 126-129. http://dx.doi.org/10.5465/AME.2004.13836176
Flack, O., & Heblich, S. (2007).Corporate Social Responsibility: Doing Well by Doing Good. Business Horizons. 50(3), 247-254. http://dx.doi.org/10.1016/j.bushor.2006.12.002
Fombrun, C. J. et al. (2000). Opportunity Platforms and safety nets: Corporate citizenship and reputational risk. Business and Society Review, 105(1), 85-106. http://dx.doi.org/10.1111/0045-3609.00066
Francesc, R. (2011), Maximizing social return in the banking Sector. Corporate Governance.

Business and Economic Research ISSN 2162-4860
2014, Vol. 4, No. 1
www.macrothink.org/ber 246
11(3), 274-284. http://dx.doi.org/10.1108/14720701111138698
Hafsi T., & Farashahi, M. (2005). Applicability of management theories to developing countries: a synthesis. Management International Review. 45(4). 483-511.
Handelman, J. M., & Arnold, S. J. (1999). The role of marketing actions with a social dimension: appeals to the institutional environment. Journal of Marketing. 63(3), 33-48. http://dx.doi.org/10.2307/1251774
Jenkins R. (2005). Globalization, corporate social responsibility and poverty. International Affairs. 81(3), 525-540. http://dx.doi.org/10.1111/j.1468-2346.2005.00467.
Khan, F. S., & Nomani, U. (2006). Corporate social responsibility and natural disaster reduction in Pakistan. Sustainable Development Policy Institute, www. sdpi. org, accessed 23 March.
Lemke, L. (1987). Current financial advertising: mass. Bank's evolutionary account also assists vanishing species. Bank Marketing. 19(5), 41.
Maignan, I., & Ferrell, O. C. (2004). Corporate social responsibility and marketing: an integrated framework, Journal of the Academy of Marketing Science. 32(1), 3-19. http://dx.doi.org/10.1177/0092070303258971
McDonald, L. M., & Rundle-Thiele, S. (2008). Corporate social responsibility and bank customer satisfaction: a research agenda. International Journal of Bank Marketing. 26(3), 170-182.
McDonald, L.M. & Hung, C.H. (2011). Impact of corporate social responsibility initiatives on Taiwanese banking customers. International Journal of Bank Marketing. 29(1), 50-63.
Murray, K. B., & Vogel, C. M. (1997). Using a hierarchy-of-effects approach to gauge the effectiveness of corporate social responsibility to generate goodwill toward the firm: Financial versus nonfinancial impacts. Journal of Business Research. 38(2), 141-159. http://dx.doi.org/10.1016/S0148-2963(96)00061-6
Narwal, M. (2007), CSR initiatives of Indian banking industry. Social Responsibility Journal. 3(4), 49 60. http://dx.doi.org/10.1108/17471110710840233
Nunnally, J. (1978). Psychometric methods. McGraw-Hill, New York, NY.
Rahim, R. A. et al. (2011). The importance of Corporate Social Responsibility on conusmer behavior in Malaysia. Asian Academy of Management Journal. 16(1), 119-139.
Rashid,M. (2010),Customer Centric Corporate Social Responsibility, Retrieved from http://ssrn.com/abstract=1691563.
Reverte, C. (2009), Determinants of corporate social responsibility disclosure ratings by Spanish listed firms. Journal of Business Ethics. 88(2). 351-366. http://dx.doi.org/10.1007/s10551-008-9968-9
Safi, A., & Ramay, M. I. (2013). Corporate Social Responsibility and Consumer Behavior: A

Business and Economic Research ISSN 2162-4860
2014, Vol. 4, No. 1
www.macrothink.org/ber 247
Study from Pakistan. Information Management and Business Review. 5(4), 194-202.
Scholtens, B. (2009). Corporate social responsibility in the international banking industry. Journal of Business Ethics. 86(2), 159-75. http://dx.doi.org/10.1007/s10551-008-9841-x
Sen, S., & Bhattacharya, C. B. (2001). Does doing good always lead to doing better? Consumer reactions to corporate social responsibility. Journal of Marketing Research. 38(2), 225-44. http://dx.doi.org/10.1509/jmkr.38.2.225.18838
Stuebs, M., & Li-Sun (2011). Corporate social responsibility and firm reputation, Journal of Accounting, Ethics & Public Policy. 12(1), Retrieved from http://ssrn.com1863343.
Zappi, G. (2007). Corporate responsibility in the Italian banking industry: creating value through listening to stakeholders. Corporate Governance. 7(4), 471-475. http://dx.doi.org/10.1108/14720700710820542
Zenisek, T. J. (1979). Corporate social responsibility: a conceptualization based on organizational literature. Academy of Management Review. 4(3), 359-68.
Copyright Disclaimer
Copyright reserved by the author(s).
This article is an open-access article distributed under the terms and conditions of the Creative Commons Attribution license (http://creativecommons.org/licenses/by/3.0/).
Business and Economic Research ISSN 2162-4860
2014, Vol. 4, No. 1
www.macrothink.org/ber 248
The Impact of Economic Crisis in Greece: Key Facts and an Overview of the Banking Sector
Fotios V. Mitsakis
Dept. of Human Resource Management, University of Strathclyde
Glasgow G1 1XU, Scotland
E-mail: [email protected], [email protected]
Received: March 27, 2014 Accepted: April 15, 2014
doi:10.5296/ber.v4i1.5515 URL: http://dx.doi.org/10.5296/ber.v4i1.5515
Abstract
Nowadays, the global economic crisis (GEC) highly influences organizations through its macroeconomic causes and effects, which account for a significant impact on firms’ human resources (HR) practices and labor relations (IR) as well. Of greatest concern is the extent to which the actual impacts of the crisis may be hoarding future problems for organization’s operations. Owing to the dynamic nature of contemporary business, its complexity, along with the increasing need for expertise, strategic HR interventions are highly required in an attempt of creating mature and resilient, in HR terms, organizations which will be able to assure their competitiveness, survival, change and growth. However, most organizations (banks) failed to adequately finance their daily operations, accompanied by their failure to finance national economies as well. In that event, the straightaway effects of GEC have resulted into a collapse of most financial systems and in major shortages at financial institutions around the globe. The purpose of this paper is to highlight the impact of GEC through demonstrating key facts related to the current economic crisis in Greece, and more precisely for Greek banking organizations.
Keywords: Economic Crisis (EC), Greek Banks, Human Resources (HR)
1. Introduction
The GEC, the deepest the world has experienced since the stock market crash in 1930s, originated in the US mortgage market, leading to a liquidity shortfall in its banking system, the full effect of which started to be felt in August 2007 (Soriano, 2011), although, Appelbaum (2011: 597) believes that the crisis did not originate in financial markets, but its direct cause initiated by the bursting of the housing bubble. Eventually, the financial crisis initiated in US impacted upon the world economy and led to global trade’s collapse

Business and Economic Research ISSN 2162-4860
2014, Vol. 4, No. 1
www.macrothink.org/ber 249
(Appelbaum, 2011). The second phase of GEC began in September 2008 with the fall of Lehman Brothers; it was more intense and resulted to a general loss of confidence and solvency problems in many financial institutions across the globe. Whilst the crisis has been more concentrated in the financial systems of US and Europe, it has ultimately affected the real economies of all developed and emerging countries, including Greece. Even though this economic hardship did not impact all European Union (EU) countries at the same intensity, its effects were almost similar for all of its member states (European Commission, 2010). The particularity of the current crisis is that it combines a financial crisis originating in the largest world economy (US), along with a global downturn that weight heavily on everyone’s mind (Soriano, 2011). Apparently, GEC’s severity targeted almost the majority of nations and businesses, no matter of each country’s or organization’s level of competitiveness.
2. Methodological Approach
As afore stated, the purpose of this paper is to highlight the impact of the EC through demonstrating key facts related to the current economic crisis in Greece, and more precisely for Greek banking organizations. To that end, to serve its purpose, it was decided to conduct an extensive and thoughtful review and retrieve of relevant literature, along with assessing germane journal articles, reports, dissertations and other documents discussing the impact of GEC in banking institutions. In that event, a careful keyword search was conducted through assessing several databases (e.g. Web of knowledge, British library Ethos, EBSCO library, Social Science Research Network –SSRN library, Science Direct, Strathclyde online database etc.). Additionally, Google Scholar was utilized as the major search engine, by limiting the research to those articles straight referring to GEC, banks, and human resources in crisis, either published in Greek or English. The resulting material included a vast majority of journal articles, reports and practice-related documents. Both a “concept-centric” and “structured” approach was used in order to audit, segregate and decide which sources to review and include in this review paper. All documents were further listed into specific key themes (e.g. economic crisis, banking institutions, human resources etc.) to assist the author for further analysis and consideration. To that end, all of the referenced resources provided the necessary information from which evidence and conclusions were drawn.
3. The Impact of Economic Crisis in Greece: Key Facts
The impact of EC in Greece was, and still remains, quite severe. During the first phase of the GEC, the Greek economy managed to avoid serious shocks. GEC’s impact delayed to affect Greece, due to the fact that its economy is a relatively closed economy, along with some favorable factors from past years, such as the great effort of the Greek government of improving its economy, and more precisely, the diminution of its inflation and budget deficits in the period before 2001, owing to its efforts to become European Union’s (EU) member (Moschos & Chortareas, 2013).
From 2000 to 2007, Greece had one of the fastest growing economies in the Eurozone (Gross Domestic Product (GDP) annual rate of 4.2%), as foreign investments and capitals entered the country (Nelson et al., 2011). Besides the stability brought about by the adoption of the common currency and the participation in Eurozone, Greek economy was further strengthened,

Business and Economic Research ISSN 2162-4860
2014, Vol. 4, No. 1
www.macrothink.org/ber 250
the previous years, by high inflows of EU Structural Funds for infrastructure projects in view of the Olympic Games in Athens in 2004, the making of several structural reforms, and banking system’s contribution after its liberalization. However, as reported by many global financial institutions, Greece is considered as being a very uncompetitive country, and its economy characterized as very ineffective in terms of efficacy and competitiveness. According to Lynn (2011), Greek industry remains stuck in the past and largely unable to compete in the modern world. Despite a remarkable progress recorded in the financial sector, this was not initiated by national resources, but from external assistance and incentives, which were not used to autonomously expand further growth, but rather developed a dependence relationship with the external environment, especially the EU. All in all, it was inevitable for the economic crisis to badly affect Greece due to a relatively small manufacturing sector and due to a large share of the “shadow economy” which is estimated to be 25%-30% of GDP (Kouretas & Vlamis, 2010). Conditions began to deteriorate after the collapse of Lehman Brothers and by the time the significant pressure on valuations of Greek government bonds has started, both typified as the warnings of the approaching “storm” (Mylonas, 2013).
The crisis in the Greek economy first started as a crisis of the European financial system and as a result of the recession due to GEC, and subsequently resulted to a general social and political crisis (Kotios et al., 2011). The crisis has further evolved into a liquidity crisis in the regional countries, and then became a debt and solvency crisis, while these days, it is expressed as a continuous crisis of the existence and cohesion of the Eurozone within international dimensions (Shambaugh, 2012). In Eurozone, by the end of 2009, financial markets discovered that the monetary union lacked of fiscal coordination and knowledge of the appropriate procedures so being able to correct problems resulting from competitiveness’ differences among the member states. Eurozone’s structure weaknesses have even questioned the existence of a common European currency (HBA, 2013). To that end, many analysts predict that the economic crisis in Greece could become the worst recession in modern world history as the majority of the organizations have been negatively affected (Epitropaki, 2012; Thompson, 2012); nonetheless to highlight a decline of over 7.1% in GDP.
In terms of their HR practices, native organizations failed to equilibrate the negative effects of the recession, as dominated by short-term oriented planning, rather than seeing crisis as an opportunity to push forward their strategic dynamic (Bouas & Katsimardos, 2012). A study conducted by Glover and Tomek (2012) outlined that Greece is spiraling into this kind of decline in which both US and Germany endured during the Great Depression, showing the scale of the challenge involved in attempting to regain competitiveness through austerity, as the economy shrank 18.4% in the past four years, while there is a forecast of another 4.6% in 2013 as Greece struggles to reduce its debt (27% decline US Economy during 1929-1933, 34% decline German economy during 1929-1933). Another study, undertaken by Epitropaki (2012) clearly illustrated the severe impact of EC within the Greek economy and its industries by highlighting a considerably (44.9%) and dramatic (7.5%) impact of crisis among the investigated industries.
This catastrophe also presents a social and political impact throughout Europe and the rest of the world. However, it has a great impact on the people and companies within Greece itself.

Business and Economic Research ISSN 2162-4860
2014, Vol. 4, No. 1
www.macrothink.org/ber 251
More precisely, the social impact of the crisis is seen through a record unemployment rate, decreased wage levels, the closure of businesses and an increasing number of people facing social exclusion through wages inequalities among the citizens. Especially, in terms of income inequality, Berg and Ostry (2011) and Berg and Sachs (1998) identified that such disparity can be a significantly hazardous factor to sustained economic growth, as unequal societies are more likely to face serious debt crises. Work in Greece became less secure as, nowadays, more and more employees developed flexible status, like part-time, temporary and fixed-contract work. To that end, employers argue that the benefits of using temporary workforce considered as of great value in terms of “try before you buy”, not only at a micro level, but also as means of the organizational efforts for post-recession competitiveness through enhanced flexibility when it comes to staff redundancies along with lower costs and more transparency on their administration (Sarathy, 2010).
Quite similarly to Ireland’s case, Greek labor market’s increase (especially construction) was higher not only among other sectors at a national level, but also higher than those of other EU member states. Greece and Ireland were in the eye of this financial storm as their banks had become over-exposed to bad debt due to lecherous lending to property developers, and eventually this financial turbulence affected the national economy as a whole (Whelan, 2010; Roche et al., 2011). Honohan (2006) argued that the availability of easy money encouraged the construction industry to expand, property prices to rise, and eventually the domestic spending to catapult. As in Irish recession, the current recession in Greece, is very astute and extended due to a large fall in Gross National Product (GNP), and the rise in closures, layoffs and unemployment (Roche et al., 2011). Greece has experienced a sharper fall in output, and as a result unemployment has wafted. The banking system almost collapsed, while the austerity measures further diminished government finances.
Greek crisis’ management, both on the part of the Greek government and the European side, is an example to be avoided (Featherstone, 2011; Kotios et al., 2011). There is no doubt that Greek crisis’ management highlighted by a universal failure. The total public debt increased in absolute numbers and as a percentage of GDP compared with that of 2009 (from 129.4% of GDP in 2009 to 160.2% in 2012). Despite the unusual “haircut” of the private debt, the repayment extensions and interest rates’ cuts, the national debt cannot be regarded as sustainable (Kotios & Roukanas, 2013). Suffice it to say that the major responsibility rests with the Greek authorities who state control of the economy, mismanaged it and deceived their citizens about the true nature of its budgetary problems. Moreover, Greece has to confront a large and very inefficient public administration, widespread tax evasion, and its political “clientelism” (Nelson et al., 2011: 4-5). In addition, the inability of the credit rating agencies to predict the 2007 US mortgage loan crisis, led them targeting Greece and other European countries since they all had very large budget deficits, and eventually downgraded and led them to withdraw from the international markets (Kouretas & Vlamis, 2010). Finally, the delayed reaction of the European Central Bank and Eurozone governments to signal their intention to provide help to those countries facing financial problems, illustrated the lack of political union in Europe (Kouretas & Vlamis, 2010). Furthermore, the continuous pressing social problems and the austerity measures implemented by the Greek government further impacted on Greek

Business and Economic Research ISSN 2162-4860
2014, Vol. 4, No. 1
www.macrothink.org/ber 252
society. The clearest evidence of this is that over 1 million people lost their jobs since the beginning of the economic recession. In April 2013, the unemployment rate reached 26.4 per cent (EL column) – the highest since Greece joined the Euro zone and the highest within the borders of EU (Eurostat, 2013).
Such high levels of unemployment present two distinct problems for Greece. First, it means that an increasing number of people are being driven to financial ruin because the Greek social security system pays unemployment benefit only for the first 12 months. Of the 1.147 million people that are unemployed at the moment, only, approximately, 480.000 receive state benefits, which are less than 400 Euros per month (Malkoutzis, 2011). A second issue is that Greece has no formal system for helping either young people to enter the job market or middle-aged people who have lost their jobs to retrain for other positions. Therefore, Greece faces the real possibility that some people will join the ranks of the long-term unemployed while others will choose to leave the country. The economic crisis and the on-going depression further resulted in an exodus of talented, ambitious and well educated young Greeks (49.3%) to other European growing economies, as part of their efforts to find a job (Natsios, 2012; Eurostat, 2013).
Another survey highlighting this workforce mobility, conducted among high school graduates, indicated that seven out of ten graduates are considering working abroad (Malkoutzis, 2011). Furthermore, according to the Recruitment Confidence Index (RCI) which is conducted every 6 months by the Applied Research & Innovation Department of ALBA Graduate Business School at American College of Greece, there will be a decrease and stagnancy in the recruiting processes in the Greek labor market for the next 6 months. The survey showed that 52.4% of the companies have been affected either a lot or dramatically by the current financial crisis, while only 1.8% state that they have not been affected at all. To greatest concern is the fact that 49.7% of the companies will reduce their employees' executive training (ALBA, 2012). Similar implications of the economic crisis can be viewed in Spain, where the unemployment rate is the

Business and Economic Research ISSN 2162-4860
2014, Vol. 4, No. 1
www.macrothink.org/ber 253
highest of EU zone, and to Italy, Portugal etc. Companies that survived from the economic crisis, forced to reduce cost by lying off employees and reducing spending. This perpetuates the vicious cycle, increasing unemployment further. Austerity measures place additional pressure on individuals and companies, as the government decrease spending and raise fees. Unlike the Irish government which implemented a program of incentives to encourage employment retention in firms, especially in the export sector, and job placements schemes as a series of labor activation measures to counter the rise of long-term unemployment (Roche & Teague, 2012: 6), Greek government’s measures still remain sluggish or in the wrong way.
All that can be clearly explained through the suggested types of capitalism from Hall and Soskice (2001). According to the authors, there are three varieties of capitalism that demonstrate the ways in which countries react in response to an economic crisis. Therefore, there are “liberal market” economies (LME), “coordinated market” economies (CME), and the called “Mediterranean Model of Economy” (MME), as illustrated below (Hall & Soskice, 2001; Lallement, 2011: 636-637).
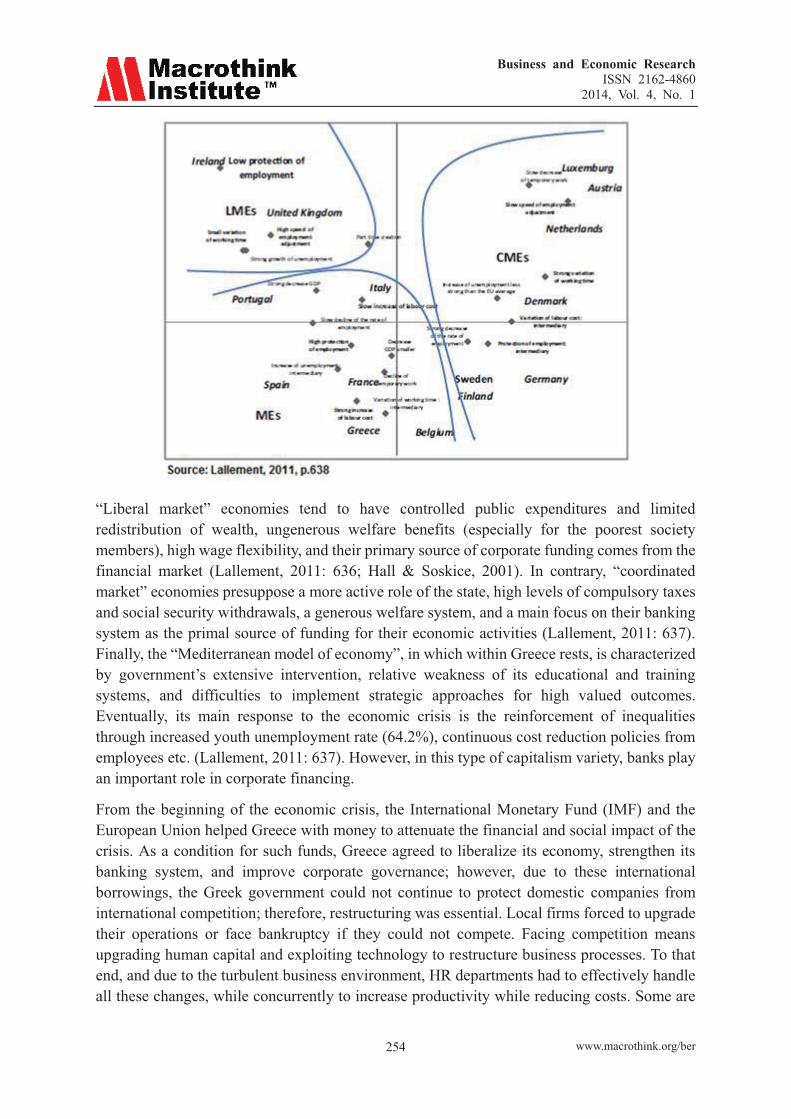
Business and Economic Research ISSN 2162-4860
2014, Vol. 4, No. 1
www.macrothink.org/ber 254
“Liberal market” economies tend to have controlled public expenditures and limited redistribution of wealth, ungenerous welfare benefits (especially for the poorest society members), high wage flexibility, and their primary source of corporate funding comes from the financial market (Lallement, 2011: 636; Hall & Soskice, 2001). In contrary, “coordinated market” economies presuppose a more active role of the state, high levels of compulsory taxes and social security withdrawals, a generous welfare system, and a main focus on their banking system as the primal source of funding for their economic activities (Lallement, 2011: 637). Finally, the “Mediterranean model of economy”, in which within Greece rests, is characterized by government’s extensive intervention, relative weakness of its educational and training systems, and difficulties to implement strategic approaches for high valued outcomes. Eventually, its main response to the economic crisis is the reinforcement of inequalities through increased youth unemployment rate (64.2%), continuous cost reduction policies from employees etc. (Lallement, 2011: 637). However, in this type of capitalism variety, banks play an important role in corporate financing.
From the beginning of the economic crisis, the International Monetary Fund (IMF) and the European Union helped Greece with money to attenuate the financial and social impact of the crisis. As a condition for such funds, Greece agreed to liberalize its economy, strengthen its banking system, and improve corporate governance; however, due to these international borrowings, the Greek government could not continue to protect domestic companies from international competition; therefore, restructuring was essential. Local firms forced to upgrade their operations or face bankruptcy if they could not compete. Facing competition means upgrading human capital and exploiting technology to restructure business processes. To that end, and due to the turbulent business environment, HR departments had to effectively handle all these changes, while concurrently to increase productivity while reducing costs. Some are

Business and Economic Research ISSN 2162-4860
2014, Vol. 4, No. 1
www.macrothink.org/ber 255
forced to change structures, cut benefits, impose wage cuts, dismiss employees and change contracts to more flexible employment (full time (FT) to part time (PT), fewer days of work etc.). However, in short term, gains from such adjustments counterweighted by losses in administrative capacity in the long term (Bouas & Katsimardos, 2012). Kusku’s (2000) study on Turkish economic crisis highlighted that short-term crisis policies were not favored against long-term ones within Turkish organizations. The study outlined organizations’ failure to reduce the negative effects and deception created among their employees, by implementing HR practices focusing on behavioral change through short-term focused approaches, rather than adopting strategic, proactive and long-term oriented HR interventions. While coping with this intense workload, HR departments need to realize their value-added capacity through increasing the performance and agility of the talent (human capital) and culture of the organization (Freed et al, 2012).
More precisely in Greece, HR has a rather short history; hence, there is still much room for growth for strategic HR practices within Greek organizations. In past years there has been a trend in countries in south Eastern Europe that shows a decrease in the number of companies where the head of HR was on the board of directors (Apospori et al, 2005). Another study comparing Greek firms with Multinational Companies’ (MNC) subsidiaries in Greece reported that “HR planning was found to be less tightly linked with corporate planning in Greek firms than in MNC subsidiaries” (Myloni et al, 2004). Greek companies and their HR departments must strengthen their competency as strategic positioners. As they internalize their understanding of the business context and stakeholder expectations, they will be able to add value by contributing to business strategy that drives critical results. A fine example of proper implementation of its HR practices could be seen in TITAN Group of companies where the HR division plays an active role not only in company’s operations but also in its strategy formulation. This is declared in the strategy statement of the group where HR is one of the four pillars of strategy at the same level of importance as the other three business pillars, and every business decision is decided on the basis of these four pillars (Titan Web Site, 2012).
As economic turbulence is directly reflected to society, people who affected by economic changes are likely to stick to traditional beliefs and values. Bourantas and Papadakis (1996) alleged that Greek HR is on the way of overcoming past idiosyncratic flaws. They characterized Greek HR as a western-type management style which has not yet reached the level of modernization, by means of delaying the adoption of scientific and analytic methods and techniques. However, progress in the application of advanced HR techniques in the Greek context is demonstrated by the elevation of the Greek subsidiary of Colgate on the top, as the best European workplace of the year 2006. Colgate Hellas has developed an excellent workplace climate in which about 40% of the employees have been with the company more than 15 years; voluntary turnover amounts to 3.3% only; absenteeism also ranges over very low rates (0.3% in 2005). The company offers several incentives to its employees such as training days off, numerous sick days, extended annual holiday, early Fridays, and extra parental leave etc. (Myloni, 2002). Even though most of the Greek corporations are HR short-term oriented, in the recent years, there is evidence that, at least the biggest companies seem to embrace a more strategic long-term HR approach (Theriou, 2004).
Business and Economic Research ISSN 2162-4860
2014, Vol. 4, No. 1
www.macrothink.org/ber 256
From a financial perspective, Greek crisis should be stopped. A crisis in the government bond markets may lead to large losses on the balance sheets of the banks, which this could trigger a new banking crisis in the Eurozone. Furthermore, the crisis will lead to increases in government bond yields in a significant number of Eurozone countries, and may start a domino effect, by setting off a chain of events that would create an economic contagion with severe consequences (Sanati, 2011). This will put pressure on the governments of these countries to sharply contract fiscal policies, leading to deflationary effects and risking pulling down the European economies in a double-dip depression (De Grauwe, 2010). To reach a final resolution of the Greek crisis within the Eurozone that requires coordinated efforts from both sides. On the Greek side, it is required a serious effort to rebuild the country through a broad set of reforms in almost all levels of the economy, politics and the society. The country will never be able to emerge from the crisis if it does not cure the structural causes that led to the collapse. On the other hand, on part of the Eurozone, further acts and less destabilizing and degrading statements are needed. There is a need of elongating fiscal adjustments; a restructuring of the public debt, and a generous liquidity provision and support for the country’s development. Problems can be resolved by the time the country will return to high growth rates (Kotios & Roukanas, 2013). Luckily, recent reports provide evidence that key macroeconomic indicators are now moving in the right direction, and confirm that the adjustment of imbalances in the problem countries is well under way, as competitiveness is on the rise, external imbalances are shrinking, and fiscal rectitude is returning (Heise, 2012). Nonetheless to point out that stimulating economic recovery is important in making labor market adjustments with a view to prevent further social crises (Sarica, 2012). May this crisis be a good lesson for all nations and organizations so to change their business mindset and being more strategic focused and long-term oriented.
4. Banking Institutions during the Recession
The financial sector has suffered its worst crisis since the 1929 crash, and although the crisis was heavily concentrated in US and Europe, its effects have spread to financial systems globally and spilled over to the real economies, leading to the deepest world economic downturn since the Second World War (Soriano, 2011). Financial activities are both at the origin of the current GEC and have been strongly affected by the economic instability which impacted organizations’ performance and their HR practices respectively (Lahteenmaki et al., 1998). More precisely for Greek banking industry, for many years, banks encouraged their employees to take full advantage of the various Hellenic Banks Association’s sponsored education and training opportunities, besides including those offered from within. As a result, the banking sector became widely known as a leader in workforce development. However, with the advent of the GEC, everything changed. The sector has undergone significant change due to fierce competition, merger and acquisition activities, and many other developments occurred by the recession. Inevitably, in times of economic hardship, HR practices are among the first casualties (Felstead et al., 2012a). This assumption is frequently repeated in both general and specialist commentaries on the impact of recession on HR (Kingston, 2009; Charlton, 2008).
The HR function in the banking industry has been transformed in several fundamental ways. First, as HR budgets came under increased scrutiny, much of the responsibility for improving

Business and Economic Research ISSN 2162-4860
2014, Vol. 4, No. 1
www.macrothink.org/ber 257
job performance and enhancing career potential rests with the employee and not the organization. Bank’s previous full responsibility for the long-term development of employees is rapidly disappearing. That trend is expected to continue until employers fully understand the important linkage between HR investments and business performance. Although HR executives indicate that people are their banks’ most important asset, relevant expenses are more often considered a cost of doing business rather than an investment, therefore, it can be one of the first areas of any organization which has its budget reduced in times of economic difficulties. Generally, short-term counter-measures, focusing on generating increases in quarterly earnings, take priority over long-term investment strategies, such as people development, which can pay dividends in the future (Felstead et al., 2012b). As a result, in most banks, HR budgets are always at risk. A study by Bassi et al. (2004) indicated that US banks that managed to resist Wall Street’s pressure to cut staff costs have outperformed their peers financially and on the stock market, thereby reaping the benefits of fully investing in their people. Similarly, a most recent research report conducted by Miller (2012) reported that organizations’ revenues and overall profitability were positively correlated with HR (training) expenditures, regardless of how expenditure was measured, and regardless of whether performance was compared to previous years or to other organizations. A number of other studies pointed to equally impressive conclusions as well. HR investments have been shown to be a key driver of employee retention, which in turn has been linked to improved customer retention, leading to enhanced sales and ultimately overall profitability (IoD, 2009: 11, 22; Bassi et al., 2004). Contrariwise, there are other studies, such a meta-analysis from 67 studies, implemented by Tharenou et al. (2007: 264), which concluded that specific HR practices (e.g. training) do not appear to be related to organizational financial performance. However, according to IoD (2009), organizations that scored highest in innovation tend to spend significantly more on education and workplace learning per employee than do less-innovative firms. In addition, there is ample empirical evidence to show that employee training can reduce attrition, boost staff’s morale, and increase recruitment success (p.22).
Accordingly, most of the European banks have been as severely hit by the global financial crisis, with many of them reporting at least three restructurings during the period. Nevertheless to mention that it is not easy to assess the real impact of the global crisis on the banking sector because, before the crisis surfaced, the sector was already experiencing a deep restructuring as a consequence of a strong process of market integration and internationalization during recent decades due to the liberalization in global capital markets, new information technologies and commercial expansion. International markets and analysts realized that GEC is not over yet; therefore, there are several concerns about the banking sector’s vulnerability in response to its efforts to alleviate recession’s impact (BIS, 2012: 65). Furthermore, the recent GEC is intertwined with an impressive spread of financial innovations and largely attributed to the weaknesses of financial institutions to effectively manage the assessment and evaluation of risks that exist in the modern world of international finance (Moschos & Chortareas, 2013).
As a response to the crisis, most of the European governments, primary provided financial support to their banking systems, in order to help them facing not only the liquidity but also

Business and Economic Research ISSN 2162-4860
2014, Vol. 4, No. 1
www.macrothink.org/ber 258
their solvency problems (Lallement, 2011: 629). However, the measures implemented by governments were not sufficient enough to pace with the challenges they have to meet (Watt, 2009). The current European debt crisis and sovereign bond market volatility will pose further challenges to the European banking sector, and will be affected by the general economic situation. Several financial institutions have to be bailed out and public programs of an unprecedented nature should be put in place in order to avoid the collapse of the financial systems. In the EU27 as a whole, 250.000 jobs were lost in the banking sector between 2008 and 2010. This means that employment decreased by 6%, above the average employment reduction in the whole economy (-2.4%). In general terms, these decreased employment levels are explained by two opposite trends. On one hand, the privatization and liberalization of the sector resulted in higher profitability, value added and employment, in particular in countries where the sector was less developed. On the other hand, the concentration process of the sector increased the number of redundancies and resulted in job losses even before the crisis, particularly in countries where the sector was already mature and well structured. Jobs in the banking sector have traditionally been considered well protected, with a low incidence of temporary contracts and with higher than average levels of remuneration. However, this favorable outlook for working conditions has been challenged by company strategies to tackle the effects of the crisis. Taking into account Spain’s case, the European Commission has recently established a relentless crackdown in exchange for bailout money to banks. It is estimated that there will be a cut of approximately 8,000 jobs in nationalized banks, between direct lay-offs and downsizing, rigged to the sale of close of subsidiaries and the elimination of nearly 1,000 offices (Barron & Perez, 2012). In nearly all countries (including Greece), banks have implemented cost-saving programs (e.g. wage reductions and moderations) in order to reduce labor costs, while aiming at creating a more flexible workforce with higher productivity (Soriano, 2011).
As Greece is amid the economic crisis, and more or less is mired in the recession, according to Dimitropoulos (2012), the current issues Greek banks facing today are the following:
� Withdrawal of a large amount of deposits (approximately 80 billion 2009-2011) due to the crisis, and the uncertainty about future developments at a European and global level,
� The large share (about 60 billion) of obsolete Greek government bonds in bank portfolios; therefore, a possible default of Greece’s debt will lead to a collapse and freeze of the Greek banking system (Sanati, 2011).
� Liquidity problem and high degree of dependence from the European Central Bank and it is currently the main lender of banks, opposed to the old borrowing way (through the interbank market),
� The significant increase in non-performing loans and a concomitant increase in bad debts in 2012,
� Major pressures from the bond swap program (PSI) and greater likelihood of cutting public debt,
� Serious recapitalization needs despite aid packages that have already been provided, � The decline in equity values and stock capitalization which consistently creates
difficulty of implementing future capital increases,

Business and Economic Research ISSN 2162-4860
2014, Vol. 4, No. 1
www.macrothink.org/ber 259
� Finally, the total assets among the Greek banking sector burdened with a tenfold rise between 2005 and 2011, leading to the system’s further containment to absorb the shock of the crisis, as the higher the proportion of its pledged assets, the more vulnerable a bank institution becomes (Dimitropoulos, 2012; BIS, 2012: 72).
Obviously, the Greek banking sector is experiencing unprecedented challenges from the escalating economic crisis which tests system’s resilience under the profound recession, Greek debt’s restructuring and the overall reduction of the traditional liquidity sources coming from the international markets due to the deterioration of the creditworthiness of the Greek government (Mylonas, 2013). Even worse for banks, Greek economy’s outlook still remains gloomy with most analysts foreseeing the economy contracting by 2.5 to 3.5 per cent as fiscal consolidation, private sector wage cuts and high unemployment bite. Consequently, Greek financial crisis’ escalation led to a rapid deterioration in the banking system. This gradation centered in Greece in the second half of 2009 and early 2010, created an extremely challenging economic and financial environment. However, Rapanos (2012), president of the Hellenic Bank Association, emphasized the key role of banks in the current period of the economic crisis being experienced by Greece by pointing out that “the banking sector is currently in the middle of the storm, a storm that it is dealing with, with sobriety and without complaint, in order to help the suffering economy and to support the national effort for the tackling of the economic crisis. We deeply believe that Greece has the possibilities to exit from the crisis the country has been experiencing over the past five years, and in this effort the banking system can play a catalytical role”. Cihak et al. (2012) also highlighted the paramount importance of financial sector’s influence on overall productivity. Moreover, according to Rioja and Valev’s (2004) study of 74 countries, the role of the financial sector can be presented as a key driver for national growth. Nevertheless to point out that economic crisis’ effect on the banking sector affected other companies as well by limiting their access to credit.
5. Conclusion
Apparently, crisis, and the prolonged Greek recession, both resulted in changes within the labor relations and organizations’ structures and other operational practices. More precisely, the banking sector is bound to go through the biggest overhaul in decades as local credit institutions take corporate actions and proceed with plans to fill their capital shortfalls on losses incurred by the recession and by their prospective private sector involvement (PSI) participation and future loan diagnostic tests. Additionally, the literature clearly outlines the immediate profound impact of the economic crisis on the way in which organizations have managed their human resources, by indicating more market-oriented and short-term moves instead of proactive, long-term interventions. However, this immediate impact does not necessarily constitute a strong indicator of any other continuing effects which may present. To this extent, banks need to pay greater attention to a more strategic HR approach if they want to achieve organizational growth, maturity and resilience.
References
ALBA Graduate Business School. (2012). Recruitment Confidence Index for the Greek Labor Market. Research Report (No. September 2012B), Retrieved from ALBA Graduate Business

Business and Economic Research ISSN 2162-4860
2014, Vol. 4, No. 1
www.macrothink.org/ber 260
School website: http://www.alba.edu.gr/RCI/Documents/RCI%202012%20B.pdf [assessed on 10th February 2014].
Apospori, E., Nikandrou, I., & Papalexandris, N. (2005). Changes in HRM in Europe: A Longitudinal Comparative Study among 18 European Countries. Journal of European Industrial Training, 29(7), 541-560. http://dx.doi.org/10.1108/03090590510621045
Appelbaum, E. (2011). Macroeconomic Policy, labor market institutions and employment outcomes. Work, Employment and Society, 25(4), 596-610. http://dx.doi.org/10.1177/0950017011419711
Bank of International Settlements (BIS). (2012). Post-crisis evolution of the banking sector. BIS 82nd Annual Report, Research Paper, pp.64-83, Retrieved from BIS website: http://www.bis.org/publ/arpdf/ar2012e6.pdf [assessed on 10th March 2014].
Barron I. and Perez C. (2012). Despidos masivos en las cajas nacionalizadas (Lay-offs in nationalized banks). Retrieved February 10, 2014, from Elpais.com: http://economia.elpais.com/economia/2012/11/24/actualidad/1353789346_922547.html, Translated by Bing – Microsoft Internet Explorer Translator.
Bassi, L., McGraw, K., & McMurrer, D. (2003). Beyond Quarterly Earnings: Using Measurement to Create Sustainable Growth. Atlanta, GA: McBassi & Company.
Berg, A.G. and Ostry, J.D. (2011). Inequality and Unsustainable Growth: Two Sides of the Same Coin?, International Monetary Fund (IMF) Discussion Note SDN/11/08. Retrieved from IMF website: https://www.imf.org/external/pubs/cat/longres.aspx?sk=24686.0 [assessed on 2nd March 2014].
Berg, A. G., & Sachs, J. (1988). The debt crisis: structural explanations of country performance. Journal of Development Economics, 29 (3), 271-306. http://dx.doi.org/10.1016/0304-3878(88)90046-6
Boland, R.J. and Tenkasi, R.V. (1995). Perspective making and perspective taking in communities of knowing. Organization Science, 6(4), 350-372. http://dx.doi.org/10.1287/orsc.6.4.350
Bouas, K. and Katsimardos, P. (2012). Strategic Agility in Greek Human Resource Management. Retrieved from Institute for Regulatory Policy Research website: http://www.inerp.gr/en/blog/60-nea-stratigiki-anthropinon-poron-dimosias-dioikisis.html
Bourantas, D., & Papadakis, V. (1996). Greek Management: Diagnosis and Prognosis. International Studies of Management and Organization, 26(3), 13-22.
Charlton, J. (2008). Training budget cuts predicted by learning and development managers. Retrieved April 2, 2014, from Personnel Today website: http://www.personneltoday.com/hr/training-budget-cuts-predicted-by-learning-and-development-managers/
Cihak, M., Demirguc-Kunt, A., Feyen, H. B. E., & Levine, R. E. (2012). Benchmarking
Business and Economic Research ISSN 2162-4860
2014, Vol. 4, No. 1
www.macrothink.org/ber 261
Financial Systems around the World. Policy Research Working Paper (No.WPS6175), 1-58. http://dx.doi.org/10.1596/1813-9450-6175
De Grauwe, P. (2010). The Greek crisis and the future of Eurozone. Retrieved from: http://www.econ.kuleuven.be/ew/academic/intecon/degrauwe/pdg-papers/discussion_papers/eurointelligence-march-2010.pdf, (pp.1-5) [assessed on 1st February 2014].
Dimitropoulos, N. (2012). Greek Banks’ Reaction and the 2012 Blackrock Report. Retrieved from Capitalinvest.gr website: http://www.capitalinvest.gr/info.php?product_id=335 [assessed on 1st march 2014].
Epitropaki, O. (2012). Human Resource Management Strategies during the Economic Crisis. Retrieved from ALBA Graduate Business School website, http://www.alba.edu.gr/RCI/Documents/rci_2011%20olga%20final.pdf [assessed on 12th March 2014].
European Commission. (2010). Employment in Europe. (European Commission Report: Catalogue No. KE-AH-10-001-EN-C), Brussels, Retrieved from European Commission website: http://ec.europa.eu/social/main.jsp?catId=738&langId=en&pubId=593 [assessed on 20th February 2014].
Eurostat. (2013). Unemployment Statistics. Retrieved from Eurostat website: http://epp.eurostat.ec.europa.eu/statistics_explained/index.php/Unemployment_statistics#Main_statistical_findings [assessed on 5th March 2014].
Featherstone, K. (2011). The Greek Sovereign Debt Crisis and EMU: A Failing State in a Skewed Regime. Journal of Common Market Studies, 49(2), 193-217. http://dx.doi.org/10.1111/j.1468-5965.2010.02139.x
Felstead, A., Green, F. and Jewson, N. (2012a). The Impact of the 2008-2009 Recession on Training at Work: (First Interim Report from February 2010 to September 2010). Briefing Paper, May 2012. Retrieved from UK Commission for Employment & Skills website: http://www.ukces.org.uk/assets/ukces/docs/publications/training-in-the-recession-first-interim.pdf [assessed on 9th February 2014].
Felstead, A., Green, F., & Jewson, N. (2012b). An analysis of the impact of the 2008-2009 recession on the provision of training in the UK. Work Employment and Society, 26(6), 968-986. http://dx.doi.org/10.1177/0950017012458016
Freed, A., Hyatt, J., Papachristou, A. and Papalexandris, N. (2012). Greek HRM: Building the Critical Competencies. Retrieved from The RBL Group website: http://rbl.net/index.php/library/display-content-page/greek-hrm-building-the-critical-competencies [assesed on 29th March 2014].
Glover, J., & Tomek, R. (2012). Greece Austerity Diet Risks 1930s-Style Depression: Euro Credit. Retrieved February 8, 2014, from Bloomberg website: http://www.bloomberg.com/news/2012-10-22/greece-austerity-diet-risks-1930s-style-depression-euro-credit.html
Business and Economic Research ISSN 2162-4860
2014, Vol. 4, No. 1
www.macrothink.org/ber 262
Hall, P., & Soskice, D. (2001). Varieties of Capitalism: The Institutional Foundation of Comparative Advantages. Oxford: Oxford University Press. http://dx.doi.org/10.1093/0199247757.001.0001
Heise, M. (2012). Grexit’ fears give way to ‘Crexit’ optimism - Investors are looking towards an exit from crisis. Financial Times, Retrieved from Bullfax.com website: http://www.bullfax.com/?q=node-%E2%80%98grexit%E2%80%99-fears-give-way-%E2%80%98crexit%E2%80%99-optimism [assessed on 10th January 2014].
Hellenic Bank Association (HBA). (2013). The Greek Banking System in 2011 and 2012. Hellenic Bank Association Research Report 2013. (pp.31-77), Retrieved from HBA website: http://62.1.43.74//Main/Ereunes-meletes/EllinikoTrapezikoSystima2011-12web.pdf [assessed on 5th March 2014].
Honohan, P. (2006). To What Extent Has Finance Been a Driver of Ireland’s Economic Success?, Quarterly Economic Commentary, Special Articles, Economic and Social Research Institute (ESRI), 2006.2006 (4) 59-72.
Institute of Directors (IoD). (2009). Training in the Recession: Winner or Loser?, IoD Survey Report, June 2009, (pp.1-40). Retrieved from Institute of Directors (IoD) website: http://www.iod.com/influencing/policy-papers/education-and-skills/training-in-the-recession-winner-or-loser [assessed on 5th January 2014].
Kingston, P. (2009). Beware false economies. Retrieved February 12, 2014, from “The Guardian” website: http://www.guardian.co.uk/thetraininggame/beware-false-economies
Kotios, A., Galanos, G., & Pavlidis, G. (2011). Greece and the Euro: The Chronicle of an Expected Collapse. Intereconomics, 46(5), 263-269. http://dx.doi.org/10.1007/s10272-011-0390-7
Kotios, A., & Roukanas, S. (2013). The Greek Crisis and Eurozone’s Governance. In Sklias, P. and Tzifakis, N. (2013). Greece’s Horizons: Reflecting on the Country’s Assets and Capabilities. The Konstantinos Karamanlis Institute for Democracy series on European and International Affairs, Centre for European Studies Publications, (pp.91-105). Retrieved from: http://link.springer.com/chapter/10.1007%2F978-3-642-34534-0_8
Kouretas, P.G. and Vlamis, P. (2010). The Greek Crisis: Causes and Implications. Panoeconomicus, 57 (4), 391-404. http://dx.doi.org/10.2298/PAN1004391K
Kusku, F. (2000). Do Periods of Crisis Affect Human Resource Management Applications?: The Case of the Turkish Textile Industry. First International Joint Symposium on Business Administration: “Challenges for Business Administrators in the new Millennium”, pp.108-114, Retrieved from http://www.opf.slu.cz/vvr/akce/turecko/pdf/Kusku.pdf [assessed on 29th February 2014].
Lahteenmaki, S., Storey, J., & Vanhala, S. (1998). HRM and Company Performance: The Use of Measurement and the Influence of Economic Cycles. Human Resource Management Journal, 8(2), 51-65. http://dx.doi.org/10.1111/j.1748-8583.1998.tb00166.x

Business and Economic Research ISSN 2162-4860
2014, Vol. 4, No. 1
www.macrothink.org/ber 263
Lallement, M. (2011). Europe and the Economic Crisis: Forms of Labour Market Adjustment and Varieties of Capitalism. Work, Employment and Society, 25(4), 627-641. http://dx.doi.org/10.1177/0950017011419717
Lynn, M. (2011). Bust: Greece, the Euro, and the Sovereign Debt Crisis. New Jersey: John Wiley & Sons.
Malkoutzis, N. (2011). Greece – a year in crisis. Retrieved February 10, 2014, from: http://www.opendemocracy.net/nick-malkoutzis/greece-%E2%80%93-year-in-crisis
Miller, L. (2012). ASTD State of the Industry Report: Organizations continue to Invest in Workplace Learning. Research Report (No. 790401E), Retrieved from CPP website: http://people.cpp.com/rs/cpp/images/ASTD-Report.pdf [assessed on 14th April 2014].
Moschos, D., & Chortareas, G. (2013). Financial systems and economic activity. In HBA Report (2013). The global crisis, the Eurozone crisis and the Greek financial system. Section 1: The role of the financial sector in the course of the economic development. (In Greek, pp.53-67). Retrieved February 12, 2014, from: http://62.1.43.74/5Ekdosis/UplPDFs//syllogikostomos/2-a%20Moschos-Xortareas53-66.pdf
Mylonas, P. (2013). The Greek banking System in 2011 and 2012. In HBA Report (2013). The Greek Banking System: A Survival strategy in an environment of unprecedented challenges. (pp.51-58). Retrieved February 12, 2014, from HBA website: http://62.1.43.74//Main/Ereunes-meletes/EllinikoTrapezikoSystima2011-12web.pdf
Myloni, B. (2002). The Transfer of Human Resource Management Practices within Multinational Companies in Greece – A Comparative Analysis of Human Resource Management Practices in Subsidiaries of European and US Multinationals and Greek Companies. (Unpublished PhD thesis), School of Management, University of Bradford.
Myloni, B., Harzing, A-W. and Mirza, H. (2004). Human Resource Management in Greece: Have the colors of culture faded away?, International Journal of Cross Cultural Management, 4 (1), 59-76. http://dx.doi.org/10.1177/1470595804041527
Natsios, A. (2013). A Way Out of the Greek Financial Crisis. Retrieved March 5, 2014, from US News website: http://www.usnews.com/opinion/blogs/world-report/2012/12/31/a-way-out-of-the-greek-financial-crisis
Nelson, M. R., Belkin, P., & Mix, E. D. (2011). Greece’s Debt Crisis: Overview, Policy Responses, and Implications. Congressional Research Service, CRS Report for Congress (No. R41167), pp.1-24, Retrieved from: http://www.fas.org/sgp/crs/row/R41167.pdf
Rapanos, V. (2012). Banking Sector Key in Greece Exiting Crisis. Retrieved Febrary 10, 2014, from: http://ru.cbonds.info/news/item/575769
Rioja, F., & Valev, N. (2004). Finance and the Sources of Growth at Various Stages of Economic Development. Economic Inquiry, 42(1), 127-140. http://dx.doi.org/10.1093/ei/cbh049

Business and Economic Research ISSN 2162-4860
2014, Vol. 4, No. 1
www.macrothink.org/ber 264
Roche, K. W., & Teague, P. (2012). Do Recessions Transform Work and Employment? Evidence from Ireland. British Journal of Industrial Relations, Early View (Online Version of Record published before inclusion in an issue), Blackwell Publishing Ltd/London School of Economics 2012, November 2012, 1-25.
Roche, K.W., Teague, P., Coughlan A. and Fahy, M. (2011). Human Resources in the Recession: Managing and Representing People at Work in Ireland. Final Report Presented to the Labor Relations Commission January 2011, pp.1-48, Retrieved from: http://www.lrc.ie/documents/symposium11/Exec-Summary-Human-Resources-in-the-Recession.pdf
Sanati, C. (2011). End of the line: What a Greek default means. Retrieved from: http://finance.fortune.cnn.com/2011/06/17/end-of-the-line-what-a-greek-default-means/ [assessed on 10th January 2014].
Sarathy, P. (2010). HR Practices during Recession and Post Recession Planning. Mumbai Business School (Dr. Sunil Rai), August 2010, Retrieved upon request to the author through LinkedIn Professional Network, pp.1-15.
Shambaugh, J.C. (2012). The Euro’s Three Crises. Brussels. Brookings Papers on Economic Activity, pp.157-231, Retrieved January 15, 2014 from Brookings.edu website: http://www.brookings.edu/~/media/Projects/BPEA/Spring%202012/2012a_Shambaugh.pdf
Soriano, V.C. (2011). Recession and social dialogue in the banking sector: a global perspective. (European Foundation for the Improvement of Living and Working Conditions Report, ef1115), Retrieved from Eurofound website: http://www.eurofound.europa.eu/publications/htmlfiles/ef1115.htm [assessed on 15th March 2014].
Soykut Sarica Y. P. (2012). Social Responses to Turkey’s Recent Economic Crises of 2008-2009. Journal of Social Policy Conferences, 61, 133-151.
Tharenou, P., Saks, A. and Moore, C. (2007). A review and critique of research on training and organizational-level outcomes. Human Resource Management Review, 17(3), 251-273. http://dx.doi.org/10.1016/j.hrmr.2007.07.004
Theriou, N. G. (2004). The Long-Range Objectives and Targets and the Relationship between Them: A Survey of the Top Greek Companies. Review of Economic Sciences, 4(6), 145-160.
Thompson, D. (2012). Greece Is on Pace for the Worst Recession in Modern History. Retrieved February 20, 2014, from The Atlantic website: http://www.theatlantic.com/business/archive/2012/02/greece-is-on-pace-for-the-worst-recession-in-modern-history/253128/
Titan Web Site (2012). Titan’s Strategic Pillars. Retrieved February 23, 2014, from Titan website: http://www.titan.gr/el/titan-group/governing-objective/
Watt, A. (2009). A quantum of solace? An assessment of fiscal stimulus packages by EU member states in response to the economic crisis. Working Paper (No.2009.05), European

Business and Economic Research ISSN 2162-4860
2014, Vol. 4, No. 1
www.macrothink.org/ber 265
Trade Union Institute (ETUI), Brussels, pp.1-42, Retrieved from: http://www.etui.org/Publications2/Working-Papers/A-quantum-of-solace-An-assessment-of-fiscal-stimulus-packages-by-EU-Member-States-in-response-to-the-economic-crisis/
Whelan, K. (2010). Policy Lessons from Ireland’s Latest Depression. Economic and Social Review, 41(2), 225-254.
Copyright Disclaimer
Copyright reserved by the author(s).
This article is an open-access article distributed under the terms and conditions of the Creative Commons Attribution license (http://creativecommons.org/licenses/by/3.0/).

Business and Economic Research ISSN 2162-4860
2014, Vol. 4, No. 1
www.macrothink.org/ber 266
Cultural Awareness, a Form of Risk Management in International Business: Case Study of China
Fadun Solomon Olajide
Glasgow School for Business and Society
Glasgow Caledonian University, Glasgow United Kingdom
E-mail: [email protected]
Received: March 6, 2014 Accepted: March 22, 2014
doi:10.5296/ber.v4i1.5520 URL: http://dx.doi.org/10.5296/ber.v4i1.5520
Abstract
Mutual awareness of cultural references is essential in international business as levels of formality vary greatly among cultures. The emergence of capitalism into China induces international firms’ investment in the country. This resulted to creation of a production base to explore the inexpensive factors of production, particularly low-cost labour. The study examines cultural awareness as a form of risk management in international business, using China as a case study. The study uses ‘XYZ International’, with western cultural background, as a hypothetical international business that operates in China market. The study explores international trade and global organisations; considers barriers to international business; outlines cultural awareness as a form of risk management in international business; highlights Chinese business culture; outlines the impact of culture on negotiation; appraises Chinese businessman culture and its impact in the Chinese market; and justifies reasons to support conducting trade with China. The study findings indicate that mutual awareness of cultural references is essential in international business, and levels of formality vary greatly among cultures. The implication for practice is that culture induces each country societal prevailing life-styles because culture and life-style influence patterns of consumption, manufacturing, agriculture, service, distribution and investment.
Keywords: Risk Management, International business, International organisations, Culture, Cultural awareness, International trade barriers, China
1. Introduction
Mutual awareness of cultural references is essential in international business as levels of

Business and Economic Research ISSN 2162-4860
2014, Vol. 4, No. 1
www.macrothink.org/ber 267
formality vary greatly among cultures. Using China as a case study, the study examines cultural awareness as a form of risk management in international business. It uses a hypothetical international organisation (hereafter, XYZ International) that seeks to expand its business operations in China. XYZ International is an international business, with western cultural background, operating in China. The study explores international trade and global organisations; considers barriers to international business; outlines cultural awareness as a form of risk management in international business; highlights Chinese business culture; examines the impact of culture on negotiation; appraises Chinese business culture and its impact in the Chinese market; and justifies reasons to support conducting trade with China.
2. Scope and Objectives of Study
The study examines cultural awareness as a form of risk management in international business, using China as a case study. Specifically, objectives of the study include:
a) Description of international trade and global organisations;
b) Identification of barriers to international business;
c) Justification of cultural awareness as a form of risk management in international business;
d) Highlight Chinese culture and its impact on negotiation; and
e) Explore Chinese business culture and its impact in the Chinese market.
3. Methodology
Secondary data is the main source of information employed for the study. The study is a case study which explores relevant literature and international organisations data. International organisations data used for the study include: Central Intelligence Agency (CIA), Chinese Academy of Science, Science & Technology in China (CASSTC); European Union (EU); Infoplease; Internet World Stats (IWS); International Monetary Fund (IMF); National Bureau of Statistics of China (NBSC); Organisation for Economic Co-operation and Development (OECD); PricewaterhouseCoopers; United Nations Development Programme (UNDP); United Nation Conference on Trade and Development (UNCTAD); World Bank (WB); and World Trade Organisation (WTO). The study findings obtained from through the literature and international organisations data are deemed sufficient to establish the role of cultural awareness in the international business. Moreover, to underpin the implication of the study findings for practice, China is used as a case study.
4. Theoretical Framework and Literature Review
4.1 International Trade and Global Organisations
International trade promotes openness thereby impacting national, regional and global economic growth. International business comprises of business transactions (including exchanges of money) necessary for production, transporting, and selling of goods and services across national borders (Guest et al., 2007; Alder, 2008; Czinkota et al., 2011). It is also referred to as international trade or foreign trade. International business consists of various

Business and Economic Research ISSN 2162-4860
2014, Vol. 4, No. 1
www.macrothink.org/ber 268
forms of transactions undertaken across national borders to attain individuals, household, firms and organisations objectives. Types of international business include: export–import trade, direct foreign investment (wholly owned subsidiaries and joint ventures), licensing, franchising, and management contracts. International business can be undertaken in various ways. It includes: exporting goods and services; starting a joint venture with a company; license individuals or organisations to produce goods in the host country; opening branch networks for producing and distributing goods in the host country; and provision of managerial services to companies in the host country (Emerson, 2007; Nadeau and Casselman, 2008).
Global organisations are organisations which operate and compete in more than one country - global business environment (Michie, 2011; Lechner, 2012). The global business environment is highly complex, uncertain and unpredictable. The global environment consists of forces and conditions that operate beyond an organisation’s boundaries, but impact the organisational resources and operations (Ritzer, 2011; Stutz and Warf, 2011; Jones and George, 2013). The global business environment comprises of task environment and general environment. General environment consist of economic, technological, sociocultural, demographic, political, and legal forces which impact an organisation and its task environment; whilst, task environment consist of forces and conditions that originate with suppliers, distributors, customers, and competitors and affect an organisation’s ability to obtain inputs and dispose of its outputs because they influence managers daily (Rath, 2012; Jones and George, 2013). Global environment has become highly competitive as a result of globalisation. Globalisation is a process driven by, and resulting from, increasing cross-border interaction and flow of goods, services, money, people, information, and culture (IMF, 2000; Guillen, 2001; Gangopadhyay and Chatterji, 2005; Lechner, 2012). Pearce and Robinson (2011:56) define ‘globalisation refers to the strategy of approaching worldwide markets with standardized products’ (Pearce and Robinson, 2011:56). Globalisation consists of forces which facilitate interaction of social, economic and political systems across cultures, countries and geographical regions (Michie, 2011; Lechner, 2012; Jones and George, 2013). It facilitates flow of four major forms of capital between countries: human capital, financial capital, resources capital and political capital (Ritzer, 2011; Lechner, 2012; Jones and George, 2013).
4.2 Barriers to International Business
Global organisations can use their worldwide experience to compete in global markets. Similarly, national, regional and international policies impact international trade. This is because a component of a nation’s trade and investment policy impact on nations, firms, and individuals in the global business market. It is necessary to describe some terms commonly used in international trade: domestic trade/transaction; international transaction, import, export, trade surplus and trade deficit. Domestic trade is the selling of goods produced in the same country; and international trade involves production, transportation, and selling of goods and services across national borders. Imports are goods or services brought in a country from another country (e.g. made in Nigeria); while, exports are products or services produced in a country (e.g. China) and sold in another country (e.g. Nigeria). Trade surplus occurs when a country exports more goods than it imports; while, trade deficit occurs when a country imports more goods than it exports. International trade is regulated and promoted by a number of trade

Business and Economic Research ISSN 2162-4860
2014, Vol. 4, No. 1
www.macrothink.org/ber 269
bodies, for example, World Trade Organisation (WTO). WTO is the main international organisation that deals with the rules of trade between nations. WTO provides a forum for negotiating agreements (legal and institutional frameworks) to minimise obstacles to international trade and ensure a level playing field for participants to contribute to global economic growth and development. There are two major benefits of reducing international trade barriers: enable businesses to sell their products and services in international markets at lower prices, as additional tariffs on exported products are reduced or eliminated; and increase competition thereby motivating firms to improve quality or reduce their prices in order to effectively compete with imported goods. However, a country can adopt barriers to international trade to protect its domestic businesses and consumers. Hence, barriers to international trade may be used to: encourage starting new domestic businesses; protect an existing industry that is struggling in a competitive global environment; protect consumers from importing products with problems; and ensure that imported products and services conform to the nation’s safety standards (Wen-Cheng et al., 2011; Rath, 2012). Trade barriers a country can impose include: tariffs or custom duties - are form of tax on certain types of imports; non-tariff barriers - setting standard or quality of imported goods so high that foreign competitors cannot enter the market; increased costs of importing and exporting; excise taxes - are taxes on manufacture, sale, or consumption of a particular product produced in the country; and currency fluctuations (Emerson, 2007; Gibson et al., 2012; Jones and George, 2013).
4.3 Cultural Awareness, a Form of Risk Management in International Business
The global market is dynamic; thus, risk is at the centre of international business activity. Although the degree of risk in international business varies among firms; awareness of culture of the host country is critical. Hubbard (2009:10) defines risk management process as ‘the identification, assessment, and prioritisation of risks followed by coordinated and economical application of resources to minimise, monitor, and control the probability and/or impact of unfortunate events’. The study views cultural awareness in international business in the context of risk management. It perceives ‘cultural awareness’ as a form of risk management in international business which may impact, positive or negative, international organisations’ operations (Damodaran, 2008; Hillson and Murray-Webster, 2011). Risk management does not eliminate risks, but it facilitates effective management of global organisations operations, thereby maximises opportunities and minimises threats. Basically, main stages of risk management, as shown in Figure 1, are: context analysis; risk identification; risk analysis; risk evaluation; risk treatment; monitoring and review; and communication and consulting. Furthermore, suitable risk management framework and adequate modus operandi are necessary to facilitate effective and efficient risk management in business enterprises (Fadun, 2013). Consequently, international businesses may undertake risk management in various ways; particularly, through mutual awareness and integration of cultural references into their strategic planning.

Business and Economic Research ISSN 2162-4860
2014, Vol. 4, No. 1
www.macrothink.org/ber 270
Figure 1: Stages of Risk Management
4.4 Chinese Business Culture and its Impact in the Chinese Market
The section considers some Chinese businessman customs, beliefs, culture and laws as well as their impacts on international business in Chinese market place. Knowledge and awareness of these customs, beliefs, culture and laws are critical in international trade because international organisations are undertaken across national borders. International organisations need to be awareness of host country culture to enable them use their worldwide market strategy approach and experience to compete effectively in global markets (Pearce and Robinson, 2011). Moreover, cultural outlook can be deciphered in terms of the changing global socio-economic context (Tibbs, 2011). Consequently, the culture of the host country significantly impacts international business firms’ performance.
4.4.1 Chinese Business Culture and its Impact on International Business in China
Awareness of Chinese culture and negotiating components are key elements of establishing a successful gateway into the Chinese market (Horwitz et al., 2008). Culture entails complex construct that embodies a people's knowledge, morals, art, beliefs, customs, laws and other capabilities gathered by a community over time (Clifton, 2004). Czinkota et al. (2011:141) define ‘culture as an integrated system of learned behaviour patterns that are characteristic of the members of any given society’. Similarly, Hofstede (2011:3) defines culture as ‘the collective programming of the mind that distinguishes the members of one group or category of people from others’. Also, Hummel (2012) describes culture as collective experience of a society and its impact on reaction and decision-making in relation to every-day facts and circumstances. Culture is dynamic, continuously developing and evolving. Hence, culture entails much more than cultural dimensions, as culture manifests itself in several levels and domains (Leung et al., 2005). This implies that some cultural elements are stable, while others are dynamic and changing (Leung et al., 2005; Tibbs, 2011). According to Morden (2007) local cultures may be categorised into three: traditional, achieving and affluent. Traditional cultures are long-established cultures rooted in the past; achieving cultures are cultures that are

Business and Economic Research ISSN 2162-4860
2014, Vol. 4, No. 1
www.macrothink.org/ber 271
gradually deviating from the traditions of the past to facilitate growth and development; and affluent cultures consist of industrial societies of North America, Europe, and South East Asia which place varied emphasis on various concepts and issues to protect those who are disadvantaged by the competitive nature of such cultures (Morden, 2007).
Culture induces countries societal prevailing life-styles because lifestyle influences cultural, behavioural, and social pattern of the society. This suggests that culture and life-style influence patterns of consumption, manufacturing, agriculture, service, distribution and investment (Morden, 2007; Czinkota et al., 2011; Tibbs, 2011). In essence, national culture shapes personal consumption thereby influences investment (political and economic) priority in manufacturing and distribution of consumer goods; as well as provision of auxiliary services. For XYZ International to succeed in China, the Chinese cultural difference must be considered and integrated in its operations so as enhance customers’ trustworthiness in the firm. Geert Hofstede (1980), a Dutch social psychologist and management scholar, develops the most widely used framework for categorising national cultures. Similarly, Hofstede (2011) highlights six model dimensions of national cultures: power distance, uncertainty avoidance, individualism/collectivism, masculinity/femininity, long/short term orientation, and indulgence/restraint. Power distance relates to different solutions to the basic problem of human inequality; uncertainty avoidance relates to the level of stress in a society in the face of an unknown future; individualism versus collectivism focus on the integration of individuals into primary groups; masculinity versus Femininity deal with the division of emotional roles between women and men; long term versus short term orientation relate to the choice of focus for people's efforts, the future or the present and past; and indulgence versus restraint relate to the gratification versus control of basic human desires related to enjoying life (Hofstede, 2011:8). Considering difference in values, attitudes, and behaviour which characterises human interaction; managers must be aware of dynamic and complex environment of operating international business (Morden, 2007). The business environment in China is unique; hence, the knowledge of China business environment is necessary to ensure effectively operation and expansion of business in the country. To be locally responsive, international business managers’ must adapt to local culture and legally mandated expectations (Palk and Sohn, 2004; Wu, 2008). Lack of local responsiveness and strategic planning are some of the major challenges of international businesses in China (Fan et al, 2009; Rath, 2012). Consequently, XYZ International managers’ in China need to be aware and understand issues such as national geography and history; local political and economic management; international trade and competition policy; knowledge and technological development; socio-cultural features; and the international context within which the country may be placed.
4.5 Chinese Business Culture
There are three major intertwined determinants of Chinese business culture and negotiating style. They are: (1) Confucianism, Taoism, and War Stratagems - the backbone of Chinese business culture; (2) Guoqing - the milieu in which Chinese business culture evolved; and (3) adoption of International Best Practices - reform of Chinese business culture (Fang, 2006; Sebenius and Qian, 2008; Wu, 2008).
Business and Economic Research ISSN 2162-4860
2014, Vol. 4, No. 1
www.macrothink.org/ber 272
4.5.1 Confucianism, Taoism, and War Stratagems: Cores of Chinese Business Culture
4.5.1.1 Confucianism
Confucianism is an ethical belief system, rather than a religion, which deals with human relationships based on the teachings and writing of the philosopher Confucious. From Chinese business culture and negotiating style perspective, confucianism entails six core values: moral cultivation; importance of interpersonal relationships; family orientation; respect for seniority and hierarchy; pursuit of harmony and avoidance of conflict; and the concept of face (Fang, 1999; Fang, 2006; Sebenius and Qian, 2008). In essence, Confucianism emphasises the need for people to trust each other, to avoid conflict and to promote harmonious co-existence (Ghauri and Fang, 2001). Confucianism places great value on interpersonal relationships (Fang, 1999); and encourages respect for hierarchy and status (Miles, 2003). Operations in China where Confucianism advocates for individual connections rather than the rule of law have been problematic. Business ethics have not been adhered to, making the firm lose out on opportunities for lack of connections, referred to as Guanxi (Goodrich, 2005). In individualistic societies, competition for resources is the norm where each person tends to focus on his or her own self-interest; hence, such societies preferred individualism over group conformity (Emerson, 2007). Due to the influence of Confusion, Chinese would rather trust people more than any other contracts during the business transactions (Dunfee and Warrant, 2001). Hence, to successfully expand in the Chinese market, XYZ International must adopt people oriented approach and maintain high level of trust relationship with Chinese partners and customers (Ghauri and Fang 2001; Graham and Lam, 2003: Wu, 2008).
4.5.1.2 Taoism
Taoism deals with creativity of life and harmony with nature (Fang, 2001). Tao (pronounced ‘Dow’) simply implies the path or the way; meaning the general law of nature between two changing forces, the negative and the positive, of the same phenomenon (Fang, 1999). Hence, Chinese believe that Tao regulates natural occurrences and nourishes balance in the Universe. It embodies the harmony of opposites; and encompasses the power which envelops, surrounds and flows through all things, living and non-living (Tian, 2007). It indicates that people’s fortune and business performance are impacted by their environment; and more importantly, the position of building relative to its physical environment, interior layout and arrangement of furniture can influence events occur to the occupants of the building (Tsang 2004). Consequently, Taoism philosophy traditions would influence business behaviour and decision-making of XYZ International in the Chinese market (Wu, 2008).
4.5.1.3 Stratagems
The third backbone of Chinese business culture is Chinese Stratagems, or Ji (Fang, 1999; Von Senger, 2006). The Chinese stratagems is a strategic component of Chinese culture and thinking which characterised the strategic patterns of Chinese negotiating style and Chinese negotiating tactics (Mun, 1990; Chu, 1991; Tung, 1994; Chen, 1995; Faure, 1998; Fang, 1999: Von Senger, 2006). The Chinese belief that business is a marketplace and the marketplace is a battlefield (Chu, 1991). Sun Tzu, a Chinese military strategist in the period of warring state (c.
Business and Economic Research ISSN 2162-4860
2014, Vol. 4, No. 1
www.macrothink.org/ber 273
300 BC), in his book The Art of War critically examines Chinese thinking about stratagems (Sun, 1982). Furthermore, Von Senger explores the Thirty-Six Stratagems principles which underlined the Chinese wisdom in dealing with enemies, and overcoming difficult and dangerous situations (Von Senger, 1991). Moreover, Guari and Fang (2001) emphasise that Chinese stratagems (ji) is more than a list of strategies, tricks and ploys; rather is a collection of Chinese wisdom and a framework through which challenging situations can be assessed and addressed. In other words, Chinese stratagems advocate the application of human wisdom to handle situations and to gain advantage over the opponent rather engaging in physical battle. For example, the Chinese businessmen will typically not force international business partners to accept their terms, instead persuade partners by signal that competitors are ready to offer better terms. Consequently, XYZ International managers should be aware that Chinese businessmen are more likely to apply stratagems when dealing with people they do not trust.
4.6 Guoqing-The Milieu in Which Chinese Business Culture Evolved
Guoqing refers to distinctive and dynamic elements of contemporary socio political system and conditions of the People’s Republic of China (PRC) after opening up its economy to the rest of the world in 1978 (Ghuari and Fang, 2001; Fang, 2006; Sebenius and Qian, 2008). China is a socialist state and Chinese politics influence every aspects of Chinese life, including business. Guoqing comprises eight variables: (1) Chinese politics; (2) China’s socialist planned (centralised) economic system; (3) legal framework - China’s legal system is influenced greatly by human factors and ideology; (4) technology advancement; (5) great size - world largest population; (6) China backwardness and uneven development; (7) rapid change; and (8) Chinese bureaucracy (Ghuari and Fang, 2001: Fang, 2006). These guoqing variables immensely influenced Chinese business culture; hence, XYZ International managers’ must be aware of these variables and how they impact on business activities in the Chinese market place.
4.7 Adoption of International Best Practices - Reform of Chinese Business Culture
Following Deng Xiaoping’s open door policy, China has increasingly integrated into the world economy and international politics. From December 1978 China gradually abandon planning system and adopted a more market oriented economy; thus, gradually relaxed its social and ideological controls. The major reasons for China market oriented reform include: unpopularity of the cultural Revolution of 1966-1976; challenges and economically inefficient of planning system; and rapid economic growth and development in more market-oriented neighbouring economies, including Hong Kong, Taiwan, South Korea and Singapore (Chow, 2004). Moreover, China’s economic reform success can be measured partly by its rapid economic growth in real GDP (about 9.6 percent) in three decades after 1978 (World Bank, 2013). Furthermore, three basic factors accounted for the success: first, Chinese citizens’ freedom and opportunity to make money by hard working and ingenuity in a healthy competitive environment; second, large amount of human capital imbedded in the Chinese culture; and third, political will and competence of Chinese leaders in carrying out economic reform (Chow, 2004). The western exposures have impacted Chinese business culture in that western technology, lifestyle, value and business rules are gradually influencing the mentality

Business and Economic Research ISSN 2162-4860
2014, Vol. 4, No. 1
www.macrothink.org/ber 274
and behaviour of the Chinese (Sebenius and Qian, 2008; Tisdell, 2009).
4.8 The impact of Culture on Negotiation
Western and Chinese negotiation approaches often appear incompatible and these differences stem from their cultural backgrounds. The westerners (e.g. American) perceive Chinese negotiators as inefficient, indirect, and dishonest; while the Chinese perceive American negotiators as aggressive, impersonal, and excitable (Graham and Lam, 2003). Meanwhile, Salacuse (2004) identifies ten most important cultural factors which influence business negotiations, as indicated below.
Source: Salacuse (2004)
Similarly, Graham and Lam (2003) present negotiating view from both sides (American and Chinese), as summarised below.
AMERICAN CHINESE
THEIR BASIC CULTURAL VALUE AND WAYS OF THINKING
Individualist Collectivist
Egalitarian Hierarchical
Information oriented Relationship oriented
Reductionist Holistic
Sequential Circular
Seeks the truth Seeks the way
The argument culture The haggling culture
HOW THEY APPROACH THE NEGOTIATION PROCESS
Non-task Sounding
Quick meetings Long courting process

Business and Economic Research ISSN 2162-4860
2014, Vol. 4, No. 1
www.macrothink.org/ber 275
Informal Formal
Make cold calls Draw on intermediaries
Information Exchange
Full authority Limited authority
Direct Indirect
Proposals first Explanations first
Means of Persuasion
Aggressive Questioning
Impatient Enduring
Terms of Agreement
Forging a 'good deal' Forging a long-term relationship
Adapted from: Graham and Lam (2003)
4.9 Arguments to Support Conducting Trade with China
China’s deepening reform and opening up are induced by the country’s growing wealth, ageing population, rising environmental awareness, changing consumer attitudes, greater mobility, urbanisation, and decreasing household sizes (PricewaterhouseCoopers, 2013). We now proceed to identify and discuss reasons or arguments for conducting trade with China.
4.9.1 China Modernisation and Technology Advancement
China modernisation and technology advancement are good reasons for conducting trade with China. Innovative technological development has gradually become essential part of modernisation (Irrgang, 2007); and China scientists pay great attention to development trends of science and technology in the world (Jin, 2012). Advanced technology induces highest degree of automation and rationalisation. Technological advancement has transformed China into one of the largest high-tech exporting country in the world (UNDP, 2001). Similarly, technology advancement contributed greatly to China business advancement and modernisation (CASSTC, 2009). China is the leader in the world in both importing and exporting of information and communication technology (ICT) products, including: computers, smart phones and tablets (UNCTAD, 2012). China imported more than $280 billion and exported more than $459 billion of ICT goods in 2010 (Tables 1 and 2), ahead of the United States (UNCTAD, 2012).

Business and Economic Research ISSN 2162-4860
2014, Vol. 4, No. 1
www.macrothink.org/ber 276

Business and Economic Research ISSN 2162-4860
2014, Vol. 4, No. 1
www.macrothink.org/ber 277
4.9.2 China is the Most Dynamic Trading Economy in the World
China is the most dynamic trading economy in the world (PWC, 2008). Jacques (2009) describes China as a growing economic power and central player in the twenty-first century. Although, China operates a centralised economic system, its international trade openness has increased considerably and the importance of state-owned enterprises has also reduced remarkably (Yang and Zheng 2005; Wen 2005; Tinsdale, 2009). From 1978 when China economic reforms began, the nation has witnessed substantial and steady growth (Table 3). The nation’s international trade openness also grown remarkably (Tables 4 and 5), and over 40% of China’s GDP is contributed by privately owned enterprises (Tisdell 2007; Qian and Wu, 2008; World Bank, 2013). China rapid economic development and dynamic trading economy are tenable reasons for conducting trade with China.
Table 3: China’s Average Annual Real GDP Growth: 1979-2012
Year Real Growth Rate (%) Year Real Growth Rate (%)
1979 7.6 1996 10
1980 7.9 1997 9.3
1981 5.3 1998 7.8
1982 9.0 1999 7.6
1983 10.9 2000 8.4
1984 15.2 2001 8.3
1985 13.5 2002 9.1
1986 8.9 2003 10.0
1987 11.6 2004 10.1
1988 11.3 2005 11.3
1989 4.1 2006 12.7
1990 3.8 2007 14.2
1991 9.2 2008 9.6
1992 14.2 2009 9.2
1993 13.9 2010 10.4
1994 13.1 2011 8.1
1995 10.9 2012 - First Quarter 9.2
Source: Economist Intelligence Unit, based on official Chinese government data. *2012 data are year-on-year
Table 4: China's Trade with the World, 2001-2010 ($ billion)
2001 2002 2003 2004 2005 2006 2007 2008 2009 2010
Exports 266.1 325.6 438.2 593.3 762.0 968.9 1,217.8 1,430.7 1,201.6 1,577.9
% change* 6.8 22.4 34.6 35.4 28.4 27.2 25.7 17.5 -16.0 31.3
Imports 243.6 295.2 412.8 561.2 660.0 791.5 956.0 1,132.6 1,005.9 1,394.8
% change* 8.2 21.2 39.8 35.9 17.6 19.9 20.8 18.5 -11.2 38.7

Business and Economic Research ISSN 2162-4860
2014, Vol. 4, No. 1
www.macrothink.org/ber 278
Total 509.7 620.8 851.0 1,154.6 1,421.9 1,760.4 2,173.7 2,563.3 2,207.5 2,972.8
% change* 7.5 21.8 37.1 35.7 23.2 23.8 23.5 17.9 -13.9 34.7
Balance 22.6 30.4 25.5 32.1 102.0 177.5 261.8 298.1 195.7 183.1
Source: National Bureau of Statistics of China, 2012
NOTES: *Calculated by US-China Business Council (USCBC).
Table 5: China's Top Trade Partners, 2010 ($ billion)
Rank Country/Region Volume % change over 2009
1 United States 385.3 29.2
2 Japan 297.8 30.2
3 Hong Kong 230.6 31.8
4 South Korea 207.2 32.6
5 Taiwan 145.4 36.9
6 Germany 142.4 34.8
7 Australia 88.1 46.5
8 Malaysia 74.2 42.8
9 Brazil 62.5 47.5
10 India 61.8 42.4
Source: PRC General Administration of Customs, China's Customs Statistics
4.9.3 China Business and Economic Growth
China business and economic growth have improved considerably; hence it offers immersed opportunities for foreign investors, including XYZ International. China is one of the world’s largest and fastest growing marketplaces. It is a home for the world’s emerging global companies (PWC, 2008). Whilst the global foreign direct investment (FDI) flows continued declining in the third quarter of 2012; China remained the first FDI destination for third consecutive quarter in 2012 (OECD, 2013). China attracted the largest share of global FDI flows with USD 170 billion (Table 6) during the period January – September 2012 (OECD, 2013).
Table 6: China’s Foreign Direct Investment Inflows (Units: USD Billion)
Annual Quarterly
2007 2008 2009 2010 2011 Q1 2012 Q2 2012 Q3 2012
160.1 175.1 114.2 185 228.6 63.3 54.4 52.2
Source: OECD (2013)
4.9.4 China is the Second Largest Economy and Biggest Exporter in the World
China growth in 2011 was above 9.3% (World Bank, 2013) and is the biggest exporter in the

Business and Economic Research ISSN 2162-4860
2014, Vol. 4, No. 1
www.macrothink.org/ber 279
world (CIA, 2012). China WTO membership in 2001 provided China a platform to entrenched itself as a world’s biggest exporter (Tables 7, 8 and 9) and second largest economy in the world (EU, 2012). Table 4 shows the breakdown of items exported by China in 2010.
Table 7: Country comparison – Export ($) in Billion as at 2011
Rank Country Exports
1 China 2,050.00
2 United States 1,612.00
3 Germany 1,492.00
4 Japan 792.90
5 France 567.50
6 Netherland 556.50
7 South Korea 552.60
8 Russia 530.70
9 Italy 483.30
10 Canada 481.70
Source: CIA, 2012
Table 8: China's Top Exports, 2010 ($ billion)
HS Commodity description Volume % change over 2009
85 Electrical machinery and equipment 388.8 29.1
84 Power generation equipment 309.8 31.4
61, 62 Apparel 121.1* 20.5*
72, 73 Iron and steel 68.1* 44.1*
90 Optics and medical equipment 52.1 34.0
94 Furniture 50.6 30.0
28, 29 Inorganic and organic chemicals 43.2* 34.9*
89 Ships and boats 40.3 42.1
87 Vehicles, excluding rail 38.4 37.5
64 Footwear 35.6 27.1
Source: PRC General Administration of Customs, China's Customs Statistics
Calculated by USCBC
Table 9: China's Top Export Destinations, 2010 ($ billion)
Rank Country/region Volume % change over 2009
1 United States 283.3 28.3
2 Hong Kong 218.3 31.3

Business and Economic Research ISSN 2162-4860
2014, Vol. 4, No. 1
www.macrothink.org/ber 280
3 Japan 121.1 23.7
4 South Korea 68.8 28.1
5 Germany 68.0 36.3
6 The Netherlands 49.7 35.5
7 India 40.9 38.0
8 United Kingdom 38.8 24.0
9 Singapore 32.3 7.6
10 Italy 31.1 53.8
Source: PRC General Administration of Customs, China's Customs Statistics
4.9.5 Importance of Foreign Owned and Private Firms in China
Although several industries are largely state-owned, foreign owned and private companies are rapidly gaining importance in the Chinese economy. Chinese transnational corporations (TNCs) play active role in a number of industries and the wide spread of their FDI projects over a large number of host economies have raised awareness of their home country as a source of investment. The United Nations Conference on Trade and Development (UNCTAD) World Investment Prospects Survey 2012-2014 provides an outlook on future trends in foreign direct investment (FDI) by the largest TNCs. China led the list with 62 per cent of respondents selecting it (Table 10). Essentially, this is largely due to the rapid increase of its outward FDI in recent years - 41 and 57 per cent in 2009 and 2010 respectively (UNCTAD, 2009; 2010).
Table 10: TNCs’ top prospective host economies, 2012-2014
(Percentage of respondents selecting economy as a top destination)
Country % of Responses Ranking
China 62 1
United States 61 2
Germany 41 3
United Kingdom 40 4
France 27 5
Japan 22 6
India 21 7
Spain 17 8
Canada 17 9
United Arab Emirates 11 10
Brazil 11 11
Source: UNCTAD Survey World Investment Prospects 2012-2014

Business and Economic Research ISSN 2162-4860
2014, Vol. 4, No. 1
www.macrothink.org/ber 281
4.9.6. Chinese Government Incentives to Attract International Investors
The Chinese government encourages and attracts international investors to invest in China. Notwithstanding considerable bureaucracy, the Chinese government is making efforts to promote foreign investment. The Chinese government has been proactive in removing tariff and non-tariff barriers for trade in goods through the negotiation and implementation of regional free trade agreements (PWC, 2008). Furthermore, China has passed an Anti-Monopoly Law (AML) which regulate competition effective August 2008 (Tian, 2010; Chin, 2012). China’s Anti-Monopoly Law (AML) is the first anti-monopoly law in China. The AML has been described as an economic constitution and milestone of China’s efforts in promoting a fair competition market and cracking down on monopoly activities (Tian, 2010). However, foreign businesses in China, including XYZ International, need to consider the immediate impact of the new law on their businesses.
4.9.7 China Huge Population
China’s huge population provides international firms with a great pool of low-wage workers, enabling mass-market factories and lower-cost production platforms to produce for both the export market and the growing Chinese market (Meredith, 2007, Wu, 2008; Czinkota et al., 2011). With its population of 1.3 billion, China has low production costs and a higher supply of cheap labour. China has the highest labour force of about 795.4 million by the end of 2012 (CIA, 2012). Its labour force by occupation in 2012 was: agriculture – 34.8%; industry – 29.5%; and services – 35.7% (CIA, 2012). This is one of the major reasons for supporting trade with China, as reduced cost of production (particularly low-cost labour) enhances profitability. This is beneficial to international investors as China’s huge population, together with the nation’s export-friendly infrastructures, facilitates lower-cost production platforms. However, it has been observed that China’s labour force may have already reached its peak in 2011 (Rozelle et al., 2008). Furthermore, most rural youth in the 16–20 age brackets are already working off the farm; hence, China’s rural-to-urban migration may reduce because the rural young people are highly Mobile (Hongbin et al., 2012).
4.9.8 China Political Stability and Rapid Economic Growth
Political stability and rapid economic growth are other considerations for conducting trade with China. China's political and social landscape is stable after the nation’s three decades of reform and opening-up. China's economy, largely closed to international trade before December 1978, has changed from a centrally planned system to a more market-oriented that has a rapidly growing private sector (Tisdell, 2009). This is obvious form the chronology of events and the implication of the events associated with the formulation of China’s development policies in the last three decades (Table 11).
Table 11: Chronological events of China’s development policies in the last three decades
Time Event
Jan 1976 Premier Zhou Enlai dies.
Sept 1977 Chairman Mao Zedong dies. Hua Guafeng becomes Chairman of the CCP and subsequently Deng

Business and Economic Research ISSN 2162-4860
2014, Vol. 4, No. 1
www.macrothink.org/ber 282
Xiaoping returns from political exile.
Dec. 1978 Increasing CCP support for Deng Xiaoping’s reformist agenda culminates in its basic acceptance by the 11th Central Committee of the CCP. It was argued that the reforms should begin with agriculture.
1979 Deng Xiaoping becomes Chairman of the Military Commission. He criticises dogmatic approaches to policy and favours a pragmatic approach.
1980 Hua Guofeng steps down as Chairman of CCP.
Mid-1981 Under the influence of Deng Xiaoping, the CPC stresses that China’s policies for modernisation must be realistically based, systematic and staged, and take account of Chinese conditions.
1984 The CCP decides that the economic reforms commenced in agriculture should be extended to the whole economy. An end to the privileged position of state enterprises is signalled. Increasing emphasis occurs on greater economic openness as an instrument of development policy.
1989 Chairman Jiang Zemin confirms the direction of China’s development policies, such as extension of the market system and greater economic openness as well as measures to limit population growth. He saw the need for China to improve its science and technology policy because as China catches up with the rest of the world’s technology; it will need to do more to advance its own scientific and technological improvements.
2002 Jiang Zemin in his report to the 16th Congress of the CCP re-affirms China’s policies for economic development but expressed concern about growing economic inequality in China. Given changed economic conditions in China, it seemed that Deng Xiaoping‘s principle of payment according to work (expounded in 1978) was going to be modified. China’s rise as a major global economy was boosted by its WTO membership in 2001, which made it reform and open up its economy. This provided a platform for the nation to establish itself as a major global trader and exporter.
2007 Chairman Hu Jintao in his report to the 17th Congress of the CCP then confirmed support for continuing earlier economic reforms but also indicated that policy must pay more attention to income inequality, approaching technological (and similar) barriers to China’s continuing development, and environmental and energy issues.
2008 China faced the challenge of the global economic crises and formulated policies to weather the economic storm. This has been described as ‘China’s greatest [economic] crisis since its reforms 30 years ago’.
2009 To 2011
Signs of recovery of economic activity in China as a result of Government intervention. China is the second largest economy and biggest exporter in the world. it growth in 2011 was above 9%, and international estimates predict China may be on track to become the world’s biggest economy within the next 5-10 years, with an internal market of 1.39 billion potential consumers by the end of 2015 (EU, 2012). This provided a platform for China to establish itself as a major global trader and the world’s biggest exporter. About half of China's exports are produced by foreign invested companies. China attracted the largest share of global FDI flows with USD 170 billion between January and September 2012 (OECD, 2013). Similarly, the UNCTAD Survey World Investment Prospects 2012-2014 provides an outlook on future trends in foreign direct investment (FDI) by the largest TNCs; China led the list with 62 per cent of respondents selecting it.
China’s Development Policies in the Last 30 Years - Adapted from: Tisdell 2009
5. Conclusion
The emergence of capitalism into China enhanced international firms’ investment in the country. This resulted to creation of a production base to explore the inexpensive factors of

Business and Economic Research ISSN 2162-4860
2014, Vol. 4, No. 1
www.macrothink.org/ber 283
production, particularly low-cost labour. Hence, the Chinese production flourished through improvements in production facilities, access to ports, skilled labour, and export friendly infrastructure (Czinkota et al., 2011). Mutual awareness of cultural references is essential in international business as levels of formality vary greatly among cultures. The study has examined cultural awareness as a form of risk management in international business, using China as a case study. The study used ‘XYZ International’ as a hypothetical international business, with western cultural background, which operates in China market. The study explored international trade and global organisations; considered barriers to international business; justified cultural awareness as a form of risk management in international business; highlighted Chinese business culture; outlined the impact of culture on negotiation; appraised Chinese business culture and its impact in the Chinese market; and presented arguments to support conducting trade with China. The study has shown that mutual awareness of cultural references is essential in international business, and levels of formality vary greatly among cultures. The implication for practice is that culture induces each country societal prevailing life-styles because culture and life-style influence patterns of consumption, manufacturing, agriculture, service, distribution and investment.
References
Adler, N. J. (2008). International-business scholarship: Contributing to a broader definition of success. In: J. J. J. Boddewyn (Ed.) International Business Scholarship: AIB Fellows on the First 50 Years and Beyond Research in Global Strategic Management (Volume 14) (pp. 327-337), Emerald Group Publishing Limited.
Central Intelligence Agency (2012). World Factbook - Country comparison: Export. CIAAccessed 13 April 2013.
Chen, M. (1995). Asian management systems: Chinese, Japanese and Korean styles of business. London, Routledge.
Chin, Y. W. (2012). Merger control under China’s Anti-Monopoly Law. Legal law for China investments E.4.2.
CASSTC (2009). Chinese Academy of Science, Science & Technology in China: A Roadmap to 2050. China: Science Press.
Chow, G. C. (2004). Economic reform and growth in China. Annals of Economics and Finance, 5, pp. 127-152.
Chu, C. N. (1991). The Asian mind game. New York: NY, Rawson Associates.
Clifton, J. (2004). Culture and international business. New York, NY: Blackwell.
Czinkota, M. R., Ronkainen, I. A., & Moffett, M. H. (2011). International business (8th ed.).Danvers, MA: John Wiley.
Damodaran, A. (2008). Strategic risk taking: A framework for risk management. Upper Saddle River, New Jersey: Prentice Hall.

Business and Economic Research ISSN 2162-4860
2014, Vol. 4, No. 1
www.macrothink.org/ber 284
Dunfee, T. W., & Warrant, D. E. (2001). Is Guanxi ethical? A normative analysis of doing business in China. Journal of Business Ethics, 32, pp. 191-204. http://dx.doi.org/10.1023/A:1010766721683
Emerson, N. (2007). The social dimension of international business. Beverly Hill: Sage.
European Union (2012). Facts and figures on EU-China trade: Did you know? 13 April 2013.
Fadun, O. S. (2013). Risk management and risk management failure: Lessons for business enterprises in Nigeria. International Journal of Academic Research in Business and Social Sciences, 3(2), 225-239.
Fan, D., Nyland, C., & Zhu, C. J. (2009). Integration-responsiveness framework for Chinese MNCs: An area for future study. Working Paper 5/09: Monash University, Department of Management.
Fang, T. (1999). Chinese business negotiation style. Thousand Oaks, CA: Sage.
Fang, T. (2001). Culture as a driving force for inter-firm adaptation: A Chinese case. Industrial Marketing Management, p. 30. http://dx.doi.org/10.1016/S0019-8501(99)00088-7
Fang, T. (2006). Negotiation: The Chinese style. Journal of Business & Industrial Marketing, 21(1), 50-60. http://dx.doi.org/10.1108/08858620610643175
Faure, G. O. (1998). Negotiation: The Chinese concept. Negotiation Journal, 14(2), 137-148. http://dx.doi.org/10.1111/j.1571-9979.1998.tb00154.x
Gangopadhyay, P., & Chatterji, M. (2005). Economics of globalisation. London: Ashgate.
Ghauri, P., & Fang, T. (2001). Negotiating with the Chinese: A social-cultural analysis. Journal of World Business, 36(3), 303-325. http://dx.doi.org/10.1016/S1090-9516(01)00057-8
Gibson, J. L., Ivancevich, J. M., Donnelly, J. H., & Konopaske, R. (2012). Organisations: Behaviour, structure, processes (14th ed.). New York, NY: McGraw-Hill Irwin.
Goodrich, A. (2005). The dynamics of global business. Chicago: Gift Book Publishers.
Graham, J. L., & Lam, N. M. (2003). The Chinese negotiation. Harvard Business Review. 12 April 2013.
Guillen, M. F. (2001). Is globalisation civilising, destructive or feeble? A critique of five key debates in the social science literature. Annual Review of Sociology, 27, 235-260. http://dx.doi.org/10.1146/annurev.soc.27.1.235
Hillson, D. A., & Murray-Webster, R. (2011). Using risk appetite and risk attitude to support appropriate risk taking: A new taxonomy and model. Journal of Project, Program & Portfolio Management, 2(1), 29-46.
Hofstede, G. (1980). Culture’s consequences: International differences in work-related values.Newbury Park, California: Sage.
Hofstede, G. (2011). Dimensionalizing Cultures: The Hofstede Model in Context. [Online]

Business and Economic Research ISSN 2162-4860
2014, Vol. 4, No. 1
www.macrothink.org/ber 285
Readings in Psychology and Culture, Unit 2. 14 April 2013. http://dx.doi.org/10.9707/2307-0919.1014
Hongbin, Li., Lei, L., Wu, B., & Xiong, Y. (2012). The end of cheap Chinese labour. Journal of Economic Perspectives, 26(4), 57-74. http://dx.doi.org/10.1257/jep.26.4.57
Horwitz, F., Hemmant, R., & Rademeyer, C. (2008). Chinese business negotiations:South African firm experiences and perspectives. South African Journal of Business Management, 39(1), 1-13.
Hubbard, D. W. (2009). The failure of management: Why it’s broken and how to fix it. Hoboken, New Jersey: John Wiley.
Hummel, D. P. (2012). Understanding the importance of culture in global business. Oracle 7 March 2013.
Infoplease (2012). Population density per square mile of countries. 6 April 2013.
Internet World Stats [IWS] (2013). The world population and the top ten countries with the highest population.
International Monetary Fund (2000). Globalisation: Threat or Opportunity? Washington D.C: IMF.
Irrgang, B. (2007). Technology transfer and modernization: what can philosophers of technology contribute? December Article no. 1. Accessed 12 April 2013.
Jacques, M. (2009). When China rules the World: The rise of the middle kingdom and the end of the Western World (2nd ed.). London: Penguin.
Jin, J. (2012). Science & technology and modernisation. Modernisation Science Newsletter, 2(2), 1-14.
Jones, G., & George, J. (2013). Essentials of contemporary management (5th ed.). New York, NY: McGraw-Hill Irwin.
Lechner, F. J. (2012). The globalisation reader (4th ed.). Maiden, MA: John Wiley.
Leung, K., Bhagat, R. S., Buchan, N. R., Erez, M., & Gibson, C. B. (2005). Culture and international business: recent advances and their implications for future research. Journal of International Business Studies, 36, 357-378. http://dx.doi.org/10.1057/palgrave.jibs.8400150
Meredith, R. (2007). The elephant and the dragon: The rise of India and China and what It means for all of us. New York, NY: W. W. Norton.
Michie, J. (2011). The handbook of globalisation (2nd ed.). Northampton, MA: Edward Elgar. http://dx.doi.org/10.4337/9780857931443
Miles, M. (2003). Negotiating with the Chinese: Lessons from the Field. Journal of Applied Behavioural Science, 39(4), 453-472. http://dx.doi.org/10.1177/0021886303260547
Morden, T. (2007). Principles of strategic management. Aldershot, London: Ashgate.

Business and Economic Research ISSN 2162-4860
2014, Vol. 4, No. 1
www.macrothink.org/ber 286
Mun, K. C. (1990). The competition model of Sun Tzu’s Art of War. In: H. Kuang, (Ed.), Encyclopedia of modern marketing in Chinese (pp. 930-935). Beijing, Economics and Management Press.
Nadeau, J., & Casselman, M. (2008). Competitive advantage with new product development: Implications for life cycle theory. Journal of Strategic Marketing, 16(5), 401-411.http://dx.doi.org/10.1080/09652540802480894
OECD (2013). GDP in figures. 13 April 2013.
Palk, Y., & Sohn, J. H. D. (2004). Striking a balance between global integration and local responsiveness: The case of Toshiba Corporation in redefining regional headquarters’ role. Organizational Analysis, 12(4), 347-359.
PricewaterhouseCoopers (2013). Doing business and investing in China. Beijing: PWC. http://download.pwc.com/ie/pubs/2013_doing_business_and_investing_in_china.pdf
Qian, Y., & Wu, J. (2008). Transformation in China. In: J. Kornai, L. Máltyás and G. Roland (Eds.), Institutional change and economic behaviour (pp. 38-63). Basingstoke, London: Palgrave Macmillan.
Quanyu, H., Leonard, J., & Tong, C. (1997). Business decision making in China. Binghamton, NY: International Business Press.
Rath, S. P. (2012). Legislation effectiveness in current economic environment towards global integration of organizations. International Journal of Social Science Tomorrow, 1(9), pp. 1-6.
Ritzer, G. (2011). Globalisation: the essentials. Maiden, MA: John Wiley.
Rozelle, S. D., Huang, J., Zhang, L., & Li, X. (2008). China’s labour transition and future educational challenges. Stanford University.
Salacuse, J. W. (2004). Negotiating: The top ten ways that culture can affect your negotiation. Ivey Business Journal, September/October.
Sebenius, J. K., & Qian, C. J. (2008). Cultural notes on Chinese negotiating behaviour. Working Paper 09-076: Harvard Business School.
Stutz, F. P., & Warf, B. (2011). The world economy: Resources, location, trade and development (6th ed.). Upper Saddle River: Pearson.
Sun T. (1982). The art of war (translated by Samuel B. Griffith). London, Oxford University.
Tian, X. W. (2007). Managing international business in China. Cambridge: Cambridge University. http://dx.doi.org/10.1017/CBO9780511810558
Tian, Y. (2010). The impacts of the Chinese anti-monopoly law on IP commercialisation in china and general strategies for technology-driven companies and future regulators. Duke Law & Technology Review, 4, 1-23.
Tibbs, H. (2011). Changing cultural values and the transition to sustainability. Journal of

Business and Economic Research ISSN 2162-4860
2014, Vol. 4, No. 1
www.macrothink.org/ber 287
Futures Studies, 15(3), 13-32.
Tisdell, C. A. (2007). Economic and business relations between China and Australia: Insights into China’s global economic footprint. In: P. Basu, G. O’Neill, and A. Travaglione (Eds.). Engagement and change (pp. 11-24). Brisbane: Australian Academic Publishers.
Tisdell, C. (2009). Economic reform and openness in China: China’s development policies in the last 30 years. Economic Analysis & Policy, 39(2), pp. 271-294.
Tsang, E. W. K. (2004). Toward a scientific inquiry into superstitious business decision-making. Organisation Studies, 25(6), 923-946. http://dx.doi.org/10.1177/0170840604042405
Tung, R. L. (1994). Strategic management thought in East Asia. Organisational Dynamics, 22(4), 55-65. http://dx.doi.org/10.1016/0090-2616(94)90078-7
United Nations Development Programme (2001). Human development reports 2001: Making new technologies work for human development. New York, NY: Oxford University.
United Nation Conference on Trade and Development (2012). UNCTAD statistics show china now the world’s largest exporter and importer of ICT products. UNCTAD 11 April 2013.
United Nation Conference on Trade and Development (2009). World investment prospects survey, 2009-2011. New York and Geneva: United Nations - UNCTAD.
UNCTAD (2010). World investment prospects survey, 2010-2012. New York and Geneva: United Nations.
UNCTAD (2012). World investment prospects survey 2012–2014. New York and Geneva: United Nations.
Von Senger, H. (2006). The 36 stratagems for business. Marshall Cavendish.
Yang, R., & Zhang, Y. (2005). Globalisation and China’s reform of state-owned enterprises (SOEs). In: C. Tisdell (Ed.), Globalisation and world economic policies (pp. 374-387). New Delhi, India: Serials Publications.
Guest, L., Notman, D., & Wilson, J. (2007). The world of business (5th ed.). Canada: Nelson Education.
Wen, J. J. (2005). Can globalisation save SOEs in China? In: C. Tisdell (Ed.), Globalisation and world economic policies (pp. 388-401). New Delhi, India: Serials Publications.
Wen-Cheng, W., Chien-Hung, L., and Ying-Chien, C. (2011). Types of competitive advantage and analysis. International Journal of Business and Management, 6(5), 100-104. http://dx.doi.org/10.5539/ijbm.v6n5p100
World Bank (2013). GDP growth (Annual %). 13 April 2013.
Wu, J. (2008). An analysis of business challenges faced by foreign multinationals operating the Chinese market. International Journal of Business and Management, 3(12), pp. 169-174.
World Trade Organisation (2014). What is the WTO. 23 July 2013

Business and Economic Research ISSN 2162-4860
2014, Vol. 4, No. 1
www.macrothink.org/ber 288
Copyright Disclaimer
Copyright reserved by the author(s).
This article is an open-access article distributed under the terms and conditions of the Creative Commons Attribution license (http://creativecommons.org/licenses/by/3.0/).

Business and Economic Research ISSN 2162-4860
2014, Vol. 4, No. 1
www.macrothink.org/ber 289
Welfare Effects of Social Cash Transfers in Chipata and Kazungula Districts of Zambia
Gelson Tembo (Corresponding author)
Department of Agricultural Economics, University of Zambia, Lusaka
P.O. Box 32379, Lusaka, Zambia
E-mail: [email protected]
Bernadette Chimai
Department of Agricultural Economics
University of Zambia, Lusaka, Zambia
Nicholas Freeland
MASDAR International Consultants, Reading, UK
Brian P. Mulenga
Indaba Agricultural Policy Research Institute, Lusaka, Zambia
Received: January 10, 2013 Accepted: February 2, 2013
doi:10.5296/ber.v4i1.5532 URL: http://dx.doi.org/10.5296/ber.v4i1.5532
Abstract
This study uses the odds-weighted regression approach and data from two spatially separated social cash transfer (SCT) programs in Zambia to determine the impact of cash transfers on household welfare. The same analytical framework was also applied on sub-samples of poor and relatively less poor households, where the wealth ranking was done using an asset-based index derived through principal components analysis. The results confirm positive SCT effects on per capita consumption expenditure and that the sizes and relative significance of these effects vary by program design and by the household's asset wealth. The effects were especially unambiguously positive and significant for non-food consumption. While the impact on food expenditure was positive and significant in the rural Kazungula SCT program, the impact on
Business and Economic Research ISSN 2162-4860
2014, Vol. 4, No. 1
www.macrothink.org/ber 290
non-food per capita consumption expenditure was three times greater. In the urban scheme in Chipata, program impacts were only significant on non-food expenditure. Future intervention designs need to take into account such heterogeneity in level and shape of potential impacts if they are to be effective.
JEL codes: C14, C21, D63, I38.
Keywords: Social cash transfers, Consumption expenditure, Impact, Chipata, Kazungula, Zambia
1. Introduction
Zambia has been implementing social cash transfer (SCT) schemes since 2003 with the primary aim to reduce extreme poverty among the poorest households with insufficient or no labour capacity. From the maiden pilot scheme in Kalomo in 2003, SCT schemes have since spread to 18 more districts and preparations are under way to add another 31. Tembo et al. (2014) provide a more comprehensive overview of the evolution of SCTs in Zambia.
This study uses survey data from two structurally different and spatially separated pilot schemes in Chipata and Kazungula Districts of Zambia to determine the impact of SCTs on household welfare. To the best of our knowledge, this study is the first comprehensive treatment of the impact of SCTs for the two schemes. Recent SCT impact evaluation work in Zambia has focused on Kalomo, the oldest scheme (Tembo et al. 2014), and the more recent programs such as the Monze SCT scheme (Handa et al., 2012; Seidenfeld et al., 2011) and the Child Grant Program (CGP) (Handa et al., 2013a; Handa et al., 2013b; Daidone et al., 2013). No such study has been done on the Chipata and/or Kazungula pilot schemes, both of which were modelled after Kalomo with a 10 percent selection threshold and a purely community-based targeting system. However, neither the Kalomo scheme nor the CGP model is completely identical to the Chipata and/or Kazungula schemes. While the Chipata scheme is the first urban-based scheme and includes an explicit educational allowance, Kazungula represents sparsely populated, hard-to-reach rural areas (RHVP 2007).1 Following Tembo et al. (2014), we measure not only aggregate effects but also heterogeneous impact across household wealth strata.
We use Hirano, Imbens and Ridder's (2003) flexible and fully efficient odds-weighted regression approach to estimate aggregate and heterogeneous impact on household consumption. Heterogeneous impact was estimated across wealth categories, where an asset-based index generated through principal components analysis (PCA) (Filmer and Pritchett 2001) was used as the stratifying variable. The results indicate significant positive aggregate effects on household welfare in both pilot districts. The impact was especially large with respect to non-food expenditure, regardless of the household’s wealth status. Food expenditure effects were unambiguously positive and significant only in the rural scheme while in the urban-based scheme of Chipata such effects were positive and significant only among asset-poor households.
1 The two schemes under study had been running for at least two years by the time of the surveys.

Business and Economic Research ISSN 2162-4860
2014, Vol. 4, No. 1
www.macrothink.org/ber 291
In the rest of the paper we first present the analytical framework in section 2. Sections 3 and 4 present methods and procedures, and results, respectively. Summary and conclusions are presented in section 5.
2. Analytical Framework
2.1 Conceptual Arguments for Cash Transfers
SCTs are motivated by extreme liquidity constraints that households experience during less productive stages in their life-cycle, during income shocks and situations of extreme poverty. These liquidity constraints are exacerbated by inherently imperfect credit markets (Gertler, Martinez, & Rubio-Codina, 2006). Cash transfers can smoothen consumption and ensure that households do not fall below a critical threshold that is necessary to make a ‘decent’ living. One of the most reliable measures of welfare in the literature is consumption expenditure. Although expenditure and income are supposed to be equivalent, the latter tends to be volatile and prone to under-reporting bias.
Program effects on consumption may not be homogeneous across beneficiary households due to variations in initial wealth levels. Relatively less poor households may have the relevant preconditions to use the SCTs to attain some of the outcomes quicker than their poorer counterparts. Conversely, poorer households may have had very low consumption levels to start with, leading to huge effects of the SCTs. Differences in the setting (rural-urban; remote-near cities) and other design elements may also foster heterogeneous impact.
2.2 Data and Data Sources
This study uses two cross-sectional data sets from three independent surveys conducted in 2007 by CARE International. In the first stage, Community Welfare Assistance Committees (CWAC) (the primary sampling units) were selected through probability proportional to size (PPS). After this, SCT beneficiary households and households not receiving but with similar characteristics as beneficiaries were selected using simple random sampling.2 Comparison households were selected from among households that had qualified to be in the program based on the selection criteria but were left out only on account of the 10 percent cut-off point. Each of the two studies had a sample size of 200 households. 3 About 46-53 percent of the households were SCT beneficiaries.
2.3 Impact Estimation
In the odds-weighted regression framework (Hirano, Imbens and Ridder 2003), impact is the
estimated slope coefficient 1 ̂ in the weighted-regression model
2 CWACs and Area Coordinating Committees (ACCs) are the grassroots structures of the Public Welfare Assistance Scheme (PWAS), which is a national scheme responsible for coordinating all social welfare interventions down to the community levels. As geographic units, the CWACs are used to define specific areas with a certain number of villages, and in turn the CWACs are nested within ACCs. 3 See Tembo and Freeland (2008) for details about the two surveys.

Business and Economic Research ISSN 2162-4860
2014, Vol. 4, No. 1
www.macrothink.org/ber 292
� � ewy ��� 1ln 0 (1)
where the observations are weighted by 1 for treatment households and by the odds-ratio,
� � � �� �xx PP ˆ1/ˆ � , for comparison households; 0 and 1 are parameters to be estimated; and e is
a zero-mean error term. The dependent variable, � �yln , is the natural logarithm of per capita
consumption expenditure on food, non-food or both. � � � �xx |1ˆ �� wEP is the conditional
probability of participation estimated as;
� � � �/Pr 1|w � �� �� � �x δ x (2)
where w is a dichotomous variable equal to one if the household is an SCT beneficiary and zero otherwise, � is a standard normal cumulative distribution function (CDF), � is the error term; � and δ are parameter and vector of parameters to be estimated; and x is a vector of household and community covariates used in the beneficiary selection process. Only variables that were found to be correlated with the outcome variable were included in x (Caliendo and Kopeinig, 2008). Equation (2) was estimated using maximum likelihood in Stata (StataCorp 2008) for both Chipata and Kazungula (estimation results not reported). Before the predicted probabilities from equation (2) could be used in the computation of the odds ratios, care was taken to ensure the balancing and common support properties were satisfied (Rosenbaum and Rubin 1985; Caliendo and Kopeinig 2008; Jalan and Ravallion 2003; Cameron and Trivedi 2005; Becker and Ichino 2002; Leuven and Sianesi 2003; Tembo et al. 2014).
In addition to equation (1), we also use the odds-weighted regression framework to estimate impact disaggregated by poverty status:
� � uDwwy ���� *ln 210 ��� (3)
where D is a dummy variable equal to 1 if the household was categorized as asset poor (falling
in the bottom two quintiles of the PCA-based wealth index) and zero otherwise; 0� , 1� , and
2� are parameters to be estimated; and u is a zero-mean error term. As in Equation (1), the
observations were weighted by 1 for treatment households and by � � � �� �xx PP ˆ1/ˆ � for
comparison households. Based on (3), the estimated impact is equal to 1�̂ if the household
falls in the less poor category (D = 0) and 21 ˆˆ �� � otherwise (D = 1).

Business and Economic Research ISSN 2162-4860
2014, Vol. 4, No. 1
www.macrothink.org/ber 293
4. Results and Discussion
4.1 Descriptive statistics
The descriptive results confirm that the SCT target population is extremely poor, characterized by elderly heads, high dependency ratios, and high incidences of female- and widow-headed households (Table 1). More than half the children 0-16 years old are orphaned. Of the two schemes under study, the urban-based Chipata scheme has the highest incidences of orphan-hood, and female- and widow-headed households.
Table 1. Selected characteristics of SCT target populations in Chipata and Kazungula
District/scheme Variable Chipata Kazungula
Sample size 200 200 Number of meals by children per day 2.4 1.5
Household income (‘000 ZMK) 979.0 366.6 Age of the household head (years) 55.4 61.9
Widow-headed households (%) 65.0 55.0 Male-headed households (%) 28.0 31.0
Orphanhood (%) 78.0 44.0 Effectively active members (%) 19.3 15.2
Kazungula had the oldest household heads (averaging 62 years), highest dependency ratios, and the lowest numbers of meals eaten by children (1.5 per day, compared to about 2.4 meals per day in Chipata). Eligible households in Kazungula also cultivate a smaller land area of about 0.3 hectares, and have the lower non-SCT income levels per household, averaging ZMK366,600 (US$93) per annum, compared with ZMK979,000 (US$245) in Chipata.

Business and Economic Research ISSN 2162-4860
2014, Vol. 4, No. 1
www.macrothink.org/ber 294
Table 2. Probit results for the propensity score models for Chipata and Kazungula SCT programs
Variable Variable description(1) (2) (3) (4)
hsex Sex of head, 1=male -0.0616 0.4797 0.1004 0.4226dhse Household owns a house,1=yes 0.0695 0.2261 -0.0852 0.2395dhdold Head 60 years or older,1=yes 0.1002 0.5548 -0.3905 * 0.5391hage Age of household head (years) -0.0383 * 0.0568 0.0083 0.0143hag2 Age-squared 0.0003 * 0.0005 - -dfprim Girls in primary school,1=yes -0.0342 0.2679 -0.1702 0.2909dfsec Girls in secondary school,1=yes 0.2825 ** 0.3332 -0.2068 0.4994dmprim Boys in primary school,1=yes 0.3552 *** 0.3031 0.0799 0.3176dmsec Boys in secondary school,1=yes 0.4114 *** 0.3519 0.2737 * 0.4509dwido Marital status, 1=widowed -0.0052 0.8249 0.4866 * 0.6969deprat Dependency ratio 0.0198 0.0558 0.0022 0.0324c0to14 Children 14 years or younger -0.0465 0.1091 -0.0245 0.1227m15to30 Male members 15-30 years 0.0030 0.1346 -0.1513 * 0.2169f15to30 Female members 15-30 years 0.0363 0.1506 0.0297 0.2165m31to45 Male members 31-45 years 0.0780 0.3111 -0.3346 * 0.4783f31to45 Female members 31-45 years -0.0422 0.2940 0.1970 0.3813m46to60 Male members 46-60 years 0.1560 0.5131 -0.0123 0.5369f46to60 Female members 46-60 years -0.1064 0.3669 -0.2967 ** 0.3673m61plus Members 61 years or older -0.0973 0.3073 0.1819 0.3191dovc Household with orphans, 1=yes 0.1577 0.4852 -0.0693 0.5250wj Asset wealth index - - 0.0053 0.0258Interaction terms a
hsex x wj -5.2 x 10⁻⁶ 0.0276 -0.0046 0.0318dwido x wj 0.0080 0.0236 -0.0193 ** 0.0232dovc x wj -0.0167 * 0.0231 -0.0051 0.0250hsex x dovc x wj 0.0242 0.0468hsex x dwido -0.5968 *** 0.7383 0.0720 0.6358dwido x c0to14 0.0418 0.1353 0.0708 0.1700dwido x m61plus -0.0596 0.3422 -0.0825 0.3904dwido x dovc -0.1984 0.6728 -0.1318 0.6092dwido x deprat 0.0295 0.0541 -0.0264 * 0.0398deprat x dovc -0.0173 0.0538 - -dovc x deprat - - 0.0183 0.0399hsex x dwido x dovc 0.6338 *** 0.4401 -0.3960 1.1767Joint significance of regions/ACCs 0.0100 2.9300Goodness of fit LR Chi-square 54.4500 *** 48.5300 **Log likelihood -107.936 -109.947Pseudo R2 0.2014 0.1808Predicted probability of participation 0.4670 0.5308Observed probability of participation 0.5026 0.5258Number of observations 195 194Level of significance: *=10 percent, **=5 percent, ***=1 percent
KazungulaChipataMarginal effect Standard error Marginal effect Standard error
4.2 Probit Results
The probit results indicate interesting systematic differences between participating households and their non-participating but eligible counterparts, and between the program districts (Table 2). In Chipata, widow-headed households were significantly more likely to be in the program if they were also female-headed. In Kazungula, widowhood was a significant determinant of

Business and Economic Research ISSN 2162-4860
2014, Vol. 4, No. 1
www.macrothink.org/ber 295
participation, regardless of the sex of the household head and whether or not the household hosts orphans.
The age of the household head was significant only in Chipata. In that district, the effect of age was negative at the lower end of the age distribution and positive towards the upper end. This means that, even among the eligible households, child-headed and elderly-headed households had the highest chances of being included in the scheme, which is perfectly consistent with expectations. Household composition was a factor only in Kazungula, where various sub-categories of active age groups were inversely and significantly related to the probability of participation.
However, not all the results were consistent with expectations. In Kazungula, for example, households whose heads were 61 years or older were 39 percent less likely to be in the program than households that had younger heads. Also, households closest to main roads, schools and health posts were more likely to be in the program. It should also be noted that these results do not constitute an assessment of targeting effectiveness. As earlier stated, our sample was drawn from the program participants (i.e. the 10 percent most incapacitated of the ultra poor) as well as from those that had qualified to be in the program but were left out only because of the 10 percent ceiling. Thus, the probit models represent only the selection process from among the eligible households. The correct comparison group for a targeting evaluation is all households other than the participants.
4.3 Impact on Consumption Expenditure
The impact of the SCTs on consumption expenditure was unambiguously positive and statistically significant in both schemes, accounting for 57-85 percent of the beneficiary households’ per capita consumption levels (Table 3). In Kazungula, the poorer of the two study districts, the impact was more than one-and-a-half times as much as in Chipata. This is not surprising as Kazungula had the most vulnerable target population. It appears that pre-intervention consumption levels may have been so low that the SCT intervention made a big difference. SCTs were especially effective in raising non-food consumption expenditure, accounting for 80-113 percent of the beneficiary households’ per capita non-food consumption expenditure. In contrast, the impact on per capita food expenditure was significant only in Kazungula.
Table 3. Propensity score matching estimates of impact of the SCT pilot schemes on per capita consumption expenditure
Outcome variable District
Chipata Kazungula
Natural log of per capita expenditure 0.570*** 0.854***
Natural log of per capita food expenditure -0.030 0.399**
Natural log of per capita non-food expenditure 0.802*** 1.132***
Level of significance: *=10 percent, **=5 percent, ***=1 percent

Business and Economic Research ISSN 2162-4860
2014, Vol. 4, No. 1
www.macrothink.org/ber 296
Table 4 presents impact estimates disaggregated by the households’ asset wealth status (see Equation 3). The results indicate that the effect of asset-wealth on the relationship between SCTs and per capita consumption expenditure was significant only in the urban scheme of Chipata. By participating in the program, asset-poor households increased their food and non-food expenditure by 83 percent and 23 percent, respectively, more than they would have had they been less poor.
In general, wealth disparities tend to be greater in urban areas than in rural areas. That is, urban areas are expected to exhibit larger absolute differences between asset-poor and less poor households than rural areas. Therefore, it is not surprising that Chipata was the only one of the two schemes that exhibited significantly larger program effects among the poor than among the relatively less poor households. In this district, poorer beneficiary households were able to extract 23 percent more non-food program benefits than their relatively less poor counterparts.
Table 4. Heterogeneous impact of the SCT pilot schemes on consumption expenditure
Outcome variablea District
Chipata Kazungula Total expenditure among less poor households 0.504*** 0.800***
Additional impact on total expenditure for poor households 0.159 0.126 Food expenditure among less poor households -0.377 0.387**
Additional impact on food expenditure for poor households 0.827** 0.476 Non-food expenditure among less poor households 0.706** 1.052**
Additional impact on non-food expenditure for poor households 0.232* 0.192
Level of significance: *=10 percent, **=5 percent, ***=1 percent
aMeasured as natural logarithms of per capita values
5. Summary and Conclusions
This paper reports the relative impact of two spatially separated SCT schemes with design variations in Zambia. Descriptive results indicate that the SCT target households are truly incapacitated and highly vulnerable. Kazungula, the rural scheme, had as expected the poorest target group with household incomes just about a third of the levels observed in Chipata and almost half the daily number of meals taken by children. Impact results suggest that the SCT schemes are achieving their primary objective of improving immediate welfare, as indicated by their consistently positive impacts on per capita consumption expenditure. The greatest consumption effects were observed in Kazungula district, where the vulnerability levels were highest.
In conclusion, SCTs are an effective basic social protection tool in Zambia. However, expectations about their impact need to be tempered by program design and initial conditions. The significant wealth effects in Chipata seem to suggest that the program is meeting its primary objective of influencing the lives of the poorest. The greater aggregate consumption effects of the rural SCT scheme also seem to confirm, as expected, that eligible households in remote areas have lower welfare levels to start with. The lack of significant wealth effects in
Business and Economic Research ISSN 2162-4860
2014, Vol. 4, No. 1
www.macrothink.org/ber 297
Kazungula further suggests that the differences in poverty between the poor and the relatively less poor are less apparent in the rural areas. Future planning of similar interventions needs to take into account the implication of heterogeneity in impact when considering design, location and target groups.
Acknowledgements
This work was supported by the World Bank, the UK Department for International Development (DfID), the German Technical Assistance (GTZ), the United Nations Children Fund (UNICEF), and CARE International. CARE International collected the data used in this study. The authors would also like to thank Ric Goodman, Kelley Toole, Charlotte Harland, Sheila Nkunika, Melissa Gonzales-Brenes, Sebastian Martinez, Mirey Ovadiya, Caglayan Isik, Stuart Kenward, Stephen Devereux, and Ricardo Sabates for their suggestions and comments on the initial drafts of the project report, on which this paper is based. However, the views expressed herein do not necessarily represent the official positions of any of these organizations and/or individuals. All errors in interpretation are the authors’ own.
References
Becker, S. O., & Ichino, A. (2002). Estimation of Average Treatment Effects based on Propensity Scores. Stata Journal, 2, 358-77. http://www.stata-journal.com/sjpdf.html?articlenum= st0026.
Caliendo, M., & Kopeinig, S. (2008). Some Practical Guidance for the Implementation of Propensity Score Matching. Journal of Economic Surveys, 22, 31-72. http:dx.doi.org/10.1111/j.1467-6419.2007.00527.x
Cameron, C. A., & Trivedi, P. K. (2005). Microeconometrics: Methods and Applications. Cambridge: Cambridge University Press.
Daidone, S., Davis, B., Dewbre, J., Gonzalez-Flores, M., Handa, S., Seidenfeld, D., & Tembo, G. (2013). Out-of-Silo Effects of Social Cash Transfers: The Impact on Livelihoods and Economic Activities of the Child Grant Programme in Zambia. Paper submitted for presentation at the Oxford CSAE conference, Oxford, UK.
Filmer, D., & Pritchett, L. H. (2001). “Estimating Wealth Effects without Expenditure Data or Tears: An Application to Educational Enrollments of India.” Demography, 38(1), 115-132 .http:dx.doi.org/10.1353/dem.2001.0003
Gertler, P., Martinez, S., & M. Rubio-Codina. (2006). Investing Cash Transfers to Raise Long-Term Living Standards. Policy Research Working Paper 3994, Impact Evaluation Series Number 6, Washington DC: The World Bank. http://ssrn.com/abstract=926443
Handa, S., Peterman, A., Seidenfeld, D., & Tembo, G. (2013a). Income shocks and maternal health: Evidence from a national randomized social cash transfer program in Zambia. Unpublished manuscript.
Handa, S., Seidenfeld, D., & Tembo, G. (2012). The Impact of a Large Scale Poverty Targeted Cash Transfer Program on Time Preference. Unpublished manuscript.

Business and Economic Research ISSN 2162-4860
2014, Vol. 4, No. 1
www.macrothink.org/ber 298
Handa, S., Seidenfeld, D., Tembo, G., Prencipe, L., & Peterman, A. (2013b). Zambia's Child Grant Program: 24-Month Impact Report. Washington DC, USA: American Institutes for Research (AIR).
Hirano, K., Imbens, G. W., & Ridder, G. (2003). Efficient Estimation of Average Treatment Effects using the Estimated Propensity Score. Research Paper Number C02-13, USC Center for Law, Economics and Organization, University of Southern California Law School, Los Angeles, California.
Jalan, J., & Ravallion, M. (2003). Estimating the Benefit Incidence of an Antipoverty Program by Propensity Score Matching. Journal of Business and Economic Statistics, 21, 19-30. http:dx.doi.org/10.1198/073500102288618720
Leuven, E., & Sianesi, B. (2003). PSMATCH2: Stata Module to Perform full Mahalanobis and Propensity Score Matching, Common Support Graphing, and Covariate Imbalance Testing. http://ideas.repec.org/c/boc/bocode/s432001.html.
RHVP (Regional Hunger and Vulnerability Programme). (2007). Social Cash Transfers, Zambia. Regional Evidence Building Agenda (REBA) Case Study Brief Number 2. Johannesburg, RSA: RHVP. www.wahenga.net.
Rosenbaum, P., & Rubin, D. (1985). Constructing a Control Group using Multivariate Matched Sampling Methods that Incorporate the Propensity Score. American Statistician, 39, 33-38. http://dx.doi.org/10.1080/00031305.1985.10479383
Seidenfeld, D., Handa, S., Prencipe, L., Huang, C., Tembo, G., & Sherman, D. (2011). Results of the Three Year Impact Evaluation of Zambia's Cash Transfer Program in Monze District. Washington DC, USA: American Institutes for Research.
StataCorp. (2008). Stata Statistical Software: Release 10. College Station, TX: StataCorp LP.
Tembo, G., Freeland, N., Chimai, B., & Schuring, E. (2014). Social Cash Transfers and Household Welfare: Evidence from Zambia's Oldest Scheme. Applied Economics and Finance 1(1), 13-26. http://dx.doi.org/10.11114/aef.v1i1.354
Tembo, G. & Freeland, N. (2008). Impact of Social Cash Transfers on Household Welfare, Investment and Education. Lusaka, Zambia: Palm Associates Limited/MASDAR International Consultants.
Copyright Disclaimer
Copyright reserved by the author(s).
This article is an open-access article distributed under the terms and conditions of the Creative Commons Attribution license (http://creativecommons.org/licenses/by/3.0/).

Business and Economic Research ISSN 2162-4860
2014, Vol. 4, No. 1
www.macrothink.org/ber 299
Effectiveness of Loan Portfolio Management in Rural SACCOS: Evidence from Tanzania
Joseph John Magali
Dongbei University of Finance and Economics
P.O Box 116025, Hei Shi Jiao, Dalian, P.R China
Tel: 86-155-0428-1348 E-mail: [email protected]
Received: April 8, 2014 Accepted: April 22, 2014
doi:10.5296/ber.v4i1.5590 URL: http://dx.doi.org/10.5296/ber.v4i1.5590
Abstract
This article uses 496 loans from ABC rural SACCOS located in the Northern zone of Tanzania to describe the effectiveness of loan’s portfolio management. The data analysis is done by using the multivariate regression, descriptive and qualitative methods. The data for this study was collected at the end of May 2013. The findings reveal that women constituted 52.6% of the loan portfolio. Also the doubtful and bad loans were 51 and 31 million TZS which was more than 10% of the loan portfolio. The findings show loans were aged into 4 classes and the loans aging was not very effective because loans of different ages were classified in a single class. The results from the regression analysis reveal that the quality of loan portfolio was positively influenced by the loan size while the influence of gender and location of the borrowers were not significant. Moreover, ABC rural SACCOS used portfolio diversification, collateral, guarantors, letter from the village/ward government offices and the affidavit from the lawyer as credits risk mitigation techniques. The findings also revealed that fluctuation of the price of agricultural produce threatened the quality of loan portfolio. This article recommends that ABC rural SACCOS should seek the effective insurance services, use the effective software for loan portfolio management, search the market for agriculture produce, write off non repaid loans, enhance the repayment of overdue loans and revise the loan classes and maturity in order to improve the quality of the loan portfolio in the SACCOS.
Keywords: Loan portfolio Management, Rural SACCOS, Tanzania
1. Introduction
Savings and credits cooperatives societies (SACCOS) in Tanzania have been established since 1980s (Maghimbi 2010). Since their establishment SACCOS play important role in providing

Business and Economic Research ISSN 2162-4860
2014, Vol. 4, No. 1
www.macrothink.org/ber 300
the financial services in both rural and urban areas. Moreover, SACCOS are considered to be more important in rural area of Tanzania because they are semiformal financial institutions which serve many inhabitants in rural areas (Wangwe 2014). SACCOS also operate by focusing not only on the profit but also the welfare of members. SACCOS like any other cooperative work to maximize the welfare of members. In SACCOS members participate in setting the interest rates for loans in which members receive back later as dividends.
SACCOS in Tanzania are not only important for providing the capital to rural dwellers who were not previously served by the formal financial institutions but also contribute to overall economy of the country. Bwana and Mwakujonga (2013) stressed that SACCOS contribute to about 40% of the Tanzania’s GDP, act as employer for secondary school and college leavers and play important roles for financing small and medium enterprises in the rural areas. Hence many small and medium entrepreneurs are self employed in the rural areas because they have access to capital from the rural SACCOS. Likewise SACCOS provide opportunity to their clients both in rural and urban areas to save their money and hence work as rural banks (Qin and Ndiege 2013).
The government of Tanzania continues to promote SACCOS to enable them to perform their essential roles in Tanzania. The government has formulated various policies which help to sensitize the formation of many SACCOS in Tanzania especially in rural areas. At the end of March 2013, about 1,153,248 members joined 5,559 SACCOS (MOFT 2013). These members contributed 463.5 billion TZS of shares, savings and deposits. However, the literatures show that poor structures, corruption, theft, inadequate working capital, lack of innovation in business, high amount of overdue loans, poor leadership and poor corporate governance are the problems which limit the development of SACCOS in Tanzania (TFC 2006; Bibby 2006; Maghimbi 2010). Both Mwakajumilo (2011) and Magali (2013a) revealed that SACCOS in Tanzania face the problem of non-performing loans (NPL). The problem of NPL for SACCOS in Tanzania indicates poor loan portfolio which might be caused by various factors.
NPL in SACCOS usually occur because of inappropriate practices in credits risk management (Magali and Qiong 2014). Moreover, other factors such as weather, poor leadership and corporate governance might influence the quality of loan portfolio in the rural SACCOS (Magali 2014; Magali and Lang’ati 2014). In order to have lower number of NPL SACCOS need strategies for managing the risk of both individual loan and loan portfolio. Magali (2013b) revealed that poor credits risk management practices influence the credits default risks for rural SACCOS in Tanzania. Poor portfolio management also influences negatively the profitability of banks, SACCOS or MFIs (Rashid and Samad 1996; George et al 2013; Imeokpararia 2013; Magali 2013a). Thus, in order to increase their profitability, the rural SACCOS require effective loan portfolio management strategies. Other factors which influence effective loan portfolio management include management strategies, MFIs or banks’ staff competencies, choice of lending methodology and management information system (Derrick et al 1998; FCA 1998; OCC 1998; IACPM 2005; Crabb and Keller 2006).
Since the loan portfolio management determines profitability of MFIs, it also might determine their sustainability or operation efficiency. Therefore staffs concerned with the management of

Business and Economic Research ISSN 2162-4860
2014, Vol. 4, No. 1
www.macrothink.org/ber 301
loans in MFIs are required to monitor the loan portfolio regularly and examine the factors influencing the infectiveness of loans’ portfolio and act immediately to find solutions to the identified weakness. Inactive reaction of the loans staff to find solutions to the factors threatening the effectiveness of loan portfolio might lead to huge loss to the MFI since loan portfolio act as the life blood of the MFI. The literatures show that banks have structured loan portfolio management which is derived from Basel II accord. The Basel II accord guidelines also are applied by the central bank of different countries to formulate the regulatory practices for commercial banks operating in a particular country. For Example in Tanzania the loan portfolio management for the commercial banks are regulated by the Bank of Tanzania (Magali and Qiong 2014). However, the loan portfolio management practices for rural MFIs like rural SACCOS are not known because to the best of my knowledge there is no study done to disclose the information. Therefore this article analyses the effectiveness of loan portfolio management of one rural SACCOS located in Northern zone of Tanzania. I believe that if the rural SACCOS understand how to manage their loan portfolio well, they will improve their profitability, efficiency and sustainability and this is a motive for writing this article. The remaining part of the article is structured as follows: The following section covers the review of literatures where the loan portfolio management practice in banks and other MFIs is described. Then the methodology used to design this article will be presented and results and discussion of the data will follow. The last section covers the conclusion and recommendations based on the findings derived from the article.
2. Literature Review
2.1 Meaning of Loan Portfolio and Loan Portfolio Management
Business Dictionary (2014) defines a Loan portfolio as the total of all loans held by a bank or finance company on any given day. Therefore, individual loans form a loan portfolio in a bank or any other MFI. Moreover, the size of loan portfolio depends on the size the individual loan which is also influenced by the economic status of the borrowers in a particular location. IACPM (2005) asserted loan portfolio management is the process by which risks that are inherent in the credit process are managed and controlled while Wise Geek (2014) describe credit portfolio management as the process of building a series of investments based upon credit relationships and managing the risks involved with these investments. Therefore, credit portfolio management encompasses assessing the risk involved with each loan and then analyzing the total amount of risks for all loans. The major objective of portfolio management is to reduce the amount of loans default. Banks reduce the loan portfolio default risk by considering the credits repayment history of both individuals and groups applying for loans. This strategy also might be applied by MFIs and SACCOS to screen qualified clients applying for loans.
2.2 Characteristics of Effective Loan Portfolio Management
FCA (1998) asserted that effective loan portfolio management considers maximizing the lending opportunities which benefit both MFIs and clients. FCA (1998) listed strategic planning, lending policies and procedures, underwriting standards, risk identification, an internal credit review program or process and other internal control systems as elements of
Business and Economic Research ISSN 2162-4860
2014, Vol. 4, No. 1
www.macrothink.org/ber 302
effective loan portfolio management. The information from FCA indicates that effective loan portfolio management should integrate other functions in a financial institution. Thus a MFI will have effective loan portfolio management if it has effective management system and procedures.
IACPM (2005) stated that effective loan portfolio management function is vital for maintaining the bank safety and soundness. Therefore, banks should employ the qualified and competent staff who can identify risks associated with individual borrowers and all borrowers (the loan portfolio). The portfolio management staff should possess the fundamental credit handling experience, quantitative analytics skills and marketing skills and experiences in order to perform their tasks well. Moreover, the bank should design the stress testing measures to examine the vulnerability of portfolios loss due to unanticipated events. Effective portfolio management also might foster the performance and sustainability of MFIs and SACCOS.
According to OCC (1998) effective loan portfolio management process should integrate the basic principles of credit risk management such as sound underwriting, comprehensive financial analysis, adequate appraisal techniques, loan documentation practices and sound internal controls. Moreover, the nine elements which comprise the effective loan portfolio management include assessment of the credit culture, formulation of sound portfolio objectives and risk tolerance limits, effective management information systems, portfolio segmentation and risk diversification objectives, analysis of loans originated by other lenders, aggregate policy and underwriting exception systems, portfolios stress testing, independent and effective control functions and analysis of portfolio risk/reward tradeoffs. However, most of these techniques are applied in banks than in rural MFIs such as rural SACCOS (Magali and Qiong 2014).
Derrick et al (1998) argued that loan portfolio is the lifeblood of each lending institution, since the success of the MFI depends on how well it manages its portfolio. They recommended the agricultural lenders to consider the needs of different groups of their clients in order to remain competitive in the agricultural lending market. They further argued that reducing operating expenses, paper work and provision of the faster loans will strengthen the competitive advantage of MFIs which issue loans to farmers in USA. Moreover, they stressed that effective loan portfolio management identify and control lending risks.
Crabb and Keller (2006) found that group lending methodologies reduce the loans portfolio risk compared to individual loans lending. The same results were confirmed by Gómez and Santor (2008) for MFIs in Nova Scotia Canada, Diagne and Zeller (2001) and Simtowe and Zeller (2006) in Malawi, Ofuoku and Urang (2009) in Nigeria, Satgar (2003) for Grameen bank in Bangladesh and Al- Mamun et al (2011) in Malaysia. Similarly, Nawai and Shariff (2010) revealed that the group lending is effective loan portfolio management in their paper which reviewed the literatures describing the determinants of repayment performance in microcredit programs.
George et al (2013) found that the effective loan portfolio management had a direct influence on the profitability of the banks in Kenya. This is because banks and other MFIs depend on interest income as their revenue. Thus, effective loan portfolio management will make

Business and Economic Research ISSN 2162-4860
2014, Vol. 4, No. 1
www.macrothink.org/ber 303
borrowers to repay their loans on time and this will lead to increase of banks’ or MFIs revenue of which in turn will lead to increase of their profitability. Imeokpararia (2013) found that despite effective management of loan portfolio and credit function is fundamental for the banks to earn interest income as revenue, it has not affected the performance of banks in Nigeria. However, the findings further revealed banks generally failed to establish the effective lending policies and adequate credit administration procedures. Rashid and Samad (1996) revealed that profit maximization for USA banks between 1836 and 1863 which was considered as a period of free banking depended on successful portfolio management. They further asserted that portfolio choice influenced both risk and return of banks’ loans and other assets.
2.3 Factors Influencing the Loan Portfolio Management in Bank and MFIs
Brandt et al (n.d) argued the largest share of an MFI’s operating income is generated from the loan portfolio. They asserted income generated by the loan portfolio is affected by number of loans disbursed, number of active clients and the effective term for repaying the loan. They argued that higher default rate occurs because of setting inappropriate loan terms. Moreover, they argued that size of loan portfolio increases if the MFI has ability to retain clients. Furthermore, they recommended the convenient loan size with reasonable delinquency rate for promoting the repayment of loans from the MFIs clients. Usually the convenient loan size and delinquency rate depends on the financial strengths of the borrowers, borrowers’ repayment history and the risks associated with loans activities. Similarly, Magali (2013a) revealed that poor credits risk administration and poor credits risk management practices have led to decline of profitability of rural SACCOS in Tanzania.
Edimister and Srivastava (n.d) revealed that in banks regulatory framework is the one which influences the loan risks mostly. The findings further revealed that banks use insurance and diversification of loans portfolio as risk mitigation strategies. Similarly, Magali (2014) revealed the influence of leadership, corporate governance and regulation on credits risk management for rural SACCOS in Tanzania. Magali (2014) revealed that regulations affects the loan portfolio management because banks credits risk management in Tanzania were highly regulated by the bank of Tanzania and therefore banks were more profitable than rural SACCOS, of which their credits risk management functions were not regulated by the bank of Tanzania.
Wood (2004) asserted strategies that can optimize the portfolio value include diversification for reducing risk, having adequate sources of funding, balancing the mixture of assets to provide growth and to operate efficiently so as to optimize the cash flow. These strategies can be applied by MFIs and SACCOS to optimize their loan portfolio. However, MFIs should be keen in loans processing and recovery in order to have the adequate funding. External loans as source of loan portfolio is recommended only if the MFI and the rural SACCOS can enhance the repayment of loans from clients. Moreover, diversification of loan portfolio might be used as loans default risk mitigation strategies for MFIs as recommended by Moti et al (2012).
Rossi et al (2009) found that despite the loan portfolio diversification strategy for the large Australian banks negatively affected the cost efficiency; it increased the profit efficiency, reduced the banks’ risk and hence increased the banks’ capital. David and Dionne (2005) found

Business and Economic Research ISSN 2162-4860
2014, Vol. 4, No. 1
www.macrothink.org/ber 304
that due to practical complexities in diversifying loan portfolio in geographical locations and industries, the banks in Sweden didn’t diversify the loan portfolio because it occurred naturally. The banks believe that the portfolio diversification occurred naturally because there are always good companies in all industries. The study further revealed that some clients defaulted their loans because of leniency procedures in loans processing and appraisal. Increasing the amount of Non Performing Loans (NPL) implies that the MFI or bank has poor portfolio management. Khemraj and Pasha (2014) examined the determinants of NPL for banks in Guyana-South America. The findings from the study revealed appreciation in the local currency increases NPL while the increase of GDP lowers the NPL. The findings further revealed that higher interest rates and lending large amount of loans increases the NPL. However, their study revealed no difference in NPL amount between the large and small banks. Similarly, Magali and Qiong (2014) found the rural SACCOS in Tanzania had bad portfolio with large number of NPL because of poor loan portfolio management. Compassionateness in loans follow-up and inadequate skills in loan portfolio management were the reasons for loans defaults and poor portfolio for rural SACCOS in Tanzania.
Afroz (2013) declared that in order to manage the loan portfolio well in Bangladesh Krishi Bank diversified its credit portfolio among various groups of poor farmers who are engaged in horticulture, dairy, fishery, poultry, sericulture, tea plantation, irrigation equipment, farm machinery, processing and marketing of agricultural or fish produce, employment generation and poverty alleviation programs. In order to run the lending activities successfully, the study recommended the employment of graduates who can handle the portfolio management functions and train farmers on entrepreneurship. Moreover, Wenner et al (2007) reported that MFIs in Latin America applied the portfolio limit as credits risk mitigation technique. The findings asserted that less than 40% portfolio limit for agricultural loans helped the MFIs in Latin America to have good loan portfolio.
Mileris (2012) found that the quality of loan portfolio in banks is influenced by macroeconomic factors such as GDP, inflation, interest rates, money supply, industrial production index, current account balance and others. These factors also might influence the portfolio quality in SACCOS and other MFIs. Tadele and Rao (2014) revealed that deterioration of loan portfolio for MFIs in Andhra Pradesh in India was caused by loans disbursement without taking into account borrowers’ repayment capacity, non diversification of loans portfolio, poor record keeping, accounting and management information systems, lack of staff control and corruption. Aballey (2009) revealed that huge bad loans portfolio for African Development Bank (ADB) in Ghana was largely caused by ineffective loan monitoring and poor credit selection. The study recommended training, effective loan monitoring, effective collateral, establishment of agriculture infrastructural facilities and use of credit bureaus as strategies for reducing the bad loans and improving the quality of loan portfolio for ADB in Ghana. Haas et al (2010) revealed that determinants of effective loan portfolio for banks in 20 transition countries were ownership styles, size and legal protection of creditors. Lagat et al (2013) found that credits’ risk identification, analysis, monitoring, evaluation and mitigation influenced the lending portfolio for SACCOS’ in Kenya.

Business and Economic Research ISSN 2162-4860
2014, Vol. 4, No. 1
www.macrothink.org/ber 305
FAO (n.d) argued that loan portfolio risk depends on the individual loans risks. For farmers changes of prices of inputs and output might influence famers not to repay the loans and hence deteriorate the loan portfolio. Likewise, FAO asserted that high fluctuation of inputs and output prices restrict farmers to properly project the profitability of the farming activities. Moreover, FAO listed the regional, sector/product and loan concentration risks as the three main categories of risks which affect the loan portfolio for agriculture based MFIs. Factors which influence regional risk include microclimate which is a big challenge for the rural SACCOS in Tanzania because majority of clients (more than 80%) allocate loans in agriculture production and they depend on rain fed agriculture. According to Magali (2013b), other factors which influence loan portfolio in Tanzania are non performance of business, loan diversion and loans mismatch (loans disbursed beyond management capacities of the borrowers or without adhering to the internal regulations).
3. Methodology
The paper analyzes data obtained from one rural SACCOS located in northern zone of Tanzania. For the sake of anonymity, I rename it as ABC rural SACCOS. The ABC rural SACCOS had more than 15 years of operating experience. Moreover, the SACCOS had 3567 (1375 male, 1934 female and 258 groups) members at the end of May 2013. This study applies the loan portfolio of ABC SACCOS consisting of 496 borrowers to describe the effectiveness of loan portfolio management. The data analysis is done by using the multivariate regression, descriptive and qualitative methods. The data for this study were collected at the end of May 2013 and data was analysed using SPSS version 16 where the effectiveness of techniques used to manage the loan portfolio in the ABC rural SACCOS was fully examined.
4. Results and Discussion
4.1 Portfolio Composition
The portfolio composition in gender is represented in Table 1. The findings show that the male borrowers were 46.4% while the female borrowers were 52.6% and the group borrowers were 1%. The findings indicate that female borrowers were more sensitized to borrow in a rural SACCOS than male borrowers. The findings are in tandem with Girabi and Mwakaje (2013) who revealed that male and female borrowers in rural SACCOS in Iramba district in Singida region-Tanzania were 46.5% and 53.5% correspondingly. However, the findings are contrary with Magali (2013b) who revealed that that 58% and 42% of the borrowers for rural SACCOS in Morogoro, Dodoma and Kilimanjaro regions in Tanzania were male and female respectively. The findings indicate that the outreach of the rural SACCOS was reasonable since the portfolio consisted of more females. The findings are consistent with Onumah and Acquah (2011) who revealed that percentage of women clients for MFIs increase from 25-47% in Ghana. The findings show that there were few groups in the loan portfolio which was 1% of the total loan portfolio.
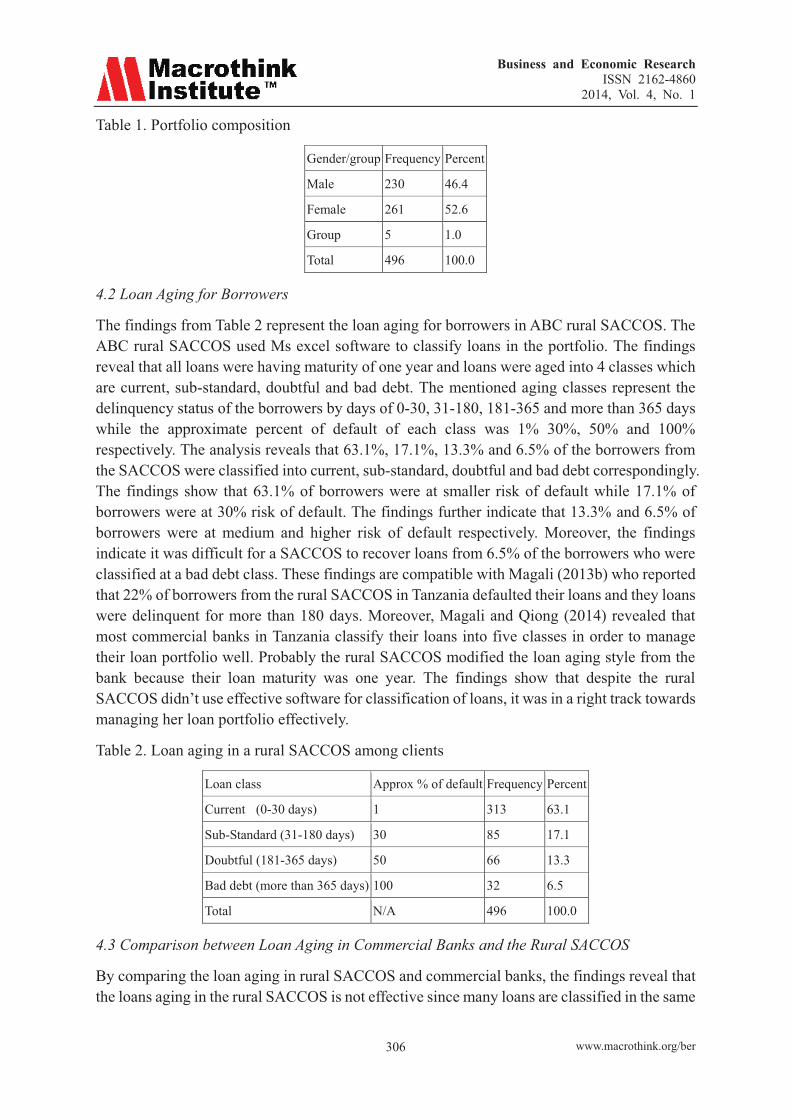
Business and Economic Research ISSN 2162-4860
2014, Vol. 4, No. 1
www.macrothink.org/ber 306
Table 1. Portfolio composition
Gender/group Frequency Percent
Male 230 46.4
Female 261 52.6
Group 5 1.0
Total 496 100.0
4.2 Loan Aging for Borrowers
The findings from Table 2 represent the loan aging for borrowers in ABC rural SACCOS. The ABC rural SACCOS used Ms excel software to classify loans in the portfolio. The findings reveal that all loans were having maturity of one year and loans were aged into 4 classes which are current, sub-standard, doubtful and bad debt. The mentioned aging classes represent the delinquency status of the borrowers by days of 0-30, 31-180, 181-365 and more than 365 days while the approximate percent of default of each class was 1% 30%, 50% and 100% respectively. The analysis reveals that 63.1%, 17.1%, 13.3% and 6.5% of the borrowers from the SACCOS were classified into current, sub-standard, doubtful and bad debt correspondingly. The findings show that 63.1% of borrowers were at smaller risk of default while 17.1% of borrowers were at 30% risk of default. The findings further indicate that 13.3% and 6.5% of borrowers were at medium and higher risk of default respectively. Moreover, the findings indicate it was difficult for a SACCOS to recover loans from 6.5% of the borrowers who were classified at a bad debt class. These findings are compatible with Magali (2013b) who reported that 22% of borrowers from the rural SACCOS in Tanzania defaulted their loans and they loans were delinquent for more than 180 days. Moreover, Magali and Qiong (2014) revealed that most commercial banks in Tanzania classify their loans into five classes in order to manage their loan portfolio well. Probably the rural SACCOS modified the loan aging style from the bank because their loan maturity was one year. The findings show that despite the rural SACCOS didn’t use effective software for classification of loans, it was in a right track towards managing her loan portfolio effectively.
Table 2. Loan aging in a rural SACCOS among clients
Loan class Approx % of default Frequency Percent
Current (0-30 days) 1 313 63.1
Sub-Standard (31-180 days) 30 85 17.1
Doubtful (181-365 days) 50 66 13.3
Bad debt (more than 365 days) 100 32 6.5
Total N/A 496 100.0
4.3 Comparison between Loan Aging in Commercial Banks and the Rural SACCOS
By comparing the loan aging in rural SACCOS and commercial banks, the findings reveal that the loans aging in the rural SACCOS is not effective since many loans are classified in the same
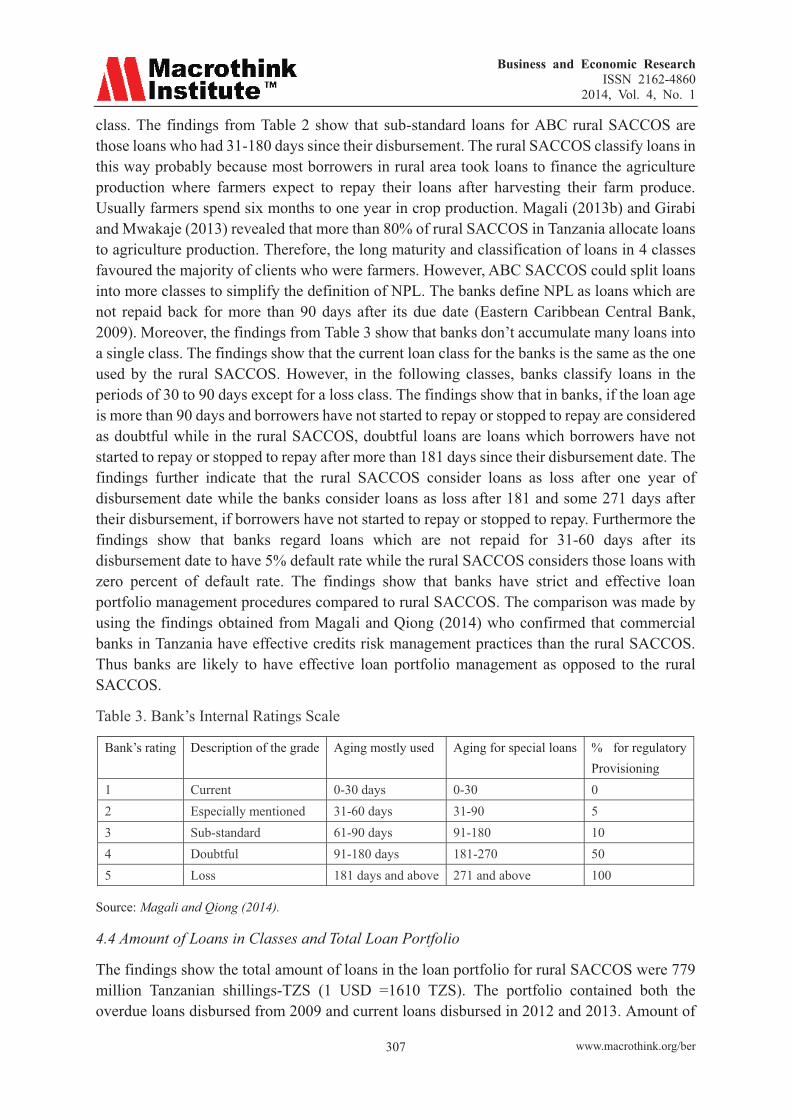
Business and Economic Research ISSN 2162-4860
2014, Vol. 4, No. 1
www.macrothink.org/ber 307
class. The findings from Table 2 show that sub-standard loans for ABC rural SACCOS are those loans who had 31-180 days since their disbursement. The rural SACCOS classify loans in this way probably because most borrowers in rural area took loans to finance the agriculture production where farmers expect to repay their loans after harvesting their farm produce. Usually farmers spend six months to one year in crop production. Magali (2013b) and Girabi and Mwakaje (2013) revealed that more than 80% of rural SACCOS in Tanzania allocate loans to agriculture production. Therefore, the long maturity and classification of loans in 4 classes favoured the majority of clients who were farmers. However, ABC SACCOS could split loans into more classes to simplify the definition of NPL. The banks define NPL as loans which are not repaid back for more than 90 days after its due date (Eastern Caribbean Central Bank, 2009). Moreover, the findings from Table 3 show that banks don’t accumulate many loans into a single class. The findings show that the current loan class for the banks is the same as the one used by the rural SACCOS. However, in the following classes, banks classify loans in the periods of 30 to 90 days except for a loss class. The findings show that in banks, if the loan age is more than 90 days and borrowers have not started to repay or stopped to repay are considered as doubtful while in the rural SACCOS, doubtful loans are loans which borrowers have not started to repay or stopped to repay after more than 181 days since their disbursement date. The findings further indicate that the rural SACCOS consider loans as loss after one year of disbursement date while the banks consider loans as loss after 181 and some 271 days after their disbursement, if borrowers have not started to repay or stopped to repay. Furthermore the findings show that banks regard loans which are not repaid for 31-60 days after its disbursement date to have 5% default rate while the rural SACCOS considers those loans with zero percent of default rate. The findings show that banks have strict and effective loan portfolio management procedures compared to rural SACCOS. The comparison was made by using the findings obtained from Magali and Qiong (2014) who confirmed that commercial banks in Tanzania have effective credits risk management practices than the rural SACCOS. Thus banks are likely to have effective loan portfolio management as opposed to the rural SACCOS.
Table 3. Bank’s Internal Ratings Scale
Bank’s rating Description of the grade Aging mostly used Aging for special loans % for regulatory Provisioning
1 Current 0-30 days 0-30 0 2 Especially mentioned 31-60 days 31-90 5 3 Sub-standard 61-90 days 91-180 10 4 Doubtful 91-180 days 181-270 50 5 Loss 181 days and above 271 and above 100
Source: Magali and Qiong (2014).
4.4 Amount of Loans in Classes and Total Loan Portfolio
The findings show the total amount of loans in the loan portfolio for rural SACCOS were 779 million Tanzanian shillings-TZS (1 USD =1610 TZS). The portfolio contained both the overdue loans disbursed from 2009 and current loans disbursed in 2012 and 2013. Amount of

Business and Economic Research ISSN 2162-4860
2014, Vol. 4, No. 1
www.macrothink.org/ber 308
outstanding loans were 567 million TZS which were 72.79% of the loan portfolio while the amount of repaid loans was 222 million TZS which were 27.21% of the loan portfolio. The analysis further reveals that loans which borrowers started to repay within 0-30 days was 57.15% of the loan portfolio while loans aged 31-180 days, 181-365 days and more than 365 days were 5.14%, 6.5% and 3.94% of the loan portfolio respectively. Generally the findings indicate that the repayment performance was fairly convincing. However, the ABC SACCOS needs to persuade other borrowers to repay their loans so as to increase the repayment rate. The findings show that more than 10% of the loans were non-performing and hence were having high probability of default. The amount of doubtful and bad debt loans which borrowers have not started to repay or stopped to repay for more than six month was 82 million TZS. The percentage of loans which were classified as bad debts was 3.94% which is compatible with the percentage which is recommended by commercial banks in Tanzania.
Magali and Qiong (2014) revealed that commercial banks in Tanzania have strategies to have NPL less than 5%. However, the findings from this article reveal that ABC SACCOS were operating inefficiently because it incurred higher costs of operations. The data from the SACCOS show that in 2011 the SACCOS incurred the operating costs of 75 million TZS and it incurred loss of 2 million TZS while in 2012 it incurred the costs of 117 million TZS and it earned the profit of 12 million TZS (Magali and Lang’ati 2014). The findings from this study are in tandem with Karumuna and Akyoo (2011) and Magali (2013b) who revealed that amount of overdue loans from rural SACCOS in Tanzania are higher.
Table 4. Amount of Loans in loan classes and total loan portfolio
Loans Amount in million TZS As % of Total Loans
Total disbursed 779 100
Amount outstanding 567 72.79
Amount repaid 222 27.21
Current (0-30 days) 445 57.15
Sub-Standard (31-180 days) 40 5.14
Doubtful (181-365 days) 51 6.50
Bad debt (more than 365 days) 31 3.94
4.5 Factors Influencing Loan Portfolio Management in the ABC Rural SACCOS
4.5.1 Location of Borrowers
The findings reveal that apart from having borrowers near the SACCOS, other borrowers were found in more than 10 locations far from the SACCOS. The findings from Table 5 show that borrowers located near and far from SACCOS comprised of 42.9% and 57.1% of all borrowers respectively. The findings indicate that more borrowers were located far from the SACCOS. However, the findings from regression analysis in Table 7 show that the influence of location in effectiveness of loan portfolio management which is measured by the amount of loans repaid was not significant. It implies that factors that hindered borrowers from repaying their loans affected all borrowers regardless of their locations. Contrary to these findings, Trà and Lensink

Business and Economic Research ISSN 2162-4860
2014, Vol. 4, No. 1
www.macrothink.org/ber 309
(n.d) revealed that informal and semi-formal borrowers located in urban areas had higher probability of loans default in Vietnam, implying that location influenced the effectiveness of loan portfolio management.
Table 5. Location of the borrower
Location of a borrower Frequency Percent
Near from SACCOS 213 42.9
Far from SACCOS 283 57.1
Total 496 100.0
4.5.2 Individual and Group Loans
The findings reveal that the minimum amount of group loan was 400,000 TZS while the maximum loan was 9 million TZS while the findings from Table 6 shows that the minimum and maximum loan for individual borrowers was 50,000 and 30 million TZS respectively. The findings indicate that the maximum loan for individual borrowers was very higher compared to group loan. Probably the SACCOS had recognized that lending groups results in non-repayment of loans. The findings from Table 1 also show that the SACCOS lent to only 5 groups which was 1% of the loan portfolio. The findings are contrary to various scholars who recommended the group lending for effective loan portfolio management in MFIs (Crabb and Keller 2006; Simtowe and Zeller 2006; Al- Mamun et al 2011). The findings further revealed that groups also defaulted their loans like individuals. This happened probably because the group did not use social cohesion as a collateral and guarantor as used in Grameen bank (Satgar 2003). The findings from Table 6 further reveal that the minimum amount of repaid loan for individual borrowers was 0, implying that some borrowers did not start to repay their loan while the maximum amount was 27.5 million TZS. Similarly, the minimum and maximum amount of remaining loan was 600 and 22.6 million TZS respectively. Moreover, the minimum loan age ranged from 0.17 years (2 months) to 4.17 years (4 years and 2 months). The findings indicate that the rural SACCOS had no strategies to write-off the loans which stayed for long time without being repaid. For example the loan with 4 years and 600 TZS amount was supposed to be written off, because 600 TZS was too small for it to remain in a loan portfolio.
4.5.3 Education of the SACCOS’ Staff and Loan Portfolio Management
The findings reveal that the chairman of the board was having the primary education while the clerk, the manager, chairperson loan committee and the loan officer were having the secondary education. The findings imply that SACCOS’ staff responsible for the management of loan portfolio management possessed the minimum qualifications which might help them to perform the loan portfolio management functions. However, IACPM (2005) asserted that effective management of portfolio requires staff with quantitative analytics skills. Hence it is recommended that the SACCOS should develop staff by allowing them to attend long term training so as to acquire the needed skills. Moreover, portfolio management requires staff with honesty and integrity. Hence education alone is not enough to enhance the effective portfolio management in the rural SACCOS. Magali (2013c) found that education of the SACCOS staff
Business and Economic Research ISSN 2162-4860
2014, Vol. 4, No. 1
www.macrothink.org/ber 310
influence the loan default risk negatively. It implies that higher level of education of the staff involved in loan management accelerated default risk and thus leads to deterioration of loan portfolio management in rural SACCOS. Moreover, Magali and Lang’ati (2014) revealed that low education was not a limiting factor for the performance of the best rural SACCOS in Tanzania.
4.5.4 Credits Risk Management and Loan Portfolio Management
As confirmed by OCC (1998), effective loan portfolio can be enhanced with effective credits risk management. The findings reveal that there were no insurance services for covering the loans against risks such as erratic weather and other unanticipated events. Presence of insurance services in rural MFIs has been recommended by various scholars as a strategy for maintaining the quality of loan portfolio (FunHo and Yusoff 2005; Mustafa et al 2007; Moti et al 2013; Lagat et al 2013). Instead of using insurance, the SACCOS diversified its portfolio and issued loans to borrowers of different financial capabilities and for different purposes to control credit risk. The portfolio consisted of borrowers with low, moderate and higher income where the loans amount issued ranged from 50,000 to 30 million TZS as shown in Table 6. Most loans were medium sized loans which ranged from 100,000 to 800,000 TZS. Moreover, the SACCOS issued loans to both individuals and groups and various activities were considered for loans. The types of loans issued by the rural SACCOS include agricultural, business, social and education loans. Diversification of loans portfolio was also recommended by Atieno (2001), Wenner (2010) and Lagat et al (2013).
The SACCOS also used the collateral and 3 guarantors including the spouse of the borrowers as portfolio management strategies. Furthermore, the SACCOS demanded from the borrowers the letter of introduction from the village or ward village offices and the letter of residence confirmation from an advocate or magistrate. The SACCOS confirmed to make follow-up of overdue loans to the homes of borrowers. The SACCOS also invited in the SACCOS office borrowers with overdue loans for conversation. During the conversation the borrowers stated the reasons for default and pledged the repayment of their loans and many defaulters repaid their loans by using this strategy. SACCOS’ leaders reported that two defaulters who were not willingly to repay their loans through normal procedures, repaid their loans amounted 2.5 million TZS through the court action. The SACCOS also confirmed that there were some cases where the SACCOS sold the collateral of the defaulters to recover the defaulted loans. However, Magali (2013b) revealed that the use of collateral to recover the loan is not an effective strategy for the rural SACCOS because collateral are not valued legally and seemed to be difficult to sell collateral such as residential house to repay the overdue loans. Moreover, Evers et al (2000) recommended that the court action should be the last means to be used by MFIs in forcing borrowers to repay their loans because it has negative impacts on both the MFIs and borrowers. The SACCOS management stated that borrowers reported that they failed to make on time loans repayment because of poor business performance and low price of agriculture produce where farmers experience the drop of paddy price per bag from 70,000 TZS in 2012 to 20,000 TZS in 2013. FAO (n.d) confirmed that changes in prices of agricultural inputs and outputs might lead to deterioration of loans portfolio because it will restrain farmers not to repay their loans.

Business and Economic Research ISSN 2162-4860
2014, Vol. 4, No. 1
www.macrothink.org/ber 311
4.5.5 Size of Loan, Gender and Loan Age
The findings from regression analysis in Table 7 indicate that the specified variables fit the equation where the adjusted R-square and F-statistics are 0.504 and 143.555 respectively. The regression equation was constructed to examine the influence of loan size, gender, location and age on the quality of portfolio management. The quality of loan portfolio is measured by the amount of loan repaid. The findings from the regression analysis show that the size of loan positively influences the quality of loan portfolio. It implies the repayment performance was higher for loans with larger size. The findings are contrary with Magali (2013b) who found that the loans default risk for rural SACCOS in Tanzania was higher for loans with large size. The findings from Table 7 further reveal that the influence of gender and location on the quality of loan portfolio for ABC rural SACCOS was not significant. Magali (2013b) also revealed that the influence on gender on loan default risk for the rural SACCOS in Tanzania was not significant.
Table 6. Age and loans quantative information
Variable (s) N Minimum Maximum Mean Loan age (Years) 496.00 0.17 4.17 0.76 Loan issued (TZS) 496.00 50,000.00 30,000,000.00 1,625,237.10 Loan repaid (TZS) 496.00 0.00 27,500,000.00 500,308.36 Remaining loan (TZS) 496.00 600.00 22,562,500.00 1,129,430.75
Table 7. Estimated Value of Regression Coefficients
Independent variables Estimated value of Beta coefficient t-value Dummy of Gender 0.005** 0.130 Dummy of location 0.021** 0.577 Log Loan amount 0.742* 20.192 Value of R2 0.553 - Adjusted R2 0.504 - Value of F 143.555* Durbin Watson 1.987 - Mean VIF 1.052 Standard Error of Estimate 0.414 -
*Significant at 1% level; **Not significant
4.6 Testing Multivariate Regression Assumptions
I test the assumption of multivariate regression results to examine the presence of multicollinearity, heteroscedasticity and autocorrelation of among the independent variables specified in the regression model as recommended by Gujarat and porter (2010). The findings from the test are found in the appendix. The findings reveal that the mean Variance Inflation Factors (VIF) is 1.052 which is recommended for acceptance of results because it is less than 10. This confirms that there is no serious problem of multicollinearity among the variables. Moreover, the Durbin Watson (DW) coefficient which tests the occurrence of autocorrelation

Business and Economic Research ISSN 2162-4860
2014, Vol. 4, No. 1
www.macrothink.org/ber 312
among variables is 1.987 which is approximately equals to 2.0 confirming that there is no autocorrelation problems in the model. I abide with Gupta (1999) and Gujarat and Porter’s (2010) recommendation regarding the testing of the existence of heteroscedasticity in the multivariate regression model by using the White test. I compare the coefficients of which chi square calculated, NXR2 �0.504*496=249.984 at 0.05 significance level which is less than (chi square) �2(496) = 553.127 tabulated. Therefore, I confirm that the there is no problems of heteroscedasticity in the multivariate regression model.
5. Conclusion and Recommendations
The findings indicate that women constituted 52.6% of the total loan portfolio. Also the doubtful and bad loans were 51 and 31 million TZS summing to 82 million TZS which was more than 10% of the loan portfolio. Therefore, the ABC rural SACCOS should devise strategies to improve the quality of the loan portfolio. The findings show that loan aging in ABC SACCOS was not very effective because loans of different age were classified in a single class. The results from the regression analysis reveal that the quality of loan portfolio was positively influenced by the loan size while the influence of gender and location of the borrowers were not significant. The findings further reveal that groups loan were only 1% of the loan portfolio and the individual loans were of larger size compared to group loan and both individuals and groups defaulted their loans. Moreover, ABC SACCOS used portfolio diversification, collateral, guarantors, letter from the village/ward government offices and affidavit from the lawyer as credits risk or mitigation techniques. However, the findings reveal that there were no insurance services which could help to reduce the risk of loans default and maintain the quality of loan portfolio. The findings also revealed that fluctuation of the price of agricultural produce acted as threat for maintaining the quality of loan portfolio in ABC rural SACCOS.
This article recommends that ABC SACCOS should seek the insurance coverage services (Especially crop insurance since majority of the clients engage in agriculture production). Also other effective types of insurance such as business and vehicle insurances should be introduced. The ABC rural SACCOS also should use the effective software for effective loan portfolio management, search the market for agriculture produce and practice warehouse receipt system or contract farming, should write off loans which borrowers have no ability to repay, enhance the repayment of overdue loans, and revise the loan classes and maturity for different types of loans.
References
Aballey, F. B. (2009). Bad Loans Portfolio: The Case of ADB. Unpublished MBA Thesis, Kwame Nkrumah University of Science and Technology.
Afroz, N. N. (2013). Credit Portfolio Management of Bangladesh Krishi Bank. Global Journal of Management and Business Research Administration and Management, 13(12), 15-20.
Al- Mamun, A., Wahab, S. A., Malarvizhi, C. A., & Mariapun, S. (2011). Examining the Critical Factors Affecting the Repayment of Microcredit. Provided by Amanah Ikhtiar Malaysia. International Business Research, 4(2), 93-102.

Business and Economic Research ISSN 2162-4860
2014, Vol. 4, No. 1
www.macrothink.org/ber 313
http://dx.doi.org/10.5539/ibr.v4n2p93.
Atieno, R. (2001). Formal and Informal Institutions’ Lending Policies and Access to Credit by Small-Scale Enterprises in Kenya: An empirical assessment. AERC Research Paper 111, African Economic Research Consortium, Nairobi, November, 2001.
Bibby, A. (2006). Tanzania’s Cooperatives Look to the Future. Retrieved from, http://www.andrewbibby.com/pdf/Tanzania.pdf (Accessed 26/02/2014).
Brandt, L., Epifanova, N. & Kamornikov, S. (n.d). Financial Management for Microfinance Organizations. Retrieved from: www.depts.washington.edu/mfinance/eng/curriculum/docs/51_financialmanagment.doc. (Accessed 21/03/2014).
Business Dictionary (2014). Loan Portfolio. Retrieved from: http://www.businessdictionary.com/definition/loan-portfolio.html#ixzz2wb2vY2OU (Accessed 21/03/2014).
Bwana, K. M., & Mwakujonga, J. (2013). Issues in SACCOS Development in Kenya and Tanzania: The Historical and Development Perspectives. Developing Country Studies, 3(5), 114-121.
Crabb, P. R., & Keller, T. (2006). A Test of Portfolio Risk in Microfinance Institutions. Faith & Economics, 47/48-Spring/Fall, 25-39.
David, C., & Dionne, C. (2005). Banks’ Loan Portfolio Diversification. Unpublished Master’s and Bachelor’s Thesis in Industrial and Financial Economy School of Economics and Commercial Law at the University of Gothenburg, Sweden.
Derrick, T. H., Peterson, L., & Premschak, C. (1998). Loan Portfolio Management. Retrieved from: http://www.fca.gov/Download/lpmfortheweb.pdf. (Accessed 20/03/2014).
Diagne, A., & Zeller, M. (2001). Access to Credit and Its Impact on Welfare in Malawi. International Food Policy Research Institute, Washington, D.C, Research Report 116.
Eastern Caribbean Central Bank (2009). Guidelines on Credit Risk Management for Institutions Licensed To Conduct Banking Business under the Banking Act, BSD 370393v2. Retrieved from: www.eccb-centralbank.org/PDF/Credit_Risk.pdf. (Accessed 02/04/2014)
Edimister, R. O., & Srivastava, S. C. (n.d). Loan Portfolio Composition and Management Control of Bank Risk: An Empirical Investigation. Journal of Applied Business Research, 9(1), 119-131.
FAO/RFLC (n.d). Agricultural Lending -Self Study Guide for Loan Officers: Lesson Eight-Loan Portfolio Management. Retrieved from: http://www.ruralfinance.org/fileadmin/templates/rflc/documents/1180354858092_AgLend_Lesson8.pdf. (Accessed 21/03/2014).
Business and Economic Research ISSN 2162-4860
2014, Vol. 4, No. 1
www.macrothink.org/ber 314
Farm Credit Administration (FCA 1998). Loan Portfolio Management. Retrieved from:http://www.fca.gov/examman.nsf/c63e1333b36d61fa852561ff00477356/de53764fc6507c9c852561cd005246cc?OpenDocument. ( Accessed 21/03/2014).
FunHo, S. K., & Yusoff, N. T. (2005). A Preliminary Study of Credit Risk Management in Malaysia, Jurnal Pengurusan, 28, 45-65.
George, G. E., Miroga, J. B., Ngaruiya, N. W., Mindila, R., Nyakwara, S., Mobisa, M. J., Ongeri J., Mandere, E. N., & Moronge, M. O. (2013). An Analysis of Loan Portfolio Management on Organization Profitability: Case of Commercial Banks in Kenya. Research Journal of Finance and Accounting, 4(8), 24-35.
Girabi, F., & Mwakaje, A. E. G. (2013). Impact of Microfinance on Smallholder Farm Productivity in Tanzania: The Case of Iramba District. Asian Economic and Financial Review, 3(2), 227-242.
Gómez, R., & Santor, E. (2008). Does the Microfinance Lending Model Actually Work? The Whitehead Journal of Diplomacy and International Relations, Summer/Fall 2008, 37-56.
Gujarat, D. N., & Porter, C. P. (2010). Basic Econometrics, Fifth Edition. McGraw-Hill Company and China Renmin University Base.
Gupta, V. (1999). SPSS for Beginners. A Vijay Gupta Publication inc. Retrieved from:http://www.upch.edu.pe/facien/fc/dbmbqf/zimic/ubioinfo/bks/Bioestadistica/Spss%20Manuals/ (Accessed 05/04/2014).
Haas, R., Ferreira, D., & Taci, A. (2010).What Determines The Composition Of Banks’ Loan Portfolios? Evidence From Transition Countries. Journal of Banking & Finance 34, 388–398.
http://dx.doi.org/10.1016/j.jbankfin.2009.08.005.
Imeokpararia, L. (2013). The Effect of Loan Management on Performance of Nigerian Banks. The International Journal of Management, 2(1), 1-21.
Kaggwa, N. S. (2013). Interest Rates and Loan Portfolio Performance in Commercial Banks. A case study of Centenary Bank, Entebbe Road Branch Uganda. Unpublished Master’s Thesis in International Business Management. Lahti University of Applied Sciences.
Khemraj, T., & Pasha, S. (2014). The Determinants of Non-Performing Loans: An Econometric Case Study of Guyana. MPRA Paper No. 53128.
Lagat, F. K., Mugo, R., & Otuya R. (2013). Effect of Credit Risk Management Practices on Lending Portfolio Among Savings and Credit Cooperatives in Kenya. International journal of Science Commerce and Humanities, 1(5), 93-105.
Magali, J. J., & Lang’at, J. K. (2014). Impacts of Corporate Governance on Efficiency and Sustainability of the Best Rural SACCOS in Tanzania. Global Journal of Commerce & Management Perspective, 3(2), 1-8.

Business and Economic Research ISSN 2162-4860
2014, Vol. 4, No. 1
www.macrothink.org/ber 315
Magali, J. J. (2013a). The Impacts of Credits Risk Management on Profitability of Rural Savings and Credits Cooperative Societies (SACCOS): The Case Study of Tanzania. International Journal of Management Sciences and Business Research, 2(12), 62-77.
Magali, J. J. (2013b). Factors Affecting Credit Default Risks For Rural Savings and Credits Cooperative Societies (SACCOS) in Tanzania. European Journal of Business and Management, 5(32), 60-73.
Magali, J. J. (2013c). The Influence of Rural Savings and Credits Cooperatives Societies (SACCOS’) Variables on Loans Default Risks: The Case Study of Tanzania. Research Journal of Finance and Accounting, 4(19), 77-91.
Magali, J. J. (2014). The Influence of Leadership, Corporate Governance and Regulations on Credit Risk Management: The Study of Rural SACCOS from Tanzania. Management and Administrative Sciences Review, 3(2), 262-281.
Magali, J. J., & Qiong, Y. (2014). Commercial Banks Vs Rural SACCOS Credits Risk Management Practices in Tanzania. Journal of Economics and Sustainable Development, 5(2), 33-45.
Maghimbi, S. (2010). Cooperatives in Tanzania mainland: Revival and growth. CoopAFRICA Working Paper No.14. Series on the status of cooperative development in Africa. International Labour Organization Office in Dar es Salaam, Tanzania.
Mileris, R. (2012). Macroeconomic Determinants of Loan Portfolio Credit Risk in Banks. Inzinerine Ekonomika-Engineering Economics, 23(5), 496-504. http://dx.doi.org/10.5755/j01.ee.23.5.1890.
Ministry of Finance, Tanzania (MOF 2013). Speech by the Minister for Finance Hon. Dr. William Augustao Mgimwa (Mp). The Estimates of Government Revenue and Expenditure for the Fiscal Year 2013/14.
Moti, H, O., Masinde, J. S., & Mugenda, N. G. (2012). Effectiveness of Credit Management System on Loan Performance: Empirical Evidence from Micro Finance Sector in Kenya. International Journal of Business, Humanities and Technology, 2(6), 99-108.
Mwakajumilo, S. L. I. (2011). The Role of Informal Microfinance Institutions in Saving Mobilization, Investment and Poverty Reduction. A Case of Savings and Credit Cooperative Societies (SACCOS) in Tanzania from 1961-2008. Unpublished Doctoral Thesis, St. Clements University.
Nails, D. (2010). Loan Review: A Critical Element of Effective Portfolio Risk Management. Retrievedhttp://www.cdfifund.gov/what_we_do/resources/OFN%20Loan%20Review%20TA%20memo.pdf (Accessed 20/03/2014).
Nawai, N., & Shariff, M.N.M. (2010). Determinants of Repayment Performance in Microcredit Programs: A Review of Literature, International Journal of Business and Social Science, 1(2), 152-161.
Business and Economic Research ISSN 2162-4860
2014, Vol. 4, No. 1
www.macrothink.org/ber 316
Office of Comptroller of the Currency (OCC 1998). Comptroller’s Handbook (1998): Loan Portfolio Management. Retrieved from: http://www.occ.gov/publications/publications-by-type/comptrollers-handbook/lpm.pdf (Accessed 20/03/2014).
Ofuoku, A. U., & Urang, E. (2009). Effect of Cohesion on Loan Repayment in Farmers’ Cooperative Societies in Delta State, Nigeria: International Journal of Sociology and Anthropology, 1(4), 70-76.
Onumah, E. E., & Acquah, H. D. (2011). Outreach and Sustainability of Inventory Credit Programme in Ghana. Journal of Agricultural Sciences, Vol. 56(2), 145-164. http://dx.doi.org/10.2298/JAS1102145O.
Qin, X., & Ndiege, B. O. (2013). Role of Financial Development in Economic Growth: Evidence from Savings and Credits Cooperative Societies in Tanzania. International Journal of Financial Research, 4(2), 115-125. http://dx.doi.org/10.5430/ijfr.v4n2p115.
Rashid, S., & Samad, A. (1996). Portfolio Management of the Free Banks of Illinois: An Examination of Historical Allegations. The Review of Austrian Economics, 9(1), 55-76. http://dx.doi.org/10.1007/BF01101881
Rossi, S. P. S., Schwaiger, M. S., & Winkler, G. (2009). How loan portfolio diversification affects risk, efficiency and capitalization: A managerial behavior model for Austrian banks. Journal of Banking & Finance 33, 2218-2226. http://dx.doi.org/10.1016/j.jbankfin.2009.05.022.
Satgar, V. (2003). Comparative Study- Cooperative Banks and the Grameen Bank Model. Co-operative and Policy Alternative Center (COPAC).
Tadele, H., & Rao, P. M. S. (2014). Corporate Governance and Ethical issues in Microfinance Institutions (MFIs)-A study of Microfinance Crises in Andhra Pradesh, India. Journal of Business Management & Social Sciences Research, 3(1), 21-26.
Tanzanian Federation of Cooperatives (TFC) (2006). A Simplified Guide to the Cooperative Development Policy and the Cooperative Societies Act of Tanzania Mainland. Retrieved from: http://www.hakikazi.org/papers/Cooperatives.pdf (Accessed 07/04/2014).
The International Association of Credit Portfolio Managers (IACPM 2005). Sound Practices in Credit Portfolio Management. Retrieved from: http://web.iacpm.org/library/public_documents/IACPMSoundPractices.pdf. (Accessed 20/03/2014).
Trà, P. T. T, & Robert Lensink, R. (n.d). Household borrowing in Vietnam: A comparative study of default risks of informal, formal and semi-formal credit. University of Groningen. Retrievedfrom:http://www.ceistorvergata.it/conferenze&convegni/banking&finance/xiii_conference/3dicembre/TraLensikcreditscoringVN.pdf (Accessed 04/04/2014).
Wangwe, S. (2004). Innovation in Rural Finance in Tanzania. Paper prepared for The Third Annual Conference on Microfinance held from 15th to 17th March 2004 at the AICC, Arusha,
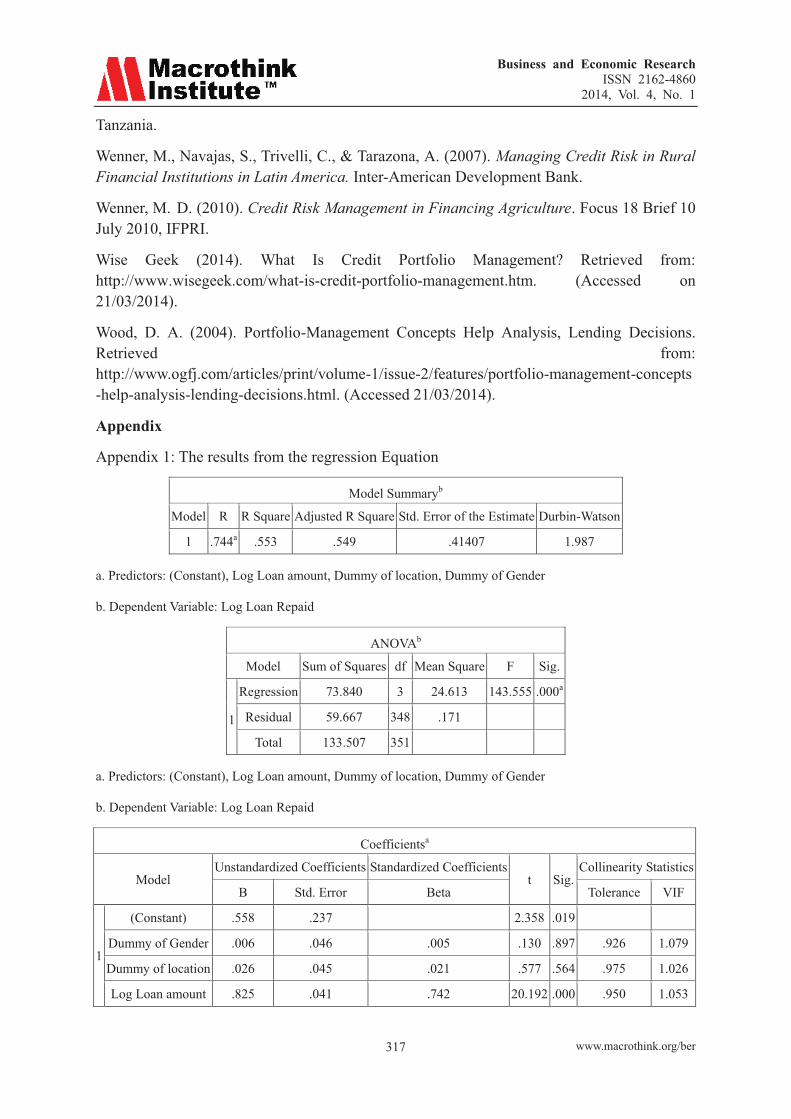
Business and Economic Research ISSN 2162-4860
2014, Vol. 4, No. 1
www.macrothink.org/ber 317
Tanzania.
Wenner, M., Navajas, S., Trivelli, C., & Tarazona, A. (2007). Managing Credit Risk in Rural Financial Institutions in Latin America. Inter-American Development Bank.
Wenner, M. D. (2010). Credit Risk Management in Financing Agriculture. Focus 18 Brief 10 July 2010, IFPRI.
Wise Geek (2014). What Is Credit Portfolio Management? Retrieved from: http://www.wisegeek.com/what-is-credit-portfolio-management.htm. (Accessed on 21/03/2014).
Wood, D. A. (2004). Portfolio-Management Concepts Help Analysis, Lending Decisions. Retrieved from: http://www.ogfj.com/articles/print/volume-1/issue-2/features/portfolio-management-concepts-help-analysis-lending-decisions.html. (Accessed 21/03/2014).
Appendix
Appendix 1: The results from the regression Equation
Model Summaryb
Model R R Square Adjusted R Square Std. Error of the Estimate Durbin-Watson
1 .744a .553 .549 .41407 1.987
a. Predictors: (Constant), Log Loan amount, Dummy of location, Dummy of Gender
b. Dependent Variable: Log Loan Repaid
ANOVAb
Model Sum of Squares df Mean Square F Sig.
1
Regression 73.840 3 24.613 143.555 .000a
Residual 59.667 348 .171
Total 133.507 351
a. Predictors: (Constant), Log Loan amount, Dummy of location, Dummy of Gender
b. Dependent Variable: Log Loan Repaid
Coefficientsa
Model Unstandardized Coefficients Standardized Coefficients
t Sig. Collinearity Statistics
B Std. Error Beta Tolerance VIF
1
(Constant) .558 .237 2.358 .019
Dummy of Gender .006 .046 .005 .130 .897 .926 1.079
Dummy of location .026 .045 .021 .577 .564 .975 1.026
Log Loan amount .825 .041 .742 20.192 .000 .950 1.053

Business and Economic Research ISSN 2162-4860
2014, Vol. 4, No. 1
www.macrothink.org/ber 318
a. Predictors: (Constant), Log Loan amount, Dummy of location, Dummy of Gender
b. Dependent Variable: Log Loan Repaid
Copyright Disclaimer
Copyright for this article is retained by the author(s), with first publication rights granted to the journal.
This is an open-access article distributed under the terms and conditions of the Creative Commons Attribution license (http://creativecommons.org/licenses/by/3.0/).

Business and Economic Research ISSN 2162-4860
2014, Vol. 4, No. 1
www.macrothink.org/ber 319
Factors that Determines the Success of Business Demon Value Added Management
Albert Irawan (Corresponding author)
Faculty of Business, Widya Mandala Catholic University
Jl. Dinoyo 42-44, Surabaya, 60265, Indonesia
Tel: 62-85733547178 E-mail: [email protected]
Received: March 19, 2014 Accepted: April 8, 2014
doi:10.5296/ber.v4i1.5325 URL: http://dx.doi.org/10.5296/ber.v4i1.5325
Abstract
The purpose of this paper is to provide a comprehensive indication of the Business Demon Value Added Management (BDVAM) as a form of Politics Governance Responsibility (PGR). This paper is to achieve its objectives by reviewing some relevant literature related to the five main areas of Business Demon Value Added Management (BDVAM) i.e revenue management, cost management, resource management, capital investment management, and sustainability. Through the above critical review of the existing literature, this paper on feature five factors that should be met as a condition for the successful practice of BDVAM, namely:(1) the amount of the commitment of business demon as a minority shareholder to suppress the majority shareholder of the company to solve operational problems, financial, political, social and environment with the help of the media, (2) the strength of militarist paradigm adopted by the business demon, (3) the ability of business demon to do coopetition, which is able to provide added value for shareholders and stakeholders, (4) the ability of business demon meet its working capital with an unlimited source of funds, (5) the ability of business demon builds mutual benefits with government bureaucrats and suppliers. From the previous paper discussed more success in the role of business angel in providing added value for the company. This paper focuses on the business demon by introducing five prepositions that can improve the performance of the company. This literature is limited only to answer five fundamental questions: (1) why the business demon success or failure in applying BDVAM? (2) what are the internal and external factors that are needed to qualify at the time of applying BDVAM, (3) how to improve and discrepancies in stock prices, while the growing political rents, interest in working at the company worker’s is reduced because of the inability of the business demon? (4) the opinion of the author, which one is better between

Business and Economic Research ISSN 2162-4860
2014, Vol. 4, No. 1
www.macrothink.org/ber 320
business demon and business angel in adding value? (5) how to improve the model BDVAM that this model does not become BDVDM (Business Demon Value Destruction Management), where business demon has dominant rols in setting the company’s stock price. The previous paper discussed more on the role of business angel in providing value added and nothing that specifically addresses the business demon who has political connections with government. The first contribution of this paper to the existing literature can be found that the relationship BDVAM with operational performance, financial, political,social and environment is still not widely studied. Second, this paper adds to the literature on entrepreneurial finance in particular how BDVAM could be an alternative strategy for the business demon in the plan will be to invest in the company. Also in this paper introduces Business Demon Value Destruction Management (BDVDM), which is a management concept that states that the business demon success is providing value to the business angel and other shareholder to buy an existing company or merged with other similar companies, as well as influencing stakdeholders to close the company if there is a discrepancy in a process that could harm customers in the long term.
Keywords: Business Demon Value Added Management (BDVAM), Business Demon Value Destruction Management (BDVDM), Politic Responsibility, Entrepreneurial Finance.
1. Introduction
A number of studies concerning entrepreneurial finance now many done and narrowly focused more on venture capital and will involve an informal investor/angel investors (Brophy and Shulma,1992; Saint Pierre and Mathieu, 2003; Denis,2004; Rassoul,2006; Lantz and Sahut, 2009; Redis, 2009). Research on an informal investor/angel investors itself has also been developing countries with a discussion as follows:
1.1 Demography Informal Investor/Angel
a. Country of origin informal investor/angel investors are based on continent:
i. Asia and Australia (Hindle and Wenban,1999; Tashiro, 1999; Hindle and Lee,2002; Kutsuna and Harada, 2004; Gunawan,Wessiani, et al., 2011; Scheela and Isidro, et al.,2012).
ii. United States (Harr, Starr, and MacMIllan,1998; Aram, 1989; Wetzel, 1981,1983,1994; Duxbury, Haines, and Riding,1996; Freear, Sohl, and Wetzel, 1997; Korhonen,2009)
iii. Europe (Mason, Harrison, and Chaloner, 1991; Mason and Harrison, 1994,1996; Van Osnabrugge,1998; Kelly, 2000; Stedler and Peters, 2003; Paul, Whittam, and Johnston,2003)
iv. Africa (Curtis,2003)
v. Nordic (Landstrom, 1992,1993,1995,1998; Suomi and Lumme, 1994; Reitan and Sorheim,2000; Sorheim and Landstrom,2001)
vi. Middle east region (Curtis,2003; The Economist,2013)

Business and Economic Research ISSN 2162-4860
2014, Vol. 4, No. 1
www.macrothink.org/ber 321
b. Age (Gaston,1989; Freear, Sohl and Wetzel,1991,1994; Van Osnabrugge and Robinson,2000; Hill and Power,2002; Autio and Arenius, 2003)
c. Sex (Gaston,1989, Freear,Sohl and Wetzel,1991; Wetzel and Freear,1996)
d. Number of assets owned (Gaston, 1989l Benjamin and Margulis,2001)
e. Experience managing multinational companies (Aram,1989; Gaston,1989; Sullivan, 1991; Van Osnabrugge and Robinson,2000; Autio and Arenius, 2003)
f. Level of competency (Sorheim and Landstrom,2001)
g. The level of formal education possessed (Aram,1989; Gaston,1989; Van Osnabrugge and Robinson,2000; Hill and Power,2002)
1.2 Characteristics of Informal Investment Transactions between the Investor/Angel Investor with the Company
h. The size of investment (Aram, 1989; Gaston,1989; Freear,Sohl and Wetzel,1991; Linde and Prasad,2000; Van Osnabrugge and Robinson,2000; Hill and Power,2002)
i. Frequency investing (Gaston,1989; Freear and Wetzel,1991; Sullivan,1991; Freear, Sohl and Wetzel,1992)
j. Geographic to invest (Aram,1989; Riding and Short,1987; Freear, Sohl and Wetzel,1992;1994; Lerner,1998; Benjamin and Margulis, 2001; Hill and Power,2002)
k. Viable industries for investments (Wetzel,1983; Aram,1989; Gaston,1989; Freear,Sohl and Wetzel,1995; Van Osnabrugge and Robinson,2000; Hill and Power,2002)
l. Object of investments in new/early stage of operation (Aram,1989; Freear and Wetzel,1989; Freear, Sohl and Wetzel,1996; Sohl,2004)
m. Family companies funded by business angel has survived to the third generation (Beckhard and Dyer,1983; Dyer and Sanchez,1998; Athanas-siou and Crittenden,2000; Filbeck and Lee,2000; Sonfield and Lussier,2004)
1.3 The investment process is done by informal investor/angel investors
n. Sourcing/Co-Investing (Aram,1989; Freear, Sohl, and Wetzel,1990; Kelly and Hay,1996; Van Osnabrugge and Robinson,2000; Benjamin and Margulis,2001)
o. Dilligence process (Harrison, Dibben and Mason,1997; Van Osnabrugge and Robinson,2000; Linde and Prasad,2000)
p. Contract structure (Freear, Sohol and Wetzel,1992; 1995; Van Osnabrugge and Robinson,2000)

Business and Economic Research ISSN 2162-4860
2014, Vol. 4, No. 1
www.macrothink.org/ber 322
1.4 In Some Studies Explained That Some Companies Belonging To The Family Business Angel Funded By Business Angel (Krueger, 1974; Davis, 2001; Hunt, 2002; Crispin, 2002)
1.5 Motivation Investments Made by Angel Investors
q. Rate of return on investment can be financially profitable or financially provide added value (Fama and Miller, 1972; Gaston,1989; Sullivan and Miller,1990; Freear,Sohl and Wetzel,1995; Van Osnabrugge,1998;2000; Linde and Prasad,2000; Benjamin and Margulis,2001; Ardichvili et al., 2002; Hill and Power,2002; Madill et al., 2005; Munck and Saublens,2005; Politis,2008)
r. Investment holding period (Gaston,1989; Freear,Sohl and Wetzel,1995; Van Osnabrugge,1998; Linde and Prasad,2000; Benjamin and Margulis,2001; Hoontrakul, 2001)
s. Can provide added value in non-financial benefit (Freear, Sohl and Wetzel,1995; Sullivan and Miller,1996; Linde and Prasad,2000; Van Osnabrugge and Robinson,2000; Sorheim,2005; Politis,2008; Ragnar, Marius, and Lars,2012)
t. Want to destroy the company (Berglas,1998; Cockerill, 2002; Ibrahim,2008)
Although the presence of the business angel has been long enough to present as a minority shareholder in the company and has been widely discussed in several previous studies, still could not prevent a global financial crisis. The global financial crisis that is happening around the world lately made two contrasting events: (1) a newly established company with the support of the business angel through still not able to survive (McCarthy,Solomon and Mihalek,2012). This is because of politic responsibility policy are not going well (Manzoor,2013) and busness angel can’t give a good contribution though trying to provide added value and therefore contributes to the quality of the financial statements and the quality of the company’s revenue (Jin and Myers,2006; Politis,2008; Lee and Seo,2009; Gul, Kim and Qiu,2010; Piotroski, Wong, and Zhang,2010; Ragnar,Marius,and Lars, 2012); (2) it is not overly impact on large companies because of the complicated relationship between political connections with the countries major companies where the majority of CEOs are former civil servants or government officials (Lantz, Montandrau, Sahut,2010) as well as the active involvement of business demon the shareholding structure of the company (Bates,2009; Zalzman,2013; Anonymous, 2014).
With the active involvement, business demon replace the company’s management system into a militaristic nature (Talbot,2003), making the resolution of shareholders and change political responsibility policy on large firms (The Economist,2007). However the business demons still remains to be watched by other shareholders and the board of the company because they invest so much capital not only as a minority shareholder, but has a high motivation to seek compensation, acquire stakes of other shareholders with a negative impact to the company so that it can acquire/sell the company at a higher price, but it also forces them to engage directly, although not knowing the problems related to the activity of the operational details that could be dangerous if the payments are restricted, the onset of the debt, the sale of assets,
Business and Economic Research ISSN 2162-4860
2014, Vol. 4, No. 1
www.macrothink.org/ber 323
changes in corporate control agreement (Bennett,2008; Rose,2010).
The business demon and other stakeholders to learn from the global financial crisis that has occurred previously (Friedman and Schwartz,1963; McCarthy, Solomon, and Mihalek,2012) and do not believe the board of the company as previously they often ask a very high compensation package without any clear indicators, change the policy of Good Corporate Governance and dominate corporate board, and can’t create added value and inhibit a change in strategy from outside the company (Corlette,1989l Paul and Lydenberg,1992; Davidson, Worrell, and Jelly,1995;Frooman,1999; Graves,Rehbein,and Waddock,2001; Rowley and Moldoveanu,2003; Lipton,2007; Myles,2011; Manzoor,2013; The Economist,2013).
The presence of the business demon to create shareholder resolutions and bring changes to the company(The Economist,2007). Business demon will use all its resources to provide added value to influence the management of the company such as (1) when the shareholder’s meeting, business demon will ask the company’s performance in detail and how the board and the audit committee control their staffs, (2) questioning why returns for shareholders when the little cash that the company very much, (3) alter the fundamental role of the board of the company is bad and unproductive, (4) degrading the performance of accountants, auditors through a board meeting, (5) create pressure on the board of the company to manage the short-term stock price performance rather than long-term value creation because the company’s board of storing information for himself and ask who controls the performance of the board of the company (Lipton,2007; The Economist,2007; Tilson and Heins,2011; Kelly,2013).
Therefore Business Demon Value Added Management (BDVAM) is an important issue for the company’s corporate board anticipation these days due to the presence of business demon: (1) involve the media to tell all the performance of the board of the company and all employees in the company, (2) change of control that was once performed by the board of the company, (3) makes the role of the board of the company to be reduced due to the inclusion of expert consultants/experts/members bureaucrats who still/not to give independent advice for business demon don’t trust the vision of the CEO, (4) support the workings of the CEO and the management to run the business and support in case of problems will be revoked and the CEO and the management should resign (Gray,2003; Myles,2011).
In general, BDVAM is a management concept which states that the success of a company depends on the ability of business demon (is angel investors from the religious/environmental group/community based organizations/group of a certain profession/group union/group of rich people who have a minority shareholding companies in many countries who want to do a shareholder resolution at a company to exert pressure on the board of the company to change practices of the company,besides having a very close relationship ties with high-ranking officials at state-owned banks or central/local government (Gaston,1989) in the revenue process optimization, cost management, resource management, management of investment capital, and the management of environmental damage and social problems in the community about where the company is located (Shleifer and Vishny,1994; MacGregor and Campbell,2008; Tilson and Heins,2011; Ameer and Othman,2012). In its development,
Business and Economic Research ISSN 2162-4860
2014, Vol. 4, No. 1
www.macrothink.org/ber 324
BDVAM strongly associated with corporate governance (Sussland,2004;Ting,2006; Lipton,2007; The Economist,2007; Myles,2011), the concept of Bottom Line (Gee,2002), the relevant debate between economism and militarism paradigm adopted by the business demon in the company (Hoskin and Macve,1990; Cloke and Goldsmith,2002; Talbot,2003).
From some research findings indicate that BDVAM is a concept that is very easy to understand, but very difficult to implement in order to be successful, because there is a motivation of business demon in the ease of running the company get through government policies that support/investment contract package from the government, in return the company must provide political support and sound (Fisman,2001; Husnan,2001;Mobarak and Purbasari,2001; Faccio,2006). From the perspective of business demon,it is generally agreed that the operational, financial,political,social and environment problems are important issues and could affect stock price synchronicity and the company’s stock price crashes (Stingler,1971; Jin and Myers,2006; Hutton,Marcus and Tehranian,2009; Piotroski,Wong, and Zhang,2010), but the business does not give enough attention to the business demon on these issues (Shleifer and Vishny,1994;Steven,1998; Ibrahim,2008; MacGregor and Campbell,2008; Cheffins and Armour,2011). Of some of the findings from previous research, the purpose of this paper is to provide a comprehensive indication of the value added elements of the business demon and actions that affect stock price synchronicity and the company’s stock price crashes. It is supported by four fundamental questions trying to be answered to achieve the objectives of this paper are: (1)why the business demon success or failure in applying BDVAM?, (2) what are the internal and external factors that are needed to quality at the time of applying BDVAM, (3) how to improve and discrepancies in stock prices, while the growing political rents, interest in working at the company’s workers is reduced because of the inability of the business demon with a high political?, (4)the opinion of the author, which one is better between business demon and business demon on the value added?, (5) how to improve the model BDVAM that this model does not become Business Demon Value Destruction Management (BDVDM), where business demon has a dominant role in setting the company’s stock price, and could force the owners to sell the company’s assets before other business to be owned by the business demon (Benoit,2014; Benoit and Chung,2014)?. The answer of these questions are very important to strengthen the argument that BDVAM is an ideal concept that can be used by informal investors in making investment decisions.
2. Literature Review
2.1 Business Demon Value Added Management (BDVAM) and Politic Responsibility (PR)
PR in a company is very important in influencing the performance of the company not only in emerging countries but also in developed countries (Fisman,2001). PR is essential to set shared between business demon, the other shareholders, the board of the company and the government because of corruption prone causing uncertainty for businesses and increase the cost of business transactions (Habib and Zurawicki,2002,2005). There is no direct involvement in several companies that stumble legal issues, government and political party supporters tend to support government actions affecting business demon in the shareholders of the company in order to depress the company’s board to achieve a good profit support

Business and Economic Research ISSN 2162-4860
2014, Vol. 4, No. 1
www.macrothink.org/ber 325
voice and money to win elections (Sutter,1999; Davis,2001; Fisman,2001; Crispin,2002; Hunt,2002; Kapner,2003; Manzoor,2013) and also joined hands with the corrupt that increase uncertainty, increasing the costs of cross border business transactions (Habib and Zurawicki,2002,2005; Faccio,Masulis, and McConnell,2006; Nelson,2012).
Board of the company has a strong influence on the company to change the PR policy, affecting the company’s stock price and hide negative information resulting in stock price synchronicity and the company’s stock price crashes (Stingler,1971; Jin and Myers,2006; Hutton, Marcus and Tehranian,2009; Piotroski, Wong, and Zhang,2010).Often companies take advantage of the information asymmetry Council corporate performance as a negative signal for the company(Bhattacharya,1979; John and Williams,1985; Miller and Rock,1985). This affects the company does not distribute dividends for shareholders when the company’s profit and have cash that very much, and vice versa (Sembenelli,1993; Moyer,Rao, and Regnard,1996; Gombola and Feng-Ying,1999; Tim, Nahum, and Xiaojing,2010).
BDVAM concept is increasingly believed to be the truth as a result of the global financial crisis around the world provide a signal that is the attitude of the board of the company during the company does not pay attention to the stakeholders and not give protection to their shareholders and themselves act as if they have the ability to manage the company’s better than business demon. The company is a member of the community for survival which is funded by the public (shareholders particularly business demon). Therefore to give a sign to the board of the company in order to work more carefully then business demon at the time of any meeting of shareholders of the truth of the information requested examined the performance of the company by an independent consultant (Graves,Rehbein, and Waddock,2001; Adegbite,Amaeshi, and Amao,2011). During its development, BDVAM directly related very closely to the concept of Politic Responsibility (PR), which is the intention of the board of the company to commit a crime is difficult to be identified, which could be more easily identified is the lack of awareness of the risks, the lack of responsibility of overseeing the company’s operations (French,1984; Goodpaster,1983; Velasquez,1983; Ranken,1987; Gibson,1995; Wilmot,2001). A company is required to maintain the continuity of the shareholders and stakeholders, therefore by all means necessary to bring about change business demon by providing added value that can be favorable the company.
With the concept BDVAM help business demon to focus on the politics of responsibility in five key areas, namely the management of income or revenue optimization process (Talluni and Van Ryzin,2005; Yu,Wee,and Su,2012; Fernandez,2012;Hasan,2013), cost management (Anderson and Dekker,2009; Piontkowski et al.,2012), resource management (Boselie, Dietz and Boon,2005; Belak, Ajinovic Barac, and Tadic,2009; Tadic,2010; Zeghal and Maaloul,2010), capital investment management (Huang et al., 2009; Zhao,2011), sustainability (Rahardjo et al., 2013), Politic Responsibility is a commitment to responsible business demon on the negative effects caused by the company’s operations (Carroll,1991; Jones et al., 2009a; Burr,2012; Nelson,2012). Politic Responsibility is a consequence of a company when running concept BDVAM.

Business and Economic Research ISSN 2162-4860
2014, Vol. 4, No. 1
www.macrothink.org/ber 326
2.2 Results of Empirical Research of BDVAM
The concept of BDVAM on the basic is how to offer board of a company’s stock price increases between 30% to 50%. This concept is a concept, which is logically easy to understand but difficult to practice. This is the conclusion of various research results.
BDVAM idealism stated that the company that can implement the BDVAM will be able to bring a shareholder resolution and support of all stakeholders so that the impact on the company’s good performance. Nevertheless, Caton,Goh, and Donaldson (2001) in their research are illustrated in Table 1 show that the implementation of Business Demon Value Added Management (BDVAM) not always able to improve the performance of the company, even from samples of the company there is no effect at all, and no effect of an increase in performance, but not all the parts (such as corporate social performance, financial performance,etc).
Table 1. Various Research Results on The Relationship of Business Demon Value Added Management (BDVAM) and Corporate Performance (CP)
Results Author(s)
BDVAM activities enhance the corporate performance Filippello, 1993; Del Guercio and Hawkins, 1999; Gillan and Starks, 2000; English et al., 2004; Nelson, 2006; Brav et al., 2008; Del Guercio et al., 2008; Greenwood and Schor,2009; Kim et al., 2009; Klein and Zur, 2009; Lee and Park, 2009; Becht et al., 2010; Cheng et al., 2010; Ertimur et al., 2010; Barach Aljinovic, et al., 2013.
BDVAM activities do not influence the corporate finance because business demon gets resistance from other shareholders and the board of the company who could not get a good performance boost moments when should remove the subsidiary company or unproductive assets or merge
Romano, 2001; Faccio, 2006; Dumev, Li, Morck, and Yeung,2004; Barber, 2006; Del Guercio et al., 2008; Tetlock, 2007; Gillan and Starks, 2007; Kaplansky and Levy,2010.
BDVAM activities only enhance a part of corporate performance DeAngelo and DeAngelo,1989; Gordon and Pound, 1993; Solh, 2000; Turner, 2007; Lublin, 2011; Burr, 2012.
Also according to Rehbein, Waddock, and Graves (2004) expose (illustrated in Table 2) that the BDVAM on the application by business demon closely related to the stakeholders (shareholders, employees, community and environment) in the goal achieving company performance. Business demon in the process of adding value for the company must pay attention to the sustainability of the existing stakeholders (Tilson and Heins, 2011).
Table 2. Various Research Results on The Relationship of implementation of Business Demon Value Added Management (BDVAM) by a Business Demon and The Stakeholders
Results Author(s)
BDVAM activities conducted by Business Demon relating to shareholders including Business Angel
Vogel, 1983; Filippello, 1993; Turner, 2007; Budsaratrahoon, Lhaopadchan, and Hillier, 2010

Business and Economic Research ISSN 2162-4860
2014, Vol. 4, No. 1
www.macrothink.org/ber 327
BDVAM activities conducted by Business Demon relating to employees
Huselid, 1995; Becker and Gerhard, 1996; Huselid, Jackson and Schuler, 1997; Ichnioski and Shaw, 1999; Pfeffer and Veiga, 1999; Burton and O’Reilly, 2000; O’Reilly and Pfeffer, 2000; Bezemer, Peij, et al, 2010
BDVAM activities conducted by Business Demon relating to communities
Waddock and Graves,1997b; Agle, Mitchell, and Sonnenfield,1999; Burke, 1999; Rochlin and Christoffer, 2000; Hillman and Keim, 2001
BDVAM activities conducted by Business Demon relating to customers
Miles,1987; Waddock and Graves,1997a,1997b
BDVAM activities conducted by Business Demon relating to environment
Feldman, Soyka, and Ameer,1997
BDVAM activities conducted by Business Demon relating to officials who sit on the government of a country where the company is domiciled
Purwoto,2011
3. Discussion
The diversity of research results and the differences between how the shareholder raises the question of why a company successfully implemented BDVAM (Business Demon Value Added Management) and why other companies do not reap good performance despite applying BDVAM? Do Business demon too dominant influence causing BDVAM transformed into BDVDM (Business Demon Value Destruction Management). Following questions increase five factors that must be considered in order to successfully implement BDVAM namely: (1)the relationship of capital owners and managers of capital, (2) militarized paradigm adopted by the business demon, (3) direct involvement of representatives of the Commission Eradication of Corruption and the people in the company, (4) the ability of the business angel transformed into business demon, in the relationship with the company’s stakeholders, (5) internal and external conditions that affect business demon is not running BDVAM but running BDVDM.
3.1 Attitudes of Business Demon On Minority Shareholder Issues
From the view of agency theory, the company that owns many subsidiaries in the relationship can be characterized as a principal-agent relationship. In this perspective, it is recognized that the interests of local subsidiaries may not always be aligned with the parent company due to the different motivations in giving values between company boards and shareholders of each company, a subsidiary even though the law should have the same perception of the purpose of the board of the company and shareholders of the parent company (Gupta and Govindarajan,2001,2002). This is supported study conducted Eisenhardt (1989) and Rose (2010) was also explained that the common difference between the perception of the company’s board by the shareholders because in the opinion of the board of the company, the shareholders are not entitled to intervene on the following issues can it can be resolved. These issues are as follows:
1. Revenue issues.

Business and Economic Research ISSN 2162-4860
2014, Vol. 4, No. 1
www.macrothink.org/ber 328
a. Often the board of the company are too high set the price of the new product regardless of whether the product can be sold in the market and preferred by the customer or not. In addition the product is often packaged and sold at a cheap price without giving good service
b. Often the company’s board more use of internal capital firms without considering the use from capital markets or financial institutions
c. Often the board of the company to buy assets remain unproductive without considering cooperation with investors
2. Cost management issues.
a. Often the board of the company not recorded correctly corporate spending and do relocation resources are not in accordance with customer needs
b. Often the board of the company in the process of re-engineering the product and service offerings have nothing to do with the needs of the customer
3. Human resource management issues.
a. Often the board of the company doesn’t give reasonable attention to its human resources when recruiting new employees or put the old employees are not in the right position according to his/her ability
4. Investment capital management issues
a. Often the board of the company doesn’t invest in assets that can be quickly converted into profit
5. Environmental issues
a. Often the board of the company is not sensitive to implementation waste q management and keep the company’s production process not to pollute the environment with eco-friendly activities
6. Social issues
a. Oten the board of the company is not sensitive to social issues in the community. Moreover allocate less profit firms to assist communities that are still undeveloped.
Business demon has taken the role to influence other shareholders through letter or at the shareholder’s meeting have noticed that during this political governance and its subsidiary companies not properly managed by the board of the company that made the unilateral decision by the company’s board. Some of the steps by the business demon different from those of the previous business angel as illustrated by a study conducted by Lin & Lin (2014) and Ragnar, Marius, and Lars (2012), which as illustrated in Table 3 that there are two activities, namely intra-organizational (relation relation to external company) and inter-organization (relating to internal company) that can be performed by minority

Business and Economic Research ISSN 2162-4860
2014, Vol. 4, No. 1
www.macrothink.org/ber 329
shareholders.
Table 3. Differences Activity Value Added conducted by Business Angel and Business Demon
The level of direct involvement
Category Intra-Organizational Activities Inter-Organizational Activities
Low Strategy
Business Angel a. Provide input strategic decisions
b. Provide direction for the formulation of a marketing plan and work program entities and subsidiaries
a. Participate approved the election of the board of the company
Business Demon a. Provide a list of investors who want an investment cooperation
b. Recruiting independent consultant and independent auditors to assist in the formulation of marketing plans and work programs
a. Offer candidates commissioners and the board of directors of government/military/ other companies that have been successful in
Intermediate Support
Business Angel a. Have the ability to marketing,economics, taxation and accounting
b. Take on the role as motivator and facilitator for the board of the company
a. Industry know-how
b. Customer and Partner processes
c. Further financing
d. Get involved in the recruitment board of the company
Business Demon a. Ask the company to pay more taxes and help the government in community activities through the products owned
b. Encourage local and foreign investors to become shareholders of the company and to the establishment of a new business venture
c. Having the ability to mergers and acquisitions as well as having experience in the stock split and the merger of the company and has a capital market investment broker connections
a. Making negative news about the company to replace the board of a company that has poor performance
b. Forcing investment idea to take off unproductive assets/sell a subsidiary that do not perform well and give advice to the company buy a large stake in the company as a form of financing
High Operational Management
Business Angel a. Assist provide input on both corporate administrative
a. Participate approve compensation to the board of the company

Business and Economic Research ISSN 2162-4860
2014, Vol. 4, No. 1
www.macrothink.org/ber 330
management application systems implementation, operational reporting
b. Participate in any meetings with customers
c. Participate in every price formation and also participate sell products to customers
including the CEO when reaching the target company
Business Demon a. Participate in the development of new products
b. Participate in the exhibition of products and work with the media for the publication of the company activities
c. Participate government tenders
d. Cooperation with other companies and undertake joint work effort in serving the customer to a product that is created
e. Working closely with the company’s competitors to exchange information and create a contract of employment about which areas to work on together and which areas should be done every company
a. Changing existing company policies and make new provisions that benefit shareholders
b. Replacing the majority of people who sit on the board of the company with outsourced labor/management consultant independent from the government or a seasoned professional
c. Questioning large corporate board compensation, performance is less
Of the few studies that have been conducted, presenting that on average, five years later after business demon involved the results are stock price and operating performance of the target company is more powerful than similar competitor company (Anonymous, 2014; Benoit, 2014). Based on the description, the first proposition is business demon commitment to press the board of the company with the implementation of Business Demon Value Added Management (BDVAM) according to which best suits the desire to direct involvement in the company is very desirable.
3.2 Militerism Paradigm and Business Demon Value Added Management
Talbot (2003) and Barac, Aljinovic, et al., (2013) states that at the time the company plans to expand, business demon with a militaristic nature should be able to be responsive to provide value added services such as (1) providing input expansion of sales of products, goods and services, (2) ask the board of the company for implementing cost effective strategies, (3) asking the board to increase the company’s competence and value of human resources (4) asking the board for carrying out new projects even asked to sell the subsidiary entities or assets that are not productive. In addition the company is currently experience a recession, business demon with a militaristic nature should be able to be responsive to provide value added services such as (1) entry into new business activities which could give positive return
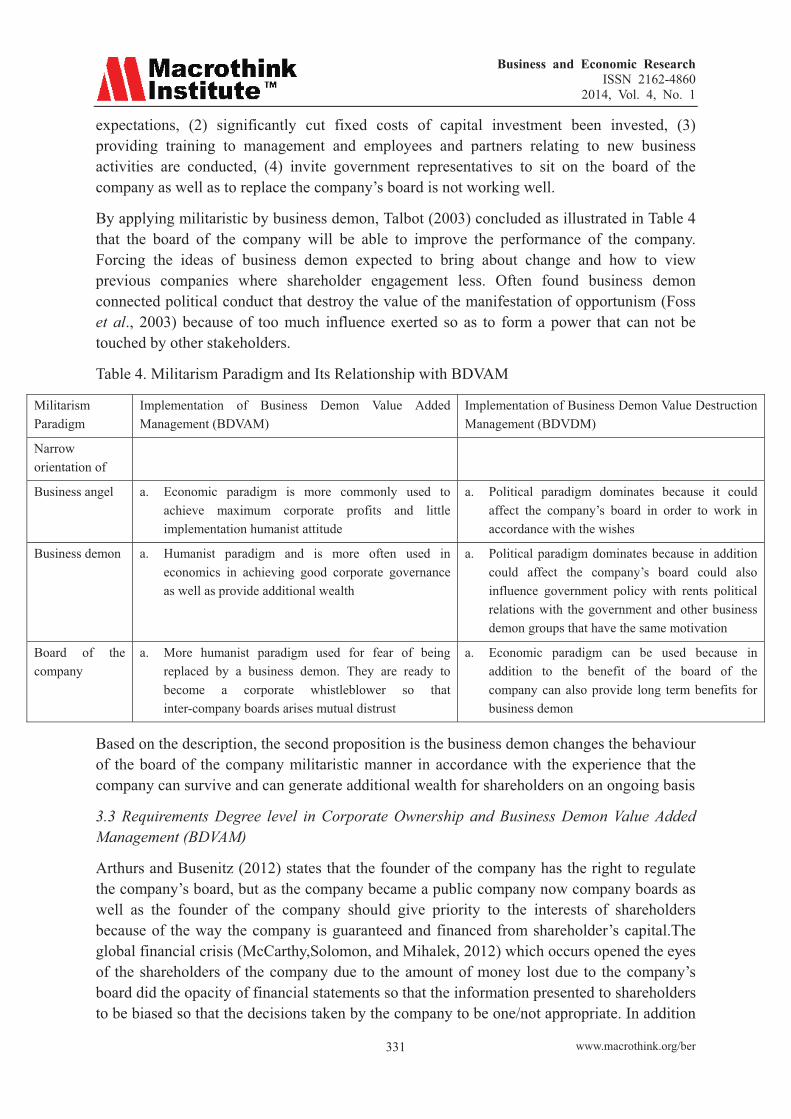
Business and Economic Research ISSN 2162-4860
2014, Vol. 4, No. 1
www.macrothink.org/ber 331
expectations, (2) significantly cut fixed costs of capital investment been invested, (3) providing training to management and employees and partners relating to new business activities are conducted, (4) invite government representatives to sit on the board of the company as well as to replace the company’s board is not working well.
By applying militaristic by business demon, Talbot (2003) concluded as illustrated in Table 4 that the board of the company will be able to improve the performance of the company. Forcing the ideas of business demon expected to bring about change and how to view previous companies where shareholder engagement less. Often found business demon connected political conduct that destroy the value of the manifestation of opportunism (Foss et al., 2003) because of too much influence exerted so as to form a power that can not be touched by other stakeholders.
Table 4. Militarism Paradigm and Its Relationship with BDVAM
Militarism Paradigm
Implementation of Business Demon Value Added Management (BDVAM)
Implementation of Business Demon Value Destruction Management (BDVDM)
Narrow orientation of
Business angel a. Economic paradigm is more commonly used to achieve maximum corporate profits and little implementation humanist attitude
a. Political paradigm dominates because it could affect the company’s board in order to work in accordance with the wishes
Business demon a. Humanist paradigm and is more often used in economics in achieving good corporate governance as well as provide additional wealth
a. Political paradigm dominates because in addition could affect the company’s board could also influence government policy with rents political relations with the government and other business demon groups that have the same motivation
Board of the company
a. More humanist paradigm used for fear of being replaced by a business demon. They are ready to become a corporate whistleblower so that inter-company boards arises mutual distrust
a. Economic paradigm can be used because in addition to the benefit of the board of the company can also provide long term benefits for business demon
Based on the description, the second proposition is the business demon changes the behaviour of the board of the company militaristic manner in accordance with the experience that the company can survive and can generate additional wealth for shareholders on an ongoing basis
3.3 Requirements Degree level in Corporate Ownership and Business Demon Value Added Management (BDVAM)
Arthurs and Busenitz (2012) states that the founder of the company has the right to regulate the company’s board, but as the company became a public company now company boards as well as the founder of the company should give priority to the interests of shareholders because of the way the company is guaranteed and financed from shareholder’s capital.The global financial crisis (McCarthy,Solomon, and Mihalek, 2012) which occurs opened the eyes of the shareholders of the company due to the amount of money lost due to the company’s board did the opacity of financial statements so that the information presented to shareholders to be biased so that the decisions taken by the company to be one/not appropriate. In addition
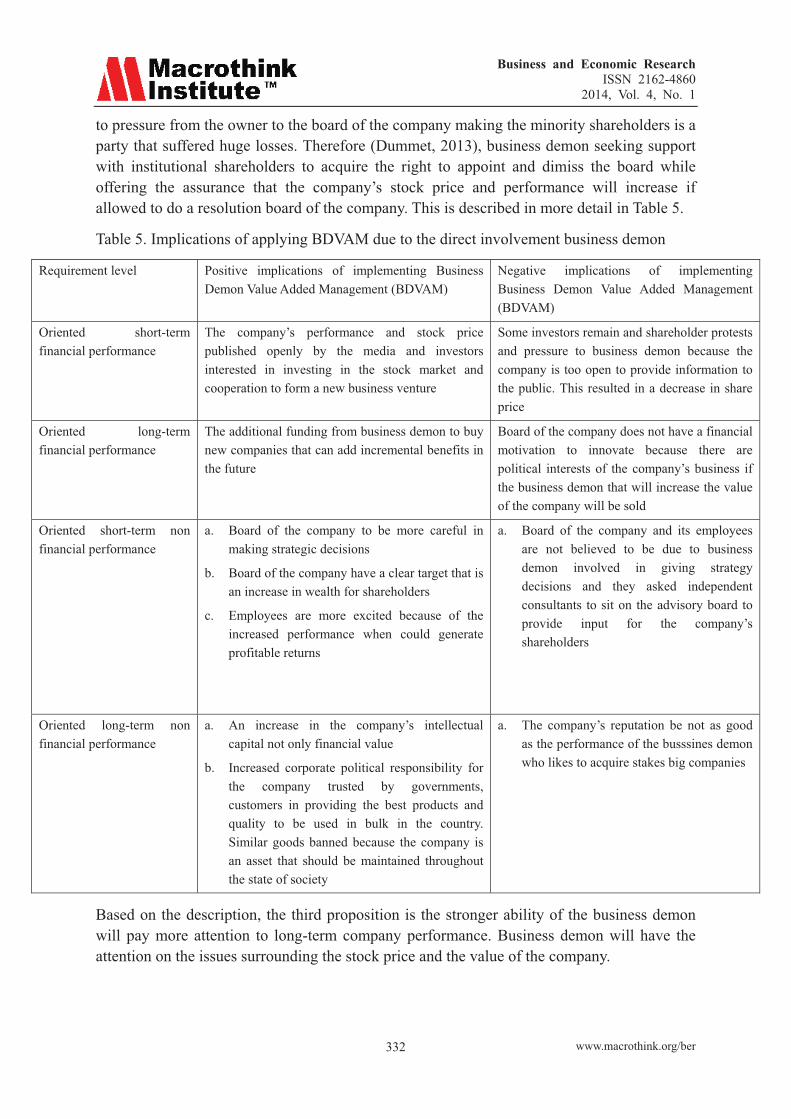
Business and Economic Research ISSN 2162-4860
2014, Vol. 4, No. 1
www.macrothink.org/ber 332
to pressure from the owner to the board of the company making the minority shareholders is a party that suffered huge losses. Therefore (Dummet, 2013), business demon seeking support with institutional shareholders to acquire the right to appoint and dimiss the board while offering the assurance that the company’s stock price and performance will increase if allowed to do a resolution board of the company. This is described in more detail in Table 5.
Table 5. Implications of applying BDVAM due to the direct involvement business demon
Requirement level Positive implications of implementing Business Demon Value Added Management (BDVAM)
Negative implications of implementing Business Demon Value Added Management (BDVAM)
Oriented short-term financial performance
The company’s performance and stock price published openly by the media and investors interested in investing in the stock market and cooperation to form a new business venture
Some investors remain and shareholder protests and pressure to business demon because the company is too open to provide information to the public. This resulted in a decrease in share price
Oriented long-term financial performance
The additional funding from business demon to buy new companies that can add incremental benefits in the future
Board of the company does not have a financial motivation to innovate because there are political interests of the company’s business if the business demon that will increase the value of the company will be sold
Oriented short-term non financial performance
a. Board of the company to be more careful in making strategic decisions
b. Board of the company have a clear target that is an increase in wealth for shareholders
c. Employees are more excited because of the increased performance when could generate profitable returns
a. Board of the company and its employees are not believed to be due to business demon involved in giving strategy decisions and they asked independent consultants to sit on the advisory board to provide input for the company’s shareholders
Oriented long-term non financial performance
a. An increase in the company’s intellectual capital not only financial value
b. Increased corporate political responsibility for the company trusted by governments, customers in providing the best products and quality to be used in bulk in the country. Similar goods banned because the company is an asset that should be maintained throughout the state of society
a. The company’s reputation be not as good as the performance of the busssines demon who likes to acquire stakes big companies
Based on the description, the third proposition is the stronger ability of the business demon will pay more attention to long-term company performance. Business demon will have the attention on the issues surrounding the stock price and the value of the company.

Business and Economic Research ISSN 2162-4860
2014, Vol. 4, No. 1
www.macrothink.org/ber 333
3.4 The Interest of Political and Business Demon Value Added Management (BDVAM)
According to Stigler (1971) in the theory of regulatory capture or private interest theory of government, academics suggested that the decision by the public officials can be influenced and distorted by political rent seeking activities undertaken by business demon in a company that does the implementation of BDVAM for increase his/her wealth. Business demon politically desirable to obtain regulatory and exchange for political donations and support voice. Regulation was not created to serve the public interest but to protect the monopoly rents. Increasingly close relationship between business demon in company with the government which is illustrated in Table 6 affect the prospects of the company now and in the future.
Table 6. The relationship between business demon with the government that affect the prospects today and in the future
Forms of cooperative relationships
Prospects of the company
Impact on intra-organizational Impact on inter-organizational
Harmonious relationship
Today a. Business demon get the ease of obtaining cheap resources, work package in the government and state facilities such as land use for business production processes
a. There is an additional distribution of dividends for the business demon and government members also serve on the board
b. The company will help launch the program and the government should facilitate a company to invest
c. Board is not performing well will be replaced by business demons
Less harmonious relationship
Today a. The company will be restricted in its movement in doing expansion of new products, or set up a new business
b. The government will lose a source of income as a result of the state can’t control the corporate tax revenue
c. The government will make the company as a target to be acquired from other big companies that are interested in investing
d. Government will instruct the anti-corruption agency to see if the business demon using state facilities and community harms
a. Board members and employees cover the space for government members who sit on the board of the company
b. The financial statements presented are not transparent for fear of government members take a personal interest in the company
Harmonious relationship
Future a. If there is a change of government, the party of government support will continue to support the company
b. The subsidiary will get a package of investment and getting more independent
a. Board of the company, the shareholders (including business demons) will try to come up with a good performance so as not to be replaced

Business and Economic Research ISSN 2162-4860
2014, Vol. 4, No. 1
www.macrothink.org/ber 334
than its parent company
c. The entry of global companies
Less harmonious relationship
Future a. The government will make the company as a target to be acquired from other big companies that are interested in investing
b. There will be a misunderstanding of the benefits that are required by the government due to absence of standard fare for the company as a contribution
a. There will be misunderstandings in interpreting prospects of the company
Based on the description, the fourth proposition is the ability of business demon in building and implementing a culture sustainable value creation is not always affect the ability of business demon in managing the company’s success in making a profit because of the political rents
3.5 Sustainability Company and Business Demon Value Added Management (BDVAM)
The global financial crisis (Rose,2010; McCarthy, Solomon, and Mihalek,2012) which occurs in addition to making the financial recession some companies are also several other companies doing massive expansion due to growth of the company in times of crisis, in addition to the government to create a new policy, minority shareholders can cooperate with other shareholders to fulfill certain criteria in ownership include more than one candidate of twenty-five percent of the contested seats. Some of the factors that led to the reason the company in recession because of the corporate governance is not good, the practice of rent-seeking corporate boards because the organizational structure is not shaped single tier or multi tier (Munster and Staal,2012), the inability of the company’s board in order to maximize political governance with all stakeholders of the company and its capital structure so that investment decisions have suffered from negative returns. It is different from other big companies that experienced growth due to the structure of share ownership is almost over and the three investors, especially minority shareholders in the company actively participate in the company in determining the company’s strategic decisions. This make business demon in investing in the company began to see that the corporate sustainability is important so that the implementation of BDVAM is need to consider internal and external factors cause the company’s sustainability (illustrated in Table 7)
Table 7. Internal and External Factors affecting the implementation of BDVAM (Business Demon Value Added Management)
Status of Company Factors that influence
If running the Business Demon Value Added Management (BDVAM)
If running the Business Demon Value Destruction Management (BDVDM)
Expanding Internal a. Limited capital firm owners
b. Lack of cooperation between the owner of the company and a business demon as a minority shareholder which offers certain advantage in term
a. Business demon wants to be involved in the operations of the company but don’t want to help the capital
b. Company’s intellectual capital (the ability of employees, brand,reputation) is not
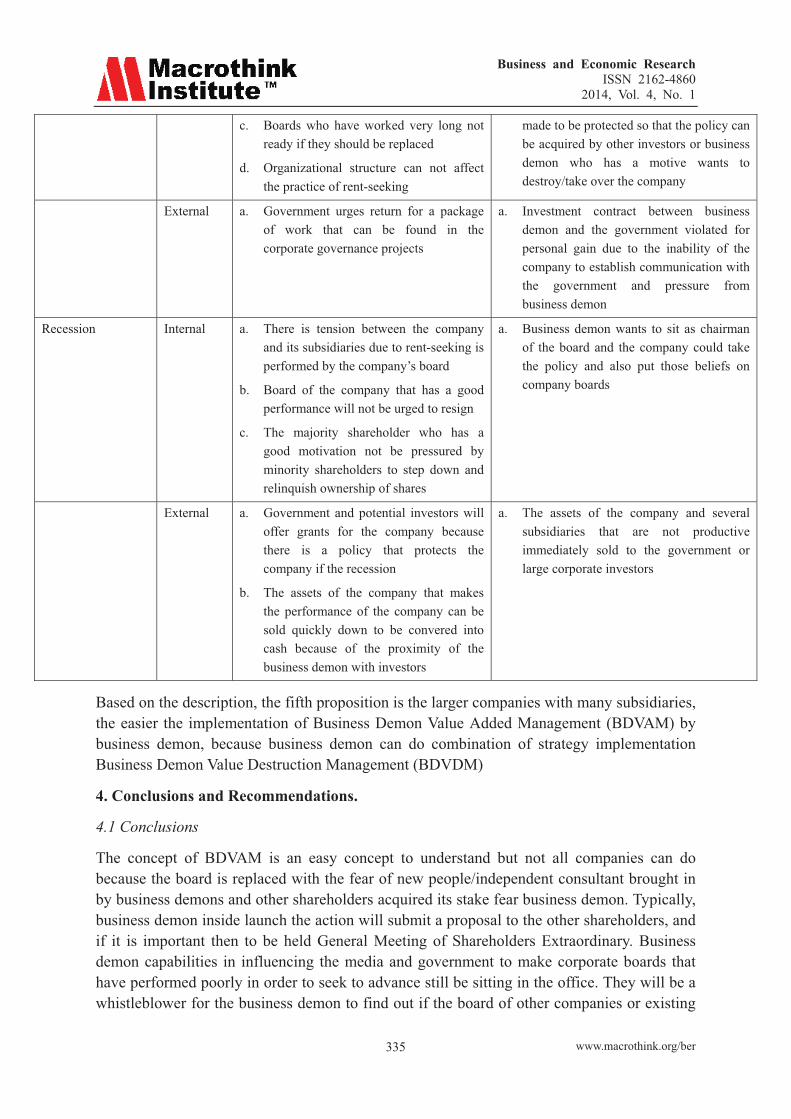
Business and Economic Research ISSN 2162-4860
2014, Vol. 4, No. 1
www.macrothink.org/ber 335
c. Boards who have worked very long not ready if they should be replaced
d. Organizational structure can not affect the practice of rent-seeking
made to be protected so that the policy can be acquired by other investors or business demon who has a motive wants to destroy/take over the company
External a. Government urges return for a package of work that can be found in the corporate governance projects
a. Investment contract between business demon and the government violated for personal gain due to the inability of the company to establish communication with the government and pressure from business demon
Recession Internal a. There is tension between the company and its subsidiaries due to rent-seeking is performed by the company’s board
b. Board of the company that has a good performance will not be urged to resign
c. The majority shareholder who has a good motivation not be pressured by minority shareholders to step down and relinquish ownership of shares
a. Business demon wants to sit as chairman of the board and the company could take the policy and also put those beliefs on company boards
External a. Government and potential investors will offer grants for the company because there is a policy that protects the company if the recession
b. The assets of the company that makes the performance of the company can be sold quickly down to be convered into cash because of the proximity of the business demon with investors
a. The assets of the company and several subsidiaries that are not productive immediately sold to the government or large corporate investors
Based on the description, the fifth proposition is the larger companies with many subsidiaries, the easier the implementation of Business Demon Value Added Management (BDVAM) by business demon, because business demon can do combination of strategy implementation Business Demon Value Destruction Management (BDVDM)
4. Conclusions and Recommendations.
4.1 Conclusions
The concept of BDVAM is an easy concept to understand but not all companies can do because the board is replaced with the fear of new people/independent consultant brought in by business demons and other shareholders acquired its stake fear business demon. Typically, business demon inside launch the action will submit a proposal to the other shareholders, and if it is important then to be held General Meeting of Shareholders Extraordinary. Business demon capabilities in influencing the media and government to make corporate boards that have performed poorly in order to seek to advance still be sitting in the office. They will be a whistleblower for the business demon to find out if the board of other companies or existing

Business and Economic Research ISSN 2162-4860
2014, Vol. 4, No. 1
www.macrothink.org/ber 336
shareholders who do monopoly rents for personal gain.
This concept also adds value for companies indirectly because the attitude of active business demon can affect policy change, but also must consider whether there are incentives that the government requested that in the future could affect the sustainability of the business and the company’s reputation in the community. Addition of a few other events, the presence of business demon in value through direct involvement using the concept of Business Demon Value Destruction Management (BDVDM) which agreed with the company’s board to rebel against the majority shareholder. Business demon trying to create a bubble stock prices by distorting the company’s policies and decisions. This is because business demon invest in the stock ownership of the other big companies either similar or not, it resulted when business demon need funds quickly then it could force companies to sell its assets in order to be able to make a profit. Addition of several studies on BDVAM suggest to the company and shareholders of the five conditions that could be a condition of success implementing BDVAM namely: (1) business demon commitment to press the company’s board with the implementation of BDVAM according to which best suits the desire to direct involvement in the company is very desirable, (2) business demon changes the behavior of the board in accordance with the company’s militaristic experience so that the company can survive and can generate additional wealth for shareholders on an ongoing basis, (3) the stronger the ability of business demon will pay more attention to long-term company performance, business demon will have the attention on the issues surrounding the stock price and the value of the company, (4) the ability of business demon in building and implementing a culture of sustainable value creation is not always affect the ability of business demon in the company’s success in managing the making a profit because of the political rents, (5) the larger companies with many subsidiaries, the easier the implementation of BDVAM by business demon because business demon can do a combination of strategy implementation of Business Demon Value Destruction Management (BDVDM).
4.2 Recommendation for Further Research
The purpose of this paper is to derive propositions about the reasons for the success and failure of implementation of BDVAM. Based on the existing literature, there are five factors that must be considered in implementing BDVAM. However, the proposition in this paper did not answer all of the phenomena associated BDVAM because BDVAM is a fairly complex issue and companies globally.The following cause BDVAM topics can still be extended in subsequent research, namely: (1) the countries of the ASEAN community 2015 that has the highest level of corruption indicator or range of countries categorized as fragile five (Brazil, India, South Africa, Turkey, and Indonesia), (2) the range of industries associated with the government, (3) the level of experience in the investment business demon stock ownership, (4) the grade levels in the world’s top ten richest people in the capital invested in the form of company stock ownership.
4.3 Recommendation for Corporate Management
From proposition of this study is expected to be a guide for the company’s board to be careful in managing the company and remain always maintain good relations with business demon

Business and Economic Research ISSN 2162-4860
2014, Vol. 4, No. 1
www.macrothink.org/ber 337
because it does BDVAM implementation could be more damaging is the company in the long run. In addition the company’s board still must perform proactive coordination with the government, especially with the commercial court did not make the opacity of financial statements that may form political responsibility of good governance.
References
Adegbite, Emmanuel, Amaeshi, Kenneth, Amao, & Olufemi. (2011). The Politics of Shareholder Activism in Nigeria. Journal Business Ethics, 105, 389-402.
Agle, B. R., Mitchell, R. K., & Sonnenfeld, J. A. (1999). Who matters to CEOs? An investigation of stakeholder attributes and salience, corporate performance, and CEO values. Academy of Management Journal, 42(3), 507-525. http://dx.doi.org/10.2307/256973
Ameer, R., Othman, R., & Mahzan, N. (2012). Information asymmetry and regulatory shortcomings in profit sharing investment accounts. International Journal of Islamic and Middle Eastern Finance and Management, 5(4), 371-387. http://dx.doi.org/10.1108/17538391211282854
Anderson, S. W., & Dekker, H. C. (2009). Strategic Cost Management in Supply Chains,Part 1: Structural Cost Management. Accounting Horizons, 23(1), 289-305. http://dx.doi.org/10.2308/acch.2009.23.3.289
Anonymous. (2007). Business: In the locust position, Shareholder activism in Japan. The Economist, 383, 80.
Anonymous. (2013). Shareholders at the gates; Corporate governance. The Economist, 406, 8826, 63-64
Anonymous. (2014). How activist shareholders turned from villains into heroes: The Economist explains. The Economist.
Aram, John D. (1989). Attitudes and behaviors of informal investors toward early-stage investing, Technology-based ventures, and co-investors. Journal of Business Venturing, 4(5), 333-347. http://dx.doi.org/10.1016/0883-9026(89)90005-0
Ardichvili, A., R. N. Cardozo, K. Tune, & J. Reinach. (2002). The role of angel investors in the assembly of non-financial resources to new ventures: Conceptual frameworks and empirical evidence. Journal of Enterprising Culture, 10(1), 39-65. http://dx.doi.org/10.1142/S021849580200013X
Arthurs, Jonathan. D., Busenitz, & Lowell. W.(2003). The Boundaries and Limitations of Agency Theory and Stewardship Theory in the Venture Capitalists/Entrepreneur Relationship. Entrepreneurship Theory and Practice Journal, Bayor University. http://dx.doi.org/10.1046/j.1540-6520.2003.00036.x
Barac, Zeljana Aljinovic, Markota, Ljerka, Belak, & Vinko. (2013). Business Value Added Management and Company’s Financial Performance. The Business Review, Cambridge, 21(1), 237-243
Business and Economic Research ISSN 2162-4860
2014, Vol. 4, No. 1
www.macrothink.org/ber 338
Barber, B. M. (2006). Monitoring the monitor: Evaluating CalPERS ‘shareholder activism. Journal of Investing, 16, 66-80. http://dx.doi.org/10.3905/joi.2007.698965 http://dx.doi.org/10.3905/joi.2007.698965
Becker, B., & Gerhart, B. (1996). The impact of human resource management on organizational performance: progress and prospects. Academy of Management Journal, 39(4), 770-801. http://dx.doi.org/10.2307/256712
Beckhard, R., & Dyer, G. W. (1983). Managing continuing in the family owned Organizational Dynamic, 11, 5-12. http://dx.doi.org/10.1016/0090-2616(83)90022-0
Bates, Steve. (2009). Report: Prepare For Increased Shareholder Activism. HR Magazine, 54(6), 32.
Becht, M., Franks, J., Mayer, C., & Rossi, S. (2010). Returns to shareholder activism: Evidence from a clinical study of Hermes UK Focus Fund. Review of Financial Studies, 22, 3093-3129. http://dx.doi.org/10.1093/rfs/hhn054
Belak, V; Aljinovic Barac, Z., & Tadic, I (2009). Recognition and measurement of human capital expenditures - impacts on company's performance measurement. International Journal of Economics and Business Research, 1, 2, 252-262. http://dx.doi.org/10.1504/IJEBR.2009.024023
Benjamin, Gerald A., & Magulis, Joel (2001). The angel investor’s handbook. Princeton, NJ: Bloomberg Press.
Bennett, Bruce C.(2008). Reflections on Indenture Remedies and Investor Protection. Insights; The Corporate & Securities Law Advisor, 22(2), 11-22.
Benoit, David. (2014). New Push to Throw Assets Overboard. Easter Edition, C.1.
Benoit, David., Chung, Juliet. (2014). Activist Presses Tribune To Sell Assets. Eastern Edition, 24, B1.
Berglas, Steven. (1998). The entrepreneurial avenger. ABI/INFORM Research,20 (11),35.
Bezemer, P.-J., Peij, S. C., Maassen, G. F., & Van Halder, H. (2010). The Changing Role of the Supervisory Board Chairman: The Case of the Netherlands (1997-2007). Journal of Management and Governance.
Boselie, P. Dietz, G., Boon, C. (2005). Commonalities and contradictions in HRM and performance research. Human Resource Management Journal, 15(3), 67-94. http://dx.doi.org/10.1111/j.1748-8583.2005.tb00154.x
Brav, A., Jiang, W., Partnoy, F., & Thomas, R. (2008). Hedge fund activism, corporate governance, and firm performance. Journal of Finance, 63, 1729-1775. http://dx.doi.org/10.1111/j.1540-6261.2008.01373.x
Brophy, David J., & Shulman, Joel M. (1992). A finance perspective on entrepreneurship research. Entrepreneurship: Theory and Practice, 16, 61-71.

Business and Economic Research ISSN 2162-4860
2014, Vol. 4, No. 1
www.macrothink.org/ber 339
Budsaratragoon, Pornanong, Lhaopadchan, Suntharee, & Hillier, David. (2010). Institutional Shareholder Activism and Limited Investor Attention. Review of Behavioral Finance, 2, 106-124. http://dx.doi.org/10.1002/rbf.12
Burr, Barry B. (2012). Managers increasing activism on governance-but quitetly. Pensions & Investments, 40(6).
Bhattacharya, S. (1979). Imperfect Information, Dividend Policy and the Bird-in-Hand fallacy. The Bell Journal of Economics, 10, 259-270. http://dx.doi.org/10.2307/3003330
Burke, E. M. (1999). Corporate community relations: The principle of the neighbor of choice. Westwood, CT: Praeger.
Burton, M. D., & O'Reilly, C. (2000). The impact of high commitment values and practices on technology slart-ups (Working Paper). Cambridge, MA: MIT Sloan School of Management.
Caton, Gary L., Goh, Jeremy, Donaldson, Jeffrey. (2001). The effectiveness of Institutional activism. Financial Analysts Journal, 57(4), 21-26. http://dx.doi.org/10.2469/faj.v57.n4.2462
Cheffins, Brian R, Armour, John. (2011). The Past, Present, and Future of Shareholder Activism by Hedge Funds. Journal of Corporation Law, 37(1),51-103.
Cheng, C. S. A., Huang, H. H., Li, Y., & Lobo, G. (2010). Institutional monitoring through shareholder litigation. Journal of Financial Economics, 95,345-383.
Cloke., K., Goldsmith, J. (2002). The End of Management, Jossey-Bass, San Francisco, CA.
Cockerill, Chris. (2002). Devil or Angel? Euromoney 400, 30-33.
Corlette, J. A. (1989). The "modified vendetta sanction" as method of corporate collective punishment. Journal of Business Ethics, 8, 937-942. http://dx.doi.org/10.1007/BF00383428
Crispin, S. W. (2002). Political connections. Far Eastern Economic Review, 165(21), 33.
Curtis, Abraham. (2003). Angel of Africa. New Scientists, 177. 2385, 50-53.
Davidson, W. N., Worrell, D. L., & El-Jelly, A. (1995). Influencing managers to change unpopular corporate behavior through boycotts and divestitures: A slock market test. Business & Society, 34, 171-196. http://dx.doi.org/10.1177/000765039503400204
Davis, B. (2001). Chairman’s deep political conncections run silent. Wall Street Journal Eastern Edition, 238, A10.
DeAngelo, H., & L. DeAngelo. (1989). Proxy Contests and the Governance of Publicly Held Corporations. Journal of Law and Economics, 23,29-59.
Del Guercio, D., & Hawkins, J. (1999). The motivation and impact of pension fund activism. Journal of Financial Economics, 52, 293-340. http://dx.doi.org/10.1016/S0304-405X(99)00011-2
Del Guercio, D., Seery, L., & Woidtke, T. (2008). Do boards pay attention when institutional

Business and Economic Research ISSN 2162-4860
2014, Vol. 4, No. 1
www.macrothink.org/ber 340
investor activists ‘‘just vote no’’?. Journal of Financial Economics, 90, 84-103. http://dx.doi.org/10.1016/j.jfineco.2008.01.002
Denis, D. J. (2004). Entrepreneurial Finance: An Overview of the Issues and Evidence. Journal of Corporate Finance, 10, 301-326. http://dx.doi.org/10.1016/S0929-1199(03)00059-2
Dummett, Ben (2013). Activist Shareholder Wants Board Seats At Canada’s Sherritt; Key Shareholder Dissapointed With Stock Price and Company’s Operational Performance. Wall Street Journal (Online), n/a.
Durnev, Art, Randall Morck, & dan Bernard Yeung, (2004), Value-enhancing capital budgeting and firm specific stock return variation, Journal of Finance, 59,65-105. http://dx.doi.org/10.1111/j.1540-6261.2004.00627.x
Duxbury, Linda, Haines, George, & Riding, Allan (1996). A personality profile of Canadian informal investors. Journal of Small Business Management, 34(2), 44-55.
Dyer, W. G., Jr., & Sanchez, M. (1998). Current state of family business theory and practice as reflected in Family Business Review, 1998-1997, Family Business Review, 11,287-296. http://dx.doi.org/10.1111/j.1741-6248.1998.00287.x
Eisenhardt, K. (1989). Agency theory: An assessment and review. Academy of Management Review,14(1),57-74
English, P. C., II, Smythe, T. I., & McNeil, C. R. (2004). The “CalPERS effect” revisited. Journal of Corporate Finance, 10,157-174. http://dx.doi.org/10.1016/S0929-1199(03)00020-8
Ertimur, Y., Ferri, F., & Stubben, S. R. (2010). Board of directors’ responsiveness to shareholders: Evidence from shareholder proposals. Journal of Corporate Finance, 16, 53-72. http://dx.doi.org/10.1016/j.jcorpfin.2009.07.005
Faccio, Mara. (2006). Politically connected firms. American Economic Review, 96, 369-386. http://dx.doi.org/10.1257/000282806776157704
Faccio, Mara, John J. McConnell, & Ronald W. Masulis. (2006). Political connections and corporate bailouts. Journal of Finance, 61, 2597-2635.
Fama, E. F., & Miller, M. H. (1972). The theory of finance. New York: Holt, Rinehart and Winston.
Feldman, S. J., Soyka, P. A., & Ameer, P. G. (1997). Does improving a firm's environmental management system and environmental performance result in a higher stock price? Journal of Investing, 6(4), 87-97. http://dx.doi.org/10.3905/joi.1997.87
Fernandez, P. (2012). Revenue Disruption: Game-Changing Sales and Marketing Strategies to Accelerate Growth. Hoboken, New Jersey:John Wiley & Sons.
Filbeck, Greg, Leee Sharon. (2000). Financial Practices in Family Business. Family Business
Business and Economic Research ISSN 2162-4860
2014, Vol. 4, No. 1
www.macrothink.org/ber 341
Review, 13(3), 201-216. http://dx.doi.org/10.1111/j.1741-6248.2000.00201.x
Filippello, A Nicholas. (1993). Giving investor the facts. Chemical Business, 15.
Fisman, Raymond. (2001). Estimating the value of political conncetions. American Economic Review, 91, 1095-1102. http://dx.doi.org/10.1257/aer.91.4.1095
Foss, N., Foss, K. and Vazquez-Vicente, X.H. (2003).'Tying the manager's hands': how firms can make credible commitments that make opportunistic managerial intervention less likely, DRUID Working Paper 2003-10, Copenhagen Business School.
Freear, John, & Wetzel, William (1989). Equity capital for entrepreneurs. In Frontiers of Entrepreneurship Research 1989. Babson Park, Mass.: Babson College.
Freear, John, Sohl, Jeffrey, & Wetzel, William (1990). Raising venture capital: entrepreneurs’ view of the process. In Frontiers of Entrepreneurship Research 1990. Babson Park, Mass.: Babson College.
Freear, John, Sohl, Jeffrey, & Wetzel, William (1991). Raising venture capital to finance growth. In Frontiers of Entrepreneurship Research 1991. Babson Park, Mass.: Babson College.
Freear, John, Sohl, Jeffrey, & Wetzel, William (1992). The investment attitudes, behavior and characteristics of high net worth individuals. In Frontiers of Entrepreneurship Research 1992. Babson Park, Mass.: Babson College.
Freear, John, Sohl, Jeffrey, & Wetzel, William (1994). Angels and non-angels: Are there differences? Journal of Business Venturing, 9(2), 109-123. http://dx.doi.org/10.1016/0883-9026(94)90004-3
Freear, John, Sohl, Jeffrey, & Wetzel, William (1995). Angels: personal investors in the venture capital market. Entrepreneurship & Regional Development, 7, 85-94. http://dx.doi.org/10.1080/08985629500000005
Freear, John, Sohl, Jeffrey, & Wetzel, William (1996). The informal venture capital market: milestones passed and the road ahead. Paper presented at the fourth State of the Art in Entrepreneurship Research Conference, May 9-11, 1996.
Freear, J., J. E. Sohl, and W. E. Wetzel. (1997). The informal venture capital market: Milestones passed and the road ahead. In Entrepreneurship 2000, ed. D.L. Sexton and R.W. Smilor, 47-69. Chicago: Upstart Publishing Company.
French, P. (1984). Collective and Corporate Responsibility. Columbia University Press, New York.
Friedman, Milton., Anna, Jacobson. (1963). A Monetary History of the United States,1867-1960, Princeton: Princeton University Press.
Frooman, J. (1999). Stakeholder influence strategies. Academy of Management Review, 24(2), 191-205.

Business and Economic Research ISSN 2162-4860
2014, Vol. 4, No. 1
www.macrothink.org/ber 342
Gaston, R. J. (1989). The scale of informal venture capital markets. Small Business Economics, 1, 223-230. http://dx.doi.org/10.1007/BF00401859
Gee, Erin Preston. (2002). Three strategies to improve your bottom line. Healthcare Executive, 17(4), 8-13.
Gibson, K. (1995). Fictitious Persons and Real Responsibilities. Journal of Business Ethics,14(9), 761-767. http://dx.doi.org/10.1007/BF00872329
Gillan, S. L., &Starks, L. T. (2000). Corporate governance proposals and shareholder activism: The role of institutional investors. Journal of Financial Economics, 57, 275-305. http://dx.doi.org/10.1016/S0304-405X(00)00058-1
Gombola, Michael J, Feng-Ying, Liu (1999). The signaling power of specially designated dividends. Journal of Financial and Quantitative Analysis, 34(3), 409-424. http://dx.doi.org/10.2307/2676266
Goodpaster, K. (1983). The concept of Corporate Responsibility. Journal of Business Ethics, 2(1), 122. http://dx.doi.org/10.1007/BF00382708
Gordon, L., & J. Pound, (1993). Information, Ownership Structure, and Shareholder Voting: Evidence from Shareholder-Sponsored Corporate Governance Proposals. Journal of Finance, 48(2), 697-718. http://dx.doi.org/10.1111/j.1540-6261.1993.tb04734.x
Graves, S. B., Rehbein, K. A., & Waddock, S. A. (2001). Fad and fashion's shareholder activism: The landscape of shareholder resolutions, 1988-1998. Business and Society Review, 106(4), 293-315. http://dx.doi.org/10.1111/0045-3609.00117
Gray, John. (2003). Shareholder No. 1. Canadian Business, 76, 14.
Greenwood, R., & Schor, M. (2009). Investor activism and takeovers. Journal of Financial Economics, 92, 362-375. http://dx.doi.org/10.1016/j.jfineco.2008.05.005
Gunawan, J., Scheela, W., Wessiani, N. A., & Luthfiyah, M. (2011). Promoting entrepreneurship research and education about business angels in Indonesia. A paper presented at the UNESCO-APIED International Conference, Jakarta, Indonesia, December, 6-8.
Gul, Ferdinan A., Jeong-Bon Kim, & dan Annie A. Qiu, (2010), ownership concentration, foreign shareholding, audit quality, and stock price synchronicity: evidence from China, Journal of Finance, 95, 425-442.
Gupta, A. K., & Govindarajan, V. (1991). 'Knowledge flows and the structure of control within multinational firms', Academy of Management Review 16(4), 768-792. http://dx.doi.org/10.1002/(SICI)1097-0266(200004)21:4<473::AID-SMJ84>3.0.CO;2-I
Gupta, A. K., & Govindarajan, V. (2000). 'Knowledge flows within multinational corporations', Strategic Management Journal 21(4), 473-496.
Habib, M., & Zurawicki, L. (2002). Corruption and Foreign Direct Investment. Journal of

Business and Economic Research ISSN 2162-4860
2014, Vol. 4, No. 1
www.macrothink.org/ber 343
International Business Studies, 33, 291-308. http://dx.doi.org/10.1057/palgrave.jibs.8491017
Habib, M., & Zurawicki, L. (2005). Corruption and Its Effect on Trade and FDI, in: Global Corruption Report 2005, Berlin: Transparency International, 305-307.
Harr, N. E., J. Starr, & I. C. MacMillan. (1988). Informal risk capital investors: Investment patterns on the east coast of the USA. Journal of Business Venturing, 3, 11-29. http://dx.doi.org/10.1016/0883-9026(88)90027-4
Harrison, Richard T., Dibben, Mark R., & Mason, Colin M. (1997). The role of trust in the informal investor’s decision: an exploratory analysis. Entrepreneurship: Theory and Practice, 21(4), 63-81.
Hasan, M. (2013). Sustainable Supply Chain Management Practices and Operational Performance. American Journal of Industrial and Business Management, 3, 42-48. http://dx.doi.org/10.4236/ajibm.2013.31006
Hill, Brian E., & Power, Dee. (2002). Attracting Capital From Angels. New York: John Wiley & Sons.
Hillman, A., & Keim, G. D. (2001). Shareholder value, stakeholder management, and social issues: What's the bottom line? Strategic Management Journal, 22(2), 125-139. http://dx.doi.org/10.1002/1097-0266(200101)22:2<125::AID-SMJ150>3.0.CO;2-H
Hindle, K., & Lee, L. (2002). An exploratory investigation of informal venture capitalists in Singapore. Venture Capital, 4(2), 169-181. http://dx.doi.org/10.1080/13691060110091255
Hindle, K., & R. Wenban. (1999).Australia’s informal venture capitalists: An exploratory profile. Venture Capital, 1(2), 169-186. http://dx.doi.org/10.1080/136910699295956 Hoontrakul, Pongsak (2001). Angel Financing. A presentation at 123 Forum. Hoskin, K., & Macve, R. (1990). Understanding modern management. University of Wales Business and Economics Review, 5, 17-23.
Huang, S. Y., Hung, Y. C., Lin, C. C., & Tang, LJ. (2009): The effects of innovative capacity and capital expenditures on financial performance, International Journal of Innovation and Learning, 6(3), 323-341. http://dx.doi.org/10.1504/IJIL.2009.023294
Hunt, A.R. (2002). A scandal centerpiece: Enron’s political connections. Wall Street Journal Eastern Edition, 239, A15.
Huselid, M. A. (1995). The impact of human resource management practices on turnover, productivity, and corporate financial performance. Academy of Management Journal, 38, 647-672. http://dx.doi.org/10.2307/256741
Huselid, M. A., Jackson, S. E., & Schuler, R. S. (1997). Technical and strategic human resource management effectiveness as determinants of firm performance. Academy of Management Journal, 40(1), 171-188. http://dx.doi.org/10.2307/257025
Husnan, Suad. (2001). Indonesia, in Corporate Governance and Finance in East Asia, Asian Development Bank.
Business and Economic Research ISSN 2162-4860
2014, Vol. 4, No. 1
www.macrothink.org/ber 344
Hutton, Amy P., Alan J. Marcus, & Hassan Tehranian. (2009). Opaque financial reports, R2, and crash risk. Journal of Financial Economists, 94, 67-86. http://dx.doi.org/10.1016/j.jfineco.2008.10.003
Ibrahim, Darian. (2008). The (Not So) Puzzling Behavior of Angel Investor. Vanderbilt Law Review, 61(5), 1403.
Ichniowski, C., & Shaw, K. ( 1999). The effects of human resource management systems on economic performance: An international comparison of US and Japanese plants. Management Science, 45(5), 704-721. http://dx.doi.org/10.1287/mnsc.45.5.704
Jin, Li, & Stewart C. Myers. (2006). R2 around the world: new theory and new tests. Journal of Financial Economics, 67, 351-382
Jones, N., H, Jones, L. Steer, & A. Datta. (2009a). Improving Impact Evaluation Production and Use. Working Paper 300.
Kaplansky, G., & Levy H. (2010). Sentiment and stock prices: The case of aviation disasters. Journal of Financial Economics, 95, 174-201. http://dx.doi.org/10.1016/j.jfineco.2009.10.002
Kapner., D. A. (2003). Alcohol and other drugs on campus: The scope of the problem (The Higher Education Center for Alcohol and other Drug Prevention Infofacts). Washington, D.C, The U.S. Department of Education
Kelly, L. M., Athanassious, N., Crittenden, W. F. (2000). Founder centrality and the strategic behavior in the family-owned firm. Entrepreneurship Theory & Practices, 25(2), 27-42.
Kelly, P. (2000). Private investors and entrepreneurs: How context shapes their relationship. Doctoral Diss., Foundation for Entrepreneurial Management London Business School, London.
Kelly, P., & Hay, M. (2000). Deal Makers: Reputation Attracts Quality. Venture Capital, 2, 183-202. http://dx.doi.org/10.1080/13691060050135073
Kelly, Ross. (2013). Shareholder Activism Rises Down Under; The Most Recent Target is Seen as a Test of Activism Efficacy for Larger Companies. Wall Street Journal. [Online]Available: online.wsj.com.
Kim, W., Kim, W., & Kwon, K.S. (2009). Value of outside blockholder activism: Evidence from the switchers. Journal of Corporate Finance, 15, 505-522. http://dx.doi.org/10.1016/j.jcorpfin.2009.04.002
Klein, A., & Zur, E. (2009). Entrepreneurial shareholder activism: Hedge funds and other private investors. Journal of Finance, 64, 187-229. http://dx.doi.org/10.1111/j.1540-6261.2008.01432.x
Korhonen, Andreia. (2009). Business Angels in Brazil: Starting up a venture to unite Brazilian entrepreneurs and foreign investors. Final Thesis Report, Tampereen Ammattikorekeakoulu, University of Applied Sciences, 1-38.

Business and Economic Research ISSN 2162-4860
2014, Vol. 4, No. 1
www.macrothink.org/ber 345
Kreuger, A. (1974). The political economy of the rent seeking society. American Economic Review, 64, 291-303.
Kutsuna, K., & N. Harada. (2004).Small business owner-managers as latent informal investors in Japan: Evidence from a country with a bank-based financial system. Venture Capital, 6(4), 283-311. http://dx.doi.org/10.1080/1369106042000282574
Landstrom, H. (1992). The relationship between private investors and small firms: An agency theory approach. Entrepreneurship and Regional Development, 4, 193-223. http://dx.doi.org/10.1080/08985629200000012
Lantz, J., & Sahut, J. (2009).Active Financial Intermediation and Market Efficiency: The Case of Fast-Growing Firms Financed by Venture Capitalists.International Journal of Business, 4, 321-339.
Lantz, J., Montandrau, Sophie, & Sahut, J. (2010). Activism of Institutional Investors, Corporate Governance Alerts and Financial Performance. International Journal of Business, 15(2), 221-240.
Lee, Brian., Seo, & Duk Soo. (2009). Reforms in the Korean Financial Reporting Systems and Earnings Quality. Asia-Pacific Financial Markets Research, 17, 51-61, Springer.
Lee, D. W., & Park, K. S. (2009). Does institutional activism increase shareholder wealth? Evidence from spillovers on non-target companies. Journal of Corporate Finance, 15, 488-504. http://dx.doi.org/10.1016/j.jcorpfin.2009.03.002
Lin, Dan; Lin, Lu. (2014). The Interplay between Director Compensation and CEO Compensation. The International Journal of Business and Finance Research, 8(2), 11-26.
Linde, Lucinda, & Prasad, Alok (2000). Venture Support Systems Project: Angel investors. Unpublished manuscript, MIT Entrepreneurship Center.
Lipton, Martin. (2007). Shareholder Activism and the ‘Eclipse of The Public Corporation’. Insights; The Corporate & Securities Law Advisor, 21(2),36-40.
Lublin, Joann S. (2011). Directors Must Decide Whether to Move to Conventional Form of Governance. Wall Street Journal, Eastern Edition, New York.
Madill, J. J., G. H. Haines, & A. L. Riding. (2005). The role of angels in technology SMEs: A link to venture capital. Venture Capital, 7(2), 107-129. http://dx.doi.org/10.1080/1369106042000316341
MacGregor, James, Campbell, Ian. (2008). Dealing with investor activism: Investors seek cash returns from pushing your buttons-There are things you can do to prepare for an attack. International Journal of Disclosure and Governance, 5(1), 23-35. http://dx.doi.org/10.1057/palgrave.jdg.2050070
Manzoor, Amir. (2013). Hermitage Fund: Shareholder Activism and Corporate Governance. Journal of Business Studies Quarterly,4(4), 26-46.
Business and Economic Research ISSN 2162-4860
2014, Vol. 4, No. 1
www.macrothink.org/ber 346
Mason, C. M., & R. T. Harrison. (1994). Informal venture capital in the UK. In Finance and the small firm, ed. A. Hughes and D. J. Storey. 64-111. London: Routledge.
Mason, C., R.T. Harrison, & J. Chaloner.(1991). Informal risk capital in the UK: A study of investor characteristics, investment preferences and investment decision-making. Venture Finance Research Project, Working Paper No. 2, University of Southampton (UK) and University of Ulster at Jordanstown (Northern Ireland).
Maula, Markku, Autio, Erkko, & Arenius, Pia (2003). What drives micro-angel investments? A large sample study of the factors explaining micro-angel investments. Working Paper Series 91-WP-2003-001. Espoo, Finland: Helsinki Univeristy of Technology.
McCarthy, Marry, Solomon, Paul, Mihalek, Paul. (2012). Financial Crisis During 2007 and 2008: Efficient Markets or Human Behavior?. Journal of Applied Business Research, 28(6), 1275-1281
Miller, M., & K. Rock. (1985). Dividend Policy under Asymmetric Information, Journal of Finance, 40, 1031-1051. http://dx.doi.org/10.1111/j.1540-6261.1985.tb02362.x
Mobarak, Ahmed Mushfiq and Denni Puspa Purbasari. (2005). Political trade protection in developing countries: firm level evidence from Indonesia, Working Paper, University of Colorado at Boulder.
Morck, Randall, & Bernard Yeung. (2004). Family control and te rent seeking society. Entrepreneurship Theory and Practice, 28, 391-409. http://dx.doi.org/10.1111/j.1540-6520.2004.00053.x
Moyer., R. Charles, Rao, P. Ramesh., Regnard, Jean Francois. (1996). Signalling and Mimicry: The Evidence from Firim Goal Definition. Managerial Finance, 22(8), 3-17. http://dx.doi.org/10.1108/eb018573
Munck, C., Saublens, C. (2005). Introduction to Business Angels and Business Angels Network Activities in Europe. European Business Angel Network.
Munster, Johannes., Staal, Klaas. (2012). How organizationa structure can reduce rent-seeking. Public Choice, 150(3-4), 579-594. http://dx.doi.org/10.1007/s11127-010-9717-3
Nelson, J. M. (2006). The “CalPERS effect” revisited again. Journal of Corporate Finance, 12, 187-213. http://dx.doi.org/10.1016/j.jcorpfin.2005.07.002
Nelson, Jacqueline. (2012). A New Wave of Activism. Canadian Business,85(3), 14.
Miles, R. H. (1987). Managing the corporate social environment: A grounded theory. Englewood Cliffs, NJ: Prentice Hall.
Myles, Danielle. (2011). How shareholder activism has changed. International Financial Law Review,n/a.
O'Reilly, C., & Pfeffer, J. (2000). Hidden value: How great companies achieve extraordinary results with ordinary people. Boston: Harvard Business School Press.

Business and Economic Research ISSN 2162-4860
2014, Vol. 4, No. 1
www.macrothink.org/ber 347
Paul, K., & Lydenberg, S. D. (1992). Applications of corporate social monitoring systems. Journal of Business Ethics, 11, 1-10. http://dx.doi.org/10.1007/BF00871986
Paul, S., G. Whittam, & J. B. Johnston. (2003). The operation of the informal venture capital market in Scotland. Venture Capital, 5(4), 313-335. http://dx.doi.org/10.1080/1369106032000141931
Pfeffer, J., & Veiga, J. F. (1999). Putting people first for organizational success. Academy of Management Executive, 13(2), 37-48.
Piotroski, J. D., T. J. Wong, & T. Zhang. (2010). Political incentives to suppress negative financial information: evidence from state-controlled Chinese firms. Working Paper.
Piontkowski, J. O.; Hoffian, ?.; Lachmann, M.; Schuchardt, L. D. (2012): Determinants of the Implementation and Long-Term Use of Interorganizational Cost Management Tools - An Experimental Investigation. In Davila, ?.; Epstein, M.J.; Manzoni, J.F. (ed.) Performance Measurement and Management Control: Global Issues (Studies in Managerial and Financial Accounting, Volume 25), Emerald Group Publishing Limited, 223-246
Politis Diamanto.(2008).Business angels and value added: what do we know and where do we go?. Journal of Venture Capital, 10, 127-147. http://dx.doi.org/10.1080/13691060801946147
Purwoto, Lukas. (2011). Pengaruh koneksi politis, kepemilikan pemerintah, dan keburaman laporan keuangan terhadap kesinkronan dan risiko crash harga saham, Disertasi, Universitas Gadjah Mada, Jakarta.
Rahardjo, Hartono, Idrus, M. S., Hadiwidjojo, Djumilah, & Aisjah, Siti. (2013).Factors that Determines the Success of Corporate Sustainability Management. Journal of Management Research, 5, 2
Ranken, N. (1987). Corporations as Persons: Objectives to Goodpaster’s “Principle of Moral Projection”. Journal of Business Ethics, 6(8), 633-637. http://dx.doi.org/10.1007/BF00705779
Rassoul Y.(2006).Behavioral Finance and Entrepreneurial Finance, The Journal of Entrepreneurial Finance and Business Ventures, 11, 1-3.
Ragnar, Andreas Severinsen, Marius, Monsen Ragnoy, Lars, Dybvik. (2012). Business Angels & Non-Financial Contributions. Journal of NTNU School of Entrepreneurship, 1-134.
Rédis, J. (2009). The Impact of Business Model Characteristics on IT Firms' Performance. International Journal of Business, 14, 291-307.
Rehbein, Kathleen, Waddock, Sandra, Graves, Samuel B. (2004). Understanding Shareholder Activism: Which Corporations Are Targeted?. Business and Society, 43(3), 239-267. http://dx.doi.org/10.1177/0007650304266869
Reitan, B., and R. Sorheim.(2000). The informal venture capital market in Norway: Investor characteristics, behavior and investment preferences. Venture Capital, 2(2), 129-141.

Business and Economic Research ISSN 2162-4860
2014, Vol. 4, No. 1
www.macrothink.org/ber 348
http://dx.doi.org/10.1080/136910600295747
Riding, A., & Short, D. (1987). On the estimation of the investment potential of informal investors: a capture-recapture approach. Journal of Small Business and Entrepreneurship, 5(4), 26-40.
Rochlin, S. A., & Christoffer, B. (2000). Making the business case: Determining the value of corporate community involvement. Chestnut Hill, MA: Boston College Center for Corporate Community Relations.
Romano, R, (2001). Less is More: Making Institutional Investor Activism a Valuable Mechanism of Corporate Governance. Yale Journal of Regulation, 18,174-251.
Rowley, T. J., & Moldoveanu, M. (2003). When will stakeholders groups act? An interest and identity based model of stakeholder group mobilization. Academy of Management Review, 28(2), 204-219.
Rose, Paul (2010). Common Agency and The Public Corporation. Vanderbilt Law Review, 63(5)-1355-1417.
Salzman, Avi. (2013). How to Profit From Today’s Shareholder Activism. Barron’s, 93, 25-26,28.
Scheela, William and Isidro,Edmundo. (2012).Business Angel Investing in Emerging Economies: Policy Implications for Southeast Asia. Kauffman Foundation’s International Research and Policy Roubtable.
Shleifer, Andrei dan Robert W. Vishny, 1994, Politicians and firms, Quarterly Journal of Economics 109,995-1025.
Solh, M. (2000).Fonds de pension et politique d’investissement a long terme des enterprises. Doctorate Thesis in Management Science, University of Paris E Naterre..
Sohl, Jeffrey E. (2004). The angel investor market in 2003: The angel market rebounds, but a troublesome post seed funding gap deepens.
Sonfield, Matthew C., Lussier, Robert N. (2004). First-, Second-, and Third-Generation Family Firms: A Comparison. Family Business Review, 17(3), 189. http://dx.doi.org/10.1111/j.1741-6248.2004.00013.x
Sørheim, R., and H. Landström (2001). "Informal Investors-A Categorisation, with Policy Implications," Entrepreneurship and Regional Development 13, 351-370. http://dx.doi.org/10.1080/08985620110067511
Sorheim, Roger. (2005). Business angels as facilitators for further finance: an exploratory study. Journal of Small Business and Enterprise Development, 12(2), 178-191. http://dx.doi.org/10.1108/14626000510594593
Stedler, H.R., and H.H. Peters. (2003). Business angels in Germany: An empirical study. Venture Capital, 5 (3), 296-276. http://dx.doi.org/10.1080/1369106032000126596
Business and Economic Research ISSN 2162-4860
2014, Vol. 4, No. 1
www.macrothink.org/ber 349
Stigler, George J., (1971) The theory of economic regulation, Bell Journal of Economics and Management Science, 2, 3-21. http://dx.doi.org/10.2307/3003160
Sullivan, Mary Kay (1991). Entrepreneurs as informal investors: Are there distinguishing characteristics? In Frontiers of Entrepreneurship 1991. Babson Park, Mass.: Babson College.
Sullivan, Mary Kay, & Miller, Alex (1990). Applying theory of finance to informal risk capital research: promise and problems. In Frontiers of Entrepreneurship 1990. Babson Park, Mass.: Babson College.
Sullivan, Mary Kay, & Miller, Alex (1996). Segmenting the informal venture capital market: economic, hedonistic, and altruistic investors. Journal of Business Research 36(1), 25-35. http://dx.doi.org/10.1016/0148-2963(95)00160-3
Suomi, M., & A. Lumme. (1994). Yksityishenkilo¨ iden pa¨ a¨ omasijoittaminen Suomessa. Informal venture capital in Findland. SITRA, 141, Helsinki.
Sussland, Willy A. Business value and corporate governance: a new approach. The Journal of Business Strategy, 25(1), 49-56.
Sutter, Daniel. (1999). Politician’s motives in the rent seeking society. Managerial Finance, 25(3-4), 38-52. http://dx.doi.org/10.1108/03074359910766424
Tadic, 1. (2010): Human Capital Practices in Different Industries in Croatia. The Business Review Cambridge, 15(2), 239-246
Talbot, Philip A. (2003). Management organisational history-a military lesson?. Journal of European Industrial Training, 27(7), 330-340. http://dx.doi.org/10.1108/03090590310490007
Taluni, T., Van Ryzin, GJ. (2005). The Theory and Practice of Revenue Management.New York. Springer.
Tashiro, Y. (1999).Business angels in Japan. Venture Capital, 1(3), 259-273. http://dx.doi.org/10.1080/136910699295893
Tetlock, P.C. (2007). Giving content to investor sentiment: The role of media in the stock market. Journal of Finance, 62, 1139-1168. http://dx.doi.org/10.1111/j.1540-6261.2007.01232.x
Tilson, Whitney, & Heins, John (2011). The Value of Shareholder Activism. Kiplinger’s Personal Finance, 65(5).
Tim,Baldenius.,Nahum,Melumad., Xiaojing Meng. (2010). Advising and Monitoring CEOs: The Dual Role of Boards. AAA 2011 Management Accounting Section Meeting Paper.
Ting, Hsiu-I. (2006). When Does Corporate Governance Add Value? The Business Review, Cambridge, 5(2), 196-203.
Turner, Matt. (2007). Setting Shareholder-Focused Performance Targets. Financial Executive, 23(7), 32-34
Business and Economic Research ISSN 2162-4860
2014, Vol. 4, No. 1
www.macrothink.org/ber 350
Van Osnabrugge, M. (1998). Do serial and non-serial investors behave differently? An empiricaland theoretical analysis. Entrepreneurship Theory and Practice, 22(4), 23-42
Van Osnabrugge, Mark, & Robinson, Robert (2000). Angel Investing: Matching Start-Up Funds with Start-Up Companies. San Francisco, CA: Jossey-Bass.
Velasquez, M. (1983). Why Corporations are not morally responsible for what they do, Business and Professional Ethics Journal, 2(Spring), 1-18. http://dx.doi.org/10.5840/bpej19832349
Vogel, David. (1983). Trends in Shareholder Activism: 1970-1982. California Management Review, 25, 68. http://dx.doi.org/10.2307/41165017
Waddock, S. A., & Graves, S. B. (1997a). The corporate social performance-financial performance link. Strategic Management Journal, 18(4), 303-319. http://dx.doi.org/10.1002/(SICI)1097-0266(199704)18:4<303::AID-SMJ869>3.0.CO;2-G
Waddock, S. A., & Graves, S. B. (1997b). Quality of management and quality of stakeholder relations: Are they synonymous? Business & Society, 36(3), 250-279. http://dx.doi.org/10.1177/000765039703600303
Wetzel, W. E. (1981).Informal risk capital in New England. In Frontiers of entrepreneurship research, ed. K. Vesper, 271-45, Wellesley, MA: Babson College.
Wetzel, William E., & Freear, John (1996). Promoting informal venture capital in the United States: reflections on the history of the Venture Capital Network. In Harrison, Richard T., & Mason, Colin M. (Ed.), Informal venture capital: Evaluating the impact of business introduction services (pp. 61-74). New York: Prentice-Halll Woodhead Faulker.
Wilmot, Stephen. (2001). Corporate moral responsibility: What can we infer from our understanding of organisations?. Journal of Business Ethics, 30(2), 161-169. http://dx.doi.org/10.1023/A:1006346125667
Yu, J. C. P., Wee, H. M., & Su, G. B. (2012). Revisiting revenue management for remanufactured products. International Journal of Systems Science, 1-6.
Zeghal, D., & Maaloul, A. (2010). Analysing value added as an indicator of intellectual capital and its consequences on company performance, Journal of Intellectual Capital, 1(1), 39-60
Zhao, D. (2011). Research and Application on Fixed Asset Management System. Techniques of Automation and Applications, 9.
Copyright Disclaimer
Copyright reserved by the author(s).
This paper is an open-access paper distributed under the terms and conditions of the Creative Commons Attribution license (http://creativecommons.org/licenses/by/3.0/).
Business and Economic Research ISSN 2162-4860
2014, Vol. 4, No. 1
www.macrothink.org/ber 351
Remittances and Economic Growth in Mexico: An Empirical Study with Structural Breaks, 1970-2010
Miguel D. Ramirez
Trinity College, Hartford, CT, USA
Tel: 860-297-2487 E-mail: [email protected]
Received: April 12, 2014 Accepted: May 18, 2014
doi:10.5296/ber.v4i1.5712 URL: http://dx.doi.org/10.5296/ber.v4i1.5712
Abstract
This paper investigates remittance flows to Mexico during the 1980-2010 period in absolute terms, relative to GDP, in comparison to FDI inflows, and in terms of their regional destination. Next, the paper reviews the growing literature that assesses the impact of remittances on investment spending and economic growth. Third, it presents a simple endogenous growth model that explicitly incorporates the potential impact of remittance flows on economic and labor productivity growth. Fourth, it presents a modified empirical counterpart to the simple model that tests for both single- and two-break unit root tests, as well as performs cointegration tests with an endogenously determined level shift over the 1970-2010 period. The error-correction model estimates suggest that remittance flows to Mexico have a positive and significant effect, albeit small, on both economic growth and labor productivity growth. The concluding section summarizes the major results and discusses potential avenues for future research on this important topic.
Keywords: Error-correction model, FDI inflows, Gregory-Hansen cointegration single-break test, Gross fixed capital formation, Johansen Cointegration test, KPSS no unit root test, Lee-Strazicich two-break unit root test, remittance flows, and Zivot-Andrews single-break unit root test.
JEL: C10, F01, 04, 010 and 054
1. Introduction
Over the past decade or so, remittance flows to Latin America and the Caribbean in general, and Mexico in particular, have increased dramatically, even surpassing their FDI inflows for selected years. Figure 1 below shows that remittance flows to Latin America and the Caribbean increased steadily from US$21.3 bn in 2001 to US$53 bn in 2005, before jumping to US$61.5 bn in 2006 and almost US$70 bn in 2008. The figure also reveals that the onset of the Great
Business and Economic Research ISSN 2162-4860
2014, Vol. 4, No. 1
www.macrothink.org/ber 352
Recession in 2008-09 led to a significant reduction in these flows before leveling off in 2010 and moving upward to an estimated $62bn in 2011; Figure 1 also shows that these flows are relatively more stable than other private and official flows, such as foreign direct investment (FDI), portfolio investment, and official development assistance (ODA) flows. Insofar as Mexico is concerned, it is the largest recipient of remittance flows in Latin America (and the third largest recipient in the world, after India and China) and, not surprisingly, it also recorded a dramatic increase in these flows for the period under review, from a level of US$10.2 bn in 2001 to US$26.3 bn in 2008 before falling to an estimated US$22bn in 2010 —a figure that far surpassed the country’s FDI inflows for that year (see ECLAC, 2011; World Bank, 2011). In fact, remittance flows have become such an important source of foreign exchange earnings for the country over the last decade that they rank third, just behind Mexico’s earnings from maquiladoras (assembly-line industry) and oil (see Canas et. al., 2007). Given the magnitude of these flows, both in absolute and relative terms, a growing literature has emerged that attempts to assess empirically the economic determinants of these flows to the region and individual countries, as well as their impact on economic growth, investment, savings, and poverty-to name a few. However, there are relatively few extant studies—and none for Mexico-that try to assess over a sufficiently long time span the economic impact of these flows on a country’s economic and labor productivity growth rates. In this study we attempt to overcome this lacuna in the extant literature by estimating a modified dynamic production function for Mexico over the 1970-2010 period. The layout of the paper is as follows: First, the paper gives an overview of remittance flows to Mexico during the 1980-2010 period in absolute terms, relative to GDP, and in terms of their regional destination. Second, it reviews the growing literature that attempts to assess empirically the impact of remittances on economic growth for selected developing countries, including several in Latin America and the Caribbean. Third, to motivate the discussion it presents a simple endogenous growth model that explicitly incorporates the potential impact of remittance flows on economic and labor productivity growth. The fourth section presents a modified empirical counterpart to the simple model presented in Section III and, using both single-and two-break unit root tests and cointegration analysis with a level shift, generates error correction models for economic growth and labor productivity growth. The concluding section summarizes the major results and discusses potential avenues for future research on this important topic.

Business and Economic Research ISSN 2162-4860
2014, Vol. 4, No. 1
www.macrothink.org/ber 353
Figure 1. FDI and Remittance Flows to Latin America, 2000-2011 (Billions of dollars).
2. Overview of Remittance Flows to Mexico
Although remittance flows to Mexico did not increase dramatically until the decade of the 2000s, they were by no means inconsequential during the decades of the 1980s and 1990s as shown in Table 1 below. Between 1980 and 1989 remittance flows almost tripled from US$1.04 bn to US$2.8 bn, and then more than doubled between 1990 and 1999, from US$3.1 to US6.7 bn. Notably, for a number of years during the early 1990s and 2000s, remittance flows rivaled or exceeded Mexico’s inflows of FDI. From a relative standpoint, remittances increased as a share of gross domestic product (GDP) from a mere 0.5 percent of GDP in 1980 to a high of 2.3 percent of GDP in 1988, before falling somewhat during the decade of the 1990s to a stable and relatively high annual average of 1.4 percent of GDP. More importantly, perhaps, given remittances’ potential role in financing private capital formation, remittance flows as a proportion of Mexico’s gross domestic capital formation (GDCF) rose from 4.3 percent in 1980 to 11.7 percent in 1988, and then stabilized at an annual average of about 9 percent of GDCF for the decade of the 1990s. The rapid growth in remittance flows to Mexico during the 1990s can be explained, in part, by the 1994-95 peso crisis which dramatically increased migratory flows to the U.S. in search of employment opportunities; the plentiful job opportunities associated with the rapid economic growth experienced by the U.S. economy during the 1995-1999 period; and the credit-driven boom in U.S. construction activity where a disproportionate number of migrants find employment.

Business and Economic Research ISSN 2162-4860
2014, Vol. 4, No. 1
www.macrothink.org/ber 354
Table 1. Remittance Flows to Mexico in Absolute and Relative Terms, 1980-2010.
Sources: World Bank (2009; 2011); Nacional Financiera, S.A. La Economia Mexicana en Cifras, various issues; and INEGI. aFigures for 2010 are preliminary and subject to revision.
During the decade of the 2000s, up until the year 2007, i.e., before the adverse effects of the Great Recession of 2008-09 began to be felt, Table 1 shows that remittance flows to Mexico increased dramatically, both in absolute terms and relative to GDP and gross domestic capital formation (GDFC). For example, in 2000 remittance flows amounted to US$7.53 bn and represented 1.3 percent of GDP and 7.6 percent of GDFC; by 2007 they had shot up to US$27.1 bn, which represented 3.4 percent of GDP and 15.2 percent of GDFC. In fact, Mexico was by far the largest beneficiary of remittance flows in all of Latin America and the Caribbean, and among the relatively larger economies of the region it was, with the exception of Peru, the biggest recipient in relation to its gross domestic product (and GDFC) over the entire 2000-2010 period. The importance of these flows is further revealed by comparing them with FDI inflows to Mexico for the period under review. As can be seen from Table 1, remittance flows began to rival FDI inflows in 2000 and exceeded them by a significant margin after 2004, particularly during the recessionary years of 2009-2010.
From a regional standpoint, Canas et. al. report that the lion’s share of remittances were sent to the middle income (and poor) central western-states of Michoacan, Guanajuato, Morelos,

Business and Economic Research ISSN 2162-4860
2014, Vol. 4, No. 1
www.macrothink.org/ber 355
Zacatecas, and Estado de Mexico (all at least 5% of gross state product). Several of the poorer southern states (Oaxaca, Guerrero and Chiapas) also received significant amounts of remittance flows (at least 5% of GSP). Only the wealthier border-states (Sonora, Chihuahua, Coahuila, and Nuevo Leon) received lower remittance flows (below 1% of GSP) because relatively few low-skilled workers emigrate to the United States from these states. Although the Banco de Mexico supplies information on the regional destination of remittance flows within Mexico, the United States does not systematically track the origins of these flows within the United States. However, the IDB’s annual survey of remittance flows to Latin America gives us some indication of where these flows originated from because they ranked, not surprisingly, California first ($13.2 bn), Texas second ($5.2 bn), and New York third ($3.7 bn) (see Canas et. al., p. 4).
With the onset and aftermath of the Great Recession of 2008-09, remittance flows to Latin America in general, and Mexico in particular, have experienced an abrupt decline. For example, according to the World Bank (2011), between 2008 and 2009 Latin America and the Caribbean witnessed a decline in remittance flows of almost 10 percent, from $65 bn to $58 bn, while Mexico saw its remittance flows drop from $26.3 bn to $21.1 bn, or a 17.6 percent decline. However, in its 2012 report, the World Bank estimates that, after remaining flat in 2010, remittance flows to Latin America and the Caribbean will rise in 2011, with Mexico registering a slight increase to about US$22bn in 2010 (see Table 1) and a more substantial rise to US24 bn in 2011. The sharp initial decline in the case of Mexico can be partly explained by the steep drop in construction employment in the U.S. during 2009-10, where there is usually a lag of 4 to 6 months between a drop in economic activity (employment) and remittance flows to Mexico (see Mohapatra et al., 2011).
To make matters worse, the economic recovery in the U.S. has been lackluster and the prediction by many economists is for a “jobless recovery” at least during the coming years. This means that the employment prospects and income levels of existing and prospective migrants will be adversely affected in years to come, thus undermining their willingness to migrate to the U.S. or, if already here, their ability to send remittances back home. Remittance flows to Mexico are also expected to remain weak in the coming years because tighter border controls have led to a significant reduction in emigration flows from Mexico beginning in the second quarter of 2008 and continuing through 2009 (INEGI, 2010).
3. The Impact of Remittance Flows on Economic Growth and Development
In general, remittances are expected to have a positive effect on the economic growth of the recipient countries when they complement national savings and augment the total pool of financial resources for investment projects. In this connection, Solimano (2003) and Orozco (2004) report that migrants in the United States, including Ecuadorans, Guatemalans, Mexicans, and Salvadorans, have formed permanent associations known as Home Town Associations (HTAs) which regularly send donations back to their communities to finance investments in small businesses and infrastructure projects such as water treatment plants, roads, bridges, and schools. To the extent that these flows become “institutionalized,” their positive effects on growth are likely to become more permanent.i
Business and Economic Research ISSN 2162-4860
2014, Vol. 4, No. 1
www.macrothink.org/ber 356
Similarly, Ratha (2003) found that remittances had a positive and significant effect on investment in receiving countries such as Mexico, Egypt, and Sub-Saharan Africa. In this connection, Aitymbetov (2006) discovered that approximately 10 to 20 percent of remittances were used as some form of investment in Kyrzastan, and thus had a positive impact on the economy. Giuliano et al. (2006) also conclude that remittances help boost the growth rate of the economy in less financially developed countries by providing credit which would otherwise not be available. Insofar as Mexico is concerned, investigators have found that remittances are used to finance investment in micro-enterprises. For example, Woodruff (2006) found that there is, in general, a positive relation between investment spending and the growth of micro-enterprises. Woodruff determined that between 10 to 20 percent of remittance flows are invested in micro-enterprises and that this could have a significant impact on the long-term growth of these labor-intensive enterprises.
Other authors have found a positive and statistically significant relationship between remittance flows and economic growth. For example, Mundaca (2005), in a study assessing the impact of remittances on growth in selected countries in Central America, found a strong correlation between remittances and economic growth. Remittances had a significant impact on the growth of these economies, and the impact was stronger when the financial sector was included in the model. Mundaca carried out several estimations on the impact of remittances on growth using different variables to proxy for financial development. When domestic credit from banks was used as one of the explanatory variables, a 10 percent increase in remittances as a percentage of GDP increased GDP per capita by 3.49%. However, when no variables were included to proxy for financial development, a 10 percent increase in remittances as a percentage of GDP increased GDP per capita at a lower rate of 3.18%. In a more recent study, Sharma and Ramirez (2009), using the Fully-Modified OLS (FMOLS) methodology, report panel estimates for selected upper and lower income Latin American and Caribbean countries which suggest that remittances have a positive and significant effect on economic growth in both groups of countries. In addition, the interaction of remittances with a financial development variable reveal that these two variables act as substitutes and, similar to Mundaca’s findings, the impact of remittances is more pronounced in the presence of the financial development variable.
However, the positive effects of remittances on economic growth are not readily accepted by other scholars working on this topic. Chami et al. (2005) report a negative correlation between remittances and growth, while, in a more recent IMF panel study for 84 countries, Barajas et al. (2009) find that workers’ remittances have little or no effect on long run economic growth. By and large, remittances were found to be counter-cyclical in nature. For example, Chami et al. argue that remittances act like compensatory transfers and, hence, do not aid in the process of economic growth. They contend that remittances are intended for consumption rather than investment. This finding is also supported by the work of Solimano (2003). He reports that in the case of Ecuador around 60 percent of remittances are spent on food, medicines, house rents, and other basic commodities (p. 16).
Another possible negative effect on growth associated with remittances may result from the possibility of a “Dutch Disease” effect via an induced real appreciation of the domestic

Business and Economic Research ISSN 2162-4860
2014, Vol. 4, No. 1
www.macrothink.org/ber 357
currency for countries with sizable remittance flows. For example, in a recent study Acosta et al. (2008) report (unbalanced) panel estimates for 109 developing and transition economies over the 1990-2003 period which suggest that rising levels of remittance flows lead to real exchange appreciation and resource movements that favor the non-tradable sector at the expense of the tradable sector. To the degree that this happens, traditional and non-traditional exports (and import-competing industries) may be adversely affected, thus undermining investment spending and growth.
Finally, there are a several economic, institutional and social factors which have a potential effect on the size of remittance flows, and thus economic growth. The size of the migrant population, the length of stay away from their home country, the migrants’ income and that of family members back home, volatility of exchange rates, the economic freedom of the source country, the transfer costs, and the migrants’ motivation to go back (see Canas et al., 2007).
4. Conceptual Model
For reasons outlined above, remittance flows may have either positive or negative effect on the long-term growth prospects of a country. To the degree that they contribute to the financing of private capital formation, they augment both the stock of private capital and the productivity of labor, thus enhancing the country’s long-term economic growth. On the other hand, if remittances are primarily channeled to finance current consumption, then they reduce current investment spending, thereby reducing the stock of private capital and the country’s long-term growth prospects. Of course, it is possible that remittance flows are used by family members to finance expenditures on education and/or vocational training, and to the extent that they do, then they contribute to the formation of human capital, thus promoting future economic growth. Following the lead of De Mello (1997) and De Vita (2004), remittance flows can be treated as a form of foreign capital that generates positive or negative externality effects to the domestic economy. It can be explicitly modeled via an augmented Cobb-Douglas production function of the following form:
Y = A f [L, Kp , E] = A Lα Kβ E(1 - α - β) (1)
Where Y is real output, Kp is the private capital stock, L is labor, and E refers to the positive or negative externality generated by additions to the stock of foreign capital in the form of remittance flows. α and β are the shares of domestic labor and private capital respectively, and A captures the efficiency of production. It is also assumed that α and β are less than one, such that there are diminishing returns to the labor and capital inputs. The externality, E, can be represented by a Cobb -Douglas function of the type:
E = [L, Kp, Krγ]θ (2)
Where γ and θ are, respectively, the marginal and the intertemporal elasticities of substitution between private and foreign capital in the form of remittance flows. Let γ >0, such that a larger stock of remittances generates a positive externality to the economy; i.e., knowledge or technological progress is an accidental by-product of capital investment by relatively small firms in the form of remittances. If θ > 0, intertemporal complementarity prevails and, if θ < 0, additions to the stock of foreign capital in the form of remittances crowd out private capital

Business and Economic Research ISSN 2162-4860
2014, Vol. 4, No. 1
www.macrothink.org/ber 358
over time and diminish the growth potential of the host country.
Combining equations (1) and (2), we obtain,
Y = A Lα + θ(1 - α - β) Kpβ + θ(1 - α - β) Kr
γθ(1 - α - β) (3)
A standard growth accounting equation can be derived by taking logarithms and time derivatives of equation (3) to generate the following dynamic production function:
gy = gA + [α + θ(1-α-β)]gL + [β + θ(1-α-β)]gKp + [γθ(1-α-β)]gKr (4)
Where gi is the growth rate of i = Y, A, L, Kp, and Kr. Equation (4) states that (provided γ and θ > 0) additions to the stock of foreign capital in the form of remittances will augment the elasticities of output with respect to labor and capital by a factor θ(1-α - β).
4.1 Empirical Model
Mexico has a sufficiently long (and official) time series data set (extending back to the decade of the fifties and sixties) for a number of key variables, including private investment spending, public capital formation, and FDI inflows, so that using a perpetual inventory method capital stock data can be generated for the different types of capital. Insofar as remittance flows are concerned, there is annual data going back only to the decade of the seventies, so it is not possible to generate a capital stock measure for this variable. Nevertheless, there are still a sufficient number of data points (41) to test empirically whether these flows have a beneficial or adverse impact on economic growth.
Official data on the economically active population (EAP), rather than just population data per se, are also available for the period under review. This study is thus the first, other than Woodruff’s (2006) at the micro level, to test whether remittance flows have a positive or negative effect on economic growth (and labor productivity growth) in Mexico during the 1970-2010 period. The most general formulation of the dynamic production function is given below,
ΔY= α + β1 ΔL + β2 ΔKp + β3 ΔKg + β4 ΔKf + β5ΔR + β6 D1 + β7D2 + εt (5)
Δ is the difference operator; Y represents the natural log of real GDP (1970 pesos); L, as indicated above, refers to the natural log of the EAP; Kp denotes the natural log of the stock of private capital (1970 pesos); Kg denotes the natural log of the stock of public capital; Kf denotes the log of the stock of FDI capital (1970 pesos); R is the natural log of remittance flows (1970 pesos); D1 is a dummy variable that equals 1 for the crises years of 1976, 1982-83, 1987, 1995, 2001, and 2009, and 0 otherwise; D2 equals 1 for the petroleum-led expansion of 1978-81, and 0 otherwise; Finally, εt is a normally distributed error term.
The economic rationale for the inclusion of the additional variables in equation (5) and the interpretation of their respective coefficients is given below. The coefficients represent the annual percentage change in real GDP associated with a respective percentage change in the variables in question. Following the lead of Aschauer (1989) and Blomstrom and Wolff (1994) equation (5) was estimated as a labor productivity growth equation by defining the variables in per capita terms using the economically active population.ii All right-hand side variables have

Business and Economic Research ISSN 2162-4860
2014, Vol. 4, No. 1
www.macrothink.org/ber 359
been lagged in order to minimize the inherent problem of reverse causality associated with some of the included variables. The sign of β1 is anticipated to be positive in both the GDP growth rate formulation and labor productivity growth rate specification. β2 is expected to be positive, while the sign of β3 can be positive or negative depending on whether government investment spending “crowds in” or “crowds out” private investment spending. To the extent that public investment spending is directed to economic and social infrastructure in the form of roads, bridges ports, and primary education, it is likely to reduce the cost of doing businesses and thereby crowd in private investment spending. On the other hand, if public investment spending is channeled primarily to sectors that directly compete with the private sector and/or indirectly raise the cost of credit by competing for scarce funds, then it is likely to crowd out private investment spending (see Aschauer, 1989; Barro, 1990; and Ramirez, 2007).
Insofar as foreign capital is concerned, FDI inflows are likely to complement private capital formation if they bring needed financing and transfer managerial and technological knowhow (see Huang, 2004). In this connection, the impact of remittance flows will be beneficial to long-term growth if, like FDI inflows, they contribute to financing private capital formation and are directed to investments in human capital and economic infrastructure rather than consumption expenditures per se. In view of these ambiguous effects, the signs of, β4 and β5 are indeterminate. Β6 is anticipated to have a negative sign for obvious reasons. Β7 is expected to be positive because of the high rates of economic growth associated with the short-lived petroleum boom of 1978-81.
The economic data used in this study were obtained from official government sources such as INEGI (various issues), Nacional Financiera, S.A., La Economia Mexicana en Cifras, the Banco de Mexico, Informe Anual (various issues), and the World Bank’s Migration and Development Brief (various issues). Private and public investment data for Mexico have been obtained from International Finance Corporation, Trends in Private Investment in Developing Countries: Statistics for 1970-2000 [2002].iii The private, public and foreign capital stock data were generated using a standard perpetual inventory model assuming an estimate of the rate of depreciation of 5 percent.
5. Empirical Results
Initially, conventional unit root tests (without a structural break) were undertaken for the variables in question given that it is well-known that macro time series data tend to exhibit a deterministic and/or stochastic trend that renders them non-stationary; i.e., the variables in question have means, variances, and covariances that are not time invariant. In their seminal paper, Engle and Granger (1987) showed that the direct application of OLS or GLS to non-stationary data produces regressions that are misspecified or spurious in nature. Consequently, this study tested the variables in question for a unit root (non-stationarity) by using an Augmented Dickey-Fuller test (ADF) (Dickey-Fuller, 1981) with a constant and deterministic trend.
It is important to acknowledge that when dealing with historical time series data for developing countries such as Mexico or Chile investigators are often constrained by the relatively small number of time series observations (usually in annual terms). This is the case in this study
Business and Economic Research ISSN 2162-4860
2014, Vol. 4, No. 1
www.macrothink.org/ber 360
where the sample size is below the threshold level of 50 observations recommended by Granger and Newbold (1986), and thus may compromise the power of the unit root (and cointegration) tests-not to mention distort the size or significance of the tests as well [see Charemza and Deadman, 1997]. However, a growing literature contends that the power of unit root (and cointegration) tests depends on the length or time span of the data more than the mere number of observations in the sample. That is, for a given sample size n, the power of the test is greater when the time span is large. Thus, unit root or cointegration tests based on 40 observations over 40 years have considerable more power than those based on 100 observations over 100 days (see Bahnam-Oskooee 1996; Hakkio and Rush, 1991).iv
Following the Doldado et al. (1990) procedure, Table 2 (part A) below presents the results of running an Augmented Dickey-Fuller test (one lag) on the variables in logarithmic form with a constant and a deterministic trend. v The results indicate that the null hypothesis of non-stationarity cannot be rejected for any of the variables in level form with a deterministic trend, suggesting that the variables in question do not exhibit a deterministic time trend throughout the period under review. In other words, the common practice of detrending the data by a single trend line will not render the data in question stationary because the trend line itself may be shifting over time (see Charemza and Deadman, 1997). vi When the ADF test is applied to these variables in first differences under the assumption of a constant and deterministic time trend, all of the variables become stationary at the five percent level of significance.
In view of the relatively low power of the ADF unit root tests when the data generating process is stationary but with a root close to the unit root, Table 2 (part B) presents the results of running a KPSS stationarity test ( Kwaitkowski et al., 1992). This test has a no unit root (stationary) null hypothesis, thus reversing the null and alternative hypotheses under the Dickey Fuller test. It is used as a confirmatory test because in the presence of insufficient information, due to a relatively small sample size, it defaults to the stationary data generating process. The reported results in both level and differenced form under the assumption of a deterministic trend are consistent with those reported in Table 2 (part A). For example, the null hypothesis of no unit root can be rejected for all the variables in level form at the 5 percent level of significance; i.e., they appear to follow a random walk with (positive) drift. In the case of first differences, however, the null hypothesis of stationarity cannot be rejected for all variables at least at the 5 percent level. Thus, the evidence presented suggests that the variables in question follow primarily a stochastic trend as opposed to a deterministic one, although the possibility that for given subperiods they follow a mixed process cannot be rejected.
5.1 Single-Break Unit Root Analysis.
Although suggestive, the results reported in Table 2 may still be misleading because the power of conventional unit root tests may be significantly reduced when the stationary

Business and Economic Research ISSN 2162-4860
2014, Vol. 4, No. 1
www.macrothink.org/ber 361
Table 2. Part A. ADF Unit Root Tests for Stationarity with constant and time trend, sample Period 1970-2010.
Variables Level First Difference 5% Critical Value Y -1.74 -6.74* -3.53 L 0.41 -6.31* -3.53 Kp -2.46 -4.21* -3.53 Kf -2.41 -3.62* -3.53 Kg -2.18 -6.76* -3.53 R -1.95 -7.60* -3.53
MacKinnon (1966) critical values for rejection of hypothesis of a unit root. * denote significance at the 5 percent level.
Part B. KPSS (LM) No Unit Root Tests for Stationarity with constant and time trend, Sample Period 1970-2010.
Variables Levels First Difference 5% Critical Value Y 0.24* 0.05 0.14 L 0.20* 0.10 0.14
Kp 0.17* 0.09 0.14 Kf 0.15* 0.12 0.14 Kg 0.24* 0.11 0.14 R 0.18* 0.10 0.14
Asymptotic critical values for rejection of null hypothesis of no unit root (LM-Stat.).*denotes significance at 5 percent level.
alternative is true and a structural break is ignored (see Altinay, 2005; and Perron, 1989); that is, the investigator may erroneously conclude that there is a unit root in the relevant series. In order to test for an unknown one-time break in the data, Zivot and Andrews (1992) developed a data dependent algorithm that regards each data point as a potential break-date and runs a regression for every possible break-date sequentially. The break date is selected where the t-statistic from the ADF test of unit root is at its most negative; i.e., a break date will be chosen where the evidence is least favorable for the null hypothesis of a unit root. The test involves running the following three regressions (models): model A which allows for a one-time change in the intercept of the series; model B which permits a one-time change in the slope of the trend function; and model C which combines a one-time structural break in the intercept and trend (Waheed et. al., 2006).
Following the lead of Perron, most investigators report estimates for either models A and C, but in a relatively recent study Seton (2003) has shown that the loss in test power (1-β) is considerable when the correct model is C and researchers erroneously assume that the break-point occurs according to model A. On the other hand, the loss of power is minimal if the break date is correctly characterized by model A but investigators erroneously use model C. Table 3 reports the Zivot-Andrews (Z-A) one-break unit root test results for model C in level form along with the endogenously determined one-time break date for each time series. With

Business and Economic Research ISSN 2162-4860
2014, Vol. 4, No. 1
www.macrothink.org/ber 362
the notable exception of the remittances variable, the unit root null hypothesis with a structural break in both the intercept and the trend cannot be rejected at the 5 percent level of significance.vii The Z-A test identifies endogenously the single most significant structural break in every time series. The exception for the remittances variable is either due to the presence of more than one structural break or the abrupt break in 1970 due to the lack of reported data before that year. In view of space constraints, Figure 2 below shows visually the endogenously determined break-date for the real GDP series.
Table 3. Zivot-Andrews One-break Unit Root Test, Sample Period 1960-2010.
Variables Levels Break Year 5% Critical Value Y -5.00 1978 -5.08 L -2.29 1992 -5.08
Kp -4.32 1985 -5.08 Kf -4.46 1984 -5.08 Kg -4.80 1978 -5.08 R -6.23* 1970 -5.08
Values for rejection of null hypothesis of a unit root with a structural break in both the intercept and trend (Model C). *Denotes significance at the 5 percent level.
-6
-5
-4
-3
-2
-1
0
55 60 65 70 75 80 85 90 95 00 05 10
Zivot-Andrew BreakpointsFig. 2
5.2 Two-Break Unit Root Analysis
The analysis undertaken so far only tests for the presence of a single endogenously determined structural break. However, Lee and Strazicich (2003) have developed a two-break minimum Lagrange Multiplier (LM) unit root test that shows that assuming erroneously that there is one structural break in the data when, in fact, there are two leads to a further loss of power. Moreover, the LM unit root test developed by Lee and Strazicich enables the investigator to properly test for structural breaks under both the null and alternative hypotheses, thus eliminating size distortions that lead to the over-rejection of the null hypothesis of a unit root
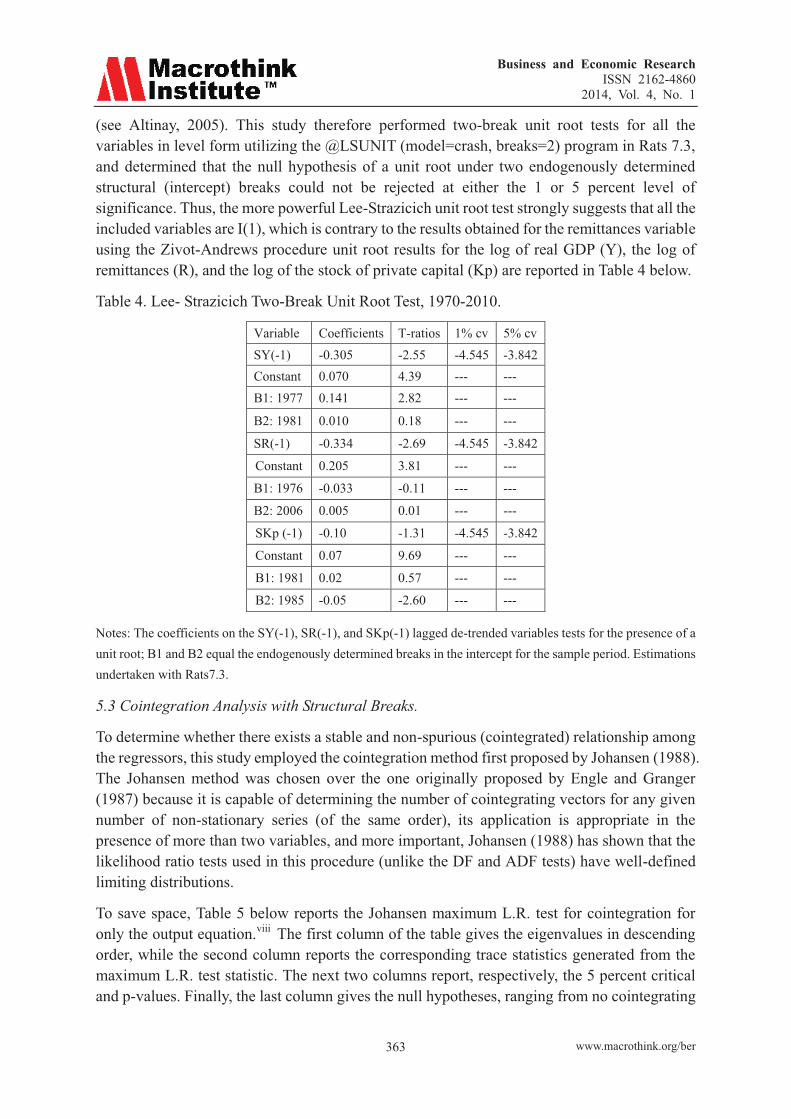
Business and Economic Research ISSN 2162-4860
2014, Vol. 4, No. 1
www.macrothink.org/ber 363
(see Altinay, 2005). This study therefore performed two-break unit root tests for all the variables in level form utilizing the @LSUNIT (model=crash, breaks=2) program in Rats 7.3, and determined that the null hypothesis of a unit root under two endogenously determined structural (intercept) breaks could not be rejected at either the 1 or 5 percent level of significance. Thus, the more powerful Lee-Strazicich unit root test strongly suggests that all the included variables are I(1), which is contrary to the results obtained for the remittances variable using the Zivot-Andrews procedure unit root results for the log of real GDP (Y), the log of remittances (R), and the log of the stock of private capital (Kp) are reported in Table 4 below.
Table 4. Lee- Strazicich Two-Break Unit Root Test, 1970-2010.
Variable Coefficients T-ratios 1% cv 5% cv SY(-1) -0.305 -2.55 -4.545 -3.842 Constant 0.070 4.39 --- --- B1: 1977 0.141 2.82 --- ---
B2: 1981 0.010 0.18 --- ---
SR(-1) -0.334 -2.69 -4.545 -3.842
Constant 0.205 3.81 --- ---
B1: 1976 -0.033 -0.11 --- ---
B2: 2006 0.005 0.01 --- ---
SKp (-1) -0.10 -1.31 -4.545 -3.842
Constant 0.07 9.69 --- ---
B1: 1981 0.02 0.57 --- ---
B2: 1985 -0.05 -2.60 --- ---
Notes: The coefficients on the SY(-1), SR(-1), and SKp(-1) lagged de-trended variables tests for the presence of a unit root; B1 and B2 equal the endogenously determined breaks in the intercept for the sample period. Estimations undertaken with Rats7.3.
5.3 Cointegration Analysis with Structural Breaks.
To determine whether there exists a stable and non-spurious (cointegrated) relationship among the regressors, this study employed the cointegration method first proposed by Johansen (1988). The Johansen method was chosen over the one originally proposed by Engle and Granger (1987) because it is capable of determining the number of cointegrating vectors for any given number of non-stationary series (of the same order), its application is appropriate in the presence of more than two variables, and more important, Johansen (1988) has shown that the likelihood ratio tests used in this procedure (unlike the DF and ADF tests) have well-defined limiting distributions.
To save space, Table 5 below reports the Johansen maximum L.R. test for cointegration for only the output equation.viii The first column of the table gives the eigenvalues in descending order, while the second column reports the corresponding trace statistics generated from the maximum L.R. test statistic. The next two columns report, respectively, the 5 percent critical and p-values. Finally, the last column gives the null hypotheses, ranging from no cointegrating

Business and Economic Research ISSN 2162-4860
2014, Vol. 4, No. 1
www.macrothink.org/ber 364
relationships up to at most four cointegrating vectors. It can be ascertained from the L.R. ratio statistics that, in the presence of a constant in the cointegrating and VAR equation, there exists a linear combination of the I(1) variables that links them in a stable and long-run relationship. In fact, the p-value reported in the table shows that the null
Table 5. Johansen Cointegration (Trace) Test, 1970-2010.
Series: Y, L , Kp , Kf , and R.
Test assumptions: Intercept (no trend) in CE and VAR; Kg, D1, and D2 are treated as exogenous variables.
Note: t-ratios are in parenthesis. Signs are reversed in the cointegrating vector because of the normalization process.
Hypothesis of no cointegrating vector can be rejected at least at the one percent level, thereby suggesting the presence of one cointegrating equation from which residuals (EC terms) can be obtained to measure the respective deviations between the current level of output and the level based on the long-run relationship. The long-run estimates reported in Part B of the Table suggest that all variables, with the notable exception of the foreign capital variable, have positive and highly significant effect on the level of real GDP.ix Similar results were obtained for the labor productivity function and they are available upon request.
Before turning to the EC models, it should be noted that the cointegrating test performed in this study does not allow for structural breaks in the sample period, whether level (intercept) shifts or regime (intercept and slope) shifts. However, Gregory and Hansen (1996) have shown that ignoring these breaks reduces the power of conventional cointegration tests similar to conventional unit root tests and, if anything, should lead to a failure to reject the null hypothesis of no cointegrating vector, which is clearly not the case in the present study. Still, this study undertook a G-H cointegration test with level shift and the results, which are consistent with the Johansen test, are reported in endnote 10.x

Business and Economic Research ISSN 2162-4860
2014, Vol. 4, No. 1
www.macrothink.org/ber 365
5.4 Error Correction Models.
The information provided by the L.R. tests is used to generate a set of EC models that capture the short- and long-run behavior of the labor productivity relationship. EC models enable the researcher to estimate the speed of adjustment back to the long-run (stable) condition among the variables. Engle and Granger (1987) warn that failure to include the lagged residual of the cointegrating equation in a (short-run) model in difference form results in a misspecified relationship because the long-run properties of the model are ignored. The changes in the relevant variables represent short-run elasticities, while the coefficient on the EC term represents the speed of adjustment back to the long-run relationship among the variables. For simplicity, consider the EC model with lags (and no dummy variables) given in equation (11) below:
ΔYt = α + β1ΔLt-i + β2ΔKpt-I + β3ΔKgt-i+ β4ΔKft-i + β5ΔRt-i + δECt-1 + εt (11)
The coefficients (β=s) of the changes in the relevant variables represent short-run elasticities, while the coefficient, δ (< 0), on the lagged EC term obtained from the cointegrating equation in level form denotes the speed of adjustment back to the long-run relationship among the variables. To conserve space, two of the estimated EC models are given below, the growth rate in real GDP and the growth rate in labor productivity (lower case letters denote per capita terms).
Δ(Y)t=-0.06 + 0.2ΔLt-1 + 0.56ΔKpt-2 + 0.06ΔKgt-1 + 0.06ΔKf t-3 + 0.04ΔR t-1 - 0.41ECt-1 - 0.06D1 + 0.07D2 (12) (-1.55) (2.09)* (5.98)* (1.20) (3.10)* (3.65)* (-5.47)* (-6.70)* ( 7.45)*
Adj. R2 = .83, S.E. = 0.02 F-Stat. = 15.65*, D.W. = 2.06, Akaike criterion = - 4.28 Schwarz criterion = - 3.76; Ramsey (RESET) test= 3.26 (p-value= 0.083); *= 5 % significance. Δ(y)t=- 0.02 + 0.72Δ(kp)t-1 + 0.11(Δkg)t-3 + 0.08Δ(kf)t-3 + 0.05Δ(r)t-1 – 0.42.ECt-1-0.07D1 +0.06D2 (13) (-1.52) (7.78 )* (1.83)* (3.62)* (3.09)* (-7.58)* (-4.09)* (8.44)* Adj. R2 = .80, S.E. = 0.02, F-Stat. = 13.8*, D.W. = 2.12, Akaike criterion = - 4.14, Schwarz criterion = - 3.66; Ramset (RESET) test= 2.609 (p-value=0.117).
Where Δ(Y) and Δ(y) denote, respectively, real gdp growth and labor productivity growth, and ECt-1 represents the lagged residual from the cointegrating equation. Both equations were tested for serial correlation via the Breusch-Godfrey LM test and were found to exhibit first order correlation at the 5 percent level of significance. The reported estimates have been corrected for first order serial correlation. In addition, the regressions were tested for specification error such as omitted variables and/or functional form via Ramsey’s Regressions Specification Error Test (RESET), and we were unable to reject the null hypothesis of no specification error at the 5 percent level of significance. Finally, the lag structure for the explanatory variables in each equation was chosen on the basis of the AIC (and Schwarz) criteria.
The estimates in equations (12) and (13) suggest that the impact of lagged changes in the growth rate of the private capital stock are positive and statistically (and economically) significant at the 5 percent level, while contemporaneous changes in employment growth have

Business and Economic Research ISSN 2162-4860
2014, Vol. 4, No. 1
www.macrothink.org/ber 366
a positive impact on the growth rate in real GDP in equation (12). The short-run growth rate in the foreign capital variable (FDI inflows), as opposed to its long-run impact reported in Table 4, has a positive and statistically significant effect when lagged three periods in both equations. The EC estimates for the foreign capital variable are not altogether surprising because the positive externalities generated in the form of a greater transfer of technology and managerial know-how are likely to impact economic growth (and labor productivity) with a lag. The public investment variable has a lagged positive and significant effect (at the 5 percent level) for the labor productivity growth specification, but not for the real GDP growth regression. The relatively weak positive effect may be due to the fact that the variable does not measure economic infrastructure spending per se, but overall public investment spending which includes spending by state-owned enterprises and other public entities. During the 1970s and early 1980s most of the increase in public investment spending was associated with the growth of state-owned enterprises in sectors that were in direct competition with the private sector (see Ramirez, 1989). Insofar as the impact of remittance flows are concerned, the estimates for both equations suggest that they have a positive and highly significant effect when lagged one period, although the economic magnitude of the coefficient is far below that of private capital formation or the foreign capital variable. Moreover, it should be noted that the estimates for the remittance variable are sensitive to the lag structure chosen.
Turning to the dummy variables, the estimates suggest that they have the anticipated signs and are highly significant in both EC regressions. The relative fit and efficiency of both EC regressions is quite good and, as the theory predicts, the EC terms are negative and statistically significant, suggesting, as in equation (13), that a deviation from long-run labor productivity growth this period is corrected by about 65 percent in the next year. Finally, stability tests were undertaken to determine whether the null hypothesis of no structural break could be rejected at the 5 percent level. The Chow breakpoint tests suggested that the hypothesis could not be rejected for the economic crises year 1976 (p-value= 0.453), 1982 (p-value= 0.325), and 1995 (p-value= .773). EC models were also used to track the historical data on the percentage growth rate labor productivity during the period under review. Figure 3 below, corresponding to equation (13) above, shows that the model was able to track the turning points in the actual series quite well. PGR refers to the actual series and (PGRF) denotes the in-sample forecast. In addition, Figure 3 shows that the Theil inequality coefficient for this model is 0 .216, which is well below the threshold value of 0.3, and suggests that the predictive power of the model is quite good [see Theil, 1966]. The Theil coefficients can be decomposed into three major components: the bias, variance, and covariance terms. Ideally, the bias and variance components should equal zero, while the covariance proportion should equal one. The estimates reported in

Business and Economic Research ISSN 2162-4860
2014, Vol. 4, No. 1
www.macrothink.org/ber 367
-.20
-.15
-.10
-.05
.00
.05
.10
.15
55 60 65 70 75 80 85 90 95 00 05 10
Fig. 3
PGR-->
PGRF-->
Actual (PGR) and Simulated (PGRF) Labor Productivity Growth Rates
-.3
-.2
-.1
.0
.1
.2
1975 1980 1985 1990 1995 2000 2005 2010
PGRF± 2 S.E.
Forecast: PGRFActual: PGRForecast sample: 1955 2010Adjusted sample: 1973 2010Included observations: 38Root Mean Squared Error 0.022785Mean Absolute Error 0.018150Mean Abs. Percent Error 191430.6Theil Inequality Coefficient 0.216961 Bias Proportion 0.000000 Variance Proportion 0.047952 Covariance Proportion 0.952048
Fig. 4 Theil Inequality Coefficient
Figure 4 suggests that all of these ratios are close to their optimum values (bias= 0.00, variance= 0.047, and covariance = 0.952). Sensitivity analysis on the coefficients also revealed that changes in the initial or ending period did not alter the predictive power of the selected models (results are available upon request).
6. Conclusion
Remittance flows to Mexico have been substantial since the second half of the eighties and during the decade of the nineties and beyond, particularly in relation to GDP, gross fixed domestic capital formation, and from a regional standpoint. Moreover, these flows have, since the decade of the 2000s, rivaled or even exceeded the country’s FDI inflows. Remittance flows also exhibit a greater degree of stability and less susceptibility to the business cycle than FDI inflows which are often referred to as the “good cholesterol” of global (private) financial flows.

Business and Economic Research ISSN 2162-4860
2014, Vol. 4, No. 1
www.macrothink.org/ber 368
This study undertook unit root tests in the presence of both one- and two-time structural breaks. The Lee-Strazicich two-break minimum LM unit root tests are consistent with those obtained from the conventional ADF and KPSS tests but not the Zivot-Andrews single break unit root test. The reported estimates for the Zivot-Andrews test suggest that the null hypothesis of non-stationarity cannot be rejected for the relevant series in level form, with the notable exception of the remittances variable. On the other hand, the more powerful two-break LM unit root test suggests that all variables (including the remittances variable) are non-stationary in level form. This is an important finding because conventional unit root tests such as the ADF test tend to exhibit low power when structural breaks are ignored and the stationary alternative is true; i.e., researchers are more likely to incorrectly conclude that the variable in question has a unit root.
The Johansen cointegration test indicated that there is a unique and stable relationship among the relevant variables in level form which keeps them in proportion to one another over the long run. Moreover, the Gregory and Hansen cointegration test with an endogenous structural (intercept) break also indicates that the null of no cointegration can be convincingly rejected at the one percent level. This is also an important contribution to the extant literature because previous econometric studies relating to the impact of remittances in the Mexican case have failed to determine whether the estimated (cointegrated) relationships were spurious or not in the presence of structural break.
The reported EC models suggest that short-run deviations from long-run labor productivity growth are corrected in subsequent periods and the in-sample forecasts of the EC models are able to track the turning points in the data relatively well. The short-run estimates suggest that remittance flows have a positive, albeit small lagged effect on both the growth rate in real GDP and labor productivity growth over the period in question. The other included quantitative variables also have their anticipated signs and they are, for the most part, statistically and economically significant. Finally, the qualitative variables also have their expected signs and they are statistically significant.
Although suggestive, the positive estimates reported in this study for the remittance variable are by no means conclusive and need to be supported by micro-based case studies and/or sectorial (regional) studies. As more disaggregated data becomes available on a regional or sectorial basis, it will be possible to conduct panel studies to determine whether remittance flows have greater positive (or negative) effects on investment spending and labor productivity growth in certain regions or sectors of the Mexican economy. This should help policymakers and the home town associations alluded to earlier to funnel remittances to where they can have their maximum effect in terms of financing investment, promoting economic growth, and alleviating poverty.
References
Acosta, Pablo A. et al. (2008). Remittances and the Dutch Disease. Federal Reserve Bank of Atlanta, Working Paper2007-8a (August), 1-22.
Aitymbetov, S. (2006). Emigrant remittances: Impact on economic development of
Business and Economic Research ISSN 2162-4860
2014, Vol. 4, No. 1
www.macrothink.org/ber 369
Kyrgyzstan.” ICEG Working Paper (June), 1-20.
Altinay, G. (2005). Structural Breaks in Long-Term Turkish Macroeconomic Data, 1923-2003, Applied Econometrics and International Development, 5(4), 117-130.
Aschauer, D. A. (1989). Public Investment and Productivity Growth in the Group of Seven, Economic Perspectives, 13, Sept./Oct.: 17-25.
Bahamani-Oskoee, M. (1996). Decline of the Iranian Rial during the post-revolutionary period: A Productivity Approach, Journal of Developing Areas, 30, 479-92.
Barajas, Adolfo et al. (2009). Do Workers Remittances Promote Economic Growth? IMF Working Paper, No. 153 (July): 1-22.
Barro, R. J. (1990). Government Spending in a Simple Model of Endogenous Growth, Journal of Political Economy, 98(5), 103-125. http://dx.doi.org/10.1086/261726
Bloomstrom, M., and E. Wolff. Multinational Corporations and Productivity Convergence in Mexico. (1994). In Convergence of Productivity: Cross-National Studies Historical Evidence, edited by W. Baumol, R. Nelson, and E. Wolff. Oxford: Oxford University Press.
Canas, J., Coronado, R., & Orrenius, P. (2007). Explaining the increase in remittances to Mexico. The Southwest Economy, Federal Reserve Bank of Dallas, July/August.
Chami, R., Fullenkamp, C., & Jahjah, S. (2005). Are immigrant remittance flows a source of capital for development? IMF Staff Papers, 53(1). 57-70.
Charemza, W.W. and D.F. Deadman. (1997). New Directions in Econmetric Practice: General to Specific Modelling, Cointegration and Vector Autoregression. Cheltenham: Edward Elgar Publishers.
De Mello, Jr. Luiz R. (1997). Foreign Direct Investment in Developing Countries and Growth: A Selective Survey. Journal of Development Studies, 34, 1 (October), 1-34. http://dx.doi.org/10.1080/00220389708422501
De Vita, G., & K. Lawler. (2004). Foreign Direct Investment and its Determinants: A Look to the Past, A View to the Future. In Foreign Investment in Developing Nations, edited by H.S. Kehal. New York: Palgrave Macmillan, Ltd.
Dickey, D., & W. Fuller, (1979). Likelihood Ratio Statistics for Autoregressive Time Series with a Unit Root. Econometrica, 49 (June): 1057-1072.
Doldado, J., T. Jenkinson, & S. Sosvilla-Rivero, (1990). Cointegration and Unit Roots, Journal of Economic Surveys, 4, 249-73. http://dx.doi.org/10.1111/j.1467-6419.1990.tb00088.x
ECLAC. (2006-11. Foreign Investment in Latin America and the Caribbean, Various Reports.
Ellerman, D. (2003). Policy Research on Migration and Development, World Bank Policy Research Working Paper, No. 3117. Washington, D.C.: The World Bank.
Engle, R. F., & C. W. J. Granger. (1987). Cointegration and Error Correction: Representation,

Business and Economic Research ISSN 2162-4860
2014, Vol. 4, No. 1
www.macrothink.org/ber 370
Estimation, and Testing. Econometrica 55 (March): 251-76. http://dx.doi.org/10.2307/1913236
Guiliano, P., & Ruiz-Arranz, M. (2006). Remittances, Financial Development, and Growth. IMF Working Papers, No. 05-234.
Gregory, A. W., & B. E. Hansen. (1996). Tests for Cointegration in Models with Regime and Trend shifts.” Journal of Econometrics, 70(1), 99-126. http://dx.doi.org/10.1016/0304-4076(69)41685-7
Hakkio, C. S., & M. Rush. (1991). Cointegration: How Short is the Long- run? Journal of International Money and Finance, 10, 571-81. http://dx.doi.org/10.1016/0261-5606(91)90008-8
Huang, T. Jr. (2004). Spillovers from FDI in China. Contemporary Economic Policy, 22, 13-25. http://dx.doi.org/10.1093/cep/byh002
Johansen, Soren and K. Juselius. (1990). Maximum Likelihood Estimation and Inference on Cointegration with Applications to the Demand for Money. Oxford Bulletin ofEconomics and Statistics, 52(May): 169-210.
Kwaitkowski, D., Phillips, P.C.B., Schmidt, P., and Shin, Y., (1992). Testing the Null Hypothesis of Stationarity against the Alternative of a Unit Root, Journal of Econometrics, 54: 159-78. http://dx.doi.org/10.1016/0304-4076(92)90104-Y
Lee, J. and M.C. Strazicich. (2003). Minimum Lagrange Multiplier Unit Root Test with Two Structural Breaks, The Review of Economics and Statistics, 85(4), 1082-1089. http://dx.doi.org/10.1162/003465303772815961
Mohapatra, D., D. Ratha, & A. Silwal. (2011). Outlook for Remittance Flows 2011-13, Migration and Development Brief, No. 16. Washington, D.C.: The World Bank, May.
Mundaca, G. (2005). Can remittances enhance economic growth? the role of financial market development SSRN. Retrieved from http://ssrn.com/paper=799484
Nacional Financiera, S.A. La Economia Mexicana en Cifras. Mexico, D.F.: Nafinsa, various issues.
Perron, P. (1989). The Great Crash, the Oil Price Shock and the Unit Root Hypothesis, Econometrica, 57, 1361-1401. http://dx.doi.org/10.2307/1913712
Ramanarayanan, A. (2009). Ties that Bind: Bilateral Trade’s Role in Synchronizing Business Cycles. Economic Letter, 4, 1, January, pp. 1-8. Federal Reserve Bank of Dallas.
Ramirez, M. D. (1997). The Latest IMF-Sponsored Stabilization Program: Does It Represent a Long-term Solution for Mexico’s Economy? Journal of Interamerican Studies and Affairs, 39(4), 129-156.
Ramirez, M. D. (2007). A Panel Unit Root and Panel Cointegration Test of the Complementarity Hypothesis in the Mexican Case: 1960-2001. Atlantic Economic Journal, 35,

Business and Economic Research ISSN 2162-4860
2014, Vol. 4, No. 1
www.macrothink.org/ber 371
343-356. http://dx.doi.org/10.1007/s11293-007-9078-6
Ratha, D. (2003). Workers’ Remittances: An important and Stable Source of External Development Finance. Global Development Finance. Washington, D.C.: The World Bank.
Seton , A. (2003). On Unit Root Tests when the Alternative is a Trend Break Stationary Process, Journal Of Business and Economic Statistics, 21, 174-184. http://dx.doi.org/10.1198/073500102288618874
Sharma, H., & M. D. Ramirez. (2009). Remittances and Growth in Latin America: A Panel Unit Root and Panel Cointegration Analysis, Estudios Economicos de Desarrollo Internacional, 9(1), 5-32.
Solimano, A. (2003). Remittances by Emigrants: Issues and Evidence. Macroeconomias del Desarrollo, 26, Economic Development Division. Santiago: Chile, October.
Theil, H. (1966). Applied Economic Forecasting. Amsterdam: North-Holland.
The World Bank. (2009-11). Migration and Development Brief. Washington, D.C.: Migration and Remittances Unit.
United Nations. (2007). World Investment Report 2007: Trends and Determinants. Switzerland: United Nations.
Waheed, M. A., A. Tasneem, & G. S. Pervaiz. (2007). Structural Breaks and Unit Roots: Evidence From Pakistani Macroeconomic Time Series, MPRA Paper, No. 1797, (November): 1-18.
Woodruff, C. (2006). Mexican microenterprise investment and employment: Role of remittances. INTAL-ITD Working Paper 26.
Zivot, E., & D. Andrews. (1992). Further Evidence of Great Crash, the Oil Price Shock, and Unit Root Hypothesis, Journal of Business and Economic Statistics, 10, 251-270.
Endnotes
1.Ellerman (2003) reports that Mexican migrant associations send home between US $5000-$25, 000 per year, while migrant associations from El Salvador send home donations of about US $ 10,000 per year. Orozco (2004) identifies at least 2000 HTAs in the U.S., with the highest concentration in southern California and the Chicago Metropolitan area (p. 2). His field work indicates that, on average, Mexican HTAs send around $10,000 a year for a variety of rural projects, including health and education, public infrastructure, economic investment, church support, and recreation. He reports that these contributions are quite significant because in rural towns of less than 6000 inhabitants the annual municipal budget for public works is often less than $50,000 (p.4).
2. For further detail see Blomstrom and Wolf (op. cit) who find that labor productivity growth in Mexico is positively associated with the degree of foreign concentration in a given industry (pp. 263-284).
3. Investment and FDI data published by the OECD was cross-checked with that found in INEGI and La

Business and Economic Research ISSN 2162-4860
2014, Vol. 4, No. 1
www.macrothink.org/ber 372
Economia Mexicana en Cifras, and no significant differences were discerned.
4. For example, Hakkio and Rush (1991) contend that in nearly non-stationary time series “the frequency of observation plays a very minor role” in cointegration [and unit root] analysis because “cointegration is a long-run property, and thus we often need long spans of data to properly test it” (p. 579). They demonstrate this using Monte Carlo simulations for four popular tests. Similarly, Bahmani-Oskooee (1996) observes that in cointegration (and unit root) analysis using annual data over 30 years “is as good as using quarterly data over the same period” (p. 481).
5. The Doldado et al. procedure starts by estimating the most general (unrestricted) model (with a constant and a trend) before moving to the next more restricted model (a constant only), and so on. The order of the lag length was determined by applying both the Akaike Information Criterion (AIC) and the Schwartz Bayesian Criterion (SBC). Between the two criteria, the SBC is more reliable because the AIC is known to be biased towards choosing an over-specified model.
6. A stochastic trend is one where the random component of the series itself, say variable xt, contributes directly to the long run pattern of the series, either upward or downward. However, in the case of a deterministic trend the deviations from the non-stationary mean over time are quickly corrected. It is also possible for the variable in question to display both a stochastic and deterministic trend process over time. For further details see Charemza and Deadman, (1997, pp. 84-92).
7. The Z-A one-break point unit root test was also performed for the relevant time series in differenced form under the assumption of model C and the null hypothesis was rejected at the 5 percent level or lower in all cases.
8. Estimates for the labor productivity function are consistent with those for the output function and are available upon request.
9. The public investment variable was assumed to be exogenous because Mexican policymakers abruptly reduced public investment spending in response to the demise of import-substitution industrialization policies as well as external pressure on the part of the IMF and other multilateral institutions (for further details, see Ramirez, 1997).
10. As a confirmatory test, I performed a Gregory and Hansen (1996) cointegration test with endogenously determined level (intercept) shift (CC) and obtained a minimum ADF* stat. = -5.89 [break point=1987] which is smaller than the tabulated 1 % critical value [-5.13 (1%); -4.61(5%); -4.34(10%)] reported by Gregory and Hansen. Thus, the null hypothesis of no cointegration with endogenously determined break is rejected at the 1 percent level of significance. It should be noted that the break date is found by estimating the cointegrating relationship for all possible break dates in the sample period. The Rats program selects the break date where the modified [trimmed] ADF* = inf ADF (τ) test statistic is at its minimum. All estimations were undertaken with Rats 7.3 and are available upon request.
Copyright Disclaimer
Copyright for this article is retained by the author(s), with first publication rights granted to the journal.

Business and Economic Research ISSN 2162-4860
2014, Vol. 4, No. 1
www.macrothink.org/ber 373
This is an open-access article distributed under the terms and conditions of the Creative Commons Attribution license (http://creativecommons.org/licenses/by/3.0/).
Business and Economic Research ISSN 2162-4860
2014, Vol. 4, No. 1
http://ber.macrothink.org 374
Reviewer Acknowledgements
Business and Economic Research (BER) would like to thank the following reviewers for reviewing manuscripts from January 1, 2014, to May 31, 2014. Their comments and suggestions were of great help to the authors in improving the quality of their papers. Many authors, regardless of whether BER publishes their work, appreciate the helpful feedback provided by the reviewers. Macrothink Institute appreciates the following reviewers’ rigorous and conscientious efforts for this journal. Each of the reviewers listed below returned at least one review during this period.
Alunica Morariu Annamaria Fiore Antonio Ruiz-Porras Armin J. Kammel B M Santosh Bilal Sakarneh Bratu (Simionescu) Mihaela Ewa Kleczyk
Eyup Dogan Fahmi Shaaban Fararah Judy Li Piotr Siemiątkowski S. H. Hengky Sahar Bahmani Said Jaouadi Sarker Sandip
Daisy Young
Editorial Assistant
On behalf of,
The Editorial Board of Business and Economic Research
Macrothink Institute
5348 Vegas Dr.#825
Las Vegas, Nevada 89108
United States
URL: http://ber.macrothink.org