Modeling of microalgal metabolism - WUR eDepot
200
Modeling of microalgal metabolism
-
Upload
khangminh22 -
Category
Documents
-
view
0 -
download
0
Transcript of Modeling of microalgal metabolism - WUR eDepot

Modeling of microalgal
metabolism

Thesis committee
Thesis supervisor
Prof. dr. R.H. Wijffels Professor of Bioprocess Engineering,
Wageningen University
Thesis co‐supervisors
Dr. ir. M.G.J. Janssen Assistant professor Bioprocess Engineering,
Wageningen University
Dr. ir. D.E. Martens Assistant professor Bioprocess Engineering,
Wageningen University
Other members
Prof. dr. V.A.P. Martins dos Santos Wageningen University
Prof. dr. K.J. Hellingwerf University of Amsterdam
Prof. dr. O. Kruse Bielefeld University, Germany
Dr. B.G. Temmink Wageningen University
This research has been conducted under the auspices of the Graduate School VLAG

Modeling of microalgal metabolism
Anna Marguérita Jeanetta Kliphuis
Submitted in fulfillment of the requirement for the degree of doctor
at Wageningen University
by the authority of the Rector Magnificus
Prof. dr. M.J. Kropff,
in the presence of the
Thesis Committee appointed by the Academic Board
to be defended in public
on Wednesday 15 December 2010
at 4 p.m. in the Aula

A.M.J. Kliphuis
Modeling of microalgal metabolism
200 pages
PhD Thesis, Wageningen University, Wageningen, NL (2010)
With references, with summaries in Dutch and English
ISBN 978‐90‐8585‐833‐1

Twijfel niet.
Voor opi en omi

Contents
Chapter 1 9
Introduction and thesis outline Chapter 2 17 Photosynthetic efficiency of Chlorella sorokiniana in a turbulently mixed short light‐path photobioreactor Chapter 3 43 Light respiration in Chlorella sorokiniana Chapter 4 69 Metabolic modeling of Chlamydomonas reinhardtii: energy requirements for photoautotrophic growth and maintenance Chapter 5 107 Effect of O2 : CO2 ratio on the primary metabolism of Chlamydomonas reinhardtii Chapter 6 139 Towards high biomass yields ‐ a better understanding of microalgal metabolism References 161 Summary 177 Samenvatting 182 Dankwoord 189 Curriculum Vitae 195 Training activities 199


Chapter
Introduction and thesis outline
Chapter 1
10
Introduction
Microalgae and photoautotrophic growth
Microalgae are a potential source for a wide range of products, such as carotenoids, lip‐
ids, hydrogen, protein and starch, which are of interest for food, feed and biofuel appli‐
cations. However, to produce these compounds the microalgae themselves need to be
cultivated first.
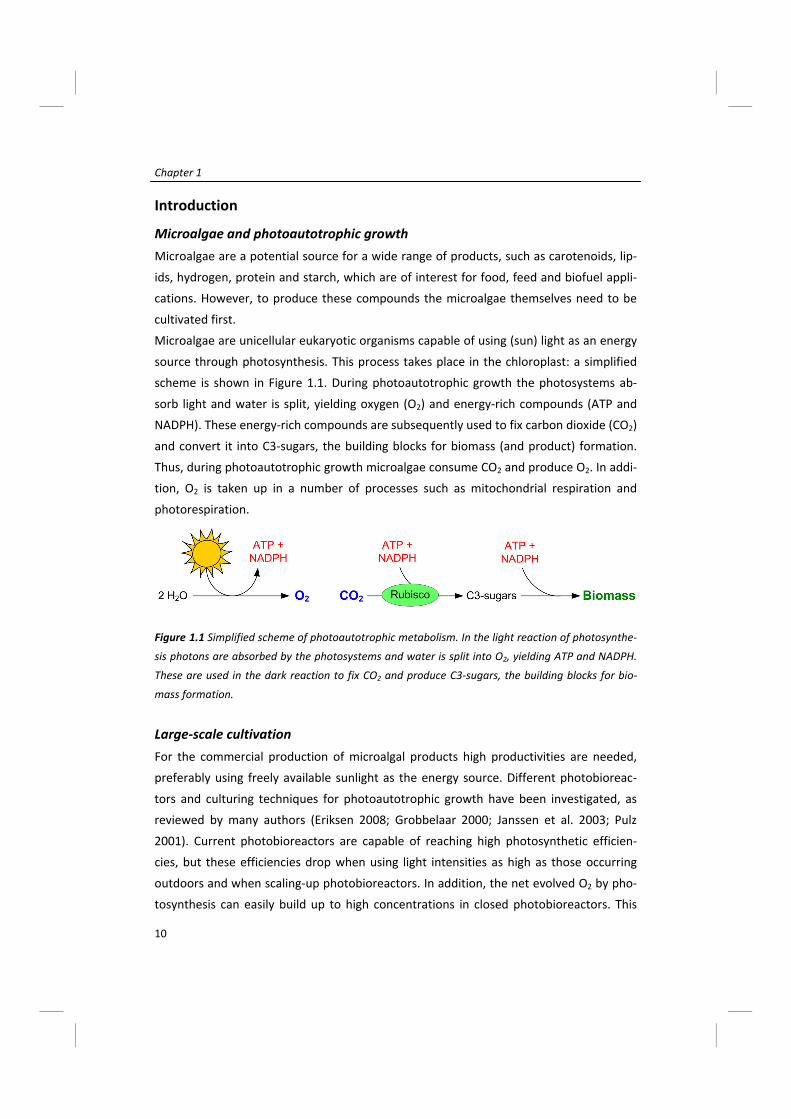
Microalgae are unicellular eukaryotic organisms capable of using (sun) light as an energy
source through photosynthesis. This process takes place in the chloroplast: a simplified
scheme is shown in Figure 1.1. During photoautotrophic growth the photosystems ab‐
sorb light and water is split, yielding oxygen (O2) and energy‐rich compounds (ATP and
NADPH). These energy‐rich compounds are subsequently used to fix carbon dioxide (CO2)
and convert it into C3‐sugars, the building blocks for biomass (and product) formation.
Thus, during photoautotrophic growth microalgae consume CO2 and produce O2. In addi‐
tion, O2 is taken up in a number of processes such as mitochondrial respiration and
photorespiration.
Figure 1.1 Simplified scheme of photoautotrophic metabolism. In the light reaction of photosynthe‐
sis photons are absorbed by the photosystems and water is split into O2, yielding ATP and NADPH.
These are used in the dark reaction to fix CO2 and produce C3‐sugars, the building blocks for bio‐
mass formation.
Large‐scale cultivation
For the commercial production of microalgal products high productivities are needed,
preferably using freely available sunlight as the energy source. Different photobioreac‐
tors and culturing techniques for photoautotrophic growth have been investigated, as
reviewed by many authors (Eriksen 2008; Grobbelaar 2000; Janssen et al. 2003; Pulz
2001). Current photobioreactors are capable of reaching high photosynthetic efficien‐
cies, but these efficiencies drop when using light intensities as high as those occurring
outdoors and when scaling‐up photobioreactors. In addition, the net evolved O2 by pho‐
tosynthesis can easily build up to high concentrations in closed photobioreactors. This

Introduction
11
can inhibit growth of the microalgae and have a negative effect on productivity (Carvalho
et al. 2006; Miron et al. 1999; Wijffels et al. 2010). Oxygen build‐up can only be pre‐
vented by gassing the cultures with air, a major energy input and an important economic
factor limiting the large‐scale cultivation of microalgae. A very important objective of
applied algae research is to maximize biomass (or product) yield and at the same time
minimize the energy input and cultivation costs. Both have to be balanced in the end. To
achieve this, insight in the metabolism of the microalgae is a valuable tool to optimize
cultivation parameters accordingly.
Figure 1.2 Photosynthetic cell
factory. Sunlight, CO2, NO3 and
nutrients are taken up by the
cell and metabolized to O2,
biomass and products. This
figure shows the metabolism
inside the cell as a ‘black box’,
an unknown set of processes.
With a metabolic network and
subsequent Flux Balance Analy‐
sis (FBA) insight in these proc‐
esses can be gained.
Figure 1.3 Short light‐path (SLP) photobioreactor setup.

Chapter 1
12
Flux Balance Analysis as a tool
To obtain the desired insight in the metabolism (more specifically O2 metabolism) and
understand the mechanisms behind the allocation of light energy for microalgal growth,
we constructed a metabolic model describing the metabolism of the green microalga
Chlamydomonas reinhardtii. With this model Flux Balance Analysis (FBA) can be per‐
formed to study the effect of cultivation parameters on the metabolism and the biomass
yield. FBA is a powerful tool to study the fluxes through metabolic pathways of any or‐
ganism of interest (Stephanopoulos et al. 1998). It provides information on how nutri‐
ents and energy are utilized to form biomass and other components. Information on
metabolic fluxes and pathways leads to a better understanding of metabolism and the
identification of targets for process optimization.
However, to be able to study the effect of O2 on the metabolism of C. reinhardtii, the
energy requirements for growth and maintenance need to be incorporated in the model
to accurately describe the metabolism. To estimate these energy requirements and to
assess the effect of O2 on the metabolism, experiments under controlled conditions are
necessary. Additionally, inputs and outputs of the metabolism need to be measured ac‐
curately to serve as input parameters for FBA.
Controlled lab‐scale cultivation and growth monitoring
To be able to perform experiments under controlled conditions and accurately measure
the inputs and outputs of the metabolism (CO2, O2, biomass, nitrogen, light) on‐line dur‐
ing cultivation, a novel cultivation and on‐line measurement system is needed. Therefore
we designed a lab‐scale photobioreactor which combines a short light path of 12 mm
with controlled mixing and aeration (Figure 1.3). In this SLP photobioreactor mixing is
provided by rotating an inner tube in the cylindrical cultivation vessel. The algae are cul‐
tivated in the annular gap between this rotating cylinder and the outer glass cylinder. By
uncoupling the mixing from aeration the effect of mixing on the biomass yield can be
studied and the gas‐exchange can be measured on‐line. The on‐line measured CO2 up‐
take rate (CUR) and O2 production rate (OPR) can be used as inputs for the metabolic
model and give insight in the biomass yield on light. In addition, frequent analyses of
reactor samples off‐line give information on growth rate, biomass concentration and
composition, which can also be used as inputs for the model.

Introduction
13
Thesis outline
The aim of this thesis is to obtain insight in the biomass yield on light and the metabo‐
lism of microalgae and more specifically the O2 metabolism because this has a large im‐
pact on the energy efficiency. To be able to accurately measure the inputs and outputs
of the metabolism (CO2, O2, biomass, nitrogen, light) on‐line during cultivation, we devel‐
oped a lab‐scale short light‐path (SLP) photobioreactor with an on‐line measurement
system as described in detail in Chapter 2. In this photobioreactor mixing was carried out
independently from aeration to be able to measure the gas‐exchange on‐line as well as
determine the effect of mixing on the biomass yield of Chlorella sorokiniana.
In illuminated microalgal cells several processes in which oxygen is involved occur simul‐
taneously. Under the cultivation conditions in the experiments in Chapter 3 two proc‐
esses dominate, photosynthesis and mitochondrial light respiration. The net oxygen ex‐
change rate, which can be directly measured, is the sum of the oxygen production by
photosynthesis and oxygen consumption through respiration in the mitochondria. To
know the rates of these two processes one of these has to be measured. In Chapter 3 a
method is described to estimate the light respiration rate by measuring the post‐
illumination oxygen uptake. This method was tested for Chlorella sorokiniana at different
biomass concentrations and revealed that part of the respiratory activity was coupled to
growth and a part was not.
To gain insight in the metabolism and understand the mechanisms behind the allocation
of light energy for microalgal growth we constructed a metabolic model. This model de‐
scribes the primary metabolism for the green microalgae Chlamydomonas reinhardtii
and is described in Chapter 4. This model was based on literature and the sequenced
genome of C. reinhardtii. In addition to the model, this chapter describes experiments
performed to estimate the energy requirements for growth and maintenance and the
consequences for the yield of biomass on light energy.
The effect of elevated O2 concentrations on the yield and metabolism of C. reinhardtii is
described in Chapter 5. By cultivating microalgae under different O2 : CO2 ratios in the
SLP photobioreactor and measuring the oxygen production rate (OPR) and carbon diox‐
ide uptake rate (CUR) on‐line we could assess the effect of elevated O2 concentrations on
the biomass yield of C. reinhardtii. The measured rates were used as input for the meta‐
bolic model to quantify the effect of higher O2 : CO2 ratios and gain insight in the process
of photorespiration.
Chapter 1
14
To thoroughly understand the energy metabolism of microalgal cells and with that the
conversion of light energy into biomass, insight into the different processes involved in
O2 production and uptake and CO2 consumption and production is necessary. In Chapter
6 an overview is given of the metabolic processes in which O2 plays a role, as well as how
these processes could be measured. Subsequently, ways to improve and expand the
metabolic model in order to obtain a better insight in the metabolism are discussed. If a
dynamic description of the light reactions of photosynthesis is included it might ulti‐
mately be possible to make predictions on biomass and product yield based on the light
regime the microalgae are exposed to.


Chapter
Photosynthetic efficiency of
Chlorella sorokiniana in a turbulently
mixed short light‐path photobioreactor
Kliphuis AMJ, de Winter L, Vejrazka C, Martens DE, Janssen M, Wijffels RH (2010)
Photosynthetic efficiency of Chlorella sorokiniana in a turbulently mixed
short light‐path photobioreactor
Biotechnology Progress 26:687‐696

Chapter 2
18
Abstract
T o be able to study the effect of mixing as well as any other parameter on productiv‐
ity of algal cultures we designed a lab‐scale photobioreactor in which a short light
path (SLP) of (12 mm) is combined with controlled mixing and aeration. Mixing is pro‐
vided by rotating an inner tube in the cylindrical cultivation vessel creating Taylor vortex
flow and as such mixing can be uncoupled from aeration. Gas exchange is monitored on‐
line to gain insight in growth and productivity. The maximal productivity, hence photo‐
synthetic efficiency, of Chlorella sorokiniana cultures at high light intensities (1500 µmol
m‐1 s‐1) was investigated in this Taylor vortex flow SLP photobioreactor. We performed
duplicate batch experiments at three different mixing rates: 70, 110 and 140 rpm, all in
the turbulent Taylor vortex flow regime. For the mixing rate of 140 rpm we calculated a
quantum requirement for oxygen evolution of 21.2 mol PAR photons per mol O2 and a
yield of biomass on light energy of 0.8 g biomass per mol PAR photons. The maximal
photosynthetic efficiency was found at relatively low biomass densities (2.3 g L‐1) at
which light was just attenuated before reaching the rear of the culture. When increasing
the mixing rate two‐fold we only found a small increase in productivity. Based on these
results we conclude that the maximal productivity and photosynthetic efficiency for
Chlorella sorokiniana can be found at that biomass concentration where no significant
dark zone can develop and that the influence of mixing‐induced light/dark fluctuations is
marginal.
Keywords: Microalgae, Chlorella sorokiniana, Productivity, Photosynthetic efficiency,
Short light‐path photobioreactor, Mixing
Photosynthetic efficiency of C. sorokiniana in a turbulently mixed SLP photobioreactor
19
Introduction
Microalgal products such as carotenoids and lipids for food, feed and biofuels are of big
interest. To produce these compounds the microalgae themselves need to be cultivated
first. Different photobioreactors and culturing techniques for photoautotrophic growth
have been investigated, as reviewed by many authors (Eriksen 2008; Grobbelaar 2000;
Janssen et al. 2003; Pulz 2001). Current photobioreactors are capable of reaching high
photosynthetic efficiencies, but these efficiencies drop when using high light intensities
as occur outdoors and when scaling‐up photobioreactors. Maximization of biomass pro‐
ductivity in (large‐scale) outdoor photobioreactors is important. To achieve this, we need
more knowledge of the growth characteristics of microalgae and optimize cultivation
parameters such as the light regime.
Faster mixing of dense Spirulina (Arthrospira) cultures in short light path (SLP) panel
photobioreactors, for example, can increase the biomass productivity at high light inten‐
sities (Qiang et al. 1996; Qiang and Richmond 1996). Under such conditions these cyano‐
bacteria are only shortly exposed to over‐saturating light intensities at the bioreactor
surface before travelling to darker regions of the photobioreactor and it was hypothe‐
sized that this light regime lead to higher photosynthetic efficiencies by preventing over‐
saturation and inducing light integration (Richmond 2000). However, the photosynthetic
efficiencies found for microalgae were considerably lower than for Spirulina and the
question remains whether the same strategy could be applied for microalgae.
In flat panel photobioreactors mixing is provided by aeration and enhanced by increasing
the airflow. To create turbulence, 2.8 to 4.2 L min‐1 of air per liter reactor volume must
be provided (Qiang et al. 1996; Qiang and Richmond 1996; Qiang et al. 1998). However,
in order to be able to accurately measure photosynthetic activity through the on‐line
monitoring of oxygen production rates and carbon dioxide consumption rates, the air‐
flow needs to be lower to have larger differences in O2 and CO2 mass fractions in the
ingoing and outgoing gas. In addition, Barbosa et al. (2003) found that high gas flow ve‐
locities entering the photobioreactor can cause high shear rates and cell death. There‐
fore to be able to measure algal productivity accurately we need to uncouple mixing
from the gas flow, whilst maintaining a short light path.
To be able to study the effect of mixing as well as any other parameter on productivity of
algal cultures we designed a lab‐scale photobioreactor which combines a short light path
of 12 mm with controlled mixing and aeration (Figure 2.1). In this SLP photobioreactor,
all cultivation conditions can be controlled and varied to study the productivity of micro‐

Chapter 2
20
algal cultures as a function of different design parameters, e.g. temperature, light inten‐
sity, oxygen and carbon dioxide partial pressure, and mixing rate. Mixing is provided by
rotating an inner tube in the cylindrical cultivation vessel, inducing Taylor vortex flow.
The algae were cultivated in the annular gap between this rotating cylinder and the
outer glass cylinder. This system is similar to the device used by Miller et al. (1964) but
our system was improved considerably so that algae could be grown for a period of days
within the photobioreactor under fully controlled conditions, and microalgae growth
could be accurately monitored and quantified during this period.
Figure 2.1 Taylor vortex flow SLP photobioreactor containing Chlorella sorokiniana at the start of a
batch cultivation. The inner rotating cylinder and gas bubbles are still visible at this low initial bio‐
mass density.

Photosynthetic efficiency of C. sorokiniana in a turbulently mixed SLP photobioreactor
21
In this study we determined the maximal productivity of Chlorella sorokiniana cultures at
high light intensities in the Taylor vortex flow SLP photobioreactor. We worked in the
turbulent Taylor vortex flow regime (Reθ = 6660 – 13320) which was shown to give the highest photosynthetic activity for very dense algal cultures (Miller et al. 1964). In our
experiments, on the other hand, we started at very low initial biomass concentrations
and allowed the microalgae to grow inside the photobioreactor. By continuously moni‐
toring the carbon dioxide consumption rate (CUR) and oxygen production rate (OPR) we
were able to assess the maximal productivity and hence the maximal photosynthetic
efficiency of microalgae growth. Frequent analysis of reactor samples off‐line allowed us
to assess at which biomass concentration this optimum was reached. Moreover, the mix‐
ing rate was increased with a factor 2 to check whether a further increase in mixing rate
led to an increase in productivity.
Theory ‐ Liquid flow in a Couette apparatus
The flow pattern occurring in a Couette apparatus with rotating inner cylinder and fixed
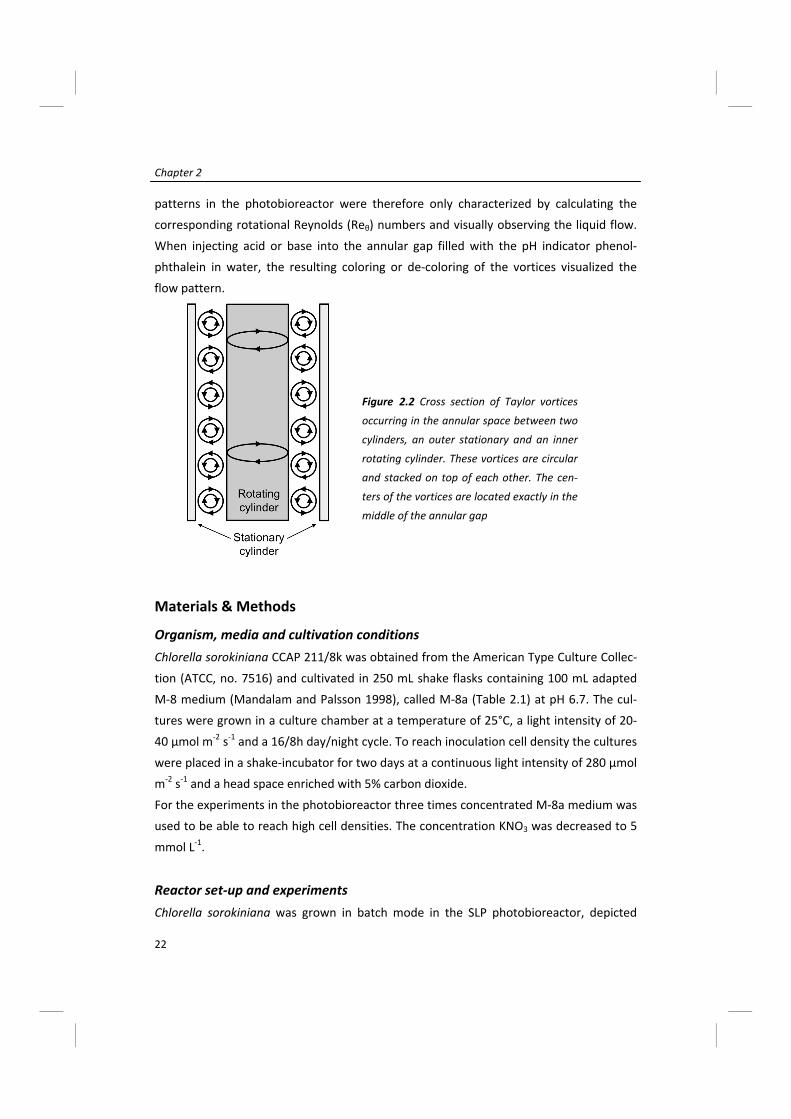
outer cylinder is described by Taylor (1923). Taylor vortices will appear when the angular
speed of the inner cylinder reaches a critical value, as shown in Figure 2.2. This secon‐
dary flow pattern, singly periodic flow, is stable above this critical angular speed. How‐
ever, when the angular speed of the inner cylinder increases, the centers of the vortices
become vertically oscillating waves. This flow pattern is described as wavy vortex flow, or
doubly periodic flow. When the angular speed of the inner cylinder increases even more,
the flow becomes turbulent (Bird et al. 1960). This turbulent flow is still characterized by
a secondary vortex flow, for an example see Yang et al. (2006), and is usually referred to
as turbulent Taylor vortex flow.
The transition of these flow patterns largely depends on the radius ratio of the inner and
outer cylinder and on the fluid viscosity. Many different ways of analyzing and quantify‐
ing the corresponding flow patterns are described in literature (Conway et al. 2004;
Curran and Black 2005; Giordano and Giordano 2006; Hondzo et al. 1998; Lathrop et al.
1992; Miller et al. 1964; Resende et al. 2001). However, the problems with these flow
instabilities and transitions between flow patterns are complex and cannot be solved by
theory alone (Bird et al. 1960). In our system we have a two‐phase flow due to the ne‐
cessity to gas the culture to supply carbon dioxide and remove oxygen. The presence of
gas bubbles still allows vortex flow (Murai et al. 2005) but it will further complicate the
accurate quantitative evaluation of the liquid flow. In our biotechnological study the flow
Chapter 2
22
patterns in the photobioreactor were therefore only characterized by calculating the
corresponding rotational Reynolds (Reθ) numbers and visually observing the liquid flow.
When injecting acid or base into the annular gap filled with the pH indicator phenol‐
phthalein in water, the resulting coloring or de‐coloring of the vortices visualized the
flow pattern.
Materials & Methods
Organism, media and cultivation conditions
Chlorella sorokiniana CCAP 211/8k was obtained from the American Type Culture Collec‐
tion (ATCC, no. 7516) and cultivated in 250 mL shake flasks containing 100 mL adapted
M‐8 medium (Mandalam and Palsson 1998), called M‐8a (Table 2.1) at pH 6.7. The cul‐
tures were grown in a culture chamber at a temperature of 25°C, a light intensity of 20‐
40 µmol m‐2 s‐1 and a 16/8h day/night cycle. To reach inoculation cell density the cultures
were placed in a shake‐incubator for two days at a continuous light intensity of 280 µmol
m‐2 s‐1 and a head space enriched with 5% carbon dioxide.
For the experiments in the photobioreactor three times concentrated M‐8a medium was
used to be able to reach high cell densities. The concentration KNO3 was decreased to 5
mmol L‐1.
Reactor set‐up and experiments
Chlorella sorokiniana was grown in batch mode in the SLP photobioreactor, depicted
Figure 2.2 Cross section of Taylor vortices
occurring in the annular space between two
cylinders, an outer stationary and an inner
rotating cylinder. These vortices are circular
and stacked on top of each other. The cen‐
ters of the vortices are located exactly in the
middle of the annular gap
Photosynthetic efficiency of C. sorokiniana in a turbulently mixed SLP photobioreactor
23
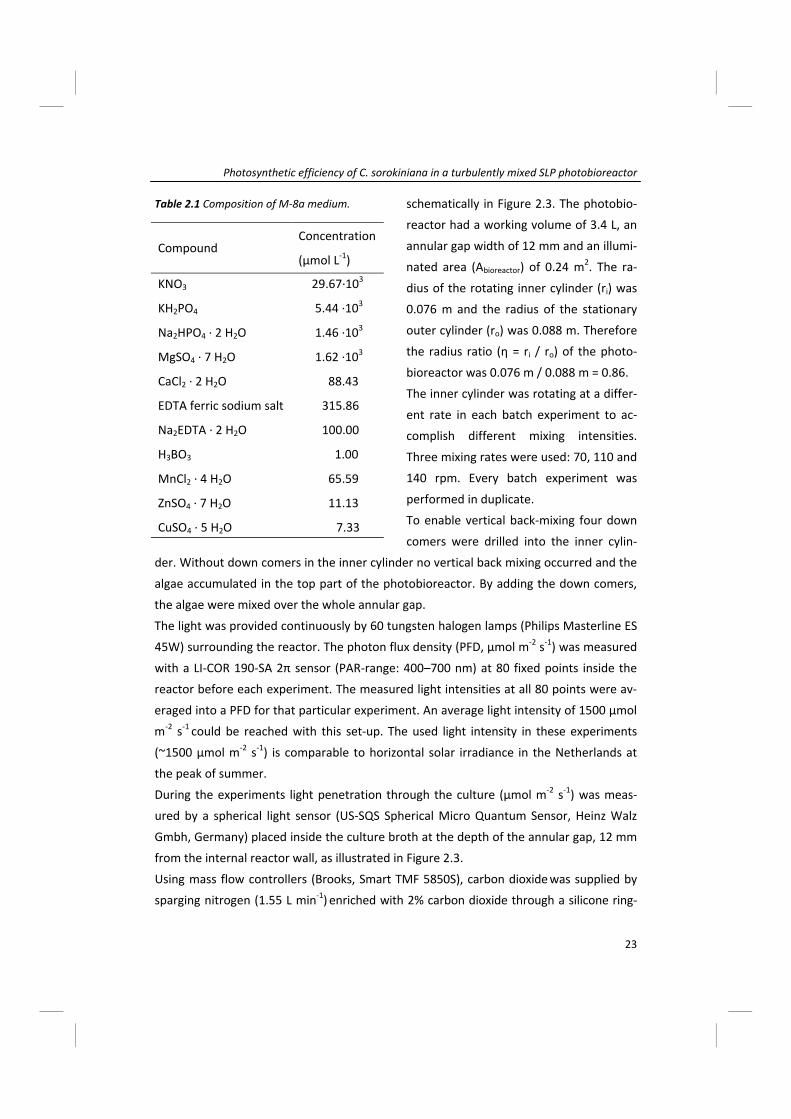
schematically in Figure 2.3. The photobio‐
reactor had a working volume of 3.4 L, an
annular gap width of 12 mm and an illumi‐
nated area (Abioreactor) of 0.24 m2. The ra‐
dius of the rotating inner cylinder (ri) was
0.076 m and the radius of the stationary
outer cylinder (ro) was 0.088 m. Therefore
the radius ratio (η = ri / ro) of the photo‐
bioreactor was 0.076 m / 0.088 m = 0.86.
The inner cylinder was rotating at a differ‐
ent rate in each batch experiment to ac‐
complish different mixing intensities.
Three mixing rates were used: 70, 110 and
140 rpm. Every batch experiment was
performed in duplicate.
To enable vertical back‐mixing four down
comers were drilled into the inner cylin‐
der. Without down comers in the inner cylinder no vertical back mixing occurred and the
algae accumulated in the top part of the photobioreactor. By adding the down comers,
the algae were mixed over the whole annular gap.
The light was provided continuously by 60 tungsten halogen lamps (Philips Masterline ES
45W) surrounding the reactor. The photon flux density (PFD, µmol m‐2 s‐1) was measured
with a LI‐COR 190‐SA 2π sensor (PAR‐range: 400–700 nm) at 80 fixed points inside the
reactor before each experiment. The measured light intensities at all 80 points were av‐
eraged into a PFD for that particular experiment. An average light intensity of 1500 µmol
m‐2 s‐1 could be reached with this set‐up. The used light intensity in these experiments
(~1500 µmol m‐2 s‐1) is comparable to horizontal solar irradiance in the Netherlands at
the peak of summer.
During the experiments light penetration through the culture (µmol m‐2 s‐1) was meas‐
ured by a spherical light sensor (US‐SQS Spherical Micro Quantum Sensor, Heinz Walz
Gmbh, Germany) placed inside the culture broth at the depth of the annular gap, 12 mm
from the internal reactor wall, as illustrated in Figure 2.3.
Using mass flow controllers (Brooks, Smart TMF 5850S), carbon dioxide was supplied by
sparging nitrogen (1.55 L min‐1) enriched with 2% carbon dioxide through a silicone ring‐
Compound Concentration
(µmol L‐1)
KNO3
KH2PO4
Na2HPO4 ∙ 2 H2O
MgSO4 ∙ 7 H2O
CaCl2 ∙ 2 H2O
EDTA ferric sodium salt
Na2EDTA ∙ 2 H2O
H3BO3
MnCl2 ∙ 4 H2O
ZnSO4 ∙ 7 H2O
CuSO4 ∙ 5 H2O
29.67∙103
5.44 ∙103
1.46 ∙103
1.62 ∙103
88.43
315.86
100.00
1.00
65.59
11.13
7.33
Table 2.1 Composition of M‐8a medium.

Chapter 2
24
sparger at the bottom of the reactor. This gas flow also served to remove excess oxygen
from the culture broth. The pH was controlled at pH 6.7 ± 0.1 by pumping nitric acid (1.7
M), serving also as nitrogen source. The acid, antifoam and overflow were placed on bal‐
ances and weighed on‐line. The reactor was kept at 37°C by a water jacket connected to
a temperature‐controlled water bath. To prevent water from evaporating into the off‐
gas the reactor was equipped with a condenser connected to a cryostat set at 2°C. Bio‐
mass samples were taken from the bottom of the reactor and weighed off‐line.
Figure 2.3 Schematic overview (not on scale) of the SLP photobioreactor. A = annular gap, C = con‐
denser, D = internal down comer, DO = dissolved oxygen sensor, GA = gas analyzer, I = inner cylin‐
der, M = motor, MFC = Mass flow controllers for both N2 and CO2, pH = pH control connected to
acid pump, S = sparger, T = temperature control connected to cryostat and cooling jacket (not
shown).
On‐line gas analysis and calculations
The off‐gas was analyzed by leading it over a gas analyzer (Servomex, 4100) fitted with
two different gas sensor modules, a paramagnetic purity transducer to measure oxygen
and an infrared 1500 transducer to measure carbon dioxide.

Photosynthetic efficiency of C. sorokiniana in a turbulently mixed SLP photobioreactor
25
Before each experiment, a dry and a wet baseline were measured to correct the experi‐
mental gas data for moisture content according to equation 1. The dry baseline was
measured by leading 1.55 L min‐1 nitrogen enriched with 2% carbon dioxide over the gas
analyzers. For the wet baseline the nitrogen enriched with carbon dioxide was first
sparged through the reactor, containing medium at the same temperature and pH as
during the batch experiment, and through the condenser before being analyzed.
(1)
The total molar gas flow going in (ngas,in, mmol h‐1) is corrected for the molar fraction of
carbon dioxide in both the dry (xCO2,db) and wet baseline (xCO2,wb). With this corrected
molar gas flow ngas,out (mmol h‐1) and the molar fraction of oxygen (xO2,exp) and carbon
dioxide (xCO2,exp) measured during the experiments, the oxygen production rate (OPR,
mmol h‐1) and carbon dioxide uptake rate (CUR, mmol h‐1) are calculated according to
equations 2 and 3.
(2)
(3)
The ratio between the OPR and CUR is the photosynthetic quotient PQ. The PQ can be
calculated according to equation 4:
(4)
The quantum requirement for oxygen (QRO2, mol photons mol O2‐1) and carbon dioxide
(QRCO2, mol photons mol CO2‐1) are calculated according to equations 5 and 6. The pho‐
ton flux (PF, mmol h‐1) is calculated using the measured average photon flux density
(PFD, µmol m‐2 s‐1) and the illuminated photobioreactor area Abioreactor (m2) described
earlier.
(5)
wbCO2,
dbCO2,ingas,outgas, x
xnn ⋅=
100
)x(xnOPR wbO2,expO2,outgas, −⋅
=
100
)x(xnCUR wbCO2,expCO2,outgas, −⋅
=
CUROPRPQ =
OPRPFQRO2 =

Chapter 2
26
(6)
These QR values are a measure for productivity and are expressed as the quanta of light
(mol photons) that are needed to produce one mol of oxygen (QRO2) or to fix one mol of
carbon dioxide into biomass (QRCO2). All incident photons are assumed to be absorbed by
the algae.
The biomass yield on light energy (YxE, g mol‐1) is defined as gram dry biomass formed per
mol incident photons on the photobioreactor surface according to equation 7. We as‐
sumed that all consumed carbon is converted into biomass. The dry biomass C‐molar
mass (mbiomass, g mol‐1) was determined as described in the next paragraph.
(7)
With the theoretical QRminO2 of 10 and the dry biomass C‐molar mass (mbiomass, g mol‐1)
we can calculate the theoretical maximal yield of biomass on light energy for photoauto‐
trophic growth on nitrate, YxEmax (g mol‐1) according to equation 8. According to the
growth equation, equation 11, 1.42 moles of oxygen are produced per C‐mol biomass
produced (YO2x). The QRminCO2 follows from this value and is 14.
(8)
This gives a theoretical maximal biomass yield (YxEmax) for growth on nitrate of 1.57 gram
dry weight per mol of photons (quanta).
Mixing
The flow patterns in the SLP photobioreactor at different mixing rates were observed by
staining with a pH indicator (phenolphthalein). When injecting acid or base into the an‐
nular gap filled with a phenolphthalein in water solution, the resulting coloring or de‐
coloring of the vortices visualized the flow pattern. Next to visual observations of the
flow patterns, corresponding rotational Reynolds numbers (Reθ) were calculated. Mixing
rates in rpm can be converted into Reynolds numbers using equation 9 and 10, in which
ri is the diameter of the inner cylinder (m), ro is the diameter of the outer cylinder (m), ν
CURPFQRCO2 =
PFmCUR
Y biomassEx,
⋅=
xOminO
biomassxEmax
22YQR
mY⋅
=

Photosynthetic efficiency of C. sorokiniana in a turbulently mixed SLP photobioreactor
27
is the kinematic viscosity (m2 s‐1) and Ω is the angular speed of the inner cylinder (rad s‐1).
Ω is calculated by multiplying the rotation rate of the inner cylinder, N (s‐1) with 2π.
(9)
(10) Statistical analyses
The quantum requirement for O2 and CO2 (QRO2 and QRCO2) and the biomass yield (YxE)
values (dependent variables) for the optima in the batches with three mixing rates
(independent variables) were analyzed with the ANOVA PostHoc Tukey HSD test to test
whether they differed significantly from each other (P<0.05).
Biomass Determinations
Optical Density
The optical densities (OD) at 530 nm (OD530) and 680 nm (OD680) were measured on a
spectrophotometer (Spectronic R20, Genesys, Spectronic Instruments, UK) against M‐8a
medium as a blank. At 530 nm the algae hardly absorb any light and cellular light scatter‐
ing is determining the optical density. At 680 nm the optical density is determined by
both scattering and light absorption by chlorophyll‐a. The ratio between the OD680 and
OD530 is therefore a relative measure of the amount of chlorophyll per cell (Bosma et al.
2008) and can be used as an indication of bleaching of cells due to photo inhibition. This
ratio should stay above 1.0 for healthy cells.
Cell number and cell size
Cell number and cell size were determined with a Beckman Coulter Multisizer 3
(Beckman Coulter Inc., Fullerton USA, 50 µm orifice). The samples were diluted with fil‐
tered (0.2 µm) Coulter® Isoton® II dilution buffer to a cell concentration between 1*105
and 3*105 cells mL‐1. The cell number and cell size were used to calculate the total bio‐
volume.
Dry Weight Determination
Whatman glass microfiber filters (Ø 55 mm, pore size 0.7 µm) were dried at 95°C over‐
night and placed in a desiccator to cool to room temperature. The empty filters were
( )ν
rrrΩRe ioiθ
−⋅⋅=
Nπ2Ω ⋅⋅=

Chapter 2
28
weighed and pre‐wet with de‐mineralized water. Two grams of sample was diluted with
de‐mineralized water and filtrated under mild vacuum (0.67 bar). The filter was rinsed
twice with de‐mineralized water to remove adhering inorganic salts. The wet filters con‐
taining the samples were again dried at 95°C overnight, allowed to cool to room tem‐
perature in a desiccator and weighed. The difference in weight between the dry filters
containing the samples and the empty weight was the dry weight of the samples.
Nitrate Determination
Samples were prepared by centrifuging 2 mL of biomass sample from the reactor at 6000
rpm for five minutes in an Eppendorf centrifuge. The supernatant was filtered through a
0.2 µm filter to remove remaining cell debris. The supernatant was then analyzed by Ion
Chromatography on a Dionex AS17 analytical column.
Elemental Composition
Biomass samples were centrifuged for 10 min at 4500 rpm and the resulting pellets were
washed three times with de‐mineralized water by re‐suspending and centrifuging and
stored at ‐20°C. Algae pellets stored at ‐20°C were freeze dried and ground to a fine pow‐
der. This freeze dried algal powder was combusted at 925°C in the oven of an elemental
analyzer (EA 1110, ThermoQuest CE Instruments). C, H and N content were measured.
Ash content was determined by burning the freeze‐dried algae samples in an oven at
550°C. From these determinations the O content and subsequently the dry biomass mo‐
lar mass (mbiomass, g mol‐1) could be calculated (C, H, O, N and ash) (Duboc et al. 1999;
Gurakan et al. 1990).
Results
Batch growth of C. sorokiniana in the Taylor vortex flow SLP photobioreactor
To assess the maximal productivity and photosynthetic efficiency of Chlorella sorokiniana
in a SLP photobioreactor, batch experiments at different turbulent mixing rates were
performed. The mixing in the Taylor vortex flow photobioreactor was accomplished by
rotating the inner tube at three different rates: 70, 110 and 140 rpm. A typical result of
such a batch experiment can be seen in Figure 2.4a. This graph shows the oxygen pro‐
duction rate (OPR) and carbon dioxide uptake rate (CUR) obtained by duplicate batch
cultivations (a and b) at a mixing rate of 70 rpm. Also the biomass dry weight in g L‐1 is
plotted for both experiments. The results for the other two mixing rates are similar and

Photosynthetic efficiency of C. sorokiniana in a turbulently mixed SLP photobioreactor
29
therefore only the results at 70 rpm are shown in Figure 2.4 (following page).
After inoculating with a very low biomass density the algae were grown at a light inten‐
sity of 200 µmol m‐2 s‐1. When the biomass concentration increased to around 0.1 g L‐1
dry weight the light was increased to 600 µmol m‐2 s‐1 as indicated by the first closed
arrow in Figure 2.4a. The OPR and CUR increased due to this sudden increase in available
photons, which means that the algae were light limited before. When the biomass con‐
centration reached 1.2 g L‐1 dry weight the light was increased to 1500 µmol m‐2 s‐1,
which is the light intensity of interest (indicated by the second closed arrow in Figure
2.4a). After this second increase in light supply, the OPR and CUR increased dramatically
and continued to increase until an optimum was reached, indicated by the open arrows.
This sudden increase indicates again that the algae were light limited. After reaching the
optimum at a biomass density of 2.3 g L‐1 dry weight the OPR and CUR decreased again
until the batch was ended.
With the on‐line gas analysis the experiments can be monitored and the quantum re‐
quirement (QR) can be determined during the batch at any given time point. This gives
insight into the photoautotrophic growth during the whole experiment, not just at sam‐
ple points. By monitoring the most important substrate (carbon dioxide) and product
(oxygen) on‐line, the ratio between these, the photosynthetic quotient (PQ), can be cal‐
culated (equation 4). For autotrophic growth on nitrate the PQ should be around 1.4 as
can be seen from the net growth equation (equation 11).
(11)
The biomass composition (CHON) for Chlorella sorokiniana was determined at the end of
the described experiments and the values in equation 11 represent the average values ±
95% confidence interval.
The PQ value shows if the composition of the produced biomass changes (Eriksen et al.
2007), different substrates are used or other products are formed, thus serving as a con‐
trol parameter for photoautotrophic growth according to equation 11. The PQ values for
the batch experiments at 70 rpm are shown in Figure 2.4b. Initially the error on the on‐
line gas data causes a large fluctuation in the PQ but when the OPR and CUR increase,
the PQ value stabilizes around 1.4. When the light intensity is increased the second time,
the PQ shifts shortly, due to a sudden increase in OPR and CUR, but quickly returns to its
previous value around 1.4. For all experiments the PQ was around 1.4, indicating that the
algae were growing according to equation 11.
−±±±
− ⋅+⋅+→⋅+⋅+ OH0.15O1.42NOCHNO0.15OH0.93CO 20.004 0.150.02 0.400.01 1.71322

Chapter 2
30

Photosynthetic efficiency of C. sorokiniana in a turbulently mixed SLP photobioreactor
31
The OD680/OD530 ratio for the experiments at 70 rpm is shown in Figure 2.4c. This ratio
between the optical density measured at 680 nm (OD680) and 530 nm (OD530) is a relative
measure of the amount of chlorophyll per cell (Bosma et al. 2008) and can be used as an
indication and control parameter for bleaching of cells due to photo inhibition. This ratio
stays around 1.2 for all experiments and seems to be unaffected by the step‐wise in‐
crease of available photons.
During the experiments, the light penetrating the culture (shown in Figure 2.4c) was
measured by a spherical PAR sensor hanging inside the culture at the depth of the annu‐
lar gap. The step wise light increase can be clearly seen as well as the fast decrease of
light penetrating the culture when the biomass increased. At the optimum OPR and CUR
all the light was absorbed in the annular gap.
Productivity and photosynthetic efficiency
The batch experiments at 110 and 140 rpm gave similar results as the results described
for 70 rpm. The only difference was the height of the optimum, which was slightly higher
with increasing mixing rate. At this optimum, the quantum requirement for oxygen
(QRO2) and carbon dioxide (QRCO2) as well as the biomass yield on light energy (YxE) were
calculated and compared for the different mixing rates. Both the QRO2 and QRCO2 de‐
creased, and the YxE increased with increasing mixing rate (Table 2.2). However, the in‐
crease in productivity was very small. Only the increase in productivity between 70 and
140 rpm was significant (P<0.05). Table 2.3 shows the P‐values of QRO2, QRCO2 and YxE for
multiple comparisons of mixing rates obtained with the PostHoc Tukey HSD test. Signifi‐
cance is indicated with asterisks.
Figure 2.4 Detailed overview of duplicate batch experiments at a mixing rate of 70 rpm. a) Oxygen
production rates (OPR), carbon dioxide uptake rates (CUR) (in mmol h‐1) and dry weight concentra‐
tions (in g L‐1) for duplicate batch experiments a and b. All data are normalized for the time point of
light increase to 1500 µmol m‐2 s‐1. Closed arrows indicate the time points of stepwise light in‐
crease. Open arrows indicate the time points with the maximal productivity and minimal quantum
requirement for oxygen evolution and carbon dioxide fixation. b) Average oxygen production rate
(OPR), carbon dioxide consumption rate (CUR) (in mmol h‐1) and photosynthetic quotient (PQ) for
both experiments. c) Average oxygen production rate (OPR), carbon dioxide consumption rate
(CUR) (in mmol h‐1), OD 680 / OD 530 ratio as indication of photo inhibition and the light penetra‐
tion through the culture (in µmol m‐2 s‐1).

Chapter 2
32
Table 2.2 Mixing rates in rpm and corresponding rotational Reynolds numbers calculated according
to equations 9 and 10. Also the quantum requirement for oxygen production (QRO2), carbon dioxide
consumption (QRCO2) (in mol photons / mol oxygen or carbon dioxide) and the biomass yield on light
energy (YxE, in gram dry biomass / mol photons) at three different mixing rates (70, 110 and 140
rpm) are given. Experiments were done at a high light intensity (~1500 µmol m‐2 s‐1). The values are
± the standard deviation of the duplicate experiments.
Table 2.3 PostHoc Tukey HSD table: P‐values of QRO2, QRCO2‐ and YxE for multiple comparisons of
mixing rates. Significance is indicated by asterisks.
Mixing effects
At a mixing rate of 70 rpm we observed Taylor vortex flow: bands of revolving liquid
were clearly visible. At both 110 and 140 rpm vortex flow was still clearly visible. The
same bands of revolving liquid were observed, but at these higher mixing rates they
were oscillating vertically (forming waves) around the inner cylinder. The rising gas bub‐
bles caused by sparging did not disrupt the flow pattern as was also found by Miller et al.
(1964) and Murai et al. (2005), but increased the mass transfer between the vortices as
described below. The down comers did not disturb the observed flow patterns either,
but largely increased the mixing efficiency. When injecting base into the top of the
photobioreactor, the coloring spread quickly through the down comers to the bottom of
the photobioreactor.
Mixing rate
(rpm)
Reynolds
number
QRO2
(mol mol‐1)
QRCO2
(mol mol‐1)
YxE
(g mol‐1)
70
110
140
6660
10466
13320
22.7 ± 0.56
21.8 ± 0.27
21.2 ± 0.001
30.98 ± 0.32
29.97 ± 0.16
29.44 ± 0.25
0.76 ± 0.008
0.79 ± 0.004
0.80 ± 0.007
Mixing rates
compared (rpm)
QRO2
(mol mol‐1)
QRCO2
(mol mol‐1)
YxE
(g mol‐1)
70 – 110
110 – 140
140 – 70
0.163
0.336
0.048 *
0.056
0.239
0.018 *
0.060
0.229
0.019 *
Photosynthetic efficiency of C. sorokiniana in a turbulently mixed SLP photobioreactor
33
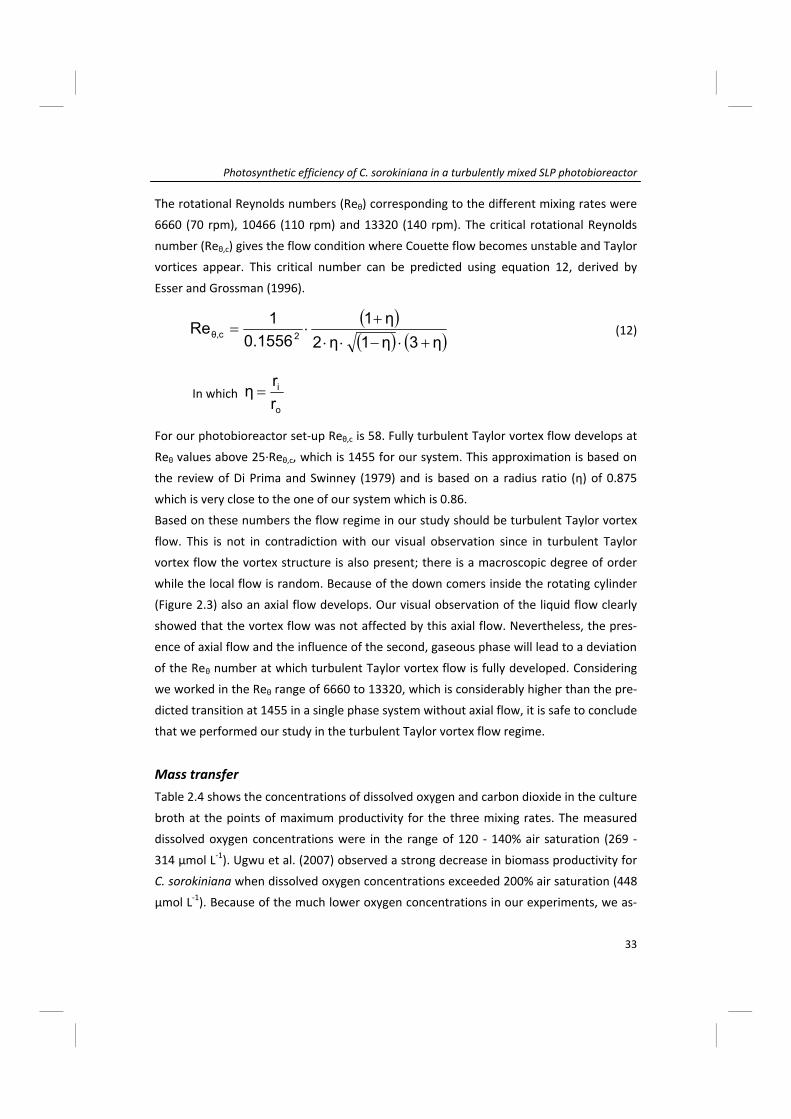
The rotational Reynolds numbers (Reθ) corresponding to the different mixing rates were
6660 (70 rpm), 10466 (110 rpm) and 13320 (140 rpm). The critical rotational Reynolds
number (Reθ,c) gives the flow condition where Couette flow becomes unstable and Taylor
vortices appear. This critical number can be predicted using equation 12, derived by
Esser and Grossman (1996).
(12)
In which
For our photobioreactor set‐up Reθ,c is 58. Fully turbulent Taylor vortex flow develops at
Reθ values above 25∙Reθ,c, which is 1455 for our system. This approximation is based on
the review of Di Prima and Swinney (1979) and is based on a radius ratio (η) of 0.875
which is very close to the one of our system which is 0.86.
Based on these numbers the flow regime in our study should be turbulent Taylor vortex
flow. This is not in contradiction with our visual observation since in turbulent Taylor
vortex flow the vortex structure is also present; there is a macroscopic degree of order
while the local flow is random. Because of the down comers inside the rotating cylinder
(Figure 2.3) also an axial flow develops. Our visual observation of the liquid flow clearly
showed that the vortex flow was not affected by this axial flow. Nevertheless, the pres‐
ence of axial flow and the influence of the second, gaseous phase will lead to a deviation
of the Reθ number at which turbulent Taylor vortex flow is fully developed. Considering
we worked in the Reθ range of 6660 to 13320, which is considerably higher than the pre‐
dicted transition at 1455 in a single phase system without axial flow, it is safe to conclude
that we performed our study in the turbulent Taylor vortex flow regime.
Mass transfer
Table 2.4 shows the concentrations of dissolved oxygen and carbon dioxide in the culture
broth at the points of maximum productivity for the three mixing rates. The measured
dissolved oxygen concentrations were in the range of 120 ‐ 140% air saturation (269 ‐
314 µmol L‐1). Ugwu et al. (2007) observed a strong decrease in biomass productivity for
C. sorokiniana when dissolved oxygen concentrations exceeded 200% air saturation (448
µmol L‐1). Because of the much lower oxygen concentrations in our experiments, we as‐
( )( ) ( )η3η1η2
η10.1556
1Re 2cθ,+⋅−⋅⋅
+⋅=
o
i
rrη =

Chapter 2
34
sume that oxygen was not inhibiting the productivity.
The concentrations of dissolved carbon dioxide were in the range 110 ‐ 130 µmol L‐1
(Table 2.4) as calculated with the method described by Royce and Thornhill (1991). This
method is based on the measured OPR and dissolved oxygen concentration to calculate
the mass transfer coefficient for O2 and subsequently CO2, followed by the calculation of
the dissolved carbon dioxide concentration. The affinity constant Km for carbon dioxide
was found to be in the range of 15 ‐ 65 µmol L‐1 for different species of Chlorella and for
Rubisco itself (Bozzo et al. 2000; Jensen and Bahr 1977; Moroney and Somanchi 1999;
Shelp and Canvin 1980). This Km value indicates the concentration of carbon dioxide at
which photosynthesis works at half its capacity. The concentration of dissolved carbon
dioxide in our experiments (Table 2.4) was much higher than the Km, showing that car‐
bon was not limiting for growth.
Table 2.4 Dissolved oxygen (DO) and
dissolved carbon dioxide concentra‐
tions ([CO2]ol) at the point of optimal
productivity for the three different
mixing rates.
Discussion
The observed optimum in OPR and CUR at a biomass density of 2.3 g L‐1 is the point
where the QR reaches its minimal value and the YxE its maximal value for the batch ex‐
periments and therefore this is the point of maximum productivity. To find this optimum
at such low biomass densities was unexpected since Qiang and Richmond (1996) demon‐
strated that the optimal culture density was proportional to the used light intensity. At
high light intensities such as we used in these experiments, they found optimal culture
densities from 8 to 13 g L‐1 for cultures of Spirulina platensis in flat panel photobioreac‐
tors with a short light path.
The decrease in OPR and CUR after having reached an optimum was also remarkable.
When increasing the light intensity to the maximum value, we did expect to see an in‐
crease in OPR and CUR and this was indeed observed (Figure 2.4). More light is available
per cell so the algae can fix more carbon dioxide, produce more oxygen and grow faster.
Mixing rate
(rpm)
DO
(%)
DO
(µmol L‐1)
[CO2]ol
(µmol L‐1)
70
110
140
133
133
126
298
298
282
117
112
130
Photosynthetic efficiency of C. sorokiniana in a turbulently mixed SLP photobioreactor
35
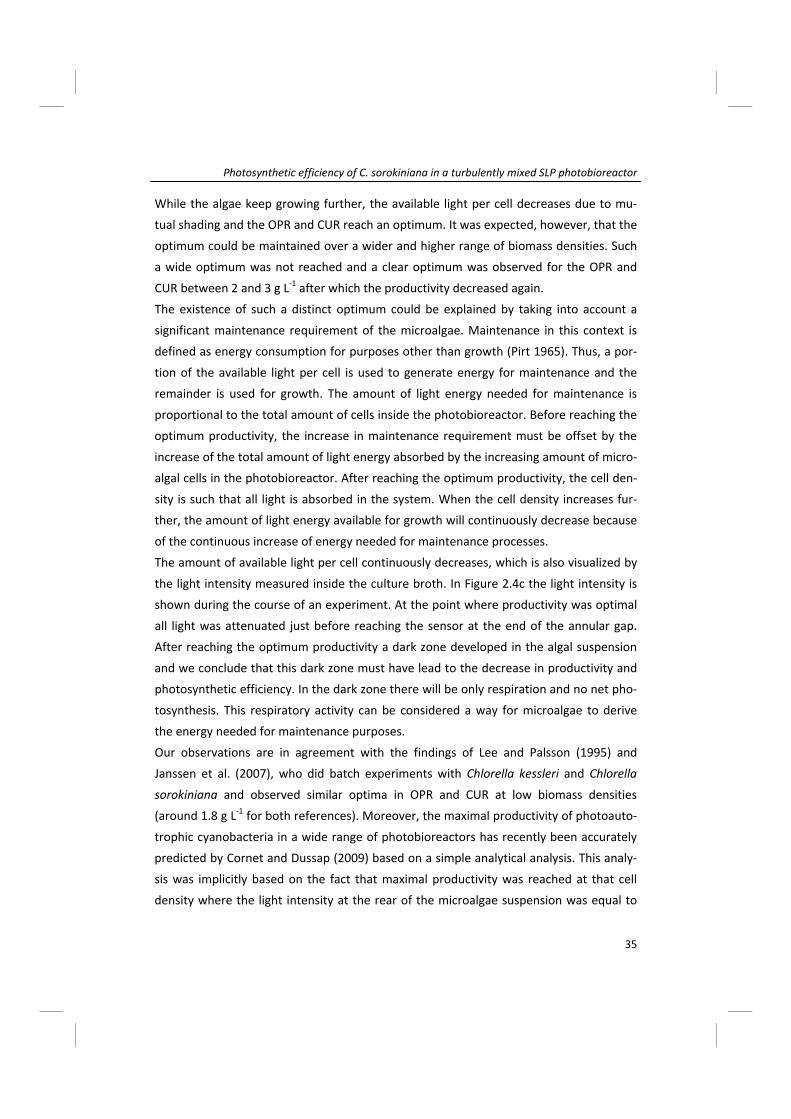
While the algae keep growing further, the available light per cell decreases due to mu‐
tual shading and the OPR and CUR reach an optimum. It was expected, however, that the
optimum could be maintained over a wider and higher range of biomass densities. Such
a wide optimum was not reached and a clear optimum was observed for the OPR and
CUR between 2 and 3 g L‐1 after which the productivity decreased again.
The existence of such a distinct optimum could be explained by taking into account a
significant maintenance requirement of the microalgae. Maintenance in this context is
defined as energy consumption for purposes other than growth (Pirt 1965). Thus, a por‐
tion of the available light per cell is used to generate energy for maintenance and the
remainder is used for growth. The amount of light energy needed for maintenance is
proportional to the total amount of cells inside the photobioreactor. Before reaching the
optimum productivity, the increase in maintenance requirement must be offset by the
increase of the total amount of light energy absorbed by the increasing amount of micro‐
algal cells in the photobioreactor. After reaching the optimum productivity, the cell den‐
sity is such that all light is absorbed in the system. When the cell density increases fur‐
ther, the amount of light energy available for growth will continuously decrease because
of the continuous increase of energy needed for maintenance processes.
The amount of available light per cell continuously decreases, which is also visualized by
the light intensity measured inside the culture broth. In Figure 2.4c the light intensity is
shown during the course of an experiment. At the point where productivity was optimal
all light was attenuated just before reaching the sensor at the end of the annular gap.
After reaching the optimum productivity a dark zone developed in the algal suspension
and we conclude that this dark zone must have lead to the decrease in productivity and
photosynthetic efficiency. In the dark zone there will be only respiration and no net pho‐
tosynthesis. This respiratory activity can be considered a way for microalgae to derive
the energy needed for maintenance purposes.
Our observations are in agreement with the findings of Lee and Palsson (1995) and
Janssen et al. (2007), who did batch experiments with Chlorella kessleri and Chlorella
sorokiniana and observed similar optima in OPR and CUR at low biomass densities
(around 1.8 g L‐1 for both references). Moreover, the maximal productivity of photoauto‐
trophic cyanobacteria in a wide range of photobioreactors has recently been accurately
predicted by Cornet and Dussap (2009) based on a simple analytical analysis. This analy‐
sis was implicitly based on the fact that maximal productivity was reached at that cell
density where the light intensity at the rear of the microalgae suspension was equal to

Chapter 2
36
the compensation light intensity. The compensation light intensity is defined as the light
intensity where net photosynthesis is zero and gross photosynthesis matches respiration.
Consequently this analysis also holds for our experiments with Chlorella sorokiniana.
Working at a high mixing rate (Reθ = 6660) a further increase in mixing only resulted in a
marginal increase in productivity and photosynthetic efficiency. The experiments at 110
and 140 rpm gave similar results as the one described for 70 rpm. The height of the opti‐
mum only increased slightly with increasing mixing rate. This means that with higher
mixing rates a little more carbon dioxide was consumed and oxygen produced with the
same amount of available photons per surface area. This resulted in a small decrease in
the quantum requirement for oxygen evolution (QRO2) and carbon dioxide fixation
(QRCO2) and a small increase in the biomass yield on light energy (YxE) (Table 2.2). How‐
ever, only the increase in photosynthetic efficiency between 70 and 140 rpm was signifi‐
cant (P<0.05) (Table 2.3).
Apparently we were working at those mixing rates which resulted in the highest produc‐
tivity and a further increase in turbulence or mixing rate did not lead to a significant im‐
provement of photosynthetic efficiency. It has to be stressed that cell death due to high
shear forces inside the culture broth did not occur. No cell rupture or cell lysis was ob‐
served during frequent microscopic analysis of the microalgal suspension. Our observa‐
tions correspond partly to the data reported by Miller et al. (1964), who found that the
photosynthetic activity was highest in the turbulent flow regime which was also used in
our study. A re‐examination of Miller’s data, on the other hand, shows that the quantum
requirement for oxygen evolution (QRO2) was still 29 under maximal mixing (see appen‐
dix for calculations). In our study we observed a QRO2 of 21 to 23 indicating that photo‐
synthetic efficiency was considerably higher. Considering the fact that Miller et al. only
performed short term experiments with much denser algal cultures it is very difficult to
bring our work in line with the much older work of Miller et al.
The minimal value we found for QRO2 was 21.2 mol photons per mol of oxygen produced,
at a mixing rate of 140 rpm. Although this is a good efficiency at over‐saturating light
intensities, it is still two times higher than the theoretical QRminO2 which lies around 10
for photoautotrophic growth at very low light intensities. For example, Emerson and
Lewis (1943) found a QRminO2 of 11 for Chlorella pyrenoidosa and Ley and Mauzerall
(1986) found an average QRminO2 of 10.4 ± 1.8 for Chlorella vulgaris. Bjorkman and Dem‐

Photosynthetic efficiency of C. sorokiniana in a turbulently mixed SLP photobioreactor
37
mig (1987) determined an average QRminO2 of 9.43 ± 0.09 for 37 species of C3‐plants.
This theoretical minimal quantum requirement can be combined with the stoichiometry
of the growth reaction (equation 11) to calculate the theoretical maximum biomass yield
YxEmax on light energy (i.e. photons). For growth on nitrate this gives a maximum yield of
1.57 g mol‐1 and, as mentioned, this yield can only be reached under low, sub‐saturating,
light levels. This value sets the ultimate target for the biomass yield YxE in photobioreac‐
tors since this determines the productivity.
The maximal value for YxE found in our experiments was 0.8 g mol‐1 at a mixing rate of
140 rpm, which is two times lower than the theoretical YxEmax of 1.57 g mol‐‐1. This is in
contrast to what Qiang and Richmond (1996) have found for the cyanobacterium
Spirulina (Arthrospira). For Spirulina yields approached 1.5 g mol‐1 and these record
yields were related to the use of short‐light path reactors combined with high biomass
densities and turbulent mixing, resulting in favorable light‐dark cycles (the so‐called
flashing light effect).
Based on our observations we think that in SLP photobioreactors (≥ 1 cm) it is not possi‐
ble to reach the theoretical maximum biomass yield YxEmax of 1.57 g mol‐1 for microalgae
under over‐saturating light. In our work no real dark zone developed at the point of opti‐
mal productivity and consequently there was no cycling between light and dark zones.
Mixing only lead to movement of the microalgal cells through the light gradient within
the light zone. Growth of Chlorella sorokiniana appears to be fundamentally different
than that described for Spirulina (Arthrospira) by Richmond and co‐workers. Interest‐
ingly, our work is in agreement with the analysis of Spirulina growth by Cornet and Dus‐
sap (2009). In addition, the yields found for microalgae by other researchers are compa‐
rable to the yields we observed (Hu et al. 1996; Hu et al. 1998; Meiser et al. 2004; Rich‐
mond et al. 2003). Our biomass yields also agree with the findings of Morita et al. (2000),
who found a similar efficiency for experiments with Chlorella sorokiniana (the same
strain as used in our study) using high light intensities (~1000 µmol m‐2 s‐1).
The fact that we found the optimal productivity at a fairly low biomass concentration
could hypothetically be explained by the induction of growth inhibition as biomass den‐
sity increases. Evidence of this phenomenon was found by Richmond and coworkers for
Spirulina and also a green microalga, Nannochloropsis (Richmond et al. 2003). Removing
growth inhibition for Nannochloropsis only resulted in a biomass yield of 0.4 g mol‐1 in a

Chapter 2
38
1 cm light path reactor under over‐saturating light, whereas we report 0.8 g mol‐1 for
Chlorella in this study. With Chlorella growth inhibition is not likely to occur, even at high
biomass densities as shown by Mandalam and Palsson (1995). In our experiments a bal‐
anced growth medium for Chlorella developed by Mandalam and Palsson (1998) was
used. This balanced medium can support high biomass densities. Moreover, Lee and
Palsson (1995) used medium perfusion in their batch experiments with Chlorella kessleri,
thus removing any growth inhibiting compounds that could be present at higher biomass
densities. With perfusion they also observed an optimum oxygen production rate at a
biomass density of 1.8 g L‐1, indicating that growth inhibition does not play a role.
In conclusion we found high biomass yields under over‐saturating light conditions, com‐
parable or higher than yield values for green microalgae in literature. Surprisingly, these
high yields occurred at relatively low biomass densities. We think this is related to the
effect of a maintenance related requirement for light energy. The maximal productivity is
reached at that biomass density where all light is just attenuated before reaching the
rear of the culture. When increasing mixing rates two‐fold we only found a small in‐
crease in productivity, showing that we worked at the optimal mixing rate yielding maxi‐
mal photosynthetic efficiency and hence productivity at over‐saturating light conditions.
Nomenclature
η Radius ratio (‐)
λ Wavelength (nm)
ν Kinematic viscosity (m2 s‐1)
Ω Angular speed (rad s‐1)
Abioreactor Illuminated photobioreactor area (m2)
c Speed of light (m s‐1)
[CO2]ol Concentration dissolved carbon dioxide in the medium (µmol L‐1)
CUR Carbon uptake rate (mmol h‐1)
DO Dissolved oxygen (% air saturation)
E Energy content of 1 mol of photons at a certain wavelength (kJ mol‐1)
h Planck’s constant (J s)
Km Affinity constant for carbon dioxide (µmol L‐1)
mbiomass Molar mass of dry biomass (g mol‐1)
N Rotation rate (s‐1)

Photosynthetic efficiency of C. sorokiniana in a turbulently mixed SLP photobioreactor
39
NA Avogadro constant (mol‐1)
ngas,in Total molar gas flow going into the reactor (mmol h‐1)
ngas,out Total molar gas flow going out of the reactor corrected for moisture con
tent (mmol h‐1)
OPR Oxygen production rate (mmol h‐1)
PAR Photosynthetic active radiation, all photons between 400 and 700 nm
PF Photon flux (mmol h‐1)
PFD Photon flux density (µmol m‐2 s‐1)
PQ Photosynthetic quotient (‐)
QR Quantum requirement, mol photons needed per mol of oxygen produced
or carbon dioxide fixated (mol mol‐1)
QRCO2 Quantum requirement for CO2 fixation (mol mol‐1)
QRmin Minimal quantum requirement either for CO2 fixation, QRminCO2, or for O2
production, QRminO2 (mol mol‐1)
QRO2 Quantum requirement for O2 production (mol mol‐1)
Reθ Rotational Reynolds number (‐)
Reθ,c Critical rotational Reynolds number (‐)
ri Radius of inner (rotating) cylinder (m)
ro Radius of outer (stationary) cylinder (m)
xCO2,db Molar fraction of CO2 in dry baseline (‐)
xCO2,exp Molar fraction of CO2 in experimental gas data (‐)
xCO2,wb Molar fraction of CO2 in wet baseline (‐)
xO2,exp Molar fraction of O2 in experimental gas data (‐)
xO2,wb Molar fraction of O2 in dry baseline (‐)
YO2,x Oxygen produced per C‐mol biomass produced (mol C‐mol‐1)
YxE Biomass yield on light energy (g mol‐1)
YxEmax Maximal yield of biomass on light energy (g mol‐1)
Acknowledgements
This research project is financially supported by Technology Foundation STW‐VICI
(WLM.6622). The authors declare that they have no conflict of interest.
We want to thank Fred van den End for setting up the on‐line data acquisition and the
Ontwikkelwerkplaats AFSG for manufacturing the Taylor vortex flow SLP photobioreac‐
tor.

Chapter 2
40
Appendix
To be able to compare the QRO2 for Chlorella sorokiniana found by Miller et al. (1964)
and our study, their maximal efficiency of 0.115 mol O2 per kWh was re‐calculated to
mol O2 per mol photons (QRO2). For this the equivalent amount of mol photons for 1 kWh
needs to be calculated. This can be calculated by applying Planck’s law (equation 13).
(13)
In this equation Planck’s constant (h, in J s) and the speed of light (c, in m s‐1) are multi‐
plied and divided by the wavelength (λ, in nm). This is the energy content of one particle,
which can be re‐calculated to 1 mol by multiplying with the Avogadro constant (NA, in
mol‐1). Since Miller et al. used halogen light a wavelength of 600 nm is taken since this
represents the spectrum in the visible range.
The resulting number is the energy content of 1 mol of photons at a wavelength of 600
nm (E, in J mol‐1). Miller et al. used an infrared filter to filter the light. A fraction of 0.185
was passing the filter and illuminating the surface of their photobioreactor. Therefore we
have to multiply by 0.185 to correct for this.
With this we can calculate that 1 kWh of energy represents 3.35 mol photons. The maxi‐
mal efficiency found by Miller et al. was 0.115 mol O2 per 1 kWh or per 3.35 mol pho‐
tons. This results in a QRO2 of 29 mol mol‐1.
AN
λc hE ⋅
⋅=


Chapter
Light respiration in Chlorella sorokiniana
Kliphuis AMJ, Janssen M, van den End EJ, Martens DE, Wijffels RH (2010)
Light respiration in Chlorella sorokiniana
Accepted for publication in Journal of Applied Phycology
Chapter 3
44
Abstract
R espiration and photosynthesis are two important processes in microalgal growth
that occur simultaneously in the light. To know the rates of both processes at least
one of them has to be measured. To be able to measure the rate of light respiration of
Chlorella sorokiniana the measurement of oxygen uptake must be fast, preferably in the
order of minutes. We measured the immediate post‐illumination respiratory O2 uptake
rate (OUR) in‐situ, using fiber‐optic oxygen micro‐sensors, and a small and simple exten‐
sion of the cultivation system. This method enables rapid and frequent measurements
without disturbing the cultivation and growth of the microalgae. Two batch experiments
were performed with Chlorella sorokiniana in a short light‐path photobioreactor and the
OUR was measured at different time points. The net oxygen production rate (net OPR)
was measured on‐line. Adding the OUR and net OPR gives the gross oxygen production
rate (gross OPR), which is a measure for the oxygen evolution by photosynthesis. The
gross OPR was 35‐40% higher than the net OPR for both experiments. The respiration
rate is known to be related to the growth rate and it is suggested that faster algal growth
leads to a higher energy (ATP) requirement and, as such, respiratory activity increases.
This hypothesis is supported by our results, as the specific OUR is highest in the begin‐
ning of the batch culture when the specific growth rate is highest. In addition, the spe‐
cific OUR decreases towards the end of the experiments until it reaches a stable value of
around 0.3 mmol O2 h‐1 g‐1. This value for the specific OUR is equal to the maintenance
requirement of Chlorella sorokiniana as determined in an independent study of Zijffers et
al. (2010). This suggests that respiration could fulfill the maintenance requirements of
the microalgal cells.
Keywords: Microalgae, Chlorella sorokiniana, Respiration, Maintenance, Photosynthetic
efficiency, Short light‐path photobioreactor

Light respiration in Chlorella sorokiniana
45
Introduction
Respiration and photosynthesis are two important processes in microalgal growth that
occur simultaneously in the light. These two processes and their relationship are exten‐
sively studied in plant science as reviewed by many authors (Badger et al. 1998; Geider
and Osborne 1989; Graham 1980; Hoefnagel et al. 1998; Hunt 2003; Raghavendra et al.
1994; Turpin et al. 1988), because the balance between them determines, to a large ex‐
tent, the growth and yield of most plants. (Hunt 2003)
In illuminated microalgal cells three processes in which oxygen is involved occur simulta‐
neously. These processes are schematically shown in Figure 3.1. The first process is pho‐
tosynthesis in which oxygen is released and ATP and NADPH are produced to be able to
fix CO2 into glyceraldehyde 3‐phosphate (GAP). This can then be converted into biomass
building‐blocks. The second process is respiration. This process mainly takes place in the
mitochondria where NADH is oxidized to generate extra energy in the form of ATP to
support biomass formation and maintenance processes. In this process oxygen is con‐
sumed. (Geider and Osborne 1989; Graham 1980; Hoefnagel et al. 1998; Turpin et al.
1988) The third process that can occur in the light is photorespiration. The oxygenase
activity of Rubisco can also fix oxygen instead of carbon dioxide, forming glycolate. (Tural
and Moroney 2005) To convert glycolate into glyceraldehyde 3‐phosphate, so it can be
re‐used in biosynthesis, energy is needed. This process occurs at high extracellular oxy‐
gen concentrations or at low carbon dioxide concentrations and can be neglected when
this is not the case (Peltier and Thibault 1985).
To understand the energy metabolism of algal cells and with that the conversion of light
energy into biomass, insight into the rates of these three processes is necessary. In this
paper we work under conditions where photorespiration can be neglected. In this situa‐
tion the net oxygen exchange rate, which can be directly measured, is the sum of the
oxygen production by photosynthesis and oxygen consumption through respiration in
the mitochondria. To know the rates of these two processes one of these has to be
measured. In this paper we estimate the light respiration rate by measuring the post‐
illumination oxygen uptake. The rate of post‐illumination O2 uptake has been shown to
provide a good measure for respiratory O2 uptake in the light (Grande et al. 1989; Weger
et al. 1989; Xue et al. 1996). In Chlorella pyrenoidosa respiration rates decreased from an
initially high rate immediately after transfer to darkness to a much lower rate after 12‐24
hours in darkness (Geider and Osborne 1989). Bate et al. (1988) found a decline of respi‐
ration to the basal rate of steady state dark respiration within an hour upon transfer to

Chapter 3
46
darkness for Dunaliella tertiolecta. This suggests that to be able to measure the rate of
light respiration of Chlorella sorokiniana the measurement of post‐illumination oxygen
uptake must be performed immediately upon transfer to darkness. In addition, at higher
biomass concentrations the oxygen uptake rate will be high and therefore the oxygen
concentration will decrease to zero in the order of a few minutes. Therefore an oxygen
probe with a short response time is needed.
Figure 3.1 Simplified overview of an algal cell in the light, showing the processes in which oxygen
and energy in the form of ATP are either consumed or produced. In the chloroplast light is fixed (1),
yielding O2, NADPH and ATP. These are needed by Rubisco to fix carbon dioxide into glyceraldehyde
3‐phosphate (GAP) (2). GAP can be regenerated into Ribulose 1,5‐bisphosphate using ATP (3) or can
be transported to the cytosol (4) to be converted into building blocks for biomass (5). The oxy‐
genase activity of Rubisco can also fix O2, forming glycolate (6). This process is called photorespira‐
tion. Energy is consumed to convert glycolate into GAP so it can enter the central carbon metabo‐
lism (7). Energy in the form of ATP is yielded through the glycolysis and TCA cycle (8). Electrons are
carried via NADH and FADH2 to the electron transport chain located in the membrane of the mito‐
chondria (9), yielding more ATP by taking up O2.
Widely used methods to determine respiratory O2 uptake in the light are gas analysis,
Mass Spectrometry using oxygen isotopes and Clark type oxygen electrodes. The advan‐
tages and disadvantages of these methods for O2 measurements are reviewed by Hunt
(2003), Suresh et al. (2009) and Millan‐Almaraz et al. (2009). The main drawbacks of

Light respiration in Chlorella sorokiniana
47
these methods are the time scale in which measurements are possible and the fact that
for some of the methods the algae need to be transferred from the cultivation vessel to
a measurement chamber. This can cause changes in growth rate and thus in respiration
rate. Fast and in‐situ measurements of oxygen uptake are preferred and these can be
done using luminescence‐based O2 sensors. These fiber‐optic sensors offer advantages
over electrochemical devices such as lack of oxygen consumption, insensitivity to inter‐
fering agents and, most important, a faster response time. (López‐Gejo et al. 2009) In
addition, Tyystjarvi et al. (1998) found the same oxygen uptake data with fiber‐optic sen‐
sors as with leaf disk O2 electrodes, indicating that measuring OUR with fiber‐optic sen‐
sors is a reliable method.
This paper describes a new method to measure the rate of respiration of Chlorella so‐
rokiniana in the light, in‐situ inside a short light‐path (SLP) photobioreactor during culti‐
vation, by means of a simple extension of the cultivation system. This is done by measur‐
ing the immediate post‐illumination O2 uptake using two types of commercially available
fiber‐optic oxygen micro‐sensors. This method enables rapid and frequent measure‐
ments without disturbing the cultivation and growth of the microalgae. In the photobio‐
reactor set‐up used the net oxygen production rate (OPR) is measured on‐line using a gas
analysis system. This net OPR represents the oxygen that is produced as a sum of all
processes in the cell that either produce or consume oxygen. By measuring the oxygen
uptake rate (OUR) by respiration and adding the amount of consumed oxygen to the
amount of net produced oxygen the gross OPR can be calculated giving the total rate of
photosynthesis. Consequently, the method described in this paper gives insight into the
different processes in which oxygen is involved in the light inside a microalgal cell, and
more specifically it gives insight into the energy requirements for biomass formation and
maintenance.
Materials & Methods
Organism, media and cultivation conditions
Chlorella sorokiniana CCAP 211/8k was obtained from the American Type Culture Collec‐
tion (ATCC, no. 7516) and cultivated in 250 mL shake flasks containing 100 mL adapted
M‐8 medium (Mandalam and Palsson 1998), called M‐8a (Table 3.1) at pH 6.7. The cul‐
tures were grown in a culture chamber at a temperature of 25°C, a light intensity of 20‐
40 µmol m‐2 s‐1 and a 16/8h day/night cycle. To reach inoculation cell density the cultures
were placed in a shake‐incubator for two days at a continuous light intensity of 280 µmol

Chapter 3
48
m‐2 s‐1 and a head space enriched with
5% carbon dioxide. For the experiments
in the photobioreactor three times con‐
centrated M‐8a medium was used to be
able to reach high cell densities. The con‐
centration KNO3 was decreased to 5
mmol L‐1, since HNO3 was added on‐
demand via the pH control.
Reactor set‐up
Chlorella sorokiniana was grown in batch
mode in a short light‐path (SLP) photo‐
bioreactor, depicted schematically in
Figure 3.2. This photobioreactor design is
described in more detail in Kliphuis et al.
(2010a). The photobioreactor had a
working volume of 3.4 L, an annular gap
width of 12 mm and an illuminated area
(Apbr) of 0.24 m2. The radius of the rotating inner cylinder (ri) was 0.076 m and the radius
of the stationary outer cylinder (ro) was 0.088 m. Therefore the radius ratio (η = ri / ro) of
the photobioreactor was 0.076 m / 0.088 m = 0.86.
The inner cylinder was rotating at a speed of 70 rpm during the batch cultivations. To
enable vertical back‐mixing four down comers were drilled into the inner cylinder. With‐
out down comers in the inner cylinder no vertical back mixing occurred and the algae
accumulated in the top part of the photobioreactor. By adding the down comers, the
algae were mixed over the whole annular gap.
The light was provided continuously by 60 tungsten‐halogen lamps (Philips Masterline ES
45W) surrounding the reactor. The photon flux density (PFD, µmol m‐2 s‐1) was measured
with a LI‐COR 190‐SA 2πsensor (PAR‐range: 400–700 nm) at 80 fixed points inside the
reactor before each experiment. The measured light intensities at all 80 points were av‐
eraged into a PFD for that particular experiment. An average light intensity of 1500 µmol
m‐2 s‐1 could be reached with this set‐up. The light intensity applied in these experiments
(~1500 µmol m‐2 s‐1) is comparable to horizontal solar irradiance in the Netherlands at
the peak of summer.
Compound Concentration
(µmol L‐1)
KNO3
KH2PO4
Na2HPO4 ∙ 2 H2O
MgSO4 ∙ 7 H2O
CaCl2 ∙ 2 H2O
EDTA ferric sodium salt
Na2EDTA ∙ 2 H2O
H3BO3
MnCl2 ∙ 4 H2O
ZnSO4 ∙ 7 H2O
CuSO4 ∙ 5 H2O
29.67∙103
5.44 ∙103
1.46 ∙103
1.62 ∙103
88.43
315.86
100.00
1.00
65.59
11.13
7.33
Table 3.1 Composition of M‐8a medium

Light respiration in Chlorella sorokiniana
49
During the experiments the transmitted irradiance through the culture (µmol m‐2 s‐1) was
measured by a spherical light sensor (US‐SQS Spherical Micro Quantum Sensor, Heinz
Walz Gmbh, Germany) placed inside the culture broth at the depth of the annular gap,
12 mm from the internal reactor wall, as illustrated in Figure 3.2.
Using mass flow controllers (Brooks, Smart TMF 5850S), carbon dioxide was supplied by
sparging nitrogen (1.55 L min‐1) enriched with 2% carbon dioxide through a silicone ring‐
sparger at the bottom of the reactor. This gas flow also served to remove excess oxygen
from the culture broth. The pH was controlled at pH 6.7 ± 0.1 by pumping nitric acid (1.7
M), serving also as nitrogen source. The acid bottle, antifoam bottle, and overflow bottle
were placed on balances and weighed on‐line. The reactor was kept at 37°C, the optimal
temperature for Chlorella sorokiniana (Sorokin and Myers 1953), by a water jacket con‐
Figure 3.2 Schematic overview (not on scale) of the SLP photobioreactor. A = annular gap, C = con‐
denser, D = internal down comer, DO = dissolved oxygen sensor, GA = gas analyzer, I = inner cylin‐
der, L = spherical light sensor, M = motor, MFC = Mass flow controllers for both N2 and CO2, pH = pH
control connected to acid pump, S = sparger, T = temperature control connected to cryostat and
cooling jacket (not shown)

Chapter 3
50
nected to a temperature‐controlled water bath. To prevent water from evaporating into
the off‐gas the reactor was equipped with a condenser connected to a cryostat set at
2°C. Biomass samples were taken from the bottom of the reactor and weighed off‐line.
On‐line gas analysis and calculations
The off‐gas was analyzed by leading it over a gas analyzer (Servomex, 4100) fitted with
two different gas sensor modules, a paramagnetic purity transducer to measure oxygen
and an infrared 1500 transducer to measure carbon dioxide.
Before each experiment, a dry and a wet baseline were measured to correct the experi‐
mental gas data for moisture content according to equation 1. The dry baseline was
measured by leading 1.55 L min‐1 nitrogen enriched with 2% carbon dioxide over the gas
analyzers. For the wet baseline the nitrogen enriched with carbon dioxide was first
sparged through the reactor, containing medium at the same temperature and pH as
during the batch experiment, and through the condenser before being analyzed.
(1)
The total molar gas flow going in (ngas,in, mmol h‐1) is corrected for the molar fraction of
carbon dioxide in both the dry (xCO2,db) and wet baseline (xCO2,wb). With this corrected
molar gas flow ngas,out (mmol h‐1) and the molar fraction of oxygen (xO2,exp) and carbon
dioxide (xCO2,exp) measured during the experiments, the oxygen production rate (OPR,
mmol h‐1) and carbon dioxide uptake rate (CUR, mmol h‐1) are calculated according to
equations 2 and 3.
(2)
(3)
The ratio between the OPR and CUR is the photosynthetic quotient PQ. The PQ can be
calculated according to equation 4:
(4)
wbCO2,
dbCO2,ingas,outgas, x
xnn ⋅=
100
)x(xnOPR wbO2,expO2,outgas, −⋅
=
100
)x(xnCUR wbCO2,expCO2,outgas, −⋅
=
CUROPRPQ =

Light respiration in Chlorella sorokiniana
51
The observed biomass yield on light energy (Yx,E(obs), g mol‐1) is defined as gram dry bio‐
mass formed per mol incident photons on the photobioreactor surface according to
equation 5. The photon flux (PFin, mmol h‐1) is calculated using the measured average
photon flux density (PFDin, µmol m‐2 s‐1) and the illuminated photobioreactor area Apbr
(m2) described earlier. We assumed that all consumed carbon is converted into biomass.
The dry biomass C‐molar mass (Mbiomass, g mol‐1) was determined as described in the next
paragraph.
(5)
The theoretical maximal biomass yield (YxEmax) for growth on nitrate is estimated to be
1.57 gram dry weight per mol of photons (quanta) (calculation in Kliphuis et al. (2010a)).
Respiration measurements
Oxygen uptake through respiration (OUR) was measured using two different fiber‐optic
oxygen micro‐sensors as shown in Table 3.2. In experiment I the OceanOptics (OO) mi‐
cro‐sensor was used and in experiment II the PreSens (PS) micro‐sensor was used.
The measurement principle of both oxygen micro‐sensors is based on the effect of dy‐
namic fluorescence quenching by molecular oxygen. Light pulses by a LED (475nm) are
sent to the tip of the micro‐sensor coated by a Ru(II) complex, which is excited by the
light. The excited complex fluoresces at 600 nm. If the excited complex encounters an
oxygen molecule, the excess energy is transferred to the oxygen molecule, quenching
the fluorescence signal. So when more oxygen is present, more of the fluorescence will
be quenched, resulting in lower fluorescence. The fluorescence light is collected by the
probe, transported through the optical fiber to the detector and translated into an oxy‐
gen concentration. The OceanOptics micro‐sensor translates the fluorescence intensity
(or phase shift) to an oxygen concentration. The PreSens micro‐sensor translates the
in
biomass(obs) Ex, PF
MCURY
⋅=
Type of micro‐sensor Measuring method Response time Exp.
AL‐300 FOXY (Ocean Optics)
NTH‐PSt1‐L2.5‐TS‐NS40/0.4‐YOP
(PreSens)
Fluorescence intensity
Fluorescence decay time
< 1s (no optical isolation)
< 1s (optical isolation)
I
II
Table 3.2 Two types of fiber‐optic oxygen micro‐sensors used in this study.
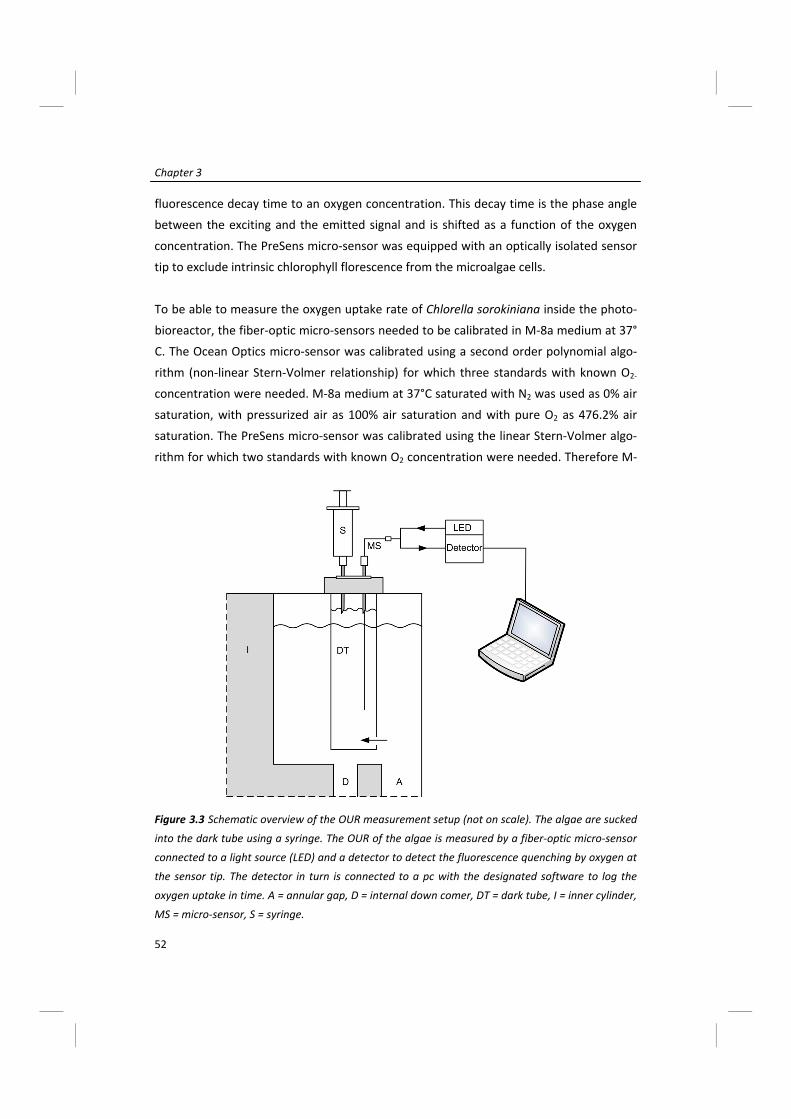
Chapter 3
52
fluorescence decay time to an oxygen concentration. This decay time is the phase angle
between the exciting and the emitted signal and is shifted as a function of the oxygen
concentration. The PreSens micro‐sensor was equipped with an optically isolated sensor
tip to exclude intrinsic chlorophyll florescence from the microalgae cells.
To be able to measure the oxygen uptake rate of Chlorella sorokiniana inside the photo‐
bioreactor, the fiber‐optic micro‐sensors needed to be calibrated in M‐8a medium at 37°
C. The Ocean Optics micro‐sensor was calibrated using a second order polynomial algo‐
rithm (non‐linear Stern‐Volmer relationship) for which three standards with known O2‐
concentration were needed. M‐8a medium at 37°C saturated with N2 was used as 0% air
saturation, with pressurized air as 100% air saturation and with pure O2 as 476.2% air
saturation. The PreSens micro‐sensor was calibrated using the linear Stern‐Volmer algo‐
rithm for which two standards with known O2 concentration were needed. Therefore M‐
Figure 3.3 Schematic overview of the OUR measurement setup (not on scale). The algae are sucked
into the dark tube using a syringe. The OUR of the algae is measured by a fiber‐optic micro‐sensor
connected to a light source (LED) and a detector to detect the fluorescence quenching by oxygen at
the sensor tip. The detector in turn is connected to a pc with the designated software to log the
oxygen uptake in time. A = annular gap, D = internal down comer, DT = dark tube, I = inner cylinder,
MS = micro‐sensor, S = syringe.

Light respiration in Chlorella sorokiniana
53
8a medium at 37°C saturated with N2 as 0% air saturation and with pressurized air as
100% air saturation were used. The output of the fiber‐optic micro‐sensors was O2 con‐
centration in percentages air saturation. The concentration dissolved O2 in mmol L‐1 M‐
8a medium could be calculated from the percentages air saturation by correcting for the
temperature and salinity of the M‐8a medium according to Quicker et al. (1981).
A dark tube with a volume of 8 mL, closed with a septum was placed in the top of the
photobioreactor, hanging in the culture broth as shown schematically in Figure 3.3. The
fiber‐optic oxygen micro‐sensor was inserted into the dark tube through the septum
with help of a needle. Algae were sucked into the dark tube through a small hole (Ø 1
mm) in the bottom of the tube using a needle and a syringe. As soon as the algae are in
the dark they will immediately stop photosynthesizing and oxygen uptake through respi‐
ration can be measured by logging the decrease in oxygen concentration in time. The
micro‐sensors were connected to the corresponding detectors which were in turn con‐
nected to a pc logging the data using the corresponding software supplied with the mi‐
cro‐sensors. Before and after each measurement the tube was flushed with air.
Oxygen uptake rate calculation
The slope of the decrease in oxygen concentration (mmol kg‐1 h‐1) is multiplied by the
reactor volume (Vpbr, kg) to give the oxygen uptake rate (OUR) in mmol h‐1, according to
equation 6:
(6)
In previous experiments with Chlorella sorokiniana we observed the formation of a
biofilm when the batch experiment was kept running for longer than 60 hours and bio‐
mass densities increased to more than 10 g L‐1. The cells forming this biofilm were not
detectable with dry weight measurements but were most probably still alive and actively
contributing to oxygen production and consumption in the photobioreactor. The total
accumulation of biomass, so the cells in suspension and the live cells in biofilm, at each
time point during the cultivation (Cx,tot(t), g) can be calculated from the CUR (CUR(t),
mol). For this we assume that every mol of CO2 which is taken up is converted into one C‐
mol of dry biomass with a known molecular weight (Mbiomass, g mol‐1), according to equa‐
tion 7.
pbrVSlope(t) OUR ⋅=

Chapter 3
54
∫ ⋅+=t
0biomassxx,tot dtMCUR(t)(0)C(t)C
(7)
To calculate the cumulative CUR, the amount of inoculum had to be added to the CUR at
t=0 (Cx(0), g). The elemental composition and molecular weight of Chlorella sorokiniana
biomass was CH1.71 ±0.01O0.40 ±0.02N0.15 ±0.004 with a Mbiomass of 23.682 g mol‐1 (including ash),
as determined by Kliphuis et al. (2010a). This total biomass can be compared with the
measured dry weight of the cells in suspension to assess whether there was biofilm for‐
mation during the experiment. If biofilm formation takes place in the photobioreactor it
is not possible to determine if that is also the case inside the dark measuring tube.
Therefore we can calculate two values for the OUR. If we assume that inside the dark
tube the same biofilm is built up as in the rest of the photobioreactor and that this
biofilm actively contributes to the OUR, the measured OUR in mmol h‐1 represents the
OUR for the whole reactor. If however there is no biofilm build‐up inside the dark tube or
the biofilm would be inactive due to the darkness in the tube, the measured OUR is only
caused by the cells in suspension which are sucked into the tube. This measured OUR in
mmol h‐1 then only represents the cells in suspension. To be able to calculate the OUR
for the whole reactor, we then need to correct for the cells that are present in the form
of biofilm in the photobioreactor, hence OURcorr.
With the measured dry weight we first calculate the specific OUR per biomass (OURspec
(t), mmol h‐1 g‐1) by dividing the OUR at time t (mmol h‐1) with the measured dry weight
at that time (Cx(t), g) according to equation 8:
(8)
By multiplying with the total biomass present in the reactor (Cx,tot(t), g) calculated from
the CUR (equation 7), the OURcorr (mmol h‐1) can be calculated with equation 9:
(9)
The resulting OUR, whether corrected or not, can be added up to the Net OPR at time t
(OPR, mmol h‐1) as measured with gas analysis at that time point, according to Equation
10. This gives the gross OPR (OPRgross) at time t (mmol h‐1), which shows the total oxygen
evolution at that time point.
(t)C
(t) OUR(t)OURx
spec =
(t)C(t)OUR(t)OUR x,totspeccorr ⋅=
Light respiration in Chlorella sorokiniana
55
(10)
Biomass Determinations
Cell number and cell size
Cell number and cell size were determined with a Beckman Coulter Multisizer 3
(Beckman Coulter Inc., Fullerton USA, 50 µm orifice). The samples were diluted with fil‐
tered (0.2 µm) Coulter® Isoton® II dilution buffer to a cell concentration between 1*105
and 3*105 cells mL‐1. The cell number and cell size were used to calculate the total bio‐
volume.
Dry Weight Determination
Whatman GF/F glass microfiber filters (Ø 55 mm, pore size 0.7 µm) were dried at 95°C
overnight and placed in a desiccator to cool to room temperature. The dry, empty filters
were weighed and pre‐wet with de‐mineralized water. Two grams of sample were di‐
luted with de‐mineralized water and filtrated under mild vacuum (0.67 bar absolute).
The filter was rinsed twice with de‐mineralized water to remove adhering inorganic salts.
The wet filters containing the samples were dried again at 95°C overnight, allowed to
cool to room temperature in a desiccator and weighed. The difference in weight be‐
tween the dry filters containing the samples and the empty weight was the dry weight of
the samples.
Results
Two batch experiments were performed with Chlorella sorokiniana in a SLP photobiore‐
actor. The mixing in the SLP photobioreactor was accomplished by rotating the inner
tube at 70 rpm. The results of these batch experiments can be seen in Figure 3.4. Figure
3.4a shows the net oxygen production rate (OPR) and carbon dioxide uptake rate (CUR)
obtained by duplicate batch cultivations (I and II). After inoculating with a very low bio‐
mass density the algae were grown at a light intensity of 200 µmol m‐2 s‐1. When the bio‐
mass concentration increased to 0.1 g L‐1 dry weight the light was increased to 600 µmol
m‐2 s‐1. When the biomass concentration reached 1.2 g L‐1 dry weight the light was in‐
creased to 1500 µmol m‐2 s‐1, which is the light intensity of interest. After this increase in
light supply to 1500 µmol m‐2 s‐1 at 23 hours, the OPR and CUR increased dramatically
and continued to increase until an optimum was reached at 27 hours. After reaching this
(t)OUR(t) OPR(t)OPR (corr)gross +=

Chapter 3
56
Figure 3.4 Detailed overview of duplicate batch experiments I and II at a mixing rate of 70 rpm.
a) Oxygen production rates (OPR), carbon dioxide uptake rates (CUR) (in mmol h‐1) and photosyn‐
thetic quotient (PQ) for both experiments. All data are normalized for the time point of light in‐
crease to 1500 µmol m‐2 s‐1, which is indicated with a dotted line. b) Total biomass present in the
reactor (in g) as calculated from the CUR as well as the measured dry weight present in the reactor
(in g) for duplicate batch experiments I and II. Also plotted is the transmitted irradiance through the
culture during the batch experiment. The two peaks indicate the step‐wise light increase, the first
time to 600 µmol m‐2 s‐1 when the biomass is still relatively low and the second time to 1500 µmol
m‐2 s‐1. This second light increase is indicated with a dotted line.

Light respiration in Chlorella sorokiniana
57
optimum at a biomass density of 2.3 g L‐1 dry weight the OPR and CUR decreased again
until the batch was ended.
The PQ values for the duplicate experiments are also shown in Figure 3.4a. When the
light was increased to 1500 µmol m‐2 s‐1 the PQ fluctuated and finally stabilized at a value
of 1.34 for both duplicate experiments. The PQ value shows if the composition of the
produced biomass changes (Eriksen et al. 2007), different substrates are used or other
products are formed, thus serving as a control parameter for photoautotrophic growth.
In this case the PQ for both experiments shows the same trend and the same values,
indicating that the growth of both cultures was comparable. The fluctuation of the PQ
observed after the light increase to 1500 µmol m‐2 s‐1 is probably related to changes in
biomass composition as for example a change in the amount of stored carbohydrates.
During the experiments the light penetrating the culture was measured by a spherical
PAR sensor hanging inside the culture at the depth of the annular gap as shown in Figure
3.4b. The step wise light increase can be clearly seen as well as the fast decrease of light
penetrating the culture when the biomass increased. At the optimum OPR and CUR all
the light was absorbed in the annular gap.
The biomass dry weight present in the reactor (in grams) is plotted in Figure 3.4b for
both experiments. Both the measured biomass, representing the biomass in suspension
as determined by dry weight measurements, and the calculated total biomass, repre‐
senting all the biomass present in the reactor calculated with equation 7, are given. In
the beginning of the batch experiments the measured and the calculated total biomass
were equal but during the experiment, as the biomass density increased above 10 g L‐1,
these values started to deviate. This deviation was due to the formation of a biofilm.
During the experiments, especially experiment II, a thin biofilm formed on the reactor
wall which contributed to the OPR and CUR but could not be measured by taking sam‐
ples and measuring dry weight because these only represented the cells present in sus‐
pension.
Respiration measurements
During the batch experiments respiration was quantified by measuring the oxygen up‐
take rate (OUR) of the microalgae inside the dark tube. Figure 3.5 shows such a duplicate
measurement. When the algae were sucked into the dark tube the starting oxygen con‐
centration was the same as in the photobioreactor at that time point. Then the oxygen
concentration started to decrease due to oxygen uptake by respiration. All oxygen was

Chapter 3
58
consumed after about 4 minutes and after a while the tube was flushed and new algae
were sucked into the dark for a duplicate measurement. The oxygen concentration in %
air saturation was converted to mmol L‐1 as described before, and the slope thus gave
the OUR (t) in mmol h‐1 (equation 6). This measurement was performed at different time
points during the batch (either in duplicate or triplicate) and a biomass sample was taken
from the bottom of the photobioreactor simultaneously. Figure 3.4b shows a deviation
between the measured and calculated biomass content of the bioreactor at higher bio‐
mass concentrations and we observed the formation of a thin biofilm. This biofilm for‐
mation starts at high biomass concentrations of over 10 g L‐1 and becomes more pro‐
nounced at even higher concentrations of around 20 g L‐1 dry weight. These biomass
concentrations are very high for microalgal cultivations. The algae are probably very light
limited at that point and likely react to this by forming a thin biofilm. To be able to also
judge respiration and gross OPR at these high biomass concentrations the OUR was also
corrected according to equation 9. This correction was performed assuming no biofilm
build up in the dark tube and only in the photobioreactor. This correction also reflects
Figure 3.5 Duplicate OUR measurement. Upon transfer to the dark the microalgae consumed the
oxygen present in the liquid. The starting oxygen concentration was equal to the DO in the photo‐
bioreactor. When all oxygen was consumed the tube was flushed and the process was repeated for
a duplicate measurement at that time point. At the same time one biomass sample was taken. The
oxygen concentration was measured in % air saturation. The slope represents the OUR and was
converted to mmol h‐1 using equation 6.
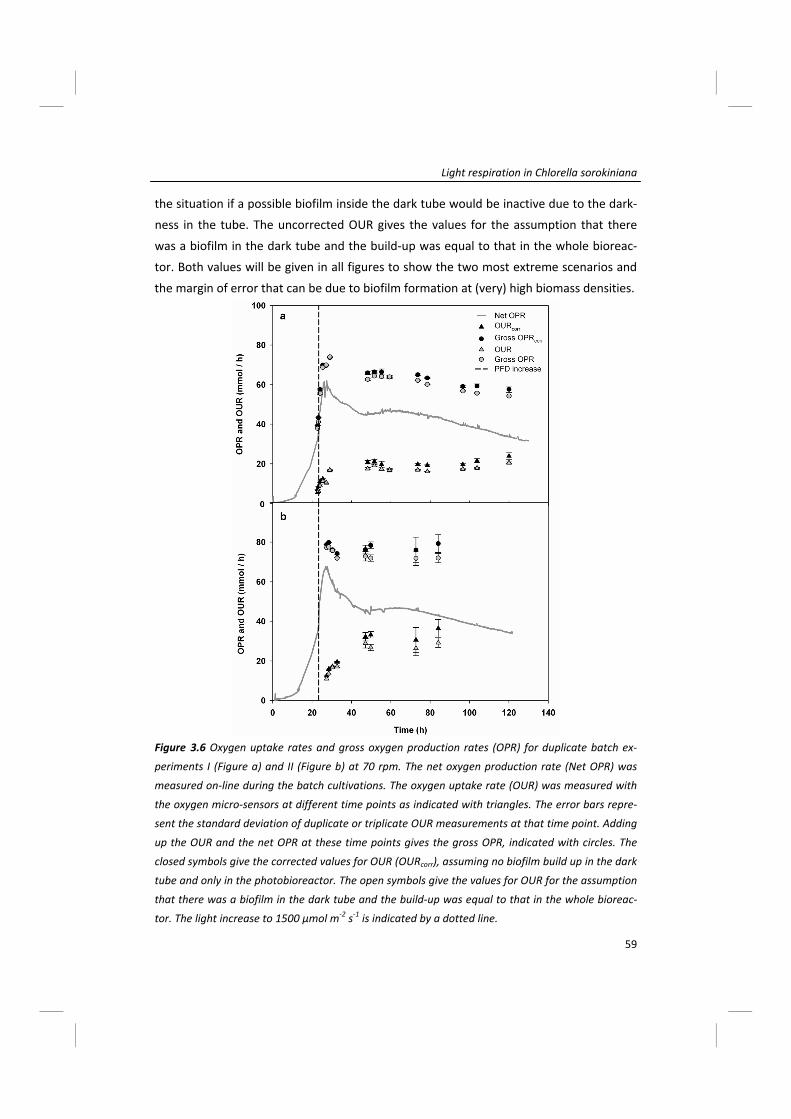
Light respiration in Chlorella sorokiniana
59
the situation if a possible biofilm inside the dark tube would be inactive due to the dark‐
ness in the tube. The uncorrected OUR gives the values for the assumption that there
was a biofilm in the dark tube and the build‐up was equal to that in the whole bioreac‐
tor. Both values will be given in all figures to show the two most extreme scenarios and
the margin of error that can be due to biofilm formation at (very) high biomass densities.
Figure 3.6 Oxygen uptake rates and gross oxygen production rates (OPR) for duplicate batch ex‐
periments I (Figure a) and II (Figure b) at 70 rpm. The net oxygen production rate (Net OPR) was
measured on‐line during the batch cultivations. The oxygen uptake rate (OUR) was measured with
the oxygen micro‐sensors at different time points as indicated with triangles. The error bars repre‐
sent the standard deviation of duplicate or triplicate OUR measurements at that time point. Adding
up the OUR and the net OPR at these time points gives the gross OPR, indicated with circles. The
closed symbols give the corrected values for OUR (OURcorr), assuming no biofilm build up in the dark
tube and only in the photobioreactor. The open symbols give the values for OUR for the assumption
that there was a biofilm in the dark tube and the build‐up was equal to that in the whole bioreac‐
tor. The light increase to 1500 µmol m‐2 s‐1 is indicated by a dotted line.

Chapter 3
60
Figure 3.6a shows the OUR data for experiment I and Figure 3.6b shows the OUR data for
experiment II. Both graphs show the net OPR as measured on‐line and the OUR meas‐
ured with the oxygen micro‐sensors, indicated with triangles. The values for both OUR
and OURcorr are equal in the beginning of the experiment and start to deviate in time,
due to the biofilm increasing in size. Both OUR and OURcorr follow the same pattern for
both experiments. Figure 3.6 also shows the gross OPR for both experiments, indicated
with circles. The net OPR is measured on‐line based on the gas analysis and represents
the oxygen that is produced as a sum of all processes in the cell that either produce or
consume oxygen. In photosynthesis oxygen is produced but in mitochondrial respiration
oxygen is consumed again. This is not reflected in the net OPR but by measuring the OUR
and adding the amount of consumed oxygen to the amount of net produced oxygen the
gross OPR can be calculated. The OUR and gross OPR increase with increasing net OPR
Figure 3.7 Specific OUR (mmol h‐1 g Dw‐1) for duplicate experiments I and II. The OPR was measured
on‐line. The OUR was measured at different time points at which the biomass concentration was
also measured. The closed symbols give the corrected values for OURspec (OURspec,corr), assuming no
biofilm build up in the dark tube and only in the photobioreactor. The open symbols give the values
for OURspec for the assumption that there was a biofilm in the dark tube and the build‐up was equal
to that in the whole bioreactor. The error bars represent the standard deviation of duplicate or
triplicate OUR measurements at that time point. The light increase to 1500 µmol m‐2 s‐1 is indicated
by a dotted line.

Light respiration in Chlorella sorokiniana
61
and stabilize after the optimum OPR is reached. The gross OPR is 30‐45% higher than the
net OPR.
From the OUR and the simultaneous biomass measurements the specific OUR could be
calculated according to equation 8. To obtain the corrected specific OUR, the measured
OUR was divided by the total biomass Cx,tot calculated according to equation 7. These
data are shown in Figure 3.7 for both experiment I and II. The on‐line measured OPR for
both experiments is shown and the dotted line represents the light increase to 1500
µmol m‐2 s‐1. The specific OUR is highest at the optimum OPR and decreases with the
decreasing OPR until it reaches a stable value at the end of the experiments.
Discussion
To be able to gain insight in microalgal respiration during photosynthesis in the light we
measured the oxygen uptake of the algae immediately upon transfer into darkness dur‐
ing different time points in the batch experiments. The post‐illumination oxygen uptake
rates were thus measured at different biomass concentrations and therefore at different
light supply rates. Immediately upon transfer to darkness photosynthesis stopped and
the oxygen present in the dark tube was taken up by the algae within minutes. Both opti‐
cal micro‐sensors were able to measure this uptake since the response time of both sen‐
sors was in the order of seconds. The measured decrease of oxygen is shown in Figure
3.5. This measurement was very similar to all other measurements we performed. On
each measurement output we performed linear regression and we always found a R2 of
0.95 or higher and a P value well below 0.05, indicating that the decrease of oxygen was
linear. From these measurements a slope could be calculated, indicating the volumetric
OUR in mmol h‐1 kg‐1. It is also interesting to note that during this measurement no
change in the slope could be detected. On the timescale of these measurements the oxy‐
gen uptake rate did not decrease towards the lower respiration rate of dark adapted
algae. This lower dark rate would be reached on a timescale of hours according to litera‐
ture (Bate et al. 1988; Geider and Osborne 1989) and with this fast measurement we
were not able to see this lower respiration rate of dark adapted algae. Therefore the
measured OUR must have been predominantly caused by mitochondrial (light) respira‐
tion.
Another process that could cause oxygen uptake in the light is photorespiration, but we
estimated that photorespiration only could take place at a low rate. Ogren (1984) de‐
scribed an equation to calculate the relative rate of photosynthesis versus photorespira‐

Chapter 3
62
tion vc/vo for isolated Rubisco, equation 11. It is important to note that this equation was
derived for free Rubisco enzymes and that several transport processes play a role in the
functioning of Rubisco in whole cells. Currently it is not possible to calculate the intracel‐
lular CO2 and O2 concentration at the site of Rubisco and the selectivity of the free en‐
zyme is the only way to estimate whether photorespiration takes place at the concentra‐
tions of O2 and CO2 present in the cultivation medium. The specificity factor Srel was de‐
termined experimentally to be 61 for Chlamydomonas reinhardtii (Ogren 1984).
(11)
At the point of maximum productivity in experiment II, which was higher than for experi‐
ment I, the dissolved oxygen reached 122% air saturation corresponding to an oxygen
concentration in the medium of 260 µmol L‐1. At this point the concentration dissolved
CO2 was 102 µmol L‐1 as calculated by the method described by Royce and Thornhill
(1991). This method is based on the measured OPR and dissolved oxygen concentration
to calculate the mass transfer coefficient for O2 and subsequently CO2, followed by the
calculation of the dissolved carbon dioxide concentration.
The ratio of photosynthesis and photorespiration vc/vo then becomes 23.93. This means
that the rate of photorespiration is indeed very low, 4% of photosynthesis, at that point.
During the rest of the experiment the ratio of CO2 to O2 increased again so the rate of
photorespiration will have been less than 4% of gross photosynthesis. This is much
smaller than the difference between net and gross OPR and this difference therefore
must have been predominantly caused by mitochondrial respiration.
To show the total oxygen evolution by photosynthesis (the gross OPR), the on‐line meas‐
ured net OPR and the OUR were added up. This is shown in Figure 3.6. The graphs for
both experiments generally show the same pattern, although the values for experiment
II are slightly higher. This could be due to the use of different micro‐sensors. It is known
that the respiration rate is related to the growth rate (Falkowski et al. 1985). So when
the algae are growing faster, more energy for growth is needed and the OUR will be
higher and, consequently, the gross OPR will be higher too as can be seen from our re‐
sults. The OUR increases with increasing biomass and when the PQ (as shown in Figure
3.4) stabilizes the OUR values also become relatively constant. Near the end of both ex‐
periments the OUR starts to increase. When looking at the rates of oxygen uptake where
][O][COS
vv
2
2rel
o
c ⋅=

Light respiration in Chlorella sorokiniana
63
the PQ is constant the gross OPR was 35‐40% higher than the Net OPR for both experi‐
ments. This is in agreement with the 33% found by Weger et al. (1989) for Thalassiosira
as measured by Mass Spectrometry, and the 17‐43% found for cyanobacterial biofilms as
measured with a Clark type micro‐sensor (Kühl et al. 1996). Bate et al. (1988) found a
difference of 15.6% for the green alga Dunaliella tertiolecta.
Compared to specific studies using Chlorella sorokiniana, our values are high. In two
studies Vona et al. determined the difference between gross OPR and Net OPR to be 5%
for C. sorokiniana (Vona et al. 2004; Vona et al. 1999). However, they used different cul‐
ture conditions and more importantly they used a different, ex‐situ, method to measure
the oxygen uptake rate. In the aforementioned study, the respiratory oxygen uptake was
measured by transferring the cells to a biological oxygen meter (BOM) equipped with an
oxygen electrode. Transferring the cells from the cultivation vessel to a BOM might result
in a lower growth rate and a lower oxygen uptake of the cells.
Similar to a previous study (Kliphuis et al. 2010a), we observed an optimum OPR and CUR
at a biomass concentration of around 2.3 g L‐1 for both batch experiments with Chlorella
sorokiniana, Figure 3.4a. This point is the moment where the biomass yield on light en‐
ergy (Yx,E(obs)) reaches its maximum value, 0.82 g mol‐1 for experiment I and 0.87 g mol‐1
for experiment II. At first, more light was available per cell. Because of this the algae
could fix more CO2, produce more O2 and grow faster. While the biomass concentration
in the photobioreactor keeps increasing, as can be seen in Figure 3.4b, the available light
per cell decreases due to mutual shading, and the OPR and CUR reach an optimum. After
this point the OPR and CUR decrease again and keep on doing so until the end of the
batch experiment.
This decrease in net OPR and CUR after having reached the optimum can now be related
to the specific oxygen uptake rate (OUR) which is shown in Figure 3.7. The specific OUR is
highest at the optimum of the net OPR and decreases together with the net OPR until it
reaches a stable value towards the end of the experiments. This trend can be explained
by taking into account that part of the respiratory activity is coupled to growth, as dis‐
cussed before, but that another part is related to the maintenance requirements of the
microalgae. Maintenance in this context is defined as energy consumption for purposes
other than growth (Pirt 1965). When there is sufficient light available per cell the algae
grow fast and need energy (ATP) to support growth. This energy is supplied by respira‐
tion of a part of the carbohydrates produced in photosynthesis and thus the specific OUR
will be high. A portion of the available light per cell, on the other hand, is needed to gen‐

Chapter 3
64
erate energy for maintenance, possibly also via respiration of carbohydrates produced in
photosynthesis. Thus, after having reached the optimum productivity, the cell density is
such that all light is absorbed in the system. When the cell density increases further, the
energy extracted from this light (via photosynthesis and respiration) will decrease from a
maximal value during the optimum, consisting of a large growth‐associated fraction and
a smaller but constant maintenance‐associated fraction, to a low value, composed of
predominantly the constant maintenance‐associated fraction.
This analysis is supported by the maintenance requirement of Chlorella sorokiniana
which was determined in an independent study of Zijffers et al. (2010). The specific OUR
decreases towards the end of the experiments until it reaches a stable value of around
0.3 mmol O2 h‐1 g‐1. This low value for the specific OUR is in the same order as the value
for maintenance requirement determined experimentally by Zijffers et al. (2010). Zijffers
et al. determined a maintenance constant of 6.8 mmol photons g‐1 h‐1 for Chlorella so‐
rokiniana based on the maintenance/growth model by Pirt (1986). The corresponding
yield Yx,E was 0.75 g mol photons‐1 for growth on urea. The YxEmax for photoautotrophic
growth on urea is estimated to be 1.8 g mol‐1. The maintenance constant therefore
needs to be corrected for this growth inefficiency by multiplying with a factor 0.75/1.8,
yielding a corrected maintenance constant of 2.84 mmol photons g‐1 h‐1. In the light reac‐
tion of photosynthesis, 8 photons are used to produce one mol of O2. The formed ATP is
used to fix one mol of CO2 into one C‐mol biomass. When this biomass is respired again,
one mol of O2 is taken up. When we assume that all oxygen uptake is due to mainte‐
nance, one mol of oxygen is taken up per 8 photons, giving 2.84*1/8 = 0.36 mmol O2 g‐1
h‐1. This value represents the OUR for maintenance only and corresponds well with the
value found in our experiments.
In short, Zijffers et al. determined the maintenance light requirements of C. sorokiniana
based on the corresponding light use. In this study we measured the specific oxygen con‐
sumption rate which converged to a low and constant value at the end of the batch culti‐
vation. Recalculating the data from Zijffers et al. to a specific respiratory oxygen con‐
sumption shows that both values are almost the same. This shows that respiration could
fulfill the maintenance requirements of the microalgal cells.
To conclude, the method described in this paper for measuring the respiration rates of
microalgae proved to be a good technique for determining the oxygen uptake in situ
during cultivation in a photobioreactor. Only a small and simple extension of the system

Light respiration in Chlorella sorokiniana
65
was necessary to be able to measure respiration rates. This method enables rapid and
frequent measurements without disturbing the cultivation and growth of the microalgae.
The rate of oxygen uptake in the light gives insight in the gross oxygen evolution by pho‐
tosynthesis which is 30‐45% higher than net oxygen evolution rate. Respiration rates in
the light are very high and consequently photosynthesis rates are very high to produce
sugars which can be respired to produce extra ATP for growth. Measuring respiration
rates during a batch cultivation showed the relationship between growth and respiration
as an energy supporting mechanism. It also provided strong evidence that respiration
could fulfill the maintenance requirement of the microalgal cells.
Nomenclature
η Radius ratio of the photobioreactor (‐)
µt Specific growth rate at time t (h‐1)
Apbr Illuminated photobioreactor area (m2)
CUR Carbon dioxide uptake rate (mmol h‐1)
CURcum Cumulative carbon dioxide uptake rate (mol)
Cx Biomass present in the photobioreactor as measured with dry weight
measurement (g)
Cx,tot Total biomass present in the photobioreactor, including biofilm, calculated
from CO2 uptake (g)
Km affinity constant for carbon dioxide (µmol L‐1)
Mbiomass Molar mass of dry biomass (g mol‐1)
mE,x Maintenance coefficient (mol g‐1 h‐1)
ngas,in Total molar gas flow going into the reactor (mmol h‐1)
ngas,out Total molar gas flow going out of the reactor corrected for moisture con
tent (mmol h‐1)
OPR Oxygen production rate (mmol h‐1)
OPRgross Gross oxygen production rate (mmol h‐1)
OUR Oxygen uptake rate (mmol h‐1)
OURcorr Oxygen uptake rate corrected for biofilm in the photobioreactor (mmol h‐1)
OURspec Oxygen uptake rate per unit biomass (mmol h‐1 g‐1)
PAR Photosynthetic active radiation, all photons between 400 and 700 nm (‐)
PFin Photon flux on the surface of the photobioreactor (mmol h‐1)
PFDin Photon flux density on the surface of the photobioreactor (µmol m‐2 s‐1)

Chapter 3
66
PQ Photosynthetic quotient (‐)
rE,x Light supply rate (µmol g‐1 s‐1)
ri Radius of inner (rotating) cylinder (m)
ro Radius of outer (stationary) cylinder (m)
Vpbr Photobioreactor volume (kg)
xCO2,db Molar fraction of CO2 in dry baseline (‐)
xCO2,exp Molar fraction of CO2 in experimental gas data (‐)
xCO2,wb Molar fraction of CO2 in wet baseline (‐)
xO2,exp Molar fraction of O2 in experimental gas data (‐)
xO2,wb Molar fraction of O2 in dry baseline (‐)
Yx,E Biomass yield on light energy (g mol‐1)
YxEmax Maximal yield of biomass on light energy (g mol‐1)
Yx,E(obs) Observed biomass yield on light energy (g mol‐1)
Acknowledgements
This research project is financially supported by Technology Foundation STW‐VICI
(WLM.6622). The authors declare that they have no conflict of interest.


Chapter
Metabolic modeling of Chlamydomonas reinhardtii:
energy requirements for photoautotrophic growth
and maintenance
Kliphuis AMJ, Klok AJ, Martens DE, Lamers PP, Janssen M, Wijffels RH (2010)
Metabolic modeling of Chlamydomonas reinhardtii: energy requirements
for photoautotrophic growth and maintenance
Submitted for publication
Chapter 4
70
Abstract
I n this study a metabolic network describing the primary metabolism of Chlamydomo‐
nas reinhardtii was constructed. By performing chemostat experiments at different
growth rates energy parameters for maintenance and biomass formation were deter‐
mined. The chemostats were run at low light intensities resulting in a high biomass yield
on light of 1.25 g mol‐1. The ATP requirement for biomass formation from biopolymers
(Kx) was determined to be 109 mmol g‐1 (18.9 mol mol‐1) and the maintenance require‐
ment (mATP) was determined to be 2.85 mmol g‐1 h‐1. With these energy requirements
included in the metabolic network, the network accurately describes the primary me‐
tabolism of C. reinhardtii and can be used for modeling of C. reinhardtii growth and me‐
tabolism. Simulations showed that cultivating microalgae at low growth rates is unfavor‐
able because of the high maintenance requirements which result in low biomass yields.
At high light supply rates biomass yields will decrease due to light saturation effects.
Thus, to optimize biomass yield on light energy in photobioreactors, an optimum be‐
tween low and high light supply rates should be found. These simulations show that flux
balance analysis can be used as a tool to gain insight into the metabolism of algae and
ultimately can be used for the maximization of algal biomass and product yield.
Keywords: Chlamydomonas reinhardtii, Energy requirements, Flux Balance Analysis
(FBA), Yield, Maintenance, Respiration

Metabolic modeling of Chlamydomonas reinhardtii
71
Introduction
Microalgae are interesting organisms because of their ability to produce a wide range of
compounds, such as carotenoids (Ben‐Amotz et al. 1982; Kleinegris et al. 2010; Lamers et
al. 2008), lipids (Chisti 2007; Griffiths and Harrison 2009; Hu et al. 2008), hydrogen
(Ghirardi et al. 2000; Melis et al. 2000), protein (Becker 2007; Boyd 1968) and starch
(Delrue et al. 1992). These algal compounds have numerous applications, varying from
fine chemicals to biofuels to food additives. To make commercial bulk production of
these compounds economically feasible, maximization of algal biomass production and
optimization of biomass composition is necessary. Understanding of how compounds are
produced in the algal metabolism will help to fully exploit the potential of microalgae
and their products.
Flux Balance Analysis (FBA) is a powerful tool to study the fluxes through metabolic path‐
ways of any organism of interest. It provides information on how nutrients and energy
are utilized to form biomass and other components. Using information on metabolic
fluxes and pathways a better understanding of metabolism is obtained and targets for
process optimization or genetic modification can be identified. Several metabolic net‐
work models have been published for common production organisms, such as E. coli
(Carlson and Srienc 2004; Kayser et al. 2005), Saccharomyces cerevisiae (Forster et al.
2003) and Corynebacterium glutamicum (Kieldsen and Nielsen 2009). Due to the increas‐
ing interest in microalgae as production organisms, metabolic networks for photoauto‐
trophic organisms such as Chlorella vulgaris (Yang et al. 2000) and Arthrospira platensis
(Spirulina) (Cogne et al. 2003) have been developed as well. Flux balance analysis will
improve understanding of algal metabolism and ultimately can be used for the maximiza‐
tion of algal biomass and product yield (Schmidt et al. 2010).
Chlamydomonas reinhardtii has been studied extensively in the past decades. It is re‐
garded as a model organism for green microalgae because of its diverse metabolism and
its ability to grow photoautotrophically as well as heterotrophically on acetate (Gfeller
and Gibbs 1984; Heifetz et al. 2000). In addition, C. reinhardtii is able to accumulate
starch (Ball et al. 1990) and produce hydrogen when grown anaerobically (Melis et al.
2000). The Chlamydomonas genome has been sequenced (Merchant et al. 2007) and the
availability of this genetic information provides a sound basis for the development of
metabolic network models. Recently, Boyle and Morgan (2009) and Manichaikul et al.
(2009) developed two extensive genome‐scale models describing the primary metabo‐
lism of C. reinhardtii divided over several cellular compartments and as such both models

Chapter 4
72
have a high degree of compartmentalization. They qualitatively and up to a limited ex‐
tent quantitatively predict algal metabolism and are well suited to get a better insight in
algal metabolism. However, quantitative validation is very limited and there are some
difficulties in developing such detailed models. For a number of reactions the localization
is not known and has to be assumed. Also information on the exchange of metabolites
between compartments is limited. Finally, to reduce the number of fluxes that cannot be
calculated, many, often complex, measurements are needed. When developing a meta‐
bolic model the practical applicability should be considered. Extensive, fully compart‐
mentalized models are excellent tools for the qualitative study of cellular reaction net‐
works and their regulation, but are generally not suited for quantitative studies because
of their underdetermined characteristics. A model for finding specific engineering bottle‐
necks and solutions would call for simple, easy to handle networks, which require less
input parameters and optimization commands but still represent the important charac‐
teristics of metabolism (Burgard et al. 2001). Therefore, we developed a more con‐
densed metabolic model describing the primary metabolism of C. reinhardtii, in which
reactions are less extensively compartmentalized and which is thus less underdeter‐
mined.
Apart from the above mentioned uncertainties on compartmentalization and transport
steps, the stoichiometry of the energy metabolism is not fixed in these models. The
amount of energy in the form of adenosine triphosphate (ATP) required for biomass for‐
mation and maintenance is difficult to determine and varies between different micro‐
organisms and growth conditions (Pirt 1965). These parameters are essential in meta‐
bolic modeling because they largely influence the growth dynamics and biomass or prod‐
uct yields calculated by the model. It is known from previous studies that theoretical
estimates of the amount of ATP used for the production of biomass based solely on the
required energy for the formation of biopolymers is much lower than the experimentally
determined value (Baart et al. 2008; Kayser et al. 2005; Roels 1983). Additional energy is
required for the assembly of biopolymers into growing biomass. In order to obtain a cor‐
rect metabolic network model these parameters have to be determined experimentally.
In this paper we describe the construction of a metabolic model for Chlamydomonas
reinhardtii and the subsequent experimental determination of the energy requirements
for maintenance and biomass formation. In this model photosynthesis and the Calvin
cycle are the only processes that are compartmentalized in order to separate these proc‐
esses from the pentose phosphate pathway in the cytosol and energy generation in the

Metabolic modeling of Chlamydomonas reinhardtii
73
mitochondria. Furthermore, reactions in linear pathways are lumped. The energy pa‐
rameters are estimated from a series of chemostats operated at different dilution rates,
a commonly used method for heterotrophic micro‐organisms (Kayser et al. 2005; Tay‐
maz‐Nikerel et al. 2010). To our best knowledge this has not been applied to photoauto‐
trophically grown microalgae, most probably because light is a challenging energy source
to measure accurately. This study shows how this method can be applied to determine
energy parameters for photoautotrophic organisms. The final model including the deter‐
mined energy parameters was used to calculate the respiration rate at different specific
growth rates, which enabled prediction of optimal growth rates for efficient light use.
Materials & methods
Organism, medium and cultivation conditions
Chlamydomonas reinhardtii CC1690 (Chlamydomonas Genetics Centre, Duke University)
was cultivated in 250 mL shake flasks containing 100 mL defined medium (Table 4.1) at
pH 7.0. The medium was based on the Sueoka high salts (HS) medium, enriched for mag‐
nesium and calcium (Sueoka et al. 1967). Additional EDTA was added to prevent precipi‐
tation of salts. Nitrate was used as a nitrogen source and enough nitrogen was added to
support 4.5 g L‐1 biomass. Finally, 1 mL of trace element solution was added to the me‐
dium. This trace element solution was based on Hutner’s trace element solution (Hutner
et al. 1950). The medium was sterilized by filtering through a Whatman liquid filter (pore
size 0.2 µm) into a pre‐sterilized medium vessel. The medium for the photobioreactor
experiments was enriched with 5.00 mmol L‐1 NaHCO3 to ensure sufficient dissolved CO2
supply to the algae. C. reinhardtii cultures were maintained in a culture chamber at a
temperature of 25°C, a light intensity of 20‐40 µmol m‐2 s‐1 and a 16/8h day/night cycle.
To reach inoculation cell density the cultures were placed in a shake‐incubator for three
days at a continuous light intensity of 280 µmol m‐2 s‐1 and a headspace enriched with 5%
carbon dioxide.
Reactor set‐up and experiments
C. reinhardtii was cultivated in chemostat mode in a pre‐sterilized flat panel photobiore‐
actor. Dilution rates in a range of 0.018 h‐1 to 0.064 h‐1 were used. Figure 4.1 shows a
schematic overview of the experimental setup. The photobioreactor consisted of two
transparent polycarbonate sheets held together by a stainless steel frame. The reactor
had a working volume (Vpbr) of 0.4 L, a light path of 25 mm and an illuminated area (Apbr)
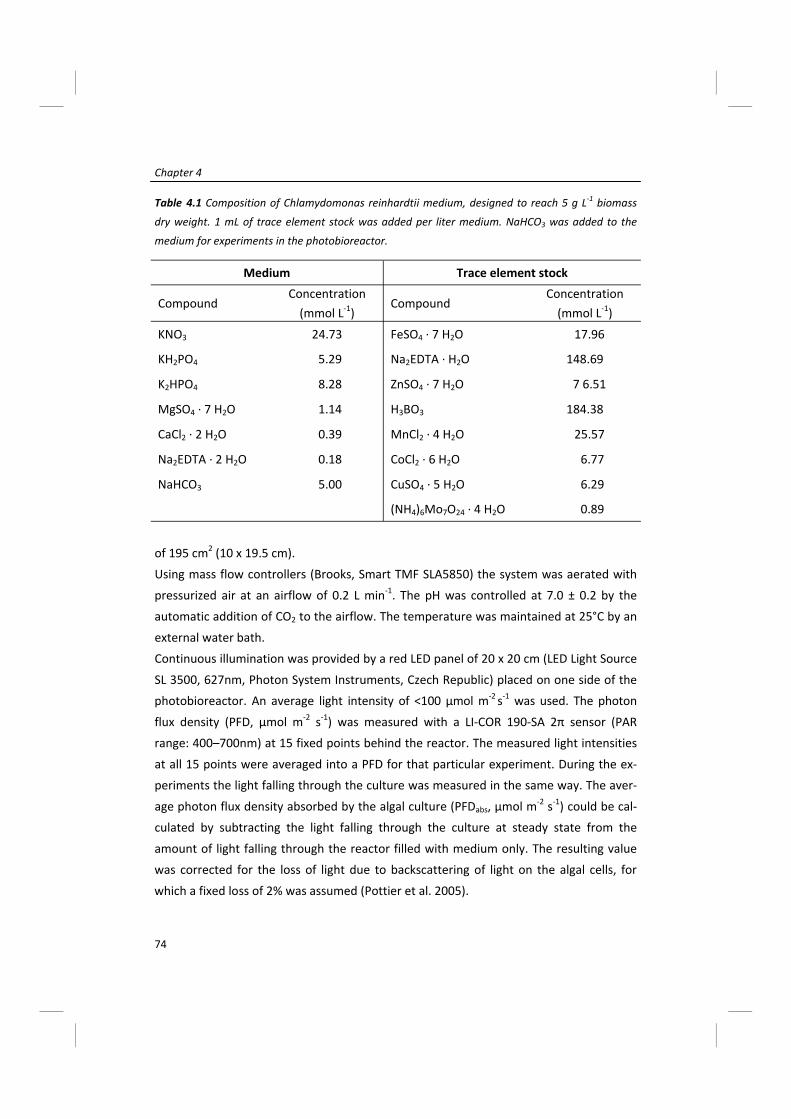
Chapter 4
74
of 195 cm2 (10 x 19.5 cm).
Using mass flow controllers (Brooks, Smart TMF SLA5850) the system was aerated with
pressurized air at an airflow of 0.2 L min‐1. The pH was controlled at 7.0 ± 0.2 by the
automatic addition of CO2 to the airflow. The temperature was maintained at 25°C by an
external water bath.
Continuous illumination was provided by a red LED panel of 20 x 20 cm (LED Light Source
SL 3500, 627nm, Photon System Instruments, Czech Republic) placed on one side of the
photobioreactor. An average light intensity of <100 µmol m‐2 s‐1 was used. The photon
flux density (PFD, µmol m‐2 s‐1) was measured with a LI‐COR 190‐SA 2π sensor (PAR
range: 400–700nm) at 15 fixed points behind the reactor. The measured light intensities
at all 15 points were averaged into a PFD for that particular experiment. During the ex‐
periments the light falling through the culture was measured in the same way. The aver‐
age photon flux density absorbed by the algal culture (PFDabs, µmol m‐2 s‐1) could be cal‐
culated by subtracting the light falling through the culture at steady state from the
amount of light falling through the reactor filled with medium only. The resulting value
was corrected for the loss of light due to backscattering of light on the algal cells, for
which a fixed loss of 2% was assumed (Pottier et al. 2005).
Medium Trace element stock
Compound Concentration (mmol L‐1)
Compound Concentration (mmol L‐1)
KNO3 24.73 FeSO4 ∙ 7 H2O 17.96
KH2PO4 5.29 Na2EDTA ∙ H2O 148.69
K2HPO4 8.28 ZnSO4 ∙ 7 H2O 7 6.51
MgSO4 ∙ 7 H2O 1.14 H3BO3 184.38
CaCl2 ∙ 2 H2O 0.39 MnCl2 ∙ 4 H2O 25.57
Na2EDTA ∙ 2 H2O 0.18 CoCl2 ∙ 6 H2O 6.77
NaHCO3 5.00 CuSO4 ∙ 5 H2O 6.29
(NH4)6Mo7O24 ∙ 4 H2O 0.89
Table 4.1 Composition of Chlamydomonas reinhardtii medium, designed to reach 5 g L‐1 biomass
dry weight. 1 mL of trace element stock was added per liter medium. NaHCO3 was added to the
medium for experiments in the photobioreactor.

Metabolic modeling of Chlamydomonas reinhardtii
75
After inoculation at an optical density at 530nm (OD530) of 0.05, the culture was grown in
batch mode until a sufficient optical density was reached. Then the medium supply was
started at a constant dilution rate until steady state was reached. In these experiments
steady state was defined as a constant optical density, biovolume and cell density (Cx, g
L‐1) in the photobioreactor for at least 5 residence times. Biomass samples were taken
from the middle of the reactor or from the overflow, which was collected on ice. Both
sample methods gave the same results. Due to the small reactor volume it was necessary
to take the larger samples for dry weight determination and biomass composition from
the overflow in order to prevent disturbances of the steady state equilibrium.
Biomass determinations
Cell number and cell size
Cell number and cell size were determined in duplicate with a Beckman Coulter Mul‐
Figure 4.1 Schematic front and side view of the photobioreactor set‐up (not on scale) for the
chemostat experiments. MFC = mass flow controller for both air and CO2, WB = water bath, F = air
filter.

Chapter 4
76
tisizer 3 (Beckman Coulter Inc., Fullerton USA, 50 µm orifice). The samples were diluted
with filtered (0.2 µm) Coulter® Isoton® II dilution buffer to a cell concentration between
1*105 and 3*105 cells mL‐1. The cell number and cell size were used to calculate the total
biovolume.
Dry Weight Determination
Whatman glass microfiber filters (Ø 55 mm, pore size 0.7 µm) were dried at 95°C over‐
night and placed in a desiccator to cool to room temperature. The empty filters were
weighed and pre‐wet with de‐mineralized water. Two grams of sample were diluted with
de‐mineralized water and filtrated under mild vacuum. The filter was rinsed twice with
de‐mineralized water to remove adhering inorganic salts. The wet filters containing the
samples were dried at 95°C overnight, allowed to cool to room temperature in a desicca‐
tor and weighed. The microalgal dry weight of the samples was then calculated from the
difference in weight between the dry filters with and without biomass.
Biomass composition
Liquid samples were centrifuged for 10 min at 1750 rcf and the resulting pellets were
washed three times with de‐mineralized water by re‐suspending and centrifuging and
stored at ‐20°C. Algae pellets stored at ‐20°C were freeze dried and ground to a fine pow‐
der. The freeze dried algae powder was used for all further biomass composition analy‐
ses. Ash content was determined by burning the freeze‐dried algae samples in an oven at
550°C, so that all organic material was oxidized and the ash residue remained.
Lipids and pigments
Lipid content was determined gravimetrically after extraction of the freeze dried algal
powder with a 5:4 methanol:chloroform mixture. This extraction was described by Lam‐
ers et al. (2010). The resulting total lipid extract contained all lipid‐like compounds pre‐
sent in the algal cells, including pigments. Therefore the weight of the total lipid extract
had to be corrected for the amount of pigments present. Pigments were determined
spectrophotometrically after dissolving the lipid residue in methanol. The total pigment
content was calculated using absorption equations for chlorophyll in methanol (Porra
2002). The relative fatty acid composition was determined by GC‐analysis according to
the method described by Bosma et al. (2008).
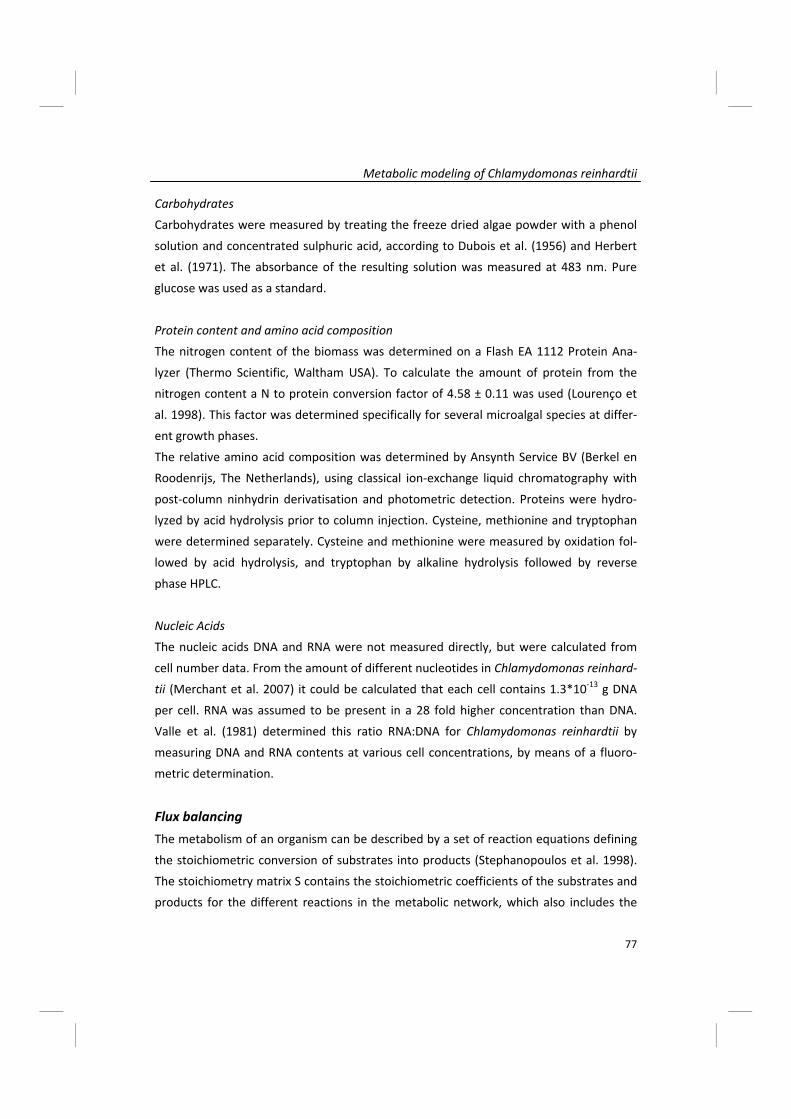
Metabolic modeling of Chlamydomonas reinhardtii
77
Carbohydrates
Carbohydrates were measured by treating the freeze dried algae powder with a phenol
solution and concentrated sulphuric acid, according to Dubois et al. (1956) and Herbert
et al. (1971). The absorbance of the resulting solution was measured at 483 nm. Pure
glucose was used as a standard.
Protein content and amino acid composition
The nitrogen content of the biomass was determined on a Flash EA 1112 Protein Ana‐
lyzer (Thermo Scientific, Waltham USA). To calculate the amount of protein from the
nitrogen content a N to protein conversion factor of 4.58 ± 0.11 was used (Lourenço et
al. 1998). This factor was determined specifically for several microalgal species at differ‐
ent growth phases.
The relative amino acid composition was determined by Ansynth Service BV (Berkel en
Roodenrijs, The Netherlands), using classical ion‐exchange liquid chromatography with
post‐column ninhydrin derivatisation and photometric detection. Proteins were hydro‐
lyzed by acid hydrolysis prior to column injection. Cysteine, methionine and tryptophan
were determined separately. Cysteine and methionine were measured by oxidation fol‐
lowed by acid hydrolysis, and tryptophan by alkaline hydrolysis followed by reverse
phase HPLC.
Nucleic Acids
The nucleic acids DNA and RNA were not measured directly, but were calculated from
cell number data. From the amount of different nucleotides in Chlamydomonas reinhard‐
tii (Merchant et al. 2007) it could be calculated that each cell contains 1.3*10‐13 g DNA
per cell. RNA was assumed to be present in a 28 fold higher concentration than DNA.
Valle et al. (1981) determined this ratio RNA:DNA for Chlamydomonas reinhardtii by
measuring DNA and RNA contents at various cell concentrations, by means of a fluoro‐
metric determination.
Flux balancing
The metabolism of an organism can be described by a set of reaction equations defining
the stoichiometric conversion of substrates into products (Stephanopoulos et al. 1998).
The stoichiometry matrix S contains the stoichiometric coefficients of the substrates and
products for the different reactions in the metabolic network, which also includes the

Chapter 4
78
transport reactions over the membranes. To be able to calculate fluxes, mass balances
are written for all the intracellular metabolites present in the network. Assuming steady
state and neglecting the accumulation of intermediates, this results in the next set of
linear equations:
(1)
In which A is the transpose of the stoichiometry matrix S and x is the vector which con‐
tains the reaction rates. The solution space of equation 1 was studied to find possible
dead ends in the model, which were subsequently removed. Because part of the rates in
x is usually measured, equation 1 can be converted to:
(2)
Where xc contains the unknown and xm contains the measured rates. Ac and Am are the
corresponding parts of the matrix A. By studying the null space of Ac it was revealed that
our system was underdetermined and therefore no unique solution of equation 2 exists.
Underdeterminancies were solved by setting constraints to some of the fluxes in the
underdetermined part of the metabolism and using optimization of an objective func‐
tion. Thus, linear programming/optimization was used according to equation 3:
(3)
In which c contains the objective function and LB and UB are the lower and upper bound‐
ary of reaction rate x. In this study we used the objective functions ‘maximize biomass
yield’ and ‘maximize ATP yield’. Constraints were set on transport fluxes depending on
whether a compound was consumed or produced. In case a rate was measured, the
transport rate was constrained to the measured value. Reactions that are irreversible
were constrained to one direction. To solve the underdetermined parts constraints were
set in such a way that flux distributions that are thermodynamically impossible were ex‐
cluded. Mathcad 14.0 (M020, Parametric Technology Corporation, USA) was used for
network analysis and Matlab (version 6.0.0.88, release 12, The MathWorks Inc., USA)
was used for in silico simulations.
0xA =⋅
mmcc xAxA ⋅−=⋅
UBxLB 0x A :sConstraintx)max(c :functionObjective
≤≤=⋅
⋅

Metabolic modeling of Chlamydomonas reinhardtii
79
Theoretical Aspects ‐ Energy parameters
The ATP balance for complete metabolic network models can be written as equation 4:
(4)
In this balance the first term, qATP,ox (mmol g‐1 h‐1), is the specific ATP production rate in
oxidative phosphorylation in the mitochondria. The second term, qATP,light (mmol g‐1 h‐1),
represents sum of the specific ATP production rate in the light reaction in the chloro‐
plast. The third term, ∑qiATP (mmol g‐1 h‐1), is the specific ATP production and consump‐
tion in the part of the metabolism that has a known ATP stoichiometry. Notably, the syn‐
thesis reactions of the biopolymers that make up biomass have a known ATP stoichiome‐
try and are therefore included in this term. The energy requirements for the formation of
protein, DNA, RNA and chlorophyll were assumed to be 4.306, 1.372, 0.4 and 2.0 mol
ATP per mol of the respective macromolecule (Berg et al. (2003); http://www.kegg.com).
The specific ATP consumption rate required to assemble these biopolymers into func‐
tional growing biomass does not have a fixed stoichiometry and is represented by the
fourth term in the ATP balance equation. In this term μ (h‐1) is the specific growth rate
and Kx (mmol g‐1) is a constant, which represents the additional amount of ATP needed
to make biomass from biopolymers, by others defined as the ‘growth associated mainte‐
nance’ (Kayser et al. 2005; Taymaz‐Nikerel et al. 2010). Finally, the fifth term represents
the maintenance ATP requirement, mATP (mmol g‐1 h‐1), which vary with the type of or‐
ganism and the culture conditions.
The specific ATP production rate in the mitochondria depends on the P/O ratio, which
represents the amount of ATP formed per oxygen atom that is reduced. Here we assume
a constant P/O ratio of 2.5 for NADH and 1.5 for FADH2. The stoichiometry of the light
reaction also depends on environmental conditions. Here we assume a fixed stoichiome‐
try of 8 photons resulting in the generation of 2 NADPH and 3 ATP. With these two as‐
sumptions all reactions contained in the first three terms have a fixed stoichiometry. The
ATP balance (equation 4) thus shows that the sum of these three terms (hereafter ‘qATP’)
must be equal to the amount of ATP required for maintenance and for biomass forma‐
tion from biopolymers.
The parameters Kx and mATP can be determined from experiments by determining qATP at
different growth rates. For this purpose a series of chemostat cultures operated at differ‐
ent dilution rates were performed. By definition, the growth rate during steady state is
0mμKqqq ATPxATPilightATP,oxATP, =−⋅−++ ∑

Chapter 4
80
equal to the dilution rate and thus by setting different dilution rates different growth
rates can be studied. At steady state the biomass density (Cx, g L‐1) and the photon flux
density absorbed by the algae (PFDabs, µmol m‐2 s‐1) were measured. With these values a
light supply rate per amount of biomass (rEx, mmol g‐1 h‐1) can be calculated for each
growth rate µ (h‐1) according to equation 5:
(5)
In which PFDabs‐ is the absorbed photon flux density (in mmol m‐2 h‐1 in this equation),
Apbr is the illuminated surface of the photobioreactor (m2) and Vpbr the working volume
of the photobioreactor (L).
At high light intensities light saturation occurs and light energy is dissipated as heat and
fluorescence, causing a decrease in the efficiency of the photosystems (Krause and Weis
1991; van der Tol et al. 2009). Consequently, the actual rate with which photons are
used in algal metabolism is not known. Moreover, elevated light intensities also induce
damage to the algal cells (Kok 1955), possibly increasing the energy consumption for
maintenace purposes. Chlamydomonas reinhardtii becomes light saturated at light inten‐
sities of 300 µmol m‐2 s‐1 (Janssen et al. 2000). At light intensities below 100 µmol m‐2 s‐1
light energy is limiting and is used at maximal efficiency as can be deduced from the fact
that the growth curve increases linearly with light intensities below this level (Janssen et
al. 2000). Hence the chemostat experiments to estimate the energy parameters for the
metabolic model were performed at low light intensities (<100 µmol m‐2 s‐1), to ensure
that the photosystems were working at maximum efficiency and to prevent any light
damage to the algal cells. However, even at low light intensities not all light is taken up
by the photosystem and therefore the calculated light supply rate rEx should be corrected
for the maximum efficiency (ΦPmax) of the photosystems. ΦPmax was assumed to be 0.8,
which corresponds to a quantum requirement of oxygen evolution of 10 (instead of 8
according to the Z‐scheme). This is in accordance with measurements of the quantum
requirement under ideal low‐light conditions for a variety of organisms using a variety of
experimental techniques (Bjorkman and Demmig 1987; Dubinsky et al. 1986; Emerson
and Lewis 1943; Evans 1987; Ley and Mauzerall 1982; Malkin and Fork 1996; Tanada
1951). The specific light utilization rate (rEx,u in mmol g‐1 h‐1), which is the rate with which
light is used to generate ATP and NADPH, can now be calculated according to equation 6:
(6)
pbrx
pbrabsEx VC
APFDr
⋅⋅
=
ExPmaxuEx, rΦr ⋅=
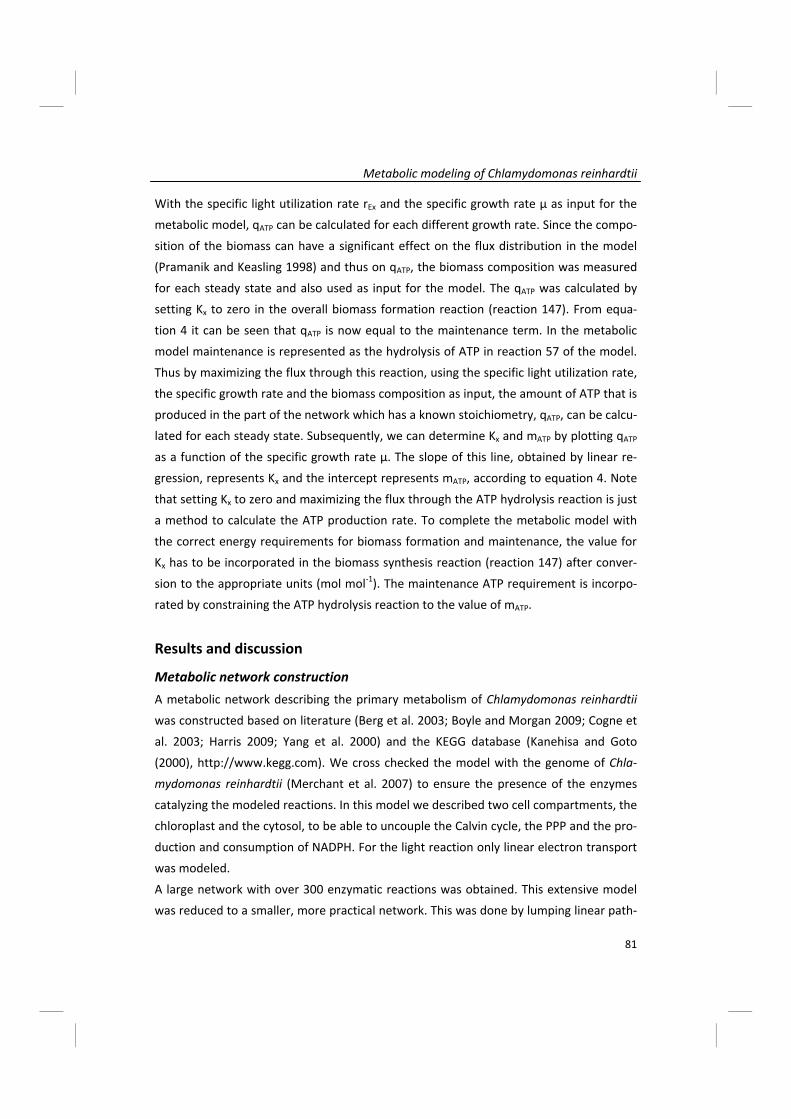
Metabolic modeling of Chlamydomonas reinhardtii
81
With the specific light utilization rate rEx and the specific growth rate µ as input for the
metabolic model, qATP can be calculated for each different growth rate. Since the compo‐
sition of the biomass can have a significant effect on the flux distribution in the model
(Pramanik and Keasling 1998) and thus on qATP, the biomass composition was measured
for each steady state and also used as input for the model. The qATP was calculated by
setting Kx to zero in the overall biomass formation reaction (reaction 147). From equa‐
tion 4 it can be seen that qATP is now equal to the maintenance term. In the metabolic
model maintenance is represented as the hydrolysis of ATP in reaction 57 of the model.
Thus by maximizing the flux through this reaction, using the specific light utilization rate,
the specific growth rate and the biomass composition as input, the amount of ATP that is
produced in the part of the network which has a known stoichiometry, qATP, can be calcu‐
lated for each steady state. Subsequently, we can determine Kx and mATP by plotting qATP
as a function of the specific growth rate µ. The slope of this line, obtained by linear re‐
gression, represents Kx and the intercept represents mATP, according to equation 4. Note
that setting Kx to zero and maximizing the flux through the ATP hydrolysis reaction is just
a method to calculate the ATP production rate. To complete the metabolic model with
the correct energy requirements for biomass formation and maintenance, the value for
Kx has to be incorporated in the biomass synthesis reaction (reaction 147) after conver‐
sion to the appropriate units (mol mol‐1). The maintenance ATP requirement is incorpo‐
rated by constraining the ATP hydrolysis reaction to the value of mATP.
Results and discussion
Metabolic network construction
A metabolic network describing the primary metabolism of Chlamydomonas reinhardtii
was constructed based on literature (Berg et al. 2003; Boyle and Morgan 2009; Cogne et
al. 2003; Harris 2009; Yang et al. 2000) and the KEGG database (Kanehisa and Goto
(2000), http://www.kegg.com). We cross checked the model with the genome of Chla‐
mydomonas reinhardtii (Merchant et al. 2007) to ensure the presence of the enzymes
catalyzing the modeled reactions. In this model we described two cell compartments, the
chloroplast and the cytosol, to be able to uncouple the Calvin cycle, the PPP and the pro‐
duction and consumption of NADPH. For the light reaction only linear electron transport
was modeled.
A large network with over 300 enzymatic reactions was obtained. This extensive model
was reduced to a smaller, more practical network. This was done by lumping linear path‐

Chapter 4
82
ways into one reaction equation. The resulting network contains 160 reactions and 164
compounds and is listed in Appendix A. A simplified overview of this metabolic network
is shown in Figure 4.2.
We found that several enzymatic steps which were necessary in the network were not
annotated in the KEGG database. Therefore we performed protein BLAST (Basic local
alignment search tool, Altschul et al. (1990)) searches against the Chlamydomonas
reinhardtii genome, using amino acid sequences from green (micro) organisms for the
‘missing’ enzymes. Table 4.2 (pages 84‐85) shows the enzymes, the E.C. numbers and the
corresponding geneIDs that were found in this way. The reactions in the network (partly)
Figure 4.2 Simple overview of an algal cell in the light, showing the main metabolic processes The
model contains two compartments. The light reaction and Calvin cycle are placed in the chloroplast
compartment and all other processes are located in the cytosol compartment. Light energy is har‐
vested in the chloroplast, yielding O2, ATP and NADPH. These are needed to fix carbon dioxide in
the Calvin cycle into glyceraldehyde 3‐phosphate (GAP). GAP can be transported to the cytosol to
be converted into building blocks for biomass. Lipids are formed through glycolysis and the tri‐
carboxylic acid (TCA) cycle. Nitrate is taken up by the cell and converted into glutamate which in
turn can be converted to protein and chlorophyll. GAP can be converted to glucose 6‐phosphate
(G6P) from which carbohydrates are formed. G6P can also enter the pentose phosphate pathway
(PPP) which yields NADPH, DNA and RNA. Electrons are carried by NADH and FADH2 to the mito‐
chondrial electron transport chain, yielding ATP by taking up O2.

Metabolic modeling of Chlamydomonas reinhardtii
83
catalyzed by these enzymes are also given. In total 41 enzymes were found not to be
annotated in the KEGG database, of which 39 were retrieved by BLAST searches. Of
these 39 enzymes, several have a geneID and are annotated but are not taken up in the
KEGG database yet. Other enzymes have a draft geneID and still need to be annotated.
Only two enzymes could not be found in this way. The first one is ATP phosphoribosyl‐
transferase (E.C. 2.4.2.17). This enzyme is essential in histidine formation and is de‐
scribed in the Chlamydomonas sourcebook (Harris 2009). The second enzyme is homos‐
erine acetyltransferase (E.C. 2.3.1.31), which is necessary in cysteine formation. This en‐
zyme is present in other green microalgae (Ostreococcus lucimarinus), cyanobacteria
(Synechococcus elongates, Anabaena variabilis) and diatoms (Phaeodactylum tricornu‐
tum, Thalassiosira pseudonana). BLAST searches with the amino acid sequences from
these organisms did not give a result. Therefore we assume this reaction is performed by
another but similar enzyme, because this step is essential in the formation of cysteine.
Because both histidine and cysteine were measured in the amino acid composition and
not added to the medium, they had to be formed within the metabolism. Thus both re‐
actions were taken up in the model.
By studying the null space of matrix Ac (equation 2), twelve underdetermined parts were
revealed in the model. This means that there is no unique solution for equation 2. By
measuring and setting constraints to some of the fluxes in the underdetermined parts of
the metabolism and using optimization of objective functions, unique solutions could be
obtained. Reactions that are irreversible were constrained to one direction and thermo‐
dynamically impossible combinations of reactions were also constrained in the correct
direction. In the appendix the arrows indicate whether a reaction is reversible or irre‐
versible and if so, in which direction it is set. By choosing the objective functions
‘maximize biomass yield’ and ‘maximize ATP yield’ unique values could be calculated for
the fluxes in all but two underdetermined parts. The first remaining underdeterminancy
involved the anaplerotic routes between phosphoenolpyruvate (PEP), pyruvate (PYR) and
oxaloacetate (OXA). This was solved by setting the upper and lower boundaries of the
flux through reaction 35 to zero. The second underdetermined part involved the coupling
of the pentose phosphate pathway (PPP), the glycolysis and the tricarboxylic acid cycle
(TCA). The aerobic degradation of sugars can occur through both the PPP as well as the
TCA if NADPH and NADH are freely exchangeable through reaction 54, a transhydro‐
genase reaction. We restricted this by setting this reaction forward so NADPH can only
be converted to NADH. In this way the fluxes through the PPP will only be dictated by the
demand of NADPH and PPP intermediates.

Nr.
Reaction
E.C. nr.
Nam
e Gen
eID
43
DHAP
+ H2O
DHA + Pi
3.1.3.1
Alkaline ph
osph
atase
572332
4 PH
OD
44
DHA + H[+] +
NAD
PH
GLYC + NADP
1.1.15
6 Dihydroxyaceton
e redu
ctase
572030
0 LCI28
47
H[+] +
NADH + NO3
H2O
+ NAD + NO2
1.7.1.1
Nitrate redu
ctase
572228
5 NIT1
50
APS + NAD
H
AMP + NAD
+ SO3
1.8.99
.2
Adynylyl sulfate re
ductase
572264
4 MET16
54
NAD + NAD
PH
NADH + NADP
1.6.1.2
NAD
(P) transhydrogen
ase
572577
3 CH
LRED
RAFT 139
758
1.1.1.25
Shikim
ate de
hydrogen
ase
571987
5 SH
KD1
70
2 PE
P + AT
P + E4P + NAD
PH
ADP + CH
O + NAD P + 4 Pi
2.7.1.71
Shikim
ate kinase
571601
1 SH
KF1
71
CHO
PRE
5.4.99
.5
Chorismate mutase
572307
1 CH
M1
72
GLU
+ H[+] +
PRE
AKG
+ CO2 + H2O
+ PHE
4.2.1.51
Prephe
nate dehydratase
572202
3 PR
D1
73
GLU
+ NAD + PRE
AKG
+ CO2 + NADH + TYR
1.3.1.43
Prephanate deh
ydrogenase
572088
3 AG
D1
2.4.2.17
AT
P ph
osph
oribosyltransferase
not fou
nd, H
IS1 (Harris 2009)
2.4.2.‐
Glutamine am
idotransferase
572294
4 HIS7
76
3 H2O
+ 2 NAD + ATP
+ GLN
+ PRP
P AICAR
+ AKG
+ HIS + Pi + 2
NADH + 2 PPi + 5 H[+]
3.1.3.15
Histid
inolph
osph
atase
572041
8 HIS2
81
3 H[+] +
2 NADH + GLU
PRO
+ 2 H2O
+ 2 NAD
1.5.1.2
Pyrroline‐5‐carboxylate redu
ctase
572308
2 PC
R1
82
AKG + O2 + PR
O
CO2 + HydPro + SU
C 1.14.11.2
Prolyl 4‐hydroxylase
572171
9 PH
X1
1.3.1.26
Dihydrodipicolinate redu
ctase
572345
6 DPR
1 84
2 H[+] +
ASA
+ GLU
+ NADH + PYR
AKG
+ DAP
+ H2O
+ NAD
2.6.1.83
LL‐diaminop
imelate am
inotransferase
571861
7 DPA
1
88
AcCo
A + CY
S + H2O
+ HSER
Ace + CoA
+ HCY
S + H[+] +
NH4[+] +
PYR
2.3.1.31
Hom
oserine acetyltransferase
not fou
nd
3.1.3.18
Ph
osph
oglycolate pho
sphatase
572897
9 PG
P1, 5716118
PGP2
,
572183
3 PG
P3
91
H2O
+ NAD + O2 + cRu1
5DP
H[+] +
NADH + Pi + cG3P
+
glyoxylate
1.1.99
.4
Glycolate dehydrogenase
572105
5 GYD
1
96
H[+] +
HydPyr +
NADH
Glycerate + NAD
1.1.1.81
Hydroxypyruvate red
uctase
571707
0 HPR
1
Table 4.2 ‘M
issing
’ reactions in th
e Ch
lamydom
onas re
inha
rdtii datab
ase which were foun
d by blasting the sequ
ences from
other green
(micro)organ
isms ag
ainst the
genom
e.

97
ATP + Glycerate
ADP + 2 H[+] +
3PG
2.7.1.31
Glycerate kinase
571952
0 GLYK
100
H2O
+ M
YLTH
F H[+] +
N10
FTHF
3.5.4.9
Methe
nyl‐T
HF cycloh
ydrolase
572845
7 CH
LRED
RAFT 194
856
101
ATP + FO
RM + THF
ADP + N10
FTHF + Pi
3.5.4.9
Methe
nyl‐T
HF cycloh
ydrolase
572845
7 CH
LRED
RAFT 194
856
102
MYLTH
F + NAD
PH
METHF + NAD
P 1.5.1.5
Methylene
‐THF de
hydrogenase
572845
7 CH
LRED
RAFT 194
856
103
H[+] +
METHF + NADPH
M
THF + NADP
1.5.1.20
Methylene
‐THF redu
ctase
572803
0 CH
LRED
RAFT 111
330
104
5FTH
F + AT
P + H2O
ADP + H[+] +
N10
FTHF + Pi
6.3.3.2
5‐form
yl‐THF cycloligase
572319
9 FLC1
105
FORM
+ H[+] +
THF
H2O
+ N10
FTHF
3.5.1.10
Form
yl‐THF de
form
ylase
572809
3 CH
LRED
RAFT 111
421
106
DHF + H[+] +
NAD
PH
NADP + TH
F 1.5.1.3
Dihydrofolate red
uctase
572598
6 CH
LRED
RAFT 139
742
113
C160ACP
+ H[+] +
NAD
H + O2
C16
:1ACP
+ NAD + 2 H2O
1.14.19.2
Stearyl‐A
CP desaturase
571728
9 FA
B2
115
C162ACP
+ H[+] +
NAD
H + O2
C16
:3ACP
+ NAD + 2 H2O
1.14.19.‐
Oxido
redu
ctase (fatty acid de
saturase)
571551
7 FA
D7
117
C180ACP
+ H[+] +
NAD
H + O2
C18
:1ACP
+ NAD + 2 H2O
1.14.19.2
Stearyl‐A
CP desaturase
571728
9 FA
B2
119
C182ACP
+ H[+] +
NAD
H + O2
C18
:3ACP
+ NAD + 2 H2O
1.14.19.‐
Oxido
redu
ctase (fatty acid de
saturase)
571551
7 FA
D7
2.1.2.2
Phosph
oribosylglycinam
ide
form
yltransferase
571965
5 CH
LRED
RAFT 117
678
121
4 ATP
+ 2 GLN
+ 2 H2O
+ ASP + CO2 + GLY + N10FTHF + PR
PP
AICA
R + FU
M + PPi + THF + 2 GLU
+ 4 ADP + 4 Pi + 7 H[+]
4.3.2.2
Aden
ylosuccinate lyase
571904
1 CH
LRED
RAFT 992
87
132
ASP + GTP
+ IM
P AMP + FU
M + GDP + Pi + 2 H[+]
4.3.2.2
Aden
ylosuccinate lyase
571904
1 CH
LRED
RAFT 992
87
133
ATP + H[+] +
METHF + NADPH
+ UDP
ADP + DHF + H2O
+ NADP
+ dTTP
2.1.1.45
Thym
idylate synthase
572
5986
CHLRED
RAFT 139742
140
18 H[+] +
15 NAD
PH + 8 ATP
+ 4 GAP
+ 4 PYR
Phytyl‐P
P + 4 AD
P
+ 4 AM
P + 4 CO
2 + 7 PP
i + 8 H2O
+ 15 NADP
2.5.1.29
Geranylgeranyl‐d
ipho
sphate synthase
572873
0 GGPS
2.1.1.11
Magne
sium
protopo
rphyrin
IX
methyltransferase
572788
8 CH
LM
1.14.13.81
Mg‐protop
orph
yrin IX
mon
omethyl ester
(oxidative) cyclase
571655
6 CT
H1
144
4 NADPH
+ 2.5 O2 + 2 AT
P + Ad
MET
+ M
g2[+] +
PPo
rphyrin
+
Phytyl‐PP
AdH
CYS + Ch
loroph
yll + PPi + 2 ADP + 2 H2O
+ 2 Pi + 3
H[+] +
4 NADP
1.3.1.75
Divinyl chlorop
hyllide
a 8‐vinyl‐red
uctase
571560
2 DVR
1

Chapter 4
86
Chemostat experiments
To estimate the energy parameters for maintenance and the formation of biomass, we
performed seven chemostat experiments at low light intensities and low dilution rates
ranging from 0.018 h‐1 to 0.064 h‐1. The experiments were performed at low light intensi‐
ties, to make sure the photosystems were working at maximum efficiency (Baker et al.
2007) and to prevent light damage to the algal cells. When steady state was reached the
biomass density Cx (g L‐1) and the photon flux density absorbed by the algae (PFDabs,
µmol m‐2 s‐1) were measured for each dilution rate. In Table 4.3 the biomass density and
the absorbed photon flux density at the different growth rates are given. With these val‐
ues a light supply rate per amount of biomass (rEx, mmol g‐1 h‐1) could be calculated for
each growth rate µ (h‐1) according to equation 5. The relationship between the specific
light supply rate rEx (mmol g‐1 h‐1) and the growth rate μ (h‐1) can be described using the
model of Pirt (1965) as used by Zijffers et al. (2010) according to equation 7:
(7)
In which mE is the maintenance requirement (mmol photons g‐1 h‐1) and YxE the yield of
biomass on light (g biomass mmol photons‐1). The amount of light used by the algae in‐
creases proportionally to the growth rate, while a fixed amount of maintenance light
Growth rate µ (h‐1)
Biomass density Cx (g L
‐1)
Photon flux density
absorbed PFDabs
(μmol m‐2 s‐1)
Specific light utilization
rate rEx,u (mmol g ‐1 h‐1)
0.018 ± 0.000 0.78 ± 0.04 88 15.8 ± 1.5
0.019 ± 0.000 0.84 ± 0.08 87 16.7 ± 0.8
0.031 ± 0.001 0.41 ± 0.02 80 25.7 ± 1.4
0.034 ± 0.001 0.39 ± 0.02 73 26.8 ± 1.6
0.052 ± 0.001 0.21 ± 0.01 51 36.1 ± 1.7
0.061 ± 0.003 0.11 ± 0.01 36 45.5 ± 3.7
0.064 ± 0.001 0.10 ± 0.01 31 44.8 ± 3.7
Table 4.3 Biomass density (Cx, g L‐1), absorbed photon flux density (PFDabs, μmol m‐2 s‐1) and growth
rates (µ, h‐1) determined for each chemostat experiment. The specific light utilization rate (rEx,u, mol
g ‐1 h‐1) is calculated from these data using equations 6 and 8.
E
xEEx m
Yμr +=

Metabolic modeling of Chlamydomonas reinhardtii
87
energy is necessary to keep the algae in a healthy state. Regression on the specific
growth rates µ and specific light supply rates rEx for all chemostat experiments yields a
straight line with a R2 of 0.988. According to equation 7, the offset of this line gives a mE
of 5.99 mmol g h‐1 and the inverse of the slope gives a YxE of 1.25 g mol‐1. This YxE is high
compared to biomass yields found for other green microalgae as can be seen from Table
4.4. Cuaresma et al. (2009), Kliphuis et al. (2010a) and Zijffers et al. (2010) found yields
ranging from 0.5 g mol‐1 to 1.0 g mol‐1 for several green microalgae. These yields were all
obtained at high light intensities of 1000 µmol m‐2 s‐1 or more. At low light intensities we
expect a higher yield than at high light intensities because at high light intensities the
antenna complexes in the algal photosystems become saturated. The remainder of the
absorbed light will be dissipated as heat or fluorescence (Krause and Weis 1991; van der
Tol et al. 2009). In addition, elevated light intensities also induce damage to the algal
cells (Kok 1955), possibly increasing the energy consumption for maintenance purposes.
Therefore, high light intensities will lead to low photosynthetic efficiencies as can also be
seen from the yields for Chlamydomonas reinhardtii obtained by Takache et al. (2010).
The difference between the yields at high and low light intensities in these experiments
Organism YxE or YxE
obs (g mol‐1)
Light intensity (µmol m‐2 s‐1)
Reference
Chlamydomonas reinhardtii 1.25 a 80 This paper
Dunaliella tertiolecta 0.78 a 930 Zijffers et al. (2010)
Chlorella sorokiniana 0.75 a 930 Zijffers et al. (2010)
Chlorella sorokiniana 0.80 b 1500 Kliphuis et al. (2010a)
Chlorella sorokiniana 1.00 b 2100 Cuaresma et al. (2009)
Chlamydomonas reinhardtii 1.11 b, c 110 Takache et al. (2010)
Chlamydomonas reinhardtii 0.73 b, c 500 Takache et al. (2010)
Chlamydomonas reinhardtii 0.51 b, c 1000 Takache et al. (2010)
Table 4.4 Comparison of biomass yields on light energy and the used light intensities for different
microalgae from literature.
a YxE = µ / (rEx + mE), according to equation 7. b YxE
obs = µ / rEx (the observed yield was not corrected for maintenance requirements) c recalculated from data obtained in flat Torus photobioreactor by Takache et al. (2010)

Chapter 4
88
reflects the fact that a large part of the light is ‘wasted’ at higher light intensities. The
high biomass yield found in our experiments supports the hypothesis that the efficiency
of the algal photosystems was indeed high at a light intensity of 80 μmol m‐2 s‐1. More‐
over, it seems that we were working at maximal efficiency because the relation between
specific light utilization and specific growth rate is linear (R2 = 0.988). This shows that the
biomass yield is constant and not influenced by the change in light regime (Table 4.3),
indicating we reached the maximal value of this yield parameter.
It needs to be stressed that even at these low light intensities not all absorbed light can
be converted in the photosystems. Therefore the light supply rate rEx was corrected for
the maximum efficiency (ΦPmax = 0.8) of the photosystems to obtain the specific light
utilization rate rEx,u (equation 6), which is also shown in Table 4.3. This specific light utili‐
zation rate rEx,u should be used for energy parameter estimation, since this rate repre‐
sents the actual amount of photons that enter the algal metabolism. As expected, re‐
gression on the specific growth rates µ and specific light utilization rates rEx,u also yields a
straight line according to equation 7. The offset of this line gives a mE of 4.79 mmol g‐1 h‐1
and the inverse of the slope gives a YxE of 1.57 g mol‐1. These values represent the yield
and maintenance requirements corrected for the inefficiency of light use, ΦPmax.
Biomass composition
The composition of the biomass can have a significant effect on the flux distribution in
the model and thus on the estimation of energy parameters (Pramanik and Keasling
1998). Therefore, the macromolecular biomass composition (%w/w) was determined for
six of the steady states as shown in Table 4.5. In addition, the average biomass composi‐
tion for all growth rates is given here. These compositions, along with the corresponding
growth rates µ and light utilization rates rEx,u, were used for the model simulation of each
steady state. The macromolecular biomass composition was not measured for μ = 0.019
h‐1 and therefore the composition of μ = 0.018 h‐1 was used to perform model simula‐
tions for this growth rate.
The biomass composition did not show much variation as a function of growth rate, al‐
though the carbohydrate content seemed to increase at increasing growth rates. The
pigment content, on the other hand, decreased at increasing growth rate, which can be
explained by the fact that the amount of light per cell increased at increasing growth
rate, because the culture became more diluted. Such a response of microalgae to de‐
crease the amount of photosynthetic pigments upon an increase in irradiance, is known

Metabolic modeling of Chlamydomonas reinhardtii
89
µ (h
‐1)
Average c
0.018
0.031
0.034
0.052
0.061
0.064
Protein
a 42
.48 ± 0.55
39.34 ± 0.77
40.17 ± 1.10
41.63 ± 0.67
40.16 ± 0.40
37.61 ± 0.88
40.23 ± 1.71
Carboh
ydrate a
24.09 ± 2.00
21.70 ± 0.73
24.62 ± 2.15
27.29 ± 4.08
26.26 ± 1.59
28.87 ± 1.11
25.47 ± 2.54
Lipids a
14.13 ± 0.28
22.16 ± 2.24
17.72 ± 0.88
14.25 ± 0.47
16.78 ± 3.85
18.65 ± 1.84
17.28 ± 3.01
DNA b
0.21
± 0.008
0.20
± 0.004
0.23
± 0.006
0.22
± 0.002
0.23
± 0.002
0.19
± 0.002
0.21
± 0.02
RNA b
5.99
± 0.23
5.57
± 0.12
6.48
± 0.16
6.04
± 0.06
6.57
± 0.06
5.27
± 0.05
5.99
± 0.50
Chloroph
yll a
7.06
± 0.07
5.59
± 0.03
5.13
± 0.05
4.73
± 0.07
4.34
± 0.20
4.01
± 0.06
5.14
± 1.09
Ash a
6.05
± 0.03
5.44
± 0.40
5.66
± 0.24
5.84
± 0.11
5.66
± 0.24
5.41
± 0.42
5.68
± 0.24
Table 4.5 Measured biom
ass compo
sitio
n (%
w/w
) no
rmalized
to 100%
and
average
biomass compo
sitio
n of C. reinh
ardtii at different
specific grow
th rates µ (h
‐1) including
the
stand
ard deviations. The
sum
of the
individu
al biomass compo
nents includ
ing ash was com
pa‐
rable to th
e measured dry weigh
ts with
in 10%
.
a N = 3
b Based
on literature values (M
erchant e
t al. 2007; V
alle et a
l. 1981) and
the
b measured dry weight a
nd cell num
bers. N
= 3, 6, 5, 5, 4, 8
respe
ctively.
c Average biomass compo
sitio
n for all growth rates with
the standard devia‐
c tio
n for all six growth rates.
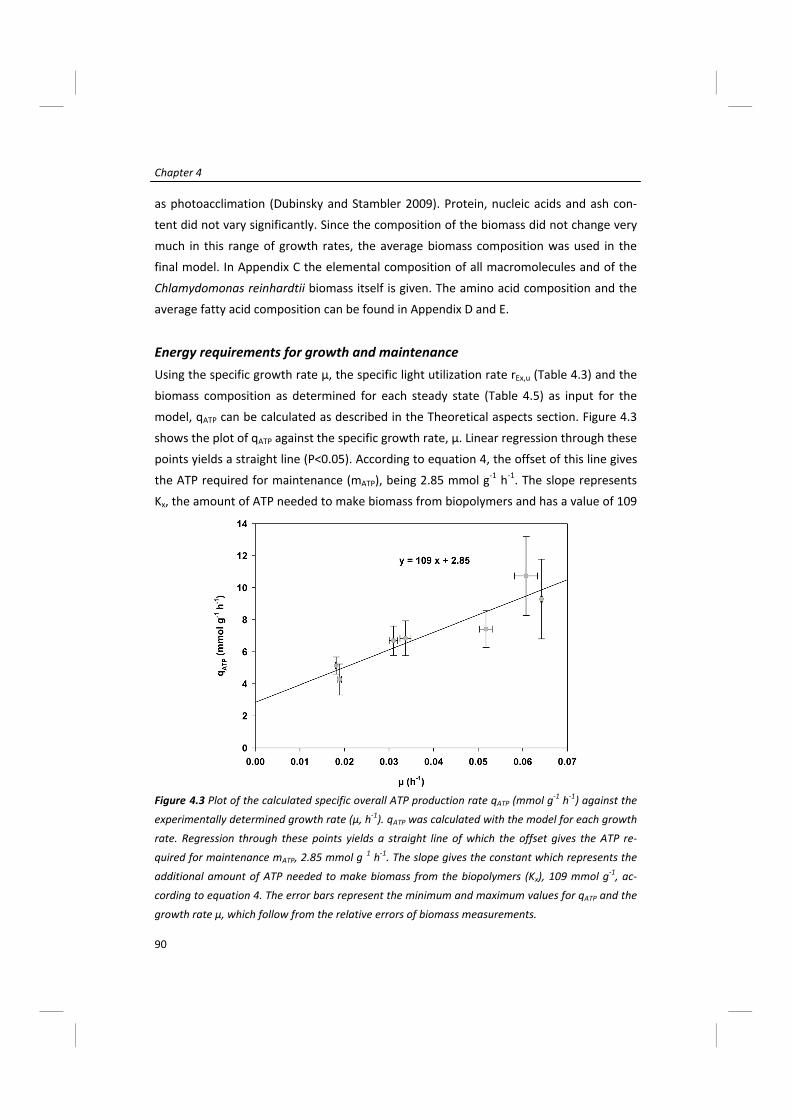
Chapter 4
90
as photoacclimation (Dubinsky and Stambler 2009). Protein, nucleic acids and ash con‐
tent did not vary significantly. Since the composition of the biomass did not change very
much in this range of growth rates, the average biomass composition was used in the
final model. In Appendix C the elemental composition of all macromolecules and of the
Chlamydomonas reinhardtii biomass itself is given. The amino acid composition and the
average fatty acid composition can be found in Appendix D and E.
Energy requirements for growth and maintenance
Using the specific growth rate µ, the specific light utilization rate rEx,u (Table 4.3) and the
biomass composition as determined for each steady state (Table 4.5) as input for the
model, qATP can be calculated as described in the Theoretical aspects section. Figure 4.3
shows the plot of qATP against the specific growth rate, µ. Linear regression through these
points yields a straight line (P<0.05). According to equation 4, the offset of this line gives
the ATP required for maintenance (mATP), being 2.85 mmol g‐1 h‐1. The slope represents
Kx, the amount of ATP needed to make biomass from biopolymers and has a value of 109
Figure 4.3 Plot of the calculated specific overall ATP production rate qATP (mmol g‐1 h‐1) against the
experimentally determined growth rate (µ, h‐1). qATP was calculated with the model for each growth
rate. Regression through these points yields a straight line of which the offset gives the ATP re‐
quired for maintenance mATP, 2.85 mmol g1 h‐1. The slope gives the constant which represents the
additional amount of ATP needed to make biomass from the biopolymers (Kx), 109 mmol g‐1, ac‐
cording to equation 4. The error bars represent the minimum and maximum values for qATP and the
growth rate µ, which follow from the relative errors of biomass measurements.

Metabolic modeling of Chlamydomonas reinhardtii
91
mmol g‐1. From this number it could be calculated that 18.9 mol ATP is required to trans‐
port and assemble one mol biomass. This amount was added to the biomass synthesis
reaction (mol ATP per mol biomass, reaction 147) of the final model. The ATP hydrolysis
flux (reaction 57) was set to the value for mATP to fix the maintenance requirements of
the final metabolic model.
An overview of values for Kx and mATP for several micro‐organisms is presented in Table
4.6. The value for Kx depends on the characteristics of the model, for example the degree
of compartmentalization and the ATP stoichiometry for biopolymer formation and thus
the value for Kx differs per model. To make a good comparison of the total ATP use in
several species 1/YxATP (mol ATP g‐1) is also given, which is the total amount of ATP re‐
quired to make 1 gram of biomass. As can be seen from Table 4.6 there is considerable
variation in the values for 1/YxATP, Kx and mATP for different micro‐organisms. This can be
due to the type of micro‐organism, the culture conditions and the assumptions made in
the models. Firstly, these parameters depend on the assumed P/O ratio, the relationship
between ATP synthesis and oxygen consumption. We assumed that NADH yields 2.5 ATP
and FADH2 yields 1.5 ATP upon respiration. However, lower values for these ratios would
result in lower values for Kx and mATP. Secondly, we assumed a ratio between NADPH and
ATP production during linear electron transport in chloroplast of 3:2 (ATP:NADPH) which
exactly fits the requirements of the Calvin cycle. Studies on Spinach chloroplasts, how‐
Organism 1/YxATP (mol g‐1)
Kx
(mol g‐1)
mATP (mmol g‐1 h‐1)
Reference
Chlamydomonas reinhardtii a 0.43 0.11 2.85 This paper
Petunia hybrida (cell culture) b 0.44 0.15 1.41 de Gucht and van der Plas (1995)
Saccharomyces cerevisiae b 0.35 0.07 1.00 Forster et al. (2003)
Escherichia coli b 0.31 0.09 2.81 Kayser et al. (2005)
Escherichia coli b 0.40 0.10 4.70 Carlson and Srienc (2004)
Streptomyces coelicolor b ‐ 0.08 3.69 Borodina et al. (2005)
Neisseria meningitides b 0.40 0.05 1.61 Baart et al. (2008)
Corynebacterium glutamicum b 0.29 0.03 ‐ Kieldsen and Nielsen (2009)
Table 4.6 Comparison of yields and maintenance coefficients of different micro‐organisms from literature.
a photoautotrophic growth on light and CO2 b heterotrophic growth on glucose. Glucose yields 32 ATP (Berg et al. 2003)
Chapter 4
92
ever, show that linear electron transport only can deliver 2.57 ATP per every 2 NADPH
and that cyclic photosynthetic electron transport (i.e. cyclic photophosphorylation) is
needed to generate additional ATP (Allen 2003). This cyclic pathway was not included in
our model because the additional ATP requirement is small and it would make our model
underdetermined. Its necessity, however, could partly explain the fact that the experi‐
mentally determined minimal quantum requirement of oxygen evolution is 10 instead of
8 as discussed before (equivalent to ΦPmax = 0.8) and as such it is implicitly present in our
model. Besides the balance of ATP and NADPH in the chloroplast, the microalgal cells as
a whole require substantial ATP as is extensively discussed in this study. According to our
model ATP must be generated by the complete conversion of sugars (GAP) produced in
the chloroplast by the combined action of glycolysis, TCA cycle and oxidative phosphory‐
lation in the cytosol and mitochondria (Figure 4.2). It is interesting to note that this path‐
way ultimately yields 1 mol of ATP per 1.5 mol photons (see ‘Simulation of oxygen up‐
take through respiration’ for calculation). Cyclic photophosphorylation on the other
hand, would only yield 1 molecule of ATP per 2 photons (Allen 2003). This shows that
energy generation through linear photosynthetic electron transport is energetically more
favorable than through cyclic electron transport and supports our description of C.
reinhardtii metabolism.
Thirdly, the parameter Kx accounts for the requirement of ATP for biomass formation
which is not accounted for in the part of the network with a known energy stoichiome‐
try. For more complex models involving more compartmentalization, a larger part of the
ATP may be accounted for and consequently the value of this parameter would become
lower. However, for the two more extensive models described for Chlamydomonas the
energy parameters were not properly estimated. Manichaikul et al. (2009) used parame‐
ters taken from yeast cultivation and not from C. reinhardtii itself. Boyle and Morgan
(2009) estimated the energy parameters for autotrophic, heterotrophic and mixotrophic
growth by fitting their model to one experimentally determined biomass yield, based on
experiments performed in shake flasks. The maintenance parameter was taken from
literature and not measured. Boyle and Morgan estimated a Kx of 29.89 mmol g‐1, which
is indeed lower than our value, as would be expected for a more detailed model. How‐
ever, they used shake flask experiments to estimate this parameter. Shake flasks usually
have undefined light regimes, which makes it difficult to properly measure the absorbed
light by the culture (PFDabs) and thus the light supply rate (rEx). Also the efficiency of pho‐
tosynthesis is unknown under these cultivation conditions. Furthermore, only a single

Metabolic modeling of Chlamydomonas reinhardtii
93
growth rate was used, making the estimation highly dependent on the assumed value of
the maintenance parameter.
Simulation of oxygen uptake through respiration
With the average biomass composition (Table 4.5) for all chemostats and the energy
requirements for both maintenance and growth associated processes, a working model
was obtained as shown in the appendix. With this model we simulated the mitochondrial
respiration rate (mmol O2 g‐1 h‐1) at different growth rates (µ, h‐1). Figure 4.4 (separate
figure sheet) shows the flux distribution through the network at a specific growth rate µ
of 0 h‐1 and 0.062 h‐1. The size of the fluxes in mmol g‐1 h‐1 are shown in boxes, red boxes
for µ = 0 h‐1 and black boxes for µ = 0.062 h‐1. Light is taken up in the light reaction of
photosynthesis and with the energy that is formed CO2 is fixed in the Calvin cycle. The
carbon is moved to the cytosol in the form of GAP, where it enters the glycolysis and TCA
cycle. Part of the GAP is used to synthesize biopolymers and part is used here to gener‐
ate energy in the form of ATP, NADH and FADH2. NADH and FADH2 are in turn respired in
the mitochondria to generate additional ATP to fulfill the energy requirements for
growth and maintenance. The flux distribution at µ = 0 h‐1 shows the maintenance me‐
tabolism without biomass formation. It also shows that the minimal light uptake rate is
4.28 mmol photons g‐1 h‐1, which is used to provide energy for maintenance (2.85 mmol
g‐1 h‐1). Using these fluxes it can be calculated that in this model 1.5 mol photons should
be consumed to produce 1 mol ATP.
Figure 4.5 shows the simulated biomass yield on light (YxE in g mol‐1, closed dots) for sev‐
eral growth rates µ. These simulations give an ideal situation since no light saturation is
modeled and consequently the biomass yield YxE increases asymptotically to the maximal
value of 1.57 g mol‐1 at very high specific growth rates. In reality light saturation will oc‐
cur due to the high light intensities necessary to reach maximal growth rates. The pho‐
tons are absorbed, but the energy is only partly used for growth, causing a decrease in
the biomass yield on light energy (ΦP < ΦPmax, equation 6). If light saturation (Baker et al.
2007; Krause and Weis 1991; van der Tol et al. 2009) would be taken into account the
yield in Figure 4.5 would reach an optimum and decrease as soon as light saturation oc‐
curs. The simulated respiration rate (open diamonds), calculated by the sum of the oxy‐
gen consumption rates in oxidative phosphorylation (reactions 52 and 53) and the frac‐
tion of oxygen used for maintenance (open triangles) are also plotted in Figure 4.5. As
expected, respiration is a linear function of the growth rate and regression through these
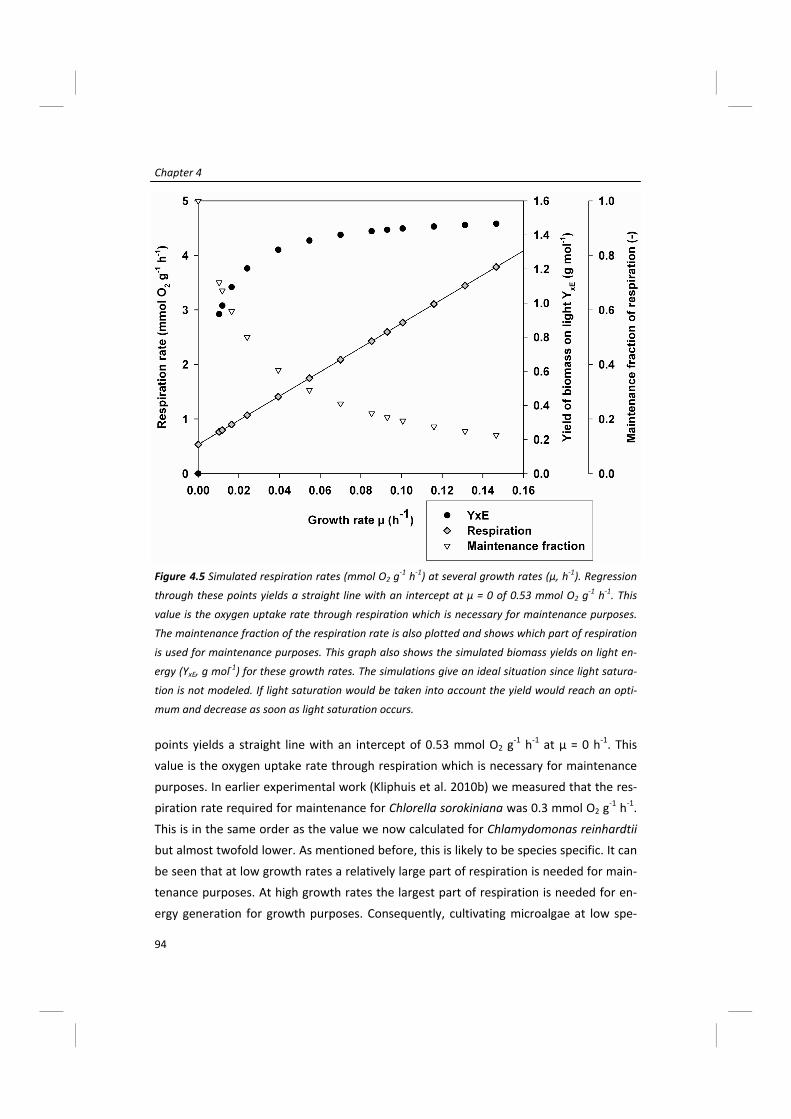
Chapter 4
94
points yields a straight line with an intercept of 0.53 mmol O2 g‐1 h‐1 at µ = 0 h‐1. This
value is the oxygen uptake rate through respiration which is necessary for maintenance
purposes. In earlier experimental work (Kliphuis et al. 2010b) we measured that the res‐
piration rate required for maintenance for Chlorella sorokiniana was 0.3 mmol O2 g‐1 h‐1.
This is in the same order as the value we now calculated for Chlamydomonas reinhardtii
but almost twofold lower. As mentioned before, this is likely to be species specific. It can
be seen that at low growth rates a relatively large part of respiration is needed for main‐
tenance purposes. At high growth rates the largest part of respiration is needed for en‐
ergy generation for growth purposes. Consequently, cultivating microalgae at low spe‐
Figure 4.5 Simulated respiration rates (mmol O2 g‐1 h‐1) at several growth rates (µ, h‐1). Regression
through these points yields a straight line with an intercept at µ = 0 of 0.53 mmol O2 g‐1 h‐1. This
value is the oxygen uptake rate through respiration which is necessary for maintenance purposes.
The maintenance fraction of the respiration rate is also plotted and shows which part of respiration
is used for maintenance purposes. This graph also shows the simulated biomass yields on light en‐
ergy (YxE, g mol‐1) for these growth rates. The simulations give an ideal situation since light satura‐
tion is not modeled. If light saturation would be taken into account the yield would reach an opti‐
mum and decrease as soon as light saturation occurs.
Metabolic modeling of Chlamydomonas reinhardtii
95
cific growth rates results in a low biomass yield YxE, since a large part of the energy is
used for maintenance processes rather than growth. This effect was experimentally con‐
firmed for Chlorella sorokiniana and Dunaliella tertiolecta by Zijffers et al. (2010).
Conclusions
A metabolic network describing the primary metabolism of C. reinhardtii was con‐
structed. By performing chemostat experiments energy parameters for maintenance and
biomass formation were obtained. The chemostats were run at low light intensities re‐
sulting in a high biomass yield on light of 1.25 g mol‐1. The ATP requirement for biomass
formation from biopolymers (Kx) was determined to be 109 mmol g‐1 (18.9 mol mol‐1)
and the maintenance requirement (mATP) was determined to be 2.85 mmol g‐1 h‐1. These
values are in the same range as literature values. With these energy requirements in‐
cluded in the metabolic network, the network accurately describes the primary metabo‐
lism of C. reinhardtii and can be used for modeling of C. reinhardtii growth and metabo‐
lism. Simulations with this metabolic model showed that mitochondrial respiration both
provides energy for maintenance and additional energy to support growth. The high
maintenance requirements at low growth rates result in low biomass yields and thus
cultivating algae at low growth rates is unfavorable. Cultivating algae at high light supply
rates is less favorable as well, because the biomass yield will decrease due to light satu‐
ration effects. Thus, to optimize biomass yield on light energy in photobioreactors, an
optimum between these two situations should be found.
The simulations presented in this paper show that the metabolic model can be used as a
tool to gain insight into the metabolism of Chlamydomonas reinhardtii and ultimately
can be used for the maximization of biomass and product yield.
Nomenclature
µ Specific growth rate (h‐1)
ΣqiATP Specific ATP production rate in the metabolism with known ATP
stoichiometry (mmol g‐1 h‐1)
ΦP Photochemical quantum yield (‐)
ΦPmax Maximum photochemical quantum yield (‐)
A Transpose of the stoichiometric matrix of the network (‐)
Apbr Illuminated surface of the photobioreactor (m2)
Cx Biomass concentration in the photobioreactor (g L‐1)

Chapter 4
96
Kx ATP requirement for the formation of biomass from biopolymers (mmol g‐1
or mol mol‐1)
mATP Maintenance ATP requirements (mmol ATP g‐1 h‐1)
mE Maintenance light energy requirements (mmol photons g‐1 h‐1)
N Number of measurements (‐)
OD530 Optical density measured at 530nm on a spectrophotometer (‐)
PFD Photon flux density (µmol m‐2 s‐1)
PFDabs Average photon flux density absorbed by the microalgal culture (µmol m‐2
s‐1)
qATP Total specific ATP production rate in the metabolism (mmol g‐1 h‐1)
qATP,light Specific ATP production rate in the chloroplast (mmol g‐1 h‐1)
qATP,ox Specific ATP production rate in oxidative phosphorylation (mmol g‐1 h‐1)
rEx Specific light supply rate (mol g‐1 h‐1)
rEx,u Specific light utilization rate (mmol g‐1 h‐1)
Vpbr Working photobioreactor volume (L)
YxATP Biomass yield on ATP (g mol‐1)
YxE Biomass yield on light energy (g mol‐1)
YxEobs Observed experimental biomass yield on light energy, not corrected for
maintenance requirements (g mol‐1)
Acknowledgements
This research project is financially supported by Technology Foundation STW‐VICI
(WLM.6622) and was performed in the TTIW‐cooperation framework of Wetsus, centre
of excellence for sustainable water technology (www.wetsus.nl). Wetsus is funded by the
Dutch Ministry of Economic Affairs. The authors like to thank the participants of the re‐
search theme ‘algae’ for their fruitful discussions and their financial support. The authors
declare that they have no conflict of interest.
Appendix
A. Metabolic model of Chlamydomonas reinhardtii
Arrows indicate the direction and reversibility of the reactions. The compounds in the
chloroplast are notated with a ‘c’ before the abbreviation. All fluxes are in mmol g‐1 h‐1.

Metabolic modeling of Chlamydomonas reinhardtii
97
The factor in the biomass export reaction (159) converts the biomass flux through reac‐
tion 147 (in mmol g‐1 h‐1) to mg g‐1 h‐1, the biomass production rate.
Light reaction 0 8 Light + 3 ADP + 3 Pi + H[+] + 2 cNADP O2 + H2O + 2 cNADPH + 3 ATP Calvin cycle 1 CO2 + H2O + cRu15DP 2 cG3P 2 ATP + cG3P ADP + H[+] + c13DPG 3 H[+] + cNADPH + c13DPG cNADP + Pi + cGAP 4 cGAP cDHAP 5 cDHAP + cGAP cF16P 6 H2O + cF16P Pi + cF6P 7 cF6P + cGAP cE4P + cX5P 8 H2O + cE4P + cGAP Pi + cS7P 9 cGAP + cS7P cR5P + cX5P 10 cX5P cRu5P 11 cR5P cRu5P 12 ATP + cRu5P ADP + H[+] + cRu15DP Transport chloroplast to cytosol 13 cDHAP DHAP Glycolysis 14 G6P G1P 15 F6P G6P 16 ATP + F6P ADP + F16P + H[+] 17 F16P + H2O F6P + Pi 18 DHAP + GAP F16P 19 DHAP GAP 20 GAP + NAD+Pi 13DPG + H[+] + NADH 21 13DPG + ADP 3PG + ATP 22 3PG 2PG 23 2PG H2O + PEP 24 ADP + H[+] + PEP ATP + PYR Tricarboxylic acid cycle 25 CoA + NAD + PYR AcCoA + CO2 + NADH 26 AcCoA + H2O + OXA CIT + CoA + H[+] 27 CIT + NAD AKG + CO2 + NADH 28 AKG + CoA + NAD CO2 + NADH + SUCCoA 29 ADP + Pi + SUCCoA ATP + CoA + SUC 30 FAD + SUC FADH2 + FUM 31 FUM + H2O MAL 32 FAD + MAL FADH2 + OXA 33 ATP + CO2 + H2O + PYR ADP + OXA + Pi + 2 H[+] 34 ATP + OXA ADP + CO2 + PEP 35 CO2 + H2O + PEP H[+] + OXA + Pi

Chapter 4
98
Pentose phosphate pathway 36 G6P + H2O + NADP 6PG + NADPH + 2 H[+] 37 6PG + NADP CO2 + NADPH + RU5P 38 RU5P R5P 39 RU5P X5P 40 R5P + X5P GAP + S7P 41 GAP + S7P E4P + F6P 42 F6P + GAP E4P + X5P Glycerol 43 DHAP + H2O DHA + Pi 44 DHA + H[+] + NADPH GLYC + NADP 45 ATP + GLYC ADP + GLYC3P + H[+] 46 GLYC3P + NAD DHAP + H[+] + NADH N and S fixation 47 H[+] + NADH + NO3 H2O + NAD + NO2 48 5 H[+] + 3 NADPH + NO2 NH4[+] + 2 H2O + 3 NADP 49 ATP + SO4 APS + PPi 50 APS + NADH AMP + NAD + SO3 51 5 H[+] + 3 NADPH + SO3 H2S + 3 H2O + 3 NADP Oxidative phosphorylation 52 1.5 ADP + 1.5 H[+] + 1.5 Pi + FADH2 + 0.5 O2 FAD + 1.5 ATP + 2.5 H2O 53 3.5 H[+] + 2.5 ADP + 2.5 Pi + NADH + 0.5 O2 NAD + 2.5 ATP + 3.5 H2O 54 NAD + NADPH NADH + NADP 55 H2O + PPi H[+] + 2 Pi 56 AMP + ATP 2 ADP 57 ATP + H2O ADP + H[+] + Pi Amino acids and protein 58 AKG + H[+] + NADPH + NH4[+] GLU + H2O + NADP 59 ATP + GLU + NH4[+] ADP + GLN + H[+] + Pi 60 AKG + GLN + H[+] + NADPH NADP + 2 GLU 61 3PG + GLU + H2O + NAD AKG + H[+] + NADH + Pi + SER 62 SER NH4[+] + PYR 63 AcCoA + H2S + SER Ace + CYS + CoA + H[+] 64 ATP + Ace + CoA ADP + AcCoA + Pi 65 GLU + PYR AKG + ALA 66 H[+] + THR 2‐oxobutan + NH4[+] 67 2‐oxobutan + GLU + H[+] + NADPH + PYR AKG + CO2 + H2O + ILE + NADP 68 2 H[+] + ALA + NADPH + PYR CO2 + H2O + NADP + VAL 69 2 PYR + AcCoA + GLU + H[+] + NAD + NADPH AKG + CoA + LEU + NADH + NADP + 2 CO2 70 2 PEP + ATP + E4P + NADPH ADP + CHO + NADP + 4 Pi 71 CHO PRE 72 GLU + H[+] + PRE AKG + CO2 + H2O + PHE 73 GLU + NAD + PRE AKG + CO2 + NADH + TYR 74 CHO + GLN ANTH + GLU + H[+] + PYR 75 ANTH + H[+] + PRPP + SER CO2 + GAP + PPi + TRYP + 2 H2O 76 3 H2O + 2 NAD + ATP + GLN + PRPP AICAR + AKG + HIS + Pi + 2 NADH + 2 PPi + 5 H[+]

Metabolic modeling of Chlamydomonas reinhardtii
99
77 GLU + OXA AKG + ASP 78 ASP + ATP + GLN + H2O ADP + ASN + GLU + H[+] + Pi 79 2 ATP + 2 H2O + CO2 + GLN CaP + GLU + Pi + 2 ADP + 3 H[+] 80 2 GLU + ASP + ATP + CaP + NADH AKG + AMP + ARG + FUM + H2O + NAD + PPi + Pi 81 3 H[+] + 2 NADH + GLU PRO + 2 H2O + 2 NAD 82 AKG + O2 + PRO CO2 + HydPro + SUC 83 ASP + ATP + H[+] + NADPH ADP + ASA + NADP + Pi 84 2 H[+] + ASA + GLU + NADH + PYR AKG + DAP + H2O + NAD 85 DAP CO2 + H[+] + LYS 86 ASA + H[+] + NADPH HSER + NADP 87 ATP + H2O + HSER ADP + H[+] + Pi + THR 88 AcCoA + CYS + H2O + HSER Ace + CoA + HCYS + H[+] + NH4[+] + PYR 89 HCYS + MTHF H[+] + MET + THF 90 4.306 ATP + 3.306 H2O + 0.111 ALA + 0.094 GLY + 0.093 LEU + 0.059 PRO + 0.059 VAL +
0.058 LYS + 0.057 THR + 0.055 SER + 0.05 GLN + 0.05 GLU + 0.047 ARG + 0.047 ASN + 0.047 ASP + 0.045 PHE + 0.036 ILE + 0.031 TYR + 0.022 MET + 0.017 HIS + 0.013 HydPro + 0.012 CYS + 0.001 TRYP PROTEIN + 4.306 ADP + 4.306 Pi + 4.314 H[+]
Photorespiration 91 H2O + NAD + O2 + cRu15DP H[+] + NADH + Pi + cG3P + glyoxylate 92 GLY + H[+] + PYR ALA + glyoxylate 93 SER + glyoxylate GLY + HydPyr 94 GLY + H2O + METHF SER + THF 95 GLY + NAD + THF CO2 + METHF + NADH + NH4[+] 96 H[+] + HydPyr + NADH Glycerate + NAD 97 ATP + Glycerate ADP + 2 H[+] + 3PG THF metabolism 98 ATP + R5P AMP + H[+] + PRPP 99 5FTHF + H[+] H2O + MYLTHF 100 H2O + MYLTHF H[+] + N10FTHF 101 ATP + FORM + THF ADP + N10FTHF + Pi 102 MYLTHF + NADPH METHF + NADP 103 H[+] + METHF + NADPH MTHF + NADP 104 5FTHF + ATP + H2O ADP + H[+] + N10FTHF + Pi 105 FORM + H[+] + THF H2O + N10FTHF 106 DHF + H[+] + NADPH NADP + THF Lipids (phosphatidic acid) 107 ACP + AcCoA + H[+] AcACP + CoA 108 ATP + AcCoA + CO2 + H2O ADP + H[+] + MalCoA + Pi 109 ACP + MalCoA CoA + MalACP 110 10 H[+] + 10 NADPH + 5 MalACP + AcACP C12:0ACP + 5 ACP + 5 CO2 + 5 H2O + 10 NADP 111 12 H[+] + 12 NADPH + 6 MalACP + AcACP C14:0ACP + 6 ACP + 6 CO2 + 6 H2O + 12 NADP 112 14 H[+] + 14 NADPH + 7 MalACP + AcACP C16:0ACP + 7 ACP + 7 CO2 + 7 H2O + 14 NADP 113 C160ACP + H[+] + NADH + O2 C16:1ACP + NAD + 2 H2O 114 C161ACP + H[+] + NADH + O2 C16:2ACP + NAD + 2 H2O 115 C162ACP + H[+] + NADH + O2 C16:3ACP + NAD + 2 H2O 116 16 H[+] + 16 NADPH + 8 MalACP + AcACP C18:0ACP + 8 ACP + 8 CO2 + 8 H2O + 16 NADP 117 C180ACP + H[+] + NADH + O2 C18:1ACP + NAD + 2 H2O
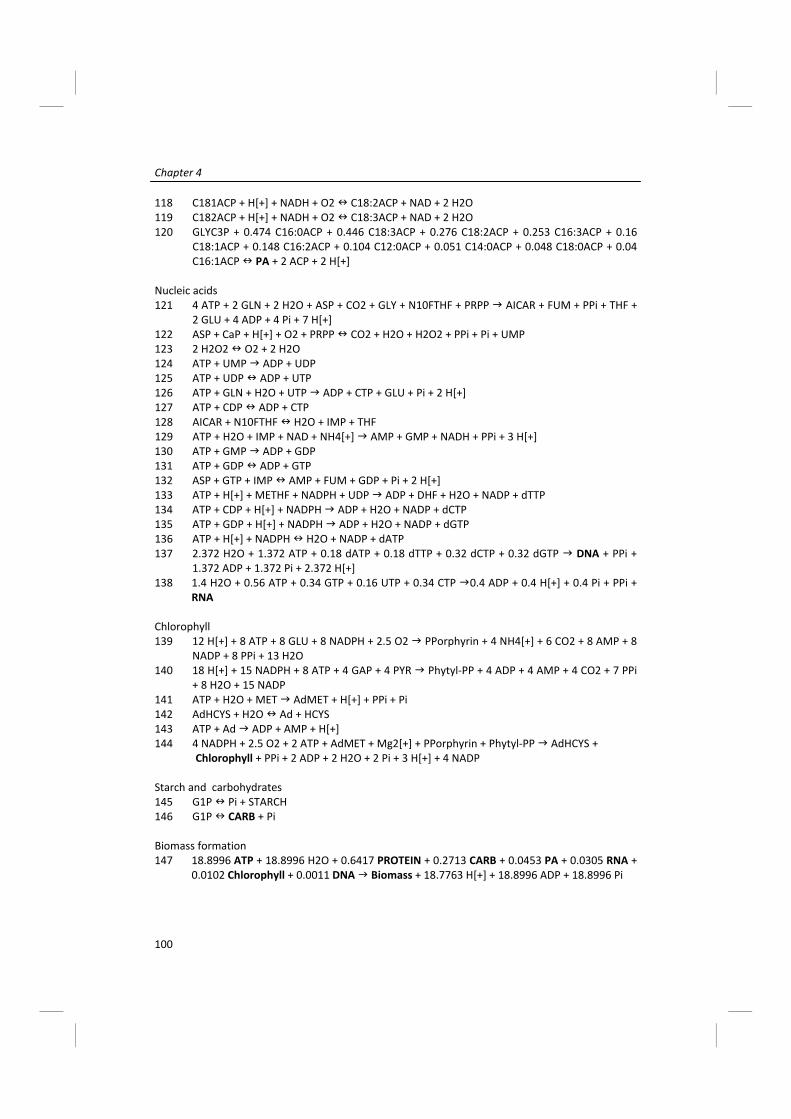
Chapter 4
100
118 C181ACP + H[+] + NADH + O2 C18:2ACP + NAD + 2 H2O 119 C182ACP + H[+] + NADH + O2 C18:3ACP + NAD + 2 H2O 120 GLYC3P + 0.474 C16:0ACP + 0.446 C18:3ACP + 0.276 C18:2ACP + 0.253 C16:3ACP + 0.16
C18:1ACP + 0.148 C16:2ACP + 0.104 C12:0ACP + 0.051 C14:0ACP + 0.048 C18:0ACP + 0.04 C16:1ACP PA + 2 ACP + 2 H[+]
Nucleic acids 121 4 ATP + 2 GLN + 2 H2O + ASP + CO2 + GLY + N10FTHF + PRPP AICAR + FUM + PPi + THF +
2 GLU + 4 ADP + 4 Pi + 7 H[+] 122 ASP + CaP + H[+] + O2 + PRPP CO2 + H2O + H2O2 + PPi + Pi + UMP 123 2 H2O2 O2 + 2 H2O 124 ATP + UMP ADP + UDP 125 ATP + UDP ADP + UTP 126 ATP + GLN + H2O + UTP ADP + CTP + GLU + Pi + 2 H[+] 127 ATP + CDP ADP + CTP 128 AICAR + N10FTHF H2O + IMP + THF 129 ATP + H2O + IMP + NAD + NH4[+] AMP + GMP + NADH + PPi + 3 H[+] 130 ATP + GMP ADP + GDP 131 ATP + GDP ADP + GTP 132 ASP + GTP + IMP AMP + FUM + GDP + Pi + 2 H[+] 133 ATP + H[+] + METHF + NADPH + UDP ADP + DHF + H2O + NADP + dTTP 134 ATP + CDP + H[+] + NADPH ADP + H2O + NADP + dCTP 135 ATP + GDP + H[+] + NADPH ADP + H2O + NADP + dGTP 136 ATP + H[+] + NADPH H2O + NADP + dATP 137 2.372 H2O + 1.372 ATP + 0.18 dATP + 0.18 dTTP + 0.32 dCTP + 0.32 dGTP DNA + PPi +
1.372 ADP + 1.372 Pi + 2.372 H[+] 138 1.4 H2O + 0.56 ATP + 0.34 GTP + 0.16 UTP + 0.34 CTP 0.4 ADP + 0.4 H[+] + 0.4 Pi + PPi +
RNA Chlorophyll 139 12 H[+] + 8 ATP + 8 GLU + 8 NADPH + 2.5 O2 PPorphyrin + 4 NH4[+] + 6 CO2 + 8 AMP + 8
NADP + 8 PPi + 13 H2O 140 18 H[+] + 15 NADPH + 8 ATP + 4 GAP + 4 PYR Phytyl‐PP + 4 ADP + 4 AMP + 4 CO2 + 7 PPi
+ 8 H2O + 15 NADP 141 ATP + H2O + MET AdMET + H[+] + PPi + Pi 142 AdHCYS + H2O Ad + HCYS 143 ATP + Ad ADP + AMP + H[+] 144 4 NADPH + 2.5 O2 + 2 ATP + AdMET + Mg2[+] + PPorphyrin + Phytyl‐PP AdHCYS + Chlorophyll + PPi + 2 ADP + 2 H2O + 2 Pi + 3 H[+] + 4 NADP Starch and carbohydrates 145 G1P Pi + STARCH 146 G1P CARB + Pi Biomass formation 147 18.8996 ATP + 18.8996 H2O + 0.6417 PROTEIN + 0.2713 CARB + 0.0453 PA + 0.0305 RNA +
0.0102 Chlorophyll + 0.0011 DNA Biomass + 18.7763 H[+] + 18.8996 ADP + 18.8996 Pi

Metabolic modeling of Chlamydomonas reinhardtii
101
Transport 148 CO2 CO2_ex 149 O2 O2_ex 150 H2O H2O_ex 151 Pi Pi_ex 152 SO4 SO4_ex 153 NO3 NO3_ex 154 Mg2[+] Mg2[+]_ex 155 Light Light_ex 156 H[+] H[+]_ex 157 GLYC GLYC_ex 158 STARCH STARCH_ex 159 Biomass 172.848 Biomass_ex
B. Compound abbreviations 13DPG 1,3‐diPhosphoglycerate 2‐oxobutan 2‐Oxobutanoate 2PG 2‐Phosphoglycerate 3PG 3‐Phosphoglycerate 5FTHF 5‐Formyl‐THF 6PG 6‐Phosphogluconate AcACP Acetyl‐ACP AcCOA Acetyl‐CoA Ace Acetate ACP Acetyl‐carrier protein Ad Adenosine AdHCYS S‐Adenosyl‐L‐homocysteine AdMET S‐Adenosyl‐L‐methionine ADP Adenosine diphosphate AICAR 5‐Aminoimidazole‐4‐
carboxamide ribonucleine AKG 2‐Oxoglutarate (alpha‐
ketoglutarate) ALA Alanine AMP Adenosine monophosphate ANTH Anthranilate APS Adenylyl sulfate ARG Arginine ASA L‐Aspartic semialdehyde ASN Asparagine ASP Aspartate ATP Adenosine triphosphate Biomass Biomass Biomass_ex Biomass (g) C12:0ACP Dodecanoyl‐ACP (Lauric acid) C14:0ACP Tetradecanoyl‐ACP (Myristic
acid) C16:0ACP Hexadecanoyl‐ACP (Palmiticacid)
C16:1ACP Trans‐Hexadec‐2‐enoyl‐ACP
(Palmitoleic acid) C16:2ACP Hexadecadienoic acid C16:3ACP Hexadecatrienoic acid C18:0ACP Octadecanoyl‐ACP (Stearic acid) C18:1ACP Cis‐11‐ocadecanoate‐ACP (Oleic
acid) C18:2ACP Linoleic acid C18:3ACP Alpha‐linoleic acid CaP Carbamoyl phosphate CARB Carbohydrate CDP Cytidine diphosphate Chlorophyll Chlorophyll CHO Chorismate CIT Citrate CO2 Carbon dioxide CO2_ex Carbon dioxide (extracellular) CoA Coenzyme A CTP Cytidine triphosphate CYS Cysteine DAP Diaminopimelate dATP Deoxy ATP dCTP Deoxy CTP dGTP Deoxy GTP DHA Dihydroxyacetone (Glycerone) DHAP Dihydroxyacetone‐P DHF Dihydrofolate DNA Deoxyribonucleic acid dTTP Deoxy TTP E4P Erythrose 4‐phosphate F16P Fructose 1,6‐bisphosphate F6P Fructose 6‐phosphate FAD Flavin adenine dinucleotide

Chapter 4
102
oxidized FADH2 Flavin adenine dinucleotide
reduced FORM Formic acid FUM Fumarate G1P Glucose 1‐phosphate G6P Glucose 6‐phosphate GAP Glyceraldehyde 3‐phosphate GDP Guanosine diphosphate GLN Glutamine GLU Glutamate GLY Glycine GLYC Glycerol GLYC3P Glycerol 3‐phosphate Glycerate Glycerate GLYC_ex Glycerol (extracellular) glyoxylate Glyoxylate GMP Guanosine monophosphate GTP Guanosine triphosphate H[+] Proton H[+]_ex Proton (extracellular) H2O Water H2O2 Hydrogen peroxide H2O_ex Water (extracellular) H2S Hydrogen sulfide HCYS Homocysteine HIS Histidine HSER Homoserine HydPro Hydroxyproline HydPyr 3‐Hydroxypyruvate ILE Isoleucine IMP Inosine monophosphate LEU Leucine Light Photons Light_ex Photons (extracellular) LYS Lysine MAL Malate MalCoA Malonyl‐CoA MET Methionine METHF 5,10‐Methylene‐THF Mg2[+] Magnesium Mg2[+]_ex Magnesium (extracellular) MTHF Methyl‐THF MYLTHF 5,10‐Methenyl‐THF N10FTHF 10‐Formyl‐THF NAD Nicotinamide oxidized
NADH Nicotinamide reduced NADP Nicotinamidephosphate oxidized NADPH Nicotinamidephosphate reduced NH4[+] Ammonium NH4[+]_ex Ammonium (extracellular) NO2 Nitrite NO3 Nitrate NO3_ex Nitrate (extracellular) O2 Oxygen O2_ex Oxygen (extracellular) OXA Oxaloacetate PA Phosphatidic acid PEP Phosphoenolpyruvate PHE Phenylalanine Phytyl‐PP Phytyl‐diphosphate Pi Orthophosphate Pi_ex Orthophosphate (extracellular) PPi Pyrophosphate PPorphyrin Protoporphyrine PRE Prephanate PRO Proline PROTEIN Protein PRPP Phosphorybosylpyrophosphate PYR Pyruvate R5P Ribose 5‐phosphate RNA Ribonucleic acid Ru15DP Ribulose 1,5‐bisphosphate RU5P Ribulose 5‐phosphate S7P Sedoheptulose 7‐phosphate SER Serine SO3 Sulphite SO4 Sulphate SO4_ex Sulphate (extracellular) STARCH Starch STARCH_ex Starch (extracellular) SUC Succinate SUCCoA Succinyl Coenzyme A THF Tetrahydrofolate THR Threonine TRYP Tryptophan TYR Tyrosine UDP Uridine diphosphate UMP Uridine monophosphate UTP Uridine triphosphate VAL Valine X5P Xylulose 5‐phosphate

Metabolic modeling of Chlamydomonas reinhardtii
103
C. Elemental composition of macromolecules
The average elemental biomass composition thus becomes CH1.62O0.41N0.14P0.01S0.003.
The biomass contains an ash fraction of 0.057. This yields a molecular weight of 23.97 g C‐mol‐1.
D. Protein composition
In the network, proteins were modeled as a coupling of one average amino acid, consuming 4.306
mol ATP. One average amino acid constitutes of the sum of the molar fractions of the various
amino acids present in C. reinhardtii.
C H O N P S Charge
Protein 4.8 7.6 1.5 1.3 0 0.03 ‐
Carbohydrates 6.0 10.0 5.0 0 0 0 ‐
Lipids (PA) 36.3 63.4 8.0 0 1.0 0 ‐2
DNA 9.7 12.2 7.0 3.8 1.0 0 ‐2
RNA 9.5 12.8 8.0 3.8 1.0 0 ‐1
Chlorophyll 55.0 72.0 5.0 4.0 0 0 ‐
Biomass 7.2 11.7 3.0 1.0 0.08 0.02 ‐
Amino Acid % (mol AA/mol protein) Alanine (Ala) 11.07 Arginine (Arg) 4.67 Asparagine (Asn) 4.68 Aspartate (Asp) 4.68 Cysteine (Cys) 1.17 Glutamate (Glu) 4.96 Glutamine (Gln) 4.96 Glycine (Gly) 9.36 Histidine (His) 1.69 Hydroxyproline (HydPro) 1.30 Isoleucine (Ile) 3.59 Leucine (Leu) 9.25 Lysine (Lys) 5.78 Methionine (Met) 2.22 Phenylalanine (Phe) 4.45 Proline (Pro) 5.92 Serine (Ser) 5.51 Threonine (Thr) 5.71 Tryptophan (Trp) 0.10 Tyrosine (Tyr) 3.08 Valine (Val) 5.86
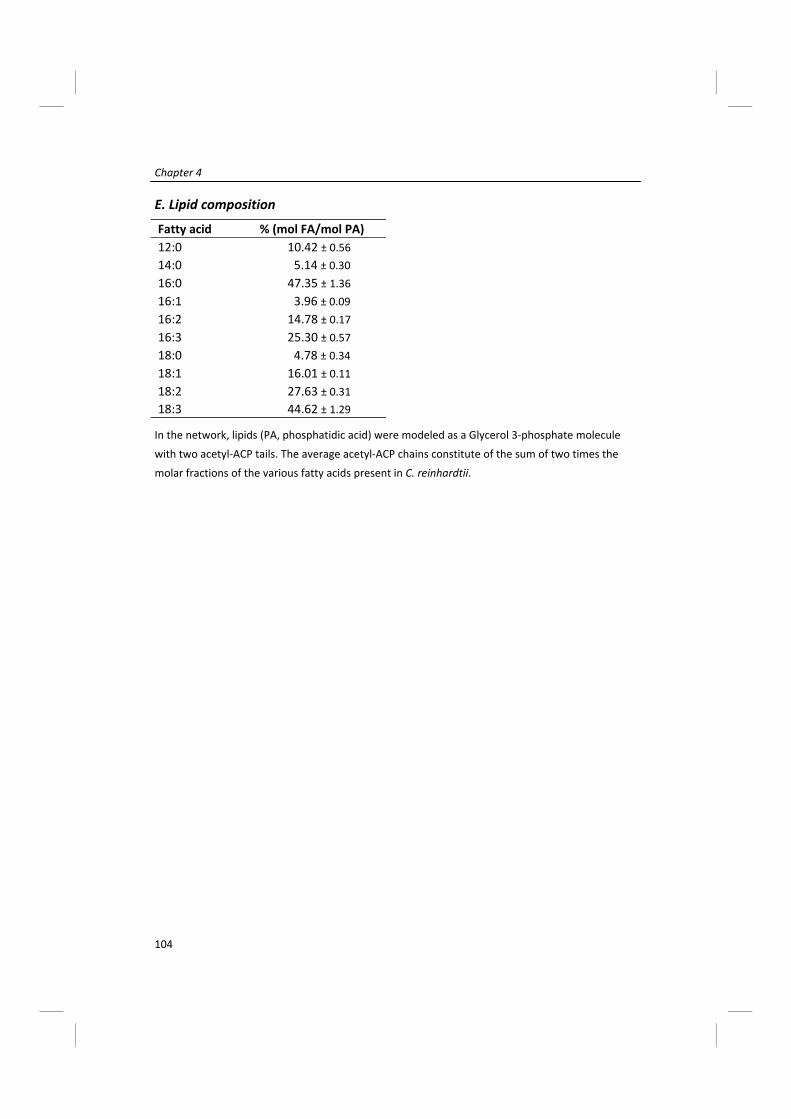
Chapter 4
104
E. Lipid composition
In the network, lipids (PA, phosphatidic acid) were modeled as a Glycerol 3‐phosphate molecule
with two acetyl‐ACP tails. The average acetyl‐ACP chains constitute of the sum of two times the
molar fractions of the various fatty acids present in C. reinhardtii.
Fatty acid % (mol FA/mol PA) 12:0 10.42 ± 0.56 14:0 5.14 ± 0.30 16:0 47.35 ± 1.36 16:1 3.96 ± 0.09 16:2 14.78 ± 0.17 16:3 25.30 ± 0.57 18:0 4.78 ± 0.34 18:1 16.01 ± 0.11 18:2 27.63 ± 0.31 18:3 44.62 ± 1.29


Kliphuis AMJ, Janssen M, Martens DE, Wijffels RH (2010)
Effect of O2 : CO2 ratio on the primary metabolism of Chlamydomonas reinhardtii
Submitted for publication
Chapter
Effect of O2 : CO2 ratio on the primary metabolism of Chlamydomonas reinhardtii

Chapter 5
108
Abstract
H igh oxygen : carbon dioxide ratios may have a negative effect on growth and pro‐
ductivity of microalgae. To investigate the effect of O2 and CO2 concentrations and
the ratio between these on the metabolism of Chlamydomonas reinhardtii, we per‐
formed turbidostat experiments at different O2 : CO2 ratios. These experiments showed
that elevated O2 concentrations and the corresponding increase in the ratio of O2 : CO2
common in photobioreactors led to a reduction of growth and biomass yield on light
with 20‐30%. This is most probably related to the oxygenase activity of Rubisco and the
resulting process of photorespiration. Using flux balance analysis with measured rates
for each experiment we were able to quantify the ratio of the oxygenase reaction to the
carboxylase reaction of Rubisco and could demonstrate that photorespiration indeed can
cause the reduction in biomass yield on light. The calculated ratio of the oxygenase reac‐
tion to the carboxylase reaction was 16.6% and 20.5% for air with 2% CO2 and 1% CO2
respectively. Thus photorespiration has a significant impact on the biomass yield on light
already at conditions common in photobioreactors (air with 2% CO2).
Keywords: Chlamydomonas reinhardtii, Oxygen, Photorespiration, Flux balance analysis
(FBA), Yield.

Effect of O2 : CO2 ratio on the primary metabolism of Chlamydomonas reinhardtii
109
Introduction
During photoautotrophic growth microalgae consume carbon dioxide (CO2) and produce
oxygen (O2). The evolved O2 can easily build up to high concentrations in closed photo‐
bioreactors and this can have a negative effect on productivity and inhibit growth of the
microalgae (Carvalho et al. 2006; Miron et al. 1999; Wijffels et al. 2010). Therefore, high
O2 concentrations are generally prevented by increasing the gas flow through the culture
and thus removing O2 faster. However, this requires more energy and thus increases
operation costs (Norsker et al. 2010; Wijffels et al. 2010). If inhibitory levels of O2 could
be increased this would thus result in a reduction of the operational costs. Therefore it is
important to understand the effect of O2 concentration and the ratio with CO2 concen‐
tration on algal metabolism.
The main processes that can occur at high O2 : CO2 ratios are photorespiration, the
Mehler reaction (water‐water cycle) and photoinhibition. The Mehler reaction and
photoinhibition are thought to occur only at a strong imbalance between light absorp‐
tion and utilization of the reductants generated in the light reactions (Adir et al. 2003;
Cruz et al. 2005; Hideg 1997). The Mehler reaction takes place when the NADP/NADPH
pool as well as the other components of the photosynthetic apparatus are reduced. High
light intensities, CO2 limitation and low temperatures can induce this situation (Badger et
al. 2000). However, over‐reduction of the chloroplast can also be prevented by trans‐
porting NADPH out of the chloroplast through a shuttle mechanism, the Malate/
Oxaloacetate shuttle. This shuttle is activated by high NADPH levels in the chloroplast.
This process seems to be preferred over the Mehler reaction, provided enough Ox‐
aloacetate is present (Hoefnagel et al. 1998). Thus, these processes will occur at high
light intensities and/or low growth rates due to nutrient limitations or temperature
stress. In this paper we focus on the effect of the O2 : CO2 ratio on photorespiration, by
avoiding these conditions and thus preventing photoinhibition and the Mehler reaction
from occurring. Photorespiration occurs when high concentrations of O2 and/or low con‐
centrations of CO2 are present (Foyer et al. 2009; Ogren 1984; Wingler et al. 2000). In
this process Ribulose 1,5‐bisphosphate carboxylase/oxygenase (Rubisco, EC 4.1.1.39)
reacts with O2 instead of CO2. When Rubisco fixes CO2, two molecules of Glycerate 3‐
phosphate are formed (Figure 5.1a). These can be converted back to Ribulose 1,5‐
bisphosphate or can be used in the central carbon metabolism to form biomass compo‐
nents. However, if O2 is fixed only one Glycerate 3‐phosphate is formed and one mole‐
cule of Glycolate 2‐phosphate (Figure 5.1b). This compound is converted into glyoxylate

Chapter 5
110
through glycolate and can subsequently be converted to Glycerate 3‐phosphate at the
expense of energy in the form of ATP. In addition CO2 is ‘lost’ and needs to be re‐fixed in
the Calvin cycle. Ammonium (NH4+) is also ‘lost’ and needs to be re‐fixed into Glutamate.
This costs additional ATP and NADPH which are generated in the light reaction (linear
electron transport) of photosynthesis and thus this costs additional light. Thus, in case
photorespiration occurs less energy is available for growth, which will decrease the yield
of microalgal biomass on light. To prevent this, it is important to keep the O2 : CO2 ratio
low in order to minimize photorespiration and maximize biomass yield on light energy.
Figure 5.1 Carboxylase and oxygenase reactions of Rubisco, followed by the Calvin cycle (a) and
photorespiration (b). The two processes are shown for two Ribulose 1,5‐bisphosphate molecules
each. The numbers correspond to the reactions in the metabolic model as shown in Appendix A.
When Rubisco binds CO2 (a), per two CO2 four Glycerate 3‐phosphate are formed, which can be
converted to Glyceraldehyde 3‐phosphate (GAP). GAP can be regenerated into Ribulose 1,5‐bP at
the expense of ATP or be used in the central carbon metabolism to form building blocks for bio‐
mass. When Rubisco binds O2 (b), per two O2 two Glycerate 3‐phosphate and two Glycolate 2‐
phosphate are formed. To convert these two Glycolate 2‐phosphate to one Glycerate 3‐phosphate,
ATP is consumed, CO2 and ammonia (NH4+) are lost. Re‐fixing this lost CO2 and NH4
+ costs more ATP
and NADPH elsewhere in the metabolism.
a b

Effect of O2 : CO2 ratio on the primary metabolism of Chlamydomonas reinhardtii
111
The aim of this study is to get insight in the effect of the oxygen to carbon dioxide ratio
on photorespiration and the metabolism of Chlamydomonas reinhardtii in general. The
metabolism at different O2 : CO2 ratios is analyzed using a previously developed meta‐
bolic flux model describing the primary metabolism of C. reinhardtii (Kliphuis et al.
2010c). A simplified overview of this metabolic network is shown in Figure 5.2.
To assess the effect of different O2 : CO2 ratios on the metabolism of Chlamydomonas
reinhardtii we performed two turbidostat experiments in a SLP photobioreactor. We
examined four steady states, two control steady states at a very low O2 : CO2 ratio and
two steady states at higher ratios, which are common in photobioreactors. Since these
Figure 5.2 Simple overview of an algal cell in the light, showing the main metabolic processes The
model contains two compartments. The light reaction and Calvin cycle are placed in the chloroplast
compartment and all other processes are located in the cytosol compartment. Light energy is har‐
vested in the chloroplast, yielding O2, ATP and NADPH. These are needed to fix carbon dioxide in
the Calvin cycle into glyceraldehyde 3‐phosphate (GAP). GAP can be transported to the cytosol to
be converted into building blocks for biomass. Lipids are formed through glycolysis and the tricar‐
boxylic acid (TCA) cycle. Nitrate is taken up by the cell and converted into glutamate which in turn
can be converted to protein and chlorophyll. GAP can be converted to glucose 6‐phosphate (G6P)
from which carbohydrates are formed. G6P can also enter the pentose phosphate pathway (PPP)
which yields NADPH, DNA and RNA. Electrons are carried by NADH and FADH2 to the mitochondrial
electron transport chain, yielding ATP by taking up O2.

Chapter 5
112
experiments were performed in turbidostat mode the biomass concentration in the reac‐
tor and thus the amount of light supplied per amount of biomass, i.e. the light supply
rate rEx, was the same for each steady state and only the ratio of O2 to CO2 varied. Fur‐
thermore, the average light intensity experienced by the microalgae was sub‐saturating,
about 150 µmol m‐2 s‐1. Under these conditions we assumed that the main effect of the
O2 : CO2 ratio will be on photorespiration and the Mehler reaction and photoinhibition
are negligible.
Materials & Methods
Organism, medium and cultivation conditions
Chlamydomonas reinhardtii CC1690 (Chlamydomonas Genetics Centre, Duke University)
was cultivated in 250 mL shake flasks containing 100 mL defined medium (Table 5.1) at
pH 6.7. The medium was based on the Sueoka high salts (HS) medium, enriched for mag‐
nesium and calcium (Sueoka et al. 1967). The micronutrients were based on Hutner’s
trace element solution (Hutner et al. 1950). Additional EDTA was added to prevent pre‐
cipitation of salts. Nitrate was used as a nitrogen source and enough nitrogen was added
Table 5.1 Composition of Chlamydomonas reinhardtii medium designed to reach 5 g L‐1 biomass dry
weight. The concentrations were doubled for photobioreactor cultivations, except for the phos‐
phate buffer. The nitrate concentration was lowered to 10 mmol L‐1 for the photobioreactor experi‐
ments.
a NaHCO3 was only added to the medium for photobioreactor experiments.
Medium Trace element stock
Compound Concentration (mmol L‐1)
Compound Concentration (mmol L‐1)
KNO3 24.73 FeSO4 ∙ 7 H2O 17.96
KH2PO4 5.29 Na2EDTA ∙ H2O 148.69
K2HPO4 8.28 ZnSO4 ∙ 7 H2O 76.51
MgSO4 ∙ 7 H2O 1.14 H3BO3 184.38
CaCl2 ∙ 2 H2O 0.39 MnCl2 ∙ 4 H2O 25.57
Na2EDTA ∙ 2 H2O 0.39 CoCl2 ∙ 6 H2O 6.77
CuSO4 ∙ 5 H2O 6.29
NaHCO3 1.00 a (NH4)6Mo7O24 ∙ 4 H2O 0.89
Effect of O2 : CO2 ratio on the primary metabolism of Chlamydomonas reinhardtii
113
to support 5 g L‐1 biomass. For the photobioreactor experiments the nitrate concentra‐
tion in the medium was lowered to 10 mM since nitrate was added on demand via the
pH control. The medium for the photobioreactor experiments was enriched with 1 mmol
L‐1 NaHCO3 and aerated overnight with either N2 or pressurized air enriched with 1 or 2%
CO2. C. reinhardtii cultures were maintained in a culture chamber at a temperature of
25°C, a light intensity of 20‐40 µmol m‐2 s‐1 and a 16/8h day/night cycle. To reach inocula‐
tion cell density the cultures were placed in a shake‐incubator for three days at a con‐
tinuous light intensity of 280 µmol m‐2 s‐1 and a headspace enriched with 5% CO2.
Reactor set‐up and experiments
Chlamydomonas reinhardtii was cultivated in turbidostat mode in a short light‐path (SLP)
photobioreactor, depicted schematically in Figure 5.3. This photobioreactor design is
described in more detail in Kliphuis et al. (2010a). The photobioreactor had a working
volume of 3.4 L, an annular gap width of 12 mm and an illuminated area (Apbr) of 0.24 m2.
The inner cylinder was rotating at a speed of 70 rpm during the turbidostat cultivations,
while the outer cylinder was stationary. To enable vertical back‐mixing four down com‐
ers were drilled into the inner cylinder. Without down comers in the inner cylinder no
vertical back mixing occurred and the algae accumulated in the top part of the photobio‐
reactor. By adding the down comers, the algae were mixed over the whole annular gap.
The light was provided continuously by 60 tungsten‐halogen lamps (Philips Masterline ES
45W) surrounding the reactor. The photon flux density (PFDin, µmol m‐2 s‐1) was meas‐
ured with a LI‐COR 190‐SA 2π quantum sensor (PAR‐range: 400‐700 nm) at 80 fixed
points inside the reactor before each experiment. The measured light intensities at all 80
points were averaged into a PFDin for that particular experiment. An average incoming
light intensity (PFDin) of 600 µmol m‐2 s‐1 was used for the experiments.
During the experiments the light transmitted through the culture (µmol m‐2 s‐1) was
measured by a spherical PAR quantum sensor (US‐SQS Spherical Micro Quantum Sensor,
Heinz Walz Gmbh, Germany) placed inside the culture broth at the depth of the annular
gap, 12 mm from the internal reactor wall, as illustrated in Figure 5.3. With this light sen‐
sor the turbidity of the culture was controlled by maintaining the photon flux density at
this position (PFDout) at 10 µmol m‐2 s‐1.
Assuming an exponential decrease of the photon flux density at increasing depth inside
the photobioreactor the spatially averaged light intensity (PFDavg) can be calculated

Chapter 5
114
based on equation 1. In which a is the attenuation coefficient of the microalgal broth (in
m‐1) and d is the optical depth of the system (12 mm). With a PFDin of 600 µmol m‐2 s‐1
and a PFDout of 10 µmol m‐2 s‐1 the result is a PFDavg of 144 µmol m‐2 s‐1.
(1)
In which:
Figure 5.3 Schematic overview (not on scale) of the SLP photobioreactor. A = annular gap, C = con‐
denser, D = internal down comer, DO = dissolved oxygen sensor, GA = gas analyzer, I = inner cylin‐
der, L = spherical quantum sensor, M = motor, MFC = Mass flow controllers for both N2 or air and
CO2, pH = pH sensor connected to acid pump via control unit, S = sparger, T = temperature control
connected to cryostat and cooling jacket (not shown). The acid bottle, antifoam bottle, medium in
and overflow bottle were placed on balances and weighed on‐line.
( )⎭⎬⎫
⎩⎨⎧ −⋅
−⋅= ⋅− 1e
aPFD
d1PFD dain
avg
dPFDPFD
lna in
out
−
⎟⎟⎠
⎞⎜⎜⎝
⎛
=

Effect of O2 : CO2 ratio on the primary metabolism of Chlamydomonas reinhardtii
115
Using mass flow controllers (Brooks, Smart TMF 5850S), carbon dioxide was supplied by
sparging nitrogen (N2) or pressurized air (1.5 L min‐1) enriched with 1 or 2% CO2 through
a silicone ring sparger at the bottom of the reactor. This gas flow also served to remove
excess oxygen from the culture broth.
Foam formation was prevented by adding antifoam (Antifoam B silicone emulsion, Mal‐
linckrodt Baker B.V.) to the culture when foam formation was detected by a foam sen‐
sor. The pH was controlled at pH 6.7 ± 0.1 by pumping nitric acid (1.2 M), serving also as
nitrogen source. The acid bottle, antifoam bottle, medium in and overflow bottle were
placed on balances and weighed on‐line. The reactor was kept at 25°C by a water jacket
connected to a temperature‐controlled water bath. To prevent water from evaporating
into the off‐gas the reactor was equipped with a condenser connected to a cryostat set
at 2°C.
After inoculation at an optical density at 530 nm (OD530) of 0.05, the culture was grown
in batch mode until a sufficient optical density was reached. Then the medium supply
was started, automatically controlled by the turbidity of the culture. The quantum sensor
behind the annular gap measured the light transmitted through the culture and thus the
turbidity of the culture. When this transmitted light was less than 10 µmol m‐2 s‐1, the
culture was automatically diluted until this set‐point was restored. The resulting dilution
rate D, and as such the specific growth rate µ (in steady state µ = D), was continuously
monitored. This turbidostat operation was maintained until steady state was reached. In
these experiments steady state was defined as a constant specific growth rate (i.e. dilu‐
tion rate), optical density, biovolume and cell density (Cx, g L‐1) in the photobioreactor for
at least 7 residence times.
Biomass samples were taken from the culture overflow and weighed off‐line. When
steady state was reached the overflow was collected on ice overnight to have enough
biomass material for biomass composition determinations.
On‐line gas analysis and calculations
The off‐gas was analyzed by leading it over a gas analyzer (Servomex, 4100) fitted with
two different gas sensor modules, a paramagnetic purity transducer to measure oxygen
and an infrared 1500 transducer to measure carbon dioxide. Before each experiment, a
dry and a wet baseline were measured to correct the experimental gas data for the vol‐
ume change due to the consumption of CO2 and the production of O2 and the moisture
content. The dry baseline was measured by leading 1.5 L min‐1 N2 or air enriched with 1%

Chapter 5
116
or 2% CO2 over the gas analyzers. For the wet baseline the N2 or air enriched with CO2
was first sparged through the reactor, containing medium at the same temperature and
pH as during the turbidostat experiment, and through the condenser before being ana‐
lyzed. The total molar gas flow going in (ngas,in, mmol h‐1) is corrected for the volume
change due to the consumption of CO2 and the production of O2 and for the moisture
content (xH2O) according to equations 2 and 3.
(2)
(3)
With this corrected molar gas flow ngas,out,exp (mmol h‐1) and the molar fraction of oxygen
(xO2,exp) and carbon dioxide (xCO2,exp) measured during the experiments, the oxygen pro‐
duction rate (OPR, mmol h‐1) and carbon dioxide uptake rate (CUR, mmol h‐1) are calcu‐
lated according to equations 4 and 5.
(4)
(5)
The observed biomass yield on light energy (YxEobs, g mol‐1) is defined as gram dry bio‐
mass formed per mol incident photons on the photobioreactor surface according to
equation 6. The photon flux (PFin, mmol h‐1) is calculated using the measured average
photon flux density (PFDin, µmol m‐2 s‐1) and the illuminated photobioreactor area Apbr
(m2) described earlier. We assumed that all consumed carbon is converted into biomass.
The dry biomass C‐molar mass (mbiomass, g mol‐1) was determined as described in the next
paragraph.
(6)
( )( )H2OexpCO2,expO2,
dbCO2,dbO2,ingas,expout,gas, xxx1
xx1nn
−−−−−
⋅=
dbO2,
wbO2,H2O x
x1x −=
100
)x(xnOPR wbO2,expO2,expout,gas, −⋅
=
100
)x(xnCUR wbCO2,expCO2,expout,gas, −⋅
=
in
biomassobsxE PF
mCURY
⋅=

Effect of O2 : CO2 ratio on the primary metabolism of Chlamydomonas reinhardtii
117
Biomass determinations
Cell number and cell size
Cell number and cell size were determined in duplicate with a Beckman Coulter Mul‐
tisizer 3 (Beckman Coulter Inc., Fullerton USA, 50 µm orifice). The samples were diluted
with filtered (0.2 µm) Coulter® Isoton® II dilution buffer to a cell concentration between
1*105 and 3*105 cells mL‐1. The cell number and cell size were used to calculate the total
biovolume.
Dry Weight Determination
Whatman glass microfiber filters (Ø 55 mm, pore size 0.7 µm) were dried at 95°C over‐
night and placed in a desiccator to cool to room temperature. The empty filters were
weighed and pre‐wet with de‐mineralized water. Two grams of sample were diluted with
de‐mineralized water and filtrated under mild vacuum. The filter was rinsed twice with
de‐mineralized water to remove adhering inorganic salts. The wet filters containing the
samples were dried at 95°C overnight, allowed to cool to room temperature in a desicca‐
tor and weighed. The microalgal dry weight of the samples was then calculated from the
difference in weight between the dry filters with and without biomass. Dry weight deter‐
minations were performed in triplicate.
Biomass composition
Liquid samples were centrifuged for 10 min at 1750 rcf and the resulting pellets were
washed three times with de‐mineralized water by re‐suspending and centrifuging and
stored at ‐20°C. Algae pellets stored at ‐20°C were freeze dried and ground to a fine pow‐
der. The freeze dried algae powder was used for all further biomass composition analy‐
ses.
Elemental Composition (C, H, O, N, ash)
C, H and N content were measured in duplicate for each steady state by combustion of
the freeze dried algal powder at 925°C in the oven of an elemental analyzer (EA 1110,
ThermoQuest CE Instruments). Ash content was determined by burning the freeze‐dried
algae samples in an oven at 550°C, so that all organic material was oxidized and the ash
residue remained. From these determinations the O content and subsequently the dry
biomass molar mass (mbiomass, g C‐mol‐1) could be calculated (C, H, O, N and ash) (Duboc
et al. 1999; Gurakan et al. 1990).

Chapter 5
118
Lipids and pigments
Lipid content was determined gravimetrically after extraction of the freeze dried algal
powder with a 5:4 methanol:chloroform mixture. This extraction was described by La‐
mers et al. (2010). The resulting total lipid extract contained all lipid‐like compounds pre‐
sent in the algal cells, including pigments. Therefore the weight of the total lipid extract
had to be corrected for the amount of pigments present. Pigments were determined
spectrophotometrically after dissolving the lipid residue in methanol. The total pigment
content was calculated using absorption equations for chlorophyll in methanol (Porra
2002). The relative fatty acid composition was determined by GC‐analysis according to
the method described by Bosma et al. (2008).
Carbohydrates
Carbohydrates were measured by treating the freeze dried algae powder with a phenol
solution and concentrated sulphuric acid, according to Dubois et al. (1956) and Herbert
et al. (1971). The absorbance of the resulting solution was measured at 483 nm. Pure
glucose was used as a standard.
Protein content and amino acid composition
The nitrogen content of the biomass was determined on a Flash EA 1112 Protein Ana‐
lyzer (Thermo Scientific, Waltham USA). To calculate the amount of protein from the
nitrogen content a N to protein conversion factor of 4.58 ± 0.11 was used (Lourenço et
al. 1998). This factor was determined specifically for several microalgal species at differ‐
ent growth phases.
The relative amino acid composition was determined by Ansynth Service BV (Berkel en
Roodenrijs, The Netherlands), using classical ion‐exchange liquid chromatography with
post‐column ninhydrin derivatisation and photometric detection. Proteins were hydro‐
lyzed by acid hydrolysis prior to column injection. Cysteine, methionine and tryptophan
were determined separately. Cysteine and methionine were measured by oxidation fol‐
lowed by acid hydrolysis, and tryptophan by alkaline hydrolysis followed by reverse
phase HPLC.
Nucleic Acids
The nucleic acids DNA and RNA were not measured directly, but were calculated from
cell number data. From the amount of different nucleotides in Chlamydomonas reinhard‐

Effect of O2 : CO2 ratio on the primary metabolism of Chlamydomonas reinhardtii
119
tii (Merchant et al. 2007) it could be calculated that each cell contains 1.3*10‐13 g DNA
per cell. RNA was assumed to be present in a 28 fold higher concentration than DNA.
Valle et al. (1981) determined this ratio RNA : DNA for Chlamydomonas reinhardtii by
measuring DNA and RNA contents at various cell concentrations, by means of a fluoro‐
metric determination.
Metabolic model and flux balancing
A metabolic network describing the primary metabolism of Chlamydomonas reinhardtii
was constructed as described in (Kliphuis et al. 2010c). The metabolism of an organism
can be described by a set of reaction equations defining the stoichiometric conversion of
substrates into products (Stephanopoulos et al. 1998). The stoichiometry matrix S con‐
tains the stoichiometric coefficients of the substrates and products for the different reac‐
tions in the metabolic network, which also includes the transport reactions over the
membranes. To be able to calculate fluxes, mass balances are written for all the intracel‐
lular metabolites present in the network. Assuming steady state and neglecting the accu‐
mulation of intermediates, this results in the next set of linear equations:
(7)
In which A is the transpose of the stoichiometry matrix S and x is the vector which con‐
tains the reaction rates.
The combination of the model with the measured rates resulted in two redundancy rela‐
tions, a carbon balance and a combined redox/nitrogen balance. Before proceeding with
flux calculations, we checked whether the rates were consistent using the redundancy
relations and a Chi‐square test. Subsequently, when the rates were consistent they were
balanced according to van der Heijden et al. (1994). These balanced rates were then
used as input for the model.
Linear programming/optimization was used to calculate flux distributions according to
equation 8:
(8)
In which c contains the objective function and LB and UB are the lower and upper bound‐
ary of reaction rate x. In this study we used the objective functions ‘minimize light use’
0xA =⋅
UBxLB 0x A :sConstraintx)max(c :functionObjective
≤≤=⋅
⋅
Chapter 5
120
and ‘maximize oxygenase reaction rate’. Constraints were set on transport fluxes de‐
pending on whether a compound was consumed or produced. In case a rate was meas‐
ured, the transport rate was constrained to the measured value. Reactions that are irre‐
versible were constrained to one direction. To solve the underdetermined parts con‐
straints were set in such a way that flux distributions that are thermodynamically impos‐
sible were excluded. Mathcad 14.0 (M020, Parametric Technology Corporation, USA) was
used for network analysis and Matlab (version 6.0.0.88, release 12, The MathWorks Inc.,
USA) was used for in silico simulations.
Results and Discussion
Experiments
To assess the effect of different O2 : CO2 ratios on the metabolism of Chlamydomonas
reinhardtii we performed two separate turbidostat experiments in a SLP photobioreac‐
tor, in which four steady states were studied. In the first experiment (1) the control
steady state in which the culture was sparged with N2 enriched with 2% CO2 was studied.
In the second experiment (2) the two other steady states in which the culture was
sparged with air enriched with either 2% CO2 or 1% CO2 were studied. At the end of this
second experiment the control steady state was repeated to check the reproducibility of
the system.
Figure 5.4 shows the biomass concentration, the oxygen production rate (OPR) and the
carbon dioxide uptake rate (CUR) for the steady states during the second experiment.
Since the control steady states were comparable, only the results of the second experi‐
ment are shown in Figure 5.4. Vertical dotted lines indicate the switch from one condi‐
tion to the next. The fluctuations in the gas data coincide with the cell cycles of the algae
(approx. 24h) and the steady states were therefore taken over multiples of 24 hours
(horizontal bars in Figure 5.4). In this experiment we started by sparging the culture with
air enriched with 2% CO2 until steady state was reached, indicated with a horizontal bar.
Then the concentration CO2 was lowered to 1% in the ingoing gas and the OPR and CUR
decreased. Finally, as stated, we switched back to N2 enriched with 2% CO2 similar to the
steady state in experiment 1 to check whether the experiments were reproducible. Upon
this decrease in O2 and increase in CO2 the OPR and CUR immediately increased. For all
steady states the biomass concentration stayed the same as regulated by the turbidity
control. At steady state the measured dilution rate D was equal to the specific growth
rate µ.

Effect of O2 : CO2 ratio on the primary metabolism of Chlamydomonas reinhardtii
121
The steady state results are summarized in Table 5.2 in which the measured PFDin and
calculated PFDavg for each experiment is given along with the measured specific growth
rate µ (i.e. dilution rate D), dry weight concentration Cx and biomass yield on light energy
YxE (calculated with equation 6) for each steady state. The microalgae are exposed to a
light gradient in the photobioreactor and thus are not continuously exposed to the in‐
coming PFDin. Therefore the spatially averaged PFDavg (equation 1) gives a better meas‐
ure of the light intensity that the microalgae experience and photoinhibition is unlikely
to occur at these light intensities.
The slightly lower growth rate and CUR for the control steady state in the first experi‐
ment (1) compared to the control steady state in the second experiment (2) is due to the
Figure 5.4 Oxygen production rates (OPR), carbon dioxide uptake
rates (CUR) (in mmol h‐1) and dry weight concentrations (in g L‐1) for
a turbidostat experiment with three different steady states. The
vertical dotted lines represent the transitions from one condition to
the next. The horizontal bars indicate the steady states for each
condition. In the OPR and CUR lines some gaps can be seen, indi‐
cated by lowercase letters a and b, which are caused by excess addi‐
tion of antifoam, leading to a disruption in the gas data.

Chapter 5
122
slightly lower PFDin in experiment 1. Apart from this the two control steady states with
N2 and 2% CO2 were similar, which also proves that the experiments are reproducible.
The YxE for the steady states with N2 was around 1.00 g mol‐1. This is high considering
that at very low light intensities (around 80 µmol m‐2 s‐1) we determined a biomass yield
of 1.25 g mol‐1 for C. reinhardtii (Kliphuis et al. 2010c), which seems to approach the
maximal yield for C. reinhardtii. This illustrates the high yield that can be reached with
microalgae cultures under optimal conditions. These optimal conditions are low O2 con‐
centrations and high CO2 concentrations as well as a biomass density at which light can
fully penetrate the culture but is almost completely absorbed. In a previous study
(Kliphuis et al. 2010a) we determined that the highest productivity of a Chlorella so‐
rokiniana culture occurred at the point where all light was almost attenuated when
reaching the quantum sensor at the end of the annular gap. No dark zone had developed
yet and thus there was still light available for all microalgal cells. For this reason we se‐
lected a set‐point for the current turbidostat experiments of 10 µmol m‐2 s‐1, the light
intensity transmitted through the annular gap, and hence no dark zone could develop.
Changing the ingoing gas composition to air with 2% CO2 and subsequently to air with 1%
CO2, thus increasing the O2 : CO2 ratio in the medium, caused a decrease in the specific
growth rate and in the yield of biomass on light. The yield of biomass on light decreased
from 1.0 g mol‐1 for N2 with 2% CO2 to respectively 0.79 and 0.71 g mol‐1 for air with 2%
CO2 and air with 1% CO2. The YxE for the steady states in which air was used are compara‐
ble to the yields found by Takache et al. (2010) for C. reinhardtii. They found a YxE of 0.73
g mol‐1 at a PFDin of 500 µmol m‐2 s‐1 for a culture sparged with air and CO2 on demand as
Table 5.2 Overview of the incoming and average light intensity, specific growth rate µ, dry weight
concentration Cx, average CUR, and biomass yield on light energy YxE for the examined steady
states.
a PFDout was always maintained at 10 µmol m‐2 s‐1 by means of the turbidostat control
Steady state PFDin
(µmol m‐2 s‐1)
PFDavg a
(µmol m‐2 s‐1)
Growth rate µ (h‐1)
Dry weight Cx (g L
‐1)
CUR (mmol h‐1)
Biomass yield YxE (g mol‐1)
N2 + 2% CO2 (1) 606 145 0.092 ± 0.004 1.58 ± 0.06 22.02 ± 0.60 0.97 ± 0.03
N2 + 2% CO2 (2) 635 151 0.100 ± 0.004 1.53 ± 0.05 23.76 ± 0.22 1.00 ± 0.01
Air + 2% CO2 (2) 635 151 0.081 ± 0.004 1.51 ± 0.07 18.98 ± 0.46 0.79 ± 0.02
Air + 1% CO2 (2) 635 151 0.078 ± 0.003 1.52 ± 0.04 16.85 ± 0.17 0.70 ± 0.01

Effect of O2 : CO2 ratio on the primary metabolism of Chlamydomonas reinhardtii
123
pH control. However, Takache et al. used ammonium (NH4+) as N‐source, a more reduced
source than nitrate (NO3‐) which we used in our cultivations. Using a more reduced N‐
source higher biomass yields can be obtained and our biomass yield is thus high com‐
pared to the yield obtained by Takache et al..
Because the light regime was always the same during the turbidostat experiments and
nutrients were supplied in excess, the change in the specific growth rate and the biomass
yield on light energy were only dependent on the O2 : CO2 ratio in the ingoing gas and
thus in the medium.
Modeling
To quantify the effect of the O2 : CO2 ratio on the metabolism of Chlamydomonas
reinhardtii the metabolic flux distribution was calculated for the different steady states.
For this purpose a metabolic network describing the primary metabolism of Chlamydo‐
monas reinhardtii was used, which was constructed as described in (Kliphuis et al. 2010c)
and shown in the Appendix. This model includes the ATP requirements for maintenance
and biomass formation for C. reinhardtii. The light utilization rate rEx,u, CUR, OPR, bio‐
mass formation rate and the biomass composition were used as inputs for the model.
Since the biomass composition may be different for the different steady states, the mac‐
romolecular biomass composition (%w/w) was determined for each steady state. As
shown in Table 5.3 the biomass composition for the different steady states was not sig‐
nificantly different. There seems to be some variation in carbohydrate content between
the steady states, but since only a duplicate measurement was done this is statistically
not significant. The average dry biomass molar mass mbiomass was determined to be 23.08
± 0.16 g mol‐1.
The biomass compositions were used for the model simulations by filling in the molar
biomass composition normalized to 100% in reaction 147 (Appendix A) for each steady
state. The elemental composition of the macromolecules and the biomass for each
steady state are given in Appendix C and D. Since the protein and lipid composition did
not vary significantly between the steady states, both for protein and lipids the average
composition was used in all simulations. These average amino acid and fatty acid compo‐
sitions can be found in Appendix D and E.
For the measured rates there are two balances that need to be closed, being a carbon
balance and a combined nitrogen/redox balance. For all steady states these two bal‐
ances closed. Subsequently the rates were balanced and used as input for the metabolic
model. The balanced rates are shown in Table 5.4.
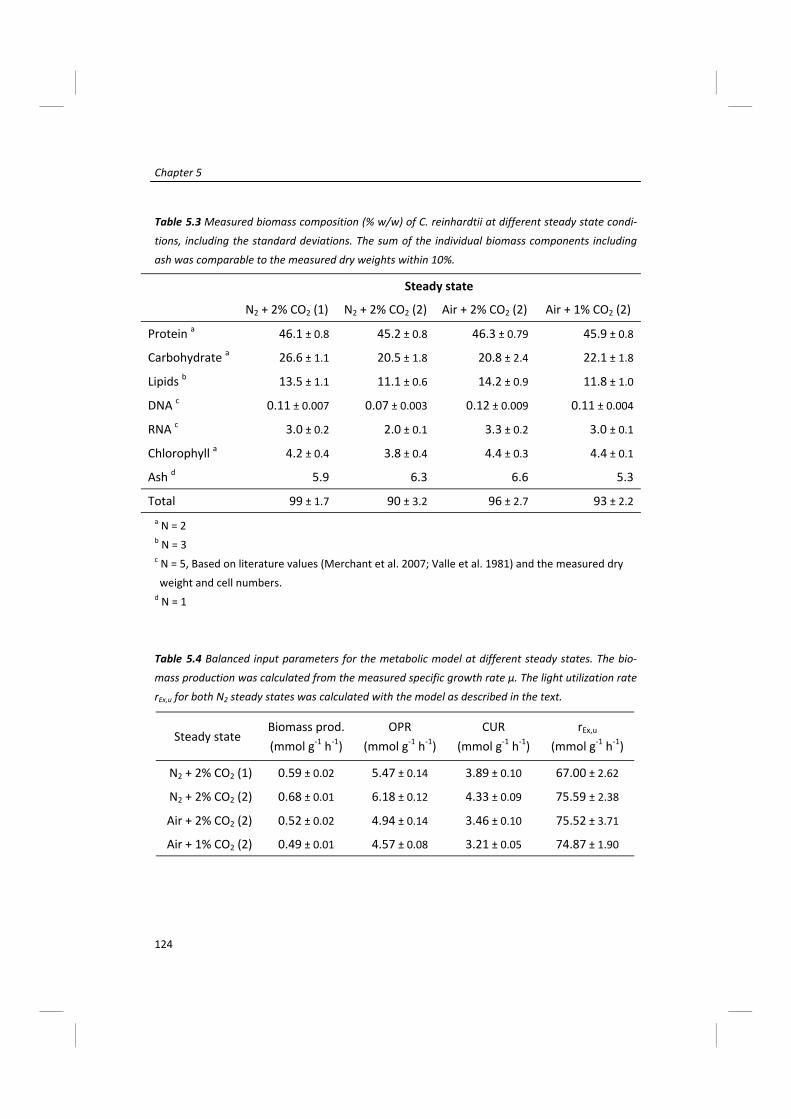
Chapter 5
124
Table 5.3 Measured biomass composition (% w/w) of C. reinhardtii at different steady state condi‐
tions, including the standard deviations. The sum of the individual biomass components including
ash was comparable to the measured dry weights within 10%.
a N = 2 b N = 3 c N = 5, Based on literature values (Merchant et al. 2007; Valle et al. 1981) and the measured dry c weight and cell numbers. d N = 1
Table 5.4 Balanced input parameters for the metabolic model at different steady states. The bio‐
mass production was calculated from the measured specific growth rate µ. The light utilization rate
rEx,u for both N2 steady states was calculated with the model as described in the text.
Steady state
N2 + 2% CO2 (1) N2 + 2% CO2 (2) Air + 2% CO2 (2) Air + 1% CO2 (2)
Protein a 46.1 ± 0.8 45.2 ± 0.8 46.3 ± 0.79 45.9 ± 0.8
Carbohydrate a 26.6 ± 1.1 20.5 ± 1.8 20.8 ± 2.4 22.1 ± 1.8
Lipids b 13.5 ± 1.1 11.1 ± 0.6 14.2 ± 0.9 11.8 ± 1.0
DNA c 0.11 ± 0.007 0.07 ± 0.003 0.12 ± 0.009 0.11 ± 0.004
RNA c 3.0 ± 0.2 2.0 ± 0.1 3.3 ± 0.2 3.0 ± 0.1
Chlorophyll a 4.2 ± 0.4 3.8 ± 0.4 4.4 ± 0.3 4.4 ± 0.1
Ash d 5.9 6.3 6.6 5.3
Total 99 ± 1.7 90 ± 3.2 96 ± 2.7 93 ± 2.2
Steady state Biomass prod. (mmol g‐1 h‐1)
OPR (mmol g‐1 h‐1)
CUR (mmol g‐1 h‐1)
rEx,u (mmol g‐1 h‐1)
N2 + 2% CO2 (1) 0.59 ± 0.02 5.47 ± 0.14 3.89 ± 0.10 67.00 ± 2.62
N2 + 2% CO2 (2) 0.68 ± 0.01 6.18 ± 0.12 4.33 ± 0.09 75.59 ± 2.38
Air + 2% CO2 (2) 0.52 ± 0.02 4.94 ± 0.14 3.46 ± 0.10 75.52 ± 3.71
Air + 1% CO2 (2) 0.49 ± 0.01 4.57 ± 0.08 3.21 ± 0.05 74.87 ± 1.90

Effect of O2 : CO2 ratio on the primary metabolism of Chlamydomonas reinhardtii
125
Even at low light intensities not all light is taken up by the photosystem and the maxi‐
mum efficiency of the photosystems (ΦPmax) is 0.8, which corresponds to a quantum re‐
quirement of oxygen evolution of 10 (instead of 8 according to the Z‐scheme). This is in
accordance with measurements of the quantum requirement under ideal low‐light con‐
ditions for a variety of organisms using a variety of experimental techniques (Bjorkman
and Demmig 1987; Dubinsky et al. 1986; Emerson and Lewis 1943; Evans 1987; Ley and
Mauzerall 1982; Malkin and Fork 1996; Tanada 1951). Since the experiments in this study
are done at higher light intensities the efficiency with which light is used is probably
lower than 0.8. Thus, to calculate the light utilization rate, which is used as an input for
the model, first the efficiency factor for these experiments must be calculated. The dupli‐
cate control steady states with N2 and 2% CO2 were used to determine this efficiency of
light use, i.e. the amount of light that was utilized by the photosystem of the algae to
form biomass with growth rate µ for that steady state. In the case of these steady states
we assume that the O2 : CO2 ratio is so low that the rate of the oxygenase reaction ap‐
proaches zero and photorespiration does not occur. The specific light utilization rate rEx,u
was calculated by constraining all measured rates and minimizing the light reaction
(reaction 0 in the Appendix). The obtained light uptake rate (reaction 155) represents the
minimal rEx,u that was necessary to form the measured amount of biomass. This value
was less than the light supplied to the microalgal culture per gram dry weight, rEx, since
not all light was used efficiently by the microalgal photosystems. By comparing the spe‐
cific light utilization rate rEx,u with the specific light supply rate rEx the photochemical
quantum yield Φp could be determined according to equation 9. This photochemical
quantum yield Φp is a measure for the efficiency of light use of the microalgae in these
turbidostat experiments.
(9)
In which PFDin is the measured incoming photon flux density for that experiment (here in
mmol m‐2 h‐1), Apbr is the illuminated photobioreactor area (m‐2), Cx is the steady state
biomass concentration (g L‐1) and Vpbr is the working volume of the photobioreactor (L).
Table 5.4 shows the rEx,u as calculated with the model for both control steady states. The
difference in these specific values is caused by the differences in PFDin and Cx (Table 5.2)
between both steady states but this eventually translates in similar photochemical quan‐
tum yields. For the first control steady state (1) the Φp was 0.70 and for the second con‐
pbrx
pbrinpExpuEx, VC
APFDΦrΦr
⋅
⋅⋅=⋅=

Chapter 5
126
trol steady state (2) the Φp was 0.72. This means that on average 71% of the light was
used efficiently and the rest was dissipated as heat or fluorescence. This value is quite
high considering the maximum value of 80%, which was obtained at much lower light
intensities than used here. This confirms that photorespiration, photoinhibition and the
Mehler reaction do not, or hardly occur under these conditions, since these would result
in a lower efficiency.
Because the experiments were done in turbidostat mode, the biomass concentration
was more or less constant for all steady states and thus the amount of light supplied per
gram dry weight was constant. Therefore it can be safely assumed that Φp is also con‐
stant for all steady states and for the calculation of the specific light utilization rate for
the other steady states, the average of these two values, 0.71 was used. Furthermore,
since only the O2 : CO2 ratio changes we assume that photorespiration is the main cause
for the decrease in the biomass yield on light energy.
With the calculated Φp the rEx,u could be calculated for the other steady states in which
air was used (Table 5.4) by multiplying with the specific light supply rate for those steady
states. Again the variation in these biomass specific values is due to the small variation in
Cx between steady states. To calculate the flux through photorespiration for the steady
states with air, the rEx,u (light uptake rate, reaction 155), specific carbon and oxygen pro‐
duction rate and the biomass production rate (calculated from the growth rate µ, reac‐
tion 147) were constrained to their measured, balanced values. Subsequently, the flux
through the oxygenase reaction of Rubisco (reaction 91) was maximized. Because the
light utilization rate was the same for all steady states the amount of energy (ATP) gener‐
ated in all conditions was also the same. Since at higher O2 : CO2 ratios less biomass was
formed, less energy was needed for biomass formation and there was an excess of en‐
ergy in these steady states. By maximizing the flux through the oxygenase reaction all
this ‘excess’ ATP generated from light which was not necessary to form biomass will be
consumed in the photorespiratory pathway. Thus, for each steady state the rate through
the oxygenase reaction and thus the rate of photorespiration responsible for the ob‐
served decrease in biomass yield on light was calculated, as well as the fluxes through
the rest of the metabolism.
Figure 5.5 (separate figure sheet) shows the flux distribution through the metabolic net‐
work for steady states N2 + 2% CO2 (2) (red boxes) and air + 2% CO2 (2) (black boxes). The
flux through the light reaction of photosynthesis (reaction 0) is almost equal for both

Effect of O2 : CO2 ratio on the primary metabolism of Chlamydomonas reinhardtii
127
situations because the specific light utilization rate is similar for all steady states as ex‐
plained before. The fluxes through the carboxylase and the oxygenase reaction of
Rubisco are shown in the chloroplast for both situations. In the steady state with N2 the
flux through the oxygenase reaction and the subsequent reactions to Glycerate 3‐
phosphate are zero as assumed. At air with 2% CO2 the flux through the oxygenase reac‐
tion increases to 1.45 mmol g‐1 h‐1. At the same time the flux through the carboxylase
reaction decreases from 9.45 to 8.72 mmol g‐1 h‐1. Furthermore, the ‘lost’ NH4+ needs to
be re‐fixed in the metabolism, causing an increase in the flux to Glutamate (reaction 58)
from 0.76 to 1.31 mmol g‐1 h‐1. Finally, since the growth rate is lower for this steady state
fluxes for the biosynthesis of biomass components decrease.
The ratio between the carboxylase reaction and the oxygenase reaction is given in Table
5.5 alongside the O2 and CO2 concentrations in the medium for all steady states. These
medium concentrations were calculated with the method described by Royce and Thorn‐
hill (1991). This method is based on the measured OPR and dissolved oxygen (DO) con‐
centration to calculate the mass transfer coefficient for O2 and subsequently CO2, fol‐
lowed by the calculation of the dissolved carbon dioxide concentration. The ratio be‐
tween the carboxylase reaction and the oxygenase reaction gives the amount of photo‐
respiration for each steady state. When switching from N2 with 2% CO2 to air with 2%
CO2 the oxygen concentration increases about threefold and the O2 : CO2 ratio increases
twofold, coinciding with an increase in photorespiration to 16.5%. When the concentra‐
tion CO2 is decreased from 2% to 1% in the ingoing gas the O2 concentration slightly de‐
creases to 305 mM. Due to the strong decrease in CO2 concentration the ratio of O2 : CO2
again increases twofold. However, this results in only a small additional increase in
Steady state [O2]ol
(µmol L‐1)
[CO2]ol (µmol L‐1)
Ratio O2 : CO2
% photorespiration
N2 + 2% CO2 (1) 141 460 1 : 3.3 ‐
N2 + 2% CO2 (2) 142 451 1 : 3.2 ‐
Air + 2% CO2 (2) 329 527 1 : 1.6 16.5 ± 5.5
Air + 1% CO2 (2) 305 217 1 : 0.7 20.5 ± 2.9
Table 5.5 Dissolved oxygen concentrations ([O2]ol), dissolved carbon dioxide concentrations ([CO2]ol)
and the ratio of dissolved O2 : CO2 at each steady state. The amount of photorespiration was calcu‐
lated with the metabolic model as the ratio of the oxygenase reaction to the carboxylase reaction
rate of Rubisco.
Chapter 5
128
photorespiration from 16.5% to 20.5%. The fact that this additional increase in photores‐
piration is so small could be explained from the fact that the concentrations for O2 and
CO2 are medium concentrations, which very well may not be representative for the con‐
centrations near Rubisco. The carbon concentrating mechanism (CCM) which C. reinhard‐
tii possesses could keep the CO2 concentration near Rubisco high and reduce the oxy‐
genase flux. Although according to Ghoshal and Goyal (2001) and Ogren (1984) the CCM
is probably not induced at the CO2 concentrations used here, their findings were based
on the CO2 concentration in the ingoing gas and not on the dissolved CO2 concentrations
in the culture broth. Therefore, we cannot exclude the presence and activity of a CCM
which could explain the smaller effect of decreased CO2 concentrations compared to
increased O2 concentrations.
The calculated photorespiration rates are realistic values (Hoefnagel et al. (1998) reports
20 ‐ 35% photorespiration under normal conditions), showing that photorespiration can
indeed explain the reduction in biomass yield on light. However, this is based on the as‐
sumption that the Mehler reaction and photoinhibition do not occur. Although at the
used conditions of average light intensities and high growth rates this assumption is justi‐
fied, knowledge on when these processes occur in C. reinhardtii is still limited. Therefore,
it remains to be validated that only photorespiration was responsible for the observed
decrease in specific growth rate. Despite this remaining uncertainty, this metabolic flux
model gives insight in the metabolism of C. reinhardtii at higher O2 : CO2 ratios and quan‐
tifies photorespiration and its implications of on the biomass yield on light energy of the
microalgae.
Conclusion
In conclusion, this study shows that elevated oxygen concentrations and the correspond‐
ing increase in the ratio of O2 versus CO2 common in photobioreactors leads to a reduc‐
tion of the biomass yield on light of the microalgae Chlamydomonas reinhardtii. A reduc‐
tion in yield of 20% was already observed at conditions common in photobioreactors (air
with 2% CO2). Using metabolic flux modeling with measured rates for each steady state
we were able to quantify the ratio of the oxygenase reaction to the carboxylase reaction
of Rubisco. This showed that the observed decrease in yield can be explained from an
increase in oxygenase activity of Rubisco and the resulting process of photorespiration,
up to 20.5% of the carboxylase activity.

Effect of O2 : CO2 ratio on the primary metabolism of Chlamydomonas reinhardtii
129
Nomenclature
µ Specific growth rate (h‐1)
ΦP Photochemical quantum yield (‐)
ΦPmax Maximum photochemical quantum yield (‐)
Apbr Illuminated photobioreactor area (m2)
CUR Carbon dioxide uptake rate (mmol h‐1)
Cx Biomass concentration (dry weight) in the photobioreactor (g L‐1)
D Dilution rate (h‐1)
Km affinity constant for carbon dioxide (µmol L‐1)
mbiomass Measured C‐molar mass of dry biomass (C, H, O, N and ash) (g C‐mol‐1)
N Number of measurements (‐)
ngas,in Total molar gas flow going into the reactor (mmol h‐1)
ngas,out,exp Total molar gas flow going out of the reactor corrected for moisture con‐
tent and volume change (mmol h‐1)
OD530 Optical density measured at 530 nm on a spectrophotometer (‐)
OPR Oxygen production rate (mmol h‐1)
PAR Photosynthetic active radiation, all photons between 400 and 700 nm (‐)
PFDavg Spatially averaged light intensity (µmol m‐2 s‐1)
PFDin Incoming photon flux density (µmol m‐2 s‐1)
PFDout Photon flux density falling through the culture (µmol m‐2 s‐1)
PFin Photon flux on the surface of the photobioreactor (mmol h‐1)
PQ Photosynthetic quotient (‐)
rEx Specific light supply rate (mmol g‐1 h‐1)
rEx,u Specific light utilization rate (mmol g‐1 h‐1)
Vpbr Photobioreactor volume (L)
xCO2,db Molar fraction of CO2 in dry baseline (‐)
xCO2,exp Molar fraction of CO2 in experimental gas data (‐)
xCO2,wb Molar fraction of CO2 in wet baseline (‐)
xH2O Molar fraction of moisture in the gas (‐)
xO2,db Molar fraction of O2 in dry baseline (‐)
xO2,exp Molar fraction of O2 in experimental gas data (‐)
xO2,wb Molar fraction of O2 in wet baseline (‐)
YxEobs Observed experimental biomass yield on light energy (g mol‐1)
Chapter 5
130
Appendix
A. Metabolic model of Chlamydomonas reinhardtii
Arrows indicate the direction and reversibility of the reactions. The compounds in the chloroplast are notated with a ‘c’ before the abbreviation. All fluxes are in mmol g‐1 h‐1. The flux through reaction 57, the ATP requirement for maintenance, was set to 2.582 mmol g‐1 h‐1 as determined for C. reinhardtii in a previous study (Kliphuis et al. 2010c). The factor (given by x) in the biomass export reaction (159) converts the biomass flux through reaction 147 (in mmol g‐1 h‐1) to mg g‐1 h‐1, the biomass production rate. The amount of macromolecule (given by lowercase letters) to produce one mol of biomass in reaction 147 depends on the biomass composition for each steady state. Light reaction 0 8 Light + 3 ADP + 3 Pi + H[+] + 2 cNADP O2 + H2O + 2 cNADPH + 3 ATP Calvin cycle 1 CO2 + H2O + cRu15DP 2 cG3P 2 ATP + cG3P ADP + H[+] + c13DPG 3 H[+] + cNADPH + c13DPG cNADP + Pi + cGAP 4 cGAP cDHAP 5 cDHAP + cGAP cF16P 6 H2O + cF16P Pi + cF6P 7 cF6P + cGAP cE4P + cX5P 8 H2O + cE4P + cGAP Pi + cS7P 9 cGAP + cS7P cR5P + cX5P 10 cX5P cRu5P 11 cR5P cRu5P 12 ATP + cRu5P ADP + H[+] + cRu15DP Transport chloroplast to cytosol 13 cDHAP DHAP Glycolysis 14 G6P G1P 15 F6P G6P 16 ATP + F6P ADP + F16P + H[+] 17 F16P + H2O F6P + Pi 18 DHAP + GAP F16P 19 DHAP GAP 20 GAP + NAD+Pi 13DPG + H[+] + NADH 21 13DPG + ADP 3PG + ATP 22 3PG 2PG 23 2PG H2O + PEP 24 ADP + H[+] + PEP ATP + PYR Tricarboxylic acid cycle 25 CoA + NAD + PYR AcCoA + CO2 + NADH 26 AcCoA + H2O + OXA CIT + CoA + H[+] 27 CIT + NAD AKG + CO2 + NADH

Effect of O2 : CO2 ratio on the primary metabolism of Chlamydomonas reinhardtii
131
28 AKG + CoA + NAD CO2 + NADH + SUCCoA 29 ADP + Pi + SUCCoA ATP + CoA + SUC 30 FAD + SUC FADH2 + FUM 31 FUM + H2O MAL 32 FAD + MAL FADH2 + OXA 33 ATP + CO2 + H2O + PYR ADP + OXA + Pi + 2 H[+] 34 ATP + OXA ADP + CO2 + PEP 35 CO2 + H2O + PEP H[+] + OXA + Pi Pentose phosphate pathway 36 G6P + H2O + NADP 6PG + NADPH + 2 H[+] 37 6PG + NADP CO2 + NADPH + RU5P 38 RU5P R5P 39 RU5P X5P 40 R5P + X5P GAP + S7P 41 GAP + S7P E4P + F6P 42 F6P + GAP E4P + X5P Glycerol 43 DHAP + H2O DHA + Pi 44 DHA + H[+] + NADPH GLYC + NADP 45 ATP + GLYC ADP + GLYC3P + H[+] 46 GLYC3P + NAD DHAP + H[+] + NADH N and S fixation 47 H[+] + NADH + NO3 H2O + NAD + NO2 48 5 H[+] + 3 NADPH + NO2 NH4[+] + 2 H2O + 3 NADP 49 ATP + SO4 APS + PPi 50 APS + NADH AMP + NAD + SO3 51 5 H[+] + 3 NADPH + SO3 H2S + 3 H2O + 3 NADP Oxidative phosphorylation 52 1.5 ADP + 1.5 H[+] + 1.5 Pi + FADH2 + 0.5 O2 FAD + 1.5 ATP + 2.5 H2O 53 3.5 H[+] + 2.5 ADP + 2.5 Pi + NADH + 0.5 O2 NAD + 2.5 ATP + 3.5 H2O 54 NAD + NADPH NADH + NADP 55 H2O + PPi H[+] + 2 Pi 56 AMP + ATP 2 ADP 57 ATP + H2O ADP + H[+] + Pi Amino acids and protein 58 AKG + H[+] + NADPH + NH4[+] GLU + H2O + NADP 59 ATP + GLU + NH4[+] ADP + GLN + H[+] + Pi 60 AKG + GLN + H[+] + NADPH NADP + 2 GLU 61 3PG + GLU + H2O + NAD AKG + H[+] + NADH + Pi + SER 62 SER NH4[+] + PYR 63 AcCoA + H2S + SER Ace + CYS + CoA + H[+] 64 ATP + Ace + CoA ADP + AcCoA + Pi 65 GLU + PYR AKG + ALA 66 H[+] + THR 2‐oxobutan + NH4[+] 67 2‐oxobutan + GLU + H[+] + NADPH + PYR AKG + CO2 + H2O + ILE + NADP

Chapter 5
132
68 2 H[+] + ALA + NADPH + PYR CO2 + H2O + NADP + VAL 69 2 PYR + AcCoA + GLU + H[+] + NAD + NADPH AKG + CoA + LEU + NADH + NADP + 2 CO2 70 2 PEP + ATP + E4P + NADPH ADP + CHO + NADP + 4 Pi 71 CHO PRE 72 GLU + H[+] + PRE AKG + CO2 + H2O + PHE 73 GLU + NAD + PRE AKG + CO2 + NADH + TYR 74 CHO + GLN ANTH + GLU + H[+] + PYR 75 ANTH + H[+] + PRPP + SER CO2 + GAP + PPi + TRYP + 2 H2O 76 3 H2O + 2 NAD + ATP + GLN + PRPP AICAR + AKG + HIS + Pi + 2 NADH + 2 PPi + 5 H[+] 77 GLU + OXA AKG + ASP 78 ASP + ATP + GLN + H2O ADP + ASN + GLU + H[+] + Pi 79 2 ATP + 2 H2O + CO2 + GLN CaP + GLU + Pi + 2 ADP + 3 H[+] 80 2 GLU + ASP + ATP + CaP + NADH AKG + AMP + ARG + FUM + H2O + NAD + PPi + Pi 81 3 H[+] + 2 NADH + GLU PRO + 2 H2O + 2 NAD 82 AKG + O2 + PRO CO2 + HydPro + SUC 83 ASP + ATP + H[+] + NADPH ADP + ASA + NADP + Pi 84 2 H[+] + ASA + GLU + NADH + PYR AKG + DAP + H2O + NAD 85 DAP CO2 + H[+] + LYS 86 ASA + H[+] + NADPH HSER + NADP 87 ATP + H2O + HSER ADP + H[+] + Pi + THR 88 AcCoA + CYS + H2O + HSER Ace + CoA + HCYS + H[+] + NH4[+] + PYR 89 HCYS + MTHF H[+] + MET + THF 90 4.306 ATP + 3.306 H2O + 0.111 ALA + 0.092 GLY + 0.09 LEU + 0.061 VAL + 0.06 LYS + 0.056
PRO + 0.056 THR + 0.054 SER + 0.052 ARG + 0.052 GLN + 0.052 GLU + 0.047 ASN + 0.047 ASP + 0.041 PHE + 0.037 ILE + 0.03 TYR + 0.024 MET + 0.017 HIS + 0.012 CYS + 0.009 HydPro + 0.001 TRYP PROTEIN + 4.306 ADP + 4.306 Pi + 4.319 H[+]
Photorespiration 91 H2O + NAD + O2 + cRu15DP H[+] + NADH + Pi + cG3P + glyoxylate 92 GLY + H[+] + PYR ALA + glyoxylate 93 SER + glyoxylate GLY + HydPyr 94 GLY + H2O + METHF SER + THF 95 GLY + NAD + THF CO2 + METHF + NADH + NH4[+] 96 H[+] + HydPyr + NADH Glycerate + NAD 97 ATP + Glycerate ADP + 2 H[+] + 3PG THF metabolism 98 ATP + R5P AMP + H[+] + PRPP 99 5FTHF + H[+] H2O + MYLTHF 100 H2O + MYLTHF H[+] + N10FTHF 101 ATP + FORM + THF ADP + N10FTHF + Pi 102 MYLTHF + NADPH METHF + NADP 103 H[+] + METHF + NADPH MTHF + NADP 104 5FTHF + ATP + H2O ADP + H[+] + N10FTHF + Pi 105 FORM + H[+] + THF H2O + N10FTHF 106 DHF + H[+] + NADPH NADP + THF Lipids (phosphatidic acid) 107 ACP + AcCoA + H[+] AcACP + CoA 108 ATP + AcCoA + CO2 + H2O ADP + H[+] + MalCoA + Pi

Effect of O2 : CO2 ratio on the primary metabolism of Chlamydomonas reinhardtii
133
109 ACP + MalCoA CoA + MalACP 110 10 H[+] + 10 NADPH + 5 MalACP + AcACP C12:0ACP + 5 ACP + 5 CO2 + 5 H2O + 10 NADP 111 12 H[+] + 12 NADPH + 6 MalACP + AcACP C14:0ACP + 6 ACP + 6 CO2 + 6 H2O + 12 NADP 112 14 H[+] + 14 NADPH + 7 MalACP + AcACP C16:0ACP + 7 ACP + 7 CO2 + 7 H2O + 14 NADP 113 C160ACP + H[+] + NADH + O2 C16:1ACP + NAD + 2 H2O 114 C161ACP + H[+] + NADH + O2 C16:2ACP + NAD + 2 H2O 115 C162ACP + H[+] + NADH + O2 C16:3ACP + NAD + 2 H2O 116 16 H[+] + 16 NADPH + 8 MalACP + AcACP C18:0ACP + 8 ACP + 8 CO2 + 8 H2O + 16 NADP 117 C180ACP + H[+] + NADH + O2 C18:1ACP + NAD + 2 H2O 118 C181ACP + H[+] + NADH + O2 C18:2ACP + NAD + 2 H2O 119 C182ACP + H[+] + NADH + O2 C18:3ACP + NAD + 2 H2O 120 GLYC3P + 0.474 C16:0ACP + 0.446 C18:3ACP + 0.276 C18:2ACP + 0.253 C16:3ACP + 0.16
C18:1ACP + 0.148 C16:2ACP + 0.104 C12:0ACP + 0.051 C14:0ACP + 0.048 C18:0ACP + 0.04 C16:1ACP PA + 2 ACP + 2 H[+]
Nucleic acids 121 4 ATP + 2 GLN + 2 H2O + ASP + CO2 + GLY + N10FTHF + PRPP AICAR + FUM + PPi + THF +
2 GLU + 4 ADP + 4 Pi + 7 H[+] 122 ASP + CaP + H[+] + O2 + PRPP CO2 + H2O + H2O2 + PPi + Pi + UMP 123 2 H2O2 O2 + 2 H2O 124 ATP + UMP ADP + UDP 125 ATP + UDP ADP + UTP 126 ATP + GLN + H2O + UTP ADP + CTP + GLU + Pi + 2 H[+] 127 ATP + CDP ADP + CTP 128 AICAR + N10FTHF H2O + IMP + THF 129 ATP + H2O + IMP + NAD + NH4[+] AMP + GMP + NADH + PPi + 3 H[+] 130 ATP + GMP ADP + GDP 131 ATP + GDP ADP + GTP 132 ASP + GTP + IMP AMP + FUM + GDP + Pi + 2 H[+] 133 ATP + H[+] + METHF + NADPH + UDP ADP + DHF + H2O + NADP + dTTP 134 ATP + CDP + H[+] + NADPH ADP + H2O + NADP + dCTP 135 ATP + GDP + H[+] + NADPH ADP + H2O + NADP + dGTP 136 ATP + H[+] + NADPH H2O + NADP + dATP 137 2.372 H2O + 1.372 ATP + 0.18 dATP + 0.18 dTTP + 0.32 dCTP + 0.32 dGTP DNA + PPi +
1.372 ADP + 1.372 Pi + 2.372 H[+] 138 1.4 H2O + 0.56 ATP + 0.34 GTP + 0.16 UTP + 0.34 CTP 0.4 ADP + 0.4 H[+] + 0.4 Pi + PPi +
RNA Chlorophyll 139 12 H[+] + 8 ATP + 8 GLU + 8 NADPH + 2.5 O2 PPorphyrin + 4 NH4[+] + 6 CO2 + 8 AMP + 8
NADP + 8 PPi + 13 H2O 140 18 H[+] + 15 NADPH + 8 ATP + 4 GAP + 4 PYR Phytyl‐PP + 4 ADP + 4 AMP + 4 CO2 + 7 PPi
+ 8 H2O + 15 NADP 141 ATP + H2O + MET AdMET + H[+] + PPi + Pi 142 AdHCYS + H2O Ad + HCYS 143 ATP + Ad ADP + AMP + H[+] 144 4 NADPH + 2.5 O2 + 2 ATP + AdMET + Mg2[+] + PPorphyrin + Phytyl‐PP AdHCYS + Chlorophyll + PPi + 2 ADP + 2 H2O + 2 Pi + 3 H[+] + 4 NADP

Chapter 5
134
Starch and carbohydrates 145 G1P Pi + STARCH 146 G1P CARB + Pi Biomass formation 147 18.8996 ATP + 18.8996 H2O + a PROTEIN + b CARB + c PA + d RNA + e Chlorophyll + f DNA
Biomass + g H[+] + 18.8996 ADP + 18.8996 Pi Transport 148 CO2 CO2_ex 149 O2 O2_ex 150 H2O H2O_ex 151 Pi Pi_ex 152 SO4 SO4_ex 153 NO3 NO3_ex 154 Mg2[+] Mg2[+]_ex 155 Light Light_ex 156 H[+] H[+]_ex 157 GLYC GLYC_ex 158 STARCH STARCH_ex 159 Biomass x Biomass_ex
B. Compound abbreviations 13DPG 1,3‐diPhosphoglycerate 2‐oxobutan 2‐Oxobutanoate 2PG 2‐Phosphoglycerate 3PG 3‐Phosphoglycerate 5FTHF 5‐Formyl‐THF 6PG 6‐Phosphogluconate AcACP Acetyl‐ACP AcCOA Acetyl‐CoA Ace Acetate ACP Acetyl‐carrier protein Ad Adenosine AdHCYS S‐Adenosyl‐L‐homocysteine AdMET S‐Adenosyl‐L‐methionine ADP Adenosine diphosphate AICAR 5‐Aminoimidazole‐4‐
carboxamide ribonucleine AKG 2‐Oxoglutarate (alpha‐
ketoglutarate) ALA Alanine AMP Adenosine monophosphate ANTH Anthranilate APS Adenylyl sulfate ARG Arginine ASA L‐Aspartic semialdehyde ASN Asparagine ASP Aspartate
ATP Adenosine triphosphate Biomass Biomass Biomass_ex Biomass (g) C12:0ACP Dodecanoyl‐ACP (Lauric acid) C14:0ACP Tetradecanoyl‐ACP (Myristic
acid) C16:0ACP Hexadecanoyl‐ACP (Palmitic
acid) C16:1ACP Trans‐Hexadec‐2‐enoyl‐ACP
(Palmitoleic acid) C16:2ACP Hexadecadienoic acid C16:3ACP Hexadecatrienoic acid C18:0ACP Octadecanoyl‐ACP (Stearic acid) C18:1ACP Cis‐11‐ocadecanoate‐ACP (Oleic
acid) C18:2ACP Linoleic acid C18:3ACP Alpha‐linoleic acid CaP Carbamoyl phosphate CARB Carbohydrate CDP Cytidine diphosphate Chlorophyll Chlorophyll CHO Chorismate CIT Citrate CO2 Carbon dioxide CO2_ex Carbon dioxide (extracellular) CoA Coenzyme A

Effect of O2 : CO2 ratio on the primary metabolism of Chlamydomonas reinhardtii
135
CTP Cytidine triphosphate CYS Cysteine DAP Diaminopimelate dATP Deoxy ATP dCTP Deoxy CTP dGTP Deoxy GTP DHA Dihydroxyacetone (Glycerone) DHAP Dihydroxyacetone‐P DHF Dihydrofolate DNA Deoxyribonucleic acid dTTP Deoxy TTP E4P Erythrose 4‐phosphate F16P Fructose 1,6‐bisphosphate F6P Fructose 6‐phosphate FAD Flavin adenine dinucleotide
oxidized FADH2 Flavin adenine dinucleotide
reduced FORM Formic acid FUM Fumarate G1P Glucose 1‐phosphate G6P Glucose 6‐phosphate GAP Glyceraldehyde 3‐phosphate GDP Guanosine diphosphate GLN Glutamine GLU Glutamate GLY Glycine GLYC Glycerol GLYC3P Glycerol 3‐phosphate Glycerate Glycerate GLYC_ex Glycerol (extracellular) glyoxylate Glyoxylate GMP Guanosine monophosphate GTP Guanosine triphosphate H[+] Proton H[+]_ex Proton (extracellular) H2O Water H2O2 Hydrogen peroxide H2O_ex Water (extracellular) H2S Hydrogen sulfide HCYS Homocysteine HIS Histidine HSER Homoserine HydPro Hydroxyproline HydPyr 3‐Hydroxypyruvate ILE Isoleucine IMP Inosine monophosphate LEU Leucine Light Photons Light_ex Photons (extracellular)
LYS Lysine MAL Malate MalCoA Malonyl‐CoA MET Methionine METHF 5,10‐Methylene‐THF Mg2[+] Magnesium Mg2[+]_ex Magnesium (extracellular) MTHF Methyl‐THF MYLTHF 5,10‐Methenyl‐THF N10FTHF 10‐Formyl‐THF NAD Nicotinamide oxidized NADH Nicotinamide reduced NADP Nicotinamidephosphate oxidized NADPH Nicotinamidephosphate reduced NH4[+] Ammonium NH4[+]_ex Ammonium (extracellular) NO2 Nitrite NO3 Nitrate NO3_ex Nitrate (extracellular) O2 Oxygen O2_ex Oxygen (extracellular) OXA Oxaloacetate PA Phosphatidic acid PEP Phosphoenolpyruvate PHE Phenylalanine Phytyl‐PP Phytyl‐diphosphate Pi Orthophosphate Pi_ex Orthophosphate (extracellular) PPi Pyrophosphate PPorphyrin Protoporphyrine PRE Prephanate PRO Proline PROTEIN Protein PRPP Phosphorybosylpyrophosphate PYR Pyruvate R5P Ribose 5‐phosphate RNA Ribonucleic acid Ru15DP Ribulose 1,5‐bisphosphate RU5P Ribulose 5‐phosphate S7P Sedoheptulose 7‐phosphate SER Serine SO3 Sulphite SO4 Sulphate SO4_ex Sulphate (extracellular) STARCH Starch STARCH_ex Starch (extracellular) SUC Succinate SUCCoA Succinyl Coenzyme A THF Tetrahydrofolate THR Threonine

Chapter 5
136
TRYP Tryptophan TYR Tyrosine UDP Uridine diphosphate UMP Uridine monophosphate
UTP Uridine triphosphate VAL Valine X5P Xylulose 5‐phosphate
C. Elemental composition of macromolecules
The composition is given for one mol of macromolecule. D. Protein composition
C H O N P S Charge
Protein 4.77 7.58 1.45 1.35 0 0.04 ‐
Carbohydrates 6 10 5 0 0 0 ‐
Lipids (PA) 36.34 63.39 8 0 1 0 ‐2
DNA 9.68 12.18 7 3.82 1 0 ‐2
RNA 9.50 12.84 8 3.84 1 0 ‐1
Chlorophyll 55 72 5 4.00 0 0 ‐
Amino Acid % (mol AA/mol protein) Alanine (Ala) 11.07 ± 0.03 Arginine (Arg) 5.16 ± 0.01 Asparagine (Asn) 4.66 ± 0.02 Aspartate (Asp) 4.66 ± 0.02 Cysteine (Cys) 1.19 ± 0.02 Glutamate (Glu) 5.17 ± 0.03 Glutamine (Gln) 5.17 ± 0.03 Glycine (Gly) 9.23 ± 0.03 Histidine (His) 1.69 ± 0.01 Hydroxyproline (HydPro) 0.94 ± 0.05 Isoleucine (Ile) 3.69 ± 0.02 Leucine (Leu) 8.96 ± 0.02 Lysine (Lys) 6.04 ± 0.05 Methionine (Met) 2.42 ± 0.04 Phenylalanine (Phe) 4.12 ± 0.02 Proline (Pro) 5.62 ± 0.02 Serine (Ser) 5.42 ± 0.02 Threonine (Thr) 5.59 ± 0.02 Tryptophan (Trp) 0.10 ± 0.00 Tyrosine (Tyr) 2.98 ± 0.02 Valine (Val) 6.14 ± 0.03
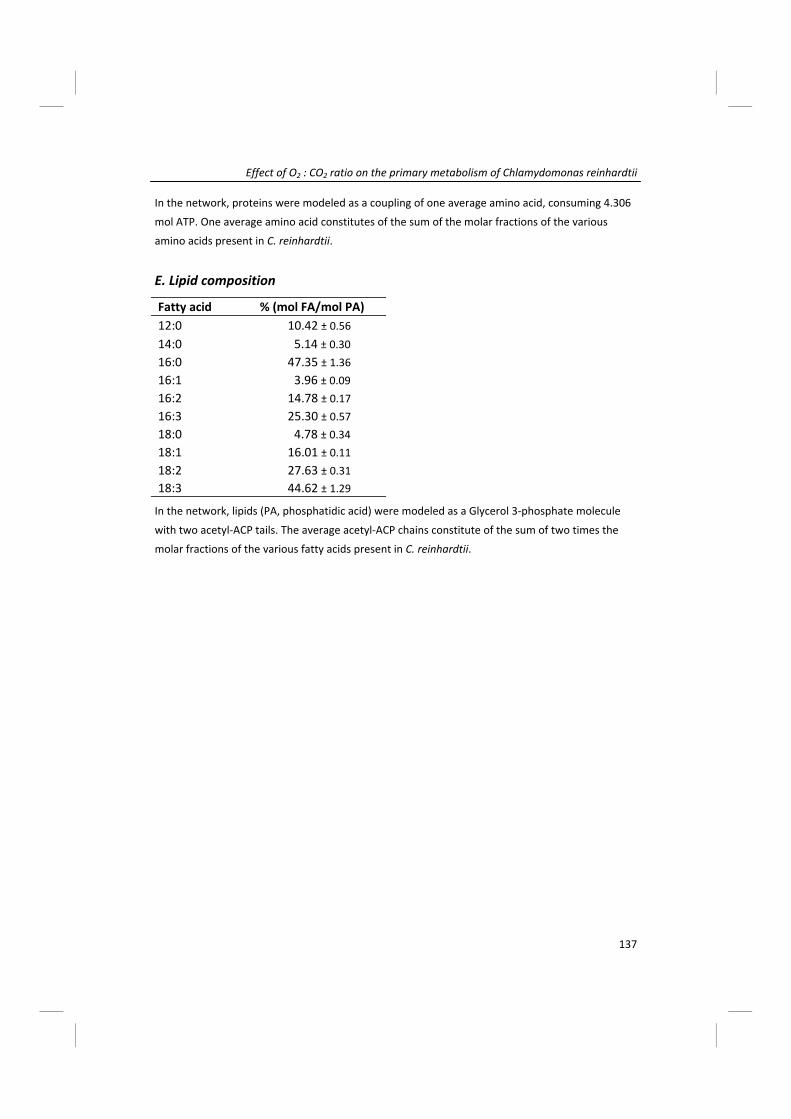
Effect of O2 : CO2 ratio on the primary metabolism of Chlamydomonas reinhardtii
137
In the network, proteins were modeled as a coupling of one average amino acid, consuming 4.306
mol ATP. One average amino acid constitutes of the sum of the molar fractions of the various
amino acids present in C. reinhardtii.
E. Lipid composition
In the network, lipids (PA, phosphatidic acid) were modeled as a Glycerol 3‐phosphate molecule
with two acetyl‐ACP tails. The average acetyl‐ACP chains constitute of the sum of two times the
molar fractions of the various fatty acids present in C. reinhardtii.
Fatty acid % (mol FA/mol PA) 12:0 10.42 ± 0.56 14:0 5.14 ± 0.30 16:0 47.35 ± 1.36 16:1 3.96 ± 0.09 16:2 14.78 ± 0.17 16:3 25.30 ± 0.57 18:0 4.78 ± 0.34 18:1 16.01 ± 0.11 18:2 27.63 ± 0.31 18:3 44.62 ± 1.29


Chapter
Discussion
Towards high biomass yields – a better
understanding of microalgal metabolism

Chapter 6
140
Abstract
T o thoroughly understand the energy metabolism of microalgal cells and with that
the conversion of light energy into biomass, insight into the different processes in‐
volved in O2 production and uptake and CO2 consumption and production is necessary.
An overview of these processes that play a dominant role in the generation of metabolic
energy and reductants is given. To reach high biomass yields on light (i.e. productivity)
conditions at which processes such as the Mehler reaction, photoinhibition and photo‐
respiration occur should be avoided. A number of measurement methods are proposed
which could be used to determine under which cultivation conditions certain processes
take place and to what extent, so that these conditions possibly can be avoided. These
measurements need to be combined with flux balance analysis in order to accurately
assess the real implications of these pathways for the energy budget of the microalgae.
For this purpose the metabolic model for C. reinhardtii itself can be further improved and
expanded by introducing cellular compartments and possibly adding desired product
pathways. This will give more insight in the metabolism and the effect of different pa‐
rameters on the conversion of light energy into biomass or useful products. If a dynamic
description of the light reactions of photosynthesis is included it might ultimately be pos‐
sible to make predictions on biomass and product yield based on the light regime the
microalgae are exposed to.

Discussion
141
Introduction
Maximization of microalgal product and biomass productivity in (large‐scale) outdoor
photobioreactors is important for commercial production of food, feed, chemicals or fuel
compounds. To achieve this, insight in the metabolism of the microalgae is a valuable
tool. We constructed a metabolic model to understand fundamental mechanisms behind
biomass yield on light for the green microalgae Chlamydomonas reinhardtii (described in
Chapter 4) and applied metabolic flux balancing to achieve this insight. To be able to ac‐
curately measure the inputs and outputs of the metabolism (CO2, O2, biomass, nitrogen,
light) on‐line during cultivation, we developed a lab‐scale short light‐path (SLP) photobio‐
reactor with an on‐line measurement system (described in Chapter 2 and 3). In this
photobioreactor mixing was carried out independently from aeration to be able to meas‐
ure the gas‐exchange on‐line as well as determine the effect of mixing on the biomass
yield.
In this study we used the metabolic model and the SLP photobioreactor to get a better
insight in the metabolism of microalgae and more specifically the O2 metabolism. During
photoautotrophic growth microalgae consume carbon dioxide (CO2) and produce oxygen
(O2). In addition O2 is taken up in a number of processes such as mitochondrial respira‐
tion and photorespiration. The net evolved O2 can easily build up to high concentrations
in closed photobioreactors and this can inhibit growth of the microalgae and have a
negative effect on productivity (Carvalho et al. 2006; Miron et al. 1999; Wijffels et al.
2010). By cultivating microalgae under different O2 : CO2 ratios in this photobioreactor
and measuring the oxygen production rate (OPR) and carbon dioxide uptake rate (CUR)
on‐line we could assess the effect of elevated O2 concentrations on the microalgae
(described in Chapter 5). The measured rates were used as input for the metabolic
model to quantify the effect of higher O2 : CO2 ratios.
To thoroughly understand the energy metabolism of microalgal cells and with that the
conversion of light energy into biomass, insight into the different processes involved in
O2 production and uptake and CO2 consumption and production is necessary. In the next
paragraphs the metabolic processes in which O2 plays a role will be discussed as well as
how they could be measured. Subsequently, ways to improve the metabolic model in
order to obtain a better insight in the metabolism will be discussed.
Microalgal cultivation: mixing and oxygen
To be able to accurately measure photosynthetic activity through the on‐line monitoring
Chapter 6
142
of the oxygen production rate (OPR) and carbon dioxide consumption rate (CUR), the
differences in O2 and CO2 in the ingoing and outgoing gas need to be large enough. To
accomplish this we need to decrease the airflow going through the microalgal culture
and as a consequence there will be less mixing in the reactor (longer light/dark cycles).
To be able to measure this gas‐exchange on‐line and study the effect of mixing on the
productivity of algal cultures independently, we designed a lab‐scale photobioreactor
which combines a short light‐path (SLP) of 12 mm with controlled aeration and mixing by
stirring, independent from the gas flow. The design and operation of this lab‐scale
photobioreactor is described in Chapter 2.
To reach high biomass densities and increase biomass yield at high light intensities,
faster mixing could be important as was found for cultures of Spirulina (Arthrospira)
(Qiang et al. 1996; Qiang and Richmond 1996). Under such conditions the cyanobacteria
are only shortly exposed to over‐saturating light intensities at the photobioreactor sur‐
face before traveling to darker regions of the photobioreactor, the so called L/D (light/
dark) cycles. It was hypothesized that this light regime leads to higher photosynthetic
efficiencies by preventing oversaturation and inducing light integration (Richmond 2000).
To test whether this was the case for green microalgae we investigated the effect of mix‐
ing on cultures of Chlorella sorokiniana under over‐saturating light in the SLP photobiore‐
actor (Chapter 2). Batch experiments with Chlorella sorokiniana at different mixing
speeds showed that the maximal photosynthetic efficiency occurred at relatively low
biomass densities (2.3 g L‐1) at which light was just attenuated before reaching the rear
of the culture. In our work, no real dark zone developed at the point of optimal produc‐
tivity, and consequently there was no cycling between light and dark zones. Mixing only
leads to movement of the microalgal cells through the light gradient within the light
zone. When increasing the mixing rate twofold, we only found a small increase in bio‐
mass yield on light energy for the green microalga Chlorella sorokiniana in contrast to
the findings for Spirulina.
Mixing is needed to prevent algae from settling, for supplying CO2 and for removing O2.
But to reach higher productivities with faster mixing and thus higher energy inputs, the
question arises if the increased biomass productivity is proportional to the increased
energy input. Miller et al. (1964) calculated an optimum mixing speed based on the total
power input for illumination and mixing. According to their calculations, there was a cut‐

Discussion
143
off between the efficiency of the algae, related to light intensity, and the optimum mix‐
ing speed. Calculations done by Norsker et al. (2010) and Weissman et al. (1988) show
that high mixing velocities in closed systems are associated with high energy input costs.
Even for specialty products the question is if these high costs can be justified for promot‐
ing higher productivities.
As stated above, mixing is also needed to supply CO2 to the culture and remove the pro‐
duced O2. This produced O2 can easily build up to high concentrations in closed photo‐
bioreactors and this can have a negative effect on productivity and inhibit growth of the
microalgae (Carvalho et al. 2006; Miron et al. 1999; Wijffels et al. 2010). If mixing is de‐
creased to reduce energy consumption, which is preferable, this effect can be even lar‐
ger because even more O2 can build up in the culture.
Thus, there are two main effects associated with mixing. First, an increase in biomass
yield by faster mixing, which we found to be only small. Second, an effect on the removal
of evolved O2, which can be inhibiting for microalgal growth and have a negative effect
on biomass yield.
Effect of oxygen and carbon dioxide on the metabolism of microalgae
During photoautotrophic growth there are a number of metabolic processes in which O2
and CO2 are involved. To be able to assess the effect of O2 and CO2 on the metabolism of
microalgae we need to understand these processes and know when and if they occur
and under which circumstances. In the following paragraphs an overview is given of the
most commonly occurring processes in which O2 and/or CO2 are involved.
Photosynthesis, linear electron transport
Photosynthesis takes place in the chloroplasts of microalgae where the photosynthetic
machinery is located on the thylakoid membranes, as shown in Figure 6.1. This machin‐
ery consists of two photosynthetic units (PSI and PSII), a Cytochrome b6f complex and
electron carriers (plastoquinone (PQ) and plastocyanin (PC)).
Per 8 photons absorbed (4 at PSII and 4 at PSI), two molecules of H2O are split at the lu‐
men side of PSII yielding O2 and 4 protons. Thus, photosynthesis is the major source of
O2 production. The four electrons originating from water flow through PSII to the Cyt b6f
complex through PQ. Every second electron which arrives at the Cyt b6f complex is cycled
back to the PQ pool and additional protons are pumped to the lumen. With this Q‐cycle
the proton pumping stoichiometry is increased to 2 H+ per electron. (Cape et al. 2006)

Chapter 6
144
The electrons eventually flow to Ferredoxin (Fd) on PSI, through the PC pool. Here they
are used to reduce two NADP+ to two NADPH. The electrochemical trans‐membrane pro‐
ton gradient that is created during this process (proton‐motive force) drives ATP synthe‐
sis through ATP synthase. In this step three ATP are formed for 12 protons pumped
across the thylakoid membrane. This process is represented by equation 1 and this is
also how the light reaction is modeled in the metabolic network (reaction 0, Appendix
Figure 6.1 Linear electron transport in the thylakoid membranes of the chloroplast. Light is ab‐
sorbed at PSII and water is split, yielding oxygen (O2), protons (H+) and electrons (e‐). Electrons
move from H2O through PSII, PQ, PSI and finally to NADP+. Light is also absorbed at PSI and with
these electrons NADP+ is reduced to NADPH. Every second electron which arrives at the Cyt b6f com‐
plex is cycled back to the PQ pool and additional protons are pumped to the lumen. This is the Q‐
cycle. Protons are pumped from the stroma to the lumen and this creates an electrochemical pro‐
ton gradient which drives ATP synthesis through ATP synthase. hν = photons or quanta, PSI = pho‐
tosystem I, PSII = photosystem II, PQ = plastoquinone, PC = plastocyanin, Fd = ferredoxin, Cyt b6f
complex = Cytochrome b6f complex.

Discussion
145
Chapter 4).
8 Light + 3 ADP + 3 Pi + H+ + 2 NADP+ O2 + H2O + 2 NADPH + 3 ATP (1)
In this model we assumed a ratio between NADPH and ATP of 2 : 3 as can also be seen
from this equation. However, this ratio might actually be higher since linear ET delivers
less than the maximum of 3 ATP per 2 NADPH (Allen 2003), as is also discussed in Chap‐
ter 4. To fulfill the requirements of the Calvin cycle for carbon fixation the ratio of 2 : 3
needs to be restored and it is thought that cyclic ET provides the additional ATP to re‐
store this ratio. (Allen 2003; Joliot and Joliot 2006) Perhaps the combination of linear and
cyclic ET provides flexibility in the NADPH : ATP ratio to meet metabolic demands (Allen
2003). Another view is that mitochondrial respiration provides the additional ATP to re‐
store the ratio needed for the operation of the Calvin cycle (Hoefnagel et al. 1998).
Cyclic electron transport
In cyclic electron transport (ET) electrons transported to Fd on PSI are transferred back
to the PQ pool rather than to NADP+. These electrons then flow back to PC and are re‐
turned to PSI again. This cyclic flow of electrons induces the pumping of protons by the
Cyt b6f complex and the resulting proton gradient drives ATP synthesis by ATP synthase.
In this process no NADPH is formed and also no O2 is produced since PSII does not par‐
ticipate in this process. The net reaction of this process is given by equation 2:
2 Light + ADP + Pi + H+ ATP (2)
Cyclic ET can change the ratio of ATP to NADPH in the microalgal cells and restore the
ratio of NADPH : ATP to meet the demands of the Calvin cycle as discussed before (Allen
2003; Endo and Asada 2008; Joliot and Joliot 2006). In addition, cyclic ET establishes a pH
gradient over the thylakoid membrane and this might help to induce pathways to dissi‐
pate excess excitation energy in PSII as heat (Allen 2003; Endo and Asada 2008; Shikanai
2010) thus preventing photoinhibition.
It is interesting to note that cyclic ET yields 1 molecule of ATP per 2 photons, where lin‐
ear ET followed by the complete conversion of sugars (Glyceraldehyde 3‐phosphate) pro‐
duced in the chloroplast yields 1 mol of ATP per 1.5 photons. This shows that energy
generation through linear photosynthetic electron transport is energetically more favor‐

Chapter 6
146
able than through cyclic electron transport. This cyclic pathway as such was not included
in our model because the flux through this pathway could not be calculated from the
measured rates. Nevertheless the flux through this pathway could partly explain the fact
that the practically determined minimal quantum requirement of oxygen evolution is 10
instead of 8 as discussed in Chapter 4 (equivalent to ΦPmax = 0.8). Considering this ΦPmax
of 0.8 and the ratio of 3 ATP per 8 photons assumed for linear ET, this possible need for
cyclic ET is implicitly present in our model.
Pseudocyclic electron transport, or Mehler reaction
This process is also called the Mehler reaction or sometimes the water‐water cycle
(Mehler 1951). In this process electrons are transferred from Fd to O2 instead of to
NADP+. This gives superoxide, which quickly needs to be scavenged to form hydrogen
peroxide (H2O2). This can be converted to water in several enzymatic steps. The reactions
occurring in this process are given below.
1. splitting of water at PSII 2 H2O 4 e‐ + 4 H+ + O2
2. reduction of water at PSI 2 O2 + 2 e‐ 2 O2
‐
3. formation of hydrogen peroxide 2 O2‐ + 2 H+ O2 + H2O2
4. conversion of hydrogen peroxide H2O2 + 2 e‐ + 2 H+ 2 H2O
A more extensive overview of all reactions that occur in this process is given by Endo and
Asada (2008) and Asada (1999). The net reaction of the Mehler reaction, the sum of all
these steps, is given in equation 3:
2 H2O + O2 O2 + 2 H2O (3)
In this pathway only protons are transferred over the thylakoid membrane. As in cyclic
electron transport no NADPH and no O2 are formed. The proton gradient can be used for
ATP synthesis providing ADP is present (Allen 2003). Although cyclic ET around PSI and
the Mehler reaction share similar physiological functions, it should be noted that cyclic
ET is an energy conserving system while the Mehler reaction is an energy‐dissipating
system (Endo and Asada 2008). The functions of the Mehler reaction are still studied
(Shikanai 2010). Possible functions are (Asada 1999; Endo and Asada 2008; Hideg 1997;
Shikanai 2010):
• protecting the photosynthetic apparatus against photoinhibition at high light in‐
tensities by sustaining a pH gradient over the thylakoid membrane so that exces‐

Discussion
147
sive absorbed light can be dissipated as heat.
• to increase the ATP : NADPH ratio of the cells similar to cyclic ET. However, the
quantum yield of ATP in the Mehler reaction is lower than that of cyclic ET.
The Mehler reaction takes place when the NADP+/NADPH pool is reduced as well as the
other components of the photosynthetic electron transport chain. High light intensities
can induce this situation as can CO2 limitation and low temperatures. (Badger et al. 2000)
However, over‐reduction of the chloroplast can also be prevented by transporting the
excess reducing equivalents out of the chloroplast through a shuttle mechanism, the
Malate/Oxaloacetate shuttle. This shuttle is activated by high NADPH levels in the
chloroplast after which NADPH reduces oxaloacetate to malate, which is exported from
the chloroplast, yielding NADP+. This NADP+ can subsequently be used in linear ET. This
shuttle seems to be preferred over the Mehler reaction, provided enough oxaloacetate is
present. (Hoefnagel et al. 1998)
Chlororespiration
Chlororespiration is the process in which the PQ pool is reduced in the dark and re‐
oxidized via a chloroplast oxidase at the expense of O2. In higher plants the PQ pool is
reduced by a NAD(P)H‐oxidoreductase but in C. reinhardtii the responsible complex re‐
mains to be discovered. (Bennoun 2005) A role of chlororespiration might be in regulat‐
ing the redox level of the PQ pool under stress conditions and in the dark (Büchel and
Gyözö 1997). However, the rate of oxygen uptake by chlororespiration is very small and
hard to differentiate from mitochondrial dark respiration (Bennoun 2005).
Photorespiration
A process which occurs when high concentrations of oxygen and/or low concentrations
of carbon dioxide are present is photorespiration (Badger et al. 2000; Foyer et al. 2009;
Ogren 1984; Tural and Moroney 2005; Wingler et al. 2000). This process can also occur at
high temperatures which will influence the kinetic properties of the Rubisco enzyme and
increase its oxygenase potential (Badger et al. 2000). In this process Rubisco reacts with
O2 instead of CO2. When Rubisco fixes carbon dioxide, two molecules of Glycerate 3‐
phosphate are formed (Figure 6.2a). These can be converted back to Ribulose 1,5‐
bisphosphate or can be used in the central carbon metabolism to form biomass compo‐
nents. However, if oxygen is fixed only one Glycerate 3‐phosphate is formed and one

Chapter 6
148
molecule of Glycolate 2‐phosphate (Figure 6.2b). This compound is converted into gly‐
oxylate through glycolate and can then be converted to Glycerate 3‐phosphate at the
expense of energy in the form of ATP. In addition CO2 is ‘lost’ and needs to be re‐fixed in
the Calvin cycle. This costs additional ATP and NADPH which are formed in the light reac‐
tion (linear electron transport) of photosynthesis and thus costs additional light. Also
ammonium (NH4+) is ‘lost’ and can be re‐fixed into Glutamate at the expense of NADPH.
Thus, in this situation less energy is available for growth, which lowers the productivity of
the microalgal cells. This process and its implications on the metabolism are explained in
detail in Chapter 5. Together with mitochondrial respiration this process causes net con‐
Figure 6.2 Carboxylase and oxygenase reactions of Rubisco, followed by the Calvin cycle (a) and
photorespiration (b). The two processes are shown for two Ribulose 1,5‐bisphosphate molecules
each. The numbers correspond to the reactions in the metabolic model as shown in Appendix A,
Chapter 4. When Rubisco binds CO2 (a), per two CO2 four Glycerate 3‐phosphate are formed, which
can be converted to Glyceraldehyde 3‐phosphate (GAP). GAP can be regenerated into Ribulose 1,5‐
bP at the expense of ATP or be used in the central carbon metabolism to form building blocks for
biomass. When Rubisco binds O2 (b), per two O2 two Glycerate 3‐phosphate and two Glycolate 2‐
phosphate are formed. To convert these two Glycolate 2‐phosphate to one Glycerate 3‐phosphate,
ATP is consumed, CO2 and ammonia (NH4+) are lost. Re‐fixing this lost CO2 and NH4
+ costs more ATP
and NADPH elsewhere in the metabolism.
a b

Discussion
149
sumption of O2 in the light. In the dark this process quickly stops due to the fact that
there is no ATP and NADPH to regenerate Ribulose 1,5‐bisphosphate.
Mitochondrial light respiration
This process (also named oxidative phosphorylation) mainly takes place in the mitochon‐
dria where NADH and FADH2 are oxidized to generate extra energy in the form of ATP to
support biomass formation and maintenance processes. In this process oxygen is con‐
sumed. (Geider and Osborne 1989; Graham 1980; Hoefnagel et al. 1998; Turpin et al.
1988) The respiration rate is known to be related to the growth rate and it is suggested that faster algal growth leads to a higher energy (ATP) requirement and, as such, respira‐
tory activity increases (also observed in Chapter 3). This process is represented by equa‐
tions 4 and 5 (reactions 52 and 53, Appendix Chapter 4).
1.5 ADP + 1.5 H+ + 1.5 Pi + FADH2 + 0.5 O2 FAD + 1.5 ATP + 2.5 H2O (4)
3.5 H+ + 2.5 ADP + 2.5 Pi + NADH + 0.5 O2 NAD + 2.5 ATP + 3.5 H2O (5)
Comparison of measured and calculated mitochondrial respiration rates
The rate of post‐illumination O2 uptake has been shown to provide a good measure for
respiratory O2 uptake in the light (Grande et al. 1989; Weger et al. 1989; Xue et al. 1996).
A method to measure this post‐illumination O2 uptake in situ inside the SLP photobiore‐
actor during cultivation is described in Chapter 3. By means of a simple extension of the
cultivation system we were able to measure the respiratory O2 uptake (OUR) using a fi‐
ber‐optic oxygen micro‐sensor. During the steady states at different O2 : CO2 ratios as
described in Chapter 5 we measured the OUR for C. reinhardtii with this method. In addi‐
tion we calculated the respiration rate with the metabolic model by adding up the fluxes
through reactions 52 and 53 for each steady state (more details on the model inputs can
be found in Chapter 5). Figure 6.3 shows the calculated and measured OUR for the differ‐
ent steady states. This graph shows a large, almost 3‐fold, discrepancy between the
model output and the measured values. This can be either due to the measurement
method, to the model or to both.
As for the measurement method, the upside of this method is that it is fast (which is im‐
portant to measure the immediate post‐illumination O2 uptake) and it enables rapid and
frequent measurements without disturbing the cultivation and growth of the microalgae.

Chapter 6
150
The downside is that the fiber‐optic sensors are not robust and can lose their optical
coating easily, severely affecting the measurements.
As for the model, a number of assumptions can influence the OUR through respiration.
Firstly the P/O ratio, the relationship between ATP synthesis and O2 consumption. In the
model we assumed that NADH yields 2.5 ATP and FADH2 yields 1.5 ATP upon respiration.
However, if this ratio would be lower, the O2 uptake rate through respiration according
to the model will increase (described in Chapter 4). A way to determine the P/O ratio for
E. coli is described in Taymaz‐Nikerel et al. (2010). This approach is similar to the deter‐
mination of energy requirement for growth and maintenance as described in Chapter 4,
with additional objective functions and chemostats using different conditions and sub‐
strates.
Secondly, the compartmentation of the model influences the energy requirement of the
cell and thus the OUR through respiration. In the current model only the Calvin cycle is
compartmentalized to the chloroplast. As a consequence, in the model all ATP that is
used in biomass synthesis is generated in oxidative phosphorylation and is thus con‐
Figure 6.3 Oxygen uptake rates (in mmol g‐1 h‐1) as calculated with the metabolic model compared
to the measured rates with a fiber optic oxygen sensor for the steady states with different O2 : CO2
ratios as described before. The error bars represent the standard deviations.

Discussion
151
nected with O2 consumption. However, for example lipids are synthesized in the chloro‐
plast in vivo from Glyceraldehydes 3‐phosphate, the product of the Calvin cycle. For this
lipid synthesis additional reducing equivalents (NADPH) and ATP are needed which can
be derived directly from linear ET. Therefore less ATP needs to be generated in oxidative
phosphorylation and consequently less O2 needs to be consumed. However, for many
reactions the compartment in which they occur is not known and neither are all trans‐
porters responsible for transport of compounds between compartments. Furthermore,
compartmentalization requires additional measurements, like for example the composi‐
tion of the chloroplast, and their contribution to the total dry weight.
Improving and expanding the metabolic flux model
Improving and expanding the metabolic model is only useful if the fluxes through the
added pathways can be calculated and the improved model can be validated. Therefore
some of the above described processes need to be measured during steady state condi‐
tions, like the respiration method described before. The existence of the processes ex‐
plained above has been proven by measurements on either isolated chloroplasts and
mitochondria or on mutants deficient in one or more enzymes, disabling these pro‐
cesses. However, ultimately we want to assess the effect of cultivation conditions as they
occur in photobioreactors on whole microalgal cells and understand the impact on the
metabolism. Thus all processes that significantly contribute to the biomass yield on light
should be known and included in the model. In case the flux through some of these path‐
ways cannot be calculated from the measurements, either additional measurements are
needed (for example chloroplast composition) or conditions need to be chosen in such a
way that the contribution of certain pathways can be neglected (for example Mehler
reaction at low light and high growth rates). In addition to this we would like to under‐
stand and improve the metabolic pathways towards microalgal products such as lipids
for biodiesel or carotenoids for food applications.
In the following paragraphs a number of measurement methods and ways to improve
the metabolic model are discussed. After this some possibilities to expand the metabolic
model with product pathways will be given.
Measurements
In Table 6.1 an overview is presented of several measurement methods which could be
used to quantify several of the processes involving oxygen and carbon dioxide described

Chapter 6
152
Metho
d Process
References
16O/1
8 O isotop
e stud
y, with
NMR or M
S
O2 u
ptake reactio
ns
(Meh
ler reaction, m
itochon
drial respiratio
n)
Badger et a
l. (2000), B
ate et al. (1988), Eisen
stadt
et al. (2010), End
o and Asada
(2008), Falkowski
and Ra
ven (2007), Kana (1993)
12C/
13C/
14C isotop
e stud
y,
with
NMR or M
S
CO2 e
volutio
n (M
itochon
drial respiratio
n, pho
torespiration)
Grand
e et al. (1989), R
aghavend
ra et a
l. (1994)
13C labe
ling, with
NMR or
MS
Flux m
easuremen
ts
(changes in
interm
ediates and intracellular
metabolite
s)
Iwatani et a
l. (2008). Shastri and
Morgan (2007),
van Winde
n et al. (2001a), Yang
et a
l. (2002)
32P labe
ling
Cyclic ET
Herzig and Dub
insky (1993)
PAM fluo
rescen
ce
ΦP and Φ
Pmax, the
quantum
yield of P
SII, PSI
NADPH
, ΔpH
Ph
otoinh
ibition
Badger et a
l. (2000), H
äder et a
l. (1996), H
ancke
et al. (2008), Klugham
mer and
Schreiber (2
008),
Krom
kamp et al. (2009), Lippe
meier et a
l. (2001),
Ravene
l et a
l. (1994), Shikanai (2010)
Dynam
ic fluo
rescen
ce
quen
ching
Oxygen up
take reactions
(M
itochon
drial respiratio
n)
Kliphu
is et a
l. (2010b
)
Table 6.1 Overview of measurement metho
ds described
and
reviewed
in literature. T
he processes which can
be measured
with
these metho
ds are also given.

Discussion
153
before. Measuring these processes in vivo under relevant cultivation conditions is not
easy (Badger et al. 2000). Nevertheless, some of these methods can be used to deter‐
mine under which cultivation conditions certain processes take place. For example, to
obtain higher yields it is beneficial to cultivate microalgae under conditions at which
photorespiration or the Mehler reaction do not take place.
There are a number of different O and C isotope labeling studies that can be performed
to elucidate several processes in which O2 and CO2 are involved. By performing 16O/18O
labeling combined with a detection method such as NMR or MS insight can be obtained
in the oxygen uptake reactions during photosynthesis.
For example the Mehler reaction can be observed using this method. The stoichiometry
is as follows:
PSII 2 H216O 16O2 + 4 e
‐ + 4 H+
PSI 18O2 + 4 e‐ + 4 H+ 2 H2
18O
The O2 evolved at PSII is derived from water, while O2 is taken up from the dissolved O2
in the cultivation medium. (Badger et al. 2000; Endo and Asada 2008)
Labeling of oxygen can be combined with carbon labeling to identify CO2 evolution dur‐
ing photosynthesis. This is the result of mitochondrial respiration and photorespiration.
The combination of these two labeling methods can shed more light on these processes.
However, for these labeling studies, one has to make sure the measurement conditions
are chosen in such a way that only the process which needs to be studied takes place.
For example, when determining the rate of cyclic ET by 32P labeling linear ET was blocked
by DCMU (Herzig and Dubinsky 1993). The question then arises if the processes meas‐
ured in such a way also occur in the exact same way under cultivation conditions.
Fluorescence techniques can be used to determine the quantum yield ΦP of PSII and the
maximum (dark‐adapted) quantum yield ΦPmax of PSII, giving a measure for linear ET. In
addition, the quantum yield of PSI, the NADPH pool and the transmembrane pH gradient
(ΔpH) can be determined with fluorescence techniques (Klughammer and Schreiber
2008; Ravenel et al. 1994).
As discussed in Chapter 4 the quantum yield is important to accurately determine how
efficient linear electron transport is under certain cultivation conditions. This method is
much more accurate than labeling with enriched O2 or CO2 to determine gross oxygen
evolution or carbon fixation through linear ET (Hancke et al. 2008). The downside of this

Chapter 6
154
method is that optically thin cultures without a light gradient are necessary. These can
be obtained either by diluting the culture or measuring a dilute sample. The question
then arises if the conditions during the measurement are the same as during large scale
cultivation, where high biomass densities are required.
A tool for elucidating the intracellular fluxes in metabolic networks is 13C labeling. This
method relies on a number of assumptions (van Winden et al. 2001b):
• the stoichiometry of the network is complete. There are no omitted reactions that
can influence the labeling state of the biomass. In addition, the reversibility of all
reactions is known, since this can also have a large effect on the labeling state of the
metabolites.
• there are no metabolic isotope effects, i.e. enzymes do not discriminate between
molecules with various numbers of labeled C‐atoms.
• all reactions take place in compartments in which all metabolites are homogeneously
distributed
Almost all 13C labeling techniques for algal flux balance analysis have been performed
under heterotrophic or mixotrophic conditions. If enriched 1‐13C glucose is used the label
is on a specific location, the first carbon atom. When measuring the isotopic steady state
of the metabolism the distribution of the label over the metabolites is C‐atom specific
and gives information on how the metabolite was formed from glucose. However, label‐
ing with 13CO2 provides a challenge in this respect because the label is not location spe‐
cific. Therefore measuring changes in 13C labeling patterns of metabolic intermediates as
a function of time is the only way to measure fluxes at steady state for photoautotrophic
micro‐organisms. (Shastri and Morgan 2007)
To be able to measure these changes in time, rapid sampling and quenching of the me‐
tabolism are required, which is another challenge. If flash‐freezing of the whole sample is
used it is, however, not possible to make a distinction between intracellular and extracel‐
lular compounds. Centrifugation is commonly used to separate the cells from the cultiva‐
tion medium, but this requires handling the sample outside cultivation conditions prior
to quenching. This can alter the metabolism and disturb the measurements and cannot
be used for such highly dynamic experiments. A new method for quenching the metabo‐
lism of C. reinhardtii cells is described in Bölling and Fiehn (2005), in which the cells are
injected in a cold (‐25°C) solution of methanol‐water supplied with Tris‐acetate phos‐
phate for osmotic conditions. However, when using this method for other algal species,

Discussion
155
tests should be done to check whether the cells stay intact during this quenching proce‐
dure.
Model
In addition to measuring which processes occur during cultivation under different condi‐
tions, the model itself can be improved. In the next paragraphs ways to do this are dis‐
cussed. However, model expansion and improvement usually has to go together with
additional measurements to validate the model.
Compartmentation model
The metabolic model as introduced in Chapter 4 can be improved substantially by com‐
partmentalizing the different reactions to the different cell organelles where they take
place as described before. In this way the compounds produced in each organelle can
immediately be used there as a building block as opposed to be formed in the cytosol as
the model describes now. In addition, the energy generated in an organelle can immedi‐
ately be used to form biomass building blocks in that organelle. The compounds can be
shuttled to the different cell compartments by translocators/shuttles. An example is the
photorespiratory pathway in which glycolate is formed. This is transported over the
chloroplast membrane to the cytosol and the mitochondria to be converted back to
Glycerate 3‐phosphate, which is in turn transported back to the chloroplast to enter the
Calvin cycle again. (Foyer et al. 2009; Hoefnagel et al. 1998; Wingler et al. 2000) A glyco‐
late/glycerate translocator for the chloroplast is described by Flügge and Heldt (1991).
More of these translocators for several compounds and the compartmentation of path‐
ways have been described in literature for the chloroplast, mitochondria and cytosol
(Flügge and Heldt 1991; Hoefnagel et al. 1998; Klein 1986). The chloroplast and mito‐
chondria are closely linked through photosynthesis and carbon compound formation in
the chloroplast and respiration of these compounds in the mitochondria, yielding energy
and carbon intermediates for biosynthesis (Hoefnagel et al. 1998; Raghavendra et al.
1994). The interaction between these organelles and the exchange of ATP, NAD(P)H and
carbon compounds are described in more detail in Hoefnagel et al. (1998).
Compartmentation of the model will describe reality more accurately. However, there
are some considerations. First of all not all translocators/shuttle systems are known and
it is unclear how much energy it costs to shuttle components through the cell, hence
assumptions have to be made here. This might affect the energy balance of the cell.

Chapter 6
156
Secondly, identical pathways may occur in different organelles. This leads to underdeter‐
minancies and unique fluxes cannot be calculated for these pathways without further
assumptions and/or measurements. Thirdly, the composition of the modeled organelles
should be measured in gram per gram dry weight. By doing this, information can be ob‐
tained on which components are made and used in which organelle and which compo‐
nents are used elsewhere as building blocks and thus need to be transported.
Gap‐filling methods
In this thesis we used a top‐down approach to build our metabolic model for C. reinhard‐
tii. All important pathways of primary metabolism were identified based on literature.
Subsequently we checked whether these pathways were present in the genome and if
they were, they were incorporated in the model. A better approach would be to use a
bottom‐up approach. In this approach the model would be built using a prediction of all
metabolic reactions based on the complete genome, providing the genome sequence is
available. This includes compartmentalization as mentioned before. Such a model would
contain a number of gaps which can be filled in using gap filling methods. Network re‐
constructions contain gaps because our knowledge of the metabolism of any organism is
incomplete. There are two types of missing information (gaps) in metabolic networks.
The first type of gaps are places where a reaction is missing, creating a dead‐end. The
second type are reactions that are known to exist but it is not yet known which gene or
genes code for their enzymes. An example of the first type is the unknown enzyme nec‐
essary in cysteine formation in our metabolic model for Chlamydomonas reinhardtii
(Chapter 4). The computational methods to fill these gaps and improve metabolic net‐
works are reviewed in Herrgård et al. (2006) and Orth and Palsson (2010). These algo‐
rithms use metabolic reaction databases for the organism of interest (such as KEGG) and
experimental data to find gaps and add or delete reactions.
Detailed modeling of photosynthetic light reactions – dynamic effects
When modeling the metabolism of any micro‐organism steady state is assumed, a situa‐
tion in which the specific growth rate µ, the biomass density and all other cultivation
parameters do not change over time. This steady state actually is pseudo steady state
since the cells still go through cell cycles and the composition of these cells thus
‘fluctuates’. There is an added difficulty when modeling photoautotrophic micro‐
organisms such as green microalgae. Microalgae use light as a substrate. During cultiva‐

Discussion
157
tion a light gradient will develop in the photobioreactor and the algae will travel through
this gradient due to mixing. The photosystems will be presented with different amounts
of photons due to this effect and thus the rate of photosynthetic ET will fluctuate. This
reaction ultimately dictates the amount of energy that can be used in the metabolism
and will thus dictate the specific growth rate of the cells. However, this fluctuating light
effect will dampen out when going towards biomass formation in the metabolism and
thus the definition for steady state still holds for the major part of primary metabolism.
Nevertheless, when changing the light regime or mixing intensity the model may not be
able anymore to accurately predict the biomass yield.
Ultimately we would like to use metabolic flux models to predict biomass or product
yields for microalgae in large‐scale photobioreactors. In these systems the algae will con‐
tinuously move through a light gradient. The dynamic light regime experienced by the
microalgae depends on the depth of the photobioreactor and its hydrodynamics, the
incident light intensity, the biomass concentration and its pigmentation. To be able to
accurately predict the amount of energy generated in linear ET in such a system, another
approach for modeling the photosystem is needed. This model has to be a dynamic
model which includes the primary light and dark biochemical reactions as well as regula‐
tory interactions and is proposed in Nedbal et al. (2007).
Metabolic flux models as discussed here cannot be used to model such processes. How‐
ever, if energy generation in the photosystems can be viewed as a separate block of me‐
tabolism with only a limited number of connections to the rest of metabolism it may be
possible to link a dynamic model of photosynthesis describing energy and reductant gen‐
eration to a metabolic flux model describing biomass and product formation. This might
be the way to go to be able to accurately predict biomass or product yields for microal‐
gae in fluctuating light.
Towards product formation
To gain more insight in product formation and possible product yields the metabolic
model can be expanded with the pathways for these products. The incorporation of
these pathways depends on the microalgae of interest and on the presence of genes
encoding for these pathways in the genome.
Possible pathways with which the model can be extended are:
• carotenoid formation, branching from Acetyl‐CoA (Grossman et al. 2004; McCaskill

Chapter 6
158
and Croteau 1993; Schwender et al. 2001). Carotenoids are compounds of interest
for food, feed, cosmetics and pharmaceutical applications.
• PUFA (poly‐unsaturated fatty acids) pathways, which are an extension of the fatty
acid formation pathway as is incorporated in the current model. PUFA’s are long‐
chain fatty acids which are interesting for nutraceutical purposes. (Harwood and
Guschina 2009; Ward and Singh 2005)
• TAG (triacylglycerol) formation, also branching from Acetyl‐CoA. TAG is a potential
source of biodiesel from microalgae. (Hu et al. 2008; Radakovits et al. 2010)
• Hydrocarbon formation. Hydrocarbons are long chain lipids consisting only of carbon
and hydrogen elements. These compounds can be a potential renewable energy
source. (Dayananda et al. 2007; Metzger and Largeau 2005)
• EPS (exo‐polysaccharide) production pathways, branching from Glucose 1‐phosphate
(Cogne et al. 2003). Some species of cyanobacteria and green microalgae are known
to excrete EPS, which can be used as thickening or suspending agents or emulsifying
compounds amongst others (De Philippis et al. 2001; Lewin 1956). Another possible
role of EPS could be in bio‐flocculation for downstream processing of microalgae
(Lavoie and de la Noüe 1987; Salim et al. 2010).
• Carbohydrate synthesis such as starch and glucan, branching from Glucose 1‐
phosphate. These storage carbohydrates can be metabolized into biofuels such as
ethanol and H2. (Radakovits et al. 2010)
Conclusion
When investigating the effect of mixing we only found a small increase in productivity
with increasing mixing rates. This showed that we worked at the optimal mixing rate
yielding maximal photosynthetic efficiency and hence productivity at over‐saturating
light conditions. However, when decreasing mixing because of the associated energy
input costs, O2 will build up in the medium and this can inhibit growth of the microalgae.
To investigate the effect of O2 on the metabolism we developed and used flux balance
analysis to quantify photorespiration. We found that a reduction in biomass yield of 20%
was already observed at conditions common in photobioreactors (air enriched with 2%
CO2) and that this reduction was due to photorespiration. However, there are several
more processes involved with O2 as described in this discussion. These processes play a
role in reaching high photosynthetic efficiencies and processes such as the Mehler reac‐
tion, photoinhibition and photorespiration should be avoided. A number of measure‐
Discussion
159
ment methods are proposed which can be used to determine under which cultivation
conditions certain processes take place so that these conditions can be avoided.
During cultivation we also quantified the rate of light respiration. However, the meas‐
ured rates did not agree yet with the calculated rates with the metabolic model. The
method described in Chapter 3, however, is a promising method to measure this but the
robustness of the method needs to be improved. Once O2 uptake in the light can be re‐
liably measured this can be used to further optimize the model. The metabolic model for
C. reinhardtii can be improved and expanded by introducing cellular compartments and
adding desired product pathways, for which additional measurements are needed. This
will give more insight in the metabolism and the effect of different parameters on bio‐
mass yield on light. Ultimately it might be possible to make predictions on biomass and
product yield based on the metabolism simulated with a predictive metabolic flux model.
Abbreviations
ΦP Photochemical quantum yield (‐)
ΦPmax Maximum photochemical quantum yield (‐)
CO2 Carbon dioxide
CUR Carbon dioxide uptake rate
Cyt Cytochrome
e‐ Electron or reductant
EPS Exo‐polysaccharide
ET Electron transport
Fd Ferredoxin
hν Photons or quanta
H+ Proton
O2 Oxygen
OPR Oxygen production rate
OUR Oxygen uptake rate
PC Plastocyanin
PQ Plastoquinone
PSI Photosystem I
PSII Photosystem II
PUFA Poly‐unsaturated fatty acid
SLP Short light‐path
TAG Triacylglycerol


References

162
B
A
Adir N, Zer H, Shochat S, Ohad I. (2003) Photoinhibition: a historical perspective. Photosynthesis
Research 76:343‐370
Allen JF. (2003) Cyclic, pseudocyclic and noncyclic photophosphorylation: new links in the chain.
Trends in Plant Science 8:15‐19
Altschul SF, Gish W, Miller W, Myers EW, Lipman DJ. (1990) Basic local alignment search tool. Jour‐
nal of Molecular Biology 215:403‐410
Asada K. (1999) The water‐water cycle in chloroplasts: scavenging of active oxygens and dissipation
of excess photons. Annual Review of Plant Physiology and Plant Molecular Biology 50:601‐
639
Baart GJE, Willemsen M, Khatami E, Haan A, Zomer B, Beuvery EC, Tramper J, Martens DE. (2008)
Modeling Neisseria meningitidis B metabolism at different specific growth rates. Biotech‐
nology and Bioengineering 101:1022‐1035
Badger MR, Andrews TJ, Whitney SM, Ludwig M, Yellowlees DC, Leggat W, Price GD. (1998) The
diversity and coevolution of Rubisco, plastids, pyrenoids, and chloroplast‐based CO2‐
concentrating mechanisms in algae. Canadian Journal of Botany 76:1052‐1071
Badger MR, von Caemmerer S, Ruuska S, Nakano H. (2000) Electron flow to oxygen in higher plants
and algae: rates and control of direct photoreduction (Mehler reaction) and Rubisco oxy‐
genase. Philosophical Transactions: Biological Sciences 355:1433‐1446
Baker NR, Harbinson J, Kramer DM. (2007) Determining the limitations and regulation of photosyn‐
thetic energy transduction in leaves. Plant, Cell & Environment 30:1107‐1125
Ball SG, Dirick L, Decq A, Martiat J‐C, Matagne RF. (1990) Physiology of starch storage in the mono‐
cellular alga Chlamydomonas reinhardtii. Plant Science 66:1‐9
Barbosa MJ, Albrecht M, Wijffels RH. (2003) Hydrodynamic stress and lethal events in sparged
microalgae cultures. Biotechnology and Bioengineering 83:112‐120
Bate GC, Sültemeyer JDF, Fock HP. (1988) 16O2/18O2 analysis of oxygen exchange in Dunaliella terti‐
olecta. Evidence for the inhibition of mitochondrial respiration in the light. Photosynthesis
Research 16:219‐231
Becker EW. (2007) Microalgae as a source of protein. Biotechnology Advances 25:207‐210
Ben‐Amotz A, Katz A, Avron M. (1982) Accumulation of β‐carotene in halotolerant algae: purifica‐
tion and characterization of β‐carotene‐rich globules from Dunaliella bardawil
(Chlorophyceae). Journal of Phycology 18:529‐537
Bennoun P. (2005) The present model for chlororespiration. In: Govindjee, Beatty JT, Gest H, Allen
JF, editors. Discoveries in Photosynthesis. Springer Netherlands. p 905‐909
Berg JM, Tymoczko JL, Stryer L. (2003) Biochemistry. New York: Freeman.
Bird RB, Stewart WE, Lightfoot EN. (1960) Transport Phenomena. New York: Wiley.
Bjorkman O, Demmig B. (1987) Photon yield of O2 evolution and chlorophyll fluorescence charac‐

References
163
C
teristics at 77 K among vascular plants of diverse origins. Planta 170:489‐504
Bölling C, Fiehn O. (2005) Metabolite profiling of Chlamydomonas reinhardtii under nutrient depri‐
vation. Plant Physiology 139:1995‐2005
Borodina I, Krabben P, Nielsen J. (2005) Genome‐scale analysis of Streptomyces coelicolor A3(2)
metabolism. Genome Research 15:820‐829
Bosma R, Miazek K, Willemsen SM, Vermuë MH, Wijffels RH. (2008) Growth inhibition of Monodus
subterraneus by free fatty acids. Biotechnology and Bioengineering 101:1108‐1114
Boyd C. (1968) Fresh‐water plants: a potential source of protein. Economic Botany 22:359‐368
Boyle NR, Morgan JA. (2009) Flux balance analysis of primary metabolism in Chlamydomonas
reinhardtii. BMC Systems Biology 3 DOI: 10.1186/1752‐0509‐3‐4
Bozzo GG, Colman B, Matsuda Y. (2000) Active transport of CO2 and bicarbonate is induced in re‐
sponse to external CO2 concentration in the green alga Chlorella kessleri. Journal of Experi‐
mental Botany 51:1341‐1348
Büchel C, Gyözö G. (1997) Respiratory regulation of electron transport in chloroplasts: chlororespi‐
ration. In: Pessarakli M, editor. Handbook of photosynthesis. 1st ed. New York: Marcel
Dekker, Inc. p 83‐93
Burgard AP, Vaidyaraman S, Maranas CD. (2001) Minimal reaction sets for Escherichia coli metabo‐
lism under different growth requirements and uptake environments. Biotechnology Pro‐
gress 17:791‐797
Cape JL, Bowman MK, Kramer DM. (2006) Understanding the cytochrome bc complexes by what
they don't do. The Q‐cycle at 30. Trends in Plant Science 11:46‐55
Carlson R, Srienc F. (2004) Fundamental Escherichia coli biochemical pathways for biomass and
energy production: Creation of overall flux states. Biotechnology and Bioengineering
86:149‐162
Carvalho AP, Meireles LA, Malcata FX. (2006) Microalgal reactors: A review of enclosed system
designs and performances. Biotechnology Progress 22:1490‐1506
Chisti Y. (2007) Biodiesel from microalgae. Biotechnology Advances 25:294‐306
Cogne G, Gros JB, Dussap CG. (2003) Identification of a metabolic network structure representative
of Arthrospira (Spirulina) platensis metabolism. Biotechnology and Bioengineering 84:667‐
676
Conway SL, Shinbrot T, Glasser BJ. (2004) A Taylor vortex analogy in granular flows. Nature
431:433‐437
Cornet JF, Dussap CG. (2009) A simple and reliable formula for assessment of maximum volumetric
productivities in photobioreactors. Biotechnology progress 25:424‐435
Cruz JA, Avenson TJ, Kanazawa A, Takizawa K, Edwards GE, Kramer DM. (2005) Pasticity in light
reactions of photosynthesis for energy production and photoprotection. Journal of Experi‐
mental Botany 56:395‐406

164
E
D
Cuaresma M, Janssen M, Vílchez C, Wijffels RH. (2009) Productivity of Chlorella sorokiniana in a
short light‐path (SLP) panel photobioreactor under high irradiance. Biotechnology and
Bioengineering 104:352‐359
Curran SJ, Black RA. (2005) Oxygen transport and cell viability in an annular flow bioreactor: com‐
parison of laminar couette and taylor‐vortex flow regimes. Biotechnology and Bioengineer‐
ing 89:766‐774
Dayananda C, Sarada R, Usha Rani M, Shamala TR, Ravishankar GA. (2007) Autotrophic cultivation
of Botryococcus braunii for the production of hydrocarbons and exopolysaccharides in
various media. Biomass and Bioenergy 31:87‐93
de Gucht LPE, van der Plas LHW. (1995) Growth kinetics of glucose‐limited Petunia hybrida cells in
chemostat cultures: determination of experimental values for growth and maintenance
parameters. Biotechnology and Bioengineering 47:42‐52
De Philippis R, Sili C, Paperi R, Vincenzini M. (2001) Exopolysaccharide‐producing cyanobacteria
and their possible exploitation: a review. Journal of Applied Phycology 13:293‐299
Delrue B, Fontaine T, Routier F, Decq A, Wieruszeski JM, Van Den Koornhuyse N, Maddelein ML,
Fournet B, Ball S. (1992) Waxy Chlamydomonas reinhardtii: monocellular algal mutants
defective in amylose biosynthesis and granule‐bound starch synthase activity accumulate a
structurally modified amylopectin. Journal of Bacteriology 174:3612‐3620
Di Prima RC, Swinney HL. (1979) Instabilities and transition in flow between concentric rotating
cylinders. In: Swinney HL, Gollub JP, editors. Hydrodynamic Instabilities and the Transition
to Turbulence. 2nd ed. Berlin: Springer‐Verlag. p 139‐180
Dubinsky Z, Falkowski PG, Wyman K. (1986) Light harvesting and utilization by phytoplankton.
Plant and Cell Physiology 27:1335‐1349
Dubinsky Z, Stambler N. (2009) Photoacclimation processes in phytoplankton: mechanisms, conse‐
quences, and applications. Aquatic Microbial Ecology 56:163‐176
Duboc P, Marison I, Von Stockar U. (1999) Quantitative calorimetry and biochemical engineering.
In: Kemp RB, editor. Handbook of Thermal Analysis and Calorimetry. Aberystwyth, Wales:
Elsevier Science. p 267‐365
Dubois M, Gilles KA, Hamilton JK, Rebers PA, Smith F. (1956) Colorimetric method for determina‐
tion of sugars and related substances. Analytical Chemistry 28:350‐356
Eisenstadt D, Barkan E, Luz B, Kaplan A. (2010) Enrichment of oxygen heavy isotopes during photo‐
synthesis in phytoplankton. Photosynthesis Research 103:97‐103
Emerson R, Lewis CM. (1943) The dependence of the quantum yield of Chlorella on wavelength of
light. American Journal of Botany 30:165‐178
Endo T, Asada K. (2008) Photosystem I and photoprotection: cyclic electron flow and water‐water
cycle. In: Demmig‐Adams B, Adams WW, Mattoo AK, editors. Photoprotection, Photoinhibi‐

References
165
G
F
tion, Gene Regulation, and Environment. Dordrecht: Springer. p 205‐221
Eriksen NT, Riisgard FK, Gunther WS, Iversen JJL. (2007) On‐line estimation of O2 production, CO2
uptake, and growth kinetics of microalgal cultures in a gas‐tight photobioreactor. Journal
of Applied Phycology 19:161‐174
Eriksen NT. (2008) The technology of microalgal culturing. Biotechnology Letters 30:1525‐1536
Esser A, Grossman S. (1996) Analytic expression for Taylor–Couette stability boundary. Physics of
Fluids 8:1814‐1819
Evans JR. (1987) The dependence of quantum yield on wavelength and growth irradiance. Austra‐
lian Journal of Plant Physiology 14:69‐79
Falkowski PG, Dubinsky Z, Wyman K. (1985) Growth‐irradiance relationships in phytoplankton.
Limnology and Oceanography 30:311‐321
Falkowski PG, Raven JA. (2007) Aquatic photosynthesis. Princeton: Princeton University Press.
Flügge U, Heldt HW. (1991) Metabolite translocators of the chloroplast envelope. Annual Review of
Plant Physiology and Plant Molecular Biology 42:129‐144
Forster J, Famili I, Fu P, Palsson BO, Nielsen J. (2003) Genome‐scale reconstruction of the Saccharo‐
myces cerevisiae metabolic network. Genome Research 13:244‐253
Foyer CH, Bloom AJ, Queval G, Noctor G. (2009) Photorespiratory metabolism: genes, mutants,
energetics, and redox signaling. Annual Review of Plant Biology 60:455‐484
Geider RJ, Osborne BA. (1989) Respiration and microalgal growth ‐ a review of the quantitative
relationship between dark respiration and growth. New Phytologist 112:327‐341
Gfeller RP, Gibbs M. (1984) Fermentative metabolism of Chlamydomonas reinhardtii: I. Analysis of
fermentative products from starch in dark and light. Plant physiology 75:212‐218
Ghirardi ML, Zhang L, Lee JW, Flynn T, Seibert M, Greenbaum E, Melis A. (2000) Microalgae: a
green source of renewable H2. Trends in Biotechnology 18:506‐511
Ghoshal D, Goyal A. (2001) Oxygen inhibition of dissolved inorganic carbon uptake in unicellular
green algae. Phycological Research 49:319‐324
Giordano RC, Giordano RLC. (2006) Taylor‐Couette vortex flow in enzymatic reactors. In: Guisan
JM, editor. Methods in Biotechnology: Immobilization of Enzymes and Cells. 2nd ed. To‐
towa, NJ: Humana Press Inc. p 321‐332
Graham D. (1980) Effects of light on "dark" respiration. In: Stumpf PK, Conn EE, editors. The Bio‐
chemistry of Plants, Vol. 2. Academic Press, Inc. p 525‐579
Grande KD, Marra J, Langdon C, Heinemann K, Bender ML. (1989) Rates of respiration in the light
measured in marine phytoplankton using an 18O isotope‐labeling technique. Journal of
Experimental Marine Biology and Ecology 129:95‐120
Griffiths MJ, Harrison STL. (2009) Lipid productivity as a key characteristic for choosing algal spe‐
cies for biodiesel production. Journal of Applied Phycology 21:493‐507

166
H
Grobbelaar JU. (2000) Physiological and technological considerations for optimizing mass algal
cultures. Journal of Applied Phycology 12:201‐206
Grossman AR, Lohr M, Im CS. (2004) Chlamydomonas reinhardtii in the landscape of pigments.
Annual Review of Genetics 38:119‐173
Gurakan T, Marison IW, Stockar U, Gustafsson L, Gnaiger E. (1990) Proposals for a standardized
sample handling procedure for the determination of elemental composition and enthalpy
of combustion of biological material. Thermochimica Acta 172:251‐266
Häder DP, Lebert M, Mercado J, Aguilera J, Salles S, Flores‐Moya A, Jimenez C, Figueroa FL. (1996)
Photosynthetic oxygen production and PAM fluorescence in the brown alga Padina
pavonica measured in the field under solar radiation. Marine Biology 127:61‐66
Hancke TB, Hancke K, Johnsen G, Sakshaug E. (2008) Rate of O2 production derived from pulse‐
amplitude‐modulated fluorescence: testing three biooptical approaches against measured
O2‐production rate. Journal of Phycology 44:803‐813
Harris EH. (2009) The Chlamydomonas sourcebook: a comprehensive guide to biology and labora‐
tory use. San Diego: Academic Press.
Harwood JL, Guschina IA. (2009) The versatility of algae and their lipid metabolism. Biochimie
91:679‐684
Heifetz PB, Förster B, Osmond CB, Giles LJ, Boynton E. (2000) Effects of acetate on facultative auto‐
trophy in Chlamydomonas reinhardtii assessed by photosynthetic measurements and sta‐
ble isotope analyses. Plant Physiology 122:1439‐1445
Heijden RTJM van der, Heijnen JJ, Hellinga C, Romein B, Luyben KCAM. (1994) Linear constraint
relations in biochemical reaction systems: I. Classification of the calculability and the bal‐
anceability of conversion rates. Biotechnology and Bioengineering 43:3‐10
Herbert D, Phipps PJ, Strange RE. (1971) Chemical analysis of microbial cells. In: Norris JR, Ribbons
DW, editors. Methods in Microbiology. London and New York: Academic Press. p 209‐344
Herrgård MJ, Fong SS, Palsson BØ. (2006) Identification of genome‐scale metabolic network mod‐
els using experimentally measured flux profiles. PLoS Computational Biology 2:e72
Herzig R, Dubinsky Z. (1993) Effect of photoacclimation on the energy partitioning between cyclic
and non‐cyclic photophosphorylation. New Phytologist 123:665‐672
Hideg E. (1997) Free radical production in photosynthesis under stress conditions. In: Pessarakli M,
editor. Handbook of Photosynthesis. 1st ed. New York: Marcel Dekker Inc. p 911‐930
Hoefnagel MHN, Atkin OK, Wiskich JT. (1998) Interdependence between chloroplasts and mito‐
chondria in the light and the dark. Biochimica et Biophysica Acta 1366:235‐255
Hondzo MM, Kapur A, Lembi CA. (1998) The effect of small‐scale fluid motion on the green alga
Scenedesmus quadricauda. Hydrobiologia 364:225‐235
Hu Q, Guterman H, Richmond A. (1996) A flat inclined modular photobioreactor for outdoor mass
cultivation of photoautotrophs. Biotechnology and Bioengineering 51:51‐60

References
167
K
J I
Hu Q, Kurano N, Kawachi M, Iwasaki I, Miyachi S. (1998) Ultrahigh‐cell‐density culture of a marine
green alga Chlorococcum littorale in a flat‐plate photobioreactor. Applied Microbiology
and Biotechnology 49:655‐662
Hu Q, Sommerfeld M, Jarvis E, Ghirardi M, Posewitz M, Seibert M, Darzins A. (2008) Microalgal
triacylglycerols as feedstocks for biofuel production: perspectives and advances. Plant
Journal 54:621‐639
Hunt S. (2003) Measurements of photosynthesis and respiration in plants. Physiologia Plantarum
117:314‐325
Hutner SH, Provasoli L, Schatz A, Haskins CP. (1950) Some approaches to the study of the role of
metals in the metabolism of micro‐organisms. Proceedings of the American Philosophical
Society 94:152‐170
Iwatani S, Yamada Y, Usuda Y. (2008) Metabolic flux analysis in biotechnology processes. Biotech‐
nology Letters 30:791‐799
Janssen M, de Winter M, Tramper J, Mur LR, Snel JFH, Wijffels RH. (2000) Efficiency of light utiliza‐
tion of Chlamydomonas reinhardtii under medium‐duration light/dark cycles. Journal of
Biotechnology 78:123‐137
Janssen M, Tramper J, Mur LR, Wijffels RH. (2003) Enclosed outdoor photobioreactors: light re‐
gime, photosynthetic efficiency, scale‐up and future prospects. Biotechnology and Bioengi‐
neering 81:193‐210
Janssen M, Wijffels R, von Stockar U. (2007) Biocalorimetric monitoring of photoautotrophic batch
cultures. Thermochimica Acta 458:54‐64
Jensen RG, Bahr JT. (1977) Ribulose 1,5‐bisphosphate carboxylase‐oxygenase. Annual Review of
Plant Physiology 28:379‐400
Joliot P, Joliot A. (2006) Cyclic electron transfer around Photosystem I. In: Goldbeck JH, editor.
Photosystem I: the light‐driven plastocyanin: ferredoxin oxidoreductase. Dordrecht: Spring‐
er. p 639‐656
Kana TM. (1993) Rapid oxygen cycling in Trichodesmium thiebautii. Limnology and Oceanography
38:18‐24
Kanehisa M, Goto S. (2000) KEGG: Kyoto Encyclopedia of Genes and Genomes. Nucleic Acids Re‐
search 28:27‐30
Kayser A, Weber J, Hecht V, Rinas U. (2005) Metabolic flux analysis of Escherichia coli in glucose‐
limited continuous culture: I. Growth‐rate dependent metabolic efficiency at steady state.
Microbiology 151:693‐706
Kieldsen KR, Nielsen J. (2009) In silico genome‐scale reconstruction and validation of the Coryne‐
bacterium glutamicum metabolic network. Biotechnology and Bioengineering 102:583‐597

168
L
Klein U. (1986) Compartmentation of glycolysis and of the oxidative pentose‐phosphate pathway in
Chlamydomonas reinhardii. Planta 167:81‐86
Kleinegris D, Janssen M, Brandenburg WA, Wijffels RH. (2010) The selectivity of milking of Du‐
naliella salina. Marine Biotechnology 12:14‐23
Kliphuis AMJ, de Winter L, Vejrazka C, Martens DE, Janssen M, Wijffels RH. (2010a) Photosynthetic
efficiency of Chlorella sorokiniana in a turbulently mixed short light‐path photobioreactor.
Biotechnology Progress 26:687‐696
Kliphuis AMJ, Janssen M, End EJ van den, Martens DE, Wijffels RH. (2010b) Light respiration in
Chlorella sorokiniana. Accepted for publication in Journal of Applied Phycology
Kliphuis AMJ, Klok AJK, Martens DE, Lamers PP, Janssen M, Wijffels RH. (2010c) Metabolic model‐
ing of Chlamydomonas reinhardtii: energy requirements for photoautotrophic growth and
maintenance. Submitted for publication
Klughammer C, Schreiber U. (2008) Saturation Pulse method for assessment of energy conversion
in PS I. PAM Application Notes 1:11‐14
Kok B. (1955) On the inhibition of photosynthesis by intense light. Biochimica et Biophysica Acta
21:234‐244
Krause GH, Weis E. (1991) Chlorophyll fluorescence and photosynthesis: the basics. Annual Review
of Plant Physiolology and Plant Molecular Biology 42:313‐349
Kromkamp JC, Beardall J, Sukenik A, Kopecký J, Masojidek J, Van Bergeijk S, Gabai S, Shaham E,
Yamshon A. (2009) Short‐term variations in photosynthetic parameters of Nannochloropsis
cultures grown in two types of outdoor mass cultivation systems. Aquatic Microbial Ecol‐
ogy 56:309‐322
Kühl M, Glud RN, Ploug H, Ramsing NB. (1996) Microenvironmental control of photosynthesis and
photosynthesis‐coupled respiration in an epilithic cyanobacterial biofilm. Journal of Phycol‐
ogy 32:799‐812
Lamers PP, Janssen M, De Vos RCH, Bino RJ, Wijffels RH. (2008) Exploring and exploiting carotenoid
accumulation in Dunaliella salina for cell‐factory applications. Trends in Biotechnology
26:631‐638
Lamers PP, van de Laak CCW, Kaasenbrood PS, Lorier J, Janssen M, de Vos RCH, Bino RJ, Wijffels
RH. (2010) Carotenoid and fatty acid metabolism in light‐stressed Dunaliella salina. Bio‐
technology and Bioengineering 106:638‐648
Lathrop DP, Fineberg J, Swinney HL. (1992) Turbulent flow between concentric rotating cylinders at
large Reynolds number. Physical Review Letters 68:1515‐1518
Lavoie A, de la Noüe J. (1987) Harvesting of Scenedesmus obliquus in wastewaters: auto‐ or biofloc‐
culation? Biotechnology and Bioengineering 30:852‐859
Lee CG, Palsson BO. (1995) Continuous medium perfusion leads to long‐term cell viability and oxy‐
gen production in high‐density photobioreactors. Biotechnology Letters 17:1149‐1154

References
169
M
Lewin RA. (1956) Extracellular polysaccharides of green algae. Canadian Journal of Microbiology
2:665‐672
Ley AC, Mauzerall D. (1982) Absolute absorption cross‐sections for photosystem II and the mini‐
mum quantum requirement for photosynthesis in Chlorella vulgaris. Biochimica et Bio‐
physica Acta 680:95‐106
Ley AC, Mauzerall D. (1986) The extent of energy transfer among photosystem II reaction centers
in Chlorella. Biochimica et Biophysica Acta 850:234‐248
Lippemeier S, Hintze R, Vanselow KH, Hartig P, Colijn F. (2001) In‐line recording of PAM fluores‐
cence of phytoplankton cultures as a new tool for studying effects of fluctuating nutrient
supply on photosynthesis. European Journal of Phycology 36:89‐100
López‐Gejo J, Haigh D, Orellana G. (2009) Relationship between the microscopic and macroscopic
world in optical oxygen sensing: a luminescence lifetime microscopy study. Langmuir
26:2144‐2150
Lourenço SO, Barbarino E, Marquez UML, Aidar E. (1998) Distribution of intracellular nitrogen in
marine microalgae: basis for the calculation of specific nitrogen‐to‐protein conversion
factors. Journal of Phycology 34:798‐811
Malkin S, Fork DC. (1996) Bill Arnold and calorimetric measurements of the quantum requirement
of photosynthesis ‐ once again ahead of his time. Photosynthesis Research 48:41‐46
Mandalam RK, Palsson BO. (1995) Chlorella vulgaris (Chlorellaceae) does not secrete autoinhibitors
at high cell densities. American Journal of Botany 82:955‐963
Mandalam RK, Palsson BO. (1998) Elemental balancing of biomass and medium composition en‐
hances growth capacity in high‐density Chlorella vulgaris cultures. Biotechnology and Bio‐
engineering 59:605‐611
Manichaikul A, Ghamsari L, Hom EFY, Lin C, Murray RR, Chang RL, Balaji S, Hao T, Shen Y, Chavali
AK and others. (2009) Metabolic network analysis integrated with transcript verification
for sequenced genomes. Nature Methods 6:589‐592
McCaskill D, Croteau R. (1993) Procedures for the isolation and quantification of the intermediates
of the mevalonic acid pathway. Analytical Biochemistry 215:142‐149
Mehler AH. (1951) Studies on reactions of illuminated chloroplasts. 1. Mechanism of the reduction
of oxygen and other Hill reagents. Archives of Biochemistry and Biophysics 33:65‐77
Meiser A, Schmid‐Staiger U, Trosch W. (2004) Optimization of eicosapentaenoic acid production by
Phaeodactylum tricornutum in the flat panel airlift (FPA) reactor. Journal of Applied Phycol‐
ogy 16:215‐225
Melis A, Zhang L, Forestier M, Ghirardi ML, Seibert M. (2000) Sustained photobiological hydrogen
gas production upon reversible inactivation of oxygen evolution in the green alga Chlamy‐
domonas reinhardtii. Plant Physiology 122:127‐135
Merchant SS, Prochnik S, Vallon O, Harris EH, Karpowicz SJ, Witman GB, Terry A, Salamov A, Fritz‐

170
P O N
Laylin LK, Sanderfoot AA and others. (2007) The Chlamydomonas genome reveals the evo‐
lution of key animal and plant functions. Science 318:245‐251
Metzger P, Largeau C. (2005) Botryococcus braunii: a rich source for hydrocarbons and related
ether lipids. Applied Microbiology and Biotechnology 66:486‐496
Millan‐Almaraz JR, Guevara‐Gonzalez RG, Romero‐Troncoso RD, Osornio‐Rios RA, Torres‐Pacheco I.
(2009) Advantages and disadvantages on photosynthesis measurement techniques: a re‐
view. African Journal of Biotechnology 8:7340‐7349
Miller RL, Fredrickson AG, Brown AH, Tsuchiya HM. (1964) Hydromechanical method to increase
efficiency of algal photosynthesis. I&EC Process Design and Development 3:134‐143
Miron AS, Gomez AC, Camacho FG, Grima EM, Chisti MY. (1999) Comparative evaluation of com‐
pact photobioreactors for large‐scale monoculture of microalgae. Journal of Biotechnology
70:249‐270
Morita M, Watanabe Y, Saiki H. (2000) High photosynthetic productivity of green microalga Chlor‐
ella sorokiniana. Applied Biochemistry and Biotechnology 87:203‐218
Moroney JV, Somanchi A. (1999) How do algae concentrate CO2 to increase the efficiency of photo‐
synthetic carbon fixation? Plant Physiology 119:9‐16
Murai Y, Oiwa H, Takeda Y. (2005) Bubble behavior in a vertical Taylor‐Couette flow. Journal of
Physics: Conference Series 14:143‐156
Nedbal L, Červený J, Rascher U, Schmidt H. (2007) E‐photosynthesis: a comprehensive modeling
approach to understand chlorophyll fluorescence transients and other complex dynamic
features of photosynthesis in fluctuating light. Photosynthesis Research 93:223‐234
Norsker NH, Barbosa MJ, Vermuë MH, Wijffels RH. (2010) Microalgal production ‐ a close look at
the economics. Biotechnology Advances, DOI: 10.1016/j.biotechadv.2010.08.005
Ogren WL. (1984) Photorespiration: Pathways, regulation, and modification. Annual Review of
Plant Physiology 35:415‐442
Orth JD, Palsson BØ. (2010) Systematizing the generation of missing metabolic knowledge. Biotech‐
nology and Bioengineering DOI: 10.1002/bit.22844
Pirt SJ. (1965) The maintenance energy of bacteria in growing cultures. Proceedings of the Royal
Society of London, Series B: Biological Sciences 163:224‐231
Pirt SJ. (1986) The thermodynamic efficiency (quantum demand) and dynamics of photosynthetic
growth. New Phytologist 102:3‐37
Porra R. (2002) The chequered history of the development and use of simultaneous equations for
the accurate determination of chlorophylls a and b. Photosynthesis Research 73:149‐156
Pottier L, Pruvost J, Deremetz J, Cornet JF, Legrand J, Dussap CG. (2005) A fully predictive model for
one‐dimensional light attenuation by Chlamydomonas reinhardtii in a torus photobioreac‐

References
171
R
Q
tor. Biotechnology and Bioengineering 91:569‐582
Pramanik J, Keasling JD. (1998) Effect of Escherichia coli biomass composition on central metabolic
fluxes predicted by a stoichiometric model. Biotechnology and Bioengineering 60:230‐238
Pulz O. (2001) Photobioreactors: production systems for phototrophic micro‐organisms. Applied
Microbiology and Biotechnology 57:287‐293
Qiang H, Guterman H, Richmond A. (1996) Physiological characteristics of Spirulina platensis
(cyanobacteria) cultured at ultrahigh cell densities. Journal of Phycology 32:1066‐1073
Qiang H, Richmond A. (1996) Productivity and photosynthetic efficiency of Spirulina platensis as
affected by light intensity, algal density and rate of mixing in a flat plate photobioreactor.
Journal of Applied Phycology 8:139‐145
Qiang H, Zarmi Y, Richmond A. (1998) Combined effects of light intensity, light‐path and culture
density on output rate of Spirulina platensis (Cyanobacteria). European Journal of Phycol‐
ogy 33:165‐171
Quicker G, Schumpe A, Konig B, Deckwer WD. (1981) Comparison of measured and calculated oxy‐
gen solubilities in fermentation media. Biotechnology and Bioengineering 23:635‐650
Radakovits R, Jinkerson RE, Darzins A, Posewitz MC. (2010) Genetic engineering of algae for en‐
hanced biofuel production. Eukaryotic Cell 9:486‐501
Raghavendra AS, Padmasree K, Saradadevi K. (1994) Interdependence of photosynthesis and respi‐
ration in plant cells: interactions between chloroplasts and mitochondria. Plant Science
97:1‐14
Ravenel J, Peltier G, Havaux M. (1994) The cyclic electron pathways around photosystem I in Chla‐
mydomonas reinhardtii as determined in vivo by photoacoustic measurements of energy
storage. Planta 193:251‐259
Resende MM, Tardioli PW, Fernandez VM, Ferreira ALO, Giordano RLC, Giordano RC. (2001) Distri‐
bution of suspended particles in a Taylor‐Poiseuille vortex flow reactor. Chemical Engineer‐
ing Science 56:755‐761
Richmond A, Cheng‐Wu Z, Zarmi Y. (2003) Efficient use of strong light for high photosynthetic pro‐
ductivity: interrelationships between the optical path, the optimal population density and
cell‐growth inhibition. Biomolecular engineering 20:229‐236
Richmond A. (2000) Microalgal biotechnology at the turn of the millennium: a personal view. Jour‐
nal of Applied Phycology 12:441‐451
Roels JA. (1983) Relaxation times and their relevance to the construction of kinetic models. In:
Verachtert H, de Mot R, editors. Energetics and kinetics in Biotechnology. Amsterdam:
Elsevier Biomedical Press. p 205‐221
Royce PNC, Thornhill NF. (1991) Estimation of dissolved carbon dioxide concentrations in aerobic
fermentations. AIChE Journal 37:1680‐1686

172
T
S
Salim S, Bosma R, Vermuë MH, Wijffels RH. (2010) Harvesting of microalgae by bio‐flocculation.
Journal of Applied Phycology DOI: 10.1007/s10811‐010‐9591‐x
Schmidt BJ, Lin‐Schmidt X, Chamberlin A, Salehi‐Ashtiani K, Papin JA. (2010) Metabolic systems
analysis to advance algal biotechnology. Biotechnology Journal 5:660‐670
Schwender J, Gemünden C, Lichtenthaler HK. (2001) Chlorophyta exclusively use the 1‐
deoxyxylulose 5‐phosphate/2‐C‐methylerythritol 4‐phosphate pathway for the biosynthe‐
sis of isoprenoids. Planta 212:416‐423
Shastri AA, Morgan JA. (2007) A transient isotopic labeling methodology for 13C metabolic flux
analysis of photoautotrophic micro‐organisms. Phytochemistry 68:2302‐2312
Shelp BJ, Canvin DT. (1980) Utilization of exogenuous inorganic carbon species in photosynthesis
by Chlorella pyrenoidosa. Plant Physiology 65:774‐779
Shikanai T. (2010) Regulation of photosynthetic electron transport. In: Rebeiz CA, Benning C,
Bohnert HJ, Daniell H, Hoober JK, Lichtenthaler HK, Portis AR, Tripathi BC, editors. The
Chloroplast: Basics and Applications. Dordrecht: Springer Science + Business Media. p 347‐
361
Sorokin C, Myers J. (1953) A high‐temperature strain of Chlorella. Science 117:330‐331
Stephanopoulos GN, Aristidou A, Nielsen J. (1998) Metabolic Engineering, principles and method‐
ologies. San Diego: Academic Press.
Stouthamer AH, Bettenhausen C. (1973) Utilization of energy for growth and maintenance in con‐
tinuous and batch cultures of micro‐organisms ‐ reevaluation of method for determination
of ATP production by measuring molar growth yields. Biochimica Et Biophysica Acta
301:53‐70
Sueoka N, Chiang KS, Kates JR. (1967) Deoxyribonucleic acid replication in meiosis of Chlamydomo‐
nas reinhardtii: I. Isotopic transfer experiments with a strain producing eight zoospores.
Journal of Molecular Biology 25:47‐66
Suresh S, Srivastava VC, Mishra IM. (2009) Techniques for oxygen transfer measurement in biore‐
actors: a review. Journal of Chemical Technology and Biotechnology 84:1091‐1103
Takache H, Christophe G, Cornet J‐F, Pruvost J. (2010) Experimental and theoretical assessment of
maximum productivities for the microalgae Chlamydomonas reinhardtii in two different
geometries of photobioreactors. Biotechnology Progress 26:431‐440
Tanada T. (1951) The photosynthetic efficiency of carotenoid pigments in Navicula minima. Ameri‐
can Journal of Botany 38:276‐283
Taymaz‐Nikerel H, Borujeni AE, Verheijen PJT, Heijnen JJ, van Gulik WM. (2010) Genome‐derived
minimal metabolic models for Escherichia coli MG1655 with estimated in vivo respiratory
ATP stoichiometry. Biotechnology and Bioengineering 107:369‐381
Taylor GI. (1923) Stability of a viscous liquid contained between two rotating cylinders. Philosophi‐

References
173
W
V U
cal Transactions of the Royal Society of London, Series A 223:289‐343
Tural BM, Moroney JV. (2005) Regulation of the expression of photorespiratory genes in Chlamy‐
domonas reinhardtii. Canadian Journal of Botany 83:810‐819
Turpin DH, Elrifi IR, Birch DG, Weger HG, Holmes JJ. (1988) Interactions between photosynthesis,
respiration, and nitrogen assimilation in microalgae. Canadian Journal of Botany 66:2083‐
2097
Tyystjarvi E, Karunen J, Lemmetyinen H. (1998) Measurement of photosynthetic oxygen evolution
with a new type of oxygen sensor. Photosynthesis Research 56:223‐227
Ugwu CU, Aoyagi H, Uchiyama H. (2007) Influence of irradiance, dissolved oxygen concentration,
and temperature on the growth of Chlorella sorokiniana. Photosynthetica 45:309‐311
Valle O, Lien T, Knutsen G. (1981) Fluorometric determination of DNA and RNA in Chlamydomonas
using ethidium bromide. Journal of Biochemical and Biophysical Methods 4:271‐277
van der Tol C, Verhoef W, Rosema A. (2009) A model for chlorophyll fluorescence and photosyn‐
thesis at leaf scale. Agricultural and Forest Meteorology 149:96‐105
van Winden W, Schipper D, Verheijen P, Heijnen J. (2001a) Innovations in generation and analysis
of 2D [13C,1H] COSY NMR spectra for metabolic flux analysis purposes. Metabolic Engineer‐
ing 3:322‐343
van Winden W, Verheijen P, Heijnen S. (2001b) Possible pitfalls of flux calculations based on 13C‐
labeling. Metabolic Engineering 3:151‐162
Vona V, Di Martino Rigano V, Lobosco O, Carfagna S, Esposito S, Rigano C. (2004) Temperature
responses of growth, photosynthesis, respiration and NADH:nitrate reductase in cryophilic
and mesophilic algae. New Phytologist 163:325‐331
Vona V, Rigano VM, Esposito S, Carillo P, Carfagna S, Rigano C. (1999) Growth, photosynthesis, and
respiration of Chlorella sorokiniana after N‐starvation. Interactions between light, CO2 and
NH4+ supply. Physiologia Plantarum 105:288‐293
Ward OP, Singh A. (2005) Omega‐3/6 fatty acids: alternative sources of production. Process Bio‐
chemistry 40:3627‐3652
Weger HG, Herzig R, Falkowski PG, Turpin DH. (1989) Respiratory losses in the light in a marine
diatom: measurements by short‐term mass spectrometry. Limnology and Oceanography
34:1153‐1161
Weissman JC, Goebel RP, Benemann JR. (1988) Photobioreactor design: Mixing, carbon utilization,
and oxygen accumulation. Biotechnology and Bioengineering 31:336‐344
Wijffels RH, Barbosa MJ, Eppink MHM. (2010) Microalgae for the production of bulk chemicals and
biofuels. Biofuels, Bioproducts and Biorefining 4:287‐295
Wingler A, Lea PJ, Quick WP, Leegood RC. (2000) Photorespiration: metabolic pathways and their
174
X
Z
Y
role in stress protection. Philosophical Transactions of the Royal Society B: Biological Sci‐
ences 355:1517‐1529
Xue XP, Gauthier DA, Turpin DH, Weger HG. (1996) Interactions between photosynthesis and respi‐
ration in the green alga Chlamydomonas reinhardtii ‐ characterization of light‐enhanced
dark respiration. Plant Physiology 112:1005‐1014
Yang C, Hua Q, Shimizu K. (2000) Energetics and carbon metabolism during growth of microalgal
cells under photoautotrophic, mixotrophic and cyclic light‐autotrophic/dark‐heterotrophic
conditions. Biochemical Engineering Journal 6:87‐102
Yang C, Hua Q, Shimizu K. (2002) Metabolic flux analysis in Synechocystis using isotope distribution
from 13C‐labeled glucose. Metabolic Engineering 4:202‐216
Yang L, Chu L, Chen W. (2006) Study on the flow field inside the microfiltration separator with ro‐
tary tubular membrane. Separation Science And Technology 41:1513‐1525
Zijffers JW, Schippers KJ, Zheng K, Janssen M, Tramper J, Wijffels RH. (2010) Maximum photosyn‐
thetic yield of green microalgae in photobioreactors. Marine biotechnology DOI: 10.1007/
s10126‐010‐9258‐2


Summary

178
M icroalgae are a potential source for a wide range of products, such as carote‐noids, lipids, hydrogen, protein and starch, which are of interest for food, feed
and biofuel applications. Maximization of microalgal product and biomass productivity in
(large‐scale) outdoor photobioreactors is important for commercial production of these
compounds. Microalgae are unicellular eukaryotic organisms capable of using (sun) light
as an energy source through photosynthesis. During photoautotrophic growth microal‐
gae consume CO2 and produce O2. In addition, O2 is taken up in a number of processes
such as mitochondrial respiration and photorespiration.
A very important objective of applied algae research is to maximize biomass (or product)
yield and at the same time minimize the energy input to reduce cultivation costs. Insight
in the metabolism of the microalgae is a valuable tool to optimize cultivation parameters
accordingly.
To be able to study the effect of cultivation parameters such as mixing on productivity of
algal cultures we designed a lab‐scale photobioreactor in which a short light path (SLP) of
12 mm is combined with controlled mixing and aeration (Chapter 2). Mixing was pro‐
vided by rotating an inner tube in the cylindrical cultivation vessel creating Taylor vortex
flow and as such it could be uncoupled from aeration. Gas exchange was monitored on‐
line to gain insight in growth and productivity. The maximal productivity, hence photo‐
synthetic efficiency, of Chlorella sorokiniana cultures at high light intensities (1500 µmol
m‐1 s‐1) was investigated in this Taylor vortex flow SLP photobioreactor. We performed
duplicate batch experiments at three different mixing rates: 70, 110 and 140 rpm, all in
the turbulent Taylor vortex flow regime. For the mixing rate of 140 rpm we calculated a
quantum requirement for oxygen evolution of 21.2 mol PAR photons per mol O2 and a
yield of biomass on light energy of 0.8 g mol‐1. The maximal photosynthetic efficiency
was found at relatively low biomass densities (2.3 g L‐1) at which light was just attenu‐
ated before reaching the rear of the culture. Upon doubling the mixing rate we only
found a small increase of 5% in productivity. Based on these results we concluded that
the maximal productivity and photosynthetic efficiency for C. sorokiniana can be found
at that biomass concentration where no significant dark zone is present and that the
influence of mixing‐induced light/dark fluctuations is marginal.
In addition to moving the algae through the light gradient in the photobioreactor and
preventing the cells from settling, mixing is also needed to supply CO2 to the culture and
remove the O2 produced in photosynthesis. This O2 can easily build up to high concentra‐
Summary
179
tions in closed photobioreactors and this can have a negative effect on productivity and
inhibit growth of the microalgae. If mixing is decreased to reduce energy consumption,
which is preferable, this effect can be even larger because more O2 can build up in the
culture. In illuminated microalgal cells several processes in which O2 is involved occur
simultaneously. The cultivation conditions in the experiments in Chapter 3 where chosen
in such a way that two processes dominated, photosynthesis and mitochondrial light
respiration. The net O2 exchange rate, which could be measured on‐line, is the sum of
the O2 production by photosynthesis (gross OPR) and O2 consumption through respira‐
tion in the mitochondria (OUR). To know the rates of these two processes one of these
had to be measured. We measured the immediate post‐illumination respiratory O2 up‐
take rate (OUR) in‐situ, using fiber‐optic O2 micro‐sensors, and a small and simple exten‐
sion of the cultivation system. This method enabled rapid and frequent measurements
without disturbing the cultivation and growth of the microalgae. Two batch experiments
were performed with C. sorokiniana in the SLP photobioreactor and the OUR was meas‐
ured at different time points during cultivation. The net O2 production rate (net OPR)
was measured on‐line. Adding the OUR and net OPR gave the gross O2 production rate
(gross OPR), which is a measure for the O2 evolution by photosynthesis. The gross OPR
was 35‐40% higher than the net OPR for both experiments, showing that photosynthesis
is underestimated when only looking at net OPR. The respiration rate is known to be
related to the growth rate and it is suggested that faster algal growth leads to a higher
energy (ATP) requirement and, as such, respiratory activity increases. This hypothesis is
supported by our results, as the specific OUR was highest in the beginning of the batch
culture when the specific growth rate was highest. In addition, the specific OUR de‐
creased towards the end of the experiments until it reached a stable value of around 0.3
mmol O2 h‐1 g‐1. This suggests that respiration could fulfill the maintenance requirements
of the microalgal cells.
To obtain the desired insight in the metabolism (more specifically O2 metabolism) and
understand the mechanisms behind the allocation of light energy for microalgal growth
and maintenance, we constructed a metabolic model describing the metabolism of the
green microalga Chlamydomonas reinhardtii (Chapter 4). Starting from genomic informa‐
tion a large network with over 300 enzymatic reactions was obtained which was reduced
to a smaller, more practical network by lumping linear pathways. The resulting network
contained 160 reactions and 164 compounds. Seven chemostat experiments were per‐

180
formed at different growth rates to determine the energy requirements for maintenance
and biomass formation in vivo. The chemostats were run at low light intensities resulting
in a high biomass yield on light of 1.25 g mol‐1. The ATP requirement for biomass forma‐
tion from biopolymers was determined to be 109 mmol ATP g‐1 (18.9 mol mol‐1) and the
maintenance requirement was determined to be 2.85 mmol ATP g‐1 h‐1. With these en‐
ergy requirements included in the metabolic network, the network described the pri‐
mary metabolism of C. reinhardtii and can be used for modeling of C. reinhardtii growth
and metabolism. Simulations confirmed that cultivating microalgae at low growth rates is
unfavorable because of the high maintenance requirements which result in low biomass
yields. At high light supply rates biomass yields will decrease due to light saturation ef‐
fects. Thus, to optimize biomass yield on light energy in photobioreactors, an optimum
between low and high light supply rates should be found. In addition, these simulations
showed that respiration can provide both energy for maintenance and additional energy
to support growth.
With this model Flux Balance Analysis (FBA) could be performed to study the effect of
elevated O2 concentrations on the metabolism and the biomass yield of C. reinhardtii
(Chapter 5). High O2 : CO2 ratios can have a negative effect on growth and productivity of
microalgae. To investigate the effect of O2 and CO2 concentrations and the ratio between
these on the metabolism of C. reinhardtii we performed turbidostat experiments at dif‐
ferent O2 : CO2 ratios. These experiments showed that elevated O2 concentrations and
the corresponding increase in the ratio of O2 : CO2 common in photobioreactors led to a
reduction of growth and biomass yield on light with 20‐30%. This was most probably
related to the oxygenase activity of Rubisco and the resulting process of photorespira‐
tion. Using FBA with measured rates for each experiment we were able to quantify the
ratio of the oxygenase reaction to the carboxylase reaction of Rubisco and could demon‐
strate that photorespiration indeed could have caused the reduction in biomass yield on
light. The calculated ratio of the oxygenase reaction to the carboxylase reaction was
16.6% and 20.5% for air with 2% CO2 and 1% CO2 respectively. Thus, photorespiration
has a significant impact on the biomass yield on light already at conditions common in
photobioreactors (air with 2% CO2).
To thoroughly understand the energy metabolism of microalgal cells and with that the
conversion of light energy into biomass, insight into the different processes involved in
O2 production and uptake and CO2 consumption and production is necessary. An over‐
Summary
181
view of the processes that play a dominant role in the generation of metabolic energy
and reductants is given in Chapter 6. To reach high biomass yields on light (i.e. productiv‐
ity) conditions at which processes such as the Mehler reaction, photoinhibition and
photorespiration occur should be avoided. A number of measurement methods are pro‐
posed which could be used to determine under which cultivation conditions certain proc‐
esses take place and to what extent, so that these conditions possibly can be avoided.
These measurements need to be combined with flux balance analysis in order to accu‐
rately assess the real implications of these pathways for the energy budget of the micro‐
algae. For this purpose the metabolic model for C. reinhardtii itself can be further im‐
proved and expanded by introducing cellular compartments and possibly adding desired
product pathways. This will give more insight in the metabolism and the effect of differ‐
ent parameters on the conversion of light energy into biomass or useful products. If in‐
cluding a dynamic description of the light reactions of photosynthesis it might ultimately
be possible to make predictions on biomass and product yield based on the light regime
the microalgae are exposed to.

182
M icroalgen zijn een potentiële bron van een breed scala aan producten, zoals carotenoïden, vetten, waterstofgas, eiwitten en zetmeel, die van belang zijn
voor toepassingen op het gebied van voeding, diervoeder en biobrandstoffen. Het
maximaliseren van product en biomassa productiviteit in (grootschalige) buiten gelegen
fotobioreactoren is belangrijk voor de commerciële productie van deze verbindingen.
Microalgen zijn eencellige eukaryote organismen die door middel van fotosynthese in
staat zijn zonlicht als energiebron te gebruiken voor groei. Tijdens hun fotoautotrofe
groei nemen de microalgen CO2 op en produceren ze O2. De CO2 wordt ingebouwd in
nieuwe algenbiomassa. Verder wordt O2 weer opgenomen, en CO2 afgegeven, in een
aantal deelprocessen, waaronder mitochondriële respiratie en fotorespiratie.
Een belangrijk streven binnen het toegepaste algenonderzoek is het maximaliseren van
de opbrengst aan biomassa of product en het minimaliseren van de energetische input,
om zodoende de kweekkosten laag te houden. Inzicht in het metabolisme van
microalgen is een belangrijk hulpmiddel om de kweekomstandigheden zodanig te
optimaliseren.
Om het effect van kweekparameters zoals menging op de productiviteit van
algenkweken te kunnen bepalen hebben we een labschaal fotobioreactor ontworpen,
waarin een korte lichtweg (short ligth path, SLP) van 12 mm gecombineerd is met
gecontroleerde menging en beluchting (Hoofdstuk 2). Menging vond plaats door rotatie
van een buis in het cylindrische kweekvat, waardoor een Taylor‐vortexstroming
ontstond. Op deze manier kon de menging losgekoppeld worden van de beluchting. On‐
line registratie van de gasuitwisseling gaf inzicht in de groei en productiviteit. In deze
Taylor‐vortex SLP‐fotobioreactor hebben we de maximale productiviteit, en dus ook
maximale fotosynthetische efficiëntie, bepaald van Chlorella‐kweken (C. sorokiniana) bij
een hoge lichtintensiteit (1500 µmol m‐1 s‐1). Batch‐experimenten zijn in tweevoud
uitgevoerd bij drie verschillende mengsnelheden: 70, 110 en 140 rpm, allemaal onder de
omstandigheid van turbulente Taylor‐vortexstroming. Voor de mengsnelheid van 140
rpm hebben we een quantum behoefte voor zuurstofvorming berekend van 21.2 mol
PAR fotonen per mol O2, en een opbrengst van biomassa op lichtenergie van 0.8 g mol‐1.
We vonden deze maximale fotosynthetische efficiëntie bij relatief lage biomassa‐
concentraties (2.3 g L‐1), waarbij al het licht bijna volledig was geabsorbeerd maar het
inwendige van de reactor nog niet volledig donker was. Verdubbeling van de
mengsnelheid leidde slechts tot 5% toename in productiviteit. Op basis van deze

Samenvatting
183
resultaten concluderen we dat de maximale productiviteit en fotosynthetische efficiëntie
van C. sorokiniana ligt bij een biomassaconcentratie waarbij zich nog geen donkere zone
ontwikkeld heeft en dat onder deze omstandigheden de invloed van door menging
geïnduceerde licht‐/donker cycli marginaal is.
Menging blijft echter noddzakelijk om te voorkomen dat de cellen bezinken. Verder
worden algenculturen veelal gemengd door middel van beluchting die noodzakelijk is om
CO2 in de kweek te brengen en de tijdens de fotosynthese gevormde O2 af te voeren. Als
deze beluchting niet voldoende is kunnen hoge concentraties O2 ontstaan met als gevolg
een negatief effect op de productiviteit en remming van de groei van de microalgen. Als
de mengsnelheid wordt verlaagd om het energieverbruik te reduceren (hetgeen de
voorkeur verdient) dan kan dit negatieve effect toenemen omdat zich meer O2 kan
ophopen in de kweek. In microalgencellen vinden in het licht simultaan verschillende
processen plaats waarbij O2 is betrokken. De kweekomstandigheden van de
experimenten in Hoofdstuk 3 zijn zodanig gekozen dat twee processen dominant waren:
fotosynthese en mitochondriële (licht)respiratie. De netto O2‐uitwisselingssnelheid
(oxygen production rate, netto OPR), die on‐line gemeten kon worden, is de som van de
O2‐productie door fotosynthese (bruto OPR) en O2‐consumptie via respiratie in de
mitochondriën (oxygen uptake rate, OUR). Om te kunnen weten in welke mate deze
processen optraden moest eén van beide worden gemeten. We bepaalden de
respiratoire O2‐opnamesnelheid (OUR) in‐situ, direct nadat een algenmonster uit het
licht in het donker was geplaatst, met behulp van glasvezel O2‐microsensoren en een
kleine, eenvoudige uitbreiding van het kweeksysteem. Deze methode stelde ons in staat
snel en veelvuldig te meten zonder de kweek en de groei van de microalgen te verstoren.
We hebben met C. sorokiniana twee batch‐experimenten uitgevoerd in de SLP‐
fotobioreactor, waarbij de OUR gemeten werd op verschillende momenten tijdens de
kweek. De netto O2‐productiesnelheid (netto OPR) werd on‐line gemeten. Optellen van
de OUR en de netto OPR gaf de bruto O2‐productiesnelheid (bruto OPR), die een maat is
voor de vorming van O2 door fotosynthese. De bruto OPR was voor beide experimenten
35‐40% hoger dan de netto OPR, wat liet zien dat de fotosynthese wordt onderschat als
er alleen wordt gekeken naar netto OPR. Het is bekend dat de respiratiesnelheid
gerelateerd is aan de groeisnelheid en gedacht wordt dat snellere groei van algen leidt
tot een hogere energetische (ATP‐)behoefte en daarmee tot een hogere
respiratiesnelheid. Onze resultaten ondersteunen deze hypothese, aangezien de
specifieke OUR het hoogste was tijdens het begin van de batchkweek, waar ook de

184
specifieke groeisnelheid het hoogst was. Verder nam de specifieke OUR af naarmate het
experiment vorderde, totdat een stabiele waarde werd bereikt van ongeveer 0.3 mmol
O2 h‐1 g‐1. Deze waarde komt overeen met de zogenaamde onderhoudsbehoefte van
deze microalg zoals deze in eerder onderzoek is gemeten op basis van de hoeveelheid
geabsorbeerde lichtenergie.
Om het gewenste inzicht te verkijgen in het metabolisme (specifieker, het O2‐
metabolisme), en om de mechanismen te begrijpen die ten grondslag liggen aan de
verdeling van lichtenergie ten behoeve van groei en onderhoud van de microalgen,
hebben we een metabool netwerk model gebouwd dat het metabolisme beschrijft van
de groene microalg Chlamydomonas reinhardtii (Hoofdstuk 4). Op basis van genomische
informatie en literatuur werd een uitgebreid netwerk van 300 enzymatische reacties
geconstrueerd, waaruit door het samenvoegen van lineaire metabole routes een kleiner
en praktischer netwerk gedestilleerd kon worden. Het resulterende netwerk bevatte 160
reacties en 164 verbindingen. Vervolgens werden zeven chemostaat‐experimenten
uitgevoerd bij verschillende groeisnelheden, om na te gaan hoeveel energie er nodig is
voor onderhoud en biomassaproductie in vivo. De chemostaten werden uitgevoerd bij
lage lichtintensiteiten om lichtverzadiging te voorkomen. Dit resulteerde in een hoge
biomassaopbrengst op licht van 1.25 g mol‐1. De benodigde hoeveelheid ATP voor de
vorming van biomassa uit biopolymeren werd vastgesteld op 109 mmol ATP g‐1 (18.9 mol
mol‐1), en de onderhoudsbehoefte werd vastgesteld op 2.85 mmol ATP g‐1 h‐1. Door het
invoeren van deze energetische behoeften in het metabole netwerk kon het primaire
metabolisme van C. reinhardtii beschreven worden en kan het gebruikt worden om groei
en metabolisme van C. reinhardtii te modelleren. Simulaties bevestigden dat het kweken
van microalgen bij lage groeisnelheden en hoge biomassaconcentraties (lage
lichttoevoer snelheid) niet de voorkeur verdient, vanwege de hoge onderhouds‐
behoeften die leiden tot een lage biomassaopbrengst. Bij hoge groeisnelheden en lage
biomassaconcentraties (en de bijbehorenede hoge lichttoevoer snelheid) zal de
biomassaopbrengst afnemen als gevolg van lichtverzadigingseffecten. Om de
biomassaopbrengst op lichtenergie in fotobioreactoren te optimaliseren moet dus een
optimum gevonden worden tussen een lage en een hoge lichttoevoer snelheid. Verder
lieten de simulaties ook zien dat het aannemelijk is dat respiratie zowel energie levert
ten behoeve van groei alswel voor onderhoud.

Samenvatting
185
Met dit model kon Flux Balans Analyse (FBA) worden uitgevoerd, om het effect te
kunnen bestuderen van verhoogde O2‐concentraties op het metabolisme en de
biomassaopbrengst van C. reinhardtii (Hoofdstuk 5). Hoge O2 : CO2‐verhoudingen
kunnen een negatief effect hebben op de groei en productiviteit van microalgen. Om het
effect te kunnen bepalen van O2‐ en CO2‐concentraties en hun onderlinge verhouding op
het metabolisme van C. reinhardtii hebben we turbidostaatexperimenten uitgevoerd bij
verschillende O2 : CO2 verhoudingen, door te begassen met lucht of N2 verrijkt met 1% of
2% CO2. Deze experimenten lieten zien dat verhoogde O2‐concentraties en de bij‐
behorende toename in de verhouding O2 : CO2 (gebruikelijk in fotobioreactoren) leidden
tot een afname in groei en biomassaopbrengst op licht van 20‐30%. Dit was naar alle
waarschijnlijkheid te wijten aan de oxygenaseactiviteit van Rubisco en het daaruit
voortvloeiende proces van fotorespiratie. Door FBA toe te passen met de gemeten
snelheden uit elk experiment als randvoorwaarden konden we de verhouding
kwantificeren tussen de oxygenasereactie en de carboxylasereactie van Rubisco, en
konden we laten zien dat fotorespiratie inderdaad verantwoordelijk zou kunnen zijn voor
de reductie in biomassaopbrengst op licht. De verhouding tussen de oxygenase‐ en de
carboxylasereactie was 16.6% en 20.5% voor lucht met respectievelijk 2% CO2 en 1% CO2.
Fotorespiratie blijkt dus een significante invloed te hebben op de biomassaopbrengst op
licht onder omstandigheden die gebruikelijk zijn in fotobioreactoren (lucht met 2% CO2).
Om het metabolisme van microalgencellen (en daarmee de omzetting van lichtenergie in
biomassa) beter te begrijpen, is inzicht nodig in de verschillende processen die betrokken
zijn bij de productie en opname van O2 en de consumptie en productie van CO2. Een
overzicht van de processen die het meest belangrijk zijn voor het genereren van
metabole energie en reductanten is te vinden in Hoofdstuk 6. Om hoge biomassa‐
opbrengsten op licht te kunnen bereiken dienen condities, waaronder processen zoals de
Mehler‐reactie, fotoinhibitie en fotorespiratie optreden, te worden vermeden. We
beschrijven in dit hoofdstuk een aantal meetmethoden die kunnen worden gebruikt om
te bepalen onder welke kweekomstandigheden dit soort processen plaatsvinden, en in
welke mate, zodat deze omstandigheden kunnen worden vermeden. Dergelijke
metingen moeten gecombineerd worden met FBA om een nauwkeurige inschatting te
kunnen maken van de daadwerkelijke implicaties van processen als de Mehler‐reactie op
het energiebudget van de microalgen. Om dit te kunnen realiseren, moet het metabole
netwerk model van C. reinhardtii uitgebreid worden door de introductie van cellulaire

compartimenten en eventueel ook gewenste metabole product-routes. Uiteindelijk levert dit meer inzicht op in het metabolisme en het effect van procesomstandigheden op de omzetting van lichtenergie in biomassa en/of bruikbare producten. Als verder ook een dynamische beschrijving van de fotosynthetische lichtreacties wordt ingebouwd, kan dit uiteindelijk leiden tot de mogelijkheid de biomassa- en productopbrengst te voor-spellen op basis van het lichtregime waaraan de microalgen zijn blootgesteld.
186

Samenvatting
187


Dankwoord

190
H ier ligt het dan, het eindresultaat van een hoop plezier, gepiel en gepruts in het lab, experimenten, modelleren en schrijfwerk. Wat was het leuk om met die leuke
kleine algjes te werken (oooh, kijk! Ze zwemmen! Agossie!) in zo’n supermooie
photobioreactor, mijn ‘kindje’ en mijn trots (incl. gelukbrengende kerstbal). Erg populair,
ook buiten de vakgroep, heeft menig krantje gesierd en zo nu ook de omslag van mijn
proefschrift! Al dat werk heb ik natuurlijk niet alleen gedaan en ik wil iedereen dan ook
heel erg bedanken, zonder jullie was het niet gelukt!
René, dankjewel dat je me lang geleden op de fiets vroeg of ik al wist wat ik ging doen,
ja, dat wist ik, bij jou promoveren! Dankjewel voor je begeleiding, over toppen en door
dalen, en voor je input en frisse kijk op mijn resultaten en artikelen. Ik ben ook blij dat je
mij wist af te remmen als ik dan toch liever weer een (in mijn ogen) niet zo fraai
experiment over wilde doen, terwijl jij vond dat het prima publiceerbaar zou zijn zo (wat
natuurlijk ook zo was, zie het resultaat!). Ook dankjewel voor alle avonturen, zowel
boven als onder water in binnen en buitenland. Ik zal nooit onze ‘infamous’ duik in
Ierland vergeten, daar werd pijnlijk duidelijk dat macroalgen toch behoorlijk
misselijkmakend kunnen zijn…, nooit aan beginnen dus. Marcel en Dirk, ik ben blij dat
jullie mijn begeleiders waren. Marcel, met al je kennis en geniale ideëen stimuleerde je
me om het onderste uit de kan te halen. Dankzij jouw gedetailleerde commentaar
werden de artikelen beter en de commentaren naar de reviewers een stuk subtieler. Fijn
dat ik altijd langs kon lopen voor advies of gewoon een praatje! Dirk, dankjewel dat jij na
een half jaartje ook bij ‘de mannen’ kwam horen! Met jouw input is het metabole model
een feit geworden en heb ik er ook mee kunnen simuleren. Bedankt voor je geduld bij de
eindeloze stroom model‐vragen/problemen, voor je hulp bij de model artikelen en
bovenal voor je luisterend oor.
De bioreactor en het meetsysteem kwamen niet zomaar werkend in het lab te staan,
daar heeft een heleboel werk in gezeten. ‘Mannen van de werkplaats’, Jan, Hans, André,
Reinoud en Hans, heel erg bedankt voor al jullie werk, het bouwen van de reactor en het
aanpassen of repareren als hij keer op keer weer kuren had of als de electronica het
weer eens begaf (of gewoon als ik een O‐ringetje nodig had). Fred, dankjewel voor al je
technische hulp in het lab en voor het programmeren van de DAQ (en voor al die
gezellige koffie‐momenten). Wat ben ik blij dat je nog een half dode zuurstofprobe met
toebehoren in de kast had liggen. De basis voor een mooie meetmethode en een mooi

Dankwoord
191
artikel, het was wat gepruts, maar met koffie erbij is alles mogelijk (inclusief geniale
stellingen bedenken)!
Natuurlijk heb ik niet al het werk zelf gedaan, een hoop werk is verzet door mijn
afstudeerstudenten. Carsten en Lenneke, jullie waren mijn eerste studenten en jullie
hebben de experimenten gedaan die geleid hebben tot hoofdstuk 2, het eerste artikel.
Bedankt voor al jullie werk, ook in de avonduurtjes! Blijkbaar is het toch niet té
afschrikwekkend geweest, fijn dat jullie nu ook AIO zijn met algjes, succes! Marieke, wat
een gepruts met die zuurstofprobes, maar wel helemaal alleen een chemostaat gedraaid
terwijl ik in Japan was! Leuk dat je weer aan het werk bent met de STT photobioreactor,
maar groen vind ik hem toch mooier…. Yusak, thank you for all the work in the lab.
Anne, mijn ‘partner‐in‐crime’, dankjewel voor al je werk tijdens je afstudeervak en ook
daarna, toen je ook AIO werd op een soort vervolg project van het mijne, jij ook succes!
Het was toch gezellig hè, al die uren (dagen, weken) samen achter de computer om de
experimenten te simuleren met het model en daarna het schrijven van ons artikel,
inclusief de ups en downs (bij beiden hoort natuurlijk chocolade!). Ons artikel is ‘the
best’, het zit hem vast in de initialen en de voornaam. Ik ga je missen!
Dan ben ik aangeland bij de vakgroep. Allereerst wil ik mijn lieve kamergenootjes,
Dorinde, Elsbeth, Thanawit en sinds kort Kim, bedanken. Thank you for sharing good
times (almost five years!), chatting about everything and anything, filling and emptying
the ‘droppot’ and for making our room a happy (and green) place where I truly felt at
home! Packo en Dorinde, VICI‐buddies, het was fijn om met z’n drieën de Dunaliella‐
uitdaging aan te gaan. Helaas ben ik overgelopen naar zoetwater algjes (foei!) en zijn we
er niet meer aan toegekomen om die superalg te creeëren en een prachtig productie‐
proces op te zetten… Dankjulliewel voor al het algen‐gepraat, de besprekingen,
presentaties en gezellige brainstorm‐sessies! Lunchwandelaars, Frank, Hylke, Sebas,
Janneke, Dione, Mgeni, Olivier, Marleen, van Unitas pannenkoeken tot Arboretum
wandelingen, bedankt voor de broodnodige ontspanning iedere dag en bedankt voor
een plek om vanalles te bespreken en mijn hart te luchten. Lieve PRE‐ers en ex‐PRE‐ers,
Marzia, Dominick, Marieke, Klaske, Dorinde, Elsbeth, Lieke, Mgeni, Frank, Francisco,
Packo, Maartje, Marjoleine, Petra, Rouke, Sina, Pieter, Anja, Sayam, Jos, Martin, Hylke,
Sebastiaan, Fred, Rik, Arjen, Miranda, Joyce, Jan, Koen, Tim, Daniël, Jan‐Willem, Mathieu,
Maria C, Maria B, Floor, Marian en iedereen die ik vergeten ben, allemaal super bedankt

192
voor alle fijne momenten bij labuitjes, AIO‐reizen, borrels en koffiehoek momenten!
Buiten het lab wil ik graag ook nog wat mensen bedanken. Lieve Miriam, bedankt voor
de heerlijke etentjes, sushi, filmpjes, feestjes en gewoon avondjes kletsen. Hopelijk gaan
we hier gewoon mee door, al dan niet over de hele wereld! Frank, mede‐semi‐bioloog,
dankje voor alle libel/vlinder/vogel‐excursies, foute filmavondjes, biertjes, chocolade‐
taart (mmmPIE!) en rare kampeermomenten. Ik ben blij dat je mijn paranimf wilt zijn!
Marcel, Floor, Tim, Marieke en Klaske, bedankt voor de heerlijke reisjes en geweldige
duiken. Het was fantastisch en hopelijk gaan we nog veel vaker op avontuur onder
water! Nardy en Joeri, ook al zien we elkaar heel weinig, bedankt voor de gezellige
avondjes en het wordt duidelijk tijd voor een reünie. Ruben, Richard, Corjan, Frank,
Wiger, Nick en Yvette, bedankt voor alle fijne concerten en festivals waar we samen
geweest zijn, All Hail The Mud! Lieve Vivae, bedankt voor alle heerlijke muziek, super
weekenden en prachtige concerten die we gegeven hebben en gaan geven. Een zondag
VivaVoce is goed voor weken mooie muziek in mijn hoofd! De Utrecht‐clan: Lot, Sofie en
Sim, Mark, Noor, Luka en Juultje, Nicole, Frederik, Merlijntje en Catootje, fijn dat jullie
er altijd voor ons zijn. Hopelijk kunnen we wat vaker afspreken! André en Kelly, bedankt
voor de supergezellige avondjes, dat er maar meer mogen volgen nu we een stuk dichter
in de buurt komen wonen! Mgeni and Hashim, thanks for the great evenings with good
food and fun! Annelies, Rogier en Isis, drukdrukdruk maar zo nu en dan moet er tapas
gegeten worden! Stephanie, we met at the ISAP and discovered we had a lot in common,
capoeira (playing at the conference dinner, how awesome was that!), AIMS, diving and
Chlamydomonas! Our favourite algae. Thank you for exchanging knowledge, protocols
and capoeira invitations! Nu ik het toch over capoeira heb, bedankt trainings‐maatjes,
voor alle heerlijke trainingen, festivals, workshops en nieuwjaarsdinertjes: Mourão,
Natureza, Espoleta, Pulginha, Poty, Marcha Lenta, Ferrugem, Espaguete, Durinho, FifiR,
Betty Boop, Pé de Pau, Diamante, Duente, Modelo, Coisa, Congo, Tarzan, Paulien, Per‐
nelle, Tartaruga, Sargento, Palma, Merel en iedereen die ik vergeten ben.
En dan last but zeker not least, mijn familie. Pap en mam, jullie staan altijd achter mij en
hebben me altijd gestimuleerd. Zonder jullie zou ik niet zijn waar ik nu ben, ik hou van
jullie! Ed, lief groot klein broertje, jou kan ik altijd bellen en andersom, dankje daarvoor.
Ik vind het heel fijn dat jij aan mijn zijde staat als paranimf! Lieve omi, bedankt voor uw
altijd luisterend oor, dat u altijd meeleeft en ook precies begrijpt waar ik mee bezig ben.

Dankwoord
193
‘Schoonmama’ Tineke en Paul, bedankt voor jullie steun en dat jullie er altijd zijn voor
ons. Mirjam, schoon zusje, en Lola, fijn dat we in de buurt komen wonen, lufjoe!
Als allerlaatste wil ik natuurlijk Michaël bedanken. Lievie, zonder jou was dit niet
mogelijk geweest. Dankje voor je liefde, steun, gekkigheid, plezier, muziek en alle
avonturen die we hebben beleefd en gaan beleven. Samen zijn wij eén en kunnen we de
hele wereld aan! Ik hou van je!
Liefs,
Annette


Curriculum
Vitae

196

Curriculum Vitae
197
Curriculum Vitae
Anna Marguérita Jeanetta (Annette) Kliphuis was born in
Bilthoven, the Netherlands, on March 25th 1981. She went to
primary school in her hometown Zeist and attended secondary
school at the Christelijk College Zeist. After receiving her VWO
(gymnasium) diploma in 1999 she started her studies in
Bioprocess Engineering at Wageningen University. In her major
thesis project at the Bioprocess Engineering group of
Wageningen University she worked on cultivation and growth
measurements of the marine sponge Chondrosia reniformis. Her two minor theses
projects dealt with the role of DDM1 in DNA‐methylation in roots of Arabidopsis thaliana
(performed at the Department of Microbiology, Wageningen University) and modelling
controlled release of water through biodegradable polymers (performed at the Biopro‐
cess Engineering group of Wageningen University). For her internship Annette went to
Australia where she worked on accessing marine natural products for herbicide and drug
discovery by scaling up fungal fermentations and constructing DNA libraries at the Aus‐
tralian Institute of Marine Science (AIMS) in Townsville. During her studies she organised
the international symposium “Marine Biotechnology: An Ocean Full of Prospects?”. After
graduating in September 2005 she started her PhD project at the Bioprocess Engineering
group of Wageningen University, focusing on the metabolism of green microalgae. Cur‐
rently she is working as an Associate Scientist at the DSM Biotechnology Center / Fer‐
mentation in Delft, the Netherlands.

198

Training activities
199
Overview of completed training activities
Courses
Discipline specific
Biosystems Engineering, Bioreactors and Cell Factories (2005)
Marine Biology for Divers (2005)
LabVIEW course (2006)
Bioreactor Design and Operation (2006)
Basic Statistics (2007)
General courses
VLAG PhD week (2005)
PhD Competence Assessment (2005)
Supervising BSc and MSc thesis work (2006)
Project‐ and time management (2006)
Techniques for writing and presenting a scientific paper (2006)
Career Perspectives (2009)
Conferences
NorthSea days, Vlissingen, The Netherlands (2006)
International Marine Biotechnology Conference Eilat, Israël (2007)
BSDL symposium, Delft, The Netherlands (2006, 2007)
Netherlands Biotechnology Conference, Ede, The Netherlands (2006 ‐ 2008)
International Conference on Applied Phycology, Galway, Ireland (2008)
Optionals
Brainstormweek Process Engineering (2005)
Process Engineering PhD study tour to Denmark and Sweden (2006)
Process Engineering PhD study tour to Japan (2008)
Brainstormday Process Engineering (2008, 2009)
Teaching
Practical Course Marine Biotechnology (2006 ‐ 2009)
Food Fermentation (2007, 2008)

This research was financially supported by the technology foundation STW
(www.STW.nl; project WLM.6622), which is part of the Netherlands Organization for
Scientific Research (www.NWO.nl).