Modeling microRNA-mRNA Interactions Using PLS Regression in Human Colon Cancer
15
RESEARCH ARTICLE Open Access Modeling microRNA-mRNA Interactions Using PLS Regression in Human Colon Cancer Xiaohong Li 1,2 , Ryan Gill 3 , Nigel GF Cooper 2 , Jae Keun Yoo 4 and Susmita Datta 1* Abstract Background: Changes in microRNA (miRNA) expression patterns have been extensively characterized in several cancers, including human colon cancer. However, how these miRNAs and their putative mRNA targets contribute to the etiology of cancer is poorly understood. In this work, a bioinformatics computational approach with miRNA and mRNA expression data was used to identify the putative targets of miRNAs and to construct association networks between miRNAs and mRNAs to gain some insights into the underlined molecular mechanisms of human colon cancer. Method: The miRNA and mRNA microarray expression profiles from the same tissues including 7 human colon tumor tissues and 4 normal tissues, collected by the Broad Institute, were used to identify significant associations between miRNA and mRNA. We applied the partial least square (PLS) regression method and bootstrap based statistical tests to the joint expression profiles of differentially expressed miRNAs and mRNAs. From this analysis, we predicted putative miRNA targets and association networks between miRNAs and mRNAs. Pathway analysis was employed to identify biological processes related to these miRNAs and their associated predicted mRNA targets. Results: Most significantly associated up-regulated mRNAs with a down-regulated miRNA identified by the proposed methodology were considered to be the miRNA targets. On average, approximately 16.5% and 11.0% of targets predicted by this approach were also predicted as targets by the common prediction algorithms TargetScan and miRanda, respectively. We demonstrated that our method detects more targets than a simple correlation based association. Integrative mRNA:miRNA predictive networks from our analysis were constructed with the aid of Cytoscape software. Pathway analysis validated the miRNAs through their predicted targets that may be involved in cancer-associated biological networks. Conclusion: We have identified an alternative bioinformatics approach for predicting miRNA targets in human colon cancer and for reverse engineering the miRNA:mRNA network using inversely related mRNA and miRNA joint expression profiles. We demonstrated the superiority of our predictive method compared to the correlation based target prediction algorithm through a simulation study. We anticipate that the unique miRNA targets predicted by the proposed method will advance the understanding of the molecular mechanism of colon cancer and will suggest novel therapeutic targets after further experimental validations. Background Colon cancer is the third most common cancer in the United States [1] and contributes to over 655,000 deaths per year worldwide. However when diagnosed early, it is one of the most treatable cancers [2]. Many efforts are focused on detection rates and screening utilization [3,4]. The primary treatment for colon cancer may involve surgery, chemotherapy, biological therapy or radiation [5]. Unfortunately, these treatments often damage normal cells and tissues, so side effects are common as are the possibilities of drug resistance and disease recurrence [6]. Therefore, the identification of new biomarkers for early diagnosis and prognosis of human colon cancer is of great interest. Furthermore, such biomarkers might be useful for the development of novel therapeutics. Recently miRNAs have been suggested to be among these potential biomarkers [7]. The miRNAs are short * Correspondence: [email protected] 1 Department of Bioinformatics and Biostatistics, University of Louisville, (485 E. Gray St.), Louisville, KY 40202, USA Full list of author information is available at the end of the article Li et al. BMC Medical Genomics 2011, 4:44 http://www.biomedcentral.com/1755-8794/4/44 © 2011 Li et al; licensee BioMed Central Ltd. This is an Open Access article distributed under the terms of the Creative Commons Attribution License (http://creativecommons.org/licenses/by/2.0), which permits unrestricted use, distribution, and reproduction in any medium, provided the original work is properly cited.
Transcript of Modeling microRNA-mRNA Interactions Using PLS Regression in Human Colon Cancer

RESEARCH ARTICLE Open Access
Modeling microRNA-mRNA Interactions Using PLSRegression in Human Colon CancerXiaohong Li1,2, Ryan Gill3, Nigel GF Cooper2, Jae Keun Yoo4 and Susmita Datta1*
Abstract
Background: Changes in microRNA (miRNA) expression patterns have been extensively characterized in severalcancers, including human colon cancer. However, how these miRNAs and their putative mRNA targets contributeto the etiology of cancer is poorly understood. In this work, a bioinformatics computational approach with miRNAand mRNA expression data was used to identify the putative targets of miRNAs and to construct associationnetworks between miRNAs and mRNAs to gain some insights into the underlined molecular mechanisms ofhuman colon cancer.
Method: The miRNA and mRNA microarray expression profiles from the same tissues including 7 human colontumor tissues and 4 normal tissues, collected by the Broad Institute, were used to identify significant associationsbetween miRNA and mRNA. We applied the partial least square (PLS) regression method and bootstrap basedstatistical tests to the joint expression profiles of differentially expressed miRNAs and mRNAs. From this analysis, wepredicted putative miRNA targets and association networks between miRNAs and mRNAs. Pathway analysis wasemployed to identify biological processes related to these miRNAs and their associated predicted mRNA targets.
Results: Most significantly associated up-regulated mRNAs with a down-regulated miRNA identified by theproposed methodology were considered to be the miRNA targets. On average, approximately 16.5% and 11.0% oftargets predicted by this approach were also predicted as targets by the common prediction algorithmsTargetScan and miRanda, respectively. We demonstrated that our method detects more targets than a simplecorrelation based association. Integrative mRNA:miRNA predictive networks from our analysis were constructedwith the aid of Cytoscape software. Pathway analysis validated the miRNAs through their predicted targets thatmay be involved in cancer-associated biological networks.
Conclusion: We have identified an alternative bioinformatics approach for predicting miRNA targets in humancolon cancer and for reverse engineering the miRNA:mRNA network using inversely related mRNA and miRNA jointexpression profiles. We demonstrated the superiority of our predictive method compared to the correlation basedtarget prediction algorithm through a simulation study. We anticipate that the unique miRNA targets predicted bythe proposed method will advance the understanding of the molecular mechanism of colon cancer and willsuggest novel therapeutic targets after further experimental validations.
BackgroundColon cancer is the third most common cancer in theUnited States [1] and contributes to over 655,000 deathsper year worldwide. However when diagnosed early, it isone of the most treatable cancers [2]. Many efforts arefocused on detection rates and screening utilization[3,4]. The primary treatment for colon cancer may
involve surgery, chemotherapy, biological therapy orradiation [5]. Unfortunately, these treatments oftendamage normal cells and tissues, so side effects arecommon as are the possibilities of drug resistance anddisease recurrence [6]. Therefore, the identification ofnew biomarkers for early diagnosis and prognosis ofhuman colon cancer is of great interest. Furthermore,such biomarkers might be useful for the development ofnovel therapeutics.Recently miRNAs have been suggested to be among
these potential biomarkers [7]. The miRNAs are short
* Correspondence: [email protected] of Bioinformatics and Biostatistics, University of Louisville, (485E. Gray St.), Louisville, KY 40202, USAFull list of author information is available at the end of the article
Li et al. BMC Medical Genomics 2011, 4:44http://www.biomedcentral.com/1755-8794/4/44
© 2011 Li et al; licensee BioMed Central Ltd. This is an Open Access article distributed under the terms of the Creative CommonsAttribution License (http://creativecommons.org/licenses/by/2.0), which permits unrestricted use, distribution, and reproduction inany medium, provided the original work is properly cited.

(~21nt) non-coding RNAs that regulate gene expressionby causing transcript degradation or translational repres-sion [8,9]. In animals, they have been found to regulatea wide range of biological processes such as stem cellmaintenance, development, metabolism, host-viral inter-action, differentiation, proliferation and apoptosis [10].Their activities are also implicated in cancer progressionor suppression by affecting oncogenesis, growth, inva-sion and metastasis [11]. Studies suggest that three ofthese miRNAs, miR-15a, miR-16 [12,13] and let-7[14,15] can function as tumor suppressors, while miR-155 and miR-21 play roles in oncogenesis [16,17]. Manystudies have also shown that miRNAs play a critical rolein cancer initiation and progression. For example,miRNA-135a and miR-135b are reported to be involvedin the initiation of human colon cancer by targeting theadenomatous polyposis coli gene (APC) [18]. Alterationsin miRNA expression patterns are commonly associatedwith numerous human cancers, such as colorectal can-cer and chronic lymphocytic leukemia [19]. Lu et al.used 218 miRNAs expression profiles from 334 samples,including multiple human cancers, to obtain informationon the developmental lineage and differentiation state ofthe tumors [20]. They found most miRNAs in tumorswere down-regulated compared to expression levels innormal tissues. Thus, miRNA expression profiles maybe a useful tool in human cancer diagnosis and indesigning treatments strategies. Nevertheless, specifictargets of the abnormally expressed miRNAs and theirbiological functions remain largely unknown. So, accu-rately identifying those genes regulated by such miRNAsand their biological functions in affecting cancer devel-opment and progression is of utmost importance.Although, an increasing number of miRNA targets
have been validated experimentally http://diana.cslab.ece.ntua.gr/tarbase, a majority of miRNA targets arecurrently unknown and bioinformatics algorithmsremain the primary means of predicting these putativetargets. The principles of these algorithms are based onsequence complementarity, species conservation, ther-modynamic stability, and site accessibility. Currently,there are eight widely used algorithms for miRNA targetprediction (DIANA-microT 3.0, EIMMo, miRanda, miR-Base, PicTar, PITA, RNA22 and TargetScan 5.1) [11].However, the utility of these computational techniquesis limited by various factors including miRNA size, iden-tification of 3´ UTR and conservation analysis [19].Furthermore, to our knowledge, none of these algo-rithms incorporate high-throughput microarray geneexpression profiling data to predict miRNA targets.As many miRNAs initiate the degradation of target
mRNA transcripts [8], simultaneous expression profilesof miRNAs and mRNAs should reveal the existence ofsuch inverse relationships. Huang et al. in 2007 was the
first to utilize paired expression profiles of miRNAs andmRNAs to identify functional miRNA targets using aBayesian data analysis algorithm (GeneMiR++) [21].More recently, a similar strategy was used to identifyhepatitis C virus (HCV)-associated miRNA-mRNA regu-latory modules [22]. However, the integrative computa-tional method used in that paper was based on thesimilarities in the expression profiles of miRNAs andmRNAs across samples to calculate a simple miRNA-mRNA correlation matrix. This pairwise correlationmethod may grossly undermine the existing collineari-ties amongst the covariates. The complex interrelation-ship of multiple miRNAs influencing the expression ofone mRNA can be modeled by a regression method.However, due to the large number of miRNAs com-pared to the sample size and the existing collinearitiesamongst the covariates (miRNAs) it is impossible to usean ordinary linear regression model. So we use PLSregression model to cope with these issues. Associationsbetween gene expression profiles have been previouslystudied using a PLS regression approach in [23]. Sincethen several others have proposed using PLS in themicroarray and proteomics contexts [24-27]. Standardlinear regression is not applicable for microarray geneexpression data where the number of covariates farexceeds the sample size. PLS is a method for construct-ing predictive models when there are numerous covari-ates and many of them are highly collinear. To the bestof our knowledge, a PLS regression method has notbeen used previously to integrate miRNA and mRNAmicroarray data to predict miRNA targets.Thus, the PLS regression method was used to explore
the likely associations/interactions between miRNA andmRNA using expression data previously collected from7 colon tumors [20]. We have used Pathway analysis tounderstand the biological processes linked to these miR-NAs and their predicted target mRNAs in the contextof colorectal cancer.
ResultsOutline of our analysisWe used a multi-step approach in our analysis. In STEP1, an un-paired t-test was used with FDR correctionmethods to identify differentially expressed miRNAs andmRNAs in colon tumors and normal colon tissues. InSTEP 2, the PLS regression method and statistical testson the association measures were performed. Repeatedbootstrap samples were used to identify significant asso-ciations/interactions between miRNA and mRNA using31 down-regulated miRNAs and 71 up-regulatedmRNAs. This PLS-bootstrap algorithm work-flow is out-lined in the Figure 1. In STEP 3, we compared the pre-dictions from our PLS regression method with thosefrom TargetScan 5.1 and miRanda. In STEP 4, a gene
Li et al. BMC Medical Genomics 2011, 4:44http://www.biomedcentral.com/1755-8794/4/44
Page 2 of 15

ontology analysis was constructed with the aid of Path-way Studio software. In STEP 5, miRNA-mRNA inter-acting networks were developed with the aid ofCytoscape 2.7 software. In STEP 6 and 7, IPA and IPApathway designer were used to create a functional analy-sis of biological processes related to miRNAs and theirtarget mRNAs. Finally, in STEP 8, a simulation was per-formed to evaluate the false detection rate for PLS.Steps 1-3 can be considered as the discoveries aftermining the real data and Steps 6-8 correspond to thevalidities of these mined results.
STEP 1. Differentially expressed miRNA and mRNA inhuman colon tissuesThe miRNA and mRNA microarray expression profilesfrom the same tissues including 7 human colon tumortissues and 4 normal tissues were analyzed with the aidof GeneSpring GX10 software (Agilent, CA). The Benja-mini & Hochberg FDR (false discovery rate) was used toobtain adjusted p-values for unpaired t-tests [28]. Differ-entially expressed miRNAs and mRNAs with adjusted p-values less than or equal to 10% and the absolute foldchanges greater than or equal to 1.2 were obtained. Wefound a total of 31 down-regulated miRNAs and 2 up-regulated miRNAs that fit these criteria (Additional file1, table S1). In addition, we found 73 up-regulated
mRNAs and 63 down-regulated mRNAs (Additional file2, table S2). Some of the mRNAs did not have gene IDs.There were only two up-regulated miRNAs using theabove mentioned cutoff. Therefore, in this study weselected the 31 down-regulated miRNAs and the 71 up-regulated mRNAs to find the most likely miRNA:mRNAnegative/inverse associations with the aid of the PLSregression method. Among the differentially expressedmiRNAs, only miR-135b and miR-221 are significantlyup-regulated (4.3 and 1.7 fold, respectively) in the coloncancer tissue samples. The remaining 31 miRNAs(Additional file 1, table S1) were significantly down-regulated in these samples.
STEP 2. miRNA:mRNA Associations predicted by PLSTo identify the most likely prospective targets the 31down-regulated miRNAs were used as independent vari-ables and the 71 mRNAs were denoted as dependentvariables in the PLS regression analysis. Subsequently,statistical tests were performed to identify significantnegative associations between each mRNA with the 31down-regulated miRNAs. The algorithm flow diagramfor this multi-step procedure is shown in Figure 1.Table 1 lists the 31 down-regulated miRNAs and their
associated target mRNAs predicted by the PLS regres-sion method. The maximum number of predicted
2. Removed 1 column of the X variable (miRNA expressions) at a time, ran PLS & recorded the predicted values of Y (mRNA
expressions)
4. Bootstrapped by re-sampling from residuals and calculated new Y
variables
mRNA1
mRNA2
mRNA4
mRNA3
mRNA5
miRN
A1
miRN
A4
miRN
A2
miRN
A3
3. Calculated the residuals by subtracting
the predicted values from the observed ones
5. Ran PLS with new Y variables and 31 miRNAsand calculated the new associated scores and
repeated bootstrarppingfor 1000 times
6. Calculated the proportion of times a specific association score is less than the observed
association scores amongst all the 1000 bootstrapped association scores, which were the estimated p-value. A small p-value implied strong
miRNA-mRNA association/interaction
7. A Benjamini & Hochberg FDR correction to obtain an adjusted p-value. The mRNA which had strong
association with a miRNA is deemed to be the target of that miRNA
1. Ran PLS with 71 mRNA & 31 miRNA,
calculated the association scores and stored them in a 71x31
matrix
Figure 1 Algorithm to find miRNA targets. Illustrated is a workflow involving PLS and statistical testing to find the significant mRNA targetsfor each down-regulated miRNA.
Li et al. BMC Medical Genomics 2011, 4:44http://www.biomedcentral.com/1755-8794/4/44
Page 3 of 15

Table 1 Identification of 31 down-regulated miRNAs from a list of 71 up-regulated mRNAs
Down-regulatedmiRNA
miRNAfamily
No. of mRNAtargets
Target genes predicted by the PLS method
*hsa-let-7 g Let-7 g 17 BUD31, COTL1, CPNE1, EIF3B, FTL, GTF3C1, IFITM1, NAP1L4, NUDT1, PHB, PSMC2, PSMC4, PUF60, Ras-Like protein, RPL10, SRD5A3, WDR36
hsa-miR-1 miR-1 1 RPL10
hsa-miR-100 miR-100 1 GSTP1
*hsa-miR-101 miR-101 7 ATP6V0B, GTF2IRD1, GUK1, NEBL, PSMB4, UBE2I, VKORC1
hsa-miR-10b miR-10b 2 MIF, PSMC2
hsa-miR-126 miR-126 16 ANXA2, CSTB, DDIT4, GPATCH3, GTF2IRD1, GUK1, MDK, NDK, NEBL, OAZ1, PSMB4, S100A11, SLC7A11,TBCD, UBA6, VKORC1
hsa-miR-130a miR-130 2 GSTP1, RPL34
*hsa-miR-133a miR-133 17 ANXA2, ATP6V0B, CSTB, GPATCH3, GPX1, GTF2IRD1, NAP1L4, NEBL, OAZ1, POLR2H, PSMB4, RPL10,SLC7A11, TBCD, UBA6, UBE2I, VKORC1
hsa-miR-142-5p miR-142 6 ARPC1B, DDIT4, GSTP1, MDK, TUFM, USP22
*hsa-miR-150 miR-150 20 ABHD12, C7orf28A, CLIC1, CPNE1, EIF3B, GSTP1, GTF3C1, IFITM1, LAPTM5, NAP1L4, ODC1, PRDX2,PSMB2, PSMC4, PSMD8, PUF60, RPL10, SRD5A3, TBCD, Wilm’s tumor-related protein
*hsa-miR-15a miR-15 8 C7orf28A, CAPG, CPNE1, GTF3C1, NUDT1, PSMD8, WDR36, Wilm’s tumor-related protein
*hsa-miR-16 miR-16 8 FTL, GTF3C1, LAPTM5, PHB, PSMD8, SRD5A3, WDR36, Wilm’s tumor-related protein
hsa-miR-195 miR-195 2 PSMD8, RPL10
hsa-miR-26a miR-26 3 CAPG, FTL, GTF3C1
hsa-miR-26b miR-26 15 ATP6V0B, BUD31, CANX, CAPG, EIF3B, FTL, MIF, NAP1L4, NUDT1, ODC1, POLR2H, PSMC2, PSMC4,UBE2I, WDR36
hsa-miR-28 miR-28 21 ABHD12, ARPC1B, CLIC1, CPNE1, EIF3B, FTL, GTF3C1, IFITM1, LAPTM5, NAP1L4, ODC1, PRDX2, PSMB2,PSMC4, PSMD8, PUF60, RPL10, RPS9, SRD5A3, TUFM, Wilm’s tumor-related protein
*hsa-miR-29b miR-29 15 ANXA2, CDC42SE1, CSTB, DDIT4, GNPTG, GPATCH3, GPX1, ITPA, MDK, PSMB4, S100A11, SLC7A11,USP22, VKORC1, ZNF37A
*hsa-miR-29c miR-29 7 ABHD12, C7orf28A, PSMD8, RPL10, TBCD, USP22, ZNF37A
*hsa-miR-30a miR-30 22 ANXA2, C7orf28A, CAPG, CSTB, DAP, GPATCH3, GPX1, GTF2IRD1, GUK1, ITPA, MMP11, NEBL, NUDT1,OAZ1, POLR2H, PSMB4, SLC7A11, TBCD, UBA6, UBE2I, VKORC1, ZNF37A
*hsa-miR-30b miR-30 20 ANXA2, CDC42SE1, CSTB, DDIT4, GNPTG, GPATCH3, GPX1, GPX4, GSTP1, GTF2IRD1, ITPA, MDK, NDK,OAZ1, PSMB4, S100A11, SLC7A11, USP22, VKORC1, ZNF37A
*hsa-miR-30c miR-30 15 ANXA2, CSTB, GPATCH3, GSTP1, GTF2IRD1, ITPA, MDK, NDK, OAZ1, PSMB4, S100A11, SLC7A11, UBA6,VKORC1, ZNF37A
*hsa-miR-30d miR-30 25 ANXA2, ATP6V0B, BHLHE40, C7orf28A, CAPG, CDC42SE1, CSTB, DAP, DDIT4, GPATCH3, GPX1,GTF2IRD1, MIF, MMP11, NEBL, POLR2H, PSMB4, RPL10, S100A11, SLC7A11, TBCD, UBA6, UBE2I,
VKORC1, ZNF37A
*hsa-miR-30e miR-30 17 ATP6V0B, BHLHE40, C7orf28A, CAPG, CSTB, DAP, GPATCH3, GPX1, MMP11, NEBL, NUDT1, OAZ1,POLR2H, RPL10, TBCD, VKORC1, ZNF37A
hsa-miR-32 miR-32 5 C7orf28A, ODC1, PSMD8, RPL10, TBCD
*hsa-miR-34b miR-34 12 BUD31, CANX, EIF3B, FTL, GTF3C1, IFITM1, PHB, PSMC4, PUF60, RPL34, SRD5A3, WDR36
hsa-miR-99a miR-99 19 ANXA2, CSTB, DDIT4, GPATCH3, GSTP1, GTF2IRD1, MDK, MIF, NDK, NEBL, OAZ1, POLR2H, S100A11,SLC7A11, TBCD, UBA6, UBE2I, VKORC1, ZNF37A
mmu-miR-10b miR-10 2 Ras-Like protein, WDR36
mmu-miR-151 miR-151 13 ATP6V0B, BHLHE40, C7orf28A, CAPG, GTF2IRD1, MIF, MMP11, NUDT1, OAZ1, POLR2H, RPL10, TBCD,VKORC1
*mmu-miR-342 miR-342 21 ABHD12, ARPC1B, CLIC1, CPNE1, EIF3B, FTL, GTF3C1, IFITM1, NAP1L4, ODC1, PSMB2, PSMC4, PSMD8,PUF60, RPL10, RPL34, RPS9, SRD5A3, TGFBI, TUFM, Wilm’s tumor-related protein
rno-miR-140 miR-140 1 NDK
rno-miR-151 miR-151 16 ANXA2, CDC42SE1, CSTB, DDIT4, GNPTG, GPATCH3, GPX1, GTF2IRD1, ITPA, MDK, MMP11, PSMB4,S100A11, SLC7A11, USP22, ZNF37A
*miRNAs are selected as cancer-mediators based on the literature.
Li et al. BMC Medical Genomics 2011, 4:44http://www.biomedcentral.com/1755-8794/4/44
Page 4 of 15

targets was 25 for miR-30d, and the minimum numberof predicted targets was one for miR-1, miR-100 andrno-miR-140 (Table 1). The number of predicted targetsfor each member of the miR-30 family (a-e) was 22, 20,15, 25 and 17, respectively. Table 2 lists the mRNAs foreach of those miRNAs which have been previouslyreported to have associations with some form of cancer.Table 2 also contains some additional results related toSTEP 3.
STEP 3. Comparisons between PLS Regression, TargetScan5.1 and miRandaComparing the PLS regression method with other com-putational miRNA-target prediction algorithms such asTargetScan 5.1 and miRanda we found some areas ofagreement. Thus, some of the miRNA-targets predictedby PLS were also predicted by either TargetScan ormiRanda or both of them (Table 2). This table providesthe number of miRNA-targets for those miRNAs report-edly linked to cancer [29-42]. It shows the percentage ofcommon targets predicted by our use of the PLS regres-sion method, with TargetScan 5.1 and miRanda.Using 15 down-regulated miRNAs (let-7 g, miR-101,
miR-133a, miR-150, miR-15a, miR-16, miR-29b, miR-29c, miR-30a, miR-30b, miR-30c, miR-30d, miR-30e,miR-34b and miR-342), known to be associated withcancer, we found 16.5% and 11.0% of our PLS-predictedmiRNA-targets, on average, were also predicted as tar-gets for the corresponding miRNAs by TargetScan5.1and miRanda, respectively (Table 2). Moreover, wefound that five out of 25 of our PLS-predicted targets(20%) for miR-30d were also predicted as targets for this
miRNA by both TargetScan5.1 and miRanda. These fivetarget genes predicted by our PLS regression approach,TargetScan 5.1 and miRanda were BHLHE40, DDIT4,NEBL, SLC7A11 and UBE2I. In this regard, it is inter-esting to note that our method identified more commontargets with TargetScan than miRanda. From Tables 1and 2 it is evident that our analysis provides many noveltargets that were not identified by these existing algo-rithms which may prove to be significant biomarkers forcolon cancer. In order to further pursue the integrativeanalysis an association network for these significantlyassociated miRNAs and mRNAs was constructed (seeSTEP 5).
STEP 4. Gene ontology (GO) terms for miRNA-targets inthe category of biological processesTo gain further insight into the biological functions ofeach miRNA and its predicted targets, the 71 up-regu-lated mRNAs from the colon cancer microarray werefirst analyzed with the aid of Pathway Studio 7 (AriadneGenomics Inc., Rockville, MD, USA). This analysis wasused to obtain the gene ontological (GO) terms for thecategory of biological processes. We selected three ofthe most significant GO terms with all of the unadjustedp-values less than 0.02 except one function termed DNAreplication which had a p-value 0.05. The correspondingadjusted p-values were less than 0.06 and 0.13 respec-tively. Almost all the terms are significant at FDR 10%.The remaining term is significant at FDR 13%. In Table3 the significant GO terms associated with the predictedtargets for 15 miRNAs linked to colorectal cancer tis-sues are listed as biological processes. The significant
Table 2 Identification of miRNA targets from 15 down-regulated and 71 up-regulated mRNAs
Cancer-related and down-regulated miRNA
miRNAfamily
No. of targetmRNAs
No. (%) of overlapping PLS predictedmRNAs with TargetScan5.1
No. (%) of overlapping PLS predictedmRNAs with miRanda
hsa-let-7 g Let-7 g 16 0 2(12.5)
hsa-miR-101 miR-101 7 0 0
hsa-miR-133a miR-133 17 3(17.6) 2(11.8)
hsa-miR-150 miR-150 20 3(15.0) 1(5.0)
hsa-miR-15a miR-15 8 1(12.5) 1(12.5)
hsa-miR-16 miR-16 8 1(12.5) 0
hsa-miR-29b miR-29 15 3(20.0) 2(13.3)
hsa-miR-29c miR-29 7 2(28.6) 1(14.3)
hsa-miR-30a miR-30 22 3(13.6) 3(13.6)
hsa-miR-30b miR-30 20 4(20.0) 2(10.0)
hsa-miR-30c miR-30 15 1(6.7) 1(6.7)
hsa-miR-30d miR-30 25 7(28.0) 5(20.0)
hsa-miR-30e miR-30 17 3(17.6) 3(17.6)
hsa-miR-34b miR-34 12 3(25.0) 0
mmu-miR-342 miR-342 21 4(19.0) 1(4.8)
Total - - 16.5 11.0
Li et al. BMC Medical Genomics 2011, 4:44http://www.biomedcentral.com/1755-8794/4/44
Page 5 of 15

biological processes include anaphase-promoting com-plex (APC)-dependent proteasomal ubiquitin-dependentprotein catabolic process, negative or positive regulationof ubiquitin-protein ligase activity during mitotic cellcycle, polyamine biosynthetic process, oxidative stress,oxidation reduction, oxidoreductase activity, glutathioneperoxidase process, regulation of cell proliferation andapoptosis, translational elongation and lipid metabolicprocess. Interestingly, many of the target mRNAsexpressed in the colorectal cancer tissues and associatedwith the miRNAs appear to be involved in proteindegradation and apoptosis and are linked to the oxida-tive stress signal transduction pathway. Therefore, thesedata highlight the oxidative stress mechanism that isoperative in colorectal cancer tissue.
STEP 5. Visualization of miRNA:mRNA associationnetworksUsing the statistically significant bij -association scoresbetween the i-th mRNA and j-th miRNA, derived fromthe PLS regression method, we constructed associationnetworks including the significant miRNAs andmRNAs. The resulting miRNA:mRNA association net-work had 97 nodes and 155 connections between the
31 down-regulated miRNAs and the 71 up-regulatedmRNAs (Figure 2A). We developed a network todemonstrate the overlapping miRNA targets for miR-NAs in the miR-30 family (a-e) (Figure 2B) since thesemiRNAs have a large number of mRNA targets. Thenumber of targets for miR-30 a-e was 22, 20, 15, 25 and17, respectively (Table 3). This network (Figure 2B)indicated that two mRNAs (VKORC1 and CSTB; inred) were predicted to be targets of five miR-30 miR-NAs, six mRNAs (ANXA2, GPATCH3, OAZ1, PSMB4,SLC7A11, ZNF37A; in turquoise) were targeted by fourof the miRNAs, and ten mRNAs (CAPG, C7orf28A,DAP, GPX1, ITPA, MMP11, NEBL, POLR2H, S100A11and GTF2IRD1; 3 in green and 7 in blue) were targetedby three of the miRNAs (Figure 2B). Networks werealso developed for the seven miRNAs (let-7 g, miR-101,miR-133a, miR-15a, miR-16, miR-29b and miR-29c) clo-sely related to cancer and their associated mRNAs (Fig-ure 2C). Most of the targets mentioned here have beenreported to be linked to cancer. For example, ANXA2up-regulation was reported to be associated with humanhepatocellular carcinoma, pancreatic adenocarcinoma,high-grade glioma, gastric carcinoma, acute promyelocy-tic leukemia and primary colorectal cancer [43]. Also,
Table 3 Gene ontology (GO) terms for miRNA-targets in the category of biological processes
Cancer-related and down-regulated miRNA
miRNAfamily
No. ofmRNAs
GO terms
hsa-let-7 g Let-7 g 16 Anaphase-promoting complex(APC)-dependent proteasomal ubiquitin-dependent proteincatabolic process, response to oxidative stress and regulation of apoptosis
hsa-miR-101 miR-101 7 Ubiquitin-dependent protein catabolic process, APC-dependent proteasonmal ubiquitin-dependent protein catabolic process and oxidoreductase activity
hsa-miR-133a miR-133 17 Polyamine biosynthetic process,glutathione peroxidase process, Ubiquitin-dependent proteincatabolic process and regulation of apoptosis
hsa-miR-150 miR-150 20 Polyamine biosynthetic process, APC-dependent proteasomal ubiquitin-dependent proteincatabolic process, Glutathione peroxidase activity
hsa-miR-15a miR-15 8 Anaphase-promoting complex-dependent proteasomal ubiquitin-dependent protein catabolicprocess, response to oxidative stress and proteasome complex
hsa-miR-16 miR-16 8 APC-dependent proteasomal ubiquitin-dependent protein catabolic process, negativeregulation of cell proliferation and oxidoreductase activity
hsa-miR-29b miR-29 15 Regulation of cell proliferation, glutathione peroxidase activity and regulation of apoptosis
hsa-miR-29c miR-29 7 Ubiquitin-dependent protein catabolic process, APC-dependent proteasomal ubiquitin-dependent protein catabolic process and translational elongation
hsa-miR-30a miR-30 22 Polyamine biosynthetic process, ubiquitin-dependent protein catabolic process, and regulationof apoptosis
hsa-miR-30b miR-30 20 Ubiquitin-dependent protein catabolic process, polyamine biosynthetic process and oxidativestress
hsa-miR-30c miR-30 15 Polyamine biosynthetic process, ubiquitin-dependent protein catabolic process, and regulationof apoptosis
hsa-miR-30d miR-30 25 Regulation of apoptosis, glutathione peroxidase activity and ubiquitin-dependent proteincatabolic process
hsa-miR-30e miR-30 17 Polyamine biosynthetic process, response to oxidative stress and regulation of apoptosis
hsa-miR-34b miR-34 12 Regulation of cell proliferation, oxidoreductase activity and translational elongation
mmu-miR-342 miR-342 21 Polyamine biosynthetic process, translational elongation and APC-dependent proteasomalubiquitin-dependent protein catabolic process
Li et al. BMC Medical Genomics 2011, 4:44http://www.biomedcentral.com/1755-8794/4/44
Page 6 of 15

CapG message and protein are reported to be up-regu-lated in colorectal cancer [44].
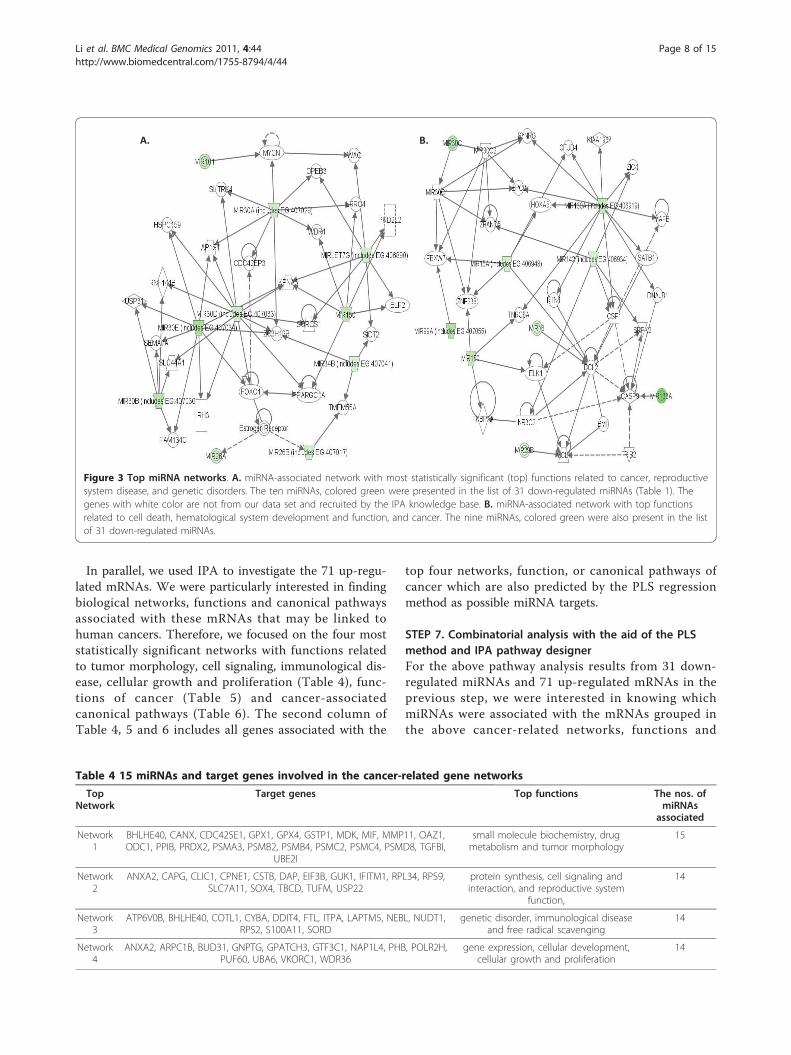
STEP 6. Pathway analysis with the aid of IPATo gain additional insight into prospective miRNAlinked biological networks and canonical pathways, the31 down-regulated miRNAs from the colon cancermicroarrays were analyzed with the aid of IngenuityPathway Analysis (IPA) software. We focused on twomiRNA-associated networks related to cancer. The mostsignificant (top) functional pathways highlighted by IPA
consisted of 1) cancer, reproductive system disease, andgenetic disorders and 2) cell death, hematological systemdevelopment and function, and cancer. We found thatten of the down-regulated miRNAs (miR101, miR26a,miR26b, miR30a, miR30b, miR30d, miR30e, miR34b,miR-let7 g and miRN140) were grouped together in afunctional network (Figure 3A) and nine of the down-regulated miRNAs (miR-130a, miR-133a, miR-142, miR-150, miR15a, miR-16, miR-29b, miR-30c and miR-99a)were grouped together in a second network (Figure 3B).These are colored in green in Figures 3A and 3B.
A.
B. C.
Figure 2 miRNA-mRNA association network. A. miRNA-mRNA interaction network with 97 nodes and 155 connections between 31 down-regulated miRNAs and 71 up-regulated mRNAs. miRNAs are in yellow while mRNAs are in pink. B. A sub-network depicting miRNA-mRNAinteractions predicted from the miR-30 family. miRNAs are in yellow and mRNAs are in other colors. C. A sub-network depicting miRNA:mRNAinteractions predicted from other cancer-associated miRNAs: let-7 g, miR-101, miR-133a, miR-15a, miR-16, miR-29b and miR-29c.
Li et al. BMC Medical Genomics 2011, 4:44http://www.biomedcentral.com/1755-8794/4/44
Page 7 of 15
In parallel, we used IPA to investigate the 71 up-regu-lated mRNAs. We were particularly interested in findingbiological networks, functions and canonical pathwaysassociated with these mRNAs that may be linked tohuman cancers. Therefore, we focused on the four moststatistically significant networks with functions relatedto tumor morphology, cell signaling, immunological dis-ease, cellular growth and proliferation (Table 4), func-tions of cancer (Table 5) and cancer-associatedcanonical pathways (Table 6). The second column ofTable 4, 5 and 6 includes all genes associated with the
top four networks, function, or canonical pathways ofcancer which are also predicted by the PLS regressionmethod as possible miRNA targets.
STEP 7. Combinatorial analysis with the aid of the PLSmethod and IPA pathway designerFor the above pathway analysis results from 31 down-regulated miRNAs and 71 up-regulated mRNAs in theprevious step, we were interested in knowing whichmiRNAs were associated with the mRNAs grouped inthe above cancer-related networks, functions and
A. B.
Figure 3 Top miRNA networks. A. miRNA-associated network with most statistically significant (top) functions related to cancer, reproductivesystem disease, and genetic disorders. The ten miRNAs, colored green were presented in the list of 31 down-regulated miRNAs (Table 1). Thegenes with white color are not from our data set and recruited by the IPA knowledge base. B. miRNA-associated network with top functionsrelated to cell death, hematological system development and function, and cancer. The nine miRNAs, colored green were also present in the listof 31 down-regulated miRNAs.
Table 4 15 miRNAs and target genes involved in the cancer-related gene networks
TopNetwork
Target genes Top functions The nos. ofmiRNAs
associated
Network1
BHLHE40, CANX, CDC42SE1, GPX1, GPX4, GSTP1, MDK, MIF, MMP11, OAZ1,ODC1, PPIB, PRDX2, PSMA3, PSMB2, PSMB4, PSMC2, PSMC4, PSMD8, TGFBI,
UBE2I
small molecule biochemistry, drugmetabolism and tumor morphology
15
Network2
ANXA2, CAPG, CLIC1, CPNE1, CSTB, DAP, EIF3B, GUK1, IFITM1, RPL34, RPS9,SLC7A11, SOX4, TBCD, TUFM, USP22
protein synthesis, cell signaling andinteraction, and reproductive system
function,
14
Network3
ATP6V0B, BHLHE40, COTL1, CYBA, DDIT4, FTL, ITPA, LAPTM5, NEBL, NUDT1,RPS2, S100A11, SORD
genetic disorder, immunological diseaseand free radical scavenging
14
Network4
ANXA2, ARPC1B, BUD31, GNPTG, GPATCH3, GTF3C1, NAP1L4, PHB, POLR2H,PUF60, UBA6, VKORC1, WDR36
gene expression, cellular development,cellular growth and proliferation
14
Li et al. BMC Medical Genomics 2011, 4:44http://www.biomedcentral.com/1755-8794/4/44
Page 8 of 15

pathways predicted by our PLS regression method. Withthe aid of IPA pathway designer we expanded the abovenetworks, functions and pathways generated by IPA(Figure 3, Tables 4, 5 and 6) by combining the PLSregression method and IPA pathway.At first, we examined the two networks that were
mediated by miRNAs and that were generated from the31 down-regulated miRNAs (Figure 3A and 3B). Withthe aid of the IPA pathway designer, we connectedmiRNA-targets predicted by the PLS regression methodwith each associated miRNA labeled as my list (ML inFigure 4A and 4B). These miRNAs in ML were con-nected to the two networks (Figure 3A and 3B) throughtheir predicted targets by IPA. The new expanded net-works from Figure 3A and 3B are shown in Figure 4Aand 4B. In Figure 4A, we found that 27 of 31 down-regulated miRNAs were associated with the miRNA-associated network through 15 genes (ANXA2,ARPC1B, BHLHE40, GPX1, MIF, OAZ1, ODC1, PHB,PSMB4, RAN, RPL10, RPL34, RPS9, TUFM, UBE2I)
predicted by the PLS regression method. These mRNAsare all included in the list of predicted target in Table 2.It was interesting to see that the four remaining miR-NAs (miR-100, rno-miR-140, miR15a and miR-26a)were grouped in this network by IPA and not connectedthrough the above cancer-related target mRNAs by thepathway designer and hence two of them (miR-100 andmiR-15a) were not included in Figure 4A. In this net-work, many of the cancer-affected target mRNAs weremainly regulated by the transcription factors MYCN andFOXO1 which play a vital role in cell death, apoptosis,proliferation and survival. Particularly MYCN wasinvolved in the ERK/MAPK signaling pathway andcancer.In a similar manner in Figure 4B, we found that 12 of
31-miRNAs were grouped with the miRNA-associatednetwork through their predicted targets (BHLHE40,GPX1, MDK, S100A9 and UBE2I). These cancer-asso-ciated target mRNAs were connected to this networkmainly through the interaction with apoptosis and cell
Table 5 15 miRNAs and target genes involved in the cancer-related functions
Cancer. relatedFunction
PLS predicted Target genes in the respective functions The nos. of cancer relatedmiRNAs associated with the
mRNA targets
Cancer ANXA2, BHLHE40, CANX, CAPG, COTL1, CYBA, DDIT4, FTL, GPX1, GSTP1, IFITM1, MIF, MMP11,OAZ1, ODC1, S100A11, SLC12A8, SLC7A11, SOX4 and UBE2I (20)
15
Tumorigenesis ANXA2, BHLHE40, CANX, CAPG, COTL1, CYBA, DDIT4, FTL, GPX1, GSTP1, IFITM1, MIF, MMP11,NUDT1, OAZ1, ODC1, PRDX2, S100A11, SLC12A8, SLC7A11, SOX4 and UBE2I (22)
15
Carcinoma ANXA2, BHLHE40, CANX, COTL1, CYBA, FTL, GSTP1, IFITM1, MMP11, OAZ1, ODC1, S100A11and SLC7A11 (13)
12
Malignant tumor ANXA2, BHLHE40, CANX, COTL1, CYBA, FTL, GPX1, GSTP1, IFITM1, MIF, MMP11, OAZ1, ODC1,S100A11, SLC7A11 and SOX4 (16)
12
Primary tumor ANXA2, BHLHE40, CANX, COTL1, CYBA, FTL, GPX1, GSTP1, IFITM1, MIF, MMP11, OAZ1, ODC1,PRDX2, S100A11, SLC7A11 and SOX4 (17)
12
Angiogenesis ANXA2, CANX and GPX1 (3) 8
Table 6 15 miRNAs and target genes in the cancer-related canonical pathways
Cancer related canonical pathway PLS predicted Target genes in the respectivepathways
The nos. of cancer related miRNAs associated withthe mRNA targets
Protein Ubiquitination Pathway PSMA3, PSMB2, PSMB4, PSMC2, PSMC4, PSMD8,UBE2I, USP22(8)
14
Polyamine Regulation in ColonCancer
OAZ1, ODC1, PSMA3, PSMB2, PSMB4, PSMC2,PSMC4, PSMD8(8)
15
Purine Metabolism ATP6V0B, GUK1, ITPA, POLR2H, PSMC2, PSMC4 (6) 11
Circadian Rhythm Signaling BHLHE40(1) 2
Hypoxia Signaling in theCardiovascular System
UBE2I(1) 4
Cdc42 Signaling ARPC1B, CDC42SE1(2) 4
Pyrimidine Metabolism ITPA, POLR2H (2) 7
mTOR Signaling DDIT4, EIF3B (2) 7
NRF2-mediated Oxidative StressResponse
FTL, GSTP1, PPIB(3) 7
Xenobiotic Metabolism Signaling FTL, GSTP1(2) 7
Li et al. BMC Medical Genomics 2011, 4:44http://www.biomedcentral.com/1755-8794/4/44
Page 9 of 15
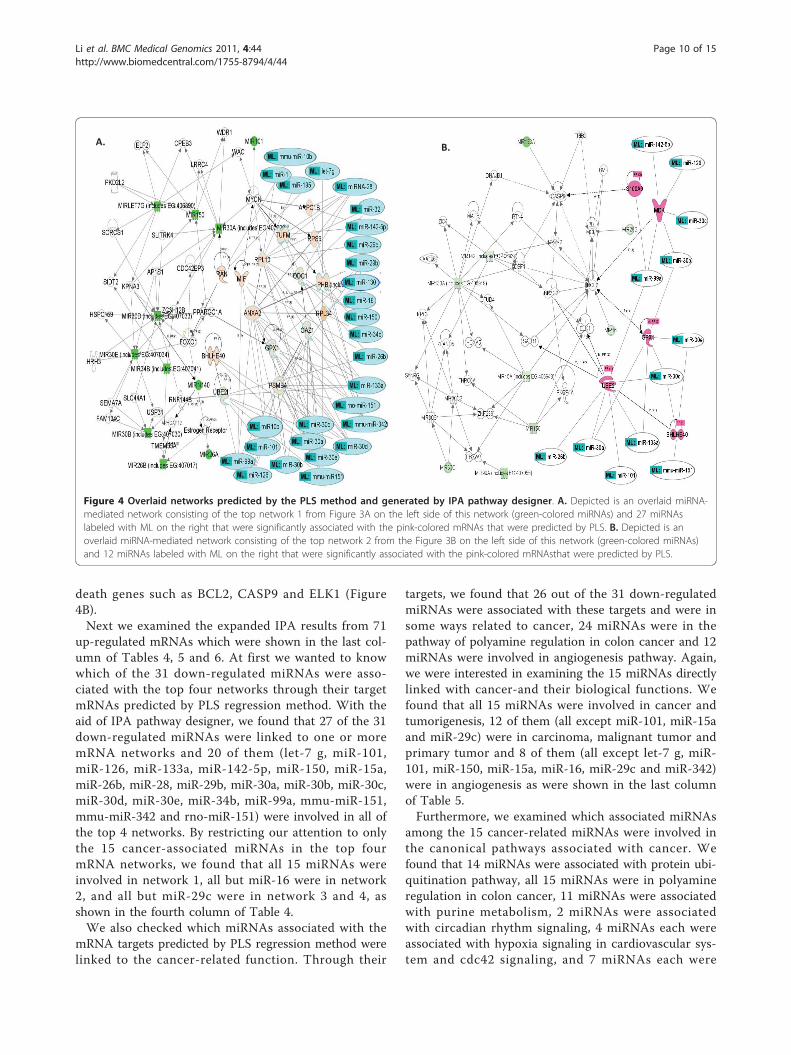
death genes such as BCL2, CASP9 and ELK1 (Figure4B).Next we examined the expanded IPA results from 71
up-regulated mRNAs which were shown in the last col-umn of Tables 4, 5 and 6. At first we wanted to knowwhich of the 31 down-regulated miRNAs were asso-ciated with the top four networks through their targetmRNAs predicted by PLS regression method. With theaid of IPA pathway designer, we found that 27 of the 31down-regulated miRNAs were linked to one or moremRNA networks and 20 of them (let-7 g, miR-101,miR-126, miR-133a, miR-142-5p, miR-150, miR-15a,miR-26b, miR-28, miR-29b, miR-30a, miR-30b, miR-30c,miR-30d, miR-30e, miR-34b, miR-99a, mmu-miR-151,mmu-miR-342 and rno-miR-151) were involved in all ofthe top 4 networks. By restricting our attention to onlythe 15 cancer-associated miRNAs in the top fourmRNA networks, we found that all 15 miRNAs wereinvolved in network 1, all but miR-16 were in network2, and all but miR-29c were in network 3 and 4, asshown in the fourth column of Table 4.We also checked which miRNAs associated with the
mRNA targets predicted by PLS regression method werelinked to the cancer-related function. Through their
targets, we found that 26 out of the 31 down-regulatedmiRNAs were associated with these targets and were insome ways related to cancer, 24 miRNAs were in thepathway of polyamine regulation in colon cancer and 12miRNAs were involved in angiogenesis pathway. Again,we were interested in examining the 15 miRNAs directlylinked with cancer-and their biological functions. Wefound that all 15 miRNAs were involved in cancer andtumorigenesis, 12 of them (all except miR-101, miR-15aand miR-29c) were in carcinoma, malignant tumor andprimary tumor and 8 of them (all except let-7 g, miR-101, miR-150, miR-15a, miR-16, miR-29c and miR-342)were in angiogenesis as were shown in the last columnof Table 5.Furthermore, we examined which associated miRNAs
among the 15 cancer-related miRNAs were involved inthe canonical pathways associated with cancer. Wefound that 14 miRNAs were associated with protein ubi-quitination pathway, all 15 miRNAs were in polyamineregulation in colon cancer, 11 miRNAs were associatedwith purine metabolism, 2 miRNAs were associatedwith circadian rhythm signaling, 4 miRNAs each wereassociated with hypoxia signaling in cardiovascular sys-tem and cdc42 signaling, and 7 miRNAs each were
A. B.
Figure 4 Overlaid networks predicted by the PLS method and generated by IPA pathway designer. A. Depicted is an overlaid miRNA-mediated network consisting of the top network 1 from Figure 3A on the left side of this network (green-colored miRNAs) and 27 miRNAslabeled with ML on the right that were significantly associated with the pink-colored mRNAs that were predicted by PLS. B. Depicted is anoverlaid miRNA-mediated network consisting of the top network 2 from the Figure 3B on the left side of this network (green-colored miRNAs)and 12 miRNAs labeled with ML on the right that were significantly associated with the pink-colored mRNAsthat were predicted by PLS.
Li et al. BMC Medical Genomics 2011, 4:44http://www.biomedcentral.com/1755-8794/4/44
Page 10 of 15
associated with pyrimidine metabolism, mTOR signalingor NRF2-mediated oxidative stress response or xenobio-tic metabolism signaling along and their targets arementioned in the last column of Table 6.Overall, it clearly showed that these cancer-related
miRNAs may mediate many biological functions andpathways by regulating the target genes predicted by ourintegrative and computational method.
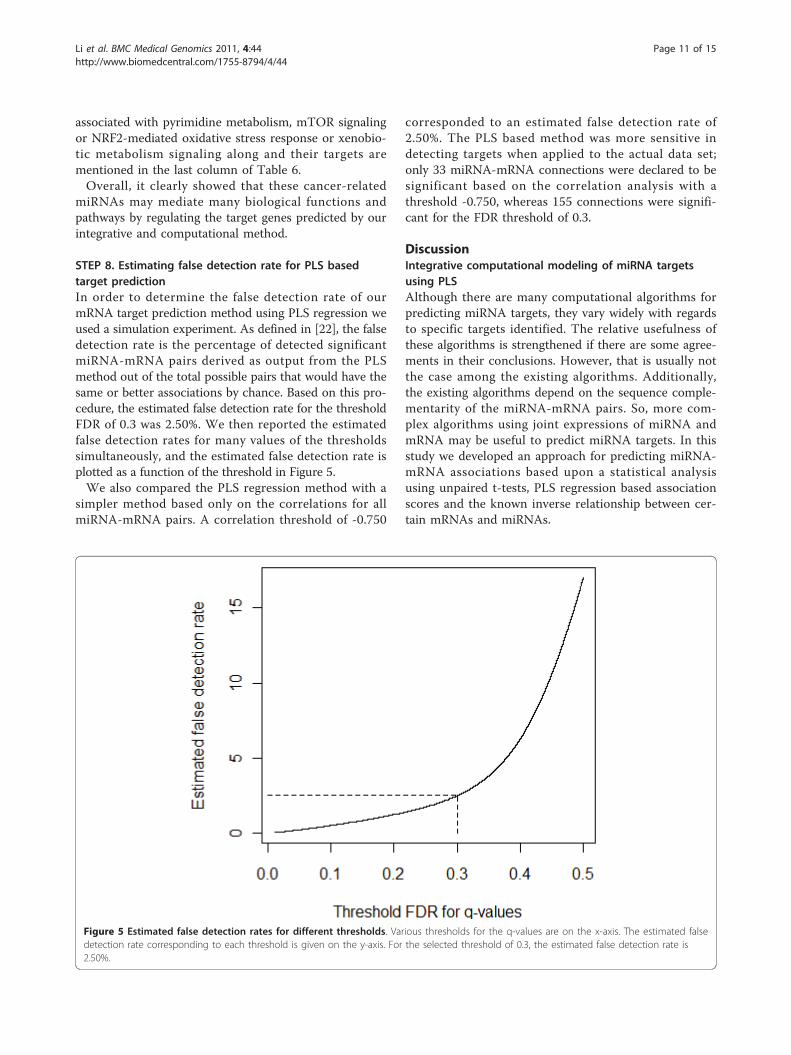
STEP 8. Estimating false detection rate for PLS basedtarget predictionIn order to determine the false detection rate of ourmRNA target prediction method using PLS regression weused a simulation experiment. As defined in [22], the falsedetection rate is the percentage of detected significantmiRNA-mRNA pairs derived as output from the PLSmethod out of the total possible pairs that would have thesame or better associations by chance. Based on this pro-cedure, the estimated false detection rate for the thresholdFDR of 0.3 was 2.50%. We then reported the estimatedfalse detection rates for many values of the thresholdssimultaneously, and the estimated false detection rate isplotted as a function of the threshold in Figure 5.We also compared the PLS regression method with a
simpler method based only on the correlations for allmiRNA-mRNA pairs. A correlation threshold of -0.750
corresponded to an estimated false detection rate of2.50%. The PLS based method was more sensitive indetecting targets when applied to the actual data set;only 33 miRNA-mRNA connections were declared to besignificant based on the correlation analysis with athreshold -0.750, whereas 155 connections were signifi-cant for the FDR threshold of 0.3.
DiscussionIntegrative computational modeling of miRNA targetsusing PLSAlthough there are many computational algorithms forpredicting miRNA targets, they vary widely with regardsto specific targets identified. The relative usefulness ofthese algorithms is strengthened if there are some agree-ments in their conclusions. However, that is usually notthe case among the existing algorithms. Additionally,the existing algorithms depend on the sequence comple-mentarity of the miRNA-mRNA pairs. So, more com-plex algorithms using joint expressions of miRNA andmRNA may be useful to predict miRNA targets. In thisstudy we developed an approach for predicting miRNA-mRNA associations based upon a statistical analysisusing unpaired t-tests, PLS regression based associationscores and the known inverse relationship between cer-tain mRNAs and miRNAs.
Figure 5 Estimated false detection rates for different thresholds. Various thresholds for the q-values are on the x-axis. The estimated falsedetection rate corresponding to each threshold is given on the y-axis. For the selected threshold of 0.3, the estimated false detection rate is2.50%.
Li et al. BMC Medical Genomics 2011, 4:44http://www.biomedcentral.com/1755-8794/4/44
Page 11 of 15

Our efforts focused on a set of 31 significantly down-regulated miRNAs and a set of 71 significantly up-regu-lated mRNAs identified by the t-test for colon cancer vs.the control samples after multiple hypotheses correc-tions. We selected these miRNAs and mRNAs based ontheir inverse relationship for our integrative analysis.Using miRNAs as independent variables and mRNAs asdependent variables in our PLS regression method weidentified significant miRNA-mRNA associations and inturn predicted mRNA targets for individual miRNAs(Table 1). When comparing these to miRNA-targetspredicted by TargetScan 5.1 and miRanda, we found onaverage about 16.5% and 11.0% of our predicted targetsmatched those predicted by these two programs, respec-tively. Furthermore, some of our predicted target geneslie within the union or intersection of the other two tar-get prediction programs. It seems likely that the miRNAtarget genes that lie within such intersections could bemore accurate, although this claim remains to be evalu-ated further, experimentally. Interestingly, many of thetargets predicted by our methods are not predicted bythe other prediction algorithms and thus our approachprovides possible novel targets that need further investi-gation for relevance to colorectal cancer {Step 7}. Weestimated the false detection rate of the proposedmethod through a simulation study by sampling fromthe real data under the null model. A limitation of thepresent study is that we are unable to compute statisti-cal performance measures such as the false discoveryrate since there does not exist any realistic simulatorcurrently for generating miRNA and mRNA datasetssimultaneously with controlled biological interactionsbetween them.We have also compared our computational method of
target prediction with another computational method oftarget prediction by association resulting from pairwisesimple correlations between all 31 the up-regulatedmiRNAs and 71 down-regulated mRNAs. For the samedataset using the same threshold we get many more tar-gets and so the PLS based method proved to be moresensitive than just correlation based target predictiondescribed in Step 8 in the Results section.
ConclusionIn summary, we have developed a bioinformatics com-putational approach for the analysis of miRNA andmRNA expression profiles derived from the same set ofcancerous tissue samples to infer the molecular mechan-ism for the colon cancer etiology. This analysis providesan alternative computational approach to identify puta-tive miRNA targets and reverse engineer the miRNAnetworks with their mRNA targets. We have developeda PLS modeling approach to take advantage of theknown inverse relationships between some miRNAs and
their target mRNAs. This approach would certainly haveto be modified for those situations where such a rela-tionship does not exist. Our analysis resulted in 3 majoroutcomes. 1) First, several of the predicted miRNA tar-gets identified with our approach have also been pre-dicted by other target prediction algorithms, whichprovide some support for the development of our meth-ods. 2) The PLS regression approach adopted here hasresulted in the recognition of novel miRNA-mRNA sets(in turn miRNA targets). These putative data-sets couldprovide better understanding of the underlined molecu-lar mechanism of colon cancer or any other complexdisease and identify novel therapeutic targets uponexperimental validations. 3) An in silico analysis of thebiological significance of the results obtained with ourPLS approach and pathway analysis indicates that pro-cesses related to protein degradation and cell death per-haps initiated by oxidative stress are likely involved incolorectal cancer. This fact has been concluded by otherexperimental studies [45]. Overall, it clearly shows thatthese down-regulated miRNAs for colon cancer canmost likely be involved in many altered biological func-tions along with their targets. The utility of ourapproach and its possible applicability to other diseasestates awaits further experimental validation.
MethodsmiRNA and mRNA microarray data and gene expressionprofile analysisThe miRNA and mRNA microarray data sets for bothhuman colon tumors and normal tissues used herewere obtained from the Broad Institute and down-loaded from their web-accessible database: http://www.broadinstitute.org/cgi-bin/cancer/datasets.cgi [20]. Thedata sets originally consisted of five normal human tis-sues and 10 human colon tumors for both miRNA andmRNA. However, only four of the normal tissue sam-ples and seven of the colon tumor samples passedquality control criteria [46]. The mRNA expressionvalues were obtained using Affymetrix GENECHIPanalysis software (after hybridization to Affymetrix oli-gonucleotide microarrays Hu6800 and Hu35KsubA)containing a total of 16,063 probes [46]. The miRNAmedian fluorescence intensity values were measured byusing a new, bead-based flow cytometric miRNAexpression profiling method. All data were filtered byminimum value 32 (values less than 32 were consid-ered as a background value according to the reference)and log2 transformed [20].The miRNA and mRNA expression data sets for colon
cancer patients were loaded into GeneSpring GX 10.0(Agilent Technologies). An unpaired t-test was used tocompare miRNA and mRNA expressions for normaland tumor tissue samples. The p-values obtained were
Li et al. BMC Medical Genomics 2011, 4:44http://www.biomedcentral.com/1755-8794/4/44
Page 12 of 15

then adjusted with the aid of the Benjamini-Hochbergfalse discovery rate (FDR) [28] correction method. Thedifferentially expressed miRNAs or mRNAs with q-values less than or equal to 10% and the absolute foldchanges greater than or equal to 1.2 were determined tobe significant.
miRNA target prediction using partial least square (PLS)method and bootstrappingAn algorithmic version of the whole procedure is pro-vided in Figure 1. A detailed description of the PLSregression method used in this paper was previouslyreported in [23] and [27]. Briefly, consider a data setwith n observations of p miRNAs (predictor variables)and m mRNAs (response variables). Let Y = (Y1i,Y2i, ...,Yni)’ be the column vector of observed values for the ithmRNA;i = 1,2, ... ,m, and let Xj = (X1j, X2j, ..., Xnj)’ bethe column vector of observed values for the jth miRNAfor j = 1,2, ...,p. For each mRNA Yi, PLS fits a regressionmodel of the form
ei
where ei is an n-dimensional vector of residuals and
t(k)i
is the k-th latent variable amongst the set of all
orthogonal latent variables (l<<<p), all of which are lin-ear combinations of the covariates. All of the originalvariables are standardized before doing PLS.Using ordinary least squares leads to
γik =t(k)t
i yi
t(k)t
i t(k)i
, 1 ≤ k ≤ n
and then the coefficients associated with the originalcovariates can be obtained from the coefficients of thelatent variables.Specifically, after q latent factors are found by select-
ing the number of component as 3, we calculated thescaled score coefficient γik. Then the score coefficients
βij and intercept αi can be obtained by transforming γik
back to the original scale as followsβij =
q∑k=1
γik
σ (x)σ (yi)
,
and
αi = yi − β ′ijx. These coefficients are called the PLS
scores, and these scores are defined as the associationsbetween each response variable (mRNA) and themiRNA covariate βij for a specific i and j.
Statistical test of the significance of the associationbetween miRNA and mRNA (bij)In order to test the significance of the associationbetween miRNA and mRNA, we tested the null
hypothesis is H0: bij = 0, (which implies there is no sig-nificant association between a specified miRNA andmRNA) versus the alternative Ha: bij< 0( which impliesthere is an inverse association between them). As we donot know the asymptotic distribution of such associa-tions we used a bootstrap re-sampling scheme to con-struct the sampling distribution of the score bij fortesting the hypothesis.We ran PLS after removing the jth miRNA gene, to
generate new bij and we compute the residual of themodel which is the estimate of the error ei.After the residuals are computed, bootstrapping resi-
duals e∗i1, e∗
i2, . . . , e∗in are generated by simple random
sampling with replacement of the components ei1,ei2,...,ein of the residual vector ei. Then the bootstrapped Y∗
idata can be found by the original regression equation:
Y∗i = αiJ +
p∑
g=1 & g �=j
βigXg + e∗i .
where the parameters hold their usual meanings. Wethen run PLS with the new Y∗
i and original full set ofmiRNAs, and store the bootstrapped PLS based scoreβ∗
ij. We did this bootstrapping step 1000 times for eachgene and calculate the proportion of times when thenegative bootstrapped association scores were smallerthan negative observed association score β∗
ij < βij. Theseproportions are the estimated p-values of the tests. TheBenjamini & Hochberg FDR [28] then is used to calcu-late q-values. A threshold FDR was arbitrarily chosen as0.3 since the number of variables in this test was smallafter having identified the inverse relationship betweenmiRNA and mRNA. The associations for which the q-values were less than equal to the FDR cutoff weredeemed to be significant.
Simulation ExperimentA simulation method similar in concept to the one pro-posed in [22] was used to estimate the false detectionrate of possible targets using PLS regression for a speci-fic threshold of FDR. The definition of the false detec-tion rate was provided before in Step 8 of the Resultssection, as described on page 4 of [22]. Note that theconcept of false detection rate refers to the simulation-based estimate of the percentage of detected significantmiRNA-mRNA pairs derived by chance, and when usingthis concept, we refer to it in full as false detection rateso as not to confuse it with the abbreviation FDR whichwe have already reserved for the more commonly-usedfalse discovery rate [28]. While we still use the FDR tocontrol false positives for our PLS method, we use thefalse detection rate for this simulation to determineequivalent thresholds for our method and for a simple
Li et al. BMC Medical Genomics 2011, 4:44http://www.biomedcentral.com/1755-8794/4/44
Page 13 of 15

correlation method which does not choose its thresholdbased on FDR.To generate a simulated data set with n “unassociated”
observations of p miRNAs and m mRNAs, we randomlypermuted the order of the n observations for both themiRNA genes and the mRNA genes so that none of themiRNA arrays corresponded to its true mRNA array.Specifically, we randomly permuted the labels of botharrays and rejected any generated data sets for whichthe new labels matched. Therefore, since the miRNAsdo not correspond to the mRNAs in the simulated dataset, any low q-values only occur by chance. For thesimulated data set, we then compute the number offalse positives by counting the number of q-valueswhich fell below the threshold. The process wasrepeated for 1000 simulated data sets and the estimatedfalse detection rate was computed by dividing the totalnumber of false positives for the 1000 data sets by theoverall total number of miRNA-mRNA pairs for the1000 data sets.We also compared the PLS regression with a simpler
method based only on the correlations for all miRNA-mRNA pairs. In the correlation method, we declare that amiRNA-mRNA pair is significant if the correspondingpairwise correlation fell below a certain threshold. Tocompare the sensitivity of the methods, we used the samesimulation method described above, and we chose thethreshold for which the estimated false detection rate wasthe same as that found for the PLS regression method.
Biological function and pathway analysisTo obtain gene ontology (GO) terms for each miRNA,we used Pathway Studio software (Ariadne GenomicsInc., Rockville, MD, USA). This software enabled anenrichment analysis of expressed genes for GO termsusing the differentially expressed miRNA target geneswith respect to the category of biological process. TheGO terms were selected by significant p-value and can-cer-associated biological functions.Using Ingenuity Pathway Analysis System and pathway
designer (IPA 8.5, Ingenuity Systems, Edwood, CA,USA), we performed more detailed functional analysisto identify miRNA-mediated, cancer-related and statisti-cally significant networks, biological functions and cano-nical signaling pathways for both differentially expressedmiRNAs and mRNAs.
Additional material
Additional file 1: Differentially expressed miRNAs in human colontissues. Supplemental Table 2 (S2): This file is a tab-delimited text fileand contains 2 up-regulated and 31 down-regulated miRNAs with FDRcorrected p-value less than 0.1 and absolute fold changes greater than1.2. It also provides detailed information about each miRNA such as itsname, expression values and description.
Additional file 2: Differentially expressed mRNAs in human colontissues. Supplemental Table 1 (S1): This file is a tab-delimited text fileand contains 73 up-regulated and 63 down-regulated mRNAs with FDRcorrected p-value less than 0.1 and absolute fold changes greater than1.2 It also provides detailed information about each mRNA such as itsname, expression values and description.
AcknowledgementsWe would like to thank Dr. Timothy O’Toole for assistance with manuscriptpreparation. This work was supported by NSF-DMS-0805559 (S.Datta), NIH-CA133844 (S.Datta), and P20RR16481 (N.G.Cooper). The assistance of theBioinformatics, Biostatistics and Computational Biology-Core in the Centerfor Genomics and Integrative Biology, supported by 1P30ES014443, is alsogratefully acknowledged.
Author details1Department of Bioinformatics and Biostatistics, University of Louisville, (485E. Gray St.), Louisville, KY 40202, USA. 2Department of Anatomical Sciencesand Neurobiology, University of Louisville, (500 S. Preston St.), Louisville, KY40202, USA. 3Department of Mathematics, University of Louisville, (328Natural Sciences Building), Louisville, KY 40292, USA. 4Department ofStatistics, Ewha Womans University, (52 Ewhayeodae-gil, Seodaemun-gu),Seoul, 120-750, Republic of Korea.
Authors’ contributionsXL conducted the computational analysis and pathway analysis. RGconducted the simulation. JY, RG and SD helped with PLS coding in R.NGFC helped with the biological pathway analysis and interpretation. SDdesigned and supervised the project. XL, RG, and SD wrote manuscript. Allauthors read and approved the final manuscript.
Competing interestsThe authors declare that they have no competing interests.
Received: 27 September 2010 Accepted: 19 May 2011Published: 19 May 2011
References1. Stokes M: Colon cancer: Current and emerging trends in detection and
treatment. Cancer and modern sciences. 1 edition. published by RosenPublishing group, Inc; 2006.
2. [http://en.wikipedia.org/wiki/Colorectal_cancer].3. Greenlee RT, Hill-Harmon MB, Murray T, Thun M: Cancer statistics. CA
Cancer J Clin 2001, 51:15-36.4. Parkin DM, Bray F, Ferlay J, Pisani P: Global cancer statistics. CA Cancer J
Clin 2002, 55:74-108.5. Jemal AR, Siegel E, Ward E, Murray T, Xu T, Thun MJ: Cancer Statistics.
Cancer J Clin 2007, 57:43-66.6. Chau I, Wylie AH: Adjuvant therapy in colon cancer-what, when and
how? Ann Oncol 2006, 17:1347-1359.7. Cho WCS: MicroRNAs: Potential biomarkers for cancer diagnosis,
prognosis and targets for therapy. Inter J Biochem Cell Biolo 2009, online.8. Pillai RS, Bhattacharyya SN, Filipowicz W: Repression of protein synthesis
by miRNAs: how many mechanisms? Trends Cell Biolo 2007, 17:118-126.9. Brown JR, Sanseau P: A computational view of miRNAs and their targets.
Drug Discovery Today 2005, 10:595-601.10. Betel D, Wilson M, Gabow AK, Marks DS, Sander C: The microRNA.org
resource: targets and expression. Nucleic Acids Research 2008,36:149-153.
11. Alexiou P, Maragkakis M, Papadopoulos GL, Reczko M, Hatzigeorgiou AG:Lost in translation: an assessment and perspective for computationalmicroRNA target identification. Bioinformatics 2009, 25:3049-3055.
12. Cimmino A, Calin GA, Fabbri M, Lorio MV, Ferracin M, Shimizu M: miR-15and miR-16 induce apoptosis by targeting BCL2. Proc Natl Acad Sci USA2005, 102:13944-13949.
13. Roccaro AM, Sacco BA, Thompson B, Leleu X, Azab AK, Azab F: MicroRNAs15a and 16 regulate tumor proliferation in multiple myeloma. Blood2009, 113:6669-6680.
Li et al. BMC Medical Genomics 2011, 4:44http://www.biomedcentral.com/1755-8794/4/44
Page 14 of 15

14. Johnson SM, Grosshans H, Shingara J, Byrom M, Jarvis R, Cheng A: RAS isregulated by the let-7 microRNA family. Cell 2005, 120:635-647.
15. Rahman MM, Qian ZR, Wang EL, Sultana R, Kudo E, Nakasono M: Frequentoverexpression of HMGA1 and 2 in gastroentero pancreaticneuroendocrine tumors and its relationship to let-7 downrgulation. Br JCancer 2009, 100:501-510.
16. Violinia S, Calin GA, Liu CG, Ambs S, Cimmino A, Petrocca F: A microRNAexpression signature of human solid tumors defines cancer genetargets. Proc Ntl Acad Sci USA 2006, 103:2257-2261.
17. Chang CS, Elemento O, Tavazoie S: Revealing posttranscriptionalregulatory elements through network-level conservation. PLoS ComputBiol 2005, 1:e69.
18. Nagel R, le Sage C, Diosdado B, van der Waal M, Oude Vrielink JA, Bolijn A,Meijer GA, Agami R: Regulation of the adenomatous polyposis coli geneby the miR-135 family in colorectal cancer. Cancer Res 2008, 68:5795-5802.
19. Maziere P, Enright AJ: Prediction of microRNA targets. Drug Disc Today2007, 12:452-458.
20. Lu J, Getz G, Miska EA, Alvarez-Saavedra E, Lamb J, Peck D, Sweet-Cordero A, Ebert BL, Mak RH, Ferrando AA, Downing JR, Jacks T, Horvitz HR,Golub RR: MicroRNA expression profiles classify human cancers. Nature2005, 435:834-838.
21. Huang JC, Babak T, Corson TW, Chua G, Khan S, Gallie BL, Hughes TR,Blencowe BJ, Frey BJ, Morris QD: Using expression profiling data toidentify human microRNA targets. Nature methods 2007, 4:1045-1049.
22. Peng X, Li Y, Walters KA, Rosenzweig ER, Lederer SL, Aicher LD, Proll S,Katze MG: Computational identification of hepatitis C virus associatedmicroRNA-mRNA regulatory modules in human livers. BMC Genomics2009, 10:373.
23. Datta S: Exploring relationships in gene expression: a partial least squareapproach. Gene Expression 2001, 9:249-55.
24. Nguyen DV, Rocke DM: Tumor classification by partial least squares usingmicroarray gene expression data. Bioinformatics 2002a, 18:39-50.
25. Purohit P, Rocke DM: Discriminant models for high-throughputproteomics mass spectrometer data. Proteomics 2003, 3:1699-1703.
26. Datta S, Le-Rademacher J, Datta S: Predicting patient survival frommicroarray data by accelerated failure time modeling using partial leastsquares and LASSO. Biometrics 2007, 63:259-271.
27. Pihur V, Datta S, Datta S: Reconstruction of genetic association networksfrom microarray data: A partial least squares approach. Bioinformatics2008, 24:561-568.
28. Benjamini Y, Hochberg Y: Controlling the false discovery rate: a practicaland powerful approach to multiple testing. Journal of the Royal StatSociety. Series B (Methodological) 1995, 57:289-300.
29. Christensen BC, Moyer BJ, Avissar M, Ouellet LG, Plaza SL, McClean MD,Marsit CJ, Kelsey KT: A let-7 microRNA-binding site polymorphism in theKRAS 3’UTR associated with reduced survival in oral cancer.Carcinogenesis 2009, 30:1003-1007.
30. Childs G, Fazzari M, Kung G, Kawachi N, Brandwein-gensier M, McLemore M,Chen Q, Burk RD, Smith RV, Prystowsky MB, Belbin TJ, Schlecht NF: Low-level expression of microRNAs let-7d and miR-205 are prognositicmarkers of head and neck squamous cell carcinoma. Am J Pathol 2009,174:736-745.
31. Friedman JM, Liang G, Liu CC, Wolff EM, Tsai YC, Ye W: The putative tumorsuppressor microRNA-101 modulates the cancer epigenome byrepressing the polycomb group protein EZH2. Cancer Res 2009,69:2623-2629.
32. Li S, Fu H, Wang Y, Tie Y, Xing R, Zhu J: MicroRNA-101 regulatesexpression of the v-fos FBJ murine osteosarcom viral oncogenehomolog (FOS) oncogene in human hepatocellular carcinoma. Heptology2009, 49:1194-1202.
33. Ichimi T, Enokida H, Okuno Y, Kunimoto R, Chiyomaru T, Kawamoto K:Identification of novel microRNA targets based on microRNA signaturesin bladder cancer. Int J Cancer 2009, 125:345-352.
34. Xu H, Cheung IY, Guo HF, Cheung NK: MicroRNA miR-29 modulatesexpression of immunoinhibitory molecule B7-H3: potential implicationsfor immune based therapy of human solid tumors. Cancer Res 2009,69:6275-6281.
35. Stamatopoulos B, Meuleman N, Haibe-Kains B, Saussoy P, Van Den Neste E,Michaux L, Heimann P, Martiat P, Bron D, Lagneaux L: MicroRNA-29c andmicroRNA-223 down-regulation has in vivo significance in chronic
lymphocytic leukemia and improves disease risk stratification. Blood2009, 113:5237-5245.
36. Wu F, Zhu S, Ding Y, Beck WT, Mo YY: MicroRNA-mediated regulation ofUbc9 expression in cancer cells. Clin Cancer Res 2009, 15:1550-1557.
37. Rossi S, Kopetz S, Davuluri R, Hamilton SR, Calin GA: MicroRNAs, ultraconserved genes and colorectal cancers. Inter J Biochem Cell Biolo 2009,online.
38. Pigazzi M, Manara E, Baron E, Basso G: miR-34b targets cyclic AMP-responsive element binding protein in acute myeloid leukemia. CancerRes 2009, 69:2471-2478.
39. Chen HC, Chen GH, Chen YH, Liao WL, Liu CY: MicroRNA deregulation andpathway alterations in nasopharyngeal carcinoma. Br J Cancer 2009,100:1002-1011.
40. Grady WM, Parkin RK, Mitchell PS, Lee JH, Kim YH, Tsuchiya KD,Washington MK, Parskeva C, Willson JK, Kaz AM, Kroh EM, Allen A, Fritz BR,Markowitz SD, Tewari M: Epigenetic silencing of the intronic microRNAhas-miR-342 and its host gene EVL in colorectal cancer. Oncogene 2008,27:3880-3888.
41. Zhang Y, Li M, Wang H, Fisher WE, Lin PH, Yao Q, Chen C: Profiling of 95microRNAs in pancreatic cancer cell lines and surgical specimens byreal-time PCR analysis. World J Surg 2009, 33:498-709.
42. Siva AC, Nelson LJ, Fleischer CL, Majlessi M, Becker MM, Vessella RL,Reynolds MA: Molecular assays for the detection of microRNAs inprostate cancer. Mol Cancer 2009, 8:17.
43. Bae SM, Min HJ, Ding GH, Kwak SY, Cho YL, Nam KH, Park CH, Kim YW,Kim CK, Han BD, Lee YJ, Kim do K, Ahn WS: Protein expression profileusing two-dimensional gel analysis in squamous cervical cancerpatients. Cancer Res Treat 2006, 38(2):99-107.
44. Nibbe RK, Markowitz S, Myeroff L, Ewing R, Chance MR: Discovery andscoring of protein interaction subnetworks discriminative of late stageof human colon cancer. Molecular cell proteomics 2009, 8(4):827-845.
45. Chang D, Wang F, Zhao YS, Zhi H: Evaluation of Oxidative Stress inColorectal Cancer Patients. Biomedical and Environmental Sciences 2008,21(4):286-289.
46. Ramaswamy S, Tamayo P, Rifkin R, Mukherjee S, Yeang CH, Angelo M,Ladd C, Reich M, Latulippe E, Mesirov JP, Poggio T, Gerald W, Loda M,Lander ES, Golub TR: Multiclass cancer diagnosis using tumor geneexpression signatures. Proc Natl Acad Sci USA 2001, 98:15149-15154.
Pre-publication historyThe pre-publication history for this paper can be accessed here:http://www.biomedcentral.com/1755-8794/4/44/prepub
doi:10.1186/1755-8794-4-44Cite this article as: Li et al.: Modeling microRNA-mRNA InteractionsUsing PLS Regression in Human Colon Cancer. BMC Medical Genomics2011 4:44.
Submit your next manuscript to BioMed Centraland take full advantage of:
• Convenient online submission
• Thorough peer review
• No space constraints or color figure charges
• Immediate publication on acceptance
• Inclusion in PubMed, CAS, Scopus and Google Scholar
• Research which is freely available for redistribution
Submit your manuscript at www.biomedcentral.com/submit
Li et al. BMC Medical Genomics 2011, 4:44http://www.biomedcentral.com/1755-8794/4/44
Page 15 of 15