
The SWI/SNF ATPase Brm Is a Gatekeeper of Proliferative Control in Prostate Cancer
BioMed Central
ss
BMC Cancer
Open AcceResearch articleHuman colon cancer profiles show differential microRNA expression depending on mismatch repair status and are characteristic of undifferentiated proliferative statesAaron L Sarver*1, Amy J French2, Pedro M Borralho3, Venugopal Thayanithy4, Ann L Oberg5, Kevin AT Silverstein1, Bruce W Morlan5, Shaun M Riska5, Lisa A Boardman6, Julie M Cunningham2, Subbaya Subramanian4, Liang Wang2, Tom C Smyrk2, Cecilia MP Rodrigues3, Stephen N Thibodeau2 and Clifford J Steer7,8
Address: 1Biostatistics and Informatics, Masonic Cancer Center, University of Minnesota, Minneapolis, Minnesota, USA, 2Department of Laboratory Medicine and Pathology, Mayo Clinic, Rochester, Minnesota, USA, 3Research Institute for Medicines and Pharmaceutical Sciences, Faculty of Pharmacy, University of Lisbon, Lisbon, Portugal, 4Department of Laboratory Medicine and Pathology, University of Minnesota, Minneapolis, Minnesota, USA, 5Department of Health Sciences Research, Division of Biomedical Informatics and Statistics, Mayo Clinic, Rochester, Minnesota, USA, 6Division of Gastroenterology and Hepatology, Mayo Clinic, Rochester, Minnesota, USA, 7Department of Medicine, University of Minnesota, Minneapolis, Minnesota, USA and 8Genetics, Cell Biology and Development, University of Minnesota, Minneapolis, Minnesota, USA
Email: Aaron L Sarver* - [email protected]; Amy J French - [email protected]; Pedro M Borralho - [email protected]; Venugopal Thayanithy - [email protected]; Ann L Oberg - [email protected]; Kevin AT Silverstein - [email protected]; Bruce W Morlan - [email protected]; Shaun M Riska - [email protected]; Lisa A Boardman - [email protected]; Julie M Cunningham - [email protected]; Subbaya Subramanian - [email protected]; Liang Wang - [email protected]; Tom C Smyrk - [email protected]; Cecilia MP Rodrigues - [email protected]; Stephen N Thibodeau - [email protected]; Clifford J Steer - [email protected]
* Corresponding author
AbstractBackground: Colon cancer arises from the accumulation of multiple genetic and epigeneticalterations to normal colonic tissue. microRNAs (miRNAs) are small, non-coding regulatory RNAsthat post-transcriptionally regulate gene expression. Differential miRNA expression in cancerversus normal tissue is a common event and may be pivotal for tumor onset and progression.
Methods: To identify miRNAs that are differentially expressed in tumors and tumor subtypes, wecarried out highly sensitive expression profiling of 735 miRNAs on samples obtained from astatistically powerful set of tumors (n = 80) and normal colon tissue (n = 28) and validated a subsetof this data by qRT-PCR.
Results: Tumor specimens showed highly significant and large fold change differential expressionof the levels of 39 miRNAs including miR-135b, miR-96, miR-182, miR-183, miR-1, and miR-133a,relative to normal colon tissue. Significant differences were also seen in 6 miRNAs including miR-31 and miR-592, in the direct comparison of tumors that were deficient or proficient for mismatchrepair. Examination of the genomic regions containing differentially expressed miRNAs revealedthat they were also differentially methylated in colon cancer at a far greater rate than would be
Published: 18 November 2009
BMC Cancer 2009, 9:401 doi:10.1186/1471-2407-9-401
Received: 25 August 2009Accepted: 18 November 2009
This article is available from: http://www.biomedcentral.com/1471-2407/9/401
© 2009 Sarver et al; licensee BioMed Central Ltd. This is an Open Access article distributed under the terms of the Creative Commons Attribution License (http://creativecommons.org/licenses/by/2.0), which permits unrestricted use, distribution, and reproduction in any medium, provided the original work is properly cited.
Page 1 of 15(page number not for citation purposes)
BMC Cancer 2009, 9:401 http://www.biomedcentral.com/1471-2407/9/401
expected by chance. A network of interactions between these miRNAs and genes associated withcolon cancer provided evidence for the role of these miRNAs as oncogenes by attenuation oftumor suppressor genes.
Conclusion: Colon tumors show differential expression of miRNAs depending on mismatchrepair status. miRNA expression in colon tumors has an epigenetic component and alteredexpression that may reflect a reversion to regulatory programs characteristic of undifferentiatedproliferative developmental states.
BackgroundColon cancer (CC) is the second most frequent cause ofcancer-related death in the United States and in Europe[1,2]. The development of CC is considered a stepwiseprocess with the accumulation of different genetic andepigenetic alterations. Most tumors (~85%) are generatedby chromosomal instability (CIN) and associated withhigh frequency aneuploidy and allelic imbalance. Theremaining 15% have defective DNA mismatch repair(dMMR), which is frequently measured by either the pres-ence of microsatellite instability (MSI) or by testing forloss of the protein products for genes involved in DNAmismatch repair, most commonly MLHI, MSH2, MSH6,and PMS2 [3]. Sporadic CCs with dMMR have distinctiveclinical and pathological features that include proximalcolon predominance, poor differentiation and/or muci-nous histology, intra- and peritumoral lymphocytic infil-tration, diploid DNA content [3] and generally have abetter prognosis [4]. The presence of MSI-H tumor pheno-type and loss of protein expression of MLHl and MSH2 ishighly concordant [5].
Recent progress has been made in CC screening [6] andtreatment protocols [7]. Currently, the most importantprognostic factor for patients is pathologic tumor stagingbased on the tumor-node-metastasis (TNM) system [8].However, several pathologic and clinical features havebeen associated with increased risk of tumor recurrence inresectable CC [7]. Between 20 and 25% of stage II CCpatients develop recurrence and die from the disease [9].Therefore, it is imperative to identify and develop accu-rate, reliable and sensitive biomarkers.
Genome-wide approaches have reshaped the landscape ofcancer research. Meta-analysis of multi-study data hasallowed the identification of overlapping sets of differen-tially expressed genes that may have biomarker potential[10]. Emphasis on genome-wide gene expression analyseshas been driven by the general view that alterations inprotein-coding oncogenes or tumor-suppressor genesunderlie tumorigenesis. However, the discovery of a grow-ing class of small non-coding RNAs, termed miRNAs, hasopened a new field of cancer research and revealed thecomplexity of cancer biology. miRNAs regulate geneexpression post-transcriptionally by translational attenua-
tion/repression or cleavage of target mRNAs [11], therebyadding a new dimension to the regulation of gene expres-sion [12]. Further, aberrant expression of miRNAs hasbeen associated with a growing list of cancers [13].
The potential use of miRNAs in diagnosis and prognosishas been demonstrated for several forms of cancer[14,15]. miRNA expression profiles may be better-suitedtargets for the discovery of novel cancer biomarkers com-pared to gene expression profiles. This is supported by areport demonstrating the ability of miRNA profiles to cor-rectly classify human cancers of unknown primary originas well as poorly differentiated tumors [16]. A growingnumber of studies have addressed miRNA expression inCC [17-20]. However, comparison across studies is lim-ited by differences in profiling platform, quantity ofmiRNA obtainable, methodology, in some cases samplenumber and a paucity of clinicopathologic data. Conse-quently, translation of results into clinically useful andwidely applicable biomarkers is hampered. Importantly, apotentially strong contributor to the variability of dataamong different studies relates to the tumor resection pro-cedures. The inadvertent collection of surrounding resid-ual non-tumor tissue may skew experimental results,diluting quantitative estimates of particular miRNA spe-cies based on the extent and type of tissue present in thesample. Most studies do not specifically address thispotential problem.
In this study, global miRNA expression was evaluated in80 colon tumors and 28 normal mucosa samples usingthe BeadArray™ platform (Illumina, Inc.) to evaluate glo-bal miRNA expression of 735 miRNA targets [21]. Ourresults demonstrate that, in a sufficiently statistically pow-ered number of tumors, a larger set of miRNAs than haspreviously been reported is differentially expressedbetween normal colon and tumor tissue. Additionally,specific miRNAs are significantly differentially expressedbetween tumors of deficient and proficient mismatchrepair status (dMMR and pMMR, respectively).
MethodsColon Cancer SamplesCC biospecimens were obtained from Mayo ClinicRochester patients with colorectal neoplasia beginning in
Page 2 of 15(page number not for citation purposes)
BMC Cancer 2009, 9:401 http://www.biomedcentral.com/1471-2407/9/401
1995. Of the consented patients, US residents who hadonly CC were included in this study. The majority ofpatients in the registry are from the surrounding five-stateregion. Pathologic tumor staging was carried out using thetumor-node-metastasis (TNM) system[8]. Collection oftissue material and review of patient records to obtainclinical information were performed under IRB-approvedprotocol.
Mismatch Repair StatusDefective DNA mismatch repair (dMMR) was defined bythe presence of microsatellite instability (MSI-H) and/orthe absence of protein expression for hMLH1. ProficientDNA mismatch repair (pMMR) was defined by theabsence of microsatellite instability (MSS/MSI-L) and thepresence of normal protein expression for hMLH1. MSI inCC cases was compared with paired normal and tumorDNA isolated (Qiagen DNA extraction kit) from formalin-fixed, paraffin-embedded (FFPE) material. Tumors wereclassified as MSI-H if > 30% of markers demonstratedinstability and as MSS/MSI-L if < 30% demonstrated MSI[22,23]. Immunohistochemical analysis of hMLH1expression was performed on FFPE samples, as previouslydescribed [5].
RNA ExtractionFollowing harvest, tissue samples were immediately snapfrozen and stored at -80°C. For each case, frozen tumortissue was cut on a cryostat to generate a hematoxylin andeosin (H&E) stained slide. Tumors were then evaluatedfor content of tumor present, areas of tumor containing atlast 70% tumor or greater were macro-dissected and tissueequivalent to 7 mm2 and 10-microns thick was then sec-tioned and placed in a vial containing 400 uL of RLTbuffer (QIAGEN, Chatsworth, CA) including 4 μL of β-mercaptoethanol. The vial was then stored at -80°C untilutilized for RNA extraction using TRIzol® LSTrizol© (Invit-rogen, Corp., Carlsbad, CA), according to the manufac-turer's instructions.
miRNA Expression by qRT-PCRqRT-PCR was carried using normalization to U6 snRNA.First strand cDNA was synthesized from 1 μg of total RNAusing a miScript reverse transcription kit (Qiagen, Valen-cia, CA). miRNA was quantified with an miRscript SYBRGreen PCR kit (Catl: 218073, Qiagen, Valencia, CA) usingcDNA equivalent of 50 ng total RNA per reaction. MaturemiRNA-specific forward primers [see Additional file 1]were purchased from a vendor (IDT, USA) and the univer-sal reverse primer provided by the manufacturer. Real-time PCR was performed at 55°C annealing followingstandard protocol of the manufacturer in 7500 Real TimePCR system (Applied Biosystem, USA) and thresholdcycles (CT) were calculated using Sequence Detection Soft-ware (SDS v1.2.1, Applied Biosystem, USA). Fold expres-
sion was calculated from the triplicate of CT valuesfollowing the 2-ΔΔCt method [24].
RNA ProcessingThe chemistry involved in the miRNA BeadArray™ wassimilar to that used in the DASL amplification process[21]. Total RNA [200 ng (all 108 samples) and 400 ng (38technical replicates)] was poly-adenylated and then con-verted to cDNA using a biotinylated oligo-dT primer witha universal PCR sequenced at its 5'-end. This was followedby annealing of a miRNA-specific oligonucleotide pool(MSO), which consisted of three parts: a universal PCRpriming site at the 5' end; an address sequence comple-mentary to a capture sequence on the BeadArray™; and amicroRNA-specific sequence at the 3'-end. Extension ofMSO was facilitated by addition of a polymerase but onlyif their 3' bases were complementary to the cognatesequence in the cDNA template. Common primers wereused to amplify the cDNA templates; the primer compli-mentary to the BeadArray™ was fluorescently labeled. Thesingle-stranded PCR product was hybridized to the SentrixArray Matrix where the labeled strand bound to the beadon the array containing the complementary addresssequence. The arrays were imaged using an Illumina Bea-dArray™ Reader, which measures the fluorescence inten-sity at each addressed bead location. Intensity files wereanalyzed using BeadStudio version 3.1.1. Expression lev-els were expressed as an average Beta value.
Pre-processing and AnalysesData were exported from Illumina's BeadStudio package,with neither background correction nor scale correction,and transformed to the log base 2 scale. Quantile normal-ization [25] was used as implemented by the R library affy[26,27]. Samples were distributed on two Illumina SAMs;systematic effects due to SAM were evaluated and found tobe minimal. A linear mixed-effects model [28] was usedon a probe-by-probe basis to compare expression betweengroups accounting for the correlation between replicatesor paired normal-tumor samples from a given subject.Replicate samples were averaged for further data analyses.
Support Vector Machine Classification (SVM) was carriedout using the Genedata expressionist data analyses suite.Clustering was carried out on log transformed mediancentered data using Cluster 3.0 for Mac OS X (C ClusteringLibrary 1.43) centroid linkage clustering and was visual-ized using Java TreeView Version 1.1.3. miRNA tumorexpression data has been submitted to NCBI's GeneExpression Omnibus (GEO) as ID: GSE18392. Addition-ally, the data will be searchable on our website http://www.oncomir.umn.edu.
Genomewide CC methylation data [29], genes implicatedin CC via forward genetic screen [30] and stem cell
Page 3 of 15(page number not for citation purposes)
BMC Cancer 2009, 9:401 http://www.biomedcentral.com/1471-2407/9/401
miRNA expression data [31] were obtained from publica-tion. The Diana miRpath application [32] was used todetermine pathway enrichment within the putative targetsfor miRNAs found to be altered in CC. miRNA::mRNAinteractions were downloaded from the miRDB version2.0 database. Custom Perl scripts were used to parsemiRDB, identify predicted miRNA interactions withtumor suppressor mRNA and identify relationshipsbetween miRNA and methylated regions.
ResultsTissue SpecimensTo systematically determine differences in miRNA expres-sion in colon cancers and their subgroups from normalcolon tissue, the expression levels of 735 miRNA in 108tissue samples were examined using the Illumina miRNAdetection platform. The characteristics of these tissue sam-ples are described in Table 1 with additional data pro-vided [see Additional file 2]. All tumors werehistologically reviewed and macrodissected to ensure thatat minimum 70% of the tumors contained neoplastic cellsto ensure that the majority of tissue extracted was of neo-plastic origin. The colon tumors were further separated bymismatch repair status into dMMR (n = 12) of acquiredvariety (sporadic) and pMMR groups (n = 68). Theremaining 28 tissue specimens were derived from adja-cent normal colon tissue removed during tumor resection.All data, both raw and normalized, is provided [see Addi-tional file 3].
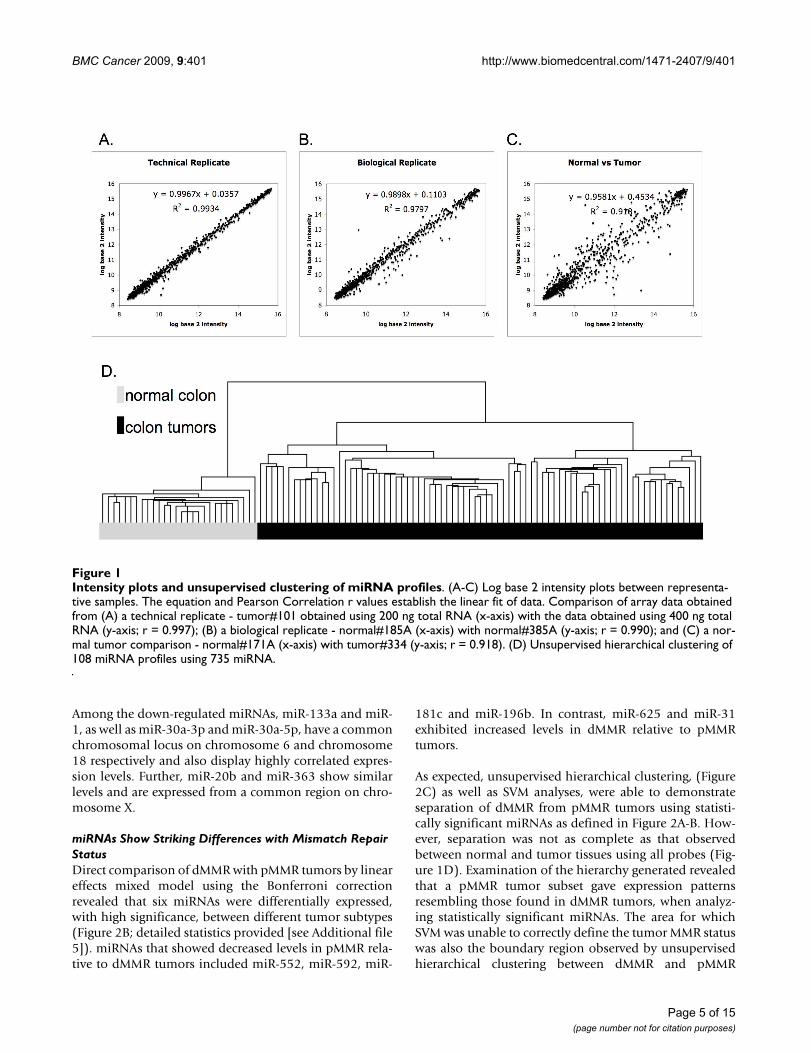
Technical Array Replicates Show High Level of CorrelationRepresentative log base 2 intensity plots for direct com-parison of normalized array data are shown for pairs oftechnical replicates, biological replicates and Normal/Tumor (Figure 1). Technical replicates using either 200 ngor 400 ng of RNA were used to determine the reproduci-bility of the Illumina miRNA platform. High Pearson cor-relation r values were found between technical replicateseven when using different concentrations of RNA foramplification (Average 0.993; Range {0.977 to 0.997})(Figure 1A). Lower, but still high, correlations were seenbetween biological replicates Normal to Normal (Average0.984; Range {0.951 to 0.996}) (Figure 1B). The lowest
correlations were seen between normal colon tissue andtumor tissue [Average 0.967; Range {0.891 to 0.985} (Fig-ure 1C)].
miRNA Profiles Show Distinct Separation of Tumors from Normal TissueUnsupervised hierarchical clustering was carried out onthe miRNA expression data (Figure 1D). Analyses of thedendrogram revealed that normal colon tissue profilescluster together in a group separate from the colon tumorsamples (Figure 1D). In addition, normal tissue gave atighter internal correlation, signified by higher correla-tions, than the tumor tissue subset, which as a groupshowed less internal correlation.
SVM analyses were used to determine whether the miRNAprofiled by the unsupervised hierarchical clustering aresufficient to classify the tumor/normal status. SVMs lookfor distinctive patterns in groups of data and then usethem to classify group membership status for additionaldata. A Monte Carlo cross-validation simulation was setup to create training sets from 50% of the data and use thesets to predict tumor/normal status of the remainder ofthe dataset with 1000 iterations. Following combinationof the results from all simulations, tumor vs normal statuswas correctly classified 100% of the time. The confusionmatrix is included [see Additional file 4].
Differential ExpressionA linear mixed effects model was used to determine statis-tically significant miRNAs differentially expressed in nor-mal tissue compared with all tumor tissues (Figure 2;detailed statistics also provided [see Additional file 5]). Inorder for a miRNA to be rigorously considered significant,a p <6.8e-5 was required. This represents the Bonferronicorrection for solving the multiple testing problems asso-ciated with carrying out 735 individual tests, one for eachmiRNA studied on the array. In addition, significantlyaltered miRNAs were also required to show a fold changeof absolute value greater than 1.7 to further focus onmiRNA with large expression changes in our high tumorcontent samples.
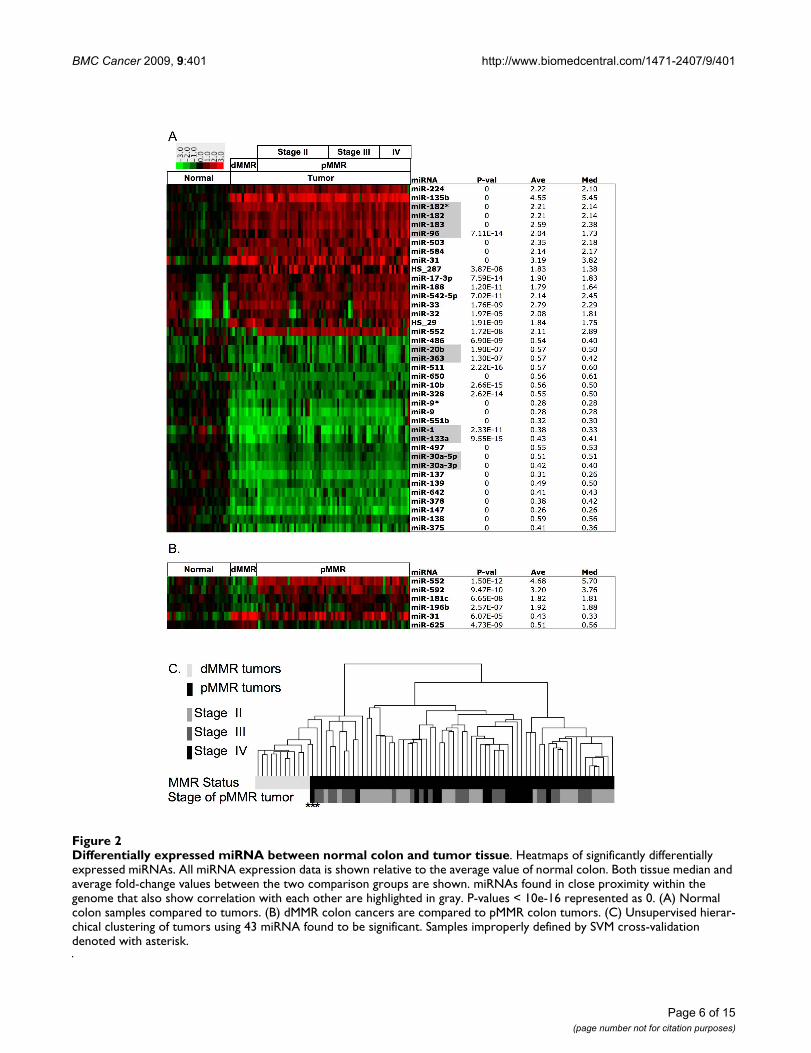
Using these criteria, 39 miRNAs were differentiallyexpressed between normal colon tissue and the compositecollection of colon tumor tissue (Figure 2A). Many ofthese miRNA show similar expression patterns and arefound in close chromosomal proximity. A subset of 17miRNAs showed increased expression in colon tumorsrelative to normal colon tissue. Importantly, miR-135bdisplayed the largest average change, a 4.55-fold increase.miR-96, miR-182, miR-182* and miR-183 were all up-regulated; expression was highly correlated and mappedto the same region of chromosome 7. Additionally, 22miRNAs showed decreased expression in colon tumors.
Table 1: Sample counts of tissues meeting specified characteristics analyzed in this study
Characteristic Count
normal colon 28dMMR/MSIH tumors (sporadic) 12pMMR Stage II tumor 28pMMR Stage III tumor 24pMMR Stage IV tumor 15pMMR Stage undefined 1Total Profiled 108
Page 4 of 15(page number not for citation purposes)
BMC Cancer 2009, 9:401 http://www.biomedcentral.com/1471-2407/9/401
Among the down-regulated miRNAs, miR-133a and miR-1, as well as miR-30a-3p and miR-30a-5p, have a commonchromosomal locus on chromosome 6 and chromosome18 respectively and also display highly correlated expres-sion levels. Further, miR-20b and miR-363 show similarlevels and are expressed from a common region on chro-mosome X.
miRNAs Show Striking Differences with Mismatch Repair StatusDirect comparison of dMMR with pMMR tumors by lineareffects mixed model using the Bonferroni correctionrevealed that six miRNAs were differentially expressed,with high significance, between different tumor subtypes(Figure 2B; detailed statistics provided [see Additional file5]). miRNAs that showed decreased levels in pMMR rela-tive to dMMR tumors included miR-552, miR-592, miR-
181c and miR-196b. In contrast, miR-625 and miR-31exhibited increased levels in dMMR relative to pMMRtumors.
As expected, unsupervised hierarchical clustering, (Figure2C) as well as SVM analyses, were able to demonstrateseparation of dMMR from pMMR tumors using statisti-cally significant miRNAs as defined in Figure 2A-B. How-ever, separation was not as complete as that observedbetween normal and tumor tissues using all probes (Fig-ure 1D). Examination of the hierarchy generated revealedthat a pMMR tumor subset gave expression patternsresembling those found in dMMR tumors, when analyz-ing statistically significant miRNAs. The area for whichSVM was unable to correctly define the tumor MMR statuswas also the boundary region observed by unsupervisedhierarchical clustering between dMMR and pMMR
Intensity plots and unsupervised clustering of miRNA profilesFigure 1Intensity plots and unsupervised clustering of miRNA profiles. (A-C) Log base 2 intensity plots between representa-tive samples. The equation and Pearson Correlation r values establish the linear fit of data. Comparison of array data obtained from (A) a technical replicate - tumor#101 obtained using 200 ng total RNA (x-axis) with the data obtained using 400 ng total RNA (y-axis; r = 0.997); (B) a biological replicate - normal#185A (x-axis) with normal#385A (y-axis; r = 0.990); and (C) a nor-mal tumor comparison - normal#171A (x-axis) with tumor#334 (y-axis; r = 0.918). (D) Unsupervised hierarchical clustering of 108 miRNA profiles using 735 miRNA.
Page 5 of 15(page number not for citation purposes)
BMC Cancer 2009, 9:401 http://www.biomedcentral.com/1471-2407/9/401
Page 6 of 15(page number not for citation purposes)
Differentially expressed miRNA between normal colon and tumor tissueFigure 2Differentially expressed miRNA between normal colon and tumor tissue. Heatmaps of significantly differentially expressed miRNAs. All miRNA expression data is shown relative to the average value of normal colon. Both tissue median and average fold-change values between the two comparison groups are shown. miRNAs found in close proximity within the genome that also show correlation with each other are highlighted in gray. P-values < 10e-16 represented as 0. (A) Normal colon samples compared to tumors. (B) dMMR colon cancers are compared to pMMR colon tumors. (C) Unsupervised hierar-chical clustering of tumors using 43 miRNA found to be significant. Samples improperly defined by SVM cross-validation denoted with asterisk.
BMC Cancer 2009, 9:401 http://www.biomedcentral.com/1471-2407/9/401
tumors. The SVM confusion matrix for this analysis isincluded [see Additional file 4]. Further, unsupervisedclustering was not able to differentiate between pMMRstages II, III and IV using either the complete dataset or thestatistically significant tumor dataset. Furthermore, nodifferences were observed between tumors from malesand females.
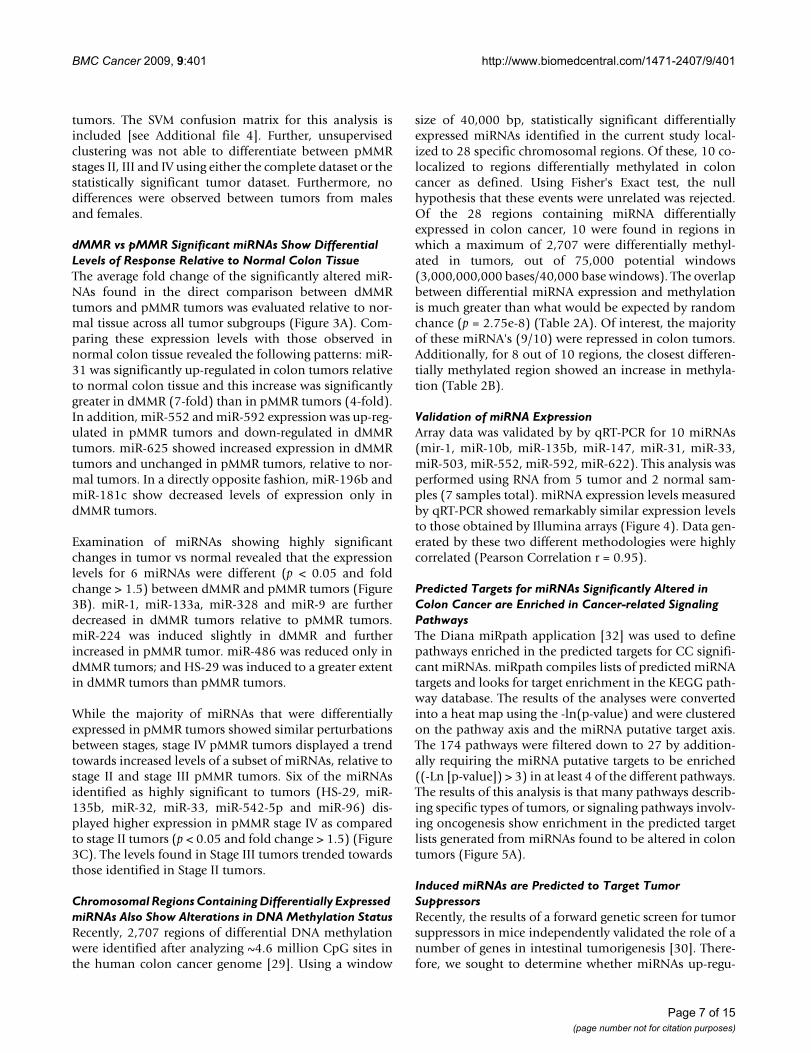
dMMR vs pMMR Significant miRNAs Show Differential Levels of Response Relative to Normal Colon TissueThe average fold change of the significantly altered miR-NAs found in the direct comparison between dMMRtumors and pMMR tumors was evaluated relative to nor-mal tissue across all tumor subgroups (Figure 3A). Com-paring these expression levels with those observed innormal colon tissue revealed the following patterns: miR-31 was significantly up-regulated in colon tumors relativeto normal colon tissue and this increase was significantlygreater in dMMR (7-fold) than in pMMR tumors (4-fold).In addition, miR-552 and miR-592 expression was up-reg-ulated in pMMR tumors and down-regulated in dMMRtumors. miR-625 showed increased expression in dMMRtumors and unchanged in pMMR tumors, relative to nor-mal tumors. In a directly opposite fashion, miR-196b andmiR-181c show decreased levels of expression only indMMR tumors.
Examination of miRNAs showing highly significantchanges in tumor vs normal revealed that the expressionlevels for 6 miRNAs were different (p < 0.05 and foldchange > 1.5) between dMMR and pMMR tumors (Figure3B). miR-1, miR-133a, miR-328 and miR-9 are furtherdecreased in dMMR tumors relative to pMMR tumors.miR-224 was induced slightly in dMMR and furtherincreased in pMMR tumor. miR-486 was reduced only indMMR tumors; and HS-29 was induced to a greater extentin dMMR tumors than pMMR tumors.
While the majority of miRNAs that were differentiallyexpressed in pMMR tumors showed similar perturbationsbetween stages, stage IV pMMR tumors displayed a trendtowards increased levels of a subset of miRNAs, relative tostage II and stage III pMMR tumors. Six of the miRNAsidentified as highly significant to tumors (HS-29, miR-135b, miR-32, miR-33, miR-542-5p and miR-96) dis-played higher expression in pMMR stage IV as comparedto stage II tumors (p < 0.05 and fold change > 1.5) (Figure3C). The levels found in Stage III tumors trended towardsthose identified in Stage II tumors.
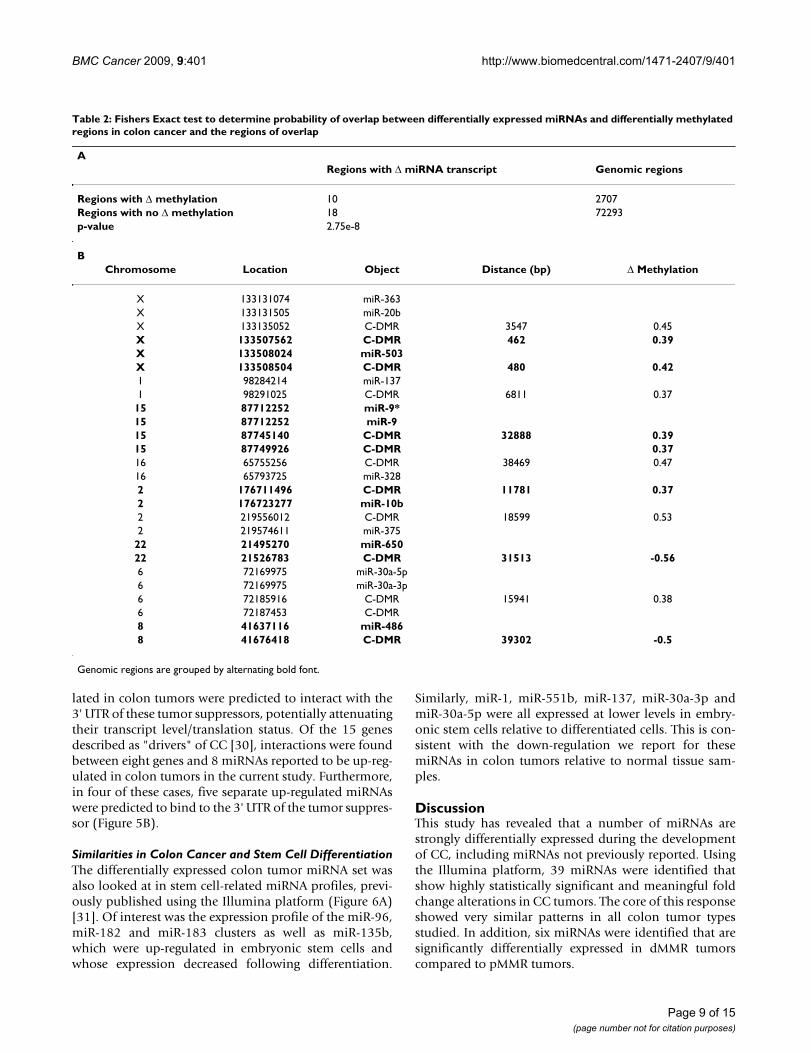
Chromosomal Regions Containing Differentially Expressed miRNAs Also Show Alterations in DNA Methylation StatusRecently, 2,707 regions of differential DNA methylationwere identified after analyzing ~4.6 million CpG sites inthe human colon cancer genome [29]. Using a window
size of 40,000 bp, statistically significant differentiallyexpressed miRNAs identified in the current study local-ized to 28 specific chromosomal regions. Of these, 10 co-localized to regions differentially methylated in coloncancer as defined. Using Fisher's Exact test, the nullhypothesis that these events were unrelated was rejected.Of the 28 regions containing miRNA differentiallyexpressed in colon cancer, 10 were found in regions inwhich a maximum of 2,707 were differentially methyl-ated in tumors, out of 75,000 potential windows(3,000,000,000 bases/40,000 base windows). The overlapbetween differential miRNA expression and methylationis much greater than what would be expected by randomchance (p = 2.75e-8) (Table 2A). Of interest, the majorityof these miRNA's (9/10) were repressed in colon tumors.Additionally, for 8 out of 10 regions, the closest differen-tially methylated region showed an increase in methyla-tion (Table 2B).
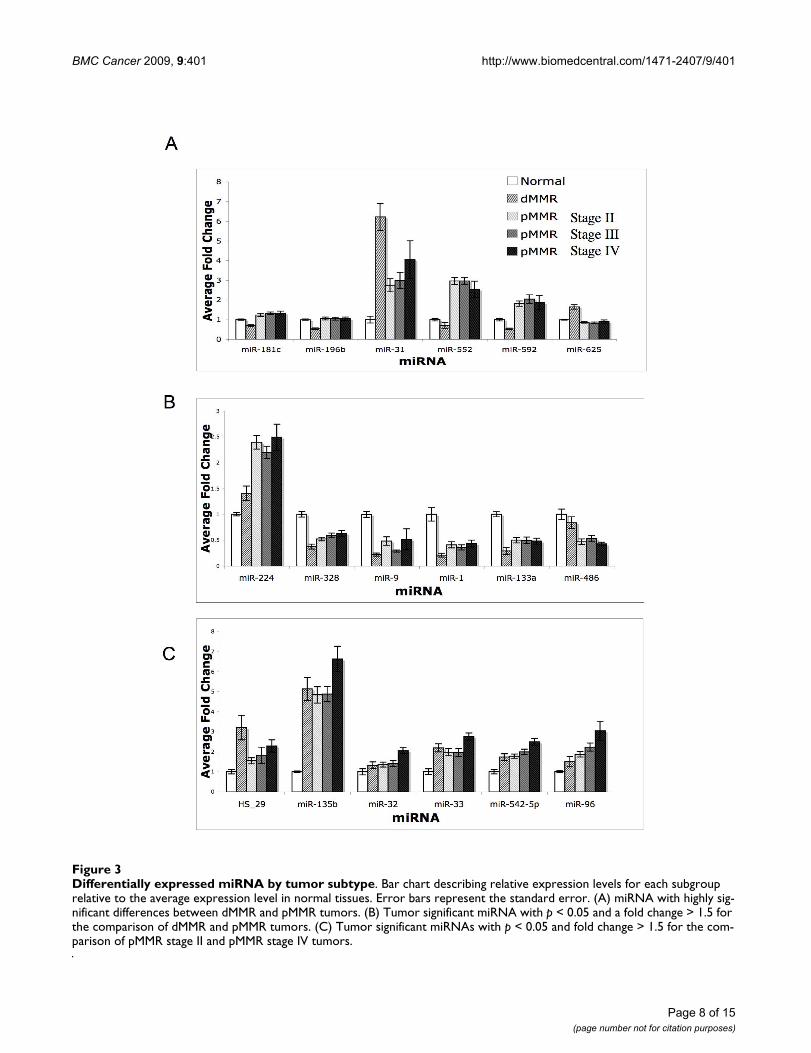
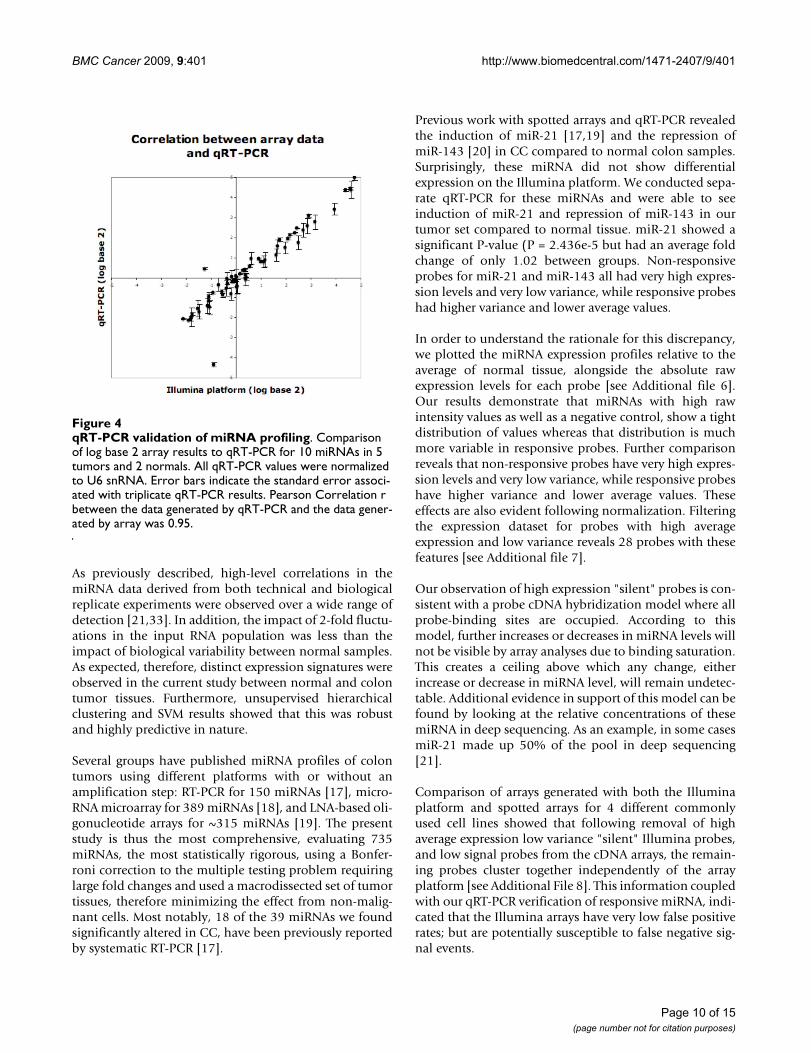
Validation of miRNA ExpressionArray data was validated by by qRT-PCR for 10 miRNAs(mir-1, miR-10b, miR-135b, miR-147, miR-31, miR-33,miR-503, miR-552, miR-592, miR-622). This analysis wasperformed using RNA from 5 tumor and 2 normal sam-ples (7 samples total). miRNA expression levels measuredby qRT-PCR showed remarkably similar expression levelsto those obtained by Illumina arrays (Figure 4). Data gen-erated by these two different methodologies were highlycorrelated (Pearson Correlation r = 0.95).
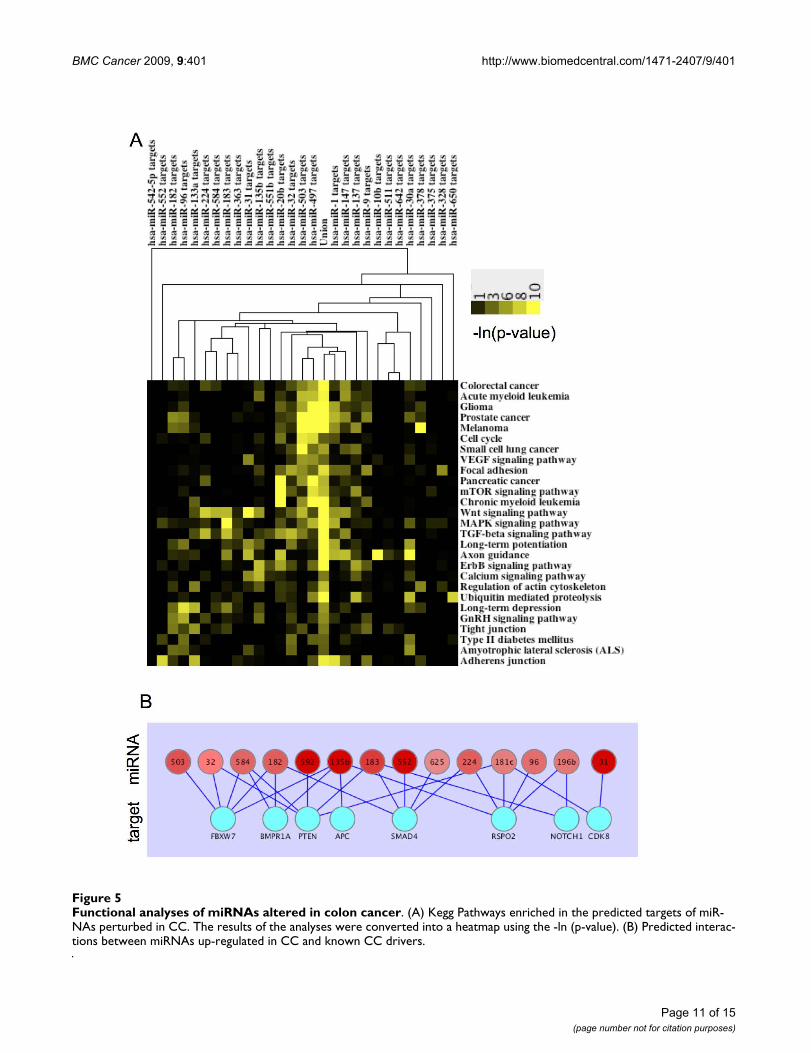
Predicted Targets for miRNAs Significantly Altered in Colon Cancer are Enriched in Cancer-related Signaling PathwaysThe Diana miRpath application [32] was used to definepathways enriched in the predicted targets for CC signifi-cant miRNAs. miRpath compiles lists of predicted miRNAtargets and looks for target enrichment in the KEGG path-way database. The results of the analyses were convertedinto a heat map using the -ln(p-value) and were clusteredon the pathway axis and the miRNA putative target axis.The 174 pathways were filtered down to 27 by addition-ally requiring the miRNA putative targets to be enriched((-Ln [p-value]) > 3) in at least 4 of the different pathways.The results of this analysis is that many pathways describ-ing specific types of tumors, or signaling pathways involv-ing oncogenesis show enrichment in the predicted targetlists generated from miRNAs found to be altered in colontumors (Figure 5A).
Induced miRNAs are Predicted to Target Tumor SuppressorsRecently, the results of a forward genetic screen for tumorsuppressors in mice independently validated the role of anumber of genes in intestinal tumorigenesis [30]. There-fore, we sought to determine whether miRNAs up-regu-
Page 7 of 15(page number not for citation purposes)
BMC Cancer 2009, 9:401 http://www.biomedcentral.com/1471-2407/9/401
Page 8 of 15(page number not for citation purposes)
Differentially expressed miRNA by tumor subtypeFigure 3Differentially expressed miRNA by tumor subtype. Bar chart describing relative expression levels for each subgroup relative to the average expression level in normal tissues. Error bars represent the standard error. (A) miRNA with highly sig-nificant differences between dMMR and pMMR tumors. (B) Tumor significant miRNA with p < 0.05 and a fold change > 1.5 for the comparison of dMMR and pMMR tumors. (C) Tumor significant miRNAs with p < 0.05 and fold change > 1.5 for the com-parison of pMMR stage II and pMMR stage IV tumors.
BMC Cancer 2009, 9:401 http://www.biomedcentral.com/1471-2407/9/401
lated in colon tumors were predicted to interact with the3' UTR of these tumor suppressors, potentially attenuatingtheir transcript level/translation status. Of the 15 genesdescribed as "drivers" of CC [30], interactions were foundbetween eight genes and 8 miRNAs reported to be up-reg-ulated in colon tumors in the current study. Furthermore,in four of these cases, five separate up-regulated miRNAswere predicted to bind to the 3' UTR of the tumor suppres-sor (Figure 5B).
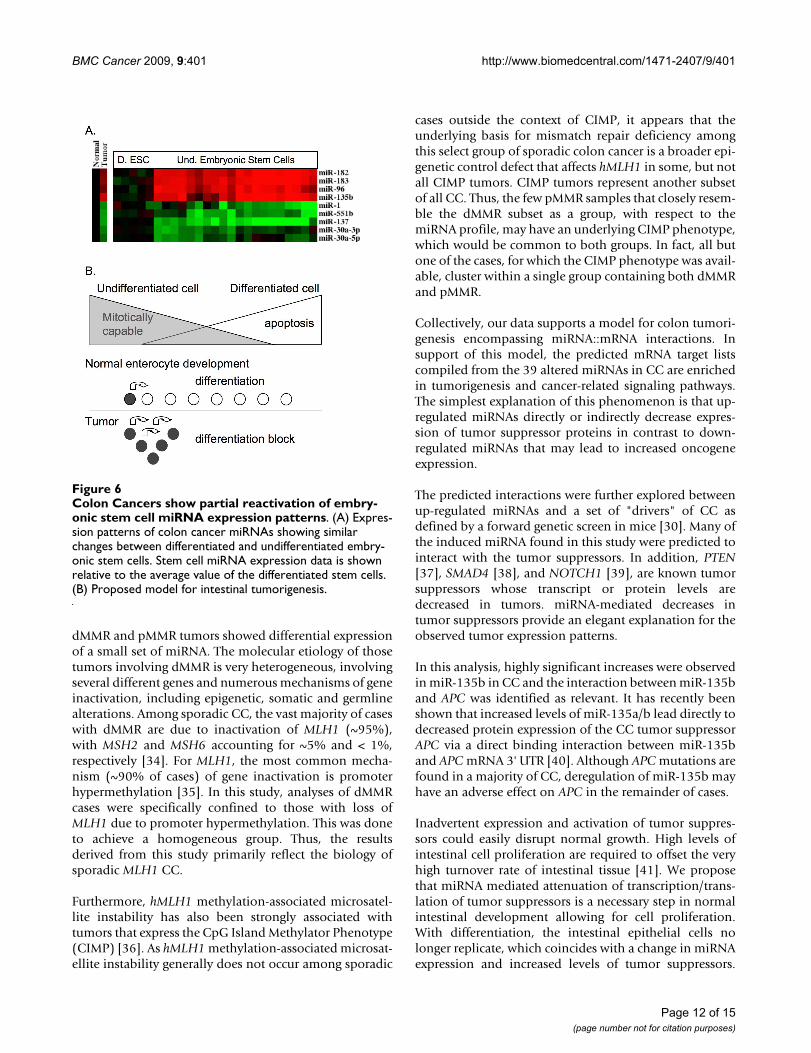
Similarities in Colon Cancer and Stem Cell DifferentiationThe differentially expressed colon tumor miRNA set wasalso looked at in stem cell-related miRNA profiles, previ-ously published using the Illumina platform (Figure 6A)[31]. Of interest was the expression profile of the miR-96,miR-182 and miR-183 clusters as well as miR-135b,which were up-regulated in embryonic stem cells andwhose expression decreased following differentiation.
Similarly, miR-1, miR-551b, miR-137, miR-30a-3p andmiR-30a-5p were all expressed at lower levels in embry-onic stem cells relative to differentiated cells. This is con-sistent with the down-regulation we report for thesemiRNAs in colon tumors relative to normal tissue sam-ples.
DiscussionThis study has revealed that a number of miRNAs arestrongly differentially expressed during the developmentof CC, including miRNAs not previously reported. Usingthe Illumina platform, 39 miRNAs were identified thatshow highly statistically significant and meaningful foldchange alterations in CC tumors. The core of this responseshowed very similar patterns in all colon tumor typesstudied. In addition, six miRNAs were identified that aresignificantly differentially expressed in dMMR tumorscompared to pMMR tumors.
Table 2: Fishers Exact test to determine probability of overlap between differentially expressed miRNAs and differentially methylated regions in colon cancer and the regions of overlap
ARegions with Δ miRNA transcript Genomic regions
Regions with Δ methylation 10 2707Regions with no Δ methylation 18 72293p-value 2.75e-8
BChromosome Location Object Distance (bp) Δ Methylation
X 133131074 miR-363X 133131505 miR-20bX 133135052 C-DMR 3547 0.45X 133507562 C-DMR 462 0.39X 133508024 miR-503X 133508504 C-DMR 480 0.421 98284214 miR-1371 98291025 C-DMR 6811 0.37
15 87712252 miR-9*15 87712252 miR-915 87745140 C-DMR 32888 0.3915 87749926 C-DMR 0.3716 65755256 C-DMR 38469 0.4716 65793725 miR-3282 176711496 C-DMR 11781 0.372 176723277 miR-10b2 219556012 C-DMR 18599 0.532 219574611 miR-375
22 21495270 miR-65022 21526783 C-DMR 31513 -0.566 72169975 miR-30a-5p6 72169975 miR-30a-3p6 72185916 C-DMR 15941 0.386 72187453 C-DMR8 41637116 miR-4868 41676418 C-DMR 39302 -0.5
Genomic regions are grouped by alternating bold font.
Page 9 of 15(page number not for citation purposes)
BMC Cancer 2009, 9:401 http://www.biomedcentral.com/1471-2407/9/401
As previously described, high-level correlations in themiRNA data derived from both technical and biologicalreplicate experiments were observed over a wide range ofdetection [21,33]. In addition, the impact of 2-fold fluctu-ations in the input RNA population was less than theimpact of biological variability between normal samples.As expected, therefore, distinct expression signatures wereobserved in the current study between normal and colontumor tissues. Furthermore, unsupervised hierarchicalclustering and SVM results showed that this was robustand highly predictive in nature.
Several groups have published miRNA profiles of colontumors using different platforms with or without anamplification step: RT-PCR for 150 miRNAs [17], micro-RNA microarray for 389 miRNAs [18], and LNA-based oli-gonucleotide arrays for ~315 miRNAs [19]. The presentstudy is thus the most comprehensive, evaluating 735miRNAs, the most statistically rigorous, using a Bonfer-roni correction to the multiple testing problem requiringlarge fold changes and used a macrodissected set of tumortissues, therefore minimizing the effect from non-malig-nant cells. Most notably, 18 of the 39 miRNAs we foundsignificantly altered in CC, have been previously reportedby systematic RT-PCR [17].
Previous work with spotted arrays and qRT-PCR revealedthe induction of miR-21 [17,19] and the repression ofmiR-143 [20] in CC compared to normal colon samples.Surprisingly, these miRNA did not show differentialexpression on the Illumina platform. We conducted sepa-rate qRT-PCR for these miRNAs and were able to seeinduction of miR-21 and repression of miR-143 in ourtumor set compared to normal tissue. miR-21 showed asignificant P-value (P = 2.436e-5 but had an average foldchange of only 1.02 between groups. Non-responsiveprobes for miR-21 and miR-143 all had very high expres-sion levels and very low variance, while responsive probeshad higher variance and lower average values.
In order to understand the rationale for this discrepancy,we plotted the miRNA expression profiles relative to theaverage of normal tissue, alongside the absolute rawexpression levels for each probe [see Additional file 6].Our results demonstrate that miRNAs with high rawintensity values as well as a negative control, show a tightdistribution of values whereas that distribution is muchmore variable in responsive probes. Further comparisonreveals that non-responsive probes have very high expres-sion levels and very low variance, while responsive probeshave higher variance and lower average values. Theseeffects are also evident following normalization. Filteringthe expression dataset for probes with high averageexpression and low variance reveals 28 probes with thesefeatures [see Additional file 7].
Our observation of high expression "silent" probes is con-sistent with a probe cDNA hybridization model where allprobe-binding sites are occupied. According to thismodel, further increases or decreases in miRNA levels willnot be visible by array analyses due to binding saturation.This creates a ceiling above which any change, eitherincrease or decrease in miRNA level, will remain undetec-table. Additional evidence in support of this model can befound by looking at the relative concentrations of thesemiRNA in deep sequencing. As an example, in some casesmiR-21 made up 50% of the pool in deep sequencing[21].
Comparison of arrays generated with both the Illuminaplatform and spotted arrays for 4 different commonlyused cell lines showed that following removal of highaverage expression low variance "silent" Illumina probes,and low signal probes from the cDNA arrays, the remain-ing probes cluster together independently of the arrayplatform [see Additional File 8]. This information coupledwith our qRT-PCR verification of responsive miRNA, indi-cated that the Illumina arrays have very low false positiverates; but are potentially susceptible to false negative sig-nal events.
qRT-PCR validation of miRNA profilingFigure 4qRT-PCR validation of miRNA profiling. Comparison of log base 2 array results to qRT-PCR for 10 miRNAs in 5 tumors and 2 normals. All qRT-PCR values were normalized to U6 snRNA. Error bars indicate the standard error associ-ated with triplicate qRT-PCR results. Pearson Correlation r between the data generated by qRT-PCR and the data gener-ated by array was 0.95.
Page 10 of 15(page number not for citation purposes)
BMC Cancer 2009, 9:401 http://www.biomedcentral.com/1471-2407/9/401
Page 11 of 15(page number not for citation purposes)
Functional analyses of miRNAs altered in colon cancerFigure 5Functional analyses of miRNAs altered in colon cancer. (A) Kegg Pathways enriched in the predicted targets of miR-NAs perturbed in CC. The results of the analyses were converted into a heatmap using the -ln (p-value). (B) Predicted interac-tions between miRNAs up-regulated in CC and known CC drivers.
BMC Cancer 2009, 9:401 http://www.biomedcentral.com/1471-2407/9/401
dMMR and pMMR tumors showed differential expressionof a small set of miRNA. The molecular etiology of thosetumors involving dMMR is very heterogeneous, involvingseveral different genes and numerous mechanisms of geneinactivation, including epigenetic, somatic and germlinealterations. Among sporadic CC, the vast majority of caseswith dMMR are due to inactivation of MLH1 (~95%),with MSH2 and MSH6 accounting for ~5% and < 1%,respectively [34]. For MLH1, the most common mecha-nism (~90% of cases) of gene inactivation is promoterhypermethylation [35]. In this study, analyses of dMMRcases were specifically confined to those with loss ofMLH1 due to promoter hypermethylation. This was doneto achieve a homogeneous group. Thus, the resultsderived from this study primarily reflect the biology ofsporadic MLH1 CC.
Furthermore, hMLH1 methylation-associated microsatel-lite instability has also been strongly associated withtumors that express the CpG Island Methylator Phenotype(CIMP) [36]. As hMLH1 methylation-associated microsat-ellite instability generally does not occur among sporadic
cases outside the context of CIMP, it appears that theunderlying basis for mismatch repair deficiency amongthis select group of sporadic colon cancer is a broader epi-genetic control defect that affects hMLH1 in some, but notall CIMP tumors. CIMP tumors represent another subsetof all CC. Thus, the few pMMR samples that closely resem-ble the dMMR subset as a group, with respect to themiRNA profile, may have an underlying CIMP phenotype,which would be common to both groups. In fact, all butone of the cases, for which the CIMP phenotype was avail-able, cluster within a single group containing both dMMRand pMMR.
Collectively, our data supports a model for colon tumori-genesis encompassing miRNA::mRNA interactions. Insupport of this model, the predicted mRNA target listscompiled from the 39 altered miRNAs in CC are enrichedin tumorigenesis and cancer-related signaling pathways.The simplest explanation of this phenomenon is that up-regulated miRNAs directly or indirectly decrease expres-sion of tumor suppressor proteins in contrast to down-regulated miRNAs that may lead to increased oncogeneexpression.
The predicted interactions were further explored betweenup-regulated miRNAs and a set of "drivers" of CC asdefined by a forward genetic screen in mice [30]. Many ofthe induced miRNA found in this study were predicted tointeract with the tumor suppressors. In addition, PTEN[37], SMAD4 [38], and NOTCH1 [39], are known tumorsuppressors whose transcript or protein levels aredecreased in tumors. miRNA-mediated decreases intumor suppressors provide an elegant explanation for theobserved tumor expression patterns.
In this analysis, highly significant increases were observedin miR-135b in CC and the interaction between miR-135band APC was identified as relevant. It has recently beenshown that increased levels of miR-135a/b lead directly todecreased protein expression of the CC tumor suppressorAPC via a direct binding interaction between miR-135band APC mRNA 3' UTR [40]. Although APC mutations arefound in a majority of CC, deregulation of miR-135b mayhave an adverse effect on APC in the remainder of cases.
Inadvertent expression and activation of tumor suppres-sors could easily disrupt normal growth. High levels ofintestinal cell proliferation are required to offset the veryhigh turnover rate of intestinal tissue [41]. We proposethat miRNA mediated attenuation of transcription/trans-lation of tumor suppressors is a necessary step in normalintestinal development allowing for cell proliferation.With differentiation, the intestinal epithelial cells nolonger replicate, which coincides with a change in miRNAexpression and increased levels of tumor suppressors.
Colon Cancers show partial reactivation of embryonic stem cell miRNA expression patternsFigure 6Colon Cancers show partial reactivation of embry-onic stem cell miRNA expression patterns. (A) Expres-sion patterns of colon cancer miRNAs showing similar changes between differentiated and undifferentiated embry-onic stem cells. Stem cell miRNA expression data is shown relative to the average value of the differentiated stem cells. (B) Proposed model for intestinal tumorigenesis.
Page 12 of 15(page number not for citation purposes)
BMC Cancer 2009, 9:401 http://www.biomedcentral.com/1471-2407/9/401
miRNA expression profiles found in CC show strikingsimilarities with those miRNA profiles found in undiffer-entiated embryonic stem cells relative to differentiatedstem cells (Figure 6A) and cancer cell lines [31]. Embry-onic stem cells and colon tumor cells are both capable ofalmost unlimited mitotic division. A potential interpreta-tion of this observation is that the intestinal crypt cells failto properly differentiate and may instead continue toactively divide leading to tumor formation (Figure 6B).This is further supported by the observed decreases inmiR-1 and miR-133a, which are involved in maintainingthe differentiation status of muscle cells [42]. In addition,miR-1 over-expression has been shown to cause expres-sion of differentiated muscle cell mRNA [43]. Thedecreased levels of miR-1 and miR-133a in dMMR tumorsrelative to pMMR tumors may also explain why sporadicCC with dMMR show poor differentiation.
Temporal patterns of gene expression during cell-celladhesion-initiated polarization of cultured human Caco-2 cells found similar transcript changes to those observedduring migration and differentiation of intestinal epithe-lial cells in vivo, despite the absence of morphogen gradi-ents and interactions with stromal cells characteristic ofenterocyte differentiation in situ [44]. Here, we proposethat miRNAs may be involved in these changes and thatthe miRNA profile within each cell is modified as cellsstop dividing, undergo chromatin remodeling andbecome further differentiated with limited ability to repli-cate.
Taken together, these findings suggest that the inability toproperly differentiate due to loss of epigenetic controlmay be an important factor in the development of coloncancer. The role of induced miRNA found in tumors maybe to (i) drive tumorigenesis by attenuating the transla-tion of tumor suppressors thereby maintaining a statecapable of cell division; or (ii) act as passengers whose lev-els reflect that they are locked into a state of uncontrolledcell replication.
Several basic questions arise from these findings. Howand why are miRNA expression levels altered and how canthey be modified? Our analyses show that miR-135b washighly up-regulated in colon tumors. PDRM5 is a tumorsuppressor and a target of epigenetic silencing in CC [45].Of interest, PDRM5 has been shown to bind to the pro-moter of miR-135b and PDRM5 silencing leads toincreased levels of miR-135b. Mechanistically, PRDM5recruits HDAC1 and G9a to the miR-135b promoter, andthis chromatin remodeling results in decreased miR-135bexpression. Decreases in PDRM5 expression levels lead toincreased expression of miR-135b presumably due to lossof recruitment of this chromatin-remodeling complex.Intriguingly, PDRM5 was also found by CHIP-CHIP to be
present at the promoter regions of miR-9, miR-378, miR-196b, miR-96-182-183, as well as additional colon cancerrelevant miRNA miR-21 and miR-143-145 [46]. Decreasesin PDRM5 were associated with both increases anddecreases in miRNA expression. miR-9 was also down-reg-ulated in invasive breast cancers via promoter hypermeth-ylation [47]. Therefore, PDRM5-mediated chromatinremodeling may be a general epigenetic mechanismrelated to a wide range of tumors. Drugs that modify chro-matin structure and methylation status in a sequence spe-cific fashion may be useful in colon cancer treatment dueto the reversible nature of histone modification and DNAmethylation. Those that modify miRNA transcript level ormimic/inhibit miRNA function may also be useful.
ConclusionThe data presented here unifies miRNA expression plat-forms, broadens the miRNAome associated with CC anddefines highly significant differences in miRNA expres-sion between dMMR and pMMR tumors. We hypothesizethat the differential miRNA expression patterns observedmay modify oncogene and tumor suppressor proteinexpression and thereby may promote tumorigenesis byblocking the proper differentiation of intestinal progeni-tor cells, consequently leading to improper cell divisionand tumor formation. By identifying the miRNA altera-tions associated with CC at a high level of definition in astatistically powerful dataset, we have provided an impor-tant template on which to discover critical biomarkers anddevelop more effective treatment protocols for colon can-cer at all stages.
Competing interestsThe authors declare that they have no competing interests.
Authors' contributionsCJS and SNT conceived the project. ALS, AJF, ALO, KATS,BWM, LAB, SS, LW, TCS, SNT and CJS were involved inexperimental design. AJF carried out macro-dissection andMMR determination. PMB carried out RNA extraction.JMC carried out the miRNA profiling. VT carried out qRT-PCR. ALS, ALO, KATS, BWM, SMR conducted analyses ofexpression data. ALS drafted the manuscript and carriedout cross data set comparisons. AJF, PMB, SS, CR, SNT andCJS contributed to the manuscript. All authors read andapproved the final manuscript.
Additional material
Additional file 1qRT-PCR primer sequences. Sequences used for qRT-PCR of miRNA lev-els.Click here for file[http://www.biomedcentral.com/content/supplementary/1471-2407-9-401-S1.XLS]
Page 13 of 15(page number not for citation purposes)
BMC Cancer 2009, 9:401 http://www.biomedcentral.com/1471-2407/9/401
Page 14 of 15
AcknowledgementsWe thank the Minnesota Supercomputing Institute for providing access to computational resources.
Funding Supported in part by grant PTDC/SAU-GMG/099161/2008 from Fundação para a Ciência e a Tecnologia (FCT), Lisbon, Portugal (to C.M.P.R.), and by Ph.D. fellowship SFRH/BD/24165/2005 (to P.M.B.).
This work was supported by a grant from the Minnesota Partnership for Biotechnology and Medical Genomics [Medica Foundation 2006-100412].
References1. Ferlay J, Autier P, Boniol M, Heanue M, Colombet M, Boyle P: Esti-
mates of the cancer incidence and mortality in Europe in2006. Ann Oncol 2007, 18:581-592.
2. Jemal A, Siegel R, Ward E, Hao Y, Xu J, Murray T, Thun MJ: Cancerstatistics. CA: Cancer J Clin 2008, 58:71-96.
3. Baudhuin LM, Burgart LJ, Leontovich O, Thibodeau SN: Use of mic-rosatellite instability and immunohistochemistry testing forthe identification of individuals at risk for Lynch Syndrome.Fam Cancer 2005, 4(3):255-265.
4. Grady WM, Carethers JM: Genomic and epigenetic instability incolorectal cancer pathogenesis. Gastroenterology 2008,135:1079-1099.
5. Lindor NM, Burgart LJ, Leontovich O, Goldberg RM, Cunningham JM,Sargent DJ, Walsh-Vockley C, Petersen GM, Walsh MD, Leggett BA,et al.: Immunohistochemistry versus microsatellite instabilitytesting in phenotyping colorectal tumors. J Clin Onc 2002,20:1043-1048.
6. Zauber AG, Levin TR, Jaffe CC, Galen BA, Ransohoff DF, Brown ML:Implications of new colorectal cancer screening technolo-gies for primary care practice. Med Care 2008, 46:S138-S146.
7. Wolpin BM, Mayer RJ: Systemic treatment of colorectal cancer.Gastroenterology 2008, 134:1296-1310.
8. Kehoe J, Khatri VP: Staging and prognosis of colon cancer. SurgOncol Clin N Am 2006, 15:129-146.
9. Benson AB: New approaches to the adjuvant therapy of coloncancer. Oncologist 2006, 11:973-980.
10. Chan SK, Griffith OL, Tai IT, Jones SJ: Meta-analysis of colorectalcancer gene expression profiling studies identifies consist-ently reported candidate biomarkers. Cancer Epidemiol Biomar-kers Prev 2008, 17:543-552.
11. Bartel DP: MicroRNAs: genomics, biogenesis, mechanism,and function. Cell 2004, 116:281-297.
12. Carthew RW: Gene regulation by microRNAs. Curr Opin GenetDev 2006, 16:203-208.
13. Esquela-Kerscher A, Slack FJ: Oncomirs - microRNAs with a rolein cancer. Nat Rev Cancer 2006, 6:259-269.
14. Volinia S, Calin GA, Liu CG, Ambs S, Cimmino A, Petrocca F, VisoneR, Iorio M, Roldo C, Ferracin M, et al.: A microRNA expressionsignature of human solid tumors defines cancer gene tar-gets. Proc Natl Acad Sci USA 2006, 103:2257-2261.
15. Lu J, Getz G, Miska EA, Alvarez-Saavedra E, Lamb J, Peck D, Sweet-Cordero A, Ebert BL, Mak RH, Ferrando AA, et al.: MicroRNAexpression profiles classify human cancers. Nature 2005,435:834-838.
16. Rosenfeld N, Aharonov R, Meiri E, Rosenwald S, Spector Y, ZepeniukM, Benjamin H, Shabes N, Tabak S, Levy A, et al.: MicroRNAs accu-rately identify cancer tissue origin. Nat Biotechnol 2008,26:462-469.
17. Bandres E, Cubedo E, Agirre X, Malumbres R, Zarate R, Ramirez N,Abajo A, Navarro A, Moreno I, Monzo M, et al.: Identification byreal-time PCR of 13 mature microRNAs differentiallyexpressed in colorectal cancer and non-tumoral tissues. MolCancer 2006, 5:29.
18. Schepeler T, Reinert JT, Ostenfeld MS, Christensen LL, SilahtarogluAN, Dyrskjot L, Wiuf C, Sorensen FJ, Kruhoffer M, Laurberg S, et al.:Diagnostic and prognostic microRNAs in stage II colon can-cer. Cancer Res 2008, 68:6416-6424.
19. Schetter AJ, Leung SY, Sohn JJ, Zanetti KA, Bowman ED, Yanaihara N,Yuen ST, Chan TL, Kwong DL, et al.: MicroRNA expression pro-files associated with prognosis and therapeutic outcome incolon adenocarcinoma. JAMA 2008, 299:425-436.
20. Slaby O, Svoboda M, Fabian P, Serdova T, Knoflickova D, BednarikovaM, Nenutil R, Vyzula R: Altered expression of miR-21, miR-31,
Additional file 2Tissue clinical data. Additional clinical data shown in Table 1 broken down by tumor id.Click here for file[http://www.biomedcentral.com/content/supplementary/1471-2407-9-401-S2.XLS]
Additional file 3miRNA profiles in Colon Cancer and normal tissues. All data, both raw and normalized. A)Raw Log base 2 transformed miRNA data B)Quantile normalized log base 2 miRNA data C) Averaged log base 2 quantile nor-malized miRNA data D) Averaged, quantile normalized miRNA data E)quantile normalized averaged data normalized by average of normal colon tissue.Click here for file[http://www.biomedcentral.com/content/supplementary/1471-2407-9-401-S3.XLS]
Additional file 4SVM confusion matrices. Confusion matrices for A) normal vs tumor comparison using all miRNA B) dMMR vs pMMR tumor comparison.Click here for file[http://www.biomedcentral.com/content/supplementary/1471-2407-9-401-S4.XLS]
Additional file 5Complete statistical data. A linear mixed effects model was used to deter-mine statistically significant miRNAs for A) normal tissue compared with colon cancer tissue and B) dMMR tumor tissue compared with pMMR tumor tissue.Click here for file[http://www.biomedcentral.com/content/supplementary/1471-2407-9-401-S5.XLS]
Additional file 6Illumina platform analyses. Illumina platform performance analysis for previously reported miRNAs altered in CC. Heat map describing fold change from normal tissue for known high concentration miRNAs (let-7a), a negative control element (neg.con.), miRNAs reported involved in colon tumorigenesis (miR-21 and miR-143) and miRNAs we observed to be altered in tumor specimens (miR-31, miR-135b, miR-30a-3p). The log base 2 raw fluorescent intensity is shown for each miRNA. The highest value found on the array was less than 16 on the log base 2 scale.Click here for file[http://www.biomedcentral.com/content/supplementary/1471-2407-9-401-S6.PNG]
Additional file 7Probes with high average expression and low variance. Probes with high average expression and low variance.Click here for file[http://www.biomedcentral.com/content/supplementary/1471-2407-9-401-S7.XLS]
Additional file 8Unsupervised hierarchical clustering of cell line miRNA profiles obtained from Illumina platform and cDNA arrays. Following removal of high expressing low variability Illumina probes and low expressing cDNA probes the remaining miRNA cluster together by cell line of sample origin.Click here for file[http://www.biomedcentral.com/content/supplementary/1471-2407-9-401-S8.PNG]
(page number not for citation purposes)
BMC Cancer 2009, 9:401 http://www.biomedcentral.com/1471-2407/9/401
Publish with BioMed Central and every scientist can read your work free of charge
"BioMed Central will be the most significant development for disseminating the results of biomedical research in our lifetime."
Sir Paul Nurse, Cancer Research UK
Your research papers will be:
available free of charge to the entire biomedical community
peer reviewed and published immediately upon acceptance
cited in PubMed and archived on PubMed Central
yours — you keep the copyright
Submit your manuscript here:http://www.biomedcentral.com/info/publishing_adv.asp
BioMedcentral
miR-143 and miR-145 is related to clinicopathologic featuresof colorectal cancer. Oncology 2007, 72:397-402.
21. Chen J, Lozach J, Garcia EW, Barnes B, Luo S, Mikoulitch I, Zhou L,Schroth G, Fan JB: Highly sensitive and specific microRNAexpression profiling using BeadArray technology. Nucleic AcidsRes 2008, 36:e87.
22. Boland CR, Thibodeau SN, Hamilton SR, Sidransky D, Eshleman JR,Burt RW, Meltzer SJ, Rodriguez-Bigas MA, Fodde R, Ranzani GN, etal.: A National Cancer Institute Workshop on MicrosatelliteInstability for cancer detection and familial predisposition:development of international criteria for the determinationof microsatellite instability in colorectal cancer. Cancer Res1998, 58:5248-5257.
23. Thibodeau SN, French AJ, Cunningham JM, Tester D, Burgart LJ,Roche PC, McDonnell SK, Schaid DJ, Vockley CW, Michels VV, et al.:Microsatellite instability in colorectal cancer: different muta-tor phenotypes and the principal involvement of hMLH1.Cancer Res 1998, 58:1713-1718.
24. Schmittgen TD, Livak KJ: Analyzing real-time PCR data by thecomparative C(T) method. Nat Protoc 2008, 3:1101-1108.
25. Bolstad BM, Irizarry RA, Astrand M, Speed TP: A comparison ofnormalization methods for high density oligonucleotidearray data based on variance and bias. Bioinformatics 2003,19:185-193.
26. Gautier L, Cope L, Bolstad BM, Irizarry RA: affy--analysis ofAffymetrix GeneChip data at the probe level. Bioinformatics2004, 20:307-315.
27. R Development Core Team R: A language and environment forstatistical computing. R Foundation for Statistical Computing,Vienna, Austria; 2008.
28. Pinheiro JC, Douglas MB: Mixed-effects models in S and S-PLUS. Springer-Verlag New York, LLC; 2002.
29. Irizarry RA, Ladd-Acosta C, Wen B, Wu Z, Montano C, Onyango P,Cui H, Gabo K, Rongione M, Webster M, et al.: The human coloncancer methylome shows similar hypo- and hypermethyla-tion at conserved tissue-specific CpG island shores. NatureGenetics 2009, 41:178-186.
30. Starr TK, Allaei R, Silverstein KA, Staggs RA, Sarver AL, BergemannTL, Gupta M, O'Sullivan MG, Matise I, Dupuy AJ, et al.: A transpo-son-based genetic screen in mice identifies genes altered incolorectal cancer. Science 2009, 323:1747-1750.
31. Laurent LC, Chen J, Ulitsky I, Mueller FJ, Lu C, Shamir R, Fan JB, Lor-ing JF: Comprehensive microRNA profiling reveals a uniquehuman embryonic stem cell signature dominated by a singleseed sequence. Stem Cells 2008, 26:1506-1516.
32. Papadopoulos GL, Alexiou P, Maragkakis M, Reczko M, HatzigeorgiouAG: DIANA-mirPath: Integrating human and mouse micro-RNAs in pathways. Bioinformatics 2009, 25:1991-1993.
33. Cunningham JM, Oberg AL, Borralho PM, Kren BT, French AJ, WangL, Bots BM, Morlan BW, Silverstein KAT, Staggs R, et al.: Evaluationof a new high-dimensional miRNA profiling platform. BMCMed Genomics 2009, 2:57.
34. Cunningham JM, Kim CY, Christensen ER, Tester DJ, Parc Y, BurgartLJ, Halling KC, McDonnell SK, Schaid DJ, Vockley CW, et al.: The fre-quency of hereditary defective mismatch repair in a prospec-tive series of unselected colorectal carcinomas. Am J HumanGenet 2001, 69:780-790.
35. Cunningham JM, Kim CY, Christensen ER, Tester DJ, Parc Y, BurgartLJ, Halling KC, McDonnell SK, Schaid DJ, Walsh Vockley C, et al.:Hypermethylation of the hMLH1 promoter in colon cancerwith microsatellite instability. Cancer Res 1998, 58:3455-3460.
36. Weisenberger DJ, Siegmund KD, Campan M, Young J, Long TI, FaasseMA, Kang GH, Widschwendter M, Weener D, Buchanan D, et al.:CpG island methylator phenotype underlies sporadic micro-satellite instability and is tightly associated with BRAF muta-tion in colorectal cancer. Nat Genet 2006, 38:787-793.
37. Zhou X, Loukola A, Salovaara R, Nystrom-Lahti M, Peltomaki P, de laChapelle A, Aaltonen LA, Eng C: PTEN mutational spectra,expression levels, and subcellular localization in microsatel-lite stable and unstable colorectal cancers. Am J Pathol 2002,161:439-447.
38. Salovaara R, Roth S, Loukola A, Launonen V, Sistonen P, Avizienyte E,Kristo P, Jarvinen H, Souchelnytskyi S, Sarlomo-Rikala M, et al.: Fre-quent loss of SMAD4/DPC4 protein in colorectal cancers.Gut 2002, 51:56-59.
39. Nicolas M, Wolfer A, Raj K, Kummer JA, Mill P, van Noort M, Hui CC,Clevers H, Dotto GP, Radtke F: Notch1 functions as a tumorsuppressor in mouse skin. Nat Genet 2003, 33:416-421.
40. Nagel R, le Sage C, Diosdado B, Waal M van der, Oude Vrielink JA,Bolijn A, Meijer GA, Agami R: Regulation of the adenomatouspolyposis coli gene by the miR-135 family in colorectal can-cer. Cancer Res 2008, 68:5795-5802.
41. Radtke F, Clevers H: Self-renewal and cancer of the gut: Twosides of a coin. Science 2005, 307:1904-1909.
42. Sweetman D, Goljanek K, Rathjen T, Oustanina S, Braun T, Dalmay T,Munsterberg A: Specific requirements of MRFs for the expres-sion of muscle specific microRNAs, miR-1, miR-206 and miR-133. Dev Biol 2008, 321:491-499.
43. Lim LP, Lau NC, Garret-Engele P, Grimson A, Schelter JM, Castle J,Bartel DP, Linsley PS, Johnson JM: Microarray analysis shows thatsome microRNAs down-regulate large numbers of targetmRNAs. Nature 2005, 433:769-773.
44. Sääf AM, Halbleib JM, Chen X, Yuen ST, Leung SY, Nelson WJ, BrownPO: Parallels between global transcriptional programs ofpolarizing Caco-2 intestinal epithelial cells in vitro and geneexpression programs in normal colon and colon cancer. MolBiol Cell 2007, 18:4245-4260.
45. Watanabe Y, Toyota M, Kondo Y, Suzuki H, Imai T, Ohe-Toyota M,Maruyaa R, Nohima M, Sasaki Y, Sekido Y, et al.: PRDM5 identifiedas a target of epigenetic silencing in colorectal and gastriccancer. Clin Cancer Res 2007, 13:4786-4794.
46. Duan Z, Person RE, Lee HH, Huang S, Donadieu J, Badolato R, GrimesHL, Papayannopoullou T, Horwitz MS: Epigenetic regulation ofprotein-coding and microRNA genes by the Gfi1-interactingtumor suppressor PRDM5. Mol Cell Biol 2007, 27:6889-6902.
47. Lehmann U, Hasemeier B, Christgen M, Muller M, Romermann D,Langer F, Kreipe H: Epigenetic inactivation of microRNA genehsa-mir-9-1 in human breast cancer. J Pathol 2008, 214:17-24.
Pre-publication historyThe pre-publication history for this paper can be accessedhere:
http://www.biomedcentral.com/1471-2407/9/401/prepub
Page 15 of 15(page number not for citation purposes)
Copyright © 2022 FDOKUMEN


![[Proliferative lupus nephritis treatment: practice survey in nephrology and internal medicine in France]](https://static.fdokumen.com/doc/165x107/6336db7d20d9c9602f0b0be8/proliferative-lupus-nephritis-treatment-practice-survey-in-nephrology-and-internal.jpg)