MicroRNA Profiles Discriminate among Colon Cancer Metastasis
Human natural Treg microRNA signature: Role ofmicroRNA-31 and microRNA-21 in FOXP3 expression
Redouane Rouas�1, Hussein Fayyad-Kazan�1, Nabil El Zein1,
Philippe Lewalle1, Franc-oise Rothe2, Alexandru Simion3, Haidar Akl1,
Mohamad Mourtada4, Mohamad El Rifai1, Arsene Burny1,
Pedro Romero5, Philippe Martiat��1 and Bassam Badran��1
1 Laboratory of Experimental Hematology, Institut Jules Bordet, Universite Libre de Bruxelles,
Bruxelles, Belgium2 Translational Research Unit, Institut Jules Bordet, Universite Libre de Bruxelles, Bruxelles,
Belgium3 Universite Catholique de Louvain and de Duve Institute, Brussels, Belgium4 Department of Biochemistry, Laboratory of Immunology, Faculty of Sciences, Lebanese
University, Hadath Beirut, Lebanon5 Division of Clinical Onco-Immunology, Ludwig Institute for Cancer Research, Lausanne
Branch, Lausanne, Switzerland
Treg are the main mediators of dominant tolerance. Their mechanisms of action and
applications are subjects of considerable debate currently. However, a human microRNA
(miR) Treg signature has not been described yet. We investigated human natural Treg and
identified a signature composed of five miR (21, 31, 125a, 181c and 374). Among those, two
were considerably under-expressed (miR-31 and miR-125a). We identified a functional
target sequence for miR-31 in the 30 untranslated region (30 UTR) of FOXP3 mRNA. Using
lentiviral transduction of fresh cord blood T cells, we demonstrated that miR-31 and miR-
21 had an effect on FOXP3 expression levels. We showed that miR-31 negatively regulates
FOXP3 expression by binding directly to its potential target site in the 30 UTR of FOXP3
mRNA. We next demonstrated that miR-21 acted as a positive, though indirect, regulator
of FOXP3 expression. Transduction of the remaining three miR had no direct effect on
FOXP3 expression or on the phenotype and will remain the subject of future investiga-
tions. In conclusion, not only have we identified and validated a miR signature for human
natural Treg, but also unveiled some of the mechanisms by which this signature was
related to the control of FOXP3 expression in these cells.
Key words: Human . MicroRNA . Treg
Introduction
It has been established that Treg are the main mediators of dominant
tolerance [1, 2]. Their mechanisms of action as well as their potential
applications are subjects of considerable debate at the moment.
Although a variety of T lymphocytes with suppressive functions have
been described, mainly two subsets of CD41 Treg appear to be better
characterized, i.e. the thymus-derived natural Treg (nTreg) and the
peripherally induced Treg, which derive from naıve T-cell precursors.
nTreg are characterized by the expression of the fork head-winged
helix transcription factor FOXP3 and of the a chain of IL-2 receptor
(CD25). Naturally arising CD41CD251 Treg can inhibit or alter most
�These authors contributed equally to this work.��These authors are joint senior authors.
Correspondence: Dr. Philippe Martiate-mail: [email protected]
& 2009 WILEY-VCH Verlag GmbH & Co. KGaA, Weinheim www.eji-journal.eu
DOI 10.1002/eji.200838509 Eur. J. Immunol. 2009. 39: 1608–1618Rouas Redouane et al.1608
types of immune responses, either innate or acquired [3]. Consider-
ing their immunoregulatory characteristics, Treg represent a very
attractive cell population in the context of immunotherapy of cancers,
immune disorders, infectious diseases and in the field of post-
transplantation immunomodulation. Thus, understanding their
biology as well as developing tools for their accurate identification
and manipulation is central for discovering novel immunotherapeutic
strategies.
FOXP3 has generally been described as a master regulator of
Treg development and function [4–6], both because its expression
in T cells generates an nTreg-like phenotype and function, and
because its absence or inactivating mutations are at the basis of
multiple immune disorders with often fatal consequences [7, 8].
Human FOXP3 has also been involved in nTreg function. The
immune dysregulation polyendocrinopathy and enteropathy
X-linked syndrome, a lethal inherited lymphoproliferative disease
in children has been linked to mutations in the FOXP3 gene.
However, in contrast to the pattern of FOXP3 expression in
experimental mice, human FOXP3 has been shown to be a less
stringent Treg marker. Indeed, FOXP3 is transiently expressed
after T-cell activation [9–12]. Additional phenotypic markers
such as low cell-surface expression of the IL-7Ra chain: CD127
[13] or epigenetic traits [14] may be needed to precisely define
FOXP31 T cells as bona fide nTreg.
Human cord blood contains a distinct population of CD251
Treg [15–17], less heterogeneous than in adult peripheral blood.
Indeed, unless fetal infection, the majority of cord blood CD41
CD251 T cells express FOXP3. Thus, cord blood is a convenient
source for studies aiming at understanding human nTreg
because, in contrast to adult blood, they are less contaminated by
CD251-activated non-Treg T cells. Moreover, while FOXP3
expression is not sufficient to identify Treg in adult human blood,
it remains a marker of choice in umbilical cord blood (UCB)
lymphocytes from healthy newborns and in adult peripheral
blood Treg provided they are distinguished from activated T cells.
MicroRNA (miR) are small single-stranded non-coding RNA
molecules of about 21–23 nucleotides in length, which regulate gene
expression by targeting mRNA for degradation or translational
repression at the post-transcriptional level. Studies in human cells
have only begun to reveal the mechanisms of miR regulation activity,
the normal physiological functions they influence and how their
alteration can lead to pathologies [18]. miR recognize their targets by
base pairing with a short region of about seven nucleotides, either in
the translated region, or in the 30 untranslated region (30 UTR) of
their target mature mRNA. On recognition by RNA Induced Silencing
Complex, target mRNA translation is inhibited or, otherwise, the
target itself is committed to degradation.
An miR signature has been described in mouse Treg, but not yet
in their human counterpart [19]. We therefore investigated the miR
expression profile of human nTreg, purified from cord blood cells, in
comparison with their non-Treg counterpart. We identified a signa-
ture consisting of five miR, the expression of which was statistically
different from the non-Treg CD41 T cells. Among those, miR-31 and
miR-125a were markedly under-expressed. Since the down-regulated
miR can be assumed to result in the up-regulation of the expression of
its target genes, we next screened several genes sequences for
potential target sites for these miR. As far as FOXP3 was concerned,
we were able to identify a potential miR-31 target sequence in the
30 UTR of FOXP3 mRNA, but not for the other four miR of the Treg
signature. Using several types of experiments, including lentiviral
transduction of fresh T cells, we found evidence for a major direct
role of miR-31 in the regulation of FOXP3 expression. We also found
that FOXP3 expression was positively regulated by miR-21. In this
paper, we defined for the first time a human nTreg miR signature and
demonstrated the major direct role played by miR-31 in the regula-
tion of FOXP3 as well as an indirect one for miR-21.
Results
Human nTreg miR signature
Human naturally occurring Treg and CD41CD25� T cells subsets
were isolated using immunomagnetic selection from a series of
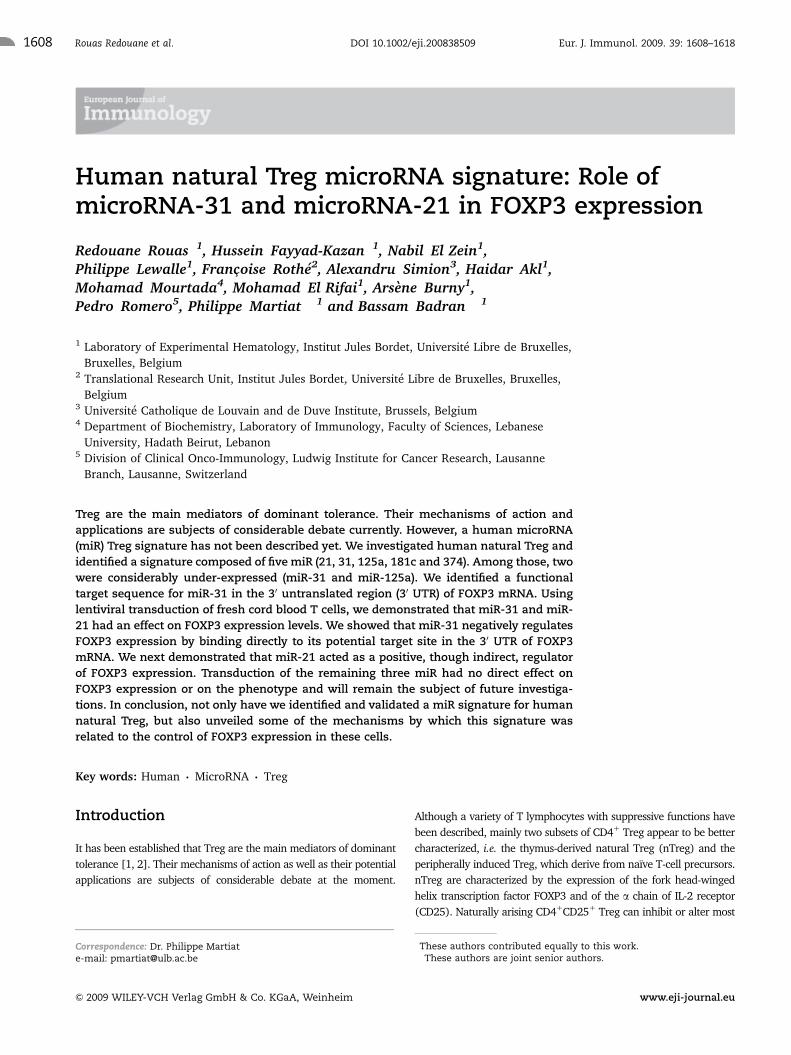
Figure 1. Representative flow cytometry plots of purified human UCBCD41 T cells stained for FOXP3. Intracellular FOXP3 expression wasdetermined by flow cytometry in gated CD41 T cells to exclude celldebris. Histograms illustrate FOXP3 expression (filled histograms) withrespective isotype control (empty histograms) in total CD41 T cells. Thecells were sorted by immunomagnetic cell sorting and FOXP3 expres-sion was analyzed in CD41CD25� and CD41CD251 T-cell fractions.Results are representative of five independent experiments.
Eur. J. Immunol. 2009. 39: 1608–1618 Molecular immunology 1609
& 2009 WILEY-VCH Verlag GmbH & Co. KGaA, Weinheim www.eji-journal.eu
UCB lymphocyte samples. Flow cytometry after intracellular
FOXP3 staining was performed on each sample to confirm protein
expression in the CD41CD251 fraction and its absence in the
CD41CD25� fraction (Fig. 1). RNA was extracted from pairs of
nTreg and their CD41CD25� T-cell counterparts isolated from
five independent UCB samples. Each sample pair was studied
using TaqMan Low Density Array (TLDA). The data sets were
subjected to significant analysis of miR, in which each miR was
assigned a score on the basis of its change in expression relative
to the standard deviation of repeated measurements. We
identified ten miR that were differentially expressed between
nTreg and naıve CD41CD25� T cells (Table 1).
Eight miR were preferentially expressed in nTreg (miR-425-
5p, miR-181c, miR-21, miR-374, miR-586, miR-340, miR-26b
and miR-491) and two were selectively down-regulated in nTreg
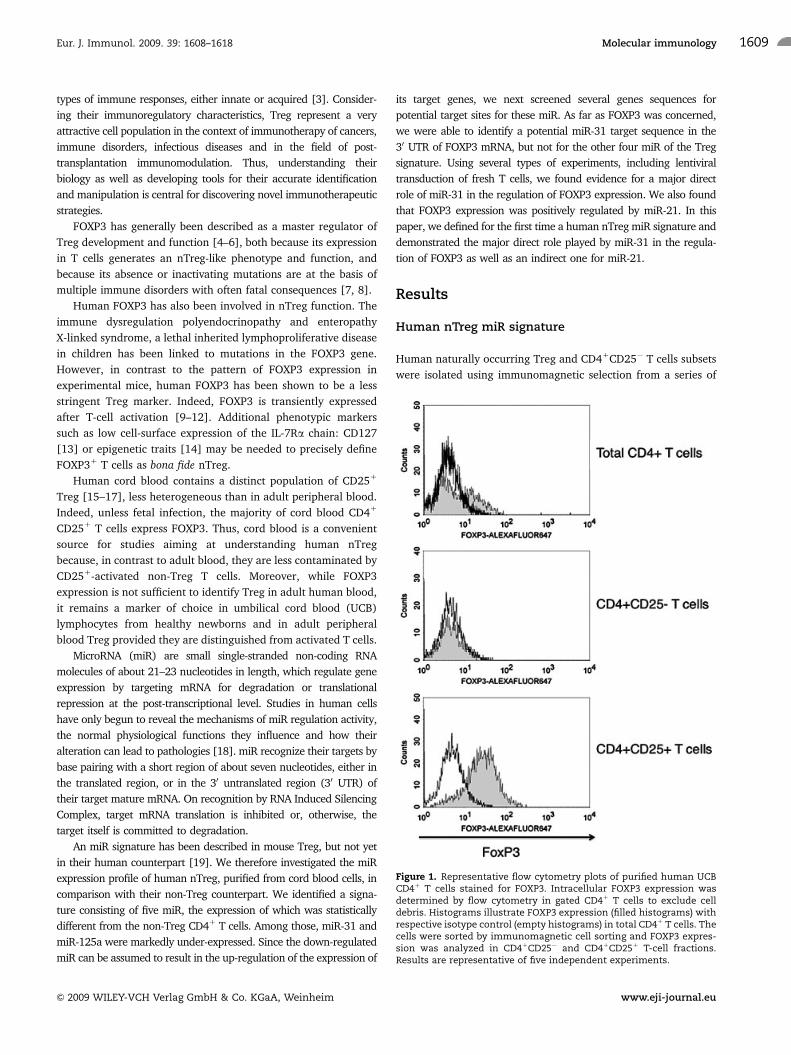
(miR-31 and miR-125a) using the TLDA technique. Differential
miR expression was then validated by real-time PCR (Fig. 2). An
nTreg miR signature was defined consisting of five statistically
differentially expressed miR (21, 31, 125a, 181c and 374). These
miR were detected using the TLDA technique and confirmed by
quantitative PCR. Three of the five miR were over-expressed (21,
181c and 374) and the remaining two were under-expressed (31
and 125a).
Lentiviral transduction of regulatory and non-regulatory UCB T-cells
Lentiviral-based systems have been developed to generate
replication incompetent lentiviral vectors that efficiently trans-
duce both dividing and non-dividing mammalian cells and
provide stable, long-term expression of RNA of interest [20,
21]. To investigate the effect of some miR of this signature
(miR-31, miR-21) on Treg and CD41CD25� T lymphocytes
and more specifically on FOXP3 expression, lentiviral vectors
(lenti-miR-31, lenti-miR-21, lenti-miR-125a) containing copepod
GFP as a reporter gene were produced and transduced into cord
blood Treg and non-Treg after 18 h stimulation period with IL-2
and PHA. To rule out any artifact due to the stimulation, we
verified that the signature, i.e. the ratio for the five miR found in
Treg versus non-Treg did not change upon activation. We found
that activation, prior to transduction, augmented some miR
expression (especially miR-21 and mir-31) in both types of cells,
but by the same factor (approximately threefold) as presented in
Table 2. In addition, the Treg/non-Treg ratio of FOXP3
expression levels remained the same in activated and non-
activated T cells. A scrambled lenti-miR-ctrl was used as a
negative control. After optimization of transduction conditions
Table 1. nTreg miR signature using the TLDA techniquea)
miRNA Treg/CD41CD25� ratio p-Value
miR-491 2.3 0.001
miR-21 2.7 0.01
miR-425-5p 2.1 0.01
miR-31 0.2 0.03
miR-586 4.7 0.02
miR-181c 1.8 0.02
miR-340 2.6 0.03
miR-26b 2.5 0.03
miR-125a 0.6 0.04
miR-374 2.9 0.04
a) The TLDA technique identified ten miR differentially expressedbetween CD41CD251 T cells (nTreg) and the CD41CD25� fraction,with a p-value o0.05. The expression of each of these ten miR wasthen subjected to an individual quantitative PCR assay.
Figure 2. Five miRNA are significantly differentially expressed between CD41CD25� and CD41CD251 T cells from five independent donors. Dataobtained by quantitative RT-PCR amplification of miR are plotted. p-Values for each miRNA are shown. Boxes represent SE. Error bars represent SD;pooled data from five independent experiments. �po0.05, ��po0.01 CD41CD251 versus CD41CD25� T cells (Student’s t-test).
Eur. J. Immunol. 2009. 39: 1608–1618Rouas Redouane et al.1610
& 2009 WILEY-VCH Verlag GmbH & Co. KGaA, Weinheim www.eji-journal.eu
using adult CD41 T cells, we defined an MOI of five as the one
providing the highest transduction rate. This MOI was then
chosen to transduce purified CD41CD25� and CD41CD251 UCB
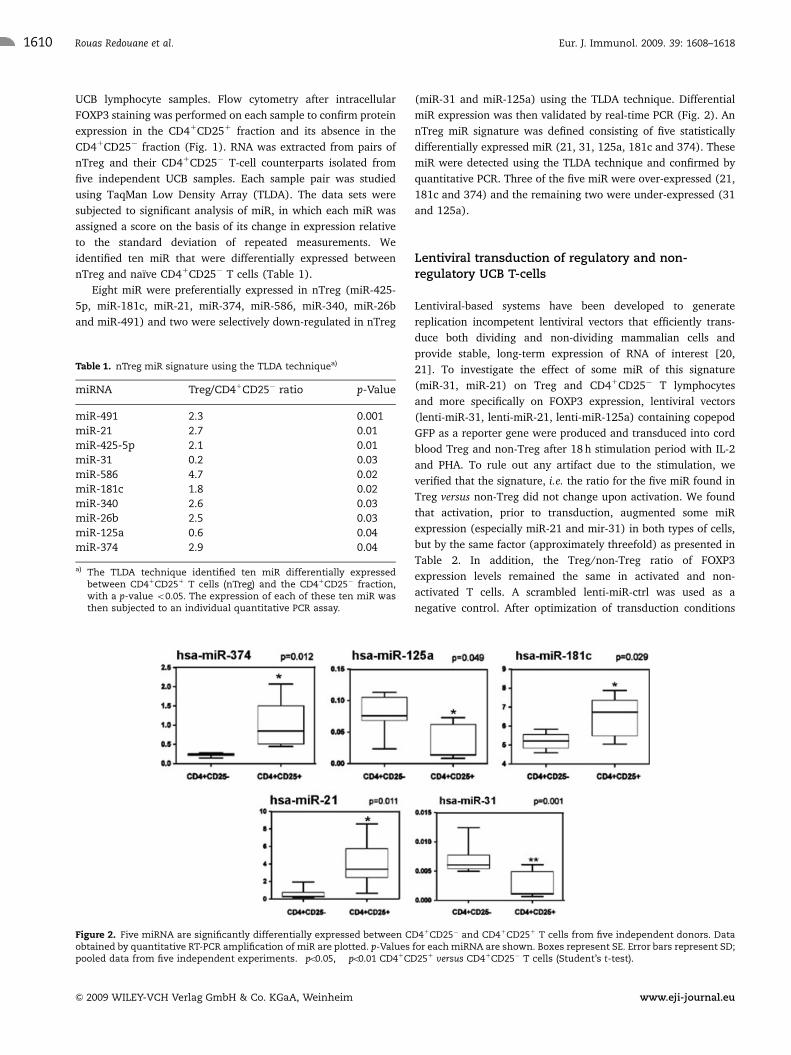
T cells. The efficacy of transduction was measured 1 wk after
transduction. Measurement of GFP expression by flow cytometry
showed a 75–87 and 70–85% transduction efficiency of,
respectively, lenti-mir-31 and lenti-miR-21. Subsequent flow
cytometry sorting of the GFP1 cells resulted in a 99% pure
population (Fig. 3).
Lentiviral expression of miR-21 in non-Treg T cellssignificantly increases the FOXP3 level
After GFP1 cell sorting, FOXP3 mRNA and miR-21 expression
were assessed after transduction by lenti-miR-21 and lenti-miR-
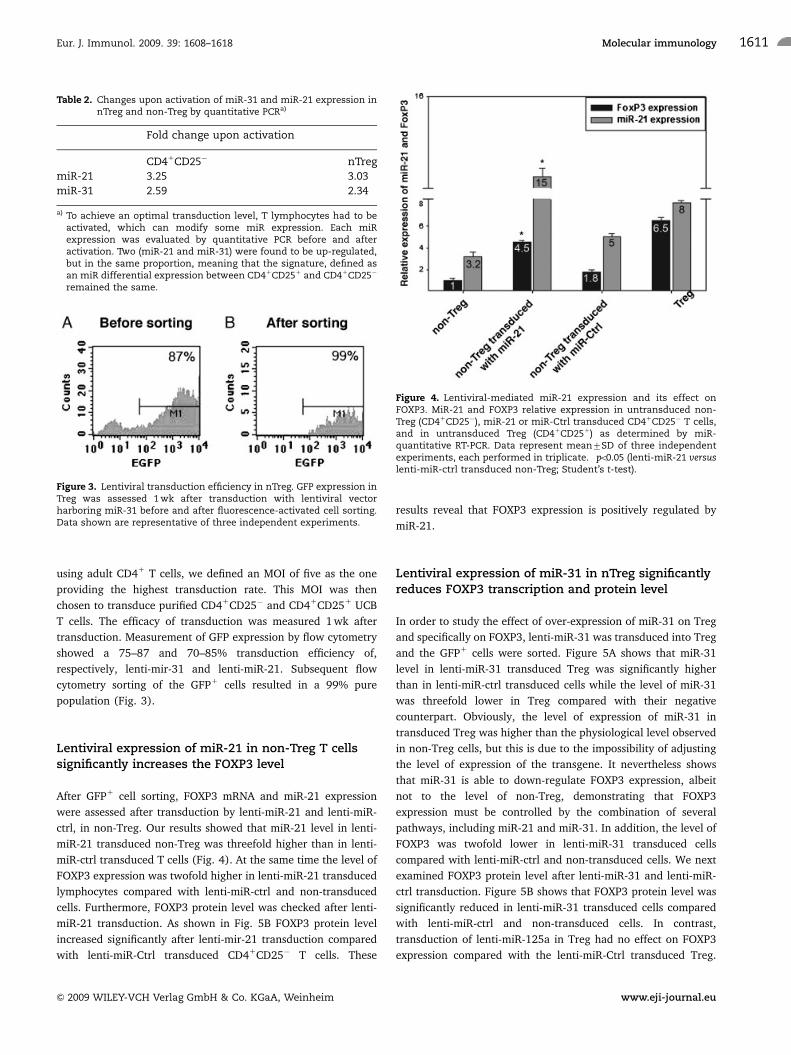
ctrl, in non-Treg. Our results showed that miR-21 level in lenti-
miR-21 transduced non-Treg was threefold higher than in lenti-
miR-ctrl transduced T cells (Fig. 4). At the same time the level of
FOXP3 expression was twofold higher in lenti-miR-21 transduced
lymphocytes compared with lenti-miR-ctrl and non-transduced
cells. Furthermore, FOXP3 protein level was checked after lenti-
miR-21 transduction. As shown in Fig. 5B FOXP3 protein level
increased significantly after lenti-mir-21 transduction compared
with lenti-miR-Ctrl transduced CD41CD25� T cells. These
results reveal that FOXP3 expression is positively regulated by
miR-21.
Lentiviral expression of miR-31 in nTreg significantlyreduces FOXP3 transcription and protein level
In order to study the effect of over-expression of miR-31 on Treg
and specifically on FOXP3, lenti-miR-31 was transduced into Treg
and the GFP1 cells were sorted. Figure 5A shows that miR-31
level in lenti-miR-31 transduced Treg was significantly higher
than in lenti-miR-ctrl transduced cells while the level of miR-31
was threefold lower in Treg compared with their negative
counterpart. Obviously, the level of expression of miR-31 in
transduced Treg was higher than the physiological level observed
in non-Treg cells, but this is due to the impossibility of adjusting
the level of expression of the transgene. It nevertheless shows
that miR-31 is able to down-regulate FOXP3 expression, albeit
not to the level of non-Treg, demonstrating that FOXP3
expression must be controlled by the combination of several
pathways, including miR-21 and miR-31. In addition, the level of
FOXP3 was twofold lower in lenti-miR-31 transduced cells
compared with lenti-miR-ctrl and non-transduced cells. We next
examined FOXP3 protein level after lenti-miR-31 and lenti-miR-
ctrl transduction. Figure 5B shows that FOXP3 protein level was
significantly reduced in lenti-miR-31 transduced cells compared
with lenti-miR-ctrl and non-transduced cells. In contrast,
transduction of lenti-miR-125a in Treg had no effect on FOXP3
expression compared with the lenti-miR-Ctrl transduced Treg.
Table 2. Changes upon activation of miR-31 and miR-21 expression innTreg and non-Treg by quantitative PCRa)
Fold change upon activation
CD41CD25� nTreg
miR-21 3.25 3.03
miR-31 2.59 2.34
a) To achieve an optimal transduction level, T lymphocytes had to beactivated, which can modify some miR expression. Each miRexpression was evaluated by quantitative PCR before and afteractivation. Two (miR-21 and miR-31) were found to be up-regulated,but in the same proportion, meaning that the signature, defined asan miR differential expression between CD41CD251 and CD41CD25�
remained the same.
Figure 3. Lentiviral transduction efficiency in nTreg. GFP expression inTreg was assessed 1 wk after transduction with lentiviral vectorharboring miR-31 before and after fluorescence-activated cell sorting.Data shown are representative of three independent experiments.
Figure 4. Lentiviral-mediated miR-21 expression and its effect onFOXP3. MiR-21 and FOXP3 relative expression in untransduced non-Treg (CD41CD25�), miR-21 or miR-Ctrl transduced CD41CD25� T cells,and in untransduced Treg (CD41CD251) as determined by miR-quantitative RT-PCR. Data represent mean7SD of three independentexperiments, each performed in triplicate. �po0.05 (lenti-miR-21 versuslenti-miR-ctrl transduced non-Treg; Student’s t-test).
Eur. J. Immunol. 2009. 39: 1608–1618 Molecular immunology 1611
& 2009 WILEY-VCH Verlag GmbH & Co. KGaA, Weinheim www.eji-journal.eu
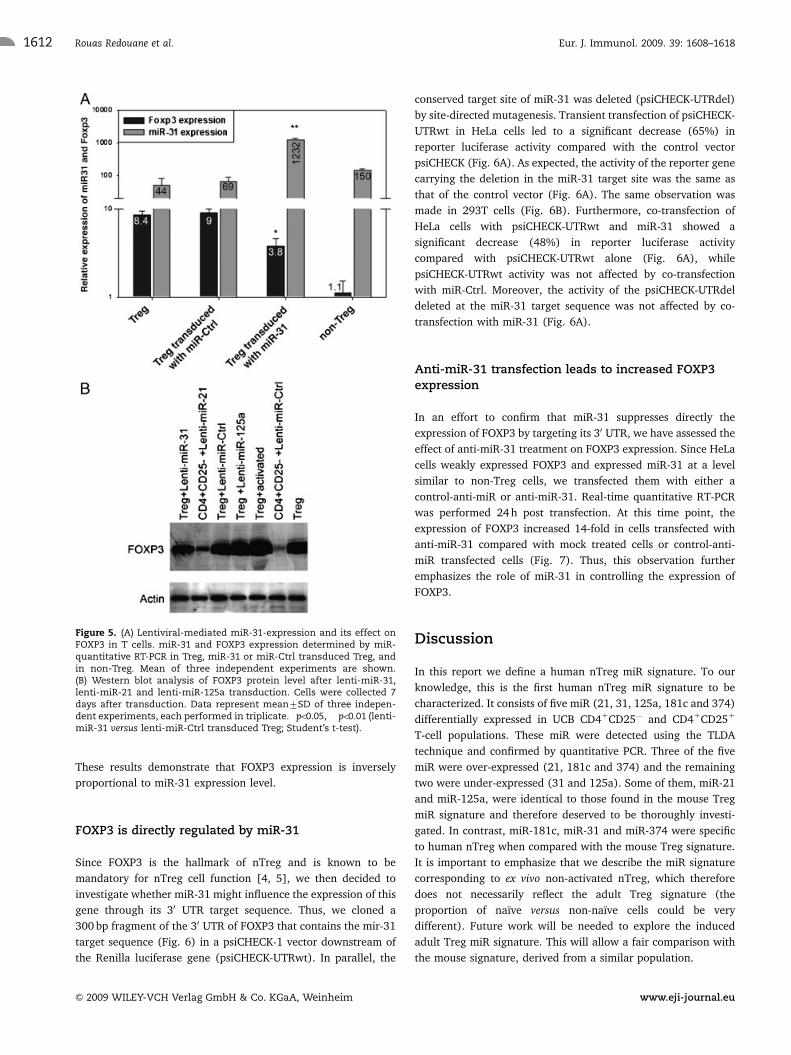
These results demonstrate that FOXP3 expression is inversely
proportional to miR-31 expression level.
FOXP3 is directly regulated by miR-31
Since FOXP3 is the hallmark of nTreg and is known to be
mandatory for nTreg cell function [4, 5], we then decided to
investigate whether miR-31 might influence the expression of this
gene through its 30 UTR target sequence. Thus, we cloned a
300 bp fragment of the 30 UTR of FOXP3 that contains the mir-31
target sequence (Fig. 6) in a psiCHECK-1 vector downstream of
the Renilla luciferase gene (psiCHECK-UTRwt). In parallel, the
conserved target site of miR-31 was deleted (psiCHECK-UTRdel)
by site-directed mutagenesis. Transient transfection of psiCHECK-
UTRwt in HeLa cells led to a significant decrease (65%) in
reporter luciferase activity compared with the control vector
psiCHECK (Fig. 6A). As expected, the activity of the reporter gene
carrying the deletion in the miR-31 target site was the same as
that of the control vector (Fig. 6A). The same observation was
made in 293T cells (Fig. 6B). Furthermore, co-transfection of
HeLa cells with psiCHECK-UTRwt and miR-31 showed a
significant decrease (48%) in reporter luciferase activity
compared with psiCHECK-UTRwt alone (Fig. 6A), while
psiCHECK-UTRwt activity was not affected by co-transfection
with miR-Ctrl. Moreover, the activity of the psiCHECK-UTRdel
deleted at the miR-31 target sequence was not affected by co-
transfection with miR-31 (Fig. 6A).
Anti-miR-31 transfection leads to increased FOXP3expression
In an effort to confirm that miR-31 suppresses directly the
expression of FOXP3 by targeting its 30 UTR, we have assessed the
effect of anti-miR-31 treatment on FOXP3 expression. Since HeLa
cells weakly expressed FOXP3 and expressed miR-31 at a level
similar to non-Treg cells, we transfected them with either a
control-anti-miR or anti-miR-31. Real-time quantitative RT-PCR
was performed 24 h post transfection. At this time point, the
expression of FOXP3 increased 14-fold in cells transfected with
anti-miR-31 compared with mock treated cells or control-anti-
miR transfected cells (Fig. 7). Thus, this observation further
emphasizes the role of miR-31 in controlling the expression of
FOXP3.
Discussion
In this report we define a human nTreg miR signature. To our
knowledge, this is the first human nTreg miR signature to be
characterized. It consists of five miR (21, 31, 125a, 181c and 374)
differentially expressed in UCB CD41CD25� and CD41CD251
T-cell populations. These miR were detected using the TLDA
technique and confirmed by quantitative PCR. Three of the five
miR were over-expressed (21, 181c and 374) and the remaining
two were under-expressed (31 and 125a). Some of them, miR-21
and miR-125a, were identical to those found in the mouse Treg
miR signature and therefore deserved to be thoroughly investi-
gated. In contrast, miR-181c, miR-31 and miR-374 were specific
to human nTreg when compared with the mouse Treg signature.
It is important to emphasize that we describe the miR signature
corresponding to ex vivo non-activated nTreg, which therefore
does not necessarily reflect the adult Treg signature (the
proportion of naıve versus non-naıve cells could be very
different). Future work will be needed to explore the induced
adult Treg miR signature. This will allow a fair comparison with
the mouse signature, derived from a similar population.
Figure 5. (A) Lentiviral-mediated miR-31-expression and its effect onFOXP3 in T cells. miR-31 and FOXP3 expression determined by miR-quantitative RT-PCR in Treg, miR-31 or miR-Ctrl transduced Treg, andin non-Treg. Mean of three independent experiments are shown.(B) Western blot analysis of FOXP3 protein level after lenti-miR-31,lenti-miR-21 and lenti-miR-125a transduction. Cells were collected 7days after transduction. Data represent mean7SD of three indepen-dent experiments, each performed in triplicate. �po0.05, ��po0.01 (lenti-miR-31 versus lenti-miR-Ctrl transduced Treg; Student’s t-test).
Eur. J. Immunol. 2009. 39: 1608–1618Rouas Redouane et al.1612
& 2009 WILEY-VCH Verlag GmbH & Co. KGaA, Weinheim www.eji-journal.eu
Except for over-expression of miR-21, which is not strictly
specific to Treg, although, in any circumstances, its expression
remains higher than in other T cells types, this signature is unique
to natural naıve Treg among all T-cells. The role of these five miR
in human nTreg was largely unexplored. To gain further insight
into the functional role of this signature, we chose to explore the
role of the five miR composing the signature: miR-21, 181c and
374 (over-expressed), and miR-31 and miR-125a, which are
markedly under-expressed in nTreg and therefore should be
mirrored by up-regulated expression of their target genes. The
read-out was FOXP3 expression and protein level. Only two miR
(21 and 31) had an observable effect on these parameters. After
computer screening, we focused our analysis mainly on miR-31
because of its potential binding site in the 30 UTR of FOXP3.
It should also be noted that activation is still required to achieve
a highly efficient lentiviral transduction of T cells and to keep them
alive in culture. Since activation of human T cells transiently induces
FOXP3 up-regulation [9–12], it was necessary to verify the impact of
stimulation on the expression of both the miR signature and FOXP3.
The signature, i.e. the ratios of the five miR between the CD41CD251and CD41CD25� populations, did not change, despite a two- to
threefold increase in miR-21 and miR-31 expression, in both
populations, upon activation. The same was true for the level of
FOXP3 transcripts: although there was a slight increase in both
populations (roughly twofold), the ratio remained the same. This
observation could provide an explanation for the transient increase
in FOXP3 expression in activated T cells, via the activation-induced
up-regulation of miR-21 upon stimulation. A critical question may
arise concerning the impact of miR-31 at physiological levels on
FOXP3 expression in conventional T cells. It is to be noted that we
first tried several ways of transfecting these T cells to get a more
physiological level of miR-31 expression (electroporation, lipofec-
tion, dextran) and none gave us a reasonable percentage of trans-
fected cells (always less than 10% and on average 5%). Only
lentiviral transduction was efficient enough to achieve, on average,
70% transduction efficiency, but the downside of this method is that
it is highly difficult to regulate the expression in order to achieve a
physiological level after transduction. Nevertheless, several authors
(reviewed in [22]) have shown that a 50% reduction of the target
mRNA seemed to be the maximum achievable, even using a
combination of several miR.
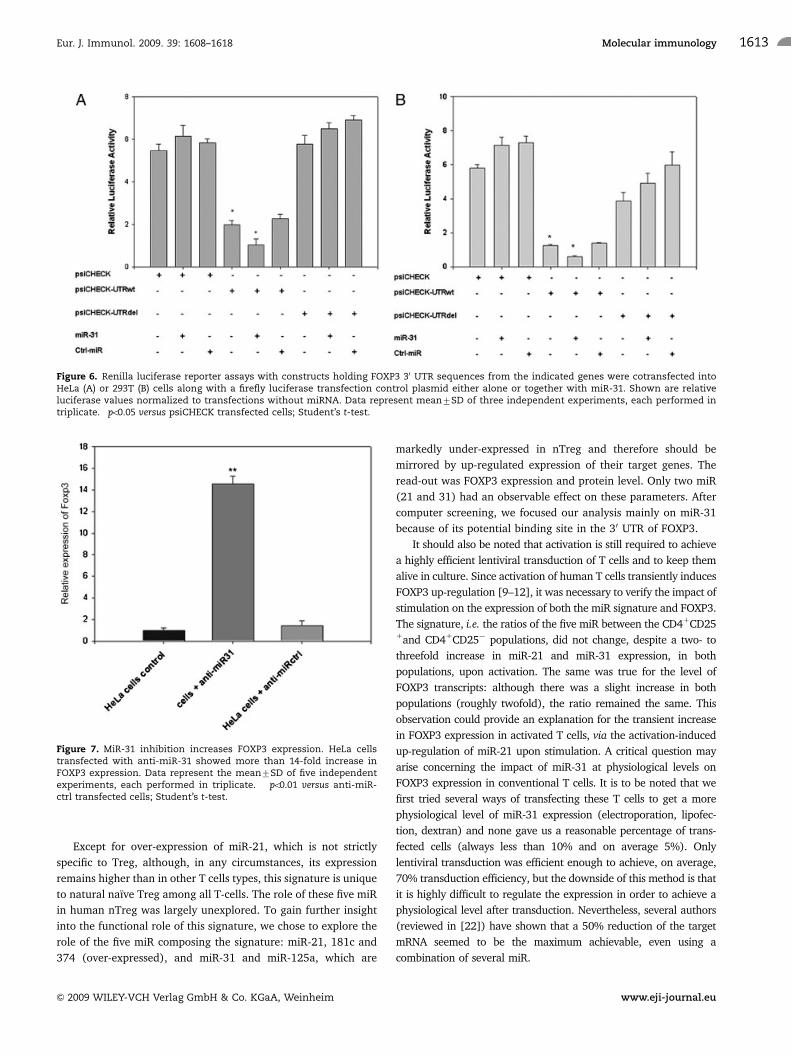
Figure 6. Renilla luciferase reporter assays with constructs holding FOXP3 30 UTR sequences from the indicated genes were cotransfected intoHeLa (A) or 293T (B) cells along with a firefly luciferase transfection control plasmid either alone or together with miR-31. Shown are relativeluciferase values normalized to transfections without miRNA. Data represent mean7SD of three independent experiments, each performed intriplicate. �po0.05 versus psiCHECK transfected cells; Student’s t-test.
Figure 7. MiR-31 inhibition increases FOXP3 expression. HeLa cellstransfected with anti-miR-31 showed more than 14-fold increase inFOXP3 expression. Data represent the mean7SD of five independentexperiments, each performed in triplicate. ��po0.01 versus anti-miR-ctrl transfected cells; Student’s t-test.
Eur. J. Immunol. 2009. 39: 1608–1618 Molecular immunology 1613
& 2009 WILEY-VCH Verlag GmbH & Co. KGaA, Weinheim www.eji-journal.eu
First, our results demonstrate that miR-31 is a negative
regulator of FOXP3 expression in fresh nTreg. Moreover, its
impact is directly linked to the target site found in the 30 UTR of
the FOXP3 gene, as evidenced by our transfection experiments.
Next, we found miR-21 to positively regulate FOXP3 expression.
Since it is over-expressed in the Treg population and since
no potential target sequence in FOXP3 mRNA could be
identified, the mechanism of FOXP3 up-regulation may be
indirect. The study of the role of miR-125a remains crucial, both
because it is under-expressed in Treg, suggesting that it should
lead to up-regulated expression of other proteins central to Treg
function, and because it is one of the two miR of the signature
conserved across species. This will be the subject of future work,
especially since the five miR from the signature have target sites
in several genes that could be critical for immunoregulatory
functions.
Future work should also address some mechanistic questions such
as the precise role of miR-31 in Treg: is it a major player (apart from
miR-21) in the regulation of FOXP3 expression or does it synergize
with other levels of transcriptional control, genetic or epigenetic?
What mechanisms are responsible for the specific regulation of the
five miR found in the signature? How does miR-21 indirectly regulate
FOXP3 expression? And finally what is the role of the other three miR
found in the signature with regard to the regulatory function of these
cells? Computer analysis showed that the 30 UTR of the following
genes had at least one potential miR target site: FOXP3 (miR-31),
CTLA-4 (miR-181c), IL-10 (miR-374), IL-2 (miR-181c), CD28 (miR-
31), IFN-g (miR-125a and miR-181c), CD25 (miR-21), TGF-b (miR-
425-5p), histone deacetylase (HDAC) 1 (miR-31 and miR-125a),
HDAC2 (miR-21 and miR-31) and HDAC9 (miR-21, miR-31, and
miR-181c) and others containing some of these miR differentially
expressed in Treg. These possibilities will need to be addressed in
future works, using micro-array analyses of transduced T cells.
Indeed, a genomic analysis of FOXP3-transduced cells suggested that
some elements of the Treg gene expression profile might be inde-
pendent of this transcription factor [23, 24]. The transduction of
naıve CD41CD25� T lymphocytes with a FOXP3-encoding retroviral
vector resulted in significant FOXP3 expression. However, this was
not sufficient to induce neither suppressive phenotype nor up-regu-
lation of Treg surface markers [25]. Moreover, Cobb et al. [19]
showed, in mice, that ectopic FOXP3 expression, after CD41 T-cell
transduction, could lead to the expression of some of the murine Treg
miR signatures. Those last observations demonstrate that FOXP3 is
not sufficient for inducing Treg function even though it participates,
directly or indirectly, in mice Treg miR expression profile.
nTreg represent a good model to understand immune toler-
ance to self and non-self antigens. In this regard our data may
contribute to advance the understanding of the underlying
mechanisms modulating Treg function.
In summary, we have not only found and validated a miR
signature for human nTreg but also unveiled some of the
mechanisms by which this signature may be involved in the
control of the FOXP3 levels in nTreg. This opens several possi-
bilities for the future, i.e. to qualitatively investigate induced Treg
in several circumstances, healthy volunteers and patients suffer-
ing from cancer and immune disorders. These experiments,
coupled with quantitative measurements in these different
situations, could provide new insights into the defective immune
response in malignancies, immune disorders, infections and
transplantation.
Material and methods
Collection and preparation of UCB samples
After informed consent, umbilical cord blood mononuclear cells
(UCBMC) were derived from the umbilical vein after normal full-
term deliveries. UCBMC were isolated by centrifugation over a
Ficoll-Hypaque gradient (PAA laboratories).
Isolation of T-cell populations
Cord blood CD41 lymphocytes were purified using CD41 T-cells
isolation kit (Miltenyi Biotec, Bergisch Gladbach, Germany)
according to the manufacturer protocol. Briefly, UCBMC were
first incubated in PBS supplemented with 2% decomplemented
fetal bovine serum and saturating amounts of biotin-conjugated
antibody cocktail (CD8, CD14, CD16, CD19, CD36, CD56,
CD123, TCR-g/d and Glycophorin A). Cells were then incubated
with antibiotin micro-beads and CD41 cells were purified using
magnetic separation columns (Miltenyi Biotec). The negatively
selected cells were incubated with anti-CD25 micro-beads, then
CD251 and CD25� cells were purified from CD41 T-cell fraction
using magnetic columns (Miltenyi Biotec).
FOXP3 intracellular staining
FOXP3 intracellular staining was performed using Alexa Fluors
647 anti-human FOXP3 Flow Kit (BioLegend, San Diego, CA,
USA) following the manufacturer’s instructions. Flow cytometry
analysis was performed on a FACSCalibur machine with Cell
Quest software (Becton-Dickinson Biosciences).
Cell culture
The HeLa cell line was cultured in DMEM (Lonza, Verviers,
Belgium) supplemented with 10% heat inactivated fetal bovine
serum (Invitrogen Europe, Paisley, UK), 2 mM L-glutamine,
50 IU/mL Penicillin and 50 mg/mL Streptomycin (all from Lonza).
RNA extraction, RT and real-time PCR quantification
Total RNA was extracted from cells using Trizols total RNA
isolation reagent (Roche Diagnostics, Belgium). The concentra-
Eur. J. Immunol. 2009. 39: 1608–1618Rouas Redouane et al.1614
& 2009 WILEY-VCH Verlag GmbH & Co. KGaA, Weinheim www.eji-journal.eu
tion was quantified using a NanoDrop Spectrophotometer.
TaqMan miR assays (Applied Biosystems) were used to quantify
mature miR expression. RNU44 (Applied Biosystems) was used as
endogenous control for miR expression studies.
Thus, gene-specific RT was performed for each miR using
10 ng of purified total RNA, 100 mM dNTP, 50 U MutliScribe
reverse transcriptase, 20 U RNase inhibitor, and 50 nM of gene-
specific RT primer samples using the TaqMan MicroRNA Reverse
Transcription kit (Applied Biosystems). Fifteen microliter reac-
tions were incubated for 30 min at 161C, 30 min at 421C, and
5 min at 851C to inactivate the reverse transcriptase. Real-time
RT-PCR (5 mL of RT product, 10 mL TaqMan 2�Universal PCR
master Mix, (Applied Biosystems) and 1 mL TaqMan MicroRNA
Assay Mix containing PCR primers and TaqMan probes) were run
in triplicates at 951C for 10 min followed by 40 cycles at 951C for
15 s and 601C for 1 min.
Quantitative miR expression data were acquired and analyzed
using an ABI Prism 7900HT Sequence Detection System (Applied
Biosystems).
TLDA and individual quantitative PCR validation
The TLDA (Applied Biosystems) technique allowed us to measure
the expression of 384 miR, in order to compare the miR
expression profile of purified nTreg with their CD25� counterpart
T cells originating from five different cord bloods. TLDA loaded
with TaqMans Gene Expression Assays (Applied Biosystems)
were used for quantitative RT-PCR analysis of selected genes.
cDNA was synthesized from 100 ng of total cellular RNA by First
Strand cDNA Synthesis System using 100 mM dNTP, 50 U
MutliScribe reverse transcriptase, 20 U RNase inhibitor, 10�RT buffer, and Multiplex RT human primer. Ten microliter
reactions were incubated for 30 min at 161C, 30 min at 421C,
5 min at 851C to inactivate the reverse transcriptase.
Five microliter cDNA were mixed with 307mL nuclease free
water and 50 mL of this diluted cDNA were mixed with 50 mL of
TaqMan Universal PCR Master Mix (Applied Biosystems). After
that, 100 mL of the sample-specific PCR mixture was loaded into
one sample port, the cards were centrifuged twice for 1 min at
280g and sealed to prevent well-to-well contamination. The cards
were placed in the Micro Fluidic Card Sample Block of
an ABI Prism 7900 HT Sequence Detection System (Applied
Biosystems). The thermal cycling conditions were 2 min at 501C
and 10 min at 951C, followed by 40 cycles of 15 s at 951C and
1 min at 601C.
In each sample, average cycle threshold (Ct) values for the
target genes were subtracted from the average Ct value of the
reference gene to yield the DCt value. 2-DCt values were calcu-
lated to indicate the relative amount of transcripts in each
sample.
For each miR that was found differentially expressed,
a validation by individual quantitative PCR was performed,
and we retained only the miR concordant with the two
techniques.
MiR-31 target prediction
Computer-based programs were used to predict potential miR-31
targets. Using ‘‘hsa-miR-31’’ as a search term, we searched
miRBase [26] (http://microrna.sanger.ac.uk/), and TargetScan
4.2 [27] (http://www.targetscan.org/).
FOXP3 was identified by both programs as a putative miR-31
target gene. Mir-31 potential target sequence in FOXP3 30 UTR is
presented in Table 3.
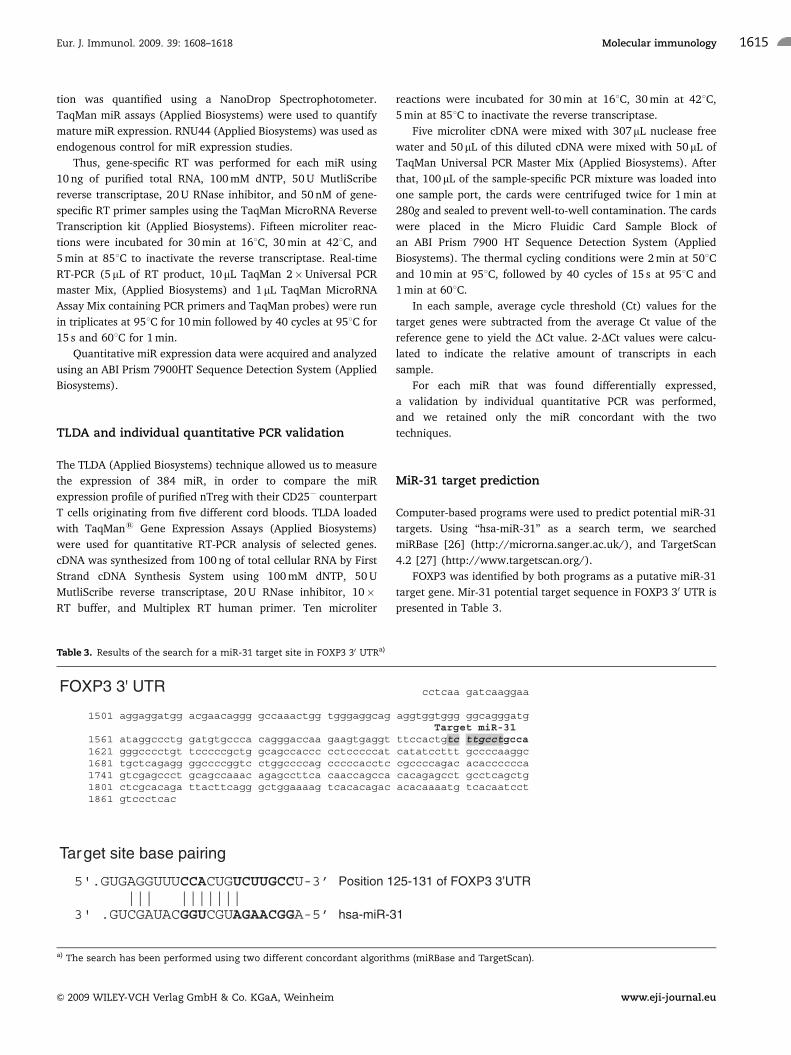
Table 3. Results of the search for a miR-31 target site in FOXP3 30 UTRa)
FOXP3 3' UTR cctcaa gatcaaggaa
1501 aggaggatgg acgaacaggg gccaaactgg tgggaggcag aggtggtggg ggcagggatgTarget miR-31
1561 ataggccctg gatgtgccca cagggaccaa gaagtgaggt ttccactgtc ttgcctgcca 1621 gggcccctgt tcccccgctg gcagccaccc cctcccccat catatccttt gccccaaggc 1681 tgctcagagg ggccccggtc ctggccccag cccccacctc cgccccagac acacccccca 1741 gtcgagccct gcagccaaac agagccttca caaccagcca cacagagcct gcctcagctg 1801 ctcgcacaga ttacttcagg gctggaaaag tcacacagac acacaaaatg tcacaatcct 1861 gtccctcac
Target site base pairing
5'.GUGAGGUUUCCACUGUCUUGCCU-3’ Position 125-131 of FOXP3 3’UTR ||| |||||||
3' .GUCGAUACGGUCGUAGAACGGA-5’ hsa-miR-31
a) The search has been performed using two different concordant algorithms (miRBase and TargetScan).
Eur. J. Immunol. 2009. 39: 1608–1618 Molecular immunology 1615
& 2009 WILEY-VCH Verlag GmbH & Co. KGaA, Weinheim www.eji-journal.eu
Plasmids construction
A 300 bp fragment encompassing the entire FOXP3 30 UTR was
cloned downstream of the Renilla luciferase gene (EcoRI/XhoI
sites) in the psiCheck-1 plasmid (Promega) and designated as
psiCHECK 30 UTR WT. PCR primers used for amplification of the
FOXP3 30 UTR were:
Forward primer: 50-GCGCCTCGAGGACCTCAAGATCAAGG-
AAAGGA-30
Reverse primer: 50-GCGCGAATTCTGAGGGACAGGATTGTG-
ACAT-30
QuikChange site-directed mutagenesis (deletion) of miR-31
target site in psiCHECK 30 UTR WT was performed according to
the manufacturer’s protocols (Stratagene) and designated as
psiCHECK-UTRdel. QuikChange site-directed mutagenesis was
performed using the following primers:
Forward primer: 50-GGTTTCCACTGGCCAGGGCCCC-30
Reverse primer: 50-GGGGCCCTGGCCAGTGGAAACG-30
The constructs were verified by sequencing.
Luciferase assays
Assays were conducted in a 24-well format. Reporter plasmids
(psiCHECK/psiCHECK 30 UTR WT/psiCHECK 30 UTR deleted)
(100 ng) were co-transfected into HeLa cells along with miR-31-
mimic/miR-negative control-mimic at final concentration of
10 mM (miRIDIAN mimic, Dharmacon) and control firefly
plasmid pGL3-CMV (100 ng) using Lipofectamine 2000
(Invitrogen) according to the manufacturer’s guidelines.
Twenty-four hours post transfection, cells were harvested
and luciferase levels were measured using the Dual luciferase
reporter assay system (Promega) according to the manufacturer’s
guidelines. Relative protein levels were expressed as Renilla/
firefly luciferase ratios.
Quantitative PCR for FOXP3 expression
Total RNA was extracted with Trizol reagent according
to the manufacturer’s guidelines (Invitrogen) and first-strand
cDNA were synthesized by RT (Superscript First-strand Synthesis
System for RT-PCR kit; Invitrogen). Quantitative mRNA
expression was measured by real-time PCR, with PRISM
7900 sequence detection system (PE Applied Biosystems), and
the TaqMan Master mix kit with EF1-a mRNA was used
as an internal control, as well as the GUS gene. The primers
and the internal fluorescence TaqMan probes were designed as
follows:
FOXP3 (forward) 50-TTTCACCTACGCCACGCTCA-30
(reverse) 50-CCAGCTCATCCACGGTCCA-30,
and probe 50-FAM-CCACCTGGAAGAACGCCATCCGC-TAMRA-30;
and EF1-a (forward) 50-CTGAACCATCCAGGCCAAAT-30
(reverse) 50-GCCGTGTGGCAATCCAAT-30,
and probe 50-FAM-AGCGCCGGCTATGCCCCTG-TAMRA-30.
The program used for amplification was: 10 min at 951C
followed by 40 cycles of 15 s at 951C, 1 min at 601C.
Lentiviral vector production
Vesicular stomatitis virus glycoprotein G (VSV-G) pseudo-typed
lentiviral particles were generated by polyethylene imine (Sigma,
St. Louis, MO) co-transfection of 293 T cells with three plasmids,
pMIRNA, pCMVDR8.91 and pMD.G [28].
pCMVDR8.91 is HIV-derived packaging construct that encodes the
HIV-1 Gag and Pol precursors as well as the regulatory proteins Tat
and Rev [29]. Vesicular stomatitis virus glycoprotein G (VSV-G) was
expressed from pMD.G [22]. pMIRNA provided from System Bios-
ciences is a lentiviral-based vector in which an miR precursor mole-
cule has been cloned downstream of the CMV promoter and contains
copepod GFP as a reporter gene; 24h after transient transfection of
293 T cells, viral supernatants were collected, filtered through
0.45mm low protein-binding filters (Nalgene, Rochester, NY), and
concentrated as previously described [30]. The viral pellets were then
resuspended in 1/100 vol of PBS. Viral stocks were stored in aliquots
at �801C and the titers were determined by transducing HeLa T cells
in a limiting dilution assay. Lentiviral vector preparations collected
24h post transfection displayed titers of 108–109 transducing units/
mL in HeLa T cells. No replication-competent virus was detected in
the concentrated lentiviral stocks. A second production cycle was
repeated after 24h, routinely generating lentiviral vector prepara-
tions of approximately 5�107 to 5�108 transducing units/mL.
Lentiviral transduction
Treg and non-Treg purified from cord blood were plated at a
density of 105 cells/well in 12-well tissue culture plates in 1 mL
of RPMI 1640 supplemented with 10% AB serum, 2 mM
L-glutamine, 100 U/mL penicillin, 100 mg/mL streptomycin
(Lonza Europe, Verviers, Belgium), in the presence of 5mg/mL
PHA-L (Sigma-Aldrich) and 20 U/mL IL-2.
Twenty-four hours after Treg and non-Treg isolation, cells were
exposed to lentiviral vector preparations with MOI 5, in a volume
of 500mL in the presence of 8mg/mL polybrene (Sigma). GFP1
cells were sorted by flow cytometry at day 7 after transduction.
Western blot analysis
A total of 4�106 cells were lysed and subjected to SDS-PAGE using
10% polyacrylamide gels and transferred to polyvinylidene fluoride
membranes (Amersham Biosciences, Uppsala, Sweden) using a
semidry electroblot chamber. Membranes were blocked with TBST
containing 5% BSA overnight at 41C. After blocking, the blots were
incubated with a 1/200 dilution of goat anti-FOXP3 diluted in TBST
for 1h at 251C. Following 1h of incubation with anti-goat peroxidase-
conjugated antibody (Sigma Chemical) at room temperature,
proteins were detected by the electogenerated chemiluminescence
Eur. J. Immunol. 2009. 39: 1608–1618Rouas Redouane et al.1616
& 2009 WILEY-VCH Verlag GmbH & Co. KGaA, Weinheim www.eji-journal.eu
method (Amersham Biosciences), according to the manufacturer’s
instructions.
To confirm sample loading and transfer, membranes were
incubated in stripping buffer and reblocked for 1 h, and then
reprobed using anti-actin (C-2; Santa Cruz Biotechnology).
Detection of mature miR-31 by TaqMan real-time PCR
TaqMan miRNA assays (ABI, Forest City, CA) used the stem loop
method [19, 20] to detect the expression level of mature
miR-31. For RT reactions, 10 ng total RNA was used in each
reaction (15mL) and mixed with the RT primer (3mL). The
RT reaction was carried out at the following conditions:
161C for 30 min; 421C for 30 min; 851C for 5 min, and then held
on 41C. After the RT reaction, the cDNA products were diluted at
5� and 9mL of the diluted cDNA was used for PCR along with
TaqMan microarray assay (1mL) and PCR master mix (10mL). The
PCR was conducted at 951C for 10 min, followed by 40 cycles of
951C for 15 s and 601C for 60 s in ABI’s 7900 real-time PCR system.
The real-time PCR results were analyzed and expressed as relative
miRNA expression of Ct value, which was then converted to fold
changes. RT primer, PCR primers and TaqMan probe for miR-31
were purchased from ABI. RNU44 was used for normalization.
Anti-miRNA transfection
HeLa cells were seeded in p24 plate at 30% confluence with a
serum-free medium without antibiotics the day before transfec-
tion. Fifteen picomole of anti-miR-31 miRNA inhibitor (Ambion)
was transiently transfected in cells using Lipofectamine 2000
according to the manufacturer’s instructions. Cells were incu-
bated in the presence of the specific anti-miR miRNA inhibitor
(anti-miR-31), target miRNA mature sequence: AGGCAAGAUG-
CUGGCAUAGCU and the negative control for 24 h. The Anti-miR
miRNA Inhibitor Negative Control is a random sequence anti-miR
molecule offered for use as a negative experimental control. The
Anti-miR Negative Control has been extensively tested in many
human cell lines and tissues and validated to not produce any
identifiable effect on known miR function.
Statistical analysis
Data are presented as means7SD of five experiments and
analyzed using Student’s t-test. p-Values less than 0.05 were
considered significant.
Acknowledgements: This work was supported by grants from
the Belgian Fonds National de la Recherche Scientifique (FRSM,
Televie), the MEDIC Foundation, les Amis de l’Institut Bordet, the
Van Buuren and Hoguet Foundations. P.R. was supported in part
by a European Union grant ‘‘Cancer immunotherapy’’.
Conflict of interest: The authors declare no financial or
commercial conflict of interest.
References
1 Sakaguchi, S., Naturally arising Foxp3-expressing CD251CD41regulatory
T cells in immunological tolerance to self and non-self. Nat. Immunol.
2005. 6: 345–352.
2 Fontenot, J. D., Rasmussen, J. P., Williams, L. M., Dooley, J. L.,
Farr, A. G. and Rudensky, A. Y., Regulatory T cell lineage specifica-
tion by the forkhead transcription factor Foxp3. Immunity 2005. 22:
329–341.
3 Sakaguchi, S., Naturally arising CD41regulatory t cells for immunologic
self-tolerance and negative control of immune responses. Annu. Rev.
Immunol. 2004. 22: 531–562.
4 Hori, S., Nomura, T. and Sakaguchi, S., Control of regulatory T cell
development by the transcription factor Foxp3. Science 2003. 299:
1057–1061.
5 Fontenot, J. D., Gavin, M. A., and Rudensky, A. Y., Foxp3 programs the
development and function of CD41CD251regulatory T cells. Nat.
Immunol. 2003. 4: 330–336.
6 Khattri, R., Cox, T., Yasayko, S. A. and Ramsdell, F., An essential role
for Scurfin in CD41CD251T regulatory cells. Nat. Immunol. 2003.
4:337–342.
7 Kim, J. M., Rasmussen, J. P. and Rudensky, A. Y., Regulatory T cells
prevent catastrophic autoimmunity throughout the lifespan of mice. Nat.
Immunol. 2007. 8: 191–197.
8 Gambineri, E., Torgerson, T. R. and Ochs, H. D., Immune dysregulation,
polyendocrinopathy, enteropathy, and X-linked inheritance (IPEX), a
syndrome of systemic autoimmunity caused by mutations of Foxp3, a
critical regulator of T cell homeostasis. Curr. Opin. Rheumatol. 2003. 15:
430–435.
9 Morgan, M. E., van Bilsen, J. H., Bakker, A. M., Heemskerk, B., Schilham,
M. W., Hartgers, F. C., Elferink, B. G. et al., Expression of Foxp3 mRNA is
not confined to CD41CD251T regulatory cells in humans. Hum. Immunol.
2005. 66: 13–20.
10 Wang, J., Ioan-Facsinay, A., van der Voort, E. I., Huizinga, T. W. and Toes,
R. E., Transient expression of Foxp3 in human activated nonregulatory
CD41T cells. Eur. J. Immunol. 2007. 37: 129–138.
11 Jandus, C., Bioley, G., Speiser, D. E. and Romero, P., Selective accumula-
tion of differentiated Foxp3(1) CD4 (1) T cells in metastatic tumor lesions
from melanoma patients compared to peripheral blood. Cancer Immunol.
Immunother. 2008. 57: 1795–1805.
12 Gavin, M. A., Torgerson, T. R., Houston, E., DeRoos, P., Ho, W. Y.,
Stray-Pedersen, A., Ocheltree, E. L. et al. Single-cell analysis of
normal and Foxp3-mutant human T cells: Foxp3 expression without
regulatory T cell development. Proc. Natl. Acad. Sci. USA 2006. 103:
6659–6664.
13 Seddiki, N., Santner-Nanan, B., Martinson, J., Zaunders, J., Sasson, S.,
Landay, A., Solomon, M. et al. Expression of interleukin (IL)-2 and IL-7
receptors discriminates between human regulatory and activated T cells.
J. Exp. Med. 2006. 203: 1693–1700.
Eur. J. Immunol. 2009. 39: 1608–1618 Molecular immunology 1617
& 2009 WILEY-VCH Verlag GmbH & Co. KGaA, Weinheim www.eji-journal.eu
14 Baron, U., Floess, S., Wieczorek, G., Baumann, K., Grutzkau, A., Dong, J.,
Thiel, A. et al. DNA demethylation in the human Foxp3 locus discrimi-
nates regulatory T cells from activated Foxp3(1) conventional T cells. Eur.
J. Immunol. 2007. 37: 2378–2389.
15 Bresatz, S., Sadlon, T., Millard, D., Zola, H. and Barry, S. C., Isolation,
propagation and characterization of cord blood derived CD41CD251
regulatory T cells. J. Immunol. Methods 2007. 327: 53–62.
16 Li, L., Godfrey, W. R., Porter, S. B., Ge, Y., June, C. H., Blazar, B. R., and
Boussiotis, V.A., CD41CD251regulatory T cell lines from human cord
blood have functional and molecular properties of T cell anergy. Blood
2005. 106: 3068–3073.
17 Godfrey, W. R., Spoden, D. J., Ge, Y., Baker, S. R., Liu, B., Levine, B. L.,
June, C. H. et al., Cord blood CD4(1)CD25(1)-derived T regulatory cell lines
express Foxp3 protein and manifest potent suppressor function. Blood
2005. 105: 750–758.
18 Boyd, S. D., Everything you wanted to know about small RNA but were
afraid to ask. Lab Invest. 2008. 88: 569–578.
19 Cobb, B. S., Hertweck, A., Smith, J., O’Connor, E., Graf, D., Cook, T., Smale,
S. T. et al. A role for Dicer in immune regulation. J. Exp. Med. 2006. 203:
2519–2527.
20 Abbas-Terki, T., Blanco-Bose, W., Deglon, N., Pralong, W. and Aebischer, P.,
Lentiviral-mediated RNA interference. Hum. Gene Ther. 2002. 13:
2197–2201.
21 Stewar, S. A., Dykxhoorn, D. M., Palliser, D., Mizuno, H., Yu, E. Y., An,
D. S., Sabatini, D. M. et al. Lentivirus-delivered stable gene silencing by
RNAi in primary cells. RNA 2003. 9: 493–501.
22 Yeung, M. L., Bennasser, Y., Le, S. Y. and Jeang, K. T., siRNA, miRNA and
HIV: promises and challenges. Cell Res. 2005. 15: 935–946.
23 Sugimoto, N., Oida, T., Hirota, K., Nakamura, K., Nomura, T., Uchiyama, T.
and Sakaguchi, S., Foxp3-dependent and -independent molecules specific
for CD251CD41natural regulatory T cells revealed by DNA microarray
analysis. Int. Immunol. 2006. 18: 1197–1209.
24 Hill, J. A., Feuerer, M., Tash, K., Haxhinasto, S., Perez, J., Melamed, R.,
Mathis, D. and Benoist, C., Foxp3 transcription-factor-dependent and
-independent regulation of the regulatory T cell transcriptional signature.
Immunity 2007. 27: 786–800.
25 Allan, S. E., Passerini, L., Bacchetta, R., Crellin, N., Dai, M.,
Orban, P. C., Ziegler, Z. F. et al., The role of 2 Foxp3 isoforms
in the generation of human CD41Tregs. J. Clin. Invest. 2005. 115:
3276–3284.
26 Krek, A., Grun, D., Poy, M. N., Wolf, R., Rosenberg, L., Epstein, E. J.,
MacMenamin, P. et al. Combinatorial microRNA target predictions. Nat.
Genet. 2005. 37: 495–500.
27 Grimson, A., Farh, K. K., Johnston, W. K., Garrett-Engele, P., Lim, L. P. and
Bartel, D. P., MicroRNA targeting specificity in mammals: determinants
beyond seed pairing, Mol. Cell 2007. 27: 91–105.
28 Naldini, L., Blomer, U., Gallay, P., Ory, D., Mulligan, R., Gage, F. H.,
Verma, I. M. and Trono, D., In vivo gene delivery and stable
transduction of nondividing cells by a lentiviral vector. Science 1996.
272: 263–267.
29 Zufferay, R., Nagy, D., Mandel, R. J., Naldini, L. and Trono, D., Multiply
attenuated lentiviral vector achieves efficient gene delivery in vivo. Nat.
Biotechnol. 1997. 15: 871–875.
30 Johnston, J. C., Gasmi, M., Lim, L., Elder, J. H., Yee, J. K., Jolly, D. J.,
Campbell, K. P. et al. Minimum requirements for efficient transduction of
dividing and nondividing cells by feline immunodeficiency virus vectors.
J. Virol. 1999. 73: 4991–5000.
Abbreviations: Ct: cycle threshold � miR: microRNA � HDAC: histone
deacetylase � nTreg: natural Treg � TLDA: TaqMan Low Density Array �UCB: umbilical cord blood � UCBMC: UCB mononuclear cells � 30 UTR:
30 untranslated region
Full correspondence: Dr. Philippe Martiat, Department of Experimental
Hematology, Institut Jules Bordet, Universite Libre de Bruxelles, 121,
Boulevard de Waterloo, 1000, Bruxelles, Belgium
Fax: 132-2-5413453
e-mail: [email protected]
Received: 14/5/2008
Revised: 8/3/2009
Accepted: 9/3/2009
Eur. J. Immunol. 2009. 39: 1608–1618Rouas Redouane et al.1618
& 2009 WILEY-VCH Verlag GmbH & Co. KGaA, Weinheim www.eji-journal.eu
Copyright © 2022 FDOKUMEN