MicroRNA expression profiling reveals the potential function of microRNA-31 in chordomas


Original R esearch 497 MicroRNA or NMD: Why Have Two RNA Silencing
Systems?
Zhenguo Zhang , Landian Hu , Xiangyin Kong
515 Nodal Promotes mir206 Expression to Control Convergence and Extension Movements During Zebraf sh Gastrulation
Xiuli Liu , Yuanqing Ma , Congwei Zhang , Shi Wei , Yu Cao , Qiang Wang
523 Generation and Characterization of a Transgenic Zebraf shExpressing the Reverse Tetracycline Transactivator
Qilin Gu , Xiaojie Yang , Xiaozhen He , Qing Li , Zongbin Cui
533 Knockouts of RecA-Like Proteins RadC1 and RadC2Have Distinct Responses to DNA Damage Agents in Sulfolobus islandicus
Peng-Juan Liang , Wen-Yuan Han , Qi-Hong Huang , Yan-Ze Li , Jin-Feng Ni , Qun-Xin She , Yu-Long Shen
Letter to the Editor 543 Positive Selection of CAG Repeats of the ATXN2 Gene in
Chinese Ethnic Groups
Xiao-Chen Chen , Hao Sun , Chang-Jun Zhang , Ying Zhang , Ke-Qin Lin , Liang Yu , Lei Shi , Yu-Fen Tao , Xiao-Qin Huang , Jia-You Chu , Zhao-Qing Yang
Cover: MicroRNA (miRNA)-induced mRNA decay and nonsense-mediated mRNA decay (NMD) perform the similar function — de grading tar get mRNAs. Why have two such systems with the seemingly similar function? To answer this question, Zhang and his colleagues systematically compared the target genes of miRN A and NMD in the plant Arabidopsis thaliana, and found that the miRN A targets are highly and stably e xpressed, e volve slower, and tend to be in volved in transcription and de velopment, while the NMD targets have the opposite gene properties, and are more associated with stress responses. These results suggest that these tw o mRN A decay systems pro vide dif ferent re gulation modes and the gene’s choice of which system is determined by its performed functions, as sho wn in the cartoon cover (Zhang et al., pp. 497−513).
Journal of Genetics and GenomicsVolume 40 No. 10, October 2013
Contents

ORIGINAL RESEARCH
MicroRNA or NMD: Why Have Two RNA Silencing Systems?
Zhenguo Zhang a,*, Landian Hu b, Xiangyin Kong b,*
a Institute of Molecular Evolutionary Genetics and Department of Biology, Pennsylvania State University, University Park, PA 16802, USAb The Key Laboratory of Stem Cell Biology, Institute of Health Sciences, Shanghai Institutes for Biological Sciences, Chinese Academy of
Sciences and Shanghai Jiao Tong University School of Medicine, Shanghai 200025, China
Received 14 June 2013; revised 13 September 2013; accepted 14 September 2013
Available online 21 September 2013
ABSTRACT
MicroRNA (miRNA)-mediated RNA silencing and nonsense-mediated decay (NMD) are two conserved RNA-level regulatory path-ways. Although they are mechanically different, both can regulate target genes by RNA degradation and translational repression.Moreover, studies of individual target genes indicated that these two pathways can be involved in the same processes (e.g., developmentand stress responses). These facts raise an important question that whether these two systems are cooperative, interchangeable or optimalfor regulation of different sorts of genes. We addressed this by comparing miRNA and NMD targets in Arabidopsis thaliana at thegenome-wide scale. We find no more overlap in the genes targeted by both systems than expected by chance. Moreover, the sorts of genesor pathways regulated by these systems are categorically different on several cross-correlating fronts. While miRNA targets showenrichment in the process of development, metabolism and transcription, NMD targets are associated with stress responses but otherwisepoorly annotated. Validated miRNA targets are more highly expressed, less variably expressed and slower evolving. These differencessuggest that the modes of regulation need not be interchangeable. Instead, we suggest that miRNA genes are commonly dose-sensitive andrequire fine control of levels through weak pull-down by miRNAs. This is consistent with miRNA-regulated genes being more likely to beinvolved in proteineprotein interactions. Many NMD-regulated genes, by contrast, have properties consistent with them being rapidemergency response “fire-fighter” genes. If true, the lack of annotation of NMD targets suggests that we poorly understand the emer-gencies plants face in the wild.
KEYWORDS: NMD; miRNA; Gene regulation; RNA degradation; Evolution
INTRODUCTION
Many eukaryotes employ two different RNA-level modesof gene expression control, microRNA (miRNA)-mediatedRNA silencing and nonsense-mediated mRNA decay (NMD).miRNAs are small (about 22 nucleotides) non-coding RNAswhich repress gene expression by base-paring with targetmRNAs at target sites (Fig. 1) (Bartel, 2004; Hendricksonet al., 2009; Guo et al., 2010). NMD is a pathway to detectand degrade mRNA transcripts with “premature” termination
codons (Fig. 1) (Chang et al., 2007; Kurihara et al., 2009;Zhang et al., 2009). NMD needs three core proteins, UPF1,UPF2 and UPF3, which can bind RNAs with recognizablepremature termination codons (PTCs) (Chang et al., 2007). Atfirst sight, the function of NMD looks like an error proofingsurveillance system for mis-spliced exons or rare nonsensemutations (Losson and Lacroute, 1979). However, it alsoregulates expression of a subset of natural transcripts withPTC-like authentic stop codons (He et al., 2003; Rehwinkelet al., 2006; Kurihara et al., 2009; Zhang et al., 2009).Under “normal” conditions, NMD prevents abundant trans-lation of these genes. However, when conditions change (e.g.,under nutrient limitation (Mendell et al., 2004)), the NMDmachinery is shut down. When this happens, normally sup-pressed transcripts are now free to be translated abundantly.
* Corresponding authors. Tel: þ1 814 865 1034, fax: þ1 814 863 7336
(Z. Zhang); Tel: þ86 21 6385 2639, fax: þ86 21 6467 8976 (X. Kong).
E-mail addresses: [email protected] (Z. Zhang); xykong@sibs.
ac.cn (X. Kong).
Available online at www.sciencedirect.com
ScienceDirectJournal of Genetics and Genomics 40 (2013) 497e513
JGG
1673-8527/$ - see front matter Copyright � 2013, Institute of Genetics and Developmental Biology, Chinese Academy of Sciences, and Genetics Society of China.
Published by Elsevier Limited and Science Press. All rights reserved.
http://dx.doi.org/10.1016/j.jgg.2013.09.002
Indeed, it is striking that under nutrient limitation NMD down-regulation permits up-regulation of genes (such as those foramino acid biosynthesis) needed under nutrient limitationconditions (Mendell et al., 2004). NMD is in this instance amode of gene regulation, but not an error proofing surveillancesystem. Similarly, a gene can be regulated by switchingdeterministically between NMD-inducing isoforms and NMDinvisible isoforms (Lareau et al., 2007; Kalyna et al., 2012).
Given that both NMD and miRNA have regulatory poten-tial with the similar regulation effect, why have two RNA-level regulatory systems? This question is all the moreintriguing when one notices many similarities between thetwo: (1) Both regulate their targets by mRNA decay and/orrepressing translation (Fig. 1) (Zhang et al., 2010; Huntzingerand Izaurralde, 2011). (2) Both are phylogenetically wide-spread. NMD exists in plants, animals and fungi, while miR-NAs are also observed in all of them except for fungi. Theprecise dynamics of the two systems, however, vary acrosstaxa. The “rules” by which cells classify a stop codon aspremature show considerable variability (Conti and Izaurralde,2005; Muhlemann, 2008; Brogna and Wen, 2009). Similarly,the degree of wobble permitted between the miRNA and thetarget site differs between taxa. In plants, the paired region is(nearly) completely complementary (Pasquinelli, 2012), whichis more stringent than in animals. (3) Both are involved insimilar cellular processes in plants. Previous studies on indi-vidual gene have shown that they are, for example, bothinvolved in development and cellular stresses in plants.miRNA-mediated regulation can affect many developmentalphenotypes, including development timing, leaf and root
morphogenesis and flower development (reviewed in Rubio-Somoza and Weigel, 2011; Khraiwesh et al., 2012), whileimpaired NMD can result in epinastic leaves, longer seeds (Shiet al., 2012), delayed flowering time, fused flowers and lethalseedlings (Arciga-Reyes et al., 2006). Moreover, NMD isresponsible for pathogen- or wounding-induced stresses(Rayson et al., 2012; Shi et al., 2012), and miRNAs werefound in biotic and abiotic stress responses, including re-sponses to bacterial pathogenesis, cold, drought, salt and so on(reviewed in Khraiwesh et al., 2012; Sunkar et al., 2012). (4)They may be mechanistically related. A recent study in HeLacells indicated that loading of AGO2 (a key protein in miRNAtargeting) or miRNA-induced silencing complex (miRISC)onto the 30 UTR of NMD targets can abolish NMD degrada-tion (Choe et al., 2010), suggesting that these two systemsmight be mechanically linked. As expected of many mRNAcontrol systems, both involve p-bodies, foci within the cyto-plasm consisting of many enzymes involved in mRNA turn-over (Shyu et al., 2008). This indicates, if nothing else, that theproteins for the two systems colocalize within a cell.
These facts raise a question as to whether these two systemscooperate when they repress target genes in cells. Forexample, do they target the same set of genes? One could, forexample, imagine that the two systems might regulate thesame set of genes but under different conditions. If not, whatare the determinants for the “choice” of which mechanism toemploy? As both systems can repress gene expression, the“choice” of the mechanism might be historical accident. Agood example consistent with this idea is that gene duplicationand alternative splicing, both increasing genic proliferation,
A
U
C
GA
UG
G
(A)n
(A)n
(A)n
Transcription andRNA processing
miRNAPTC
Repressed translationDegradation
Inactive ribosome
Start codon
mRNA cap
Stop codon/PTC
miRNA target NMD targetGenome
mRNA
Fig. 1. The mechanisms of miRNA-mediated RNA silencing (left panel) and nonsense-mediated mRNA decay (NMD) (right panel) regulation.
In miRNA regulation, the recognition of target transcripts depends on the pairing between miRNA and target sites. In NMD targeting, a premature termination
codon (PTC) is needed for target recognition. The recognition of PTC by NMD machinery is a complex process (see text). miRNA-mediated regulation mainly
degrades target mRNAs (thick arrow) and marginally represses translation (thin arrow). The NMD regulation can also cause mRNA degradation but the translation
repression needs further evidence (dashed line), though the NMD targets are translationally repressed (Zhang et al., 2010).
498 Z. Zhang et al. / Journal of Genetics and Genomics 40 (2013) 497e513

may be evolutionarily interchangeable (Kopelman et al.,2005). The model becomes more promising if we considerspecies which do not have miRNA regulation, such as fungi. Itis possible that the roles of miRNAs might be taken over byother systems, such as NMD, should this be necessary. Werethe historical accident argument to apply, we should find thegenes regulated by the two systems to be similar in manyregards. Alternatively, the targets may be quite different if theyare under different regulation modes fulfilled by these twosystems. If so, what, if anything, are the characteristics of thesorts of genes targeted by the two mechanisms? Do thesedifferences make sense in terms of the modes of action of thetwo systems?
In this study, we systematically compared the target genes ofmiRNAs and NMD in Arabidopsis thaliana (A. thaliana). Wechose this plant model organism because the miRNA targetdetection may be more reliable due to the need of completecomplementary pairing between miRNAs and their mRNAtargets (Pasquinelli, 2012). Secondly, a couple of large-scaledatasets for NMD targets were published recently (Kuriharaet al., 2009; Rayson et al., 2012), making this study feasible.Our results indicate that miRNAs and NMD target differentsubsets of genes. The sets of target genes show quite differentfeatures, including functional distribution, conservation,expression abundance and expression variation. Generally,genes normally expressed at high levels, with little variation indosage that tend also to be slow evolving, are regulated bymiRNA. By contrast, suites of genes with normally low levelsbut requiring rapid up-regulation under particular conditionstend to be regulated by NMD. The fact that these differencesaccord with the biology of the two regulation systems suggeststhat the mode of control for mRNAs is not arbitrary but tallied tothe biological function of the gene product.
RESULTS
Definition of miRNA and NMD target gene sets
For any comparison between NMD targets and miRNAtargets, it is first important to robustly define the sets of genesinvolved. Due to high constraint in target site recognition,computational prediction of miRNA target genes is thought tobe easier in plants than elsewhere. However, the false positiveand negative rates are still high and experimental validation isusually needed (Min and Yoon, 2010; Pasquinelli, 2012). Inthis regard, there exist multiple experimental methods todetect the miRNA targets directly. The degradome methodsrely on the fact that 50 mono-phosphate is left in the 30 productafter cleavage by miRNA-induced silencing complex (miR-ISC). These cleavage products can be isolated and sequencedto determine the miRNA target sites (Addo-Quaye et al., 2008;German et al., 2008). Another method, crosslinking immu-noprecipitation (CLIP), can pull down the RNA sequence re-gions bound by miRISC complex (Chi et al., 2009), which aresupposed to be miRNA target sites.
To obtain a robust set of miRNA targets, we compiled a list of275 experimentally validated target genes (Dataset S1) by
searching the literature (see Materials and Methods for datasources). We also predicted 2141 targets (Dataset S1) with therules derived from previous experiments (Schwab et al., 2005).Only 97 of these predicted targets correspond with experi-mentally confirmed targets. To define an miRNA target setbased on only computational prediction, we eliminated theoverlapping validated targets from the predicted sets. In thisway, we obtained 2044 predicted (but unvalidated) targets. Inthe following text, we will refer to the experimentally validatedmiRNA targets and computationally predicted but unvalidatedmiRNA targets as ‘validated’ and ‘predicted’, respectively.
Similar to the situation of miRNA, identification of NMDtargets is problematic. The recognition of targets with PTCs byNMD depends on a set of rules and varies from species tospecies (Brogna and Wen, 2009). In A. thaliana, the targets ofNMD may have one or more of the following features: a long30 UTR, the presence of upstream ORF (uORF) in 50 UTR, andthe presence of introns downstream stop codons (Kertesz et al.,2006; Kurihara et al., 2009; Kalyna et al., 2012). However, thepresence of the above features in a transcript does not guar-antee the targeting by NMD (Kalyna et al., 2012). Unifyingthe target recognition mechanisms in different species is still achallenging task (Muhlemann, 2008; Brogna and Wen, 2009).The NMD targets predicted based on sequence features arehence likely to be subject to unacceptably high error rates.Preferable then is to employ experimental methods alone foridentifying NMD targets. Typically, such methods examinegene expression differences between wild-type and NMD-inactive samples, and regard genes up-regulated in NMD-inactive samples as NMD targets (He et al., 2003; Kuriharaet al., 2009). However, this approach may collect both thedirect (degraded by NMD) and indirect targets (the down-stream genes up-regulated by direct NMD targets). At present,it is difficult to distinguish them using bioinformatic methods.To show that our analyses are robust and reflect the propertiesof direct NMD targets, we complied three sets of NMD targetgenes from the previous studies: (1) 238 up-regulated(by � 1.8 fold) genes in NMD upf1 or upf3 mutants usingArabidopsis tiling array (Kurihara et al., 2009); (2) 203 genescommonly up-regulated (by � 1.5 fold) in upf1, upf3 and smg7NMD mutants with ATH1 cDNA expression arrays (Raysonet al., 2012); (3) 38 genes showing up-regulated NMD-target-like alternative splicing isoforms in upf1 and upf3 mu-tants using the high-throughput RT-PCR (Kalyna et al., 2012).For easy description, we will refer to these three target genesets as “Kurihara”, “Rayson” and “Kalyna” NMD target sets,respectively. The first two sets (“Kurihara” and “Rayson”)may contain both direct and indirect NMD targets, but sincethey have a very small overlap (22 genes; Fig. S1), theyrepresent NMD targets affected under different conditions.The third NMD target set (the Kalyna set) all have NMD-inducing features and were detected by RT-PCR, and thusare supposed to be direct NMD targets. Since only 269 geneswere examined in the original study of the Kalyna set, to avoidthe prior bias, we constrained our analyses in the 266 mappedgenes (Dataset S1) when this set is used. Due to limitedoverlaps among these gene sets (Fig. S1), we did not use the
499Z. Zhang et al. / Journal of Genetics and Genomics 40 (2013) 497e513

overlapping genes or the union of these three gene sets, but rananalyses on each set separately when applicable. We noted thatwhen referring to the properties of NMD targets, the first twoNMD sets may in addition, or instead, represent properties ofgenes in NMD modulated pathways, rather than NMD targetsthemselves, and the Kalyna set represents the properties ofdirect NMD targets. For conciseness, we used the Kuriharatarget set in the main results in the following analyses andmentioned the results by using the other NMD gene sets.
miRNA and NMD targets represent independent subsetsof genes in the Arabidopsis thaliana genome
Do NMD and miRNA target the same genes more oftenthan expected? If, for example, neither mechanism were per-fect and thus the two systems are optimally employed tocontrol the same genes but under different conditions, wemight expect that there would be more genes controlled byboth systems than expected by chance. However, there areonly two validated genes targeted by both miRNAs and NMD(Table 1). Under the null hypothesis that the two sets aredrawn randomly from the complete set of 27,201 Arabidopsisgenes, we expect a mean overlap set of 2‒3 genes. The degreeof overlap is thus neither indicative of enrichment of overlap(P ¼ 0.69) nor of overlap avoidance (P ¼ 0.57) (P valuesderived by simulation). This suggests that the targeting ofgenes by these two systems is generally independent. How-ever, we cannot be confident about the absence of overlapbetween the two sets, although the overlap is smaller than theexpected mean; even if there were no overlap, the result wouldnot be significant with these sample sizes. Using the ‘pre-dicted’ miRNA targets in this analysis (Table S1A) orcombining the ‘validated’ and ‘predicted’ miRNA targets intoone set (Table S1B) gives similar results d the sizes of theoverlapped genes are never significantly different from whatwe expect by chance (Fisher’s exact test, P ¼ 1). Repeatingthe analysis with the Rayson or Kalyna NMD targetset also gave the similar results (Table S1C and D). Therefore,miRNA and NMD targets are different subsets of genes in theArabidopsis genome.
miRNA targets show functional bias and are commonlytranscription factors while NMD targets are poorlyannotated or environment-responsive
Are genes targeted by miRNAs and NMD distributeddifferentially between functional categories? To address this
issue, we performed Gene Ontology analysis withFatiGO þ (Al-Shahrour et al., 2004). First, we compared themiRNA targets against all the genes in the genome to seewhether they are enriched in some functions. The miRNAtargets show enrichment in diverse processes (includingdevelopment processes, morphogenesis, RNA binding, proteincomplexes, response to stimuli, etc.), particularly evident forthe validated miRNA targets (Dataset S2). These biologicalactivities are consistent with previous reports of studies onindividual miRNA target genes (Chen, 2005). By contrast,when we compared the Kurihara NMD targets against thegenome background, we found only one significant GO term(response to jasmonic acid stimulus, GO:0009753) at FDR(false discovery rate) (Benjamini and Hochberg, 1995) < 0.05.This is consistent with the result of the Rayson NMD set thatNMD-regulated genes were over-represented in environment-responding processes (Rayson et al., 2012), suggesting thatenvironment response is one of the major roles of NMD tar-gets (or of genes modulated downstream of NMD targets).
There is thus a striking difference in the extent to whichmiRNA and NMD targets are described as belonging todifferent functional classes. Given the similarity in samplesize, this difference is unlikely to be owing to differentialstatistical power. Indeed, randomly sampling 238 miRNAtargets from the validated set (n ¼ 275) and repeating the GOanalysis, typically give very similar results to analysis of thewhole validated set (Dataset S2). These results suggest thatmiRNA targets play roles in diverse well-described processes.As regards the absence of significance in the Kurihara NMDtargets, it is probably because they are poorly annotated (TableS2), as seen in mammals (Zhang et al., 2009).
Next, we directly compared the miRNA targets and NMDtargets to disclose in which functional categories they showsignificant differences from each other. The result shows that,with FDR < 0.05, the ‘validated’ miRNA targets are signif-icantly enriched in many functional categories (especiallydevelopment, metabolic processes and transcription regula-tion), while NMD targets are significant in only three termswhich are related to protein phosphorylation and jasmonicacid response (Table 2 and Dataset S2). Using the RaysonNMD target set gave a very similar result in which only 4 of56 significant GO terms when using the Kurihara NMD setare absent (Dataset S2). Moreover, using the Rayson NMDset resulted in more significant GO terms enriched for NMDtargets, most of which are related to biotic responses andamino acid metabolism, confirming the results of the originalstudy (Rayson et al., 2012). However, caution should be paidto this result. The original study by Rayson et al. (2012)showed that 183 of 206 NMD targets were salicylic acid(SA) dependent. Therefore, the enrichment in the biotic re-sponses might be the effect of indirect targets mediated bySA regulation. However, to answer this question, we need toisolate the real direct NMD targets. When we compared the‘predicted’ miRNA targets with the NMD targets set for thesame analysis, there were only two significant GO terms(related to membrane components as identified in the aboveanalysis) enriched for miRNA targets (Dataset S2),
Table 1
The overlap of NMD and validated miRNA targets
miRNA
Non-target Target
NMD Non-target 26,690 273
Target 236 2
Fisher’s exact test, P ¼ 1.
500 Z. Zhang et al. / Journal of Genetics and Genomics 40 (2013) 497e513

suggesting that there may be many false positives in thepredicted set.
We also used another annotation system, Plant Ontology, tocompare the functions of miRNA targets and NMD targets.Plant Ontology (http://www.plantontology.org/), like GeneOntology, is a controlled hierarchical vocabulary, but isdesigned to describe plant anatomy and development stages(Avraham et al., 2008). The results showed that miRNA targetsare enriched in multiple areas of anatomy and development(Bonferroni corrected P < 0.05, Table S3), while NMD targetsare only significant in the category “unknown functions”.These results again suggest that miRNA targets have relativelywell-described diverse roles in many biological activitieswhile NMD targets (or their downstream genes) are often lessannotated.
Based on previous studies (Yamaguchi et al., 2009;Willmann et al., 2011), miRNAs often regulate the develop-ment process by targeting a few transcriptional factors.Consistent with this expectation, we indeed found that miRNAtargets are more often transcriptional factors than any othergroup (Fig. 2, P < 6.46 � 10�7 and P < 0.053 for validatedand predicted miRNA targets, respectively), and no differencebetween NMD targets and the gene group ‘others’(P ¼ 0.883). This is also true when Rayson NMD set wasused, but the differences between miRNA targets and otherswere more significant (P < 0.034, Fig. S2).
In addition, we can ask whether the miRNA and NMDtargets are involved in different stages of plant development.We employed expression data from a prior study (Schmidet al., 2005) for the following samples: seedling at day 8
Table 2
The Gene Ontology analysis (validated miRNA targets vs. NMD targets)
GO category GO ID GO term Counts of
miRNA targets
associated with
this term/not
associated
Counts of NMD
targets associated
with this term/not
associated
Log
(odds ratio)
FDR (Benjamini
& Hochberg)
Biological process GO:0006139 Nucleobase, nucleoside, nucleotide and
nucleic acid metabolic process
95/180 33/205 1.187 3.78E-06
Biological process GO:0007275 Multicellular organismal development 53/222 9/229 1.804 3.78E-06
Biological process GO:0009059 Macromolecule biosynthetic process 95/180 34/204 1.153 5.06E-06
Biological process GO:0006350 Transcription 74/201 22/216 1.285 8.94E-06
Biological process GO:0051171 Regulation of nitrogen compound
metabolic process
73/202 22/216 1.266 1.18E-05
Biological process GO:0044237 Cellular metabolic process 161/114 87/151 0.897 1.37E-05
Biological process GO:0044249 Cellular biosynthetic process 107/168 45/193 1.005 1.37E-05
Biological process GO:0045449 Regulation of transcription 72/203 22/216 1.248 1.37E-05
Biological process GO:0006807 Nitrogen compound metabolic process 100/175 41/197 1.010 1.74E-05
Biological process GO:0048513 Organ development 29/246 2/236 2.633 1.74E-05
Biological process GO:0009753 Response to jasmonic acid stimulus 0/275 8/230 L1.80ED304 0.011107
Biological process GO:0016310 Phosphorylation 7/268 20/218 L1.256314 0.020603
Biological process GO:0006468 Protein amino acid phosphorylation 6/269 17/221 L1.238 0.035563
Cellular component GO:0005634 Nucleus 94/181 31/207 1.244 3.50E-07
Cellular component GO:0043231 Intracellular membrane-bounded organelle 164/111 83/155 1.015 3.50E-07
Cellular component GO:0005622 Intracellular 184/91 103/135 0.975 8.71E-07
Cellular component GO:0005773 Vacuole 13/262 0/238 1.80Eþ304 0.001935
Cellular component GO:0005840 Ribosome 13/262 0/238 1.80Eþ304 0.001935
Cellular component GO:0043234 Protein complex 34/241 9/229 1.278 0.002077
Cellular component GO:0005886 Plasma membrane 27/248 7/231 1.279 0.008921
Cellular component GO:0022626 Cytosolic ribosome 10/265 0/238 1.80Eþ304 0.008921
Cellular component GO:0030529 Ribonucleoprotein complex 16/259 2/236 1.986 0.009759
Cellular component GO:0016020 Membrane 61/214 32/206 0.607 0.036595
Molecular function GO:0003676 Nucleic acid binding 99/176 47/191 0.827 0.002025
Molecular function GO:0003677 DNA binding 70/205 26/212 1.024 0.002025
Molecular function GO:0003700 Transcription factor activity 58/217 20/218 1.069 0.002025
Only the top 10 or all (if total is less than 10) GO terms with FDR < 0.05 are shown and the terms enriched for NMD targets are in bold. See Dataset S2 for the
complete result of the analysis.
501Z. Zhang et al. / Journal of Genetics and Genomics 40 (2013) 497e513

and 21 after seed germination, vegetative rosette at day 7 and14, root at day 7, 8, 17 and 21, seed at stage 3 to 5 (midglobular to mid torpedo embryo) and stage 8 to 10 (walking-stick to green-cotyledon embryo). Samples for each tissuewere divided into two groups based on the ages of samples,namely ‘Early’ and ‘Late’ (Fig. S3). The genes up-regulated inthe ‘Early’ or ‘Late’ group were identified for each tissue andthe proportions of genes changed among different gene groupscompared.
This analysis reveals no robust patterns (Fig. S3). The fewstatistically significant effects are weak, require one-sided testsand are not robust to Bonferonni correction. The largest pro-portion of genes with changing expression was identified inseed development (Fig. S3B). Here, ‘validated’ miRNA targetsshow more up-regulation at stage 3 to 5 than any other genegroup (one-sided Fisher’s exact test, P < 0.05). By contrast,for the tissue vegetative rosette, we found that the NMD tar-gets are possibly more often up-regulated in the ‘Early’ group(day 7) (one-sided Fisher’s exact test, P < 0.03). Given theweakness of these results, we will not speculate with respect topossible interpretations. We did not use the Kalyna NMD setfor the functional analysis above, because the sample size istoo small to get an unbiased result.
NMD targets are more often responsive to stresses thanmiRNA targets
The above analyses suggest that NMD genes are poorlydescribed or environment-responding depending on the NMDset used. However, the ontology-based analyses rely on theannotation quality of the system. Another less biased methodto infer gene functions is to examine the gene expression; forexample, up-regulated genes upon stresses are stress-responsive genes. On the other hand, prior studies(Khraiwesh et al., 2012; Rayson et al., 2012; Shi et al., 2012;Sunkar et al., 2012) suggest that both miRNA targets andNMD targets were involved in plant stress responses. To seewhether both groups of targets are equally involved in stressresponses, we examined the stress up-regulated genes.
To this end, we identified the genes responsive to fiveabiotic stress conditions (salt, osmotic, the hormone abscisicacid, cold and heat) with the microarray expression data froma previous study (Zeller et al., 2009). Both up-regulated anddown-regulated genes were identified upon stresses. The genesaltered in expression under any condition were regarded asresponsive genes (see Materials and Methods). We comparedthe proportion of responsive genes among the following fourgene groups: ‘validated’ miRNA targets, ‘predicted’ miRNAtargets, NMD targets and the rest of genes (the ‘others’ group)representing the genome average (Dataset S1).
We found that the NMD targets have a significantly higherproportion of up-regulated genes than any other group (Fig. 3,Fisher’s exact test, NMD vs. miRNA targets, P < 0.035; NMDvs. ‘others’, P ¼ 0.061), but not in the down-regulated case(P > 0.33). miRNA targets are less responsive than the genegroup ‘others’, but this is not statistically significant(P > 0.147). When we used the Rayson NMD target set for theanalysis, we observed a more significant enrichment for up-regulated genes in NMD targets (Fig. S4, Fisher’s exact test,P � 5.94 � 10�9), but we also observed that NMD targetswere more often down-regulated (P � 6.46 � 10�13). Thereare at least two possible explanations for this: these down-regulated genes are indirect NMD targets as suggestedabove, or this is another strategy for real direct NMD targets torespond to stresses. Again, isolating the direct NMD targets isneeded for answering this question. However, it is probably
Up−regulation Down−regulation
Perc
enta
ge o
f res
pons
ive
gene
s (%
)
Validated miRNA targetsPredicted miRNA targetsNMD targetsOthers
0
2
4
6
8
10
12
14
Fig. 3. NMD target genes are more often up-regulated (left panel, Fisher’s
exact test, NMD vs. miRNA targets, P < 0.035; NMD vs. ‘others’, P ¼ 0.061)
in abiotic stress responses, but not so in down-regulation (right panel,
P > 0.33).
Perc
enta
ge o
f gen
es (%
)
0
5
10
15
20
25273(59)
2044(205)
218(13)
24,874(1422)
Validated miRNA targetsPredicted miRNA targetsNMD targetsOthers
Fig. 2. miRNA targets are enriched for transcriptional factors.
The number on the top of each bar gives the total number of genes examined
and genes encoding transcription factors (in parentheses). Fisher’s exact test,
P < 6.46 � 10�7 and P < 0.053 for validated and predicted miRNA targets,
respectively.
502 Z. Zhang et al. / Journal of Genetics and Genomics 40 (2013) 497e513

safe to say that NMD targets are more active in stress re-sponses because both NMD target sets show up-regulationupon stresses. Unfortunately, here we cannot use the Kalynaset to show the situation for the direct NMD targets becausetoo few genes were mapped to make a reliable comparison.
miRNA targets are expressed at higher levels than NMDtargets
Since both miRNA and NMD repress target genes at themRNA level, it might be expected that their targets show lowerexpression than the genomic average. To examine this, wecollected the mRNA expression levels for all the genes in A.thaliana from a large-scale study (Schmid et al., 2005), inwhich many tissues were examined by microarrays during A.thaliana development. We compiled the expression data for19,838 genes from 9 different tissues (stamen, pollen, root,seed, flower, shoot apex, leaf, rosette, and stem) afterexcluding the genes which were not expressed in any sample.The expression levels were compared in each tissue among thefour gene groups defined as above.
Intriguingly, the ‘validated’ miRNA targets show higherexpression than the genome average in all tissues (except forpollen) (paired Wilcoxon rank sum test, P < 0.0039) whileNMD targets show the opposite (P ¼ 0.0078) (Fig. 4A andFig. S5). Similar patterns are shown when only genes withdetectable A. lyrata or rice orthologs are considered or whentranscription factor genes, defined in the plant transcriptionalfactor database (Zhang et al., 2011), are excluded (Fig. S6).We repeated the analysis by using the other two NMD targetsets: Rayson and Kalyna, and similar results were obtained
although it was much noisier when using the Kalyna set due tothe very small sample size (Fig. S7). Moreover, we found thatthe validated miRNA targets are expressed in more tissuesthan NMD targets (Wilcoxon rank sum test, P ¼ 0.002,Fig. 4B) but there is no significant difference between thepredicted miRNA targets and NMD targets (P ¼ 0.647),though there is a tendency for the predicted miRNA targetsexpressed in more than seven tissues (P ¼ 0.06). Consistentwith the difference in gene expression levels, we found thatboth ‘validated’ and ‘predicted’ miRNA targets have longeraverage RNA half-life than NMD targets (Fig. S8,P � 1.54 � 10�5). Together, these results suggest that miRNAtargets show higher and broader gene expression than NMDtargets.
Expression level differences between validated miRNAtargets and NMD targets are not method artifacts
The difference in expression level and breadth betweenvalidated targets and the genome average is suggestive of asystematic difference between the two groups. But might theexpression differences be caused by methods for identifyingthese sets of genes? Indeed, that the predicted miRNA targetsshow similar expression compared to the group ‘others’(P ¼ 0.82), although still higher than the ‘NMD’ group(P ¼ 0.0078) (Fig. 4A and Fig. S5), is consistent with apossible method bias in the ‘validated’ miRNA target set (butalso with the notion that the predicted set is rich in falsepositives).
NMD targets are identified through microarray-basedinference of up-regulation. Since the microarrays have the
(0,1] (1,2] (2,5] (5,7] (7,8] (8,9]
Validated miRNA targetsPredicted miRNA targetsNMD targetsOthers
Number of tissues
Frac
tion
of g
enes
0.35
0.30
0.25
0.20
0.15
0.10
0.05
0.00
9.0
8.5
8.0
7.5
7.0
6.5
6.0
Expr
essi
on le
vel (
gcR
MA
)
Validated miRNA targetsPredicted miRNA targets
NMD targetsOthers
B
A
Polle
n
Stam
en
Roo
t
Seed
Flow
er
Shoo
t ape
x
Leaf
Ros
ette
Stem
Fig. 4. miRNA targets have higher and broader expressions than NMD targets.
A: the average of gene expression levels for each gene group in each tissue is shown, and the error bars represent the standard errors. B: the distribution of the
number of tissues in which a gene is expressed is compared among gene groups. The tissues used are the same as those in A.
503Z. Zhang et al. / Journal of Genetics and Genomics 40 (2013) 497e513

signal saturation issue (effectively an upper limit), the abilityto detect up-regulation may be impaired for highly expressedgenes because the expression, after up-regulation, may exceedthe measurement range for microarrays. Consequentially, if anup-regulated fold threshold is set for identifying up-regulatedgenes, the genes with higher expression may be more oftenoverlooked.
To check whether this issue affected our results, we rean-alyzed the original microarray expression data (Kurihara et al.,2009). We found that there is not a negative correlation be-tween fold change and expression levels in the upf1 mutantdataset (Spearman correlation r ¼ �0.04, P ¼ 0.405) and onlya weak negative correlation in upf3 mutant dataset (Spearmanr ¼ �0.12, P ¼ 0.016) suggesting that any bias is weak atbest. In addition, we checked whether there is gene expressionlevel difference for genes up-regulated by � 1.8 fold (thethreshold used in the original study) and by < 1.8 fold. The
results showed no difference (Fig. 5A and B, Wilcoxon ranksum test, P � 0.48). We conclude that the method for iden-tifying NMD targets should not have biased the dataset to-wards lower expression levels. Actually, the lower expressionof NMD targets in the Kalyna set also supports this conclusionbecause these targets were identified with RT-PCR rather thanmicroarrays.
As regards miRNA targets, the ‘degradome’ method relieson the ligation of the 30 cleavage product into the sequencinglibrary (German et al., 2008; Ma et al., 2010). For two miRNAtargets expressed at different levels, assuming equal targetingefficiency on both miRNA targets, the one with higherexpression may produce more 30 cleavage products and thushave a higher probability of being sequenced and reported asan miRNA target. To check for such a bias, we alternativelycompiled the genes up-regulated in dcl1 and ago1 mutantsassayed with AtGenome1 microarrays (Ronemus et al., 2006).
≤ 1.8 fold > 1.8 fold
12
10
8
6
Expr
essi
on le
vel (
RM
A)
≤ 1.8 fold > 1.8 fold
12
10
8
6
Expr
essi
on le
vel (
RM
A)
BA
10
9
8
7
6
Expr
essi
on le
vel (
gcR
MA
)
Genes upregulated in dcl1 and ago1 mutantsPredicted miRNA targetsNMD targetsOthers
C
upf3upf1
P = 0.54 P = 0.48
Polle
n
Stam
en
Roo
t
Seed
Shoo
t ape
x
Leaf
Ros
ette
Stem
Flow
er
Fig. 5. Lower and higher gene expression levels of NMD and miRNA targets, respectively, are not caused by method artifacts.
Comparison of the gene expression levels between two groups of genes up-regulated by� 1.8 fold and by< 1.8 fold in upf1 (A) and upf3 (B) mutants, respectively.
The results show that there are no significant differences in gene expression levels between these two groups of genes (Wilcoxon rank sum test, P � 0.48). The
microarray data is from the previous experiment (Kurihara et al., 2009). C: the expression levels of genes up-regulated in dc1 or ago1 mutants (Ronemus et al.,
2006) were compared with the other gene groups. Genes without probes on the AtGenome1 array were excluded.
504 Z. Zhang et al. / Journal of Genetics and Genomics 40 (2013) 497e513

Since dcl1 and ago1 are vital components in miRNA synthesisand target cleavage in plants, the defect in these two genes willseverely affect the miRNA regulation pathway. Therefore, thegenes up-regulated should be enriched for miRNA targets. Toreduce the potential effect, we also excluded the miRNA tar-gets defined in our original ‘validated’ set. As shown inFig. 5C, these up-regulated genes in dcl1 or ago1 mutantsshow higher expression levels than all other groups, confirm-ing our original result. This suggests that the experimentalmethod for identifying miRNA targets has not biased the geneexpression level of identified miRNA targets. The result alsosuggests that both direct and indirect targets of miRNAs maybe highly expressed. In conclusion, the observation of higherexpression in miRNA targets and lower expression in NMDtargets appear not to be method artifacts.
NMD and miRNA targets differ in expression variation
The above results show that validated miRNA and NMDtargets are expressed at different levels under normal condi-tions. Is their expression otherwise unusual? Previous studiesin animals have shown that one major role of miRNAs is toprevent expression fluctuations upon perturbation by couplingwith upstream transcriptional factors (Li et al., 2009; Osellaet al., 2011). In another word, miRNA-mediated regulationcan stabilize gene expression. Consistent with this, a study inanimals found that miRNA targets often show lower expres-sion variation among species (Cui et al., 2007). Might thesame be true in A. thaliana?
Since no single cell expression noise data is available for A.thaliana, we calculated the expression coefficient of variation(CV, standard deviation divided by mean) across A. thalianaaccessions as a proxy of gene expression noise. Although CVof expression and expression noise are two different biologicalparameters, they are highly correlated (Dong et al., 2011).Therefore, CV provides a good approach to infer expression
noise. To calculate CV for each gene, we collected the RNA-seq data of seedlings from 19 natural A. thaliana accessions(ecotypes) (Gan et al., 2011) and determined the CV as thestandard deviation divided by the mean of expression levelsacross these 19 accessions.
As shown in Fig. 6A, both ‘validated’ and ‘predicted’miRNA targets show a lower CV on average than ‘others’groups, while the NMD targets show the highest CV (Wil-coxon rank sum test: ‘validated’ vs. NMD, P ¼ 1.06 � 10�7;‘validated’ vs. ‘others’, P ¼ 6.39 � 10�5; ‘predicted’ vs.‘others’, P ¼ 5.7 � 10�5; ‘predicted’ vs. ‘NMD’,P ¼ 1.13 � 10�5; NMD vs. ‘others’, P ¼ 2.69 � 10�3).Consistent with the observation of higher gene expression CV,we also found that NMD targets more often show differentialexpression between at least one pair of A. thaliana accessions(Fig. 6B, one-side Fisher’s exact test: NMD vs. ‘validated’,P ¼ 0.0504; NMD vs. ‘predicted’, P ¼ 0.0002; NMD vs.others, P ¼ 1.67 � 10�4). There are no significant differencesbetween miRNA targets and the ‘others’ group (P > 0.1).Repeating the analyses by replacing the Kurihara target setwith the Rayson or Kalyna set shows the similar patterns,though the differences when using the Kalyna set are notsignificant due to small sample sizes (Fig. S9). These resultssuggest that miRNAs targets have more consistent expressionand the NMD targets tend to have variable expression levels.
These results, however, come with a strong caveat. There is,as regularly reported, a strong negative correlation betweenexpression CV and mean expression level (Spearman corre-lation, r ¼ �0.475, P < 2.2 � 10�16 in our dataset), sug-gesting that the CV difference among gene groups might bedue to the expression level differences. To control for this, weestimated a single lowess regression for all genes with CVpredicted by the mean expression level of the seedlings amongthe 19 accessions and took the residuals from this (Text S1).Comparing these residuals in a non-parametric framework, wefind that, although miRNA targets have absolutely lower
1.0
0.8
0.6
0.4
0.2
0.0
Expr
essi
on C
V
ValidatedmiRNAtargets
PredictedmiRNAtargets
NMDtargets
Others
Perc
enta
ge o
f gen
es (%
)
60
55
50
45
40
35
30
1775(690)
209(108)
17,873(6911)
ValidatedmiRNAtargets
PredictedmiRNAtargets
NMDtargets Others
270(118)
A B
Fig. 6. miRNA targets have more consistent gene expression among 19 A. thaliana accessions.
A: miRNA targets show the lowest gene expression variation measured by coefficient of variation (CV) (Wilcoxon rank sum test, P � 6.39 � 10�5), while NMD
targets have the largest variation (P � 2.69 � 10�3). B: more NMD targets show differential expression among at least one pair of A. thaliana ecotypes (one-side
Fisher’s exact test: NMD vs. ‘validated’, P ¼ 0.0504; NMD vs. ‘predicted’, P ¼ 0.0002; NMD vs. others, P ¼ 1.67 � 10�4). The total number of genes in each
group is shown above the bars and the numbers of differentially expressed genes are in parentheses.
505Z. Zhang et al. / Journal of Genetics and Genomics 40 (2013) 497e513
abundance-controlled CV and NMD targets have higherabundance-controlled CV than the genomic average(Fig. S10), only the comparison between the two largestgroups (predicted miRNA targets and ‘others’) is significant(P ¼ 1.80 � 10�6). These results indicate that gene expressionlevel is the major determinant of gene expression variation, butthat sample sizes may be too small to make definitive con-clusions as to whether expression level is the sole reason thatthe classes appear to be different.
Our results provide a slight cause for concern regardingconclusions derived in other taxa. A prior study in mammalsand Drosophila revealed that miRNA targets show signifi-cantly lower expression variation across species (Cui et al.,2007). Covariance with expression level was not howevercontrolled. Our concern is further supported by an observation
of higher expression levels of miRNA targets in animals (Hu,2009). Moreover, a recent study showed that miRNA targetingresults in higher expression variation among human pop-ulations and between humans and other primates (Lu andClark, 2012), making the role of miRNAs in repressingexpression variation yet more questionable. The coupling be-tween miRNA targeting and noise control at the genome-widescale should not be considered to be a safe generalization.
NMD targets are faster evolving
The above results suggest that miRNA-regulated genesmight be functionally important and highly expressed geneswhile NMD-regulated genes tend to be lowly expressed, hardto classify and commonly stress response genes. Might these
Perc
enta
ge o
f gen
es (%
)
273(258)
2044(1875)
218(194)
24,664(21,285)
A
ValidatedmiRNAtargets
PredictedmiRNAtargets
NMDtargets
Others
ValidatedmiRNAtargets
PredictedmiRNAtargets
NMDtargets
OthersValidatedmiRNAtargets
PredictedmiRNAtargets
NMDtargets
Others
ValidatedmiRNAtargets
PredictedmiRNAtargets
NMDtargets
Others
B
Cd S
d N
d N / d
S
D
100
95
90
85
80
0.6
0.5
0.4
0.3
0.2
0.15
0.10
0.05
0.00
0.2
0.0
0.4
0.6
1.0
0.8
0.1
0.0
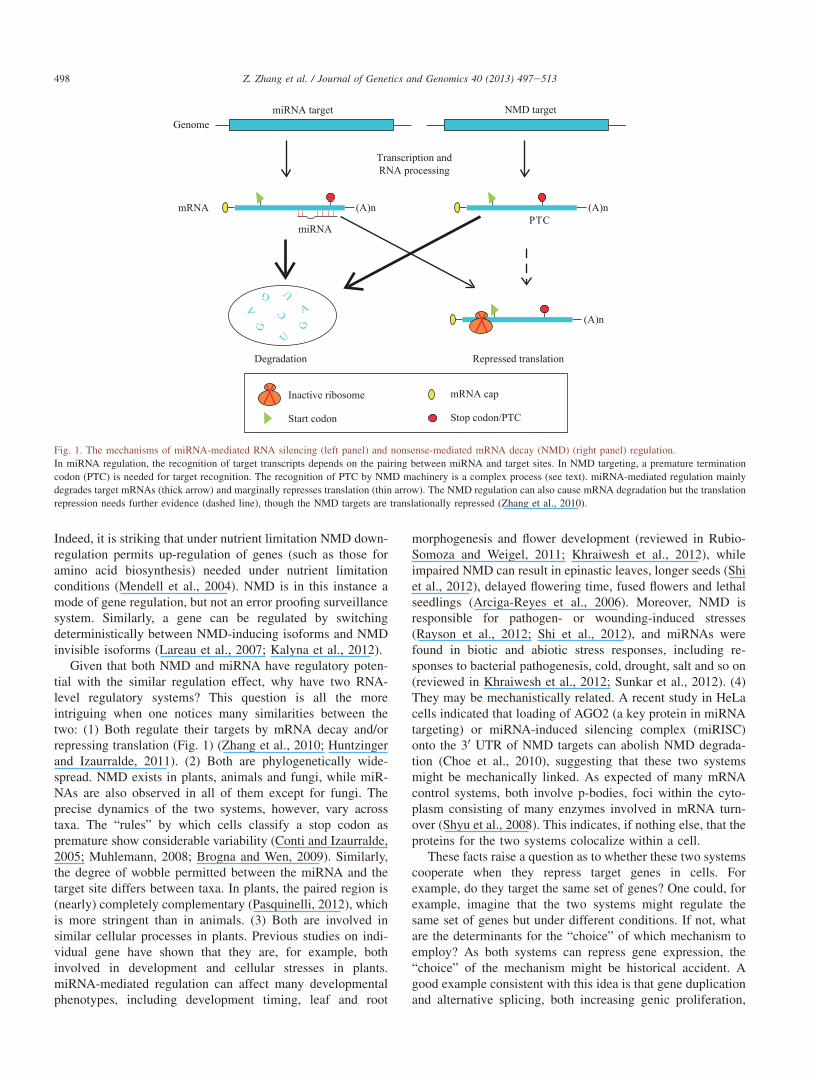
Fig. 7. miRNA targets are more conserved than NMD targets.
A: percentage of genes in A. thaliana with orthologs in A. lyrata is compared among gene groups. The validated miRNA targets have a significantly higher
proportion of genes with orthologs than NMD targets (one-side Fisher’s exact test, P ¼ 0.018). B‒D: comparisons of the synonymous substitution rates (dS), of the
nonsynonymous substitution rates (dN) and of their ratios (dN/dS) among gene groups. The differences of synonymous substitution rates are weak, but miRNA
targets show the lowest nonsynonymous substitution rates and dN/dS (Wilcoxon rank sum test, P < 0.002) while NMD targets show the opposite (P � 0.046).
506 Z. Zhang et al. / Journal of Genetics and Genomics 40 (2013) 497e513

differences also relate to differences in their rates of evolutionand their longer term maintenance in plant genomes?
To examine these issues, we assembled a set of orthologs ofA. thaliana in A. lyrata from the Ensembl database (Smedleyet al., 2009) and extracted accompanying evolutionary ratesestimates. Both predicted and validated miRNA targets have alower nonsynonymous substitution rate (dN) and a lower u(the ratio of nonsynonymous (dN) to synonymous substitutionrate (dS)) than the genome average (Wilcoxon rank sum test,P < 0.002) (Fig. 7BeD). NMD targets present the oppositeresult (P ¼ 0.046) indicating that they are faster evolving andunder less constraint. After controlling the gene expressionlevels with the lowess regression (as done for the aboveanalysis of expression CV, also see Text S1), NMD targets stillshow significantly higher dN (Wilcoxon rank sum test,P � 0.0169) and dN/dS (P � 0.0072) than any other group, butthe difference between miRNA targets and the group ‘others’disappears (P ¼ 1), suggesting that expression level is themajor determinant of their evolutionary rates.
We can, in addition, ask whether the two sets of genes aremore or less likely to be retained over evolutionary time.Using the orthology relationship from the Ensembl database,we found that the validated miRNA targets more often havedetectable orthologs in A. lyrata (Fig. 7A, one-side Fisher’sexact test, P ¼ 0.018) or in rice (Fig. S11A, P ¼ 0.02) thanNMD targets. The predicted miRNA targets show the sametrend but not significantly different from NMD targets asregards A. lyrata and rice ortholog detectability (P � 0.21).However, using the orthologous list between A. thaliana andrice from the InParanoid database (Ostlund et al., 2010)confirmed our results but gave more significant results(Fig. S11B, P ¼ 9.5 � 10�6 and 0.02, for both validated andpredicted miRNA targets vs. NMD targets, respectively).
The above evidence suggests that miRNA targets in A.thaliana are more likely to be evolutionarily preserved. Thismight, however, be a method artifact. Even if a fast evolvinggene has an ortholog in a different genome, it is less likely thatthis will be detected by sequence similarity search methods.To address this concern, we repeated the analysis by control-ling the evolutionary rate. For the set of genes with an orthologin A. lyrata, we can derive a rate of protein evolution.Assuming the evolutionary rate for a gene is relatively con-stant, we can ask whether the two groups of genes are equallylikely to have an ortholog detected in rice controlling for therate of sequence evolution. The results showed that, asexpected given the above bias, dN is a significant predictorfor ortholog detectability (Logistic regression,coefficient ¼ �9.5863, P < 2.2 � 10�16). For different genegroups, only the difference between validated miRNA targetsand the gene group ‘others’ shows any trend (P ¼ 0.07). Theseresults suggest that the apparent differential retention of NMDtargets and miRNA targets is potentially explained as anartifact of their different underlying rates of evolution.
We also reanalyzed the data by using the Rayson andKalyna NMD target sets. Using the Rayson NMD set gavesimilar results in terms of the difference between miRNAtargets and NMD targets, but there was not any difference
between NMD targets and the ‘others’ gene group (Fig. S12).Since it has been reported that NMD targets evolved faster inmammals (Zhang et al., 2009), this negative observation mightbe caused by a higher proportion of indirect NMD targetscompared to the Kurihara NMD set. Again, with the Kalynaset, we could not make any conclusion because only twovalidated miRNA targets and 12 predicted miRNA targetshave the associated data (data not shown).
DISCUSSION
It has been known that both miRNAs and NMD can represstarget gene expression by mRNA degradation and occasionallyby translation repression (Wen and Brogna, 2008; Zhang et al.,2010; Huntzinger and Izaurralde, 2011). It was, however,unknown whether these two systems could cooperate in thesame biological processes, and if not what are the character-istics of the two sorts of target genes. Our results support thelatter that genes targeted by miRNAs and NMD (and/ordownstream genes of NMD targets) show different properties.miRNA targets have diverse well-described functions(particularly development, metabolism and transcriptionregulation), are highly expressed, have low noise, evolveslowly and are phylogenetically conserved. NMD genes(direct targets or those affected downstream) resist attempt atfunctional classification but appear enriched for stress re-sponses. They are lowly and noisily expressed and evolverelatively fast. We find no evidence for cooperation betweenthe two systems in either the regulation of the same genes or inthe sorts of processes they are commonly involved in. In theanalyses, although the validated and predicted miRNA targetsdo not always give consistent results compared to the genomeaverage, they have the same directional differences relative tothe NMD targets. Meanwhile, we also tried to ask whether thesame conclusions could be reached if we constrained our an-alyses in the direct NMD targets. By using the Kalyna NMDgene set which represents the direct NMD targets, we obtainedthe consistent results with those by using the Kurihara/RaysonNMD sets. For instance, the interrogation of gene expressionabundance and expression variation showed the similar pat-terns, though less or not significant for the Kalyna set due tothe small sample sizes. On the other hand, since only 22 geneswere shared among the Kurihara and Rayson NMD gene setsand both sets gave similar results in most analyses, this sug-gests that NMD modulated genes often have similar proper-ties. These results together indicate that pathways targeted bymiRNAs and NMD are categorically different.
Our proposition that miRNA regulation and NMD regula-tion are employed for different sorts of genes and pathways ismore supported by further analysis. In yeast, the miRNApathway is absent. If NMD regulation and miRNA regulationare interconvertible, we might expect that the fungal orthologsof A. thaliana miRNA targets would be more often targeted byNMD than expected. Using the NMD targets in the buddingyeast Saccharomyces cerevisiae (S. cerevisiae) compiled in aprevious study (Zhang et al., 2010), we found that the yeastorthologs of A. thaliana miRNA targets are less likely to be
507Z. Zhang et al. / Journal of Genetics and Genomics 40 (2013) 497e513

targeted by NMD than the genome average, although notsignificantly so (Fig. S13, miRNA targets vs. ‘others’,P > 0.247). As perhaps expected, the yeast orthologs of A.thaliana NMD targets are more often under NMD regulation(24.4%) than are the validated miRNA targets (P ¼ 0.034).Using the Rayson NMD set, we got similar results (data notshown). In this case, the absence of miRNAs in fungi maysuggest that the roles played by miRNAs are not underconstraint or other unknown systems are responsible. Inter-estingly, siRNA is also absent in the budding yeast S. cer-evisiae, though it exists in the close species S. castellii andCandida albicans (Drinnenberg et al., 2009), suggesting thatsmall RNA based regulation is possibly less constrained inS. cerevisiae.
While we can be confident that miRNA-regulated genesand those modulated owing to NMD are different sorts ofgenes, can we relate the mode of regulation to their functions?miRNA-mediated regulation applies to genes normally highlyexpressed. The repression by miRNAs is usually weak (Baeket al., 2008; Selbach et al., 2008) and thus it may be amechanism for gently correcting overly high expression levelsrather than necessarily causing rapid and dramatic reductionsin dosage. miRNAs are perhaps thus more suitable for fine-tuning the expression of genes in development where fluctu-ations of gene expression may be especially damaging.Whether this explains the sorts of functional classes enrichedfor miRNA-regulated genes is unclear. However, as changes intranscription factor levels can have profound knock-on effects,we might conjecture that preventing these from going too highor pulling their levels down in a graded fashion is optimal.
If a need for fine control of dosage is the issue, we mightexpect that miRNA targets are more often involved in proteincomplexes as such complex related proteins are known to besensitive to dosage (Papp et al., 2003). Using the curatedprotein-interaction dataset from the TAIR database (Lameschet al., 2012), we found that miRNA targets more often haveprotein interacting partners than NMD targets (Fig. S14,Fisher’s exact test, P < 0.0233) and the gene group ‘others’(P < 0.0055). There is no difference between NMD targetsand the ‘others’ group (P ¼ 0.416). However, since the morehighly expressed genes have a higher chance of being detectedin protein-interaction experiments, this observation may bebiased by different gene expression levels among gene groups.To address this, we performed a logistic regression analysis,adding the expression level as a covariate. The results showedthat there is still a significant difference among gene groups(analysis of deviance, P ¼ 0.017). Further comparisons amonggene groups with the Wald test showed that miRNA targetsstill have a significant higher probability of being involved inprotein interactions than any other group of genes (P < 0.045,except for the comparison between validated miRNA targetsand the genome average). These results accord with the notionthat miRNA targets require fine regulation.
The interpretation of the genes subject to NMD is lesstransparent. Based on previous studies, NMD targets might be(1) spurious functionless transcripts incorrectly annotated asprotein-coding (e.g., transcripts from intergenic sequence,
transposons (Mendell et al., 2004)), (2) accidental functionlesssplice forms of otherwise functional genes (Zhang et al., 2009)or (3) functional splice forms regulated by presence/absence ofNMD (Cuccurese et al., 2005). While there is no reason thatall models might not apply, we can ask if any one makes aprima facie better explanation of the facts.
While the junk transcription model (model 1) might lookattractive so much, as it would predict the lack of annotation, itis strongly contradicted by the finding that, although the pro-teins evolve relatively fast, dN/dS remains only just above thegenomic mean (Fig. 7) and is considerably lower than thatexpected if the translated products are neutrally evolving (dN/dS ¼ 1). These genes are under purifying selection and so arenot simply the result of spurious transcription. If most NMDtargets are really downstream of the actual target, this wouldsuggest that the real target has the ability to regulate func-tionally important genes, making the junk transcription modeldubious.
Another possibility is that a good proportion of NMD genesare junk transcripts but some are functional. However,amongst the NMD targets there are only two genes with dN/dS �1. To address this more robustly, we can ask whether thereare two discrete populations of NMD genes, possibly thoseunder strong purifying selection and those neutrally evolving.We found no evidence that the distribution of dN/dS values isnot significantly non-unimodal (Hartigan’s dip test,P ¼ 0.991). However, we cannot eliminate the possibility thatthe 11% of NMD targets without A. lyrata orthologs are notsimply junk transcription.
The possibility (model 2) that NMD targets might beaccidental functionless alternative transcripts of otherwisefunctional genes (that wouldn’t otherwise be subject to NMD)is a more viable model. Supporting this idea, 77.9% of alter-natively spliced transcripts in A. thaliana introduced in-framePTCs which may be subject to NMD degradation (Filichkinet al., 2010). If NMD is suppressed under stress conditions,the accidental splicing forms could appear to be up-regulated,so any connection to stress might be explained.
Such a model could predict purifying selection on thefunctional transcripts and hence on the gene as a whole. Un-fortunately, the methods to define NMD targets don’t permitdefinition of the splicing form that is caught by NMD, so wecannot test whether the evolutionary rates of the PTC-causingexons are consistent with neutrality, as this model wouldpredict. The finding that for NMD targets with just one knownsplice form in the TAIR database, the rate of evolution is notdifferent from those NMD targets with more splice forms(Wilcoxon rank sum test, P ¼ 0.5832), however, arguesagainst this model. Naturally, the single splice form genes maybe missing annotation of alternative splicing forms, and thusthis evidence is not definitive. Similarly, we cannot be confi-dent that these are the direct NMD targets. The evidence fromexpression levels also argues against this model. If the NMDgenes all have two or more splicing forms and one splicingform is rare, erroneous and trapped by NMD but the others arefunctional, it is far from clear why the functional ones are notexpressed at normal levels. It is similarly unclear why these
508 Z. Zhang et al. / Journal of Genetics and Genomics 40 (2013) 497e513

genes might be enriched for genes without annotation if theyare normal functional genes with spurious splice forms.
If the NMD trapped splicing forms are functional and underregulation (model 3), what might we expect? At least some ofthe NMD targeted genes might reflect a rapid response force.When conditions change such that NMD is inactivated, genesneeded under the sorts of emergency conditions drastic enoughto force a shut down of NMD need to be up-regulated rapidly.The persistent transcription of the relevant mRNAs under non-emergency conditions ensures up-regulation without the lagimposed by a feedback circuit to up-regulate particular tran-scription factors for emergency responses. It need not be atime lag that is the driving force. To enable a cheap/fastresponse, the transcripts are always made (transcription ischeap) so immediately available when NMD is shut down.Consistent with this idea, some NMD target genes, e.g., CCA1and ATSRP30, can change both the gene expression level andthe ratio of productive to PTC-containing splicing isoforms torespond the abiotic stresses quickly (Filichkin et al., 2010).Moreover, as the recognition of NMD targets mostly dependson only the fixed sequence features in targets, the change ofefficiency of the NMD machinery will affect all the targets.NMD is shut down under starvation (Mendell et al., 2004), andthus manufacture of new transcription factors to up-regulatethe “fire-fighters” is more costly than just making the “fire-fighters”.
This model can readily explain why the NMD target pro-teins are under purifying selection but the selection pressure isweaker than those experienced by other proteins expressed at“similar” levels. In this case, “similar” means similar at theRNA level (as this was the covariate controlled) not the proteinlevel. We expect the number of proteins produced per tran-script of NMD targeted transcripts to be lower than that forgenes not regulated in this manner (Zhang et al., 2010), andhence the covariate control suggests the NMD genes evolve alittle faster than “expected”. This model makes a robust caseof considering the relationship with stress response (and jas-monic acid response) and why the genes are more often up-regulated but not commonly down-regulated under stress.This model is also consistent with phylogenetic preservationof NMD targets, especially since any converse signal appearsto be an artifact of differences in evolutionary rate. That NMDcan suppress targets with a very high fold change (Zetouneet al., 2008) is consistent with this emergency responsemodel. Thus, most findings appear to be consistent with thisframework, at least in Arabidopsis. If true, the lack of anno-tation of these genes suggests that we still poorly understandthe emergency conditions plants experience in the wild.
In conclusion, the miRNA- and NMD-regulated genes arelargely separate subsets of genes in the genome under differentregulation modes, by which the expression of miRNA targetsare under fine-tuning while the NMD targets are generallysuppressed when not needed in normal conditions and arerelieved when high expression of these genes are necessary.These different regulation modes are consistent with theproperties of miRNAs and NMD, and closely related to thefunctions of regulated genes. We conclude that miRNA-
mediated RNA silencing and NMD regulate two sets ofgenes needing different regulation requirements. Our studyalso implies that other RNA silencing systems may be optimalfor regulating subsets of genes with specific functions.
MATERIALS AND METHODS
Data collection
Protein-coding genes in A. thalianaTo obtain the set of protein-coding genes in A. thaliana, we
downloaded the gene annotation file at ftp://ftp.arabidopsis.org/home/tair/Genes/TAIR10_genome_release/TAIR10_gff3/TAIR10_GFF3_genes.gff in August, 2011. The file was parsedand filtered with tools under Linux to keep only the nuclearprotein-coding genes (27,201 genes in total).
miRNA targetsTo obtain the validated miRNA targets for A. thaliana, we
extracted the list of target genes from the following studies: (1)validated targets in Tables S4 and S5 of the reference (Germanet al., 2008), (2) validated miRNA targets from ArabidopsisMPSS Plus database http://mpss.udel.edu/at/mpss_index.php,(3) validated targets in Table S8 of the study (Alves et al.,2009), (4) the miRNA targets from the supplemental DataSets 5 and 6 of a previous study (Ma et al., 2010) based ondetecting miRNA-mediated cleavage sites (Ma et al., 2010).After we put all the targets together, we removed the targetswhose associated miRNAs are not in miRBase (release 17)(Griffiths-Jones et al., 2008). The compiled list of miRNAtargets are in Dataset S1.
To predict miRNA targets, we downloaded the maturemiRNA sequences from miRBase (release 17) and extractedthe 266 mature miRNA sequences for A. thaliana. Then, thetarget sites in all protein-coding transcripts were identifiedwith experimental features summarized in the study (Schwabet al., 2005). Briefly, a target site should meet the followingcriteria: (1) no more than three mismatches (excluding posi-tion 1 of the miRNA) and no gaps in the pairing betweenmature miRNA and target transcript; (2) in terms of miRNAsequence, at most one mismatch in positions 2 to 12; (3) nomismatch at positions 10 and 11; and (4) at most twoconsecutive mismatches after position 12. The written pro-gram is available upon request. The cDNA sequences(including UTRs and coding regions) of A. thaliana geneswere downloaded from TAIR10 database (http://www.arabidopsis.org/).
NMD targetsTheNMD targetswere compiled from three previous studies:
(1) 238 genes up-regulated by � 1.8 fold in the 15-day-oldseedlings of NMD mutants were extracted from the Tables S1and S2 in a large-scale study (Kurihara et al., 2009), where theArabidopsis tiling arrays were used for measuring the geneexpression levels and Mann-Whitney U test (FDR ¼ 0.05) wasemployed to detect the significantly up-regulated genes in NMDmutants; (2) 206 genes commonly up-regulated by� 1.5 fold in
509Z. Zhang et al. / Journal of Genetics and Genomics 40 (2013) 497e513

the 17-day-old seedings of upf1, upf3 and smg7 mutants andWelch’s t-test was used for checking the expression difference(P < 0.05) (Rayson et al., 2012); (3) 38 genes which increasedthe ratios of alternative splicing isoforms with NMD-inducingfeatures to other isoforms without those features when NMDwas impaired by using the high-throughput RT-PCR (Kalynaet al., 2012); in that study totally 269 genes (288 primer pairs)were investigated.
Gene expression analysis
Gene expression level comparison in each tissueTo compare gene expressions among miRNA targets, NMD
targets and the remaining genes, we downloaded the processedexpression data from http://www.ebi.ac.uk/arrayexpress/experiments/E-TABM-17, which contain 79 tissue sampleswith 3 biological replicates for each. We excluded mutant andtreated samples in our analyses and obtained 63 wild-typesamples. The expression values among sample replicateswere averaged before further analyses. To identify the samplesfrom the same tissue types, we hierarchically clustered all the63 samples using the Pearson correlation and average clus-tering in R (R Development Core Team, 2009). We checkedthe sample tissue types in the clustering graph and grouped thesamples under a sub-cluster where all the samples have thesame tissue type into one group to represent that tissue. Intotal, we obtained nine tissue types. To detect whether a genewas expressed in a sample, we used the mas5calls methodimplemented in R package ‘affy’ (Gautier et al., 2004) toderive absence/presence calls. A gene was considered to beexpressed in that sample if at least two replicates of three gavethe ‘presence’ calls. To consider a gene to be expressed in atissue type, we required that at least 50% of samples in thattissue type gave the ‘presence’ call for that gene. We alsochanged the cutoffs to 30% and 70% in the latter analysis andour conclusions were not affected.
For comparing gene expression levels during plant devel-opment, we extracted the samples representing proper devel-opment stages for each tissue type from the above dataset (seeTable S4 for sample names). Then, we divided the samplesinto the group ‘Late’ or ‘Early’ based on their relative ages.The genes up-regulated in either group were identified with Rpackage RankProd (Hong et al., 2006) with the FDRcutoff < 0.01.
Calculation of the expression variation among 19A. thaliana accessions (ecotypes)
To calculate expression variation, we downloaded theexpression values of 19 natural A. thaliana accessions fromhttp://mus.well.ox.ac.uk/19genomes/. The data was generatedby RNA sequencing of seedlings at the age when the fourth trueleaf appeared (Gan et al., 2011). Each sample has two replicates.We averaged the values among sample replicates before furtheranalyses. To exclude the potential noise in gene expressionmeasurement and control the sampling variance caused by lowlyexpressed genes, we considered only the genes which wereexpressed in all the 19 accessions based on the expression
significance tests provided in the dataset.We used the coefficientof variation (CV), standard deviation to measure the expressionvariation for each gene among 19 A. thaliana accessions.
The differentially expressed genes among 19 A. thalianaecotypes were downloaded from http://mus.well.ox.ac.uk/19genomes/gene_expression/expression_summary.csv. Weagain excluded genes which were not expressed in anyaccession. The differentially expressed genes between at leastone pair of accessions are determined by DESeq in the originalstudy (Gan et al., 2011). We used corrected P-value < 0.01 todefine the differentially expressed genes.
Detection of stress-responsive genesTo detect the genes responsive to stresses, we download the
tiling array .cel files from ftp://ftp.tuebingen.mpg.de/fml/zeller/tiling_arrays/stress_data/tiling_array_data/ (Zelleret al., 2009) and customized cdf file from http://www.weigelworld.org/resources/microarray/at-tax/resources/athat1rtair10.cdf.gz/view. The study gave the following treat-ments to the seedlings: 200 mmol/L NaCl (salt stress),300 mmol/L mannitol (osmotic stress), 100 mmol/L abscisicacid (ABA), liquid MS medium at 8�C (cold stress) and at30�C (heat). Then, the samples were collected at 1 h and12 h after the treatment. We extracted the expression values byusing the RMA method implemented in ‘affy’ package(Gautier et al., 2004). The expression-changing genes uponstresses at 1 h and 12 h compared to the mock control weredetected by R package RankProd (Hong et al., 2006). Weconsidered a gene as stress-responsive if it is up-regulated ordown-regulated in any treated sample.
Genes up-regulated in ago1 and dcl1 mutantsTo obtain the genes affected bymiRNAs with microarrays, we
collected the up-regulated genes in ago1 and dcl1 Arabidopsismutants from a previous study (Ronemus et al., 2006). In thisstudy, the genes up-regulated in mutants were identified withAffymetrix AtGenome1 microarrays and stored in Table S4.When comparinggene expression levels among genegroups, onlygenes with probes in the AtGenome1 microarray were included.
Reanalysis of the upf1 and upf3 mutant microarray dataTo see whether the up-regulated change fold for a gene is
related to its baseline gene expression level, we downloadedthe tiling array .cel files from GEO under accessionGSE12101. The samples hybridized on Affymetrix Arabi-dopsis Tiling 1.0R Array were only used. These samplesinclude three replicates for each wide-type strain, upf1 mutantand upf3 mutant. The gene expression values were extractedwith the RMA method using the custom CDF file in the stressresponse analysis above. Then, the genes up-regulated in upf1and upf3 mutants compared to the wild-type were determinedby the R package RankProd (Hong et al., 2006).
Orthologs and substitution rates
To see whether a gene in A. thaliana has orthologs in A.lyrata or rice (Oryza sativa), we downloaded the orthology
510 Z. Zhang et al. / Journal of Genetics and Genomics 40 (2013) 497e513

relationship from the Ensembl database (version 56) withBioMart (Smedley et al., 2009). We also downloaded theorthology relationships between A. thaliana and rice from theInParanoid 7 database (Ostlund et al., 2010). During the an-alyses, the genes not included in the original input dataset forhomology search were excluded.
To compare the synonymous and nonsynonymous substi-tution rates among gene groups, we extracted these values forthe ortholog pairs between A. thaliana and A. lyrata from theEnsembl (version 56) through BioMart. These evolutionaryrates were calculated with codeml in the PAML package(Yang, 2007).
ACKNOWLEDGEMENTS
This work is partially supported by the National BasicResearch Program of China (No. 2011CB510100 to X.K.), andthe National Natural Science Foundation of China (No.81030015 to X.K.). First of all, we express our gratitude toProfessor Masatoshi Nei for providing the great atmosphereto Z.Z. to nourish this study. We give our heartfelt thanks toLaurence D Hurst for the help to improve the manuscript. Wewould like to thank Professor Claude dePamphilis’s group forcomments on the study, Dr. Zhao Su for help in choosing geneexpression datasets, Lisa Smith in Professor DetlefWeigel’s labat Max Planck Institute and Lei Wang in Huazhong Agricul-tural University for sharing the gene expression data. We thankDr. Sayaka Miura for discussing miRNA regulation in plants.
SUPPLEMENTARY DATA
Table S1. The overlap of NMD targets and miRNA targets.Table S2. The proportion of annotated genes in Gene
Ontology.Table S3. Functional comparison of microRNA and NMD
targets (Kurihara) with Plant Ontology (http://www.plantontology.org).
Table S4. The samples used in the study of differentiatedgenes in A. thaliana development.
Fig. S1. The overlaps among three NMD gene sets.Fig. S2. Comparison of transcriptional factor enrichment
between NMD and miRNA targets by using the Rayson NMDtarget set.
Fig. S3. Validated miRNA targets and NMD targets areinvolved in the development of different tissues.
Fig. S4. The Rayson set of NMD targets show significantenrichment in both up-regulated and down-regulated genesupon stresses.
Fig. S5. miRNA targets show higher expression levels inalmost all tissue samples than NMD targets (the Kurihara set).
Fig. S6. Comparison of gene expression levels after con-trolling for the confounding factors.
Fig. S7. Comparison of gene expression levels among genegroups by using the Rayson or Kalyna NMD target sets.
Fig. S8. miRNA targets have longer RNA half-lives thanNMD targets on average.
Fig. S9. NMD targets show higher expression variation(CV) among 19 A. thaliana accessions.
Fig. S10. Comparison of the expression variation (CV)among 19 A. thaliana accessions.
Fig. S11. Evaluation of the ortholog detectability using theorthology relationship between A. thaliana and rice.
Fig. S12. Comparison of conservation among the genegroups.
Fig. S13. Comparison of the proportion of NMD targets inthe budding yeast orthologs among the A. thaliana four genegroups.
Fig. S14. The miRNA targets interact with other proteinsmore often than other groups of genes.
Text S1. Supplementary methods.Dataset S1. Classification of genes in A. thaliana.Dataset S2. All the results of the Gene Ontology analyses.Supplementary data related to this article can be found at
http://dx.doi.org/10.1016/j.jgg.2013.09.002.
REFERENCES
Addo-Quaye, C., Eshoo, T.W., Bartel, D.P., Axtell, M.J., 2008. Endogenous
siRNA and miRNA targets identified by sequencing of the Arabidopsis
degradome. Curr. Biol. 18, 758e762.
Al-Shahrour, F., Diaz-Uriarte, R., Dopazo, J., 2004. FatiGO: a web tool for
finding significant associations of Gene Ontology terms with groups of
genes. Bioinformatics 20, 578e580.
Alves Jr., L., Niemeier, S., Hauenschild, A., Rehmsmeier, M., Merkle, T.,
2009. Comprehensive prediction of novel microRNA targets in Arabi-
dopsis thaliana. Nucleic Acids Res. 37, 4010e4021.Arciga-Reyes, L., Wootton, L., Kieffer, M., Davies, B., 2006. UPF1 is required
for nonsense-mediated mRNA decay (NMD) and RNAi in Arabidopsis.
Plant J. 47, 480e489.
Avraham, S., Tung, C.W., Ilic, K., Jaiswal, P., Kellogg, E.A., McCouch, S.,
Pujar, A., Reiser, L., Rhee, S.Y., Sachs, M.M., Schaeffer, M., Stein, L.,
Stevens, P., Vincent, L., Zapata, F., Ware, D., 2008. The Plant Ontology
Database: a community resource for plant structure and developmental
stages controlled vocabulary and annotations. Nucleic Acids Res. 36,
D449eD454.
Baek, D., Villen, J., Shin, C., Camargo, F.D., Gygi, S.P., Bartel, D.P., 2008.
The impact of microRNAs on protein output. Nature 455, 64e71.
Bartel, D.P., 2004. MicroRNAs: genomics, biogenesis, mechanism, and
function. Cell 116, 281e297.
Benjamini, Y., Hochberg, Y., 1995. Controlling the False Discovery Rate e a
practical and powerful approach to multiple testing. J. R. Statist. Soc. B.
57, 289e300.
Brogna, S., Wen, J., 2009. Nonsense-mediated mRNA decay (NMD) mecha-
nisms. Nat. Struct. Mol. Biol. 16, 107e113.
Chang, Y.F., Imam, J.S., Wilkinson, M.E., 2007. The nonsense-mediated decay
RNA surveillance pathway. Annu. Rev. Biochem. 76, 51e74.
Chen, X.M., 2005. MicroRNA biogenesis and function in plants. FEBS Lett.
579, 5923e5931.Chi, S.W., Zang, J.B., Mele, A., Darnell, R.B., 2009. Argonaute HITS-CLIP
decodes microRNA-mRNA interaction maps. Nature 460, 479e486.
Choe, J., Cho, H., Lee, H.C., Kim,Y.K., 2010.microRNA/Argonaute 2 regulates
nonsense-mediated messenger RNA decay. EMBO Rep. 11, 380e386.Conti, E., Izaurralde, E., 2005. Nonsense-mediated mRNA decay: molecular
insights and mechanistic variations across species. Curr. Opin. Cell Biol.
17, 316e325.
Cuccurese, M., Russo, G., Russo, A., Pietropaolo, C., 2005. Alternative
splicing and nonsense-mediated mRNA decay regulate mammalian ribo-
somal gene expression. Nucleic Acids Res. 33, 5965e5977.
Cui, Q., Yu, Z., Purisima, E.O., Wang, E., 2007. MicroRNA regulation and
interspecific variation of gene expression. Trends Genet. 23, 372e375.
511Z. Zhang et al. / Journal of Genetics and Genomics 40 (2013) 497e513

Dong, D., Shao, X., Deng, N., Zhang, Z., 2011. Gene expression variations are
predictive for stochastic noise. Nucleic Acids Res. 39, 403e413.
Drinnenberg, I.A., Weinberg, D.E., Xie, K.T., Mower, J.P., Wolfe, K.H.,
Fink, G.R., Bartel, D.P., 2009. RNAi in budding yeast. Science 326,
544e550.Filichkin, S.A., Priest, H.D., Givan, S.A., Shen, R.K., Bryant, D.W., Fox, S.E.,
Wong, W.K., Mockler, T.C., 2010. Genome-wide mapping of alternative
splicing in Arabidopsis thaliana. Genome Res. 20, 45e58.Gan, X., Stegle, O., Behr, J., Steffen, J.G., Drewe, P., Hildebrand, K.L.,
Lyngsoe, R., Schultheiss, S.J., Osborne, E.J., Sreedharan, V.T., Kahles, A.,
Bohnert, R., Jean, G., Derwent, P., Kersey, P., Belfield, E.J., Harberd, N.P.,
Kemen, E., Toomajian, C., Kover, P.X., Clark, R.M., Ratsch, G., Mott, R.,
2011. Multiple reference genomes and transcriptomes for Arabidopsis
thaliana. Nature 477, 419e423.
Gautier, L., Cope, L., Bolstad, B.M., Irizarry, R.A., 2004. affyeanalysis of
Affymetrix GeneChip data at the probe level. Bioinformatics 20, 307e315.German, M.A., Pillay, M., Jeong, D.H., Hetawal, A., Luo, S., Janardhanan, P.,
Kannan, V., Rymarquis, L.A., Nobuta, K., German, R., De Paoli, E.,
Lu, C., Schroth, G., Meyers, B.C., Green, P.J., 2008. Global identification
of microRNA-target RNA pairs by parallel analysis of RNA ends. Nat.
Biotechnol. 26, 941e946.
Griffiths-Jones, S., Saini, H.K., van Dongen, S., Enright, A.J., 2008. miRBase:
tools for microRNA genomics. Nucleic Acids Res. 36, D154eD158.Guo, H., Ingolia, N.T., Weissman, J.S., Bartel, D.P., 2010. Mammalian
microRNAs predominantly act to decrease target mRNA levels. Nature
466, 835e840.
He, F., Li, X., Spatrick, P., Casillo, R., Dong, S., Jacobson, A., 2003. Genome-
wide analysis of mRNAs regulated by the nonsense-mediated and 50 to 30
mRNA decay pathways in yeast. Mol. Cell 12, 1439e1452.
Hendrickson, D.G., Hogan, D.J., McCullough, H.L., Myers, J.W.,
Herschlag, D., Ferrell, J.E., Brown, P.O., 2009. Concordant regulation of
translation and mRNA abundance for hundreds of targets of a human
microRNA. PLoS Biol. 7, e1000238.
Hong, F., Breitling, R., McEntee, C.W., Wittner, B.S., Nemhauser, J.L.,
Chory, J., 2006. RankProd: a bioconductor package for detecting differ-
entially expressed genes in meta-analysis. Bioinformatics 22, 2825e2827.
Hu, Z., 2009. Insight into microRNA regulation by analyzing the character-
istics of their targets in humans. BMC Genomics 10, 594.
Huntzinger, E., Izaurralde, E., 2011. Gene silencing by microRNAs: contri-
butions of translational repression and mRNA decay. Nat. Rev. Genet. 12,
99e110.
Kalyna, M., Simpson, C.G., Syed, N.H., Lewandowska, D., Marquez, Y.,
Kusenda, B., Marshall, J., Fuller, J., Cardle, L., McNicol, J., Dinh, H.Q.,
Barta, A., Brown, J.W., 2012. Alternative splicing and nonsense-mediated
decay modulate expression of important regulatory genes in Arabidopsis.
Nucleic Acids Res. 40, 2454e2469.
Kertesz, S., Kerenyi, Z., Merai, Z., Bartos, I., Palfy, T., Barta, E., Silhavy, D.,
2006. Both introns and long 30-UTRs operate as cis-acting elements to
trigger nonsense-mediated decay in plants. Nucleic Acids Res. 34,
6147e6157.
Khraiwesh, B., Zhu, J.K., Zhu, J., 2012. Role of miRNAs and siRNAs in biotic
and abiotic stress responses of plants. Biochim. Biophys. Acta. 1819,
137e148.Kopelman, N.M., Lancet, D., Yanai, I., 2005. Alternative splicing and gene
duplication are inversely correlated evolutionary mechanisms. Nat. Genet.
37, 588e589.Kurihara, Y., Matsui, A., Hanada, K., Kawashima, M., Ishida, J.,
Morosawa, T., Tanaka, M., Kaminuma, E., Mochizuki, Y., Matsushima, A.,
Toyoda, T., Shinozaki, K., Seki, M., 2009. Genome-wide suppression of
aberrant mRNA-like noncoding RNAs by NMD in Arabidopsis. Proc. Natl.
Acad. Sci. USA 106, 2453e2458.
Lamesch, P., Berardini, T.Z., Li, D., Swarbreck, D., Wilks, C., Sasidharan, R.,
Muller, R., Dreher, K., Alexander, D.L., Garcia-Hernandez, M.,
Karthikeyan, A.S., Lee, C.H., Nelson, W.D., Ploetz, L., Singh, S.,
Wensel, A., Huala, E., 2012. The Arabidopsis Information Resource
(TAIR): improved gene annotation and new tools. Nucleic Acids Res. 40,
D1202eD1210.
Lareau, L.F., Brooks, A.N., Soergel, D.A., Meng, Q., Brenner, S.E., 2007. The
coupling of alternative splicing and nonsense-mediated mRNA decay. Adv.
Exp. Med. Biol. 623, 190e211.
Li, X., Cassidy, J.J., Reinke, C.A., Fischboeck, S., Carthew, R.W., 2009. A
microRNA imparts robustness against environmental fluctuation during
development. Cell 137, 273e282.
Losson, R., Lacroute, F., 1979. Interference of nonsense mutations with
eukaryotic messenger RNA stability. Proc. Natl. Acad. Sci. USA 76,
5134e5137.
Lu, J., Clark, A.G., 2012. Impact of microRNA regulation on variation in
human gene expression. Genome Res. 22, 1243e1254.
Ma, Z., Coruh, C., Axtell, M.J., 2010. Arabidopsis lyrata small RNAs: tran-
sient MIRNA and small interfering RNA loci within the Arabidopsis
genus. Plant Cell 22, 1090e1103.
Mendell, J.T., Sharifi, N.A., Meyers, J.L., Martinez-Murillo, F., Dietz, H.C.,
2004. Nonsense surveillance regulates expression of diverse classes of
mammalian transcripts and mutes genomic noise. Nat. Genet. 36,
1073e1078.
Min, H., Yoon, S., 2010. Got target? Computational methods for microRNA
target prediction and their extension. Exp. Mol. Med. 42, 233e244.
Muhlemann, O., 2008. Recognition of nonsense mRNA: towards a unified
model. Biochem. Soc. Trans. 36, 497e501.
Osella, M., Bosia, C., Cora, D., Caselle, M., 2011. The role of incoherent
microRNA-mediated feedforward loops in noise buffering. PLoS Comput.
Biol. 7, e1001101.
Ostlund, G., Schmitt, T., Forslund, K., Kostler, T., Messina, D.N., Roopra, S.,
Frings, O., Sonnhammer, E.L., 2010. InParanoid 7: new algorithms and tools
for eukaryotic orthology analysis. Nucleic Acids Res. 38, D196eD203.
Papp, B., Pal, C., Hurst, L.D., 2003. Dosage sensitivity and the evolution of
gene families in yeast. Nature 424, 194e197.Pasquinelli, A.E., 2012. MicroRNAs and their targets: recognition, regula-
tion and an emerging reciprocal relationship. Nat. Rev. Genet. 13,
271e282.
R Development Core Team, 2009. R: A Language and Environment for Sta-
tistical Computing. R Foundation for Statistical Computing, Vienna,
Austria.
Rayson, S., Arciga-Reyes, L., Wootton, L., De Torres Zabala, M., Truman, W.,
Graham, N., Grant, M., Davies, B., 2012. A role for nonsense-mediated
mRNA decay in plants: pathogen responses are induced in Arabidopsis
thaliana NMD mutants. PLoS ONE 7, e31917.
Rehwinkel, J., Raes, J., Izaurralde, E., 2006. Nonsense-mediated mRNA
decay: target genes and functional diversification of effectors. Trends
Biochem. Sci. 31, 639e646.
Ronemus, M., Vaughn, M.W., Martienssen, R.A., 2006. MicroRNA-targeted
and small interfering RNA-mediated mRNA degradation is regulated by
argonaute, dicer, and RNA-dependent RNA polymerase in Arabidopsis.
Plant Cell 18, 1559e1574.
Rubio-Somoza, I., Weigel, D., 2011. MicroRNA networks and developmental
plasticity in plants. Trends Plant Sci. 16, 258e264.Schmid, M., Davison, T.S., Henz, S.R., Pape, U.J., Demar, M., Vingron, M.,
Scholkopf, B., Weigel, D., Lohmann, J.U., 2005. A gene expression map of
Arabidopsis thaliana development. Nat. Genet. 37, 501e506.
Schwab, R., Palatnik, J.F., Riester, M., Schommer, C., Schmid, M., Weigel, D.,
2005. Specific effects of microRNAs on the plant transcriptome. Dev. Cell
8, 517e527.
Selbach, M., Schwanhausser, B., Thierfelder, N., Fang, Z., Khanin, R.,
Rajewsky, N., 2008. Widespread changes in protein synthesis induced by
microRNAs. Nature 455, 58e63.
Shi, C., Baldwin, I.T., Wu, J., 2012. Arabidopsis plants having defects in
nonsense-mediated mRNA decay factors UPF1, UPF2, and UPF3 show
photoperiod-dependent phenotypes in development and stress responses. J.
Integr. Plant Biol. 54, 99e114.
Shyu, A.B., Wilkinson, M.F., van Hoof, A., 2008. Messenger RNA regulation:
to translate or to degrade. EMBO J. 27, 471e481.Smedley, D., Haider, S., Ballester, B., Holland, R., London, D., Thorisson, G.,
Kasprzyk, A., 2009. BioMartebiological queries made easy. BMC Ge-
nomics 10, 22.
512 Z. Zhang et al. / Journal of Genetics and Genomics 40 (2013) 497e513
Sunkar, R., Li, Y.F., Jagadeeswaran, G., 2012. Functions of microRNAs in
plant stress responses. Trends Plant Sci. 17, 196e203.
Wen, J., Brogna, S., 2008. Nonsense-mediated mRNA decay. Biochem. Soc.
Trans. 36, 514e516.
Willmann, M.R., Mehalick, A.J., Packer, R.L., Jenik, P.D., 2011. MicroRNAs
regulate the timing of embryo maturation in Arabidopsis. Plant Physiol.
155, 1871e1884.
Yamaguchi, A., Wu, M.F., Yang, L., Wu, G., Poethig, R.S., Wagner, D., 2009.
The microRNA-regulated SBP-Box transcription factor SPL3 is a direct
upstream activator of LEAFY, FRUITFULL, and APETALA1. Dev. Cell
17, 268e278.
Yang, Z., 2007. PAML 4: phylogenetic analysis by maximum likelihood. Mol.
Biol. Evol. 24, 1586e1591.
Zeller, G., Henz, S.R., Widmer, C.K., Sachsenberg, T., Ratsch, G., Weigel, D.,
Laubinger, S., 2009. Stress-induced changes in the Arabidopsis thaliana
transcriptome analyzed using whole-genome tiling arrays. Plant J. 58,
1068e1082.
Zetoune, A.B., Fontaniere, S., Magnin, D., Anczukow, O., Buisson, M.,
Zhang, C.X., Mazoyer, S., 2008. Comparison of nonsense-mediated
mRNA decay efficiency in various murine tissues. BMC Genet. 9, 83.
Zhang, H., Jin, J., Tang, L., Zhao, Y., Gu, X., Gao, G., Luo, J., 2011. Plant
TFDB 2.0: update and improvement of the comprehensive plant tran-
scription factor database. Nucleic Acids Res. 39, D1114eD1117.Zhang, Z., Xin, D., Wang, P., Zhou, L., Hu, L., Kong, X., Hurst, L.D., 2009.
Noisy splicing, more than expression regulation, explains why some exons
are subject to nonsense-mediated mRNA decay. BMC Biol. 7, 23.
Zhang, Z., Zhou, L., Hu, L., Zhu, Y., Xu, H., Liu, Y., Chen, X., Yi, X.,
Kong, X., Hurst, L.D., 2010. Nonsense-mediated decay targets have
multiple sequence-related features that can inhibit translation. Mol. Syst.
Biol. 6, 442.
513Z. Zhang et al. / Journal of Genetics and Genomics 40 (2013) 497e513
Copyright © 2022 FDOKUMEN