Mid-IR emission of galaxies in the Virgo cluster III. The data
37
A&A 406, 867–877 (2003) DOI: 10.1051/0004-6361:20030799 c ESO 2003 Astronomy & Astrophysics Mid-IR emission of galaxies in the Virgo cluster III. The data A. Boselli 1 , M. Sauvage 2 , J. Lequeux 3 , A. Donati 4 , and G. Gavazzi 4 1 Laboratoire d’Astrophysique de Marseille, BP 8, Traverse du Siphon, 13376 Marseille Cedex 12, France e-mail: [email protected] 2 DSM/DAPNIA/Service d’Astrophysique, CEA/Saclay, 91191 Gif-sur-Yvette, France e-mail: [email protected] 3 DEMIRM and URA 336 du CNRS, Observatoire de Paris, 61 Av. de l’Observatoire, 75014 Paris, France e-mail: [email protected] 4 Universit` a degli Studi di Milano-Bicocca, Dipartimento di Fisica, Piazza dell’Ateneo Nuovo 1, 20126 Milano, Italy e-mail: [email protected];[email protected] Received 1 October 2002 / Accepted 16 May 2003 Abstract. We present ISOCAM imaging data at 6.75 and 15 µm for 145 galaxies in the Virgo cluster and in the Coma/A1367 supercluster. Of these, 99 form a complete, optically-selected, volume-limited sample including galaxies in the core and in the periphery of the Virgo cluster, suitable for statistical analysis. 34 of the Virgo galaxies were resolved by ISOCAM: for these objects we present mid-IR images, radial light and colour profiles, as well as effective and isophotal radii, surface brightness and light concentration indices. The mid-IR colours of the target galaxies show a weak trend with the H band luminosity, with values of F(6.75 µm)/F(15 µm) ≥ 1 found generally in massive objects (L H ≥ 10 10 L H ), and F(6.75 µm)/F(15 µm) ≤ 1 in low-mass (L H ≤ 10 10 L H ) dwarf galaxies. All early-type galaxies (type ≤ S0a) have F(6.75 µm)/F(15 µm) ≥ 1, as expected when the mid-IR emission is dominated by the photosphere of the cold stellar population. The mid-IR, near-IR and visible light concentration indices of bright galaxies are tightly correlated with one another, indicating that the spatial distribution of the mid-IR emitting sources is, to the first order, similar to that of the stars. Key words. galaxies: general – galaxies: spiral – galaxies: ISM – stars: formation 1. Introduction Interstellar dust plays an important role in the energy balance of galaxies. Dust grains efficiently absorb the stellar light and re-emit the absorbed energy in the infrared. A large fraction of the energy emitted by a galaxy therefore lies in the infrared, ranging from ∼30% in normal galaxies such as the Milky Way up to more than 90% in ultra-luminous infrared galaxies (Cox & Mezger 1989). Observations with the IRAS, COBE and ISO satellites have demonstrated the existence of dust grains with a large range of sizes, from big grains (with a radius a > ∼ 200 Å) to very small grains (10 Å < ∼ a < ∼ 200 Å) and even smaller particles respon- sible for the Aromatic Infrared Bands (AIBs). Depending on the radiation field, these grains are or are not in thermal equi- librium. For example, in the radiation field near the Sun which is typical for an ordinary spiral galaxy, the big grains which contain most of the dust mass are in thermal equilibrium with a Send offprint requests to: A. Boselli, e-mail: [email protected] Figures 1 and 2, and Tables 1, 2, 4, 5 are only available in elec- tronic form at http://www.edpsciences.org typical temperature of 17.7 K (Lagache et al. 1999). However, there are also colder grains with temperatures as low as ≈12 K in regions shielded from visible and UV radiation (Ristorcelli et al. 1999). At the other extreme of the grain size range, the carriers of the AIBs are always heated stochastically by absorp- tion of single photons and temporarily reach very high tem- peratures, at which most of the emission occurs (Draine & Li 2001). The situation with the intermediate very small grains is more complex, because the size of grains that exhibit stochas- tic heating and of those that emit at equilibrium temperature depends on the radiation field. The intensity emitted at frequency ν by grains at temper- ature T is I ν = τB ν (T ), where B ν (T ) is the specific inten- sity of the blackbody at temperature T and the optical depth τ is roughly proportional to ν −2 . Consequently, the peak of emission for cold grains (12–20 K) is at wavelengths longer than 100 µm. Stochastically heated grains reach temporarily high temperatures, at which most of the energy is radiated, so that the peak of their emission is at much shorter wave- lengths. Models for the optical properties of grains consis- tent with the local dust extinction and emission properties of the Milky Way have been presented in Li & Draine (2001). Article published by EDP Sciences and available at http://www.aanda.org or http://dx.doi.org/10.1051/0004-6361:20030799
-
Upload
independent -
Category
Documents
-
view
0 -
download
0
Transcript of Mid-IR emission of galaxies in the Virgo cluster III. The data

A&A 406, 867–877 (2003)DOI: 10.1051/0004-6361:20030799c© ESO 2003
Astronomy&
Astrophysics
Mid-IR emission of galaxies in the Virgo clusterIII. The data�
A. Boselli1, M. Sauvage2, J. Lequeux3, A. Donati4, and G. Gavazzi4
1 Laboratoire d’Astrophysique de Marseille, BP 8, Traverse du Siphon, 13376 Marseille Cedex 12, Francee-mail: [email protected]
2 DSM/DAPNIA/Service d’Astrophysique, CEA/Saclay, 91191 Gif-sur-Yvette, Francee-mail: [email protected]
3 DEMIRM and URA 336 du CNRS, Observatoire de Paris, 61 Av. de l’Observatoire, 75014 Paris, Francee-mail: [email protected]
4 Universita degli Studi di Milano-Bicocca, Dipartimento di Fisica, Piazza dell’Ateneo Nuovo 1, 20126 Milano, Italye-mail: [email protected];[email protected]
Received 1 October 2002 / Accepted 16 May 2003
Abstract. We present ISOCAM imaging data at 6.75 and 15 µm for 145 galaxies in the Virgo cluster and in the Coma/A1367supercluster. Of these, 99 form a complete, optically-selected, volume-limited sample including galaxies in the core and in theperiphery of the Virgo cluster, suitable for statistical analysis. 34 of the Virgo galaxies were resolved by ISOCAM: for theseobjects we present mid-IR images, radial light and colour profiles, as well as effective and isophotal radii, surface brightnessand light concentration indices.The mid-IR colours of the target galaxies show a weak trend with the H band luminosity, with values of F(6.75 µm)/F(15 µm) ≥1 found generally in massive objects (LH ≥ 1010 LH�), and F(6.75 µm)/F(15 µm) ≤ 1 in low-mass (LH ≤ 1010 LH�) dwarfgalaxies. All early-type galaxies (type ≤ S0a) have F(6.75 µm)/F(15 µm) ≥ 1, as expected when the mid-IR emission isdominated by the photosphere of the cold stellar population. The mid-IR, near-IR and visible light concentration indices ofbright galaxies are tightly correlated with one another, indicating that the spatial distribution of the mid-IR emitting sources is,to the first order, similar to that of the stars.
Key words. galaxies: general – galaxies: spiral – galaxies: ISM – stars: formation
1. Introduction
Interstellar dust plays an important role in the energy balanceof galaxies. Dust grains efficiently absorb the stellar light andre-emit the absorbed energy in the infrared. A large fraction ofthe energy emitted by a galaxy therefore lies in the infrared,ranging from ∼30% in normal galaxies such as the Milky Wayup to more than 90% in ultra-luminous infrared galaxies (Cox& Mezger 1989).
Observations with the IRAS, COBE and ISO satellites havedemonstrated the existence of dust grains with a large range ofsizes, from big grains (with a radius a >∼ 200 Å) to very smallgrains (10 Å <∼ a <∼ 200 Å) and even smaller particles respon-sible for the Aromatic Infrared Bands (AIBs). Depending onthe radiation field, these grains are or are not in thermal equi-librium. For example, in the radiation field near the Sun whichis typical for an ordinary spiral galaxy, the big grains whichcontain most of the dust mass are in thermal equilibrium with a
Send offprint requests to: A. Boselli,e-mail: [email protected]� Figures 1 and 2, and Tables 1, 2, 4, 5 are only available in elec-
tronic form at http://www.edpsciences.org
typical temperature of 17.7 K (Lagache et al. 1999). However,there are also colder grains with temperatures as low as ≈12 Kin regions shielded from visible and UV radiation (Ristorcelliet al. 1999). At the other extreme of the grain size range, thecarriers of the AIBs are always heated stochastically by absorp-tion of single photons and temporarily reach very high tem-peratures, at which most of the emission occurs (Draine & Li2001). The situation with the intermediate very small grains ismore complex, because the size of grains that exhibit stochas-tic heating and of those that emit at equilibrium temperaturedepends on the radiation field.
The intensity emitted at frequency ν by grains at temper-ature T is Iν = τBν(T ), where Bν(T ) is the specific inten-sity of the blackbody at temperature T and the optical depthτ is roughly proportional to ν−2. Consequently, the peak ofemission for cold grains (12–20 K) is at wavelengths longerthan 100 µm. Stochastically heated grains reach temporarilyhigh temperatures, at which most of the energy is radiated,so that the peak of their emission is at much shorter wave-lengths. Models for the optical properties of grains consis-tent with the local dust extinction and emission properties ofthe Milky Way have been presented in Li & Draine (2001).
Article published by EDP Sciences and available at http://www.aanda.org or http://dx.doi.org/10.1051/0004-6361:20030799

868 A. Boselli et al.: Mid-IR emission of galaxies in the Virgo cluster. III.
Such dust models can be used as the basis for self-consistentcalculations of grain heating, incorporating realistic geome-tries, in well-studied late-type galaxies. Such calculations showfor example that at 60 µm, most of the integrated emis-sion of a normal galaxy is not dominated by very smallgrains, as is the case for the emission from grains immersedin the interstellar radiation field near the Sun (Dsert et al.1990; Dwek et al. 1997), but mainly (about 60%) by big-ger grains in equilibrium with the high radiation fields inthe star-forming regions: see e.g. Fig. 8 and Table 3 ofPopescu et al. (2000) for the case of NGC 891. At this wave-length, only about 20% of the emission comes from stochas-tically heated grains in the outer disks, with approximatelyanother 20% arising from big grains in equilibrium with thediffuse optical photons in the central regions of galaxies.
There is another difficulty, of observational nature, in theinterpretation of far-infrared observations of galaxies. The coldgrains, which contain most of the mass of the dust, could barelybe seen in the 100 µm filter of IRAS, which therefore offereda biased view of dust emission in galaxies. ISO extended theobserving wavelength range to 200 µm, providing a better in-sight on this emission and consequently enabling a more com-plete knowledge of dust emission and energy balance in galax-ies (Popescu et al. 2002; Popescu & Tuffs 2002).
To which extent the mid- and far-IR emission can be usedas a tracer of star formation in galaxies is still unclear. The far-infrared wavelength range is more favorable a priori, since itcarries the bulk of the luminosity re-radiated by grains, mostof which arise from the young stellar population. Whetherthe mid-IR can also be of use is an interesting and still openquestion, which could resolved by statistical comparisons ofmid-IR data with star formation rates corrected for extinc-tion and derived from a combination of UV/optical and far-IR/submillimeter data. It should be reminded at this stage thatthe spectral energy distribution of the mid-IR emission in theUIBs and associated continuum does not depend on the inten-sity of the radiation field, but only on its hardness. This mightease the interpretation of the corresponding observations.
With this aim in mind amongst others, the ISOCAM andISOPHOT consortia defined a coordinated program of obser-vations of an optically selected, complete sample of late typegalaxies, which was executed in the guaranteed time of theISOCAM and ISOPHOT instrument teams. The sample ofVirgo cluster galaxies was chosen because, at that time, it wasthe deepest complete sample available of normal star-forminggalaxies. Most of these galaxies are thought to be freshly fallingin from the field, before being affected by the cluster environ-ment. However the sample contains galaxies in the central re-gion that are clearly affected. Roussel et al. (2001b) have pre-sented ISOCAM data for 23 of the brightest Virgo galaxieswhich add to the present sample. The Virgo sample can be com-pared to the Coma/A1367 supercluster ISO sample (see later),which is more affected by the environment, and to the samplesof nearby field galaxy of the ISO surveys of Dale et al. (2000)and of Bendo et al. (2002).
In this paper we report on the ISOCAM consortium ob-servations at 6.75 and 15 µm and present the results of newreductions made using updated CIA data reduction tools,
i.e. v 4.0. We discuss and analyze the mid-IR properties oflate-type galaxies. The PHOT and LWS data are presented inTuffs et al. (2002) and Leech et al. (1999) respectively, anddiscussed respectively by Popescu et al. (2002), Pierini et al.(1999, 2001) and Boselli et al. (2002; 2003). The origin of thedust emission of late-type galaxies and its relation with star for-mation, already presented in Boselli et al. (1997a, 1998), willbe discussed further in future papers. We also present homo-geneously reduced mid-IR data for other galaxies in the Virgocluster and in the Coma/A1367 supercluster. The total num-ber of galaxies we discuss is 145. It represents, up to date, thelargest available sample in the literature with ISOCAM data.
The samples are presented in Sect. 2, the observations, thedata reduction procedures and the image analysis in Sects. 3and 4. The Mid-IR properties of 34 spatially resolved galaxiesare given in Sect. 4. The data are compared to those availablein the literature in Sect. 5, while a simple statistical analysis ofthe mid-IR properties of late-type galaxies is given in Sect. 6.
2. The sample
The present paper reports ISOCAM observations of 123 galax-ies in the Virgo cluster region (12h ≤ RA ≤ 13h, 0◦ ≤ Dec ≤18◦) and 22 objects in the Coma/A1367 supercluster region(11h30m ≤ RA ≤ 13h30m, 18◦ ≤ Dec ≤ 32◦).
The present sample can be subdivided in 5 different sub-samples, defined as:
– The optically-selected, volume-limited, complete ISOVirgo sample, defined as described in Boselli et al. (1997b,1998), observed in guaranteed time as part of the Virgo cen-tral program with CAM, PHOT1 (Tuffs et al. 2002) andpartly with LWS2 (Leech et al. 1999). This sample hasbeen extracted from the Virgo Cluster Catalogue (VCC) ofBinggeli et al. (1985), which is complete to BT = 18, to in-clude all late-type galaxies (type ≥S0a) with BT < 18, clas-sified as cluster member by Binggeli et al. (1985, 1993).For telescope time limitation, out of the 207 VCC galax-ies matching these criteria, only 100 were selected. Theseare objects with projected separation <2◦ from M 87 (clus-ter core) or at the periphery of the cluster, with an angularseparations greater than 4◦ from the position of maximumprojected galaxy density given by Sandage et al. (1985),but excluding galaxies within 1.5◦ of the M 49 sub-cluster.To limit the spread of distances within the sample, galaxiesbelonging to the M and W clouds (as defined by Binggeliet al. 1985, 1993), and in the Southern extension (δ < 5 ◦)were also excluded.The total sample includes 118 objects (see Boselli et al.2003). Because of the low visibility of the Virgo cluster dur-ing the ISO mission and because of the low detection rate
1 Sixty-one out of the 100 ISO Virgo sample galaxies (see Sect. 2)were observed by ISOPHOT. These comprise all galaxies west fromRA(1950) 12.596 h with BT brighter than 16.8 mag in the cluster pe-riphery and BT brighter than 14.5 mag in the cluster core areas.
2 Eighteen out of the 100 ISO Virgo sample galaxies were observedby ISOLWS. These comprise all objects with type ≤Scd and BT ≤12.3, with the exception of the interacting system VCC 1673-1676and VCC 836.
A. Boselli et al.: Mid-IR emission of galaxies in the Virgo cluster. III. 869
of small galaxies with ISOCAM, the 18 Im and BCDs inthe cluster core could not be observed. The resulting sam-ple is still unbiased but includes only 100 objects, with 28spirals (S0/Sa–Sm) in the cluster core, and 72 spirals, ir-regulars and BCDs in the cluster periphery. It thus consti-tutes an optically–selected, volume–limited complete sam-ple, ideal for statistical analyses. 99 out of the 100 galaxieswere observed by ISOCAM3. The sample includes galax-ies spanning the whole range in morphological type forlate-type systems, from S0/a to Im and BCDs, luminosity(−21 ≤ MB ≤ −13), and galaxy density (cluster core vs.cluster periphery).
– The Virgo serendipitous sample is composed of 18 galaxieswith optical counterparts in the VCC, serendipitously ob-served in the field of the ISO Virgo galaxies. This sample isdominated by early-type systems, mostly dwarf ellipticals(10 objects). Despite its small dimension, this subsamplecan be taken as representative of a mid-IR selected sampleof nearby galaxies. Two of the 18 objects (VCC 899 andVCC 1018) are background galaxies.
– Six galaxies belonging to the Virgo cluster were observedwith ISOCAM as part of other guaranteed or open time pro-posals. Out of the 6 objects, only one is not included in theVCC. The ISOCAM data, now available at the ISO datacentre, are here reduced, analyzed and presented as homo-geneously as possible with those of the ISO Virgo sampleproviding to the community the largest available dataset ofgalaxies in the Virgo cluster region. Since the observationsof these objects were taken for different purposes, the pho-tometric quality of the present data is not always as good asthat of the ISO Virgo sample.
– The A1367 and Coma clusters sample, extensively de-scribed in Contursi et al. (2001), includes 19 late–typegalaxies. Briefly, the sample is composed of high star form-ing galaxies with peculiar morphologies, blue colour in-dices (B − H ≤ 2.75), characterized by asymmetric HIand/or Hα distributions or indicating any possible sign ofan ongoing interaction with the intracluster medium. Thepresent sample is thus not complete in any sense. The CAMdata, already presented in Contursi et al. (2001), are here re-processed using the new data reduction tools and are thusdirectly comparable to those of the Virgo samples. Data forthe serendipitously detected CGCG97-087N are added.
– We present CAM data of other 3 galaxies in theComa/A1367 supercluster region; two of them (CGCG159-072) form an interacting system, known as “The mices”(Arp 242), the third one (CGCG130-023) is a galaxy in thesmall group of UGC 8248 (Gavazzi et al. 1999b).
Table 1 gathers the principal information on the target galaxies,arranged as follows:
– Column 1: VCC denomination for the Virgo cluster galax-ies (Binggeli et al. 1985, hereafter VCC), CGCG for the ob-jects in the Coma/A1367 supercluster (Zwicky et al. 1961-1968, hereafter CGCG).
3 The galaxy VCC 1869, unfortunately not observed by ISOCAM,should be added to these 99 objects to form the exact complete sample.
– Column 2: UGC name (Nilson 1973).– Column 3: NGC or IC name.– Columns 4 and 5: (J2000.0) celestial coordinates with few
arcsec accuracy, from the VCC, or measured by us on theDSS.
– Column 6: morphological type, from the VCC or fromBinggeli et al. (1993) for Virgo galaxies, from Gavazzi &Boselli (1996) for the other objects.
– Column 7: photographic magnitude from the VCC for theVirgo galaxies, from the CGCG for the other objects.
– Columns 8 and 9: major (a) and minor (b) optical di-ameters (arcmin) determined at the surface brightness of25th mag arcsec−2. From the UGC (when available) or con-sistently determined by us. For VCC galaxies the diame-ter is computed from the “last visible” isophotal diametergiven in the VCC using: Log aext(bext) = 0.99Log a(b)+0.1.
– Column 10: distance, in Mpc. Distances to the various sub-structures of Virgo are as given in Gavazzi et al. (1999a).A distance of 96 and 91.3 Mpc is assumed for galaxies inComa and A1367 respectively. For galaxies not belongingto the clusters, the distance is determined from the redshiftassuming H0 = 75 km s−1Mpc−1.
– Column 11: cluster membership as defined in Gavazzi et al.(1999a) for Virgo and in Gavazzi et al. (1999b) for theComa/A1367 supercluster4. Codes A, B, M, W, S, N andE are for clusters A and B, M and W clouds, southern ex-tension, N and E substructures respectively.
– Column 12: projected angular distance from the clustercentre (M 87), in degrees. Among the ISO Virgo galax-ies, the core subsample is composed by all objects withθ < 2 degrees.
– Columns 13 and 14: the K and B band C 31(K) and C31(B)concentration index, defined as the model independent ra-tio between the radii that enclose 75% and 25% of the to-tal light, from Gavazzi et al. (2000) and Gavazzi et al., inpreparation.
– Column 15: notes on morphological type, from Boselliet al. (2003) for the ISO Virgo sample, from NED for otherobjects, unless specified.
3. Observations and data reduction
All galaxies were observed in 2 filters, LW2 (λ = 6.75 µm,∆λ = 5.00−8.50 µm) and LW3 (λ = 15.0 µm, ∆λ =12.0−18.0 µm).
Observations of the ISO Virgo sample were part of theISOCAM Central Program: all galaxies were observed in oneof the few visibility windows of the Virgo cluster during theISO mission, in the summer of 1996. The 32 × 32 pixel long–wavelength camera was used to make a raster map coveringthe whole pointed galaxy and its nearby background, with ashift (then overlap) of 16 pixels between adjacent positions.
4 The Gavazzi et al. (1999a) cluster membership criterion, based onthe analysis of the 3-D distribution of galaxies in the Virgo cluster, isslightly different from that used by Binggeli et al. (1985, 1993). It isthus not surprising that several objects in Table 1 appear as membersof cluster B or of the M and W clouds.

870 A. Boselli et al.: Mid-IR emission of galaxies in the Virgo cluster. III.
The pixel size was 6′′ × 6′′, with a diffraction limit of6 arcsec at 6.75 µm and of 8 arcsec at 15 µm. 3×3 rasters weremade for galaxies with the smallest angular dimensions, whilelarger rasters, up to 8 × 8, were adopted for giant or extendedobjects. The extension of the combined map was selected toexceed by a factor of ∼2–3 the optical angular dimension ofthe galaxy in order to allow an accurate determination of thebackground contribution. All rasters were performed along thesatellite axes, which are aligned with the camera axes. This im-plies that the orientation of the North axis with respect to theraster axes is in principle different from one map to the other.This orientation is listed in Table 4, where the quoted angle isfrom the North axis to the main scanning axis of the raster (i.e.that on which ghosts due to transients appear). As can be seenthere is in fact little dispersion because the observations wereperformed in a small group of nearby orbits. Table 5 also liststhe ISO TDT number which can be useful to locate our obser-vations in the ISO archive5. The elementary integration timewas 2.1 s, with 16 to 20 integrations per position. To minimizethe effects of transients of the detector on the determination ofthe source flux, 40 to 70 integrations per position were usedin the first raster position every time the background was ex-pected to change significantly from the previous target, i.e. forsignificantly different pointings and for different filters.
The large raster maps allowed us to observe other Virgogalaxies: only those fully covered by the CAM image were in-cluded in the Virgo serendipitous sample.
An accurate description of the observations of the A1367and Coma clusters galaxies is given in Contursi et al. (2001).This program was prepared to follow most of the proceduresused in the Virgo galaxy observations. Given the small angularsize of the targets, images were obtained by mosaics of 2 × 2raster positions with shifts of 10 pixels (60′′) between succes-sive positions. The final images have sizes of 42× 42 pixels, or4.2′ × 4.2′. The central 22 × 22 pixels, containing the galaxy,were sampled 4 times. All observations were done with an el-ementary integration time of 5.04 s, with ∼10 integrations perposition, 20 for the first raster position.
In order to minimize the overhead time for galaxy pointingand for the stabilization of the detector, galaxies in the ISOVirgo sample as well as in the clusters A1367 and Coma wereobserved in a concatenated mode, with a complete sequenceof observations of 5–10 nearby galaxies in a given (and fixed)filter.
The remaining 6 galaxies in the Virgo cluster as well as the3 objects in the Coma/A1367 supercluster were part of differentand thus heterogeneous observing programs. In particular, onlythe central region of the three early-type objects in Virgo wasmapped, making the determination of the sky emission, andthus of the total flux density, highly uncertain.
Images were reduced following the standard CIA6 pro-cedures available at the ISO center at CEA/Saclay: images
5 http://www.iso.vilspa.esa.es/6 CAM Interactive Analysis, CIA, is a joint development by the
ESA Astrophysics Division, and the ISOCAM Consortium led bythe ISOCAM P.I., C. Cesarsky, Direction des Sciences de la Matiere,CEA, France.
were dark-subtracted using a time-dependent model of thedark current (Siebenmorgen et al. 2000), then deglitched usingthe multi-resolution method described in Starck et al. (1999).Data cubes were then transient-corrected using the algorithmdeveloped by Coulais & Abergel (2000). It is well knownthat even with this transient correction, there remains in theISOCAM data a long term drift, called “long-term transient”by Miville-Deschenes et al. (2000) which manifests itself as anincrease of the background level as the raster progresses. Wehave used the methods developed by Miville-Deschenes et al.(2000) to correct for this long-term transient, as well as to flat-field the data, the two corrections being intimately linked. Theroutines necessary for these corrections are available at CIA,through the SLICE package. Even with these, we often ob-served a 2-D gradient in the background of the final, reducedimages. This gradient was removed using the task IMSURFITin IRAF/IMAGES7. In Sect. 4.1 we come back to the uncer-tainties introduced by the data reduction process.
The absolute astrometric accuracy of the reconstructedrasters is dominated by the lens wheel jitter which introducesan absolute uncertainty of 1.5–2 pixels, i.e. 9–12 ′′. The rela-tive pointing uncertainty, i.e. that which relates to successivepointings inside a raster, is much smaller, at 0.′′5. Given thatthe observations we made in rather long concatenated chainsof rasters, the same absolute astrometric error will apply to therasters obtained in the same concatenation chain. For the samereason, since the LW2 and LW3 observations were generallymade in different chains, a different pointing error occur in thetwo maps of the same galaxy.
4. Image analysis
The total flux densities were extracted using the QPHOT rou-tine in IRAF/NOAO after subtraction of the sky backgroundestimated in a concentric annulus outside the galaxy, of ra-dius ∼20% larger than the mid-IR extension of the galaxy.Total counts have been obtained by integrating the pixel countsover the area covered by each galaxy, as derived by its mid-IRimage, i.e. within a circle of radius rλ, ∼10% larger than theisophotal radii r5(6.75) and r5(15) as given in Eqs. (5) and (6).Counts were transformed into flux densities using the conver-sion factors given in the ISOCAM handbook (Siebenmorgenet al. 2000), i.e. by dividing by 2.32 ADU gain−1 s−1 mJy−1 forLW2 and 1.96 ADU gain−1 s−1 mJy−1 for LW3.
For undetected galaxies, an upper limit has been deter-mined as:
Flimit(λ) = 2
√[σ(s)λ (π r′2λ )]2 + [σ(p)λ
√(π r′2λ )]2 (mJy) (1)
where σ(p)λ is the background noise per pixel at a given λ,σ(s)λ is the uncertainty on the sky determination and r ′λ is theexpected mid-IR radius (in pixel units, 6 arcsec/pixel) of theobserved galaxy. r′λ has been estimated using Eqs. (5) and (6),
7 IRAF is the Image Analysis and Reduction Facility madeavailable to the astronomical community by the National OpticalAstronomy Observatories, which are operated by AURA, Inc., undercontract with the U.S. National Science Foundation.

A. Boselli et al.: Mid-IR emission of galaxies in the Virgo cluster. III. 871
determined from the relationship between optical and mid-IRisophotal radii of resolved galaxies (see Sect. 4.2). The upperlimit to the flux density corresponds to 2 × errλ, where errλ(see Eq. (4)) would be the total error for the flux density if thegalaxy was detected (see Sect. 4.1).
The results of the observations are given in Table 2, orga-nized as follows:
– Column 1: galaxy name.– Column 2: raster map.– Column 3: total field of view, in arcminutes.– Column 4: elementary integration time.– Columns 5, 6, 7, 8 and 9: mid-IR flux density (in mJy)
with error, background surface brightness, uncertainty onthe sky determination σ(s)λ, pixel noise σ(p)λ and photo-metric quality of the data at 6.75 µm. For galaxies withtwo independent data reductions (see Sect. 4.1), Col. 5(and 10) gives the average value. The error is determinedusing Eq. (4) given in Sect. 4.1. The rms σ(s)λ used in theerror determination has been computed as the standard de-viation on the estimate of the sky background, whose ac-curacy is limited by the quality of the flat-fielding. This is,on average, a factor of 2 lower than the rms on the sin-gle pixel counts σ(p)λ. The background surface brightness,σ(s)λ andσ(p)λ are given in units of µJy arcsec−2. A photo-metric quality of 1 is for high signal to noise images with aflat sky background. A value of 2 is for low signal to noisedata, for images with strong residual gradients in the skybackground, for objects where the transient memory of thebright nucleus is not perfectly corrected and partly contam-inates the disc emission in the reduced image, or for thoseobjects whose photometric parameters differ by more than∼30% when images are reduced using different parameters(see Sect. 4.1). In all these objects the photometric uncer-tainty is expected to be larger than on the average. A pho-tometric quality of 3 is given to tentative detections. Thesedata should be used with caution in any statistical analysis.
– Columns 10, 11, 12, 13 and 14: mid-IR flux density (inmJy) with error, background surface brightness, uncertaintyon the sky determination σ(s)λ, pixel noise σ(p)λ and pho-tometric quality of the data at at 15 µm.
– Column 15: an asterisk indicates notes to individual ob-jects, reported at the end of the table. For the serendipitousVirgo sample, Col. 15 lists the target name of the framewhere the galaxy was detected.
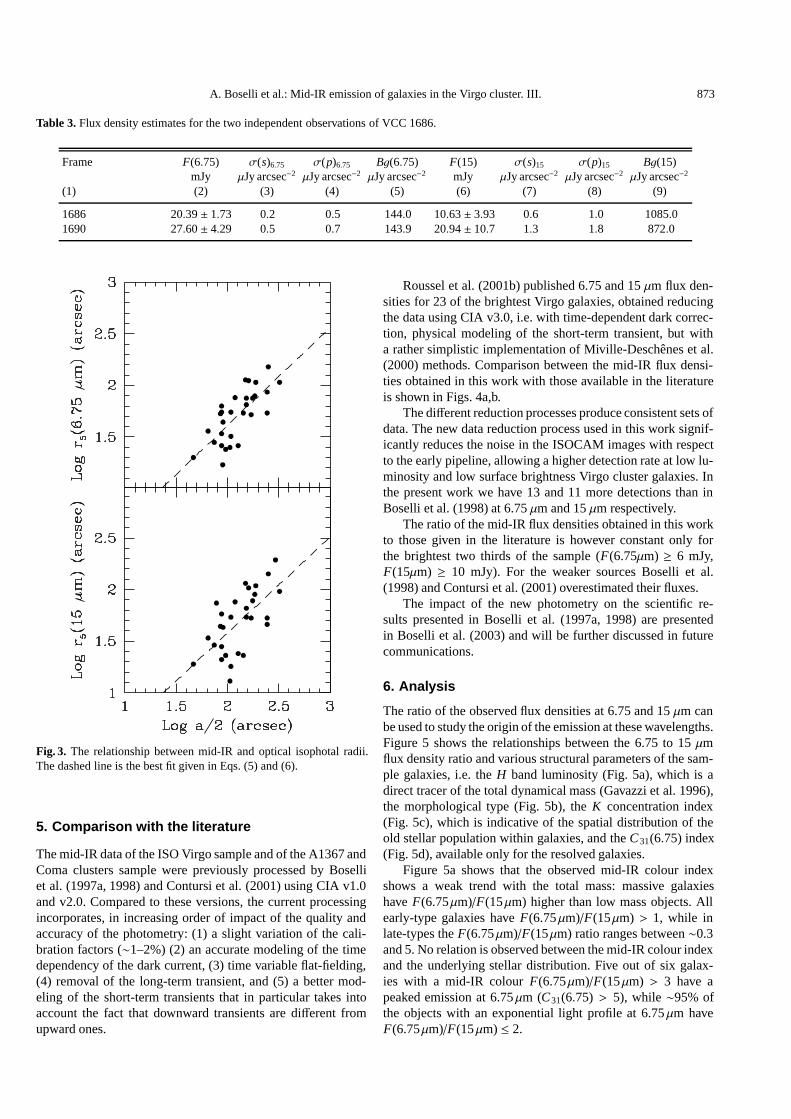
The detection rate is 77% and 67% at 6.75 and 15 µm re-spectively for the ISO Virgo sample, 28% and 22% for theVirgo serendipitous sample, and 100% at both frequencies forthe other samples. The 6.75 and 15 µm gray-level images ofthe fully resolved galaxies (see Sect. 4.2) are given in Fig. 1,while the contour plot of all the other detected galaxies (witha surface brightness brighter than 2 µJy arcsec−2) are shown inFig. 2.
4.1. Photometric uncertainty
All the possible origins of photometric errors in ISOCAM im-ages are extensively discussed in Roussel et al. (2001b). Those
which are going to affect the present data are mostly related to(1) remnants of transient on the galaxies’ nuclei that either de-crease the responsivity of the array, or leave ghosts in the map,(2) the use of an incorrect flat-field, (3) an incomplete correc-tion of the long-term transient leading to a wrong assessment ofthe background. It is not possible to perform statistical tests onpoint (1) since it would mean changing the parameters of theCoulais & Abergel (2000) model, thus abandoning the physicalbasis that is its strength. One can only identify on the imagesthe presence of these ghosts and label the fluxes accordingly(see Table 2). For the other effects, it is possible to investigatetheir amplitude by adjusting the correction parameters. Theseparameters are in fact mostly those dealing with long-term tran-sient and flat-field corrections.
Inaccurate corrections for the long-term transient and/or forflat-fielding lead to large uncertainties in the sky backgrounddetermination. These uncertainties are larger than those in-duced by the statistical noise of the image on extended sources,where are the major sources of error for the flux determina-tion. Inaccurate corrections for long-term transient and/or flat-fielding can introduce 2-D structures on the image backgroundon scale comparable or larger than the angular size of the targetgalaxies, leading to systematic errors on the sky background.Using the uncertainty on the sky determination (σ(s) λ) (Cols. 7and 12 in Table 2), we can compute the error on the flux den-sity determination due to long-term transient and/or for flat-fielding, err(s)λ, using the relation:
err(s)λ = σ(s)λ (π r2λ) (mJy) (2)
where rλ is the radius (in pixels) of the circular aperture insidewhich the galaxy counts were determined8.
For point-like, faint sources near the detection limit the ran-dom error due to photon noise from the dominant foregroundzodiacal light, err(p)λ, can be dominant. Random uncertaintiescan be estimated using the relation:
err(p)λ = σ(p)λ√
(π r2λ) (mJy) (3)
where σ(p)λ (from Cols. 8 and 13 in Table 2) is the pixel perpixel rms. The total uncertainty in the flux determination (givenin Table 2) is thus:
errλ =√
err(s)2λ + err(p)2
λ (mJy). (4)
Since we did not included the uncertainties induced by tran-sient remnants (see previous point 1), the total error given inEq. (4) is underestimated.
Indeed, this relation generally leads to photometric errorssmaller than those given by Roussel et al. (2001b) for the galax-ies in common. The reason for that is that the errors quotedhere do not include those due to incomplete short-term tran-sient correction. These were estimated on a case by case basisby Roussel et al. (2001b) using a method that is impractical toimplement on a larger sample such as this one. This compari-son clearly shows the dominant impact of short-term transienton ISOCAM photometry.
8 As explained in the previous section, rλ is on average ∼20% largerthan the mid-IR major axis radius of the galaxy.

872 A. Boselli et al.: Mid-IR emission of galaxies in the Virgo cluster. III.
We performed an internal check on the accuracy of thephotometry by comparing total flux densities extracted fromimages independently reduced with different parameters. Thistest has been done on both LW2 and LW3 images of 20 galax-ies. The consistency on the flux densities extracted on imagesreduced using different parameters for the long-term transientand flat-field corrections (see Miville-Deschenes et al. 2000 fordetails) is generally within ∼15%. Only a few objects wherethe gradient in the sky background has not been succesfullyremoved by the task IMSURFIT (see previous section) havelarger inconsistencies.
These tests, however, do not give an estimate of the sys-tematic error since they are based on the analysis of non-independent data. The galaxy VCC 1686 has two indepen-dent datasets since it has been observed twice during the ISOVirgo observations: once with a dedicated raster, and once as aserendipitous observation in the raster field of VCC 1690. Theresults of the different observations are given in Table 3.
Even if the discrepancy between the two observations arehigh, the two sets of data are consistent within the errors. Wedo not know whether this case is representative of weak sources(we however detect sources∼10 times weaker than VCC 1686),or holds also for brighter sources, with higher signal to noise.For general purposes we can assume that the photometric er-ror on the absolute flux densities of these ISOCAM images is∼30%. We warn however of conceiving the ISOCAM errors asa constant fraction of the object’s flux. This is generally wrong:for most objects observed with ISOCAM, the major source ofnoise is the zodiacal background, which is often much brighterthan the object itself. Errors quite routinely reach a few % toless than 1% of the background level (as is clearly the case forthe ISO-Virgo sample observations). Depending on the sourcebrightness however, this can lead to much larger errors, whenexpressed as a function of the source flux.
4.2. Resolved galaxies
Thirty-four galaxies have been fully resolved by ISOCAM at6.75 µm. Their images (obtained after a rebinning to 1 arc-sec/pixel using a linear interpolation) are shown in Fig. 1 asgrey levels. All images of late-type galaxies are characterizedby a strong nuclear emission, a diffuse and extended emission,and by the emission of the brightest spiral patterns (see for in-stance VCC 1555 or VCC 1727). Early-type galaxies such asVCC 1978 show only a nuclear and a diffuse emission.
Radial profiles and colours of the near-IR images (Fig. 1)have been obtained using the same procedure adopted inGavazzi et al. (2000). For each rebinned frame the sky back-ground was determined in regions of “empty” sky, and it wassubtracted from the frame. Sky-subtracted frames were in-spected individually and the light of unwanted superposed ornearby stars and galaxies was masked.
The 2-dimensional light distribution of each galaxy was fit-ted with elliptical isophotes, using a modified version of theSTSDAS ISOPHOTE package. Starting from a set of initialparameters given manually, the fit maintains as free parame-ters the ellipse center, ellipticity and position angle. The ellipse
semi-major axis is incremented by a fixed fraction of its valueat each step of the fitting procedure. The routine halts whenthe surface brightness found in a given corona equals the skyrms. The fit fails to converge for some galaxies with very ir-regular light distributions. In these cases we keep fixed one ormore of the initial parameters. The resulting radial light pro-files are fitted with models of the galaxy light distribution: a deVaucouleurs r1/4 law (de Vaucouleurs 1948) or an exponentialdisc law, or a combination of the two. Total flux densities arethen obtained by adding to the flux density measured within theoutermost significant isophote the value extrapolated to infinityalong either the r1/4 (dV galaxies), or the exponential law thatfitted the outer parts of the galaxy (pure discs and B+D galax-ies)9. This routine gives also the concentration index (C 31), de-fined in de Vaucouleurs (1977) as the model–independent ratiobetween the radii that enclose 75% and 25% of the total flux.Values of C31 ≤ 3 are for pure exponential discs, >3 for galax-ies with prominent bulges and/or nuclei.
Results of the fitting procedures are given in Table 4, ar-ranged as follows:
– Column 1: VCC galaxy name.– Column 2: C31(6.75) concentration index at 6.75 µm.– Column 3: 6.75 µm isophotal major axis radius r5(6.75) at
5 µJy arcsec−2, in arcsec.– Column 4: 6.75 µm effective radius Re(6.75), the radius
containing half of the total light, in arcsec.– Column 5: 6.75 µe(6.75) effective surface brightness, the
mean surface brightness within Re(6.75), in µJy arcsec−2.– Columns 6, 7, 8 and 9: 15 µm C31(15) concentration index,
isophotal major axis radius r5(15), effective radius Re(15)and surface brightness µe(15).
Light profiles are reliable only outside the diffraction limit ofeach filter, the colour profile outside 8 arcseconds, which rep-resents the diffraction limit at 15 µm, as indicated by the ver-tical dashed line in the F(6.75)/F(15) colour profile given inFig. 1. The error in the light profile is dominated by the pres-ence of large scale gradients in the sky background, left overby the flat-fielding procedure. These errors affects mostly thelarge scale, low surface brightness extended regions.
Late-type galaxies have a variety of mid-IR light profiles,from pure exponential discs such as VCC 66 to bulge plus discprofile (VCC 1110), or irregular profiles such as VCC 92.
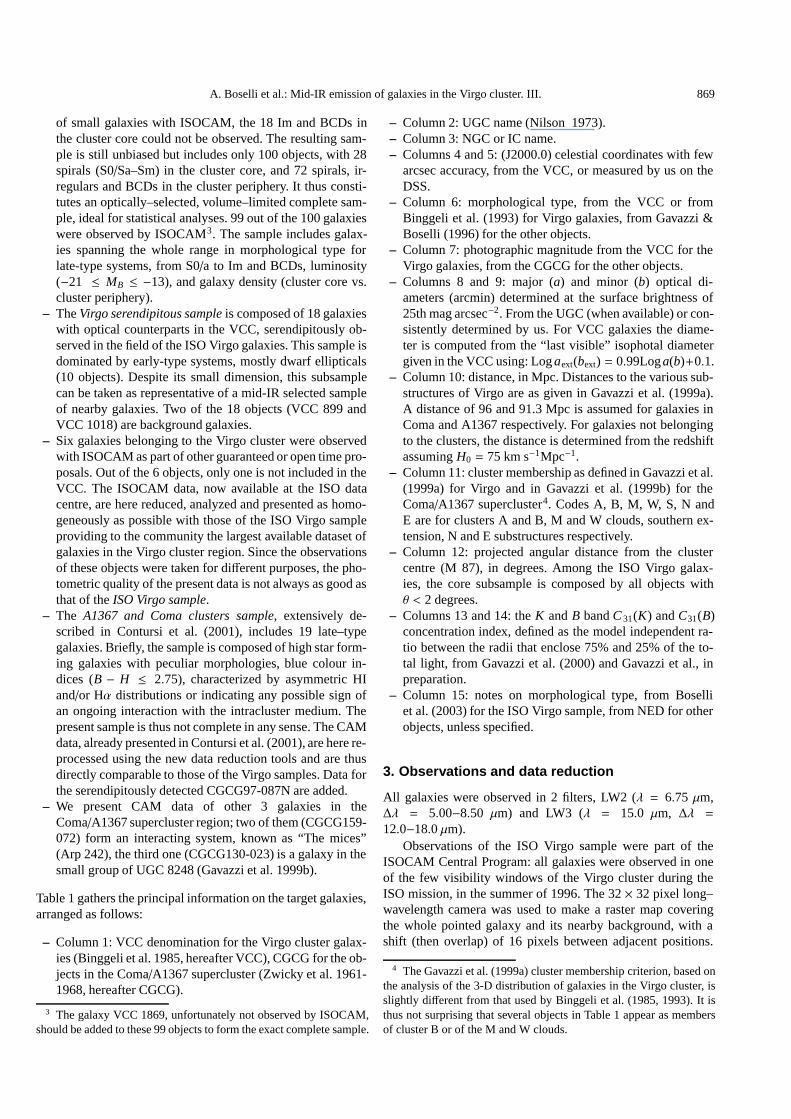
Mid-IR and optical isophotal radii are strongly related oneanother (see Fig. 3).
The best fit gives the following relationships:
r5(6.75) = 0.375 × (a/2) + 8.321 R2 = 0.52 (5)
and
r5(15) = 0.408 × (a/2) + 2.428 R2 = 0.46. (6)
These relationships are used to estimate the mid-IR extensionof undetected sources (see Sect. 4).
9 For homogeneity, the flux densities of the 34 fully resolved galax-ies given in Table 2 are not the extrapolated values obtained by this fit-ting procedure but are those obtained with the QPHOT task describedin Sect. 4.
A. Boselli et al.: Mid-IR emission of galaxies in the Virgo cluster. III. 873
Table 3. Flux density estimates for the two independent observations of VCC 1686.
Frame F(6.75) σ(s)6.75 σ(p)6.75 Bg(6.75) F(15) σ(s)15 σ(p)15 Bg(15)mJy µJy arcsec−2 µJy arcsec−2 µJy arcsec−2 mJy µJy arcsec−2 µJy arcsec−2 µJy arcsec−2
(1) (2) (3) (4) (5) (6) (7) (8) (9)
1686 20.39 ± 1.73 0.2 0.5 144.0 10.63 ± 3.93 0.6 1.0 1085.01690 27.60 ± 4.29 0.5 0.7 143.9 20.94 ± 10.7 1.3 1.8 872.0
Fig. 3. The relationship between mid-IR and optical isophotal radii.The dashed line is the best fit given in Eqs. (5) and (6).
5. Comparison with the literature
The mid-IR data of the ISO Virgo sample and of the A1367 andComa clusters sample were previously processed by Boselliet al. (1997a, 1998) and Contursi et al. (2001) using CIA v1.0and v2.0. Compared to these versions, the current processingincorporates, in increasing order of impact of the quality andaccuracy of the photometry: (1) a slight variation of the cali-bration factors (∼1–2%) (2) an accurate modeling of the timedependency of the dark current, (3) time variable flat-fielding,(4) removal of the long-term transient, and (5) a better mod-eling of the short-term transients that in particular takes intoaccount the fact that downward transients are different fromupward ones.
Roussel et al. (2001b) published 6.75 and 15 µm flux den-sities for 23 of the brightest Virgo galaxies, obtained reducingthe data using CIA v3.0, i.e. with time-dependent dark correc-tion, physical modeling of the short-term transient, but witha rather simplistic implementation of Miville-Deschenes et al.(2000) methods. Comparison between the mid-IR flux densi-ties obtained in this work with those available in the literatureis shown in Figs. 4a,b.
The different reduction processes produce consistent sets ofdata. The new data reduction process used in this work signif-icantly reduces the noise in the ISOCAM images with respectto the early pipeline, allowing a higher detection rate at low lu-minosity and low surface brightness Virgo cluster galaxies. Inthe present work we have 13 and 11 more detections than inBoselli et al. (1998) at 6.75 µm and 15 µm respectively.
The ratio of the mid-IR flux densities obtained in this workto those given in the literature is however constant only forthe brightest two thirds of the sample (F(6.75µm) ≥ 6 mJy,F(15µm) ≥ 10 mJy). For the weaker sources Boselli et al.(1998) and Contursi et al. (2001) overestimated their fluxes.
The impact of the new photometry on the scientific re-sults presented in Boselli et al. (1997a, 1998) are presentedin Boselli et al. (2003) and will be further discussed in futurecommunications.
6. Analysis
The ratio of the observed flux densities at 6.75 and 15 µm canbe used to study the origin of the emission at these wavelengths.Figure 5 shows the relationships between the 6.75 to 15 µmflux density ratio and various structural parameters of the sam-ple galaxies, i.e. the H band luminosity (Fig. 5a), which is adirect tracer of the total dynamical mass (Gavazzi et al. 1996),the morphological type (Fig. 5b), the K concentration index(Fig. 5c), which is indicative of the spatial distribution of theold stellar population within galaxies, and the C 31(6.75) index(Fig. 5d), available only for the resolved galaxies.
Figure 5a shows that the observed mid-IR colour indexshows a weak trend with the total mass: massive galaxieshave F(6.75µm)/F(15µm) higher than low mass objects. Allearly-type galaxies have F(6.75µm)/F(15µm) > 1, while inlate-types the F(6.75µm)/F(15µm) ratio ranges between ∼0.3and 5. No relation is observed between the mid-IR colour indexand the underlying stellar distribution. Five out of six galax-ies with a mid-IR colour F(6.75µm)/F(15µm) > 3 have apeaked emission at 6.75µm (C31(6.75) > 5), while ∼95% ofthe objects with an exponential light profile at 6.75µm haveF(6.75µm)/F(15µm) ≤ 2.

874 A. Boselli et al.: Mid-IR emission of galaxies in the Virgo cluster. III.
Fig. 4. The ratio of the flux densities obtained in this work with those available in the literature versus our flux densities at a) 6.75 µm and b)15 µm. The dashed line indicates a linear relation between the two sets of data. Crosses are for Roussel et al. (2001b), filled dots for Contursiet al. (2001), while open dots and open triangles are for detected and undetected (upper limits) galaxies in Boselli et al. (1998), respectively.
Fig. 5. The relationship between the mid-IR colour index F(6.75 µm)/F(15 µm) and a) the total mass (as traced by the H band luminosity), b)the morphological type, c) the K band C31(K) concentration index and d) the mid-IR C31(6.75) concentration index. Filled dots are for galaxiesdetected at 6.75 and 15 µm, open triangles for galaxies undetected at 15 µm.

A. Boselli et al.: Mid-IR emission of galaxies in the Virgo cluster. III. 875
Fig. 6. The relationship between the mid-IR and the near-IR and visible concentration indices.
The relationships between the mid-IR and the near-IR andvisible concentration indices (this last being weak), shown inFig. 6, indicate that bulge dominated galaxies (C 31(K) ≥ 3)have peaked mid-IR distributions.
High values of F(6.75µm)/F(15µm) are expected whenthe contribution of the black-body tail of the cold stellar popu-lation to the total mid-IR emission becomes important: our ob-servational evidences indicate that the contribution of the oldstellar population to the mid-IR emission is important in early-type and/or massive galaxies, with prominent bulges, with acentrally peaked mid-IR light distribution. Dust emission isdominant in low-mass objects characterized by an exponen-tial distribution of the visible, near- and mid-IR light. This pic-ture is coherent with our previous results given in Boselli et al.(1998), and confirmed by our recent analysis of the spectralenergy distribution (SED) presented in Boselli et al. (2003).
No strong relationships are observed between the ratio ofthe mid-IR effective radii and surface brightnesses and otherstructural parameters, such as the H band luminosity, the mor-phological type and the C31(K) concentration index. A weaktrend is however observed between the ratio of the mid-IR6.75 µm to visible isophotal radii and the morphological type(if limited to spirals) and C31(K) concentration index (Fig. 7),indicating that the mid-IR disc is more extended in Sc galax-ies characterized by exponentially declining light distributions(both near- and mid-IR) than in bulge-dominated Sa.
Colour profiles are generally flat, with an average valueof F(6.75µm)/F(15µm) flux density ratio of ∼1. Only a fewobjects present peculiar colour profiles: some galaxies have6.75 to 15µm flux densities ratios lower than one in thecentral region (VCC 836, and to a lower extent VCC 460,VCC 1003, VCC 1690, VCC 1727 and VCC 1813). All butone (VCC 1813) are active galaxies (Syfert, LINER). Laurentet al. (2000) have shown that in active galaxies such as AGN theF(6.75µm)/F(15µm) ratio is expected to be lower than one.On the contrary, the Sa VCC 1158 and VCC 2070 have 6.75 to15µm flux densities ratios increasing towards the centre prob-ably due to an higher contribution at 6.75µm than at 15µmof the old stellar component. The two resolved S0a galaxiesVCC 1253 and VCC 1978 have flat colours, with a 6.75 to15µm flux density ratio ≥2. The emission is diffuse withoutany evident morphological structure. 6.75 to 15µm flux den-sity ratio ≥2 in early-type galaxies are easely obtained if theirmid-IR emission is dominated by the cold stellar population.Morphological considerations are thus in total agreement withthose obtained by the analysis of the SED (Boselli et al. 2003).
7. Conclusion
We present new ISOCAM imaging data taken at 6.75 and15µm for a complete, optically-selected, volume-limitedsample of 99 late-type (≥S0a) galaxies in the Virgo cluster. Thissample is composed of 71 objects in the cluster periphery, with

876 A. Boselli et al.: Mid-IR emission of galaxies in the Virgo cluster. III.
Fig. 7. The relationship between the mid-IR 6.75 µm to visible isophotal radii and a) the total mass (as traced by the H band luminosity), b) themorphological type, c) the K band C31(K) concentration index and d) the mid-IR C31(6.75) concentration index.
a projected angular distance θ ≥ 4◦ from M 87, and 28 in thecluster core (θ ≤ 2◦). ISOCAM data for another 24 galax-ies in the Virgo cluster serendipitously observed in the sameframe of other objects (18 galaxies), or found in the ISOCAMdata archive (6 galaxies), are also presented. To these we add22 galaxies in the Coma/A1367 supercluster, out of which 13are Coma members and 6 are in A1367.
All the data here presented are reduced and analysed in ahomogeneous way. Out of the 145 observed galaxies, 34 ob-jects, all in the Virgo cluster, were fully resolved by ISOCAM:for these objects we present images, light profiles and colourprofiles, as well as effective and isophotal radii, surface bright-nesses and light concentration indices.
Our analysis shows that the mid-IR colours of the targetgalaxies are weakely correlated with the total mass of galax-ies, as traced by the H band luminosity, with high values ofF(6.75µm)/F(15µm) (≥1) found generally in massive objects(LH ≥ 1010 LH�), and F(6.75µm)/F(15µm) ≤ 1 in low-mass(LH ≤ 1010 LH�) dwarf galaxies. All early-type galaxies (type≤S0a) have F(6.75µm)/F(15µm) ≥1, as expected if the mid-IR emission is dominated by the photosphere of the cold stellarpopulation.
The mid-IR, near-IR and visible light concentration indicesare tightly correlated in bright, resolved galaxies, indicatingthat the spatial distribution of the mid-IR emitting sources is,to the first order, similar to that of the stars.
The analysis on the origin of the mid-IR emission of late-type galaxies is postponed to a forthcoming communication.
Acknowledgements. A.B. thanks the CEA team for the support duringhis staying in Saclay. We thank G. Sanvito and J. Iglesias for assistencein the preparation of the figures. We wish to thank R. Tuffs, the referee,for his useful comments and suggestions which helped improving thequality of the manuscript. This work is partly financed by the FrenchPrograme National Physique et Chimie du Milieu Interstellaire.
References
Bendo, G. J., Joseph, R. D., Wells, M., et al. 2002, AJ, 123, 3067Binggeli, B., Sandage, A., & Tammann, G. A. 1985, AJ, 90, 1681
(VCC)Binggeli, B., Popescu, C. C., & Tammann, G. A. 1993, A&AS, 98,
275Boselli, A., Lequeux, J., Contursi, A., et al. 1997a, A&A, 324, L13Boselli, A., Tuffs, R. J., Gavazzi, G., Hippelein, H., & Pierini, D.
1997b, A&A, 121, 507

A. Boselli et al.: Mid-IR emission of galaxies in the Virgo cluster. III. 877
Boselli, A., Lequeux, J., & Sauvage, M. 1998, et al. A&A, 335, 53Boselli, A., Gavazzi, G., Lequeux, J., & Pierini, D. 2002, A&A, 385,
454Boselli, A., Gavazzi, G., & Sanvito, G. 2003, A&A, 402, 37Contursi, A., Boselli, A., Gavazzi, G., et al. 2001, A&A, 365, 11Coulais, A., & Abergel, A. 2000, A&AS, 141, 533Cox, P., & Mezger, P. 1989, A&ARv, 1, 49Dale, D. A., Silbermann, N. A., Helou, G., et al. 2000, AJ, 120, 583Desert, F.-X., Boulanger, F., & Puget, J.-L. 1990, A&A, 237, 215de Vaucouleurs, G. 1948, Ann. Astrophys., 11, 247de Vaucouleurs, G. 1977, in Evolution of Galaxies and Stellar
Populations, ed. R. Larson, & B. Tinsley (New Haven: YaleUniversity Observatory), 43
Draine, B. T., & Li, A. 2001, ApJ, 551, 807Dwek, E., Arendt, R., Fixsen, D., et al. 1997, ApJ, 475, 565Elbaz, D., Cesarsky, C. J., Chanial, P., et al. 2002, A&A, 384, 848Gavazzi, G., & Boselli, A. 1996, Astro. Lett. Commun., 35, 1Gavazzi, G., Pierini, D., & Boselli, A. 1996, A&A, 312, 397Gavazzi, G., Boselli, A., Scodeggio, M., Pierini, D., & Belsole, E.
1999a, MNRAS, 304, 595Gavazzi, G., Carrasco, L., & Galli, R. 1999b, A&AS, 136, 227Gavazzi, G., Franzetti, P., Scodeggio, M., Boselli, A., & Pierini, D.
2000, A&A, 361, 863Gavazzi, G., Marcelin, M., Boselli, A., et al. 2001, A&A, 377, 745Laurent, O., Mirabel, L., Charmandaris, V., et al. 2000, A&A, 359,
887Lagache, G., Abergel, A., Boulanger, F., Desert, F. X., & Puget, J.-L.
1999, A&A, 344, 322Leech, K., Volk, H., Heinrichsen, I., et al. 1999, MNRAS, 310, 317
Li, A., & Draine, B. T. 2001, ApJ, 554, 778Miville-Deschenes, M. A., Boulanger, F., Abergel, A., & Bernard, J. P.
2000, A&AS, 146, 519Nilson, P. 1973, Uppsala General Catalogue of Galaxies, Uppsala
Obser. Annu., Vol. 6 (UGC)Pierini, D., Leech, K. J., Tuffs, R. J., & Volk, H. J. 1999, MNRAS,
303, L29Pierini, D., Lequeux, J., Boselli, A., Leech, K. J., & Volk, H. J. 2001,
A&A, 373, 827Popescu, C. C., Misiriotis, A., Kylafis, N. D., Tuffs, R. J., & Fishera,
J. 2000, A&A, 362, 138Popescu, C. C., Tuffs, R. J., Volk, H. J., Pierini, D., & Madore, B. F.
2002, ApJ, 567, 221Popescu, C. C., & Tuffs, R. J. 2002, MNRAS, 335, L41Ristorcelli, I., Serra, G., Lamarre, J. M., et al. 1999, in Solid
Interstellar Matter: The ISO Revolution, ed. L. d’Hendecourt, C.Joblin, & A. Jones (EDP Sciences and Springer-Verlag), 49
Roussel, H., Sauvage, M., Vigroux, L., & Bosma, A. 2001a, A&A,372, 427
Roussel, H., Vigroux, L., Bosma, A., et al. 2001b, A&A, 369, 473Sandage, A., Binggeli, B., & Tammann, G. A. 1985, AJ, 90, 1759Siebenmorgen, R., Blommaert, J., Sauvage, M., & Starck, J. L. 2000,
The ISO handbook. III. CAM - the ISO camera, ESA, SAI-99-057/Dc, Version 1.1
Starck, J. L., Abergel, A., Aussel, A., et al. 1999, A&AS, 134, 135Tuffs, R. J., Popescu, C. C., Pierini, D., et al. 2002, ApJS, 139, 37Zwicky, F., Herzog, E., Karpowicz, M., Kowal, C., & Wild, P. 1961–
1968, Catalogue of Galaxies and of Cluster of Galaxies (Pasadena,California Institute of Technology: CGCG)

A. Boselli et al.: Mid-IR emission of galaxies in the Virgo cluster. III., Online Material p 1
Online Material

A. Boselli et al.: Mid-IR emission of galaxies in the Virgo cluster. III., Online Material p 2
Table 1. The target galaxies.
The ISO Virgo sampleVCC UGC NGC/IC RA(2000) dec Type mpg a b Dist Memb. θ C31(K) C31(B) notes
h m s o ′ ′′ ′ ′ Mpc deg(1) (2) (3) (4) (5) (6) (7) (8) (9) (10) (11) (12) (13) (14) (15)
1 - - 120820.02 134100.2 BCD? 14.78 0.80 0.18 32 M 5.63 3.36 2.684 - - 120830.75 150548.2 Im 17.50 0.50 0.43 32 M 6.06 - -
17 7150 3023 121001.86 142142.4 Im 15.20 0.91 0.45 32 M 5.43 2.85 2.3724 - - 121035.65 114538.5 BCD 14.95 1.00 0.37 32 M 4.99 6.23 2.7826 - - 121040.20 143848.5 Im 17.50 0.43 0.27 32 M 5.39 2.35 -66 7215 4178 121246.27 105156.0 SBc(s) 11.89 5.35 1.87 17 N 4.68 3.24 1.62 *81 7223 4186 121326.18 144620.1 d:Sc 15.60 0.95 0.81 17 N 4.85 3.22 2.6487 - - 121340.91 152713.2 Sm 15.00 1.45 0.72 17 N 5.17 3.18 -92 7231 4192 121348.24 145401.2 Sb: 10.92 9.78 2.60 17 N 4.84 5.04 2.84 *
130 - - 121504.22 94513.5 BCD 16.50 0.63 0.25 17 N 4.68 2.71 -152 7268 4207 121530.31 93508.6 Scd(on edge) 13.48 1.96 0.89 17 N 4.69 3.54 2.21159 - - 121541.50 81707.7 Im 15.08 1.04 0.52 32 W 5.54 2.73 -169 - - 121556.39 93855.7 Im 16.50 0.85 0.43 17 N 4.57 - -171 - - 121558.88 82225.8 Im 17.40 0.57 0.36 32 W 5.43 - -207 - - 121648.07 80302.0 BCD 17.20 0.36 0.13 32 W 5.55 2.63 -318 7352 776 121903.40 85122.7 SBcd 14.01 1.71 1.00 32 W 4.57 2.93 -425 - - 122035.90 81209.3 Im: 17.30 0.43 0.38 23 B 4.89 - -459 - - 122111.46 173818.5 BCD 14.95 0.84 0.36 17 A 5.74 3.09 -460 7405 4293 122112.68 182256.5 Sa pec 11.20 5.10 2.92 17 A 6.42 3.52 2.83 *655 7468 4344 122337.45 173228.5 S pec,N:/BCD 13.21 1.55 1.55 17 A 5.44 2.50 -664 7470 3258 122344.36 122842.5 Sc 13.50 2.60 1.87 17 A 1.73 2.55 -666 - - 122346.13 164728.5 Im: 16.80 1.00 0.57 17 A 4.72 2.80 -692 7476 4351 122401.37 121216.6 Sc(s) 12.93 2.92 1.87 17 A 1.67 2.95 -809 7510 3311 122533.17 121536.3 Sc (on edge) 14.55 1.45 0.36 17 A 1.30 3.24 -836 7520 4388 122546.60 123940.4 Sab 11.83 5.10 1.24 17 A 1.26 4.69 13.70 *848 - - 122552.78 54829.5 Im pec/BCD 14.72 1.16 0.98 23 B 6.70 2.86 -857 7523 4394 122555.64 181249.5 SBb(sr) 11.76 3.60 3.60 17 A 5.94 5.64 4.11 *873 7528 4402 122607.32 130643.6 Sc (on edge) 12.56 3.95 1.16 17 A 1.36 2.95 2.40890 - - 122620.85 64005.7 BCD 16.00 0.21 0.21 23 B 5.83 2.64 -912 7538 4413 122632.16 123639.8 SBbc(rs) 12.97 2.92 1.75 17 A 1.07 3.14 -971 7556 4423 122708.93 55248.1 Sd (on edge) 14.28 3.06 0.43 23 B 6.57 3.44 -984 7562 4425 122713.30 124405.1 SBa 12.82 2.99 1.00 17 A 0.94 4.68 4.36995 7565 3371 122721.55 105155.2 Sc (on edge) 15.32 1.53 0.11 17 A 1.75 3.43 2.69
1002 7566 4430 122726.37 61544.2 SBc(r) 12.48 3.02 2.69 23 B 6.19 2.73 2.381003 7568 4429 122726.31 110629.2 S0/Sa pec 11.15 8.12 3.52 17 A 1.53 5.48 4.65 *1043 7574 4438 122745.52 130031.4 Sb (tides) 10.91 8.12 3.68 17 A 0.97 10.21 8.30 *1047 7581 4440 122753.52 121735.5 SBa(sr) 12.48 2.01 1.71 17 A 0.72 7.42 -1110 7594 4450 122829.27 170506.8 Sab pec 10.93 6.15 4.04 17 A 4.73 4.33 3.65 *1158 7613 4461 122903.01 131101.1 Sa 12.09 3.52 1.29 17 A 0.90 7.45 6.691189 7621 3414 122928.83 64612.3 Sc(s) 13.70 1.84 1.07 17 S 5.63 2.42 -1196 7628 4468 122931.25 140258.3 S0/Sa 13.80 1.76 1.06 17 A 1.69 4.31 -1217 7630 3418 122942.54 112404.4 SBm 14.59 1.87 1.29 17 A 1.03 2.80 -1253 7638 4477 123002.37 133810.6 SB0/SBa 11.31 3.60 3.60 17 A 1.26 8.73 5.86 *1257 - - 123004.68 172401.6 Im pec 16.50 1.36 0.32 17 A 5.01 2.55 -1326 7657 4491 123057.15 112859.1 SBa(s) 13.41 1.89 0.94 17 A 0.91 2.87 -1368 7665 4497 123132.79 113736.4 SB0/SBa 13.12 2.01 0.85 17 A 0.78 2.81 -1379 7669 4498 123139.62 165107.5 SBc(s) 12.62 2.85 1.53 17 A 4.46 2.27 2.111410 7677 4502 123203.22 164114.7 Sm 14.57 1.48 0.78 17 A 4.31 2.8 2.911412 7680 4503 123206.13 111034.8 Sa 12.12 4.33 1.71 17 A 1.25 5.95 5.451419 7682 4506 123210.46 132509.8 Spec(dust) 13.64 2.16 1.29 17 A 1.08 3.44 -1450 7695 3476 123241.91 140256.1 Sc(s) 13.29 2.60 2.01 17 A 1.72 2.93 -1552 7729 4531 123415.77 130429.1 Sa pec 12.58 4.24 2.42 17 A 1.08 3 3.001554 7726 4532 123419.31 62807.1 Sm 12.30 2.60 1.00 17 S 5.99 2.92 2.381569 - 3520 123431.68 133013.2 Scd: 15.00 1.07 0.71 17 A 1.43 3.16 -1575 7736 3521 123439.28 70938.3 SBm pec 13.98 2.00 1.41 17 S 5.32 2.44 1.991581 7739 - 123444.93 61807.4 Sm 14.55 1.46 1.16 17 S 6.17 2.77 -1596 - - 123500.91 91116.5 Im: 17.24 0.35 0.16 17 S 3.36 - -1673 7777 4567 123632.66 111528.6 Sc(s) 12.08 2.92 1.87 17 A 1.80 2.73 2.80 *1675 - - 123634.65 80317.6 Pec 14.47 1.26 0.74 17 S 4.56 2.87 -1676 7776 4568 123634.16 111419.6 Sc(s) 11.70 5.10 1.75 17 A 1.82 4.27 2.87 *1678 7781 3576 123637.61 63716.6 SBd 13.70 2.16 1.87 17 S 5.94 2.91 - *1686 7784 3583 123643.57 131531.7 Sm 13.95 2.79 1.71 17 A 1.68 2.98 2.411690 7786 4569 123649.78 130945.7 Sab(s) 10.25 10.73 5.35 17 A 1.65 4.37 3.11 *1699 7790 3589 123702.24 65530.9 SBm 14.11 1.55 0.83 17 S 5.68 2.64 -1725 - - 123741.51 83331.3 Sm/BCD 14.51 1.55 0.97 17 S 4.19 2.92 -1726 7795 - 123745.08 70622.4 Sdm 14.54 1.29 1.00 17 S 5.55 2.73 -1727 7796 4579 123743.48 114904.4 Sab(s) 10.56 6.29 4.87 17 A 1.78 4.51 3.30 *1730 7794 4580 123748.60 52206.4 Sc/Sa 12.61 2.16 1.60 17 S 7.23 2.68 -1750 - - 123815.48 65938.7 BCD? 16.50 0.31 0.16 17 S 5.70 2.54 -1757 7803 4584 123817.79 130635.8 Sa(s)pec 13.60 1.87 1.00 17 A 1.96 3.53 -1758 7802 - 123820.81 75328.8 Sc (on edge) 14.99 1.71 0.27 17 S 4.87 3.47 -1784 - - 123913.81 153749.4 Im 15.84 0.79 0.63 17 E 3.83 2.80 -1789 - - 123921.34 45619.5 Im 15.07 1.10 0.62 17 S 7.74 2.46 -1791 7822 3617 123924.55 75752.5 SBm/BCD 14.67 1.29 0.64 17 S 4.90 2.86 -1804 - - 123940.25 92355.7 Im/BCD 15.63 0.75 0.30 17 E 3.70 4.33 3.751811 7826 4595 123951.63 151753.9 Sc(s) 12.92 2.16 1.42 17 E 3.64 2.71 -1813 7828 4596 123955.88 101034.9 SBa 11.51 4.76 4.04 17 E 3.14 5.44 4.461822 - - 124010.14 65050.1 Im 15.60 0.63 0.25 17 S 6.00 2.79 2.83

A. Boselli et al.: Mid-IR emission of galaxies in the Virgo cluster. III., Online Material p 3
Table 1. continued.
VCC UGC NGC/IC RA(2000) dec Type mpg a b Dist Memb. θ C31(K) C31(B) notesh m s o ′ ′′ ′ ′ Mpc deg
(1) (2) (3) (4) (5) (6) (7) (8) (9) (10) (11) (12) (13) (14) (15)1885 - - 124137.57 154933.2 Im 16.41 1.16 0.57 17 E 4.32 2.80 -1918 - - 124218.10 54421.7 Im 15.80 1.03 0.36 17 S 7.23 2.81 -1929 7874 4633 124237.12 142122.0 Scd(s) 13.77 2.48 1.07 17 E 3.48 3.14 2.821932 7875 4634 124240.83 141746.0 Sc (on edge) 13.19 2.92 0.87 17 E 3.45 3.08 2.191952 - - 124306.86 73858.4 Im 16.00 0.71 0.35 17 E 5.62 2.93 -1970 - - 124329.11 100534.7 Im,N? 15.80 0.71 0.50 17 E 3.86 2.94 -1972 7896 4647 124332.28 113454.7 Sc(rs) 12.03 2.60 2.16 17 E 3.21 3.06 - *1987 7902 4654 124356.71 130734.0 SBc(rs) 11.14 4.99 2.60 17 E 3.28 2.93 2.171992 7906 - 124410.02 120659.2 Im 15.50 0.81 0.51 17 E 3.27 2.80 3.161999 7915 4659 124429.38 132953.5 Sa 13.08 1.99 1.25 17 E 3.51 6.03 -2006 7920 3718 124445.93 122111.7 Amorphous 13.68 2.60 0.71 17 E 3.40 3.19 -2007 - 3716 124447.50 80629.7 Im/BCD: 15.20 0.78 0.41 17 E 5.49 2.70 -2023 7932 3742 124531.55 131951.3 SBc(s) 13.86 2.01 1.00 17 E 3.70 3.09 -2033 - - 124604.76 82830.8 BCD 14.65 0.73 0.73 17 E 5.42 3.70 -2034 - - 124607.96 100948.8 Im 15.82 0.78 0.52 17 E 4.36 2.46 9.722037 - - 124615.15 101224.9 Im/BCD 15.92 0.88 0.38 17 E 4.37 2.92 3.602058 7965 4689 124745.39 134548.3 Sc(s) 11.55 5.86 4.44 17 E 4.34 2.80 2.782066 7969 4694 124815.05 105906.7 Amorphous 12.19 3.20 1.16 17 E 4.49 4.21 6.88 *2070 7970 4698 124822.96 82913.8 Sa 11.53 5.67 2.84 17 E 5.82 5.78 5.90 *2087 7997 4733 125106.81 105444.3 SB0/a 12.63 1.96 1.96 17 E 5.18 2.73 -2094 - - 125235.75 102648.7 Im: 17.80 0.37 0.37 17 E 5.68 - -
The Virgo serendipitous sampleVCC UGC NGC/IC RA(2000) dec Type mpg a b Dist Memb. θ C31(K) C31(B) notes
h m s o ′ ′′ ′ ′ Mpc deg(1) (2) (3) (4) (5) (6) (7) (8) (9) (10) (11) (12) (13) (14) (15)
5 - - 120833.15 150718.2 dE 18.90 0.39 0.25 32 M 6.06 - -79 - - 121320.19 144819.1 Im? 17.20 0.57 0.28 17 N 4.89 - 1.7590 - - 121347.15 145013.2 dE 18.50 0.33 0.33 17 N 4.81 - -
147 - - 121526.42 93543.6 dE,N 19.00 0.25 0.25 17 N 4.70 - -644 - - 122329.26 173228.4 dE 20.00 0.28 0.28 17 A 5.45 - -823 - - 122539.36 121853.4 dE,N 16.06 0.84 0.84 17 A 1.27 - -832 - - 122544.10 124029.4 dE? 19.00 0.28 0.28 17 A 1.28 - 2.75884 - - 122615.21 130829.6 dE: 18.50 0.43 0.43 17 A 1.34 - -899 - - 122626.24 64229.7 Sm: 16.60 0.57 0.28 56 Bckg 5.79 - -
1018 7570 4432 122732.87 61354.3 Sc(s) 14.81 1.10 1.10 86.2 Bckg 6.21 - 2.871030 7575 4435 122740.42 130444.3 SB0 11.84 2.92 2.48 17 A 1.03 10.06 7.07 *1146 7610 4458 122857.51 131431.0 E 12.93 1.80 1.52 17 A 0.96 7.99 7.651366 - - 123131.30 113544.4 dE,N 17.60 0.35 0.35 17 A 0.81 - -1385 - - 123147.21 165014.6 dE?,N 19.00 0.20 0.20 17 A 4.45 - -1821 - - 124008.93 65302.1 ? 17.20 0.41 0.20 17 S 5.97 - 1.901944 - - 124251.62 141722.2 BCD? 18.00 0.46 0.22 17 E 3.49 - -1978 7898 4649 124339.58 113309.8 S0 9.81 5.10 5.10 17 E 3.25 4.96 - *2028 - - 124537.25 131942.4 dE: 16.60 0.85 0.27 17 E 3.72 - -
Other galaxies in the Virgo clusterVCC UGC NGC/IC RA(2000) dec Type mpg a b Dist Memb. θ C31(K) C31(B) notes
h m s o ′ ′′ ′ ′ Mpc deg(1) (2) (3) (4) (5) (6) (7) (8) (9) (10) (11) (12) (13) (14) (15)
1226 7629 4472 122946.74 80001.4 E/S0 9.31 10.25 8.11 17 S 4.40 7.34 6.56 *1508 7709 4519 123330.18 83916.6 SBc(rs) 12.34 3.60 2.60 17 S 3.79 3.17 -1555 7727 4535 123420.32 81154.1 SBc(s) 10.51 8.33 7.43 17 S 4.28 2.18 2.601632 7760 4552 123539.87 123325.0 S0 10.78 7.23 7.23 17 A 1.19 7.92 - *1939 7878 4636 124249.63 24118.1 E/S0 10.48 9.63 8.79 17 S 10.15 10.44 5.77 *
CGCG43041 7985 4713 124957.78 51839.2 Sc 12.3 3.20 2.16 17 S 8.51 2.93 - *
Galaxies in the clusters A1367 and ComaCGCG UGC NGC/IC RA(2000) dec Type mpg a b Dist Memb. θ C31(K) C31(B) notes
h m s o ′ ′′ ′ ′ Mpc deg(1) (2) (3) (4) (5) (6) (7) (8) (9) (10) (11) (12) (13) (14) (15)
97062 - - 114214.64 195832.5 Pec 15.5 1.01 0.40 91.3 A1367 0.53 3.16 2.9397073 - - 114256.43 195759.0 Pec 15.6 0.76 0.74 91.3 A1367 0.37 2.74 2.1397079 - - 114313.35 200016.4 Pec 15.7 0.75 0.45 91.3 A1367 0.33 2.88 2.1197087 6697 - 114348.78 195809.7 Pec 14.3 2.00 0.50 91.3 A1367 0.20 3.45 1.82 *
97087N - - 114349.80 195834.0 Pec 17.2 0.20 0.15 91.3 A1367 0.20 - -97138 - - 114544.77 200151.1 Pec 15.5 0.75 0.64 91.3 A1367 0.38 2.93 -
160020 - - 125606.05 274039.9 Pec 15.5 0.45 0.22 96 Coma 0.90 2.13 2.97 *160026 - 3913 125628.56 271729.2 Sc 15.5 0.85 0.55 96 Coma 1.03 3.95 2.9160055 8082 4848 125805.55 281432.8 Sab 14.2 1.51 0.58 96 Coma 0.48 4.12 2.96160067 - - 125837.17 271036.0 Pec 15.4 0.56 0.52 96 Coma 0.85 2.40 -160076 - - 125940.23 283751.2 Sc 15.6 0.64 0.60 96 Coma 0.65 3.25 -160086 - - 130033.58 273814.2 Pec 15.4 0.75 0.54 96 Coma 0.37 3.34 - *160088 8118 842 130039.63 290111.1 Sb 14.6 1.12 0.64 96 Coma 1.05 3.15 2.25160095 8134 4921 130126.09 275308.1 Sb 13.7 2.28 2.23 96 Coma 0.35 3.46 2.83160127 - - 130426.46 271816.7 Sc 15.5 0.95 0.64 96 Coma 1.21 3.40 -160128 - - 130422.57 284838.5 Pec 15.3 0.63 0.62 96 Coma 1.29 3.00 2.38 *160139 - - 130637.92 285059.1 Pec 15.0 1.22 0.64 96 Coma 1.71 2.73 -160252 - 4040 130037.74 280328.2 Pec 15.1 0.85 0.36 96 Coma 0.18 3.26 2.22160260 8128 4911 130056.10 274727.5 Sa 13.7 1.89 1.50 96 Coma 0.30 2.47 2.28

A. Boselli et al.: Mid-IR emission of galaxies in the Virgo cluster. III., Online Material p 4
Table 1. continued.
Other galaxies in the Coma/A1367 superclusterCGCG UGC NGC/IC RA(2000) dec Type mpg a b Dist Memb. θ C31(K) C31(B) notes
h m s o ′ ′′ ′ ′ Mpc deg(1) (2) (3) (4) (5) (6) (7) (8) (9) (10) (11) (12) (13) (14) (15)
159072N 7938 4676 124610.19 304354.7 Pec(tides) 14.8 2.20 0.40 88.4 Pair 4.07 3.53 - *159072S 7939 - 124611.38 304325.0 Pec(tides) 14.8 1.70 0.70 87.9 Pair 4.06 3.62 - *
130023 - 860 131504.07 243701.3 Sa 14.8 0.96 0.61 54.1 Group 4.78 - 2.78 *
Notes on morphological type:VCC 66: HII; VCC 92: M 98: HII and Seyfert; VCC 460: LINER; VCC 836: Seyfert2; VCC 857: LINER; VCC 1003: HII LINER; VCC 1030:LINER, tidally interacting with VCC 1043 (Arp 120); VCC 1043: LINER, tidally interacting with VCC 1030 (Arp 120); VCC 1110: LINER;VCC 1226: Seyfert2, M 49, Arp 134; VCC 1253: Seyfert 2; VCC 1632: LINER HII, M 89; VCC 1673: interacting with VCC 1676?; VCC 1676:interacting with VCC 1673?; VCC 1678: HII; VCC 1690: M 90: LINER, Seyfert; VCC 1727: M 58; LINER, Seyfert 1.9; VCC 1939: LINER;VCC 1972: interacting with VCC 1978 (M 60; Arp 116)?; VCC 1978: interacting with VCC 1972 (Arp 116)?; VCC 2066: HII; VCC 2070:Seyfert 2; CGCG 43041: LINER; CGCG 97087: merging system (Gavazzi et al. 2001); CGCG 130023: HII; CGCG 159072N,S: Arp 242CGCG 160020: HII; CGCG 160086: starburst; CGCG 160128: HII.

A.B
osellietal.:Mid-IR
emission
ofgalaxies
inthe
Virgo
cluster.III.,Online
Materialp
5
Table 2. The results of the observations.
The ISO Virgo sampleVCC Raster FOV tint F(6.75) Bg(6.75) σ(s)6.75 σ(p)6.75 Q F(15) Bg(15) σ(s)15 σ(p)15 Q Notes
′ s mJy µJy arcsec−2 µJy arcsec−2 µJy arcsec−2 mJy µJy arcsec−2 µJy arcsec−2 µJy arcsec−2
(1) (2) (3) (4) (5) (6) (7) (8) (9) (10) (11) (12) (13) (14) (15)1 3×3 6.4 2.10 1.15 ± 0.34 174.6 0.2 0.5 1 2.86 ± 0.60 1007.9 0.4 0.7 24 3×3 6.4 2.10 <0.45 204.6 0.2 0.5 - <0.79 1074.5 0.4 0.7 -
17 3×3 6.4 2.10 0.98 ± 0.39 204.6 0.2 0.5 2 1.76 ± 0.46 1093.7 0.3 0.6 124 3×3 6.4 2.10 0.37 ± 0.23 210.4 0.1 0.4 2 0.82 ± 0.75 1139.5 0.4 0.6 226 3×3 6.4 2.10 <0.41 204.7 0.2 0.5 - <0.71 1063.5 0.4 0.7 -66 5×5 9.6 2.10 229.59 ± 13.39 175.6 0.2 0.7 1 192.69 ± 63.23 1052.2 1.1 1.6 281 3×3 6.4 2.10 <0.49 194.8 0.1 0.6 - <0.99 1063.2 0.3 0.7 -87 3×3 6.4 2.10 2.18 ± 0.67 194.6 0.2 0.5 1 0.74 ± 0.80 1034.7 0.3 0.6 292 7×7 12.8 2.10 900.15 ± 22.78 95.9 0.4 0.7 1 692.42 ± 18.06 632.1 0.3 1.3 1
130 3×3 6.4 2.10 <0.55 237.3 0.2 0.5 - <0.41 1283.9 0.1 0.7 -152 3×3 6.4 2.10 173.99 ± 1.52 236.4 0.4 0.7 1 145.13 ± 1.79 1039.3 0.4 0.6 1159 3×3 6.4 2.10 <0.90 177.9 0.2 0.5 - <2.09 1068.6 0.6 0.7 -169 3×3 6.4 2.10 <0.73 235.8 0.2 0.5 - <1.27 1256.2 0.4 0.7 -171 3×3 6.4 2.10 <0.50 178.9 0.2 0.5 - <0.62 1073.1 0.3 0.7 -207 3×3 6.4 2.10 <0.36 178.2 0.2 0.4 - <0.82 1050.3 0.6 0.7 -318 3×3 6.4 2.10 3.08 ± 0.84 227.1 0.2 0.5 1 5.16 ± 1.47 1041.0 0.4 0.6 2425 3×3 6.4 2.10 <0.25 171.1 0.1 0.5 - <0.31 1048.0 0.1 0.6 -459 3×3 6.4 2.10 2.87 ± 0.20 171.6 0.1 0.5 1 2.96 ± 0.62 897.5 0.4 0.6 2460 5×5 9.6 2.10 195.11 ± 9.18 168.3 0.4 0.8 1 186.36 ± 10.86 917.0 0.4 1.0 1655 3×3 6.4 2.10 42.05 ± 0.68 166.4 0.4 0.7 2 15.17 ± 0.81 894.3 0.4 1.0 2664 3×3 6.4 2.10 7.09 ± 2.31 159.5 0.4 0.5 1 15.17 ± 3.63 972.5 0.6 0.6 1666 3×3 6.4 2.10 <0.88 168.8 0.2 0.6 - <1.53 896.0 0.4 0.9 -692 3×3 6.4 2.10 33.64 ± 0.76 162.2 0.2 0.6 1 25.22 ± 1.33 997.7 0.4 0.9 1809 3×3 6.4 2.10 5.97 ± 0.67 185.3 0.2 0.5 1 3.57 ± 2.34 1016.7 0.9 0.7 1836 5×5 9.6 2.10 528.11 ± 6.89 156.7 0.4 0.7 1 1064.56 ± 10.87 992.8 0.6 1.0 2848 3×3 6.4 2.10 1.20 ± 0.27 168.2 0.1 0.4 1 <2.37 1032.9 0.6 0.7 -857 4×4 8.0 2.10 114.95 ± 4.93 167.4 0.4 0.6 1 98.30 ± 7.78 908.4 0.6 0.9 1873 4×4 8.0 2.10 500.01 ± 6.31 157.8 0.2 0.8 1 525.45 ± 11.19 980.7 0.4 1.4 1890 4×4 8.0 2.10 <0.28 174.0 0.2 0.5 - <0.61 1052.7 0.6 0.6 - *912 3×3 6.4 2.10 60.94 ± 1.28 158.2 0.2 0.6 1 54.72 ± 2.99 993.5 0.6 0.9 1971 3×3 6.4 2.10 8.21 ± 2.00 165.8 0.2 0.5 1 6.57 ± 2.36 1010.6 0.3 0.6 1984 4×4 8.0 2.10 19.56 ± 0.33 154.6 0.2 0.5 1 9.69 ± 0.40 984.7 0.3 0.7 2995 3×3 6.4 2.10 1.40 ± 0.72 206.4 0.2 0.4 2 3.02 ± 1.69 1124.6 0.6 0.7 1
1002 3×3 6.4 2.10 119.35 ± 4.23 167.0 0.5 1.0 2 72.17 ± 14.91 985.0 1.7 1.3 11003 6×6 11.2 2.10 267.86 ± 8.05 175.2 0.2 0.7 1 192.87 ± 33.23 1090.7 1.0 1.4 11043 7×7 12.8 2.10 259.53 ± 4.76 176.8 0.4 0.7 1 247.26 ± 15.00 905.3 1.1 1.6 11047 3×3 6.4 2.10 - - - - - 5.09 ± 1.86 920.6 0.4 0.7 11110 5×5 9.6 2.10 236.00 ± 6.80 158.9 0.2 0.7 1 252.78 ± 28.05 879.1 1.0 1.4 11158 4×4 8.0 2.10 44.15 ± 0.70 149.7 0.2 0.6 1 16.45 ± 2.42 906.6 0.9 0.9 11189 3×3 6.4 2.10 12.89 ± 0.94 162.5 0.2 0.6 1 5.80 ± 1.64 1008.8 0.4 0.7 11196 3×3 6.4 2.10 6.03 ± 0.87 149.1 0.2 0.4 1 1.82 ± 3.05 890.3 0.9 0.7 21217 3×3 6.4 2.10 3.65 ± 0.95 162.5 0.2 0.5 2 <6.65 1029.5 0.9 0.7 -1253 4×4 8.0 2.10 96.85 ± 1.13 150.0 0.2 0.5 1 28.74 ± 4.61 878.3 1.0 0.9 11257 3×3 6.4 2.10 <1.24 159.8 0.2 0.5 - 1.75 ± 1.09 850.8 0.4 0.6 21326 3×3 6.4 2.10 27.00 ± 0.96 167.4 0.2 0.4 1 70.10 ± 2.81 1054.0 0.7 0.6 11368 3×3 6.4 2.10 8.62 ± 1.05 161.5 0.2 0.5 1 3.59 ± 1.25 1043.5 0.3 0.6 21379 4×4 8.0 2.10 95.88 ± 3.06 162.7 0.2 0.5 1 62.02 ± 3.63 874.9 0.3 0.7 11410 3×3 6.4 2.10 9.68 ± 0.70 161.4 0.2 0.6 1 4.51 ± 27.98 859.4 9.9 0.7 21412 3×3 6.4 2.10 47.83 ± 5.30 166.2 0.4 0.5 1 13.47 ± 10.45 1051.6 0.7 0.9 11419 3×3 6.4 2.10 16.31 ± 0.63 149.5 0.1 0.6 1 12.50 ± 2.74 894.4 0.6 0.7 11450 3×3 6.4 2.10 72.46 ± 2.31 151.8 0.4 0.6 1 59.61 ± 3.64 881.2 0.6 0.9 11552 4×4 8.0 2.10 40.15 ± 1.11 145.5 0.4 0.5 1 27.73 ± 1.32 888.3 0.4 0.7 11554 3×3 6.4 2.10 183.96 ± 2.32 156.5 0.4 0.7 1 213.47 ± 2.75 996.5 0.4 0.9 11569 3×3 6.4 2.10 0.80 ± 0.46 139.0 0.2 0.4 2 <2.15 826.1 0.6 0.6 -1575 3×3 6.4 2.10 47.48 ± 1.05 157.4 0.2 0.5 1 46.02 ± 1.25 994.5 0.3 0.7 11581 3×3 6.4 2.10 <1.36 158.9 0.2 0.5 - <2.38 996.5 0.4 0.6 -

A.B
osellietal.:Mid-IR
emission
ofgalaxies
inthe
Virgo
cluster.III.,Online
Materialp
6Table 2. continued.
VCC Raster FOV tint F(6.75) Bg(6.75) σ(s)6.75 σ(p)6.75 Q F(15) Bg(15) σ(s)15 σ(p)15 Q Notes′ s mJy µJy arcsec−2 µJy arcsec−2 µJy arcsec−2 mJy µJy arcsec−2 µJy arcsec−2 µJy arcsec−2
(1) (2) (3) (4) (5) (6) (7) (8) (9) (10) (11) (12) (13) (14) (15)1596 3×3 6.4 2.10 <0.21 157.4 0.1 0.4 - <0.62 945.4 0.4 0.7 -1673 5×5 9.6 2.10 324.33 ± 6.48 174.8 0.4 0.7 1 319.63 ± 22.95 973.2 1.3 1.8 1 *1675 3×3 6.4 2.10 <1.66 156.3 0.4 0.4 - <0.77 975.1 0.1 0.7 -1676 5×5 9.6 2.10 973.91 ± 7.04 174.8 0.4 0.7 1 1050.86 ± 24.95 973.2 1.3 1.8 1 *1678 3×3 6.4 2.10 <3.48 154.8 0.4 0.4 - <10.93 962.0 1.1 0.6 -1686 4×4 8.0 2.10 25.20 ± 2.59 143.9 0.4 0.7 2 19.42 ± 4.07 872.3 0.6 1.0 2 *1690 8×8 14.4 2.10 830.16 ± 18.63 144.2 0.4 0.7 1 972.71 ± 36.73 872.0 0.7 1.0 11699 3×3 6.4 2.10 4.15 ± 0.74 150.6 0.2 0.5 1 14.04 ± 0.46 991.1 0.1 0.6 11725 3×3 6.4 2.10 2.32 ± 0.38 150.9 0.1 0.4 2 2.70 ± 0.46 956.9 0.1 0.6 21726 3×3 6.4 2.10 <0.60 158.2 0.1 0.4 - <2.03 967.4 0.4 0.6 -1727 6×6 11.2 2.10 658.15 ± 31.02 172.2 0.6 0.7 1 646.18 ± 7.59 974.2 0.1 1.4 11730 3×3 6.4 2.10 99.75 ± 1.17 155.1 0.2 0.5 1 97.40 ± 1.41 1051.0 0.3 0.9 11750 3×3 6.4 2.10 0.28 ± 0.10 156.5 0.1 0.5 3 <0.93 940.1 0.7 0.9 -1757 3×3 6.4 2.10 <0.99 142.2 0.1 0.4 - <2.27 867.9 0.3 0.7 -1758 3×3 6.4 2.10 5.92 ± 0.83 152.9 0.2 0.4 1 0.98 ± 0.99 938.5 0.3 0.6 21784 3×3 6.4 2.10 <0.68 152.8 0.2 0.5 - <2.69 843.5 1.0 1.0 -1789 3×3 6.4 2.10 1.40 ± 0.26 210.2 0.1 0.5 2 <2.78 1192.2 0.7 0.9 -1791 3×3 6.4 2.10 1.88 ± 0.57 151.9 0.2 0.4 2 2.97 ± 0.37 958.6 0.1 0.6 11804 3×3 6.4 2.10 0.41 ± 0.17 178.2 0.1 0.4 2 <3.62 1020.4 1.4 0.9 -1811 3×3 6.4 2.10 74.49 ± 2.83 158.6 0.5 0.7 1 52.59 ± 2.51 877.3 0.4 0.7 11813 5×5 9.6 2.10 126.86 ± 4.76 188.3 0.4 0.7 1 40.01 ±13.12 1063.2 1.0 1.3 11822 3×3 6.4 2.10 0.72 ± 0.15 151.9 0.1 0.4 2 <0.94 960.3 0.4 0.6 -1885 3×3 6.4 2.10 <1.02 153.1 0.2 0.4 - <1.23 836.6 0.3 0.7 -1918 3×3 6.4 2.10 0.87 ± 0.45 204.6 0.2 0.5 2 1.00 ± 0.78 1170.9 0.4 0.6 21929 6×6 11.2 2.10 29.28 ± 0.88 140.4 0.2 0.6 1 35.14 ± 2.55 827.4 0.7 1.3 1 *1932 6×6 11.2 2.10 290.08 ± 3.30 140.4 0.2 0.6 1 265.79 ± 9.74 827.4 0.7 1.3 1 *1952 3×3 6.4 2.10 <0.61 206.7 0.2 0.5 - <1.05 1010.8 0.4 0.6 -1970 3×3 6.4 2.10 <0.61 163.1 0.2 0.5 - <2.74 940.2 1.1 0.7 -1972 6×6 11.2 2.10 501.09 ± 2.34 181.0 0.4 1.0 1 493.38 ± 7.28 846.4 1.1 1.6 11987 5×5 9.6 2.10 1051.86 ± 27.70 173.0 0.5 1.0 1 1101.42 ± 32.80 820.0 0.6 1.3 11992 3×3 6.4 2.10 0.58 ± 0.18 138.6 0.1 0.4 3 <1.21 0.61 829.1 0.4 0.7 -1999 3×3 6.4 2.10 10.06 ± 1.04 140.7 0.2 0.5 1 3.98 ± 4.30 811.4 1.0 2.0 22006 3×3 6.4 2.10 2.93 ± 0.78 170.3 0.1 0.4 1 1.49 ± 1.83 803.9 0.3 0.6 22007 3×3 6.4 2.10 1.80 ± 0.33 202.2 0.2 0.5 1 <2.28 983.7 0.9 0.9 -2023 3×3 6.4 2.10 5.46 ± 1.05 135.3 0.2 0.5 1 5.45 ± 1.85 786.1 0.4 0.6 12033 3×3 6.4 2.10 0.59 ± 0.17 196.5 0.1 0.4 2 1.17 ± 0.88 1097.2 0.7 0.6 32034 3×3 6.4 2.10 0.19 ± 0.33 164.4 0.2 0.4 3 <0.49 926.7 0.1 0.7 -2037 3×3 6.4 2.10 <0.75 160.4 0.2 0.4 - <1.72 947.0 0.6 0.5 -2058 5×5 9.6 2.10 316.50 ± 9.16 131.6 0.4 0.6 1 352.68 ± 18.06 797.9 0.7 1.0 12066 4×4 8.0 2.10 68.00 ± 0.64 182.2 0.2 0.5 1 68.13 ± 2.96 1009.8 1.1 0.7 12070 4×4 8.0 2.10 88.49 ± 2.95 185.7 0.2 0.5 1 66.58 ± 8.69 1026.9 0.7 1.0 12087 3×3 6.4 2.10 11.46 ± 1.51 183.3 0.4 0.5 1 7.06 ± 1.21 1011.2 0.3 0.7 12094 3×3 6.4 2.10 0.44 ± 0.19 185.9 0.2 0.5 3 <0.46 1013.3 0.3 0.7 -

A.B
osellietal.:Mid-IR
emission
ofgalaxies
inthe
Virgo
cluster.III.,Online
Materialp
7
Table 2. continued.
The Virgo serendipitous sampleVCC Raster FOV tint F(6.75) Bg(6.75) σ(s)6.75 σ(p)6.75 Q F(15) Bg(15) σ(s)15 σ(p)15 Q Notes
′′ s mJy µJy arcsec−2 µJy arcsec−2 µJy arcsec−2 mJy µJy arcsec−2 µJy arcsec−2 µJy arcsec−2
(1) (2) (3) (4) (5) (6) (7) (8) (9) (10) (11) (12) (13) (14) (15)5 3×3 6.4 2.10 <0.38 204.6 0.2 0.5 - <0.66 1074.5 0.4 0.7 - 4
79 3×3 6.4 2.10 <0.33 194.8 0.1 0.6 - <0.62 1063.2 0.3 0.7 - 8190 7×7 12.8 2.10 <0.52 95.9 0.4 0.6 - <0.51 632.1 0.3 1.1 - 92
147 3×3 6.4 2.10 <0.32 236.4 0.2 0.6 - <0.55 1039.3 0.4 1.0 - 152644 3×3 6.4 2.10 <0.48 166.4 0.2 0.7 - <0.58 900.8 0.4 1.0 - 655823 3×3 6.4 2.10 <0.73 185.3 0.2 0.5 - <2.46 1016.7 0.9 0.9 - 809832 5×5 9.6 2.10 <0.48 156.4 0.2 0.7 - <0.73 993.2 0.6 1.0 - 836884 4×4 8.0 2.10 <0.49 157.8 0.2 0.7 - <0.74 981.0 0.4 1.0 - 873899 4×4 8.0 2.10 <0.50 174.0 0.2 0.5 - <1.13 1052.7 0.6 0.6 - 890
1018 3×3 6.4 2.10 7.68 ± 0.74 167.4 0.4 0.7 2 2.02 ± 3.31 986.1 1.4 1.0 1 10021030 7×7 12.8 2.10 119.98 ± 4.61 177.3 0.4 0.7 1 76.48 ± 8.73 904.9 0.6 1.1 1 10431146 4×4 8.0 2.10 9.67 ± 0.91 149.7 0.2 0.6 1 4.83 ± 3.16 906.6 0.9 0.9 1 11581366 3×3 6.4 2.10 <0.38 161.5 0.2 0.6 - <0.44 1043.5 0.3 0.7 - 13681385 4×4 8.0 2.10 <0.27 162.7 0.2 0.5 - <0.34 874.9 0.3 0.7 - 13791821 3×3 6.4 2.10 <0.22 151.9 0.1 0.4 - <0.67 960.3 0.4 0.6 - 18221944 6×6 11.2 2.10 0.32 ± 0.22 140.4 0.2 0.6 3 <1.22 827.4 0.7 1.0 - 19321978 6×6 11.2 2.10 431.24 ± 7.06 181.0 0.4 1.0 1 171.69 ± 22.18 845.4 1.1 1.3 1 19722028 3×3 6.4 2.10 <0.74 135.3 0.2 0.5 - <1.26 786.1 0.4 0.6 - 2023
Other galaxies in the Virgo clusterVCC Raster FOV tint F(6.75) Bg(6.75) σ(s)6.75 σ(p)6.75 Q F(15) Bg(15) σ(s)15 σ(p)15 Q Notes
′ s mJy µJy arcsec−2 µJy arcsec−2 µJy arcsec−2 mJy µJy arcsec−2 µJy arcsec−2 µJy arcsec−2
(1) (2) (3) (4) (5) (6) (7) (8) (9) (10) (11) (12) (13) (14) (15)1226 5×5 1.8 5.04 31.17 ±41.41 55.3 0.6 0.7 3 10.76 ± 19.62 259.8 0.3 0.6 3 *1508 2×2 4.45 5.04 158.09 ± 3.92 183.2 0.4 1.0 2 201.81 ± 10.76 1049.5 1.0 1.8 2 *1555 4×4 8.0 5.04 1029.23 ± 37.09 169.4 0.4 0.8 1 853.78 ± 102.39 1043.4 1.0 1.8 11632 5×3 15.2x3.6 1.12 180.51 ± 13.10 175.0 0.4 0.8 2 39.31 ± 25.82 986.5 0.7 1.4 3 *1939 5×5 1.8 5.04 11.51 ± 22.13 70.0 0.4 0.5 3 3.49 ± 26.18 348.9 0.4 0.3 3 *
CGCG43041 2×2 4.45 5.04 189.20 ± 8.53 130.5 1.0 1.0 2 133.95 ± 10.12 847.5 1.1 1.7 2 *
Galaxies in the clusters A1367 and ComaCGCG Raster FOV tint F(6.75) Bg(6.75) σ(s)6.75 σ(p)6.75 Q F(15) Bg(15) σ(s)15 σ(p)15 Q Notes
′ s mJy µJy arcsec−2 µJy arcsec−2 µJy arcsec−2 mJy µJy arcsec−2 µJy arcsec−2 µJy arcsec−2
(1) (2) (3) (4) (5) (6) (7) (8) (9) (10) (11) (12) (13) (14) (15)97062 2×2 4.2 5.04 9.60 ± 0.48 171.3 0.2 0.2 1 7.20 ± 0.86 916.7 0.4 0.4 197073 2×2 4.2 5.04 5.78 ± 0.25 170.9 0.2 0.2 1 2.74 ± 0.44 911.1 0.4 0.3 197079 2×2 4.2 5.04 6.40 ± 0.25 171.2 0.2 0.2 1 7.48 ± 0.44 924.0 0.4 0.4 197087 2×2 4.2 5.04 50.83 ± 3.30 171.2 0.4 0.4 1 52.40 ± 6.50 919.8 0.7 0.4 1
97087N 2×2 4.2 5.04 2.92 ± 0.10 171.2 0.2 0.4 2 2.09 ± 0.16 919.8 0.4 0.4 1 *97138 2×2 4.2 5.04 1.62 ± 0.09 167.3 0.1 0.2 1 1.08 ± 0.37 904.9 0.6 0.4 2
160020 2×2 4.2 5.04 15.52 ± 0.36 88.8 0.2 0.4 1 17.27 ± 0.44 528.2 0.3 0.6 1160026 2×2 4.2 5.04 7.89 ± 0.36 89.7 0.2 0.2 1 6.90 ± 0.44 542.8 0.3 0.6 1160055 2×2 4.2 5.04 41.77 ± 0.80 87.0 0.2 0.4 1 42.20 ± 0.95 513.7 0.3 0.6 1160067 2×2 4.2 5.04 14.30 ± 0.36 100.0 0.2 0.2 1 13.41 ± 0.43 557.7 0.3 0.4 1160076 2×2 4.2 5.04 2.14 ± 0.36 86.2 0.2 0.2 1 1.73 ± 0.43 558.0 0.3 0.4 1160086 2×2 4.2 5.04 9.18 ± 0.36 86.2 0.2 0.4 1 10.87 ± 0.44 525.1 0.3 0.6 1160088 2×2 4.2 5.04 19.40 ± 1.19 88.7 0.2 0.4 1 12.22 ± 1.42 520.8 0.3 0.6 1160095 2×2 4.2 5.04 14.08 ± 1.92 88.8 0.2 0.4 1 9.22 ± 2.27 529.2 0.3 0.4 1160127 2×2 4.2 5.04 3.02 ± 0.25 84.4 0.2 0.4 1 3.42 ± 0.30 503.4 0.3 0.4 1160128 2×2 4.2 5.04 4.82 ± 0.36 83.8 0.2 0.2 1 4.59 ± 0.22 505.4 0.1 0.3 1160139 2×2 4.2 5.04 3.07 ± 0.63 81.8 0.2 0.2 1 3.39 ± 0.38 502.6 0.1 0.3 1160252 2×2 4.2 5.04 36.86 ± 0.79 86.7 0.2 0.2 1 37.10 ± 0.95 517.9 0.3 0.4 1160260 2×2 4.2 5.04 67.75 ± 1.19 89.2 0.2 0.4 1 68.45 ± 1.41 530.0 0.3 0.4 1

A.B
osellietal.:Mid-IR
emission
ofgalaxies
inthe
Virgo
cluster.III.,Online
Materialp
8Table 2. continued.
Other galaxies in the Coma/A1367 superclusterVCC Raster FOV tint F(6.75) Bg(6.75) σ(s)6.75 σ(p)6.75 Q F(15) Bg(15) σ(s)15 σ(p)15 Q Notes
′ s mJy µJy arcsec−2 µJy arcsec−2 µJy arcsec−2 mJy µJy arcsec−2 µJy arcsec−2 µJy arcsec−2
(1) (2) (3) (4) (5) (6) (7) (8) (9) (10) (11) (12) (13) (14) (15)159072N 2×2 2.1 2.1 65.54 ± 2.97 35.4 0.6 0.5 1 68.82 ± 5.62 166.5 1.1 0.7 1 *159072S 2×2 2.1 2.1 11.23 ± 2.05 35.4 0.6 0.5 1 11.96 ± 3.87 166.5 1.1 0.7 1 *
130023 2×2 4.45 5.04 28.69 ± 0.80 113.9 0.5 0.5 2 63.58 ± 1.42 602.6 0.9 0.9 2 *
Notes:σ(s)λ and σ(p)λ are given in units of mJy per 6′′×6′′ pixel.VCC 890: in the same frame of VCC 899.VCC 1508: at 15 µm tint = 2.1 s.VCC 1632: at 15 µm tint = 2.1 s.VCC 1673: in the same frame of VCC 1676.VCC 1676: in the same frame of VCC 1673.VCC 1686: the given value is the average value obtained from the pointed observation of VCC 1686 and that extracted from the image of the nearby VCC 1690.VCC 1929: in the same frame of VCC 1932.VCC 1932: in the same frame of VCC 1929.VCC 1226: images taken with a pixel size of 3 arcsec.VCC 1939: images taken with a pixel size of 3 arcsec.CGCG 43041: at 15 µm tint = 2.1 s.CGCG 97087N: serendipitously detected in the frame of CGCG 97087.CGCG 159072N and S: in the same frame, obtained with a pixel size of 3 arcsec.CGCG 130023: at 15 µm tint = 2.1 s.

A. Boselli et al.: Mid-IR emission of galaxies in the Virgo cluster. III., Online Material p 9
Table 4. Parameters of the resolved galaxies.
VCC C31(6.75) r5(6.75) Re(6.75) µe(6.75) C31(15) r5(15) Re(15) µe(15)” ” µJy arcsec−2 ” ” µJy arcsec−2
(1) (2) (3) (4) (5) (6) (7) (8) (9)66 3.02 111 78 16 2.58 104 78 1892 3.85 - 90 46 2.28 194 112 40
460 7.26 75 34 66 5.16 54 13 323655 1.98 20 12 39 1.87 19 13 20692 2.99 26 15 34 2.65 21 11 31836 4.91 65 21 422 4.21 66 11 2117857 3.19 55 91 6 3.35 54 114 05873 2.84 76 43 126 2.90 76 41 120912 3.20 34 15 56 5.26 28 18 44984 5.48 17 50 4 2.98 - 43 1
1002 1.73 44 34 18 1.69 43 36 121003 7.07 86 48 40 11.45 46 72 151043 5.13 54 24 121 4.75 53 21 1061110 3.19 79 56 22 2.99 90 60 211158 6.94 25 20 41 2.99 13 171 11253 5.01 32 132 3 4.71 18 16 211379 1.80 53 43 18 2.12 44 39 141552 3.53 26 28 10 3.21 24 23 111554 2.75 - 24 117 2.82 - 21 1591555 2.95 151 102 38 2.51 142 88 491673 1.91 63 31 70 2.57 - 27 871676 3.57 - 37 231 3.72 - 35 2791690 3.36 107 64 60 5.12 96 61 701727 2.80 107 77 25 3.13 109 68 311811 2.74 36 19 31 2.85 34 19 281813 5.34 54 36 8 8.23 23 47 451929 3.20 28 23 15 2.81 29 19 181932 2.67 55 26 131 2.60 58 26 1521972 2.67 - 33 92 2.78 74 31 961978 5.27 - 72 27 6.71 - 77 101987 2.41 113 56 104 2.62 115 57 992058 2.39 75 37 51 2.43 78 38 502066 2.44 24 10 122 2.34 23 10 1122070 5.30 52 65 8 2.67 53 170 3

A. Boselli et al.: Mid-IR emission of galaxies in the Virgo cluster. III., Online Material p 10
Table 5. Supplementary parameters of the observations.
The ISO Virgo sampleTarget name Filter ISO TDT number Raster orientation(1) (2) (3) (4)VCC 1 LW2,LW3 22600301 21.2600VCC 4 LW2 23501217 18.5900VCC 4 LW3 23501149 18.6000VCC 17 LW2 23501218 18.9000VCC 17 LW3 23501150 18.9100VCC 24 LW2,LW3 23501902 19.7500VCC 26 LW2 23501216 18.8300VCC 26 LW3 23501148 18.8400VCC 66 LW2,LW3 22701301 21.6700VCC 81 LW2 23501219 18.8800VCC 81 LW3 23501151 18.8900VCC 87 LW2 23501220 18.6600VCC 87 LW3 23501152 18.6700VCC 92 LW2,LW3 19900303 28.0100VCC 130 LW2 23901022 19.7500VCC 130 LW3 23900954 19.7500VCC 152 LW2 23900808 19.8200VCC 152 LW3 22700934 21.9800VCC 159 LW2 22802524 22.0000VCC 159 LW3 22802456 22.0100VCC 169 LW2 23901021 19.8000VCC 169 LW3 23900953 19.8000VCC 171 LW2 22802525 21.9900VCC 171 LW3 22802457 22.0000VCC 207 LW2 22802523 22.0600VCC 207 LW3 22802455 22.0700VCC 318 LW2 23900809 20.1100VCC 318 LW3 22700935 22.1800VCC 425 LW2 22802526 22.0100VCC 425 LW3 22802458 22.0200VCC 459 LW2,LW3 23401803 18.6100VCC 460 LW2 23401976 18.3700VCC 460 LW3 23500583 18.1200VCC 655 LW2 23401910 18.7600VCC 655 LW3 23500536 18.5100VCC 664 LW2 22701411 21.7800VCC 664 LW3 23100537 20.8900VCC 666 LW2,LW3 23402404 18.9000VCC 692 LW2 22701412 21.8300VCC 692 LW3 23100538 20.9500VCC 809 LW2,LW3 23502005 19.9800VCC 836 LW2 22701477 21.8300VCC 836 LW3 23100584 20.9200VCC 848 LW2,LW3 22801006 22.5600VCC 857 LW2 23401960 18.6800VCC 857 LW3 23500568 18.4200VCC 873 LW2 22701461 21.7800VCC 873 LW3 23100569 20.8300VCC 890/9 LW2,LW3 22801514 22.4600VCC 912 LW2 22701413 21.8700VCC 912 LW3 23100539 20.9500VCC 971 LW2 22801315 22.5700VCC 971 LW3 22701141 22.6800VCC 984 LW2 22701462 21.8800VCC 984 LW3 23100570 20.9500VCC 995 LW2,LW3 23901207 19.5500VCC 1002 LW2 22801314 22.5300VCC 1002 LW3 22701140 22.6500VCC 1003 LW2 23100990 21.2100VCC 1003 LW3 23600292 20.1500VCC 1043 LW2 23501494 19.8900VCC 1043 LW3 22600995 22.1500VCC 1047 LW2 23501421 20.0700VCC 1047 LW3 22600947 22.2300VCC 1110 LW2 23402178 19.1100VCC 1110 LW3 23402285 19.1000VCC 1158 LW2 22600465 22.2300VCC 1158 LW3 22600573 22.2200VCC 1189 LW2 22801316 22.5100VCC 1189 LW3 22701142 22.6400VCC 1196 LW2 22600422 22.1500VCC 1196 LW3 22600548 22.1400VCC 1217 LW2 23100917 21.2200VCC 1217 LW3 23600243 20.1300VCC 1253 LW2 22600464 22.2300VCC 1253 LW3 22600572 22.2200VCC 1257 LW2,LW3 23402008 19.1200VCC 1326 LW2 23100918 21.2400VCC 1326 LW3 23600244 20.1400

A. Boselli et al.: Mid-IR emission of galaxies in the Virgo cluster. III., Online Material p 11
Table 5. continued.
Target name Filter ISO TDT number Raster orientation(1) (2) (3) (4)VCC 1368 LW2 23100919 21.2400VCC 1368 LW3 23600245 20.1200VCC 1379 LW2 23402163 19.3300VCC 1379 LW3 23402271 19.3200VCC 1410 LW2,LW3 23402509 19.3400VCC 1412 LW2 23100920 21.3300VCC 1412 LW3 23600246 20.2400VCC 1419 LW2 22600423 22.3500VCC 1419 LW3 22600549 22.3400VCC 1450 LW2 22600424 22.3000VCC 1450 LW3 22600550 22.3000VCC 1552 LW2 22601467 22.3700VCC 1552 LW3 22600675 22.4600VCC 1554 LW2 22701227 22.7700VCC 1554 LW3 22801453 22.6300VCC 1569 LW2,LW3 22601110 22.3600VCC 1575 LW2 22701228 22.7200VCC 1575 LW3 22801454 22.5800VCC 1581 LW2 22802028 22.6300VCC 1581 LW3 22801960 22.6300VCC 1596 LW2,LW3 22802633 22.4500VCC 1673/6 LW2,LW3 23501602 20.5600VCC 1675 LW2 22802034 22.5200VCC 1675 LW3 22801966 22.5200VCC 1678 LW2 22701226 22.8100VCC 1678 LW3 22801452 22.6600VCC 1686 LW2 22601466 22.4700VCC 1686 LW3 22600674 22.5700VCC 1690 LW2,LW3 22600704 22.5700VCC 1699 LW2 22701229 22.7900VCC 1699 LW3 22801455 22.6500VCC 1725 LW2 22802032 22.5100VCC 1725 LW3 22801964 22.5100VCC 1726 LW2 22802027 22.6300VCC 1726 LW3 22801959 22.6300VCC 1727 LW2,LW3 23501305 20.5000VCC 1730 LW2 22701230 22.9000VCC 1730 LW3 22801456 22.7700VCC 1750 LW2 22801629 22.6600VCC 1750 LW3 22801861 22.6600VCC 1757 LW2 22601425 22.5300VCC 1757 LW3 22600651 22.6200VCC 1758 LW2 22801630 22.6000VCC 1758 LW3 22801862 22.5900VCC 1784 LW2 23402736 19.9300VCC 1784 LW3 23500768 19.7600VCC 1789 LW2 24100938 20.9300VCC 1789 LW3 24101070 20.9300VCC 1791 LW2 22802035 22.6000VCC 1791 LW3 22801967 22.6000VCC 1804 LW2,LW3 23600411 20.8200VCC 1811 LW2,LW3 23500807 19.8600VCC 1813 LW2 23901179 20.0100VCC 1813 LW3 23901179 20.0100VCC 1822 LW2 22801631 22.7200VCC 1822 LW3 22801863 22.7100VCC 1869 LW2 23500980 19.9500VCC 1869 LW3 23500980 19.9500VCC 1885 LW2 23402737 20.0000VCC 1885 LW3 23500769 19.8300VCC 1918 LW2 24100939 20.7100VCC 1918 LW3 24101071 20.7100VCC 1929/32 LW2 22600206 22.8300VCC 1929/32 LW3 22600206 22.8300VCC 1952 LW2 24300141 19.9000VCC 1952 LW3 23503173 21.3600VCC 1970 LW2 23503042 20.9300VCC 1970 LW3 23502974 20.9300VCC 1972 LW2 24101391 19.1000VCC 1972 LW3 22601693 22.9000VCC 1987 LW2 24101381 18.6400VCC 1987 LW3 22601688 22.8200VCC 1992 LW2,LW3 22601745 22.8900VCC 1999 LW2 22601333 22.8400VCC 1999 LW3 22601259 22.8500

A. Boselli et al.: Mid-IR emission of galaxies in the Virgo cluster. III., Online Material p 12
Table 5. continued.
Target name Filter ISO TDT number Raster orientation(1) (2) (3) (4)VCC 2006 LW2 24101331 18.9000VCC 2006 LW3 22601657 22.9100VCC 2007 LW2 24300140 19.7900VCC 2007 LW3 23503172 21.3100VCC 2023 LW2 22601332 22.9100VCC 2023 LW3 22601258 22.9200VCC 2033 LW2,LW3 24300212 19.6900VCC 2034 LW2 23503043 20.9900VCC 2034 LW3 23502975 20.9900VCC 2037 LW2 23503044 20.9800VCC 2037 LW3 23502976 20.9900VCC 2058 LW2 22601382 23.0000VCC 2058 LW3 22601289 23.0100VCC 2066 LW2 24300377 19.0000VCC 2066 LW3 24300478 18.9900VCC 2070 LW2,LW3 24101613 20.0200VCC 2087 LW2 24300315 19.0800VCC 2087 LW3 24300447 19.0800VCC 2094 LW2,LW3 24300546 19.2400
Galaxies in the clusters A1367 and ComaTarget name Filter ISO TDT number Raster orientation(1) (2) (3) (4)97062 LW2,LW3 22201301 19.410097073 LW2,LW3 22201102 19.460097079 LW2,LW3 22201303 19.460097087 LW2,LW3 22201104 19.510097138 LW2,LW3 22201606 19.6000160020 LW2,LW3 21501131 28.0000160026 LW2,LW3 21501132 28.0300160055 LW2 61000240 13.5000160055 LW2,LW3 21400934 28.8200160067 LW2,LW3 22803435 21.8100160076 LW2,LW3 21400936 29.0400160086 LW2,LW3 21400937 29.0900160088 LW2,LW3 21500866 28.6400160095 LW2 61700846 9.78000160095 LW2,LW3 21500968 28.6700160095 LW3 61700747 9.79001160127 LW2,LW3 21401169 29.5000160128 LW2,LW3 21401170 29.5900160139 LW2,LW3 21401171 29.8800160252 LW2,LW3 21500865 28.6000160252 LW3 61600443 10.2600160260 LW2,LW3 21500967 28.6100
Other galaxies in the Virgo clusterTarget name Filter ISO TDT number Raster orientation(1) (2) (3) (4)1226∗ LW2,LW3 22700815 22.55001508 LW2,LW3 23600326 20.87001555 LW2,LW3 23100103 21.98001632 LW2,LW3 23902129 19.21001939∗ LW2,LW3 39600117 −155.150CGCG43041 LW2,LW3 22500757 23.4300
Other galaxies in the Coma/A1367 superclusterTarget name Filter ISO TDT number Raster orientation(1) (2) (3) (4)159072N,S∗ LW2,LW3 24602014 9.56000130023 LW2,LW3 24300658 16.6300
Notes:Galaxies marked with an asterisk have been observed at high resolution with a pixel size of 3 arcsec

A. Boselli et al.: Mid-IR emission of galaxies in the Virgo cluster. III., Online Material p 13
Fig. 1. The gray-scale level images at 6.75 µm (left) and 15 µm (centre) of the 34 resolved galaxies; contours are at 2, 4, 6, 8, 12 (black), 20,30, 40, 60, 100 (white) µJy arcsec−2 (coordinates are J2000). Radial (6.75 and 15 µm) and colour profiles (6.75/15 µm ratio) of each galaxy,obtained integrating along elliptical annuli, are given in the right side panel. A vertical dashed line in the colour profile indicates the 8 arcsecdiffraction limit of the 15 µm image.

A. Boselli et al.: Mid-IR emission of galaxies in the Virgo cluster. III., Online Material p 14
Fig. 1. continued.

A. Boselli et al.: Mid-IR emission of galaxies in the Virgo cluster. III., Online Material p 15
Fig. 1. continued.

A. Boselli et al.: Mid-IR emission of galaxies in the Virgo cluster. III., Online Material p 16
Fig. 1. continued.
A. Boselli et al.: Mid-IR emission of galaxies in the Virgo cluster. III., Online Material p 17
Fig. 1. continued.

A. Boselli et al.: Mid-IR emission of galaxies in the Virgo cluster. III., Online Material p 18
Fig. 1. continued.

A. Boselli et al.: Mid-IR emission of galaxies in the Virgo cluster. III., Online Material p 19
Fig. 1. continued.

A. Boselli et al.: Mid-IR emission of galaxies in the Virgo cluster. III., Online Material p 20
R.A.(2000)
Dec
VCC 2066
R.A.(2000)
Dec
VCC 2066
R.A.(2000)
Dec
VCC 2070
R.A.(2000)
Dec
VCC 2070
Fig. 1. continued.

A. Boselli et al.: Mid-IR emission of galaxies in the Virgo cluster. III., Online Material p 21
Fig. 1. continued.

A. Boselli et al.: Mid-IR emission of galaxies in the Virgo cluster. III., Online Material p 22
Fig. 2. The contour level images of galaxies detected with a surface brightness brighter than 2 µJy arcsec−2. For each galaxy, the left image is at6.75 µm and the right one at 15 µm; as for the images of the fully resolved galaxies, contours are at 2, 4, 6, 8, 12, 20, 30, 40, 60, 100 µJy arcsec−2
(coordinates are J2000).

A. Boselli et al.: Mid-IR emission of galaxies in the Virgo cluster. III., Online Material p 23
Fig. 2. continued.

A. Boselli et al.: Mid-IR emission of galaxies in the Virgo cluster. III., Online Material p 24
Fig. 2. continued.

A. Boselli et al.: Mid-IR emission of galaxies in the Virgo cluster. III., Online Material p 25
Fig. 2. continued.

A. Boselli et al.: Mid-IR emission of galaxies in the Virgo cluster. III., Online Material p 26
Fig. 2. continued.