Characterization of the Virgo Seismic Environment
12
arXiv:1108.1598v1 [gr-qc] 8 Aug 2011 Characterization of the Virgo Seismic Environment T. Accadia 11 , F. Acernese 5ac , P. Astone 8a , G. Ballardin 2 , F. Barone 5ac , M. Barsuglia 1 , A. Basti 7ab , Th. S. Bauer 14a , M. Bebronne 11 , M.G. Beker 14a , A. Belletoile 11 , M. Bitossi 7a , M. A. Bizouard 10a , M. Blom 14a , F. Bondu 15b , L. Bonelli 7ab , R. Bonnand 13 , V. Boschi 7a , L. Bosi 6a , B. Bouhou 1 , S. Braccini 7a , C. Bradaschia 7a , M. Branchesi 3ab , T. Briant 12 , A. Brillet 15a , V. Brisson 10a , T. Bulik 17bc , H. J. Bulten 14ab , D. Buskulic 11 , C. Buy 1 , G. Cagnoli 3a , E. Calloni 5ab , B. Canuel 2 , F. Carbognani 2 , F. Cavalier 10a , R. Cavalieri 2 , G. Cella 7a , E. Cesarini 3b , O. Chaibi 15a , E. Chassande-Mottin 1 , A. Chincarini 4 , A. Chiummo 2 , F. Cleva 15a , E. Coccia 9ab , P.-F. Cohadon 12 , C. N. Colacino 7ab , J. Colas 2 , A. Colla 8ab , M. Colombini 8b , A. Conte 8ab , M. Coughlin 19 , J.-P. Coulon 15a , E. Cuoco 2 , S. D’Antonio 9a , V. Dattilo 2 , M. Davier 10a , R. Day 2 , R. De Rosa 5ab , G. Debreczeni 18 , W. Del Pozzo 14a , M. del Prete 16b , L. Di Fiore 5a , A. Di Lieto 7ab , M. Di Paolo Emilio 9ac , A. Di Virgilio 7a , A. Dietz 11 , M. Drago 16ab ,G.Endr˝oczi 18 , V. Fafone 9ab , I. Ferrante 7ab , F. Fidecaro 7ab , I. Fiori 2 , R. Flaminio 13 , L. A. Forte 5a , J.-D. Fournier 15a , J. Franc 13 , S. Frasca 8ab , F. Frasconi 7a , M. Galimberti 13 , L. Gammaitoni 6ab , F. Garufi 5ab , M. E. G´ asp´ ar 18 , G. Gemme 4 , E. Genin 2 , A. Gennai 7a , A. Giazotto 7a , R. Gouaty 11 , M. Granata 1 , C. Greverie 15a , G. M. Guidi 3ab , J.-F. Hayau 15b , A. Heidmann 12 , H. Heitmann 15 , P. Hello 10a , P. Jaranowski 17d , I. Kowalska 17b ,A.Kr´olak 17ae , N. Leroy 10a , N. Letendre 11 , T. G. F. Li 14a , N. Liguori 16ab , M. Lorenzini 3a , V. Loriette 10b , G. Losurdo 3a , E. Majorana 8a , I. Maksimovic 10b , N. Man 15a , M. Mantovani 7ac , F. Marchesoni 6a , F. Marion 11 , J. Marque 2 , F. Martelli 3ab , A. Masserot 11 , C. Michel 13 , L. Milano 5ab , Y. Minenkov 9a , M. Mohan 2 , N. Morgado 13 , A. Morgia 9ab , S. Mosca 5ab , B. Mours 11 , L. Naticchioni 8ab , F. Nocera 2 , G. Pagliaroli 9ac , L. Palladino 9ac , C. Palomba 8a , F. Paoletti 7a,2 , M. Parisi 5ab , A. Pasqualetti 2 , R. Passaquieti 7ab , D. Passuello 7a , G. Persichetti 5ab , F. Piergiovanni 3ab , M. Pietka 17d , L. Pinard 13 , R. Poggiani 7ab ,
-
Upload
independent -
Category
Documents
-
view
1 -
download
0
Transcript of Characterization of the Virgo Seismic Environment

arX
iv:1
108.
1598
v1 [
gr-q
c] 8
Aug
201
1
Characterization of the Virgo Seismic Environment
T. Accadia11, F. Acernese5ac, P. Astone8a, G. Ballardin2,
F. Barone5ac, M. Barsuglia1, A. Basti7ab, Th. S. Bauer14a,
M. Bebronne11, M.G. Beker14a, A. Belletoile11, M. Bitossi7a,
M. A. Bizouard10a, M. Blom14a, F. Bondu15b, L. Bonelli7ab,
R. Bonnand13, V. Boschi7a, L. Bosi6a, B. Bouhou1,
S. Braccini7a, C. Bradaschia7a, M. Branchesi3ab, T. Briant12,
A. Brillet15a, V. Brisson10a, T. Bulik17bc, H. J. Bulten14ab,
D. Buskulic11, C. Buy1, G. Cagnoli3a, E. Calloni5ab, B. Canuel2,
F. Carbognani2, F. Cavalier10a, R. Cavalieri2, G. Cella7a,
E. Cesarini3b, O. Chaibi15a, E. Chassande-Mottin1,
A. Chincarini4, A. Chiummo2, F. Cleva15a, E. Coccia9ab,
P.-F. Cohadon12, C. N. Colacino7ab, J. Colas2, A. Colla8ab,
M. Colombini8b, A. Conte8ab, M. Coughlin19, J.-P. Coulon15a,
E. Cuoco2, S. D’Antonio9a, V. Dattilo2, M. Davier10a, R. Day2,
R. De Rosa5ab, G. Debreczeni18, W. Del Pozzo14a,
M. del Prete16b, L. Di Fiore5a, A. Di Lieto7ab,
M. Di Paolo Emilio9ac, A. Di Virgilio7a, A. Dietz11,
M. Drago16ab, G. Endroczi18, V. Fafone9ab, I. Ferrante7ab,
F. Fidecaro7ab, I. Fiori2, R. Flaminio13, L. A. Forte5a,
J.-D. Fournier15a, J. Franc13, S. Frasca8ab, F. Frasconi7a,
M. Galimberti13, L. Gammaitoni6ab, F. Garufi5ab,
M. E. Gaspar18, G. Gemme4, E. Genin2, A. Gennai7a,
A. Giazotto7a, R. Gouaty11, M. Granata1, C. Greverie15a,
G. M. Guidi3ab, J.-F. Hayau15b, A. Heidmann12, H. Heitmann15,
P. Hello10a, P. Jaranowski17d, I. Kowalska17b, A. Krolak17ae,
N. Leroy10a, N. Letendre11, T. G. F. Li14a, N. Liguori16ab,
M. Lorenzini3a, V. Loriette10b, G. Losurdo3a, E. Majorana8a,
I. Maksimovic10b, N. Man15a, M. Mantovani7ac, F. Marchesoni6a,
F. Marion11, J. Marque2, F. Martelli3ab, A. Masserot11,
C. Michel13, L. Milano5ab, Y. Minenkov9a, M. Mohan2,
N. Morgado13, A. Morgia9ab, S. Mosca5ab, B. Mours11,
L. Naticchioni8ab, F. Nocera2, G. Pagliaroli9ac, L. Palladino9ac,
C. Palomba8a, F. Paoletti7a,2, M. Parisi5ab, A. Pasqualetti2,
R. Passaquieti7ab, D. Passuello7a, G. Persichetti5ab,
F. Piergiovanni3ab, M. Pietka17d, L. Pinard13, R. Poggiani7ab,
Characterization of the Virgo Seismic Environment 2
M. Prato4, G. A. Prodi16ab, M. Punturo6a, P. Puppo8a,
D. S. Rabeling14ab, I. Racz18, P. Rapagnani8ab, V. Re9ab,
T. Regimbau15a, F. Ricci8ab, F. Robinet10a, A. Rocchi9a,
L. Rolland11, R. Romano5ac, D. Rosinska17cf , P. Ruggi2,
B. Sassolas13, D. Sentenac2, L. Sperandio9ab, R. Sturani3ab,
B. Swinkels2, M. Tacca2, L. Taffarello16c, A. Toncelli7ab,
M. Tonelli7ab, O. Torre7ac, E. Tournefier11, F. Travasso6ab,
G. Vajente7ab, J. F. J. van den Brand14ab, C. Van Den Broeck14a,
S. van der Putten14a, M. Vasuth18, M. Vavoulidis10a,
G. Vedovato16c, D. Verkindt11, F. Vetrano3ab, A. Vicere3ab,
J.-Y. Vinet15a, S. Vitale14a, H. Vocca6a, R. L. Ward1, M. Was10a,
M. Yvert11, A. Zadrozny17e, J.-P. Zendri16c
1Laboratoire AstroParticule et Cosmologie (APC) Universite Paris Diderot, CNRS:
IN2P3, CEA: DSM/IRFU, Observatoire de Paris, 10 rue A.Domon et L.Duquet,
75013 Paris - France
2European Gravitational Observatory (EGO), I-56021 Cascina (PI), Italy
3INFN, Sezione di Firenze, I-50019 Sesto Fiorentinoa; Universita degli Studi di
Urbino ’Carlo Bo’, I-61029 Urbinob, Italy
4INFN, Sezione di Genova; I-16146 Genova, Italy
5INFN, Sezione di Napoli a; Universita di Napoli ’Federico II’b Complesso
Universitario di Monte S.Angelo, I-80126 Napoli; Universita di Salerno, Fisciano,
I-84084 Salernoc, Italy
6INFN, Sezione di Perugiaa; Universita di Perugiab, I-06123 Perugia,Italy
7INFN, Sezione di Pisaa; Universita di Pisab; I-56127 Pisa; Universita di Siena,
I-53100 Sienac, Italy
8INFN, Sezione di Romaa; Universita ’La Sapienza’b, I-00185 Roma, Italy
9INFN, Sezione di Roma Tor Vergataa; Universita di Roma Tor Vergata, I-00133
Romab; Universita dell’Aquila, I-67100 L’Aquilac, Italy
10LAL, Universite Paris-Sud, IN2P3/CNRS, F-91898 Orsaya; ESPCI, CNRS,
F-75005 Parisb, France
11Laboratoire d’Annecy-le-Vieux de Physique des Particules (LAPP), Universite de
Savoie, CNRS/IN2P3, F-74941 Annecy-Le-Vieux, France
12Laboratoire Kastler Brossel, ENS, CNRS, UPMC, Universite Pierre et Marie Curie,
4 Place Jussieu, F-75005 Paris, France
13Laboratoire des Materiaux Avances (LMA), IN2P3/CNRS, F-69622 Villeurbanne,
Lyon, France
14Nikhef, Science Park, Amsterdam, the Netherlandsa; VU University Amsterdam,
De Boelelaan 1081, 1081 HV Amsterdam, the Netherlandsb
Characterization of the Virgo Seismic Environment 3
15Universite Nice-Sophia-Antipolis, CNRS, Observatoire de la Cote d’Azur, F-06304
Nicea; Institut de Physique de Rennes, CNRS, Universite de Rennes 1, 35042
Rennesb, France
16INFN, Gruppo Collegato di Trentoa and Universita di Trentob, I-38050 Povo,
Trento, Italy; INFN, Sezione di Padovac and Universita di Padovad, I-35131 Padova,
Italy
17IM-PAN 00-956 Warsawa; Astronomical Observatory Warsaw University 00-478
Warsawb; CAMK-PAN 00-716 Warsawc; Bia lystok University 15-424 Bia lystokd; IPJ
05-400 Swierk-Otwocke; Institute of Astronomy 65-265 Zielona Goraf , Poland
18RMKI, H-1121 Budapest, Konkoly Thege Miklos ut 29-33, Hungary
19Physics and Astronomy, Carleton College, Northfield, MN, 55057, USA
E-mail: [email protected]
Abstract. The Virgo gravitational wave detector is an interferometer (ITF) with
3km arms located in Pisa, Italy. From July to October 2010, Virgo performed its third
science run (VSR3) in coincidence with the LIGO detectors. Despite several techniques
adopted to isolate the interferometer from the environment, seismic noise remains an
important issue for Virgo. Vibrations produced by the detector infrastructure (such
as air conditioning units, water chillers/heaters, pumps) are found to affect Virgo’s
sensitivity, with the main coupling mechanisms being through beam jitter and scattered
light processes. The Advanced Virgo (AdV) design seeks to reduce ITF couplings to
environmental noise by having most vibration-sensitive components suspended and in-
vacuum, as well as muffle and relocate loud machines. During the months of June and
July 2010, a Guralp-3TD seismometer was stationed at various locations around the
Virgo site hosting major infrastructure machines. Seismic data were examined using
spectral and coherence analysis with seismic probes close to the detector. The primary
aim of this study was to identify noisy machines which seismically affect the ITF
environment and thus require mitigation attention. Analyzed machines are located at
various distances from the experimental halls, ranging from 10m to 100m. An attempt
is made to measure the attenuation of emitted noise at the ITF and correlate it to the
distance from the source and to seismic attenuation models in soil.

Characterization of the Virgo Seismic Environment 4
1. Introduction
The general theory of relativity predicts that all accelerating objects with non-symmetric
mass distributions produce gravitational waves (GW) ‡. LIGO (the Laser Interferometer
Gravitational-Wave Observatory) [1] and Virgo [2] experiments seek to directly detect
GWs and use them to study astrophysical sources.
Virgo, located in Cascina, Italy, consists of a laser Michelson interferometer with 3km
long, Fabry Perot resonant optical cavities in its arms. With respect to other similar
detectors, Virgo has enhanced sensitivity between 10 and 100Hz due to the seismic
isolation performance of the “super-attenuators” to which the test masses are suspended
[3]. Beginning in 2011, the detector expects to undergo upgrades, known as Advanced
Virgo (AdV), to improve its sensitivity by one order of magnitude [4].
Seismic noise places a limit on Virgo’s detection sensitivity. In particular, the main
source of seismic noise in the 10 to 100Hz band at the Virgo site is the detector’s
infrastructure machines (please see the left of Fig. 1 for a comparison with a low
noise model). Although Virgo’s mirrors are well-isolated from local seismic activity
by suspension systems made of multi-stage pendulums, seismic noise remains a concern.
The residual ground motion causes “diffused light” [5]. Because of unavoidable
imperfections in the detector’s optical components, some tiny fraction of light can exit
the main optical path and strike a surface that is connected to the ground, and thus be
subject to the local seismic field. When this light scatters off of objects connected to
the ground (such as optical components on external tables used for detector controls),
it is often diffused over a wide solid angle. A fraction of the light can re-enter the main
beam path, but with a noisy phase modulated by the seismically excited scattering
object. This phenomenon functions as additional noise in the GW channel and limits
its sensitivity.
Because seismic events couple in this way into the GW channel, it is necessary to
understand and attenuate the noise from the local seismic environment. Many of the
strong lines seen during VSR2 can be attributed to seismic sources (please see the right
of Fig. 1). To assist in the identification effort, the Virgo detector is supplemented with
several types of environmental sensors, including seismometers and accelerometers, that
monitor the local environment [6]. These channels are used to detect environmental
disturbances that can couple to the GW channel and are placed in sensitive areas of the
interferometer. To reduce the influence of anthropogenic noise, during the Advanced
Virgo upgrade, machines that are identified as seismically and acoustically affecting
the interferometer will be replaced, moved, or isolated [4]. The current proposal is to
move all chillers, water pumps, air compressors, and air conditioners from their current
locations to other areas further from the interferometer. By placing these machines
‡ As presented at the Gravitational-wave Physics and Astronomy Workshop in Milwaukee, Wisconsin,
January 26-29, 2011.
Characterization of the Virgo Seismic Environment 5
on their own isolated platforms and by adopting techniques to reduce noise emission
and propagation, Virgo hopes to significantly reduce their effects on the detector.
To prioritize the actions required to reduce noise at Virgo, a careful documentation
of the present local seismic environment is necessary, as well as identification among
the infrastructure machines of relevant sources of seismic noise reaching the detector’s
sensitive components. The work described hereafter is part of this effort.
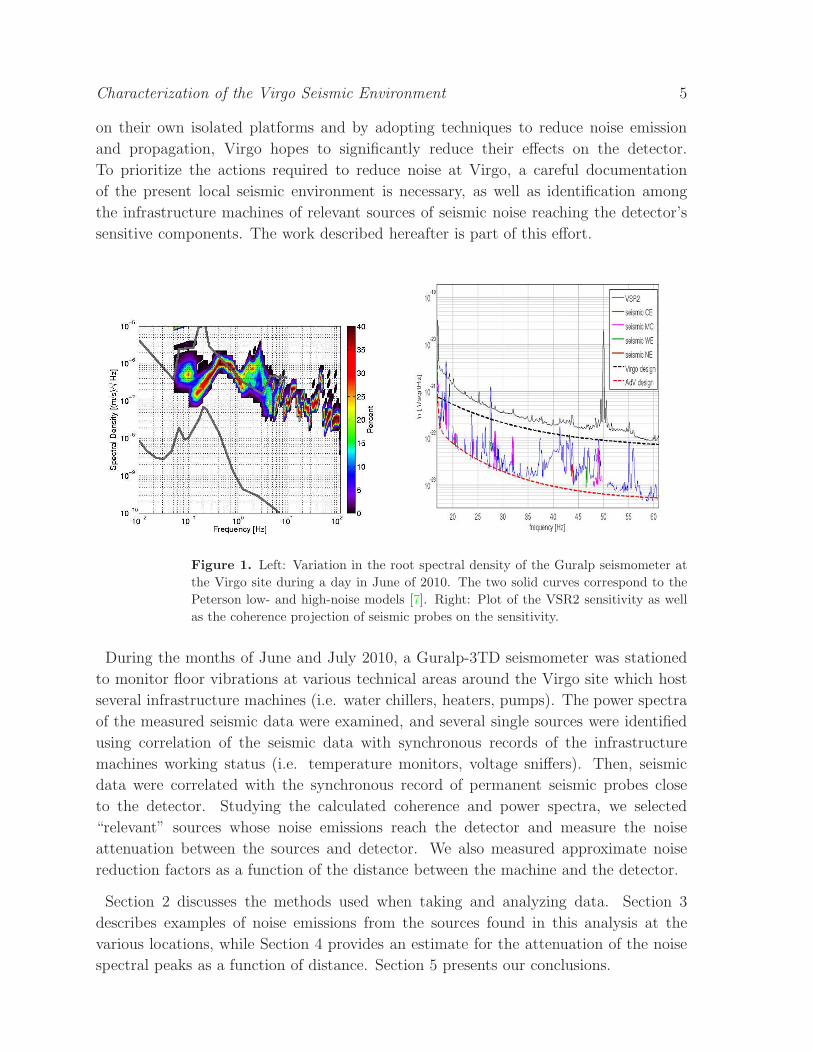
Figure 1. Left: Variation in the root spectral density of the Guralp seismometer at
the Virgo site during a day in June of 2010. The two solid curves correspond to the
Peterson low- and high-noise models [7]. Right: Plot of the VSR2 sensitivity as well
as the coherence projection of seismic probes on the sensitivity.
During the months of June and July 2010, a Guralp-3TD seismometer was stationed
to monitor floor vibrations at various technical areas around the Virgo site which host
several infrastructure machines (i.e. water chillers, heaters, pumps). The power spectra
of the measured seismic data were examined, and several single sources were identified
using correlation of the seismic data with synchronous records of the infrastructure
machines working status (i.e. temperature monitors, voltage sniffers). Then, seismic
data were correlated with the synchronous record of permanent seismic probes close
to the detector. Studying the calculated coherence and power spectra, we selected
“relevant” sources whose noise emissions reach the detector and measure the noise
attenuation between the sources and detector. We also measured approximate noise
reduction factors as a function of the distance between the machine and the detector.
Section 2 discusses the methods used when taking and analyzing data. Section 3
describes examples of noise emissions from the sources found in this analysis at the
various locations, while Section 4 provides an estimate for the attenuation of the noise
spectral peaks as a function of distance. Section 5 presents our conclusions.

Characterization of the Virgo Seismic Environment 6
2. Characterization Methods
2.1. Measurement Setup
We acquired several sets of data with a Guralp 3TD tri-axial seismometer [8] at
six locations around the site. The chosen sampling rate was 250 Hz. The Guralp
seismometer is equipped with a GPS antenna receiver to synchronize its data to Virgo
seismic channels. Maps for the site and the locations of the measurements can be seen
in Fig. 2. These locations were chosen for their proximity to machinery known to create
large seismic noise. These locations are detailed in Table 1. In each location, the Guralp
seismometer was installed on the same concrete platform where the machinery sat and if
possible, at a distance of at least a few meters from the machinery to prevent saturation.
For each location, the Power Spectral Density (PSD) of the Guralp seismometer, referred
to as the “test probe,” is computed (see the left of Fig. 1). Each measurement lasts
approximately 24 hours in order to determine the hourly and daily cycle operation of
the machines. This measurement is compared with a tri-axial seismometer, referred to
as the “reference probe,” permanently stationed in the closest nearby experimental area
containing sensitive interferometer components [6]. In the Mode Cleaner, West End,
and North End Buildings, the reference probe was an Episensor FBA ES-T, while in
the Central Building, the probe was a Guralp CNG-T40. If the source is not obvious,
suspected machines are analyzed with a piezoelectric accelerometer (PCB) [9] placed in
direct contact with the machine and read out with a spectrum analyzer. The machines
characteristic frequencies are then compared to those seen in the coherence.
Figure 2. Left: Aerial View of the Virgo Interferometer. Right: Aerial view of Virgo’s
Central Area. Measurement sites are marked with letters (see Table 1).
Characterization of the Virgo Seismic Environment 7
Section Letter Test Probe Location Reference Probe Location Distance Between Seismometers (m)
A Technical Building One: Ground Floor Central Building: Ground Floor 80
B Building One: First Floor Central Building: Ground Floor 105
C Outside Building One: Ground Floor Mode Cleaner: Ground Floor 30
D Outside Mode Cleaner Building: Ground Floor Mode Cleaner: Ground Floor 10
E/F West/North End Building: Ground Floor West/North End Building: External Optical Bench 20
Table 1. Locations of seismometer placement.
2.2. Analysis Methods
We considered relevant the frequency lines (persistent spectral peaks) that appear as
significantly coherent (coherence rising out of the background) between the test and
reference probes, as the source of those lines is very likely to be the same.. Coherence
itself does not allow one to distinguish between the seismic signals generated close to the
test probe (i.e. machinery under test) from those produced close to the reference probe
(i.e. cooling fans of electronic units). In order to determine when the former is the case,
the ratio of the test and reference seismometers PSDs is examined, and coherent lines
that are stronger near the reference probe are selected. These techniques work well for
machines producing continuous lines, such as water pumps and cooling fans.
Periodic lines, on the other hand, are more difficult to identify. Because the lines come
and go, they tend to be washed out in PSD averaging. For this reason, frequency-time
(FT) plots of the PSDs are produced and examined by eye for periodic lines. In order
to identify the source of these lines, we compute the root-mean-square (RMS) around
that line, which is defined as:
RMS =
√
√
√
√
f2∑
i=f1
xi2 ∗ δf (1)
where xi is the ith component of the frequency band in question and δf is the width
of the frequency bins in the spectrum. The sum goes from i = f1 to i = f2, where f1
and f2 are the minimum and maximum frequencies respectively in the frequency band.
This RMS value is then correlated to the time series of various Infrastructure Machine
Monitoring System (IMMS) signals, including temperature and pressure probes.
3. Characterization Examples
In this section, the most significant examples utilizing methods discussed above are
presented. In Table 2, information about important, identified noise lines are given.

Characterization of the Virgo Seismic Environment 8
Location Frequency (Hz) Periodicity (Period) Source PSD Ratio
Technical Building One 24.2, 48.4,78.6 Periodic (42 Minutes) Cold Water Chiller 1 16
Building One 19.3 Continuous Computer Fans 13
Outside Building One 48.9 Continuous (Daytime) B1 Chiller 2
Mode Cleaner 48.9, 97.8 Periodic (21.5 Minutes) Mode Cleaner Chiller 220
West End Building 47.1 Continuous Warm Water Pump 1.1
West End Building 48.8 Continuous Cold Water Pump 6.1
North End Building 22.8 Continuous Water Pump 4.2
Table 2. Important noise lines identified in the study. The table provides the line’s
frequency, periodicity, source, and the ratio of the PSDs of the test and reference
probes.
3.1. Characterization of Noise from Technical Building One
A data set was taken in Technical Building One (TB1) and compared with data from
a seismometer on the floor of the Central Building (CB), where the two arms of the
interferometer converge. These two probes are approximately 80 meters apart. The
PSDs of the test and reference probes, as well as the coherence between them, can be
seen in Fig. 3. A periodic line around 24.2Hz (with harmonics at 48.4Hz and 72.6Hz)
is seen, which is showed in detail on the left plot of Fig. 4.
Figure 3. Left: PSDs of the seismometers in TB1 and the CB. The peaks topped by
red stars correspond to the 24.2Hz periodic line while the blue stars correspond to the
48Hz continuous line. Right: Coherence between seismometers in TB1 and the CB.
The peak topped by the red star corresponds to the 24.2Hz periodic line while the blue
star corresponds to the 47.9Hz continuous line.
The coherence for this line between the test and reference probes was about 0.6,
indicating a relevant correlation between the two seismometers at that frequency. In
order to find the source of the periodic line, it was necessary to determine in which
building the line was louder. The ratio of the PSDs (Seismometer in TB1/Seismometer
in CB) was approximately 16, indicating the source of the line to be in TB1.
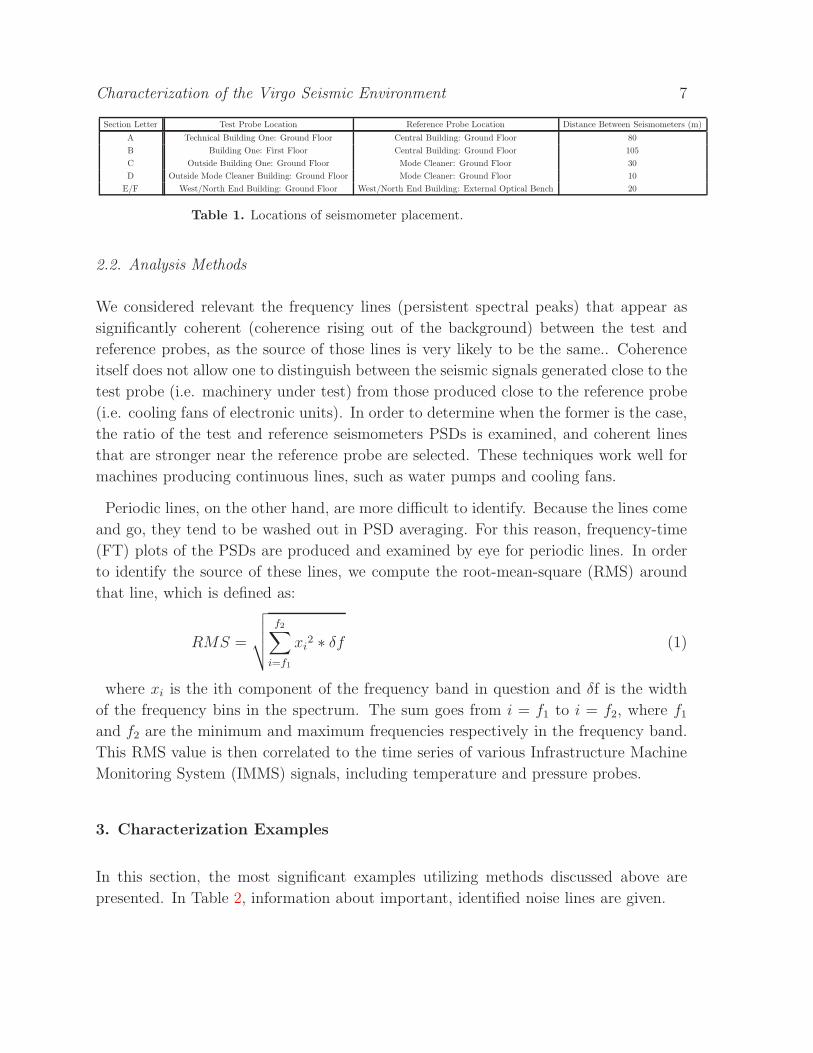
The time series of several machinery monitors in TB1 were compared with the RMS
of the 24.2Hz signal in the Guralp seismometer, one of which may be seen on the right
of Fig. 4. From this figure, the RMS is clearly correlated with the time series of a
temperature monitor of the first water chiller. We see that when the temperature of the
Characterization of the Virgo Seismic Environment 9
water reaches a high point, the cold water chiller switches on, causing the temperature
of the water to decrease. When the temperature reaches a low point, the water chiller
switches off and the whole process starts again. The chiller is located on the roof of
TB1. Even though the chiller is equipped with insulating springs, the vibrations can
probably travel through the rigid water pipes between TB1 and the CB or in the water
itself.
Figure 4. Left: FT-plot of the test probe in TB1 zoomed in on the 24 Hz region.
Right: A plot of both the RMS in the 24Hz band of the Guralp seismometer as well
as the time series of a temperature monitor of the first (of two) cold water chillers.
3.2. Characterization of Noise from the Cold Water Chiller Outside the Mode Cleaner
Another data set was taken outside the Mode Cleaner Building (MCB), on the same
concrete platform as the MC’s cold water chiller, and compared with the seismometer
on the MCB floor. The MCB contains the end mirror of the Input Mode Cleaner, an
optical cavity that filters jitter and power noise as well as higher order modes from the
beam. The distance between these probes is approximately 10 meters.
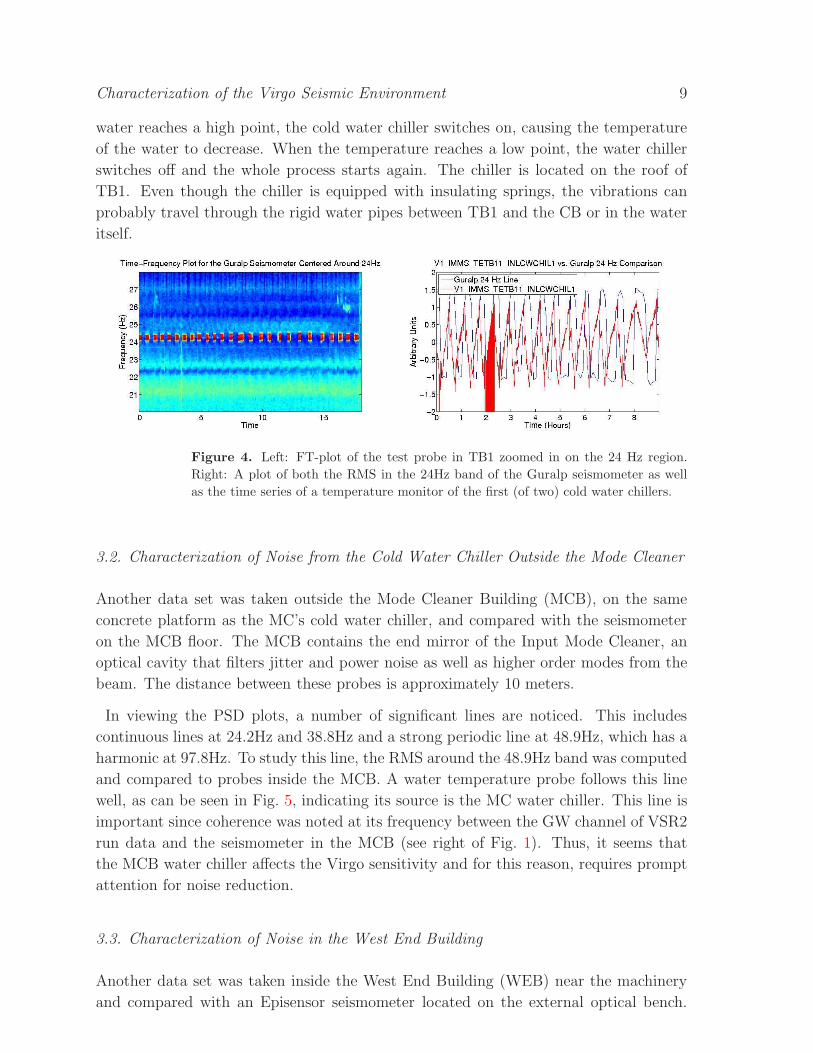
In viewing the PSD plots, a number of significant lines are noticed. This includes
continuous lines at 24.2Hz and 38.8Hz and a strong periodic line at 48.9Hz, which has a
harmonic at 97.8Hz. To study this line, the RMS around the 48.9Hz band was computed
and compared to probes inside the MCB. A water temperature probe follows this line
well, as can be seen in Fig. 5, indicating its source is the MC water chiller. This line is
important since coherence was noted at its frequency between the GW channel of VSR2
run data and the seismometer in the MCB (see right of Fig. 1). Thus, it seems that
the MCB water chiller affects the Virgo sensitivity and for this reason, requires prompt
attention for noise reduction.
3.3. Characterization of Noise in the West End Building
Another data set was taken inside the West End Building (WEB) near the machinery
and compared with an Episensor seismometer located on the external optical bench.
Characterization of the Virgo Seismic Environment 10
Figure 5. Comparison between the RMS in the 48.9Hz band of the Guralp
seismometer and the time series of a temperature monitor of the water chiller.
The distance between these seismic probes is approximately 20 meters.
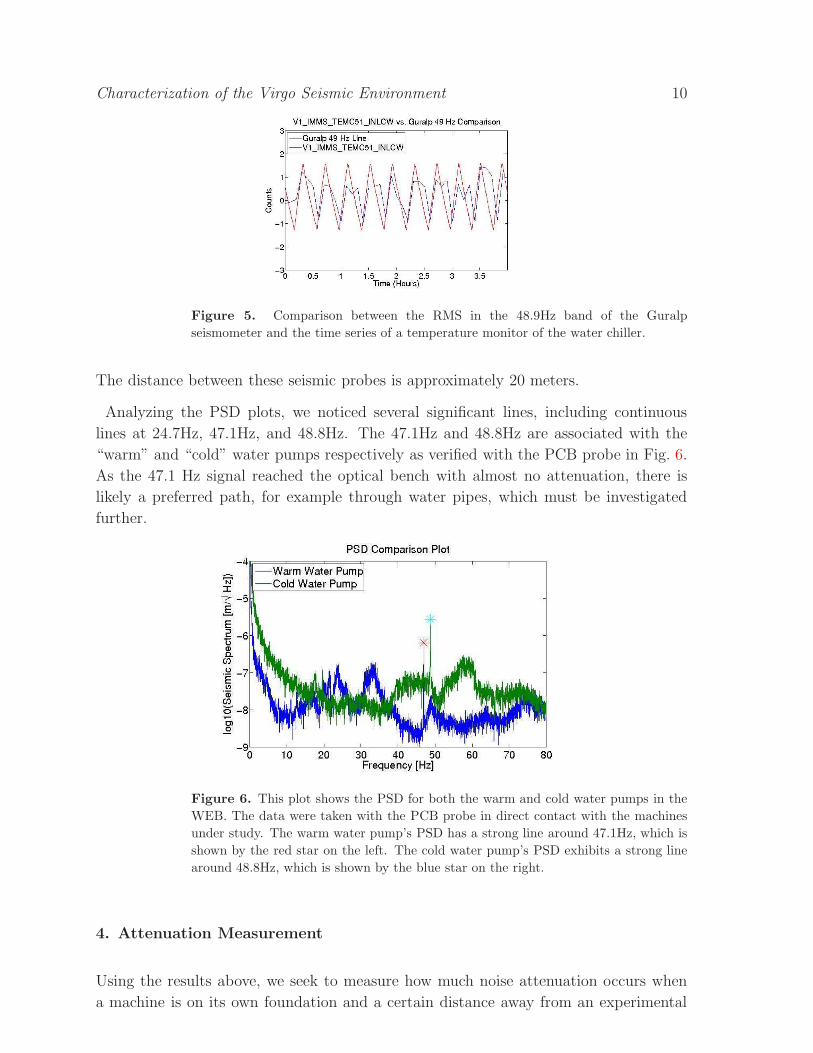
Analyzing the PSD plots, we noticed several significant lines, including continuous
lines at 24.7Hz, 47.1Hz, and 48.8Hz. The 47.1Hz and 48.8Hz are associated with the
“warm” and “cold” water pumps respectively as verified with the PCB probe in Fig. 6.
As the 47.1 Hz signal reached the optical bench with almost no attenuation, there is
likely a preferred path, for example through water pipes, which must be investigated
further.
Figure 6. This plot shows the PSD for both the warm and cold water pumps in the
WEB. The data were taken with the PCB probe in direct contact with the machines
under study. The warm water pump’s PSD has a strong line around 47.1Hz, which is
shown by the red star on the left. The cold water pump’s PSD exhibits a strong line
around 48.8Hz, which is shown by the blue star on the right.
4. Attenuation Measurement
Using the results above, we seek to measure how much noise attenuation occurs when
a machine is on its own foundation and a certain distance away from an experimental

Characterization of the Virgo Seismic Environment 11
area. The PSD ratio of test and reference probes is used as a tentative estimate of the
attenuation of the vibration, the result for which can be seen in Fig. 7. Measurements are
compared to a dissipation law accounting for geometrical spreading of surface cylindrical
waves and for energy dissipation in soil [10].
As can be seen in the plot, distances of about 30 meters or less have an attenuation
of approximately a factor of 3, while distances of about 80 meters and greater have
attenuation values greater than 10. Indeed, the simple noise attenuation model does
not apply in most of the examined cases. One reason is that the point-like source
approximation is not valid for short propagation distances (d≤ λ, with our seismic waves
length ≃ 10m) or for extended sources (L ≥ d, with the machine platform size L ≃ 10m).
In addition, the soil medium is often not uniform, and waves’ reflection and refraction
can occur at discontinuities. Wave amplification due to mechanical resonances of the
two platforms (technical area and experimental area) which are excited by the seismic
noise is also possible. Another important reason is that in most cases, propagation does
not occur uniquely through soil. Less dissipative paths can exist, such as through water
pipes or pressure waves inside the water itself.
Figure 7. A plot of the average of the PSD ratio of the coherent lines as a function
of distance between the probes. We selected locations separated by at least a few
wavelengths of soil. The attenuation factors data at 105m are lower limits only.
5. Conclusion
Noise from several Virgo infrastructure devices, such as water chillers, heaters, and
pumps, seismically affects sensitive parts of the interferometer. Although an impact on
the present interferometer is not evident in Virgo’s sensitivity (with the exception of the
MC chiller), the noise reaching the experimental area is, in several cases, considerably
above the background, and requires a reduction for AdV.
Characterization of the Virgo Seismic Environment 12
Measured attenuation of seismic signal from a distant source seems not compatible
with the much stronger attenuation expected from soil dissipation. It is suspected that
water pipes might function as seismic shortcuts and thus need more comprehensive
investigation and mitigation attention. Noise transmitted through soil can be more
efficiently reduced using seismic isolation systems (i.e. springs).
Further beneficial studies might include setting up a noise source with known power and
characteristic frequencies at various distances from a sensitive experimental area. This
would allow a comprehensive study of the noise attenuation as a function of distance,
something we were unable to do in this study.
Acknowledgments
This project is funded by the NSF through the University of Florida’s IREU program.
The work has been carried on also thanks to the support coming from Italian Ministero
dell’Istruzione, dell’Universita’ e della Ricerca through grant PRIN 2007NXMBHP.
References
[1] Abbott B et al (LIGO Scientific Collaboration) 2009 Reports on Progress in Physics 72 076901
[2] Acernese F et al (Virgo Collaboration) 2008 Classical and Quantum Gravity 25 114045
[3] Braccini S et al 2005 Astroparticle Physics 23
[4] Acernese F et al (Virgo Collaboration) 2008 Virgo Internal report: VIR-0089A-08 URL
https://tds.ego-gw.it/ql/?c=2110
[5] Accadia T et al (VIRGO Collaboration) 2010 Classical and Quantum Gravity 27
[6] Barone F, Garufi F, and Milano L 2001 VIRGO Document VIR-MAN-NAP-5800-102 URL
https://tds.ego-gw.it/ql/?c=800
[7] Peterson J 1993 Open-file report 93–322
[8] Boschi V and Gennai A 2010 VIRGO Document VIR-0172A-10 URL
https://tds.ego-gw.it/ql/?c=7305
[9] Piezotronics 2010 Piezotronics Document URL http://www.pcb.com/spec_sheet.asp?model=393B12
[10] Hu J and Su Y 1999 Acta Seismologica Sinica 12