Micronutrients in Long-Term Care (LTC) - UWSpace
282
Micronutrients in Long-Term Care (LTC): Issues and opportunities for improvement by Ivy Lam A thesis presented to the University of Waterloo in fulfillment of the thesis requirement for the degree of Master of Science in Kinesiology Waterloo, Ontario, Canada, 2014 © Ivy Lam 2014
-
Upload
khangminh22 -
Category
Documents
-
view
0 -
download
0
Transcript of Micronutrients in Long-Term Care (LTC) - UWSpace

Micronutrients in Long-Term Care (LTC):
Issues and opportunities for improvement
by
Ivy Lam
A thesis
presented to the University of Waterloo
in fulfillment of the
thesis requirement for the degree of
Master of Science
in
Kinesiology
Waterloo, Ontario, Canada, 2014
© Ivy Lam 2014

ii
AUTHOR’S DECLARATION
This thesis consists of material all of which I authored or co-authored: see Statement of Contributions
included in the thesis. This is a true copy of the thesis, including any required final revisions, as
accepted by my examiners.
I understand that my thesis may be made electronically available to the public.

iii
STATEMENT OF CONTRIBUTIONS
Chapter 7 was a joint effort of several co-authors. Portions of this chapter has been
accepted for publication and copyright has been assigned to the Canadian Journal of Dietetic
Practice and Research.
Lam I, Keller H, Duizer L, Stark KD. Micronutrients on the Menu: Enhancing the quality
of food in Long-Term Care for regular, non- therapeutic menus. Can J Diet Pract Res.
2015;76(1). (Pagination not yet finalized)
with only the following notable exceptions: 1) increased methodological details in the thesis, 2)
inclusion of 3 figures detailing how micronutrient contents of current Long-Term Care menus
compared to Super-Menus in meeting the Recommended Dietary Allowance/Adequate Intakes of
vitamin D, vitamin E, and potassium, and 3) a 5-day Super-Menu sample menu. The inclusion of
this article as part of this thesis has been approved by the editor of the journal. This study was
designed and conducted by Ivy Lam and Dr. Heather Keller. Ivy Lam performed all the data
collection and analysis. Dr. Lisa Duizer and Dr. Ken Stark contributed to the formatting, review,
correction, and presentation of the tables in this chapter.
Chapter 8 was also a joint effort of several co-authors. Portions of this chapter has been
accepted for publication and copyright has been assigned to the Journal of Nursing Home
Research:
Lam ITL, Keller HH, Duizer LM, Stark KD, Duncan AM. Nothing Ventured, Nothing
Gained: Acceptability testing of micronutrient fortification in Long-Term Care. J Nurs
Home Res. 2014; 1(1). (Pagination not yet finalized)
iv
with the exceptions of: 1)increased methodological detail, and 2) supplementary data (e.g.
recruitment letters, specific survey results) in the appendices. The inclusion of this article as part
of this thesis has been approved by the editor of the journal. This study was designed and
conducted by Dr. Heather Keller and Ivy Lam. Dr. Lisa Duizer, Dr. Ken Stark, and Dr. Alison
Duncan formed the advisory committee to guide the creation of interview questions, and
suggested potential experts for key informant interviews. Ivy Lam and Dr. Heather Keller
conducted all of the webinars, key informant interviews, and in-person focus groups. Note-
taking during focus groups was done by Kaylen Pfisterer.
All aspects of this thesis not listed above were authored by myself, Ivy Lam.

v
Abstract
BACKGROUND: Malnutrition is common among long-term care (LTC) residents, yet there is limited
research on micronutrient (vitamin and mineral) malnutrition in the LTC setting. Micronutrient
deficiencies may exacerbate symptoms of dementia, depression, infections, osteoporosis, and other
prevalent conditions in LTC.
PURPOSE: This research accomplishes phase 1 of a multi-phase study, with the overall research
objective of investigating the potential and extent of micronutrient malnutrition in LTC and identifying
and developing food-first strategies to improve micronutrient intake in LTC residents. This was done
through four sub-studies (detailed below):
METHODS & FINDINGS: Each method and respective findings/conclusions are described below.
Sub-Studies 1 and 2: Scoping Review Observational (SRO) and Intervention (SRI)
Methods: A rigorous scoping review was conducted using selected key terms in four health-related
electronic databases. The initial search identified 2248 eligible titles and abstracts for screening with
inclusion/exclusion criteria. Results: SRO (n=50 citations): Intake for vitamin D, folate, calcium, vitamin
E and B6 were consistently <50% of the Recommended Dietary Allowance (RDA) regardless of
divergent food intake assessment methods. More than one study found biomarkers to be low for vitamin
D, C, folate, and iron in LTC residents. SRI (n=25 citations): Vitamin D and calcium were the most
common micronutrients to be included in both pill supplementation and food fortification interventions.
Different formulations (e.g. single vs. multi-nutrient) were trialed, making comparisons difficult.
Supplementation and fortification demonstrated efficacy but no studies comparing these strategies were
identified. Conclusion: Findings suggest that micronutrient intake and biochemical status are suboptimal
for key nutrients in LTC. Single nutrient interventions predominated and more work on efficacy of multi-
nutrient physiological doses, whether in supplemental or fortification formulations is needed. Limited
fortification studies have been completed and there is a need to determine efficacy for prevention as
compared to supplementation. More research on fortification doses and formulations that are acceptable
and efficacious is also required.
Menu Analysis (MA) and Super-Menus (SM) Methods: Regular, non-therapeutic menus
(week 1, all meals) from diverse LTC homes (n=5) across Canada were analyzed for micronutrient
content using Food Processor with the Canadian Nutrient File. EaTracker was used to determine Canada’s
Food Guide servings. Site dietitians provided home recipes/portion sizes, and validated menu analyses.
SM were designed to meet micronutrient needs without increasing volume and calories, considering the
preferences and portion sizes used in LTC. Results: Despite planning to and generally meeting CFG
recommendations, menus’ nutrient content varied significantly across homes. Micronutrients of greatest
concern across all menus were vitamins D (8.90 ± 5.29 µg/d) and E (5.13 ± 1.74 mg/d). Folate,

vi
magnesium, and potassium were also below recommended values. SM were significantly higher in
several nutrients as compared to home menus, but still were unable to meet vitamin D (11.2 ± 2.54 µg,
mean 56% RDA), E (12.6 ± 4.08, 84% RDA) and potassium (4018 ± 489 mg, 85%) recommendations.
Conclusion: Evidently, current guidelines for menu planning may be inadequate to address micronutrient
needs, and more nutrient-dense strategies need to be explored in LTC. Careful menu planning results in
most micronutrients recommendations being met.
Acceptability Testing (AT) Prior to implementation, potential interventions should be assessed
for their need, feasibility, and acceptability with knowledge users. Methods: Online LTC Staff webinar
focus groups, expert Key Informant interviews and in-person focus groups (residents and family) were
conducted to develop and determine the acceptability of a micronutrient fortification strategy. Polling and
rating questions provided quantitative data to confirm qualitative data. Results: Focus groups and key
informant interviews provided insight into potential food vehicles for fortification (e.g. soups, desserts,
condiments), production and regulatory issues, and helped to develop the strategy to minimize anticipated
barriers and promote uptake. Development of outsourced/pre-made fortified products was the preferred
intervention, with mandatory training and clear protocols for preparers to ensure appropriate use.
Conclusion: Knowledge users can envision food fortification as a potential intervention if products are
easy to access and incorporate into current production systems. All stakeholders desire efficacy research
to support use of this strategy in LTC.
OVERALL: Triangulation of methods (SRI, SRO, MA/SM, and AT) and findings offers a
multidimensional understanding of potential micronutrient deficiencies in LTC and food-first strategies
that can be used to prevent this form of malnutrition. In general, food-first interventions in LTC to
prevent or ameliorate micronutrient deficiency are lacking and quality menu planning using the DRI as a
guide and food fortification are plausible strategies. Further work is needed to determine the relationship
between micronutrient intake and biomarkers of function; does sufficient micronutrient nutrition support
the overall health and quality of life of residents. Greater knowledge and awareness of micronutrient
qualities of foods and of best practices in food-preparation methods through better training and education
of LTC health providers is needed. As a food fortification strategy is further developed, involvement of
multi-level stakeholders is needed to ensure uptake. This work provides foundation for a micronutrient
food fortification strategy to address malnutrition in LTC.

vii
Acknowledgements
“Teach us to number our days, that we may gain a heart of wisdom.” Psalm 90:12
We know so little about how our choices might influence our paths. I would, then, like to dedicate
this work to those who have influenced my choices: To Mum and Dad, for teaching me to respect my
elders and setting an example in loving and caring for our elders. To my Family, much love and thanks.
To my supervisor, Dr. Heather Keller, for your contagious passion for aging and nutrition –
evident to me as I sat in my second year nutrition at U of Guelph. It is thanks to your vision, guidance,
perseverance, and wisdom over the years that this work has become what it is today. It is a joy to be able
to know you as my professor, mentor, and friend. | To my Committee, Dr. Lisa Duizer and Dr. Ken Stark
(and Dr. Alison Duncan), for sharing your expertise, for somehow knowing when to challenge and when
to encourage me to be a better researcher. | To my mentors/colleagues in nutrition/healthcare: Thank you
for answering questions and sharing your real-life experiences. Thank you for advocating for your
residents, clients, and patients. | To my lab (KP, KD, VV, JM), friends/colleagues in Kinesiology (IB,
LM, KDS, DG), and Grad Cell members on my go-to email list (SL, GL, AL, JL, JQ, OW, FC): Thanks
for listening and solving research problems, and for smiling despite hearing the talk for the nth time. If I
have made any improvements as a presenter or educator, it is thanks to your advice and feedback.
To Janet, thank you for celebrating every milestone with me and for teaching me to see people
over work. To Ashleigh, Melanie, Vanessa – thanks for showing me that Friendship > Distance. To Betty,
thanks for listening and sharing food. To Stephanie, thanks for lovingly reining in my over-the-top ideas,
but sometimes coming along for the ride as well. To Gregory, your pursuit of excellence in all your
undertakings motivates me to do the same – thank you. | To Grad Cell (and PT), thanks for your
hospitality and love. Thanks for welcoming me into your lives at KW/UW, for taking time to
answer/explain, for bringing joy through food/movies/exercise, and for setting an example in carrying out
the Great Commission. To friends at KWCAC (esp Andrew & Larissa) and CLBC, thank you for your
faithfulness in nurturing my spiritual life, and for standing firm. Space does not allow me to adequately
acknowledge everyone who has impacted this journey – so simply, thank you. | Soli Deo gloria.

viii
Table of Contents
AUTHOR’S DECLARATION ..........................................................................................................ii
STATEMENT OF CONTRIBUTIONS ............................................................................................ iii
Abstract ................................................................................................................................................. v
Acknowledgements ............................................................................................................................vii
Table of Contents .............................................................................................................................. viii
List of Figures ................................................................................................................................... xiii
List of Tables .....................................................................................................................................xiv
List of Abbreviations .......................................................................................................................... xv
Chapter 1 Introduction.......................................................................................................................... 1
Chapter 2 Background .......................................................................................................................... 3
2.1 Overview of Assessing Nutritional Status and Limits of this Thesis ...................................... 3
2.2 Diet Assessment Terminology & Methodology ....................................................................... 3
2.2.1 Terminology: Dietary Reference Intakes ........................................................................... 3
2.2.2 Methods: Dietary Intake Assessment ................................................................................. 5
2.2.3 Biochemical Assessment of Micronutrients ...................................................................... 7
2.3 Food Intake in Long-Term Care & the Potential for Micronutrient Inadequacy ................... 8
2.3.1 Physiological factors contribute to low food intake ........................................................ 10
2.3.2 Menu Planning and Canada’s Food Guide....................................................................... 11
2.4 On Food Fortification ............................................................................................................... 12
2.4.1 Food Fortification Regulations ......................................................................................... 13
2.4.2 Meeting Micronutrient Needs in LTC .............................................................................. 15
2.5 Acceptability Testing of an Intervention................................................................................. 17

ix
2.6 Triangulation of Data to Answer Research Questions ........................................................... 18
2.7 Summary of Background ......................................................................................................... 19
Chapter 3 Rationale and Research Questions ................................................................................... 20
3.1 Rationale ................................................................................................................................... 20
3.2 Research Objective and Questions .......................................................................................... 20
Chapter 4 Methodological Overview ................................................................................................ 22
4.1 Introduction to Methods ........................................................................................................... 22
4.2 Scoping Review Methodology................................................................................................. 22
4.2.1 Scoping Review vs Systematic Reviews .......................................................................... 23
4.2.2 Scoping Review Search Strategy Used in these Studies ................................................. 24
4.2.3 Standards used for Comparisons: Focus on Biomarker Reference Ranges and Cut-offs
...................................................................................................................................................... 26
4.3 Menu Analysis .......................................................................................................................... 28
4.3.1 Overview of Menu Selection ............................................................................................ 28
4.3.2 Choice of Nutrient Analysis Programs : ESHA Food Processor & EaTracker ............. 29
4.3.4 Interpretation of Micronutrient Analysis of Long-Term Care Menus............................ 30
4.3.5 Development of Super-menus........................................................................................... 31
4.4 Assessing Acceptability of a Micronutrient Fortification Strategy ....................................... 33
4.4.1 Webinar Focus Groups with LTC staff ............................................................................ 33
4.4.2 Key Informant Interviews with Relevant Experts ........................................................... 40
4.4.3 In-person (Traditional) Focus Groups with Residents and Family Members................ 42

x
4.4.4 Enhancing Rigor of Qualitative Methods for Acceptability Testing.............................. 44
4.4.5 Overview of Data Analysis, Interpretation and Triangulation of Acceptability Data ... 49
4.5 Overall Triangulation of Methods ........................................................................................... 50
4.6 Summary ................................................................................................................................... 53
Chapter 5 Micronutrient Intake and Status in Long-Term Care: A scoping review. ..................... 54
Abstract............................................................................................................................................ 54
5.1 Introduction and Background .................................................................................................. 55
5.2 Method of Review .................................................................................................................... 56
5.3 Results of Scoping Review ...................................................................................................... 59
5.4 Discussion ................................................................................................................................. 70
5.5 Limitations ................................................................................................................................ 80
5.6 Conclusion ................................................................................................................................ 81
Chapter 6 Scoping Review: Pill Supplementation and Food Fortification in Long-Term Care.... 86
Abstract............................................................................................................................................ 87
6.1 Introduction ............................................................................................................................... 88
6.2 Method of Review .................................................................................................................... 91
6.3 Results ....................................................................................................................................... 93
6.4 Discussion ............................................................................................................................... 108
6.6 Strengths, Limitations and Future Work ............................................................................... 117
6.6 Conclusion .............................................................................................................................. 120

xi
Chapter 7 Micronutrients on the Menu: Enhancing the quality of food in Long-Term Care for
regular, non-therapeutic menus........................................................................................................ 124
Abstract.......................................................................................................................................... 124
7.1 Introduction ............................................................................................................................. 125
7.2 Methods ................................................................................................................................... 127
7.3 Results ..................................................................................................................................... 130
7.4 Discussion ............................................................................................................................... 131
7.5 Strengths and Limitations ...................................................................................................... 133
Relevance to Practice ................................................................................................................ 134
Chapter 8 Acceptability of Strategy: Webinar Focus Groups, Resident Focus Groups, and Key
Informant Interviews ........................................................................................................................ 136
Abstract.......................................................................................................................................... 136
8.1 Introduction ............................................................................................................................. 137
8.2 Methods ................................................................................................................................... 139
8.3 Results ..................................................................................................................................... 143
8.4 Discussion ............................................................................................................................... 151
8.5 Conclusion .............................................................................................................................. 155
Chapter 9 Discussion and Conclusion ............................................................................................. 157
9.1 Prior Research ......................................................................................................................... 157
9.2 Positioning of Key Findings within Existing Research and Implications of Research
Findings ......................................................................................................................................... 158
9.3 Proposed Micronutrient Fortification Strategy ..................................................................... 168

xii
9. 4 Study Strengths ...................................................................................................................... 171
9.5 Study Limitations ................................................................................................................... 172
9.6 Future Research Directions and Implications for Practice................................................... 174
9.7 Conclusion .............................................................................................................................. 176
References ......................................................................................................................................... 177
Appendices ........................................................................................................................................ 206
Appendix A ............................................................................................................................... 206
Appendix B ................................................................................................................................ 207
Appendix C ................................................................................................................................ 208
Appendix D ............................................................................................................................... 210
Appendix E ................................................................................................................................ 212
Appendix F ................................................................................................................................ 215
Appendix G ............................................................................................................................... 218
Appendix H ............................................................................................................................... 219
Appendix I ................................................................................................................................. 221
Appendix J ................................................................................................................................. 223
Appendix K ............................................................................................................................... 225
Appendix L ................................................................................................................................ 226

xiii
List of Figures
Figure 1 Flow diagram of study 83
Figure 2 Dietary Intake Data 84
2A) Comparison by Dietary Intake Assessment Method (DIAM) at <50% RDA 84
2B) Comparison by Dietary Intake Assessment Method (DIAM) at 50-99% RDA 84
2C) Comparison by Dietary Intake Assessment Method (DIAM) at >99% RDA 84
Figure 3 Micronutrients of Concern by Biochemical Assessment Methods 85
Figure 4A) Micronutrients assessed by biomarkers in Calcium/Vit D interventions 121
Figure 4B) Micronutrients assessed by biomarkers in non-Calcium/Vit D interventions 122
Figure 5A) Micronutrients cited by observation studies measuring intake and/or in
intervention studies dosages 123
Figure 5B) Micronutrients cited by observation and intervention studies measuring
biomarker status 123
Figure 6) Comparison of LTC vs Super-Menus in meeting RDA/AIs for Vitamins
D, E, and Potassium 135
Figure 7) Frequency of micronutrients identified in webinars as being of potential
concern for LTC residents 156

xiv
List of Tables
TABLES 227
Table 1 Database Search Terms 227
Table 2 Micronutrients of Concern from Intake Studies (by type and length of study) 229
Table 3 Biochemical Data Compared to Reference Values (AMA, CDC, Paper references)
235
Table 4 Scoping Review Observational Studies: Reference Range 238
Table 5A Supplementation: Results of Vitamin D and Calcium Studies 241
Table 6A Supplementation: Results Other Micronutrient Studies 243
Table 7A Fortification: Results from Vitamin D and Calcium Studies 246
Table 8A Fortification: Results of Other Micronutrient Studies 247
Table 5B Supplementation: Results Vitamin D and Calcium Studies 248
Table 6B Supplementation: Results Other Micronutrient Studies 250
Table 7B Fortification: Results from Vitamin D and Calcium Studies 252
Table 8B Fortification: Results from Other Micronutrient Studies 253
Table 9 Supplementation of Vitamin D/Calcium 254
Table 10 Supplementation of Other Micronutrients 255
Table 11 Fortification of Vitamin D and Calcium 257
Table 12 Fortification of Other Micronutrients 258
Table 13 Five-day Super-Menu Sample Menu 259
Table 14 Key foods used to Meet DRIs in Super-menus 261
Table 15 Between-home Comparison of Planned Menus and the Dietary Reference Intake for
Calories, Protein and Micronutrients 261
Table 16 Comparison of Planned Menu and Super-Menu Averages to Dietary Reference Intakes
for Calories, Protein, Fibre, and Micronutrients 263
Table 17 Participant Characteristics 264
Table 18 Exemplar Quotes on the Acceptability of Food Fortification in Long-Term Care
265
Table 19 Potential Food Vehicles for Micronutrient Food Fortification in Long-Term Care
267

xv
List of Abbreviations
AMA American Medical Association
CDC Centers for Disease Control and Prevention
CFG Canada’s Food Guide
DRI Dietary Reference Intakes
EAR Estimated Average Requirement
EFR Estimated Food Record
KI Key Informant
ONS Oral Nutritional Supplement
RD Registered Dietitian
RDA Recommended Dietary Allowance
LTC Long-Term Care
NM Nutrition Manager
WFR Weighed Food Record

1
Chapter 1
Introduction
The number Canadians aged 65 and above living in health care institutions, including
Long-Term Care (LTC) Homes is projected to double, with an anticipated 750, 000 Canadians
living in these settings by 2036 (1). A similar trend is seen globally (2,3), although different
formats and styles of care are available (4). While estimates of malnutrition in LTC are elusive, it
is estimated to occur in 20-60% of residents in Canada (5–9); similar rates of malnutrition are
seen worldwide (10–12). Adequate intake of a varied diet is needed to meet micronutrient
requirements, although physiological factors including challenges with self-feeding, early
satiation, taste changes, dysphagia, and decreased appetite are significant contributors to older
adults’ food intake, rendering them nutritionally vulnerable (13,14). Micronutrient (specifically,
vitamin and mineral) status is critical to managing common health issues in LTC, including
anemia, bone health (15), cognitive and functional status (16), immunity (17), infections, and
wound healing (18). Micronutrient deficiency is potentially a prevalent yet preventable form of
malnutrition among older adults living in long-term care (LTC) (5,19–21). These deficiencies
may further aggravate poor health and low intake, leading to a vicious cycle of malnutrition and
decreased function, directly impacting residents’ quality of life (22).

2
Poor food intake is common in LTC (5,21,23). Plate waste estimation suggested that
approximately 1600 kilocalories is consumed (14), with even lower consumption by cognitively
impaired residents (~1,100 to 1,200 kcal per day) (5). Yet, most studies to date that rigorously
collected food intake data are based on a single convenience sample, which doesn’t necessarily
represent the population of older adults in LTC. To further understand if micronutrients are a
potential problem, rigorous review of the extant literature to summarize findings and identify
research gaps is needed. Recent research has also demonstrated that menus may not provide
adequate micronutrients to meet dietary recommendations, even when meals are completely
consumed (5,19,24,25). Clearly, a shift towards prevention of micronutrient malnutrition is
needed for this vulnerable population.
At present, there is no consensus on the best way to prevent or treat micronutrient
malnutrition in LTC residents (26). In view of residents’ average low food intake (5,27) and the
recommended micronutrient levels to achieve nutritional adequacy (5,28), micronutrient
fortification of key foods is a potential prevention method (29). Little is known about
fortification and how this strategy can be developed to be useful for prevention for the majority
of older adults living in care environments. Other strategies, such as micronutrient
supplementation, which is typically used to treat known or suspected deficiency, may also be
beneficial, but a better understanding of these strategies (including micronutrient content and
dosages trialed) is needed. To move forward, agreement on the micronutrients of concern (i.e.
micronutrients that residents are at highest risk of deficiencies for), based on poor intake or
biochemical status is needed for the LTC sector. Moreover, identifying stakeholders’
perspectives of micronutrient fortification will enhance understanding of both the practicality
and potential barriers to implementation of this strategy. This thesis will begin to bridge these
gaps to support micronutrient nutrition of older adults living in LTC.

3
Chapter 2
Background
2.1 Overview of Assessing Nutritional Status and Limits of this Thesis
Nutritional status of residents living in LTC is measured comprehensively by using
several methods, including: clinical characteristics (e.g. factors that place an individual at risk of
poor intake such as requiring eating assistance), environmental factors impacting food intake
(e.g. micronutrient content of menus), body size and composition (e.g. weight for height), food
intake (i.e. dietary status), functional parameters (e.g. strength, capacity for activities) and
biochemical markers of nutritional state (i.e. serum albumin, micronutrient-related biomarkers)
(30,31). To determine micronutrient status specifically, three measures are commonly used: food
intake, biochemical markers of the micronutrient and functional outcomes of
adequate/inadequate status (e.g. vitamin D and fractures) (31,32). Intake has to be adequate to
meet individual requirements for biochemical markers to be at a normal level, which then
influences body and tissue functions that require the nutrient. Research may undertake only one
or two of these assessment areas in an attempt to understand micronutrient status, but true status
can only be determined from functional markers (32,33). This thesis will be focused on the two
former methods and a review of terminology, concepts and methods will be first provided. A
brief literature of micronutrient food intake and biochemical status will then be outlined.
2.2 Diet Assessment Terminology & Methodology
2.2.1 Terminology: Dietary Reference Intakes
The Dietary Reference Intakes (DRIs) were developed by the Institute of Medicine
(IOM) of The National Academies in order to provide reference values of nutrients for which to
guide nutrition intake or assess and plan diets for healthy populations in the United States and
4
Canada (33). Specific values are given for different age groups, gender, and life stage (34). Other
dietary references have been developed around the world (35), but this thesis will focus on the
DRIs as set by the IOM. Within the DRIs are several terms and concepts which will be addressed
below.
RDA: The Recommended Dietary Allowance (RDA) provides a reference for meeting
nutrient requirements for nearly all (97-98%) healthy individuals in a particular gender, age, and
life stage group (e.g. those >70 years old) (28). This is the goal to which individuals would target
their intake, as an individual’s requirements are typically unknown (36). The RDA is set where
there is an established Estimated Average Requirement (EAR). Understandably, certain
individuals may require nutrient levels higher than the RDA, but the RDA covers the needs of
the majority.
EAR: The Estimated Average Requirement (EAR) is the level of average daily nutrient
intake estimated to meet half (50%) of the population’s requirements, based on their given age
and gender group. These levels have been established based on a thorough literature review
identifying requirements for a population group based on use of functional markers of status
(33). In general, the RDA is calculated from the EAR using this equation: RDA = EAR + 2 SD,
where the RDA is the EAR plus two times its standard deviation (SD).
AI: Adequate Intake (AI) is used in the place of the RDA if an EAR (thus, RDA) has not
been established for a particular micronutrient due to insufficient scientific data (34). The AI is
developed from observed or experimental estimates of the nutrient intake of groups of healthy
individuals who are assumed to have adequate intake (34). For instance, since EARs have not
been developed for vitamin K, pantothenic acid, biotin, choline, chromium, fluoride, manganese,
these micronutrients will have an AI instead.

5
UL: The Tolerable Upper Intake Levels (UL) is used to determine the highest level of
long-term daily intake for individuals that does not present adverse health effects (28,37).
Logically, should intake increase above the UL, the risk of adverse effects would also increase
(28). The UL is useful in areas of food fortification or supplementation, as the UL typically takes
into account the total intake of nutrient from natural food, fortified food, or supplements (34).
Those at higher risk of toxicity would be those who consume a large amount of key foods, select
a higher proportion of fortified foods, or who take supplements as well as fortified foods (37).
Certain nutrients are not presented with a UL due to insufficient data, not because there are no
adverse effects from high intakes of these nutrients; it is recommended that extra caution be
given when consuming high amounts of these nutrients (34).
2.2.2 Methods: Dietary Intake Assessment
Dietary assessment is a less invasive method of assessing nutrient or nutritional status
compared to physiological methods, and can be used as an initial measurement of potential
inadequate or excess intake, to be then be paired with physiological and/or biochemical measures
for a more accurate assessment (30). Dietary assessments include retrospective methods (e.g.
Food Frequency Questionnaires (FFQ), dietary surveys, 24-hour recalls, diet histories) and
prospective methods (e.g. estimated food records (EFR), weighed food records (WFR), and
duplicate portion analysis) (31). While other dietary assessment methods exist, only those
encountered in the conduct of this thesis will be explained. Description of methods have been
focused for the LTC context.
Retrospective Methods
24-hour recall: Participants report on past food and beverage consumption for a 24-hour
timeframe, with a trained interviewer probing on portion size, frequency, and missed items (31).

6
Although potentially useful in some LTC environments, potentially with the respondent being
staff, this method is not commonly used due to limits of memory and recall of residents.
Food Frequency Questionnaire (FFQ): Participants are provided a list of foods in
different categories (e.g. by food group) consumed over a specified period (e.g. past month, past
year) to select from. This can be done individually, or administered by a staff or the researcher.
FFQs may be tailored to a specific nursing home diet/menus, but are also limited by the memory
of residents.
Diet history: Participants report on all food and beverages consumed over a usual day or
number of days to a trained interviewer, who will also probe on portion size, frequency, and
missed items (31). This can be combined with food diaries to help participants to recall and
increase accuracy of the report.
Prospective Methods
Weighed food record (WFR): Trained staff or researcher weighs foods (either entire plate,
or separately weighing components of food on the plate) on a scale before it is served to the
participant. A reference plate’s weight may also be used as a standard pre-serving weight.
Leftovers are reweighed, and the weight difference before and after the meal is calculated and
recorded.
Estimated Food Record (EFR): Trained staff or researcher observes participants’ intake
at mealtimes (and snack-time) and records the amount of foods consumed. This can be recorded
in terms of range of percentage of the food consumed (e.g. 50-75% consumed).
Food Diary: The participants record all food and beverages consumed in household
measures (by estimate or actual measures), usually over a number of days (31). This may be
done by staff as capacity of residents to complete the diary may be limited.

7
Duplicate Portion Analysis: A researcher or trained staff weighs or measures a duplicate
identical portion of food and beverages consumed by the participant.
Retrospective methods are considered inferior to prospective methods as they rely on
recall of the participant and items can be missed; thus they are less accurate (38). Although
prospective methods measure ‘actual’ intake as intake is recorded as consumed, no method
adequately represents true intake of an individual, as prospective methods are known to change
eating behavior (31). How close the dietary assessment represents ‘true diet’ is also influenced
by the number of days of diet collection. Yet, different numbers of days of collection are needed
to represent usual intake, depending on the nutrients assessed (30). Certain procedures within an
assessment method may also be more accurate than others (e.g. weighed food records vs.
estimated food records). Consideration of administration time and participant burden impact the
choice of dietary assessment method and need to be balanced against need for representativeness
and accuracy of intake (31). Thus, the reality is that few to no individual food intake studies will
be of sufficient rigor to fully address the question of which micronutrients are inadequately
consumed in LTC residents. A rigorous review of the literature to date could provide a basis for
this understanding.
2.2.3 Biochemical Assessment of Micronutrients
In addition to dietary intake, biomarkers or biochemical measurements of micronutrients
provide a snapshot of their levels or their activity in the body (e.g. PTH for vitamin D and
calcium status) (39). Biomarkers may be a more accurate method to determine potential
micronutrient deficiency for some nutrients, due to absorption, storage and utilization differences
among individuals (39,40). For better accuracy, several studies have examined both dietary

8
intake and biochemical data, finding that intake assessment may identify inadequate
micronutrient intake, but micronutrient biomarker statuses may still be within normal limits
(20,41–43). A review that rigorously accumulates this evidence to determine those
micronutrients that may be inadequate for residents living in in LTC, based on an assessment of
biomarker status in addition to dietary intake is needed.
When conducting research on micronutrient status, individual laboratories conducting
biochemistry and researchers in their won labs often use their own cut-offs to determine potential
inadequacy of a nutrient. To be able to compare citations, a common reference is needed.
Reference ranges for what is considered normal is available for most nutrients from the
American Medical Association (AMA); these ‘normal’ ranges are used in both scientific and
medical settings (44). The Centers for Disease Control and Prevention (CDC) also provides
reference cut-offs for values that are below normal, at low and/or deficient values (45).
Additional limitations with biochemistry assessments include issues with sensitivity and
reliability of existing biomarkers, where some have limited usefulness due to tight self-regulation
(e.g. serum calcium) or lack in sensitivity (e.g. decreases do not always indicate deficient states)
or specificity (changes in response to more than one micronutrient status) (39,46). Potential
biomarkers for assessing micronutrient status are under development (40,47). All of these add to
the challenge in identifying micronutrients that are potentially inadequate.
2.3 Food Intake in Long-Term Care & the Potential for Micronutrient Inadequacy
Malnutrition in LTC has been well-documented, affecting 20-60% of residents (5–9).
Low food intake in LTC has been measured in practice and research (5,24,48). Micronutrient
deficiency (specifically, vitamin and mineral) is a potentially prevalent yet preventable form of
malnutrition among older adults living in LTC (5,19–21). Moreover, micronutrient status is

9
critical to managing common health issues in LTC, including anemia, bone health (15), cognitive
and functional status (16), immunity (17), infections, and wound healing (18). Deficiencies may
further aggravate poor health and low intake, leading to a vicious cycle of malnutrition and
decreased function, directly impacting residents’ quality of life (22). Contributors to inadequate
food intake include poor dentition (49), declining health requiring modified texture diets (50),
and other disease states requiring higher nutrient needs (12). One study measured plate waste and
found that residents, on average, consumed about 1600 kcal/day (14). Intake may be lower for
those with cognitive impairments, where a mean intake of 1,100 to 1,200 kcal/day has been
identified (5).
To date our understanding of potentially inadequate micronutrient intake and biochemical
status of nutrients is fragmented. In practice, estimated food records are commonly used to assess
residents’ food intake over time (51). Issues with this method include inaccuracies in reporting
by nursing staff where residents’ food intake is often overestimated (52,53). Additionally,
records generally do not specify which portion of the meal was not consumed, lacking the
specificity to assess residents’ micronutrient intake, making it difficult to determine if residents
are at risk of micronutrient deficiencies. In research, a variety of assessment methods have been
used, from food frequency questionnaires (54) to duplicate portion analysis (55). Due to the
variability in the quality of dietary assessment methods, different micronutrients are often
identified to be poorly consumed creating a challenge in identifying whether micronutrient intake
is actually poor in LTC, and which micronutrients are likely to be at a high risk of deficiency
(41,56,57). Furthermore, studies are generally based on a single convenience sample (Viveky et
al., 2012; Wakimoto & Block, 2001; Woods et al., 2009) which is not generalizable. A
comprehensive review that brings together the available literature, and identifies effects seen and
strategies used to address potential micronutrient inadequacies across different regions is needed

10
to provide some clarity to this issue. As it is unknown at this point the extent of literature
focused on micronutrients in LTC, a scoping review methodology will be used to summarize the
disparate data on micronutrient food intake in LTC to better understand not only consistent
micronutrients that are low in the diet, but also gaps in literature.
2.3.1 Physiological factors contribute to low food intake
With age comes physiological changes, including declining abilities of organ systems and
impaired homeostatic regulations (60). Common physiological challenges include issues with
self-feeding, early satiation, taste changes, dysphagia, and decreased appetite which often hinder
older adults’ food intake or affect their ability to eat, rendering them nutritionally vulnerable
(13,14). Dentition (49,61) and impaired swallowing mechanisms (62–64) further limit residents’
ability for adequate food and subsequently, micronutrient, consumption. As aforementioned, low
food intake is prevalent in LTC. This is beyond caloric intake alone, as dietary diversification, or
an adequate intake of a varied diet is also needed to meet micronutrient requirements. However,
decreased physical mobility and energy expenditure may lead to decreased appetite (60), despite
similar or even increased nutrient requirements (65).
Prolonged inadequate intake of micronutrients may accelerate degenerative chronic
diseases such as cardiovascular disease, cognitive decline (66), and other conditions that plague
the LTC population. Impaired adaptive mechanisms to oxidative stress from deficient intakes of
anti-oxidative micronutrient (e.g. vitamin C, E), along with selenium and zinc, further contribute
to age-related oxidative diseases (67). Thus, a vicious micronutrient malnutrition cycle is seen
where physiological factors impair consumption of micronutrients, and inadequate
micronutrients further aggravate disease states in residents living in LTC.
11
2.3.2 Menu Planning and Canada’s Food Guide
In addition to the physiological and psychosocial barriers to food intake in LTC that need
to be considered when identifying potential micronutrient inadequacy, the menus themselves
used in LTC for provision of food are another potential barrier to nutrient intake. In Canadian
LTC homes, menus are currently planned with Canada’s Food Guide to Healthy Eating (CFG)
to ensure variety (55). However, CFG may be inadequate in addressing micronutrient needs in
menu planning, as foods were not grouped into food groups based on nutrient content, but rather
how food is traditionally consumed (5,68). Consequently, micronutrient content of CFG choices
differ greatly from choices within the same food group, and even the most nutrient dense food
choices may still be inadequate to meet micronutrient recommendations. For instance, legumes
are grouped with meats because they are used as a meat substitute, yet the micronutrient profile
of legumes are much different from meat products.
Dietary Reference Intakes (DRIs) provide micronutrient recommendations, yet planning
based on this reference requires knowledge of intake distribution (69), which is currently lacking
in LTC. Thus, menu planners use their professional judgment with the assumption that, by
following CFG and serving a variety of foods, the DRIs will be met (5). Although menus are
planned to meet 100% of residents’ needs, some residents may not meet their micronutrient
requirement due to low food intake (5). Canadian research examining the adequacies of LTC
menus using the CFG have demonstrated some improvements in nutrient provision with the 2007
revision to the guide (48), yet difficulties in meeting all micronutrient requirements with current
menus continue to call for new menu planning strategies (5,70). Moreover, these studies
generally examine single menus from one location, and are not generalizable. A study examining
several Homes under different management from several locations in Canada may provide a
more comprehensive report of the state of micronutrient provision in menu planning in LTC and

12
if current planning is inadequate to meet the DRI. As well to date, there has been no comparison
of menus designed to meet the DRI to those based on CFG.
2.4 On Food Fortification
Increasing nutrient-density of traditional foods is a way of increasing micronutrient
intake and status. Historically, micronutrients and food fortification has been used to combat
population-specific diseases, maintain health, and prevent illnesses worldwide (71). From iodine
in salt (72,73) to folic acid and iron in cereal grains (74–77), issues like gout, spina bifida, and
iron-deficiency anemia have become more rare in populations that have implemented
fortification for these nutrients. Furthermore, fortification can be incorporated into staple foods,
thus minimizing change and burden for consumers (71). Cost-wise, micronutrient fortification
has been shown to be a cost-effective preventative method in reducing nutrient-based diseases
when comparing cost of fortification to costs attributed to deficiency or hospitalization (78,79).
It is recognized that fortification will not meet all population requirements (79). Thus,
guidelines to assess whether food fortification should be considered have been established
(79,80). This includes the need for: an appropriate food vehicle that is consumed by the
population at risk, centralized food-processing systems, evidence of prevalent deficiencies in the
population, or the cost of deficiency is high even if the effects only pertain to a small group
(79,80).
The majority of fortification work has targeted developing countries (Rosalind S. Gibson
& Hotz, 2007; UNICEF, 2005; Usfar et al., 2009; Van der Merwe, Kluyts, Bowley, & Marais,
2007), usually targeting youth (84) and pregnant women (73). In developed countries, research
on fortification target similar populations: pregnant women (85) and children (86).

13
However, a rapidly growing at risk population in developed countries has been
overlooked– older adults in LTC. Studies have evaluated the benefits of fortification for older
adults, focused on vitamin B12 and homocysteine-related cardiovascular disease (74), and
vitamin D/calcium and bone diseases (87,88). This population potentially meets the criteria
stated by Horton et al. (2006). However, identification of appropriate food vehicles and a
structured examination of the prevalence of micronutrient deficiencies in LTC residents is
required. The sections below will explain fortification regulations from both general and
Canadian-specific viewpoints, and how fortification may be applied in the LTC setting.
2.4.1 Food Fortification Regulations
Fortification of micronutrients (vitamin and minerals) is a strategy to maintain and/or
promote nutrition in food, along with potential protection from nutrient deficiencies (89).
Fortification regulations are in place to avoid excessive nutrient provision, and to ensure that
adequate and consistent amounts of nutrients are added to fortified foods. Each nation has its
own food fortification regulations (37,87,90).
The Codex Alimentarius Commission (the Codex), developed by the United Nations and
the World Health Organization, has established general principles for adding essential nutrients
into food (91). According to the Codex, essential nutrients are substances in food that cannot be
made in the body, or cannot be made in adequate amounts, and these substances are needed for
maintenance of health and/or growth (91). Fortification is the term used when essential
nutrient(s) are added to a food that may or may not originally be in the food, with the goal of
preventing or correcting potential nutrient deficiencies for a specific population (91). This is
different from restoration, which is the addition of essential nutrients that were originally in a
food but removed due to losses from the manufacturing, storage, or handling process; the
purpose is to restore the original amount present prior to processing (91,92). Standardisation is

14
the term used when nutrients are added back to foods to offset natural or seasonal fluctuations in
nutrient content (71).
The food vehicle is the food in which these essential nutrients will be placed. It should
also be a food that is commonly consumed by the population of interest (91). The nutrient and
dosage added in the fortification formulation will be based on the nutritional issues and food
consumption patterns of the population of interest. The dosage of nutrient(s) added to the food
should be adequate to prevent or correct the deficiency of interest based on normal consumption
of the fortified food by the targeted population group, yet not high enough to lead to excessive
nutrient intake by those who have high intakes of the fortified food (91). “Demonstrated need”
refers to evidence of actual clinical or subclinical deficiencies, estimated risk due to low levels of
nutrient intake, or potential deficiencies due to changes in food habits (91).
Discretionary Fortification and the Canadian Food Inspection Agency
Canada’s fortification policies presents an example of regulations around micronutrient
(vitamin and mineral) fortification. The Canadian Food Inspection Agency has proposed
regulations for discretionary fortification (beyond mandatory fortification, where manufacturers
can choose to add additional micronutrients to foods), based on the types of micronutrients
chosen for fortification (89). Three risk categories exist to group the nutrients and levels
permitted for fortification:
Risk A nutrients: Thiamine, riboflavin, niacin, vitamin B6, vitamin B12, pantothenate,
biotin, vitamin E, vitamin C, and beta-carotene.
These are nutrients with a wide margin of safety with the Tolerable Upper Limit of Intake

15
(UL), nutrients with no UL set, or nutrients with narrow UL margin but has “non-serious
critical adverse effects.” The total percent daily value (% DV, total of naturally occurring
and added) of these nutrients can be up to 20%, to make the fortified food an “excellent
source” of the nutrient(s) (89)
Risk B nutrients: Vitamin D, folate, potassium, calcium, magnesium.
These are nutrients with serious adverse effects if taken at excessive levels, but risk of
excessive intake at the proposed level of discretionary fortification is low. These nutrients
can be added up to 10% DV to a food (total of naturally occurring and added) (89)
Risk C nutrients: Nutrients not permitted in discretionary fortification: Vitamin A, zinc,
iron, copper, selenium, manganese, iodine, and fluoride.
These are nutrients that have a narrow margin of safety with serious adverse effects,
and/or current intake of the population is already above the UL (89)
2.4.2 Meeting Micronutrient Needs in LTC
In addition to menu planning that meets the DRI, there are two other approaches that
have been used to improve micronutrient intake in LTC residents. Supplementation of
micronutrients in LTC has been shown to improve bone markers and bone mass for those with
vitamin D deficiencies (93,94) and ameliorate status of other micronutrients (95,96). However,
contradictory results have been reported when functional outcomes were measured, where
micronutrient supplementation was not shown to reduce respiratory infections (97,98), fracture
rates (99), or healing times of pressure ulcers (100). There are also concerns with

16
supplementation, including food-drug interactions (101), polypharmacy (102–104), the need for
staff administration and resident compliance (105), and toxicity at high dosages (106).
Enriched/fortified foods have been proposed as a ‘food first’ approach to addressing
nutritional issues and improving health status, requiring no change in behaviour on the part of the
resident (107,108). High protein and energy ingredients (e.g. milk, eggs, or cheese) have been
added to foods and shown to improve macronutrient intake (109), but these enhanced foods
typically do not focus on improving micronutrient intake (107). Liquid or powdered protein
supplements are also available to be added to the diet (108).
Fortification has been considered a potential solution to micronutrient malnutrition in the
elderly population (29,110). Yet, few studies have examined micronutrient deficiencies and/or
fortification, with the most commonly studied nutrients being vitamin D (111–114), calcium
(114,115), and folate (116,117). These fortification studies have found improvements in blood
vitamin levels from micronutrient fortification (29,118,119). Although not all biomarkers
improve (119), one study showed no improvement in a functional score for community-dwelling
older adults consuming vitamin and mineral enriched foods (120). Difficulties with fortification
have been noted, such as altered taste of the enhanced food (119). However, the lack of
consistency between dosage used, micronutrient added, food vehicles, and settings (community,
LTC) between studies make comparisons difficult. It is also unclear how efficacious fortification
is in contrast to other strategies. A comprehensive review that identifies diverse supplementation
and fortification studies in LTC may provide further insight to these questions.
In view of LTC residents’ average food intake levels in comparison with the
micronutrient levels needed to achieve nutritional adequacy, micronutrient fortification of foods
holds promise as a means of increasing nutrients without calories (19,26) and replacing
supplementation which is not a preventative strategy. However, before a new intervention is

17
fully implemented, it is important to determine if it is acceptable and feasible to the end users
(knowledge users, in our case). To date, there is minimal understanding of how acceptable food
fortification would be to all stakeholders, including residents and staff.
2.5 Acceptability Testing of an Intervention
Assessment of acceptability and feasibility of new interventions with knowledge and end
users have been recommended to promote understanding, participation, adherence and positive
outcomes of interventions, and to ensure that these approaches are applicable to the users’ daily
lives (121). Acceptability and feasibility are commonly confused and their definitions should be
clarified. ‘Acceptability’ is defined as the “suitability or favorability” of an intervention, and
‘feasibility’ is the “ease or convenience of execution” (121–123). Both of these terms affect the
researchers and the participants, yet it has been argued that ‘feasibility’ pertains more to the
researcher who is executing the study/intervention, while ‘acceptability’ affects the
interventions’ recipients and the providers/health professionals who will carry out the
intervention (122). Thus, this thesis used the term ‘acceptability testing’ when describing
participants’ perception of a micronutrient fortification strategy in LTC.
Acceptability testing has been suggested to be done with end users prior to
implementation, especially when the strategy requires changes in care processes (121).
Involvement of stakeholders (e.g. practitioners and consumers) may enhance relevance and use
of research in practice (121,124,125). Resident and family members’ perspectives have also been
found to be helpful in designing new programs in LTC (126). Establishment of acceptability is
essential in the early stages of the intervention, prior to full implementation, to determine
whether it is the lack of acceptability to the intervention (e.g. poor intervention uptake) that led
to poor results, rather than failure of the intervention, per se (127).

18
Determining the acceptability of micronutrient fortification with stakeholders who are
closely aligned with planning, purchasing, preparing and serving food (dietitians, nutrition
managers, cooks), as well as with end users of food fortification (residents) and family members
will enhance understanding of barriers to implementation of a potential food fortification
strategy. To date there is no known acceptability testing for fortification in LTC.
2.6 Triangulation of Data to Answer Research Questions
Strategies to collect diverse data to address complex issues and questions in health
research have been proposed (128). Research of LTC environment and teams have generally
been qualitative studies (129,130). However, researchers have expressed the need for multi-
approach/methods studies to address multifaceted questions affecting care practices in LTC
(131,132). Care for aged residents with complex health concerns involves many stakeholders
(i.e. staff, family, and residents), and is thus an ideal context for use of diverse data collection
methods and approaches, including flexibility in methodology to capture each stakeholder
groups’ perspectives (133). Moreover, a better understanding of the context through participants’
perspectives can challenge researchers’ assumptions and interpretations, providing additional
critical analysis and feedback on the study and enhancing the credibility of the findings (134).
Mixed methods research that uses both quantitative and qualitative approaches in
combination may provide a better understanding of research problems than a single approach
alone (134). The use of surveys (quantitative) and focus groups (qualitative) has complementary
strengths and supports a mix of open and closed ended questions. The combination of
quantitative and qualitative methods and interpretation of findings in light of each other’s results
is called triangulation. Triangulation through the use, congruence, and confirmation of multiple
sources of evidence helps to strengthen research validity (134). As well, where one method

19
informs the other, leading to new directions of research and lines of questioning, the overall
quality of a study will be enhanced (134,135).
Specific to this work, the overarching research question is multifaceted and requires
several angles or studies to be fully addressed. Learning and building on results from each study
in a stepwise approach will result in triangulation of findings. Additionally, acceptability testing
for a strategy to improve micronutrient intake in LTC requires the multiple perspectives and their
triangulation of knowledge users to enhance our understanding of the acceptability of this
strategy (136). Thus data within this specific study will also be triangulated.
2.7 Summary of Background
In summary, poor overall intake due to physiological changes with age impacts food and
micronutrient intake of residents in LTC; menu planning which is based on CFG, may be part of
this problem. Yet, due to variability in diet assessment and biochemical markers and their cut-
offs, often in single, convenience samples, it is still unclear if and which micronutrients are
potentially inadequate in this population. A thorough review of research to date on the topic to
examine results of diverse assessment methods and strategies trialed is needed to not only
summarize work to date, but also identify gaps for future research. Interventions to improve
micronutrient status in LTC need to be similarly summarized. Fortification is believed to be a
viable strategy, but as it requires changes in practice and is a more novel approach, input from
stakeholders (residents, family, health providers, experts) through acceptability testing is needed
before this strategy is further formalized. Triangulation of findings from diverse perspectives and
approaches is needed to address the overarching research question of if micronutrient status is a
problem in LTC and how it can be improved.

20
Chapter 3
Rationale and Research Questions
3.1 Rationale
While researchers agree that micronutrient inadequacies are of concern for older adults
(42,137–139), the prevalence of micronutrient malnutrition in LTC is still not fully understood,
and studies have not examined the full range of micronutrients that may be low for LTC
residents. Moreover, the variety of strategies trialed to improve residents’ micronutrient intake
have yet to be documented. Thus, this thesis aims to begin to address this gap in knowledge.
3.2 Research Objective and Questions
The overarching research objectives were to 1) investigate the potential and extent of
micronutrient malnutrition in LTC and 2) identify and develop food-first strategies to improve
micronutrient intake in LTC residents.
The specific research questions were:
(1) What is the range of micronutrient intake and status (biomarkers) in LTC from the
literature, and how do these values compare to standard references (DRI and biomarker
cut-offs) to determine the potential for micronutrient malnutrition?
Hypothesis 1: Micronutrient malnutrition (including specific micronutrient deficiencies
and/or decreased intake (140)) exists in LTC and can be evidenced by assessing
micronutrient intake and biomarker statuses.

21
(2) What feasible and effective non-oral nutritional supplement interventions for
improving micronutrient status have been shown to be effective in LTC residents?
Hypothesis 2: Identified micronutrient food fortification interventions will improve
micronutrient biomarker levels for LTC residents.
(3) What is the adequacy of micronutrient provision in LTC menus when compared to the
DRI? Can a food-first menu planning strategy provide sufficient nutrients to meet
residents’ requirements?
Hypothesis 3: LTC menus show variability and do not meet the RDA for several
nutrients.
(4) Is a food fortification strategy considered acceptable by various stakeholder groups?
What provisions are necessary to enhance acceptability?
Hypothesis 4: Micronutrient fortification is an acceptable intervention for stakeholders,
and be preferred over pill-forms for supporting micronutrient intake.
Both quantitative and qualitative methods in four linked sub-studies were used to meet research
objectives. It is anticipated that a better understanding of the extent of micronutrient malnutrition
in LTC and the effects of strategies trialed will inform future micronutrient-enhancing strategies,
such as micronutrient food fortification. Methods and results were triangulated to provide a more
comprehensive understanding to address the overarching research question.

22
Chapter 4
Methodological Overview
4.1 Introduction to Methods
Several different methods were chosen to address the overall research question.
Specifically, for Objective 1: to identify if this is an issue with respect to consumption of specific
nutrients in LTC residents, a scoping review of observational studies related to LTC was
undertaken. Similarly to address Objective 2, a scoping review of intervention studies of non-
oral nutritional supplement (ONS) studies trialing either vitamin/mineral pills or food
fortification was completed. For Objective 3, a nutrient analysis on five, 7-day LTC menus from
4 provinces was performed, and a five-day micronutrient-dense food-based super-menu was
created and compared to standards, as well as these five homes. Objective 4 was focused on
determining the acceptability of a micronutrient fortification strategy for LTC. To address this
objective, webinar focus groups (with LTC staff), key informant interviews (with relevant
experts), and in-person focus groups (with LTC residents/family) were conducted. An overview
of key points in the methods to address each of these objectives is outlined below. Not every
aspect of methods undertaken will be covered; rather key methodological points, will provide an
overview justifying the choice of method, and demonstrate particular strengths and limitations as
well as methodological processes to enhance rigor.
4.2 Scoping Review Methodology
A thorough literature review is needed to provide an understanding of the micronutrient
needs of older adults in LTC and what interventions, outside of oral nutritional supplementation
such as micronutrient fortification, have been shown to be efficacious to improve status. A
scoping review was the chosen method for this literature review. This method provides an

23
opportunity to quickly explore a body of literature, allows for summary and dissemination of
research findings, and helps identify research gaps in existing literature when the research
conducted to date in a specific area is diverse (124). Scoping reviews have been recommended
for areas of research that have yet to be reviewed in a thorough manner (141) and are especially
useful when the research question is not focused.
The five stages of a scoping review have been expanded and detailed by Levac et al.
(2010) using the Arksey and O’Malley framework. These include: 1) Identifying the research
question, 2) Identifying relevant studies, 3) Study selection, 4) Charting the data, and 5)
Collating, summarizing and reporting results (142). An optional stage 6) Consultation exercise to
inform and validate findings, is also suggested. The first two stages were particularly relevant to
this study: 1) to summarize and disseminate research findings, and 2) to identify research gaps in
existing literature. The following will contrast scoping and systematic reviews. Next, the
methodology used for identification and extraction of data will be reviewed. Finally, the
consideration of standards for comparison, and specifically biomarkers to demonstrate status and
efficacy of interventions will be discussed.
4.2.1 Scoping Review vs Systematic Reviews
A scoping review follows similar rigorous steps to that of a systematic review, but with a
different outcome. Systematic reviews begin with highly focused and well-defined questions,
typically only include rigorous study designs, have pre-defined inclusion/exclusion criteria, and
focus on the quality of the research findings in order to come to a conclusion; often systematic
reviews are used to determine if and how a treatment or intervention should be employed for a
specific condition (124,143,144). Scoping reviews are less focused allowing reviewers the ability
to address broader topics as compared to systematic reviews (124). Thus, a scoping review is

24
especially useful when the question is less focused, helping to map out relevant literature in the
field of interest (144), including grey literature (124). Due to a lack of prior reviews on this topic,
this study did not have a highly specific question, which is one of the key criteria for a
systematic review. In addition, this study aimed to explore the diversity of research describing
micronutrient status in LTC, regardless of how status was determined (i.e. food intake vs.
biochemical markers). Due to the limited work anticipated around interventions outside of oral
nutritional supplements (ONS), the scoping review process allowed for the inclusion of various
research designs studying micronutrient interventions in LTC. Thus, the flexibility of a scoping
review was well-suited to the exploratory nature of this study.
4.2.2 Scoping Review Search Strategy Used in these Studies
To enhance the rigor and comprehensiveness of the search, key search terms related to: 1)
micronutrient status and 2) interventions to improve micronutrient intake that were specific to the
LTC population were identified and reconfirmed with a health research librarian as well as the
co-authors. The search included four diverse databases: Ovid MEDLINE, Ovid EMBASE,
EBSCO CINAHL, and Web of Science (Table 1). Searches were iterative, and terms were
changed, refined and finalized to ensure a comprehensive search. No date restrictions were used
to allow for broader inclusion, with December 31st, 2012 as the last publication date. Key
articles were hand-searched for further citations. This broad search strategy captured both
observational and intervention studies, and was later divided as two papers to allow more in-
depth descriptions of citations that addressed the two research questions.

25
Inclusion and Exclusion of Citations
There are two key points at which bias can occur in a scoping review; the inclusion of
research and the extraction of data (145). To ensure rigor, two assessors were involved in the
initial review of citations that were identified in the search. Inclusion and exclusion criteria were
applied to all titles and abstracts; where agreement was not reached, a senior author reviewed the
citation to determine inclusion. In some cases, a full article review was required to eliminate
articles and the extraction process described below also resulted in the removal of some citations
as the questions and search criteria were refined. For example, menu analysis studies were
initially identified and upon extraction of pertinent data, found to be too dissimilar to food intake
and biochemical marker studies to be included in the first scoping review focused on
micronutrient status.
To be included, citations of observational studies had at minimum, to report the results
of the assessment of one or more micronutrients for a LTC sample, whether based on food intake
assessment or biochemical markers representing specific nutrients. Citations of intervention
studies had to include, at minimum, results of the effects of supplementation of one or more
micronutrients in pill or food-form for a LTC sample. For studies examining multiple participant
groups (e.g. community, retirement and LTC participants), only results specific to LTC residents
were included and if results were merged across sectors, the citation was excluded. Studies
using ONS were also excluded, as these provide macronutrients as well as micronutrients, and
effects of micronutrients alone could not be ascertained. Citations were limited to the English
language and studies conducted in North America, Europe, Mediterranean (Greece, Italy,
Portugal Spain) and Scandinavian countries (Denmark, Finland, Iceland, Norway, Sweden), New
Zealand, and Australia. It was anticipated that there would be differences in foods consumed,

26
LTC nutrition care processes, and micronutrients of interest in other geographic regions. A
flowchart of the number of studies examined and included is found in Figure 1.
Data Extraction, Categorization, and Synthesis
As extraction is another point at which bias or inaccuracies can occur, it is important to
include a second reviewer to check extraction material (146). Pertinent information was
extracted to a spreadsheet, and 100% of the articles were divided and reviewed among the
authors to validate this extraction. Data extracted included participant characteristics (age (mean
± standard deviation), study design (sample size, length of study, intervention type, dosage; for
fortification studies), assessment methods (dietary intake assessment method used, biomarkers
used), and for the intervention studies, changes identified in outcome variables for both
intervention and control groups (for fortification studies). Observational studies focused on status
were divided into two categories for summarization, results based on food intake data and those
based on biochemical makers. Intervention studies were also divided into two categories,
depending on whether the intervention was delivered in pill-form or food form. As anticipated in
the methodology described by Arksey & O’Malley, this was a truly iterative process with
citations being re-examined for inclusion post extraction and the data extracted being refined
several times to enhance presentation of a concise message and overview of the research to date.
The senior author also worked iteratively with the candidate to confirm extracted material during
the writing of these reviews to ensure accuracy and consistency in reporting.
4.2.3 Standards used for Comparisons: Focus on Biomarker Reference Ranges
and Cut-offs
To determine adequate intake and status of micronutrients, the Dietary Reference Intakes
(DRIs) and biomarkers are commonly used (33,39). This section will focus on the biomarkers, as

27
DRIs were briefly introduced in Chapter 2, and further discussed in section 4.3 with respect to
the menu analysis conducted.
Biomarkers of exposure, that reflect dietary intake, commonly assess blood levels or
pools of micronutrients (32). However, this provides only a limited view of ‘status,’ as it does
not allow determination of functional outcomes related to the nutrient’s role in the body (e.g.
rates of fractures); as such, blood levels can only be considered as intermediate outcomes. Yet,
limiting studies for review to only those with functional outcomes would have resulted in few
articles that may not have addressed the primary research objectives. Thus, the primary
outcomes used in the scoping reviews to address Objectives 1 and 2, used the end point of serum
or plasma biochemical markers of nutrients.
The American Medical Association (AMA)’s reference ranges, which are commonly
used in both scientific and medical settings, were used for comparison of serum or plasma
biochemical results from observational and intervention studies (44). Since AMA provided
values for normal ranges, values from the Centers for Disease Control and Prevention (CDC)
(45) were also included to provide reference ranges for values that were considered to be below
normal (low and deficient values). It is important to note that AMA ranges are often wide and
may overlap CDC values. For instance, AMA normal ranges for vitamin D are 35-150 nmol/L,
whereas CDC values to determine deficiency are <30 nmol/L, inadequacy is defined at 30-49
nmol/L, and sufficiency at 50-75 nmol/L. Hence, discrepancies may be seen in the
categorization of micronutrients when using these two standards. Thus, categorization of low or
adequate status by nutrient are based primarily on AMA values for these scoping reviews. Where
neither AMA (44) nor CDC (45) reference values are available, as in the case of studies that
report results from rare biomarkers, the reference values from the original study were used.

28
4.3 Menu Analysis
4.3.1 Overview of Menu Selection
In Canada, all meals and snacks are provided for residents in LTC; hence, careful menu
planning is needed to ensure residents meet their nutritional needs (25,48,147). Energy, macro-
and micronutrient analysis of menus is a method to determine whether foods provided in a LTC
meet dietary recommendations (48).
In this analysis a convenience sample of menus was obtained for analysis. Registered
dietitians and/or nutrition managers part of the acceptability testing (Objective 4) provided the
first week (7 days) of their LTC home menu, including recipes and serving sizes, for analysis.
Five regular (non-therapeutic), regular texture menus were selected to ensure regional
representation, with one specific cultural group included. Homes that provided menus were
either stand-alone or part of a small network of homes; none were part of a corporate chain. Ten
menus were provided and five were chosen to represent provinces, type (for-profit (FP)/not profit
(NFP)) and to promote diversity (i.e. culturally defined population). Further details are not
provided to ensure confidentiality of Homes where analysis was completed. One Home menu
from British Columbia (NFP), Nova Scotia (NFP), Alberta (NFP) and two from Ontario (1F,
1NFP) were selected; the second home from Ontario included a unique cultural group. This
number was chosen to ensure feasibility, and provided greater diversity and a more
comprehensive analysis than conducted to date (5,48). As homes may not have the same
therapeutic diet menus (e.g. diabetes, low-sodium), and may use different methods or products
for modified texture diets, the use of regular (non-therapeutic) was only completed to support
comparisons. Key steps in this analysis to improve accuracy of results will be reviewed below.

29
4.3.2 Choice of Nutrient Analysis Programs : ESHA Food Processor & EaTracker
Different criteria for how to choose and perform appropriate nutritional assessments have
been established (31,148). Since the menu analysis required use of a nutrient analysis database, it
is essential that an appropriate one be selected. Gibson (2005) recommends that the database
chosen should represent the average composition on a “year-round, nation-wide basis” (Gibson,
2005, pp. 69). The USDA Nutrient Database for Standard Reference is one of the largest
databases of food components, and the majority of foods on Canadian Nutrient File (CNF) is
derived from this source, with adjustments where fortification and enrichment practices differ
(31). All menus were analyzed using the ESHA Food Processor SQL (version 10.12.0, ESHA
Research, Salem, OR, 2012) nutrient analysis program. The analysis examined calories, protein,
fibre, and 21 micronutrients. The ESHA program was chosen as it contains a comprehensive
database of 55,000+ food items from the most up-to-date USDA database references,
manufacturer and restaurant data, and literature references (149). To contrast, the CNF contains
only 5000+ foods(150). This program was chosen as it is commonly used in Canadian research
involving LTC (48,70,119,151) and in LTC practice, and is based on a comprehensive foods
database (U.S. Department of Agriculture (USDA)), including Canadian foods which vary in
their production and/or fortification.
Initial food selection from the data base were USDA food choices as these provided the
most complete micronutrient data and greater choice of food products. Micronutrient values of
American foods were compared with Canadian food product values using the CNF to account for
different food supply and fortification practices (152); Canadian foods were chosen where
discrepancies existed. Specific foods that required adjustment or replacement to CNF
micronutrient values were oatmeal, cream of wheat, corn flakes, and bran flakes; margarine,
yogurt, 1% and 2% milk; and eggs. For mixed dishes (e.g. lasagna), recipes, descriptions, or

30
brand names of purchased products were obtained from the homes to ensure accuracy in
analysis. For single food entrées (e.g. chicken nuggets), a similar Food Processor item was
selected. Where recipes were not provided, generic recipes used from food distribution
companies (e.g. Sodexo or Sysco) or from online recipe databases (e.g., allrecipes.com,
canadianliving.com) were used. The Dietitians of Canada’s online eaTracker diet tracking tool
was used to count CFG servings in menu items and recipes (153). As well, the micronutrient
analysis provided by eaTracker, which is based primarily on CNF, was used to confirm the
nutrient analysis resulting from the Food Processor program. No adjustments were needed based
on this comparison. By searching the CNF for key foods where fortification was different and
comparing the complete analysis to eatTracker, these steps improved the confidence in the
accuracy of analysis and characterization of the menus.
Confirmation and verification with the home after the recipe was analyzed was done to
help ensure the recipe’s accuracy. Analyzed menus were provided to the homes for verification
and adjustments made as required in portion size or selection of standard items in the food
database. All homes were notified to respond via e-mail if changes were required to the recipes
used; after two e-mail reminders, it was assumed that no changes were required to the two
Homes’ menus. Adjustments post analysis were made for three of the five homes based on
feedback from site personnel. This member validation and check is important as it enhances the
credibility of the study.
4.3.4 Interpretation of Micronutrient Analysis of Long-Term Care Menus
The Dietary Reference Intakes (DRIs) were used to interpret and compare and contrast
nutrient analysis of home menus to determine adequacy of intake of micronutrients. The
micronutrients examined were: Vitamins A, D, E, C, B6, B12, Thiamin, Riboflavin, Niacin,
31
Pantothenic acid, Folate; and minerals: Calcium, Copper, Iron, Magnesium, Manganese,
Phosphorus, Potassium, Selenium, Sodium, and Zinc. Menus’ nutrient values were compared to
Recommended Dietary Allowances (RDAs)/Adequate Intakes (AIs) for individuals aged 70 and
above. Cut-offs of <50% (also known as the Estimated Average Requirement (EAR)) and 50-
99% RDA were chosen to demonstrate where Homes’ menus fell short of RDA/AIs. Although
the EAR is recommended to assess inadequate food intake for groups, it requires data of
individuals’ usual intake in the group (154). However, only pooled data was available in the
studies identified from the scoping review. Thus, the RDA/AI was chosen. Understanding that
the RDA, being set at a level to meet 97-98% of the group’s requirements (154), may
overestimate the proportion of the group at risk, this study established levels of comparisons at
50% of RDA (which is similar to EAR levels) and >99% (above) the RDA, to determine the
variations in the groups’ intake. Intakes were also compared to AIs, but it is important to note
that while mean intake levels at or above the AI can be assumed to indicate low risk of
inadequate intake, levels below the AI cannot be assumed to be inadequate (154).
Each home’s data was analyzed separately and compared across homes. All home results
were also averaged and compared to the DRIs. Food items per day and per week were also
entered into EaTracker to determine whether homes met CFG portion recommendations on a
daily and, when averaged, weekly basis; only qualitative and quantitiative comparisons were
made for this interpretation of the diet quality.
4.3.5 Development of Super-menus
The purpose of the Super-Menus was to determine if micronutrient recommendations
could be met by increasing the nutrient-density of foods alone and providing a smaller volume
(regardless of financial cost), given that decreased energy intake with aging is a common
phenomenon associated with changes in body composition and decreased activity (59). To date,

32
no published work on creation of super menus was available as a template. Thus, the criteria set
for super-menus for this study were that: 1) foods had to be common foods available to LTC or
be comparable to an item served (e.g. beef stew for Irish stew) based on menus provided from
Homes from menu analysis, 2) that total volume of a Super-Menu day should be less than or
equal to the volume of foods served in the Homes’ menu (based on volume or weight to volume
conversions of foods served per day), 3) the distribution of food has to reflect that of LTC (e.g.
hot cereals at breakfast, soups at lunch, dessert at lunch and dinner, beverages at every meal),
and 4) if possible, to include food preferences noted from the focus groups (e.g. cream soups,
soft vegetables). Strategies to achieve nutrient-dense recipes included identifying higher
micronutrient ingredients (e.g. soup made with milk vs soup made with water) and preparation
method (e.g. steamed vs boiled vegetables) options from ESHA, and identification of nutrient-
dense ingredients, such as herbs and spices, that could be easily incorporated into recipes without
increasing the food volume. Planned Super-Menus did not consider cost in their creation.
Super-menus based on commonly served foods across Homes’ menus (e.g. hot cereals,
quiches, soups) from the above menu analysis, were subsequently created to meet the RDAs for
11 micronutrients (thiamin, riboflavin, niacin, B6, folate, B12, C, D, calcium, magnesium, zinc)
that were known to be poorly consumed by older adults in LTC (27,95,116,155–158) and
identified to be potentially problematic from the first scoping review. Five daily menus were
created to demonstrate the variety that could be achieved in menu planning, including vegetarian
options. From the menu analysis, herbs and spices were found to contain high levels of
micronutrients and thus those consistent with recipes common to LTC were included. Some food
items were also found to have different micronutrient contents depending on the variety [e.g. 1
cup red bell peppers (higher in vitamins A, C, and E) vs. green peppers; 1 cup white beans
(higher calcium, potassium, and zinc) vs. black beans], and where appropriate, the most nutrient

33
dense variety was selected for the Super-menu. Development of these menus was an iterative
process to identify feasible micronutrient dense products that did not provide excessive calories
and volumes. The five super-menus’ micronutrient content was analyzed with Food Processor
and EaTracker and averaged for comparison to the five selected homes and the DRI.
4.4 Assessing Acceptability of a Micronutrient Fortification Strategy
Three stakeholder groups were chosen to address research Objective #4, focused on
determining the acceptability of a fortification strategy for LTC. These groups were: staff,
expert key informants (KI), and LTC residents and families. Methods were chosen based on the
stakeholder group involved, to ensure a quality data collection. For staff and residents/families
focus groups were the chosen methodology. Focus groups are used as a method to gather
individual and interactive opinion and attitudes through a carefully planned framework of
questions and discussions (159). The group format allows for interactions and discussions among
participants and can contribute to further development of ideas and concepts (159). Key
informant interviews were chosen as the method for in-depth discussions with stakeholders who
were knowledgeable about key aspects of the proposed strategy. This one-on-one data collection
method allowed for flexibility and depth in questioning that was not feasible with the focus
groups. This study underwent ethical review and clearance by the Office of Research Ethics at
the University of Waterloo (Ethics review #: 18558, Appendix A).
4.4.1 Webinar Focus Groups with LTC staff
Perspectives from diverse participants across Canada were desired for this stakeholder
group. As a result, a technology that would support conduct across different geographic regions
was required. Webinar focus groups allow for the real-time, immediate response of traditional
focus groups, without the physical presence and the need to travel (160). Webinars have been
34
previously used for training of staff (161) and students (162,163) and were thus considered a
viable option for conduct of these focus groups. Online focus groups were conducted with
webinar technology (WebEx™, Santa Clara, CA)), a program that allows for teleconferencing at
the same time as presentation on the internet (164). The webinar format traversed geographical
barriers and allowed participants to join regardless of time zone or location. On-line webinar
technology offered the opportunity for on-screen presentations, group discussions, and real-time
polling questions to engage all participants.
Lower numbers of participants are recommended for online synchronous (real-time
sharing) focus groups (165), and telephone focus groups (Krueger, 2014). Thus, several small
focus groups (3-7 participants) were scheduled and conducted. Additional techniques for
telephone focus groups that transfer to webinar focus groups include shorter duration of sessions
(e.g. 1 hour or less), and occasional use of round robin responses to ensure active participation
from all members of the focus group (166). Webinar focus groups were conducted with frontline
nutrition staff, providing insight into both clinical and production issues with micronutrient
fortification. The target participants were dietitians, nutrition managers and chefs working in
LTC recruited through the Dietitians of Canada Gerontology Network and the Canadian Society
of Nutrition Management (CSNM). Interested participants were sent an invitation e-mail
containing: a detailed information letter outlining the purpose of the study and process,
instructions to register, and a link to a pre-session online registration survey to collect pertinent
demographics. Snowball sampling was also employed; participants of the initial webinars were
asked to suggest potential further participants. The recruitment package is found in Appendix B
and C. Challenges and benefits of these strategies will be discussed below.
Through consultation with an advisory group consisting of experts from the University of
Waterloo and University of Guelph (in applied nutrition, food science, nutritional biochemistry,

35
and human health and nutritional science), focus group questions were developed (Appendix D).
Open-ended questions with additional probes were used as a guideline to solicit information and
discussion (167). Questions (with probes removed) were sent prior to the webinar session, as was
recommended for non-in-person focus groups (e.g. telephone focus groups) (Krueger, 2014).
Polling questions examined nutrients of concern for residents, current strategies used to address
micronutrient needs, and participants’ ratings on the appropriateness, feasibility and potential
effectiveness of a micronutrient fortification strategy. Initial sessions were conducted by the first
two authors. Sessions were recorded to allow for transcription of the discussion. During the
session, participants were provided with an online Powerpoint presentation on Micronutrient
enhancement of food in long-term care homes, created by the candidate and revised by the
senior author (see Appendix E; See Appendix F and G for the webinar feedback and thank you
letters). The majority of online focus groups have used the chat forum format (160,168) where
participants respond to questions via text-based discussions, either as posts or in real-time (169).
In these webinars, polling questions were used to elicit initial feedback on key questions and to
stimulate discussion. Questions were used throughout the power point presentation.
As no literature was available at the time of the start of this study (September 2012)
focused on using webinars as a research method, a feedback survey was used to understand the
challenges and benefits of this technology from the perspective of the participants. This feedback
was reviewed concurrently with data collection and recommendations were used for adjust
subsequent sessions accordingly. The key challenges identified by these participants in the
feedback survey (n= 38) are noted below.
General challenges to in-person focus groups include: dominating speakers, “constructing
the other,” and “tendencies towards normative discourses” (Krueger, 2002; Smithson, 2000;
Wright, 2006). Additional limitations proposed for online focus groups include: the requirement

36
of participants to have access to relevant technology, lack of face-to-face interaction, and
difficulties in tracking non-response (i.e. filling out feedback surveys where responses are
anonymized and gathered into an online database; more detailed questions were used for sorting
categories (e.g. work position)) (160,165). Limitations specific to webinar focus groups are: the
need for a mic and quality speakers/ audio system for moderators and participants and
preparation for technological set-backs (e.g. back-up recorder).
Dominating speakers often exist in focus groups of any format (170), but are potentially
more difficult to manage with lack of face-to-face interactions in a webinar where non-verbal
communication is not available (e.g. turning to face another speaker to signify the desire for
another participant to speak) (159). Another challenge was “constructing the other,” where the
nature/characteristics of the moderator (e.g. female dietitian) may lead others in the group to feel
as though they are the ‘other’ (170). Finally, “tendencies towards normative discourse,” where
participants may desire to comply to a societal norm and avoid discussion of controversial topics
(170) continues to be an issue with all formats of focus groups. Details of specific issues and
strategies used to overcome these challenges are discussed below.
In the thesis, specific strategies used to minimize having dominant speakers take over
discussions in the group, were a) creation of homogeneous groups with enough variation to
allow for discussions (e.g. by occupation, by location, etc.), b) keeping the groups few in number
(< 5), and c) calling on participants in a round-robin fashion for their opinions and thoughts. An
advantage of online focus groups is that face-to-face interaction is eliminated, increasing
anonymity, which may allow some participants to feel more at ease and to share (165). Both
moderators were female dietitians by profession, which meant that they were more closely
related to one group of participants (i.e. registered dietitians), than the others (e.g. cooks,
nutrition managers). To avoid being seen as from a select group with expertise, sharing their

37
perspectives’ was minimized and participants’ discussion was cultivated through probing and
follow-up questions. They also drew on their range of experience in LTC to provide relevant
examples and points to solicit further discussion. Moderators took a naïve stance, promoting the
participants as experts, which also helped to build rapport and put them at ease. Moreover,
moderators also highlighted diverse voices in the group. For instance, when homogeneous
groups were not possible due to participants’ availability, and only one cook was in a group with
dietitians and nutrition managers, the moderator purposefully directed questions to this
individual, such as asking, “From your experiences as a cook, what might be some issues with
adding fortificants to this food vehicle?” This directed questioning method may be necessary for
webinar focus groups, to facilitate more equal contribution from participants. Regarding
“tendencies toward normative discourse,” the use of probing questions helped to lead
participants to think deeper and more critically toward their responses (173). For example, the
probing question, “What are foods almost all residents will consume?” helped participants to see
a range of possibilities. Finally, participants had the opportunity via email or the feedback
survey to provide further comments to the moderators and many took advantage of this
opportunity.
Limitations of online focus groups were noted in this research. Recruitment happened
through the Dietitians of Canada Gerontology Network and the Canadian Society of Nutrition
Management (CSNM) where interested participants contacted the researchers and were sent an e-
mail invitation. This automatically limited potential participants to individuals attached to these
organizations who had email access. This likely explains part of the under-representation of
cooks for these focus groups. Dietitian and nutrition manager participants were encouraged to
invite their cooks, but there continued to be low representation. This may also have been due to
lack of down time for cooks to participate in the focus groups. Although timing of focus groups

38
was dictated by participants’ hours, the times selected may not have coincided with cook
schedules. Alternatively, the low participation of cooks may have been out of lack of interest for
the topic, concern about power issues within the focus group, lack of experience with the
webinar technology, or lack of access to a computer for participation.
As with all online focus groups, the lack of face-to-face interaction continues to be a
limitation (160,168), as participants cannot view others interactions, potentially resulting in
limited discussion. Transcripts from these webinars were brief, suggesting that this was a real
limitation. Webinars have generally been used for instructing, where trainers broadcast
information, and attendees receive information (161). While it is possible to do video-
conferencing to see all participants, the researchers decided that sessions of greater than three
participants may be too difficult for this format and it was anticipated that staff may not be fully
comfortable with this technology. Furthermore, not all participants have web-camera access. It
was decided the use of a Powerpoint presentation would help focus attention and engage
participants.
While webinar focus groups help with increased interactions between participants by
allowing for audio, it presents with its own challenges and limitations. These included issues
with audio and technological set-backs (e.g. issues with online recording). The WebEx™
program (164) was used in this study. WebEx was chosen for its reliability, as it is known as “the
oldest, best-known popular web-conferencing solution” (174) and is commonly used for web-
based training and business teleconferencing. As research studies using WebEx were not
identified, one main challenge was in managing the technology. Below is the step-by-step
strategies taken to meet webinar audio challenges.
Initially, this study proposed an online telecommunication format for talking. However,
after several practice sessions, the authors identified that online calling with use of the computer

39
audio only created feedback noises in sessions with greater than three participants. Thus a phone
line format was adopted. This then required the purchase of calling cards for international calls
(toll-free calling option did not apply in Canada), as WebEx™ is a U.S. company. Online calling
cards (CiCi) were used. Call-in codes and detailed instructions were e-mailed to participants (e.g.
participants from different cities were provided city-specific dial-in numbers). A practice sign-on
session was set for one-week prior to the actual session to ensure participants’ were acquainted
with and prepared for the Webinars (e.g. WebEx player downloaded). Times for focus groups
were set with a suggested start-time of 15 minutes prior to session to avoid delays due to sign-on
problems. Session 1 and 2 were 15-30 minutes longer than the advertised 1-hour session, as
participants had problems with sign-on, and moderators waited until most participants were in
the session prior to starting. In subsequent sessions, the moderator would send one reminder
email 5 minutes after the session began for participants who did not sign on, and begin the
session to remain within the 1-hour session time.
In the first few sessions, participants were offered the option to use online calling or
phone-line/calling cards. However, issues with hearing lead to the recommendation that all
participants use a phone line for dial-in. Several participants had issues with volume (e.g. no mic
for phone) during the session, and responded via chat. The chat option was also used if
participants had additional comments on previous question topics, and allowed for
documentation of additional comments without stopping the group to return to the previous
topic. Participants had the option to share chat comments with the moderator-only, or everyone
in the session.
The WebEx™ program provided an immediate recording option. However, due to a
glitch in the program, the audio was lost for the second session. While WebEx™ agreed it was
an issue on their end, and technicians were contacted, they were unable to retrieve the audio.

40
Since the majority of the changes were made in the first two webinar sessions to facilitate the
flow of the sessions, it was decided that the first two sessions would be used as trial sessions and
not transcribed. However, the polling and feedback responses from these two sessions were
included in results as the question content was similar. To avoid this problem in future, the
researchers added a back-up external recording device to each session, so two audio recordings
were made to avoid the risk of lost sessions.
After the webinar, participants were emailed a link to a feedback form, which allowed
them to provide further comments on the topic as well as to rate their experience with the
webinar format and technology. Results from participants’ feedback provided insight into how to
run smoother sessions. For instance, noting that participants commented ‘sessions were a bit
rushed,’ and ‘using the chat option helped,’ allowed the researchers to modify flow and
encourage use of the chat option in subsequent sessions. Confirmation from the subsequent
feedback questionnaires also ensured that the process was working; for example participants
agreed that the 1-hour session was an appropriate length.
Due to the small numbers of participants for each focus group, several focus groups were
conducted (n=11) over a 2-month time frame. This allowed for the conduct and analysis of
findings to be an iterative process (159), which is not available with chat forum focus groups
(160). Thus, despite set-backs with the initial webinar focus groups conducted in this study, with
proper preparation they may be closer to in-person focus groups while allowing the ease of the
online-format as compared to chat forums.
4.4.2 Key Informant Interviews with Relevant Experts
It was anticipated at the outset of this research that diverse perspectives would be
required to address the issue of acceptability of fortification in LTC to meet micronutrient needs.

41
It was also anticipated that some individuals may have unique and deeper experience than staff
focus group participants and an opportunity was needed to capture these perspectives. Key
informant (KI) interviews have been described as a method to gather in-depth information from
an expert source of information in a less structured interview format (175,176). Tremblay (1957)
has identified five criteria for the “ideal” key informant: 1) Role in the community (continuous
exposure), 2) Knowledge (direct access to information sought), 3) Willingness (to communicate
knowledge), 4) Communicability (able to communicate in an intelligible manner to the
interviewer), and 5) Impartiality (have minimum personal bias, and to communicate any existing
biases to the interviewer to allow proper appraisal of information obtained). How these
objectives were achieved is detailed briefly below, and in detail in Chapter 8 on acceptability
testing.
From the webinars, a number of participants who were knowledgeable on the topic of
interest (i.e. had conducted fortification) were identified and invited for individual in-depth Key
Informant (KI) interviews. As well, the advisory committee provided recommendations on
various stakeholder groups whose insight and opinion on the potential strategy was desirable and
should be solicited. (e.g. government, food industry). KIs were identified and recruited by the
candidate via email and those interested in participating were sent an information letter outlining
the expectations for an interview and the study process. Due to the likely small sample of
possible KIs, recruitment is usually by a convenience sample (177) (See Appendix H and I for
Key Informant Interview information letter and question outline).
KI interviews provided an opportunity to attain more in-depth information addressing
questions with respect to the feasibility of the developing strategy that arose from the webinar
focus groups. They were all conducted after the majority of staff focus groups were completed;
the senior author conducted most of the interviews, while the primary author took notes, as it was

42
anticipated that each line of questioning used with participants could be unique and an
interviewer with greater experience in research content was desired (178). The KI interviews
were done in an iterative process, where discussions with one expert (e.g. dietitian in a
distribution chain) led to another that could provide responses that the previous expert could not
answer (e.g. nutrition manager of the distribution chain). Thus, due to the diverse expertise of
KIs (e.g. Ministry of Health staff, distribution chain staff, director of sales in nutrition
management products), while the KI question guideline was used, question order changed due to
flow of the discussion, and additional questions were added depending on the expertise of the KI.
These on-the-spot added questions were in lieu of probing questions used in webinar focus
groups and provide strength to the methodology (179,180). This flexibility is essential when
interviewing various KIs of diverse expertise, and worked well in this study. As with webinars,
digital recordings were taken of these interviews and transcribed verbatim for analysis.
Interviews were typically one-hour in length.
4.4.3 In-person (Traditional) Focus Groups with Residents and Family Members
Although webinar and KI informants were generally in favour of a fortification strategy
in that they saw this as a viable strategy if certain issues were addressed (e.g. adequate staff
training, feasible cost of fortified food), the majority of feedback centered on the production and
Homes’ perspectives, yet acceptability from the end users (i.e. residents) had yet to be
established. Thus, resident and families’ views were ascertained via in-person focus groups (See
Appendix J-L for resident/family focus group information package, consent form, and feedback
forms).
Due to the limitations in gathering residents for focus groups (i.e. difficulties in traveling,
lack of internet and other technology required for in-person focus groups, difficulty hearing on

43
the phone), the traditional, in-person focus group format was adopted for the resident/family
focus groups. Benefits of in-person focus groups include allowing moderators to assess the
degree of attention that participants are giving to the discussion (166). This is especially
important for conducting focus groups with vulnerable populations (e.g. children, elderly), as
being in the same room and seeing participants face-to-face allow moderators to pay better
attention to the participants to address any issues that arise during the session (181). For instance,
the moderators in the in-person focus groups conducted in this thesis found that certain
participants had difficulties reading the ethics form, and moderators or staff had to read this out
to them. Moreover, the moderators learned that silence in the group may indicate that the
residents could not hear the question or did not understand the use of certain terms or the concept
in the question, and not that they did not have comments on the question. Taking pauses and
probing to see if participants needed definitions of certain terms or elaborations on concepts
helped to address these issues in our resident/family focus groups. Further, focus groups were
preferred by vulnerable groups over one-on-one interviews, as the group format is perceived as
less threatening (181). Thus, in-person focus groups was the ideal choice for gathering resident
and family’s perspective of a potential food fortification strategy in LTC.
In-person focus groups were conducted at five LTC homes to obtain the opinions of
family members and residents; these were done in the late summer and fall of 2013, post
completion of all webinars and most KIs. Due to geographic constraints, only sites within an
hour of the University of Waterloo were recruited. Initial contact was made by phone or email to
nutrition management/dietitians to determine interest. Recruitment posters/letters were provided
to notify potential participants of upcoming sessions. Group discussions were scheduled at the
routine resident/family council/food committee meetings and a 20-30 minute time slot was
allotted to the discussion. As a result, staff members were also present, although their opinions
44
were not elicited; they acted as supports to the researchers for completing consent forms and
helping with hearing impaired individuals.
Participants signed consent forms prior to the session and completed an anonymous
feedback questionnaire on benefits and concerns about the strategy at the end of the session. The
feedback questionnaires was part of the methodology, as it was anticipated that the short 20-30
minute session time slots given by the Homes may not be adequate to capture the
resident/families’ comments, or residents may not be able to express themselves adequately or
quickly enough during the session. Thus, the questionnaires provided an additional forum and
opportunity to capture afterthoughts of the fortification strategy, as not all participants spoke
during the discussion. These sessions were not audio recorded to keep the discussion informal
and allay any concerns about confidentiality of the information, as well as challenges with soft-
spoken participants on the digital recording. Extensive notes were taken by one of the two
researchers present to enhance credibility.
4.4.4 Enhancing Rigor of Qualitative Methods for Acceptability Testing
This study used a combination of quantitative and qualitative methods. It is important to
establish validity of the study, to ensure that findings are supported by evidence (182). Rigor in
qualitative research has been called an assessment of its ‘trustworthiness’ (183). Four criteria for
establishing trustworthiness of qualitative research have been established by Lincoln and Guba
(1985). These terms have been compared to quantitive terms (in brackets): 1) credibility (internal
validity), 2) transferability (external validity), 3) dependability (reliability), and 4) confirmability
(objectivity) (184).
Credibility assesses the results such that they are credible/believable to participants and
those external to the research (184). Several activities were undertaken to enhance credibility.

45
Qualitative data from webinars and KIs were transcribed. Inductive content analysis was used to
identify common points or concepts, patterns, and variations (185). The candidate and a student
researcher each reviewed and coded half of the transcripts to complete an initial overview of the
data using open coding (186). A code book was subsequently developed by the candidate, senior
author and the student researcher to assist with organization and categorization of the data
(187,188). A consistency check was done when independent coders coded raw data to create
codes and categories, then compared results to reduce the data (189). Including more than one
person and having inter-coder agreement in the coding process helped to enhance credibility of
the coded data (190). All transcripts were recoded after the development of the code book using
selective coding.
Additionally, external members not immediately involved in the study (134) in the form
of a thesis committee reviewed findings and commented on processes to help direct and check
the quality and relevance of each step of the research. Use of member or stakeholder checks,
where informants are asked whether results represented their experience or whether relevant
information was captured from the session helped to keep the findings true to the lived
experiences of the participants (189).
The use of an audit trail also helped to enhance to credibility of this study. By providing
an audit trail of carefully kept logs, field notes and memos of activities throughout the research
process, noting chronological steps, data analysis procedures, and strategies, the researchers
enhanced the internal validity of the study (134) as well as its confirmability. Exceptions were
also noted to account for possible differences in findings, such as membership in focus groups.
Transferability is the extent to which qualitative research results can be transferred to
another context/setting. A strategy to enhance transferability is thick, rich description, which
describes the context in which the behaviour occurs, so that those reading the description would

46
feel as though they were in the situation/setting (134). To enhance transferability, multiple
respondents were involved and transcription of webinars and key informant interviews provided
opportunity for in-depth analysis of findings, and thus this rich description. Quotes were
identified to exemplify these rich descriptions in the manuscript based on this work. With these
descriptions, the reader can then decide whether or not the findings can be applicable to another
similar setting, or the greater population (e.g. other LTC Homes in Canada or internationally).
Data saturation can also demonstrate transferability. Saturation was achieved between webinar
focus groups and KI interviews, as one-on-one interviews identified the same challenges
mentioned in webinar focus groups. While this was not the initial purpose of including multiple
perspectives to answer our research objectives, the identification of data saturation helped to
verify the transferability of our findings.
Data from the three groups of diverse stakeholders was integrated in this acceptability
study (187,188). Triangulation, to be discussed further below with respect to the acceptability
study as well as across all studies conducted in this thesis, also promotes transferability.
Triangulation is the analysis of data from various sources of separate and dissimilar information
(e.g. focus group interviews, feedback surveys) in order to categorize the data and generate
common themes and understanding (134,182,191). Analyses of these multiple sources of
evidence using triangulation, and the congruent findings (i.e. issues with micronutrients in LTC),
provided evidence for the need to address micronutrients in LTC, and help strengthen external
validity or transferability of the overall study (182).
Dependability of the data signifies the replicability or repeatability of the study
(134,184). As discussed above, the audit trail provides a basis for replicability, as well as a
transparent process written up in the manuscript for data collection, analysis and interpretation.
Use of post-interview notes also enhanced dependability. External auditors could use these

47
documents, transcripts and the manuscript to determine if the process was logical, determine
potential for biases, and whether or not the data is credible.
Verbatim transcription allows for interpretation of qualitative data and prepares the data
for analysis (192) and ensures dependability of the data. However, errors could be introduced
during the written transcription stage; Poland (1995) identified more than half of professionally-
transcribed passages contained significant transcriber errors. By having the research candidate
(IL), who was also the moderator, transcribe the recordings, the amount of errors are likely
reduced, further promoting dependability.
Lastly, confirmability describes the objectivity (neutrality) (189), and the degree to which
the results can be confirmed or corroborated by others without researcher bias or distortion
(184,193). The use of ‘Researcher Reflexivity,’ where researcher bias is minimized by first
having researchers understand their own position through identifying and reporting their personal
values, assumptions, and biases at the start of the research and to determine how this may affect
the conduct of the study is another activity that supports confirmability of the research (Creswell
& Miller, 2000). This critical paradigm also takes into consideration the impact of social,
cultural and historical contexts. Since the topic of micronutrients in LTC was new to the research
candidate, this may have minimized research bias, yet as a dietitian with some experience in long
term care, she had a potential bias towards the understanding of malnutrition which could have
influenced interpretation of findings. To account for this bias and that of other investigators,
inclusion of a multi-disciplinary thesis committee to review and comment on findings helped to
challenge these biases. The scoping review at the start of the study also provided the research
candidate with broader view of the issues with micronutrient food fortification in LTC; by
understanding the historical context, and the benefits and challenges other researchers have
faced, this reduced individual researcher bias due to her clinical experience.

48
The rigorous methods of data collection documentation and audit trail, transcription and
analysis throughout the study also served to enhance confirmability of the study. Lincoln &
Guba (1985) have cited six categories of reporting information for developing the audit trail
(194). These were: 1) Raw data, 2) Data reduction and analysis products, 3) Data reconstruction
and synthesis products, 4) Process notes, 5) Materials relating to intentions and dispositions, and
6) Materials relating to intentions and dispositions. These steps were carried out for the
acceptability testing study. For example: Raw data (notes and memos written, feedback survey
results) were first collected. Next, data reduction and analysis happened when field notes were
combined and written-up (e.g. when webinar field notes between the two moderators were
compared during peer debriefing, transcription and initial). Next, data reconstruction and
synthesis occurred during the coding stage when coders identified, confirmed, corrected, and
reduced findings to emerging themes and categories. Two coders were involved to lend
credibility to this step. Process notes (methodological notes, audit trail notes) were kept
throughout this process. Materials relating to intentions and dispositions were kept, including
personal notes for decisions made and expectations of the study (e.g. prediction of results).
Lastly, instrument development information was also kept, including earlier formats of the
PowerPoint presentation and discussion questions and later versions after changes were made
(e.g. putting 3 polling questions on one slide in the final PowerPoint presentation). These
detailed steps ensure that decisions made were transparent, and potential biases were minimized.
Confirmability is also enhanced by comparing findings of qualitative and quantitative
studies where similar conclusions are reached (189). Thus, a final step in confirmability is the
triangulation of findings across stakeholders and forms of data collection (e.g. polling questions,
rating questions and quotes) which will be discussed further below.

49
4.4.5 Overview of Data Analysis, Interpretation and Triangulation of Acceptability
Data
This next section will provide an overview of the data analysis process and its
interpretation, as well as describe how stakeholder data was triangulated for the acceptability of
food fortification in LTC study. Several steps were taken to triangulate data from these diverse
perspectives and forms of data collection. To begin, polling data from staff webinars were
integrated into the subsequent discussion that occurred during the session. Data from pre-session
registration surveys, online polling questions, and post-session questionnaires were summarized
and interpreted with descriptive quantitative analysis (e.g. percentages of participants working as
dietitians), and where appropriate, triangulated with qualitative data. For family/staff focus
groups, the feedback form confirmed the qualitative data captured during discussions and the
rating was quantified.
The order in which data was collected from stakeholders supported triangulation of
findings. Webinars with staff were purposefully chosen as the first form of data collection as the
strategy of food fortification was not fully flushed out. Webinars were used as a testing ground
for the concept and considerations that would be required. KI interviews occurred next and
delved into these issues in more detail. Family and resident focus groups occurred last. By this
time the fortification strategy had been more clearly defined in terms of how it could occur and
what some of the parameters may be, supporting a more focused discussion with these
participants to determine their acceptability of the strategy.
Debriefing occurred after each focus group and KI interview between the candidate and
senior author to discuss overall impressions, key points, main areas of agreement or
disagreement, and new data that resulted from each session (187). This peer debriefing provided
support, identified the researchers’ biases, challenged their assumptions, and encouraged critical

50
thinking of research methods, findings and interpretations (193). Thus, subsequent focus groups
and key informant interviews were conducted with the knowledge of results from prior data
collection points and were used to not only corroborate but also extend findings.
All webinar focus groups and KI interviews were transcribed verbatim prior to analysis,
with identifiable information removed. Transcription was completed by the candidate who was
involved in these data collections. This transcription process allowed the research candidate to
become re-acquainted with the data and acted as another level of analysis, influencing further
data collection and interpretation in an iterative process.
Finally, to summarize the qualitative data across stakeholders, the same form of analysis
was completed and data were collapsed across stakeholder groups. These data were descriptively
summarized with minimal interpretation (159,187) and are presented as key concepts that
address the purpose of the study; specifically i) concerns with micronutrient intake, ii) reflections
on current strategies, iii) appropriateness of fortification, iv) promoting feasibility, v)
determining effectiveness, and vi) overall acceptability of the strategy. Thus the write-up of this
study demonstrates the triangulation of diverse perspectives used to determine the acceptability
of micronutrient fortification of food for LTC.
4.5 Overall Triangulation of Methods
As various numerous sources of information were collected to address the research
question, the data and findings must be systematically analyzed and summarized. Triangulation
is a research technique that combines different but complementary sources of data to answer a
particular research question (195). Triangulation analyzes various sources of separate and
dissimilar information, such as data sources, theoretical comparisons and various methods (e.g.
surveys, interviews, collected documents) in order to categorize the data and generate themes
(134,191). By comparing results from different methods and data sources, intrinsic weaknesses
51
or biases of an individual method can validate and/or expand on the other, improving not only
the understanding of the research aim, but also the overall credibility of the study (195).
Five types of triangulation were identified by Guion et al. (2011): 1) data triangulation, 2)
investigator triangulation, 3) theory triangulation, 4) methodological triangulation, and 5)
environmental triangulation. Within the triangulation design, there is the choice of convergence
model, the data transformation model, the validating quantitative data model, and the multilevel
model (195). This study used convergent triangulation, where quantitative and qualitative
findings were examined with equal weight and importance (134). A convergence model is used
to compare, “validate, confirm, or corroborate quantitative results with qualitative findings”
(Creswell & Clark, 2007, pp.65). When the study is well-planned so that both the quantitative
and qualitative methods complement each other so that the data converge or triangulate, they
enhance completeness and overall quality of the study more than a single method alone (135).
Challenges in using the convergence model of triangulation include the differences in
type of data (e.g. scoping review vs. menu analysis), type of samples and sample sizes (195). In
this thesis, the candidate has attempted to address an overarching research question with four
sub-studies that have different purposes, methods and findings. However, by designing the
studies that address an overarching research question such as this, but focused on similar
concepts, a merging of data interpretation is possible (182,195). Triangulation across these
research objectives will be used to address the overall research objective of investigating
micronutrient malnutrition in LTC and strategies to improve micronutrient intake and will be
undertaken in the Discussion of this thesis.
Triangulation at the level of interpretation of findings and answering of the broad
research question is not the only way in which triangulation occurred in this thesis. Additionally,
triangulation occurred at the level of the conduct of the various studies where findings from one

52
objective impacted the methods and form of data collected in a subsequent study. For instance,
the scoping review of micronutrient intake in LTC helped to identify that menus may not be
providing adequate micronutrients to meet residents’ DRI needs, and resulted in the third
objective being added to this thesis. The design of super-menus was focused on those nutrients
found to be consumed less than the RDA based on the scoping review.
The scoping review results were also used in the acceptability study. An optional
consultation process in scoping reviews is advised (124) and preliminary findings of the scoping
reviews were part of the discussion in stakeholder groups and subsequently part of the emerging
themes in this acceptability study. Specifically, results from the second scoping review lead to
questions on food vehicles to discuss in focus groups and participants then provided input into
appropriate foods to include in the strategy.
From the focus groups, it was identified that not all homes have the capacity to analyze
micronutrient content of menus, thus menus were collected from webinar participants (LTC
staff) and selected menus were analyzed for micronutrient content to address objective 3.
Qualitative findings from the acceptability strategy testing, also challenged the researchers to
consider more fully food-first approaches before fortification. When it was identified in the five
home micronutrient analysis that some homes were closer to achieving the DRI without
excessive calories, the process of completing a super menu with the same detail to micronutrient
analysis was undertaken.
Of interest are the agreement and disagreements between findings of each of the four
components of the thesis. For instance, while certain micronutrients of concern (e.g. vitamin D)
were identified across data sets, a wide variety of micronutrients were addressed, such as
potassium and zinc with participants from acceptability testing, yet the scoping reviews
identified selenium as a micronutrient of concern, which was not mentioned by participants in

53
the acceptability testing. This leads the research candidate to question whether there is a
disconnect between research findings and actual practice, and whether both should be considered
with equal weight. Yet, inconsistencies or dissimilarities in findings is not always an indication
of error. At this point, it is important to dispel the misconception that triangulation must arrive
with consistent results across all data sources. Patton (2002) suggests that these inconsistencies
are likely due to the different inherent purposes and strengths of research approaches. Thus, he
advises that these inconsistencies should not be used to weaken the evidence, but rather be
examined as opportunities to identify deeper meaning in the data (196). For this thesis,
inconsistent findings could be used as evidence for the need to determine whether there is a
disconnect between research findings and actual practice, and identify whether knowledge
translation efforts could be placed to bridge these gaps. Nonetheless, overall findings indicate
that numerous micronutrients are of concern, beginning with inadequacies in menu planning,
intake, to biomarker status.
4.6 Summary
In summary, four sub-studies each addressing a single objective were designed to address
the overall research question on whether or not micronutrient malnutrition is prevalent and how
it should be addressed in LTC. Although not a formal mixed methods study, the combination of
four separate studies with diverse methods allowed for triangulation of methods and findings
enabling a more fulsome answer to the research question. Key points in methods to ensure rigor
and quality data collection have been outlined in this overview. The methods specifically
undertaken for the acceptability testing have been reviewed to demonstrate that careful planning,
implementation, and analyses of these methods enhanced the credibility, transferability,
dependability, and confirmability of these qualitative findings.

54
Chapter 5
Micronutrient Intake and Status in Long-Term Care: A scoping review.
Abstract
Micronutrient deficiency is a potentially prevalent form of malnutrition among long-term care
(LTC) residents, influencing health, function and quality of life. Eating difficulties, taste
changes, and decreased appetite often hinder food intake. This review maps the literature on
micronutrient consumption and biochemical status in LTC residents. Arksey and O’Malley’s
scoping review framework was used to conduct, a comprehensive search of four electronic
databases. A total of 3342 citations were identified and post screening, data from 50 studies was
extracted. Vitamin D, folate, calcium, vitamin E and B6 were identified to be consistently <50%
Recommended Dietary Allowance for LTC residents using food intake data. Several other
nutrients were consumed at 50-99% of the RDA. More than one study found biomarkers to be
low for vitamin D, C, folate, and iron. These findings suggest that micronutrient intake and
biochemical status are suboptimal for key nutrients in LTC.
KEYWORDS micronutrients, long-term care, intake, status
(Prepared for submission to the Journal of Nutrition in Gerontology and Geriatrics)

55
5.1 Introduction and Background
Older adults living in facilities face particular health challenges with various acute and
chronic illnesses (5,21,56). Malnutrition has been well-documented as a factor contributing to ill
health in older adults, particularly in long-term care (LTC) (5,23,197). Adequate intake of a
varied diet is needed to meet nutrient requirements, but physiological factors including
challenges with self-feeding, early satiation, taste changes, dysphagia, and decreased appetite
often hinder older adults’ food intake, rendering them nutritionally vulnerable (13,14,198). Thus,
micronutrient deficiency is purported to be relatively prevalent among older adults living in LTC
(5,21,199). As a preventable form of malnutrition, identification of those nutrients most likely to
be at risk is a necessary first step. Poor micronutrient (vitamin/mineral) status is known to affect
immunity, cognition, functional abilities, and quality of life (17,22,200). Nutrition interventions
have commonly focused on protein-energy malnutrition (PEM) (26,201–203), but relatively few
treatment options have been explored to address micronutrient malnutrition in LTC. In practice,
screening for PEM is more common in LTC than for micronutrient problems, due in part to the
nature of developed screening tools, and may further contribute to the difficulty in detecting
micronutrient malnutrition in LTC (13,107,198). At present, there is no consensus on the best
way to treat poor micronutrient intake in LTC residents (13), and if such treatment will be
beneficial.
Logically, the risk of micronutrient deficiencies increases as food intake decreases (5,21,24).
Poor food intake is common in LTC (5,21,23), and recent research demonstrates that menus may
not provide adequate micronutrients to meet dietary recommendations, even when meals are
completely consumed (5,19,24,25). Clearly, a shift towards prevention of micronutrient
malnutrition is needed for this vulnerable population. Past research has examined single
micronutrients (155,204,205) or combinations of micronutrients targeting specific diseases

56
(114,206) but less work has been done to assess micronutrient intake and/or status for long-term
care residents as a whole. However, there has been increasing focus on population-wide dietary
intake and nutritional assessment to further research and develop nutritional policies for
vulnerable groups (207). Potential interventions to address micronutrient malnutrition in the
elderly population, such as food fortification, has also been researched (29). To move forward, a
greater understanding of the micronutrients of concern (i.e. micronutrients that residents are at
highest risk of deficiencies for), based on poor intake or biochemical status is needed for the
LTC sector. The aim of this study is to identify micronutrients that are poorly consumed or low
based on a variety of standard biomarkers (high risk micronutrients) to provide a foundation for
potential targets for future micronutrient interventions in LTC.
5.2 Method of Review
A thorough literature review is needed to provide a better understanding of high risk
micronutrients for LTC residents. A scoping review was the chosen method, as it provides an
opportunity to quickly explore a body of literature, and allows for summary and dissemination of
research findings, and identification of research gaps in existing literature (124). Scoping reviews
have been recommended for areas of research that have yet to be reviewed in a thorough manner
(141). The five stages of a scoping review have been expanded and detailed by Levac et al (142),
using the Arksey and O’Malley framework (28). As compared to a systematic review, scoping
reviews allow researchers the ability to address broader topics (124), especially when the
question is less focused, helping to map out relevant literature in the field of interest (144),
including grey literature (124).The flexibility of a scoping review is well-suited to the
exploratory nature of this study.
57
In order to enhance the rigor and comprehensiveness of the search, key search terms were
identified and reconfirmed with a health research librarian as well as an advisory group. The
search included four diverse databases: Ovid MEDLINE, Ovid EMBASE, EBSCO CINAHL,
and Web of Science. Searches were iterative, and terms were changed, refined and finalized to
ensure a comprehensive search. No date restrictions were used to allow for broader inclusion,
with December 31st, 2012 as the last publication date. Key articles were hand-searched for
further citations. This broad search strategy captured both observational and intervention studies,
and was later divided as two papers to allow more in-depth descriptions of each area of study.
This paper will only discuss results of the observational studies.
Inclusion and exclusion criteria were applied to all titles and abstracts. Citations had to
include at minimum results of the assessment of one or more micronutrients for a LTC sample.
For studies examining multiple participant groups (e.g. community, retirement and LTC
participants), only results specific to LTC residents were included and if results were merged
across sectors, the citation was excluded. Citations with food intake data and/or biomarkers
assessing status were included, and were limited to the English language. Studies conducted in
North America, Europe, Mediterranean (Greece, Italy, Portugal Spain) and Scandinavian
countries (Denmark, Finland, Iceland, Norway, Sweden), New Zealand, and Australia were
included; differences in foods consumed, LTC nutrition care processes, and micronutrients of
interest in other geographic regions were anticipated and thus studies from other regions
excluded. The initial screening process of titles, abstracts and where required full text, was
conducted by the first author (IL) with agreement with the senior author (HK). A subsequent title
and abstract review process was completed by a second trained reviewer using the same
inclusion/exclusion criteria in efforts to avoid missing key articles from the search results. Any
articles in question to be included in the review were examined by the senior author and both
58
authors came to a decision on inclusion or exclusion. Pertinent information was extracted to a
spreadsheet, and 100% of the articles were divided and reviewed among the authors to validate
this extraction.
Food Intake
The Institute of Medicine’s Recommended Dietary Allowance (RDA) provides a
reference that meets nutrient requirements for nearly all (97-98%) of nutrient requirements for a
particular gender and age group (e.g. those >70 years old) (28). Intake data was compared to the
RDAs (28) for individuals greater than 70 years of age to allow for standardization of resulting
data, as other nations may follow their own version of dietary references. Cut-offs of <50% (also
known as the Estimated Average Requirement), 50-99%, and >99% of RDA were chosen to
denote higher to lower risk of inadequate micronutrient intake. Adequate Intake (AI) values were
used where there was no Estimated Average Requirement (EAR) to establish the RDA, and cut-
offs for this analysis were set at < AI. RDA cut-offs for males were used if a study provided a
combined-gender intake. If the study separated male and female intake values, these were
recorded separately. For single-gender studies, the specific gender’s reference values were used
(i.e. female RDA for vitamin C if it was a female-only study population).
Common intake data collection methods included weighed food records (WFR),
estimated food records (EFR), and other methods (e.g. Food Frequency Questionnaires (FFQ),
dietary surveys, 24-hour recalls, diet histories). WFR were considered to be better quality than
EFR, which was also considered better quality data than the other methods. Studies were
categorized based on the dietary intake assessment method used; where a study used multiple
dietary intake assessment methods, the study was listed under the highest quality assessment
method.

59
Biomarkers
Some identified studies provided biochemical data to assess LTC residents’ micronutrient status.
As citations used a variety of biomarkers with varying reference ranges, to promote comparison
across studies, the American Medical Association (AMA)’s reference ranges, which are
commonly used in both scientific and medical settings, were used (44). Since AMA provided
values for normal ranges, values from the Centers for Disease Control and Prevention (CDC)
(45) were also included to provide reference ranges for values that were below normal (low and
deficient values). Studies were compared to AMA (44), CDC (45), and the reference values from
the original study from the abstraction. To note, AMA ranges are often wide and may overlap
CDC values. For instance, AMA ranges for vitamin D are 35-150 nmol/L, whereas CDC values
to determine deficiency are <30 nmol/L, inadequacy at 30-49 nmol/L and sufficiency at 50-75
nmol/L, hence discrepancies may be seen when in the categorization of micronutrients by each
reference range. Categorization of low or adequate status by nutrient are based on AMA values,
or on the original study’s values if AMA values were not available.
5.3 Results of Scoping Review
Overall
The search strategy resulted in 3342 articles in total (Figure 1). Full articles were excluded if
they: focused on disease/treatment (n=11), were not part of the geographic region for inclusion
(n=4), the full citation was not accessible (n=12), did not include a LTC population (n=13), did
not present micronutrient data (intake or biochemical) (n=26), focused on the use of oral
nutritional supplements (n=10), were reviews and not original studies (n=32), or did not address
our research question (e.g., menu planning, letters to the editor) (n=25). Baseline micronutrient
data for intervention studies were also included. The screening criteria resulted in 50
60
observational studies, with 34 including dietary intake and 22 including micronutrient
biomarkers. Results from these observational studies will be presented as food intake first, then
biomarker data.
Food Intake
The 34 intake studies were quite heterogeneous in their length of data collection, range of
micronutrients examined, and size of sample (Table 2). WFRs were used in 16 studies, with a
large range in length of food intake collection from 1 (US, The Netherlands) (208,209) to 21
days (Canada) (5). Size of sample ranged from 9 (Canada) (63) to 252 residents (Spain)(210).
EFRs were used in 12 studies, ranging from 1 (Australia) (27) to 7 days (US) (50), with the
majority (n=8) as 3-day EFRs. Other diet intake assessment methods included FFQs (n=3), 24-
hour dietary recall (n=2), and diet histories (n=2). Age of the participants was relatively
consistent across these citations with participants ranging between 65 and 102 years; the mean
age of participants was approximately 80 years of age. Studies originated from Canada (26%,
n=9 of 34), Spain (20%, n=7) and the US (17%, n=6), followed by the Netherlands, Australia,
and Sweden, with Austria, Denmark, Finland, and Ireland (n=1 for each). Publication years
spanned from 1979 to 2012, with the majority of studies conducted in the 2000s (46%, n=16 of
34), followed by 1990s (n=9) and 2010s (n=6).
OVERVIEW OF MICRONUTRIENTS OF CONCERN BY RDA/AI
Less than 50% RDA (or < EAR): Of the 34 relevant studies, the most frequently cited
micronutrients <50% of RDA were: vitamin D (n=18 citations; 6 WFR, 11 EFR, 1 Other), folate
(n=7 citations; 6 WFR, 1 Other), calcium (n=6 citations; 3 WFR, 2 EFR, 1 Other), and vitamin E
(n=6 citations; 2 WFR, 3 EFR, 1 Other) (Figure 2A). Other micronutrients identified in at least
61
one citation at <50% RDA were: vitamin B6, magnesium, vitamin C, vitamin B12, selenium,
vitamin A, iodine, and thiamin.
50-99% RDA: For micronutrients between 50-99% of RDA, the most frequently cited
were: calcium (n=17 citations; 8 WFR, 6 EFR, 3 Other), thiamin (n=13 citations; 10 WFR, 2
EFR, 1 Other), zinc (n=13 citations; 8 WFR, 5 EFR), and vitamin B6 (n=10 citations; 5 WFR, 4
EFR, 1 Other) (Figure 2B). Others micronutrients with intake between 50-99% from at least one
citation were: vitamin C, folate, magnesium, vitamin A, riboflavin, iron, vitamin E, iodine, and
vitamin B12.
Greater than 99% RDA: The most frequently cited micronutrients >99% RDA were:
vitamin C (n=12 citations; 7 WFR, 4 EFR, 1 Other), vitamin A (n=8 citations; 5 WFR, 3 EFR),
vitamin B12 (n=7 citations; 5 EFR, 2 Other), thiamin (n=6 citations; 2 WFR, 4 EFR), and
riboflavin (n=6 citations; 5 EFR, 1 Other) (Figure 2C). Others with at least one citation
indicating adequacy of intake included: iron, niacin, calcium, magnesium, selenium, and zinc.
Compared with AI: Micronutrients identified to be below the AI with at least one
citation were: potassium and pantothenic acid. Copper was the only micronutrient with an AI
cited with intake above the AI (21). Given that this paper is interested in the low micronutrient
intake for older adults, elaboration will be provided for the top 4 micronutrients (vitamin D,
calcium, foate, vitamin E) where several citations indicated intake that was <50% RDA; citations
that did not identify these low levels of intake in these nutrients will also be included in this
discussion for comparison purposes.
VITAMIN D
All citations, regardless of diet assessment methodology identified vitamin D intake to be
consumed on average below 50% of the RDA.

62
WFR: The 7 WFRs examining Vitamin D originated from Canada, Ireland, Spain, and
Sweden, and ranged from 2-7 days in length (3 and 5-day WFRs were most common). Sample
size ranged from 9 to 86 residents. Only one study exclusively examined vitamin D and calcium
intake (43); all other studies examined vitamin D intake in combination with multiple nutrients.
The majority of measurements were taken at one time, although the study by Lammes et al. (211)
(Sweden) repeated measures three times over 1.5 years. The lowest WFR intake levels reported
were by Moreiras-Varela et al. (212) (Spain), at 0.7±0.2 µg (male) and 0.6±0.3 µg (female), and
by Vir et al. (56) (Ireland), at 1.25±0.68 µg (male) 1.07±0.39 µg (female). However, there was
less variability in the remaining 5 studies, with intakes ranging from 3.9 to 5.7 µg vitamin D
(19,43,63,211,213).
EFR: The 11 EFRs citing vitamin D as a micronutrient of concern were from Australia,
Canada, Denmark, and the US. Length of EFR ranged from 1 to 7 days with sample sizes of 30
to 169 residents. Seven of these studies were specific to vitamin D and/or calcium intake only
(14,15,27,97,214–217), and the remainder examined vitamin D in combination with other
micronutrients. The lowest level of intake was recorded by Nowson et al. (Australia) examining
139 residents with and without eating impairment from 9 different LTC sites; those with
impaired eating ability on a pureed diet had lower vitamin D intake (0.7 µg) as compared to
those without an eating impairment (1.1 µg) (27). Further intake analysis of residents on full,
soft, or pureed diets found that vitamin D status worsened as the diet became downgraded.
Interestingly, this level was lower than the vitamin D intake level identified by Gloth et al. (US)
of sunlight-deprived residents who had been confined indoors for 6 months or longer (216).
Johnson et al. (US) also found that regular and pureed diet intakes were below 50% RDA in a
female-only study, at 3.90±1.93µg and 3.28±1.28 µg, respectively (50). These values are within
the range of vitamin D intake seen with other EFR studies in this review. Overall, a slightly

63
wider range of EFR intake values were identified (0.7 to 7.05 µg) (14,15,214,215,217–221) as
compared to the WFR above. No clear speculations can be made regarding length of days
recorded and vitamin D intake values, as a large range of intake values can be seen at the same
length of intake recorded, especially for 3-day EFRs.
Other: A 1-day diet history done by Vikstedt et al. (Finland), noted lower vitamin D
intake in females (6.6 µg) than males (7.5 µg) (222).
FOLATE
WFR: For folate, the 6 WFR originated from Austria, Canada, Spain, and Sweden, with
length of WFR from 3-5 days. Sample size ranged from 30 to 252 participants. One study from
Canada compared WFR and EFR to examine micronutrient intake, where WFR included meals
only and EFR included meals and snacks (19). Both values were <50% RDA, but the WFR mean
intake was lower (149±68 µg) than EFR mean intake (196±59 µg (male) and 161±78 µg
(female)). The lowest intake (105.3±42.9 µg) was seen in Sturtzel’s study (Austria) examining
vitamin B6, B12 and folate intakes of LTC residents on laxative therapy (20). Folate intake
values in these WFR studies ranged between 105.3 and 199 µg/d (19,210–213).
EFR: Two EFR studies examining folate intake originated from Denmark and the US.
Sample size was 51 (50) and 104 (218) participants. The 1995 study by Johnson et al. (50) was
female-only, used a 7-day EFR, and examined both regular and pureed diets. Residents on
pureed diets were found to have lower folate intake (166±22 µg) than those on regular diets
(189±62 µg) (47). The 2002 study was a 4-day EFR examining the relationship between added
sugar consumption and nutrient density of Danish residents diets (218), where those with <10%
energy from sugar had a mean folate intake at 197.1 µg, those with10-20% energy from sugar a
mean intake of 207.9 µg, and those with ≥20% energy from sugar had the lowest level of folate
intake (151.8 µg). Overall the Beck 2002 study suggests that a high intake of added sugar in

64
residents’ diets may lead to lower intake of micronutrients, and suggests the need for a nutrient-
dense diet. Number of days of EFR appears to not have had as great an influence on the mean
intake for these two studies as compared to these other characteristics of the participants.
Other: The other citation identifying folate to be poorly consumed included 7-sites with a
dietitian-administered FFQ where food grouping was used to identify food sources of riboflavin,
folate and vitamin B12 (223). Folate intake was found to be 187.3±81.1 µg, which fell within
intake ranges seen in the WFR studies.
Six studies identified folate intake to be 50-99% RDA, originating from Australia (14),
Canada (21), Finland (222), Spain (41,210), and the US (220). No studies identified folate intake
to be >99% of the RDA. All but two of the five studies stating folate intake at 50-99% were
conducted after 2000. The two studies conducted in the US before 2000 were conducted in 1982
(208) and 1996 (220), which was before mandatory folic acid fortification. Potential reasons for
differences in intake may be due to geographic location and presence or absence of mandatory
folic acid fortification policies, levels of folate in fortification, and the year the study was
conducted (e.g. before or after implementation of fortification), and cultural food consumption
patterns (e.g. high leafy green vegetables vs. high meat diets). Thus, despite fortification of
folate, excessive intake in LTC are not a concern.
CALCIUM
WFR: Three studies examining calcium intake with WFR found intake to be <50% RDA.
Length of WFR were at 5 (224), 7(212), and 21(5) days. Barr et al.(224) (Canada) examined
intake of 30 female residents to determine the contribution of nutrients from different food
groups, and found mean intake to be at 518.4±210.4 mg (224). Wendland et al. (5) (Canada)
investigated the intake of 23 cognitively impaired residents on regular and lactose-free diets, and

65
found calcium intake to be 458±140 mg on average. Moreira-Varela et al. (212) (Spain)
examined 53 institutionalized residents and found calcium values to be 394±79 and 380±100 mg
for males and females, respectively.
Conversely, more WFR studies cited calcium intake at 50-99% RDA (n= 8) than those
that cited intake <50% RDA (n= 3). Calcium intake in these 8 studies ranged from 638 (225) to
910 mg (209). Cameron et al. identified the lowest calcium intake in the 50-99% RDA range
with a 3-day WFR, and found that female residents had lower calcium intake (638±203 mg) than
males (812±309 mg) (225). Lowik et al. identified the highest level of intake (910±430 mg) with
a 1-day WFR (209).
EFR: Two EFR studies noted low calcium intake. Length of these EFR were 1 (27) and 3
days (215) and sample sizes were 139 and 53 participants, respectively. For those without eating
impairment, Nowson et al. (Australia) identified mean calcium intake to be at 406 mg (full diet),
286 mg (soft), and 292 mg (pureed); for those with eating impairments, calcium intakes were
310 mg, 376 mg, and 382 mg, respectively (45). Lee et al. (215) (Canada) assessed calcium and
vitamin D status for diet alone and diet plus supplement, and identified lower calcium intake
from diet alone for females (560±198 mg) than males (847±264 mg). However, with
supplemental calcium at 125±354 (male) and 384±533mg (female), total intakes were still below
recommendations (total intake 972±494 and 954±512 mg, respectively) (43). Six EFR studies
identified calcium intake between 50-99% RDA, with the lowest one just above 50% (600 mg)
(19) and the highest one almost at the RDA (1080 mg) (218). Other studies fell between these
ends of the spectrum, where a 7-day EFR by Johnson et al. (US) (50) found calcium intake at
660 mg for residents on a regular diet (667 mg for pureed diets), while another US study by
Gloth et al. identified intake at 921 mg for sunlight-deprived residents (216).

66
Other: The last study citing a low calcium intake was an 11-site study using a 24-hour
diet recall (226). They found average calcium intake to be 599.1±259.9 mg for female residents
(226). In contrast, the highest level of calcium intake (>99% RDA) was also found in the Other
category, where Vikstedt et al. found calcium intake to be 1247mg for males (1106 mg for
females) with a 1-day diet history (222).
VITAMIN E
WFR: Two citations noting <50% RDA for vitamin E by WFR were recorded during a
single 1.5 year longitudinal collection by Lammes et al. (Sweden) (211,213). Length of food
intake data collection was 5 days (211,213) with 52 participants. Lammes’ studies explored the
relationship between energy and nutrient consumption of residents, and found that nutrient
density was low for vitamin E, but that vitamin E intake increased with increased energy intake
(intake mean of 4.8 mg (male) and 4.2 mg (female), and 4.6 mg (both genders) in the 2006 and
2009 studies, respectively). Lengyel et al. (Canada) also examined vitamin E with both a 3-day
WFR and EFR with 48 participants (19). Interestingly, the WFR method found a higher vitamin
E intake (7.9±4.1 mg), and was the only study in this review to find vitamin E intakes between
50-99% of RDA. Yet, the EFR performed in this same study found lower vitamin E values where
females consumed <50% RDA (6.4±2.3 mg), but males consumed 50-99% RDA (10.2±4.2 mg).
EFR: Two EFRs also noted low vitamin E intake, originating from Denmark and Canada.
Length of data collection were 3 (21) and 4 days (218) with samples sizes of 407 and 104
participants respectively. As previously mentioned, Beck (Denmark) investigated the
relationship between added sugar and micronutrient intake, and found an inverse relationship
between added sugar and vitamin E status (mean intake: 3.56, 3.45, 2.58 mg at <10% energy
from sugar, 10-20% and ≥20%, respectively) (218). The second study was cross-sectional, and

67
examined residents from 11 LTC homes with normal nutritional status (93% had normal BMI).
They found that 42.6% males and 52.8% females had a vitamin E intake below 50% of EAR
(21).
Other: A 1-day diet history by Vikstedt (222) also found low intake in both female and
male residents, 6.8 and 6.6 mg vitamin E, respectively.
Biomarkers of Nutrient Status
In addition to food intake, micronutrient status can be assessed by biomarkers or
biochemical measurements providing a snapshot of their levels or their activity in the body (e.g.
PTH for vitamin D and calcium status). Biomarkers may be a more accurate method to
determine potential micronutrient deficiency for some nutrients (39,40). Twenty-two studies
were identified from the scoping review that contained biochemical data for residents’
micronutrient status. The micronutrients examined are shown in Table 3. Studies were conducted
between 1979 (56) and 2013 (227). The most frequently studied micronutrients using biomarkers
were: vitamin D (n=11), calcium (n=7), iron (n=6), vitamin C (n=4) and vitamin B12 (n=5);
other nutrients were vitamins A, E, B1, B2, B6, folate, chloride, copper, magnesium,
phosphorus, potassium, selenium, and zinc. The micronutrients with low status using the AMA
and/or CDC criteria were: vitamin D (4/11 and 8/11 citations using the AMA and CDC criteria
respectively), vitamin C (3/5 per AMA and CDC), folate (1/4 per AMA, 0/4 per CDC), and iron
(3/6 per AMA, no CDC cut-offs) (Table 3). However, AMA reference ranges and CDC cut-offs
may differ from specific cut-offs used by the original articles, resulting in different counts of
normal or low/deficient values. The differences can be seen in Table 3; specific reference values
are available in Table 4. The potentially low status nutrients are discussed further below.

68
VITAMIN D
Vitamin D was assessed by two biomarkers, Serum 1,25-dihydroxyvitamin D
(1,25(OH)2D) and 25-hydroxyvitamin D (25(OH)D) (Figure 3A) and the 11 studies were
published between 1979 and 2011 (Table 3). Three studies measured 1,25(OH)2D status, and
originated from Spain and the US (43,214,216) (Table 2). The study by Gloth et al. examined
vitamin D status in sunlight-deprived residents confined indoors for 6 months or more, and
identified the mean serum 1,25(OH)2D levels at 50.7(24.7) pmol/L (216). This was within
normal cut-offs for CDC as well as Gloth’s reference range, but low per AMA cut-offs. The
other two studies using 1,25(OH)2D identified levels within AMA normal ranges.
All of these 11 studies measured serum 25(OH)D status: 2 identified vitamin D levels to
be deficient (per CDC cut-offs), 6 identified low status (CDC cut-off), and 2 identified 25(OH)D
status to be adequate (one study (56) stated low status but did not give numerical values). Studies
examining 25(OH)D status originated from Australia, Canada, Ireland, the Netherlands, Norway,
Spain, and the US. While Odowd et al. (1993) identified adequate 1,25(OH)2D levels, it also
identified the lowest 25(OH)D status recorded in this scoping review, at 6.37 nmol/l (214). This
study examined 109 residents from either a private nursing home or a US suburban public
hospital LTC wing. Levels of both 1,25(OH)2D and 25(OH)D (36.2 nmol/L) were low for Gloth
(216). For Perez-Llama et al, 1,25(OH)2D levels were adequate, but 25(OH)D levels were low
for female residents (48.2 nmol/L) (43). The highest 25(OH)D status was identified by Johnson
et al. (57), comparing vitamin D status between African American and White octogenarian and
centenarians in the US. They found that, for those living in facilities, centenarians had lower
mean 25(OH)D status than octogenarians, at 70.1 and 72.1 nmol/L, respectively. Yet both
subgroups were above low cut-offs for AMA, CDC, and Johnson’s references. Regarding gender
differences, both Perez-Llama (43) and Woods (24) identified adequate 25(OH)D status for
69
males (53.4 and 51.5 nmol/L, respectively), but low statuses for females (48.2 and 38.0 nmol/L,
respectively). Seasonal variations were addressed by Sem et al. (228), where mean serum
25(OH)D values were identified to be low for both winter and summer according to CDC and
Sem’s reference ranges (adequate per AMA).
VITAMIN C
Vitamin C was examined in five studies using four biomarkers (cell, leukocyte, plasma,
and whole blood ascorbic acid) (Figure 3B). Studies were conducted between 1977 and 2003,
and originated from Ireland, the Netherlands, New Zealand, and the UK (Table 3). Three of these
five studies identified low plasma ascorbic acid (AA) values; other biomarkers for vitamin C
were not found to be low. McClean et al. (229) examined the status of 35 male war veterans in
New Zealand and identified mean plasma AA values of 16 µmol/L. Marcenes et al. (49) assessed
dental status of UK residents and found mean plasma AA levels of edentulous participants (1 -10
teeth) to be low to borderline deficient at 11.4 µmol/L (per CDC), while their dentulous (21 teeth
or more) participants had adequate plasma AA levels of 31.0 µmol/L. Vir et al. measured mean
plasma AA status of residents in Ireland and found males to have deficient vitamin C levels (9.65
µmol/L, per CDC cut-off), while females counterparts had adequate vitamin C status (23.3
µmol/L, per AMA and CDC cut-offs) (56).
FOLATE
Four studies examined folate status using serum or plasma folate (Figure 3C). Studies
were published between 1979 and 2010, and originated from Austria (20), Ireland (56), the
Netherlands (54), and Spain (230) (Table 2). AMA identified one study with low plasma folate
levels with residents on laxative therapy (20). However, using paper-specific cut-offs, a second
study identified low plasma folate in older women in nursing homes with the Dutch Nutrition
Surveillance System, where AMA had classified the values as normal (54). The remaining

70
studies assessed serum folate to be normal (56,230). These two studies included both genders,
and assessed serum rather than plasma levels of folate.
IRON
Iron status was examined using six biomarkers: ferritin, hematocrit, hemoglobin, serum
iron, total iron binding capacity, and transferrin (Figure 3D). The six studies were conducted
between 1979 and 2013, and originated from Australia, Canada, Ireland, Italy, the Netherlands,
and Spain. All biomarkers, with the exception of hemoglobin, noted normal iron status. Three of
the four studies measuring mean hemoglobin levels identified low status, per AMA reference
range. Lowik et al. reported low mean hemoglobin levels (13.4 g/dL) for 51 female nursing
home residents in the Netherlands (54), while Vir et al. identified low hemoglobin values for
males (13.9 g/dL) but adequate levels for females (14.3 g/dL) [Note: both values within normal
cut-offs per Vir reference ranges] (56). Woods et al. examined 103 residents from 14 Australian
facilities and reported low mean hemoglobin values for males and females, 13.2 and 12.7 g/dL,
respectively [Note: both values within normal cut-offs per Woods reference ranges] (24). The
one study identifying normal hemoglobin levels had values at the low end of normal (total
14.3g/dL; AMA normal = 14.0-17.5g/dL) (41).
5.4 Discussion
The objective of this study was to identify and present a summary of micronutrients that
are poorly consumed or at low biochemical levels for older adults in LTC. This is the first
review, to our knowledge, to examine these issues for the LTC population. This study does not
aim to determine the optimal micronutrient intake for older adults, but rather to assess
micronutrient intake and biochemical status of LTC residents, to determine potential nutrients to
target for intervention. The LTC population is diverse; some have cognitive issues, swallowing

71
difficulties, and varying amounts of health conditions, all of which may affect eating and
nutritional status. Understandably, studies examining this heterogeneous population would be
disparate, making it challenging to compare residents’ nutritional intake and status.
Overall Intake
This review identified several food intake studies with varied objectives, samples, and
methods. Many factors are associated with micronutrient intake of LTC residents, and
specifically in this review, diet texture (27,50), sugar consumption (218), sun exposure (216),
laxative therapy (20), and dental status (49) were investigated. Regarding country of origin, most
studies originated from Canada, Spain, and the US, and it appears that these countries have
particular strengths in research for micronutrient intake in LTC. In this review studies were
summarized by intake or biochemical data, and further classified by types of intake methods
used (WFR, EFR, other), or by biomarker assessed. Calcium and vitamin D will be used to
illustrate the various issues identified in this study with respect to addressing the purpose of this
scoping review. Geographic differences and fortification practices affecting intake likely
impacted the identification of low folate levels in this review, and these will be elaborated on
below. The discrepancy between intake and biochemical data, potential gender differences and
issues regarding choice of biomarkers and cut-off references will also be discussed.
LENGTH OF DIETARY INTAKE ASSESSMENT, CHOICE OF SAMPLE AND OTHER
ISSUES IN DIETARY ASSESSMENT: CALCIUM AND VITAMIN D AS EXAMPLES
From the 34 intake studies included, several assessment methods with differing lengths of
diet intake assessment were used. Calcium intake had the widest range of days of intake
measured, from a 1-day EFR to a 21-day WFR. Shorter studies provide less accurate information

72
on actual individual intake and patterns. For example, the number of days required for assessing
specific nutrients for an individual has been suggested by Bingham (231), to be 10 days for
calcium, 12 days for iron, and up to 36 days for vitamin C. Gibson has also identified preferred
diet assessment approaches for various objectives (31). To determine mean nutrient intake of a
group, a single 24-hour recall, WFR, or EFR from a large number of participants is required,
while to determine the proportion of a population “at risk” would require repeated observations
(31). Diet intake assessment methods (DIAMs) identified many micronutrients to be below DRI
recommendations at 50-99% and some <50% of RDA. However, despite variety in the length of
assessment, there generally was agreement among the types of DIAMS; for instance,
micronutrients that were identified as low by WFRs were also identified as low by EFRs. Three
day food records were the most common length of records performed. The largest 3-day WFR
intake study of vitamin D and calcium was with 26 residents (56). The largest 3-day EFR intake
study of vitamin D and calcium with a 3-day EFR with 169 residents (14). Both of these studies
found vitamin D intake at <50% RDA (1.25±0.68 µg (Male)/1.07±0.39 µg (Female), and
1.78±2.05 µg for the WFR and EFR, respectively), and calcium intake at 50-99% RDA
(892±81.8mg (Male)/ 868±142.7mg (Female), and 796±356 mg (total) respectively). While
values were similar with these two studies, intake values vary with increasing length of intake
examined, especially for vitamin D. A 4-day WFR found intake to be 3.90±4.64 µg
(M)/2.49±1.15 µg (F) (43), a 5-day WFR identified 4.5±1.4 µg (M)/3.5±1.3 µg (F) (211), and a
7-day WFR identified 0.7±0.2 µg (M)/0.6±0.3 µg (F) vitamin D average intake levels (212). To
note, the 7-day WFR study citing the lowest vitamin D intake was conducted in 1986 in Spain
(second oldest vitamin D WFR study) (212). Although vitamin D fortification is not mandatory
in Spain, there is increasing availability of vitamin D-fortified foods world-wide due to voluntary
and mandatory food fortification, which may explain the higher vitamin D values seen in the
73
more recent studies (72,87,90,232). Alternatively, the more recent focus on adequate planning of
diets for LTC with respect to this vitamin may have played into the higher intake seen in more
recent studies. For EFR, the most common length was also 3 days; the largest variability was
also seen with this length of assessment, as vitamin D intake ranged from 0.7±0.2 µg
(M)/0.6±0.3 µg (F) (n=109) (214) to 7.05±3.65 µg (n=64) (216). These two studies were
conducted in the US, in 1993 and 1995, respectively. Despite analyzing length of food record,
sample size, and year of study, a clear trend cannot be identified to explain the variability in
reported intake. This suggests the need for additional studies using longer food records and/or
larger samples to improve the precision of population estimates and accuracy of individual intake
data. It is noted that although some studies attempted to address the intra-individual variation in
their determination of mean intake (e.g. Beck et al., 2002), many other studies did not.
Another issue in this research is the diversity in samples selected for inclusion and the
focus of the original research question. For calcium, Barr et al. identified dairy products to be
the highest contributor to calcium intake, but found an inverse relationship between dairy intake
with age, although the relationship was not statistically significant (p=0.093) (224). Wendland et
al. (2003) suggested that factors influencing micronutrient intake may be beyond actual intake,
pointing to the sufficiency of food provision. In their study, they also included menu analysis
investigating the intake of cognitively impaired residents on regular and lactose-free diets,
finding that neither diet provided adequate calcium to meet recommendations. This was echoed
by Lee et al. (2002), who found it unlikely that older adults could meet calcium and vitamin D
recommendations from diet alone. Moreover, they found that diet plus supplement intake for
both micronutrients also did not meet current RDAs for older adults. Changes in diet texture
further complicates matters, as Nowson et al. (27) identified that calcium intake decreases as diet
texture becomes downgraded. Also, those without eating impairment on a full diet had higher

74
calcium intake than those with eating impairments. The higher intake for eating impaired
residents on soft and pureed is likely due to feeding assistance. All of this suggests that
additional calcium provision, beyond what is provided by food alone, may be needed to meet
residents’ calcium (and other nutrient) recommendations, and specific subgroups of the
population are likely at higher risk.
RESEARCH INTEREST: VITAMIN D AS AN EXAMPLE
Vitamin D was identified to be a micronutrient with intake <50% RDA by all DIAM
(Table 3). As 19 of the 34 food intake studies examined vitamin D, it is apparent that research
interest has been and remains high for this nutrient, providing greater information for this review
than for any other micronutrient. For example, several studies examined vitamin D intake of
pureed foods (Germain et al., 2006; Johnson et al., 1995; Nowson et al., 2003) providing more
information for this vulnerable group than for other nutrients, which are also anticipated to be
problematic. As well, we have identified of the source and timing of intake for vitamin D, but
lack this information for other nutrients in this review. For instance, Johnson’s study examined
and specified vitamin D intake from meals, snacks, and nutrient supplements (50). Interestingly,
the lowest vitamin D intake by WFR were identified by the oldest studies (1986 and 1979)
conducted by Moreiras-Varela (212) and Vir (56), suggesting that potential changes in menu
planning or supplementation have occurred over time with the known challenges with this
nutrient.
This scoping review did not restrict the start date of relevant studies, providing an
opportunity to demonstrate that research interest for some nutrients in LTC, like vitamin D, has
always been high. The underlying assumption of research is that it is conducted in response to
identified and/or evidenced need (233,234). For instance, with the Institute of Medicine’s 2010

75
DRI updates for DRIs for vitamin D and calcium (235), the number of studies conducted around
these two micronutrients in the following years also increased. Similar trends were seen for
folate (236), vitamin C (237), and other micronutrients (238). Thus, research is also influenced
by trending interests and available funding; the number of studies on a particular micronutrient
does not necessarily imply its importance or potential for poor intake. Further examination of
whether a broad spectrum of micronutrients are, in fact, poorly consumed is needed and this
review has provided a starting point.
FOOD INTAKE VS. BIOCHEMCIAL ASSESSMENT
Despite numerous studies citing low (<RDA) micronutrient intake, when examining
biochemical status, there were surprisingly few micronutrients outside of normal biomarker
limits and only Vitamin D at low or deficiency cut-offs levels as per CDC references. Several
reasons may account for these discrepancies. Certain studies used LTC staff to administer food
records and collect data, while others had researchers or trained health professionals (e.g.
dietitians); this may have affected the accuracy and consistency of intake data collected. For
biochemical status, the dearth of studies using biochemical markers in LTC, and the
appropriateness and adequacy of methods for assessing micronutrient status is problematic. With
the exception of vitamin D, calcium, and iron, few studies have examined micronutrient
biomarkers for older adults in LTC and only vitamin D and C showed consistency across most
studies. Additionally, several different biomarkers were used, making comparisons across studies
difficult, including lack of reference standardization between laboratories. Further, potential
biomarkers for assessing micronutrient status are still being developed (40,47), and some
existing biomarkers have limited usefulness due to tight self-regulation (e.g. serum calcium) or
lack in sensitivity (e.g. decreases do not always indicate deficient states) or specificity (changes
in response to more than one micronutrient status) (39,46). Moreover, there are discrepancies
76
between AMA reference ranges and CDC cut-offs, where AMA ranges are more often wider
than CDC, resulting in overlap, as was seen with vitamin D. These discrepancies lead to
difficulties in categorizing whether a micronutrient is within normal range, or at low or deficient
values. For instance, if a study identified serum 25(OH)D level of 36 nmol/L, AMA would
classify this as normal, while CDC would classify this as inadequate, leading to more
inconsistency in categorization. Some studies on vitamin C (49,56,229), folate (20,54) and iron
(24,54,56) also suggest a potential issue with adequacy, but there was no clear consensus
between these studies; although levels were below normal, they were not low enough to be
considered low/deficient by the original paper’s cut-offs. The four micronutrients identified to be
low based on biochemical assessment and the appropriateness of their biomarkers, according to
EURRECA (39), are discussed below.
APPROPRIATENESS OF BIOMARKERS USED FOR ASSESSING MICRONUTRIENT
STATUS
The biomarkers used for vitamin D status were serum 25-hydroxyvitamin D (25(OH)D)
and serum 1,25-dihydroxyvitamin D (1,25(OH)2D). According to the EURRECA Network of
Excellence review, serum 25(OH)D is the most useful, robust, and reliable biomarker for
assessing vitamin D status, as it reflects both dietary intake and skin synthesis for the vitamin
(39). EURRECA found 1,25-dihydroxyvitamin D (1,25(OH)2D) to be not as useful as a
biomarker for assessing status, as it is tightly self-regulated and reflects kidney function, rather
than vitamin D status (39). Parathyroid Hormone (PTH) values were also not recommended as
this parameter is not specific to vitamin D, but is also affected by calcium and phosphorus intake.
Serum 25(OH)D was the most common biomarker used, and identified low vitamin D status in

77
the included studies, providing confidence in the conclusion that vitamin D is a nutrient of
concern in this population.
Vitamin C status was assessed by cell, leukocyte, plasma, and whole blood ascorbic acid.
Serum/plasma ascorbic acid is useful for measuring short-term intake status (fasting samples can
reflect long-term status) (39). Leukocyte ascorbic acid is a sensitive biomarker, and is also better
suited for measuring long-term vitamin C storage/status (39). Whole blood ascorbic acid is a less
sensitive biomarker than the aforementioned (39). Plasma ascorbic acid was the most common
biomarker used in the studies identified from this scoping review, and as it typically reflects
short-term intake, it remains questionable if vitamin C status is truly low in this population. It
was interesting to note that low vitamin C occurred in both older and more recent studies.
Reasons for this may be due to lower intake of vegetables and fruits that provide vitamin C, as
these foods may be more difficult to chew with age, and this factor has not changed in the
population over time. This finding is supported by Marcenes et al. who identified residents with
poorer dental status (fewer numbers of teeth) to have poorer vitamin C status compared to their
dentate counterparts (49).
Plasma or serum folate are limited as biomarkers, as they only reflect recent intake (39).
Homocysteine was reported by several studies, yet lacks specificity to folate, as it is also affected
by B6 and B12, and was not used as a biomarker for this review. Sturtzel et al. examined
residents on laxative therapy, and identified that these residents with low biochemcial values also
had low folate intake (about 25% of DRI) (20). Lowik et al. examined older female nursing
home residents and identified low plasma folate status along with low pyridoxal phosphate
(PLP), 25(OH)D, ascorbic acid and selenium levels (54). Findings of low folate biomarkers were
in agreement with a Norwegian study, outside of this scoping review, examining folate in non-
disabled and disabled residents (239). Plasma/serum folate and PLP status were also found to

78
have a significant positive correlation (54). However, serum folate levels were within cut-offs for
Huerta et al. (230), and Vir et al. (56). This lack of consistency across studies suggests that more
work is needed to identify more accurate biomarkers, as current biomarkers have limited
reliability (e.g. serum/plasma folate) and are overly influenced by recent dietary intake (39).
Iron status was measured by ferritin, hematocrit, hemoglobin, transferrin, serum iron, and
total iron binding capacity (TIBC). Ferritin is the gold standard for measuring iron status (39).
Hemoglobin measures anemia, and is a useful biomarker to measure changes in iron status with
iron-interventions from a deficient state, yet it is not specific, as anemia may be caused by
factors other than iron (39). Transferrin receptor measurements can be used to measure iron
depletion, and is not affected by inflammation (39). TIBC can be used but lacks specificity,
while serum iron is affected by diurnal variations, and both of these biomarkers should be used
in combination with other biomarkers to improve interpretation (39). Hemoglobin was the only
biomarker in this review to identify low iron status, but all three of these were borderline low-
normal, ranging from 12.7 to 13.9 g/dL (24,54,56). These values are below the AMA cut-offs,
but within normal limit of reference ranges used in all three studies (24,54,56). This suggests
that iron status needs to be further investigated, as anemia can be caused by other factors such as
chronic disease (240,241), especially in a LTC population.
MICRONUTRIENT INTAKE AND BIOCHEMICAL STATUS: GEOGRAPHICAL AND
GENDER DIFFERENCES
The heterogeneity of identified studies also included differences in geography. It has
been noted that geographical differences may contribute to the variations seen in micronutrient
status (242). Reasons for this may be due to diverse lifestyles, types of food consumed (243),
fortification policies (73,90,244), and soil nutrients (245). This study addressed the potential

79
socio-geographic differences through exclusion of locations where lifestyle and diets may be less
comparable (e.g. Asian countries) to the North American context. Moreover, with the LTC
population, these differences may be minimized with regular provision and intake of meals,
similar daily activities due to decreased mobility and increased functional dependency of
residents (246). This is supported by this scoping review’s findings, where intake data from
much of the western world repeatedly cited similar micronutrients of concern. The question of
whether these micronutrients affect health of older adults in LTC, regardless of location of
residency, has yet to be answered. Moreover, relationships between LTC practice and residents’
health status across different countries is still poorly-understood (4). Studies comparing
international LTC homes agree that more focus is needed to address the increasingly complex
needs of residents (4,246).
Of geographic interest are fortification practices, as these are different among countries.
Mandatory fortification programs were implemented in 1998 for Canada and the US, and in 2009
for Australia (247). The seven studies that identified folate intake <50% RDA were from Austria,
Canada, Denmark, Spain, Sweden, and the US (247). The US study was done in 1995 (before
mandatory fortification)(50), and may explain the low folate intake found. However, the
Canadian study that found low folate intake was done in 2008 (19), suggesting mandatory
fortification practices may not completely address micronutrient needs in LTC, at least in
Canada. The 6 studies identifying 50-99% folate intake originated from Australia (14), Canada
(21), Finland (222), Spain (41,210), and the US (220). The Australian and US studies were done
before implementation of fortification, in 2007 and 1998, respectively. However, the Canadian
study was done in 2007, and also found low (50-99%) folate intake, reiterating the above finding
that fortification of grains may be inadequate in Canada to meet the RDA for this population.

80
Regarding gender, while most studies included both genders, several intake studies were
female-only (50,54,224,248) (Table 2), while several biomarker studies were female-only
(54,249), and one was male-only (229) (Table 3). Studies have shown that females in LTC
traditionally have lower biochemical status compared to males (250,251). Yet, it is unknown
whether gender differences in micronutrient intake and biochemical status are due to intrinsic
physiological differences (252), culturally-based (253), or simply due to different food
preferences and foods consumed (254), including the amount of energy. Gender differences did
not show a consistent trend in this scoping review, in that certain biochemical or intake studies
found lower values for females (18,24,43), while others found higher (56). Overall findings of
micronutrient intake and biochemical status from gender-specific studies in this review were
generally within those ranges of studies that included both genders. More work is needed to
examine both genders so that potential differences can be further examined.
5.5 Limitations
This first scoping review on food intake and biochemical micronutrient status in LTC has
several strengths, including a comprehensive review of the literature and reliability checking of
extracted data. Yet there are limitations. Specifically, intake and biochemical status data were
separately reviewed, and we cannot comment on the adequacy of diet to attain biomarker levels
within normal ranges. Due to the heterogeneous methods of the included studies, sorting by
intake and biochemical data was the most logical method to present the data. However, several
studies examined both intake and biochemistry. This is beneficial, as a true understanding of
potential deficiency requires examination of both aspects as well as functional markers of the
nutrient (31).

81
Additionally, comparison of biochemical data between studies was difficult due to the
lack of standardization between labs including: diverse lab kits, analysis methods, assays, and
reference values used. As noted in this review, values may be considered normal by one
reference and low by another. This was addressed by comparing biomarker results to both
reference values from the original studies, along with AMA to provide a standard comparison,
and CDC cut-offs to determine level of inadequacy if values which were well below normal
levels. As well, this study cannot comment on the adequacy of nutrient intake for functional
outcomes, including the health of residents. Lastly, this paper only identified vitamin D as low
or deficient using biochemical analysis. Yet, low dietary intake (<50% RDA and 50-99% of
RDA) was identified by many different studies for several nutrients. This incongruence suggests
that further work, especially linking food intake to functional outcomes in LTC is needed, as
intake can be below the RDA, but still meet the individual’s requirement. The ultimate goal of
identifying micronutrients of concern for older adults is to strengthen our understanding of how
micronutrients enhance health outcomes for older adults. First, the relationship between
micronutrient intake and potential status should be demonstrated through use of selected
biomarkers. Next, the relationship between biochemical status and specific health outcome must
be shown. This study provides a foundation and reference for micronutrients of concern for LTC
by presenting residents’ intake and biochemical status. Future work is needed to demonstrate the
connection between planned diets, micronutrient intake and health outcomes.
5.6 Conclusion
This scoping review examined LTC residents’ micronutrient intake and biochemical
status. The micronutrients that were most concerning due to low intake were: Vitamin D, folate
calcium, and vitamin E. The micronutrients that were most troubling according to biochemical
status were: vitamin D, C, folate, and iron. Intervention strategies, such as fortified foods or

82
supplementation could be considered if dietary intake alone is unable to meet needs, especially
for vitamin D where consistency was seen in food intake and biomarker assessment. With the
growing number of residents in LTC, along with their increasingly complex health needs, it is an
opportune time for research and testing of interventions to meet potentially insufficient intakes.
Take-Away Points
Micronutrient intake of LTC residents is affected by many factors, including diet texture
sugar consumption, sun exposure, laxative use, and dental status
Intake is below the RDA for many micronutrients; vitamin D, folate, calcium, and
vitamin E had intakes consistently below 50% of the RDA (or the EAR) and are the
highest priority for interventions
Micronutrients identified to be below normal limits via biochemical assessment were:
vitamin D, C, folate, and iron; only vitamin D was sufficiently low to be considered
deficient
Biochemical status is difficult to compare due to lack of inter-laboratory standardization
Future studies should combine multiple methods (e.g. menu analysis, intake assessment,
biochemical assessment) to adequately examine the complex nutritional status of the LTC
population

83
Figure 1. Flow diagram of study (N= number of studies)
*Number of intake and status studies overlap; Final results are in the black box
Database Searches (N=3342)
CINAHL (n=329) Embase (n=1012)
Duplicates excluded
(n=1094)
Title and abstracts screened for eligibility
(n=2248)
Irrelevant articles excluded
(n=2026)
Full text articles assessed for eligibility (n=222)
Full articles excluded (n=147)
Disease/Treatment Focused (n=12)
Geographic region (n=4)
No access (n=17)
No LTC population (n=13)
No micronutrient data (intake or status) (n=26)
Oral Nutritional Supplement (n=10)
Reviews (n=32)
Others (Menu planning, Case Study, Letters, Duplicates, inadequate information) (n= 33)
Studies included in Intervention Studies
literature review
(N=25)
Pill (n=17)Fortification (n=8)
Medline (n=701) Web of Science (n=1300)
Studies included in
Observational literature
review (N=50)*
Intake (n=34)
Status (n= 22)

84
Figure 2A. Dietary Intake Data. Comparison of commonly cited micronutrients by Dietary
Intake Assessment Method (DIAM) at <50% RDA. Circled=4 micronutrients with lowest intake.
Figure 2B. Comparison by Dietary Intake Assessment Method (DIAM) at 50-99% RDA; AI is
used for Copper, Pantothenic acid, Potassium (< AI)
Figure 2C. Comparison by Dietary Intake Assessment Method (DIAM) at >99% RDA; AI is
used for Copper, Pantothenic acid, Potassium (>AI)
02468
1012
NU
MB
ER O
F C
ITA
TIO
NS
Intake <50% RDAWFR EFR Other
02468
1012
NU
MB
ER O
F C
ITA
TIO
NS
Intake 50-99% RDA
WFR EFR Other
02468
1012
NU
MB
ER O
F C
ITA
TIO
NS
Intake >99% RDA
WFR EFR

85
3A) 3B)
3C) 3D)
Figure 3. Micronutrients of Concern by Biochemical Assessment Methods
0
1
2
3
4
5
6
7
1,25(OH)2D 25(OH)D
Nu
mb
er o
f Cit
atio
ns
Vitamin D Status by Biochemical Assessment
Deficient Low Adequate
0
1
2
3
4
5
6
7
Cell ascorbic acid Leukocyte ascorbic acid Plasma ascorbic acid
Nu
mb
ers
of C
itat
ion
s
Vitamin C Levels by Biochemical Assessment
Deficient Low Adequate
0
1
2
3
4
5
6
7
Serum/Plasma Folate
Nu
mb
er o
f Cit
atio
ns
Folate Status by Biochemical Assessment
Low Adequate
0
1
2
3
4
5
6
7
Nu
mb
er o
f Cit
atio
ns
Iron Status by Biochemical Assessment
Low Adequate

86
Chapter 6
Scoping Review: Pill Supplementation and Food Fortification in Long-Term Care
(A Scoping Review on Micronutrient Supplementation and Fortification Intervention
Studies)
Ivy T. Y. Lam, RD, BASc a, Lisa Duizer, PhD b, Ken Stark, PhD a, Alison Duncan, RD, PhD c,
Heather H. Keller, PhD, RD, FDCa* a Department of Kinesiology, University of Waterloo, Ontario, Canada b Department of Food Science, University of Guelph, Ontario, Canada c Department of Human Health and Nutritional Science, University of Guelph, Ontario, Canada
* Address correspondence to Heather H. Keller, PhD, RD, FDC, University of Waterloo – 200
E-mail address: [email protected] (H.H. Keller).
(Prepared for submission to the Journal of the American Medical Directors Association)

87
Abstract
Micronutrient deficiency is a prevalent yet preventable form of malnutrition among long-term
care (LTC) residents, negatively affecting their functional abilities, cognition, and quality of life.
Adequate intake of a varied diet is needed to meet micronutrient requirements, but physiological
factors including eating difficulties, taste changes, and decreased appetite often hinder residents’
food intake. Micronutrient fortification and supplementation are strategies to promote nutrient
intake. This scoping review was designed to map the health literature to determine: 1) the
efficacy of micronutrient supplementation, and 2) food fortification in LTC. Using the scoping
review framework of Arksey and O’Malley, a comprehensive search strategy of four electronic
databases (MEDLINE, EMBASE, CINAHL, and Web of Science) was completed. Preliminary
results found 2248 relevant articles for abstract and potentially full article review. Application of
inclusion/exclusion criteria resulted in 25 relevant studies: 17 pill-form studies and 8 fortification
studies. Overall, vitamin D (n=17 citations) and calcium (n=12) were the most common
micronutrients to be included in both pill supplementation and food fortification formulations.
Vitamin C (n=8), folic acid (n=7), and zinc (n=5) were also commonly included in formulations.
In conclusion, the scoping review methodology allowed for mapping and categorization of a
disparate literature related to micronutrient interventions in the LTC setting. The preliminary
findings suggest a need for: 1) trials comparing the efficacy of single-micronutrient and multi-
micronutrient formulations for both supplementation and food fortification in the LTC
population, and 2) studies comparing the efficacy between supplementation and food
fortification with the same micronutrient formulations.
Key Words Micronutrient; Food Fortification; Supplementation; Long-Term Care

88
6.1 Introduction
Long-term care (LTC) homes or facilities are a growing option for medical and custodial
care for older adults in North America (255–258). Numerous factors diminish the LTC
population’s ability to meet their nutrient needs, including: chronic or acute disease,
malabsorption, depression, decreased appetite, and low food intake, resulting in malnutrition.
Protein energy malnutrition (PEM) is commonly described (108,202,259,260), but
micronutrients are also known to play a role in optimizing or maintaining health of older adults
(67,74,261,262) and poor intake and micronutrient malnutrition is a documented issue in LTC
(5,21,263,264). At present, there is no consensus on the best way to treat micronutrient
malnutrition in LTC residents (26).
Oral Nutritional Supplements (ONS) are commonly prescribed for LTC residents with
low food and fluid intake to address PEM (107), or to improve overall clinical outcome (265).
Formulations high in protein, protein and calories, and/or with specific micronutrients to address
chronic disease (e.g. wound healing) are available (107). Compliance with provision and
acceptance, especially in residents who require assistance to eat, is the greatest challenge with
this strategy (266). Suboptimal intake and high wastage of ONS has been well-documented
(267,268), with dislike of flavour, texture, or taste being the most common cause for refusal
(268,269). Research suggests that families (270) and providers (108,271) prefer a ‘food first’
approach in addressing nutritional problems, especially as ONS may replace food intake
(272,273). As ONS are often only introduced when a significant nutrition problem is noted, they
are not preventative (271). For those with limited weight loss but poor intake, ONS may result in
unnecessary weight gain and is not a first-line approach for addressing potential micronutrient

89
problems. Thus, alternative, longer term strategies to address potential micronutrient
inadequacies should be considered (273–275).
Oral vitamin/mineral pills are used in LTC to address micronutrient needs for specific or
overall nutrient inadequacies (276,277). This method allows for individualized nutrient provision
for residents. However, not all oral vitamin/mineral supplements are covered by drug benefit
plans, potentially thus incurring higher administrative costs for the LTC home or the resident
(119,278). Residents may also refuse pills due to swallowing difficulties, or have low adherence
for pill supplementation when it is crushed and provided in food due to the unpleasant taste.
Studies have demonstrated the efficacy of micronutrient supplementation in addition to food
when dietary intake is inadequate to meet physiological needs, especially for pregnant women
(279), infants (280), adolescents (281–283), and disease states (284), yet there is less literature
examining the efficacy of this strategy for the LTC population. There is some resistance with
increasing medications of any type in this environment; attending physicians have been shown to
view such supplements as extra medication, and have been known to refuse certain vitamin and
mineral orders due to lack of clear benefits (285). Lastly, there is the risk of drug-nutrient
interactions when administering vitamin/mineral pills at the same time as medications meant to
be taken without food (29), which renders this choice less desirable. Neither of the two previous
strategies are ‘food first’ approaches for increasing residents’ nutrient intake and require
intervention and behaviour modification by staff and the resident.
Enriched/fortified foods have been proposed as a ‘food first’ approach to addressing
nutritional issues and improving health status (107,108), requiring no change in behaviour on the
part of the resident. Creative methods have been used, but the focus is usually on protein and
energy with the addition of milk, eggs, or cheese added to selected foods (107). Liquid or

90
powdered protein supplements are also available to be added to the diet (108). While these
strategies appear to improve energy and protein intake (109), these enhanced foods typically do
not focus on improving micronutrient intake (107). Fortification has been considered a potential
solution to micronutrient malnutrition in the elderly population (29,110), but there is no
consensus on which micronutrients to include in formulations, at what dosage, and in which food
vehicles (food to which micronutrients will be added).
Certain micronutrients in fortified or supplemental form may also be more bioavailable
than natural food-form (e.g. vitamin B12), and may be particularly beneficial for older adults
with absorptive issues (e.g. atrophic gastritis)( Russell, 2001) and fortified or supplemental
sources of food have been recommended for older adults (28). Due to the differences in
bioavailability, the upper limit for certain micronutrients (e.g. vitamin E, niacin) only apply to
supplements or fortified foods, but not natural food form (28). Little is known about the risks and
benefits of micronutrients in both supplemental and fortified forms for the LTC population. Pills
and fortification are both options to enhance micronutrient intake, but their efficacy is not fully
understood. As it was unclear if there was sufficient evidence to support a systematic review
using a focused question, a scoping review to map this literature was undertaken. The primary
purpose of this study was to explore the evidence on micronutrient-focused interventions in LTC,
specifically pill and food fortification strategies, to determine the range of micronutrients
studied, the dosages and length of treatment, and the efficacy of these approaches, to determine
gaps that need to be addressed with further research. A secondary purpose was to identify which
nutrients and foods could successfully be used for food fortification.

91
6.2 Method of Review
A scoping review was the chosen method for this literature review. This method provides an
opportunity to quickly explore a body of literature, allows for summary and dissemination of
research findings, and helps identify research gaps in existing literature when the research
conducted to date in a specific area is diverse (124). Scoping reviews have been recommended
for areas of research that have yet to be reviewed in a thorough manner (141). The five stages of
a scoping review have been detailed by Levac et al. (2010) using the Arksey and O’Malley
framework (124,142). Compared to a systematic review, scoping reviews allow reviewers the
ability to address broader topics (124), especially when the question is less focused, helping to
map out relevant literature in the field of interest (144) including grey literature (124). Thus, the
flexibility of a scoping review is well-suited to the exploratory nature of this study.
In order to enhance the rigor and comprehensiveness of the search, key search terms related
to: 1) micronutrient deficiencies, and 2) micronutrient food fortification that were specific to the
LTC population were identified and reconfirmed with a health research librarian as well as co-
authors. The search included four diverse databases: Ovid MEDLINE, Ovid EMBASE, EBSCO
CINAHL, and Web of Science. Searches were iterative, and terms were changed, refined and
finalized to ensure a comprehensive search. No date restrictions were used to allow for broader
inclusion, with December 31st, 2012 as the last publication date. Key articles were hand-
searched for further citations. This broad search strategy captured both observational and
intervention studies, and was later divided as two papers to allow more in-depth descriptions of
each type of study. This paper will only discuss results of the intervention studies.
Inclusion and exclusion criteria were applied to all titles and abstracts. Citations had to be
intervention studies that included, at minimum, results of the effects of one or more

92
micronutrients in pill or food-form for a LTC sample. For studies examining multiple participant
groups (e.g. community, retirement and LTC participants), only results specific to LTC residents
were included and if results were merged across sectors, the citation was excluded. Studies
using ONS were also excluded, as these provide macronutrients as well as micronutrients, and
effects of micronutrients alone cannot be ascertained. Citations with food intake data and/or
biomarkers assessing status were included, and were limited to the English language. Studies
conducted in North America, Europe, Mediterranean (Greece, Italy, Portugal Spain) and
Scandinavian countries (Denmark, Finland, Iceland, Norway, Sweden), New Zealand, and
Australia were included; differences in foods consumed, LTC nutrition care processes, and
micronutrients of interest in other geographic regions were anticipated and thus studies from
other regions excluded. The initial screening process of titles, abstracts and where required full
text, was conducted by the first author (IL) with agreement with the senior author (HK). A
subsequent title and abstract review process was completed by a second trained reviewer using
the same inclusion/exclusion criteria in efforts to avoid missing key articles from the search
results. Any articles in question to be included in the review were examined by the senior author
and both authors came to a decision on inclusion or exclusion. Pertinent information was
extracted to a spreadsheet, and 100% of the articles were divided and reviewed among the
authors to validate this extraction.
Data Extraction, Categorization, and Synthesis
A flowchart of the number of studies examined and included is found in Figure 1. Data
extracted included participant characteristics (age (mean ± standard deviation), study design
(sample size, length of study, intervention type, dosage), assessment methods (biomarkers used),

93
and changes identified in outcome variables for both intervention and control groups, if
available. Studies were divided into two categories, depending on whether the intervention was
delivered in pill-form or food form.
6.3 Results
The search strategy resulted in 3342 articles in total (Figure 1). Full articles initially
selected for inclusion were excluded if they: focused on disease/treatment (n=11), were not part
of the geographic region for inclusion (n=4), the full citation was not accessible (n=12), did not
include a LTC population (n=13), did not present micronutrient data (intake or biochemical)
(n=26), focused on the use of oral nutritional supplements (n=10), were reviews and not original
studies (n=32), or did not address our research question (e.g., menu planning, letters to the editor,
had outcome measures other than biomarkers (e.g. falls, infections), enhanced foods by
ingredients rather than micronutrients for fortification (e.g. trialing fortified infant cereal as a
thickener to add nutrients to thickened foods) (n=25). The screening criteria resulted in 25
intervention studies, with 17 studies trialing micronutrient pills and 8 testing food fortification.
Results from pill-form studies will be presented first, then food fortification data (Tables 5A to
8A for change in biomarker status (increase/decrease), Tables 5B to 8B for actual/numerical
values). As the majority of interventions trialed vitamin D and/or calcium, these two
micronutrients were sorted into one subgroup for both pill- and food-form, and all other
micronutrients were put into a second subgroup for discussion.

94
Comparison to Dietary Reference Intake and Biomarker Reference Values
A variety of efficacy end points (e.g. prevention of fracture with vitamin D) were used in
the studies identified. As our primary research questions were focused on micronutrient status
and due to these various functional end-points used in studies, efficacy in this review is defined
as achieving normal serum levels of the selected biomarkers for individual nutrients. Dosage
levels for supplementation and fortification were compared to the Institute of Medicine’s
Recommended Dietary Allowance (RDA), which provides a reference to meet nutrient
requirements for nearly all (97-98%) individuals in a particular gender and age group (e.g. those
>70 years old) (28). Micronutrient intake was compared to the RDAs for individuals greater than
70 years of age to allow for standardization of resulting data, as other nations may follow their
own version of dietary references (28). Adequate Intake (AI) was used if RDAs have not been
established for a particular micronutrient. Recommendations for males were used if
recommendation levels for the genders varied (See Table 9-12C for comparisons to RDAs).
As citations used a variety of biomarkers with varying reference ranges, to promote
comparison across studies, the American Medical Association (AMA)’s reference ranges, which
are commonly used in both scientific and medical settings, were used (44). Since AMA provided
values for normal ranges, values from the Centers for Disease Control and Prevention (CDC)
(45) were also included to provide reference ranges for values that were below normal (low and
deficient values).
The two most common micronutrients included in intervention (supplementation and
fortification) studies were vitamin D (n=17 citations) and calcium (n=12). Vitamin C (n=8), folic
acid (n=7), B12 (n=6), B1 (n=6) and zinc (n=5) were also commonly included in formulations.

95
The efficacy of supplementation or fortification with these micronutrients will be discussed
below.
Pill-Form
Vitamin D and Calcium
This scoping review identified 9 citations trialing vitamin D and/or calcium in pill-form
(Table 5A). Studies in this category originated from Brazil (286,287), Canada (94), France
(288,289), Ireland (290), The Netherlands (105), Norway (99), and Switzerland (291). Studies
were conducted between 1987 (288) and 2011 (290). Randomized controlled trial (RCT) was the
most common design (n=5), with length of study ranging from 4.5 months (105) to 2 years
(99,291). RCT sample size ranged from fifty-six (287) to 3270 residents (289). The remaining
four studies were a pre-test/post-test with one (286) or two comparison groups (290), and post-
test studies with a comparison group (288) or the intervention group only (94). Length of study
for these non-RCTs ranged from 12 weeks (286,290) to 10 months (94) and sample size ranged
from forty-two (286) to 104 residents (288). The biomarkers used to assess vitamin D and
calcium status were: 1,25(OH)D, 25(OH)D, calcium (ionized and total), parathyroid hormone
(PTH), phosphorus, osteocalcin, and alkaline phosphatase. Vitamin 25(OH)D was the only
biomarker that was used across all studies.
Dosage trialed compared to RDA: The RDA for vitamin D and calcium are 800 IU and
1200 mg per day, respectively. There were three vitamin D-only studies (94,99,286), and six
included both vitamin D and calcium (Table 5A) (105,287–291). Three studies considered
factors that could affect the efficacy of supplementation (e.g. body fat, dose timing/schedule)
(105,286,290). The dose of calcium in all but one study were below the RDA (27-83% RDA)
(105,287,288,290,291). One study supplemented with calcium at 100% RDA (289). A wider
96
range of dosage was seen with vitamin D, where values ranged from 50% to 306% RDA. Three
of the 9 vitamin D studies had values at the RDA (288–290), 4 were above the RDA
(94,286,287,291), and only one was below the RDA (75% RDA) (105). None of the studies had
values above the Tolerable Upper Intake Level (UL).
Seven studies used daily vitamin D dosage schedules, providing 400 IU (99) to 2000 IU
(94) vitamin D per day (Table 5A). Two studies examined weekly dosages of 4200 IU (105) and
7000 IU (286) per week, and two studies trialed monthly doses at 18000 IU (105) and 150000 IU
(287). Of the six studies that included calcium, dosage ranged from 320 mg (105) to 1200 mg
(289) in elemental form. For change in biomarker status, this review will only examine
25(OH)D, calcium, and PTH status, as these were common across all studies in this category.
Biomarkers compared to AMA and CDC Cutoffs: For vitamin D, all studies achieved
normal 25(OH)D status according to the AMA reference ranges (35 – 150 nmol/L) (44) and
CDC cut-offs (50-70 nmol/L for 25(OH)D sufficiency) (45), regardless of dose or length of
study. Although there may be a positive dose-response, larger number of studies would be
needed to clarify any dose-response trend of vitamin D, and likewise for other micronutrients.
25(OH)D: All studies found an increase in 25(OH)D status. Dinizulu et al. identified the
greatest 25(OH)D increase (61 nmol/L from baseline) with 800 IU/day vitamin D (100% RDA)
alone for 12 weeks.(290) This study also tested 800 IU/day vitamin D with 1000 mg/day calcium
(83% RDA) and found a smaller increase (37 nmol/L) with the combined intervention,
suggesting that a single vitamin D intervention may be as effective as a combined calcium-
vitamin D intervention for improving serum vitamin D status (290). Schwalfenberg et al.
supplemented 2000 IU/day vitamin D (167% RDA) for an average of 8 months and noted an
increase of 4-4.2 nmol/L for every 100 units of vitamin D given (based on 35-40 nmol/L

97
25(OH)D at baseline) (94). The smallest increase (17 nmol/L) was found by Meyer et al., trialing
only 400 IU/day of vitamin D for 2 years (99).
Calcium: The six supplementation studies that included calcium with vitamin D reported
final serum calcium status (total and/or ionized) in all intervention groups to be above the AMA
reference ranges (no CDC cut-offs available) (105,287–291). Concern with calcium
supplementation and increased risk of adverse cardiovascular events (292–294) will be further
elaborated on in the overview section below. All participants had calcium status within normal
ranges at baseline. Moreover, two studies found decreased calcium status from baseline
(287,291), yet final values were still within AMA normal ranges. Krieg et al. supplemented
residents with 880 IU vitamin D (110% RDA) and 500 mg elemental calcium (42% RDA), but
found a small decrease in calcium for the treatment group (2.32 to 2.31 mmol/L, baseline to
final) and an even larger decrease for their control group (2.29 to 2.23 mmol/L) (291). Moreira-
Pfrimer et al. trialed 150,000 IU per month for 2 months and 90,000 IU vitamin D per month for
4 months (~3667 IU, 306% RDA) and also identified a decrease in ionized calcium for both the
treatment (1.3 to 1.25 mmol/L, baseline to final) and the control groups (1.3 to 1.27 mmol/L)
(287). However, total calcium increased for their treatment group (2.23 to 2.27 mmol/L), but
decreased in their control group (2.25 to 2.23 mmol/L) (287).
Dinizulu et al. trialed a vitamin D-and calcium and a vitamin D-only formulation, and
identified the largest increase in calcium (0.1 mmol/L from baseline) with the combined vitamin
D and calcium formulation for 12 weeks (290). The vitamin D-only formulations showed a
smaller increase in calcium status (290). Further, Meyer et al.’s vitamin-D only formulation with
400 IU/day (50% RDA) also showed the lowest and non-significant increase in serum calcium
(0.003 mmol/L) (99).

98
PTH: Parathyroid hormone status was examined in eight of the nine studies and a
decrease was found in six citations (286–291). Chapuy et al.’s 1987 study found the largest
decrease of intact PTH (60.3 ng/L, baseline to final) in a 6 month intervention of 800 IU vitamin
D (100% RDA) and calcium (1000 mg, 83% RDA) (288). This is contrasted with the control
group, which found an increase of 18.2 ng/L. Dinizulu et al.’s vitamin D, with or without
calcium intervention, identified the next largest decrease in PTH, (40 ng/L with calcium, 30 ng/L
without calcium) (290).
Other (Non-Vitamin D/Calcium) micronutrients: Zinc, vitamin C, vitamin E
Eight citations trialing other (non-vitamin D and calcium) micronutrients in pill-form
were identified. Five were multi-nutrients (95,98,205,295,296) and 3 were single-nutrients
(100,158,297). Studies were conducted between 1993 (95) and 2011 (297). The dosage content
and levels used in the multi-nutrient studies were heterogeneous, and no clear trends could be
identified. Overall, zinc was the most common micronutrient assessed with multi-nutrient
supplementation (n=5 citations), followed by vitamin C and E (n=4 each). Vitamin D was also
part of formulations (n=3), but not calcium. (See Figures 4A and 4B for comparisons of dosage
trialed vs. RDA for vitamin D/Calcium, and other micronutrients, respectively.)
For the five multi-nutrient interventions, biomarkers examined were vitamins A, D, E, C,
B6, B12, thiamin, riboflavin, and folate, copper, iron (ferritin), selenium, and zinc. These studies
originated from Australia (295), France (95,296), the UK (98), and the US (205) (Table 6A). All
were RCT designs with study length ranging from 1 month (95) to 1 year (205), and sample size
ranging from eighty-four (95) to 617 residents (205). Four studies supplemented zinc in

99
combination with other micronutrients (98,205,295,296), with dosage ranging from six (295) to
20 mg (296) elemental zinc.
For single-nutrient studies, biomarkers examined were vitamins C, B12, iron (hematocrit,
mean corpuscular volume), and zinc. Studies originated from the Netherlands (100), Switzerland
(297), and Turkey (158). Two RCT studies were conducted (100,297), and the other design was
a pre-test/post-test (158).
Dosage trialed compared to RDA recommendations: Large variations in dosage were
trialed in the multi-nutrient studies (e.g. vitamin C dosage ranged from 30 to 200 mg (30 to
222% RDA), vitamin E ranged from 6.8 to 90 mg (45 to 606% RDA), zinc ranged from 6 to 20
mg (55 to 182% RDA)) (Table 6B, Figure 4B). In all five of the multi-nutrient studies, and in
two of the three single-nutrient studies, some micronutrients were above the RDA; there was no
consistency among which nutrients were supplemented above this reference value. Two studies
had values at or above the UL; Grieger et al. supplemented with 313% RDA (50 mg) for niacin
in a multi-nutrient formula to improve nutritional status and bone quality (295), and Meydani et
al. supplemented a multi-nutrient formula with 500% RDA vitamin D (4000 IU) with the
intended purpose of reducing instances of respiratory infection (205).
Biomarkers compared to AMA and CDC Cutoffs:
Multi-nutrient results: Allsup et al. tested a multi-nutrient formula (Vitamins: A, D, E,
B1, B2, B3, B5, B6, B7, folic acid, B12, C; Ca, Cu, Fe, I, Mg, Se, Zn; see Table 10C for dosage
levels) with 119 residents (n=61, treatment) receiving influenza vaccines for 8 weeks. They
identified a significant increase in levels of vitamins A, D, E, C, folate, and selenium from
baseline (98). Levels of vitamin D and C for the treatment group were below AMA normal
ranges at baseline but improved to normal ranges with fortification. Zinc levels remained below
100
AMA at baseline and finals. Levels of the remaining micronutrients were within AMA normal
ranges at baseline and final. Interestingly, the dosage levels of all micronutrients in Allsup’s
study with the exception of vitamin D, were above the RDA for nutrients. The authors did not
record changes in vitamin B12 despite high dose given. Asciutti-Moura et al. examined a
vitamin-only intervention (Vitamin E, C, B1, B2, B3, B5, B6) with 84 residents (n=27,
treatment) for 30 days, and found a significant increase in serum vitamin C (ascorbate), vitamin
E (males only), and erythrocyte thiamin pyrophosphate (95). However, levels of riboflavin and
vitamin B6 decreased (95). Final levels of vitamin C and E remained within AMA normal
ranges; no AMA comparisons were available for the biomarkers used for thiamin, riboflavin and
vitamin B6. Grieger et al. trialed a multi-nutrient formulation (vitamins A, D, E, C, thiamin,
riboflavin, niacin, pantothenic acid, B6, B7, Folic acid, B12; Ca, Fe, Mg, Mn, K, Zn) for 24
weeks with 92 residents (n= 49, treatment), and identified a significant increase in 25(OH)D
(27.4 nmol/L), folate (13.0 nmol/L), and vitamin B12 (145.6 pmol/L) (295). Levels of zinc
decreased by 0.1 µmol/L, but was not found to be significant (295). This formulation was
adequate to help maintain folate and B12’s AMA cut-offs for adequacy (both were normal at
baseline as well); despite the decrease, average zinc level was still within AMA cut-offs.
However, vitamin D remained below AMA normal ranges. Yet, proportions of participants at
low levels of 25(OH)D (≤50 nmol/L), folate (≤ 7 nmol/L), and vitamin B12 (≤200 pmol/L) also
decreased from 37% to 23%, 14% to 0%, and 30% to 6%, respectively (295). Meydani et al.
focused on the effects of a vitamin E on respiratory infections in 617 residents (n=311,
treatment) for 1 year, and combined vitamin E (90 mg, 606% RDA) with 50% RDA for vitamins
and minerals (Vitamins A, D, C, B1, B2, B3, B6, Folic acid, B12; Cu, Fe, I, Se, Zn) in the
intervention group compared to a control without vitamin E (only 50% RDA of other vitamins
101
and minerals) (205). A significant increase of plasma vitamin E was found in the intervention
group (26.5 to 49.2 µmol/L, baseline to final; both baseline and final levels were above normal
ranges), yet there was no significant change in other micronutrients’ statuses (205). Monget et al.
examined the effects of a vitamin-only (Vitamins A, E, C); and a vitamin-and-mineral-combined
intervention (same vitamin content with Se and Zn added), with 575 residents for 6 months
(296). All dosages were at or above the RDA, and a significant increase in serum B-carotene
(vitamin A), a-tocopherol (vitamin E) and vitamin C were seen in the vitamins-only group; a
significant increase in selenium was found in the minerals-only and the combined vitamin-and-
minerals groups (baseline values were below AMA; final values reached AMA normal ranges
with fortification); and a significant increase in zinc was seen in the minerals-only group (final
value still below AMA normal ranges) (296).
Single-nutrient results: Favrat et al. trialed vitamin B12 at 1000 µg for 4 weeks with 50
residents (n=26, treatment), and found a significant increase of B12 (101.6 pmol/L) as compared
to the control (297). Levels of B12 were maintained within AMA normal ranges for both
treatment and control groups, but a smaller increase was seen in the control group. A significant
decrease in methylmalonic acid levels was also found (0.13 µmol/L, p<0.001), yet homocysteine
levels also increased (but was non-significant, p=0050). Ter Riet et al. trialed vitamin C at 1000
mg for 12 weeks with 88 residents (n=43, treatment) and identified an increase in plasma
ascorbic acid levels (64.2 µmol/L, no p-value given) (100). Both treatment and control groups’
final values were within AMA ranges, but a smaller change was seen in the control group.
Finally, Arcasoy et al.’s pre-test/post-test intervention study trialed zinc supplementation at 30
mg for 90 days with 15 residents, and found an increase in serum levels (12.96 to 14.34 µmol/L,
baseline to final; both baseline and final values were within AMA normal ranges) (158).

102
Biomarkers compared to AMA and CDC cut-offs: Vitamin C and zinc as examples
Vitamin C: All five multi-nutrient supplementation studies included vitamin C in the
formula, but only three measured vitamin C status (95,98,296). One vitamin C single-nutrient
supplementation study also supplemented with calcium (100). Overall, all of these studies that
included an outcome of vitamin C status showed an increase from baseline to final with the
intervention. Three supplementation studies had residents with vitamin C levels below AMA and
CDC cutoffs at baseline (98,100,296), while one had normal baseline values (95). While means
of average values post intervention were in the normal range, large standard deviations were also
seen (98,296). Thus, individual participants’ final vitamin C values may still be below cut-points
for normal.
Zinc: Three of the five pill studies increased zinc levels with supplementation sufficiently
to meet the AMA cutoffs (98,158,296), while the other two studies found that zinc status
decreased (205,295). The three studies with final values that met AMA cutoffs for zinc also had
within normal values at baseline, so the efficacy of treatment is questioned for improving zinc
status.
Food Fortification
Vitamin D and Calcium
Vitamin D with calcium were trialed by four food-fortification studies (Table 7A). Three
studies in this category originated from France by Bonjour et al. (111,115,298); the other
originated from Romania (112). Studies were conducted between 2009 (112,115) and 2013

103
(298). Food vehicles included cheese (111,115), yogurt (298), and buns (112). Dosage schedules
provided 100 IU (111,115) to 5000 IU (112) vitamin D per day (Table 7A) and elemental
calcium at 280 mg (298) to 320 mg (112) per day. RCTs were used by two studies with a sample
size of twenty-one (111) and 59 residents (298), and length of study of 6 and 8 weeks,
respectively. The other two studies used a pre-test/post-test one group design with the length of
study being one month (n=35 residents) (115) and one year (n=45 residents) (112). Across all
studies, biomarkers used to assess vitamin D and calcium status included: 25(OH)D, calcium
(serum and urine), parathyroid hormone (PTH), phosphorus, osteocalcin, and alkaline
phosphatase. For change in biomarker status, this review will only examine 25(OH)D, calcium,
and PTH status.
Dosage trialed compared to RDA recommendations: Three of the four studies were
conducted by Bonjour et al., and aimed to reduce bone resorption markers or decrease bone loss;
they trialed formulations that were below the RDA for both vitamin D and calcium with dairy
products (cheese and yogurt) as the vehicles (111,115,298). Range of dose in these studies were
from 13-50% RDA for vitamin D, and 25-67% RDA for calcium. Mocanu et al.’s study trialed
the safety and efficacy of a pharmacological dose (above the UL) of vitamin D (5000 IU, 625%
RDA) in a bun (112). The accompanying dose of calcium was 302 mg (27% RDA) (Table 11C).
Biomarkers compared to AMA and CDC Cutoffs:
Overall, from the combined observational and intervention studies scoping review there
were many more studies using dietary assessment methods (Figure 5A) compared to biomarker
measurements (Figure 5B). 25(OH)D: 25(OH)D status increased for all four intervention studies.
The largest increase was seen in Mocanu et al.’s one-year trial of a bun with 5000 IU/day

104
vitamin D (625% RDA) and 320 mg/day calcium (27% RDA), where 25(OH)D status increased
from 28.8±9.9 nmol/L (baseline) to 126.4±37.3 nmol/L (final) (112). Bonjour’s trialing of cheese
with 100 IU/day (13% RDA) vitamin D and 302 mg/day calcium (25% RDA) also identified
increases in serum 25(OH)D after 1 month (32 nmol/L from baseline) (115), and 6 weeks (~7.5
nmol/L from baseline) (111). This study had a high compliance rate of 93.4%. The next largest
increase (25.3 nmol/L compared to control) was Bonjour et al.’s 2013 study, trialing yogurt with
a 400 IU vitamin D (50% RDA), and 800 mg calcium (67% RDA) (298). This study had 89%
adherence. The other two studies found smaller increases of 25(OH)D status and did not provide
data on compliance rates (112,115). For these fortification studies, all but one study (115)
achieved normal 25(OH)D status per AMA reference ranges. Using the CDC cut-offs, two
studies did not achieve 25(OH)D sufficiency (115,298). The 25(OH)D outcome level in Bonjour
et al.’s 2009 study (115) where the intervention group did not meet AMA or CDC cut-offs did
show a significant increase from baseline (baseline): 13.73(4.24) nmol/L; final: 15.72(4.24)
nmol/L). Reasons for this may be the low dosage (100 IU/day), and the short intervention
duration (1 month) (115). It has been estimated that 3 months are needed to achieve steady levels
of 25(OH)D status with vitamin D supplementation (299,300) and fortification is anticipated to
have at least this or a greater time requirement for achieving normal vitamin D status. A larger
increase in 25(OH)D was found in Bonjour’s 2013 study, which met the AMA criterion, but not
CDC (298). This study had a higher dose (400 IU), but it was still lower compared to
supplementation studies (94,112,286), and length of the intervention was just under two months.
Only one study was conducted for over 2 months; Mocanu’s study was the longest vitamin D and
calcium study and was conducted for 1 year (112).
105
Calcium: Three of the four studies examined serum calcium status. Bonjour’s 2013
study trialing yogurt found that levels did not significantly change from baseline to follow-up,
however, the control group in this study showed a non-significant decrease at follow-up (298).
The calcium decrease in the control group was also not statistically significant. The remaining
two studies were pre-test/post-test studies with one group only; as with the RCT, both identified
small, non-significant decreases in serum calcium levels from baseline to final (112,115).
Bonjour (2009) saw decreased serum calcium with fortified cheese (2.29 to 2.27 mmol/L) (115)
and Mocanu identified decreased levels with use of fortified buns (2.29 to 2.28 mmol/L) (112).
Yet, average calcium values for participants were within the AMA normal range at baseline and
final. This suggests that the calcium dosage provided may be too small or fortification intake
occurred at too short of a duration. However, this may also be due to the homeostatic control of
serum calcium. Mocanu also measured urinary calcium and a slight increase was seen (3.4 to 3.7
mmol/L, baseline to final), indicating that increased calcium absorption (and excretion) occurred
at this dose (302 mg calcium), without evidence of hypercalcemia (112). For Bonjour (2009),
despite the non-significant decrease in serum calcium, there was an improvement seen in other
bone resorption markers (e.g. PTH) suggesting some benefit of fortification of foods with
calcium at these < RDA levels (115).
PTH: Parathyroid hormone status was measured by all four studies, and found to
consistently decrease with treatment. Mocanu et al. reported the largest decrease in PTH, from
59.3 to 19.0 ng/L (baseline to final) and Bonjour (2013) found a similar decrease (28.6 ng/L,
baseline to final) with their yogurt fortification (400 IU vitamin D and 800 mg calcium for 56
days) (298). Bonjour’s other two studies trialed cheese (100 IU vitamin D and 302 mg calcium)

106
with a 1 month pretest/post-test study with 1 group and 6 week RCT crossover, and found a
decrease of 9.2 ng/L(115)(Bonjour et al., 2009) and ~3ng/L (111), respectively.
Other (Non-Vitamin D/Calcium) Micronutrients:
Four studies trialed food fortification with other micronutrients (Table 8A). Studies
originated from Canada (119), Ireland (117), the Netherlands (301), and Spain (116). Studies
were conducted in 1995 (301), 1998 (117), and 2009 (116,119). Food vehicles included juice
(301), milk (117), margarine (116), and pureed entrées (meat and vegetable portions) (119).
Folic acid was trialed in all four studies. Other micronutrients in these formulations were:
Vitamins D, E, C, thiamin, riboflavin, niacin, pantothenic acid, B6, biotin, folate, and B12.
Interestingly, none of the formulations in this category included minerals. Aims of these studies
included improvement of folate status (116,117), reducing malnutrition (119), and examining
the effects of increasing micronutrients on nutritional status (96).
Dosage trialed compared to RDA recommendations: Three studies provided
micronutrient dosages below the RDA (116,301). However, one study by Adolphe et al. fortified
with levels at or above the RDA for all nutrients, except for vitamin D (80% of RDA) (119).
Two studies were folic acid-only (116,117), and two were multi-nutrient studies that included
folic acid (119,301). Ranges were from 16-100% RDA (Table 12C). Bermejo et al. conducted a
pre-test/post-test study with a treatment and comparison group (n=126 residents) trialing folic
acid-fortified margarine (200 µg/10 g margarine, 50% RDA) for 6 months, and identified an
increase of serum and erythrocyte folate, from 16.6 to 27.1 nmol/L (baseline to final) and 748 to
1403 nmol/L, respectively (116). This group also estimated that the remaining 200 µg of folate
would come from food, thus achieving the 400 µg folate recommendations. Keane et al.

107
conducted a post-test 2-group comparison only study with 89 residents (n=49, treatment) trialing
folic acid-fortified milk for 6 months at 76 µg/day (19% RDA) and identified a significantly
higher level of serum folate in the treatment compared to the control group, at 5.81 µg/L and
2.16 µg/L, respectively (117). Red blood cell folate was also higher in the treatment compared to
the control group, at 316.5 µg/L and 196.1 µg/L, respectively (117). Keane et al. concluded that
folic acid fortified milk was an acceptable and effective method in administering folic acid to
LTC residents (117).
Van der Wielen et al.’s (1995) RCT trialed a water-soluble vitamin-fortified juice
(vitamins C, B1, B6, folic acid, and zinc) with 33 residents (n=15, treatment) for 12 weeks, and
Adolphe et al. used a pre-test/post-test design with one group (n=11 residents) trialing a vitamin-
only formulation (Vitamins D, C, B1, B2, B3, B5, B7, folic acid, and B12) in pureed vegetable
and meats for 8 weeks.
Biomarkers compared to AMA and CDC Cutoffs:
Vitamin C: Only one fortification study examined vitamin C level; levels for the
treatment group was with the normal range per AMA and CDC at baseline and final, and the
control group’s baseline was below normal (301). In this study, significant increase of plasma
vitamin C was seen in the treatment (2.4 µmol/L) and control (0.9 µmol/L) groups with
fortification.
Folic Acid: All four studies had final folate levels within normal ranges for AMA and
CDC references. Folate levels increased for three of the four studies (119,301); one study did not
measure baseline values (117). However, baseline values for the studies where provided were
also within AMA and CDC normal ranges.

108
Others: Results from Van der Wielen’s (1995) study identified a significant increase in
thiamin (+17 nmol/L from baseline) and vitamin B6 (+16 nmol/L), and significant decrease in
serum homocysteine levels (-7 µmol/L) in the treatment group (301). Adolphe’s study identified
a significant increase in 25(OH)D and folate status, but did not find a significant increase in
vitamin B12 status (119).
6.4 Discussion
The primary purpose of this review was to examine the available research on pill and
fortified food forms of micronutrient delivery for LTC residents and specifically to identify the
range of micronutrients examined, the range of dosage used, and the resulting effects. The
secondary purpose was to determine which nutrients and foods have been successfully trialed
and incorporated for food fortification. Research to date favours a pill-based strategy over food
fortification to promote micronutrient intake of older adults in LTC. However, most of the
fortification studies were conducted in the past decade (111,112,115,116,119,298), suggesting an
increasing interest in this strategy. Overall, improvements in blood nutrient makers were seen
with both fortification and supplementation, with many reaching AMA and CDC cut-points to
indicate sufficiency, yet heterogeneity in study design, intervention length, dosage formulation
(single or combined), dosage schedule, and foods trialed make comparisons difficult.
Overview of Effects of Micronutrient Supplementation and Fortification
Dosage Recommendations
Several challenges arose in comparing and interpreting the findings in these identified
studies, specifically considering the doses provided in formulations. Overall, it appears that both

109
pill and fortified food forms of micronutrients are effective at improving micronutrient levels, yet
it is unknown whether doses delivered in supplements or in food are equivalent in terms of
efficacy; as well most supplements in reviewed studies were well above the RDA while
fortification studies were at or below the RDA, except for the study by Adolphe et al. (2009).
The updated DRIs consider older adults (>70 years of age), and included data from actual
studies rather than simple extrapolation from younger adults (302). However, these are set for
healthy individuals; the multi-morbid resident in LTC may require different nutrient
recommendations due to different nutrient requirements in disease states and possible changes in
metabolism of nutrients (263,302,303).
Besides the DRI, other recommendations have been suggested regarding intake and
supplemental levels of micronutrients. For instance, Osteoporosis Canada has provided more
elaboration to the current calcium RDA due to recent research suggesting an association between
calcium supplementation and risk of adverse cardiovascular events (292–294), recommending
that the 1200 mg should come mainly from food rather than from supplements/fortification
(304). However, this same advocacy group recommends vitamin D intake for older adults to go
above the RDA, suggesting an intake of 800-2000 IU/day vitamin D (100 – 250% RDA), which
is the level shown to increase serum 25(OH)D to desirable levels (305). In reviewed studies
where vitamin D was provided at 800 IU or higher (112,290,291), larger increases in 25(OH)D
were seen as compared to dosages below the RDA (98,99,115). The Linus Pauling Institute
(LPI) also suggests targets for micronutrient intake for older adults (65), taking into
consideration decreased appetite, absorption changes (e.g. atrophic gastritis), and body stores.
LPI also recommends 2000 IU/day vitamin D from supplements due to decreased ability of skin
synthesis of vitamin D for older adults (65). Other recommendations for older adults from LPI

110
include supplementation of 400 mg/day vitamin C at minimum due to heightened needs from
chronic disease, protective benefits of vitamin C against oxidative damage, and possible
decreased ability to use vitamin C with age (65,306). Hence, when considering supplementation
or fortification dosage, it is important to examine older adult-specific recommendations to target
levels based on their specific needs.
Dosage and Efficacy
In this comparison of studies, AMA and CDC were used to determine potential efficacy of
dosages. Although many studies demonstrated final levels within these reference ranges, many
baseline values are also considered normal. It needs to be noted that dosage levels reported in
these studies may not have been high enough to meet functional outcomes, especially as in some
studies that included functional or health-related outcomes, benefits were often not seen.
Factors affecting non-response
In particular, minimal change was seen in calcium levels despite a wide range of dosage
given (25-100% RDA), where all calcium studies had values within AMA range, whether an
increase or decrease was identified. This is not surprising, as the body maintains circulating
calcium levels for physiological reasons, and serum levels are thus not reflective of bone mineral
content (39,307). The decreases in serum calcium seen in these studies may point to potential
issues with nutrient metabolism and excretion for older adults due to declining renal function
with age (302). Ionized calcium is the active form of calcium and may better reflect functional
status, but levels are affected by age and other factors (39). There are currently no reliable
biomarkers to assess change in calcium status from interventions due to tight homeostatic

111
regulation, making assessment of status difficult (39). Thus, non-response may be due to
insensitive biomarkers to measure changes with intake levels. Future studies with calcium in
LTC need to examine other outcome measures to demonstrate potential benefits of
supplementation or fortification.
For micronutrients where change was not found with supplementation or fortification, it
is important to examine whether this is due to high levels of micronutrients at baseline, low
dosage or short duration of micronutrient interventions, as was demonstrated by the vitamin D
fortification example above. Asciutti-Moura et al. conducted a study with vitamins E, C, thiamin,
niacin, and B6, and found that while levels of vitamin C and E increased, B6, thiamin, and
riboflavin remained the same (95). This lack of change in status of these micronutrients may not
only indicate that doses were too low, but also that there may be a greater need for these
micronutrients for LTC residents (95).
Concerns with Toxicity and Overconsumption of Micronutrients
The Tolerable Upper Intake Levels (UL) has been established to determine the highest
level of long-term intake for individuals without presenting adverse health effects (28,37).
Individuals at higher risk of toxicity would be those who consume large amounts of high nutrient
foods, select a higher proportion of fortified foods, or who take supplements as well as fortified
foods (37). Given the commonly low food intake in LTC (5,21), and pre-portioned foods at
mealtimes, it is less likely that LTC residents will overdose on fortified foods from excessive
consumption of said fortified food. However, more work will be needed to determine the
maximum portions that individuals can have of the fortified food, should they request additional
amounts. Ideal single and double (triple, etc.) portions and their micronutrient content should be

112
calculated to ensure that the total amount provided of fortified foods does not exceed the RDA or
approach the UL. The full RDA or AI should also be divided amongst servings, and not be
provided in one serving, for this reason. This would also counter the problem of a refused food
and then the missed opportunity for fortification.
The most commonly trailed micronutrients were vitamin D, calcium, vitamin C, folic
acid, and zinc. Remarkably, many supplement studies had dosage above the RDA or AI, yet only
two studies had levels above the UL (112,295); neither of these studies reported adverse effects.
This could indicate that older adults in LTC require levels above the RDA for certain
micronutrients to maintain health status or avoid decline, or alternatively length of follow-up of
studies was insufficient to see adverse events.
Delivery Methods of Micronutrients
Pill Supplementation vs. Food Fortification
Studies have compared the bioavailability of supplemental vs. natural/food-forms of
micronutrients (308–310), yet this review did not capture any studies that compared the effects
and differences between pill-form or fortified food-form of delivery of micronutrients to LTC
residents. Other than calcium, none of the fortification studies in this review trialed minerals.
Adolphe et al. initially trialed pureed entrées with minerals, but decided to use a vitamin-only
formulation to avoid taste-issues with the fortified food (119). Regarding dosages in food, with
the exception of Mocanu’s (2009) study, dosages were generally below RDA levels, rather than
pharmacological levels of nutrients. One reason for this may be due to taste changes in foods
with the addition of micronutrients (119), or differences in regulations between fortified foods
and pills (89) . Thus, due to the differences in dosages between fortification and

113
supplementation, where supplementation can more easily reach pharmacological levels, it is
difficult to compare the effects of these two strategies.
Although there were more supplementation studies than fortification, the lack of
consistency in formulations (different micronutrients were trialed at various doses) and study
length makes comparisons within supplementation studies challenging. For instance, for vitamin
D doses ranged from 400 IU per day for a 2-year intervention to 150,000 IU per month for a 6-
month intervention. Thus, even when only one micronutrient is compared, the variability in
formulation and intervention length may not allow for an easy comparison. This becomes more
difficult for multi-nutrient formulations.
For fortification studies, differences in formulations and food vehicles for the limited
studies, also makes comparisons and conclusions on their effect difficult. One study compared
natural food-form and fortified food forms of folate, using vegetables and fortified margarine,
and found that, while both methods increased folate status, there was lower compliance with
vegetable intake, and fortified margarine was a well-accepted and more effective method to
increase folate status in LTC residents (116). Thus, food preference alone may render one
fortification strategy more effective than another due to better acceptance. Further, it illustrates
the importance of selecting food vehicles that residents enjoy, to increase the likelihood that
targeted intake levels will be achieved.
Challenges with Supplementation: Micronutrient supplementation is a simple and
direct method in delivering micronutrients, and does not depend on the resident’s appetite.
However, compounds in pill-form are not all equally effective. One study examining the
intestinal absorption of magnesium from food vs. supplement and found that foods high in
magnesium are as bioavailable as supplemental forms of soluble magnesium acetate, and that

114
enteric-coated magnesium chloride had much lower bioavailability than magnesium acetate
(310). Thus, it would be important to determine the compound with the highest efficacy. Further,
the level of micronutrient that could be added in supplemental form may be limited by the size of
the pill. For instance, multivitamin/mineral pills generally do not contain the RDA for calcium as
the pill would be too large if all 1200mg calcium were incorporated. Lastly, polypharmacy
continues to be a challenge for older adults in LTC and other settings (58,102,103,311). Use of
nutrient supplementation has been discouraged without good clinical evidence of benefits to
avoid adding additional stress and burden with medication consumption for older adults
(58,312). Concurrent use of medication with micronutrient supplementation may increase
adverse side effects (104,312).
Challenges with Food Fortification: Outside of the LTC context, other studies have
examined bioavailability of food fortification and pill supplementation (37,302,313,314).
Compared to pills, food fortification has the additional challenge of identifying a food vehicle
that enhances rather than inhibits the absorption of a nutrient (315). Simply adding nutrients to a
food may render the nutrient unavailable if it was added to a product with many inhibitors of said
nutrient, such as iron and phytates (77). However, addition of micronutrients to food via
fortification may be beneficial as certain nutrients enhance absorption of other nutrients (e.g. iron
and vitamin C) (77). One study outside of the LTC sector, compared absorption of folic acid-
fortified cereal-grains (bread, rice, pasta) and supplements, and found fortified forms to be highly
bioavailable for improving folate status and was comparable to supplemental form (309).
Colman et al. studied folate-fortified staple foods, where folate levels increased with both folic
acid-fortified maize and rice products, but lower absorption levels were found with fortified
bread (308). Two cooking methods (boiling and baking) were contrasted, with baking for longer

115
time found to be more damaging to folic acid levels. Hence, careful selection of food carriers and
cooking methods is required and when comparing products, examination of bioavailability is
needed (308).
Besides calcium, none of the fortification studies included minerals in the formulation.
Adolphe et al. suggested that the minerals may alter the taste and colors of foods it is
incorporated into (119). Hence, stronger tasting and darker color foods may be needed to mask
the changes caused by the addition of fortificants. In addition to determining the micronutrients
of greatest risk of deficiency, future research should also identify commonly consumed foods in
LTC and trial fortification formulations with these foods to assess whether it is possible to add
these nutrients without changing the color, texture, and taste of the food.
Single or Multi-Micronutrient Delivery
Micronutrients were provided in single, dual (e.g. vitamin D and calcium) and multiple
nutrient formulas for both supplementation and fortification. While single micronutrient delivery
could more clearly demonstrate the effects of a particular micronutrient, there is also value in
providing micronutrients in combination as some micronutrients enhance the absorption of
others. It is not known whether providing multiple nutrients in a formulation may attenuate the
effects of a single nutrient (65). However, it is known that certain micronutrients require other
micronutrients to work optimally (e.g. calcium and vitamin D) and appears to be an approach
consistent with natural food consumption. Meydani et al. trialed vitamin E with other
micronutrients, contrasted with just the other micronutrients alone at a low dose; they found that
only vitamin E levels increased (205). The addition of other micronutrients in the control group
may have improved the overall nutritional status of residents in the control group, thus

116
potentially reducing the effects of vitamin E alone. Yet doses were too small to show a
significant increase in biomarkers of these other nutrients (205).
Choice of food vehicle for Food Fortification
The foods trialed in fortification studies can be classified as beverages (milk (117) and
juice (301)), condiments (margarine (116)), sides (bun (112)), snacks (cheese (111,115), yogurt
(298)), and entrées (pureed meats and vegetables (119)). Similarities between these foods are
that they are commonly found in LTC and are available to different diet types and textures or can
be easily modified (e.g. pureed foods for dysphagia). Certain food vehicles also originally
contained lower levels of the micronutrient, but were still considered sources of these nutrients
(e.g. cheese and yogurt for calcium and vitamin D). Yet above all, these studies indicate that
whichever food vehicle is selected for fortification, it must be well-accepted by residents for an
effective intervention and feasible to put in more than one portion per day.
Biological Significance of Findings
In addition to nutrient biomarkers, other outcome measures were also measured, such as
respiratory infections (205), pressure ulcers (100), fractures (99), and bone quality
(111,115,295,298). This scoping review presented change in micronutrient status as the outcome
measure as this is specific to micronutrients, and is the anticipated immediate result of
supplementation or fortification, yet it does not allow for clarification on the functional effects of
these micronutrients. This is of interest, as it has been shown that food fortification is able to
improve nutritional but not functional status of residents with respect to frailty (316). However,
biomarker sensitivity is still an issue. For instance, assessment of calcium status from serum

117
biomarkers is difficult, as calcium is tightly regulated in the body, which may render it less
sensitive to changes in intake and status (39). Thus, identification of appropriate, specific and
sensitive biomarkers is much needed in both research and practice. This review captured
statistical significance of supplementation or fortification of micronutrients, and also determined
whether certain dose, formulation, and length of supplementation reached normalcy regarding
micronutrient status cut-offs, but still cannot determine whether a certain dose of micronutrient is
biologically or functionally significant (e.g. reduction of morbidity and mortality), as would be
the ultimate goal of delivering micronutrients to older adults in LTC. Several studies
demonstrated that both fortification and supplementation were able to improve micronutrient
levels to meet AMA or CDC cutoffs, decreasing the risk of deficiency and subsequent negative
health outcomes. It has been suggested that change in micronutrient status may be affected by the
baseline level of biomarkers, where a greater response to the intervention may be seen in those
with lower levels at baseline (112). Given that older adults in LTC commonly have poor
nutritional status, they may be more likely to benefit. Long-term clinical consequences of
increasing vitamin and mineral levels are still unknown (95) and future research in this area is
needed, but identification of more accurate and reliable biomarkers can help to better assess
older adults’ micronutrient status and status and functional changes with interventions (39).
6.6 Strengths, Limitations and Future Work
A strength of this study was that it was not limited to a specific functional outcome, such
as respiratory infections (205), hip fractures (288,291), pressure ulcers (100), or simply to
avoid/correct deficiency levels (116,117,158,297) ensuring that a maximal number of studies
were included for comparison. The effects of a wide range of dosages was also examined.

118
Despite the heterogeneous outcome measures, by selecting changes in micronutrient status, this
scoping review was able to compare the results from these diverse studies.
Advances in Fortification: From this study, there appears to be an increasing number of
fortification in recent years (112,116,119,298). Reasons for this include increased interest in
optimal health, and changes in the purpose of fortification, where efforts are no longer restricted
to addressing population-wide deficiencies, but rather towards voluntary fortification such that
industry can choose to fortify certain foods with certain micronutrients in order to promote health
(90). Both research and regulations are still in progress for voluntary fortification (317,318).
Supplementation vs. Fortification: At this point, it is difficult to determine whether
fortification or supplementation is a better strategy to improve micronutrient status of older
adults, especially of multi-nutrient formulations. To fully answer whether micronutrient-fortified
food or supplemental forms of nutrients are more efficacious, a better understanding of
micronutrient bioavailability, metabolism and excretion in older adults is needed (261). It is
currently unknown whether the bioavailability of micronutrients are different in pill-form vs.
fortified food form, and whether the absorption or excretion rates may require different
micronutrient cutoff points to determine normalcy for older adults. Clear benefits of vitamin D
and calcium in pill form were seen in this review, but comparable dosage levels were not seen in
fortification studies. The purpose of fortification, which is to provide micronutrients for the
whole LTC population, compared to supplementation, which is a more targeted intervention for
individuals, suggests that both strategies could be beneficial in LTC to meet micronutrient needs.
As poor nutritional status and likely poor intake of micronutrients is common in LTC
(24,227,319), micronutrient fortification may be an effective strategy in addressing micronutrient
needs of the wider LTC population. This may also help reduce polypharmacy (58,103,312), and

119
promote quality of life by providing a “food first” approach that is more enjoyable for residents
(320).
Study Limitations: Limitations of this study revolve around the dearth of available
reference ranges available for micronutrients and the variation in the studies identified. As the
AMA reference ranges did not include all micronutrients examined in the identified studies, or
did not include the biomarkers used in the studies, not all micronutrients could be compared to
AMA to determine whether levels were within normal ranges, affecting overall interpretation of
this work. The heterogeneity of data in the studies identified, as well as the lack of appropriate
biomarkers were limitations to the accuracy of the study. This study also did not examine
compliance of treatment, as not all studies provided this information, yet compliance would
undoubtedly affect treatment outcomes. Changes in micronutrient statuses were examined, but
overall intake was not examined, and a direct relationship between intake and status cannot be
made from this study, yet this is needed to demonstrate the efficacy of micronutrient-enhancing
strategies.
Future research: Future studies should determine whether there are benefits to
providing fortified food compared to pills and to determine whether incorporation of
micronutrients into foods enhances or inhibits absorption of micronutrients. Long term clinical
consequences of vitamin and mineral supplementation or fortification should also be examined.
The greatest challenges with this type of study will be the limits of dosage in the food form due
to potential taste changes. Single vs. multi-micronutrient formulations should also be trialed, to
examine whether there are benefits to providing nutrients in combination with each other, or
whether nutrients may interact with competing effects. It is also important to compare and
determine the bioavailability of different forms of micronutrients, to determine which form of
120
micronutrient to add to the fortification formula. Care must be taken with the food vehicle, not
only to allow for better bioavailability of nutrients, but also to ensure residents will accept and
completely consume the food vehicle for proper delivery of micronutrients. Focus groups with
LTC staff and residents to determine preferred and commonly consumed foods are recommended
to achieve this objective and to better understand the LTC context and potential issues with food
fortification in LTC. For recommendations to LTC practice, in addition to adding nutrients to
foods, proper food preparation procedures are also necessary to enhance micronutrient content of
provided foods. A better understanding of how to enhance bioavailability of food with different
cooking practice or food-processing practice may be an effective strategy to improve
micronutrient intake before implementation of fortified foods (321).
6.6 Conclusion
In conclusion, addition of micronutrients via fortification appears to be a feasible
alternative to current micronutrient delivery methods, and may be as effective as pill-form
delivery of micronutrients for improving residents’ micronutrient status, at least when using
AMA and CDC cut-offs as the criterion. Given the low levels of food intake and poor health
status of residents (5,21), and the low biochemical levels of certain micronutrients, strategies to
improve micronutrient status are needed; supplements certainly work, but more research is
needed on fortification. Vitamin D is likely beneficial for inclusion into a fortification formula
due to decreased sun exposure and poor nutrient absorption of LTC residents absorption (285),
but controversial findings of other micronutrients (e.g. vitamin C, folate, zinc) warrant future
studies. More work is also needed to identify appropriate food vehicles for fortification that not
only enhance bioavailability of micronutrients, but are also well-accepted by residents.

121
Figure 4A. Micronutrients assessed by biomarkers in Calcium/Vit D interventions
*Formulations contains vitamin D with calcium, (F) Fortification studies, (O)
Formulation contains vitamin D and calcium with other micronutrients, **Sig. increase in status
with supplementation/fortification (25(OH)D for Vit D, serum Ca for calcium)
600** 400** 880**1200**
5000**
800
7000**
800**
2000
400**
100** 100**
5000**
400** 400**
4000**
640**
0
1000
2000
3000
4000
5000
6000
7000
8000
Dose (
IU)
Vitamin D Supplementation/Fortification Dosage Compared to RDA
RDA (1200 mg)
RDA (800 IU)
320**
500**
1200
1000 1000**
800
302 302 320
144
0
200
400
600
800
1000
1200
1400
Chel,2008
(daily)*
Krieg,1999*
Chapuy,1992*
Dinizulu,2011*
Chapuy,1987*
Bonjour,2013* (F)
Bonjour,2011* (F)
Bonjour,2009* (F)
Mocanu,2009* (F)
Grieger,2009* (O)
Dose (
mg
)
Calcium Supplementation/Fortification Dosage Compared to RDA
RDA (1200 mg)

122
Figure 4B. Micronutrients assessed by biomarkers in non-Calcium/Vit D interventions (F) Fortification studies, (S) Single-nutrient study, **Sig. increase in status with
supplementation/fortification
120**200**
75 30120**
1000
31.5**
180
0
200
400
600
800
1000
1200
Do
sa
ge
(m
g)
Vitamin C Supplementation/Fortification Dosage Compared to RDA
146 7
20**
30**
0
5
10
15
20
25
30
35
Allsup Grieger Meydani Monget Arcasoy (S)
Do
sa
ge
(m
g)
Zinc Supplementation/Fortification Dosage compared to RDA
600**
200**
10063
200**
400**
76**
0
100
200
300
400
500
600
700
Allsup Grieger Meydani Van derWielen (F)
Bermejo (F) Adolphe (F) Keane (F)
Do
sa
ge
(µ
g)
Folic Acid Supplementation/Fortification Dosage Compared to RDA
RDA (90 mg)
RDA (11 mg)
RDA (400 µg)

123
Figure 5A. Micronutrients cited by observation studies measuring intake and/or in intervention
studies dosages
Figure 5B. Micronutrients cited by observation and intervention studies measuring biomarker
status
0
5
10
15
20
25
30
A D E C
B1
B2
B3
B5
B6
B7
B8
Fola
te
B12 C
a Cl
Cu Fe
I
K+
Mg P
Mn
Mo Se Na
Zn
Nu
mb
er o
f Cit
atio
ns
Micronutrients
Frequency of Micronutrients by Intake and Dosage
Obs-Intake Int - Dosage
0
5
10
15
20
25
30
A D E C
B1
B2
B3
B5
B6
B7
B8
Fola
te
B12 C
a Cl
Cu Fe
I
K+
Mg P
Mn
Mo Se Na
Zn
Nu
mb
er o
f Cit
atio
ns
Micronutrients
Frequency of Micronutrients by Biomarker Assessment
Obs-Biochem Int - Biochem

124
Chapter 7
Micronutrients on the Menu: Enhancing the quality of food in Long-Term Care for
regular, non-therapeutic menus
Abstract
Micronutrient (vitamin and mineral) deficiencies may exacerbate prevalent health conditions
occurring in Long-Term Care (LTC) residents and current menus may potentiate this problem. A
micronutrient-focused, food-first approach to menu planning may address this gap by
emphasizing nutrient-dense foods. The objectives were to determine if: 1) selected LTC menus
met micronutrient and Canada’s Food Guide (CFG) recommendations, and 2) recommendations
can be met through food alone with strategic menu planning. Regular, non-therapeutic menus
(week 1, all meals) from diverse LTC homes (n=5) across Canada were analyzed for
micronutrient content using Food Processor and CFG servings with EaTracker. Site dietitians
confirmed menu analyses. Five super-menus were created and analyzed for comparison. Menus’
nutrient content varied significantly across homes. Micronutrients of greatest concern were
vitamins D (mean 8.90 ± 5.29 µg/d) and E (mean 5.13 ± 1.74 mg/d). Folate, magnesium, and
potassium were also below recommendations. Super-menus of equal food volume met RDAs for
all micronutrients but vitamin D (11.2 ± 2.54 µg, mean 56% RDA), E (12.6 ± 4.08, 84% RDA)
and potassium (4018 ± 489 mg, 85%). Meeting most micronutrient recommendations is possible
with creative and deliberate menu planning and knowledge translation of best practices is
needed, as well as determining the potential cost of super-menus.
Key words: Long-term care; nursing home; menu planning; micronutrients; nutrition; aging
(A portion of this work has been published in the Canadian Journal of Dietetic Practice and
Research on Oct. 14, 2014. Available online February 2015.)

125
7.1 Introduction
In 2011, an estimated 7% of Canadians (or 300, 000 Canadians) aged 65 and above were
living in health care institutions, including Long-Term Care (LTC) Homes (1). This number is
projected to double, where 750, 000 Canadians will be living in health care institutions by 2036
(1). The Canadian Malnutrition Task Force has raised the awareness of health care providers and
the general population on the prevalence of malnutrition, and how it is impacted by many
factors, including quality food provision (322,323). CMTF defines malnutrition as deficiency,
excess or imbalance of energy, macronutrients and micronutrients that affects body tissues,
impairs function and impacts overall health (322). Although Canadian estimates of malnutrition
in LTC are elusive, it is estimated to occur in 20-60% of residents (5–9).
Adequate intake of a varied diet is needed to meet micronutrient requirements, although
physiological factors including challenges with self-feeding, early satiation, taste changes,
dysphagia, and decreased appetite are significant contributors to older adults’ food intake,
rendering them nutritionally vulnerable (13,14). Micronutrient (specifically, vitamin and
mineral) status is critical to managing common health issues in LTC, including anemia, bone
health (15), cognitive and functional status (16), immunity (17), infections, and wound healing
(18). Micronutrient deficiency is a prevalent yet preventable form of malnutrition among older
adults living in long-term care (LTC) (5,19–21). These deficiencies may further aggravate poor
health and low intake, leading to a vicious cycle of malnutrition and decreased function, directly
impacting residents’ quality of life (22).
Menu planning in Canadian LTC homes is governed by provincial regulations (324), and
typically planned considering Canada’s Food Guide to Healthy Eating (CFG) to ensure variety
(55). However, CFG may be inadequate in addressing micronutrient needs in menu planning, as

126
foods were not grouped into food groups based on nutrient content, but rather how food is
traditionally consumed (i.e., legumes are grouped with meats because it is used as a substitute)
(5,68). Consequently, micronutrient content of CFG choices differ greatly from choices within
the same food group, and even the most nutrient dense food choices may still be inadequate to
meet micronutrient recommendations. Dietary Reference Intakes (DRIs) provide micronutrient
recommendations, yet planning based on this reference requires knowledge of intake distribution
(69), which is currently lacking in LTC. Thus, menu planners use their professional judgment
with the assumption that, by following CFG and serving a variety of foods, the DRIs will be met
(5).
Compared to protein-energy malnutrition, relatively little research has been conducted on
micronutrient malnutrition in Canadian LTC homes (26,259,325,326). In addition to the
physiological changes with aging that affect food intake, it has been suggested that menus are not
sufficient in micronutrients to meet residents’ requirements (7). Analysis of menus from single
Canadian LTC homes has shown discrepancies between CFG recommendations and DRIs (5,48),
but did not always consider a comprehensive micronutrient profile for older adults (48). These
findings require confirmation, analyzing menus from several homes and preferably across
provinces to demonstrate the widespread prevalence of this potential problem. As meals provide
the main source of micronutrients for residents (7) an analysis focused on meals will be
sufficient to show discrepancies across provinces and as compared to guidelines. Given the
prevalence of low food intake in Canadian (5,19,21,327) and LTC home residents worldwide
(14,24,208,328), nutrient-dense menus with lower volumes of food are needed to help meet
nutrient needs. It is also unclear at this point if the DRI can be met with the selection of more
nutrient dense foods that are compatible with residents’ preferences when planning menus.
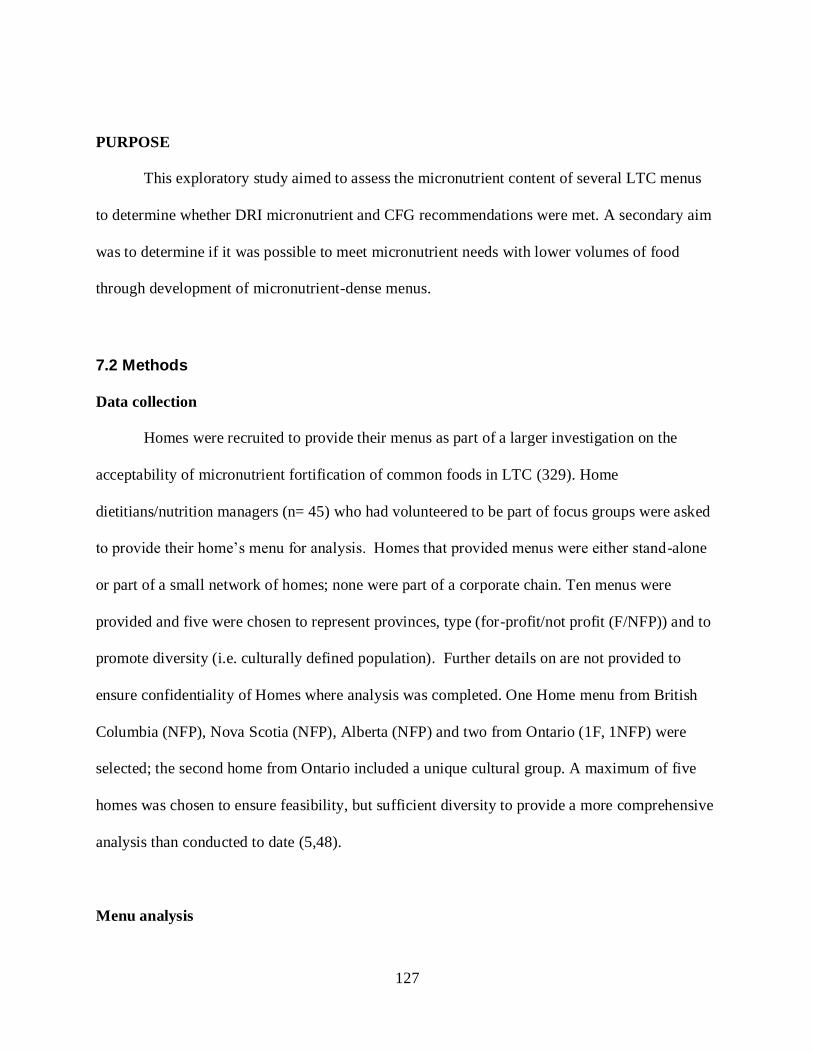
127
PURPOSE
This exploratory study aimed to assess the micronutrient content of several LTC menus
to determine whether DRI micronutrient and CFG recommendations were met. A secondary aim
was to determine if it was possible to meet micronutrient needs with lower volumes of food
through development of micronutrient-dense menus.
7.2 Methods
Data collection
Homes were recruited to provide their menus as part of a larger investigation on the
acceptability of micronutrient fortification of common foods in LTC (329). Home
dietitians/nutrition managers (n= 45) who had volunteered to be part of focus groups were asked
to provide their home’s menu for analysis. Homes that provided menus were either stand-alone
or part of a small network of homes; none were part of a corporate chain. Ten menus were
provided and five were chosen to represent provinces, type (for-profit/not profit (F/NFP)) and to
promote diversity (i.e. culturally defined population). Further details on are not provided to
ensure confidentiality of Homes where analysis was completed. One Home menu from British
Columbia (NFP), Nova Scotia (NFP), Alberta (NFP) and two from Ontario (1F, 1NFP) were
selected; the second home from Ontario included a unique cultural group. A maximum of five
homes was chosen to ensure feasibility, but sufficient diversity to provide a more comprehensive
analysis than conducted to date (5,48).
Menu analysis

128
Meals from the week 1 (7 days) non-therapeutic, regular texture menu were analyzed for
each LTC. Beverage choices and breakfast entrées were alternated each day to reflect residents’
potential preferences. The first choice of all lunch and dinner entrées were selected for analysis.
Serving sizes were obtained from each LTC. For mixed dishes (e.g. lasagna), recipes,
descriptions, or brand names of purchased products were obtained. For single food entrées (e.g.
chicken nuggets), a similar item from the nutrient analysis software was selected. Where recipes
were not provided, generic recipes used from food distribution companies (e.g. Sodexo or Sysco)
or from online recipe databases (e.g., allrecipes.com, canadianliving.com) were used. These
recipes were adjusted, confirmed and verified by the site dietitian or nutrition managers to ensure
they reflected the home’s recipes.
Food and fluid items were entered into ESHA Food Processor SQL (version 10.12.0,
ESHA Research, Salem, OR, 2012) to examine calories, protein, fibre and 21 micronutrients. As
the first step, USDA choices were selected for entry as these provided the most complete
micronutrient data. Where fortification influenced micronutrient values (e.g. grain and milk
products) Canadian Nutrient File (CNF) choices were searched in the CNF database and relevant
values were manually added to the ESHA program (152). To confirm food choices, eaTracker, a
food database based solely on CNF values, was used for comparison and to calculate CFG
servings in menu items and recipes (153). Menus’ nutrient values were compared to gender-
specific RDA/AIs for individuals aged 70 and above. Analyzed menus were provided to the
homes for verification and adjustments made as required in portion size or selection of standard
items in the food database.
Super-menus

129
Super-menus (higher nutrient-density, lower volume; Table 13) based on commonly
served foods were subsequently created to meet the RDAs for 11 micronutrients (thiamin,
riboflavin, niacin, B6, folate, B12, C, D, calcium, magnesium, zinc) that are known to be poorly
consumed by older adults in Canadian (5,15,19,21,26,48) and other LTC
(5,15,19,21,27,95,116,155,156,158,215). The analysis of the five diverse menus (above)
provided the basis for developing the Super-menu. Specifically, herbs and spices were found to
contain high levels of micronutrients and thus those consistent with recipes common to LTC
were included. Some food items were also found to have different micronutrient contents
depending on the variety [e.g. 1 cup red bell peppers (higher in vitamins A, C, and E) vs. green
peppers; 1 cup white beans (higher calcium, potassium, and zinc) vs. black beans], and where
appropriate, the most nutrient dense variety was selected for the Super-menu. Other strategies to
increase nutrient density included use of yogurt or milk (higher vitamin D and calcium) to
replace water, and cooking methods that maximized micronutrient content (e.g. steaming, re-
using water that vegetables have been boiled in etc.). An iterative process was used to create
these menus involving food/recipe definition, nutrient analysis, consideration of portion size,
volume and calories, and subsequent refinement of recipes (recipes and the Super-menu are
available from the authors). Consideration was given to having vegetarian options. Ingredients
used to increase micronutrient content of recipes are shown (Table 14). Five daily menus were
created to demonstrate the variety that could be achieved in menu planning.
Data analysis
Data were analyzed using SPSS (version 22, SPSS Inc., Chicago, IL, 2013). Descriptive
statistics per home and across homes were summarized. Multivariate analysis of variance

130
(MANOVA) was used to detect significant differences among homes. Statistical significance
was set at p<0.01 to account for the multiple tests performed. A two-tailed t-test was performed
to analyze differences between Homes’ menus (n=35) and Super-menus (n=5), with statistical
significance set at p<0.05.
7.3 Results
Current long-term care menus: Micronutrients and food group servings
Significant differences existed for nutrient levels determined from menus across the
homes (Table 14). Between-home means were significantly different for calories, riboflavin,
niacin, pantothenic acid, folate, calcium, magnesium, phosphorus, potassium selenium, and zinc
(p<0.01). Home E had the highest caloric and protein contents, and the fewest micronutrients
below RDA. However, caloric content did not always relate consistently to micronutrient
content, as Home C met most RDAs despite having the lowest-calorie menu. Homes A and D
had the second and third highest caloric content, respectively, but both had the same number of
micronutrients below RDA. Home E micronutrient means were the most significantly different
from all other Homes (p<0.01). Vitamin E levels fluctuated pending the inclusion of butter/fat at
meals. When averaged over the entire week, none of the five homes met CFG recommendations
for Grain Products; an average of 4-6 servings grain products were provided per day. Some
homes were also below CFG recommendations for Vegetables and Fruits (1/5 below
recommendation), Milk products (3/5 below recommendations), and Meat products (1/5 below
recommendations) (data not shown). When analysis across home menus was averaged, vitamins
D and E were below 50% of RDA/AI, and folate, magnesium (males only), and potassium were
50-75% below (Table 15).

131
Super-menus
Super-menus met recommendations for most micronutrients, and were closer to meeting
recommendations for D, E, and potassium than current LTC menus (Table 15, Figure 6).
Volumes and caloric content of foods served on Super-menus could not be reduced if the menu
was to meet the RDAs, especially when attempting to meet vitamin D recommendations.
Statistically significant differences between Home menus and Super-menus were seen with fibre,
niacin, folate, vitamin E, calcium, iron, magnesium, phosphorus, potassium, sodium, and zinc.
7.4 Discussion
Current long-term care menus
This study provides a flavor of the micronutrient content of current Canadian LTC menus
and a more comprehensive analysis than conducted to date (5,48). Previous studies have
examined specific macronutrients (55) or multi-nutrient contents of Canadian LTC menus from
single provinces (5,19,25,48,70), and emphasized the need and challenges of providing
micronutrient-adequate menus. To our knowledge, this is the first study to examine micronutrient
contents of menus from more than one province, and to attempt a food-first strategy to meet
recommendations with a Super-menu.
Planning for Home menus was based on CFG recommendations and generally met these
recommendations, yet average micronutrient contents varied among homes. Calcium intake was
one of the few nutrients met in all homes and achieved by providing milk at every meal.
Interestingly, the current menus demonstrate the potential of increasing nutrient density without
increasing calories, as some homes with lower-calorie menus met more micronutrient needs than

132
homes with higher-calorie menus. Yet, Vitamins D and E were consistently low in planned
menus for all homes and the RDA was also not achieved in the Super menu. As vitamin D
guidelines recommend supplementation of all residents to prevent falls (330), there is less
concern about the inadequacy of this vitamin in the current planned menus or the Super menu.
These findings demonstrate that current planning guidelines alone are inadequate to
address micronutrient needs, and more nutrient-dense strategies need to be explored in LTC
(5,147) for key nutrients. Super-menus could not meet vitamin E and potassium requirements
and other food-first strategies such as fortification may be required. The reality however, is that
even with a menu meeting micronutrient requirements, intake is commonly poor in LTC
(5,21,24,48). Menu planning is only one strategy to prevent malnutrition in this setting;
mealtime eating assistance (203,331,332) or improving dining environments (333,334) are other
potential strategies.
Super-menus
The exercise of developing super-menus presents several practice implications. Regular
incorporation of herbs and spices to recipes not only enhances flavor, but can increase nutritional
quality as they provide high levels of micronutrients in small quantities. It is also necessary to
consider the micronutrient content of food variants, as subtle differences (e.g. black vs white
beans) could mean substantial differences in nutrient density. Awareness of micronutrient
content of ingredients may help menu planners choose higher micronutrient substitutes and
create more nutrient-dense recipes. Education and training on the preparation and cooking
methods that maximize micronutrient content may further help to improve LTC menus. This

133
analysis identified that almost all nutrient recommendations can be met with modest adjustments
in menu planning.
Unfortunately, the devised super-menus were not lower in calories or food volume as
compared to the original menus assessed. Reasons for not decreasing food volume with super-
menus was the attempt to provide sufficient vitamin D (milk, eggs) potassium (vegetable and
fruits); and vitamin E sources (nut butter, margarine), which led to increased calories.
Home menus are the main source of most micronutrients for LTC residents. The use of
CFG with DRI recommendations, along with periodic examination of micronutrient components
of food through nutrient analysis with CNF, will help homes to develop menus that meet most
micronutrient recommendations. This process has demonstrated that it is feasible to improve the
nutrient content of menus, but that investment in the process is required. Food funding continues
to be an barrier to providing higher quality food in LTC for Canada (335). Moreover, Homes
need to have nutrient analysis programs available and provide sufficient resources to complete
the complex steps required to produce a menu with recipes that are acceptable to residents
7.5 Strengths and Limitations
A limitation of this study was that, no homes were from corporate groups and although
requested they did not participate, potentially due to proprietary concerns. Corporate homes
potentially have greater resources for nutrient analysis, which could lead to more nutrient dense
menus. Additionally, only five menus were analyzed, representing four provinces. This is not a
sufficient analysis to fully characterize Canadian LTC menus but is more comprehensive that
studies to date (5,48,70). As compared to prior work, this study has several strengths including
multiple menus used in analysis, across several provinces and the review of finalized recipes and

134
confirmation of analysis by the Homes’ dietitians and/or nutrition managers. Furthermore,
several steps were taken to ensure an accurate analysis such as comparison of ESHA results with
eatTracker. Limitations for super-menus are that, while they were higher in micronutrients, these
recipes have neither been trialed in LTC production kitchens, nor tasted by residents. Thus,
feasibility in production and acceptability by residents have yet to be determined. Assessing cost
of recipes is also necessary to demonstrate feasibility for use of super-menus within the
constraints of raw food budgets for LTC. This analysis was not possible in this study as Homes
and food distribution companies contacted did not provide the authors with a purchasing list.
Relevance to Practice
Menus are only one area to consider when trying to improve the nutritional status of older adults
living in LTC. Based on this analysis, most micronutrient recommendations can be met with
deliberate menu planning. Menu planning is complex and homes need to invest in training and
development of nutrient dense menus. For those nutrients difficult to achieve through menu
planning alone, supplementation (e.g. Vit D) or fortification (e.g Vit E, potassium) may be
indicated.

135
Figure 6. Comparison of LTC vs Super-Menus in meeting RDA/AIs for Vitamins D, E, and
Potassium
8.911.2
0
5
10
15
20
Vitam
in D
(µ
g)
Daily Vitamin D Provision: Current vs Super-Menus
Home Avg Super Menu
5.13
12.6
0
3
6
9
12
15
Vitam
in E
(m
g)
Daily Vitamin E Provision: Current vs Super-Menus
Home Avg Super-Menu
2854
4018
0
500
1000
1500
2000
2500
3000
3500
4000
4500
5000
Pota
ssiu
m (m
g)
Daily Potassium Provision: Current vs Super-Menus
Home Avg Super Menu
RDA (15 mg)
AI (4700 mg)
RDA (20 µg)

136
Chapter 8
Acceptability of Strategy: Webinar Focus Groups, Resident Focus Groups, and
Key Informant Interviews
I.T.Y. LAM1 , H.H. KELLER1 , L.M. DUIZER2 , K.D. STARK1, A.M. DUNCAN3
1. Department of Kinesiology, University of Waterloo, Waterloo, ON, Canada; 2. Department of
Food Science, University of Guelph, Guelph, ON, Canada, 3. Department of Human Health and
Nutritional Sciences, University of Guelph, Guelph, ON, Canada
Abstract
Purpose: Malnutrition is common in long-term care (LTC) residents, yet limited research exists
on micronutrient deficiencies. Objective: This study used qualitative methods to explore the
acceptability of a food-first micronutrient fortification strategy for LTC. Design & participants:
Webinar focus groups are a novel method of conducting online focus groups, similar to a
teleconference, to allow for the real-time, immediate response of traditional focus groups,
without the physical presence and the need to travel, as was appropriate for this nation-wide
study. Eleven staff webinar focus groups (n=45), expert key informant interviews (n=10), and
five in-person family/resident focus groups (n=71) were conducted. Results: Stakeholders
provided insight into benefits, concerns and potential solutions to minimize barriers and promote
adherence to the strategy. Suggested solutions included development of outsourced/pre-made
fortified products, mandatory training and clear protocols. Stakeholders can envision food
fortification as a strategy to improve micronutrient status if products are easy to access and
incorporate into current production systems. Yet, residents and families wish to be informed and
have the potential to ‘opt out’. Safety and efficacy also needs to be demonstrated before it is
incorporated into standard practice. Conclusion: This work provides a strong foundation for
developing a proof-of-concept micronutrient food fortification study for the prevention of
deficiencies in LTC.
(A portion of this work has been accepted for publication in the Journal of Nursing Home
Research Sciences on September 4, 2014)

137
8.1 Introduction
Micronutrient (vitamin/mineral) deficiency is a prevalent yet preventable form of
malnutrition among older adults living in long-term care (LTC) (5,20,21,199). Plate waste
estimation suggests that approximately 1600 kilocalories is consumed (14), with even lower
consumption by cognitively impaired residents (~1,100 to 1,200 kcal per day) (5). As menus are
typically planned to meet 100% of residents’ micronutrient needs, some residents may not meet
their requirement due to low food intake (5). Little intervention research has been conducted on
the prevention of micronutrient malnutrition in LTC (26).
Micronutrient deficiencies are often treated with strategies such as oral nutrition
supplements (ONS) which attempt to ameliorate overall intake (5,336). However, waiting for
signs of sufficiently low intake to stimulate this strategy means that subclinical deficiency is
overlooked. Moreover, there are possible compensatory reductions in food intake at subsequent
meals after ONS consumption, making the supplement a ‘replacement’ to regular food intake
(260,337). Low adherence to ONS further reduces their long-term use (273–275). Micronutrient
pills, although potentially preventative, are also used reactively (271). The risk of drug-nutrient
interactions when administering vitamin/mineral pills (14), lack of coverage by drug benefit
plans (338) and out-of-pocket costs for residents (119,278) are reasons for limited used in LTC.
Research suggests that families (270,339) and providers (108,271) prefer a ‘food-first’ approach
to address nutrition problems (5,21). Enriched/fortified foods have been proposed as such an
approach (107,108). Most fortification practices focus on protein, which can be increased with
naturally high foods (e.g. milk, eggs, or cheese) (107) or supplements (108) added to selected
foods. While these strategies appear to improve energy and protein intake (109), these enhanced
foods typically do not focus on improving micronutrient intake (107).

138
At present, there is no consensus on best methods for prevention of micronutrient
malnutrition in LTC residents (26). In view of residents’ average low food intake (5,27) and the
recommended micronutrient levels to achieve nutritional adequacy (5,28), micronutrient
fortification of key foods is a potential solution (29), yet has been rarely conducted and research
to date does not identify best practices. This strategy is especially relevant for residents with
insufficient nutrient intake but a stable body weight due to low levels of activity and energy
requirement (19,26).
Assessment of the acceptability and feasibility of a new intervention should be done with
end users prior to implementation, especially when the strategy requires changes in care
processes (121). Determining the acceptability of micronutrient fortification with stakeholders
who are closely aligned with planning, purchasing, preparing and serving food (dietitians,
nutrition managers, cooks), will enhance understanding of barriers to implementation of this
strategy. To date, there is minimal documentation on staff’s perspective on food fortification in
LTC. Further, few studies have examined residents’ and family members’ views of nutrition
provision in LTC (270,339). Multiple perspectives of knowledge users will enhance our
understanding of the acceptability of this strategy and will allow for triangulation of perspectives
(136).
The purpose of this study was to determine the acceptability of a fortification strategy in
LTC and to further develop the concept of this strategy based on diverse stakeholder input (e.g.
instructions and protocols, the most appropriate foods for fortification, etc.). Specifically,
knowledge users were asked to reflect on the potential of micronutrient food fortification, and
identify their concerns and potential solutions when considering food production, delivery and
consumption.

139
8.2 Methods
Three stakeholder groups verified the acceptability of fortification of food in LTC: staff,
expert key informants (KI), and LTC residents and families. Webinar focus groups were
conducted with frontline nutrition staff, providing insight into both clinical and production issues
with micronutrient fortification. Webinar focus groups allow for the real-time, immediate
response of traditional focus groups, similar to teleconference systems, without the physical
presence and the need to travel (160). Webinars have been previously used for training of staff
(161) and students (162,163) and were thus considered a viable option for conduct of these focus
groups. Online focus groups were conducted with webinar technology (WebEx™, Santa Clara,
CA)), a program that allows for teleconferencing at the same time as presentation on the internet
(164).The webinar format traversed geographical barriers and allowed participants to join
regardless of time zone or location. From the webinars, a number of participants who were
knowledgeable on topics of interest (i.e. had conducted fortification) were identified and invited
for individual in-depth KI interviews, along with additional KIs who were experts (e.g.
government, food industry). Recognizing that webinar and KI informants were generally in
favour of a fortification strategy, resident and families’ views were ascertained via in-person
focus groups. This study underwent ethical review and clearance by the Office of Research
Ethics at the University of Waterloo (Ethics review #: 18558).
Webinar Focus Groups
Focus groups gather individual and interactive opinion and attitudes through a carefully
planned framework of questions and discussions (159). The group format allows for interactions
and discussions among participants and can contribute to further development of ideas and

140
concepts (159). On-line webinar technology offers the opportunity for on-screen presentations,
group discussions, and immediate polling questions to engage all participants. Lower numbers of
participants were recommended for online synchronous (real-time sharing) focus groups (165).
Thus, several small focus groups (3-7 participants) were scheduled and conducted. The target
participants were dietitians, nutrition managers and chefs working in LTC recruited through the
Dietitians of Canada Gerontology Network and the Canadian Society of Nutrition Management
(CSNM). Interested participants were sent an invitation e-mail containing: a detailed information
letter outlining the purpose of the study and process, instructions to register, and a link to a pre-
session online registration survey to collect pertinent demographics. Snowball sampling was also
employed; participants of the initial webinars were ask to suggest potential further participants.
An advisory committee consisting of experts from the Universities of Waterloo and
Guelph helped develop and review focus group discussion and polling questions. Open-ended
questions with additional probes were used as a guideline to solicit information and discussion
(167). Polling questions examined nutrients of concern for residents, current strategies used to
address micronutrient needs, and participants’ ratings on the appropriateness, feasibility and
potential effectiveness of a micronutrient fortification strategy.
One-hour focus groups were conducted with WebEx™; initial sessions were conducted
by the first two authors. Sessions were recorded to allow for transcription of the discussion.
After the webinar, participants were emailed a link to a feedback form, which allowed them to
provide further comments on the topic as well as to rate their experience with the webinar format
and technology.

141
Key Informant Interviews
KI interviews provided more in-depth information addressing questions with respect to
the feasibility of the developing strategy that arose from the webinar focus groups. The advisory
committee provided recommendations on various stakeholder groups whose insight and opinion
on the potential strategy was desirable. Ten KIs were recruited by the primary author via email
and those interested in participating were sent an information letter outlining the expectations for
an interview and the study process. Individual KI interviews were conducted by the second
author and the primary author took notes. A question outline was used to guide the interview.
Sessions were conducted by telephone and digitally recorded for subsequent transcription.
Verbal consent was obtained at the start of each session; interviews lasted approximately 45
minutes to 1 hour.
In-person Resident/Family Focus Groups
In-person focus groups were conducted at five LTC homes to obtain the opinions of
family members and residents. Due to geographic constraints, only sites within an hour of the
University of Waterloo were recruited. Initial contact was made by phone or email to nutrition
management/dietitians to determine interest. Recruitment posters/letters were provided to notify
potential participants of upcoming sessions. Group discussions were scheduled at the routine
resident/family council/food committee meetings and a 20-30 minute time slot was allotted to the
discussion. As a result, staff members were also present, although their opinions were not
elicited; they acted as supports to the researchers for completing consent forms and helping with
hearing impaired individuals.

142
Participants signed consent forms prior to the session and completed an anonymous
feedback questionnaire on benefits and concerns about the strategy at the end of the session.
This provided the opportunity to capture afterthoughts, as not all participants spoke during the
discussion. These sessions were not audio recorded to keep the discussion informal and allay any
concerns about confidentiality of the information, as well as challenges with soft-spoken
participants on the digital recording. Extensive notes were taken by one of the two researchers
present.
Data Analysis and Interpretation
Debriefing occurred after each focus group and KI interview between the first and second
author to discuss overall impressions, key points, main areas of agreement or disagreement, and
new data that resulted from each session (187). All webinar focus groups and KI interviews were
transcribed verbatim prior to analysis, with identifiable information removed. Inductive content
analysis was used to identify common points or concepts, patterns, and variations (185). This
was the chosen analysis method, as this study aimed to explore the broad scope of the issue of
fortification as a strategy. The first author and a student researcher each reviewed and coded half
of the transcripts to complete an initial overview of the data using open coding (186). A code
book was subsequently developed by the first two authors and the student researcher to assist
with organization and categorization of the data (187,188). All transcripts were recoded after the
development of the code book using selective coding. Exemplary quotes were identified. Memos
were written throughout the analysis process to adjust and finalize the analysis.
Data from pre-session registration surveys, online polling questions, and post-session
questionnaires were summarized and interpreted with descriptive quantitative analysis, and

143
where appropriate, supplemented with qualitative data. Other results not amenable to being
counted were descriptively summarized with minimal interpretation (e.g. long-answer questions
from feedback questionnaires) (159,187) and are presented as key concepts that address the
purpose of the study; specifically i) concerns with micronutrient intake, ii) reflections on current
strategies, iii) appropriateness of fortification, iv) promoting feasibility, v) determining
effectiveness, and vi) overall acceptability of the strategy. Data from the three groups of diverse
stakeholders is integrated under each key concept demonstrating triangulation and thus validity
and credibility of results (187,188).
8.3 Results
Eleven webinar focus groups were conducted between March and April 2013, 10 KI
interviews from July to August 2013, and five in-person resident/family focus groups between
July 2013 and January 2014 (Table 16). All webinar and all but one key informant participant
were female (Table 16), as there is a gender inequality in the LTC sector and nutrition-related
professions (340). The majority of KI and webinar participants were dietitians. There was an
even mix of gender and roles (i.e. family members, residents) for in-person family/resident focus
groups. Shared key concepts are described below. Longer exemplar quotes are seen in Table 17.
Concern about the intake of micronutrients in LTC residents
Polling results during webinars indicated that there was concern about nutrient intake in
LTC residents, and specifically vitamin D, calcium, vitamin B12, and zinc (Figure 7). Webinar
and KI participants associated certain micronutrients to specific food groups (e.g. vitamin D and
calcium with dairy, thiamin with grains, magnesium with vegetables); low intake of these food

144
groups were suggested as reasons for concern. Dietitians noted micronutrients that were
commonly prescribed for residents, in particular, vitamins B12 and D.
In addition to low intake, staff recognized inadequate provision by menus for certain
micronutrients; Vitamin D was “a gap” (Registered Dietitian [RD]20) and “menus [were] not
adequate” (RD22). A dietitian from a home that performed nutrient analysis found that the DRI
for potassium was particularly difficult to meet, “due to the amount of food” and “the way
[residents] eat” (RD33). Research findings were also reasons cited by dietitians for focusing on
vitamin B12 (RD17) and D (RD16). Physiological changes with age, low intake, and low
biochemical values were among the reasons noted by participants for why micronutrient
fortification might be appropriate for LTC residents
Conversely, certain micronutrients were identified to be problematic for a home-wide
fortification strategy due to contraindications for health conditions or fear of toxicity. This
included potassium and phosphorus for renal conditions (Nutrition Manager [NM]5), long-term
zinc supplementation affecting absorption of other nutrients (RD20), and potential toxic
accumulation of fat-soluble vitamins (RD6). Of particular interest was calcium, where staff
hesitated to supplement due to recent changes to remove calcium supplements from residents’
medication lists (Family Council [FC]3 staff) as a result of potential increased cardiovascular
risk. Accordingly, staff was wary of supplementing calcium outside of food sources and
preferred to treat calcium on an “individual basis, depending on dietary intake” (RD20).
Reflections on current strategies
Current practices were mentioned as a barrier to provision of adequate micronutrients
from food for older adults. For instance, menu planning currently focuses on macronutrients,

145
with the assumption that micronutrients would be met in the process (RD16, RD17 – Table 2.A1,
A2). Moreover, certain homes may not be equipped to do micronutrient analysis of menus and
homes with pre-analyzed menus “don’t know how accurate it is” (RD17). Miscommunication
between guidelines and practice may also be a barrier. For instance, LTC homes may plan menus
to the Food Guide, focusing on quantity of food to meet food guide servings (Key Informant
[KI]4 – Corporate LTC Menu Planner – Table 2.B), when the original intent of this guidance
from the government was to provide a variety of food (KI7 – Ministry of Health personnel –
Table 17). This demonstrates a need for good knowledge translation when implementing
strategies into practice.
Pills were the most common strategy described to address potential micronutrient
deficiencies, yet this was unsatisfactory to many participants. Provision of nutrients in pill-form
“appears medicinal in nature” (RD28) rather than food. Additionally, the shift to “reduce
polypharmacy” (RD26, NM36) in LTC meant physicians were “quite reluctant to supplement
with a multivitamin” (RD15). Potential costs incurred to residents for pills not covered by drug
benefit programs and the difficulty in finding a single supplement providing complete
micronutrients for older adult were also mentioned. Staff noted that use of oral nutritional
supplements (ONS) could reduce intake at subsequent meals and may not provide other nutrients
that food does (NM36). The process of ONS administration was also noted as redundant and
reactive (KI2, Health and Marketing Specialist for Food Supplier).
Interestingly, some participants preferred provision of ONS as a combined “top up”
(RD22) approach that provided calories, protein, and fluids plus micronutrients. One family
member preferred administration of vitamins for its accuracy and simplicity for tracking
(Family/Resident Council [FRC]2). Overall, LTC homes have strategies to address nutrient

146
needs and low food intake, yet these may not be micronutrient-specific, are more medical than
food in nature, and compliance remains an issue, leaving room for alternative food-first
micronutrient strategies in LTC.
Appropriateness of a fortification strategy
When considering if fortification of common foods was appropriate in the current LTC
system, cost was “one of the biggest barriers…” (KI1, Industry Brand Manager). The given food
budget and cost of food meant that any new strategy had to be cost-effective for acceptance
within the industry. Precision is needed for micronutrient dosages. Participants were also
concerned with staff’s ability and accuracy in adding fortificant to selected foods in-house (KI5 –
Culinary expert), noting current compliance issues with supplemental protein and thickeners due
to misinterpreted instructions and lack of time (NM36). To be appropriate, the fortification
strategy would need to be easy to implement with an accurate, foolproof procedure for staff to
follow (RD17).
Further concerns for appropriateness included the classification of fortified products as
food or as medications, which had implications on the personnel providing the product. Since
most dietary staff and health care aides providing assistance at meals have minimal training, the
potential for errors with in-house fortification of food products was a noted limitation (RD9).
Hence, some webinar and KI participants identified that an outsourced product would be the best
approach to promote consistency and safety. Staff was concerned with “too much…fat-soluble
[vitamins]” (RD6). Family members were also concerned with the risk of toxicity for residents
with good appetites who may consume extra portions (FC4). Thus dosage and procedures for
daily use would need to be clearly defined and monitored.

147
For residents, taste was a top priority. Residents noted taste changes with age and were
concerned fortification could change tastes of favourite foods (Resident Council [RC]1). Family
members were also concerned that taste alterations with fortification may further limit intake for
persons with dementia who were picky eaters (FRC2). Family/resident councils thought
fortification was a good strategy but if implementation meant that other activities (e.g. staff
providing eating assistance) would be jeopardized, than they stated that, “fortifying foods would
go on the back burner” (FRC5). Other family members noted that fortification would not be
enough to meet the needs of some highly vulnerable residents who consume very low volumes of
food (Family/Resident Council (FRC) 2). The desire for choice was voiced by residents and
family who wanted the decision to voluntarily opt out of consuming fortified foods (RC1).
Findings suggest that a flexible approach to fortification, with variety in food products and
ensuring that sensory qualities are maintained are necessary for stakeholders to consider the
strategy as appropriate for LTC.
Overall, the participants appeared to find the strategy acceptable. Over half provided a
rating of 4 (n=17 of 40; 43%) or 5 (n=6), the maximum score, for the appropriateness of in-house
fortification as a strategy to improve micronutrient intake. Appropriateness of outsourced
fortified food was similar where the majority of participants provided a rating of 4 (n=13 of 31;
42%) or 5 (n=6) (Note: totals are different as appropriateness of outsourced fortification was
added after webinar session 3). Understandably, all participant groups requested additional
evidence of effectiveness of the fortification strategy, including improvements in serum markers
of nutrients, and assurance of no taste changes so as to be convinced of the appropriateness of a
fortification strategy.
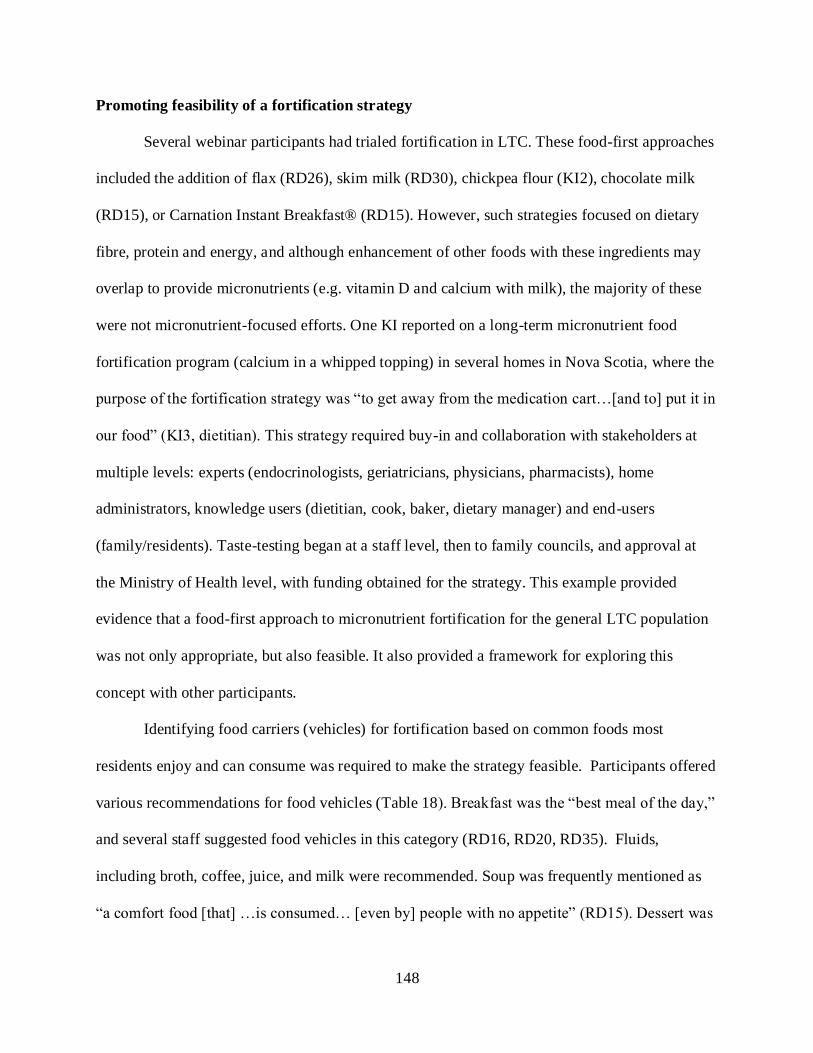
148
Promoting feasibility of a fortification strategy
Several webinar participants had trialed fortification in LTC. These food-first approaches
included the addition of flax (RD26), skim milk (RD30), chickpea flour (KI2), chocolate milk
(RD15), or Carnation Instant Breakfast® (RD15). However, such strategies focused on dietary
fibre, protein and energy, and although enhancement of other foods with these ingredients may
overlap to provide micronutrients (e.g. vitamin D and calcium with milk), the majority of these
were not micronutrient-focused efforts. One KI reported on a long-term micronutrient food
fortification program (calcium in a whipped topping) in several homes in Nova Scotia, where the
purpose of the fortification strategy was “to get away from the medication cart…[and to] put it in
our food” (KI3, dietitian). This strategy required buy-in and collaboration with stakeholders at
multiple levels: experts (endocrinologists, geriatricians, physicians, pharmacists), home
administrators, knowledge users (dietitian, cook, baker, dietary manager) and end-users
(family/residents). Taste-testing began at a staff level, then to family councils, and approval at
the Ministry of Health level, with funding obtained for the strategy. This example provided
evidence that a food-first approach to micronutrient fortification for the general LTC population
was not only appropriate, but also feasible. It also provided a framework for exploring this
concept with other participants.
Identifying food carriers (vehicles) for fortification based on common foods most
residents enjoy and can consume was required to make the strategy feasible. Participants offered
various recommendations for food vehicles (Table 18). Breakfast was the “best meal of the day,”
and several staff suggested food vehicles in this category (RD16, RD20, RD35). Fluids,
including broth, coffee, juice, and milk were recommended. Soup was frequently mentioned as
“a comfort food [that] …is consumed… [even by] people with no appetite” (RD15). Dessert was

149
the most common suggestion among participants. Ice-cream was suggested as “number one on
[residents’ preference] list,” and is preferred across various cultural groups and diets (KI4).
Condiments and toppings were also suggested for their small, pre-measured packages and
versatility for use with different foods. Participants suggested the aforementioned foods vehicles
over entrees (e.g. meats or vegetables) for ease of incorporation (KI4). Overall, staff preferred
foods addressing different texture needs (e.g. puddings, oatmeal, mashed potatoes). “Variation”
(KI5) of food vehicles or a “multipurpose item” (KI2) are also needed” “to prevent resident
boredom” (KI3) and “maximize the opportunity to consume” [foods] (KI7).
Strategies for in-house fortification included provision of clear protocols and
incorporating fortification into part of the recipe (RD28). A systematic framework of the food
fortification process, from assessment to monitoring, along with clear direction and assignment
of roles (KI7). Involvement of staff and stakeholders at multiple levels to increase resident and
family’s awareness of the need for micronutrients and to help them make informed decisions was
noted across participant groups as a means to increase adherence (NM5). Due to these feasibility
concerns with in-house production, outsourcing a food that was fortified was seen as a preferred
option to minimize time required to prepare the product, and to ensure consistency.
Determining the potential effectiveness of a fortification strategy
Staff webinar participants rated the overall potential effectiveness of the micronutrient
fortification strategy in meeting residents’ needs on a 5-point Likert scale (5=very much).
Participants agreed that the concept of the strategy could be effective (rating of 4 (n=17 of 39
responses) or were neutral about the strategy (rating of 3 (n=11)). [Note: if two or more
participants were on the same phone line/computer station for the call, only one response was

150
possible]. However, participants expressed the difficulty in determining the effectiveness of the
strategy without full knowledge of the content and format of the final product (NM36).
Cost was a barrier that could affect the appropriateness of the strategy for LTC and
participants suggested that it was necessary to show that benefits outweighed the cost (KI1).
Family members also requested evidence of effectiveness of the strategy through research, and
testing of residents’ serum micronutrient levels to demonstrate need and improvements with this
strategy. Likewise, they mentioned that funding could be “prohibitive [for the strategy] due to
budget constraints” (FRC2). Although preference of pills over food was uncommon, it suggests
the need to address and overcome administration, tracking and monitoring issues with
micronutrient food fortification.
Residents valued that the strategy may “improve [residents’] quality of life” (RC3), yet
additional factors, including ethical issues with palliative residents, still need to be addressed
before effectiveness could be fully determined (FC4). At this point, participants viewed food
fortification as a potentially effective concept to address micronutrient malnutrition in LTC, but
more development and proof-of-concept research is required before effectiveness can be
accurately assessed.
Overall acceptance of a fortification strategy
Participants generally supported the concept of micronutrient food fortification as a
potentially effective, food-first strategy to address micronutrient deficiencies, stating that “trying
to use real foods [is their] preference to a supplement” (NM36). Feedback questionnaires from
24 residents and family members rated the overall acceptability of the strategy on a 5-point

151
Likert scale (5 = very much); the majority rated the strategy as 4 (n=10) or 5(n=8). Family
members welcomed a strategy that enhanced the nutrient profile of LTC meals (FRC2).
Staff stated that “to add [micronutrients] to foods that residents enjoy eating” would be a
“better accepted” strategy (RD26) than current strategies. At the very least, participants thought
this provided “a good alternative (FC4)” to current LTC strategies used to address micronutrient
deficiencies. Participants also saw the benefits of increasing residents’ food and nutrient intake,
even in small amounts (NM3, NM36). In sum, the strongest benefit of micronutrient food
fortification was its long-term, cumulative effect rather than immediate impact:
I can’t predict they’re going to get 100% of it. But I can… predict if I give it consistently
daily, it adds to their nutrient intake. So it works! …We’ve had falls, and…a significant
reduction in broken bones! So something’s workin’. (KI3, RD with food fortification
experience)
Much work needs to be done to solidify this fortification strategy, yet findings from this study
confirm that a food-first strategy addressing micronutrient needs is a “move in the right
direction” (Chef7).
8.4 Discussion
Fortification has been noted as a potential cost-effective, long-term strategy to address
micronutrient deficiencies in vulnerable groups with known low intake (341). Ongoing concerns
about population-wide food fortification has been documented, ranging from differences in
individual absorptive ability and needs (342), to public health issues of appropriateness and
availability of fortified foods (343), to changes in food properties due to reactions with more
effective but reactive forms of these micronutrients (344). Food fortification using micronutrients

152
specific to LTC residents’ needs is a novel approach, where the objective is to provide a low-
level dosage to prevent or delay long-term complications (similar to a multivitamin), rather than
provide short-term or immediate reversal of a micronutrient deficiency. This study aimed to
determine acceptance of a potential food fortification strategy from the perspectives of various
stakeholders, and to gather feedback to inform this strategy. Due to the novelty of this approach,
little prior research is available for comparison and required participants to assess the concept in
an abstract stage of its development.
Previous work has examined pre-made (112,115) and home-produced fortified products
(119) in LTC. These studies considered some issues such as sensory changes (119),
appropriateness of texture (119) and food habits and preferences of residents (116), areas of
consideration consistent with this research. Potential food vehicles mentioned by our
participants were also similar to those used in previous studies, which included condiments (e.g.
butter) (116), beverages (e.g. juice, milk) (117,301), snacks (e.g. cheese) (115), sides (e.g. bun)
(112) and entrées (119). Yet the complexity of food fortification identified in this study,
especially the process and procedural considerations required, have not been discussed in prior
research. Efficacy of selected micronutrient fortification has been demonstrated (112,115–
117,119,301) and examined using vitamin-only preparations (119) or targeted to specific health
conditions (112), but effectiveness of a population-wide fortification strategy using many
micronutrients is still required. Given the known low food intake in LTC (19,21), and potential
inadequate micronutrient contents of LTC menus (5), this strategy is logical. However, the LTC
setting may require a separate assessment when considering these issues. This study has provided
a foundation for development of such a strategy. Specifically, the desire for residents to be

153
informed of the micronutrients chosen in the fortification formula was voiced by all participant
groups, demonstrating the value in acceptability testing with knowledge and end-users.
This study used multiple methods to gather input from diverse participants and is the first
published report focused on acceptability testing of a food-related intervention for LTC; yet it
had some challenges and limitations. Online focus groups in the literature are largely done as
chat-forums (160) and lack the immediate feedback component that in-person focus groups
provide (161). Webinar focus groups are an innovative technique for research, allowing for real-
time conference and voice discussions, while facilitating ease of participation for those in
geographically separate locations. One suggestion for future studies using webinar focus groups
is to limit group size to 3-5 participants to promote participation in the discussion and reduce
crosstalk. Focus groups with similar participant composition (e.g. all dietitians) may minimize
power imbalance and allow participants to speak more openly (159). Voice-only webinars may
be beneficial as webinars may be seen as less threatening than face-to-face, providing a sense of
detachment/remoteness that allows participant to freely divulge information (165,345).
Participants provided feedback on the webinar technology, process and content through an
anonymous feedback questionnaire. Participants’ main concerns were regarding voice
delay/overlaps. Suggestions for improvement included: using phones over computers (better
clarity), including type-in chatting (to capture all comments), having test/practice sessions, and
additional cueing/direction from facilitators. The high level of response for these questionnaires
(84%, n = 38/45 – data not shown) suggested a high level of engagement in the webinars. Focus
groups with LTC residents had some challenges, as many residents had functional and cognitive
deficits, and at least one staff member was present to help facilitate the consent process and to
help residents communicate. The inclusion of staff in the room may have affected participants’

154
responses as they may have felt less comfortable reporting issues or concerns. The inclusion of
an anonymous feedback questionnaire offered an extra venue for residents and family to share
their thoughts in a more private manner.
The LTC setting is unique in that the same food is offered to all residents. Thus, it is
essential that the selected food vehicle be well-liked and consumed by all residents for this
strategy to work. Provision of micronutrient-fortified food options at each meal may increase the
likelihood of residents accepting the fortified foods, and the choice of in-house and outsourced
food vehicles to adjust to different LTC’s production systems may facilitate the uptake of this
strategy. Yet an opt-out may still be needed for residents’ potential allergies/intolerances to the
chosen food vehicle, or simply because residents or family wish to do so. More effort is needed
to help residents and family members understand the potential benefits of the strategy through
established efficacy and potential health improvements with the use of micronutrient
fortification. Given the low food consumption in LTC (5,21), it is likely that most will benefit
from a low-level dosage of micronutrients to meet dietary recommendations. Future work should
continue to develop protocols for implementing the strategy, such as whether or not triggers are
needed to direct micronutrient food fortification to target poor eaters in LTC (e.g. if resident eats
<50% of meals consistently, s/he should receive the food vehicle), or whether the current LTC
population-wide approach is still appropriate. A current knowledge gap is an understanding of
food intake over more than one day in a large random sample of residents from diverse LTC
homes to fully understand the potential variation in micronutrient intake. Outsourced products
were preferred as they overcome feasibility issues associated with consistency in preparation and
thus safety, yet any product has to be cost-effective as food budgets are limited in LTC. Finally,

155
once the strategy is developed, creation of effective protocols to train staff, along with tracking
and monitoring residents’ intake of the food vehicle are needed.
8.5 Conclusion
This study provides a comprehensive examination of diverse perspectives on the
possibility of micronutrient food fortification for LTC. Micronutrient food fortification appears
to be acceptable if some considerations are addressed, including development of protocols,
proper education and informing of staff, residents, and family, and exploring alternative
implementation solutions (e.g. outsourcing the product). Proof-of-concept work is needed as well
food sensory evaluations to ensure that taste, texture, smell and colour of food vehicles are not
influenced. Trialing the fortification in actual LTC production systems, and a clinical trial to
provide evidence of benefits of the fortification strategy are also crucial. It is uncertain if this
strategy will surpass, equal, or fall short of current strategies, but participants confirm that it is a
needed area of future research and could be an acceptable strategy. As stated by a resident when
asked about the acceptability of this strategy: “Nothing ventured, nothing gained.”
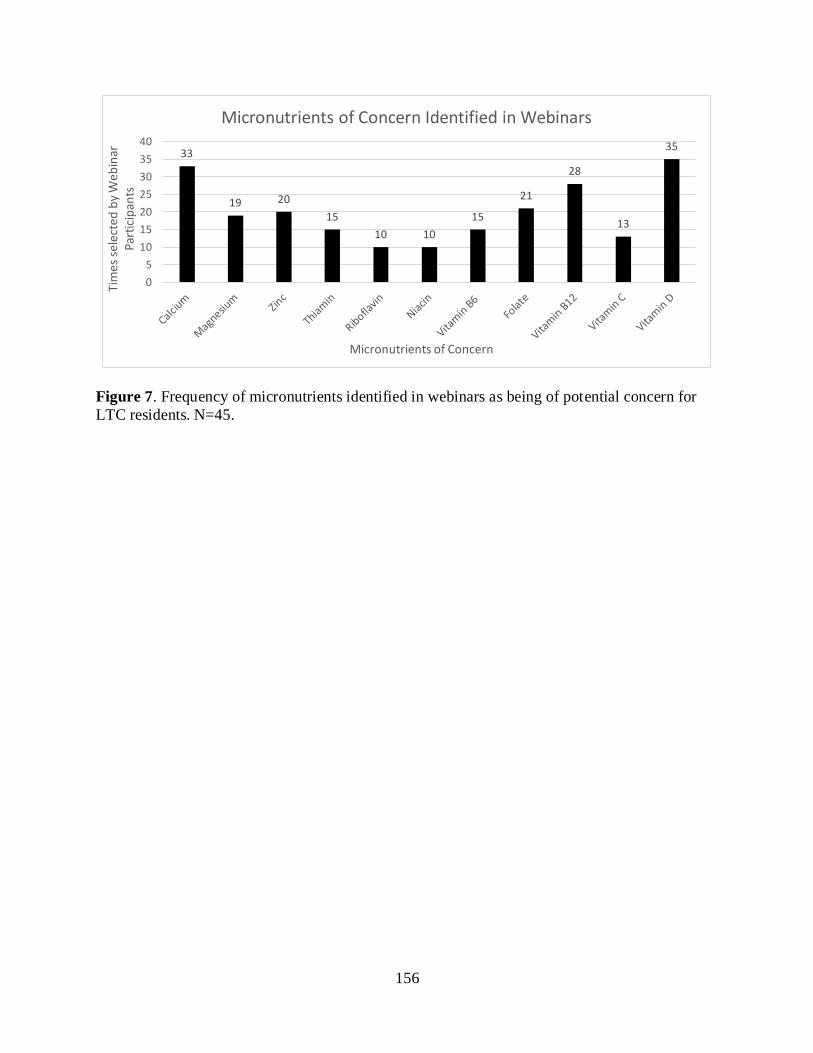
156
Figure 7. Frequency of micronutrients identified in webinars as being of potential concern for
LTC residents. N=45.
33
19 20
15
10 10
15
21
28
13
35
0
5
10
15
20
25
30
35
40
Tim
es s
elec
ted
by
Web
inar
Pa
rtic
ipan
ts
Micronutrients of Concern
Micronutrients of Concern Identified in Webinars

157
Chapter 9
Discussion and Conclusion
9.1 Prior Research
Studies have shown that many factors affect Long-Term Care (LTC) residents’
micronutrient (vitamin and mineral) intake, including challenges with self-feeding, early
satiation, taste changes, dysphagia requiring modified diet textures (27,50), poor dental status
(49), and decreased appetite, rendering them nutritionally vulnerable (13,14,198). Thus,
micronutrient deficiency is purported to be prevalent among older adults living in LTC, yet this
literature is disparate and limited in some areas, especially with respect to interventions
(5,21,199).
Accordingly, this thesis explored the gap in the understanding of micronutrient
malnutrition in LTC, and extended strategies used to improve micronutrient intake. This thesis’
overall objective was to investigate the potential and extent of micronutrient malnutrition in LTC
and identification and development of food-first strategies to improve micronutrient intake. The
four specific research questions that guided this research were:
(1) What is the range of micronutrient intake and status (biomarkers) in LTC from the
literature, and how these ranges compared to standard references to determine the
potential for micronutrient malnutrition?
(2) What feasible and effective non-oral nutritional supplement interventions for
improving micronutrient status were effective in LTC residents?
(3) What is the adequacy of micronutrient provision in LTC menus when compared to
the DRI? Can a food-first menu planning strategy provide sufficient nutrients to meet
residents’ requirements?

158
(4) Is a food fortification strategy considered acceptable by various stakeholder groups?
What provisions are necessary to enhance acceptability?
In this chapter, key findings are explained, compared, and contrasted with prior literature. The
significance of the findings, strengths, and limitations of this thesis are also discussed. Lastly,
implications for future research are made.
9.2 Positioning of Key Findings within Existing Research and Implications of
Research Findings
At the start of this thesis, the candidate recognized that low intake of micronutrients may
be of concern in LTC, given the prevalence of low food intake (5,21), inadequate micronutrient
provision in LTC menus (48,70), as well as frequency of micronutrient supplementation in
practice (58,103). However, careful summarization and examination of the literature on
residents’ micronutrient status based on biomarkers suggests that exposure may be adequate.
Efficacy of supplementation and micronutrient fortification were also examined in this thesis.
While both were able to improve micronutrient intake and certain biomarker statues, it was not
possible to determine whether one strategy was more effective than the other, as different
micronutrient formulations and dosages were trialed. Moreover, simple food-first strategies such
as careful menu planning were able to improve and meet recommendations for most
micronutrients. Thus, the need for micronutrient food fortification in LTC may not be as urgent
as initially thought, and may be more appropriate as a back-up strategy after food-first
interventions have been trialed. The steps taken to inform these decisions are discussed below.

159
Triangulation is a research technique that combines different but complementary sources
of data to answer a particular research question (195). By comparing results from different
methods and data sources, intrinsic weaknesses or biases of an individual method can validate
and/or expand on the other, improving not only the understanding of the research question, but
also the overall credibility and validity of the study (195).
Five types of triangulation were identified by Guion et al. (2011): 1) data triangulation, 2)
investigator triangulation, 3) theory triangulation, 4) methodological triangulation, and 5)
environmental triangulation. The first 4 types of triangulation were used in this thesis. Their
contributions to the findings and overall conclusion are discussed.
Scoping Review-Observational studies (SRO): The scoping review methodology allowed
for mapping and categorization of a disparate literature related to micronutrient food fortification
in the LTC setting. The first scoping review (observational studies) examined micronutrient
intake and status data of LTC residents. Intake studies (e.g. diet histories, food frequency
questionnaires, estimated food records, weighed food records) and studies with biomarker status
were collected. Data was quantitatively analyzed by categories and frequencies of appearance.
From intake studies, this review identified vitamin D, folate, calcium, vitamin E and B6 intake
to be consistently <50% RDA in LTC residents examined. For biomarkers, more than one study
found biomarkers to be below AMA and/or CDC cut-offs for vitamin D, C, folate, and iron. It
is interesting to note that vitamin D and folate were identified by both intake and status studies,
but that the more objective biomarker assessment identified fewer and different micronutrients of
low status for older adults. Biomarkers have been recognized as a more objective method of
assessing dietary consumption and exposure (346). Yet, not all nutrients examined in dietary
status studies were examined with biochemical markers. Specifically biomarker status of vitamin

160
B3, pantothenic acid, biotin, iodine, and manganese were not assessed in any of the identified
citations, and thus it is not known if poor intake transfers to abnormal biochemical status.
Micronutrients where only one citation with biomarkers was found included: vitamins A, D, E,
thiamin, riboflavin; and chloride, copper, potassium and sodium. Magnesium, phosphorus, and
zinc statuses were only assessed by two studies. Hence, of the key issues with biochemical
analysis work to date is the dearth of literature reporting biomarker statuses of nutrients.
Issues with recall bias and estimation errors are weaknesses associated with dietary intake
assessment methods that may make it a less reliable method (31,346). While varying lengths of
dietary assessments were conducted (1 to 21 days), the majority of studies were 3-day weighed
food records (n=5 of 16 WFR, 31%) and 3-day estimated food records (EFR) (n=8 of 11 EFR,
73%). Research has identified that micronutrients require differing lengths (e.g. days) of
assessment to account for dietary variations of consumption to provide an accurate estimate of
intake (231). Interestingly, the suggested number of days to account for dietary variation for
micronutrients all exceed 3 days, with calcium requiring 10, iron 12, and vitamin C requiring 36
days (231). Thus, the accuracy of 3-days of intake for correctly identifying potentially
inadequate intake is questioned. Yet the purpose of an SR is the aggregation of data across
studies and the consistency identified for some nutrients suggests a true deficit in intake as data
cross methods, regions and at risk characteristics or residents.
The use of dietary biomarkers also helps address this concern, as biomarkers are
objective methods of micronutrient status in the body (346,347), and can reflect micronutrient
intake (39,346,347). Of course, biomarkers may reflect both intake and body store levels of
micronutrients, making it difficult to untangle the effects of dietary intake alone (39,347). For
instance, while serum retinol is a reliable measure of vitamin A status, levels do not change until

161
levels of deficiency are reached, and this biomarker is not sensitive to smaller changes (39). In
this review, the one study examining vitamin A status measured serum carotene, which is
affected by non-nutritional factors as well and is thus not specific to intake status (39). This
highlights a key challenge with using biomarkers of nutrients to assess adequacy of intake—
several biomarkers are not sensitive and/or specific. Circulating 25-hydroxyvitamin D
(25(OH)D) is a common measure of vitamin D status, but reflects both dietary intake and skin
synthesis, thus is not specific to intake alone. However, given the nature of LTC residents and
low frequency of sun exposure, this biomarker may be more appropriate for LTC. The other
vitamin D biomarker identified from the studies was 1,25(OH)2D, which is a functional
biomarker and not a status marker. Moreover, it is tightly regulated and levels change based on
kidney function, making it a less useful biomarker for the elderly (39). Thus, even when
micronutrient biomarkers are documented, their appropriateness and accuracy in assessing status
is not guaranteed. However, triangulation of dietary and biomarker data can help identify which
micronutrients are potentially insufficiently consumed by residents in LTC, and have specifically
identified these to be vitamin D and folate.
Scoping Review-Intervention studies (SRI): The second scoping review summarized and
examined the extant literature to determine non-oral nutritional supplement interventions that are
feasible and effective for improving micronutrient status in LTC residents. In particular, this
review found pill-form micronutrient intervention studies to be more common than fortification
intervention studies, with vitamin D and calcium as the most common micronutrients to be
included in both forms of intervention. This was not surprising as these nutrients were identified
to be low in intake (vitamin D, calcium) and biochemical status (vitamin D) by observational
studies, and there is a considerable concern about the functional effects of deficiency, in the form

162
of falls and fractures in residents living in LTC (106,348,349). The repetition of micronutrients
of concern from observational studies that were found in intervention studies confirm that these
are, in fact, micronutrients that residents may be at risk of deficiency for, and supplementation or
fortification interventions may be effective at improving status or decreasing risk of these
micronutrient deficiencies. However, whether fortification or supplementation had higher
efficacy could not be determined, as adherence and compliance likely affects efficacy, yet not all
studies reported on this, and no study compared fortification to supplementation.
Pill form studies examined physiological (i.e., <RDA) (99) and pharmacological levels
(i.e., > RDA) of nutrients (94,205,287,297), while fortification typically only studied
physiological levels (115,117,301). As well, the purpose of fortification was focused on
prevention (117,301), whereas pill studies were sometimes used to correct known or perceived
deficiency (94,205,295). Lower doses in fortification studies may have been due acceptance and
potential taste changes with nutrient levels above the RDA; no fortification study examined
minerals because of this concern. Yet, long-term acceptance and adherence with lower dose
fortified foods may be greater than pill forms. Until such studies are conducted comparing these
forms of intervention, especially for multi-nutrient formulations to combat general low intake,
conclusions about which is more efficacious for prevention of micronutrient deficiencies is
unknown. Certainly, treatment of deficiency is more efficacious with pill forms that can deliver
pharmacological doses.
Menu Analysis (MA) and Super-Menus (SM): As informed by the scoping reviews,
vitamin D and folate were micronutrients of concern for both intake and biomarker status, while
several other micronutrients were low in intake or biomarker status. Interventions also focused
on vitamin D, so it was anticipated that menu analysis would demonstrate provision at levels for

163
this nutrient to be below the RDA. Menus were quantitatively analyzed, and micronutrient
contents were compared to DRI ranges. As anticipated, menu analyses identified vitamin D and
folate levels in menus to be below RDAs for older adults. However, vitamins D (mean 8.90 ±
5.29 µg/d) and E (mean 5.13 ± 1.74 mg/d) were the nutrients consistently lowest across homes,
and supports the SRO findings that vitamin E may also be a potential problem. From SRI
findings, only one citation on vitamin E biomarkers was identified (54), and no AMA or CDC
cut-offs are available to assess biomarker status. Thus, lack of data may lead to a perception that
a micronutrient is not of concern for deficiency when, in fact, the absence of data can lead to this
erroneous conclusion (see Figures 6A and 6B). Nonetheless, magnesium, and potassium (also
identified in SRO) were also below recommendations. These findings verify the need to address
these micronutrients of concern, yet presents another level or area for which to target efforts for
micronutrient enhancement – the menu planning stage. Although low intake is a real issue in
LTC (5,21), this menu analysis revealed that inadequacies in nutrient provision may be an issue
as well. These findings echo those of previous researchers’ with LTC menu analyses who have
documented that LTC menus are not meeting all micronutrient requirements, and have identified
challenges in planning menus that meet recommendations (5,25,48,70).
Thus, to determine whether or not it was possible to develop a food-first, menu planning
strategy that meets micronutrient requirements in LTC, five micronutrient-dense super-menus
were created and analyzed with a nutrient analysis computer program (ESHA Food Processor).
Because of the consistency in findings from the scoping reviews and menu analysis that vitamins
D, E and potassium were low, it was anticipated that these nutrients would be the hardest to
meet. Other nutrients identified in the SRO to be low were not always consistent with the menu
analysis, and it was assumed that these could be met through careful menu planning.

164
Super-menus of equal food volume and caloric level met RDAs for all micronutrients but
vitamin D (11.2 ± 2.54 µg), E (12.6 ± 4.08 mg) and potassium (4018 ± 489 mg). In summary,
while super-menus met recommendations for all but three micronutrients, and were closer to
meeting the DRIs for these than were regular Home menus, findings suggest it is not possible to
meet all micronutrient requirements with food alone without increasing volume of food
provided. Consequently, this leaves room for micronutrient-enhancing strategies beyond natural
food alone, especially to prevent deficiencies in those with low food intake.
Acceptability Testing (AT): The last substudy of the thesis was analyzed quantitatively
and qualitatively. Findings from previous sections have indicated that: micronutrient intake may
be inadequate in LTC and may affect micronutrient status, micronutrient supplementation and
fortification may be effective at improving micronutrient intake and status, and menus’
micronutrient levels could be enhanced by more purposeful planning with higher quality and
micronutrient-dense ingredients. Yet, menu analyses and super-menu findings suggest that not
all micronutrient needs could be met with food alone without an increase in volume. Given the
prevalence of low intake in LTC (19,350,351), other strategies to improve micronutrient intake
are needed. The scoping review on intervention studies identified supplementation and
fortification to be feasible methods to improve micronutrient intake. As polypharmacy continues
to be an issue in LTC (58,102,103), and families and staff have been found to prefer food-first
strategies to improve nutrition for residents (352), it was decided that a micronutrient food
fortification formula should be researched for LTC. Prior to implementation of an intervention
study, stakeholders’ input should be gathered as this has been shown to positively impact long-
term adherence of strategies (121).

165
Acceptability testing in this thesis included staff webinar focus groups, expert key
informant interviews in-person family/resident focus groups. Stakeholders provided insight into
benefits, concerns and potential solutions to minimize barriers and promote adherence to the
strategy. The most common micronutrient of concern was vitamin D, yet some were concerned
with excessive micronutrient intake as well. For instance, with recent findings of the relationship
between calcium supplementation and increased risk of cardiovascular disease (106,292), and
reductions in calcium supplementation prescriptions in LTC, staff and family members were
concerned about adding this micronutrient to formulations. Thus, micronutrients of concern for
stakeholders may be affected by trends of the times (e.g. folic acid fortification, recent interest in
vitamin D with the updated DRI recommendations). It was also noted in the SR that
micronutrients studied in individual citations were likely affected by research interest, which did
not necessarily coincide with the potential true prevalence of deficiency. Comparisons of
citations on micronutrient intake to DRIs and comparisons of micronutrient biomarkers to AMA
and CDC cut-offs indicate that these micronutrients, in fact, did not meet micronutrient
recommendations or adequacy cut-offs, and that their importance is greater than the frequency of
citations and trends would suggest. In the triangulation of methods, SR results were shared with
stakeholders to overcome potential misconceptions about micronutrient status and the potential
for fortification to meet needs.
Overall, stakeholders were receptive of micronutrient food fortification, yet wanted more
demonstration of efficacy of this strategy to prevent micronutrient deficiency in LTC. Examples
of fortification vehicles and methods from prior research identified in the SR were shared with
stakeholders to help to develop a strategy that they believed could work in the Canadian LTC
context. Suggested components of the strategy included development of outsourced/pre-made

166
fortified products, mandatory training and clear protocols. Stakeholders can envision food
fortification as a strategy to improve micronutrient status if products are easy to access and
incorporate into current production systems. Residents and families wish to be informed and
have the potential to ‘opt out’ of home-wide formulation. Safety also needs to be demonstrated
before it is incorporated into standard practice. This work provides a strong foundation for
developing a proof-of-concept micronutrient food fortification study for the prevention of
deficiencies in LTC.
Findings from Hypotheses
The first hypothesis that micronutrient malnutrition exists in LTC (as evidenced by
assessing micronutrient intake and biomarker statuses), where it was expected that both
micronutrient intake and biomarker statuses will be low in the LTC group, was partially
supported. Intake was indeed identified to be low in LTC using several dietary intake methods.
However, much fewer biomarkers were identified to be low and/or deficient. A reason for this –
as previously mentioned – may be owing to the dearth of useful biomarkers for measuring
micronutrient status, as well as having fewer studies measuring biomarker status compared to
studies measuring intake (See figures 6A, 6B). This serves as a call for future work on the
identification and testing of biomarkers specific to micronutrient status.
Second hypothesis: From the scoping review intervention studies, the hypothesis of
micronutrient food fortification being able to increase biomarker levels of LTC residents was
supported for vitamin D, but results are inconclusive for calcium, vitamin C, and folic acid. This
is partly due to the dearth of useful biomarkers used in studies cited (e.g. serum calcium was
used in calcium fortification studies). Moreover, only 8 fortification studies were identified from
167
the scoping review, and numbers may be too few to make conclusive statements of whether
fortification could improve micronutrient status.
Hypothesis 3: From the menu analysis, the hypothesis that LTC menus show variability
and do not meet the RDA for several nutrients was supported, as large variations were seen in the
menus for specific macro-and micronutrients, despite Homes using the Canada’s Food Guide as
a guideline for menu planning. This suggests that standards beyond the CFG should be in place
to ensure consistency of nutrient provision between nursing homes. Different standards and
regulations between provinces may be an issue. Thus, efforts can begin at a provincial level, with
the goal of eventually improving LTC menu planning standards across Canada.
Hypothesis 4: From the acceptability testing, the hypothesis that micronutrient
fortification will be an acceptable intervention for stakeholders, and be preferred over pill-form
of micronutrient interventions was partially supported. Participants identified micronutrient
fortification as a useful alternative, yet evidence of efficacy is needed to fully determine the
acceptability of fortification. Moreover, a small number of participants also preferred ONS over
fortification, as ONS was a simpler method that provided both micro-and macronutrients to
residents. However, participants also agreed that micronutrients are a much less common topic of
discussion between LTC providers, and less is known about micronutrients compared to
macronutrients. This gap in knowledge of micronutrients amongst clinicians could be a reason
why micronutrients do not receive much focus in LTC. This points to the need of changing both
provider and resident/family’s attitude towards micronutrients through knowledge translation
efforts, to increase their understanding of physiological impact of micronutrient deficiencies on
residents, and benefits of providing adequate micronutrients.

168
In summary, micronutrient malnutrition appears to exist in LTC when defined as
inadequate intake, and biomarker status indicates that residents may be at risk of certain
micronutrient deficiencies. Several strategies have been used to enhance resdients’ micronutrient
intake (and status), and micronutrient fortification of key food vehicles is an acceptable and
potentially viable strategy for prevention of deficiency in residents living in LTC.
9.3 Proposed Micronutrient Fortification Strategy
Thus far, the thesis has identified micronutrients that may be candidates for a fortification
formulation, based on diverse assessment methods. The micronutrients identified were: vitamins
D (all sources), E (intake, menu analysis, super-menu), C (biomarker), B6 (intake), folate
(intake, biomarker, menu analysis), calcium (intake, fortification studies), iron (biomarker)
magnesium (menu analysis), and potassium (menu analysis, super-menu). Interestingly, most of
these nutrients are Risk A or B nutrients, with iron as the only micronutrient in the Risk C
category (see Background section, p. 18). This means that the majority of micronutrients either
have a wide margin of safety with the UL, has no UL, or has non-serious critical adverse effects
(Risk A nutrients); or has low risk of excessive intake at the proposed fortification level, i.e. up
to 10% DV (Risk B nutrients) (89). Thus, addition of these nutrients to a fortification formula at
physiological dosages (i.e. <50% RDA) or as regulation allows, is likely to be safe. The Linus
Pauling Institute has developed older adult-specific micronutrient recommendations (65);
recommendations that go beyond the RDA recommendations include: vitamin B12 at 100-400
mcg/day of crystalline supplemental vitamin B12 (due to malabsorption with age), vitamin D at
2,000 IU/day from supplements (due to reduced capacity for skin synthesis of vitamin D), and
vitamin E: 200 IU of supplement of natural-source d-alpha-tocopherol (this dose is related to

169
protection from chronic diseases). The Linus Pauling Institute also cautions against
supplementation of magnesium >350mg/d (due to prevalence of reduced kidney function in older
adults, and to avoid risks of gastrointestinal disturbance) (65).
Several issues need to be addressed prior to pursuing micronutrient food fortification in
LTC. Dosage levels trialed would need to take the regulations above into account, and be
planned to the DRIs which provides a guideline to the needs of most in the population, and effort
needs to be taken to ensure that the total daily averages consumed does not exceed the tolerable
upper limit to avoid risk of toxicity.
From acceptability testing results, the selected food vehicle would be a food that is
consumed well by the majority of residents. Based on these results, an outsourced product that
was ready to consume was preferred, as it limited issues with error and staff time and negated the
need for extensive training. Thus products for inclusion should include those that are readily
outsourced. Furthermore, the amount to be eaten should be small to ensure full servings are
consumed to enhance micronutrient intake and as per prior work, two offerings per day is
reasonable to limit the effect of a missed meal or refused food item (112,119). Possible
considerations include condiments (e.g. coffee creamers, butter/margarine), garnishes (e.g.
whipped dessert topping), common sides (e.g. mashed potatoes), or soups. Regular textured
foods would be trialed first, as additions to regular foods is likely the most simple. However,
specific trialing and preparation processes with pureed would be also be needed, as simple
additions of spices during cooking vs. during pureeing, have shown differences in sensory
profiles (353).
If fortification is to occur with in-home production rather than outsourced,
implementation could begin as a pilot in smaller homes (e.g. 100 resident or less) to allow better

170
control of and fidelity to fortification procedures, documentation and troubleshooting of barriers,
and tracking of outcomes (354). Larger homes with larger production kitchens could be trialed in
subsequent phases. Baseline micronutrient biomarker status data of participants should be
collected, with regular tracking of intake (e.g. along with intake flowsheets, adding in a column
to specify consumption of the fortified food item), and intermittent biomarker measurements
should be taken depending on the micronutrient added and the half-lives of micronutrients in
circulation. Effort should be taken to ensure that selected biomarkers are useful measures of
micronutrient status (i.e. are sensitive and reliable).
Lastly, involvement with stakeholders at the start and throughout the potential
fortification project is essential to ensure adherence and long-term success (121). Conducting
focus groups or information sessions with resident/family and staff may help improve their
understanding of the importance and reasons for fortification and encourage stakeholder buy-in.
Marketing strategies, such as advertisements (e.g. posters, commercials), could help make the
strategy more appealing to end users through repetition (355). Feedback from stakeholders
(family/resident, LTC staff, government (for funding and to clarify regulations or develop new
regulations as needed), and the research team) is also needed throughout the project to allow for
changes to the strategy as needed.
It is the hope of the research candidate that the findings and suggestions of this thesis
would not only provide insights into the barriers and challenges to enhancing residents’
micronutrient intake and status, but also provide a taste of the benefits this work could bring if
properly planned and executed.

171
9. 4 Study Strengths
Strengths of specific studies have been addressed in manuscripts (Chapters 5-8). Strengths of
the overarching thesis included the use of triangulation at several levels, where the
complementary strengths and non-overlapping weaknesses of each study component helped to
address different areas of the research objective.
Data trianglation is where different sources of data are used to enhance validity (182). Data
triangulation was achieved by incorporating literature reviews, menu analyses, and stakeholders’
perespectives on micronutrient deficiencies in LTC, and whether a food fortification strategy
might be feasible and acceptable in LTC from both the literature and stakeholders.
Investigator triangulation is when multiple researchers from the same field are involved in
the study’s analysis (182). This was done in the thesis by having more than one moderator
conduct focus groups and key informant interviews and debriefing to discuss impressions after
each data collection session. The use of multiple analysts independently coding transcripts and
confirming and reducing emerging themes also allowed for further triangulation, increasing the
authors’ confidence of findings and helped establish the study’s validity. Other researchers also
confirmed SR selection of citations and extraction. Furthermore, a multidisciplinary thesis
committee supported the work of the candidate ensuring that various perspectives from food and
nutritional science and dietetics were represented in the data collection and interpretation.
Theory triangulation uses multiple perspectives outside the field to interpret available data
(182). For this thesis, investigator triangulation occurred with the collaboration of committee
members who were experts in different fields: dietetics, geriatrics, food science, and
biochemistry. This helped inform all components of the study and encouraged critical analysis of

172
the results. For instance, while the research candidate and senior author identified that certain
micronutrients were cited more frequently in the literature than others, and wondered if these
were then the micronutrients of greatest concern, another committee member questioned whether
frequency of citations truly indicated importance or just trends in research. This then resulted in
focusing the SR results to examine consistency across studies, rather than simply frequency of
micronutrients being studied, and noting that absence of research does not necessarily relate to
adequacy of the nutrient.
Finally, methodological triangulation involves using two or more methods of data collection.
This study was strengthend by using scoping reviews; menu analyses; focus groups or interviews
with LTC staff, residents, and family members; and feedback questionnaires, which built on the
development of subsequent stages. Each method then independently and later, collectively,
answered its specific and the overall thesis research objective, and allowed for deeper
understanding of which were the micronutrients for which residents may be at risk of
deficiencies, and identified that food fortification was an acceptable strategy in LTC, given proof
of concept and ease of application for LTC.
9.5 Study Limitations
A considerable limitation of this study includes the heterogeneity of data, with varing
levels of quality and accuracy. From the scoping reviews, identified intake studies of various diet
assessment quality included (ordered from lesser to more accurate): diet histories, food
frequency questionnaires, estimated food records, and weighed food records. Furthermore, some
studies focused on high risk groups in LTC and not the overall population, affecting
interpretation. Moreover, appropriateness of biomarkers were also of concern; micronutrient

173
statuses were examined with a variety of biomarkers of varying accuracy, ranging from highly
useful (e.g. 25(OH)D) to less useful with some still inclusive in their utility to assess dietary
exposure. Other biomarkers measured are tightly regulated, non-specific to the micronutrient, or
old biomarkers that are no longer used in practice (39,56). This study did not aim to determine a
direct relationship between intake and status, yet this is needed to demonstrate the efficacy of
micronutrient-enhancing strategies.
Regarding menu analysis, only a small sample size (n=5) of Canadian LTC menus were
used. Thus, this is not a sufficient analysis to fully characterize Canadian LTC menus, although it
is more comprehensive that studies to date (5,48,70). Conclusions on the sufficiency or potential
regional differences in menu planning cannot be made without a more comprehensive analysis.
Cost of super-menus was not established from this study, and it cannot be determined
whether these menus are feasible under current LTC food budgets. Super-menus have also not
been trialed in LTC homes, thus level of acceptance and compliance with consumption cannot be
determined in this thesis. However, work is underway to trial fortification formulations identified
from the scoping review with food vehicles of commonly consumed foods identified by the
acceptability testing from this study. This will first be tested with professional taste-testers to
address issues with taste changes, texture, and overall food appearance. By addressing these
issues prior to implementation, it is hoped that higher acceptance could be obtained when trialing
occurs with actual LTC residents in the future.
Intrinsic to the concept of food fortification is that the strategy will address micronutrient
needs for the population in general, yet individual needs (e.g. due to disease states or other
physiological limitations) may not be addressed. However, the concept and purpose of food
fortification in LTC was that of prevention, with the recognition that any improvement in intake
174
and status may decrease the risk of deficiencies or maintain current status and help residents
avoid the damaging effects of micronutrient malnutrition.
9.6 Future Research Directions and Implications for Practice
This work was exploratory, and certain areas require greater attention in future studies.
Due to the diversity in study designs identified in the scoping reviews, comparisons of efficacy
within supplementation and fortification, and between the two strategies, were difficult. Future
studies examining the effects of supplementation or fortification with a LTC-specific
micronutrient formulation should consider measuring both intake and resulting biomarker status
changes to comment on possible relationships between intake and status. Biomarkers of function
may also be considered for examination, as changes in function provides stronger evidence for
the benefits of adequate micronutrient intake (39,313). Length of the study should be determined
after considering the number of days required to adequately assess micronutrient intake, as
recommended by Bingham (1987).
Population to Target
To demonstrate efficacy of fortification, a long-term efficacy study measuring intake,
status, and even functional changes after intake of micronutrients would be ideal. However, this
type of study may be difficult to carry out with the current LTC populaton. While life
expectancies for older adults have been reported to increase (4,356,357), those admitted to LTC
remain an ill population that live with comorbidities (358,359), and risk of mortality following
placement in LTC remains high (360–362). Thus, the feasibility of a long-term study is a
limitation with this population. Disease states may also confound the precision and accuracy of
biomarkers used (39). Beginning research with the retirement population may allow for a longer

175
period of follow-up, but the retirement population is not well-defined, and range of health, eating
habits, and functional abilities may make comparisons difficult. As follows, identification of an
older adult population for which micronutrient fortification can be carried out for an appropriate
length of time to demonstrate its efficacy at improving micronutrient status is still needed.
Future Directions for Micronutrient Provision in LTC
For LTC practice, Homes should be equipped with micronutrient analysis programs (or
have analyzed menus) to ensure that menus meet recommendations. Prior to fortification work,
greater awareness of micronutrient contents of food can help improve menu planning. Having
LTC facilities re-examine current menus to analyze micronutrient contents of the menus may be
a first step. Identification and incorporation of micronutrient-dense foods on the menu can help
to maximize residents’ nutrient intake, and further work can be done to reduce food volume by
including these nutrient-dense ingredients. Findings suggest that meeting most micronutrient
recommendations is possible with creative and deliberate menu planning and knowledge
translation of best practices is needed, as well as determining the potential cost of super-menus.
To facilitate these objectives, stakeholders’ understanding and buy-in, from the level of
residents, to staff, to government support, are essential.
To advance micronutrient food fortification in LTC, taste-testing to address issues with
taste changes, texture, and overall food appearance, as well as determination of stability with
production and storage needs to be assessed and tested. This work is currently being done at the
University of Guelph under Dr. Lisa Duizer in the Department of Food Science. Their findings
will help answer issues noted by stakeholders and allow for better assessment of acceptability.

176
Piloting in LTC homes’ production kitchen will allow for external validity or transferability, to
assess whether this strategy is feasible in the daily LTC production kitchen.
Although this study was able to narrow down the micronutrients for which residents are
at risk of deficiency, it was not possible to pinpoint a final list of micronutrients for which all
LTC residents would benefit from. This study results from differrent levels of assessment and
analyses (i.e. intake data, biomarker status, intervention formulations, menu analysis, and super-
menu comparisons) which identified different micronutrients of concern. Vitamin D was the
micronutrient that appeared across all studies, and can be assumed as a micronutrient which all
residents may benefit from fortification, given its benefits on bone status and decreased skin
synthesis with age (93,112,349). While the other micronutrients may be of concern, other
considerations may render them inappropriate for supplementation and fortification. For
instance, with iron, contraindications to supplementation (65) or issues with acceptability of the
fortification (119) may mean it will not be considered in the potential micronutrient formulation.
Of all the assessment methods used, micronutrient biomarkers are likely the most precise
measurement. However, micronutrient requirements may differ from nation by nation due to
differences in fortification practices, cultural food intake patterns, food availability, and other
factors. Thus, a nation-wide study of LTC residents’ intake and biomarker status, specifically
evaluating the micronutrients from the findings above, may be a logical next step to answering
which are the micronutrients of concern that should be addressed in LTC.
9.7 Conclusion
This study has advanced the knowledge of micronutrients of concern in LTC through
careful examination and comparison of current literature, and critically evaluated potential

177
strategies to enhance micronutrient status through review of literature and gathering of
stakeholder and experts’ perspectives. This is the first known study to examine the use of
webinar focus group as a data collection method for research, and provided insight, guidance,
and trouble-shooting advice for future webinar focus group designs. Triangulation of data,
investigators, theory, and methods helped to address research objectives and the gap in
understanding of the depth of micronutrient malnutrition and potential strategies to ameliorate
this form of malnutrition for residents living in LTC. This thesis provides direction for where to
address research efforts, as well as possible changes to practice needed for LTC. Given the
recent interest in micronutrient fortification in LTC (112,115,119,298), and the increasing
numbers of LTC residents in Canada (1) and worldwide (4), focus on micronutrient needs for
LTC residents is a timely research endeavour.
References
1. Canadian Life and Health Insurance Association. CLHIA Report on Long-Term Care
Policy: Improving the accessibility , quality and sustainability of long-term care in
Canada. Toronto; 2012.
2. IBISWorld. Nursing Care Facilities in the US: Market Research Report. 2014 [cited 2014
Aug 31]. Available from: http://www.ibisworld.com/industry/default.aspx?indid=1594
3. Grabowski DC, Stevenson DG, Cornell PY. Assisted living expansion and the market for
nursing home care. Health Serv Res. 2012;47(6):2296–315.
4. Ribbe MW, Ljunggren G, Steel K, Topinková E, Hawes C, Ikegami N, et al. Nursing
homes in 10 nations: a comparison between countries and settings. Age Ageing. 1997;26
Suppl 2:3–12.
5. Wendland BE, Greenwood CE, Weinberg I, Young KWH. Malnutrition in
institutionalized seniors: the iatrogenic component. J Am Geriatr Soc. 2003;51(1):85–90.

178
6. Boström A-M, Van Soest D, Kolewaski B, Milke DL, Estabrooks CA. Nutrition status
among residents living in a veterans’ long-term care facility in Western Canada: a pilot
study. J Am Med Dir Assoc. 2011;12(3):217–25.
7. Carrier N, Ouellet D, West GE. Nursing home food services linked with risk of
malnutrition. Can J Diet Pract Res. 2007;68(1):14–20.
8. Carrier N, West GE, Ouellet D. Cognitively impaired residents’ risk of malnutrition is
influenced by foodservice factors in long-term care. J Nutr Elder. 2006;25(3-4):73–87.
9. Keller HH. Malnutrition in institutionalized elderly: how and why? J Am Geriatr Soc.
1993;41(11):1212–8.
10. Stange I, Poeschl K, Stehle P, Sieber CC, Volkert D. Screening for malnutrition in nursing
home residents: comparison of different risk markers and their association to functional
impairment. J Nutr Health Aging. 2013;17(4):357–63.
11. Verbrugghe M, Beeckman D, Van Hecke A, Vanderwee K, Van Herck K, Clays E, et al.
Malnutrition and associated factors in nursing home residents: a cross-sectional, multi-
centre study. Clin Nutr. 2013;32(3):438–43.
12. Harris CL, Fraser C. Malnutrition in the institutionalized elderly: the effects on wound
healing [corrected] [published errata appear in OSTOMY WOUND MANAGE 2004
Nov;50(11):10]. Ostomy Wound Manag. 2004;50(10):54–63.
13. Morley JE, Silver AJ. Nutritional issues in nursing home care. Ann Intern Med.
1995;123(11):850–9.
14. Grieger JA, Nowson CA. Nutrient intake and plate waste from an Australian residential
care facility. Eur J Clin Nutr. 2007;61(5):655–63.
15. Hall KL, Denda CE, Morris M, Yeung H. Dietary vitamin D intake among elderly
residents in a Veterans’ Centre. Can J Diet Pract Res. 2010;71(1):49–52.
16. Bartali B, Frongillo EA, Bandinelli S, Lauretani F, Semba RD, Fried LP, et al. Low
nutrient intake is an essential component of frailty in older persons. J Gerontol A Biol Sci
Med Sci. 2006;61(6):589–93.
17. Chandra RK. Nutrition and the immune system: an introduction. Am J Clin Nutr.
1997;66(2):460S–463S.
18. Worwag M, Classen HG, Schumacher E. Prevalence of magnesium and zinc deficiencies
in nursing home residents in Germany. Magnes Res. 1999;12(3):181–9.
19. Lengyel CO, Whiting SJ, Zello GA. Nutrient inadequacies among elderly residents of
long-term care facilities. Can J Diet Pract Res. 2008;69(2):82–8.
179
20. Sturtzel B, Dietrich A, Wagner K-H, Gisinger C, Elmadfa I. The status of vitamins B6,
B12, folate, and of homocysteine in geriatric home residents receiving laxatives or dietary
fiber. J Nutr Health Aging. 2010;14(3):219–23.
21. Aghdassi E, McArthur M, Liu B, McGeer A, Simor A, Allard JP. Dietary intake of elderly
living in Toronto long-term care facilities: comparison to the dietary reference intake.
Rejuvenation Res. 2007;10(3):301–9.
22. Keller HH. Nutrition and health-related quality of life in frail older adults. J Nutr Health
Aging. 2004;8(4):245–52.
23. Thomas DR, Ashmen W, Morley JE, Evans WJ. Nutritional Management in Long-Term
Care: Development of a Clinical Guideline. Journals Gerontol Ser A Biol Sci Med Sci.
2000;55(12):M725–M734.
24. Woods JL, Walker KZ, Iuliano-Burns S, Strauss BJ. Malnutrition on the menu: Nutritional
status of institutionalised elderly Australians in low-level care. J Nutr Heal Aging.
2009;13(8):693–8.
25. Lengyel CO, Zello GA, Smith JT, Whiting SJ. Evaluation of Menu and Food Service
Practices of Long-Term Care Facilities of a Health District in Canada. J Nutr Elder.
2003;22(3):29–42.
26. Dunne JL, Dahl WJ. A novel solution is needed to correct low nutrient intakes in elderly
long-term care residents. Nutr Rev. 2007;65(3):135–8.
27. Nowson CA, Sherwin AJ, McPhee JG, Wark JD, Flicker L. Energy, protein, calcium,
vitamin D and fibre intakes from meals in residential care establishments in Australia.
Asia Pac J Clin Nutr. 2003;12(2):172–7.
28. Health Canada. Dietary Reference Intakes Tables. Gov. Canada. 2010 [cited 2014 Feb 6].
Available from: http://www.hc-sc.gc.ca/fn-an/nutrition/reference/table/index-eng.php
29. De Jong N, Chin A Paw MJ, de Graaf C, Hiddink GJ, de Groot L, van Staveren WA.
Appraisal of 4 months’ consumption of nutrient-dense foods within the daily feeding
pattern of frail elderly. J Aging Health. 2001;13(2):200–16.
30. Katz SH, Weaver WW. Dietary Assessment. Encycl. Food Cult. Charles Scribner’s Sons;
2004.
31. Gibson RS. Principles of Nutritional Assessment. Second Edi. New York: Oxford
University Press; 2005.
32. Taylor CL. Framework for DRI Development: Components “Known” and Components
“To Be Explored” Background Paper. Washington D.C.; 2008.

180
33. Institute of Medicine. Dietary Reference Intakes Tables and Application. Natl. Acad. Sci.
2011 [cited 2014 Aug 1]. Available from:
http://www.iom.edu/Activities/Nutrition/SummaryDRIs/DRI-Tables.aspx
34. Food and Nutrition Board. Dietary Reference Intakes : A Risk Assessment Model for
Establishing Upper Intake Levels for Nutrients. Washington D.C.: National Academy
Press; 1998.
35. European Food Safety Authority. Dietary reference values and dietary guidelines. 2014
[cited 2014 Sep 2]. Available from: http://www.efsa.europa.eu/en/topics/topic/drv.htm
36. Tarasuk V. Use of population-weighted Estimated Average Requirements as a basis for
Daily Values on food labels. Am J Clin Nutr. 2006;83(5):1217S–1222S.
37. Fletcher RJ, Bell IP, Lambert JP. Public health aspects of food fortification: a question of
balance. Proc Nutr Soc. 2007;63(04):605–14.
38. Statistical Help. Prospective vs. Retrospective Studies. StatsDirect Ltd. 2014 [cited 2014
Sep 2]. Available from:
http://www.statsdirect.com/help/default.htm#basics/prospective.htm
39. Harvey LJ, Collings R, Casgrain A, Fairweather-tait SJ. BEST PRACTICE
GUIDELINES : Biomarkers of status / exposure - EURRECA Research activity 1.2:
Status methods - Deliverable RA1.2-3. Brussels; 2011.
40. Hooper L, Fairweather-tait SJ, Ashton K, Harvey LJ. Assessing potential biomarkers of
micronutrient status by using a systematic review methodology : methods 1 – 5. Am J Clin
Nutr. 2009;89:1953–9.
41. Garcia-Arias MT, Villarino Rodriguez A, Garcia-Linares MC, Rocandio AM, Garcia-
Fernandez MC. Iron, folate and vitamins B12 & C dietary intake of an elderly
institutionalized population in Leon, Spain. Nutr Hosp. 2003;18(4):222–5.
42. Gonzalez S, Huerta JM, Fernandez S, Patterson AM, Lasheras C. Life-quality indicators
in elderly people are influenced by selenium status. Aging-Clinical Exp Res.
2007;19(1):10–5.
43. Perez-Llamas F, Lopez-Contreras MJ, Blanco MJ, Lopez-Azorin F, Zamora S, Moreiras
O. Seemingly paradoxical seasonal influences on vitamin D status in nursing-home elderly
people from a Mediterranean area. Nutrition. 2008;24(5):414–20.
44. American Medical Association. SI Conversion Calculator. AMA Man. Style - A Guid.
Authors Ed. 10th Ed. 2014 [cited 2014 Mar 15]. Available from:
http://www.amamanualofstyle.com/page/si-conversion-calculator

181
45. Centers for Disease Control and Prevention. Second National Report on Biochemical
Indicators of Diet and Nutrition in the U . S . Population. Atlanta; 2012.
46. Blanck HM, Bowman BA, Cooper GR, Myers GL, Miller DT. Laboratory issues: use of
nutritional biomarkers. J Nutr. 2003;133 Suppl (7):888S–894S.
47. Hambidge M. Biomarkers of trace mineral intake and status. J Nutr. 2003;133 Suppl
(3):948S–955S.
48. Wright-Thompson A, Piché L. Nutritional Analysis of a Long-term Care Menu: Before
and After an Increase in the Raw Food Cost Allowance. Can J Diet Pract Res.
2011;72(3):141–5.
49. Marcenes W, Steele JG, Sheiham A, Walls AW. The relationship between dental status,
food selection, nutrient intake, nutritional status, and body mass index in older people.
Cad saude publica / Minist da Saude, Fund Oswaldo Cruz, Esc Nac Saude Publica.
2003;19(3):809–16.
50. Johnson RM, Smiciklas-Wright H, Soucy IM, Rizzo JA. Nutrient intake of nursing-home
residents receiving pureed foods or a regular diet. J Am Geriatr Soc. 1995;43(4):344–8.
51. Dietitians of Canada. Best Practices for Nutrition , Food Service and Dining in Long Term
Care Homes: A working paper. Toronto; 2013.
52. Pokrywka HS, Koffler KH, Remsburg R, Bennett RG, Roth J, Tayback M, et al. Accuracy
of patient care staff in estimating and documenting meal intake of nursing home residents.
J Am Geriatr Soc. 1997;45(10):1223–7.
53. Suominen M, Laine A, Routasalo P, Pitkala KH, Rasanen L. Nutrient content of served
food, nutrient intake and nutritional status of residents with dementia in a finnish nursing
home. J Nutr Heal Aging. 2004;8(4):234–8.
54. Lowik MRH, Van den Berg H, Schrijver J, Odink J, Wedel M, Van Houten P. Marginal
nutritional status among institutionalized elderly women as compared to those living more
independently (Dutch Nutrition Surveillance System). J Am Coll Nutr. 1992;11(6):673–
81.
55. Dahl WJ, Whiting SJ, Tyler RT. Protein content of pureed diets: Implications for
planning. Can J Diet Pract Res. 2007;68(2):99–102.
56. Vir SC, Love AH. Nutritional status of institutionalized and noninstitutionalized aged in
Belfast, Northern Ireland. Am J Clin Nutr. 1979;32(9):1934–47.
57. Johnson MA, Davey A, Park S, Hausman DB, Poon LW, Georgia Centenarian S. Age,
race and season predict vitamin D status in African American and white octogenarians and
centenarians. J Nutr Health Aging. 2008;12(10):690–5.

182
58. Viveky N, Toffelmire L, Thorpe L, Billinsky J, Alcorn J, Hadjistavropoulos T, et al. Use
of vitamin and mineral supplements in longterm care home residents. Appl Physiol Nutr
Metab. 2012;37(1):100–5.
59. Wakimoto P, Block G. Dietary intake, dietary patterns, and changes with age: an
epidemiological perspective. J Gerontol A Biol Sci Med Sci. 2001;56 Spec No(Ii):65–80.
60. Ritchie C. Geriatric nutrition: Nutritional issues in older adults. UpToDate. 2012.
61. Sheiham A, Steele JG, Marcenes W, Finch S, Walls AW. The impact of oral health on
stated ability to eat certain foods; findings from the National Diet and Nutrition Survey of
Older People in Great Britain. Gerodontology. 1999;16(1):11–20.
62. Thomas DR. Hard to Swallow: Management of Dysphagia in Nursing Home Residents. J
Am Med Dir Assoc. 2008;9(7):455–8.
63. Germain I, Dufresne T, Gray-Donald K. A Novel Dysphagia Diet Improves the Nutrient
Intake of Institutionalized Elders. J Am Diet Assoc. 2006;106(10):1614–23.
64. Schubert B, Karner A, Swoboda H. Dysphagia and food adaptation in a nursing home. 8th
Congr Eur Laryngol Soc Vienna Austria. 2011;268(5):793.
65. Linus Pauling Institute. Micronutrients for Older Adults. 2011 [cited 2014 Aug 11].
Available from: http://lpi.oregonstate.edu/infocenter/lifestages/olderadults/index.html
66. Ames BN. Low micronutrient intake may accelerate the degenerative diseases of aging
through allocation of scarce micronutrients by triage. Proc Natl Acad Sci USA.
2006;103(47):17589–94.
67. Richard MJ, Roussel a M. Micronutrients and ageing: intakes and requirements. Proc Nutr
Soc. 1999 Aug;58(3):573–8.
68. Health Canada. Eating Well with Canada’s Food Guide: A Resource for Educators and
Communicators. 2011 [cited 2014 Mar 19]. Available from: http://www.hc-sc.gc.ca/fn-
an/pubs/res-educat/res-educat-eng.php
69. Subcommittee on Interpretation and Uses Dietary Reference Intakes, The Standing
Committee on the Scientific Evaluation of Dietary Reference Intakes. Dietary Reference
Intakes: Applications in Dietary Planning. Washington D.C.: The National Academies
Press; 2003.
70. Viveky N, Billinsky J, Thorpe L, Alcorn J, Hadjistavropoulos T, Whiting SJ. Challenges
in Planning Long-term Care Menus That Meet Dietary Recommendations. Can J Diet
Pract Res. 2013;74(2):84–7.

183
71. Ottaway PB (Ed. . Food Fortification and Supplementation: Technological, Safety and
Regulatory Aspects. 1st ed. Ottaway PB, ed. Boca Raton: CRC Press; 2008.
72. Flynn A, Hirvonen T, Mensink GBM, Ocké MC, Serra-Majem L, Stos K, et al. Intake of
selected nutrients from foods, from fortification and from supplements in various
European countries. Food Nutr Res. 2009;53.
73. Darnton-Hill I, Nalubola R. Fortification strategies to meet micronutrient needs: successes
and failures. Proc Nutr Soc. 2002;61(2):231–41.
74. Tucker KL, Mahnken B, Wilson PW, Jacques P, Selhub J. Folic acid fortification of the
food supply. Potential benefits and risks for the elderly population. JAMA.
1996;276(23):1879–85.
75. Kim YI. Will mandatory folic acid fortification prevent or promote cancer? Am J Clin
Nutr. 2004;80(5):1123–8.
76. Smith a D. Folic acid fortification: the good, the bad, and the puzzle of vitamin B-12. Am
J Clin Nutr. 2007;85(1):3–5.
77. Lynch S. Food Iron Absorption and Its Importance for the Design of Food Fortification
Strategies. Nutr Rev. 2002;60(7):3–6.
78. UNICEF. Vitamin & Mineral Deficiency: A Global Progress Report. New York; 2005.
79. Horton S. The economics of food fortification. J Nutr. 2006;136(4):1068–71.
80. Haas JH, Miller DD. Symposium : Food Fortification in Developing Countries Overview
of Experimental Biology 2005 Symposium : Food Fortification in Developing Countries
1. 2006;1053–4.
81. Van der Merwe J, Kluyts M, Bowley N, Marais D. Optimizing the introduction of
complementary foods in the infant’s diet: a unique challenge in developing countries.
Matern Child Nutr. 2007;3(4):259–70.
82. Usfar AA, Achadi EL, Martorell R, Hadi H, Thaha R, Jus’at I, et al. Expert meeting on
child growth and micronutrient deficiencies - new initiatives for developing countries to
achieve millennium development goals: executive summary report. Asia Pac J Clin Nutr.
2009;18(3):462–9.
83. Gibson RS, Hotz C. Dietary diversification/modification strategies to enhance
micronutrient content and bioavailability of diets in developing countries. Br J Nutr.
2007;85(S2):S159.
84. Ahmed F, Khan MR, Akhtaruzzaman M, Karim R, Williams G, Torlesse H, et al. Long-
term intermittent multiple micronutrient supplementation enhances hemoglobin and

184
micronutrient status more than iron + folic acid supplementation in Bangladeshi rural
adolescent girls with nutritional anemia. J Nutr. 2010;140(10):1879–86.
85. Blumfield ML, Hure AJ, Macdonald-Wicks L, Smith R, Collins CE. A systematic review
and meta-analysis of micronutrient intakes during pregnancy in developed countries. Nutr
Rev. 2013;71(2):118–32.
86. Holick MF, Shao Q, Liu WW, Chen TC. The vitamin D content of fortified milk and
infant formula. N Engl J Med. 1992;326(18):1178–81.
87. Calvo MS, Whiting SJ, Barton CN. Vitamin D fortification in the United States and
Canada: current status and data needs. Am J Clin Nutr. 2004;80(6 Suppl):1710S–6S.
88. Hanley DA, Davison KS. Vitamin D insufficiency in North America. J Nutr.
2005;135(2):332–7.
89. Canadian Food Inspection Agency. Reference Database for Hazard Identification. 2008.
90. De Lourdes Samaniego-Vaesken M, Alonso-Aperte E, Varela-Moreiras G. Vitamin food
fortification today. Food Nutr Res. 2012;56:1–9.
91. Codex Alimentarius Commission. GENERAL PRINCIPLES FOR THE ADDITION OF
ESSENTIAL NUTRIENTS TO FOODS. 1991 [cited 2014 Aug 13]. Available from:
www.codexalimentarius.org/input/download/.../299/CXG_009e.pdf
92. EatRight. What’s the Difference between Enriched and Fortified? Acad. Nutr. Diet. 2013
[cited 2014 Aug 14]. Available from:
http://www.eatright.org/Public/content.aspx?id=6442479262
93. Grados F, Brazier M, Kamel S, Duver S, Heurtebize N, Maamer M, et al. Effects on bone
mineral density of calcium and vitamin D supplementation in elderly women with vitamin
D deficiency. Joint, Bone, Spine Rev du Rhum. 2003;70(3):203–8.
94. Schwalfenberg GK, Genuis SJ. Vitamin D supplementation in a nursing home population.
Mol Nutr Food Res. 2010;54(8):1072–6.
95. Asciutti-Moura LS, Guilland J-C, Fuchs F, Richard D. Vitamins E, C, thiamin, riboflavin
and vitamin B-6 status of institutionalized elderly including the effects of
supplementation. Nutr Res. 1993;13(12):1379–92.
96. Van der Wielen R, de Wild G, de Groot L, Hoefnagels W, van Staveren W. Dietary
intakes of energy and water-soluble vitamins in different categories of aging. J Gerontol A
Biol Sci Med Sci. 1995;51(1):B100–7.
97. Liu BA, McGeer A, McArthur MA, Simor AE, Aghdassi E, Davis L, et al. Effect of
multivitamin and mineral supplementation on episodes of infection in nursing home

185
residents: a randomized, placebo-controlled study [corrected] [published erratum appears
in J AM GERIATR SOC 2007 Mar;55(3):478]. J Am Geriatr Soc. 2007;55(1):35–42.
98. Allsup SJ, Shenkin A, Gosney MA, Taylor S, Taylor W, Hammond M, et al. Can a Short
Period of Micronutrient Supplementation in Older Institutionalized People Improve
Response to Influenza Vaccine? A Randomized, Controlled Trial. J Am Geriatr Soc.
2004;52(1):20–4.
99. Meyer HE, Smedshaug GB, Kvaavik E, Falch JA, Tverdal A, Pedersen JI. Can vitamin D
supplementation reduce the risk of fracture in the elderly? A randomized controlled trial. J
Bone Miner Res. 2002;17(4):709–15.
100. Ter Riet G, Kessels AGH, Knipschild PG. Randomized clinical trial of ascorbic acid in
the treatment of pressure ulcers. J Clin Epidemiol. 1995;48(12):1453–60.
101. Lewis CW, Frongillo Jr EA, Roe DA. Drug-nutrient interactions in three long-term-care
facilities. J Am Diet Assoc. 1995;95(3):309–15.
102. Gokula M, Holmes HM. Tools to reduce polypharmacy. Clin Geriatr Med.
2012;28(2):323–41.
103. Heuberger RA, Caudell K. Polypharmacy and Nutritional Status in Older Adults A Cross-
Sectional Study. Drugs Aging. 2011;28(4):315–23.
104. Maggiore RJ, Gross CP, Hurria A. Polypharmacy in older adults with cancer. Oncologist.
2010;15(5):507–22.
105. Chel V, Wijnhoven HA, Smit JH, Ooms M, Lips P. Efficacy of different doses and time
intervals of oral vitamin D supplementation with or without calcium in elderly nursing
home residents. Osteoporos Int. 2008;19(5):663–71.
106. Demontiero O, Herrmann M, Duque G. Supplementation With Vitamin D and Calcium in
Long-Term Care Residents. J Am Med Dir Assoc. 2011;12(3):190–4.
107. Bourdel-Marchasson I. How to Improve Nutritional Support in Geriatric Institutions. J
Am Med Dir Assoc. 2010;11(1):13–20.
108. Castellanos VH, Litchford MD, Campbell WW. Modular protein supplements and their
application to long-term care. Nutr Clin Pract. 2006;21(5):485–504.
109. Beck AM, Ovesen L, Schroll M. Home-made oral supplement as nutritional support of old
nursing home residents, who are undernourished or at risk of undernutrition based on the
MNA. A pilot trial. Aging - Clin Exp Res. 2002;14(3):212–5.

186
110. Kwan LL, Bermudez OI, Tucker KL. Low vitamin B-12 intake and status are more
prevalent in Hispanic older adults of Caribbean origin than in neighborhood-matched non-
Hispanic whites. J Nutr. 2002;132(7):2059–64.
111. Bonjour JP, Benoit V, Pourchaire O, Rousseau B, Souberbielle JC. Nutritional approach
for inhibiting bone resorption in institutionalized elderly women with vitamin D
insufficiency and high prevalence of fracture. J Nutr Health Aging. 2011;15(5):404–9.
112. Mocanu V, Stitt PA, Costan AR, Voroniuc O, Zbranca E, Luca V, et al. Long-term effects
of giving nursing home residents bread fortified with 125 microg (5000 IU) vitamin D(3)
per daily serving. Am J Clin Nutr. 2009;89(4):1132–7.
113. Rasmussen LB, Hansen GL, Hansen E, Koch B, Mosekilde L, Molgaard C, et al. Vitamin
D: should the supply in the Danish population be increased?. Int J Food Sci Nutr. Danish
Veterinary and Food Administration, Soborg, Denmark.; 2000;51(3):209–15.
114. Suominen MH, Hosia-Randell HM V, Muurinen S, Peiponen A, Routasalo P, Soini H, et
al. Vitamin D and calcium supplementation among aged residents in nursing homes. J
Nutr Heal Aging. 2007;11(5):433–7.
115. Bonjour JP, Benoit V, Pourchaire O, Ferry M, Rousseau B, Souberbielle JC. Inhibition of
markers of bone resorption by consumption of vitamin D and calcium-fortified soft plain
cheese by institutionalised elderly women. Br J Nutr. 2009;102(7):962–6.
116. Bermejo LM, Aparicio A, Rodriguez-Rodriguez E, Lopez-Sobaler M, Andres P, Ortega
RM. Dietary strategies for improving folate status in institutionalized elderly persons. Br J
Nutr. 2009;101(11):1611–5.
117. Keane EM, O’Broin S, Kelleher B, Coakley D, Walsh JB. Use of folic acid-fortified milk
in the elderly population. Gerontology. 1998;44(6):336–9.
118. Dhonukshe-Rutten RAM, van Zutphen M, de Groot LCP, Eussen SJP, Blom HJ, van
Staveren WA. Effect of supplementation with cobalamin carried either by a milk product
or a capsule in mildly cobalamin-deficient elderly Dutch persons. Am J Clin Nutr.
2005;82(3):568–74.
119. Adolphe JL, Whiting SJ, Dahl WJ. Vitamin fortification of puréed foods for long-term
care residents. Can J Diet Pract Res. 2009;70(3):143–50.
120. Chin A Paw MJ, de Jong N, Schouten EG, Hiddink GJ, Kok FJ. Physical exercise and/or
enriched foods for functional improvement in frail, independently living elderly: a
randomized controlled trial. Arch Phys Med Rehabil. 2001;82(6):811–7.
121. Sidani S, Epstein DR, Bootzin RR, Moritz P, Miranda J. Assessment of preferences for
treatment: validation of a measure. Res Nurs Health. 2009;32(4):419–31.

187
122. Feeley N, Cossette S, Côté J, Héon M, Stremler R, Martorella G, et al. The importance of
piloting an RCT intervention. Can J Nurs Res. 2009;41(2):85–99.
123. Sidani S, Braden CJ. Design, Evaluation, and Translation of Nursing Interventions. West
Sussex, UK: John Wiley and Sons Ltd; 2011.
124. Arksey H, O’Malley L. Scoping studies: towards a methodological framework. Int J Soc
Res Methodol. 2005;8(1):19–32.
125. Oliver S. Making research more useful: integrating different perspectives and different
methods. In: Oliver S, Peersman G, eds. Using Res Eff Heal Promot. Buckingham: Open
University Press; 2001. p. 167–79.
126. Robichaud L, Durand PJ, Bédard R, Ouellet J. Quality of life indicators in long-term care:
opinions of elderly residents and their families. Can J Occup Ther. 2006;73(4):245–51.
127. Santacroce SJ, Maccarelli LM, Grey M. Intervention fidelity. Nurs Res. 2004;53(1):63–6.
128. Foss C, Ellefsen B. The value of combining qualitative and quantitative approaches in
nursing research by means of method triangulation. J Adv Nurs. 2002;40(2):242–8.
129. Temkin-Greener H, Gross D, Kunitz SJ, Mukamel D. Measuring Interdisciplinary Team
Performance in a Long-Term Care Setting. Med Care. 2004;42(5):472–81.
130. Temkin-greener H, Zheng NT, Cai S, Zhao H. Nursing Home Environment and
Organizational. 2010;48(4):357–64.
131. Zwarenstein M, Goldman J, Reeves S. Interprofessional collaboration : effects of practice-
based interventions on professional practice and healthcare outcomes ( Review ).
2009;(3).
132. Johansson G, Eklund K, Gosman-Hedström G. Multidisciplinary team, working with
elderly persons living in the community: a systematic literature review. Scand J Occup
Ther. 2010;17(2):101–16.
133. Lees L, Dowling C, Day M. Factors that contribute to the diversion of patients from long-
term care. Nurs Older People. 2013;25(5):19–24.
134. Creswell JW, Miller DL. Determining Validity in Qualitative Inquiry. 2013;39(3):124–30.
135. Lingard L, Albert M, Levinson W. Grounded theory , mixed methods , and action
research. 2008;337(August):459–61.
136. Padgett D. Qualitative methods in social work research: Challenges and rewards. 1st ed.
California: SAGE PUBLICATIONS INC; 1998.

188
137. Chel VG, Ooms ME, Pavel S, de Gruijl F, Brand A, Lips P. Prevention and treatment of
vitamin D deficiency in Dutch psychogeriatric nursing home residents by weekly half-
body UVB exposure after showering: a pilot study. Age Ageing. 2011;40(2):211–4.
138. Figlin E, Chetrit A, Shahar A, Shpilberg O, Zivelin A, Rosenberg N, et al. High
prevalences of vitamin B12 and folic acid deficiency in elderly subjects in Israel. Br J
Haematol. 2003;123(4):696–701.
139. Lipski PS, Torrance A, Kelly PJ, James OF. A study of nutritional deficits of long-stay
geriatric patients. Age Ageing. 1993;22(4):244–55.
140. Wells JL, Dumbrell AC. Nutrition and aging: assessment and treatment of compromised
nutritional status in frail elderly patients. Clin Interv Aging. 2006;1(1):67–79.
141. Mays N, Roberts E, Popay J. Synthesising research evidence. In: Fulop N, Allen P, Clarke
A, Black N, eds. Stud Organ Deliv Heal Serv Res Methods. London: Routledge; 2001. p.
188–220.
142. Levac D, Colquhoun H, O’Brien KK. Scoping studies: advancing the methodology.
Implement Sci. 2010;5:69.
143. Badger D, Nursten J, Williams P, Woodward M. Should All Literature Reviews be
Systematic? Eval Res Educ. 2000;14(3-4):220–30.
144. Armstrong R, Hall BJ, Doyle J, Waters E. Cochrane Update. “Scoping the scope” of a
cochrane review. J Public Health (Oxf). 2011;33(1):147–50.
145. Landa AH, Szabo I, Brun L Le, Owen I, Fletcher G. An Evidence-Based Approach to
Scoping Reviews. Electron J Inf Syst Eval. 2011;14(1):46–52.
146. Sharif MO, Janjua-Sharif FN, Sharif FNJ, Ali H, Ahmed F. Systematic reviews explained:
AMSTAR-how to tell the good from the bad and the ugly. Oral Health Dent Manag.
2013;12(1):9–16.
147. Ducak K, Keller HH. Menu planning in long-term care: toward resident-centred menus.
Can J Diet Pract Res. 2011;72(2):83.
148. Wasantwisut E, Rosado J, Gibson R. Nutritional Assessment : Methods for selected
micronutrients and calcium. Encycl. Life Support Syst. UNCESCO; 2001.
149. ESHA Research. Nutritional Database. 2014 [cited 2014 Sep 1]. Available from:
http://www.esha.com/nutrition/database-information
150. Canadian Nutrient File. Nutrient Data. Heal. Canada. 2010 [cited 2014 Sep 1]. Available
from: http://www.hc-sc.gc.ca/fn-an/nutrition/fiche-nutri-data/index-eng.php

189
151. Thomas DW, Smith M. The effect of music on caloric consumption among nursing home
residents with dementia of the Alzheimer’s type. Act Adapt Aging. 2009;33(1):1–16.
152. Health Canada. Nutrient Data - Food and Nutrition. 2010 [cited 2014 Mar 19]. Available
from: http://www.hc-sc.gc.ca/fn-an/nutrition/fiche-nutridata/index-eng.php
153. Dietitians of Canada. eaTracker. 2014 [cited 2014 Mar 19]. Available from:
https://www.eatracker.ca/
154. Murphy SP, Poos MI. Dietary Reference Intakes: summary of applications in dietary
assessment. Public Health Nutr. 2002;5(6A):843–9.
155. Johnson MA, Hausman DB, Davey A, Poon LW, Allen RH, Stabler SP. Vitamin B12
deficiency in African American and white octogenarians and centenarians in Georgia. J
Nutr Heal Aging. 2010;14(5):339–45.
156. Lökk J, Nilsson M, Norberg B, Hultdin J, Sandström H, Westman G. Shifts in B12
opinions in primary health care of Sweden. Scand J Public Health. 2001;29(2):122–8.
157. Dave DM, Katz PR, Gutman S. Serum magnesium levels in nursing home patients. Nutr
Res. 1987;7(9):981–4.
158. Arcasoy A, Yildirmak T, Yildirmak Y, Tunc S, Sinav B, Kutluay L. A test in the
diagnosis of marginal zinc deficiency in the geriatric people: Serum zinc binding capacity.
Trace Elem Electrocytes. 2001;18(3):139–41.
159. Krueger RA, Casey MA. Focus Groups : A Practical Guide for Applied Research.
Thousand Oaks: Sage Publications; 2000.
160. Turney L, Pocknee C. Virtual Focus Groups : New Frontiers in Research. 2005;4(2):32–
43.
161. Wang S. Use of the Webinar Tool ( Elluminate ) to Support Training : The Effects of
Webinar-Learning Implementation from Student-Trainers ’ Perspective. J Interactive
Online Learning. 2008;7(3):175–94.
162. Kear K, Chetwynd F, Williams J, Donelan H. Web conferencing for synchronous online
tutorials: Perspectives of tutors using a new medium. Comput Educ. 2012;58(3):953–63.
163. Bonk CJ, Zhang K. Introducing the R2D2 Model: Online learning for the diverse learners
of this world. Distance Educ. 2006;27(2):249–64.
164. Cisco WebEx. Why WebEx? 2014 [cited 2013 Dec 10]. Available from:
http://www.webex.com/why-webex/overview.html

190
165. Galloway KL. Focus groups in the virtual world: Implications for the future of evaluation.
New Dir Eval. 2011;2011(131):47–51.
166. Krueger RA. Telephone Focus Groups. 2014 [cited 2014 Sep 3]. Available from:
http://www.tc.umn.edu/~rkrueger/focus_tfg.html
167. Braun V, Clarke V. Using thematic analysis in psychology. Qual Res Psychol.
2006;3(2):77–101.
168. Oringderff J. “ My Way ”: Piloting an Online Focus Group. Int J Qual Meth.
2004;3(3):69–75.
169. Van Dolen WM, Dabholkar P a., de Ruyter K. Satisfaction with Online Commercial
Group Chat: The Influence of Perceived Technology Attributes, Chat Group
Characteristics, and Advisor Communication Style. J Retail. 2007;83(3):339–58.
170. Smithson J. Using and analysing focus groups: Limitations and possibilities. Int J Soc Res
Methodol. 2000;3(2):103–19.
171. Krueger RA. Designing and Conducting Focus Group Interviews. 2002.
172. Wright KB. Researching Internet-Based Populations: Advantages and Disadvantages of
Online Survey Research, Online Questionnaire Authoring Software Packages, and Web
Survey Services. J Comput Commun. 2006;10(3):00–00.
173. Sahin A, Kulm G. Sixth grade mathematics teachers’ intentions and use of probing,
guiding, and factual questions. J Math Teach Educ. 2008;11(3):221–41.
174. Fenton W. Cisco WebEx Meeting Center. PC Mag. New York, NY; 2011.
175. Tremblay M-A. The Key Informant Technique: A Nonethnographic Application. Am
Anthropol. 1957;59(4):688–701.
176. Marshall MN. The key informant technique. Fam Pract. 1996;13(1):92–7.
177. Marshall MN. Sampling for qualitative research. Fam Pract. 1996;13(6):522–5.
178. Halcomb EJ, Davidson PM. Is verbatim transcription of interview data always necessary?
Appl Nurs Res. 2006;19(1):38–42.
179. Talja S. Analyzing Qualitative Interview Data. Libr Inf Sci Res. 1999;21(4):459–77.
180. Smith LT, Johnson DB, Beaudoin S, Monsen ER, LoGerfo JP. Qualitative assessment of
participant utilization and satisfaction with the Seattle Senior Farmers’ Market Nutrition
Pilot Program. Prev Chronic Dis. 2004;1(1):A06.

191
181. Barbour CR. Doing Focus Groups. 1 Oliver’s Yard, 55 City Road, London EC1Y 1SP
United Kingdom: SAGE Publications Ltd; 2007. p. 93–102.
182. Guion LA, Diehl DC, Mcdonald D. Triangulation : Establishing the Validity of
Qualitative. 2011 p. 2–4.
183. Krefting L. Rigor in qualitative research: the assessment of trustworthiness. Am J Occup
Ther. 1991;45(3):214–22.
184. Research Methods Knowledge Base. Qualitative Validity. William M.K. Trochi. 2006
[cited 2014 Aug 28]. Available from:
http://www.socialresearchmethods.net/kb/qualval.php
185. Corbin JM, Strauss A. Grounded theory research: Procedures, canons, and evaluative
criteria. Qual Sociol. 1990;13(1):3–21.
186. Dahlke R, Wolf KN, Wilson SL, Brodnik M. Focus groups as predictors of dietitians’
roles on interdisciplinary teams. J Am Diet Assoc. 2000;100(4):455–7.
187. Myers A. Program Evaluation for Exercise Leaders. 1st ed. IL: Human Kinetics; 1999.
188. Hsieh H-F, Shannon SE. Three approaches to qualitative content analysis. Qual Health
Res. 2005;15(9):1277–88.
189. Suter WN. Qualitative Data, Analysis, and Design. Introd to Educ Res A Crit Think
Approach. Second Edi. Thousand Oaks, CA: SAGE Publications Inc.; 2012. p. 342–86.
190. Carey JW, Morgan M, Oxtoby MJ. Intercoder Agreement in Analysis of Responses to
Open-Ended Interview Questions: Examples from Tuberculosis Research. Field methods.
1996;8(3):1–5.
191. Schulenberg JL. Systematic social observation of police decision-making: the process,
logistics, and challenges in a Canadian context. Qual Quant. 2012;48(1):297-315.
192. Poland BD. Transcription Quality as an Aspect of Rigor in Qualitative Research. Qual
Inq. 1995;1(3):290–310.
193. Lincoln YS, Guba EG. Naturalistic Inquiry. London: SAGE Publications Inc.; 1985.
194. Halpern E. Auditing Naturalistic Inquiries: The Development and Application of a Model.
Indiana University; 1983.
195. Creswell JW, Clark VLP. Designing and Conducting Mixed Methods Research. First Edit.
Thousand Oaks, CA: SAGE Publications Inc.; 2007.
192
196. Patton MQ. Qualitative Research and Evaluation Methods. Third Edit. Thousand Oaks,
CA: SAGE Publications Inc.; 2002. p. 598.
197. Cope K. Malnutrition in the Elderly: A National Crisis: A Focus on the Problems, Causes,
Consequences, and Solutions. Darby: Diane Publishing Company; 1996.
198. Sullivan DH, Sun S, Walls RC. Protein-Energy Undernutrition Among Elderly
Hospitalized Patients. J Am Med Assoc.1999;281(21):2013.
199. Lengyel CO, Smith JT, Whiting SJ, Zello GA. A questionnaire to examine food service
satisfaction of elderly residents in long-term care facilities. J Nutr Elder. 2004;24(2):5–18.
200. Bartali B, Semba RD, Zhou J, Blaum C, Ko C-W, Fried LP. Low serum micronutrient
concentrations predict frailty among older women living in the community. J Gerontol A
Biol Sci Med Sci. 2006;61(6):594–9.
201. Akner G, Cederholm T. Treatment of protein-energy malnutrition in chronic nonmalignant
disorders. Am J Clin Nutr. 2001;74(1):6–24.
202. Thomas D, Verdery R, Gardner L, Kant a, Lindsay J. A prospective study of outcome
from protein-energy malnutrition in nursing home residents. J Parenter Enter Nutr.
1991;15(4):400–4.
203. Crogan NL, Pasvogel A. The influence of protein-calorie malnutrition on quality of life in
nursing homes. Journals Gerontol - Ser A Biol Sci Med Sci. 2003;58(2):159–64.
204. Smith RL. Calcium and vitamin D supplementation in nursing home residents. J Am Med
Dir Assoc. 2003;4(2 Suppl):S23–31.
205. Meydani SN, Leka LS, Fine BC, Dallal GE, Keusch GT, Singh MF, et al. Vitamin E and
respiratory tract infections in elderly nursing home residents: a randomized controlled trial
[corrected] [published erratum appears in JAMA 2007;297(17):1882]. J Am Med Assoc.
2004;292(7):828–36.
206. Clarke R, Smith a D, Jobst K a, Refsum H, Sutton L, Ueland PM. Folate, vitamin B12,
and serum total homocysteine levels in confirmed Alzheimer disease. Arch Neurol.
1998;55(11):1449–55.
207. Novaković R, Cavelaars AEJM, Bekkering GE, Roman-Viñas B, Ngo J, Gurinović M, et
al. Micronutrient intake and status in Central and Eastern Europe compared with other
European countries, results from the EURRECA network. Public Health Nutr.
2013;16(5):824–40.
208. Sempos CT, Johnson NE, Elmer PJ, Allington JK, Matthews ME. A dietary survey of 14
Wisconsin nursing homes. J Am Diet Assoc. 1982;81(1):35–40.
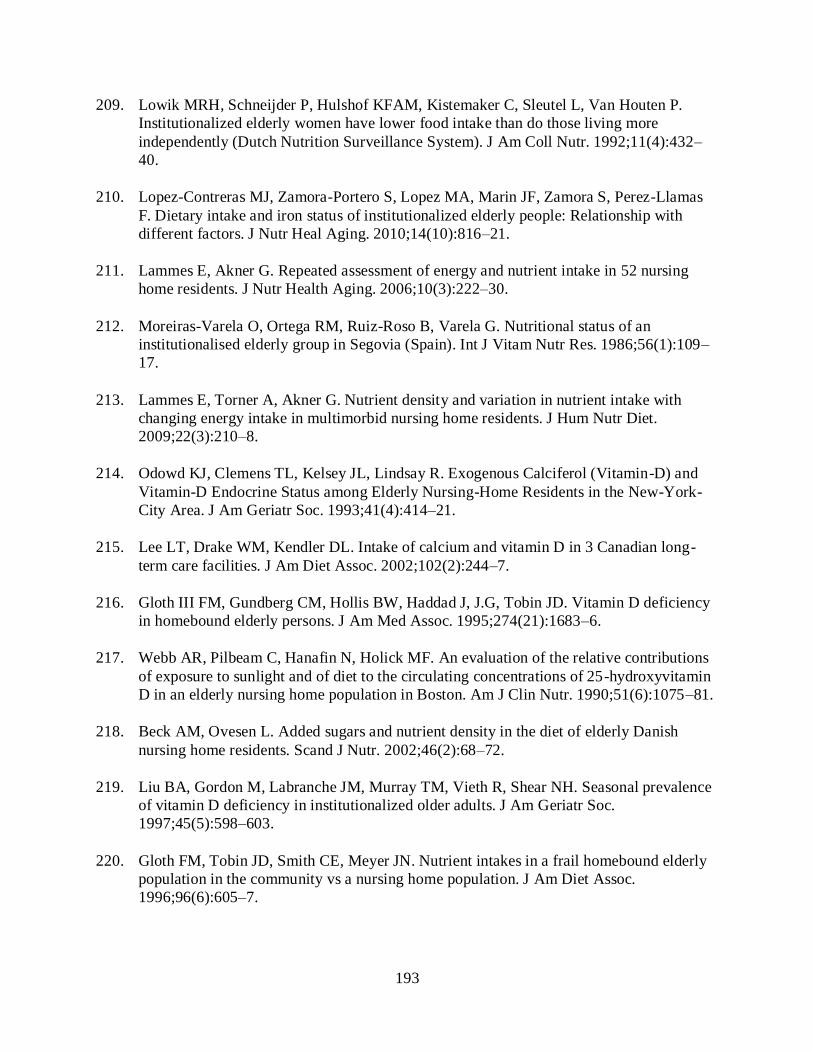
193
209. Lowik MRH, Schneijder P, Hulshof KFAM, Kistemaker C, Sleutel L, Van Houten P.
Institutionalized elderly women have lower food intake than do those living more
independently (Dutch Nutrition Surveillance System). J Am Coll Nutr. 1992;11(4):432–
40.
210. Lopez-Contreras MJ, Zamora-Portero S, Lopez MA, Marin JF, Zamora S, Perez-Llamas
F. Dietary intake and iron status of institutionalized elderly people: Relationship with
different factors. J Nutr Heal Aging. 2010;14(10):816–21.
211. Lammes E, Akner G. Repeated assessment of energy and nutrient intake in 52 nursing
home residents. J Nutr Health Aging. 2006;10(3):222–30.
212. Moreiras-Varela O, Ortega RM, Ruiz-Roso B, Varela G. Nutritional status of an
institutionalised elderly group in Segovia (Spain). Int J Vitam Nutr Res. 1986;56(1):109–
17.
213. Lammes E, Torner A, Akner G. Nutrient density and variation in nutrient intake with
changing energy intake in multimorbid nursing home residents. J Hum Nutr Diet.
2009;22(3):210–8.
214. Odowd KJ, Clemens TL, Kelsey JL, Lindsay R. Exogenous Calciferol (Vitamin-D) and
Vitamin-D Endocrine Status among Elderly Nursing-Home Residents in the New-York-
City Area. J Am Geriatr Soc. 1993;41(4):414–21.
215. Lee LT, Drake WM, Kendler DL. Intake of calcium and vitamin D in 3 Canadian long-
term care facilities. J Am Diet Assoc. 2002;102(2):244–7.
216. Gloth III FM, Gundberg CM, Hollis BW, Haddad J, J.G, Tobin JD. Vitamin D deficiency
in homebound elderly persons. J Am Med Assoc. 1995;274(21):1683–6.
217. Webb AR, Pilbeam C, Hanafin N, Holick MF. An evaluation of the relative contributions
of exposure to sunlight and of diet to the circulating concentrations of 25-hydroxyvitamin
D in an elderly nursing home population in Boston. Am J Clin Nutr. 1990;51(6):1075–81.
218. Beck AM, Ovesen L. Added sugars and nutrient density in the diet of elderly Danish
nursing home residents. Scand J Nutr. 2002;46(2):68–72.
219. Liu BA, Gordon M, Labranche JM, Murray TM, Vieth R, Shear NH. Seasonal prevalence
of vitamin D deficiency in institutionalized older adults. J Am Geriatr Soc.
1997;45(5):598–603.
220. Gloth FM, Tobin JD, Smith CE, Meyer JN. Nutrient intakes in a frail homebound elderly
population in the community vs a nursing home population. J Am Diet Assoc.
1996;96(6):605–7.

194
221. Johnson RM. Nutritional status of female nursing home residents: independent and
dependent eaters. 1995. p. 210 p–210 p.
222. Vikstedt T, Suominen MH, Joki A, Muurinen S, Soini H, Pitkala KH. Nutritional Status,
Energy, Protein, and Micronutrient Intake of Older Service House Residents. J Am Med
Dir Assoc. 2011;12(4):302–7.
223. Lasheras C, Huerta JM, Gonzalez S, Prada M, Braga S, Fernandez S, et al. Diet score is
associated with plasma homocysteine in a healthy institutionalised elderly population.
Nutr Metab Cardiovasc Dis. 2003 ;13(6):384–90.
224. Barr SI, Chrysomilides SA, Willis EJ, Beattie BL. Food intake of institutionalized women
over 80 years of age. J Can Diet Assoc. 1984;45(1):42–51.
225. Cameron K, Quartel L, Brice B, Crosbie K, Donnelly J. Diet: are elderly nursing home
residents getting what they need? Geriaction. 1997;15(4):14–9.
226. Rumbak I, Satalic Z, Keser I, Krbavcic IP, Giljevic Z, Zadro Z, et al. Diet Quality in
Elderly Nursing Home Residents Evaluated by Diet Quality Index Revised (DQI-R). Coll
Antropol. 2010;34(2):577–85.
227. Bonaccorsi G, Lorini C, Bani Assad G, Pepe P, Santomauro F. Serum trace elements and
risk of malnutrition in institutionalised elderly. Eur J Clin Nutr. 2013;67(2):155–60.
228. Sem SW, Sjoen RJ, Trygg K, Pedersen JI. Vitamin D status of two groups of elderly in
Oslo: living in old people’s homes and living in own homes. Compr Gerontol A.
1987;1(3):126–30.
229. McClean HE, Stewart AW, Riley CG, Beaven DW. Vitamin C status of elderly men in a
residential home. N Z Med J. 1977;86(598):379–82.
230. Huerta JM, González S, Vigil E, Prada M, San Martín J, Fernández S, et al. Folate and
cobalamin synergistically decrease the risk of high plasma homocysteine in a
nonsupplemented elderly institutionalized population. Clin Biochem. 2004;37(10):904–
10.
231. Bingham SA. The dietary assessment of individuals: Methods, accuracy, new techniques
and recommendations. Nutr Abstr Rev. 1987;(57):705–42.
232. Serra-Majem L, Ortega R, Aranceta J, Entrala A, Gil A. Fortified foods. Criteria for
vitamin supplementation in Spain. Public Health Nutr. 2001;4(6A):1331–4.
233. Bukvova H. Research as a process: A comparison between different research approaches.
2009. Report No.: 9.
234. Justham D. What is research? J Orthop Nurs. 2006;10(4):228–31.

195
235. Food and Nutrition Board. Dietary Reference Intakes for Calcium and Vitamin D -
Committee to Review Dietary Reference Intakes for Vitamin D and Calcium. Washington
D.C.: The National Academies Press; 2010.
236. De Jong-Van den Berg LT, Hernandez-Diaz S, Werler MM, Louik C, Mitchell AA.
Trends and predictors of folic acid awareness and periconceptional use in pregnant
women. Am J Obstet Gynecol. 2005;192(1):121–8.
237. Sahni S, Hannan MT, Gagnon D, Blumberg J, Cupples LA, Kiel DP, et al. Protective
effect of total and supplemental vitamin C intake on the risk of hip fracture--a 17-year
follow-up from the Framingham Osteoporosis Study. Osteoporos Int. 2009;20(11):1853–
61.
238. Bird J. The Most Popular Micronutrient of 2013 - Providing perspectives on recent
research into vitamins and nutritionals. TalkingNutrition - DSM Nutr. Prod. 2013 [cited
2014 Jul 3]. Available from:
http://www.dsm.com/campaigns/talkingnutrition/en_US/talkingnutrition-dsm-
com/2013/12/most_popular_researched_vitamin_2013.html
239. Magnus EM, Bache-Wiig JE, Aanderson TR, Melbostad E. Folate and vitamin B12
(cobalamin) blood levels in elderly persons in geriatric homes. Scand J Haematol.
1982;28(4):360–6.
240. Guralnik JM, Eisenstaedt RS, Ferrucci L, Klein HG, Woodman RC. Prevalence of anemia
in persons 65 years and older in the United States: evidence for a high rate of unexplained
anemia. Blood. 2004;104(8):2263–8.
241. Weiss G, Goodnough LT. Anemia of chronic disease. N Engl J Med. 2005;352(10):1011–
23.
242. Ovesen L, Andersen R, Jakobsen J. Geographical differences in vitamin D status, with
particular reference to European countries. Proc Nutr Soc. 2003;62(4):813–21.
243. De Groot CP, van den Broek T, van Staveren W. Energy intake and micronutrient intake
in elderly Europeans: seeking the minimum requirement in the SENECA study. Age
Ageing. 1999;28(5):469–74.
244. Darnton-Hill I, Bloem MW, de Benoist B, Brown LR. Micronutrient restoration and
fortification: Communicating change, benefits and risks. Asia Pac J Clin Nutr.
2002;11(s6):S184–S196.
245. Andersen P. A Review of Micronutrient Problems in the Cultivated Soil of Nepal. Mt Res
Dev. 2007;27(4):331–5.

196
246. Boyd M, Bowman C, Broad JB, Connolly MJ. International comparison of long-term care
resident dependency across four countries (1998-2009): a descriptive study. Australas J
Ageing. 2012;31(4):233–40.
247. Crider KS, Bailey LB, Berry RJ. Folic acid food fortification-its history, effect, concerns,
and future directions. Nutrients. 2011;3(3):370–84.
248. Van der Wielen RP, de Wild GM, de Groot LC, Hoefnagels WH, van Staveren WA.
Dietary intakes of energy and water-soluble vitamins in different categories of aging. J
Gerontol A Biol Sci Med Sci. 1996;51(1):B100–7.
249. Lowik MRH, Hulshof KFAM, Schneijder P, Schrijver J, Colen AAM, Van Houten P.
Vitamin C status in elderly women: A comparison between women living in a nursing
home and women living independently. J Am Diet Assoc. 1993;93(2):167–72.
250. Castel H, Shahar D, Harman-Boehm I. Gender differences in factors associated with
nutritional status of older medical patients. J Am Coll Nutr. 2006;25(2):128–34.
251. Sharkey JR, Branch LG. Gender difference in physical performance, body composition
and dietary intake in homebound elders. J Women Aging. 2004;16(3-4):71–90.
252. Bates CJ, Prentice a, Finch S. Gender differences in food and nutrient intakes and status
indices from the National Diet and Nutrition Survey of people aged 65 years and over. Eur
J Clin Nutr. 1999;53(9):694–9.
253. Darnton-Hill I, Webb P, Harvey PWJ, Hunt JM, Dalmiya N, Chopra M, et al.
Micronutrient deficiencies and gender: social and economic costs. Am J Clin Nutr.
2005;81(5):1198S–1205S.
254. Song H-J, Simon JR, Patel DU. Food preferences of older adults in senior nutrition
programs. J Nutr Gerontol Geriatr. 2014;33(1):55–67.
255. Harris-Kojetin L, Sengupta M, Park-Lee E, Valverde R. Long-Term Care Services in the
United States: 2013 Overview. Hyattsville; 2013.
256. Feder J, Komisar HL, Niefeld M. Long-term care in the United States: an overview.
Health Aff (Millwood). 2000;19(3):40–56.
257. Kane RA. Long-Term Care and a Good Quality of Life: Bringing Them Closer Together.
Gerontologist. 2001;41(3):293–304.
258. Berta W, Laporte A, Zarnett D, Valdmanis V, Anderson G. A pan-Canadian perspective
on institutional long-term care. Health Policy. 2006;79(2-3):175–94.
259. Appleton KM. Increases in energy, protein and fat intake following the addition of sauce
to an older person’s meal. Appetite. 2009;52(1):161–5.

197
260. Milne AC, Potter J, Vivanti A, Avenell A. Protein and energy supplementation in elderly
people at risk from malnutrition. Cochrane database Syst Rev. 2009;(2):CD003288.
261. Russell RM. Factors in aging that effect the bioavailability of nutrients. J Nutr.
2001;131(4 Suppl):1359S–61S.
262. Witte KK a, Nikitin NP, Parker AC, von Haehling S, Volk H-D, Anker SD, et al. The
effect of micronutrient supplementation on quality-of-life and left ventricular function in
elderly patients with chronic heart failure. Eur Heart J. 2005;26(21):2238–44.
263. Sahyoun NR, Otradovec CL, Hartz SC, Jacob RA, Peters H, Russell RM, et al. Dietary
intakes and biochemical indicators of nutritional status in an elderly, institutionalized
population. Am J Clin Nutr. 1988;47(3):524–33.
264. Drinka PJ, Goodwin JS. Prevalence and consequences of vitamin deficiency in the nursing
home: a critical review. J Am Geriatr Soc. 1991;39(10):1008–17.
265. Stratton RJ, Elia M. A review of reviews: A new look at the evidence for oral nutritional
supplements in clinical practice. Clin Nutr Suppl. 2007;2(1):5–23.
266. Whiteman E, Ward K, Simmons SF, Sarkisian CA, Moore AA. Testing the effect of
specific orders to provide oral liquid nutritional supplements to nursing home residents: a
quality improvement project. J Nutr Health Aging. 2008;12(9):622–5.
267. Ravasco P, Monteiro-Grillo I, Camilo M. Individualized nutrition intervention is of major
benefit to colorectal cancer patients: Long-term follow-up of a randomized controlled trial
of nutritional therapy. Am J Clin Nutr. 2012;96(6):1346–53.
268. Kennedy O, Law C, Methven L, Mottram D, Gosney M. Investigating age-related changes
in taste and affects on sensory perceptions of oral nutritional supplements. Age Ageing.
2010;39(6):733–8.
269. Darmon P, Karsegard VL, Nardo P, Dupertuis YM, Pichard C. Oral nutritional
supplements and taste preferences: 545 days of clinical testing in malnourished in-
patients. Clin Nutr. 2008;27(4):660–5.
270. Consultant Dietitians in Health Care Facilities Dietetic Practice Group. Involuntary weight
loss. In: Niedert KC, Dorner B, eds. Nutr Care Older Adult. Chicago: American Dietetic
Association; 2004. p. 202–9.
271. Wilson M-MG, Purushothaman R, Morley JE. Effect of liquid dietary supplements on
energy intake in the elderly. Am J Clin Nutr. 2002;75(5):944–7.
272. Singh MAF, Bernstein MA, Ryan AD, O’Neill EF, Clements KM, Evans WJ. The effect
of oral nutritional supplements on habitual dietary quality and quantity in frail elders. J
Nutr Health Aging. 2000;4(1):5–12.

198
273. Young KWH, Greenwood CE, Van Reekum R, Binns MA. Providing nutrition
supplements to institutionalized seniors with probable Alzheimer’s disease is least
beneficial to those with low body weight status. J Am Geriatr Soc. 2004;52(8):1305–12.
274. Fiatarone Singh MA, Bernstein MA, Ryan ND, O’Neill EF, Clements KM, Evans WJ.
The effect of oral nutritional supplements on habitual dietary quality and quantity in frail
elders. J Nutr Heal Aging. 2000;4(1):5–12.
275. Miller MD, Daniels LA, Bannerman E, Crotty M. Adherence to nutrition supplements
among patients with a fall-related lower limb fracture. Nutr Clin Pract. 2005;20(5):569–
78.
276. Munir J, Wright RJ, Carr DB. A Quality Improvement Study on Calcium and Vitamin D
Supplementation in Long-term Care. J Am Med Dir Assoc. 2006;7(5):305–9.
277. Thurman JE, Mooradian AD. Vitamin supplementation therapy in the elderly. Drugs
Aging. 1997;11(6):433–49.
278. Oakley GP. Oral synthetic folic acid and vitamin B12 supplements work--if one consumes
them. Nutr Rev. 2004;62(6 Pt 2):S22–6; discussion S27–8.
279. Zerfu TA, Ayele HT. Micronutrients and pregnancy; effect of supplementation on
pregnancy and pregnancy outcomes: a systematic review. Nutr J. Nutrition Journal;
2013;12(1):20.
280. Rivera J a, González-Cossío T, Flores M, Romero M, Rivera M, Téllez-Rojo MM, et al.
Multiple micronutrient supplementation increases the growth of Mexican infants. Am J
Clin Nutr. 2001;74(5):657–63.
281. Angeles-Agdeppa I, Schultink W, Sastroamidjojo S, Gross R, Karyadi D. Weekly
micronutrient supplementation to build iron stores in female Indonesian adolescents. Am J
Clin Nutr. 1997;66(1):177–83.
282. Urbano MRD, Vitalle MSS, Juliano Y, Amancio OMS. [Iron, copper and zinc in
adolescents during pubertal growth spurt]. J Pediatr (Rio J). 2002;78(4):327–34.
283. Gibson RS, Heath a-LM, Ferguson EL. Risk of suboptimal iron and zinc nutriture among
adolescent girls in Australia and New Zealand: causes, consequences, and solutions. Asia
Pac J Clin Nutr. 2002;11 Suppl 3:S543–52.
284. Tighe P, Ward M, McNulty H, Finnegan O, Dunne A, Strain J, et al. A dose-finding trial
of the effect of long-term folic acid intervention: implications for food fortification policy.
Am J Clin Nutr. 2011;93(1):11–8.
285. Anderson F. Vitamin D for older people: how much, for whom and--above all--why? Age
Ageing. 2005;34(5):425–6.

199
286. Canto-Costa MHS, Kunii I, Hauache OM. Body fat and cholecalciferol supplementation
in elderly homebound individuals. Brazilian J Med Biol Res. 2006;39(1):91–8.
287. Moreira-Pfrimer LD, Pedrosa MA, Teixeira L, Lazaretti-Castro M. Treatment of vitamin
D deficiency increases lower limb muscle strength in institutionalized older people
independently of regular physical activity: a randomized double-blind controlled trial.
Ann Nutr Metab. 2009;54(4):291–300.
288. Chapuy MC, Chapuy P, Meunier PJ. Calcium and vitamin D supplements: effects on
calcium metabolism in elderly people. Am J Clin Nutr. 1987;46(2):324–8.
289. Chapuy MC, Arlot ME, Duboeuf F, Brun J, Crouzet B, Arnaud S, et al. Vitamin D3 and
calcium to prevent hip fractures in the elderly women. N Engl J Med. 1992;327(23):1637–
42.
290. Dinizulu T, Griffin D, Carey J, Mulkerrin E. Vitamin D supplementation versus combined
calcium and vitamin D in older female patients - an observational study. J Nutr Health
Aging. 2011;15(8):605–8.
291. Krieg MA, Jacquet AF, Bremgartner M, Cuttelod S, Thiebaud D, Burckhardt P. Effect of
supplementation with vitamin D3 and calcium on quantitative ultrasound of bone in
elderly institutionalized women: a longitudinal study. Osteoporos Int. 1999;9(6):483–8.
292. Li K, Kaaks R, Linseisen J, Rohrmann S. Associations of dietary calcium intake and
calcium supplementation with myocardial infarction and stroke risk and overall
cardiovascular mortality in the Heidelberg cohort of the European Prospective
Investigation into Cancer and Nutrition study (EPIC-Heidelberg.) Heart.
2012;98(12):920–5.
293. Bolland MJ, Barber PA, Doughty RN, Mason B, Horne A, Ames R, et al. Vascular events
in healthy older women receiving calcium supplementation: randomised controlled trial.
Br Med J. 2008;336(7638):262–6.
294. Reid IR, Bolland MJ. Calcium supplements: bad for the heart? Heart. 2012;98(12):895–6.
295. Grieger JA, Nowson CA, Jarman HF, Malon R, Ackland LM. Multivitamin
supplementation improves nutritional status and bone quality in aged care residents. Eur J
Clin Nutr. 2009;63(4):558–65.
296. Monget AL, Richard MJ, Cournot MP, Arnaud J, Galan P, Preziosi P, et al. Effect of 6
month supplementation with different combinations of an association of antioxidant
nutrients on biochemical parameters and markers of the antioxidant defence system in the
elderly. Eur J Clin Nutr. 1996;50(7):443–9.

200
297. Favrat B, Vaucher P, Herzig L, Burnand B, Ali G, Boulat O, et al. Oral vitamin B12 for
patients suspected of subtle cobalamin deficiency: a multicentre pragmatic randomised
controlled trial. BMC Fam Pract. 2011;12:2.
298. Bonjour JP, Benoit V, Payen F, Kraenzlin M. Consumption of yogurts fortified in vitamin
D and calcium reduces serum parathyroid hormone and markers of bone resorption: a
double-blind randomized controlled trial in institutionalized elderly women. J Clin
Endocrinol Metab. 2013;98(7):2915–21.
299. O’Donnell S, Cranney A, Horsley T, Weiler HA, Atkinson SA, Hanley DA, et al. Efficacy
of food fortification on serum 25-hydroxyvitamin D concentrations: systematic review.
Am J Clin Nutr. 2008;88(6):1528–34.
300. Heaney RP, Davies KM, Chen TC, Holick MF, Barger-Lux MJ. Human serum 25-
hydroxycholecalciferol response to extended oral dosing with cholecalciferol. Am J Clin
Nutr. 2003;77(1):204–10.
301. Van der Wielen RP, van Heereveld HA, de Groot CP, van Staveren WA. Nutritional status
of elderly female nursing home residents; the effect of supplementation with a
physiological dose of water-soluble vitamins. Eur J Clin Nutr. 1995;49(9):665–74.
302. Russell RM. The aging process as a modifier of metabolism. Am J Clin Nutr. 2000;72(2
Suppl):529S–32S.
303. Marian M, Sacks G. Micronutrients and older adults. Nutr Clin Pract. 2009;24(2):179–95.
304. Osteoporosis Canada. Calcium Requirements -Calcium: An Important Nutrient that Builds
Stronger Bones. 2014 [cited 2014 Aug 1]. Available from:
http://www.osteoporosis.ca/osteoporosis-and-you/nutrition/calcium-requirements
305. Holick MF, Binkley NC, Bischoff-Ferrari HA, Gordon CM, Hanley DA, Heaney RP, et al.
Evaluation, Treatment, and Prevention of Vitamin D Deficiency: an Endocrine Society
Clinical Practice Guideline. J Clin Endocrinol Metab. 2011;96(7):1911–30.
306. Michels AJ, Joisher N, Hagen TM. Age-related decline of sodium-dependent ascorbic acid
transport in isolated rat hepatocytes. Arch Biochem Biophys. 2003;410(1):112–20.
307. Kochersberger G, Bales C, Lobaugh B, Lyles KW. Calcium supplementation lowers
serum parathyroid hormone levels in elderly subjects. J Gerontol. 1990;45(5):M159–62.
308. Colman N, Green R, Metz J. Prevention of folate deficiency by food fortification. II.
Absorption of folic acid from fortified staple foods. Am J Clin Nutr. 1975;28(5):459–64.
309. Pfeiffer CM, Rogers LM, Bailey LB, Gregory JF. Absorption of folate from fortified
cereal-grain products and of supplemental folate consumed with or without food

201
determined by using a dual-label stable-isotope protocol. Am J Clin Nutr.
1997;66(6):1388–97.
310. Fine KD, Santa Ana C a, Porter JL, Fordtran JS. Intestinal absorption of magnesium from
food and supplements. J Clin Invest. 1991;88(2):396–402.
311. Salva A, Coll-Planas L, Bruce S, De Groot L, Andrieu S, Abellan G, et al. Nutritional
assessment of residents in long-term care facilities (LTCFs): recommendations of the task
force on nutrition and ageing of the IAGG European region and the IANA. J Nutr Health
Aging. 2009;13(6):475–83.
312. Nahin RL, Pecha M, Welmerink DB, Sink K, DeKosky ST, Fitzpatrick AL. Concomitant
use of prescription drugs and dietary supplements in ambulatory elderly people. J Am
Geriatr Soc. 2009;57(7):1197–205.
313. Hannon-Fletcher MP, Armstrong NC, Scott JM, Pentieva K, Bradbury I, Ward M, et al.
Determining bioavailability of food folates in a controlled intervention study. Am J Clin
Nutr. 2004;80(4):911–8.
314. Hurrell RF, Lynch S, Bothwell T, Cori H, Glahn R, Hertrampf E, et al. Enhancing the
Absorption of Fortification Iron. Int J Vitam Nutr Res. 2004;74(6):387–401.
315. Hurrell R. How to ensure adequate iron absorption from iron-fortified food. Nutr Rev.
2002;60(7 Pt 2):S7–15; discussion S43.
316. Smoliner C, Norman K, Scheufele R, Hartig W, Pirlich M, Lochs H. Effects of food
fortification on nutritional and functional status in frail elderly nursing home residents at
risk of malnutrition. Nutrition. 2008;24(11-12):1139–44.
317. Pepsico. Demystifying Canada ’ s Complex Regulations for Vitamin and Mineral
Fortification. 2005;1–2.
318. Freedhoff Y. Canada leads charge to allow industry to fortify foods. CMAJ.
2010;182(5):426–7.
319. Seiler WO. Clinical pictures of malnutrition in ill elderly subjects. Nutrition.
2001;17(6):496–8.
320. Cheung G, Pizzola L, Keller H. Dietary, food service, and mealtime interventions to
promote food intake in acute care adult patients. J Nutr Gerontol Geriatr. 2013;32(3):175–
212.
321. Hotz C, Gibson RS. Traditional food-processing and preparation practices to enhance the
bioavailability of micronutrients in plant-based diets. J Nutr. 2007;137(4):1097–100.

202
322. Canadian Malnutrition Task Force. Canadian Malnutrition Task Force: CMTF. 2014
[cited 2014 Aug 18]. Available from: http://nutritioncareincanada.ca/
323. Keller HH, Vesnaver E, Davidson B, Allard J, Laporte M, Bernier P, et al. Providing
quality nutrition care in acute care hospitals: perspectives of nutrition care personnel. J
Hum Nutr Diet. 2014;27(2):192–202.
324. Ontario Ministry of Health and Long-Term Care. Long-Term Care Homes Act, 2007.
2010.
325. Mila Villarroel R, Abellana Sangra R, Padro Massaguer L, Farran Codina A. Assessment
of food consumption, energy and protein intake in the meals offered in four Spanish
nursing homes. Nutr Hosp. 2012;27(3):914–21.
326. Dahl WJ, Whiting SJ, Tyler RT. Protein content of puréed diets: implications for
planning. Can J Diet Pract Res. 2007;68(2):99–102.
327. Sitter M, Lengyel C. Nutritional Status and Eating Habits of Older Manitobans After
Relocating to a Personal Care Home. Can J Diet Pract Res. 2011;72(2):84.
328. Castellanos VH. Food and nutrition in nursing homes. Gener Am Soc Aging.
2004;28(3):65–71.
329. Lam I, Keller H, Stark K, Duizer L. Enhancing food in long-term care: Strategies to
improve micronutrient quality of food on the menu (Abstract Only). Build Transform
Improv Care Transitions (Long Term Care Appl Res Day). Toronto: Ontario Long Term
Care Association; 2014.
330. Canadian Agency for Drugs and Technologies in Health. Vitamin D Supplements for
Elderly Patients in Residential Care : Policies and Protocols. Ottawa; 2010 p. 1–6.
331. Simmons SF, Babineau S, Garcia E, Schnelle JF. Quality assessment in nursing homes by
systematic direct observation: Feeding assistance. Journals Gerontol - Ser A Biol Sci Med
Sci. 2002;57(10):M665–M671.
332. Kayser-Jones J. Inadequate staffing at mealtime: implications for nursing and health
policy... this paper was presented at the American Academy of Nursing Annual Meeting
and Conference, “On the Brink of Discovery: Implications for our Aging Society,”
Orlando, Florida, No. J Gerontol Nurs. 1997;23(8):14–21.
333. Evans BC, Crogan NL. Quality improvement practices: enhancing quality of life during
mealtimes. J Nurses Staff Dev. 2001;17(3):131–6.
334. Desai J, Winter A, Young KWH, Greenwood CE. Changes in Type of Foodservice and
Dining Room Environment Preferentially Benefit Institutionalized Seniors with Low
Body Mass Indexes. J Am Diet Assoc. 2007;107(5):808–14.

203
335. Dietitians of Canada. Inadequate funding for food in Alberta’s continuing care facilities,
Report. 2014 [cited 2014 Aug 21]. Available from: http://www.dietitians.ca/News-
Releases/Food-Costs-in-Continuing-Care-in-Alberta.aspx
336. Crogan NL, Alvine C, Pasvogel A. Improving nutrition care for nursing home residents
using the INRx process. J Nutr Elder. 2006;25(3-4):89–103.
337. Cameron ID, Kurrle SE, Uy C, Lockwood K a, Au L, Schaafsma FG. Effectiveness of oral
nutritional supplementation for older women after a fracture: rationale, design and study
of the feasibility of a randomized controlled study. BMC Geriatr. 2011 Jan;11(1):32.
338. Romanow RJ. Building on Values: The Future of Health Care in Canada - Final Report.
Saskatoon; 2002.
339. Simmons SF, Lam HY, Rao G, Schnelle JF. Family members’ preferences for nutrition
interventions to improve nursing home residents' oral food and fluid intake. J Am Geriatr
Soc. 2003;51(1):69–74.
340. Service Canada. Dietitians and Nutritionists. Gov. Canada. 2013 [cited 2014 Mar 21].
Available from: http://www.servicecanada.gc.ca/eng/qc/job_futures/statistics/3132.shtml
341. Sazawal S, Habib a KMA, Dhingra U, Dutta A, Dhingra P, Sarkar A, et al. Impact of
micronutrient fortification of yoghurt on micronutrient status markers and growth - a
randomized double blind controlled trial among school children in Bangladesh. BMC
Public Health. 2013;13(1):514.
342. Kupferschmidt K. Uncertain verdict as vitamin D goes on trial. Science.
2012;337(6101):1476–8.
343. Begley A, Coveney J. Wonder vitamin or mass medication? Media and academic
representation of folate fortification as a policy problem in Australia and New Zealand.
Aust N Z J Public Health. 2010;34(5):466–71.
344. Berry D. Trends in Fortification. Dairy Foods. 2004;105(4):36–41.
345. Kramish Campbell M, Meier A, Carr C, Enga Z, James AS, Reedy J, et al. Health
behavior changes after colon cancer: a comparison of findings from face-to-face and on-
line focus groups. Fam Community Health. 2001;24(3):88–103.
346. Hedrick VE, Dietrich AM, Estabrooks P a, Savla J, Serrano E, Davy BM. Dietary
biomarkers: advances, limitations and future directions. Nutr J. Nutrition Journal;
2012;11(1):109.
347. Vandevijvere S, Geelen a, Gonzalez-Gross M, van’t Veer P, Dallongeville J, Mouratidou
T, et al. Evaluation of food and nutrient intake assessment using concentration biomarkers

204
in European adolescents from the Healthy Lifestyle in Europe by Nutrition in Adolescence
study. Br J Nutr. 2013;109(4):736–47.
348. Hamid Z, Riggs A, Spencer T, Redman C, Bodenner D. Vitamin D deficiency in residents
of academic long-term care facilities despite having been prescribed vitamin D. J Am Med
Dir Assoc. 2007;8(2):71–5.
349. Cherniack E, Florez H, Roos B, Troen B, Levis S. Hypovitaminosis D in the elderly: From
bone to brain. J Nutr Heal Aging. 2008;12(6):366–73.
350. Berner YN, Stern F, Polyak Z, Dror Y. Dietary intake analysis in institutionalized elderly:
A focus on nutrient density. J Nutr Heal Aging. 2002;6(4):237–42.
351. Reed PS, Zimmerman S, Sloane PD, Williams CS, Boustani M. Characteristics associated
with low food and fluid intake in long-term care residents with dementia. Gerontologist.
2005;1(1):74-80.
352. Johnson S, Nasser R, Banow T, Cockburn T, Voegeli L, Wilson O, et al. Use of oral
nutrition supplements in long-term care facilities. Can J Diet Pract Res. 2009;70(4):194–8.
353. Ilhamto N, Anciado K, Keller HH, Duizer LM. In-house pureed food production in long-
term care: perspectives of dietary staff and implications for improvement. J Nutr Gerontol
Geriatr. 2014;33(3):210–28.
354. Ogunlade AO, Kruger HS, Jerling JC, Smuts CM, Covic N, Hanekom SM, et al. Point-of-
use micronutrient fortification: lessons learned in implementing a preschool-based pilot
trial in South Africa. Int J Food Sci Nutr. 2011;62(1):1–16.
355. Anand P, Sternthal B. Ease of Message Processing as a Moderator of Repetition Effects in
Advertising. J Mark Res. 1990;27(3):345.
356. Breuer B, Wallenstein S, Feinberg C, Camargo MJ, Libow LS. Assessing life
expectancies of older nursing home residents. J Am Geriatr Soc. 1998;46(8):954–61.
357. Lubitz J, Cai L, Kramarow E, Lentzner H. Health, life expectancy, and health care
spending among the elderly. N Engl J Med. 2003;349(11):1048–55.
358. Muramatsu N, Yin H, Campbell RT, Hoyem RL, Jacob A, Ross CO. Risk of Nursing
Home Admission Among Older Americans: Does States’ Spending on Home- and
Community-Based Services Matter? J Gerontol B Psychol Sci Soc Sci. 2007;62(3):S169–
S178.
359. Taylor DH, Osterman J, Will Acuff S, Ostbye T. Do seniors understand their risk of
moving to a nursing home? Health Serv Res. 2005;40(3):811–28.

205
360. Flacker JM, Kiely DK. Mortality-related factors and 1-year survival in nursing home
residents. J Am Geriatr Soc. 2003;51(2):213–21.
361. Gambassi G, Landi F, Lapane KL, Sgadari A, Mor V, Bernabei R. Predictors of mortality
in patients with Alzheimer’s disease living in nursing homes. J Neurol Neurosurg
Psychiatry. 1999;67(1):59–65.
362. Rothera IC, Jones R, Harwood R, Avery AJ, Waite J. Survival in a cohort of social
services placements in nursing and residential homes: factors associated with life
expectancy and mortality. Public Health. 2002;116(3):160–5.

206
Appendices
Appendix A

207
Appendix B
Webinar invitation letter – Dietitians of Canada Example
Dear [name of Registered Dietitian],
Here is an opportunity to participate in a LTC food fortification study. See the details and contact information below.
Debra McLennan, RD Chair, Gerontology Network
Faculty of Applied Health Sciences Department of Kinesiology
University of Waterloo
PARTICIPANTS NEEDED FOR RESEARCH IN
“ENHANCING FOOD IN LONG-TERM CARE”
WHO: Nutrition Managers, Chefs and Dietitians in Long-Term Care
WHAT: We would like to invite you to take part in a webinar to discuss how to improve
the nutrient quality of food provided to long-term care residents in Canada. One strategy is to fortify the food with vitamins and minerals. As staff in a long-term care home, you have unique understandings relating to issues, challenges, and strategies to improve
your residents’ food intake. We are interested in hearing your opinions on this specific strategy of fortifying key food products.
HOW: As a participant in this study, you would be asked to provide your insights and opinions on fortification of food products during a webinar focus group with other long-term care personnel. Participation requires a computer with internet access and a
phone line. Your participation would involve one 45-minute session.
WHY: Your participation will help us to determine if food fortification is an acceptable and feasible strategy to improve nutrient intake of residents. For more information about this study, or to volunteer for this study, please contact:
Ivy Lam, BASc MSc Candidate, Dept. Kinesiology
University of Waterloo Email: [email protected] This study has been reviewed by, and received ethics clearance through, the Office of Research Ethics, University of Waterloo.

208
Appendix C
Webinar Pre-Session Registration Survey
Enhancing Food in Long Term Care
Thank you for your interest in our webinar to discuss how to improve the nutrient quality of food
provided to long-term care residents in Canada. As a participant in this study, you will be asked
to provide your insights and opinions on vitamin and mineral fortification of food products
during a webinar focus group with other long-term care personnel. Participation requires a
computer with internet access and a phone line.
* Required
1. Full Name *_______________________
2. Email address *_______________________
3. Phone number (The number we will be contacting you at) *_______________________
4. Which city and province do you work in? (This will give us a better understanding of
different time zones and help us with the grouping assignment of the webinars. (e.g.
Toronto, ON)) * _______________________
5. What is your current work position? *
Registered Dietitian
Nutrition Manager
Chef
Other______________________
6. How long have you been working in Long Term Care? *
Less than 1 year
1- 5 years
5 - 10 years
10 - 15 years
>15 years
7. Webinar dates: (Please pick THREE) *

209
You are only required to attend ONE webinar. Please note: 11-12 pm EST (e.g. Ontario)
= 8-9 am PST (e.g. BC) = 9-10 am MST (e.g. AB) = 10-11am CST (e.g. MB)
[LIST OF SESSION DATES]
8. If none of the times above work for you, please list additional date(s) and time(s) that you
would prefer:
9. Will anyone else be joining you in the webinar?
10. Please list their name(s) and position(s). (E.g. Ivy Lam, Registered Dietitian) 11. Comments?

210
Appendix D
Webinar Outline and Discussion Questions

211

212
Appendix E
Webinar PowerPoint Presentation

213

214

215
Appendix F
Webinar Feedback Form
Feedback Form: Enhancing Food in Long-Term Care
We would like to thank you for your participation in the Enhancing Food in Long-Term Care
webinar focus group (determining the need, acceptability, and protocols for micronutrient food
fortification). As a reminder, the purpose of this study was to address the complex issue of
micronutrient malnutrition through determining the feasibility of micronutrient fortification of
food in long-term care.
* Required I am a *
o Chef
o Dietitian
o Nutrition Manager
o Other: Please tell us which city AND province you work in. *
Overall Webinar
Please rate how much you agree with the following statement: The webinar was what I had expected. * Checkbox option: 1 (completely disagree) to 5 (completely agree) If it did not meet your expectations, how can we improve the webinar so that it would meet your expectations? If it exceeded your expectations, please also explain. Your response will help us improve future sessions. Thank you. During the webinar, how much of the INFORMATION PRESENTED were you able to understand? * Checkbox option: 1 (none of it) to 5 (all of it) During the webinar, how much of the DISCUSSION were you able to understand? * Checkbox option: 1 (none of it) to 5 (all of it)
What would help improve the understandability of the INFORMATION PRESENTED?

216
The length of time (1 hour) for this webinar was__________. *
o Too short
o Just right
o Too long I communicated as much as I had wanted to in the webinar.* (If you select "No," please ALSO use the "other" section to provide an explanation)
o Yes
o No
o Other: The group was given enough time for discussion. *
o Yes
o No
o Other: The size of the group (4-6 participants) was *
o Too small
o Just right
o Too large
Using WebEx - Online Focus Groups
Next, we want to learn more about your experience in using the online focus group format. I found the WebEx (webinar) program easy to use *
o Yes
o No
o Somewhat It took me ________ minutes to sign on to the webinar session. *
o <5 minutes
o 5 - 10 minutes
o >10 minutes The information I was sent before the webinar was ____________ to prepare me for the webinar focus group.*
o Not enough
o Just enough
o Too much

217
Please rate the following on a scale of 1 to 5:
(1=strongly agree; 5 = strongly disagree)
It was easy to sign on to the webinar. * Checkbox option: 1=strongly disagree; 5 = strongly agree It was easy to use the webinar program. * Checkbox option: 1=strongly disagree; 5 = strongly agree I had no problem hearing THE FACILITATOR in the webinar. * Checkbox option: 1=strongly disagree; 5 = strongly agree I had no problem hearing OTHER PARTICIPANTS in the webinar. * Checkbox option: 1=strongly disagree; 5 = strongly agree Compared to an in-person focus group, the online focus group was _________. *
o Better
o Worse
o The same I would recommend online webinar focus groups for this type of research. *
o Yes
o No
o Not sure
Final suggestions
(Almost there. Thank you for your patience.) What did you like about this session? What could we have done to improve this session for you? How can we improve sessions for future attendees? What was the most valuable thing you learned from the webinar (presentation, polling questions, and/or group discussion)? I would have liked to learn more about _______________. Additional comments
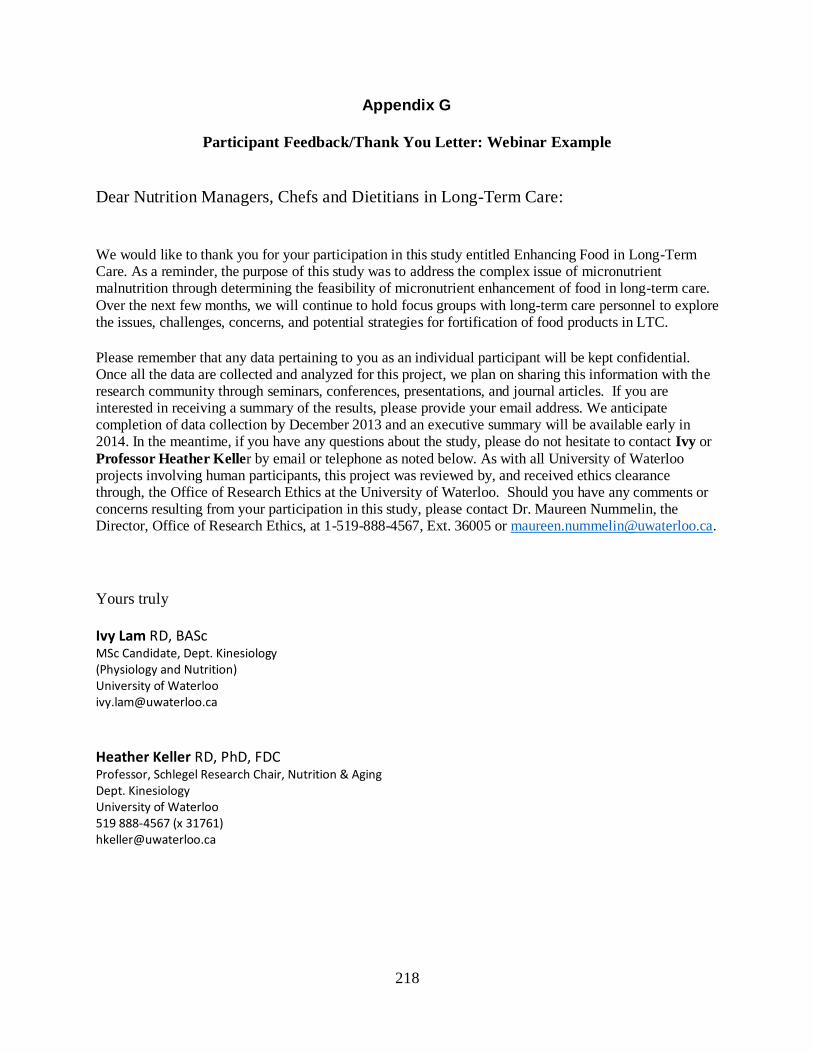
218
Appendix G
Participant Feedback/Thank You Letter: Webinar Example
Dear Nutrition Managers, Chefs and Dietitians in Long-Term Care:
We would like to thank you for your participation in this study entitled Enhancing Food in Long-Term Care. As a reminder, the purpose of this study was to address the complex issue of micronutrient malnutrition through determining the feasibility of micronutrient enhancement of food in long-term care.
Over the next few months, we will continue to hold focus groups with long-term care personnel to explore the issues, challenges, concerns, and potential strategies for fortification of food products in LTC.
Please remember that any data pertaining to you as an individual participant will be kept confidential. Once all the data are collected and analyzed for this project, we plan on sharing this information with the research community through seminars, conferences, presentations, and journal articles. If you are interested in receiving a summary of the results, please provide your email address. We anticipate completion of data collection by December 2013 and an executive summary will be available early in 2014. In the meantime, if you have any questions about the study, please do not hesitate to contact Ivy or
Professor Heather Keller by email or telephone as noted below. As with all University of Waterloo projects involving human participants, this project was reviewed by, and received ethics clearance through, the Office of Research Ethics at the University of Waterloo. Should you have any comments or concerns resulting from your participation in this study, please contact Dr. Maureen Nummelin, the Director, Office of Research Ethics, at 1-519-888-4567, Ext. 36005 or [email protected].
Yours truly
Ivy Lam RD, BASc MSc Candidate, Dept. Kinesiology (Physiology and Nutrition) University of Waterloo [email protected]
Heather Keller RD, PhD, FDC Professor, Schlegel Research Chair, Nutrition & Aging Dept. Kinesiology University of Waterloo 519 888-4567 (x 31761) [email protected]

219
Appendix H

220

221
Appendix I
Key Informant Interview Outline and Questions

222

223
Appendix J
Resident/Family Focus Group Information Letter
Dear Food Committee attendee, This letter is an invitation to participate in a research study. As a MSc. student Applied
Health Sciences at the University of Waterloo, I am currently conducting research under
the supervision of Professor Heather Keller on micronutrient enhancement of food in
long-term care homes.
Nutrient deficiency is a prevalent but preventable problem among older adults living in
long-term care. Inadequate intake of nutrients affects function, cognition, and quality of
life. A varied diet is needed to meet nutrient requirements, but changes with age affect
taste, appetite, and nutrient use by the body, leading to an increased likelihood of
insufficient nutrition. Improving food quality through nutrient enhancement of regular
food may allow older adults to meet nutrient requirements through foods rather than pills
or liquid supplements.
The purpose of this group discussion at your Food Committee is to examine the
feasibility of nutrient fortification of food in long term care and retirement homes. Focus
groups and key informant interviews have already been done with long term care staff
(dietitians, nutrition managers, chefs) to determine their opinion about enhancing foods.
The opinion of residents and/or their families is important to ensure that we also
understand your perspective. Our intent is to use the open forum discussion of the Food
Committee to present this strategy for improving nutrition of residents and identify any
concerns you may have with this strategy.
Kinesiology – Physiology
and Nutrition
University of Waterloo
200 University Avenue West
Waterloo, Ontario, Canada
N2L 3G1
N@L
519 888-4567, 31761

224
Discussion will occur in the open forum of the Food Committee. We will take notes of
your comments and discussion points. As well, we will leave you with a one-page
feedback form where you can anonymously provide any further comments.
Being present in the Food Committee meeting does not mean that you must participate
in the discussion or provide a feedback form. Your name and the name of your
organization will not appear in any thesis or publication resulting from this study.
If you have any questions regarding this study, or would like additional information
about participation or the results, please contact my supervisor Professor Heather Keller
by telephone at 1-519-888-4567 ext. 31761 or by email at [email protected].
This study has been reviewed and received ethics clearance through the Office of
Research Ethics at the University of Waterloo. If you have any comments or concerns
about this study, please contact Dr. Maureen Nummelin in the Office of Research Ethics
at 1-519-888-4567, Ext. 36005 or [email protected].
Thank you in advance for your interest and assistance with this research.
Yours very truly,
Ivy Lam
RD, MSc Candidate

225
Appendix K
Family/Resident Focus Group Consent Form
Agreement to participate
By signing this consent form, you are not waiving your legal rights or releasing the investigator(s) or involved institution(s) from their legal and professional responsibilities. I have read the information letter about the micronutrient enhancement of food in long term care study under the supervision of Professor Heather Keller at the University of Waterloo. I have had an opportunity to ask any questions related to this study, to receive satisfactory answers to my questions, and any additional details I wanted. I was informed that I may withdraw my consent at any time without penalty by advising the researcher. By providing your signature below, I provide my consent to participate in this study.
Print Name
Signature
Date
Witness

226
Appendix L
Family/Resident Focus Group Question Outline and Feedback Questionnaire
Enhancing Food in Long-Term Care
Food Committee Focus Group Discussion Questions
1. Are you concerned that some residents do not get enough nutrition from the food they eat?
2. What do you think of this strategy for adding nutrients to food products consumed by most
residents? Probe: concerns about safety, quality of food, ‘doctroing up’ food etc.
Food Committee Feedback F0rm
1. On a scale of 1(not at all) to 5 (very much so) how acceptable to
you is the strategy of adding nutrients to regular food to improve
the nutrition of residents in long term care? (Please check ONE of
the boxes below)
1 (Not at all)
2
3
4
5 (Very much so)
2. What do you like about this strategy?
3. What are your concerns with this strategy?

227
TABLES
Table 1. Database Search Terms Database Search Terms
Medline – OVID
Subject Headings
1. Exp food, fortified/ OR exp foods, specialized/ OR eating/ OR nutrition therapy/ OR diet therapy/ OR food analysis/
2. long-term care/ OR exp residential facilities/ OR exp nursing home/ Note:
EXPLODE Foods, specialized (includes: food, fortified AND food, formulated AND functional food AND health food);
EXP food, fortified (includes prebiotics)
EXP dietary supplements (incl: prebiotics, probiotics, synbiotics, yeast)
EXP eating (incl: drinking, mastication)
EXP residential Facilities (incl: assisted living facilities, group homes, homes for the aged)
EXP nursing homes (incl: intermediate care facilities, skilled nursing facilities)
Medline - OVID
Author Key words 1. (Fortified adj2 food$).tw. OR (food fortif$).tw. OR eating.tw. OR (food$
adj2 intake$).tw. OR (oral$ adj2 intake$).tw. OR ((food$ or meal$ or drink$ or beverage$ or diet$ or snack$ or breakfast$ or break-fast$ or lunch$ or dinner$) adj5 (fortif$ or enrich$ or supplement$)).tw. OR (food$ adj2 enhance$).tw.
2. (long term care$ or long-term care$ or nursing home$ or retirement home$ or residential facilit$).tw. OR (geriatric adj2 (home$ or unit$ or facilit$ or institution$)).tw.
CINAHL
Subject Headings
1. MH Food, fortified OR MH food, formulated OR MH dietary supplements+ OR MH food analysis OR MH eating OR MH food intake
2. MH long term care OR MH residential care OR MH nursing home patients OR nursing homes+ OR residential facilities
Note:
Food, fortified (already at end of tree)
Food, formulated (+ includes infant formula, but one article used infant formula for older adults)
Not (+) residential care b/c incl respite care
Nursing home+ incl skilled nursing facilities
CINAHL
Author Key words 1. TI fortified food* OR AB fortified food* OR TI food fortif* OR AB food fortif*
OR TI eating OR AB eating OR TI food* intake* OR AB food* intake* OR TI oral* intake* OR AB oral* intake* OR MH food, fortified OR MH food, formulated OR MH "dietary supplements+" OR MH food analysis OR MH eating OR MH food intake OR TI food enrich* OR AB food enrich*
OR TI meal supplement* OR AB meal supplement* OR TI diet fortif* OR AB diet fortif* OR TI diet enrich* OR AB diet enrich* OR TI food* enhance* OR AB food* enhance*
2. TI long term care OR AB long term care OR TI long-term care OR AB long-term care OR TI nursing home* OR AB nursing home* OR TI retirement home* OR AB retirement home* OR TI residential facilit* OR AB residential facilit* OR MH long term care OR MH residential care OR MH nursing home patients OR MH "nursing homes+" OR MH residential facilities OR TI geriatric home* OR AB geriatric home* OR TI

228
geriatric unit* OR AB geriatric unit* OR TI geriatric facilit* OR AB geriatric facilit* OR TI geriatric institution* OR AB geriatric institution*
Web of Science Subject Headings Not applicable
Web of Science
Author Key words
1. TS=(eating) OR TI=(eating) OR TI=((food intake*)) OR TS=((food intake*)) OR TI=((oral intake*)) OR TS=((oral intake*)) OR TI=((food fortif*)) OR TS=(( food fortif*)) OR TI=((fortified food*)) OR TS=((fortified food*)) OR TS=((food* enhance*)) OR TI=((food* enhance*))
2. TS=((long-term care*)) OR TI=((long-term care*)) OR TI=((nursing home*)) OR TS=((nursing home*)) OR TI=((long term care*)) OR TS=((long term care*)) OR TS=((residential facilit*)) OR TI=((residential facilit*)) OR TS=((retirement home*)) OR TI=((retirement home*))
EMBASE
Subject Headings
1. Exp diet supplementation/ OR eating/ OR food intake/ OR diet therapy/ OR food analysis/
2. Exp home for the aged/ OR exp residential home/ OR exp nursing home/ OR exp nursing home patient/
Note:
EXP Food supplementation o (used for: diet additive, diet supplement, dietary supplement,
dietary supplementation dietary supplements, food supplement; food, fortified; nutritional supplementation, supplementary diet)
o (EXP includes: )
Diet therapy o (used for: diet treatment, dietary therapy, dietary treatment,
nutrition therapy)
EXP nursing home o (used for: convalescence home, nursing homes, skilled nursing
facilities)
EXP Nursing home patient o (used for: long term care patient, nursing home resident)
EXP Home for the aged o (used for: homes for the aged, housing for the elderly, old age
home, old people home)
EXP residential home o (used for: group home, residential facilities, residential institution)
DID NOT USE Long term care here, because: o (Used for: chronic treatment, life support care, long term therapy,
long term treatment; medical care, long term; treatment, long term)
EMBASE
Author Key words
1. (Fortified adj2 food$).tw. OR (food fortif$).tw. OR eating.tw. OR (food$ adj2 intake$).tw. OR (oral$ adj2 intake$).tw. OR ((food$ or meal$ or drink$ or beverage$ or diet$ or snack$ or breakfast$ or break-fast$ or lunch$ or dinner$) adj5 (fortif$ or enrich$ or supplement$)).tw. OR (food$ adj2 enhance$).tw.
2. (long term care$ or long-term care$ or nursing home$ or retirement home$ or residential facilit$).tw. OR (geriatric adj2 (home$ or unit$ or facilit$ or institution$)).tw.

229
Table 2. Micronutrients of Concern from Intake Studies (by type and length of study) Authors Length No. of
participa
nts
Mean Age
(Unless stated
otherwise)
Unique
Characteristics
and Notes
<50% RDA*
[Total or Male/Female, unless
stated otherwise]
50-99% RDA*
[Total or Male/Female, unless
stated otherwise]
>99% RDA*
[Total or Male/Female, unless
stated otherwise]
Weighed Food Records (WFR)
Wendland et
al., 2003
(Canada)
21 -day
WFR
23
(M=3,
F=20)
86(6)y Cognitively
impaired residents
who retained the
ability to feed themselves
Ca (458±140 mg) C (75.6±28.7 mg)
B1 (0.7±0.2 mg)
B2 (1.2±0.4 mg)
B3 (9.0±2.9 NE)
A (1180±700 µg RE)
Fe (12.3±3.7 mg)
P (789±228 mg)
Garcia-Arias et al., 2003
(Spain)
7-day
WFR
124 (M=60,
F=64)
80.5(6.5)y (range: 65-98y)
Nursing home residents
Folate (211.9±47.0/202.5±44.7 µg)
C (119.2±53.5/118.6±35.7 mg) B12 (2.7±1.4/3.0±0.7 µg)
Fe (17.0±7.4 mg/11.8±1.5 mg)
Moreiras-
Varela et al.,
1986 (Spain)
7-day
WFR
53
(M=19,
W=34)
82y (range: 68-
91y)
Healthy,
institutionalized
adults
A (329±54/310±62 µg)
D (0.7±0.2/0.6±0.3 µg)
Folate (139±18/131±23 µg) Ca (394±79/380±100 mg)
B1 (0.9±0.08/0.9±0.09 mg)
B2 (0.9±0.07/0.9±0.13 mg)
Mg (223±17/204±20 mg) Zn (9±1 mg - male)
C (123±10/113±21 mg)
B3 (24±2/22±2 mg)
B12 (4±1/4±1 µg) Fe (11±1/10±1 mg)
I (162±59/151±70 µg)
Zn (9±1mg - female)
Lammes et
al., 2009
(Sweden)
5-day
WFR
52
(M=11,
F=41)
84(7.3)y
M=81(7.8)y,
F=85(6.9)y
Multimorbid
residents;
WFR repeated 3x over 1.5 years
D (3.9 µg)
E (4.6 mg)
Folate (168 µg) Mg (203 mg)
K* (2122 mg)
Se (25 µg)
A (1157 µg RE)
C (61 mg)
B1 (0.95 mg) B6 (1.2 mg)
Ca (824 mg)
Fe (6.7 mg)
Zn (7.1 mg)
B2 (1.4 mg)
B3 (19 NE)
B12 (6.3 µg) P (975 mg)
Na (2246 mg)
Lammes et al., 2006
(Sweden)
5-day
WFR
52 (M=11,
F=41)
84(7.3)y M=81(7.8)y,
F=85(6.9)y
Multimorbid residents;
WFR repeated 3x
over 1.5 years
D (4.5±1.4/3.5±1.3 µg) E (4.8±1.2/4.2±1.4 TE)
C (41±17 mg - male)
Folate (168±50/162±60 µg)
K* (2280±422/2130±543 mg) Se (26±8/25±7 µg)
C (48±26 mg - female) B1 (1.1±0.3/0.9±0.3 mg)
B6 (1.4±0.3/1.2±0.3 mg)
Ca (791±264/812±275 mg)
Fe (7±1/6±2 mg) Mg (220±40/202±51 mg)
Zn(8±2/7±2 mg)
A (1845±856/1341±1000 µg RE)
B2 (1.4±0.4/1.4±0.5 mg)
B3 (24±5/19±5 NE)
B12 (8±6/8±7 µg) P (1054±267/974±26 mg)
Na (2794±707/2197±459 mg)
Barr et al.,
1984
[Canada]
5-day
WFR
30 90.6y
(range: 81-
102y)
Female LTC
residents
Ca (518.4±210.4 mg) A (635±254 µg RE)
B1 (0.74±0.20 mg)
B2 (1.02±0.37 mg)
Zn (6.0±1.7 mg)
C (76.9±34.8 mg)
B3 (15.8±4.6 mg NE)
Fe (8.1±1.8 mg)
Perez-Llama et al., 2008
(Spain)
4-day
WFR
86 (M=29, F=57)
77.4(8.1)y M=72.2(7.0)y,
F=80.4(7.2)y
Residents from 3 nursing homes;
WFR included food
and fluids at meals
D (3.90±4.64/2.49±1.15 µg) Ca (851±211/838±259 mg)
Lopez-
Contreras et
al., 2010 (Spain)
4-day
WFR
252
(M=101,
F=151)
78.9(7.6)y
M=76.1(8.0)y,
F=80.7(6.8)y
Nursing home
residents
Folate (199±76 µg - female) Folate (220±79 µg - male) C(166±71/153±69 mg)
B12 (4.37±2.98/3.88±2.06 µg)
Fe (13.6±4.4/11.5±3.5 mg)

230
Vir et al.,
1979
(Ireland)
3-day
WFR
26
(M=9,
F=17)
80.6y (range
65-95y)
Residential
accommodation;
EFR filled by the
caretakers
D (1.25±0.68/1.07±0.39 µg)
C (36.7±13.07/31.1±9.53 mg)
B1 (0.83±0.18/0.81±0.14 mg)
B6 (1.17±0.39/0.93±0.18 mg)
Ca (892±81.8/868±142.7 mg)
Mg* (224±39/185±28 mg) K* (2285±491/2094±363 mg)
A (790±185.7/972±449.6 µg)
B2 (1.42±0.33)/1.30±0.39 mg)
Fe (9.5±2.58/8.2±1.71 mg)
Deijen et al.,
2003 (The
Netherlands)
3-day
WFR +
EFR
90
(M=12,
F=78)
M= 79.5y,
F=83.7y
Elderly psycho-
geriatric nursing
home residents
C (53mg)
B3 (8.27 mg)
B6 (0.92 mg)
Lengyel et
al., 2008
(Canada)
3-day
WFR +
EFR
48 (M=17,
F=31)
88(8)y
M=86(9)y,
F=89(7)y
LTC residents on
regular diet;
WFR included meals only), EFR
included meals and
snacks, *Weighed
values are in medians, † E(mg aT
= total E x 0.8)
Observation method: D (5.7±2.3/4.4±2.2 µg, >70y)
E (6.4±2.3 mg aT - female) Folate (196±59/161±78 µg)
Weighed method:
Folate (149±68 µg)
Mg (170±58 mg)
Observation method: C (78±45 mg - male)
E (10.2±4.2 mg aT - male) B1 (1.0±0.2 mg - female)
B6 (1.4±0.5/1.1±0.3 mg)
Ca (783±268/600±261 mg)
Mg (232±73/175±38 mg) Zn (7.5±2.3/5.6±2.3 mg)
Weighed method: C (57±28 mg)
E (7.9±4.1 mg aT) B1 (1.0±0.3 mg)
B6 (1.1±0.4 mg)
Zn (5.6±2.5 mg)
Observation method:
A (1770±774/1163±693 µg)
C (76±48 mg - female) B1 (1.3±0.4 mg - male)
B2 (1.8±0.4/1.4±0.4 mg)
B3 (24.7±5.8/18.9±4.2 NE)
B12 (7.2±5.3/4.7±4.2 µg) Fe (12.2±3.3/9.4±2.7 mg)
Weighed method:
(Weighed intake of A, D, and
B3 not provided) B2 (1.4±0.5 mg)
B12 (3±4.7 µg)
Fe (9.3±3.1 mg)
Cameron et
al., 1997 (Australia)
3-day
WFR
19
(M=6, F=13)
69-94y Residents
consuming a normal diet
B1 (1.0±0.4 - female mg)
Ca (812±309/638±203 mg) Fe (6.6±1.7 mg - female)
Mg (234±57.3/161±41.3 mg)
Zn (7±3/5.6±1.3 mg)
A (929±203/726±185 µg RE)
C (110±37/95±49 mg) B1 (1.4±0.3 mg - male)
B2 (1.8±0.6/1.4±0.5 mg)
B3 (26.7±5.0/19.5±4.5 mg NE)
Fe (8.7±1.7 mg - male) P (1345±404/971±234 mg)
Sturtzel et al., 2010
(Austria)
3-day
WFR
30 86.0(9.0)y (Fiber
intervention
group),
84.6(11.4)y (Control
group)
Frail patients with multiple chronic
diseases; inclusion
criteria: oral intake
with laxative use as a therapy; baseline
total values used
here
B6 (0.73±0.52 mg) Folate (105.3±42.9 µg)
B12 (1.9±1.3 µg)
Germain et
al., 2006 (Canada)
2-day
WFR
9 (M=4,
F=5)
84.6(3.81)y Residents with BMI
<24 or >7.5% weight loss within
past 3 months, with
dysphagia
D (4.45±1.81 µg) Ca (757±209 mg)
Mg (256±50.8 mg) K* (2885±625 mg)
Zn (8.88±3.50 mg)
C (155±51.4 mg)
B1 (1.63±0.74 mg) B2 (1.93±0.97 mg)
B3 (22.3±6.54 NE)
B12 (2.57±1.39 µg)
Fe (13.5±4.97 mg) P (1107±251 mg)
Na (2519±624 mg)
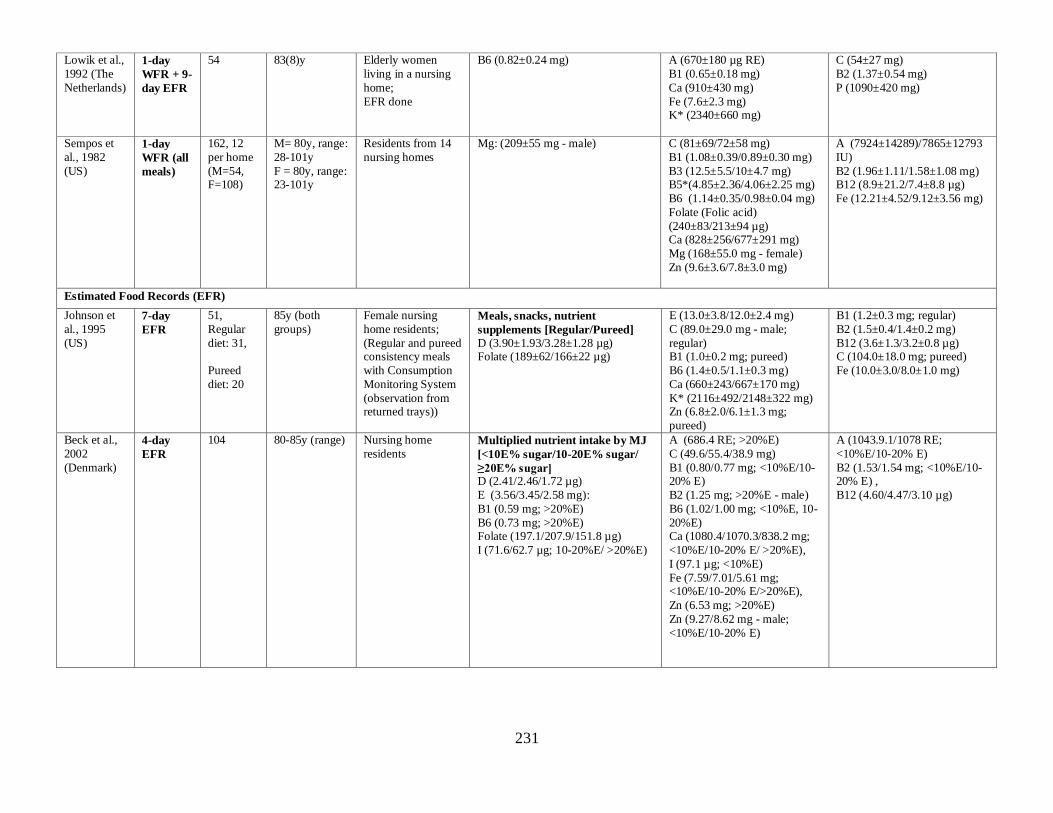
231
Lowik et al.,
1992 (The
Netherlands)
1-day
WFR + 9-
day EFR
54 83(8)y Elderly women
living in a nursing
home;
EFR done
B6 (0.82±0.24 mg) A (670±180 µg RE)
B1 (0.65±0.18 mg)
Ca (910±430 mg)
Fe (7.6±2.3 mg) K* (2340±660 mg)
C (54±27 mg)
B2 (1.37±0.54 mg)
P (1090±420 mg)
Sempos et
al., 1982
(US)
1-day
WFR (all
meals)
162, 12
per home
(M=54, F=108)
M= 80y, range:
28-101y
F = 80y, range: 23-101y
Residents from 14
nursing homes
Mg: (209±55 mg - male) C (81±69/72±58 mg)
B1 (1.08±0.39/0.89±0.30 mg)
B3 (12.5±5.5/10±4.7 mg) B5*(4.85±2.36/4.06±2.25 mg)
B6 (1.14±0.35/0.98±0.04 mg)
Folate (Folic acid)
(240±83/213±94 µg) Ca (828±256/677±291 mg)
Mg (168±55.0 mg - female)
Zn (9.6±3.6/7.8±3.0 mg)
A (7924±14289)/7865±12793
IU)
B2 (1.96±1.11/1.58±1.08 mg) B12 (8.9±21.2/7.4±8.8 µg)
Fe (12.21±4.52/9.12±3.56 mg)
Estimated Food Records (EFR)
Johnson et
al., 1995
(US)
7-day
EFR
51,
Regular
diet: 31,
Pureed
diet: 20
85y (both
groups)
Female nursing
home residents;
(Regular and pureed consistency meals
with Consumption
Monitoring System
(observation from returned trays))
Meals, snacks, nutrient
supplements [Regular/Pureed]
D (3.90±1.93/3.28±1.28 µg) Folate (189±62/166±22 µg)
E (13.0±3.8/12.0±2.4 mg)
C (89.0±29.0 mg - male;
regular) B1 (1.0±0.2 mg; pureed)
B6 (1.4±0.5/1.1±0.3 mg)
Ca (660±243/667±170 mg)
K* (2116±492/2148±322 mg) Zn (6.8±2.0/6.1±1.3 mg;
pureed)
B1 (1.2±0.3 mg; regular)
B2 (1.5±0.4/1.4±0.2 mg)
B12 (3.6±1.3/3.2±0.8 µg) C (104.0±18.0 mg; pureed)
Fe (10.0±3.0/8.0±1.0 mg)
Beck et al.,
2002
(Denmark)
4-day
EFR
104
80-85y (range) Nursing home
residents
Multiplied nutrient intake by MJ
[<10E% sugar/10-20E% sugar/
≥20E% sugar] D (2.41/2.46/1.72 µg)
E (3.56/3.45/2.58 mg):
B1 (0.59 mg; >20%E)
B6 (0.73 mg; >20%E) Folate (197.1/207.9/151.8 µg)
I (71.6/62.7 µg; 10-20%E/ >20%E)
A (686.4 RE; >20%E)
C (49.6/55.4/38.9 mg)
B1 (0.80/0.77 mg; <10%E/10-20% E)
B2 (1.25 mg; >20%E - male)
B6 (1.02/1.00 mg; <10%E, 10-
20%E) Ca (1080.4/1070.3/838.2 mg;
<10%E/10-20% E/ >20%E),
I (97.1 µg; <10%E)
Fe (7.59/7.01/5.61 mg; <10%E/10-20% E/>20%E),
Zn (6.53 mg; >20%E)
Zn (9.27/8.62 mg - male;
<10%E/10-20% E)
A (1043.9.1/1078 RE;
<10%E/10-20% E)
B2 (1.53/1.54 mg; <10%E/10-20% E) ,
B12 (4.60/4.47/3.10 µg)

232
Odowd et
al., 1993
(US)
3-day
EFR +
FFQ
109,
Site A: 57,
Site B: 52
82(1.0)y (Site
A)
81(1.3)y (Site
B)
Residents from a
private nursing
home (site A) or
public LTC wing (site B);
(Estimated EFR
used for cognitively
impaired residents by nursing staff
(51%),
FFQ for cognitively
well)
D intake (1.33±1.28 µg; food only)
Grieger et al., 2007
(Australia)
3-day
EFR
(plate
waste)
169, HLC: 93, LLC:
76
83.3(8.5)y LTC residents
D (1.78±2.05 µg)§ §Value is the median (inter-quartile
range)
Folate (248±114 µg) Ca (796±356 mg)
Zn (9.4±0.6 mg - male; 7.7±0.3
mg - female)
Lee et al.,
2002
(Canada)
3-day
EFR
(plate
waste)
53 (M=8,
F=45)
M=83(9)y,
F=86(7)y
Residents from 3
LTC facilities.
Included dietary intake values only.
D (6.35±2.28/4.68±2.18 µg),
Ca (560±198 mg- female)
Ca (847±264 mg - male)
Hall et al., 2010
(Canada)
3-day
EFR
(meals
and
snacks)
30 (M=27, F=3)
87.2(4.1)y (range: 80-96y)
Residents in complex continuing
care residents in
Veterans Centre
D (5.18 µg)
Gloth et al., 1995 (US)
3-day
EFR
64
81(8)y (Combined
nursing home
and private
dwelling)
Sunlight-deprived residents; Inclusion
criteria: free of
diseases/medication
s that interfere with D status, confined
indoors for at least 6
months
D (7.05±3.65 µg) Ca (921±377 mg)
Aghassi et
al., 2007
(Canada)
3-day
EFR
407
(M=108,
F=299)
85.2(7.7)y
M=83.8(7.5)y,
F=85.7(7.8)y
LTC residents;
Excluded: inability
to take tablets, already receiving
supplementation
E (6.2±1.9/6.2±2.8 mg)
B6 (0.5±0.5 mg - female)
B3 (15.3±4.5mg - male)
B6 (1.4±0.4 µg - male)
Folate (260.0±82.9/252.2±88.0 µg)
Zn (8.5±2.4 mg - male)
[Male/Female]
A (1122±877/1036±761 µg),
C (109.8±49.0/119.1±58.1 mg) B1 (1.3±0.4/1.3±0.4 mg)
B2 (1.7±0.5/1.6±0.5 mg)
B3 (14.6±4.7 mg)
B12 (4.4±4.8/3.9±4.3 µg) Cu* (1.1±0.5/1.1±0.5 mg)
Fe (11.1±3.5/10.7±3.6 mg)
Mg (654.6±228.7/639.0±242.9
mg) Zn (8.2±2.7 mg- female)

233
Liu et al.,
1997
(Canada)
3-day
EFR
155
(M=77,
F=78)
83.2(7.1)y LTC residents from
3 facilities without
conditions
interfering with D metabolism; 24
participants for
EFRs (assessed
every 4th participant)
D (4.93±2.55 µg)
Gloth et al.,
1996 (US) 3-day
EFR
47
78.7(1.3)y Nursing home
resident values only
D (7.05±0.53 µg),
Mg (208±16 mg)
B3 (15.5±1.4 mg - male)
B6 (1.54±0.15 mg - male)
Folate (215±25 µg)
Ca (921±55 mg) Zn (8.7±0.8 mg - male)
C (104±11 mg)
B1 (1.52±0.12 mg)
B2 (2.02±0.13 mg)
B12 (4.04±0.37 µg) Fe (11.5±0.8 mg)
Nowson et
al., 2003
(Australia)
1-day
EFR
(plate
waste at
meals)
139
(M=35,
F=104)
83.3(9.8)y Nursing home
residents from 9
sites;
Both statuses worsen as diet
becomes
downgraded
Mean nutrient intake (95% CI):
Ca (359(333, 385) mg)
D (1.0(0.9,1.0) µg);
[Not impaired/impaired eating in Nursing Home] (95% CI):
Ca (mg): Overall: 343(286,399)/362(334,362)
Full: 406(313,496)/310(242,378) Soft: 286(151,421)/376(327, 425)
Pureed: 292(226,358)/382(342,422)
D (µg): Overall: 0.9(0.8,1.1)/0.9(0.8,1.0) Full: 1.1(0.9,1.4)/0.8 (0.6,0.9)
Soft: 0.7(0.4,1.1)/0.8(0.6,1.0)
Pureed: 0.7(0.5,1.0)/1.1(1.0,1.2)
Webb et al.,
1990 (US) Dietary
survey
38,
Group A:
21, M=5, F=16
Group B:
17, M=7, F=10
81(8)y (Group
A)
82(9)y (Group B)
Group A: moderate
supervision of
ADLs, partial day outdoors;
Group B: 24-h
skilled nursing care,
from constant supervision to
bedridden;
Observed EFR
(amount delivered vs returned) for
milk only; estimated
general intake from
menus for other foods
Overall maximum daily D intake
for the center: < 5 µg;
D (Excluding milk: 0.6 µg, estimated average intake),
(Including milk: 1.3-8.8 µg, range of
maximum intake)

234
Other
Gonzalez et al., 2007
(Spain)
FFQ 227 (M=93,
F=134)
M=72.9(7.2)y, F=76.4(5.9)y
Nursing home residents from 14
nursing homes;
Home-specific FFQ
Se (100.1±31.6/98.7±23.7 µg)
Lasheras et
al., 2003 (Spain)
FFQ 140
(M=59, F=81)
M=73.3(5.6)y,
F=74.2(4.8)y
Institutionalised
elderly subjects from 7 institutions;
FFQ was specific to
each home; food
grouping to identify sources of B2,
Folate, B12
Folate (187.3±81.1 µg) B2 (1.8±0.5 mg)
B12 (4.9±1.8 µg)
Oudshoorn
et al., 2012
(The
Netherlands)
24-hr
dietary
recall
426
(M=111,
F=315)
81.0(7.2)y Residential homes
residents
Ca (826±242 mg)
Rumbak et al., 2010
(Canada)
24-hr
dietary
recall
339 (M=62,
F=277)
61-93y (range) Residents from 11 nursing homes in
Zagreb
Ca (599.1±259.9 mg - female) Ca (607.6±291.1 mg - male) Fe (9.4±3.4/8.2±3.0 mg)
Van der Wielen et
al., 1996
(The
Netherlands)
4 wk Diet
history
40 81.5(7.1)y Female nursing home residents
C (56±26 mg) B1 (0.81±0.18 mg) B2 (1.20±0.36 mg - male)
B6 (0.96±0.19 mg)
Vikstedt et al., 2011
(Finland)
1-day
Diet
history
375 (M=67,
F=308)
83y Service house residents
D (7.5/6.6 µg) E (6.8/6.0 mg)
Folate (272/220 µg) Ca (1106 mg - female)
C (mg): 104/101, Ca (1247 mg - male)
WFR = Weighed Food Record, EFR = Estimated Food Record;
B1 = thiamin, B2 = riboflavin, B3 = niacin, αT = alpha-tocopherol; Ca = calcium, Cu = copper, Fe = iron; M = male, F = female; Wk = week, hr = hour
*AI used for Copper (Cu), Pantothenic acid (B5), and Potassium (K)

235
Table 3. Biochemical Data Compared to Reference Values (AMA, CDC, Paper references) Micronutrients
Examined/
Method
Names of Authors
(Country)
Value,
(Mean(SD) for total, unless
otherwise specified)
AMA
[REF]
CDC
[REF] Papers
Number of
participants
Vitamin A
Serum carotene
Vir et al., 1979
(Ireland)
M:49.7(11.0) µg/dL
F: 91.4(48.2)µg/dL N N/A N N=26 (M=9, F=17)
Vitamin D
1,25(OH)2D
Gloth et al., 1995
(US)
50.7(24.7) pmol/L
L N/A N N=64
Odowd et al., 1993
(US)
72.3(3.90) pmol/L
N N/A N N=109
Perez-Llama et al.,
2008 (Spain)
T: 145(85) pmol/L
M: 131(70) pmol/L
F: 153(94) pmol/L N N/A N N=86 (M=29, F=57)
Vitamin D
25(OH)D
Gloth et al., 1995
(US)
36.2(17.7) nmol/L
N L N N=64
Johnson et al., 2008
(US)
Octogenarian: 72.1(26.7) nmol/L Centenarian: 70.1(33.3) nmol/L
N N N
Octogenarians: N=12
Centenarian: N=99
Lowik et al., 1992
(The Netherlands)
F: 28(16) nmol/L
L L L N=51
Odowd et al., 1993
(US)
6.37(0.32) nmol/L
L L L N=109
Oudshoorn et al.,
2012 (The
Netherlands)
39.1(21.4) nmol/L
N L N
N=426 (M=111,
F=315)
Perez-Llama et al., 2008 (Spain)
T: 50.1(32.4) nmol/L
M: 53.4(26.5) nmol/L F: 48.2(35.7) nmol/L N
N male L female
N male L female N=86 (M=29, F=57)
Sem et al., 1987
(Norway)
Winter:
M: 41.9 (13.7) nmol/L
F: 35.7(20.2) nmol/L
Summer: M: 39.9(13.5) nmol/L
F: 48.4(22.2) nmol/L N L L N=56 (M=21, F=35)
Sitter et al., 2011
(Canada)
T: 58.5(24.9) nmol/L
M: 62.0(16.5) nmol/L
F: 55.5(31.7) nmol/L
N N N/A N=14 (M=5, F=9)
Vir et al., 1979 (Ireland )
Serum 25(OH)D (no actual values but paper identified as low) N/A N/A N/A
Webb et al., 1990 (US)
Range: 27.5 - 37.5 nmol/L (Used mid-range value as cut-off) L L L N=38
Woods et al., 2009
(Australia)
M: 51.5(46.8) nmol/L
F: 38.0(41.0) nmol/L N
N male
L female
N male
L female N=105 (M=23, F=72)
Vitamin E
Alpha-tocopherol
Lowik et al., 1992
(The Netherlands)
F: 28.0(9.5) µmol/L
N/A N/A N N=51
Vitamin C
Cell ascorbic acid
Lowik et al., 1993
(The Netherlands)
F: 37.8(19.4) µmol/L
N/A N/A N/A N=54
Vitamin C
Leukocyte
ascorbic acid
McClean et al.,
1977 (New Zealand)
M: 11.1(5.5) ug/108 WBC
N/A N/A N N=35
Vitamin C Plasma ascorbic
acid
Lowik et al., 1992
(The Netherlands)
F: 35.0(20.1) µmol/L
N N N N=51
Lowik et al., 1993
(The Netherlands)
F: 23.7(18.4) µmol/L
N N N N=54
Marcenes et al., 2003 (UK)
Edentulous (Eden): 11.4 µmol/L*
Dentate (Den): 31.0 µmol/L* *Median
L Eden N Den
L Eden
(L to
borderline
deficient) N Den N/A
Dentate, n=57
Edentulous, n=139
McClean et al.,
1977 (New Zealand)
M: 16(15) µmol/L
L L L N=35

236
Vir et al., 1979
(Ireland)
M: 9.65(7.95) µmol/L
F: 23.3(12.5) µmol/L
L male
N female
L male
(deficient)
N female
L male
Nfemale N=26 (M=9, F=17)
Thiamin
ETK - EC 2.2.1.1
Vir et al., 1979
(Ireland)
M: 1.09(0.07)
F: 1.09(0.09)
N/A N/A N N=26 (M=9, F=17)
Riboflavin EGR AC - EC
1.6.4.2
Vir et al., 1979
(Ireland)
M: 1.03(0.07) mg/dL F: 1.03(0.11) mg/dL
N/A N/A N N=26 (M=9, F=17)
Vitamin B6
EGPT index - EC
2.6.1.2
Vir et al., 1979
(Ireland)
M: 1.20(0.11) mg/dL
F: 1.23(0.18) mg/dL
N/A N/A N N=26 (M=9, F=17)
Vitamin B6
Pyridoxal 5' Phosphate
Lowik et al., 1992 (The Netherlands)
F: 31(39) nmol/L N N/A N N=51
Vitamin B6 Plasma vitamin
B6
Sturtzel et al., 2010
(Austria)
M: 23.9(21.4) nmol/L F: 21.4(21.4) nmol/L
N N/A N N=30
Folate
Plasma folate
Lowik et al., 1992
(The Netherlands)
F: 3.13(1.54) ng/mL
N N L N=51
Sturtzel et al., 2010
(Austria)
M: 2.16(1.12) ng/mL
F: 2.34(1.21) ng/mL L N L N=30
Folate
Serum folate
Huerta et al., 2004
(Spain)
6.31(4.10) ng/mL
N N N/A N=140 (M=59, F=81)
Vir et al., 1979
(Ireland)
M: 3.8(1.42) ng/mL
F: 6.7(4.44) ng/mL N N N N=26 (M=9, F=17)
Vitamin B12 Plasma Vitamin
B12
Lowik et al., 1992
(The Netherlands)
F: 748(1367) pg/mL
N N/A N N=51
Sturtzel et al., 2010
(Austria)
M: 385.7(217.6) pg/mL
F: 468.6(593.7) pg/mL N N/A N N=30
Vitamin B12
Serum vitamin
B12
Huerta et al., 2004
(Spain)
395(218) pg/mL
N N/A N/A N=140 (M=59, F=81)
Mirkazemi et al.,
2012 (Australia)
With MV:
M: 337(134) pg/mL F: 396(198)pg/mL
Without MV:
M: 321(121) pg/mL
F: 381(188) pg/mL N N/A N N=130
Vir et al., 1979 (Ireland)
M: 276.7(156.9) pg/mL F: 351.5(150.9) pg/mL N N/A N N=26 (M=9, F=17)
Calcium Ionized serum
calcium
Gloth et al., 1995
(US)
1.28(0.12) mmol/L
N N/A N N=64
Calcium
Serum calcium
Odowd et al., 1993
(US)
2.385 (0.01) mmol/L
N N/A N/A N=109
Perez-Llama et al.,
2008 (Spain)
T: 2.39(0.12) nmol/L
M: 2.42(0.08) nmol/L
F: 2.37(0.13) nmol/L N N/A N N=86 (M=29, F=57)
Sem et al., 1987
(Norway)
M: 2.39(0.12) mmol/L
F: 2.36(0.15) mmol/L *Using without supplement
values N N/A N N=56 (M=21, F=35)
Vir et al., 1979 (Ireland)
T: 2.3(0.11) mmol/L F: 2.4(0.14) mmol/L N N/A N N=26 (M=9, F=17)
Webb et al., 1990
(US)
2.40(0.13) mmol/L
N N/A N/A N=38
Worwag et al., 1999
(Germany)
M: 2.17(0.12) mmol/L
F: 2.14(0.10) mmol/L
N N/A
N male
L female
(Low
normal)
N=117 (M=20, F=97*)
*97F for Ca, K, Na
Calcium Osteocalcin
Gloth et al., 1995 (US)
11.9(7.5) ng/mL N N/A N N=64

237
Chloride
Sitter et al., 2011
(Canada)
T: 102.4(3.3) mmol/L
M: 101.8(2.9) mmol/L
F: 102.8(3.7) mmol/L N N/A N/A N=14 (M=5, F=9)
Copper
Serum copper
Bonaccorsi et al.,
2013 (Italy)
F: 1268.30(249.35)µg/L
N N/A N
N=428 (M=101,
F=327)
Iron Ferritin
Garcia-Arias et al., 2003 (Spain)
T: 85.2(25.2) ng/mL
M: 94.4(27.9) ng/mL F: 64.3(20.2) ng/mL N N/A N/A N=124 (M=60, F=64)
Iron
Hematocrit
Garcia-Arias et al.,
2003 (Spain)
T: 43.7(6.3)% M: 43.8(5.4)%
F: 43.8(6.7) % N N/A N/A N=124 (M=60, F=64)
Lowik et al., 1992
(The Netherlands)
F: 42.6(4.3)%
N N/A N/A N=51
Iron
Hemoglobin
Garcia-Arias et al.,
2003 (Spain)
T:14.3(1.3) g/dL
M: 14.8(1.3) g/dL
F: 14.0(1.2) g/dL N N/A N/A N=124 (M=60, F=64)
Lowik et al., 1992 (The Netherlands) F: 13.4(1.45) g/dL L N/A N N=51
Vir et al., 1979 (Ireland )
M: 13.9(2.00) g/dL F: 14.3(1.70) g/dL
L male N female N/A N N=26 (M=9, F=17)
Woods et al., 2009
(Australia)
M: 13.2(1.8) g/dL
F: 12.7(1.2) g/dL L N/A N N=105 (M=23, F=72)
Iron
Serum Iron
Garcia-Arias et al.,
2003 (Spain)
T: 85.2(25.2) µg/dL
M: 93.8(40.7) µg/dL
F: 82.0(28.4) µg/dL N N/A N/A N=124 (M=60, F=64)
Sitter et al., 2011 (Canada)
T: 68.2(29.1) µg/dL
M: 68.2(23.5) µg/dL F: 68.2(33.5) µg/dL N N/A N/A N=14 (M=5, F=9)
Vir et al., 1979 (Ireland )
M: 92.8(24.1) µg/dL F: 104.2(48.6) µg/dL N N/A N/A N=26 (M=9, F=17)
Iron
TIBC, fasting
Vir et al., 1979
(Ireland )
M: 376.7(82.3) µg/dL
F: 384.7(48.9) µg/dL N N/A N/A N=26 (M=9, F=17)
Iron
Transferrin
Bonaccorsi et al.,
2013 (Italy)
M: 225.7(45.4) mg/dl
F: 231.6(50.3) mg/dl
N N/A N
N=428 (M=101,
F=327)
Magnesium
Serum
Dave et al., 1987
(US)
0.88(0.10) mmol/L
N N/A N N=75 (M=73, F=2)
Worwag et al., 1999
(Germany)
M: 0.79(0.07) mmol/L
F: 0.79(0.09) mmol/L N N/A N N=119 (M=20, F=99)
Phosphorus
Serum
Odowd et al., 1993
(US)
1.09(0.016) mmol/L
N N/A N/A N=109
Webb et al., 1990 (US)
1.06(0.16) mmol/L N N/A N/A N=38
Potassium Serum
Worwag et al., 1999 (Germany)
4.39(0.74)/4.23(0.51) mmol/L N N/A N
N=117 (M=20, F=97*) *97F for Ca, K, Na
Selenium
Serum
Bonaccorsi et al.,
2013 (Italy)
M: 97.88(50.76) µg/L
F: 93.77(43.19) µg/L N N/A N
N=428 (M=101,
F=327)
Gonzalez et al.,
2007 (Spain)
M: 86.7(17.0) µg/L
F: 88.2(16.6) µg/L N N/A N/A
N=227 ( M=94,
F=134)
Selenium
Erythrocyte
Lowik et al., 1992
(The Netherlands)
F: 106(18) ng/g
N/A N/A N N=51
Selenium
Plasma
Lowik et al., 1992
(The Netherlands)
F: 69(14) ng/g
N N/A N N=51
Sodium
Serum
Worwag et al., 1999
(Germany)
M: 137.1(39.3) mmol/L
F: 138.8(39.3) mmol/L N N/A N
N=117 (M=20, F=97*)
*97F for Ca, K, Na
Zinc
Serum
Bonaccorsi et al.,
2013 (Italy)
M: 13.0(2.29) µmol/L
F: 12.5(2.13) µmol/L N N/A N
N=428 (M=101,
F=327)
Worwag et al., 1999
(Germany)
M: 13.3(2.0) µmol/L
F: 13.9(2.9) µmol/L N N/A N N=119 (M=20, F=99)
Micronutrients identified as inadequate by one or more reference(s) are highlighted in grey.
T (Total), M (Male), F (Female); N (within normal range), L (low), N/A (not applicable)

238
Table 4. Scoping Review Observational Studies: Reference Range
Micronutrients
Examined
Metabolite
Measured
Substrate
used
Reference Ranges
1) AMA (normal ranges)
2) CDC, 2011 (low ranges, unless otherwise specified)
3) Original paper (low ranges, unless otherwise specified)
Vitamin A Carotene Serum 1) 10-85 µg/dL
0.2-1.6 µmol/L
3) Vir 1979
4.0 ug/dl
Vitamin D 1,25(OH)2D Serum 1) 60-108 pmol/L
25-45 pg/mL
3) Gloth 1995
36-143pmol/L (normal)
14-55 pg/mL
Odowd 1993
47-169 pmol/L (normal)
18-65 pg/ml
Webb 1990
Normal: 38- 156 pmol/L (normal)
Vitamin D 25(OH)D Serum 1) (plasma)
35-150 nmol/L
(14-60 ng/mL)
2) Deficiency: <30 nmol/L(12
ng/mL)
Inadequacy: 30-49 nmol/L(12-19 ng/ml)
Sufficient: 50-75 nmol/L(20-30
ng/mL)
3) Gloth 1995
25-137 nmol/L (normal)
10-55 ng/mL
Johnson 2008
Deficiency: < 25 nmol/L
Insufficiency: < 50 nmol/L Optimal: ≥ 80 nmol/L
Lowik 1992
<31 nmol/L Odowd 1993
10-162 nmol/L (normal)
4-65 ng/ml
Oudshoorn 2012
Low: <25 nmol/L
Normal:
The Netherlands ≥50 nmol/l United States ≥75 nmol/l
Perez-Llama 2008 Deficiency: <25 nmol/L
Insufficiency: <50 nmol/L
Sem 1987 <50 nmol/L
<20ng/mL
Vir 1979
<9.5 nmol/L <3.8 ng/ml
Webb 1990
Deficiency: <25 nmol/L Low normal: 37.5 nmol/L
(Normal per assay for young
adults: 20.0-137.5 nmol/L
Woods 2009
Deficient: <25 nmol/L
Insufficient: 25- 50 nmol/L
Vitamin E Alpha-
tocopherol
Serum 1) 5.5-17 µg/mL*
*Medscape reference value used
(No AMA value)
2) Deficiency <500 µg/dL
3) Lowik 1992
<12 umol/L

239
Vitamin C Ascorbic acid Leukocyte 3) McClean 1977
<10 ug/108 WBC
Vitamin C Ascorbic acid Serum 1) 23-85 µmol/L
0.4-1.5 mg/dL
2) Deficient: <11.4 µmol/L Low: 11.4-23 µmol/L
3) Lowik 1993 (Plasma)
Deficient <11 umol/L
Low: 11-23 umol/L
McClean 1977 (Plasma)
Low: <23 umol/L
Deficient: <12 umol/L
Vir 1979
<17 umol/L <0.3 mg/dl
Thiamin ETK - EC 2.2.1.1
3) Vir, 1979 >1.2
Riboflavin EGR AC - EC 1.6.4.2
3) Vir, 1979 ≥ 1.2
Vitamin B6 EGPT index -
EC 2.6.1.2
3) Vir, 1979
>1.15
Vitamin B6 Pyridoxine Plasma 1) 20-121 nmol/L
5-30 ng/mL
3) Lowik 1992
<19 nmol/L
Sturtzel 2010 (normal) >28 nmol/L
>6.8 ng/ml
Folate Folate Serum/Plasma 1) 7-36 nmol/L
3-16 ng/mL
2) Low
<5 nmol/L
<2 ng/ml
3) Lowik 1992
<5 nmol/L
Sturtzel 2010
>5.9 ug/L (normal)
Vir 1979 <8 nmol/L
<3.5 ng/ml
Vitamin B12 Vitamin B12 Serum 1) 118-701 pmol/L
160-950 pg/mL
2) Low: <148 pmol/L
< 200 pg/mL
3) Lowik 1992
<138 pmol/L
Mirkazemi 2012 Deficient: 150 pmol/L
Borderline/equivocal: 150-250
pmol/L
Sturtzel 2010
>200 ng/L (normal)
Vir 1979
<111 pmol/L
<150 pg/ml
Calcium Calcium,
Ionized
Serum 1) 1.15-1.27 mmol/L
4.60-5.08 mg/dl
3) Gloth 1995
1.15-1.35 mmol/L (normal)
4.61-5.41 mg/dL
Calcium Calcium,
Total
Serum 1) 2.05-2.55 mmol/L
(8.2-10.2 mg/dL)
3) Dave 1987
2.13-2.63 mmol/L(normal) 8.5-10.5 mg/dl
Worwag 1999 2.16-2.60 mmol/L(normal)
Calcium Osteocalcin Serum 1) 3.0-13.0 µg/L (3.0-13.0 ng/mL)
3) Gloth 1995 2-18 ug/L (normal)
2-18ng/ml
Sem 1987 <2.20 mmol/L
Vir 1979 <8.7mg/dl

240
Chloride Chloride Serum,
plasma
1) 96 - 106 mmol/L
(96-106 mEq/L)
Copper Serum copper Serum 1) 11- 22 µmol/L
70 - 140 µg/dL
3) Bonaccorsi 2013
7.9-20 umol/L (normal)
50–125 ug/dL
Iron Ferritin Serum 1) 34-450 pmol/L
15-200 ng/ml
2) <34 pmol/L (low)
< 15ng/mL
Iron Hematocrit Whole blood 1) 0.41-0.50 (proportion of 1.0)
41-50%
3) Woods 2009
Normal
M: 0.38-0.54 L/L (normal) F: 0.34 - 0.47 L/L
Iron Hemoglobin Whole blood 1) 140-175 g/L
(14.0-17.5 g/dL)
3) Vir 1979
Male: <130 g/L
Female: <120 g/L
Woods 2009
Normal
M: 125-175 g/L
F: 110-160 g/L
Iron Serum iron Serum 1) 10.7-26.9 µmol/L
(60-150 µg/dL)
Iron TIBC, fasting Serum 1) 44.8-80.6 µmol/L (250-450 µg/dL)
Iron Transferrin Serum 1) 2.5-5.0 µmol/L 200-400 mg/dL
3) Bonaccorsi 2013 27-43 umol/L (normal)
220–350 mg/dl
Magnesium Magnesium Serum 1) 0.65-1.05 mmol/L
1.3-2.1 mEq/L
3) Dave 1987
1.8-2.6 mg/dl (normal)
Worwag 1999
0.76-1.10 mmol/L (normal)
Phosphorus Phosphorus Serum 1) 0.74-1.52 mmol/L
2.3-4.7 mg/dL(tightly regulated,
only measure for food intake)
3) Dave 1987
0.81-1.5 mmol/L(normal)
2.5-4.5 mg/dl
Potassium Potassium Serum 1) 3.5-5.0 mmol/L
(3.5-5.0 mEq/L)
3) Dave 1987
3.5-5.0 mmol/L 3.5-5.0 meq/L
Worwag 1999
3.5 - 5.5 mmol/L (normal)
Selenium Selenium Serum 1) 0.74-2.97 µmol/L
58 - 234 µg/L
3) Bonaccorsi 2013
0.64-1.65 umol/L (normal) 50–130 ug/L
Lowik 1992
<63ng/g
Sodium Sodium Serum 1) 136-142 mmol/L 136-142 mEq/L
3) Dave 1987 135-145 mmol/L(normal)
135-145 meq/L
Worwag 1999 136 - 146 mmol/L (normal)
Zinc Zinc Serum 1) 11.5-18.5 µmol/L 75-120 µg/dL
3) Bonaccorsi 2013 9.2- 17 umol/L (normal)
60–108 ug/dL
Worwag 1999 12.2 - 23.0 umol/L (normal)
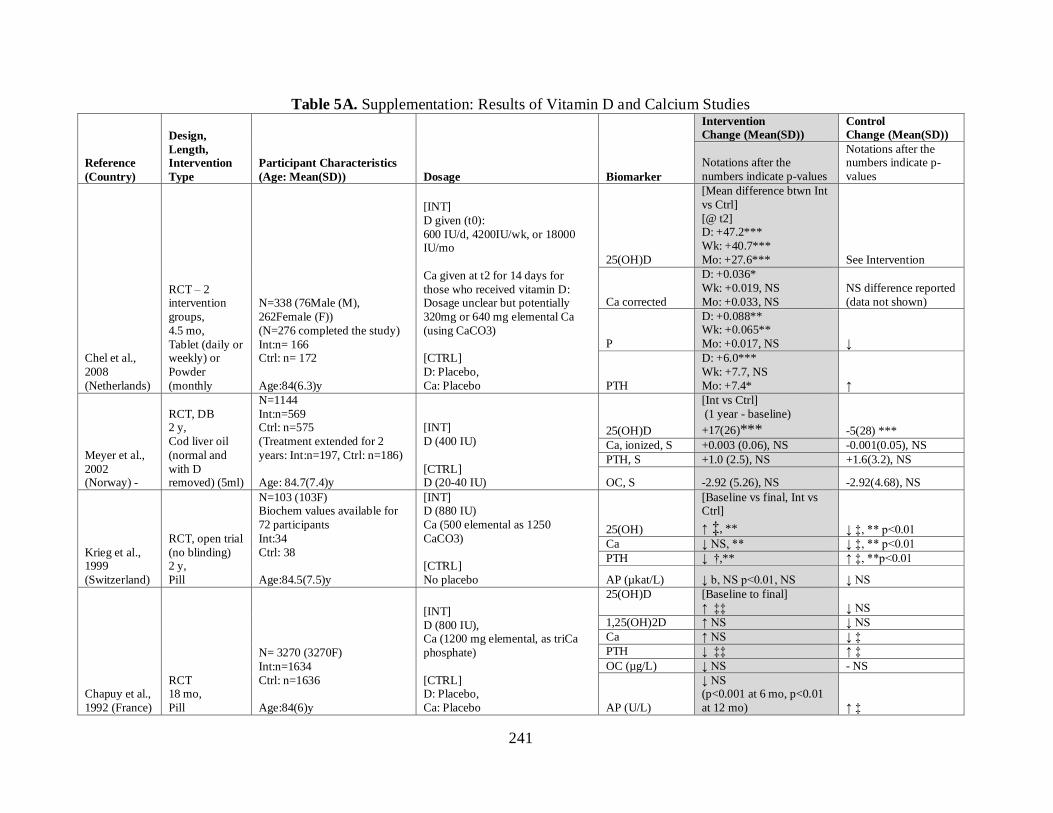
241
Table 5A. Supplementation: Results of Vitamin D and Calcium Studies
Reference
(Country)
Design,
Length,
Intervention
Type
Participant Characteristics
(Age: Mean(SD)) Dosage Biomarker
Intervention
Change (Mean(SD))
Control Change (Mean(SD))
Notations after the
numbers indicate p-values
Notations after the numbers indicate p-
values
Chel et al.,
2008
(Netherlands)
RCT – 2 intervention
groups,
4.5 mo,
Tablet (daily or weekly) or
Powder
(monthly
N=338 (76Male (M),
262Female (F))
(N=276 completed the study)
Int:n= 166 Ctrl: n= 172
Age:84(6.3)y
[INT]
D given (t0):
600 IU/d, 4200IU/wk, or 18000 IU/mo
Ca given at t2 for 14 days for
those who received vitamin D: Dosage unclear but potentially
320mg or 640 mg elemental Ca
(using CaCO3)
[CTRL]
D: Placebo,
Ca: Placebo
25(OH)D
[Mean difference btwn Int
vs Ctrl]
[@ t2] D: +47.2***
Wk: +40.7***
Mo: +27.6*** See Intervention
Ca corrected
D: +0.036*
Wk: +0.019, NS
Mo: +0.033, NS
NS difference reported
(data not shown)
P
D: +0.088** Wk: +0.065**
Mo: +0.017, NS ↓
PTH
D: +6.0***
Wk: +7.7, NS
Mo: +7.4* ↑
Meyer et al.,
2002 (Norway) -
RCT, DB 2 y,
Cod liver oil
(normal and
with D removed) (5ml)
N=1144
Int:n=569 Ctrl: n=575
(Treatment extended for 2
years: Int:n=197, Ctrl: n=186)
Age: 84.7(7.4)y
[INT]
D (400 IU)
[CTRL] D (20-40 IU)
25(OH)D
[Int vs Ctrl]
(1 year - baseline)
+17(26)***
-5(28) ***
Ca, ionized, S +0.003 (0.06), NS -0.001(0.05), NS
PTH, S +1.0 (2.5), NS +1.6(3.2), NS
OC, S -2.92 (5.26), NS -2.92(4.68), NS
Krieg et al., 1999
(Switzerland)
RCT, open trial
(no blinding) 2 y,
Pill
N=103 (103F) Biochem values available for
72 participants
Int:34
Ctrl: 38
Age:84.5(7.5)y
[INT] D (880 IU)
Ca (500 elemental as 1250
CaCO3)
[CTRL]
No placebo
25(OH)
[Baseline vs final, Int vs Ctrl]
↑ ‡, ** ↓ ‡, ** p<0.01
Ca ↓ NS, ** ↓ ‡, ** p<0.01
PTH ↓ †,** ↑ ‡, **p<0.01
AP (µkat/L) ↓ b, NS p<0.01, NS ↓ NS
Chapuy et al.,
1992 (France)
RCT 18 mo,
Pill
N= 3270 (3270F)
Int:n=1634
Ctrl: n=1636
Age:84(6)y
[INT]
D (800 IU), Ca (1200 mg elemental, as triCa
phosphate)
[CTRL] D: Placebo,
Ca: Placebo
25(OH)D
[Baseline to final]
↑ ‡‡ ↓ NS
1,25(OH)2D ↑ NS ↓ NS
Ca ↑ NS ↓ ‡
PTH ↓ ‡‡ ↑ ‡
OC (µg/L) ↓ NS - NS
AP (U/L)
↓ NS (p<0.001 at 6 mo, p<0.01
at 12 mo) ↑ ‡

242
Moreira-
Pfrimer et al., 2009 (Brazil)
RCT, DB 6 mo
(December to
May),
Ca Pill + Vit D drops/ placebo
N=56
Int:n=28 (6M, 22F) Ctrl: n=28(6M, 22F)
Age:
Int: 78.5y Ctrl: 78y
[INT]
D: 150,000 IU/mo for 2 mo, then
90,000 IU/mo for 4 mo
(~3600 /d) + Ca (1000 mg)
[CTRL]
D (Placebo) + Ca (1000 mg)
25(OH)D
[Trt vs ctrl]
↑ ***
↑ ***
Ca, ionized ↓ * ↓*
Ca Total ↑ ** ↓**
P ↓ * ↓*
PTH, i ↓ NS ↑ NS
Dinizulu et al., 2011
(Ireland)
Pre/Post 2G,
12 wk, Pill (D only or
D + Ca)
N=63F (LTC)
D only: 63 (30.1% LTC)
D + Ca: 76 (53.9% LTC)
Age:77.8y
[INT] D (800 IU) alone or with
Ca (1000 mg)
25(OH)D
[D only/ D+Ca]
+61, no p-value +37, no p-value
N/A
Ca
+0.05, no p-value +0.1, no p-value
PTH, i
-40, no p-value
-39, no p-value
Canto-Costa
et al., 2006
(Brazil)
Pre/Post, test
with an
untreated comparison
group
12 wk, Drops
N=42
Tr1: n=10, Tr2: n=11, Tr3:
n=10 Ctrl: n=11
Age: 77.5 y
[INT]
D: 7000 IU/wk, stratified by total
body fat
[CTRL]
N/A
25(OH)D
[Baseline to final]
[Tr1/Tr2/Tr3]
↑/↑/↑ † (all) ↓ NS
Ca T ↑/↓/↑ NS (all) ↑ NS
PTH ↓/↑/↓ NS (all) ↑ NS
OC ↑/↑/↓ NS (all) ↑ NS
Chapuy et al.,
1987 (France)
Post test 2G, 6 mo,
Pill
N=104 (24M, 80F)
Biochem data on 77 ppt only (did not specify gender)
Int:n=38
Ctrl: n=39
Age:83(7)y
[INT]
D (800 IU)
Ca (1000 mg)
[CTRL]
N/A
25(OH)D +38(21) *** +0.6(6.4)***
Ca +0.082(0.105) * +0.025 (0.110)*
P +0.097(0.106), NS +0.009 (0.132), NS
PTH, i -60.3(58.7) * +18.2(92.1)*
AP (Bodansky
Units %) -0.9(1.0) * 0(1.4)*
Schwalfenberg et al., 2010
(Canada)
Post test 1G,
5 - 10 mo (avg: 8 mo),
Pill
N=68 (19 M, 49F)
Int:68
Age: 80.7(9.8)y
[INT]
D (2000 IU)
25(OH)D
All subjects received
supplementation for a CQI
project and 94.1 %
achieved at least 80 nmol/l after 5 months; unclear the
change from baseline
INT = Treatment Intervention, Ctrl = Control; NS = non-significant; N/A = not applicable; S= Serum. Interventions are daily dose unless otherwise stated. RCTc(RCT-Crossover), RCT (RCT-
parallel: randomized, 2 groups or more; 1 control/comparison), Pre/Post C (Pre-test/Post-test comparison- has comparison group), non-randomized trial (e.g. 1 nursing home with treatment,
another without), Pre/Post 1G (Pre-test/post-test 1 group – 1 group), Post 2G (Post-test – 2 group comparison), Post 1G (Post-test – 1 group); DB= double blind. Baseline vs final: † p<0.05, ‡ p<0.01, ‡‡ p<0.001; Intervention vs Control: *p<0.05, **p<0.01, ***p<0.001. DOSAGE UNITS: A, D: (IU); E, C, B1, B2, B3, B5, B6, Ca, Cu, Fe, I, K (potassium), Mg, Zn: (mg); Folic
acid, B7 (biotin) B12, Mo, Mn, Se: (µg); assumed vitamin E as dl-alpha-tocopherol (synthetic form). BIOMARKER UNITS: D/Ca: 25(OH)D (nmol/L), 1,25(OH)2D (pmol/L), Ca (mmol/L),
PTH (ng/L), OC (µg/L), P (mmol/L), PTH, i (ng/L), AP (Bodansky Units %), AP (µkat/L), AP (µg/mL), Alb (g/L) Others: A (µmol/L), 25(OH)D (nmol/L), E (µmol/L), C (µmol/L), B1
(aETK), B1 (Erythrocyte TPP) (µmol/L), B1 (TPP (nmol/L), B2 (aEGR), B6 (aEAST), Folate (nmol/L), B12, S (pmol/L), Cu(µmol/L), Se (µmol/L), Zn (µmol/L); MMA, S (µmol/L), HCys, S (µmol/L), Hemotocrit (% RBC), Mean corpuscular volume (fl)

243
Table 6A. Supplementation: Results Other Micronutrient Studies
Author
(Country)
Design, Length,
Intervention Type Participant Characteristics Dosage
Biomarker Intervention Control
Biomarker Change Change
Multi-nutrient
Allsup et al., 2004 (UK)
[REF]
§ median (IQR)
RCT, DB, placebo
8 wk, Pill
N=119
Int:n=61 (25M, 36 F)
Ctrl: n=57 (18M, 39F) Note: 1 participant dropped out
Age§
Int: 82.6(8.8)y Ctrl: 83.1(6.6)y
[INT]
Vitamins: A (2,666), D (400), E (60), B1 (1.2), B2
(1.4), nicotinamide (14), Ca
pantothenate (5), B6 (3.0),
B7 (30), folic acid (600), B12 (200), C (120)
Minerals: Ca (240), Cu
(2000), Fe (12), I (150), Mg (100), Mo (100), Se (60),
Zn (14)
[CTRL] Placebo
A ↑ ‡‡ ↑ NS
D3 ↑ ‡‡ ↑ NS
E ↑ ‡‡ ↓ NS
C ↑ ‡‡ ↑ NS
Folate ↑ ‡‡ ↓ NS
Cu - NS ↑ NS
Se ↑ ‡‡ ↑ NS
Zn ↑ NS - NS
Asciutti-
Moura et al.,
1993 (France)
RCT, stratified by
gender, DB placebo
30 d,
Pill
N=84 (31M, 53F)
Int:n=43(16M, 27F) Ctrl: n=41 (15M, 26F)
Age: >65 y
[INT]
Vitamin E (6.8), C (200),
B1 (7.5), B2 (9), B3 (35), B5 (15), B6 (11)
[CTRL]
Placebo
E (a-
tocopherol)
M :↑ †, *
F: ↑ NS, *
M:↑ NS, *
F: ↑ NS, *
C (ascorbic
acid)
M: ↑ †, *
F: ↑ †, *
M: ↑NS, *
F: ↓NS, *
B1 (aETK)
M: ↓ NS, NS
F: ↓ †, *
M: ↑NS
F: ↓ NS*
B1 (Erythrocyte
TPP)
M: ↑ †,*
F: ↑ †, *
M: ↑ NS*
F: ↑NS*
B2 (aEGR)
M: ↓ †, *
F: ↓ †,*
M: ↑NS*
F: - NS*
B6 (aEAST)
M: ↓ †,*
F: ↓ †,*
M: ↓ NS*
F: ↑ NS*
Grieger et al.,
2009 (Australia)
RCT, DB, placebo,
matched treatment
and control on age;
24 wk, Pill
N=92
Int:n=49
Ctrl: n=43
Age:
[INT]
Vitamins: A (900, B-
carotene), D (400), E
(12.2), C (75), B1 (15), B2 (10), Nicotinamide (50), B5
(35 as Ca pantothenate), B6
(25), B7 (100), Inositol (8),
Folic acid (200), B12 (25), Choline bitartrate (7.9 as
25(OH)D
+27.4(3.9) *** -6.0(2.1)***
% ≤ 50
[% Cut-off ]
↓ NS ↑ NS
% >50 ↑ *** ↓ ***
Folate +13.0(1.6)*** -0.4(2.3)***
% ≤ 7 ↓ *** ↑ ***
%>7 ↑ NS ↓ NS

244
Choline bitartrate)
Minerals: Ca (144
elemental; 360 as CaCO3), Fe (5 elemental, 15.2 as
ferrous fumarate), Mg (75
elemental, 125 as Mg2O3),
Mn (750 elemental, 7.5 mg as Mn amino acid chelate),
K (1.5 elemental; 3.4 as K
sulphate), Zn (6 elemental,
30 as Zn amino acid chelate) 6mg (30mg)
Others: Bioflavonoids,
Siberian ginseng
[CTRL]
Placebo
B12 +145.6(33.1)*** -32.4(30.2)***
% ≤ 200 ↓ *** ↑ ***
%>200 ↑ NS ↓ NS
Zn -0.1(0.5) NS +0.1(0.4) NS
Meydani et
al., 2004 (US)
RCT, DB, placebo
1 yr,
Pill (soybean oil)
N=617 Int:n=311
Ctrl: n=306
No age info given
[INT]
Vit E (90) + 50% RDA of
other essential vitamins and minerals
Vitamins: A (1332 IU), D
(4000), C (30), B1 (0.6), B2
(0.6), B3 (6.0), B6 (0.9), folic acid (100), B12 (1)
Minerals: Cu (0.8), Fe (5),
I (75), Se (25), Zn (7)
[CTRL]
Vit E (1.8 µg) + Remaining
Vit/Min as Intervention
E, pl ↑ ‡‡
↑ NS
A
(Carotenoid)
[% deficient]
0 NS, NS +6 ↑ NS, NS
A +1↑ †, NS +2 ↑ †, NS
D -2↓ †, NS -2 ↓ †, NS
E -3↓ NS, NS -1↓ NS, NS
B1 +2↑ NS, NS -4↓ NS, NS
B2 2↑ NS, NS 0- NS, NS
B6 (P5P) -4↓ †, NS -4↓ †, NS
B12 0 NS, NS 0- NS, NS
Folate 0 NS, NS 0- NS, NS
Cu -3↓ NS, NS +4↓ NS, NS
Fe (Ferritin) 0 NS, NS 0- NS, NS
Zn 0 NS, NS +3↑ NS, NS
Alb +9↓ †, * +12↑ †, *
Hb -1↓NS* +6↑ NS*
Monget et al.,
1996 (France)
RCT, DB, placebo controlled, age and
gender stratified; 3
treatment groups
6 mo,
N=575 (153M, 422F)
No Trt/Ctrl breakdown
Age: 82.9(7.8)y
[INT]
Vitamins: A (20 = 1000 RE, B-
carotene), E (15, a-
tocopherol), C (120)
A (B-
carotene)
(V/M/V+M)
↑/↓/↑ NS all ↓
A (Retinol) ↑/↓/↑ NS all ↓
E (a-
tocopherol) ↑/↑/↑ Sig V effect ↓

245
Pill
Minerals: Se (100
elemental, in sodium
selenite), Zn (20 elemental, in zinc sulfate)
Vit-Min: contains both
vitamin/mineral content
[CTRL]
Placebo
C ↑/↓/↑ Sig V effect ↑
Se ↑/↑/↑ Sig M effect, Sig V+M interaction ↑
Zn -/↑/↑ Sig M effect ↓
Single Nutrient
Favrat et al.,
2011
(Switzerland)
RCT,
4 wk,
Pill
N=50
Int: n=26 (12M,14F)
Ctrl: n=24 (11M,13F)
Age:
Int:69.6(18.8)y
Ctrl: 68.6(18.5)y
[INT] B12 (1000 µg)
[CTRL]
Placebo
B12, S
[Change difference]
101.6 (60.1 - 143.2) ***
See intervention
MMA
-0.13 (-0.19 to
-0.06) ***
Hcys 0.04 (-1.2 to 1.3), NS
Hct -0.4 (-1.7 to 0.8), NS
MCV -0.4 (-2.2 to 1.4) NS
Ter Riet et al.,
1995 (The
Netherlands)
RCT, DB, placebo
12 wk,
Pill
N=88 Int: n=43
Ctrl: n= 45
No age info given
[INT] C (1000)
[CTRL]
C (20) C,pl + 64.2, No p-values +5.11
Arcasoy et
al., 2001
(Turkey)
Pre/Post1G
90 d,
Pill
N=43(18M, 25F) for baseline
data; Only 15 participants on
supplements
No age info given.
Zn (30) (elementary, in
ZnSO4 formula)
Zn, S ↑ ‡ N/A
Zn Binding
capacity, S ↓ ‡
See Table 6A notations; Baseline vs final: † p<0.05, ‡ p<0.01, ‡‡ p<0.001; Intervention vs Control: *p<0.05, **p<0.01, ***p<0.001

246
Table 7A. Fortification: Results from Vitamin D and Calcium Studies
Author
Design,
Length Food; Svg Size Participant Characteristics Intervention Biomarker
Intervention Control
Change Change
Bonjour et al., 2011 (France)
RCTc,
6 wk
Cheese;
2x100g svg/d
N=21 (21F)
Age: 87.2(6.1)y
[INT]
D (100) Ca (302)
25(OH)D, S ~+7.5 †
N/A
PTH , S
~ -3, NS (but significant
reduction
compared to
control, per text)
OC,S ~2 µg/L, NS
Bonjour et al., 2013 (France)
RCT,
DB,
placebo
56d
Yogurt; 250g
(2x125g
svg/d)
N=59
Int: n=32F
Ctrl: n=27F
Age:
Int:85.8(1.2)y
Ctrl:85.1(1.3)y
[INT] D (400),
Ca (800)
[CTRL] Ca (280)
25(OH)D
[p-value group diff]
+25.3(1.8) ***
+5.2(2.5)***
Ca - NS -0.03(0.02)
P, i +0.08(0.03) NS +0.10(0.02)
PTH -28.6(7.2) ** -7.1(2.9)**
AP µg/L -1.4(1.4), NS -0.1(1.2) NS
Mocanu et al.,
2009
(Romania)
*Used paper values - paper
different from
abstract for
25(OH)D
Pre/Post 1G,
1 yr
Bun; 100g, 1
svg/d
N=45 (17 M, 28F)
Age: 71(6.9)y
[INT]
D (5000),
Ca (320 elemental,
800 as CaCO3)
25(OH)D, S* ↑ ‡‡
N/A
Ca, S ↓ NS
Ca, U
↓ ‡‡
(significance also seen at 3 and 6
mo)
PTH, S
↓ ‡‡
(significance also
seen at 6 and 9 mo)
OC, S ↓ ‡‡
Bonjour et al.,
2009 (France)
Pre/post 1G,
1 mo
Cheese;
2x100g svg/d
N=35 (35F)
Age: 84.8(8.1)y
[INT]
D (100)
Ca (302)
25(OH)D, S +2 ‡
N/A
Ca, S -0.02 NS
P, S +0.03 NS
Alb, S +2.1 ‡‡
PTH, S -9.2 ‡
OC, S +2.7 †
AP, S µg/ml +0.1 NS
See Table 6A notations; Baseline vs final: † p<0.05, ‡ p<0.01, ‡‡ p<0.001; Intervention vs Control: *p<0.05, **p<0.01, ***p<0.001

247
Table 8A. Fortification: Results of Other Micronutrient Studies
Authors
Design,
Length
Participant
Characteristics
Food; Svg Size
Dosage level (total
daily)
Biomarker
Intervention Control
Change Change
Van der
Wielen et al.,
1995 (The
Netherlands)
RCT, single
blind, placebo
12 wk
N=33 (33F)
Int: n=15
Ctrl: n=18
Age:
Int:81(6)y
Ctrl: 82(8)y
Int: Fortified fruit
juice w 50g CHO +
50% of dietary recommendations of
water-soluble
vitamins,
400ml (2x200ml/d)
[INT] C (31.5), B1 (0.44),
B6 (0.81),
Folic acid (63),
B12 (1.10)
[CTRL]
Placebo juice with
C (40.5)
C + 17(25)* + 14(25)*
B1 (TPP) +16(21)** -22(43)**
B6 (P5P) + 45(24)*** -1(21)***
Folate +6(5), NS +3(9), NS
B12 -11(131), NS -22(114), NS
Hcys -7(8)* +2(12)*
Bermejo et
al., 2009 (Spain) Using
Centre M and
C data only
Pre/Post C,
6 mo
N=126
Age: 82.4(7.3)y
Margarine,
10 g portion
[INT]
Trt 1: 200 µg Food folate + 200 µg
folic-acid fortified
margarine (400 µg
total folic acid)
[CTRL]
Placebo
Folate, S ↑ ‡‡, * ↓ NS, *
Folate, RBC ↑ ‡‡, * ↑‡‡, *
Hb ↑ NS,* ↑‡‡, *
Hcys ↓ NS, NS ↓ NS, NS
Adolphe et
al., 2009
(Canada)
Pre/Post 1G,
8 wk
N=11 (2M, 9F)
Age: ≥ 50y
Pureed food -
vegetable and meat at
lunch and supper;
400g (4 x100g svg/d)
[INT]
D (640), E (16), C (180), B1 (1.6), B2
(2.0), B3 (21), B5
(2.4), B7 (30), folic
acid (400), B12 (4)
25(OH)D), S ↑ ‡
N/A
Folate, S ↑ ‡
B12, S ↑ NS
Keane et al., 1998 (Ireland)
Post test 2G 6 mo minimum
N=89
Int:49 (10M, 39F) Ctrl: 40 (10M, 30F)
Age:
Int:84y Ctrl: 81.9y
Milk,
200ml (2x100ml svg/d)
[INT]
Folic acid (76)
[CTRL] Folic acid (8)
Folate, S
No baseline
given, *** No baseline ***
Folate, RBC No baseline given *** No baseline ***
See Table 6A notations; Baseline vs final: † p<0.05, ‡ p<0.01, ‡‡ p<0.001; Intervention vs Control: *p<0.05, **p<0.01, ***p<0.001

248
Table 5B. Supplementation: Results from Vitamin D and Calcium Studies
Reference
(Location) Biomarkers
Baseline - Int [Mean(SD), unless
otherwise indicated] Endpoint – Int Baseline – Ctrl Final – Ctrl
Chel et al., 2008 (The
Netherlands)
25(OH)D (nmol/L)
D: 23.0(8.3)
Wk: 27.3(12.7)
Mo: 23.8(8.0)
[@ t2]
D: 69.9(17.8)
Wk: 67.2(14.0)
Mo: 53.1(15.9) 25.2(12.1)
[@ t2]
25.5(12.0)
Ca corrected (mmol/L)
D:2.42(0.10)
Wk: 2.41(0.08) Mo: 2.42(0.09)
D:2.45(0.10)
Wk:2.43(0.10) Mo:2.44(0.10) 2.42(0.10) 2.42(0.09)
P (mmol/L)
D:1.01(0.14) Wk:1.03(0.15)
Mo:1.02(0.13)
D:1.05(0.11) Wk:1.04(0.14)
Mo:1.04(0.12) 1.04(0.12) 1.01(0.14)
PTH (ng/L)
(ratio of medians)
D:66.4(45.5-107.3) Wk:59.1(48.2-86.4)
Mo:65.5(46.4-99.1)
D:46.4(33.6-70) Wk:53.6(47.3-69.1)
Mo:50.9(39.1-80.9) 65.5(45.5-107) 68.2(46.4-100)
Meyer et al., 2002
(Norway)
25(OH)D, S
(nmol/L) 47(26) (n=34)
(@ End of 1 year - No data
available on Year 2)
64(21) 51(33) (n=31)
(@ End of yr 1 -
No data on yr 2)
46(20)
Ca, ionized, S
(mmol/L) 1.23(0.05) (n=31) 1.23(0.06) 1.24(0.04) (n=26) 1.24(0.06)
PTH, S (ng/L) 6.5(3.1) (n=36) 7.5(4.2) 5.6±3.3 (n=34) 7.2(4.7)
OC, S (µg/L) 12.3(5.85) (n=35) 9.36(4.68) 11.7(5.26) (n=33) 8.77(4.09)
Krieg et al.,
1999
(Switzerland
)
25(OH)D (nmol/L) 29.7(3.0) 66.1(4.0) 29.2(3.0) 14.2(2.5)
Ca (mmol/L) 2.32 ± 0.02 2.31 ± 0.02 2.29 ± 0.01 2.23 ± 0.01
PTH (ng/L) 43.1 ± 3.2 35.5 ± 2.7 44.6 ± 3.5 67.2 ± 5.7
AP (µkat/L) 1.47(0.09) 1.26(0.09) 1.45(0.08) 1.40(0.09)
Chapuy et al., 1992
(France)
25(OH)D (nmol/L) 39.9(27.5) 104.8(22.4) 25.0 (20.0) 27.5(17.5)
1,25(OH)2D
(pmol/L) 67.6(26) 70.2(23.4) 75.4(26) 67.6(23.4)
Ca (mmol/L) 2.29(0.09) 2.30(0.1) 2.29(0.10) 2.25(0.09)
PTH (ng/L) 54(37) 30(14) 50(24) 56(29)
OC (µg/L) 8(3) 7(2) 8(3) 8(3)
AP (µkat/L) 1.15(0.42) 1.12(0.37) 1.20(0.37) 1.49(0.45)
Moreira-
Pfrimer et
al., 2009 (Brazil)
median
(ranges)
25(OH)D (nmol/L) 45.9 (20.3–84.8) 86.6 (52.3–106.5) 39.5 (20.3–68.8) 51.8 (23.5–107.8)
Ca, ionized
(mmol/L) 1.3 (1.2–1.4) 1.25 (1.17–1.36) 1.3 (1.2–1.4) 1.27 (1.17–1.41)
Ca T (mmol/L) 2.23(1.98 - 2.48) 2.27(2.08-2.45) 2.25(1.85-2.35) 2.23(1.82-2.50)
P (mmol/L) 1.13(0.84-1.52) 1.10(0.87-1.42) 1.13(0.74-1.45) 1.10(0.87-1.55)
PTH, i (ng/L) 48.5 (42.3–158.1) 41.4 (21.6–151.6) 45 (20.7–162.7) 47.5 (6.6–101.5)
Dinizulu et
al., 2011
(Ireland)
25(OH)D (nmol/L)
[D only/ D+Ca] 24.4/
27.2
[D only/ D+Ca]
84.5/63.6
N/A N/A
Ca (mmol/L) 2.25/2.25 2.33/2.35
PTH, i not reported not reported
Canto-Costa et al., 2006
(Brazil)
25(OH)D (nmol/L)
[Tr1/Tr2/Tr3]
46.9(16.0)/
55.9(26.7)/ 60.4(18.5)
62.4(15)/
76.1(16.2)/ 80.6(17.5)
61.2(17.7) 54.4(23)
Ca T (mmol/L)
2.20(0.07)/2.20(0.1)/
2.1(0.1)
2.23(0.05)/
2.20(0.05)/
2.20(0.07) 2.20(0.07) 2.23(0.05)
PTH (ng/L)
58.6(17.5)/
51.2(28.1)/
53.6(28.6)
57.2 ± 30.5/
52.8 ± 25.4/
50.1 ± 25.1 29.6(8.2) 36(12.2)
OC (µg/L)
26.2 ± 8.1/ 40.2 ± 22.8/
34.5 ± 14.2
35.1 ± 18.1/ 40.9 ± 20.8/
33.9 ± 16.6 25.6(8.6) 27.1(8.1)

249
Chapuy et
al., 1987 (France)
25(OH)D (nmol/L) 21(11)
No final values - Only change
in values given (See Table 1A)
Same as Trt baseline
No final values -
Only change in
values given (See Table 1A)
Ca (mmol/L) 2.25(0.11)
P (mmol/L) 1.09(0.01)
PTH, i (ng/L) 75.0(99.4)
AP (Bodansky Units %) 4.6(1.3)
Schwalfenberg et al.,
2010
(Canada) 25(OH)D (nmol/L) N/A
(≥5 mo)
119.4(28.1) N/A N/A
D (IU), Ca (mg); NS = non-significant; N/A = not applicable; *Daily dose unless otherwise stated

250
Table 6B. Supplementation: Results Other Micronutrient Studies
Author Biomarkers
Baseline - Int - 1st
Arm? Endpoint - Int Baseline - Ctrl Final - Ctrl
Multi-nutrients
Allsup et al.,
2004 (UK)
[REF]
§ median
(IQR)
A (µmol/L) 2.9(0.9) 3.2(1.0) 3.1(1.0) 3.2(1.2)
D (nmol/L)§ 32.4(12.5) 52.4(22.5) 54.0(30.6) 49.5(27.0)
E (µmol/L) 25.4(8.8) 35.7(13.2) 29.2(10.5) 29.1(10.9)
C (µmol/L)§ 16.2(20.3) 58(31.5) 17.6(25.2) 23.9(20.2)
Folate (nmol/L)§ 10.6(12.5) 27.4(17.7) 10.2(7.92) 9.74(9.06)
Cu(µmol/L) 20.0(3.7) 20.0(3.8) 19.4(4.1) 19.6(4.1)
Se (µmol/L) 1.04(0.22) 1.16(0.22) 1.04(0.23) 1.06(0.26)
Zn (µmol/L) 10.3(1.6) 10.6(1.8) 10.7(2.1) 10.7(2.0)
Asciutti-
Moura et al.,
1993
(France)
E (a-tocopherol)
(µmol/L)
M:19.3(4.57)
F:22.8(24.21)
M: 27.9(4.85)
F: 24.4(7.32)
M: 15.1(0.52)
F:19.1(6.54)
M: 16.2(8.25)
F: 19.3(6.45)
C (ascorbic acid) (µmol/L)
M:26.8(22.12) F:36.8(27.42)
M:85.2(15.68) F:96.6(18.65)
M:24.2(19.35) F:31.2(9.87)
M:23.0(23.5) F:28.4(16.42)
B1 (aETK))
M:1.16(0.10)
F: 1.13(0.13
M:1.05(0.09)
F:1.06(0.09) 1.12(0.12)/1.11(0.10) 1.13(0.09)/1.10(0.12)
B1 (Erythrocyte
TPP) (µmol/L)
M:0.30(0.062)
F:0.19(0.056)
M:0.35(0.041)
F: 0.30(0.086) 0.21(0.058)/0.24(0.065) 0.23(0.082)/0.26(0.086)
B2 (aEGR) M:1.10(0.12) F: 1.07(0.09)
M:1.05(0.04) F:1.04(0.03) 1.08(0.10)/1.07(0.09) 1.10(0.10)/1.07(0.08)
B6 (aEAST)
M:1.85(0.40)
F: 1.88(0.40)
M:1.70(0.25)
F:1.60(0.15) 1.88(0.32)/1.85(0.28) 1.85(0.31)/1.89(0.31)
Grieger et
al., 2009 (Australia)
25(OH)D (nmol/L)
35.7(2.8)
No final MN values, only change
35.5(2.5)
No final MN values, only change
[Cut-off ranges]
% ≤ 50 nmol/L (77%, n=37) (23%, n=11) (83%, n=35) (90%, n=38)
% >50 nmol/L (23%, n=11) (77%, n=36) (17%, n=7) (10%, n=4)
Folate (nmol/L)
14.8(1.4)
No final MN values, only change 19.0(2.0)
No final MN values, only change
≤ 7 nmol/L (14%, n=6) (0%, n=0) (13%, n=4) (21%, n=9)
>7 nmol/L (86%, n=36) (100%, n=47) (87%, n=28) (79%, n=33)
B12 (pmol/L) 273.8(17.8)
No final MN values,
only change 296.0(25.0)
No final MN values,
only change
≤ 200 pmol/L (30%, n=13) (6%, n=3) (31%, n=10) (40%, n=17)
>200 pmol/L (70%, n=30) ( 94%, n=44) (69%, n=22) (60%, n=25)
Zn (µmol/L)
(No cut-offs given) 11.6(0.5)
No final MN values, only change 10.6(0.3)
No final MN values, only change
Meydani et
al., 2004
(US)
E, pl (µmol/L) 26.5(9.07) 49.2(16.0) 26.7(9.96) 28.1(9.47)
A (Carotenoids)
[% deficient]
11 11 6 12
A 1 2 2 4
D 2 0 2 0
E 3 0 1 0
B1 0 2 4 0
B2 0 2 2 2
B6 10 6 9 5

251
B12 0 0 0 0
Folate 0 0 0 0
Cu 6 3 7 3
Fe (Ferritin) 0 0 0 0
Zn 48 42 50 53
Alb 19 28 27 39
Hb 32 31 37 43
Monget et
al., 1996
(France)
A (B-carotene)(µmol/L)
(V/M/V+M)
0.90(0.53)/0.88(0.51)/0.87(0.54)
(V/M/V+M)
2.95(1.68)/0.84(0.54)/3.20 (1.83) 0.83(0.53) 0.75(0.37)
A (Retinol) (µmol/L)
2.10(0.63)/2.00(0.61)/2.01(0.63)
2.14(0.69)/2.10(0.69)/2.08(0.66) 2.06(0.73) 1.96(0.63)
E (a-tocopherol) (µmol/L)
29.9(7.85)/ 29.5(8.89)/29.3(7.38)
35.1(8.43)/29.6(8.68)/34.3(8.41) 30.2(8.64) 30.0(0.801)
C (µmol/L)
16.8(18.6)/19.6(18.1)/
18.91(18.91)
47.3(18.6)/18.7(18.9)/
48.94(18.91) 19.1(18.3) 32.82(6.64)
Se (µmol/L)
0.72(0.19)/
0.73(0.19)/0.70(0.20)
0.77(0.25)/1.18(0.20)/
1.11(0.23) 0.73(0.54) 0.74(0.20)
Zn (µmol/L)
10.7(1.95)/10.7(1.98)/
10.93(2.22)
10.7(2.17)/11.0(2.17)/
11.11(2.31) 10.69(1.94) 10.59(2.10)
Single Nutrient
Favrat et al.,
2011
(Switzerland)
Folate, S
(nmol/L)
[Post Int (1 mo)]
16.6(9.1) No final values
[Post Int (1 mo)]
19.2(10.9) No final values
B12, S (pmol/L) 164(24) 263.4(89.8) 154(20) 154.5(41.1)
MMA, S
(µmol/L) 0.43(0.25) 0.23(0.08) 0.41(0.24) 0.37(0.14)
HCys, S (µmol/L) 18.3(6.6) 16.5(6.1) 15.0(5.3) 13.9(4.3)
Hemotocrit (%
RBC) 40.3(4.2) 39.6(4.1) 39.5(4.6) 39.7(4.6)
Mean corpuscular
volume (fl) 91.2(9.2) 89.8(6.9) 92.6(5.1) 92.8(7.0)
Creatinine, S
(µmol/L) 96.4(27.9) No final values 89.0(27.2) No final values
Ter Riet et
al., 1995
(The Netherlands) C, pl (µmol/L)
No baseline values given 84.6
No baseline values given 27.3
Arcasoy et al., 2001
(Turkey)
Zn, S (µmol/L) 12.96(0.94) 14.34 (1.18)
N/A N/A
Zn Binding capacity, S
(µg/dL) 611.26(52.06) 358.71(49.89)
Units used: A, D: (IU); E, C, B1, B2, B3, B6, Ca, Cu, Fe, I, K (potassium), Mg, Zn: (mg); Folate, B7 (biotin) B12, Mo, Mn, Se :
(µg)

252
Table 7B. Fortification: Results from Vitamin D and Calcium Studies Author Biomarkers Baseline - Int Final - Int Baseline-Ctrl Final-Ctrl
Bonjour et al., 2011 (France)
– Crossover
control
25(OH)D, S
(nmol/L) 21.96(18.72)
Statistically significant
increase in 25(OH)D, and significant decrease
in PTH between
intervention and
control. No significant differences were
recorded between the
intervention and control period for serum Ca, P ,
Alb, and AP (data not
shown). N/A N/A
Ca, S (mmol/L) 2.24(0.07)
P, i, S (mmol/L) 1.12(0.12)
PTH , S (ng/L) 75.8(24.2)
Alb , S (g/L) 31.8(2.7)
Creatinine , S
(µmol/L) 83.9(25.9)
OC, S (µg/L) 30.3(13.0)
AP , S (µg/mL) 13.6(5.3)
Bonjour et al., 2013 (France)
25(OH)D
(nmol/L)
19.2(1.2)
[@ d56]
44.6(2.5)
16.2(0.6)
[d56]
21.4(2.7)
Ca (mmol/L) 2.31(0.02) 2.31(0.02) 2.31(0.02) 2.29(0.02)
P, i (mmol/L) 1.17(0.03) 1.24(0.03) 1.14(0.03) 1.24(0.03)
PTH (ng/L) 60.8(7.1) 32.4(1.8) 53.4(6.3) 46.3(4.6)
AP (µg/L) 18.9(1.2) 17.5(1.8) 20.2(1.2) 17.5(1.8)
Mocanu et al.,
2009 (Romania)
25(OH)D, S
(nmol/L) 28.5(9.9) 126.4(37.3)
N/A N/A
Ca, S (mmol/L) 2.29(0.15) 2.28(0.15)
Ca, Urine
(mmol/L) 3.7(1.6) 3.4(2.2)
PTH, S (pg/mL) 59.3(38.2) 19.0(16.0)
OC, S (µg/L) 20.1(10.3) 14.7(9.0)
Bonjour et al.,
2009 (France)
25(OH)D, S (nmol/L) 13.73(4.24) 15.72(4.24)
N/A N/A
Ca, S (mmol/L) 2.29(0.09) 2.27(0.11)
P, S (mmol/L) 1.18(0.12) 1.21(0.16)
Alb, S (g/L) 33.9(2.7) 36.0(2.6)
PTH, S (ng/L) 74.9(22.6) 65.7(23.7)
OC, S (µg/L) 32.6(14.6) 35.3(17.5)
AP, S (µg/ml) -
need to convert
U/L to ukat/L 16.4(10.1) 16.5(13.8)
D (IU), Ca (mg); NS = non-significant; N/A = not applicable; *Daily dose unless otherwise stated

253
Table 8B. Fortification: Results from Other Micronutrient Studies
Authors Biomarkers
Baseline
(Biochemical
Status) - Int
Final (Biochemical status)
- Int Baseline - Ctrl Final - Ctrl
Van der Wielen et al.,
1995 (The
Netherlands)
C (µmol/l) 33(28)
No final values; Only
change given (see Table
4A)
20(14)
No final values;
Only change given
(see Table 4A)
B1 (TPP)
(nmol/L) 131(26) 149(42)
B6 (P5P)
(nmol/L) 39(16) 46(25)
Folate
(nmol/L) 10(5) 14(11)
B12 (pmol/L) 320(202) 365(224)
Hcys
(µmol/L) 18(8) 17(5)
Bermejo et
al., 2009
(Spain)
Folate, S
(nmol/L)
[Centre M]
16.6 (6.1) 27.1(9.4)
[Centre C]
14.6(5.9)
14.5(5.3)
Folate, RBC
(nmol/L) 748 (260) 1403(438) 588 (416) 902(175)
Hb (g/L) 129(14) 132(17) 131(16) 142(14)
Hcys
(µmol/L) 16.1 (5.4) 14.9(4.4) 18.0(5.2) 17.0(4.8)
Adolphe et
al., 2009 (Canada)
25(OH)D, S
(nmol/L) 41(21) 66(11)
N/A N/A
Folate , S (nmol/L) 10.7(4.9) 25.2(6.4)
B12 , S (pmol/L) 436(192) 448(111)
Keane et al.,
1998 (Ireland)
Folate,S
(nmol/L)
No baseline
given
13.17(8.18) No baseline given
4.89(4.49)
Folate, RBC
(nmol/L)
No baseline
given 717.26(316.38) No baseline given 444.39(230.18)
Units used: A, D: (IU); E, C, B1, B2, B3, B6, Ca, Cu, Fe, I, K (potassium), Mg, Zn: (mg); Folate, B7 (biotin) B12, Mo, Mn, Se :
(µg)

254
Table 9. Supplementation of Vitamin D/Calcium
RDAs/AIs for Male/Females >70 years of age: Vitamins A (900/700 µg), vitamin D (800 IU), E (15/15 mg), C (90/75 mg), thiamin (1.2/1.1 mg), riboflavin (1.3/1.1
mg), niacin (16/14 mg), pantothenic acid (5/5 mg, AI used), B6 (1.5/1.5 mg), folate (400/400 µg), B12 (2.4/2.4 µg),
biotin (30/30 µg, AI used), choline (550/425 mg, AI used); calcium (1200/1200 mg), copper (900/900 µg), iodine
(150/150 µg), iron (8/8 mg), magnesium (420/320 mg), manganese (2.3/1.8 mg, AI used), potassium (4700/4700 µg,
AI used), selenium (55/55 µg), and zinc (11/8 mg).
Reference (Country) Dose (daily, unless otherwise specified)
Chel et al., 2008 (Netherlands)
D 600 IU/d, 75% RDA)
[Or 4200IU/wk, or 18000IU/mo]
Or Ca (320 mg, 27% RDA) with D (3 dosage schedules, above)
Meyer et al., 2002 (Norway) D (400 IU, 50% RDA)
Krieg et al., 1999 (Switzerland) D (880 IU, 110% RDA) Ca (500 mg elemental calcium, 42% RDA)
Chapuy et al., 1992 (France) D (800 IU, 100% RDA) Ca (1200 mg, 100% RDA)
Moreira-Pfrimer et al., 2009 (Brazil)
150,000 IU and 90,000 IU vitamin D per month for a 6 month intervention
(~3667 IU, 306% RDA)
Dinizulu et al., 2011 (Ireland) D (800 IU, 100% RDA) alone OR withwith Ca (1000 mg, 83% RDA)
Canto-Costa et al., 2006 (Brazil) D (7000 IU/wk, 125% RDA at 1000 IU/day)
Chapuy et al., 1987 (France)
D (800 IU, 100% RDA) and
Ca (1000 mg, 83% RDA)
Schwalfenberg et al., 2010 (Canada) D (2000 IU, 167% RDA)

255
Table 10. Supplementation of Other Micronutrients
Author (Country) Dose (Daily, unless otherwise specified)
Multi-nutrient
Allsup et al., 2004 (UK) [REF]
A (2,666 IU, 89% RDA)
D (400 IU, 50% RDA)
C (120 mg, 133% RDA) E (60 mg, 400% RDA)
B1 (1.2 mg, 100% RDA)
B2 (1.4 mg, 108% RDA)
B3 (14 mg, 88% RDA) B5 (5 mg, 100% AI)
B6 (3.0 mg, 176% RDA)
B7 (30 µg, 100% AI)
Folic acid(600 µg, 150% RDA) B12 (200 µg, 8333% RDA)
Ca (240 mg, 20% RDA)
Cu (2000 µg, 222% RDA) Fe (12 mg, 150% RDA)
I (150 µg, 100% RDA)
Mg (100 mg, 24% RDA)
Se (60 µg, 109% RDA) Zn (14 mg, 127% RDA)
Asciutti-Moura et al., 1993 (France)
Vitamin E (6.8 mg, 45% RDA)
C (200 mg, 222% RDA)
B1 (7.5 mg, 625% RDA)
B2 (9 mg, 692% RDA) B3 (35 mg, 219% RDA)
B5 (15 mg, 300% AI)
B6 (11 mg, 647% RDA)
Grieger et al., 2009 (Australia)
A (9900 IU, 330% RDA)
D (400 IU, 50% RDA)
E (12.2 mg, 123% RDA) C (75 mg, 83% RDA)
B1 (thiamine hydrochloride) (15 mg, 1250% RDA)
B2 (10 mg, 769% RDA)
B3 (Nicotinamide) (50 mg, 313% RDA) B5 (35 mg, 700% AI)
B6 (25 mg, 1167% RDA)
B7 (100 µg, 333% AI)
Folate (200 µg, 50% RDA) B12 (25 µg, 1042% RDA)
Ca (144 mg, 12% RDA)
Fe (5 mg, 63% RDA) Mg (75 mg, 18% RDA)
Mn (750 µg, 33% AI)
K (1500 µg, 32% AI)
Zn (6 mg, 55% RDA)
Meydani et al., 2004 (US)
E (90 mg, 600% RDA) with 50% RDA of vitamins and minerals:
A (1332 IU, 45% RDA),
D (4000 IU (100 µg (per paper), 500% RDA)
C (30 mg, 30% RDA)
B1 (0.6 mg, 50% RDA) B2 (0.6 mg, 46% RDA)
B3 (6.0 mg, 38% RDA)
B6 (0.9 mg, 53% RDA)
Folic acid (100 µg, 25% RDA) B12 (1 µg, 42% RDA)
Cu (0.8 mg, 89% RDA)
Fe (5 mg, 63% RDA)

256
I (75 µg, 50% RDA)
Se (25 µg, 45% RDA)
Zn (7 mg, 64% RDA)
Note: values taken for Meydani et al., 2007 pg 1168
Monget et al., 1996 (France)
A (3330 IU, 111% RDA)
E (15 mg, 100% RDA)
C (120 mg, 133% RDA) Zn (20 mg, 182% RDA)
Single Nutrient
Favrat et al., 2011 (Switzerland) B12 (1000 µg, 41667% RDA)
Ter Riet et al., 1995 (The
Netherlands) C (1000 mg, 1111% RDA)
Arcasoy et al., 2001 (Turkey) Zinc (30 mg, 273% RDA)

257
Table 11. Fortification of Vitamin D and Calcium
Author Dose (Daily, unless otherwise specified)
Bonjour et al., 2011 (France)
D (100 IU, 13% RDA)
Ca (302mg, 25% RDA)
Bonjour et al., 2013 (France) D (400 IU, 50% RDA) Ca (800 mg, 67% RDA)
Mocanu et al., 2009 (Romania)
*Used paper values - paper different from abstract for 25(OH)D
D (5000 IU, 625% RDA) Ca (320 mg, 27% RDA)
Bonjour et al., 2009 (France)
D (100 IU, 13% RDA)
Ca (302mg, 25% RDA)

258
Table 12. Fortification of Other Micronutrients
Authors Dose (Daily, unless otherwise specified)
Van der Wielen et al., 1995 (The
Netherlands)
C (31.5 mg, 35% RDA)
B1 (0.44 mg, 37% RDA) B6 (0.81 mg, 48% RDA)
Folic acid (63 µg, 16% RDA)
B12 (1.10 µg, 46% RDA)
Bermejo et al., 2009 (Spain) Using Centre M and C data only
Folic acid (200 µg, 50% RDA) (food folate estimated to provide remaining 50% RDA)
Adolphe et al., 2009 (Canada)
D (640 IU, 80% RDA) E (16 mg, 107% RDA)
C (180 mg, 200% RDA)
B1 (1.6 mg, 133% RDA)
B2 (2.0 mg, 154% RDA) B3 (21 mg, 131% RDA)
B5 (5 mg, 100% AI)
B7 (30 µg, 100% AI)
Folic acid (400 µg, 100% RDA) B12 (4 µg, 167% RDA)
Keane et al., 1998 (Ireland) Folic acid (76 µg, 19% RDA)

259
Table 13. Five-Day Super-Menu Sample Menu
Amount Day 1 Amount Day 2 Amount Day 3 Amount Day 4 Amount Day 5
BREAKFAST No Juice Soy Beverage Half amount of
milk Vegetarian (lacto-ovo)
250 ml Milk, 2% 250 ml Milk, 1% 250 ml Soy beverage,
enriched 125 ml Milk, 1% 125 ml Soy beverage,
enriched
53 g Egg, hard
boiled 125 ml Cranberry
juice 14 g Apricot (2 each) 125 ml Grape Juice
150 ml (30 ml)
Super Oatmeal (Almond Butter) 212 g
Basil, Oregano,
Mushroom and Spinach
quiche 125 g Frittata 125 ml Super oatmeal 125 ml (30 ml)
Super oatmeal (Almond butter)
70 g
(15 ml)
Bread, WW [2sl]
(Margarine)
35 g
(23 ml)
Bread, WW [1 sl]
(Almond Butter)
100 ml (30 ml)
Yogurt (Granola) 69 g Kiwi (each) 60 g
Scrambled egg
125 ml Mashed sweet
potato 80 g Apple bacon
mini loaf
LUNCH
125 ml Milk, 2% 250ml Milk, 1% 125 ml Soy milk 250 ml Milk, 1% 250 ml Milk, 1%
125 ml (30 ml)
Endive and fennel salad
(Italian dressing) 125 ml
Soybean (edamame) 180 ml
Creamed spinach
100 ml (15 ml)
Mashed carrots (Butter) 125 ml Squash cubes
125 ml
Cream of mushroom soup (prep
w milk) 125 ml Tomato juice, low sodium 180 ml
Squash, carrot, ginger soup
100 ml Brown rice 125 g Baked red potatoes 125 ml
Fried rice with carrots and
peas 100 g Baked potato
59 g
10 ml
French bread (1 sl)
Butter + garlic
90 g Meatloaf 90 g
(15 ml) Baked Salmon
(Margarine) 120 g Tandoori chicken 150 ml Meat loaf 250 g
Vegetarian no-pasta Lasagna

260
90 ml Rhubarb ckd
w sugar 15 g Oatmeal cookie
(each) 100 g Cinnamon pull-
apart loaf 100 ml (40 ml)
Yogurt (Granola)
DINNER
125 ml Milk, 2% 125 ml Milk, 1% 175 ml Soy beverage,
enriched 125 ml Milk, 1% 125 ml Soy beverage,
enriched
180 ml Broccoli, ckd 125 ml Broccoli, ckd 125 ml
Kale and Red Cabbage Salad 250 ml
Arugula (125 ml),
clementine (74g), cheese
(20g) and pumpkin
seeds (30ml)
100 ml Brown Rice 125 ml (20 ml)
Baked mashed sweet
potatoes (Margarine) 59 g
Sour dough bread 100 ml
Make ahead hash/mashed
potatoes 130 ml Brown Rice
125 g
Bok Choy mushroom
and tofu soup 180 ml Fish stew 180 ml
Cream of spinach soup
90 g (15 ml)
Multigrain Tilapia
(Margarine) 150 g Liver and
onions 180 ml
Beef and vegetable
stew 200 ml Turkey quinoa
chili 180 ml Curry chickpea
stew
100 ml (30 ml)
Yogurt (Super
granola) 74 g Clementine
(each) 100 g
Applesauce Banana bread w choc chips 100 g Pumpkin pie

261
Table 14. Key foods used to meet DRIs in Super-menus
FOODS AND INGREDIENTS CHOICES
Vegetables and Fruit
Vegetables: Bell pepper (red), Broccoli, Cabbage (red), Carrot, Eggplant, Endive
(curly), Fennel, Kale, Mushrooms, Potatoes w skin, Spinach, Squash (butternut, zucchini), Sweet potatoes Fruits: Apricots, Clementine, Oranges
Grain Products Bran, Brown Rice, Quinoa, Wheat germ Meat and Alternatives Nut butters (almond butter)
Black beans, Chickpeas, White beans Nuts/seeds: Almond, Flax, Pecan, Pumpkin, Squash, Sunflower, Walnut
Milk and Alternatives Cheese (Ricotta, Mozzarella, Swiss), Milk, Soy milk, Yogurt Fats and Oils Butter, Canola oil, Margarine, Herbs and Spices Herbs: Basil, Bay leaf, Cilantro, Coriander, Oregano, Parsley, Rosemary, Thyme
Spices: Cinnamon, Chili/cayenne pepper, Cloves, Cumin, Garlic, Ginger (ground
vs root), Nutmeg, Paprika, Turmeric
Table 15. Between-home comparison of planned menus and the Dietary Reference Intake for calories, protein and micronutrients
Nutrients Mean±SD [Median]
RDA/AI Home A
Home B
Home C
Home D
Home E
Calories, kcal --- 2096 ± 324ab
2008 ± 213ab
1748 ± 253a
2022 ± 265ab
2358 ± 349b
Protein, g --- 88.6 ± 20.0ab
86.2 ± 11.0ab
76.9 ± 8.96ab
72.7 ± 13.7a
95.2 ± 15.5b
Dietary Fibre, g --- 20.4 ± 2.83a
18.4 ± 4.47ab
15.8 ± 2.93ab
15.6 ± 2.90b
20.1 ± 2.94ab
Vitamin A, RAE 700F/900M 1038 ± 635ab
[828]
903 ± 248a
986 ± 689ab
[725]
1152 ± 716ab
[995]
1873 ± 75b
[1672]
Vitamin D, µg 20 6.78 ± 1.33†a
7.61 ± 2.06†a
8.79 ± 11.1†a
[4.98]
8.24 ± 1.03†a
13.1 ± 0.53a
Vitamin E, mg 15 5.27 ± 2.50†a
[4.39]
3.85 ± 1.96†a
5.01 ± 1.73†a
5.52 ± 0.96†a
5.98 ± 0.52†a
Vitamin C, mg 75F/90M 120.7 ± 27.8ab
105.2 ± 38.0ab
88.9 ± 24.6a
103.9 ± 21.4ab
126.9 ± 7.13b
Thiamin, mg 1.1F/1.2M 1.16 ± 0.21a
1.46 ± 0.32ab
1.44 ± 0.25ab
1.45 ± 0.28ab
1.64 ± 0.27b
Riboflavin, mg 1.1F/1.3M 2.07 ± 0.40a 3.08 ± 0.36b 2.37 ± 0.16ac 2.79 ± 0.34bcd 2.93 ± 0.32bd

262
Niacin, NE 14F/16M 26.7 ± 6.23ab
23.3 ± 9.58a
[20.6]
27.5 ± 4.52ab
20.1 ± 6.72a
33.7 ± 5.04b
Pantothenic acid,
mg
51 7.24 ± 0.86a
8.05 ± 1.05a
6.72 ± 0.76a
6.98 ± 1.37a
12.32 ± 0.87b
B6, mg 1.5F/1.7M 1.33 ± 0.4a
1.83 ± 0.50a
1.62 ± 0.21a
1.52 ± 0.42a
1.80 ± 0.25a
Folate, µg DFE 400 294.3 ± 78.1 ab
189.8 ± 56.7†a
271.2 ± 57.4 ab
213.0 ± 57.9 a
[190.4]
336.2 ± 13.4b
B12, µg 2.4 7.09 ± 8.76a
[4.34]
15.1 ± 1.03a
9.64 ± 2.79a
15.2 ± 9.06a
[12.0]
9.78 ± 8.26a
[6.32]
Calcium, mg 1200 889 ± 165 a
1032 ± 159a
962 ± 133a
1387 ± 199b
1506 ± 210b
Copper, mg 0.9 1.43 ± 1.33a
[0.98]
0.80 ± 0.17a
1.03 ± 0.13a
1.48 ± 1.68a
[0.85]
1.78 ± 1.44a
[1.23]
Iron, mg 8 14.6 ± 5.73a
[12.1]
10.6 ± 1.50a
10.88 ± 1.79a
10.50 ± 0.72a
12.6 ± 1.85a
Magnesium, mg 320F/420M 234.7 ± 45.4a
216.5 ± 33.3a
269.2 ± 37.3*ab
232.4 ± 45.7a
325.1 ± 49.1b
Manganese, mg 1.8F/2.3M1 3.91 ± 0.97a
2.40 ± 1.34a
3.34 ± 0.74a
2.96 ± 0.82a
3.90 ± 1.25a
Phosphorus, mg 700 1123 ± 76.3a
1299 ± 184a
1363 ± 177a
1276 ± 222a
1742 ± 187b
Potassium, mg 47001 2841 ± 564a
2532 ± 404a
2711 ± 388 a
2534 ± 429a
3653 ± 411b
Selenium, µg 55 81.3 ± 13.3a
93.2 ± 16.7ab
107.3 ± 13.9ab
80.1 ± 11.6a
111.5 ± 32.1b
Sodium, mg 2300 4343 ± 3066a
[3219]
2958 ± 825a
2426 ± 321a
3277 ± 776a
3333 ± 697a
Zinc, mg 8M/11F 9.27 ± 2.20ab
8.61 ± 1.71a
8.50 ± 1.35a
8.17 ± 1.40* a
12.25 ± 3.48b
F=Female; M=Male; RDA = Recommended Dietary Allowance; SD = standard deviation; 1Represents an AI rather than an RDA; Mean±SD: † Represent values < 50% of RDA; values between 50-75% of RDA in italics; M = Males only; a,b,c,d,e Values with different superscripts indicate a significant difference at p<0.01; [Boxed]
values represent the median, and indicate skewness in the data with a >10% difference between: ((mean-median)/mean)

263
Table 16. Comparison of planned menu and super menu averages to Dietary Reference Intakes
for calories, protein, fibre, and micronutrients
Nutrients Mean±SD RDA/AI Home Average Super Menu Average
Calories, kcal --- 2046 ± 333
2074 ± 244
Protein, g --- 83.9 ± 15.8
94.6 ± 9.57
Dietary Fibre, g --- 18.0 ± 3.72
23.4 ± 1.53*
Vitamin A, RAE 700F/900M 1190 ± 695 [979]
2721 ± 1426
Vitamin D, µg 20 8.90 ± 5.29†
[7.37]
11.2 ± 2.54
Vitamin E, mg 15 5.13 ± 1.74†
12.6 ± 4.08*
Vitamin C, mg 75F/90M 109.1 ± 27.8
128.2 ± 44.9
Thiamin, mg 1.1F/1.2M 1.43 ± 0.30
1.59 ± 0.33
Riboflavin, mg 1.1F/1.3M 2.65 ± 0.49
3.54 ± 1.33
Niacin, NE 14F/16M 26.3 ± 7.79
36.8 ± 6.28*
Pantothenic acid, mg 51 8.26 ± 2.31
10.5 ± 3.03
B6, mg 1.5F/1.7M 1.62 ± 0.40
2.29 ± 0.72
Folate, µg DFE 400 260.9 ± 89.5
509.3 ± 92.7*
B12, µg 2.4 11.4 ± 7.24
[8.96] 17.4 ± 19.6
Calcium, mg 1200 1155 ± 298
1621 ± 166*
Copper, mg 0.9 1.31 ± 1.14
[0.99] 2.75 ± 2.45
Iron, mg 8 11.9 ± 3.17
15.3 ± 2.43*
Magnesium, mg 320F/420M 255.6 ± 56.1M
446.9 ± 39.3
Manganese, mg 1.8F/2.3M1 3.30 ± 1.15
4.69 ± 1.19
Phosphorus, mg 700 1361 ± 267
1733 ± 152*
Potassium, mg 47001 2854 ± 593
4018 ± 489*
Selenium, µg 55 94.7 ± 22.2
109.0 ± 12.1
Sodium, mg 2300 3267 ± 1547
2298 ± 385*
Zinc, mg 8M/11F 9.36 ± 2.54
12.5 ± 1.37*
F=Female; M=Male; RDA = Recommended Dietary Allowance; SD = standard deviation 1Represents an AI rather than an RDA; Mean±SD: † Represent values < 50% of RDA; values between 50-75% of RDA in italics; M = Males only; [Boxed] values represent the median, and indicate skewness in the data with a >10% difference between: ((mean-median)/mean); *p<0.05 (Two-tailed t-test between Home Menus (n=35) and Super
Menus (n=5), assuming unequal variance); Note: Assumption of variance may not have been met in the t-test by comparing 35 Home Menu days with 5 Super-Menu days.

264
Table 17. Participant characteristics
† Note: All webinar respondents were female; 3 dietitians-only groups, 8 mixed staff groups
IN-PERSON RESIDENT/FAMILY FOCUS GROUPS N %
GENDER 71
Women 53 75
Men 18 25
ROLE 71
Resident 45 63
Family 17 24
Staff 9 13
KEY INFORMANT INTERVIEWS N Percentages
GENDER 10
Women 9 90
Men 1 10
ROLE 10
Industry 2 20
Clinical Practice 4 40
Others (*MOHLTC officer, Culinary expert, Consulting RD firm president, Corporate LTC Menu Planner)
4 40
WEBINARS† N Percentages
LOCATION 45
Alberta 9 20
British Columbia 3 7
Manitoba 1 2
Nova Scotia 2 4
Ontario 23 50
Prince Edward Island 2 4
Saskatchewan 5 11
OCCUPATION 45
Registered Dietitian 29 63
Nutrition Manager 11 24
Chef 1 2
Others (Food supervisor, program lead, CQI Coordinator, Dietitian in Education)
4 9
YEARS OF WORK 45
< 1 year 5 11
1-5years 9 20
6-10 years 7 15
11-15 years 4 9
>15 years 20 43

265
Table 18.
Exemplar Quotes on the Acceptability of Food Fortification in Long-Term Care Participant Direct quotes
Reflections on Current Strategies
Registered Dietitian
(RD)16
{When asked about considering micronutrients when thinking about malnutrition in
residents}*We focus on macronutrients, because they’re the things we can do the most with.
RD17 If we focus on good, nutrient-dense foods that are high in the macronutrients – I’m hopeful
that we get the micronutrients.
Key Informant (KI)4,
Corporate LTC Menu
Planner
{When asked about concerns with poor intake of residents} [It’s] quite a lot of food… We
know the residents can’t eat all the food, but we have to provide it because that’s a Ministry
license [requirement]
KI7, Ministry of Health
and Long-Term Care
officer
The residents wanted to know whether they can actually ask for smaller portions at the point
of service or even as part of the menu planning, they had concerns with following Canada’s
Food Guide, saying that it was too much volume or too much weight…The intent… was not
to require that the homes adhere strictly to the portion sizes and numbers of servings as per
Canada’s Food Guide…[but to focus on] the variety aspect and fresh fruits and vegetables.
Nutrition Manager (NM)36
{On food vs. pills and movement in LTC to reduce polypharmacy} Giving another pill
is…almost the straw to break the camel’s back… If it’s in the food, then maybe we can eliminate some of those medications.
NM36
{On side effects of Oral Nutritional Supplements (ONS)} The reality is, we do have
supplements… The difficulty is that when they drink one of those tetras [ONS]…they’re
full! So they’re not getting fibre or other things that they need…then you’re ending up
having to look at bowel protocols at the other end.
KI2, Health and
Marketing Specialist for
Food Supplier
{On redundancy of current strategies} We have the powders, the formulas, whatever, but it
doesn’t seem to be getting anywhere…Our residents have to show malnutrition…to actually
get the referral to the RD [registered dietitian], for the RD to see them and give them the
supplement. So if we try to meet those needs before that happens… to be proactive
[emphasis noted in recording] instead of reactive, I think it would be a good idea.
Family Resident Council
(FRC)2
{On preference for current strategy of pill supplementation} At least if vitamins are being
administered separately, it would ensure adequate amounts of vitamins are being consumed.
Appropriateness of Fortification Strategy
KI1, Industry Brand
Manager
{On concerns with a fortification strategy} Once you take the product and add…
micronutrients…automatically, you’ll increase the cost.
KI5, Culinary Expert
If you think about somebody unwrapping a bouillon cube or a packet [to add fortificant
formulation]…Someone is going to throw the thing in with the packet still on… [and] you
don’t know what they dilute with! …There’s just too many variables… [for adding
fortificant formulation to current food products]
NM36
{When adding fortificant formulation to a food product in-house, concern about accuracy}
A scoop – is it a full scoop, or is it over-the-top scoop, or is it not quite up to the level
scoop?
RD9
{On whether the strategy is food or medication} Safety issues…[and the] legal
ramifications...[of] asking a health care…or food service aide…and making them
responsible for a vitamin, which is bordering on a medication.
Resident Council (RC)1 If taste was taken away, then it’s useless.
Family council (FC)2
{On uncertainty of adequacy of food fortification strategy} Those residents who are most
likely to suffer from nutrient deficiency are those with decreased appetite. If [residents] are
not consuming sufficient amounts of food, nutrient enhancement of food would be of little
or no benefit to these residents.
Promoting feasibility of a fortification strategy
RD28
{On need to make fortification easy to incorporate into daily routine}
[Make it] part of a recipe [where] it has been tasted and everything has been worked out
There has to be good tracking system to make sure that what is supposed to be received is…delivered and monitored…If we don’t consume all of it, at least have an idea of that…

266
KI7 - Ministry of Health
and Long-Term Care
officer
The assessment part of it…Who would be the candidate for the supplementation… Across
the board, how would that process work? What directions would we give?
NM5
{On need for multi-level involvement} If they understand why it needs to be done, the
reasons for it and the importance of it, it seems to happen better – on a more consistent basis, and they feel better informed, know that what they’re doing is, in actuality, better for
the resident that they’re feeding. They get the ownership of doing the thing correctly.
Determining the potential effectiveness of a fortification strategy
NM36
{On need to elaborate on strategy before effectiveness can be appropriately determined}A
lot of residents request small portions. And if I know there are more nutrients in the
products, then even that small portion will help them. So I do see that as a positive. The
difficulty is, how do we get it into that product?
KI1 – Food Industry
Expert
{On need to demonstrate cost-benefit of strategy}It’s this notion of cost-benefit as
well…whatever it may cost…Something as simple as this, how can it save the facility
money over the long-run, in terms of treatment of people in frail situations… [or] quality of
life in general.
FC4
Who, when, why, how? Many variables and many decisions to be considered regarding who
would administer, who would monitor it [in-house fortification] and to have it administered?
Quality of life…Good food is an asset but not necessarily should we be prolonging life [for
all residents].
Overall acceptance of a fortification strategy
FC4
Family members appreciated that the strategy “offers an extra choice for residents and
families to assist in maintaining better health”
FRC2
[Food fortification is an] interesting approach to adding nutrients to…what is missing in a
fuller meal.
NM3
[Residents are] not eating a lot to begin with, so if we would be able to have some fortified
food that we are able to give them, in small amounts, to reintroduce them to eating, I think
that would be very beneficial.
NM36
A lot of residents request small portions. And if I know [that if] there are more nutrients in
the products, then even that small portion will help them.
* {Braces} provide additional context for quotes

267
Table 19. Potential Food Vehicles for Micronutrient Food Fortification in Long-Term Care FOOD VEHICLES SPECIFIC REASONS
BREAKFAST FOOD
Well-consumed; Best meal of the day
Hot cereal (oatmeal, cream of
wheat)
Appropriate for different texture needs
FLUIDS
Broth Used as-is, or to make ‘from scratch’ soup, or in stocks/sauces
Soup Comfort food; eaten even when have no appetite for dinner
Available at multiple meals (lunch and dinner)
Juice Contains nutrients on its own
Residents may prefer this to milk
Milk Common additive to foods
Can have on own or incorporate into other foods
Coffee Well-consumed
Available throughout the day (most meals/snacks)
SIDE
Mashed Potatoes Appropriate for different texture needs
Accompanies different sides
DESSERT
Well-consumed; large variety is provided
Pudding Appropriate for different texture needs
Ice-Cream Well-liked; even by different cultures
Fruit
(canned, pureed)
Contains nutrients on its own
Appropriate for different texture needs
CONDIMENTS/
GARNISH/ TOPPING
Pre-measured; Versatile; Small amount; maximize consumption opportunities
Bouillon Cube Easy to transport
Can go in soup/stock/sauces
Whipped topping Versatile; Goes on/in various desserts
Coffee creamer Coffee is well-consumed (staple beverage)
Jam/Jelly Can go on toast or pastries (variety)