LTC: a novel algorithm to improve the efficiency of contig assembly for physical mapping in complex...
17
METHODOLOGY ARTICLE Open Access LTC: a novel algorithm to improve the efficiency of contig assembly for physical mapping in complex genomes Zeev Frenkel 1* , Etienne Paux 2 , David Mester 1 , Catherine Feuillet 2 , Abraham Korol 1 Abstract Background: Physical maps are the substrate of genome sequencing and map-based cloning and their construction relies on the accurate assembly of BAC clones into large contigs that are then anchored to genetic maps with molecular markers. High Information Content Fingerprinting has become the method of choice for large and repetitive genomes such as those of maize, barley, and wheat. However, the high level of repeated DNA present in these genomes requires the application of very stringent criteria to ensure a reliable assembly with the FingerPrinted Contig (FPC) software, which often results in short contig lengths (of 3-5 clones before merging) as well as an unreliable assembly in some difficult regions. Difficulties can originate from a non-linear topological structure of clone overlaps, low power of clone ordering algorithms, and the absence of tools to identify sources of gaps in Minimal Tiling Paths (MTPs). Results: To address these problems, we propose a novel approach that: (i) reduces the rate of false connections and Q-clones by using a new cutoff calculation method; (ii) obtains reliable clusters robust to the exclusion of single clone or clone overlap; (iii) explores the topological contig structure by considering contigs as networks of clones connected by significant overlaps; (iv) performs iterative clone clustering combined with ordering and order verification using re-sampling methods; and (v) uses global optimization methods for clone ordering and Band Map construction. The elements of this new analytical framework called Linear Topological Contig (LTC) were applied on datasets used previously for the construction of the physical map of wheat chromosome 3B with FPC. The performance of LTC vs. FPC was compared also on the simulated BAC libraries based on the known genome sequences for chromosome 1 of rice and chromosome 1 of maize. Conclusions: The results show that compared to other methods, LTC enables the construction of highly reliable and longer contigs (5-12 clones before merging), the detection of “weak” connections in contigs and their “repair”, and the elongation of contigs obtained by other assembly methods. Background Until very recently, genome sequencing projects such as the human ([1,2]), mouse ([3], rice ([4]), or maize gen- ome projects ([5,6]) have relied on the construction of physical maps as a framework to support BAC-by-BAC or whole-genome shotgun sequencing [7]. Alternatively, genome sequencing could be conducted via whole gen- ome shotgun approach ([8-11] etc.) or using the novel next generation sequencing technologies (e.g., [12-14]). Physical maps can be established via BAC clones fingerprinting using restriction enzyme profiling [15-22] or by digital fingerprinting [23-25], and subsequent assembly of the clones into contigs based on the sys- tematic comparison of fingerprint profiles. BAC contigs are then ordered using molecular markers and genetic or radiation hybrid maps. In addition, to providing a framework for sequencing, such maps can be used for high-resolution gene mapping [26-28] and map-based gene cloning [29-34]. Despite significant progress in fingerprinting techniques such as High Information Content Fingerprinting (HICF) [22] and the develop- ment of efficient programs such as FPC (FingerPrinted Contigs) [35,36], maximal likelihood-based * Correspondence: [email protected] 1 University of Haifa, Institute of Evolution, Haifa 31905, Israel Full list of author information is available at the end of the article Frenkel et al. BMC Bioinformatics 2010, 11:584 http://www.biomedcentral.com/1471-2105/11/584 © 2010 Frenkel et al; licensee BioMed Central Ltd. This is an Open Access article distributed under the terms of the Creative Commons Attribution License (http://creativecommons.org/licenses/by/2.0), which permits unrestricted use, distribution, and reproduction in any medium, provided the original work is properly cited.
-
Upload
independent -
Category
Documents
-
view
2 -
download
0
Transcript of LTC: a novel algorithm to improve the efficiency of contig assembly for physical mapping in complex...
METHODOLOGY ARTICLE Open Access
LTC: a novel algorithm to improve the efficiencyof contig assembly for physical mapping incomplex genomesZeev Frenkel1*, Etienne Paux2, David Mester1, Catherine Feuillet2, Abraham Korol1
Abstract
Background: Physical maps are the substrate of genome sequencing and map-based cloning and theirconstruction relies on the accurate assembly of BAC clones into large contigs that are then anchored to geneticmaps with molecular markers. High Information Content Fingerprinting has become the method of choice forlarge and repetitive genomes such as those of maize, barley, and wheat. However, the high level of repeated DNApresent in these genomes requires the application of very stringent criteria to ensure a reliable assembly with theFingerPrinted Contig (FPC) software, which often results in short contig lengths (of 3-5 clones before merging) aswell as an unreliable assembly in some difficult regions. Difficulties can originate from a non-linear topologicalstructure of clone overlaps, low power of clone ordering algorithms, and the absence of tools to identify sourcesof gaps in Minimal Tiling Paths (MTPs).
Results: To address these problems, we propose a novel approach that: (i) reduces the rate of false connectionsand Q-clones by using a new cutoff calculation method; (ii) obtains reliable clusters robust to the exclusion ofsingle clone or clone overlap; (iii) explores the topological contig structure by considering contigs as networks ofclones connected by significant overlaps; (iv) performs iterative clone clustering combined with ordering and orderverification using re-sampling methods; and (v) uses global optimization methods for clone ordering and BandMap construction. The elements of this new analytical framework called Linear Topological Contig (LTC) wereapplied on datasets used previously for the construction of the physical map of wheat chromosome 3B with FPC.The performance of LTC vs. FPC was compared also on the simulated BAC libraries based on the known genomesequences for chromosome 1 of rice and chromosome 1 of maize.
Conclusions: The results show that compared to other methods, LTC enables the construction of highly reliableand longer contigs (5-12 clones before merging), the detection of “weak” connections in contigs and their “repair”,and the elongation of contigs obtained by other assembly methods.
BackgroundUntil very recently, genome sequencing projects such asthe human ([1,2]), mouse ([3], rice ([4]), or maize gen-ome projects ([5,6]) have relied on the construction ofphysical maps as a framework to support BAC-by-BACor whole-genome shotgun sequencing [7]. Alternatively,genome sequencing could be conducted via whole gen-ome shotgun approach ([8-11] etc.) or using the novelnext generation sequencing technologies (e.g., [12-14]).Physical maps can be established via BAC clones
fingerprinting using restriction enzyme profiling [15-22]or by digital fingerprinting [23-25], and subsequentassembly of the clones into contigs based on the sys-tematic comparison of fingerprint profiles. BAC contigsare then ordered using molecular markers and geneticor radiation hybrid maps. In addition, to providing aframework for sequencing, such maps can be used forhigh-resolution gene mapping [26-28] and map-basedgene cloning [29-34]. Despite significant progress infingerprinting techniques such as High InformationContent Fingerprinting (HICF) [22] and the develop-ment of efficient programs such as FPC (FingerPrintedContigs) [35,36], maximal likelihood-based
* Correspondence: [email protected] of Haifa, Institute of Evolution, Haifa 31905, IsraelFull list of author information is available at the end of the article
Frenkel et al. BMC Bioinformatics 2010, 11:584http://www.biomedcentral.com/1471-2105/11/584
© 2010 Frenkel et al; licensee BioMed Central Ltd. This is an Open Access article distributed under the terms of the Creative CommonsAttribution License (http://creativecommons.org/licenses/by/2.0), which permits unrestricted use, distribution, and reproduction inany medium, provided the original work is properly cited.
reconstruction of physical map [37,38], random costalgorithm minimizing triplewise linking distance [39],etc. to automatically cluster clones into contigs, physicalmapping remains long, laborious, and expensive espe-cially for large and complex genomes that contain ahigh amount of repeated sequences (e.g., maize or wheatgenome). Therefore, the development of algorithms andmethods making this process more cost effective isimportant in view of the increasing amount of non-model species that will be sequenced in the near future.The basis of contig assembly is that the same DNA
fragments in different clones are cut by a given restric-tion enzyme at the same sites. Hence, the presence offragments with the same length in the fingerprints oftwo clones, c1 and c2, indicates a possible overlapbetween these clones. However, in large genomes, theabundance of repeated elements and the limited accu-racy of scoring the band lengths may lead to the identi-fication of shared bands for two clones that originatefrom different parts of a chromosome, thereby reducingthe reliability of contig assembly. Thus, contig assemblyrelies on the identification of significant overlaps. Thisimplies the calculation of p-values of clone overlap forany pair of clones c1 and c2. Namely, the p-value is theprobability for two random clones to have the same or ahigher number of shared bands by chance. The exactcalculation of the p-value is usually problematic(reviewed in Wendl, 2005 [40]). The FPC software usesthe Sulston approximation [17] that is based on the sim-plest model of taking into account tolerance (the accu-racy of fragment length scoring), and the assumptionthat appearances of fragments (bands) of differentlengths are independent and identically distributed (iidassumption). This approximation is valid in cases wherea small number of clones are matching but can be veryinaccurate in situations with an intermediate to largenumber of common bands [40,41]. Moreover, it wasobserved that different bands can have very differentabundances within a fingerprint database. To take thisvariation into account Nelson et al. (2005) [6] proposedto exclude the most abundant bands for reducing theproportion of false overlaps. Other ways of taking intoaccount band frequencies based on Bayes Theorem werealso proposed (e.g., [42,43]), but such methods are cum-bersome, especially with HICFs (e.g., [44]).The FPC program package assembles clones into con-
tigs based on fingerprints generated by either the end-labeled double digest method [15,18] or the completedigest method [16,45]. Because of technical difficultiesrelated to the large amount of clones to order, FPCdivides the clones into subsets of relatively small contigsin which clones are supposed to be highly significantlyoverlapping. Clones are ordered using local optimizationand building band maps. To achieve a treatable size and
ensure high accuracy of contigs, FPC users usuallyemploy a very high initial threshold (cutoff) for thep-value of clone overlaps. However, for many clone pairsthat do overlap physically, the p-value may not overcomesuch a cutoff. As a result, numerous short sub-contigsand singletons are produced calling for subsequent mer-ging. In fact, the ordering of bands and highly overlap-ping clones in short contigs is questionable. The mergingof short sub-contigs and singletons is also problematic.Additional difficulties can be caused by the presence
of “questionable” (chimerical or poorly fingerprinted)clones (referred to as Q-clones). The presence ofQ-clones and false clone overlaps can result in a wrongclone order or even in the assembly of clones derivingfrom different parts of the genome into the same contig.The presence of bands with similar lengths also make aclone ordering complex thereby hampering the correctmap assembly [46] and resulting in low-quality mini-mum tiling paths (MTP). In particular, unexpected gapscan arise when a MTP is checked by sequencing (e.g.,via BAC end sequencing). Although many physical mapshave been constructed with the standard FPC algorithmand successfully employed for genome sequencing, quitea lot of errors in contig assembling were also found[47]. The diversity of factors affecting the map quality indifferent situations calls for the development of newmethods and tools complementing FPC and other exist-ing packages. This problem is especially important forphysical mapping of complex genomes with a high levelof repeats, such as in wheat [48] and barley.In this paper, we present a novel approach coordinat-
ing clone clustering and ordering. We also propose touse a new metric of clone overlap instead of the stan-dard Sulston score. In contrast to FPC, the LinearTopology Contig (LTC, available upon request from thecorresponding author) program starts clustering with arelatively relaxed cutoff and uses the topology of signifi-cant clone overlap to obtain longer contigs with a realis-tic (linear) structure. In each cluster, clones are orderedbased on a global optimization procedure, and clonesthat disturb the order stability (assessed by re-samplinganalysis) are excluded from the contig. Ordered contigsare then merged with a relaxed cutoff into longer con-tigs using the network representation of the significantclone overlaps as a control of the contig topology (simi-lar ideas were used by Waterman et al., 1986 [49];Cuticchia et al., 1992 [50]; Zhang et al., 1994 [51] andothers). In addition to contig building, LTC can be usedfor verification, repairing, and elongation of contigsobtained by other methods (e.g., FPC).The reliability of the proposed methodology was
assessed with HICF data from the wheat 3B physicalmap [48]. The performance of LTC vs. FPC was com-pared also on the simulated BAC libraries based on the
Frenkel et al. BMC Bioinformatics 2010, 11:584http://www.biomedcentral.com/1471-2105/11/584
Page 2 of 17

known genome sequences for chromosome 1 of rice andchromosome 1 of maize. The results demonstrate thatcontigs built by LTC are longer, better ordered, andmore robust to errors caused by false and missing bandsthan those obtained by FPC and can make the MTPselection more effective, leading to more reliable physi-cal maps and increased sequencing cost efficiency.
MethodsI. Contigs ConstructionIn LTC, the contig construction algorithm includes thefollowing steps: (i) calculation of p-values for cloneoverlaps; (ii) temporary exclusion from the analysis ofthe clones and clone overlaps unproved by parallelpaths; (iii) adaptively changing cutoff clustering; (iv)“non-linear” cluster splitting into sub-clusters with lin-ear topological structure; (v) global optimization order-ing; (vi) verification of the orders by re-sampling; (vii)sub-contig merging into contigs; and (viii) MTPconstruction.(i) Calculation of p-values for clone overlapsIn the first step, LTC calculates all pair-wise p-values Pr(c1, c2) of clone overlaps and selects threshold Pr0 (cut-off) to declare clones c1 and c2 with Pr(c1, c2) <Pr0 asoverlapping clones. A proper choice of the threshold Pr0should provide a reasonable trade-off between tworequirements: (a) providing a sufficient number of pairsof overlapping clones, and (b) reducing the proportionof false overlaps among selected clone pairs. Instead ofthe Sulston score Pr(Sulst) employed in the FPC package,LTC uses metrics Pr(Siid) and Pr(Sind) that estimate p-values more accurately (refer to Additional file 1, Sec-tion 1 for description of calculation) and the corre-sponding modifications Pr(SiidM) and Pr(SindM) that takeinto account the number of shared genetic markers.Metric Pr(Siid) is based on the Sulston model of “ran-dom” clones [17]. This model assumes that appearancesof fragments (bands) of different lengths are indepen-dent and identically distributed (iid assumption). Unlikethe Sulston score, Pr(Siid) provides a good approximationeven in situations with relatively large clones and a highnumber of matching × bands. Metric Pr(Sind) is based ona model with similar assumptions, but bands may notbe identically distributed (in contrast to iid assumption)(for details see Additional file 1, Section 1).Let n1 and n2 be the numbers of bands in clones c1
and c2. LTC approximates the probability that the num-ber of bands present in both clones c1 and c2 is equal orhigher than k by exp{-(a0 + a1k + a2k
2)}, for k > k0.Coefficients a0, a1, and a2 are estimated by the Monte-Carlo method, i.e., by simulating a large number of pairsof random clones (with n1 and n2 bands) and scoringthe “observed” number of shared bands (refer to Addi-tional file 1, Section 1 for details); value k0 is defined by
inequality: exp{-(a0 + a1k + a2k2)} < 0.001 for all k > k0
(see also Additional file 1, Section 2). Shared geneticmarkers are taken into account by adding the termamarkm to a0 + a1k + a2k
2, where m is the number ofshared markers. We used amark = 100 ln 10 to make theoverlap of clones with a shared marker more significantthan 10-100. If bands are not assumed to be identicallyabundant, then the number of shared bands k is repre-sented by -∑ lnfb, where the sum is taken over all sharedbands and fb is the abundance of band b. Clearly, if allbands have equal abundances then k is proportional tothe number of shared bands (i.e., both formulations willgive the same result). Values fb can be estimated by themaximum likelihood method: the probability that a ran-dom clone with n bands contains band b is 1-(1-fb)
n.[Logarithm of likelihood is then equal to ∑c with b log(1-(1-fb)
n(c)) + ∑c without b log((1-fb)n(c)); for small fb (fb<<1/
nmax, nmax= maxc n(c)), the maximum likelihood estima-tion for fb is close to nmean
-1 πb/(1-πb), where πb is aproportion of clones in the entire database having bandb and nmean as the mean number of bands in the clone].Taking band abundances into account satisfies the addi-tive condition, when the sum of weights of two bands isequal to the weight of “pair of bands” that appearswith an abundance equal to the product of abundancesof the bands (because bands are supposed to beindependent).(ii) Temporal exclusion of clones and clone overlaps notproved by parallel paths (TENPP-procedure)In contrast to FPC, LTC excludes putatively false signifi-cant overlaps and putatively problematic clones beforeclustering. The main idea behind the identification ofproblematic clones and clone overlaps is that each partof the chromosome is most probably covered by severalclones (although in fact, some parts can be uncoveredor poorly covered by clones of the BAC library). Onecan expect that chimerical clones and false clone over-laps are not proven by parallel clones [39,52]. Thus,clustering should subdivide the clones into groups cov-ering different parts of the chromosome. LTC clustersthe clones in such a way that each position of a chro-mosomal region (without ends), covered by clones fromthe cluster, is covered by several (at least by three) sig-nificantly overlapping clones. Moreover, it requires that,even after excluding any single clone or clone overlap,for any pair of clones ci and cj from the cluster C0, asequence of clones c(1),..,c(n) from C0 should existsuch that c(1) = ci, c(n) = cj and overlap of clones c(k) andc(k+1) is significant for all k = 1,..,n-1.Let Pr0 be a liberal level of cutoff (we used 10-12≈10-3/
N2, with N≈60,000 clones in our analyses). LTC calcu-lates all pair-wise clone overlaps Pr and considers theresults as a net of significant (relative to the selectedcutoff Pr0) overlaps. For each edge e (significant overlap)
Frenkel et al. BMC Bioinformatics 2010, 11:584http://www.biomedcentral.com/1471-2105/11/584
Page 3 of 17
of the net, parallel short paths (of 2-5 edges) connectingvertexes (clones) of edge e, but not going through edgee, are searched (see Additional file 2, Fig. AF2.1a). Edgeshaving no such paths are temporarily excluded from theanalysis. Then, the following procedure is applied toeach vertex c0: for each pair of neighbor vertices c1 andc2 (connected with c0 by edge, i.e., Pr(c0,c1) < Pr0 and Pr(c0,c2) < Pr0), short “parallel” paths of 2-5 edges in thisnet, connecting vertices c1 and c2, but not going throughvertex c0, are searched (Additional file 2, Fig. AF2.1b).Vertices having at least one pair of neighbors withoutsuch parallel paths are also temporarily excluded fromthe analysis. The excluded clones and overlaps can beused later to merge or elongate contigs (see below). Forconvenience, we refer to such a procedure of TemporalExcluding from the analysis Not proven by ParallelPaths as to the TENPP procedure with respective cutoff.(iii) Clustering with “adaptively” varying cutoffThe ideal way to obtain a reliable contig assembly is towrite down a full likelihood for the entire problem thatallows a possibility for errors and repeats in data andfind out all solutions with likelihood close to the maxi-mum [37]. However, the expected length of band mapfor entire dataset is usually too long and finding maxi-mal likelihood solution will be too hard even for mod-ern computers. Moreover, estimating the probabilitiesincluded in the likelihood function is also not straight-forward. Subdividing the data into clusters putativelycovering non-overlapped parts of genome sequences byidentification of putatively false clone overlaps and chi-merical clones can simplify the problem [37]. In contrastto FPC that uses a stringent uniform cutoff LTC startsclustering with a liberal cutoff Pr0 by the single-linkagealgorithm [53], and selects the resulting reasonably sizedclusters (rs-clusters). By “reasonably sized clusters”, wearbitrarily (for certainty) define clusters with 6-500clones. Actually, larger clusters also can be analyzed bythe LTC program and subdivided into parts with lineartopological structure (see below). Such a restriction wasused to reduce the CPU time increasing cubically withnumber of clones in cluster. Additional reason for thisrestriction was the fact that the program Pajek [54] usedfor the visual control of the net structure of significantoverlaps cannot represent large nets well. Using otherprograms for net visualization can help to overcome thisproblem. Artificial split of real contig can result in addi-tional errors in ordering of obtained parts complicatingtheir merging on the next steps.For each cutoff level, LTC excludes putative false
clone overlaps and putative chimerical clones in largeclusters (with more than 500 clones) by the TENPP pro-cedure described above. Then, the single linkage algo-rithm is run again. At the next step, LTC increases thestringency, but only after removing the selected
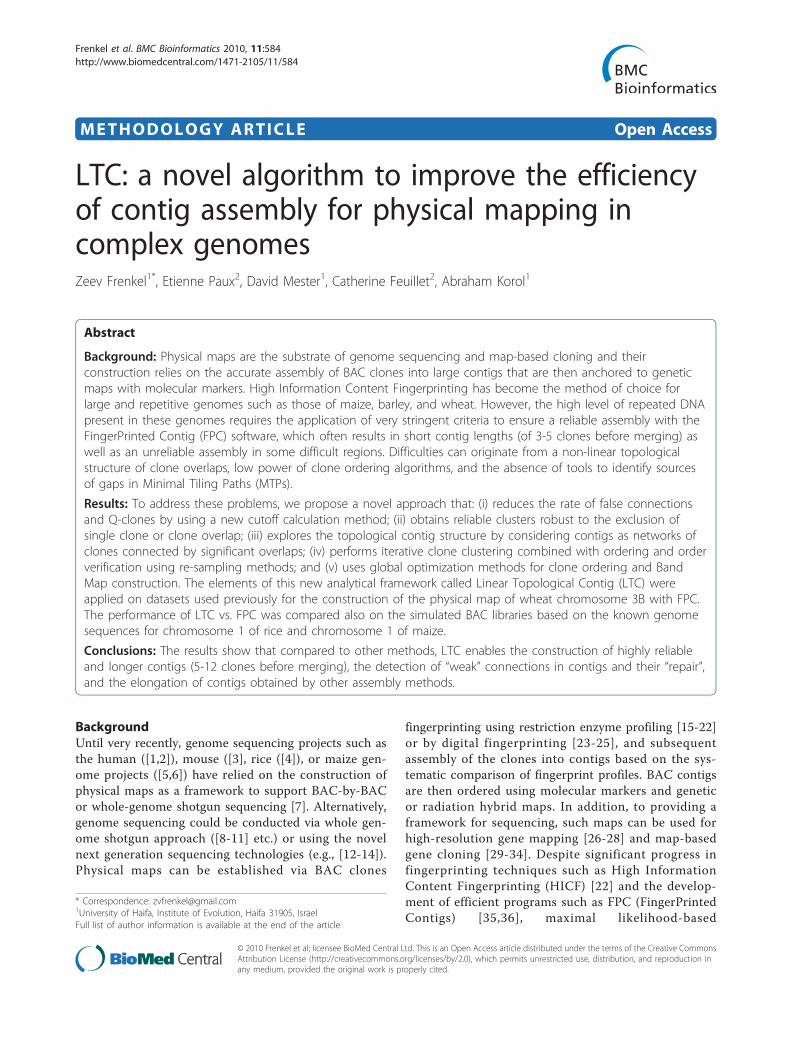
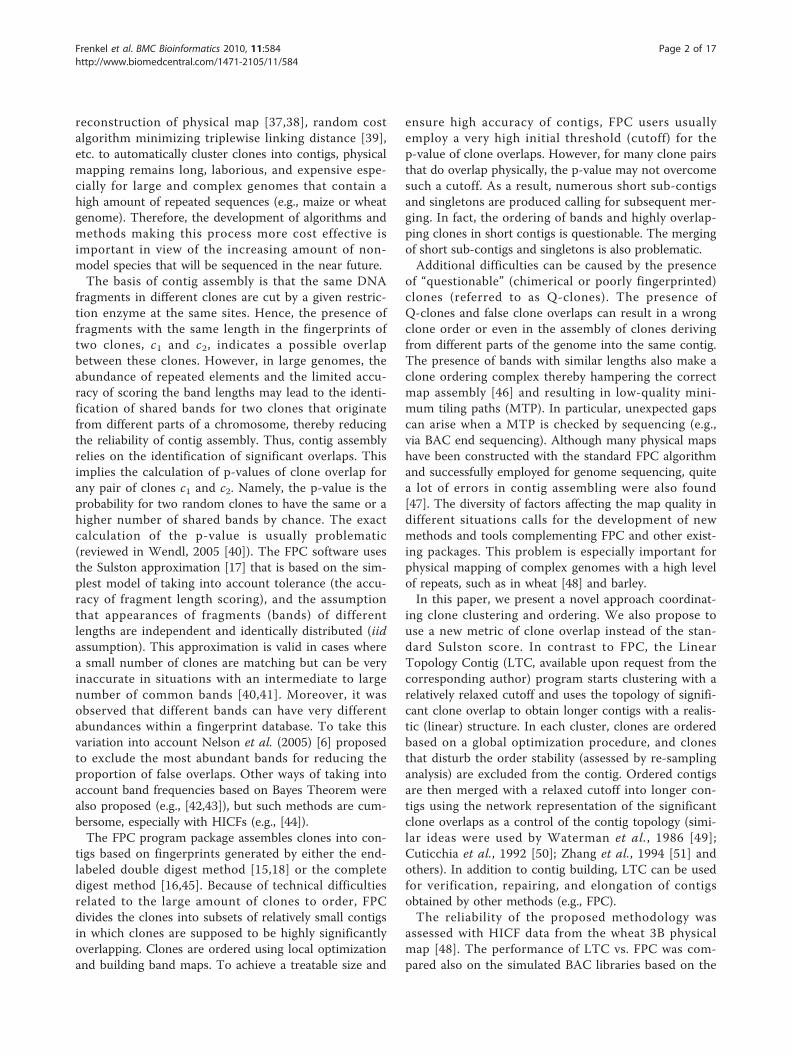
reasonably sized clusters (i.e., protecting them fromfurther “dissolving”). A schematic representation of thealgorithm is provided in Figure 1. Refer to Additionalfile 1, Section 3 for simple example illustrating the effi-ciency of the proposed algorithm. Note that repeatingthe TENPP procedure will be effective only in cases ofhigh proportions of false significant clone overlaps. Ifsuch proportion is not high, then it is reasonable toexpect that most of the putatively chimerical clones andfalse clone overlaps will be excluded directly after thefirst TENPP procedure. Sizes of clusters can also bereduced by temporary exclusion of “buried” clones.These clones can be used later to obtain more reliableband maps.(iv) Looking for linear topological structureFalse clone overlaps and chimerical clones can lead toclusters with non-linear topological structures (Figure2a) which is incompatible with the one-dimensionalstructure of eukaryotic chromosomes. To facilitate thedetection and visualization of such clusters, LTCemploys a representation of clusters as nets of signifi-cant overlaps. Obviously, ordering topologically non-lin-ear clusters is problematic. To overcome this problem,we propose to split such clusters into sub-clusters withlinear topological structure by excluding clones from thebranching nodes from the analysis (Figure 2b). Non-
Figure 1 Scheme of clone clustering with adapting cutoff.Diamonds denote single-linkage clustering with correspondingcutoff. Circles denote procedure of excluding clones and cloneoverlaps not proved by parallel paths in the net of significant(relative to the corresponding cutoff) clone overlaps from theanalysis.
Figure 2 Problematic clusters with non-linear topologicalstructure. (a) Identification of non-linearity of cluster topologicalstructure: presence of vertices with not too small ranks (e.g., morethan 2) points to non-short offshoots from the selected diametricpath (marked in bold line). (b) Splitting clusters into sub-clustershaving linear topological structure. See also Additional File 1,Section 4.
Frenkel et al. BMC Bioinformatics 2010, 11:584http://www.biomedcentral.com/1471-2105/11/584
Page 4 of 17
linearity of the cluster structure can be detected by scor-ing ranks of vertices relative to the diametric path. Bydefinition, a diametric path of the net is the longest, interms of the number of edges, among the shortest pathsbetween all possible pairs of vertices (e.g., [55]). Notethat several diametric paths can exist for the same net.Any of diametric paths can be used for detection ofnon-linearity: The presence of vertices with rank 2 andhigher indicates on non-short offshoots from theselected diametric path and, hence, a possibility of non-linear structure (Figure 2a).(v) Ordering using global optimizationLTC orders clusters with linear topological structureswithout constructing their band maps. Here, the order-ing problems are formulated in terms of global optimi-zation of some criterion (similar to Fickett andCinkosky, 1992 [56]; Alizadah et al., 1993 [57]; Wanget al., 1994 [39]; Flibotte et al., 2004 [46]). For simpli-city, let’s consider only the situation where all clones arenot buried. This can be achieved by the temporal exclu-sion of buried clones, although sometimes this can leadto loosing the contig connection. The criterion W(Ω) ofclone order Ω = (cΩ(1),..., cΩ(n)) is calculated as:
W W b Wk n k k( ) ( ) ,,.., ,Ω Σ ΩΩ Ω= −= − ( ) +( )1 1 1 0
where Wi,j = -log Pr(ci, cj), b(Ω) is the number of adja-cent (within ordering Ω) clones with Pr(cΩ(k), cΩ(k+1)) >Pr0 and W0 is the penalty for non-significant overlap ofadjacent clones.The maximization of such criterion can be reformu-
lated as the well-known and intensively studied Travel-ing Salesman Problem (TSP) without the need to returnto the starting point. Let Wmax be the maximum ofWi, j = -log Pr(ci, cj). LTC defines distance between twoclones as
d c c W W W Pr c c Pri j i j i j( , ) { , },,= − + ( ) >max 0 01
where 1{Pr(ci, cj) >Pr0} is indicator function equal to 1,if Pr(ci, cj) >Pr0, and equal to zero otherwise. Globaloptimization is effective especially when marker infor-mation is also available [46]. The exact solution to theTSP is a computationally challenging problem. Never-theless, good heuristics (e.g., based on evolution strategyoptimization) for the solution of TSP were developedfor situations where the number of vertices is up to 103
orders of magnitude [58]. Coordinates of clone endswithin the contig based on the solution path Ωbest canbe calculated by methods proposed by Flibotte et al.(2004) [46]. Using such global optimization approachcan result in a reduced number of Q-clones and ofplaces in the contig where two neighbor clones have an
unexpected non-significant overlap. More effective tri-plewise linking distance also can be used to reduce theeffect of false positive and false negative bands [39].(vi) Resampling verification of orderingThe quality of the clone order within a contig is charac-terized not only by the value of the chosen criterion,but also by its robustness to small uncertainty of bandcontent of the clones, which can be referred to as “con-tig stability”. To evaluate this stability, LTC uses jack-knife re-sampling iterations (in contrast to bootstrapones used in Cuticchia et al., 1993 [59] and Wang et al.,1994 [39], that can artificially increase the significanceof clone overlaps). Namely, LTC first constructs theorder using clone overlaps scored over all bands. Inaddition, it constructs orders using clone overlaps basedon randomly selected subsets of bands (say, 95% of thetotal set of bands). Then, the identification of unstableregions is conducted based on the frequency distributionof the right-side and left-side neighbors for each clonein the contig order. The higher the deviation from 1(i.e., from the “diagonal” pattern) is, the less certain thelocal order is ([58,59]). One of the main reasons for theappearance of unstable orders is the high similarity ofparallel clones that cannot be ordered properly due tomissing and false bands. Excluding parallel clonesallows the construction of a stable “skeleton” map, simi-larly to the approach suggested for building geneticmaps (see [58]).(vii) Merging of sub-contigsAfter ordering, LTC tries to elongate contigs by mergingthose that display significant end-to-end overlaps (whichmay be also achievable by adding 1-2 supplementaryintermediate clones), or by adding singletons. First, LTCre-analyzes all clones and clone overlaps temporallyexcluded at previous stages (see above). To elongate aconcrete contig, LTC searches for all clones connected(by significant overlaps or via short paths of significantoverlaps) with the clones from either of the contig ends.If adding all of the clones (for one of the two contigends) does not lead to a violation of contig linearity,then such elongation is not problematic. If adding theclones does lead to branching (i.e., contradicts the linearstructure of the chromosome), then each of the possibi-lities of linear elongations needs to be considered (e.g.,see Additional File 2, Fig. AF2.2). The correct elongationcan be detected by testing clone overlaps based onclone-end sequencing [23]. The same problem ariseswhen clones from one contig significantly overlap withinternal clones from another contig. The availability ofDNA markers (in clones) with known chromosomalposition helps to prevent the merging of contigs fromdifferent chromosomal zones. Contigs resulting fromelongation should be reordered (see stage (v)).
Frenkel et al. BMC Bioinformatics 2010, 11:584http://www.biomedcentral.com/1471-2105/11/584
Page 5 of 17
(viii) MTP establishmentIn the current version of LTC, MTP construction wasbased only on the topology of clone overlaps withoutbuilding of the band map (in contrast to FPC). In ouralgorithms, we assume: (i) that MTP should include theterminal clones of the contig; (ii) the adjacent clones inMTP should significantly overlap (at the chosen thresh-old); and (iii) MTP should be of minimal length, i.e.,include the minimal number of clones. To satisfy theseconditions, we select clones for MTP from the diametricpath of the net of the significant clone overlaps (seeparagraph iv). In practice other criteria come into play,such as whether or not a particular BAC has a geneticmarker on it and whether or not BAC end sequence isavailable. A further sophistication of the criterion mayalso the lengths of the clones (longer clones should bepreferable) and overlaps with clones disturbing the con-tig linearity (presence of markers based on BAC-end-sequencing of such clones can clarify clone-overlaps).
II. Verification and improvement of FPC contigsLTC can be used also to verify and improve contigsobtained with other methods and tools. To test thequality of a contig and understand the underlying rea-son(s) for the assembly problem, the following proce-dure can be applied: (i) calculate all pair-wiseprobabilities of clone overlaps and represent the contigas a net of significant overlaps; (ii) test connectionswithin this net; and (iii) test for topological linearity ofthe contig. If poor overlap (at the sequence level) ofadjacent clones in the MTP occurs together with lowsignificance of the clones’ overlap, but the contig is con-nected and has a linear structure, then it makes sense toattempt fixing the contig by reordering the clones andselecting an alternative MTP. In this case, one needs totake into account that if some part of the analysis wasalready done for the old MTP, then it can be cheaper toselect a MTP with common parts with the old one,rather than to repeat the analysis for the optimal MTP.If the detected problems in the MTP can be explainedby non-connectivity or non-linearity of the contig struc-ture, then the contigs must be split into connected partseach with linear structures. LTC first temporallyexcludes clones and clone overlaps not proven by paral-lel paths from the analysis (see above). After contigsplitting, reordering and verification, LTC attempts mer-ging the contigs by decreasing cutoff stringency or viareturning back the previously excluded clones and cloneoverlaps. LTC also checks (whenever possible) that theadded clones are not specified as belonging to otherparts of the chromosome.Comparison of clone partitionsDifferent clone partitions obtained with different clus-tering schemes were compared for the number of clones
covered by reasonable size clusters and by direct com-parisons of clusters. The comparison was performed byscoring the Rand index R [60] and its modification R’(see Additional File 1, Secttion 5). Additionally to thesecharacteristics, the mean number M of clusters of theone clone partition overlaps with each of the otherclone partition clusters was scored; if the two partitionsare very similar, M should be close to 1. Two modifica-tions of the M value, M* and M**, that reduce the roleplayed by small clusters and singletons were also scored(see Additional File 1, Section 5).Graphical representation of the cluster topological structureTopological structures of clusters are represented by thenet of significant (relative to some specified cutoff)clone overlaps. The nets were drawn using the publiclyavailable program Pajek [54]. Draft pictures wereobtained with the Kamada-Kawai algorithm for drawingundirected graphs [61] performed in the Pajek program.Simulation of BAC libraries based on the known genomesequencesTo test the effectiveness of contig assembly algorithmswe simulated clone libraries and clone fingerprintsbased on known genome sequences (analogously to Xuet al., 2004 [62] and Krzywinski et al., 2007 [63], insteadof using artificial genome sequences employed by otherauthors, e.g. Cuticchia et al., 1992 [50]; Soderlund et al.,1997 [35]). By Renzyme we denote the sequentiallyordered set of N restriction sites ri corresponding to thechosen enzyme sequence (we used HindIII). For conve-nience, we supplement this set by r0 and rN+1 corre-sponding to the start and end points of the sequence.Let L be the total length of the sequence. For each gen-erating clone the program selects a start and end pointsfrom Renzyme. Index istart is selected randomly from 0 toN + 1. Index iend calculated by istart + s h, where s isequal to 1 or -1 with probabilities 0.5 (defines clonedirection) and h is the integer part of a normally distrib-uted random value with mean a and variance s2
(defines clone sequence length distribution). Values aand s2 are selected such that mean and standard devia-tion of clone length be about 120 kbp and 30 kbp,respectively (a = 120l, s = 30 l, where l = (N + 1)/L).Chimerical clones were generated as union of regularclones, occurring with a probability pchimer (= 0.05 inour simulations).Fingerprint for generated clones were defined by the
set of bands of K types (corresponding to K used pro-truding-end restriction enzymes) presented in the clone;we used enzymes BamHI, EcoRI, XbaI and XhoI (K = 4)analogously to Ding et al. (1999) [21]. Presence of aband b with length Lb and type kb is defined by the pre-sence of sequence part of length Lb bp bounded by therestriction site of enzyme kb from the one side andrestriction site of one of the K enzymes mentioned
Frenkel et al. BMC Bioinformatics 2010, 11:584http://www.biomedcentral.com/1471-2105/11/584
Page 6 of 17
above, or restriction site of blunt-end restriction enzyme(we used HaeIII) or clone end from the another side. Infact, sequence parts bounded by two different protrud-ing-end restriction enzymes are twice included into fin-gerprint. Bands with length <Lmin = 50 bp or >Lmin =500 were filtered out. Clones with number of bands n <nmin = 50 or n > nmax = 250 were also filtered out.In the preparation of input data for the FPC and LTC
programs we introduced noise into sequence lengthscoring to simulate errors in wet fingerprinting process.“Observed” band length was calculated by Lb + err,where err is a random value uniformly distributedwithin interval (-ε, ε) or within (-3ε, 3ε) with probabil-ities pε = 0.90 and p3ε = 1-pε = 0.1 respectively. Thisimples that difference between two observations of thesame band is less than constant tolerance value t withprobability τ = pε
2(1-(1-t/2ε)2) + p3ε2(1-(1-t/6ε)2) +
2pεp3ε(t/3ε). We used ε = t/2 = 0.2 implying τ = 0.94. Tosatisfy FPC format, band lengths were multiplied by 30and rounded (hence tolerance t = 12). Type of band wastaken into account by adding 0, 5000, 10000 or 15000for the resulted band length for bands of type k = 1, 2,3 and 4, respectively. Some bands of clones wereexcluded (with probability pmissing = 0.05) to simulatefalse negatives caused by problems in PCR reactions.Automatic FPC assembly was conducted using cutoffs10-75 - 10-45 with step × 105 and DQer for contigs hav-ing more than 10% Q-clones (with step × 109) andReBuild with corresponding cutoff if needed (similar toPaux et al., 2008 [48]).
MaterialsTo illustrate the advantages of the LTC analytical frame-work we employed the results obtained in the physicalmapping of wheat chromosome 3B [48]. The corre-sponding database included High Information ContentFingerprinting results of 56,952 of BAC clones obtainedfrom the chromosome 3B specific library. The initialinput data for LTC included band lengths classifiedaccording to four dyes. For each dye, up to 4500 distinctpoints (band sizes) were obtained. Two bands wereconsidered of the same if their sizes were within a toler-ance = t (e.g., constant t = 4).The elements of the LTC analytical framework were
tested with fingerprinting data from two regions ofchromosome 3B corresponding to clones located inthe 3BL7-0.63-1.00 and 3BS1-0.33-0.55 deletion bins.Sixty-nine contigs comprising 3,606 clones that werefound to belong to bin 3BL7-0.63-1.00 and 180 (8,167clones) to bin 3BS1-0.33-0 [48] were used in theanalysis. Using LTC, these 249 contigs were verified/corrected/extended; alternative contigs were also con-structed and compared to the results obtained withFPC.
Simulated BAC librariesSimulated BAC libraries LibRiceChr1 and LibMaizeChr1 wereconstructed based on the known genome sequencesSeqRiceChr1 and SeqMaizeChr1 for chromosome 1 of rice(45 Mbp, available at http://rgp.dna.affrc.go.jp/whoga/download.html.en, file chr01.fa.gz) and chromosome 1of maize (300 Mbp, available at http://ftp.maizese-quence.org/current/assembly, we used version that wasdownloaded at June 10, 2010), respectively. Basic charac-teristics of the libraries are summarized in table Table 1.
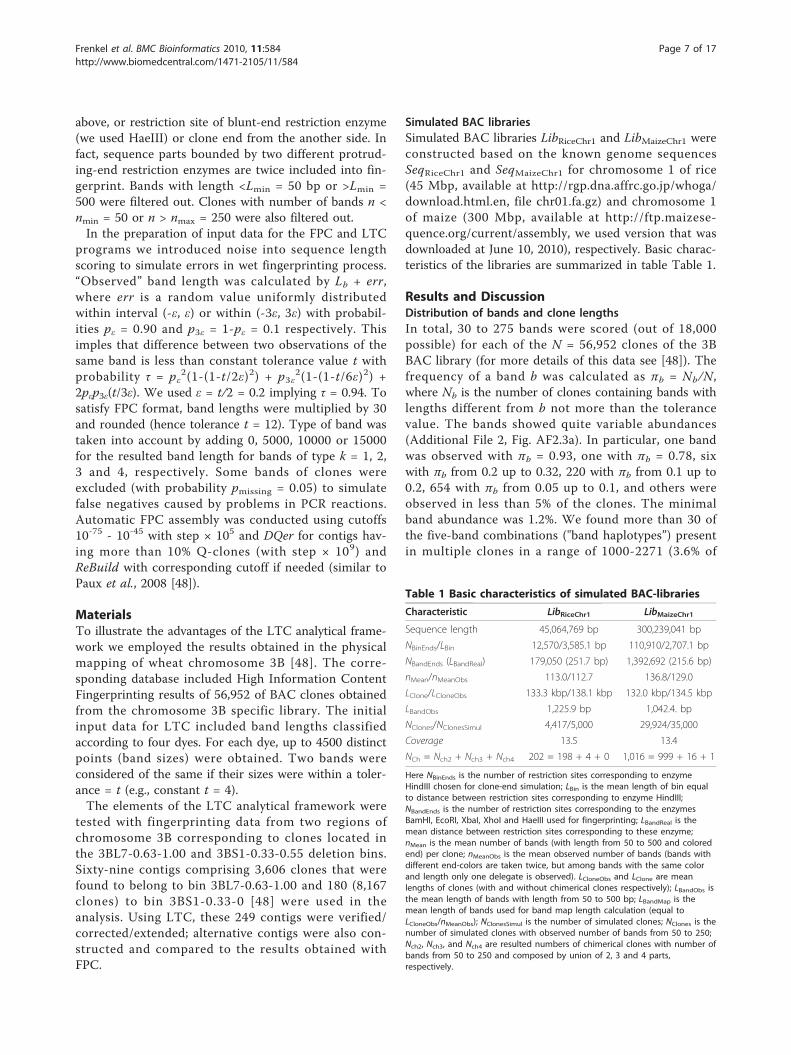
Results and DiscussionDistribution of bands and clone lengthsIn total, 30 to 275 bands were scored (out of 18,000possible) for each of the N = 56,952 clones of the 3BBAC library (for more details of this data see [48]). Thefrequency of a band b was calculated as πb = Nb/N,where Nb is the number of clones containing bands withlengths different from b not more than the tolerancevalue. The bands showed quite variable abundances(Additional File 2, Fig. AF2.3a). In particular, one bandwas observed with πb = 0.93, one with πb = 0.78, sixwith πb from 0.2 up to 0.32, 220 with πb from 0.1 up to0.2, 654 with πb from 0.05 up to 0.1, and others wereobserved in less than 5% of the clones. The minimalband abundance was 1.2%. We found more than 30 ofthe five-band combinations ("band haplotypes”) presentin multiple clones in a range of 1000-2271 (3.6% of
Table 1 Basic characteristics of simulated BAC-libraries
Characteristic LibRiceChr1 LibMaizeChr1
Sequence length 45,064,769 bp 300,239,041 bp
NBinEnds/LBin 12,570/3,585.1 bp 110,910/2,707.1 bp
NBandEnds (LBandReal) 179,050 (251.7 bp) 1,392,692 (215.6 bp)
nMean/nMeanObs 113.0/112.7 136.8/129.0
LClone/LCloneObs 133.3 kbp/138.1 kbp 132.0 kbp/134.5 kbp
LBandObs 1,225.9 bp 1,042.4. bp
NClones/NClonesSimul 4,417/5,000 29,924/35,000
Coverage 13.5 13.4
NCh = Nch2 + Nch3 + Nch4 202 = 198 + 4 + 0 1,016 = 999 + 16 + 1
Here NBinEnds is the number of restriction sites corresponding to enzymeHindIII chosen for clone-end simulation; LBin is the mean length of bin equalto distance between restriction sites corresponding to enzyme HindIII;NBandEnds is the number of restriction sites corresponding to the enzymesBamHI, EcoRI, XbaI, XhoI and HaeIII used for fingerprinting; LBandReal is themean distance between restriction sites corresponding to these enzyme;nMean is the mean number of bands (with length from 50 to 500 and coloredend) per clone; nMeanObs is the mean observed number of bands (bands withdifferent end-colors are taken twice, but among bands with the same colorand length only one delegate is observed). LCloneObs and LClone are meanlengths of clones (with and without chimerical clones respectively); LBandObs isthe mean length of bands with length from 50 to 500 bp; LBandMap is themean length of bands used for band map length calculation (equal toLCloneObs/nMeanObs); NClonesSimul is the number of simulated clones; NClones is thenumber of simulated clones with observed number of bands from 50 to 250;Nch2, Nch3, and Nch4 are resulted numbers of chimerical clones with number ofbands from 50 to 250 and composed by union of 2, 3 and 4 parts,respectively.
Frenkel et al. BMC Bioinformatics 2010, 11:584http://www.biomedcentral.com/1471-2105/11/584
Page 7 of 17
total) clones, where πb of bands was in the range of0.120 to 0.156, pointing to highly significant “linkagedisequilibria” of the bands. This can result from physicaloverlap of considered clones and from repeats [6,64].The distribution of clone length (scored as number ofbands) was bimodal (Additional File 2, Fig. AF2.3b). Theorigin of this bimodality is in the construction of theBAC library itself. Three sub-libraries were constructedincluding large, medium, and small fragments (see [65]).Fingerprinting results revealed that the medium lengthsub-library was actually a mix of large and small inserts,and not medium inserts. This resulted in two distinctpopulations of clone length.
LTC, a new algorithm for building contigs fromfingerprinted clonesIn this work we have developed a new analytical frame-work, LTC, for contig assembly of fingerprinted BACclones that can be used as an alternative or as a comple-ment to FPC. In contrast to FPC, the LTC programstarts clustering with a relatively relaxed cutoff and usesthe topology of significant clone overlaps to obtainlonger and more realistic contig structures. Instead of auniform cutoff, LTC uses a procedure that adaptivelyincreases the cutoff stringency. Using stringent cutoffsonly for large clusters generates fewer short contigs orsingletons. After ordering, LTC merges the contigs byrelaxing the cutoff (analogously to FPC), hence, thisapproach can be referred to as “up-down-up”, in con-trast to the FPC approach that can be referred to as“down-up” (stringent cutoffs applied from the begin-ning). LTC differs from FPC in a number of importantfeatures that are: (a) the metrics of clone overlap,(b) consideration of the band abundances, (c) the algo-rithm used for clone clustering, (d) the use of the topo-logical structure of clusters for contig construction,(e) the application of global optimization methods forclone ordering, and (f) the assessment of the reliabilityof the mapping results by re-sampling. These para-meters should enable the construction of more robustand longer contigs in particular when dealing with largeand repetitive genomes.To demonstrate the efficiency of LTC in contig assem-
bly, we compared contigs obtained by LTC with contigsobtained using the standard FPC package for BAC clonesfrom the wheat chromosome 3B [48]. The results arepresented for the three main analytical stages sharedbetween the LTC and FPC packages, i.e., (i) the identifi-cation of significant clone overlaps; (ii) the subdivision ofclones into clusters of significantly overlapped clones;and (iii) the ordering of clones within clusters. To assessthe capacity of LTC to verify, repair, and elongate contigsobtained by FPC, we also ran LTC on the 3B dataset pre-viously obtained by FPC for the same contigs.
(i) Identification of significant clone overlaps by LTCBoth FPC and LTC identify significant clone overlaps ina similar way: for each pair of clones, c1 and c2, thep-value Pr(c1, c2) of clone overlap is calculated and com-pared with a predefined threshold Pr0 (cutoff). Clones c1and c2 with Pr(c1, c2) <Pr0 are declared as overlappingclones. In contrast to FPC that uses Sulston scorePr(Sulst) [17], LTC uses new alternative metrics Pr(Siid)
and Pr(Sind) (see paragraph (i) in Methods) for moreaccurate approximation of p-value. To compare metricsused in FPC and LTC, values Pr(Siid), Pr(Sulst), and Pr(Snid) were calculated for each pair of clones from the 3Bdataset (56,952 clones). The results indicate that Pr(Siid)
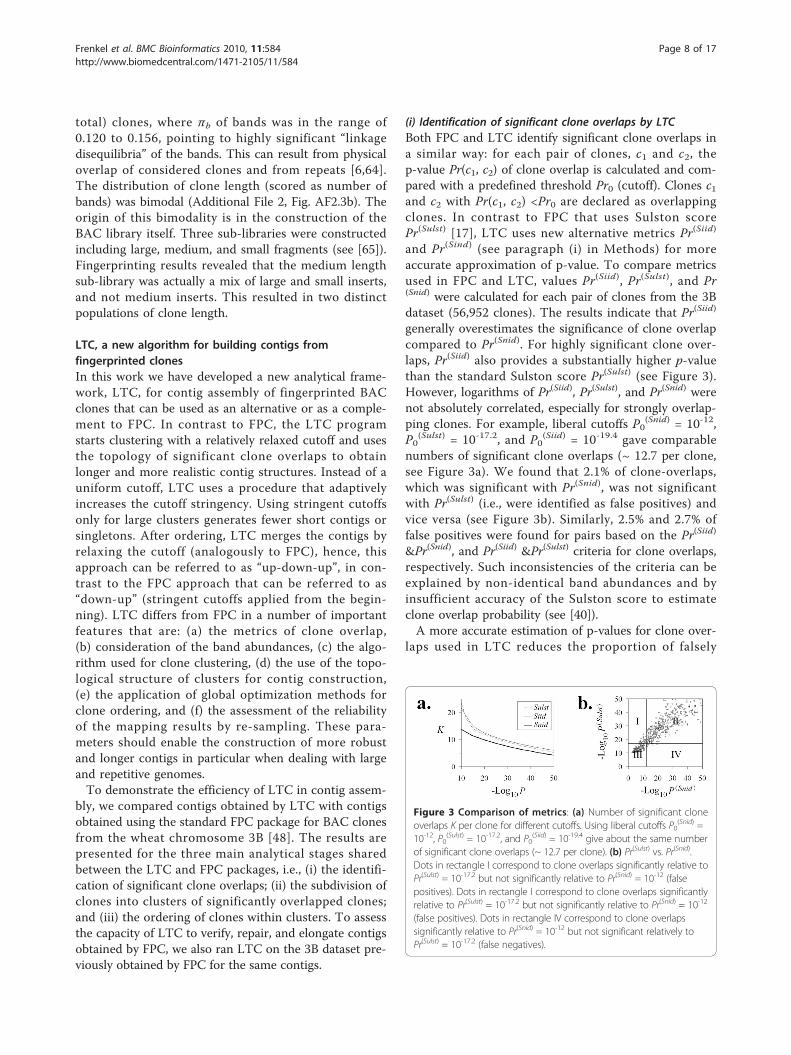
generally overestimates the significance of clone overlapcompared to Pr(Snid). For highly significant clone over-laps, Pr(Siid) also provides a substantially higher p-valuethan the standard Sulston score Pr(Sulst) (see Figure 3).However, logarithms of Pr(Siid), Pr(Sulst), and Pr(Snid) werenot absolutely correlated, especially for strongly overlap-ping clones. For example, liberal cutoffs P0
(Snid) = 10-12,P0
(Sulst) = 10-17.2, and P0(Siid) = 10-19.4 gave comparable
numbers of significant clone overlaps (~ 12.7 per clone,see Figure 3a). We found that 2.1% of clone-overlaps,which was significant with Pr(Snid), was not significantwith Pr(Sulst) (i.e., were identified as false positives) andvice versa (see Figure 3b). Similarly, 2.5% and 2.7% offalse positives were found for pairs based on the Pr(Siid)
&Pr(Snid), and Pr(Siid) &Pr(Sulst) criteria for clone overlaps,respectively. Such inconsistencies of the criteria can beexplained by non-identical band abundances and byinsufficient accuracy of the Sulston score to estimateclone overlap probability (see [40]).A more accurate estimation of p-values for clone over-
laps used in LTC reduces the proportion of falsely
Figure 3 Comparison of metrics: (a) Number of significant cloneoverlaps K per clone for different cutoffs. Using liberal cutoffs P0
(Snid) =10-12, P0
(Sulst) = 10-17.2, and P0(Siid) = 10-19.4 give about the same number
of significant clone overlaps (~ 12.7 per clone). (b) Pr(Sulst) vs. Pr(Snid).Dots in rectangle I correspond to clone overlaps significantly relative toPr(Sulst) = 10-17.2 but not significantly relative to Pr(Snid) = 10-12 (falsepositives). Dots in rectangle I correspond to clone overlaps significantlyrelative to Pr(Sulst) = 10-17.2 but not significantly relative to Pr(Snid) = 10-12
(false positives). Dots in rectangle IV correspond to clone overlapssignificantly relative to Pr(Snid) = 10-12 but not significant relatively toPr(Sulst) = 10-17.2 (false negatives).
Frenkel et al. BMC Bioinformatics 2010, 11:584http://www.biomedcentral.com/1471-2105/11/584
Page 8 of 17
significant clone overlaps and increases the proportionof real clone overlaps that have a significant number ofcommon bands. This leads to a reduction of clusteringerrors. Such errors can result in two undesired out-comes: (a) a wrong contig ordering with poor overlap ofsome adjacent clones from MTP, referred to as a gapthat will call for (non-natural) splitting the contig intoshorter contigs; and (b) a wrong partition of contigsinto “independent” contigs that could not be merged.Both outcomes will yield shorter contigs than one couldobtain using more correct clone clustering. Hence, usingmore accurate metrics for clone overlaps can result inlonger contigs even with FPC algorithms for contigassembly.Analogously to FPC, choosing cutoff stringency for
clone clustering should be based on a tradeoff betweenthe advantages of stringent and liberal cutoff values.Indeed, on the one hand, clustering with a liberal cutoffresults in large but unreliable clusters, where orderingand detecting problematic clones and clone overlaps ischallenging. On the other hand, clustering with a strin-gent cutoff results in many small clusters from whichthe ordering and identification of problematical clones ispresumably “easy”, while merging is difficult. Therefore,using liberal cutoffs may be a reasonable strategy if andonly if powerful tools for multipoint ordering are avail-able, such as with LTC.(ii) Clustering the 3B fingerprinting dataset: comparingdifferent proceduresPartition of clones using the LTC adaptive clusteringprocedure We applied the LTC main adaptive clusteringprocedure to the 56,952 fingerprints obtained for chro-mosome 3B [48]. Out of N(N-1)/2 = 1.6·109 possibleclone overlaps, 361,571 (i.e., 0.02%) were significant atPr(SnidM) <Pr0 = 10-12 (Figure 4a). From these, 2,155clone overlaps (0.6% of the significant ones) and 4,097clones (7.2% of total) have not been confirmed by paral-lel paths (Figure 4a). After temporal exclusion of theseclones and clone overlaps, the entire database was sub-divided into 828 clusters with a minimal number ofclones per cluster of 6. In total, 6,550 clones (11.5% oftotal) were found in clusters with smaller sizes or as sin-gletons. Among the 828 clusters, one was large (9,386clones), three were of intermediate size (912, 617, and525 clones) whereas the remaining ones included lessthan 336 clones per cluster (Figure 4a).The TENPP procedure was used again on the entire
database with cutoffs Pr1 = 10-3Pr0 = 10-15 which foundadditional significant clone overlaps and 243 clones notproven by short parallel paths. After temporal exclusionof these clones and clone overlaps, four large and inter-mediate clusters were subdivided into 108 clusters withat least 6 clones per cluster. In this stage, additional 339clones were found either in smaller size clusters, or as
singletons, or were excluded by the last TENPP proce-dure. Among the remaining 108 clusters, one was large(1,494 clones), one was intermediate (622 clones), andthe others contained up to 402 clones per cluster (Fig-ure 4a).Another round of the TENPP procedure with cutoffs
Pr2 = 10-3Pr1 = 10-18 identified additional significantclone overlaps and 225 clones not proven by short par-allel paths. Large and intermediate clusters were subdi-vided into 13 clusters with a minimal number of clonesper cluster of at least 6 after temporal exclusion. Thisresulted in 150 clones that were found in clusters withsmaller sizes or as singletons, or that were excluded bythe last application of TENPP procedure. Thirteen clus-ters were obtained with one intermediate containing 794clones while the rest had up to 395 clones per cluster(Figure 4a).A final TENPP procedure with cutoffs Pr3 = 10-3Pr2 =
10-21 found additional significant clone overlaps and 219clones not proven by short parallel paths. After tem-poral exclusion, the remaining clusters were subdividedinto 9 clusters with 6 to 216 clones; 78 clones werefound in clusters with smaller sizes and singletons orwere excluded by the last TENPP procedure (Figure 4a).Thus, in total, 56,952 fingerprints were subdivided
into 951 clusters comprised of 6 to 402 clones; 11,214clones were found in clusters with less than 6 clones,were singletons, or were excluded by the last TENPPprocedures. The average number of clones per clusterwas 48.3. The partition of clones obtained with this firstapproach will be referred hereafter as CLTC.Skipping some components of the LTC clusteringalgorithm To demonstrate the power of the LTC adap-tive clustering procedure, we skipped some of the clus-tering scheme components described above (Figure 4a).Three versions were considered: (i) using TENPP onlyonce; (ii) clustering with adaptively changing cutoffstringency but without the TENPP procedure; and (iii)clustering with a uniformly stringent cutoff (analogousto the FPC algorithm).(i) Figure 4b shows that if the TENPP is used only
once (with cutoff Pr0 = 10-12) then in addition to rea-sonable size clusters, clustering with cutoff Pr1 = 10-15
results also in two large (with 3,428 and 1,399 clones)and two intermediate size (with 880 and 615 clones)clusters. Repeated clustering with the more stringentcutoff Pr2 = 10-18 gives additional reasonable size clus-ters plus one large cluster with 2,878 clones and twointermediate size clusters (with 640 and 615 clones)(Figure 4b). Further increase of the cutoff stringency upto Pr3 = 10-21 splits these clusters into one large clusterwith 1,900 clones and two intermediate size clusters(with 625 and 613 clones, Figure 4b). The clone parti-tion obtained with this scenario was called C1.
Frenkel et al. BMC Bioinformatics 2010, 11:584http://www.biomedcentral.com/1471-2105/11/584
Page 9 of 17
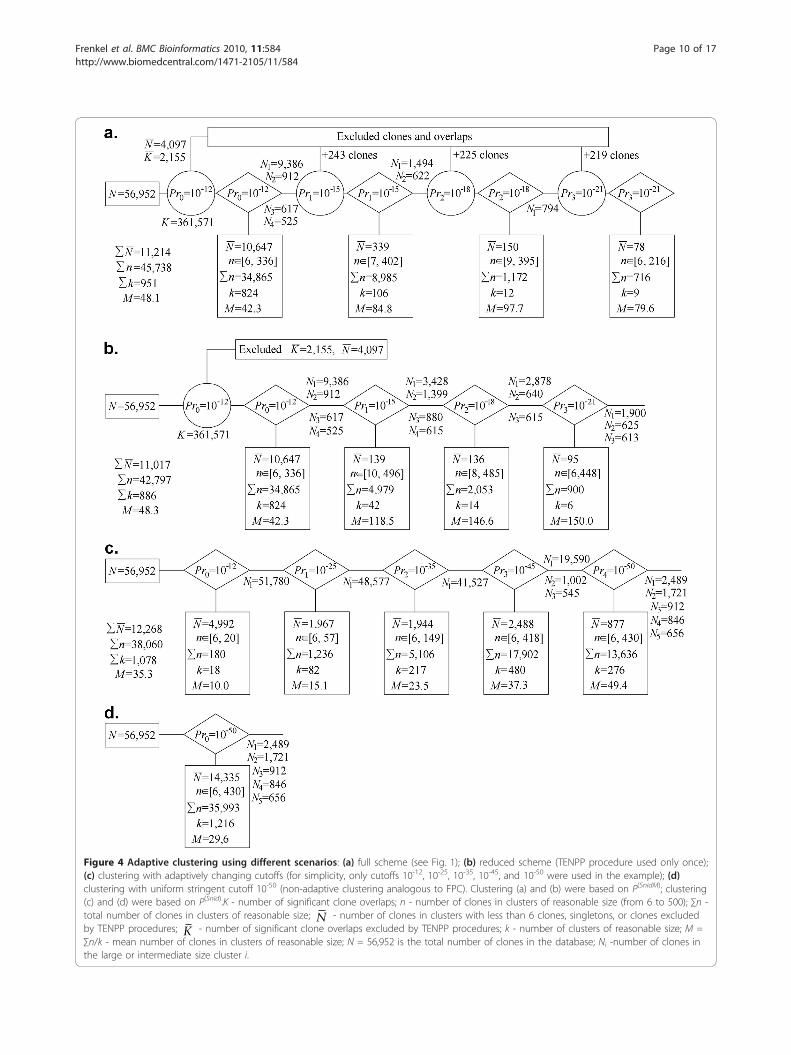
Figure 4 Adaptive clustering using different scenarios: (a) full scheme (see Fig. 1); (b) reduced scheme (TENPP procedure used only once);(c) clustering with adaptively changing cutoffs (for simplicity, only cutoffs 10-12, 10-25, 10-35, 10-45, and 10-50 were used in the example); (d)clustering with uniform stringent cutoff 10-50 (non-adaptive clustering analogous to FPC). Clustering (a) and (b) were based on P(SnidM); clustering(c) and (d) were based on P(Snid).K - number of significant clone overlaps; n - number of clones in clusters of reasonable size (from 6 to 500); ∑n -total number of clones in clusters of reasonable size; N - number of clones in clusters with less than 6 clones, singletons, or clones excludedby TENPP procedures; K - number of significant clone overlaps excluded by TENPP procedures; k - number of clusters of reasonable size; M =∑n/k - mean number of clones in clusters of reasonable size; N = 56,952 is the total number of clones in the database; Ni -number of clones inthe large or intermediate size cluster i.
Frenkel et al. BMC Bioinformatics 2010, 11:584http://www.biomedcentral.com/1471-2105/11/584
Page 10 of 17
(ii) Without using the TENPP procedure (Figure 4c),one very large cluster is obtained even for very stringentcutoffs (e.g., 51,780 for Pr0 = 10-12, 48,577 for Pr1 = 10-25,41,527 for Pr2 = 10-35, and 19,590 for Pr3 = 10-45). Thisclone partition was called C2.(iii) Clustering with a stringent uniform cutoff (10-50)
(Figure 4d) resulted in more singletons and smaller clus-ters compared to clustering with adaptively changingcutoff (Figure 4c). The clone partition obtained with theuniform cutoff will be referred to as C3, whereas thepartition obtained with FPC (after ordering and mer-ging) will be called CFPC. In partition CFPC, 41,295 ofthe 56,952 BAC clones were automatically subdividedinto 1,995 contigs (with 6 and more clones) that weremanually merged into 1,036 contigs with 6 to 290 clonesper contig; the remaining 15,675 clones were found inclusters with less than 6 clones or were singletons [48].Among the 951 clusters of CLTC (Figure 4a) only 47
have non-linear topological structures, and 31 of themhave only one branching point. The branching 47 non-linear clusters were split into about 171 “topologicallylinear” clusters. Note that among the clusters obtainedwith the other scenarios (Figure 4c-d) the proportion ofclusters with non-linear topological structure was muchhigher (up to 70% in C3, not shown). Thus, these resultsdemonstrate that the TENPP procedure enables the useof much more liberal cutoffs to obtain clusters of rea-sonable size. Repeating the procedure with more strin-gent cutoffs helps to split large clusters into reasonablesize clusters. Clustering with adaptively changing cutoffshelps to protect from “dissolving” the reasonably sizedclusters obtained at liberal cutoff stringency under morestringent cutoffs (see Additional File 2, Fig. AF2.4).Comparing LTC vs. FPC clustering The CLTC cluster-ing contains more clones in the reasonable size clustersthan CFPC: 80% vs. 73% of the 56,952 clones. Asdescribed in the Methods section (paragraph iii), “rea-sonable size of clusters” were arbitrary (for certainty)defined as clusters with 6 to 500 clones; obviously, otherranges can also be successfully used. Although the num-ber of clusters in CFPC was less than in CLTC after thesplit into clusters with linear topological structure(1,036 vs. about 1,200), CLTC clusters are proven by par-allel clones and hence should be more reliable. More-over, many of the FPC clusters were obtained bymanual merging smaller clusters, whereas 1200 clusterswere obtained by LTC before any merging was underta-ken. The Rand index was high, R(CLTC, CFPC) = 0.997because most of the clone pairs appeared in differentclusters. The modification of R: R’(CLTC, CFPC) = 0.56was more informative, reflecting that large clusters inCLTC and CFPC were rather different (one of the FPCclusters overlapped with eight LTC clusters). Neverthe-less, the values of M1(CLTC, CFPC) = 3.7, M1*(CLTC,
CFPC) = 2.15, and M1**(CLTC, CFPC) = 1.25 for the meannumber of clusters from CLTC overlapped with CFPC
(see Comparison of clone partitions in the Methods sec-tion) indicating that most of the differences betweenCFPC and CLTC originate from the difference betweenQ-clones excluded by FPC and those excluded by theTENPP procedure in LTC. If one excludes the clonesand clone overlaps from the CFPC clusters that wereexcluded by TENPP in LTC and a clustering is appliedwith a liberal cutoff Pr0 = 10-12, then a new clusteringCFPC
(TENPP) is obtained with M1**(CLTC, CFPC(TENPP)) =
1.3 and M1**(CFPC(TENPP), CLTC) = 1.0. This demon-
strates that each of CFPC(TENPP) clusters is actually a
sub-cluster of CLTC. Thus, all of LTC contigs are longerthan the corresponding FPC sub-contigs proven by par-allel clones.(iii) Verification of FPC contigsThe LTC adaptive clustering procedure was also used totest 249 FPC contigs (each containing 6 to 290 clones;the corresponding clone partition was mentioned in theprevious section and denoted by CFPC) that wereassigned to the 3BL7-0.63-1.00 and 3BS1-0.33-0.55 dele-tion bins of wheat chromosome 3B [48]. The LTC ana-lysis indicated that 201 of the contigs (80%) had regionswhere the overlap between two adjacent clones was notsignificant with the Pr0
(Siid) = 10-12 criterion and there-fore were considered as gaps by LTC. The maximumnumber of gaps per contig was 44 (found in a contig of283 clones). The gaps detected in the FPC-based contigswere of five main origins: (i) Contig consisting of two(or more) non-connected parts; (ii) Buried clones caus-ing conflicts between requests of linear ordering andcontig connectivity; (iii) Weak power of ordering toolsin FPC based on local optimization; (iv) Non-synchro-nous utilization of information on shared markers andcommon bands; (v) Topologically non-linear structureof the contig, mostly caused by the presence of clonesand clone overlaps not proven by short parallel paths.Contig consisting of two non-connected parts Onlyone contig located in the 3BL7-0.63-1.00 bin corre-sponded to this category. The net of significant cloneoverlaps for this contig consisted of two non-connectedparts (even when p-value of clone overlaps was calcu-lated using standard and the very liberal cutoff Pr0
(Sulst)
= 10-10). These parts can be connected by adding onlyone clone (see Additional File 2, Fig. AF2.5). Such asituation may result from the exclusion of one or twoconnecting clones (3B_043_I24 and 3B_073_B21) pre-sumably considered as Q-clones by FPC at the stage ofcluster ordering.Buried clones causing conflicts between ordering andcontig connectivity The significance of clone overlap isdetermined by the number of common bands and clonelengths. Hence, if clone ci is buried in clone cj and
Frenkel et al. BMC Bioinformatics 2010, 11:584http://www.biomedcentral.com/1471-2105/11/584
Page 11 of 17
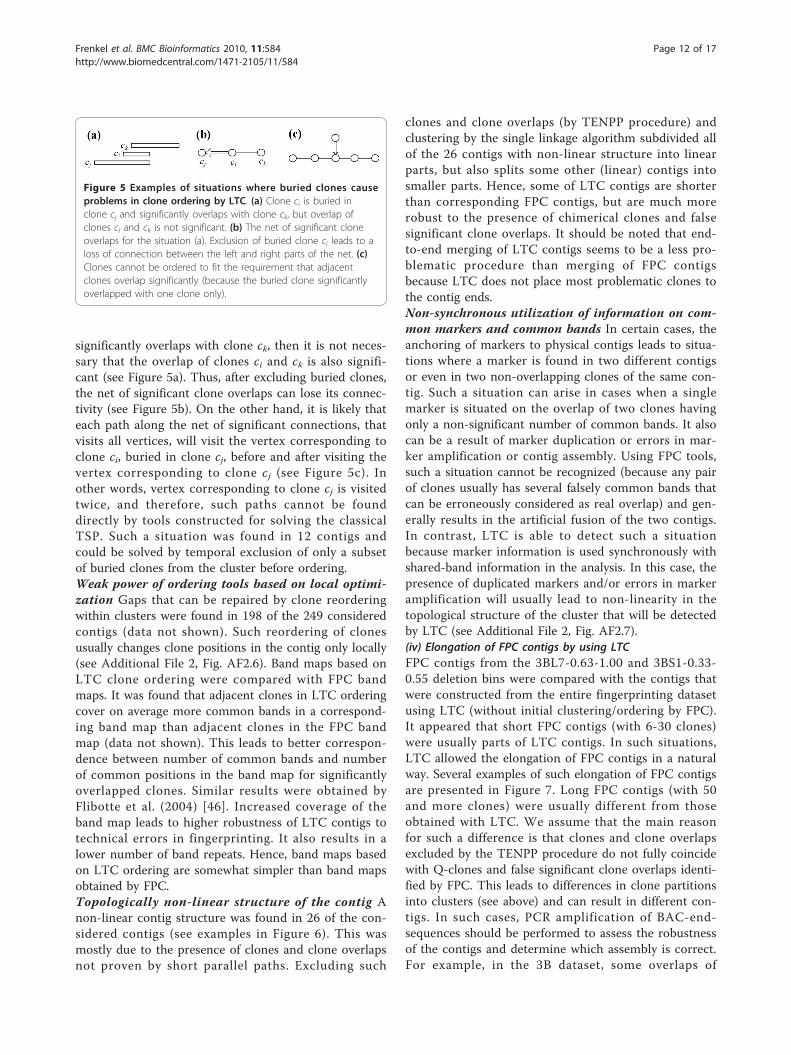
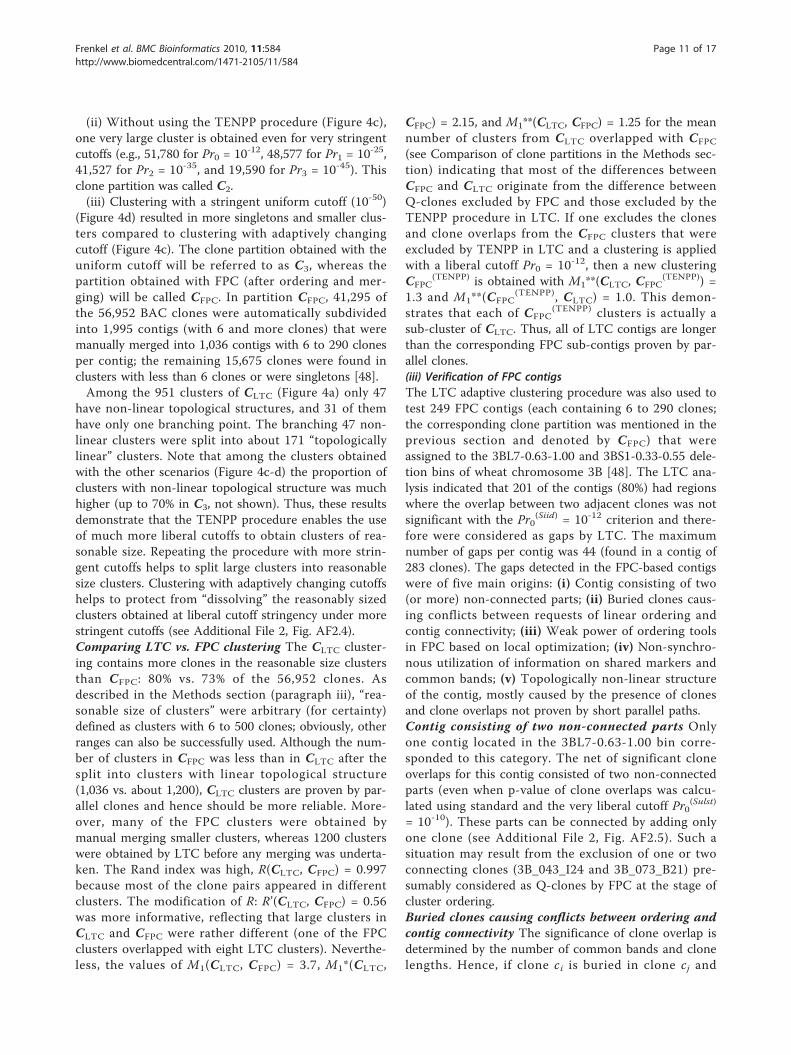
significantly overlaps with clone ck, then it is not neces-sary that the overlap of clones ci and ck is also signifi-cant (see Figure 5a). Thus, after excluding buried clones,the net of significant clone overlaps can lose its connec-tivity (see Figure 5b). On the other hand, it is likely thateach path along the net of significant connections, thatvisits all vertices, will visit the vertex corresponding toclone ci, buried in clone cj, before and after visiting thevertex corresponding to clone cj (see Figure 5c). Inother words, vertex corresponding to clone cj is visitedtwice, and therefore, such paths cannot be founddirectly by tools constructed for solving the classicalTSP. Such a situation was found in 12 contigs andcould be solved by temporal exclusion of only a subsetof buried clones from the cluster before ordering.Weak power of ordering tools based on local optimi-zation Gaps that can be repaired by clone reorderingwithin clusters were found in 198 of the 249 consideredcontigs (data not shown). Such reordering of clonesusually changes clone positions in the contig only locally(see Additional File 2, Fig. AF2.6). Band maps based onLTC clone ordering were compared with FPC bandmaps. It was found that adjacent clones in LTC orderingcover on average more common bands in a correspond-ing band map than adjacent clones in the FPC bandmap (data not shown). This leads to better correspon-dence between number of common bands and numberof common positions in the band map for significantlyoverlapped clones. Similar results were obtained byFlibotte et al. (2004) [46]. Increased coverage of theband map leads to higher robustness of LTC contigs totechnical errors in fingerprinting. It also results in alower number of band repeats. Hence, band maps basedon LTC ordering are somewhat simpler than band mapsobtained by FPC.Topologically non-linear structure of the contig Anon-linear contig structure was found in 26 of the con-sidered contigs (see examples in Figure 6). This wasmostly due to the presence of clones and clone overlapsnot proven by short parallel paths. Excluding such
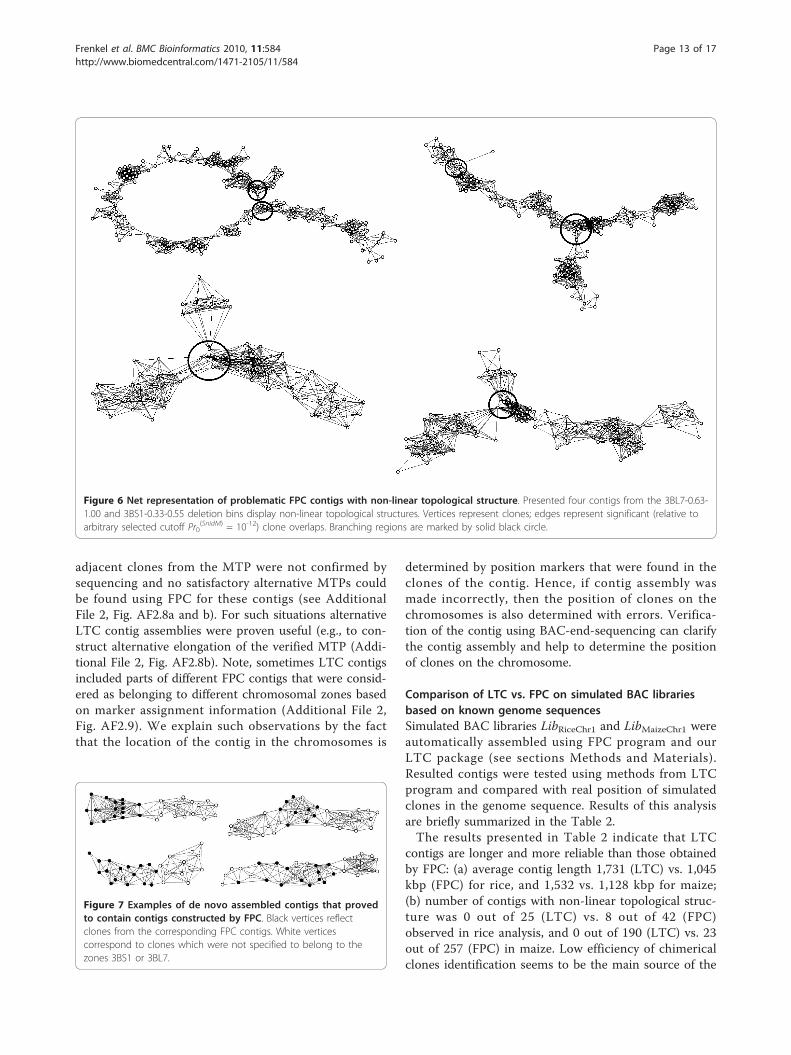
clones and clone overlaps (by TENPP procedure) andclustering by the single linkage algorithm subdivided allof the 26 contigs with non-linear structure into linearparts, but also splits some other (linear) contigs intosmaller parts. Hence, some of LTC contigs are shorterthan corresponding FPC contigs, but are much morerobust to the presence of chimerical clones and falsesignificant clone overlaps. It should be noted that end-to-end merging of LTC contigs seems to be a less pro-blematic procedure than merging of FPC contigsbecause LTC does not place most problematic clones tothe contig ends.Non-synchronous utilization of information on com-mon markers and common bands In certain cases, theanchoring of markers to physical contigs leads to situa-tions where a marker is found in two different contigsor even in two non-overlapping clones of the same con-tig. Such a situation can arise in cases when a singlemarker is situated on the overlap of two clones havingonly a non-significant number of common bands. It alsocan be a result of marker duplication or errors in mar-ker amplification or contig assembly. Using FPC tools,such a situation cannot be recognized (because any pairof clones usually has several falsely common bands thatcan be erroneously considered as real overlap) and gen-erally results in the artificial fusion of the two contigs.In contrast, LTC is able to detect such a situationbecause marker information is used synchronously withshared-band information in the analysis. In this case, thepresence of duplicated markers and/or errors in markeramplification will usually lead to non-linearity in thetopological structure of the cluster that will be detectedby LTC (see Additional File 2, Fig. AF2.7).(iv) Elongation of FPC contigs by using LTCFPC contigs from the 3BL7-0.63-1.00 and 3BS1-0.33-0.55 deletion bins were compared with the contigs thatwere constructed from the entire fingerprinting datasetusing LTC (without initial clustering/ordering by FPC).It appeared that short FPC contigs (with 6-30 clones)were usually parts of LTC contigs. In such situations,LTC allowed the elongation of FPC contigs in a naturalway. Several examples of such elongation of FPC contigsare presented in Figure 7. Long FPC contigs (with 50and more clones) were usually different from thoseobtained with LTC. We assume that the main reasonfor such a difference is that clones and clone overlapsexcluded by the TENPP procedure do not fully coincidewith Q-clones and false significant clone overlaps identi-fied by FPC. This leads to differences in clone partitionsinto clusters (see above) and can result in different con-tigs. In such cases, PCR amplification of BAC-end-sequences should be performed to assess the robustnessof the contigs and determine which assembly is correct.For example, in the 3B dataset, some overlaps of
Figure 5 Examples of situations where buried clones causeproblems in clone ordering by LTC. (a) Clone ci is buried inclone cj and significantly overlaps with clone ck, but overlap ofclones ci and ck is not significant. (b) The net of significant cloneoverlaps for the situation (a). Exclusion of buried clone ci leads to aloss of connection between the left and right parts of the net. (c)Clones cannot be ordered to fit the requirement that adjacentclones overlap significantly (because the buried clone significantlyoverlapped with one clone only).
Frenkel et al. BMC Bioinformatics 2010, 11:584http://www.biomedcentral.com/1471-2105/11/584
Page 12 of 17
adjacent clones from the MTP were not confirmed bysequencing and no satisfactory alternative MTPs couldbe found using FPC for these contigs (see AdditionalFile 2, Fig. AF2.8a and b). For such situations alternativeLTC contig assemblies were proven useful (e.g., to con-struct alternative elongation of the verified MTP (Addi-tional File 2, Fig. AF2.8b). Note, sometimes LTC contigsincluded parts of different FPC contigs that were consid-ered as belonging to different chromosomal zones basedon marker assignment information (Additional File 2,Fig. AF2.9). We explain such observations by the factthat the location of the contig in the chromosomes is
determined by position markers that were found in theclones of the contig. Hence, if contig assembly wasmade incorrectly, then the position of clones on thechromosomes is also determined with errors. Verifica-tion of the contig using BAC-end-sequencing can clarifythe contig assembly and help to determine the positionof clones on the chromosome.
Comparison of LTC vs. FPC on simulated BAC librariesbased on known genome sequencesSimulated BAC libraries LibRiceChr1 and LibMaizeChr1 wereautomatically assembled using FPC program and ourLTC package (see sections Methods and Materials).Resulted contigs were tested using methods from LTCprogram and compared with real position of simulatedclones in the genome sequence. Results of this analysisare briefly summarized in the Table 2.The results presented in Table 2 indicate that LTC
contigs are longer and more reliable than those obtainedby FPC: (a) average contig length 1,731 (LTC) vs. 1,045kbp (FPC) for rice, and 1,532 vs. 1,128 kbp for maize;(b) number of contigs with non-linear topological struc-ture was 0 out of 25 (LTC) vs. 8 out of 42 (FPC)observed in rice analysis, and 0 out of 190 (LTC) vs. 23out of 257 (FPC) in maize. Low efficiency of chimericalclones identification seems to be the main source of the
Figure 6 Net representation of problematic FPC contigs with non-linear topological structure. Presented four contigs from the 3BL7-0.63-1.00 and 3BS1-0.33-0.55 deletion bins display non-linear topological structures. Vertices represent clones; edges represent significant (relative toarbitrary selected cutoff Pr0
(SnidM) = 10-12) clone overlaps. Branching regions are marked by solid black circle.
Figure 7 Examples of de novo assembled contigs that provedto contain contigs constructed by FPC. Black vertices reflectclones from the corresponding FPC contigs. White verticescorrespond to clones which were not specified to belong to thezones 3BS1 or 3BL7.
Frenkel et al. BMC Bioinformatics 2010, 11:584http://www.biomedcentral.com/1471-2105/11/584
Page 13 of 17
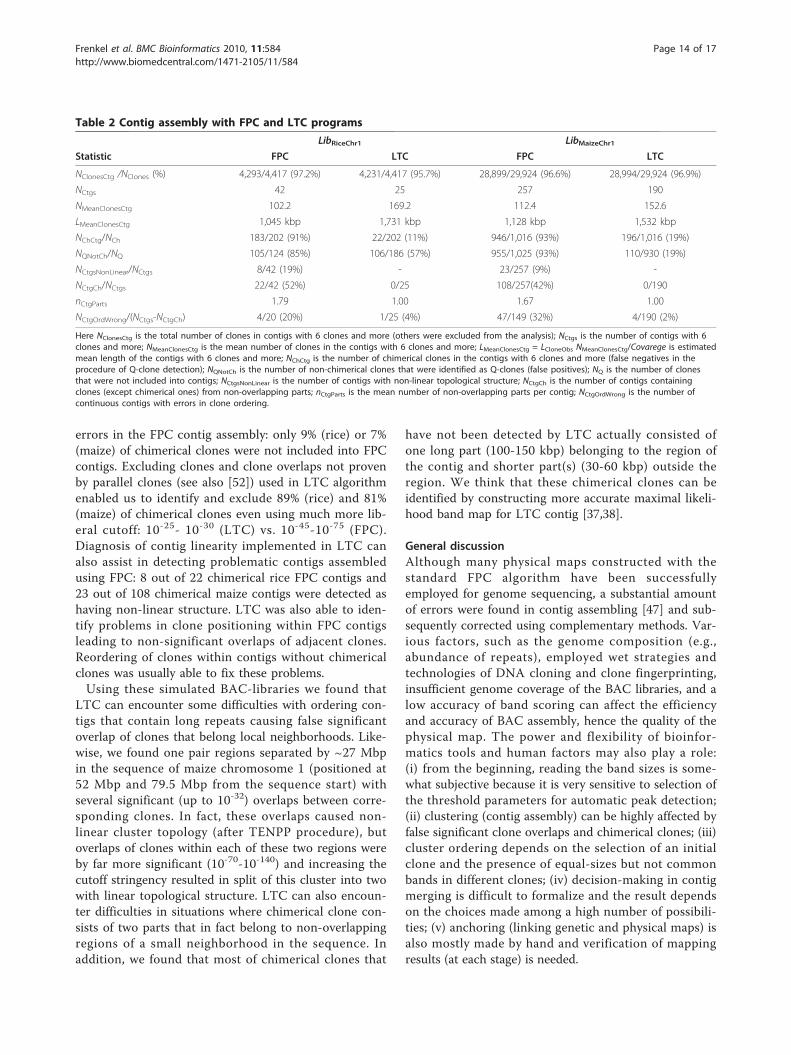
errors in the FPC contig assembly: only 9% (rice) or 7%(maize) of chimerical clones were not included into FPCcontigs. Excluding clones and clone overlaps not provenby parallel clones (see also [52]) used in LTC algorithmenabled us to identify and exclude 89% (rice) and 81%(maize) of chimerical clones even using much more lib-eral cutoff: 10-25- 10-30 (LTC) vs. 10-45-10-75 (FPC).Diagnosis of contig linearity implemented in LTC canalso assist in detecting problematic contigs assembledusing FPC: 8 out of 22 chimerical rice FPC contigs and23 out of 108 chimerical maize contigs were detected ashaving non-linear structure. LTC was also able to iden-tify problems in clone positioning within FPC contigsleading to non-significant overlaps of adjacent clones.Reordering of clones within contigs without chimericalclones was usually able to fix these problems.Using these simulated BAC-libraries we found that
LTC can encounter some difficulties with ordering con-tigs that contain long repeats causing false significantoverlap of clones that belong local neighborhoods. Like-wise, we found one pair regions separated by ~27 Mbpin the sequence of maize chromosome 1 (positioned at52 Mbp and 79.5 Mbp from the sequence start) withseveral significant (up to 10-32) overlaps between corre-sponding clones. In fact, these overlaps caused non-linear cluster topology (after TENPP procedure), butoverlaps of clones within each of these two regions wereby far more significant (10-70-10-140) and increasing thecutoff stringency resulted in split of this cluster into twowith linear topological structure. LTC can also encoun-ter difficulties in situations where chimerical clone con-sists of two parts that in fact belong to non-overlappingregions of a small neighborhood in the sequence. Inaddition, we found that most of chimerical clones that
have not been detected by LTC actually consisted ofone long part (100-150 kbp) belonging to the region ofthe contig and shorter part(s) (30-60 kbp) outside theregion. We think that these chimerical clones can beidentified by constructing more accurate maximal likeli-hood band map for LTC contig [37,38].
General discussionAlthough many physical maps constructed with thestandard FPC algorithm have been successfullyemployed for genome sequencing, a substantial amountof errors were found in contig assembling [47] and sub-sequently corrected using complementary methods. Var-ious factors, such as the genome composition (e.g.,abundance of repeats), employed wet strategies andtechnologies of DNA cloning and clone fingerprinting,insufficient genome coverage of the BAC libraries, and alow accuracy of band scoring can affect the efficiencyand accuracy of BAC assembly, hence the quality of thephysical map. The power and flexibility of bioinfor-matics tools and human factors may also play a role:(i) from the beginning, reading the band sizes is some-what subjective because it is very sensitive to selection ofthe threshold parameters for automatic peak detection;(ii) clustering (contig assembly) can be highly affected byfalse significant clone overlaps and chimerical clones; (iii)cluster ordering depends on the selection of an initialclone and the presence of equal-sizes but not commonbands in different clones; (iv) decision-making in contigmerging is difficult to formalize and the result dependson the choices made among a high number of possibili-ties; (v) anchoring (linking genetic and physical maps) isalso mostly made by hand and verification of mappingresults (at each stage) is needed.
Table 2 Contig assembly with FPC and LTC programs
LibRiceChr1 LibMaizeChr1
Statistic FPC LTC FPC LTC
NClonesCtg /NClones (%) 4,293/4,417 (97.2%) 4,231/4,417 (95.7%) 28,899/29,924 (96.6%) 28,994/29,924 (96.9%)
NCtgs 42 25 257 190
NMeanClonesCtg 102.2 169.2 112.4 152.6
LMeanClonesCtg 1,045 kbp 1,731 kbp 1,128 kbp 1,532 kbp
NChCtg/NCh 183/202 (91%) 22/202 (11%) 946/1,016 (93%) 196/1,016 (19%)
NQNotCh/NQ 105/124 (85%) 106/186 (57%) 955/1,025 (93%) 110/930 (19%)
NCtgsNonLinear/NCtgs 8/42 (19%) - 23/257 (9%) -
NCtgCh/NCtgs 22/42 (52%) 0/25 108/257(42%) 0/190
nCtgParts 1.79 1.00 1.67 1.00
NCtgOrdWrong/(NCtgs-NCtgCh) 4/20 (20%) 1/25 (4%) 47/149 (32%) 4/190 (2%)
Here NClonesCtg is the total number of clones in contigs with 6 clones and more (others were excluded from the analysis); NCtgs is the number of contigs with 6clones and more; NMeanClonesCtg is the mean number of clones in the contigs with 6 clones and more; LMeanClonesCtg = LCloneObs NMeanClonesCtg/Covarege is estimatedmean length of the contigs with 6 clones and more; NChCtg is the number of chimerical clones in the contigs with 6 clones and more (false negatives in theprocedure of Q-clone detection); NQNotCh is the number of non-chimerical clones that were identified as Q-clones (false positives); NQ is the number of clonesthat were not included into contigs; NCtgsNonLinear is the number of contigs with non-linear topological structure; NCtgCh is the number of contigs containingclones (except chimerical ones) from non-overlapping parts; nCtgParts is the mean number of non-overlapping parts per contig; NCtgOrdWrong is the number ofcontinuous contigs with errors in clone ordering.
Frenkel et al. BMC Bioinformatics 2010, 11:584http://www.biomedcentral.com/1471-2105/11/584
Page 14 of 17
Our results show that many of the previously men-tioned difficulties can become less problematic with theuse of new physical mapping algorithms and empoweringof standard algorithms by additional tools. The quality ofphysical maps can be improved by a more accurate iden-tification of chimerical clones and false clone overlaps. Inparticular this can be achieved by a more reliable scoringof the clone overlap p-value, by the utilization of “infor-mation content” of the bands, and by investigating thetopology of nets of significant clone overlaps. Clusteringcan be improved by the utilization of clone overlaps withmore liberal p-values: such overlaps result in larger clus-ters and hence simplify contig elongation and merging.Using more effective tools of contig ordering and order-ing verification also improves contig quality and leads toshorter MTPs. More reliable multilocus genetic mapsallow aligning the physical contigs to the correct chromo-somal position more accurately thereby improving thequality of anchoring.
ConclusionsThe proposed LTC methodology helps in obtaining morerealistic (relevant) clusters of clones that are expected tohave linear topological structure corroborating the linearstructure of the eukaryotic chromosome. Analytical toolsfor clone ordering based on global optimization methodsallow achieving coordinated clone orders and, presum-ably, shorter band map. Tools of LTC can also be used to“cure” and elongate contigs obtained with FPC or othermethods. In particular, the proposed framework provedeffective for fixing gaps in MTPs detected at the sequencelevel as well as for choosing alternative MTPs to increasethe efficiency of sequencing.We have shown that the LTC program has a few
advantages over standard FPC in contig assembly. Thedisadvantages of LTC are in its less friendly interface,which lead to the possibility to work only with a Win-dows operating system and to a rather primitive outputof the results. Some steps, such as, the building of bandmaps and automatic merging of contigs, the possibilityof compound alignment and optimization of physicaland genetic maps, are still not implemented in LTC. Atthis stage, it would make sense to utilize the advantagesof these two packages in the following way: (i) constructthe contigs with LTC at the beginning of a physicalmapping project; (ii) for each resulting contig separatelyconstruct band maps using FPC; (iii) test FPC ordersusing LTC; (iv) resolve the detected problems by exclud-ing clones disturbing the LTC-order in FPC-contig; (v)select a MTP for the verified contigs; (vi) if some gapsare found in the resulting MTP, try to cure them bychanging or adding clones to the MTP using LTC; (vii)align contigs to a consensus genetic map [66,67] usinggenetic markers using FPC. In addition, LTC can be
used to check the results of physical maps already con-structed by FPC and provide additional information orcorrections by curing, elongating, and merging the FPCcontigs. This can be useful in the final steps of a FPC-based project in which LTC can be used for selecting orcuring the MTP.Although our approximation of p-value seems to be
more accurate than the standard Sulston score, betterapproximations are needed to estimate p-values forhighly significant overlaps. This can be important forvery large databases of clones (e.g., when mapping isbased on genome-wide rather than chromosome-widefingerprinting) especially for organisms with highlyrepeated genomes. To achieve stability of clone orderingwe need to construct effective algorithms of excludingextra parallel clones for highly covered regions and bur-ied clones without endangering contig connectivity.Ordering of clones is associated with the bands’ relativepositions in the chromosome. Hence, LTC procedureused for clone ordering can be improved by the parallelconstruction of a globally optimal map of bands. Theprocess of merging contigs can be further optimized bybetter coordinating the “wet” and “dry” tools. We alsothink that criteria for the MTP selection can beimproved by taking into account the number of bandsand band abundances in clones and clone overlaps.
Additional material
Additional file 1: More detailed description of LTC approach. Wehave included the following items in an additional file named add_file_1.doc: (i) Description of p-value approximation for clone overlapping; (ii)Paragraph about comparison of LTC-approximation of p-value for cloneoverlapping, Sulston score, and mutual overlap statistic; (iii) Exampleillustrating clustering with “adaptively” varying cutoff; (iv) Examples ofcomplications that one can meet in dealing with clusters having non-linear topological structure; and (v) A paragraph about comparison ofclustering results obtained by different methods.
Additional file 2: Supplemental figs. In this file we present figures thatwere not included into the main text of the paper. These figures clarifyideas of LTC approach and illustrate some of our results.
AcknowledgementsThe research leading to these results has received funding from theEuropean Community’s Seventh Framework Programme (FP7/2007-2013)under the grant agreement FP7-212019 (TriticeaeGenome project, http://www.triticeaegenome.eu). It was also partially supported by BinationalAgricultural Research and Development Fund (BARD research project US-3873-06) and by the Israeli Ministry of Absorption.
Author details1University of Haifa, Institute of Evolution, Haifa 31905, Israel. 2INRA, Genetics,Diversity and Ecophysiology of Cereals, Clermont-Ferrand, France.
Authors’ contributionsZF designed algorithms, wrote the code for LTC package, conducted theanalysis using LTC (for all presented datasets) and FPC packages (forsimulated data only) and wrote the manuscript. EP provided the HICF dataon 3B, conducted the FPC analysis for 3B, suggested the algorithm for
Frenkel et al. BMC Bioinformatics 2010, 11:584http://www.biomedcentral.com/1471-2105/11/584
Page 15 of 17
simulations, proposed ideas for comparison of LTC and FPC methodologiesand participated in preparing the manuscript. DM developed algorithms andwrote code for fast global optimization of clones ordering within thecontigs. CF contributed to the discussion and participated in preparing themanuscript. AK supervised the project, proposed ideas for LTCmethodologies, contributed to developing of the algorithms, helped toconduct the analysis and wrote the manuscript. All authors read andapproved the final manuscript.
Received: 7 September 2010 Accepted: 30 November 2010Published: 30 November 2010
References1. Lander ES, Linton LM, Birren B, Nusbaum C, Zody MC, Baldwin J, Devon K,
Dewar K, Doyle M, FitzHugh W, Funke R, Gage D, Harris K, Heaford A,Howland J, Kann L, Lehoczky J, LeVine R, McEwan P, McKernan K,Meldrim J, Mesirov JP, Miranda C, Morris W, Naylor J, Raymond C, Rosetti M,Santos R, Sheridan A, Sougnez C, et al: Initial sequencing and analysis ofthe human genome. Nature 2001, 409(6822):860-921.
2. McPherson JD, Marra M, Hillier L, Waterston RH, Chinwalla A, Wallis J,Sekhon M, Wylie K, Mardis ER, Wilson RK, Fulton R, Kucaba TA, Wagner-McPherson C, Barbazuk WB, Gregory SG, Humphray SJ, French L, Evans RS,Bethel G, Whittaker A, Holden JL, McCann OT, Dunham A, Soderlund C,Scott CE, Bentley DR, Schuler G, Chen HC, Jang W, Green ED, et al: Aphysical map of the human genome. Nature 2001, 409(6822):934-941.
3. Gregory SG, Sekhon M, Schein J, Zhao S, Osoegawa K, Scott CE, Evans RS,Burridge PW, Cox TV, Fox CA, Hutton RD, Mullenger IR, Phillips KJ, Smith J,Stalker J, Threadgold GJ, Birney E, Wylie K, Chinwalla A, Wallis J, Hillier L,Carter J, Gaige T, Jaeger S, Kremitzki C, Layman D, Maas J, McGrane R,Mead K, Walker R, et al: A physical map of the mouse genome. Nature2002, 418(6899):743-750.
4. Chen M, Presting G, Barbazuk WB, Goicoechea JL, Blackmon B, Fang G,Kim H, Frisch D, Yu Y, Sun S, Higingbottom S, Phimphilai J, Phimphilai D,Thurmond S, Gaudette B, Li P, Liu J, Hatfield J, Main D, Farrar K,Henderson C, Barnett L, Costa R, Williams B, Walser S, Atkins M, Hall C,Budiman MA, Tomkins JP, Luo M, et al: An integrated physical andgenetic map of the rice genome. Plant Cell 2002, 14(3):537-545.
5. Coe E, Cone K, McMullen M, Chen SS, Davis G, Gardiner J, Liscum E,Polacco M, Paterson A, Sanchez-Villeda H, Soderlund C, Wing R: Access tothe maize genome: an integrated physical and genetic map. Plant Physiol2002, 128(1):9-12.
6. Nelson WM, Bharti AK, Butler E, Wei F, Fuks G, Kim H, Wing RA, Messing J,Soderlund C: Whole-genome validation of high-information-contentfingerprinting. Plant Physiol 2005, 139(1):27-38.
7. Lewin HA, Larkin DM, Pontius J, O’Brien SJ: Every genome sequence needsa good map. Genome Res 2009, 19(11):1925-1928.
8. Staden R: A strategy of DNA sequencing employing computer programs.Nucleic Acids Res 1979, 6(7):2601-2610.
9. Roach JC, Boysen C, Wang K, Hood L: Pairwise end sequencing: a unifiedapproach to genomic mapping and sequencing. Genomics 1995,26(2):345-353.
10. Fleischmann RD, Adams MD, White O, Clayton RA, Kirkness EF,Kerlavage AR, Bult CJ, Tomb JF, Dougherty BA, Merrick JM: Whole-genomerandom sequencing and assembly of Haemophilus influenzae Rd.Science 1995, 269(5223):496-512.
11. Adams MD, Celniker SE, Holt RA, Evans CA, Gocayne JD, Amanatides PG,Scherer SE, Li PW, Hoskins RA, Galle RF, George RA, Lewis SE, Richards S,Ashburner M, Henderson SN, Sutton GG, Wortman JR, Yandell MD,Zhang Q, Chen LX, Brandon RC, Rogers YH, Blazej RG, Champe M,Pfeiffer BD, Wan KH, Doyle C, Baxter EG, Helt G, Nelson CR, et al: Thegenome sequence of Drosophila melanogaster. Science 2000,287(5461):2185-2195.
12. Voelkerding KV, Dames SA, Durtschi JD: Next-generation sequencing: frombasic research to diagnostics. Clin Chem 2009, 55(4):641-658.
13. Li R, Fan W, Tian G, Zhu H, He L, Cai J, Huang Q, Cai Q, Li B, Bai Y, Zhang Z,Zhang Y, Wang W, Li J, Wei F, Li H, Jian M, Li J, Zhang Z, Nielsen R, Li D,Gu W, Yang Z, Xuan Z, Ryder OA, Leung FC, Zhou Y, Cao J, Sun X, Fu Y,et al: The sequence and de novo assembly of the giant panda genome.Nature 2010, 463(7279):311-317.
14. Metzker ML: Sequencing technologies - the next generation. Nat RevGenet 2010, 11(1):31-46.
15. Coulson A, Sulston J, Brenner S, Karn J: Toward a physical map of thegenome of the nematode Caenorhabditis elegans. Proc Natl Acad Sci USA1986, 83(20):7821-7825.
16. Olson MV, Dutchik JE, Graham MY, Brodeur GM, Helms C, Frank M,MacCollin M, Scheinman R, Frank T: Random-clone strategy for genomicrestriction mapping in yeast. Proc Natl Acad Sci USA 1986,83(20):7826-7830.
17. Sulston J, Mallett F, Staden R, Durbin R, Horsnell T, Coulson A: Software forgenome mapping by fingerprinting techniques. Comput Appl Biosci 1988,4(1):125-132.
18. Gregory SG, Howell GR, Bentley DR: Genome mapping by fluorescentfingerprinting. Genome Res 1997, 7(12):1162-1168.
19. Marra MA, Kucaba TA, Dietrich NL, Green ED, Brownstein B, Wilson RK,McDonald KM, Hillier LW, McPherson JD, Waterston RH: High throughputfingerprint analysis of large-insert clones. Genome Res 1997,7(11):1072-1084.
20. Zhang HB, Wing RA: Physical mapping of the rice genome with BACs.Plant Mol Biol 1997, 35(1-2):115-127.
21. Ding Y, Johnson MD, Colayco R, Chen YJ, Melnyk J, Schmitt H, Shizuya H:Contig assembly of bacterial artificial chromosome clones throughmultiplexed fluorescence-labeled fingerprinting. Genomics 1999,56(3):237-246.
22. Luo MC, Thomas C, You FM, Hsiao J, Ouyang S, Buell CR, Malandro M,McGuire PE, Anderson OD, Dvorak J: High-throughput fingerprinting ofbacterial artificial chromosomes using the snapshot labeling kit andsizing of restriction fragments by capillary electrophoresis. Genomics2003, 82(3):378-389.
23. Venter JC, Smith HO, Hood L: A new strategy for genome sequencing.Nature 1996, 381(6581):364-366.
24. Prade RA, Griffith J, Kochut K, Arnold J, Timberlake WE: In vitroreconstruction of the Aspergillus (= Emericella) nidulans genome. ProcNatl Acad Sci USA 1997, 94(26):14564-14569.
25. Mahairas GG, Wallace JC, Smith K, Swartzell S, Holzman T, Keller A, Shaker R,Furlong J, Young J, Zhao S, Adams MD, Hood L: Sequence-taggedconnectors: a sequence approach to mapping and scanning the humangenome. Proc Natl Acad Sci USA 1999, 96(17):9739-9744.
26. Faris JD, Gill BS: Genomic targeting and high-resolution mapping of thedomestication gene Q in wheat. Genome 2002, 45(4):706-718.
27. Weikard R, Goldammer T, Laurent P, Womack JE, Kuehn C: A gene-basedhigh-resolution comparative radiation hybrid map as a framework forgenome sequence assembly of a bovine chromosome 6 regionassociated with QTL for growth, body composition, and milkperformance traits. BMC Genomics 2006, 7:53.
28. Le Cunff L, Garsmeur O, Raboin LM, Pauquet J, Telismart H, Selvi A, Grivet L,Philippe R, Begum D, Deu M, Costet L, Wing R, Glaszmann JC, D’Hont A:Diploid/polyploid syntenic shuttle mapping and haplotype-specificchromosome walking toward a rust resistance gene (Bru1) in highlypolyploid sugarcane (2n approximately 12x approximately 115). Genetics2008, 180(1):649-660.
29. Wang GL, Holsten TE, Song WY, Wang HP, Ronald PC: Construction of arice bacterial artificial chromosome library and identification of cloneslinked to the Xa-21 disease resistance locus. Plant J 1995, 7(3):525-533.
30. Tanksley SD, Ganal MW, Martin GB: Chromosome landing: a paradigm formap-based gene cloning in plants with large genomes. Trends Genet1995, 11(2):63-68.
31. Huang L, Brooks SA, Li W, Fellers JP, Trick HN, Gill BS: Map-based cloningof leaf rust resistance gene Lr21 from the large and polyploid genomeof bread wheat. Genetics 2003, 164(2):655-664.
32. Ma J, SanMiguel P, Lai J, Messing J, Bennetzen JL: DNA rearrangement inorthologous orp regions of the maize, rice and sorghum genomes.Genetics 2005, 170(3):1209-1220.
33. Tameling WI, Baulcombe DC: Physical association of the NB-LRRresistance protein Rx with a Ran GTPase-activating protein is requiredfor extreme resistance to Potato virus X. Plant Cell 2007, 19(5):1682-1694.
34. Monden Y, Naito K, Okumoto Y, Saito H, Oki N, Tsukiyama T, Ideta O,Nakazaki T, Wessler SR, Tanisaka T: High potential of a transposon mPingas a marker system in japonica × japonica cross in rice. DNA Res 2009,16(2):131-140.
35. Soderlund C, Longden I, Mott R: FPC: a system for building contigs fromrestriction fingerprinted clones. Comput Appl Biosci 1997, 13(5):523-535.
Frenkel et al. BMC Bioinformatics 2010, 11:584http://www.biomedcentral.com/1471-2105/11/584
Page 16 of 17

36. Soderlund C, Humphray S, Dunham A, French L: Contigs built withfingerprints, markers, and FPC V4.7. Genome Res 2000, 10(11):1772-1787.
37. Bhandarkar SM, Machaka SA, Shete SS, Kota RN: Parallel computation of amaximum-likelihood estimator of a physical map. Genetics 2001,157(3):1021-1043.
38. Bhandarkar S, Huang J, Arnold J: Information theoretic approach togenome reconstruction. In Handbook of computational molecular biology.Edited by: Aluru S. Chapman 2006:1-26.
39. Wang Y, Prade RA, Griffith J, Timberlake WE, Arnold J: A fast random costalgorithm for physical mapping. Proc Natl Acad Sci USA 1994,91(23):11094-11098.
40. Wendl MC: Probabilistic assessment of clone overlaps in DNA fingerprintmapping via a priori models. J Comput Biol 2005, 12(3):283-297.
41. Wendl MC: Algebraic correction methods for computational assessmentof clone overlaps in DNA fingerprint mapping. BMC Bioinformatics 2007,8:127.
42. Balding DJ, Torney DC: Statistical analysis of DNA fingerprint data forordered clone physical mapping of human chromosomes. Bull Math Biol1991, 53(6):853-879.
43. Mayraz G, Shamir R: Construction of physical maps from oligonucleotidefingerprints data. J Comput Biol 1999, 6(2):237-252.
44. Meyers BC, Scalabrin S, Morgante M: Mapping and sequencing complexgenomes: let’s get physical! Nat Rev Genet 2004, 5(8):578-588.
45. Marra M, Kucaba T, Sekhon M, Hillier L, Martienssen R, Chinwalla A,Crockett J, Fedele J, Grover H, Gund C, McCombie WR, McDonald K,McPherson J, Mudd N, Parnell L, Schein J, Seim R, Shelby P, Waterston R,Wilson R: A map for sequence analysis of the Arabidopsis thalianagenome. Nat Genet 1999, 22(3):265-270.
46. Flibotte S, Chiu R, Fjell C, Krzywinski M, Schein JE, Shin H, Marra MA:Automated ordering of fingerprinted clones. Bioinformatics 2004,20(8):1264-1271.
47. Salzberg SL, Yorke JA: Beware of mis-assembled genomes. Bioinformatics2005, 21(24):4320-4321.
48. Paux E, Sourdille P, Salse J, Saintenac C, Choulet F, Leroy P, Korol A,Michalak M, Kianian S, Spielmeyer W, Lagudah E, Somers D, Kilian A,Alaux M, Vautrin S, Berges H, Eversole K, Appels R, Safar J, Simkova H,Dolezel J, Bernard M, Feuillet C: A physical map of the 1-gigabase breadwheat chromosome 3B. Science 2008, 322(5898):101-104.
49. Waterman MS, Griggs JR: Interval graphs and maps of DNA. Bull Math Biol1986, 48(2):189-195.
50. Cuticchia AJ, Arnold J, Timberlake WE: The use of simulated annealing inchromosome reconstruction experiments based on binary scoring.Genetics 1992, 132(2):591-601.
51. Zhang P, Schon EA, Fischer SG, Cayanis E, Weiss J, Kistler S, Bourne PE: Analgorithm based on graph theory for the assembly of contigs in physicalmapping of DNA. Comput Appl Biosci 1994, 10(3):309-317.
52. Arratia R, Lander ES, Tavare S, Waterman MS: Genomic mapping byanchoring random clones: a mathematical analysis. Genomics 1991,11(4):806-827.
53. Jain AK, Dubes RC: Algorithms for clustering data N.J.: Prentice Hall:Englewood Cliffs; 1988.
54. Batagelj V, Mrvar A: Pajek - analysis and visualization of large networks. InGraph drawing software. Edited by: Jünger M, Mutzel P. Berlin: Springer;2003:77-103.
55. Bollobas B: Modern graph theory. 1 edition. Springer; 2002.56. Fickett J, Cinkosky M: A genetic algorithm for assembling chromosome
physical maps. In The Second International Conference on Bioinformatics.Supercomputing and Complex Genomic Analysis. Edited by: Lim H, Fickett J,Cantor C, Robbins R. New Jersey: World Scientific; 1992:273-285.
57. Alizadah F, Karp R, Newberg LA, Weisser D: Physical mapping ofchromosomes: A combinatorial problem in molecular biology.Algorithmica 1995, 13(Numbers 1-2):52-76.
58. Mester D, Ronin Y, Minkov D, Nevo E, Korol A: Constructing large-scalegenetic maps using an evolutionary strategy algorithm. Genetics 2003,165(4):2269-2282.
59. Cuticchia AJ, Arnold J, Timberlake WE: ODS: ordering DNA sequences–aphysical mapping algorithm based on simulated annealing. Comput ApplBiosci 1993, 9(2):215-219.
60. Rand WM: Objective criteria for the evaluation of clustering methods.Journal of the American Statistical Association 1971, 66:846-850.
61. Kamada T, Kawai S: An algorithm for drawing general undirected graphs.Information Processing Letters 1989, 31:7-15.
62. Xu Z, Sun S, Covaleda L, Ding K, Zhang A, Wu C, Scheuring C, Zhang HB:Genome physical mapping with large-insert bacterial clones byfingerprint analysis: methodologies, source clone genome coverage, andcontig map quality. Genomics 2004, 84(6):941-951.
63. Krzywinski M, Bosdet I, Mathewson C, Wye N, Brebner J, Chiu R, Corbett R,Field M, Lee D, Pugh T, Volik S, Siddiqui A, Jones S, Schein J, Collins C,Marra M: A BAC clone fingerprinting approach to the detection ofhuman genome rearrangements. Genome Biol 2007, 8(10):R224.
64. Nelson WM, Dvorak J, Luo MC, Messing J, Wing RA, Soderlund C: Efficacyof clone fingerprinting methodologies. Genomics 2007, 89(1):160-165.
65. Safar J, Bartos J, Janda J, Bellec A, Kubalakova M, Valarik M, Pateyron S,Weiserova J, Tuskova R, Cihalikova J, Vrana J, Simkova H, Faivre-Rampant P,Sourdille P, Caboche M, Bernard M, Dolezel J, Chalhoub B: Dissecting largeand complex genomes: flow sorting and BAC cloning of individualchromosomes from bread wheat. Plant J 2004, 39(6):960-968.
66. Mester DI, Ronin YI, Korostishevsky MA, Pikus VL, Glazman AE, Korol AB:Multilocus consensus genetic maps (MCGM): formulation, algorithms,and results. Comput Biol Chem 2006, 30(1):12-20.
67. Korol AB, Mester D, Frenkel Z, Ronin YI: Methods for genetic analysis inthe Triticeae. In Genetics and Genomics of the Triticeae. Edited by: Feuillet C,Muehlbauer GJ. Springer + Business Media LLC; 2009:163-199.
doi:10.1186/1471-2105-11-584Cite this article as: Frenkel et al.: LTC: a novel algorithm to improve theefficiency of contig assembly for physical mapping in complexgenomes. BMC Bioinformatics 2010 11:584.
Submit your next manuscript to BioMed Centraland take full advantage of:
• Convenient online submission
• Thorough peer review
• No space constraints or color figure charges
• Immediate publication on acceptance
• Inclusion in PubMed, CAS, Scopus and Google Scholar
• Research which is freely available for redistribution
Submit your manuscript at www.biomedcentral.com/submit
Frenkel et al. BMC Bioinformatics 2010, 11:584http://www.biomedcentral.com/1471-2105/11/584
Page 17 of 17