Compositional heterogeneity within and among isochores in mammalian genomes
Upload
independentCategory
view
3download
0
Synonymous and Nonsynonymous Polymorphisms versus Divergences inBacterial Genomes
Austin L. Hughes, Robert Friedman, Pierre Rivailler, and Jeffrey O. French,Department of Biological Sciences, University of South Carolina
Comparison of the ratio of nonsynonymous to synonymous polymorphisms within species with the ratio ofnonsynonymous to synonymous substitutions between species has been widely used as a supposed indicator of positiveDarwinian selection, with the ratio of these 2 ratios being designated as a neutrality index (NI). Comparison of genome-wide polymorphism within 12 species of bacteria with divergence from an outgroup species showed substantialdifferences in NI among taxa. A low level of nonsynonymous polymorphism at a locus was the best predictor of NI , 1,rather than a high level of nonsynonymous substitution between species. Moreover, genes with NI , 1 showed a strongtendency toward the occurrence of rare nonsynonymous polymorphisms, as expected under the action of ongoingpurifying selection. Thus, our results are more consistent with the hypothesis that a high relative rate of between-speciesnonsynonymous substitution reflects mainly the action of purifying selection within species to eliminate slightlydeleterious mutations rather than positive selection between species. This conclusion is consistent with previous resultshighlighting an important role of slightly deleterious variants in bacterial evolution and suggests caution in the use of theMcDonald–Kreitman test and related statistics as tests of positive selection.
Introduction
Numerous studies have compared the patterns of syn-onymous and nonsynonymous polymorphisms within spe-cies with the patterns of synonymous and nonsynonymousdivergences between species in order to obtain informationregarding the action of natural selection on protein-codinggenes; but the interpretation of such data is complicated(Hughes 2007). McDonald and Kreitman (1991) suggestedthat a higher ratio of nonsynonymous to synonymous diver-gence than of nonsynonymous to synonymous polymor-phism might provide evidence of positive Darwinianselection that favored adaptive amino acid changes betweenspecies; and they proposed a statistical test (the McDonald–Kreitman [MK] test) of this hypothesis based on a contin-gency table. Several other authors have used similarreasoning to define as a ‘‘neutrality index’’ (NI), the ratioof nonsynonymous to synonymous polymorphism dividedby the ratio of nonsynonymous to synonymous divergence,which may or may not be used in conjunction with the MKtest (Rand and Kann 1996; Bazin et al. 2006). Alternatively,the inverse of NI may be defined as a ‘‘fixation index’’(Shapiro et al. 2007).
It has been argued that the MK test and related meth-ods may be subject to distortions caused by the presence ofslightly deleterious nonsynonymous mutations in naturalpopulations. As has frequently been suggested, these meth-ods may not be able to distinguish clearly between the fix-ation of nonsynonymous substitutions due to positiveselection and the fixation of slightly deleterious nonsynon-ymous mutations during a bottleneck accompanying speci-ation (Ohta 1993; Eyre-Walker 2002; Hughes et al. 2006;Hughes 2007). Furthermore, slightly deleterious nonsynon-ymous polymorphisms can confound the MK test andrelated methods in other ways. An abundance of slightlydeleterious polymorphisms, subject to ongoing purifyingselection, within a species might mask the effect of
between-species divergence (Hughes 2007). Conversely,effective removal of slightly deleterious variants by pu-rifying selection might lead to a false inference of positive-selection between species because within-speciesnonsynonymous polymorphism is reduced.
There are 2 aspects of purifying selection that leavesignatures detectable by nucleotide sequence analysis: 1)certain deleterious mutations have previously been elimi-nated from the population, thereby contributing the fact thatdN is less than dS in most pairwise comparisons of codingsequences and; 2) certain slightly deleterious mutations,still present in populations, are subject to ongoing purifyingselection that acts to lower their frequencies in comparisonto neutral variants (Hughes et al. 2003; Hughes AL andHughes MA 2007a, 2007b; Hughes and Piontkivska2008; Irausquin and Hughes 2008). Because nonsynony-mous mutations are more likely to be slightly deleteriousthan synonymous mutations, a signature of ongoing puri-fying selection is that gene diversity (‘‘heterozygosity’’)is reduced at nonsynonymous polymorphic sites in compar-ison to that at synonymous polymorphic sites (Hughes et al.2003). Likewise, ongoing purifying selection will influencestatistics that compare the pairwise nucleotide differencewith the number of segregating sites and thereby identifythe presence of rare variants (Tajima 1989).
Several lines of evidence suggest that slightly delete-rious variants, subject to ongoing purifying selection, arewidespread in protein-coding genes of many bacterial spe-cies. A survey of 149 data sets of bacterial sequence poly-morphism revealed an excess of rare nonsynonymousvariants but not of synonymous variants; the former islikely to represent slightly deleterious alleles whose fre-quency in the population has decreased as a result of ongo-ing purifying selection (Hughes 2005). Similar results werereported in a study of Escherichia coli and Salmonella en-terica, even when singletons (possibly due to sequencingerrors) were removed from the data (Charlesworth andEyre-Walker 2006). Moreover, Rocha et al. (2006) pre-sented evidence that the ratio of the number of nonsynon-ymous substitutions per nonsynonymous site (dN) to thenumber of synonymous substitutions per synonymous site(dS) tends to decrease as the evolutionary time between 2related bacterial genomes increases.
Key words: bacterial evolution, homologous recombination,McDonald–Kreitman test, neutrality index, nucleotide substitution.
E-mail: [email protected].
Mol. Biol. Evol. 25(10):2199–2209. 2008doi:10.1093/molbev/msn166Advance Access publication July 30, 2008
� The Author 2008. Published by Oxford University Press on behalf ofthe Society for Molecular Biology and Evolution. All rights reserved.For permissions, please e-mail: [email protected]

The efficiency with which slightly deleterious variantsare removed is correlated with effective population size.Although there is evidence that effective population sizesof bacteria are in general much greater than those of mul-ticellular eukaryotes (Lynch and Conery 2003), little isknown about variations among bacterial species with re-spect to effective population size. Another factor that willaffect these analyses is the rate of homologous recombina-tion because recombination is necessary to purge deleteri-ous variants from a population (‘‘Mueller’s ratchet’’; Lynchet al. 1993; Lynch 2007); and recombination rates areknown to vary among bacterial species (Feil et al. 2001).If nonsynonymous polymorphism involves mainly slightlydeleterious variants subject to ongoing purifying selection,species with large effective population sizes and/or efficientrecombination may be expected to have reduced within-species nonsynonymous polymorphism relative to within-species synonymous polymorphism. As a result, the MKtest and related methods may tend to identify positive selec-tion in such species. Moreover, within a given species, theMK test and related methods may tend to infer positiveselection on individual genes subject to strong ongoing pu-rifying selection and thus having low ratios of nonsynony-mous to synonymous polymorphism.
Here we address this question by examining within-species polymorphism in protein-coding genes in thecompletely sequenced genomes of 12 species of bacteria,including important pathogens of humans, domestic ani-mals, and plants. Using the closest available outgroup spe-cies, we estimate between-species synonymous andnonsynonymous substitutions and compare the pattern ofnet between-species divergence with that of within-speciespolymorphism. In particular, we examine the NI, defined asthe ratio of nonsynonymous to synonymous polymorphismdivided by the ratio of nonsynonymous to synonymous di-vergence (Rand and Kann 1996). In addition, in the case of3 species for which polymorphism data were available ona substantial number of genes in 4 or more genomes(Burkholderia pseudomallei, Staphylococcus aureus, andStreptococcus pyogenes), we test for the presence of rarenonsynonymous variants likely to be subject to ongoingpurifying selection. By comparing the patterns of within-species purifying selection within species with those ofbetween-species divergence, we test for the role of slightlydeleterious nonsynonymous variants on the MK and relatedmethods.
MethodsSequences Analyzed
We analyzed polymorphism within 12 species of Bac-teria for which at least 3 complete genome sequences wereavailable and for which the complete genome sequence ofa congeneric outgroup species was available (for GenBankaccession numbers, see supplementary table S1, Supple-mentary Material online). The species (with numbers of se-quences) and outgroups were as follows: B. pseudomallei(4) and Burkholderia thailandensis, Campylobacter jejuni(3) and Campylobacter fetus, Chlamydophila pneumoniae(4) andChlamydophila felis, Ehrlichia ruminantium (3) andEhrlichia chaffeensis, Helicobacter pylori (3) and Helico-
bacter acinonychis, Pseudomonas syringae (3) and Pseu-domonas fluorescens, Shigella flexneri (3) and Shigellasonnei, S. aureus (9) and Staphylococcus epidermidis,Streptococcus pneumoniae (3) and Streptococcus sangui-nis, S. pyogenes (12) and Streptococcus agalactiae, andYersinia pestis (5) and Yersinia pseudotuberculosis. Wedesignate the species for which multiple genomes were an-alyzed as the ingroup species. Gene families in a speciesand its outgroup were identified by applying the Blastclustsoftware (Altschul et al. 1997) to predicted protein transla-tions. Putative orthologs were identified as families withexactly one representative per genome. The parametersL (minimum length coverage) and S (similarity thresholdmeasured as Blast similarity score divided by the alignmentlength) were chosen for each pair of species so as to yield asmany orthologs as possible, given the level of sequencedivergence between ingroup and outgroup species (supple-mentary table S1, Supplementary Material online). Ortho-logs were aligned at the amino acid level using ClustalW(Thompson et al. 1994), and the alignment was imposedon the DNA sequences.
The species concept in Bacteria has been controversialbecause genetic exchange can occur beyond the boundariesof named species (Vulic et al. 1997; Majewski 2001; Cohan2002; Fraser et al. 2007). Furthermore, named bacterial spe-cies do not always correspond to monophyletic groups. Weused preliminary phylogenetic analyses to ensure that eachof the 12 ingroup species used here constituted a monophy-letic group, at least as regards the majority of its protein-coding genes. Likewise, we used phylogenetic analysesto test the hypothesis that each of the outgroup species con-stituted an outgroup to the ingroup species with which itwas compared, at least as regards the majority of its protein-coding genes. These phylogenetic analyses were based onthe aligned sets of orthologous amino acid sequences usingthe following methods: 1) maximum parsimony (MP) usingbranch-and-bound search (Swofford 2002), 2) Neighbor-Joining (Saitou and Nei 1987) based on the JTT model(Jones et al. 1992) with the gamma correction for rate var-iation among sites, using the MEGA 3 program (Kumaret al. 2004), and 3) the quartet maximum likelihood methodusing the Tree-Puzzle 5.2 program (Schmidt et al. 2002)based on the JTTmodel with gamma correction for rate var-iation among sites. We only included in our analyses spe-cies for which these analyses supported monophyly and thevalidity of the outgroup.
Nucleotide Diversity and Divergence
The number of synonymous nucleotide substitutionsper synonymous site (dS) and the number of nonsynony-mous nucleotide substitutions per nonsynonymous site(dN) were estimated for all pairwise comparisons of ortho-logs by the method of Yang and Nielsen (2000). Thismethod takes into account nucleotide content and muta-tional biases (Yang and Nielsen 2000). For each ortholog,we computed the mean of dS values in all pairwise compar-isons within the ingroup species (i.e., the synonymous nu-cleotide diversity, symbolized pS). Likewise, for eachortholog, we computed the mean of dN values in all pair-wise comparisons within the ingroup species (i.e., the
2200 Hughes et al.

nonsynonymous nucleotide diversity, symbolized pA). Foreach ortholog, we computed the net synonymous (kS) andnonsynonymous (kA) nucleotide divergences between theingroup and outgroup species following Nei and Jin(1989; see also Nei and Kumar 2000). To compute kS,we first computed the mean of dS for all comparisonsbetween ingroup and outgroup (dSb), then kS 5 dSb � pS.Similarly, to compute kA, we first computed the mean ofdN for all comparisons between ingroup and outgroup(dNb), then kA 5 dNb � pA.
Different authors have used different methods basedon the original idea of McDonald and Kreitman (1991)to compare synonymous and nonsynonymous polymor-phisms and divergences (e.g., Rand and Kann 1996;Bustamante et al. 2002; Smith and Eyre-Walker 2002;Bazin et al. 2006). Some of these methods have been devel-oped because counting of synonymous and nonsynonymousdifferences between species may underestimate the amountof substitution if the evolutionary time has been long andbecause, when there are multiple substitutions per codon,the numbers of synonymous and nonsynonymous substitu-tions depend on the pathway taken by evolution (Whittamand Nei 1991). In preliminary analyses, we found that theresults of all these methods are highly correlated. For exam-ple, we reconstructed the ancestral sequences of the set oforthologs for selected ingroup species by MP and estimateddS and dN between the outgroup species and the recon-structed ancestor of the ingroup species. In addition, weused the maximum likelihoodmethod to reconstruct internalbranches within the trees. The resulting values of these pre-liminary analyses were highly correlated with kS and kAcomputed as described above. Therefore, we used the latteras measures of between-species divergence because they in-volve fewer assumptions than methods dependent on ances-tral reconstruction, while taking into account both multiplehits and the probability of different evolutionary pathways(Yang and Nielsen 2000).
Because of homologous recombination, certain locimay have evolutionary histories that contrast markedly withthose of other genes in the genomes. We used a 2-prongedapproach to exclude these genes from our data set. First, weused a k-means clustering algorithm to identify genes withunusual patterns of dS in pairwise comparisons among in-group members (Hughes and Friedman 2004, 2005;Hughes and French 2007; Hughes and Langley 2007).Of 16,776 orthologs identified by homology search, 73(0.4%) showed highly unusual patterns and were excludedfrom further analyses. Second, we excluded all genes withpS . dSb (162 such genes or 1.0% of the total) and all geneswith pA . dNb (232 such genes or 1.4% of the total). Notethat the fact that such a small proportion of genes showedgreater within-species polymorphism than between-speciesdivergence provides further support for the conclusion thatthe outgroup species chosen constituted genuine outgroupsto the ingroup species.
We computed the following quantity:
NI5 ðpA=pSÞ=ðkA=kSÞ: ð1Þ
NI (Rand and Kann 1996) is greater than 1 when the ratio ofnonsynonymous to synonymous polymorphism exceeds
the ratio of nonsynonymous to synonymous divergence;this is the condition of the absence of positive selection in-creasing between-species divergence at nonsynonymoussites according to the assumptions of McDonald andKreitman (1991). By contrast, NI , 1 is taken to be indic-ative of such selection (McDonald and Kreitman 1991),although other interpretations are possible (Ohta 1993;Eyre-Walker 2002; Hughes et al. 2006; Hughes 2007). Inthe present analyses, we excluded genes for which NIwas undefined; 5,956 (35.5%) of orthologs identified by ho-mology searchwere excluded for this reason.NIwas definedfor relatively few genes when the available genomes fora given ingroup species were very closely related becausein those species, pS 5 0 in the case of many genes. Chla-mydophila pneumoniae and Y. pestis were the genomes thathad the highest numbers of genes excluded for this reason.
Codon Usage
Within each genome, we computed for each predictedprotein-coding gene 5 quantities summarizing codon usagein that gene. For a given gene, let nTC2f5 the number of 2-fold degenerate sites using T or C, nAG2f 5 the number of2-fold degenerate sites using A or G, and n4f5 the numberof 4-fold degenerate sites. Let nC2f5 the number of occur-rences of C at 2-fold degenerate sites; nG2f5 the number ofoccurrences of G at 2-fold degenerate sites; and nC4f, nG4f,and nA4f designate, respectively, the numbers of occurren-ces of C, G, and A at 4-fold degenerate sites. Then defineT2 5 nT2f/nTC2f, A2 5 nA2f/nAG2f, T4 5 nT4f/n4f,C4 5 nC4f/n4f, and A4 5 nA4f/n4f. Taken together, these5 codon usage variables (pC2f, pG2f, pC4f, pG4f, and pA4f)provide a measure of nucleotide usage, including both nu-cleotide content and content skewness, at almost all synon-ymous sites in the gene (excluding only the 3-folddegenerate sites in isoleucine codons and the very rareC/A synonymous mutations in the first positions of certainarginine codons). The advantage of this approach is that itdescribes codon usage in only 5 linearly independent var-iables that are not dependent on amino acid composition(Hughes and Langley 2007). Moreover, these 5 variablesare not subject to the stochastic errors due to small samplesize seen in variables measured on each amino acid or eachcodon.
In order to compare these 5 variables across species,we computed standard normal deviates for each of thesequantities within each species. We computed the standardnormal deviate for a given value by subtracting from thatvalue the mean for the species and dividing that differenceby the standard error for the species. In order to identifygenes with unusual codon usage for the species, we firstcomputed the absolute value of the standard normal devi-ates. Then we used principal components, extracted fromthe correlation matrix, to reduce dimensionality. The firstprincipal component (PC1) accounted for 35.1% of the var-iance in the correlation matrix, and PC1 was strongly pos-itively correlated with the absolute values of all 5 standardnormal deviates. We therefore used PC1 as an overall mea-sure of atypical codon usage patterns. In preliminary anal-yses, separate analyses of all 5 standard normal deviatesyielded similar results to those based on PC1 (data not
Polymorphism versus Divergence in Bacterial Genomes 2201

shown); for simplicity, we report below only the resultsbased on PC1.
Within-Species Polymorphism
For selected genomes, we compared the pattern of syn-onymous and nonsynonymous polymorphisms within indi-vidual genes. There were 3 species for which we hadsequences from4 ormore genomes and on a substantial num-berofgenesincludingbothsynonymousandnonsynonymouspolymorphicsites:B.pseudomallei (4genomes;1,710genes),S. aureus (9 genomes; 1,317 genes), and S. pyogenes (11genomes; 875 genes). For these genes, we computed thesingle-locus gene diversity (heterozygosity) independentlyfor each polymorphic site by the following formula:
1 �Xn
i5 1
x2i ; ð2Þ
where n is the number of alleles and xi is the population fre-quency of the ith allele (Nei 1987, p. 177). Single nucleotidepolymorphisms were classified either as synonymous or asnonsynonymous depending on their effect of the encoded nu-cleotidesequence;weexcludedambiguoussitesatwhichbothsynonymous and nonsynonymous variants occurred or atwhich the polymorphism could be considered synonymousor nonsynonymous depending on the pathway taken by evo-lution. There were 4,316 such ambiguous polymorphic sitesout of 177,038 total polymorphic sites (2.4%).
In order to examine the relative frequency of rare al-leles at synonymous and nonsynonymous sites, we com-pared the average number of nucleotide differences andthe number of segregating sites (Tajima 1989) separatelyfor synonymous and nonsynonymous sites (Rand and Kann1996; Hughes 2005; Hughes AL and Hughes MA 2007a,2007b). For each gene, we computed the difference Ks �S*s. Ks is the mean number of synonymous nucleotide dif-ferences for all pairwise comparisons among the n allelicsequences in the data set. If Ss is the number of synonymoussegregating sites, then
S � s5 Ss=a1: ð3Þ
The divisor in equation (3) is a factor providing an ad-justment for sample size (n) and is given by the following(Tajima 1989):
a1 5Xn� 1
i5 1
1=i: ð4Þ
Similarly, for each gene, we computed the differenceKn � S*n. Kn is the mean number of nonsynonymous nu-cleotide differences for all pairwise comparisons among then allelic sequences in the data set; and, if Sn is the number ofsegregating nonsynonymous sites
S � n5 Sn=a1: ð5ÞThe differences Ks � S*s and Kn � S*n constitute
the numerator of Tajima’s (1989) D statistic computedseparately for synonymous and nonsynonymous
polymorphisms, respectively. We then computed the ratioof this difference to the absolute value of the minimum pos-sible value of the difference, which would occur if all poly-morphisms were singletons (Schaeffer 2002). We designatethis ratio Qsyn in the case of synonymous polymorphismsand Qnon in the case of nonsynonymous polymorphisms.Comparing Qsyn and Qnon provides an index of the relativeabundance of rare alleles at synonymous and nonsynony-mous sites, with a strongly negative value indicating anabundance of rare alleles (Hughes AL and Hughes MA2007a, 2007b). Note that, unlike Tajima’s D, these ratiosare independent of sample size and thus can be comparedbetween data sets of different size.
Tajima’sDwas designed to provide a test of neutralitybut that test depends on the assumption of mutation-driftequilibrium (Tajima 1989; Nei and Kumar 2000). For ex-ample, a recent population bottleneck can yield a negativevalue of D in the absence of purifying selection. However,in the present analyses, we did not test for neutrality butmerely used Qsyn and Qnon as indices of the relative abun-dance of rare variants at synonymous and nonsynonymoussites, respectively. Note also that, because a bottleneckshould affect both synonymous and nonsynonymous poly-morphisms equally (Tajima 1989), a marked and consistentdifference between Qsyn and Qnon is likely to be due to se-lection on nonsynonymous sites.
In order to examine the relationships among NI, theaction of purifying selection, and the results of the MK tests(McDonald and Kreitman 1991), we constructed for eachgene in our data sets for B. pseudomallei, S. aureus, andS. pyogenes, a 2 � 2 contingency table including the fol-lowing quantities: Ss and Sn; the estimated number of syn-onymous differences between the ingroup and outgroupspecies and the estimated number of nonsynonymous dif-ferences between the ingroup and outgroup species. The lat-ter 2 quantities were estimated by the method of Yang andNielsen (2000) and rounded to the nearest integer. Note thatthis approximation is probably reasonably valid in the caseof these 3 species because in each of these species, the out-group was relatively close to the ingroup (see Results). Foreach contingency table, we conducted G-tests of indepen-dence using Williams’ correction (Sokal and Rohlf 1981).
Other Statistical Methods
In order to compare pS, pA, kS, and kA across species,we computed standard normal deviates for each of thesequantities within each species. We computed the standardnormal deviate for a given value by subtracting from thatvalue the mean for the species and dividing that differenceby the standard error for the species; we designate the stan-dard normal deviates as pSdev, pAdev, kSdev, and kAdev,respectively.
Because the variables analyzed were not normally dis-tributed, we used for hypothesis testing nonparametricmethods of statistical analysis, which make no assumptionsregarding the form of the underlying distribution(Hollander andWolfe 1973). However, in preliminary anal-yses, methods assuming a normal distribution generallyyielded essentially identical results.
2202 Hughes et al.

ResultsComparisons among Taxa
Table 1 summarizes means of synonymous (pS) andnonsynonymous (pA) nucleotide diversity for sets of orthol-ogous genes from 12 bacterial species, along with mean netsynonymous (kS) and nonsynonymous (kA) divergencefrom an outgroup species. The synonymous nucleotide di-versity within species ranged from less than 1% to over50% (in P. syringae; table 1). Likewise, available outgroupscovered a wide range of divergences. For example, C. fetuswas very distant from the 3 C. jejuni genomes analyzed,with mean kS estimated at nearly 3 substitutions per site(table 1). By contrast, Y. pseudotuberculosiswas very closeto the 5 Y. pestis genomes analyzed (mean kS 5 0.0186;table 1).
As predicted by Rocha et al. (2006), mean pA/pS forthe 12 taxa was negatively correlated with mean pS (rS 5�0.699; P 5 0.011; fig. 1A). Pseudomonas syringae pro-vided an influential point in this relationship, with thelowest mean pA/pS (0.0232) and by far the highest meanpS (0.5481; fig. 1A). Nonetheless, even when Pseudomonaswas excluded from the analysis, the negative relationshipbetween mean pA/pS and mean pS remained (rS 5�0.609; P 5 0.047). Besides Pseudomonas, the next low-est value of pA/pS was that seen in Campylobacter (0.0800;fig. 1A).
There was a highly significant difference among taxawith respect to the portion of genes with NI � 1(v2 5 1158.5; 11 degrees of freedom [df]; P , 0.001;fig. 1B). The proportion of orthologs with NI � 1 exceededthe proportion with NI , 1 in 4 of the 12 taxa, whereas inother 8 taxa, the proportion of orthologs with NI , 1exceeded the proportion with NI � 1 (fig. 1B). There were2 taxa in which the proportion of genes with NI � 1was strikingly low. In Campylobacter, there were only150 of 934 orthologs (16.1%) with NI � 1; and in Pseudo-monas, there were only 94 of 1,005 orthologs (9.4%) withNI � 1 (fig. 1B). In the remaining 10 taxa, the lowest pro-portion of orthologs with NI � 1 was 38.5% (363 of 942)in Neisseria (fig. 1A). Combining data for all taxa, therewere 4,551 (44.0%) of 10,353 orthologs with NI � 1
(fig. 1A). But when Campylobacter and Pseudomonas wereexcluded, 4,307 of the remaining 8,414 genes (51.2%) hadNI � 1 (fig. 1A).
If values of NI , 1 are due to positive selection lead-ing to amino acid sequence divergence between species, itwould be expected that species with NI , 1 would be spe-cies with unusually high kA values. As an initial test of this
Table 1Synonymous (pS) and Nonsynonymous (pA) Nucleotide Diversity within 12 Bacterial Species and Mean Net Numbers ofSynonymous Substitutions per Synonymous Site (kS) and of Nonsynonymous Substitutions per Nonsynonymous Site (kA)between Each Species and an Outgroup Species
Species OutgroupNo. ofGenes pS ± SE pA ± SE kS ± SE kA ± SE
Burkholderia pseudomallei Burkholderia thailandensis 1,711 0.01591 ± 0.00023 0.00104 ± 0.00003 0.3436 ± 0.0030 0.0180 ± 0.0003Campylobacter jejuni Campylobacter fetus 934 0.06937 ± 0.00177 0.00477 ± 0.00022 2.8491 ± 0.0295 0.3818 ± 0.0053Chlamydophila pneumoniae Chlamydophila felis 158 0.00232 ± 0.00011 0.00047 ± 0.00006 1.9790 ± 0.0527 0.2557 ± 0.0109Ehrlichia ruminantium Ehrlichia chaffeensis 633 0.02913 ± 0.00078 0.00252 ± 0.00016 1.9871 ± 0.0314 0.1364 ± 0.0026Helicobacter pylori Helicobacter acinonychis 1,130 0.11903 ± 0.00099 0.02118 ± 0.00049 0.1609 ± 0.0023 0.0336 ± 0.0009Neisseria meningitidis Neisseria gonorrhoeae 942 0.07336 ± 0.00193 0.00806 ± 0.00026 0.0843 ± 0.0022 0.0117 ± 0.0003Pseudomonas syringae Pseudomonas fluorescens 1,005 0.54810 ± 0.00883 0.01169 ± 0.00030 0.9906 ± 0.0160 0.0477 ± 0.0007Shigella flexneri Shigella sonnei 562 0.00295 ± 0.00011 0.00081 ± 0.00006 0.0380 ± 0.0014 0.0040 ± 0.0002Staphylococcus aureus Staphylococcus epidermidis 1,463 0.03415 ± 0.00094 0.00273 ± 0.00010 2.6932 ± 0.0267 0.1646 ± 0.0026Streptococcus pneumoniae Streptococcus sanguinis 819 0.02362 ± 0.00149 0.00307 ± 0.00019 1.6791 ± 0.0242 0.1793 ± 0.0040Streptococcus pyogenes Streptococcus agalactiae 931 0.02924 ± 0.00114 0.00407 ± 0.00019 2.1018 ± 0.0335 0.2014 ± 0.0040Yersinia pestis Yersinia pseudotuberculosis 65 0.00119 ± 0.00011 0.00051 ± 0.00014 0.0186 ± 0.0027 0.0033 ± 0.0006
NOTE.—SE, standard error.
FIG. 1.—(A) Plot of mean pA/pS versus mean pS for 12 bacterial taxa(rS 5 �0.699; P 5 0.011). Abbreviations for taxa: Burk (Burkholderia),Camp (Campylobacter), Chlam (Chlamydophila), Ehr (Ehrlichia), Helic(Helicobacter), Neis (Neisseria), Pseud (Pseudomonas), Shig (Shigella),Staph (Staphylococcus), Streppn (Streptococcus pneumoniae), Streppy(Streptococcus pyogenes), and Yers (Yersinia pestis). (B) Numbers ofgenes with NI , 1 and NI � 1. There was a significant difference amongtaxa with respect to the portion of genes with NI � 1 (v2 5 1158.5; 11df; P , 0.001).
Polymorphism versus Divergence in Bacterial Genomes 2203

prediction, we computed for each species, the number ofgenes falling in the top quartile (25%) of values of pA/pSacross all species, then we compared this value with thenumber of genes expected to be in the top quartile if thedistribution of pA/pS were uniform across species (i.e.,25% of the number of genes for the species; fig. 2A). Like-wise, we computed for each species, the number of genesfalling in the top quartile (25%) of values of kA/kS acrossall species, then we compared this value with the number ofgenes expected to be in the top quartile if the distributionof kA/kS was uniform across species (i.e., 25% of thenumber of genes for the species; fig. 2B).
Pseudomonas and Campylobacter had by far the low-est ratios of observed to expected gene numbers in the topquartile of pA/pS values (fig. 2A). In the case of Pseudomo-nas, only 4 of 1,005 genes (0.4%) were in the top quartile ofpA/pS values; and in Campylobacter, only 80 of 934 (8.6%)were in the top quartile of pA/pS values (fig. 2A). Burkhol-deria (52 of 1,711 or 3.1%) had the lowest proportion ofgenes in the top quartile of kA/kS values (fig. 2B). Pseudo-monas also had a very low proportion of genes (42 of 1,005or 4.2%) in the top quartile of kA/kS values (fig. 2B). Bycontrast, the 2 highest proportions of genes in the top quar-tile of kA/kS values were seen in Yersinia (31 of 65 or47.7%) and Campylobacter (405 of 934 or 43.4%; fig. 2B).
Thus, contrary to the usual interpretation of the NI sta-tistic, Pseudomonas, the taxon with the highest proportionsof genes with NI , 1 (fig. 1B), showed exceptionally fewgenes with high kA/kS values (fig. 2B). On the other hand,Pseudomonas also showed exceptionally few genes withhighpA/pSvalues (fig.2A).BecauseNI is a ratio, these resultssuggest that low NI values in the case of Pseudomonasweredue to low numerators rather than to high denominators.
Campylobacter, the taxon with the second highest pro-portions of genes with NI , 1 (fig. 1B), did show a highproportion of genes with high kA/kS values (fig. 2B).But, like Pseudomonas, Campylobacter also showed ex-ceptionally few genes with high of pA/pS values(fig. 2A). Thus, the factors contributing to values of NI , 1were not consistent between the 2 taxa with the highestproportions of such genes.
Codon Usage
Synonymous codon usage is one factor that might beexpected to influence the pattern of nucleotide substitution(Sharp 1991); but the method we used to estimate synon-ymous and nonsynonymous substitutions is designed totake into account differing patterns of synonymous codonusage (Yang and Nielsen 2000). Moreover, there was noobvious relationship between codon usage and the fre-quency of genes with NI , 1. Campylobacter jejuni hasan AT-rich genome, whereas P. syringae is GC-rich (sup-plementary table S2, Supplementary Material online).However, the species with lower frequencies of genes withNI , 1 included both very AT-rich species (e.g., E. rumi-nantium) and GC-rich species (e.g., B. pseudomallei; sup-plementary table S2, Supplementary Material online).
Rank Partial Correlations
In order to examine the factors influencing the value ofNI for individual genes, we used standard normal deviatesas ameasure of the deviation of pA, pS, kA, and kS for a givengene from the mean values for the species. We designatedthe standard normal deviates as pAdev, pSdev, kAdev, andkSdev, respectively. We used partial rank correlation to an-alyze the relationship between these variables and NI. Wealso tested for an independent effect of atypical patterns ofcodon usage, using the first PC1 extracted from the corre-lation matrix of absolute values of the standard normal de-viates of 5 variables describing nucleotide content atsynonymous sites (see Methods). We computed partial rankcorrelation coefficients between NI and each of 5 predictorvariables (pAdev, pSdev, kAdev, kSdev, and PC1) simulta-neously controlling in each case for the other 4 predictorvariables (table 2). Because certain ingroup species showedmuch higher kS values in comparison with the outgroupthan did others, we analyzed the taxa with close outgroups(Burkholderia, Helicobacter, Neisseria, Shigella, andYersinia; table 1) separately from the other taxa (table 2).However, the results were similar when all species wereconsidered together (data not shown).
Given that NI is a ratio of 2 ratios, it was unsurprisingthat there were significant positive partial rank correlation
FIG. 2.—Observed versus expected numbers of genes in the topquartile of values of (A) pA/pS and (B) kA/kS. Abbreviations for taxa are asin figure 1A.
2204 Hughes et al.

coefficients both between pAdev and NI and between kSdevand NI, a pattern seen both in genes from species with closeoutgroups and in genes from species with distant outgroups(table 2). Likewise, it was unsurprising that pSdev and kA-dev showed significant negative partial rank correlationswith NI both for genes from species with close outgroupsand for genes from species with distant outgroups (table 2).However, in the case of both close and distant outgroups,the strongest partial rank correlation between NI and any ofthe predictor variables was that with pAdev (table 2). In fact,whether positive or negative, all the other partial rank cor-relations differed significantly in absolute value from thatbetween NI and any of the predictor variables was that withpAdev (table 2). Thus, pAdev, rather than kAdev, was thestrongest predictor of NI, implying that low NI was primar-ily a consequence of unusually low within-species nonsy-nonymous nucleotide diversity rather than unusually highnonsynonymous between-species divergence. This result iscontrary to the expectation that a low value of NI is evi-dence of positive selection favoring between-species diver-gence at the amino acid level.
In the case of species with close outgroups, there wasnot a significant partial rank correlation between NI andPC1 (table 2). By contrast, when the outgroup was distant,there was a highly significant negative partial rank correla-tion between NI and PC1. Thus, in these species, NI tendedto be decreased when codon usage was unusual, indepen-dently of the estimates of nucleotide sequence polymor-phism and divergence. It seems plausible that this resultmay have occurred because of the difficulty of estimatingkS in the case of distant outgroups, where synonymous sitesapproached saturation (table 1), which may be especiallyproblematic when codon usage is highly unusual.
We tested this interpretation by computing rank partialcorrelations between PC1 and kSdev, simultaneously con-trolling for NI, pAdev, pSdev, and kAdev. In the case of spe-cies with close outgroups, the partial rank correlationbetween PC1 and kSdev was�0.034 (P 5 0.025), whereasin the case of species with distant outgroups, the partial rankcorrelation between PC1 and kSdev was �0.143(P, 0.001). The difference between these 2 correlation co-efficients was highly significant (P , 0.001). Thus, un-
usual nucleotide content tended to cause a reduction inthe estimate of kS, and this effect was much more pro-nounced when the outgroup was distant.
Within-Species Polymorphism
For genes of B. pseudomallei, S. aureus, and S. pyo-genes, we computed mean gene diversity separately forsynonymous and nonsynonymous polymorphic sites(table 3). In each species, the median of the gene diversityvalues at synonymous siteswas significantly greater than thatat nonsynonymous sites (sign test; P , 0.001 in each case;table 3). The fact that gene diversities at nonsynonymouspolymorphic sites tended to be lower than those at synony-mous polymorphic sites in the same genes was evidence thatnonsynonymous variants in these species include many thatare subject to ongoing purifying selection. Additional evi-dence in support of this interpretation was provided by com-parisons of Qsyn and Qnon (table 3). In all 3 species, medianQnon was significantly lower than median Qsyn (sign test;P, 0.001 in each case; table 3). In all 3 species,medianQnon
was strongly negative (table 3).MedianQsyn was negative inBurkholderia and in Staphylococcus, although less negativethanQnon, whereas in S. pyogenes, medianQsyn was actuallyslightly positive (table 3). Thus, in all 3 species, nonsynon-ymous polymorphic sites showed a greater bias toward rarepolymorphisms than did synonymous sites, implying thepresence of stronger ongoing purifying selection on the for-mer than on the latter.
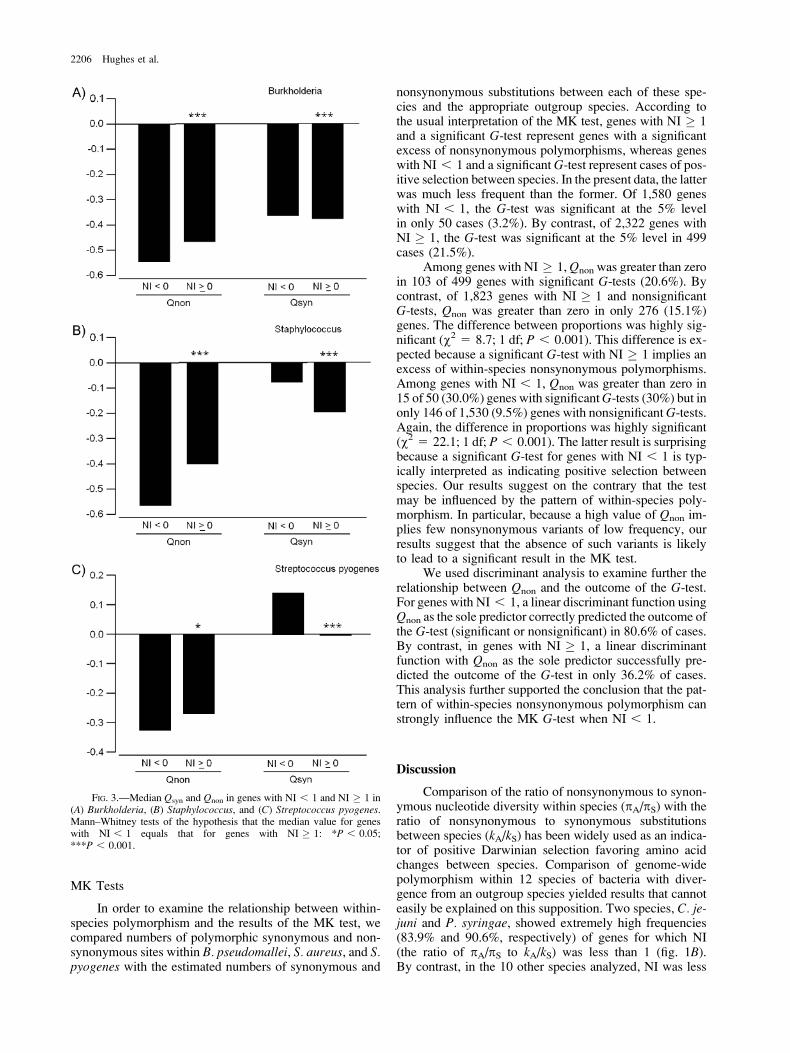
In order to examine the relationship between the valueof NI and purifying selection on nonsynonymous polymor-phic variants, we compared Qsyn and Qnon between geneswith NI , 1 and genes with NI � 1 separately for the 3species. In each species, median Qnon values differed sig-nificantly between these 2 categories of genes (fig. 3). Forall 3 species, median Qnon was lower in genes with NI , 1than in genes with NI � 1. Median Qsyn also differed sig-nificantly between the 2 categories of genes in all 3 species(fig. 3). However, in the case of Qsyn, median values forgenes with NI , 1 were consistently higher than thosefor genes with NI � 1 (fig. 3). Thus, genes with NI , 1were characterized by an excess of rare nonsynonymousvariants but not of synonymous variants.
Table 2Partial Rank Correlation Coefficients between 5 PredictorVariables and NI, Computed Separately for Genes fromSpecies with Close Outgroups and Species with DistantOutgroupsa
Predictor VariableClose Outgroup(N 5 4,410)
Distant Outgroup(N 5 5,943)
pAdev 0.747b 0.684b
pSdev 0.340b,c �0.523b,c
kAdev �0.412b,c �0.422b,c
kSdev 0.305b,c 0.400b,c
PC1 �0.020c �0.102b,c
a Each value is a fourth-order partial rank correlation between the predictor
variable and NI simultaneously controlling for the other 4 predictor variables.b Tests of the hypothesis that a given partial rank correlation coefficient equals
zero: P , 0.001.c Tests of the hypothesis that a given partial rank correlation coefficient equals
that between pAdev and NI: P , 0.001.
Table 3Median Gene Diversity at Polymorphic Nonsynonymous andSynonymous Sites and Median Qnon and Qsyn in 3 BacterialSpecies
Species(no. of genes)
Gene DiversityQnon Qsyn
Nonsynonymous Synonymous
Burkholderiapseudomallei (1,710) 0.375 0.377a �0.501 �0.368b
Staphylococcusaureus (1,317) 0.272 0.294a �0.438 �0.145b
Streptococcuspyogenes (875) 0.254 0.299a �0.289 0.039b
a Tests of the hypothesis that median gene diversity at nonsynonymous sites
equals median gene diversity at synonymous sites: P , 0.001 (sign test).b Tests of the hypothesis that median Qnon equals median Qsyn: P , 0.001
(sign test).
Polymorphism versus Divergence in Bacterial Genomes 2205
MK Tests
In order to examine the relationship between within-species polymorphism and the results of the MK test, wecompared numbers of polymorphic synonymous and non-synonymous sites within B. pseudomallei, S. aureus, and S.pyogenes with the estimated numbers of synonymous and
nonsynonymous substitutions between each of these spe-cies and the appropriate outgroup species. According tothe usual interpretation of the MK test, genes with NI � 1and a significant G-test represent genes with a significantexcess of nonsynonymous polymorphisms, whereas geneswith NI , 1 and a significant G-test represent cases of pos-itive selection between species. In the present data, the latterwas much less frequent than the former. Of 1,580 geneswith NI , 1, the G-test was significant at the 5% levelin only 50 cases (3.2%). By contrast, of 2,322 genes withNI � 1, the G-test was significant at the 5% level in 499cases (21.5%).
Among genes with NI � 1,Qnon was greater than zeroin 103 of 499 genes with significant G-tests (20.6%). Bycontrast, of 1,823 genes with NI � 1 and nonsignificantG-tests, Qnon was greater than zero in only 276 (15.1%)genes. The difference between proportions was highly sig-nificant (v2 5 8.7; 1 df; P , 0.001). This difference is ex-pected because a significant G-test with NI � 1 implies anexcess of within-species nonsynonymous polymorphisms.Among genes with NI , 1, Qnon was greater than zero in15 of 50 (30.0%) genes with significantG-tests (30%) but inonly 146 of 1,530 (9.5%) genes with nonsignificantG-tests.Again, the difference in proportions was highly significant(v2 5 22.1; 1 df; P , 0.001). The latter result is surprisingbecause a significant G-test for genes with NI , 1 is typ-ically interpreted as indicating positive selection betweenspecies. Our results suggest on the contrary that the testmay be influenced by the pattern of within-species poly-morphism. In particular, because a high value of Qnon im-plies few nonsynonymous variants of low frequency, ourresults suggest that the absence of such variants is likelyto lead to a significant result in the MK test.
We used discriminant analysis to examine further therelationship between Qnon and the outcome of the G-test.For genes with NI , 1, a linear discriminant function usingQnon as the sole predictor correctly predicted the outcome ofthe G-test (significant or nonsignificant) in 80.6% of cases.By contrast, in genes with NI � 1, a linear discriminantfunction with Qnon as the sole predictor successfully pre-dicted the outcome of the G-test in only 36.2% of cases.This analysis further supported the conclusion that the pat-tern of within-species nonsynonymous polymorphism canstrongly influence the MK G-test when NI , 1.
Discussion
Comparison of the ratio of nonsynonymous to synon-ymous nucleotide diversity within species (pA/pS) with theratio of nonsynonymous to synonymous substitutionsbetween species (kA/kS) has been widely used as an indica-tor of positive Darwinian selection favoring amino acidchanges between species. Comparison of genome-widepolymorphism within 12 species of bacteria with diver-gence from an outgroup species yielded results that cannoteasily be explained on this supposition. Two species, C. je-juni and P. syringae, showed extremely high frequencies(83.9% and 90.6%, respectively) of genes for which NI(the ratio of pA/pS to kA/kS) was less than 1 (fig. 1B).By contrast, in the 10 other species analyzed, NI was less
FIG. 3.—Median Qsyn and Qnon in genes with NI , 1 and NI � 1 in(A) Burkholderia, (B) Staphylococcus, and (C) Streptococcus pyogenes.Mann–Whitney tests of the hypothesis that the median value for geneswith NI , 1 equals that for genes with NI � 1: *P , 0.05;***P , 0.001.
2206 Hughes et al.

than 1 in only about 48% of genes. According to the usualinterpretation of NI, these results might be taken to indicatean extraordinarily high frequency of between-species pos-itive selection in Campylobacter and Pseudomonas, butthere is no obvious reason to expect that these 2 taxa aresubject to unusually strong positive selection.
As an alternative to the hypothesis of positive selec-tion, it might be proposed that the differences among taxaare artifacts of the estimation of synonymous and nonsy-nonymous substitutions. For example, it might be sug-gested that factors such as an unusual pattern of codonusage or a high rate of synonymous substitution have biasedthe estimates of synonymous and nonsynonymous substi-tutions in certain taxa. However, the method used hereto estimate the numbers of synonymous and nonsynony-mous substitutions per site is designed to take into accountfactors such as nucleotide usage and mutational bias andappears to be robust even when the rate of synonymous sub-stitution is high (Yang and Nielsen 2000). In the presentdata, the level of synonymous substitution between ingroupand outgroup species was high inCampylobacter and Pseu-domonas but not unusually so in comparison to the otherspecies analyzed (table 1). Moreover, Campylobacterand Pseudomonas did not share any atypical patterns ofcodon usage that set them apart from the other speciesanalyzed.
On the other hand, our results showed that Campylo-bacter and Pseudomonas shared a high proportion of geneswith an unusually low pA/pS (fig. 2A). Moreover, Pseudo-monas had by far the lowest overall mean pA/pS of the 12taxa analyzed (fig. 1A). Thus, contrary to the usual interpre-tation of NI , 1 as evidence of positive selection favoringamino acid sequence divergence between species, our re-sults suggested that in our data this statistic mainly reflecteda low pA/pS within species rather than a high kA/kS.
This interpretation was strongly supported by partialcorrelation analyses showing that an unusually low valueof pA was a significantly better predictor of a low NI thanwas an unusually high kA (table 2). The same pattern wasseen both in species with close outgroups and in specieswith distant outgroups. Thus, it seemed unlikely that prob-lems in estimating kS when synonymous sites were nearsaturation had a major impact on NI. The fact that, inthe case of distantly related outgroups, there was a signifi-cant negative correlation between NI and a measure of un-usual codon usage suggested that there may have beensome problems with estimating kS between distantly relatedspecies, particularly in the case of genes with unusual pat-terns of codon usage. But this effect was quite minor incomparison with the strong positive relationship betweenpA and NI.
Factors that might cause relatively low pA in a givengene include the effects of purifying selection acting toeliminate or reduce in frequency slightly deleterious non-synonymous variants. In order to examine purifying selec-tion further, we analyzed synonymous and nonsynonymouspolymorphisms in 3 species (B. pseudomallei, S. aureus,and S. pyogenes) for which we had sequences of at least3 genomes with numerous polymorphic sites. All these spe-cies had a majority of genes with NI � 1 but a substantialnumber with NI , 1 (fig. 1B). All 3 of these genomes
showed an excess of rare nonsynonymous polymorphisms,indicative of ongoing purifying selection acting toeliminate slightly deleterious variants (Hughes et al.2003; Hughes AL and Hughes MA 2007a, 2007b; Hughesand Piontkivska 2008; Irausquin and Hughes 2008). More-over, the tendency toward rare nonsynonymous variantswas strongest in genes with NI , 1.
Across the 12 taxa in our data set, there was a negativecorrelation between mean pA/pS and mean pS (fig. 1A).Taking pS as a proxy for average time since the commonancestor of a set of sequences, these results are consistentwith those of Rocha et al. (2006) and support those authors’hypothesis that this effect is due to a time lag in the removalof slightly deleterious nonsynonymous variants by purify-ing selection. In our data set, Pseudomonas showed byfar the highest mean pS, the lowest mean pA/pS, and thehighest proportion of genes with NI , 1.
Our results thus imply that the major factor in causingNI , 1 was not positive selection between species but ef-fective purifying selection within species, lowering pA/pSand thus lowering NI. Moreover, certain results suggestedthat the MK test (G-test) is sensitive to the effectiveness ofpurifying selection acting to eliminate slightly deleteriousnonsynonymous variants within populations. In the usualinterpretation of the MK test, genes with NI , 1 and a sig-nificant G-test are considered to be subject to positive se-lection causing the fixation of nonsynonymous differencesbetween species. However, we found an association ingenes with NI , 1 between a significant G-test and a pos-itive Qnon. Because a strongly negative Qnon characterizesa gene containing numerous nonsynonymous variants oflow frequency, this result implies that the G-test is morelikely to be significant when such low-frequency nonsy-nonymous variants are lacking. The absence of rare nonsy-nonymous polymorphisms evidently causes the level ofnonsynonymous between-species divergence to be rela-tively large. Because rare nonsynonymous variants are of-ten slightly deleterious (Hughes et al. 2003), their absencereflects the action of purifying selection. An ironic aspect oftheMK test and related statistics thus appears to be that theymistakenly identify as positively selected between speciesthe very genes that are most stringently negatively selectedwithin species.
These considerations can explain, without resorting tothe hypothesis of positive selection, the finding of lower NIin the mitochondrial genomes of invertebrates than of ver-tebrates (Bazin et al. 2006). On the assumption that inver-tebrates tend to have larger effective population sizes thanvertebrates, this result is easily explained if low NI is gen-erally due to purifying selection within a species reducingpA/pS because a species with a larger effective populationsize will in general be more efficient in eliminating slightlydeleterious variants. The same reasoning may also explainthe detection of more ‘‘adaptive evolution’’ by the MK testin regions of the Drosophila genome with normal recom-bination than in those with low recombination (Shapiroet al. 2007) because purifying selection is expected to bemore effective in removing deleterious variants in theformer regions than in the latter.
There are additional factors affecting NI that could notbe addressed easily by our analyses. One such factor might
Polymorphism versus Divergence in Bacterial Genomes 2207

be the fixation, during a population bottleneck, of slightlydeleterious nonsynonymous variants, thereby increasing kA(Ohta 1993; Eyre-Walker 2002; Hughes et al. 2006;Hughes 2007). On the other hand, it is possible that giventhe presumably very large effective population sizes of thegeographically widespread bacterial species analyzed herethat no extreme bottleneck occurred in speciation. And ofcourse, it is possible that certain nonsynonymous substitu-tions between species in our data set were indeed fixed bypositive selection (Charlesworth and Eyre-Walker 2006).Indeed, if fixation of slightly deleterious mutations isa widespread phenomenon, one might expect it to be ac-companied by a certain degree of positive selection favor-ing ‘‘compensatory mutations’’ that ameliorate the effect ofdeleterious alleles (Charlesworth and Eyre-Walker 2007;Sawyer et al. 2007).
Nonetheless, our results suggest that fixation of non-synonymous substitutions between species—whether bydrift or by positive selection—has a minor impact on theMK test and related methods. Rather, the strongest effectis that of ongoing purifying selection on within-speciesnonsynonymous polymorphism. Thus, our results suggestcaution regarding the use of the MK test and related meth-ods in testing for positive selection. Moreover, our resultsprovide support for the nearly neutral theory of Ohta (1973)and its prediction that slightly deleterious variants playa significant role in evolution.
Supplementary Material
Supplementary tables S1 and S2 are available atMolecular Biology and Evolution online (http://www.mbe.oxfordjournals.org/).
Acknowledgments
This research was supported by grant GM43940 fromthe National Institutes of Health to A.L.H.
Literature Cited
Altschul SF, Madden TL, Schaffer AA, Zhang J, Zhang Z,Miller W, Lipman DJ. 1997. Gapped BLAST and PSI-BLAST: A new generation of protein database searchprograms. Nucleic Acids Res. 25:3389–3402.
Bazin E, Glemin S, Galtier N. 2006. Population size does notinfluence mitochondrial genetic diversity in animals. Science.312:570–572.
Bustamante CD, Nielsen R, Sawyer SA, Olsen KM,Purugganan MD, Hartl DL. 2002. The cost of inbreeding inArabidopsis. Nature. 416:531–534.
Charlesworth J, Eyre-Walker A. 2006. The rate of adaptiveevolution in enteric bacteria. Mol Biol Evol. 23:1348–1356.
Charlesworth J, Eyre-Walker A. 2007. The other side of thenearly neutral theory, evidence of slightly advantageous back-mutations. Proc Natl Acad Sci USA. 104:16992–16997.
Cohan FM. 2002. What are bacterial species? Annu RevMicrobiol. 56:457–487.
Eyre-Walker A. 2002. Changing effective population size and theMcDonald-Kreitman test. Genetics. 162:2017–2024.
Feil EJ, Holmes EC, Bessen DE, et al. (12 co-authors). 2001.Recombination within natural populations of pathogenic
bacteria: Short-term empirical estimates and long-termphylogenetic consequences. Proc Natl Acad Sci USA.98:182–187.
Fraser C, Hanage WP, Spratt BG. 2007. Recombination and thenature of bacterial speciation. Science. 315:476–480.
Hollander M, Wolfe DA. 1973. Nonparametric statisticalmethods. New York: Wiley.
Hughes AL. 2005. Evidence for abundant slightly deleteriouspolymorphisms in bacterial populations. Genetics. 169:533–538.
Hughes AL. 2007. Looking for Darwin in all the wrong places:The misguided quest for positive selection at the nucleotidesequence level. Heredity. 99:364–373.
Hughes AL, French JO. 2007. Homologous recombination andthe pattern of nucleotide substitution in Ehrlichia ruminan-tium. Gene. 387:31–37.
Hughes AL, Friedman R. 2004. Patterns of sequence divergencein 5# intergenic spacers and linked coding regions in 10species of pathogenic Bacteria reveal distinct recombinationalhistories. Genetics. 168:1795–1803.
Hughes AL, Friedman R. 2005. Nucleotide substitution andrecombination at orthologous loci in Staphylococcus aureus. JBacteriol. 187:2698–2704.
Hughes AL, Friedman R, Glenn NL. 2006. The future of dataanalysis in evolutionary genomics. Curr Genomics.7:227–234.
Hughes AL, Hughes MA. 2007a. More effective purifyingselection on RNA viruses than in DNA viruses. Gene.404:117–125.
Hughes AL, Hughes MA. 2007b. Coding sequence polymor-phism in avian mitochondrial genomes reflects populationhistories. Mol Ecol. 16:1369–1376.
Hughes AL, Langley KL. 2007. Nucleotide usage, synony-mous substitution pattern, and past recombination ingenomes of Streptococcus pyogenes. Infect Genet Evol.7:188–196.
Hughes AL, Piontkivska H. 2008. Nucleotide sequence poly-morphism in circoviruses. Infect Genet Evol. 8:130–138.
Hughes AL, Packer B, Welsch R, Bergen AW, Chanock SJ,Yeager M. 2003. Widespread purifying selection at poly-morphic sites in human protein-coding loci. Proc Natl AcadSci USA. 100:15754–15757.
Irausquin SJ, Hughes AL. 2008. Distinctive pattern of sequencepolymorphism in the NS3 protein of hepatitis C virus type 1breflects conflicting evolutionary pressures. J Gen Virol.89:1921–1929.
Jones DT, Taylor WR, Thornton JM. 1992. The rapid generationof mutation data matrices from protein sequences. ComputAppl Biosci. 8:275–282.
Kumar S, Tamura K, Nei M. 2004. MEGA3: Integrated softwarefor molecular evolutionary genetics analysis and sequencealignment. Brief Bioinform. 5:150–163.
Lynch M. 2007. The origins of genome architecture. Sunderland(MA): Sinauer.
Lynch M, Conery S. 2003. The origins of genome complexity.Science. 302:1401–1404.
Lynch M, Burger R, Butcher D, Gabriel W. 1993. The mutationalmeltdown in asexual populations. J Hered. 84:339–344.
Majewski J. 2001. Sexual isolation in bacteria. FEMS MicrobiolLett. 199:161–169.
McDonald JH, Kreitman M. 1991. Adaptive protein evolution atthe Adh locus in Drosophila. Nature. 351:114–116.
Nei M. 1987. Molecular evolutionary genetics. New York:Columbia University Press.
Nei M, Jin L. 1989. Variances of the average numbers ofnucleotide substitutions within and between populations. MolBiol Evol. 6:290–300.
2208 Hughes et al.

Nei M, Kumar S. 2000. Molecular evolution and phylogenetics.New York: Oxford University Press.
Ohta T. 1973. Slightly deleterious mutant substitutions inevolution. Nature. 246:96–98.
Ohta T. 1993. Amino acid substitution at the Adh locus ofDrosophila is facilitated by small population size. Proc NatlAcad Sci USA. 90:4548–4551.
Rand DM, Kann LM. 1996. Excess amino acid polymorphism inmitochondrial DNA: Contrasts among genes from Drosophila,mice, and humans. Mol Biol Evol. 13:735–748.
Rocha EP, Maynard Smith J, Hurst LD, Holden MT, Cooper JE,Smith NH, Feil EJ. 2006. Comparisons of dN/dS are timedependent for closely related bacterial genomes. J Theor Biol.239:226–235.
Saitou N, Nei M. 1987. The neighbor-joining method: A newmethod for reconstructing phylogenetic trees. Mol Biol Evol.4:406–425.
Sawyer SA, Parsch J, Zhang Z, Hart DL. 2007. Prevalence ofpositive selection among nearly neutral amino acid replace-ments in Drosophila. ProcNatl Acad Sci USA. 104:6504–6510.
Schaeffer SW. 2002. Molecular population genetics of sequencelength diversity in the Adh region of Drosophila pseudoobs-cura. Genet Res. 80:163–175.
Schmidt HA, Strimmer K, Vingron M, von Haeseler A. 2002.TREE-PUZZLE: maximum likelihood phylogenetic analysisusing quartets and parallel computing. Bioinformatics.18:502–504.
Shapiro J, Huang W, Zhang C, et al. (12 co-authors). 2007.Adaptive genic evolution in Drosophila genomes. Proc NatlAcad Sci USA. 104:2271–2276.
Sharp PM. 1991. Determinants of DNA sequence divergencebetween Escherichia coli and Salmonella typhimurium: codonusage, map position, and concerted evolution. J Mol Evol.33:23–33.
Smith NG, Eyre-Walker A. 2002. Adaptive evolution inDrosophila. Nature. 415:1022–1024.
Sokal RR, Rohlf FJ. 1981. Biometry, 2nd ed. New York: W.H.Freeman.
Swofford DL. 2002. PAUP*: Phylogenetic analysis usingparsimony (*and other methods). Sunderland (MA): Sinauer.
Tajima F. 1989. Statistical method for testing the neutral mutationhypothesis by DNA polymorphism. Genetics. 123:585–595.
Thompson JD, Higgins DG, Gibson TJ. 1994. CLUSTAL W:Improvement of the sensitivity of progressive multiplesequence alignment through sequence weighting, position-specific gap penalties, and weight matrix choice. NucleicAcids Res. 22:4673–4680.
Vulic M, Dionisio F, Taddei F, Radman M. 1997. Molecularkeys to speciation: dNA polymorphism and the control ofgenetic exchange in enterobacteria. Proc Natl Acad Sci USA.94:9763–9767.
Whittam TS, Nei M. 1991. Neutral mutation hypothesis test.Nature. 354:115–116.
Yang Z, Nielsen R. 2000. Estimating synonymous and non-synonymous substitution rates under realistic evolutionarymodels. Mol Biol Evol. 17:32–43.
Dan Graur, Associate Editor
Accepted July 24, 2008
Polymorphism versus Divergence in Bacterial Genomes 2209
Copyright © 2022 FDOKUMEN