Histopathology of epi-LASIK in eyes with virgin corneas and eyes with previously altered corneas
Upload
independentCategory
view
2download
0
Microarray Analysis of Gene Expression Patternsduring Healing of Rat Corneas after Excimer LaserPhotorefractive Keratectomy
Juan C. Varela,1 Michael H. Goldstein,1 Henry V. Baker,2,3 and Gregory S. Schultz1
PURPOSE. To characterize changes over time in the genomicexpression profile of rat corneas after excimer laser photore-fractive keratectomy (PRK), in an effort to better understandthe cellular response to injury and the dynamic changes thatoccur in gene expression patterns as a wound heals.
METHODS. The corneal gene expression profile of 1176 genes at3 and 7 days after PRK was determined and compared withuntreated corneal gene expression patterns by interrogatingcommercially available cDNA arrays with labeled target cDNAprepared from pooled total RNA harvested from the respectivetreatment group of adult male rats. The gene expression pat-terns were inferred based on the hybridization intensities ofthe probes on the cDNA arrays. The hybridization signals wereglobally normalized and filtered. The data were analyzed byusing hierarchical and k-means clustering algorithms beforeand after normalization of variances.
RESULTS. Of the 1176 cDNA elements on the array, 588 consis-tently produced similar results in replicate experiments andcomprised the data set analyzed in this work. In total, 73 geneswere identified, with expression levels that differed by at leastthreefold at either 3 or 7 days after PRK. At 3 days after PRK,70 genes were identified with expression levels that differed bymore than threefold, compared with the expression level inuntreated animals. The expression of 42 genes increased bythreefold or more, whereas expression of 28 genes decreasedby threefold or more. By day 7 after PRK, the number of genesdisplaying more than a threefold difference in expression pat-tern was reduced to 27 genes, 20 of which showed elevatedlevels, whereas 7 exhibited decreased levels. Hierarchical clus-tering of the 588 studied genes produced 10 clusters withcorrelation coefficients of 0.9 or greater. To determinewhether any of the clusters were overrepresented by geneswith related functions, the cumulative hypergeometric proba-bility was calculated by obtaining the observed number offunctionally related genes within each of the 10 clusters. Sevenof the clusters were statistically overrepresented by one ormore categories of functionally related genes, such as cell cycleregulators, transcription factors, and metabolic pathway genes.Clustering analysis of 56 genes generally considered to influ-
ence corneal wound healing produced 10 gene clusters withcorrelation coefficients of at least 0.9. Expression of 23 of these56 genes increased at day 3, then decreased at day 7 to levelssimilar to those on day 0. These included several growthfactors (VEGF, FGF, IGF-I), proteases (PAI-1, PAI-2A) and pro-tease inhibitors (TIMP-2 and TIMP-3). Expression of nine genesincreased on both days 3 and 7 compared with expression onday 0 (e.g., TGFB1, TGFBIIR, M6P/IGFR-2), and no genesdecreased on both days 3 and 7, compared with day 0.
CONCLUSIONS. Microarray analysis of 1176 identified 588 geneswith reproducible patterns of expression in rat corneas on days3 and 7 after PRK and 73 genes with a threefold change inexpression compared with untreated corneas. Hierarchicalclustering of these 588 genes identified 10 clusters of geneswith very similar patterns of expression. Clustering of geneswith similar patterns of expression implies a common regula-tory pathway for the genes within a cluster, and identifiespotential new targets for regulating corneal wound healing.(Invest Ophthalmol Vis Sci. 2002;43:1772–1782)
Corneal wound healing is a complex biological process thatinvolves the integrated actions of many genes that code
for proteins with diverse functions, such as cytokines, growthfactors, receptors, extracellular matrix proteins, integrins, pro-teases, inhibitors and cell cycle genes.1,2 When expression ofthese genes is regulated correctly, corneal wounds heal appro-priately. However, when intrinsic or extrinsic factors disruptthe expression of these genes, corneal wounds may either failto heal adequately or may heal with excessive scar formation.Thus, there is a need to understand, as broadly as possible, howthe expression of key genes changes during corneal woundhealing so that therapies can be logically designed to preventcomplications from occurring.
Previous studies investigating gene expression during cor-neal wound healing have analyzed mRNA levels of a smallnumber of selected growth factors, receptors, and extracellularmatrix genes that are thought to regulate or participate incorneal wound healing. For example, quantitative reverse tran-scription–polymerase chain reaction (Q-RT-PCR) of rat corneasafter photorefractive keratectomy (PRK) showed prolongedelevation of mRNAs for the three isoforms of transforminggrowth factor-� (TGF�1, TGF�2, TGF�3), the TGF� type IIreceptor (TGF�R-II), and extracellular matrix proteins (types I,III, and VI collagen and fibronectin).3 Similar results werereported for mRNA levels for collagens I, III, IV, and V usingsemiquantitative RT-PCR in rat corneas after PRK.4 Analysis ofmRNA levels for hepatocyte growth factor (HGF), keratinocytegrowth factor (KGF), epidermal growth factor (EGF) and theirreceptors in mouse corneas after an epithelial scrape injurysuggests that HGF and KGF also play important roles in regu-lating epithelial wound healing.5
Other groups have investigated changes in protein levels incorneas during wound healing. Immunohistochemical analysisof cat corneas after PRK indicated there were increased levelsof TGF�1, TGF�2, and TGF�3 and the TGF�R-I and TGF�R-IIreceptor proteins in the subepithelial tissue of laser-ablated
From the 1Institute for Wound Research and Department of Oph-thalmology, University of Florida, Gainesville, Florida; 2Department ofMolecular Genetics and Microbiology, University of Florida, Gaines-ville, Florida; and 3University of Florida Genetics Institute, Gainesville,Florida.
Supported in part by National Institutes of Health Grant EY05587and Research to Prevent Blindness.
Submitted for publication June 25, 2001; revised February 7, 2002;accepted February 15, 2002.
Commercial relationships policy: N.The publication costs of this article were defrayed in part by page
charge payment. This article must therefore be marked “advertise-ment” in accordance with 18 U.S.C. §1734 solely to indicate this fact.
Corresponding author: Gregory S. Schultz, Institute for WoundResearch and Department of ObGyn, 1600 SW Archer Road, Universityof Florida, Gainesville, FL 32610-0294; [email protected].
Investigative Ophthalmology & Visual Science, June 2002, Vol. 43, No. 61772 Copyright © Association for Research in Vision and Ophthalmology
regions at 4 weeks after injury.6 Immunofluorescence stainingof monkey corneas showed distinct changes in the amount andlocalization of fibronectin, type III collagen, type VII collagen,and keratin sulfate in ablated regions at different times duringthe 18 months after excimer laser ablation.7 Analyses of matrixmetalloproteinases (MMPs) and the tissue inhibitors of metal-loproteinases (TIMPs) in rat and rabbit corneas after PRK foundincreased levels of TIMP-2 and MMP-9, -7, and -13 proteins andmRNAs in migrating basal epithelial cells.8–12 Immunofluores-cence analysis of radial keratotomy (RK) wounds in humancorneas detected several extracellular matrix proteins thatwere not present in the stroma of normal corneas, includingcollagen types III, VIII, and XIV; the �1-�2 chains of type IVcollagen; tenascin-C; and fibrillin-1.13 Immunohistochemicalanalysis of rat corneas after PRK ablation showed that macro-phages moved into injured area within 36 hours after injury.14
These studies have provided important information aboutthe expression of a few selected genes during healing of cor-neal wounds. However, the ability to simultaneously measurechanges in expression of large numbers of genes during cor-neal wound healing is severely limited by conventional tech-niques of immunohistochemistry, enzyme analysis, Northernblot analysis, RNase protection assays, or Q-RT-PCR. In thisstudy, we simultaneously analyzed expression of 588 genes inrat corneas on day 0 (nonablated), days 3 and 7 after excimerablation, using membrane microarray technology. The expres-sion patterns of these 588 genes were analyzed to identifygenes with similar patterns of expression. In addition, thelevels of expression of a selected subset of 56 genes thought toinfluence corneal wound healing were examined in greaterdetail.
MATERIALS AND METHODS
Animal Models
Animal procedures were performed in accordance with the ARVOStatement for the Use of Animals in Ophthalmic and Vision Research,and the animal protocol was approved by the University of FloridaAnimal Care and Use Committee. Rat corneas underwent excimer laserablation as described previously.15 Briefly, a total of 30 adult Sprague-Dawley male rats (250 g) with normal eyes were anesthetized with anintraperitoneal injection of pentobarbital sodium (30 mg/kg). Eye-lashes and whiskers surrounding the eye were removed from the visualfield. A drop of proparacaine (0.05%) was applied to the eye, and thecornea was centered under the laser microscope. Bilateral ablation ofthe corneas was performed in a 4.4-mm treatment zone with anexcimer laser (SVS Apex; Summit Technology, Waltham, MA). Thecorneal epithelium was ablated to a depth of 40 �m, followed byablation of the stroma to a depth of 20 �m, for a total ablation depthof 60 �m. After excimer laser treatment, tobramycin (0.3%) drops wereapplied to the corneal surface to prevent infection. No postoperativetopical steroid was administered. On days 3 and 7 after excimer laserablation, 15 rats were randomly selected and killed by peritonealinjection of pentobarbital. Corneas were excised under an operatingmicroscope and placed in solution (RNAlater; Ambion, Austin, TX), tostabilize the mRNA. Once harvested, the corneas were stored at 4°Cnot longer than 24 hours before RNA extraction. Thirty corneas wereharvested at each time point. For each time point three pools of 10corneas each were prepared, and total RNA was extracted, as de-scribed in the next section. An additional 30 untreated normal corneaswere harvested, separated into three pools, and processed as de-scribed. Thus, nine RNA samples were generated comprising threeindependent preparations for each of the three experimental groups(nonablated corneas designated as day 0 and days 3 and 7 after abla-tion).
RNA Isolation from Rat Corneas
Total RNA was extracted from each group of 10 pooled corneas usingguanidine isothiocyanate and phenol-chloroform according to standardmethods. Briefly, pooled corneal tissue was homogenized in 0.75 mLRNA extraction solution (TRIzol; Gibco, Grand Island, NY) using a5-mL frosted glass-on-glass tissue grinder (Duall; Konte Scientific Glass-ware, Vineland, NJ), RNA was extracted with chloroform, precipitatedwith isopropanol, washed with ethanol, and dissolved in RNase-freewater treated with 0.1% diethylpyrocarbonate. The material was thentreated with 1 U/�L DNase I at 37°C for 30 minutes to remove anycontaminating genomic DNA, and then extracted once with phenol-chloroform-isoamyl alcohol (25:24:1 pH 4.5), followed by extractionwith chloroform, precipitated with 2 M sodium acetate and 95%ethanol, washed with 80% ethanol, and resuspended in RNase-freewater. The concentration of RNA were measured spectrophotometri-cally at 260 nm (GeneQuant; Amersham Pharmacia Biotech, Uppsala,Sweden). Absorbance ratios of 280 to 260 nm were consistently morethan 1.8 for all samples.
DNA Arrays and Interrogations
Rat cDNA expression arrays (Atlas 1.2; Clontech Laboratories, PaloAlto, CA) were used in this work to study gene expression patterns incorneas after PRK. Each DNA array was manufactured by spotting anylon membrane with cDNA fragments representing 1176 knowngenes in addition to three plasmid and bacteriophage DNA sequences,which were included as a negative control, and 9 housekeeping genesequences, which were included as a positive control. To minimizecross-hybridization and nonspecific binding, cDNA fragments boundon the array were selected, so that they ranged in size from 200 to 600bp and they did not contain repetitive elements. All clones used togenerate the immobilized gene probes were sequenced by the manu-facturer to verify identity, and the size of PCR products generatedfrom all clones by gene-specific primers was confirmed by gel electro-phoresis.
For DNA array interrogation, the arrays were interrogated with�32P-labeled cDNA prepared by reverse transcribing pools of totalcorneal RNA isolated. Using the manufacturer’s protocol (ClontechLaboratories), 5 �g total RNA was reverse transcribed with gene-specific primers and reagents provided with the cDNA expressionarray. The radiolabeled target cDNAs were purified by column chro-matography, denatured under basic conditions, neutralized, and addedto 10-mL aliquots of hybridization solution (ExpressHyb; ClontechLaboratories) at 68°C, containing 100 �g/mL heat-denatured andsheared salmon testes DNA (Sigma, St. Louis, MO), to obtain a finalprobe concentration of 5 � 106 cpm/mL. The radiolabeled cDNAhybridization solutions were applied to prehybridize the array mem-branes (30 minutes in ExpressHyb with salmon testes DNA at 68°Cwithout labeled probe) and were hybridized overnight at 68°C in glassbottles with constant rotational mixing in a hybridization incubator.After hybridization, the membranes were washed four times with 140mL 2� SSC (300 mM sodium chloride, 330 mM sodium citrate, pH 7.0),and 1% SDS solution at 68°C for 30 minutes each, followed by onewash for 30 minutes in 140 mL 0.1% SSC and 0.5% SDS, at 68°C. Finally,the membranes were rinsed for 5 minutes in a solution of 2� SSC atroom temperature, and exposed to phosphor screens. Each samplewas applied to a new membrane—-that is, the membranes were notstripped and rehybridized.
Data Analysis
Data Acquisition. Hybridization signals on the cDNA expres-sion arrays were scanned at a pixel resolution of 150 �m and digitizedusing a phosphorescent imager (Storm PhosphorImager; MolecularDynamics Inc., Sunnyvale CA). The digitized data were analyzed usingthe image-analysis software associated with the cDNA arrays (AtlasImage, ver. 1.5; Clontech Laboratories). The signal intensity of eachelement on the array was determined and corrected by subtracting
IOVS, June 2002, Vol. 43, No. 6 Gene Expression Analysis of Rat Corneas after PRK 1773
background. Background intensities were determined by the imageanalysis software, based on the average background intensity from nineareas of each array where no DNA was present. The subtraction of thebackground generated the net signal intensity value for each of theelements on the array.
Global Normalization of Gene Spot Hybridization In-tensities. To normalize for experimental variations between samplesand membranes, such as differences in signal intensities due to differ-ences in specific activities of labeled target cDNA, hybridization signalson each membrane were normalized using a global normalizationmethod. Briefly, the net signal intensity of each element on the arraywas determined and multiplied by a scaling factor so that the averageintensity of elements on the array was 12,000 phosphorescence imageunits after scaling. Once the hybridization signals of each element oneach array were scaled to the same target intensity, the normalizedintensities for each gene were compared from experiment to experi-ment.
Statistical Analysis
Variance Normalization and Hierarchical Clustering.To aid in identifying patterns in changes of gene expression, wetransformed the data set to normalize the variance observed for eachset of gene expression observations. For each gene (element on thearray), we calculated its average hybridization intensity and SD afterglobal normalization, as described earlier. We then transformed thedata set by subtracting the mean observation value from each obser-vation and dividing by the SD: (x � mean of x)/SD of x. The meantransformed expression value of each gene in the transformed data setis 0 and the SD for each gene is 1.
Hierarchical clustering of the variance in gene expression over thetime course of the experiment was preformed using the Cluster algo-rithms developed by Eisen et al.16 Clusters calculates the distances ingene expression space of the expression values observed for each geneand constructs a hierarchical tree, placing the two genes with the mostsimilar expression values next to one another until all branches of thetree are linked. In this study we used the Pearson (uncentered) corre-lation metric option and the average-linking method to generate theclusters. The output of Cluster was displayed for visual inspectionusing the TreeView program (available at http://rana.stanford.edu/software) also developed by Eisen et al.16
Cumulative Hypergeometric Probabilities. We calculatedthe probability of obtaining gene members of similar functional groupswithin the major clusters obtained by hierarchical clustering. We usedthe cumulative hypergeometric probability calculation to determinewhether any of the 24 functional groups of genes as defined by themanufacturer (Clontech Laboratories) were significantly overrepre-sented in any of the 14 major clusters identified by hierarchical clus-tering.17 In general form, the cumulative hypergeometric probabilitycalculation allows calculation of the probability of observing at least(k) genes from a functional group within a cluster of size (n) given (g)genes to choose from containing f genes of the functional group inquestion. The probability is calculated using the formula:
P � 1 � �i�0
k�1 � fi�� g � f
n � i�� g
n�where f is the total number of genes within each functional groupprovided by the manufacturer (Clontech Laboratories), and g is thetotal number of genes present on the array (1176). To set the signifi-cance level, we applied a Bonferroni-type correction, because wetested for overrepresentation of each functional group. Therefore, theP � 0.05 significance level was divided by 24, which is the number offunctional groups of genes present on the arrays. Accordingly proba-bilities greater than 0.00208 (0.05/24) (�log � 2.68) were not con-sidered statistically significant.
K-Mean Clustering of Known WoundHealing Genes
Expression patterns of a set of 56 specific genes that are generallythought to play important roles in corneal wound healing based onprevious publications were also studied.18–22 The expression patternsof these selected genes were analyzed using k-means clustering in theCluster software. Briefly, k-means clustering divided the genes into auser-defined number of groups based on the similarities of their ex-pression profiles. In this study, the data were clustered into five groupswith 100 cycles. Subsequently, each of the gene clusters generated byk-means was hierarchically clustered as has been described, and theindividual expression profiles of each gene within all clusters wereplotted on line graphs.
RESULTS
Comparisons of Replicate MembranecDNA Microarrays
DNA array experiments, as with any other type of experiment,are subject to noise and experimental artifact. We designed ourexperiments and analysis to filter out as much noise and vari-ation due to uncontrolled experimental variables as possible.Three replicate experiments were conducted for each timepoint so that differences due to the controlled experimentalvariable, healing through a time course, would be reinforced,whereas differences due to uncontrolled experimental vari-ables would be dampened. The first filter we applied to thedata was the criterion that replicate measurements should yieldsimilar results.
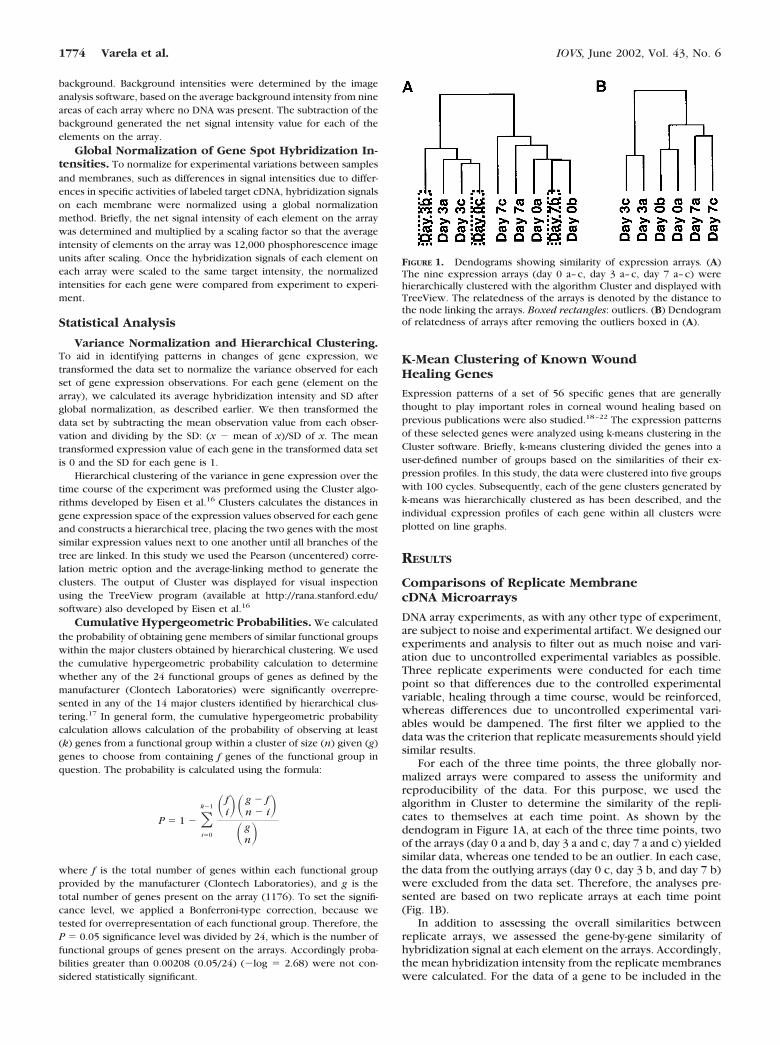
For each of the three time points, the three globally nor-malized arrays were compared to assess the uniformity andreproducibility of the data. For this purpose, we used thealgorithm in Cluster to determine the similarity of the repli-cates to themselves at each time point. As shown by thedendogram in Figure 1A, at each of the three time points, twoof the arrays (day 0 a and b, day 3 a and c, day 7 a and c) yieldedsimilar data, whereas one tended to be an outlier. In each case,the data from the outlying arrays (day 0 c, day 3 b, and day 7 b)were excluded from the data set. Therefore, the analyses pre-sented are based on two replicate arrays at each time point(Fig. 1B).
In addition to assessing the overall similarities betweenreplicate arrays, we assessed the gene-by-gene similarity ofhybridization signal at each element on the arrays. Accordingly,the mean hybridization intensity from the replicate membraneswere calculated. For the data of a gene to be included in the
FIGURE 1. Dendograms showing similarity of expression arrays. (A)The nine expression arrays (day 0 a–c, day 3 a–c, day 7 a–c) werehierarchically clustered with the algorithm Cluster and displayed withTreeView. The relatedness of the arrays is denoted by the distance tothe node linking the arrays. Boxed rectangles: outliers. (B) Dendogramof relatedness of arrays after removing the outliers boxed in (A).
1774 Varela et al. IOVS, June 2002, Vol. 43, No. 6

data set, both of its hybridization intensities at each of the threetime points had to be within 50% of the observed mean hy-bridization intensity for that time point (e.g., consider two setsof observations for genes X and Y: X1 � 90, X2 � 110 and Y1
� 10, Y2 � 190. The mean observation value for both X and Yis 100. However, data for Y would be excluded, because theobservations were outside the window defined by mean � 50%of mean [50–150]). After applying this second filter, we arrivedat a data set comprising 588 genes. The entire unfiltered dataset from all nine arrays can be viewed on our web site, http://www.obgyn.ufl.edu/research/wound/default.htm.
So-called housekeeping genes are generally believed to beexpressed at similar levels under all conditions, although thereare few or no data to support this view. Therefore, we wereinterested in assessing the expression of the nine housekeep-ing genes present on the arrays. Of these genes, phospholipaseA2 was severely depressed on day 3 (19-fold) recovering some-what on day 7, but still depressed (2-fold) when comparedwith day 0. Expression of myosin heavy chain transcript wasdepressed twofold at day 3 but recovered by day 7. In contrast,hypoxanthine-guanine phosphoribosyltransferase displayed
higher levels of expression on day 3 (fivefold) recoveringsomewhat by day 7. Variations in expression of housekeepinggenes have also been reported in postnatal rabbit sclera.23 Theother six housekeeping genes present on the arrays wereexpressed at similar levels at all three time points.
Pair-wise Comparisons
Figure 2A, 2B, and 2C show scatterplots of the hybridizationintensities for the 588 selected genes at each of the three timepoints. Scatterplots comparing the levels of expression foreach of the 588 genes on each day compared with the othertwo days are shown in Figures 2D, 2E, and 2F. The dotted linesare the boundaries for the � threefold change in levels of geneexpression. As seen in Figure 2D, there was a change in thelevel of gene expression on day 3 compared with day 0.Specifically, expression of 42 genes increased at least three-fold, and expression of 28 genes decreased at least threefold onday 3. On day 7 after PRK, the expression of only 20 genesincreased at least threefold, and expression of seven genesdecreased at least threefold compared with day 0 (Figure 2E).
FIGURE 2. Scatterplot analysis of duplicate membranes and pair-wise comparisons between the three time points. Two-dimensional comparisonof duplicate membranes for day 0 (A), day 3 (B) and day 7 (C). Scatterplot analyses of expression data for days 0, 3, and 7 are represented as thepair-wise comparisons of day 0 versus day 3 (D), day 0 versus day 7 (E), and day 3 versus day 7 (F) plotted on log–log axes. Each point representsthe normalized expression levels of an individual gene on the two days. Solid line: predicted line of identity on which a gene would lie if no changeoccurred in the level of expression between the two days. Dotted lines: � threefold changes. The perpendicular distance of a point away fromthe diagonal line represents the degree to which a gene is differentially expressed between the two time points.
IOVS, June 2002, Vol. 43, No. 6 Gene Expression Analysis of Rat Corneas after PRK 1775
Comparison of the multiple increase in expression betweendays 3 and 7 after PRK showed an intermediate result, with 24genes having increased expression on day 7 compared withtheir levels on day 3, whereas expression of 16 genes de-creased at least threefold (Figure 2F). Overall, the scatterplotsindicate that the level of expression of 70 genes increased ordecreased at least threefold on day 3 after PRK, compared withnoninjured normal corneas. By day 7, expression of many ofthese genes had returned to levels similar to those of day 0.Twenty-seven genes were differentially expressed on day 7 atmore than three times the level on day 0.
Hierarchical Cluster Analysis
Analysis of the 588 selected genes identified 73 genes withexpression that varied more than threefold at at least one timepoint after PRK when compared with the level of expression
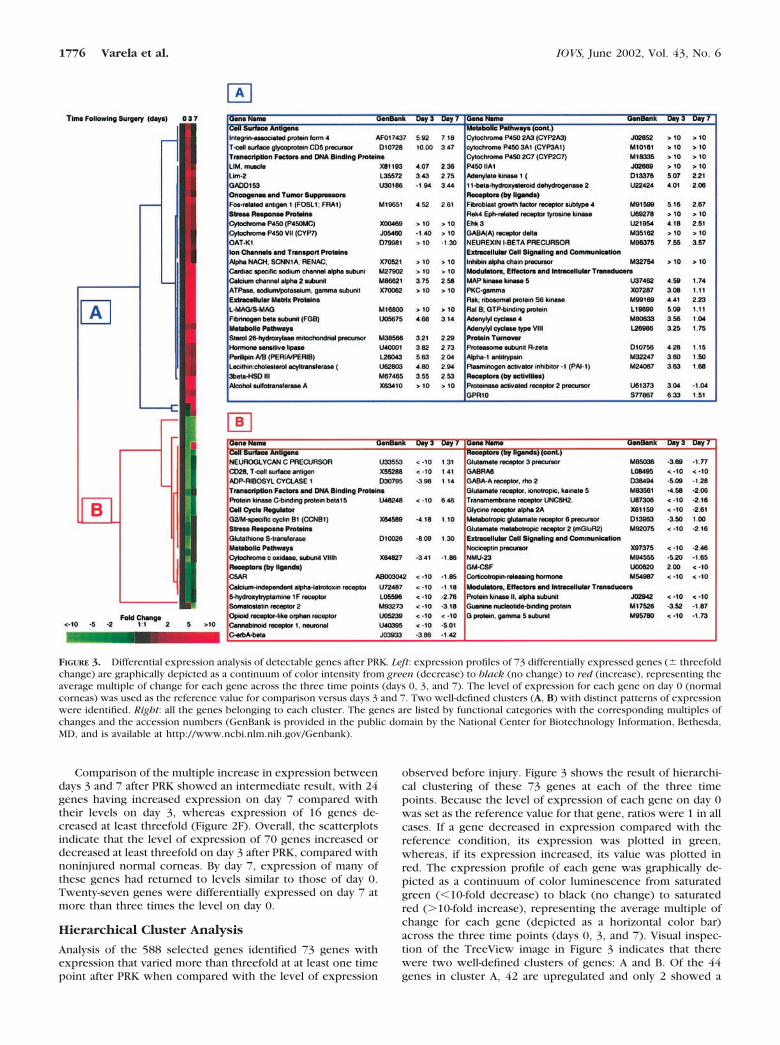
observed before injury. Figure 3 shows the result of hierarchi-cal clustering of these 73 genes at each of the three timepoints. Because the level of expression of each gene on day 0was set as the reference value for that gene, ratios were 1 in allcases. If a gene decreased in expression compared with thereference condition, its expression was plotted in green,whereas, if its expression increased, its value was plotted inred. The expression profile of each gene was graphically de-picted as a continuum of color luminescence from saturatedgreen (�10-fold decrease) to black (no change) to saturatedred (�10-fold increase), representing the average multiple ofchange for each gene (depicted as a horizontal color bar)across the three time points (days 0, 3, and 7). Visual inspec-tion of the TreeView image in Figure 3 indicates that therewere two well-defined clusters of genes: A and B. Of the 44genes in cluster A, 42 are upregulated and only 2 showed a
FIGURE 3. Differential expression analysis of detectable genes after PRK. Left: expression profiles of 73 differentially expressed genes (� threefoldchange) are graphically depicted as a continuum of color intensity from green (decrease) to black (no change) to red (increase), representing theaverage multiple of change for each gene across the three time points (days 0, 3, and 7). The level of expression for each gene on day 0 (normalcorneas) was used as the reference value for comparison versus days 3 and 7. Two well-defined clusters (A, B) with distinct patterns of expressionwere identified. Right: all the genes belonging to each cluster. The genes are listed by functional categories with the corresponding multiples ofchanges and the accession numbers (GenBank is provided in the public domain by the National Center for Biotechnology Information, Bethesda,MD, and is available at http://www.ncbi.nlm.nih.gov/Genbank).
1776 Varela et al. IOVS, June 2002, Vol. 43, No. 6

decrease in level of expression at day 3. At day 7, 38 remainupregulated and only 6 showed a level of expression similar tothat at day 0. In cluster B, 28 genes showed a decrease in levelof expression, whereas only one showed a very slight increaseat day 3. By day 7, 22 remained downregulated, 6 returned tolevels of expression similar to day 0, and 1 showed an increasein expression. In summary, most of the genes in cluster Ashowed an increase in level of expression at day 3 and re-mained upregulated at day 7, whereas almost all the genes incluster B showed a decrease in expression at day 3 and remaindownregulated at day 7.
A more in-depth look into clusters A and B reveals theprevalence of certain functional groups in those clusters. Veryinteresting patterns emerged from this observation. For exam-ple, cluster A contained 11 genes from the metabolic pathwaysfunctional group, whereas cluster B contains only 1. This mayreflect a general increase in metabolism during healing of thecorneal injuries. Included in the group in cluster A from themetabolic pathways group were four cytochrome P450 genes(2A3, 3A1, 2C7, and 2A1). Also of importance is the presencein cluster A of three genes from the protein turnover groupincluding the general inhibitor of serine proteases, �-1 anti-trypsin, and the more specific serine protease inhibitor, plas-minogen activator inhibitor-1 (PAI-1) along with the genes forfibrinogen � subunit and myelin-associated glycoprotein pre-cursor belonging to the extracellular matrix proteins functionalgroup. Similarly, cluster B contains 15 genes from the receptor(by ligands) functional group, whereas cluster A contains only5. Genes with decreased expression from the receptor (byligands) group in cluster B included two subunits of the �-ami-nobutyric acid (GABA) receptor, glutamate metabotropic re-ceptors 2 and 6, as well as glutamate receptor 3 and somatosta-tin receptor 2. Figure 2 (right) shows a complete list of all thegenes from clusters A and B with their respective multiples ofincreases and functional group designation.
It is important to point out that the justification for identi-fying genes that show large increases or decreases in expres-sion (i.e., threefold induction or reduction) after PRK ablationis based on the assumption that genes that show large changesin expression play important roles in corneal wound healing.However, it is also important to examine expression of genesthat show relatively smaller changes in expression, because itis likely that many genes that play key roles in regulatingcorneal wound healing do so by regulating expression of othergenes or by altering the activities of cascading pathways.Therefore, small changes in expression of some key regulatorgenes can generate effects in cells that are amplified manytimes more than the actual change in their level of transcrip-tion. To better evaluate genes with smaller changes in expres-sion, we analyzed the changes in expression patterns of all 588genes by variance normalization and hierarchical clusteringanalysis.
Variance Normalization and HierarchicalClustering of the Selected 588 Genes
Variance normalization was used to detect similarities in theexpression patterns of genes that show the same pattern ofvariation in their gene expression profiles. After variance nor-malization, the transformed data set for each gene has a meanof 0 and a SD of 1. After hierarchical cluster analysis of thevariance-normalized data set, genes that are expressed at dif-ferent levels but that vary in similar ways in their expressionpattern cluster together. Hierarchical clustering of the vari-ance-normalized expression of all 588 genes identified 10 clus-ters of genes (Figs. 4) with similar expression patterns. Thecluster sizes ranged from 18 genes for cluster F to 109 genes forcluster A. The correlation coefficients of the expression pat-
terns of the genes in each of the 10 clusters were greater than0.9. Genes that show similar patterns of expression may beregulated by common regulatory networks.
The expression of 213 genes increased by day 3 and thendecreased by day 7 (clusters E–H). Conversely, 255 genesdecreased expression by day 3 (clusters A–D), and of those 223genes increased expression by day 7 (clusters A, C, D). Thegenes that were upregulated included those involved in trans-lation, metabolic pathways, protein turnover, trafficking andtargeting, and immune system proteins among others. Most ofthe genes that were downregulated belonged to the extracel-lular cell signaling and communication, receptors (by ligands),modulators, effectors and intracellular transducers, and cellsurface antigens groups. The complete database of the ex-pressed genes and their levels and patterns of expression isavailable in our Web site at the address provided earlier.
Cumulative Hypergeometric Probability
Genes that are functionally related tend to be governed by thesame or overlapping sets of genetic regulatory networks. Theutility of cluster analysis with respect to gene expression datais based on the tacit assumption that genes subject to the samegenetic regulatory networks cluster in gene expression space.We sought to determine whether any of the clusters we iden-tified in this study were overrepresented by genes of a partic-ular functional group. The arrays used in this study (ClontechLaboratories) contained 1176 genes in total that were classifiedinto 24 functional groups. We calculated the cumulative hy-pergeometric probability of obtaining at least the number ofgenes of each functional group in each of the 10 clusters weobtained. Because we tested each of the 24 functional catego-ries for overrepresentation, we applied a Bonferroni-type cor-rection (0.05/24) to the standard 0.05 significance level. Thus,probabilities lower than 0.00208 (�log � 2.68) were consid-ered statistically significantly. As shown in Table 1, five func-tional groups were significantly overrepresented in 7 of the 10clusters identified in this study (transcription factors and DNA-binding proteins; modulators effectors, and intracellular trans-ducers; cell cycle regulators; oncogenes and tumor suppres-sors; and metabolic pathways). For example, 24 genesbelonging to the transcription factors and DNA-binding pro-teins functional group are present on the 1176 gene array. Nineof the 71 genes in cluster J of Figure 3 are members of thetranscription factors and DNA-binding proteins functionalgroup. The probability of a cluster of 71 genes’ (the size ofcluster J) containing at least 9 genes from the transcriptionfactors and DNA-binding proteins functional group, which to-tals 24 genes on the array of 1176 genes, is 4.0 � 10�6 (�log �5.39). Thus, transcription factors and DNA binding proteins areoverrepresented in cluster J at levels higher than would beexpected by mere chance. Similarly, 6 of the 83 genes incluster D are members of the cell cycle regulators functionalgroup. Cell cycle regulators functional group consists of a totalof 19 genes present on the array. The probability of finding 6of the 19 cell cycle regulator genes among the 83 genes in thecluster is P � 1.3 � 10�3 (�log � 2.88). The chance proba-bility of finding 16 of the 125 metabolic pathways genes amongthe 68 genes in cluster G is even lower, at P � 1.2 � 10�3
(�log � 2.91). Therefore, the general pattern of gene expres-sion shown in cluster G of a peak in expression on day 3,followed by a decrease to levels similar to day 0 corneas, isindicative of a coordinated physiological change in generalmetabolic pathway activity during the early phase of cornealhealing.
IOVS, June 2002, Vol. 43, No. 6 Gene Expression Analysis of Rat Corneas after PRK 1777

Expression Analysis of 56 Genes ConsideredImportant to Wound HealingA subset of 56 genes, including growth factors, cytokines,receptors, and protein turnover genes, that are thought to playroles in wound repair were examined in greater detail byvariance normalization followed by k-means clustering andsubsequent hierarchical clustering of the k-means clusters. Asshown in Figure 5, the 56 genes were divided into five bins byk-means clustering, based on the similarities of their expression
profiles. The expression patterns of the genes in each of thefive clusters were then subjected to hierarchical clustering, theresults of which are shown in Figure 4.
As depicted in Figure 5, 32 of the 56 wound-healing geneswere expressed at elevated levels at day 3 compared with day0. Twenty-two of the 32 genes had peak levels of expression atday 3. Genes with peak expression at 3 day include granulo-cyte-macrophage colony stimulating factor (GM-CSF), tumornecrosis factor-� (TNFA), glioma-derived vascular endothelial
FIGURE 4. Hierarchical tree clustering analysis of variance-normalized gene expression for days 0, 3, and 7. The hierarchical clustering of theselected 588 genes yielded 10 gene clusters. The average expression of all the genes within a cluster at each time point was expressed as standarddeviations from the mean observation value. Thus, the larger the change in gene expression, the farther the point lies from the mean (the x-axis).The average expression profile for each of the clusters is shown using line plots. The correlation coefficient for all the 10 clusters was at least 0.917,indicating extremely similar changes in expression of the genes within the cluster.
1778 Varela et al. IOVS, June 2002, Vol. 43, No. 6
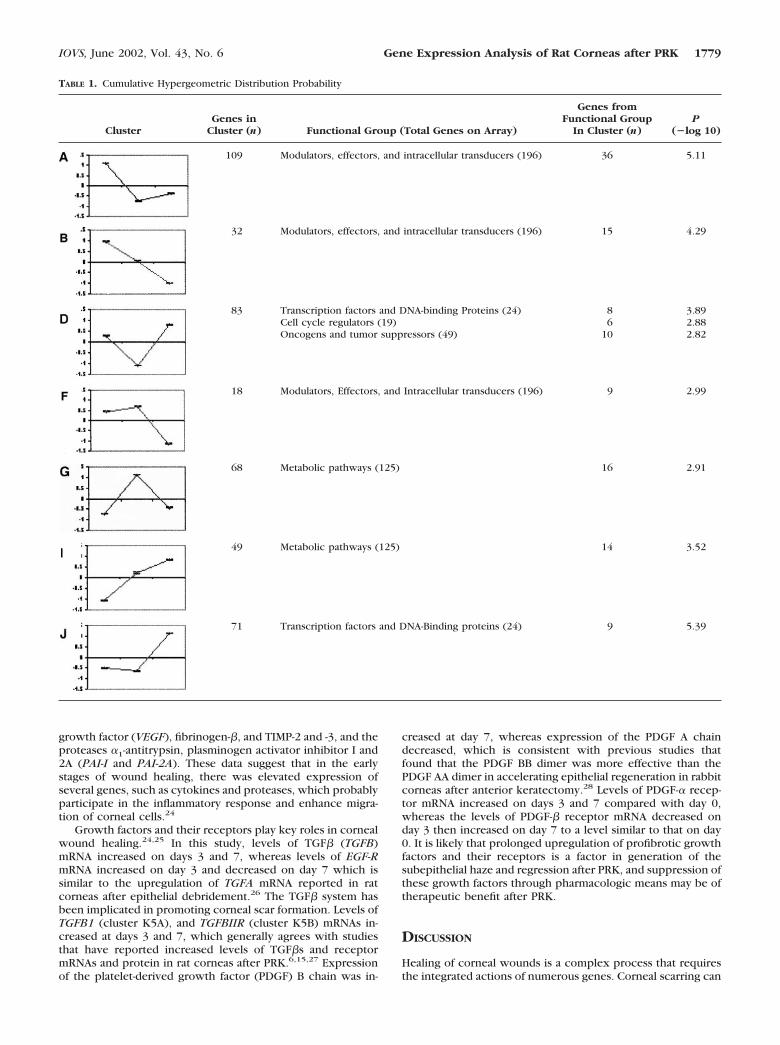
growth factor (VEGF), fibrinogen-�, and TIMP-2 and -3, and theproteases �1-antitrypsin, plasminogen activator inhibitor I and2A (PAI-I and PAI-2A). These data suggest that in the earlystages of wound healing, there was elevated expression ofseveral genes, such as cytokines and proteases, which probablyparticipate in the inflammatory response and enhance migra-tion of corneal cells.24
Growth factors and their receptors play key roles in cornealwound healing.24,25 In this study, levels of TGF� (TGFB)mRNA increased on days 3 and 7, whereas levels of EGF-RmRNA increased on day 3 and decreased on day 7 which issimilar to the upregulation of TGFA mRNA reported in ratcorneas after epithelial debridement.26 The TGF� system hasbeen implicated in promoting corneal scar formation. Levels ofTGFB1 (cluster K5A), and TGFBIIR (cluster K5B) mRNAs in-creased at days 3 and 7, which generally agrees with studiesthat have reported increased levels of TGF�s and receptormRNAs and protein in rat corneas after PRK.6,15,27 Expressionof the platelet-derived growth factor (PDGF) B chain was in-
creased at day 7, whereas expression of the PDGF A chaindecreased, which is consistent with previous studies thatfound that the PDGF BB dimer was more effective than thePDGF AA dimer in accelerating epithelial regeneration in rabbitcorneas after anterior keratectomy.28 Levels of PDGF-� recep-tor mRNA increased on days 3 and 7 compared with day 0,whereas the levels of PDGF-� receptor mRNA decreased onday 3 then increased on day 7 to a level similar to that on day0. It is likely that prolonged upregulation of profibrotic growthfactors and their receptors is a factor in generation of thesubepithelial haze and regression after PRK, and suppression ofthese growth factors through pharmacologic means may be oftherapeutic benefit after PRK.
DISCUSSION
Healing of corneal wounds is a complex process that requiresthe integrated actions of numerous genes. Corneal scarring can
TABLE 1. Cumulative Hypergeometric Distribution Probability
ClusterGenes in
Cluster (n) Functional Group (Total Genes on Array)
Genes fromFunctional Group
In Cluster (n)P
(�log 10)
109 Modulators, effectors, and intracellular transducers (196) 36 5.11
32 Modulators, effectors, and intracellular transducers (196) 15 4.29
83 Transcription factors and DNA-binding Proteins (24)Cell cycle regulators (19)Oncogens and tumor suppressors (49)
86
10
3.892.882.82
18 Modulators, Effectors, and Intracellular transducers (196) 9 2.99
68 Metabolic pathways (125) 16 2.91
49 Metabolic pathways (125) 14 3.52
71 Transcription factors and DNA-Binding proteins (24) 9 5.39
IOVS, June 2002, Vol. 43, No. 6 Gene Expression Analysis of Rat Corneas after PRK 1779
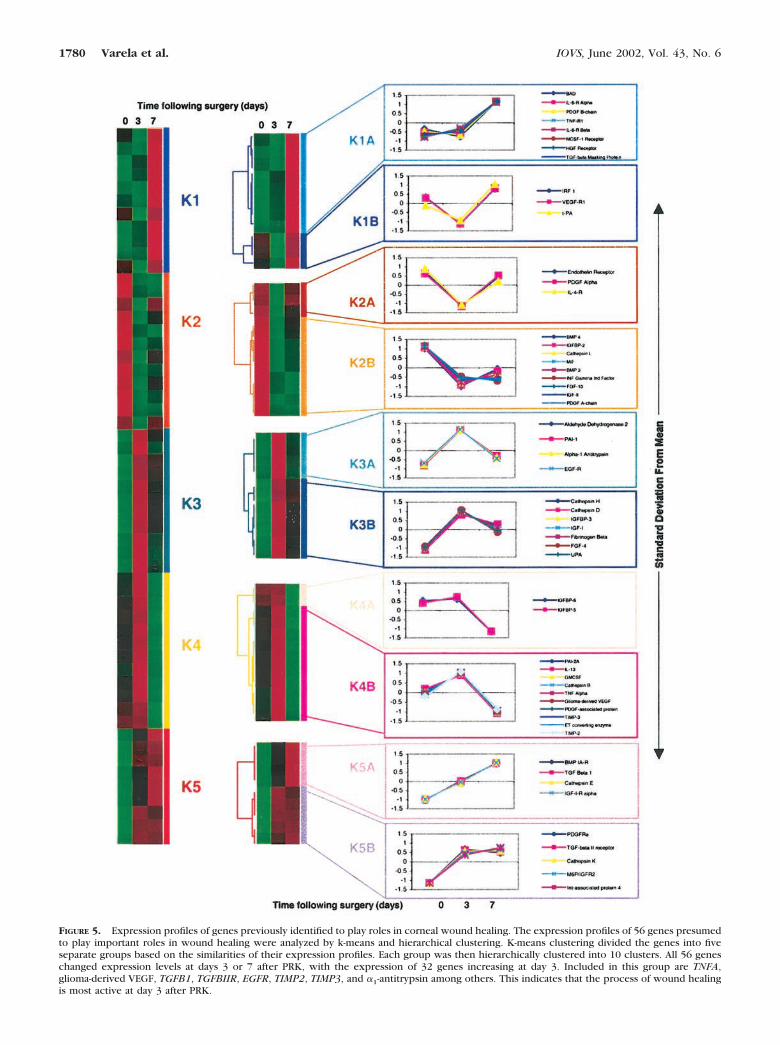
FIGURE 5. Expression profiles of genes previously identified to play roles in corneal wound healing. The expression profiles of 56 genes presumedto play important roles in wound healing were analyzed by k-means and hierarchical clustering. K-means clustering divided the genes into fiveseparate groups based on the similarities of their expression profiles. Each group was then hierarchically clustered into 10 clusters. All 56 geneschanged expression levels at days 3 or 7 after PRK, with the expression of 32 genes increasing at day 3. Included in this group are TNFA,glioma-derived VEGF, TGFB1, TGFBIIR, EGFR, TIMP2, TIMP3, and �1-antitrypsin among others. This indicates that the process of wound healingis most active at day 3 after PRK.
1780 Varela et al. IOVS, June 2002, Vol. 43, No. 6
severely limit visual function, yet there are no agents currentlyavailable that safely limit the development of corneal haze.With the increase in PRK and LASIK procedures, the need tolimit corneal scarring is not restricted to trauma or infection.Thus, there is a need to better understand which factors inducecorneal haze and to design agents that selectively reduce theiraction. Because the phenotype of a tissue is the manifestationof the expressed genotype of the cells, analysis of the ex-pressed genotype of cells within the cornea during woundhealing can provide important information about how cellsinteract at a molecular level. Microarray technology enables alarge number of genes to be simultaneously analyzed, whichenables broad insights to be made into the general trends andpatterns of gene expression.16 Previous reports of cDNA mi-croarray gene analyses have been performed on Drosophila,29
yeast,30,31 the nematode Caenorhabditis elegans,32 tumorsamples,31,33 embryonic stem cells,34 or cells in culture.35,36
This study is the first report of a cDNA microarray analysis ofthe cornea after PRK.
In this study, the whole cornea was analyzed during theearly phase of wound healing, rather than just the response ofa single cell type (e.g., fibroblasts or epithelial cells). Onelimitation of this experimental design, however, is that themeasured values represent the average expression of a gene forall the cells in the cornea and does not permit assessing thecontribution of different cell types in the cornea. Anotherlimitation of the use of cDNA microarrays is that the valuesrepresent the steady state levels of mRNAs, and there are otherwell-known cellular mechanisms that regulate the activity ofgene products and occur after transcription, including transla-tional regulation, proteolytic activation of latent proteins, orcovalent modifications, such as phosphorylation reactions.However, the most common mechanism for regulating theaction of a gene product is to regulate the transcription of thegene. In spite of these limitations, cDNA microarray analysis isthe most powerful experimental technique to study changes inexpression of large numbers of genes. When combined withhierarchical clustering, patterns of gene expression can iden-tify genes that may be regulated by common transcriptionalregulatory pathways. It is also important to recognize thatcorneal cells in vivo are exposed, not only to autocrine andparacrine corneal factors such as TGF�37 and IL-1�38 that canregulate corneal gene expression after injury, but also areexposed to exocrine proteins that are present in tears that caninfluence corneal gene expression. For example, EGF,39 TGF-�1,40 TGF-�2,41 VEGF,40 and plasmin42 are all present in phys-iologically relevant levels in normal tears, and their levelstypically change after a corneal injury. Thus, the results ofanalysis of corneal gene expression during healing after PRKinjury probably reflect regulation by autocrine, paracrine, andexocrine factors.
Analyzing the cornea at days 0, 3, and 7 after PRK providedinsight into the magnitude and time course of changes in geneexpression at different stages of corneal wound healing. Mi-croarray analysis of the expression of the selected 588 genesshowed that at day 3, when the epithelial injury was not fullyclosed, 70 genes were differentially expressed (a � threefoldchange) compared with day 0, which shows that a relativelylarge number of genes were induced or repressed at this earlystage of corneal healing. At day 7 when the epithelial woundtypically had closed but the stromal injury was still activelyhealing, 27 genes were differentially expressed (� threefoldchange) compared with day 0. Thus, there was a greaterchange in overall gene expression on day 3 compared with day7 when the number of differentially expressed (� threefoldchange) genes decreased by 62% (70 vs. 27 differentially ex-pressed genes). This suggests that corneal cells were undergo-
ing more phenotypic changes during the early phase of healing(day 3) than during the later phase (day 7).
A more extensive analysis of the 73 genes that had a three-fold change or more in expression revealed important obser-vations about the patterns of gene expression during cornealwound healing. A substantial number of metabolic pathwaygenes increased in expression threefold or more at day 3,including genes for metabolic enzymes, such as lipases (e.g.,hormone sensitive lipase), dehydrogenases (e.g., 11-�-hydrox-ysteroid dehydrogenase 2), and transferases (e.g., lecithin-cho-lesterol acyltransferase, alcohol sulfotransferase A). The up-regulation of these genes is probably a result of an increasedneed for cellular energy during wound healing, to allow cells toproliferate, migrate, and synthesize extracellular matrix. A totalof 11 metabolic pathway genes showed at least a threefoldincrease at day 3. Also, three genes belonging to the proteinturnover functional group had induction of threefold or moreat day 3 (�1-antitrypsin, PAI-I, and proteasome subunit R-�).Turnover of proteins by specific proteases is essential duringwound healing, with proteases playing essential roles in migra-tion, angiogenesis, apoptosis, and extracellular matrix forma-tion.
Among the most striking observations was the extremesimilarity in the pattern of expression of the genes within thesame hierarchical cluster in Figure 4. Presented on the rightside the figure are all the line plots showing the expressionprofiles for all the genes within each cluster. The correlationcoefficients from these clusters ranged from 0.930 to 0.997suggesting that the genes within each cluster are “movingtogether” through gene expression space and therefore couldbe controlled by common regulatory elements. This is animportant finding, because it could help in the understandingof the molecular environment during corneal wound healing.
In summary, this is the first report of cDNA microarrayanalysis performed on healing rat corneas after PRK. The se-lected 588 genes self-assembled into 10 clusters, based on thesimilarities of their expression profiles. The grouping of thesegenes into the same clusters suggests that these genes interactwith each other and/or may have common elements of regu-lation during the process of corneal wound healing. In addi-tion, the expression patterns of 56 genes that are believed toplay a part in corneal wound healing provided insight thatshowed increases on days 3 and/or 7. To further expand ourunderstanding of corneal wound healing, experiments are cur-rently being conducted to examine the expression of 12,626genes and expressed sequence tags (ESTs) over a broader timecourse after PRK.
Acknowledgements
The authors thank Clear Vision (Lakewood, CO) for donation of theexcimer laser.
References
1. Schultz GS. Modulation of corneal wound healing. In: KrachmerJH, Mannis MJ, Holland EJ, eds. Cornea: Fundamentals of Corneaand External Disease. Vol. 1. St. Louis: Mosby; 1997:183–198.
2. Cameron JD. Corneal response to injury. In: Krachmer JH, et al.,eds. Cornea: Fundamentals of Cornea and External Disease. Vol.1. St. Louis: Mosby: 1997:163–182.
3. O’Kane S, Ferguson MW. Transforming growth factor betas andwound healing. Int J Biochem Cell Biol. 1997;29:63–78.
4. Power WJ, Kaufman AH, Merayo-Lloves J, Arranategui-Correa V,Foster CS. Expression of collagens I, III, IV, and V mRNA inexcimer wounded rat cornea: analysis by semi-quantitative PCR.Curr Eye Res. 1995;14:879–886.
5. Wilson SE, Chen L, Mohan RR, Liang Q, Liu J. Expression of HGF,KGF, EGF and receptor messenger RNAs following corneal epithe-lial wounding. Exp Eye Res. 1999;68:377–397.
IOVS, June 2002, Vol. 43, No. 6 Gene Expression Analysis of Rat Corneas after PRK 1781
6. Kaji Y, Mita T, Obata H, et al. Expression of transforming growthfactor beta superfamily and their receptors in the corneal stromalwound healing process after excimer laser keratectomy [letter].Br J Ophthalmol. 1998;82:462–463.
7. Sundar RN, Geiss MJ, Fantes M, et al. Healing of excimer laserablated monkey corneas: an immunohistochemical evaluation.Arch Ophthalmol. 1990;108:1604–1610.
8. Azar DT, Hahn TW, Jain S, Yeh YC, Steller-Stevensen WG. Matrixmetalloproteinases are expressed during wound healing after ex-cimer laser keratectomy. Cornea. 1996;15:18–24.
9. Ye HQ, Azar DT. Expression of gelatinases A and B, and TIMPs 1and 2 during corneal wound healing. Invest Ophthalmol Vis Sci.1998;39:913–921.
10. Lu PC, Ye H, Maeda M, Azar DT. Immunolocalization and geneexpression of matrilysin during corneal wound healing. InvestOphthalmol Vis Sci. 1999;40:20–27.
11. Ye HQ, Maeda M, Yu FS, Azar DT. Differential expression ofMT1-MMP (MMP-14) and collagenase III (MMP- 13) genes in nor-mal and wounded rat corneas. Invest Ophthalmol Vis Sci. 2000;41:2894–2899.
12. Azar DT, Pluznik D, Jain S, Khoury JM. Gelatinase B and A expres-sion after laser in situ keratomileusis and photorefractive keratec-tomy. Arch Ophthalmol. 1998;116:1206–1208.
13. Ljubimov AV, Alba SA, Burgeson RE, et al. Extracellular matrixchanges in human corneas after radial keratotomy. Exp Eye Res.1998;67:265–272.
14. O’Brien TP, Li Q, Ashraf MF, Matteson DM, Stark WJ, Chan CC.Inflammatory response in the early stages of wound healing afterexcimer laser keratectomy. Arch Ophthalmol. 1998;116:1470–1474.
15. Chen C, Michelini-Norris B, Stevens S, et al. Measurement ofmRNAs for TGF�s and extracellular matrix proteins in corneas ofrats after PRK. Invest Ophthalmol Vis Sci. 2000;41:4108–4116.
16. Eisen MB, Spellman PT, Brown PO, Botstein D. Cluster analysis anddisplay of genome-wide expression patterns. Proc Natl Acad SciUSA. 1998;95:14863–14868.
17. Tavazoie S, Hughes JD, Campbell MJ, Cho RJ, Church GM. System-atic determination of genetic network architecture. Nat Genet.1999;22:281–285.
18. Gillitzer R, Goebeler M. Chemokines in cutaneous wound healing.J Leukoc Biol. 2001;69:513–521.
19. Rumalla VK, Borah GL. Cytokines, growth factors, and plasticsurgery. Plast Reconstr Surg. 2001;108:719–733.
20. Lawrence WT. Physiology of the acute wound. Clin Plast Surg.1998;25:321–340.
21. Bennett NT, Schultz GS. Growth factors and wound healing: bio-chemical properties of growth factors and their receptors. Am JSurg. 1993;165:728–737.
22. Bennett NT, Schultz GS. Growth factors and wound healing. II:role in normal and chronic wound healing. Am J Surg. 1993;166:74–81.
23. Moe TK, Ziliang J, Barathi A, Beuerman RW. Differential expres-sion of glyceraldehyde-3-phosphate dehydrogenase (GAPDH),�-actin and hypoxanthine phosphoribosyltransferase (HPRT) inpostnatal rabbit sclera. Curr Eye Res. 2001;23:44–50.
24. Imanishi J, Kamiyama K, Iguchi I, Kita M, Sotozono C, Kinoshita S.Growth factors: importance in wound healing and maintenance of
transparency of the cornea. Prog Retinal Eye Res. 2000;19:113–129.
25. Schultz G, Chegini N, Grant M, Khaw P, MacKay S. Effects ofgrowth factors on corneal wound healing. Acta Ophthalmol .1992;202(suppl):60–66.
26. Zieske JD, Takahashi H, Hutcheon AE, Dalbone AC. Activation ofepidermal growth factor receptor during corneal epithelial migra-tion. Invest Ophthalmol Vis Sci. 2000;41:1346–1355.
27. Mita T, Yamashita H, Kaji Y, et al. Functional difference of TGF-beta isoforms regulating corneal wound healing after excimer laserkeratectomy (Letter). Exp Eye Res. 1999;68:513–519.
28. Stern ME, Waltz KM, Buererman RW, et al. Effect of platelet-derived growth factor on rabbit corneal wound healing. WoundRepair Regeneration. 1995;3:59–65.
29. Bryant Z, Subrahmanyan L, Tworoger M, et al. Characterization ofdifferentially expressed genes in purified Drosophila follicle cells:toward a general strategy for cell type-specific developmentalanalysis. Proc Natl Acad Sci USA. 1999;96:5559–5564.
30. Lopez MC, Baker HV. Understanding the growth phenotype of theyeast gcr1 mutant in terms of global genomic expression patterns.J Bacteriol. 2000;182:4970–4978.
31. Perou CM, Sorlie T, Eisen MB, et al. Molecular portraits of humanbreast tumours. Nature. 2000;406:747–752.
32. Hill AA, Hunter CP, Tsung BT, Tucker-Kellogg G, Brown EL.Genomic analysis of gene expression in C. elegans. Science. 2000;290:809–812.
33. Alizadeh AA, Eisen MB, Davis RE, et al. Distinct types of diffuselarge B-cell lymphoma identified by gene expression profiling.Nature. 2000;403:503–511.
34. Kelly DL, Rizzino A. DNA microarray analyses of genes regulatedduring the differentiation of embryonic stem cells. Mol ReprodDev. 2000;56:113–123.
35. Iyer VR, Eisen MB, Ross DT, et al. The transcriptional program inthe response of human fibroblasts to serum [see comments].Science. 1999;283:83–87.
36. Coller HA, Grandori C, Tamayo P, et al. Expression analysis witholigonucleotide microarrays reveals that MYC regulates genes in-volved in growth, cell cycle, signaling, and adhesion. Proc NatlAcad Sci USA. 2000;97:3260–3265.
37. Khaw PT, Schultz GS, MacKay SL, et al. Detection of transforminggrowth factor-alpha messenger RNA and protein in human cornealepithelial cells. Invest Ophthalmol Vis Sci. 1992;33:3302–3306.
38. Strissel KJ, Rinehart WB, Fini ME. Regulation of paracrine cytokinebalance controlling collagenase synthesis by corneal cells. InvestOphthalmol Vis Sci. 1997;38:546–552.
39. van Setten G-B, Tervo T, Viinikka L, Perheentupa J, Tarkkanen A.Epidermal growth factor in human tear fluid: a minireview. IntOphthalmol. 1991;15:359–362.
40. Vesaluoma M, Teppo AM, Gronhagen-Riska C, Tervo T. Release ofTGF-beta 1 and VEGF in tears following photorefractive keratec-tomy. Curr Eye Res. 1997;16:19–25.
41. Kokawa N, Sotozono C, Nishida K, Kinoshita S. High total TGF-beta 2 levels in normal human tears. Curr Eye Res. 1996;15:341–343.
42. van Setten G-B, Salonen E-M, Vaheri A, et al. Plasmin and plasmin-ogen activator activates in tear fluid during corneal wound healingafter anterior keratectomy. Curr Eye Res. 1989;8:1293–1298.
1782 Varela et al. IOVS, June 2002, Vol. 43, No. 6
Copyright © 2022 FDOKUMEN


![Ratiometry of Monomer/Excimer Emissions of Dipyrenyl Calix[4]arene in Aqueous Media](https://static.fdokumen.com/doc/165x107/63155d5385333559270d17fd/ratiometry-of-monomerexcimer-emissions-of-dipyrenyl-calix4arene-in-aqueous-media.jpg)